NUMERICAL PREDICTION OF UNDRAINED RESPONSE OF PLATE ...
37
Page 1 of 20 NUMERICAL PREDICTION OF UNDRAINED RESPONSE OF PLATE 1 ANCHORS UNDER COMBINED TRANSLATION AND TORSION 2 Hamidreza Nouri 1 , Giovanna Biscontin 2 and Charles P. Aubeny, M. ASCE 3 3 4 ABSTRACT 5 The undrained pure translational and torsional capacity of anchors and the plate response un- 6 der eccentric translational loading is investigated in this paper using three-dimensional finite 7 element (3D-FE) analysis. Plastic limit analysis is adopted to establish a benchmark solution 8 for ultimate translational resistance with satisfactory agreement with the FE values which 9 confirms the developed numerical model. Although plate thickness has a marked impact on 10 the maximum shear and torsion resistance, the shape of failure envelope is minimally affected 11 by thickness. A simple three-degree-of-freedom interaction equation is curve-fitted to FE 12 failure datapoints. Representative interaction relationships are introduced for square and rec- 13 tangular plates. 14 15 KEY WORDS: plate anchor; torsional capacity; translational (shear) resistance; plastic limit 16 analysis; finite element analysis; failure envelope. 17 1 Project Geotechnical Engineer, Golder Associates, Inc., 18300 NE Union Hill Road, Suite 200, Redmond, Washington, USA 98052, E-mail: [email protected] 2 University Lecturer in Geotechnical Engineering, Department of Engineering, University of Cambridge, Schofield Centre, High Cross, Madingley Road, Cambridge CB3 0EL, UK, E-Mail: [email protected] 3 Professor, Texas A&M University, 3136 TAMU, College Station, TX 77843-3136, USA (corresponding author). E-mail:[email protected] *Manuscript Click here to view linked References
Transcript of NUMERICAL PREDICTION OF UNDRAINED RESPONSE OF PLATE ...

Page 1 of 20
NUMERICAL PREDICTION OF UNDRAINED RESPONSE OF PLATE 1
ANCHORS UNDER COMBINED TRANSLATION AND TORSION 2
Hamidreza Nouri1, Giovanna Biscontin
2 and Charles P. Aubeny, M. ASCE
3 3
4
ABSTRACT 5
The undrained pure translational and torsional capacity of anchors and the plate response un-6
der eccentric translational loading is investigated in this paper using three-dimensional finite 7
element (3D-FE) analysis. Plastic limit analysis is adopted to establish a benchmark solution 8
for ultimate translational resistance with satisfactory agreement with the FE values which 9
confirms the developed numerical model. Although plate thickness has a marked impact on 10
the maximum shear and torsion resistance, the shape of failure envelope is minimally affected 11
by thickness. A simple three-degree-of-freedom interaction equation is curve-fitted to FE 12
failure datapoints. Representative interaction relationships are introduced for square and rec-13
tangular plates. 14
15
KEY WORDS: plate anchor; torsional capacity; translational (shear) resistance; plastic limit 16
analysis; finite element analysis; failure envelope. 17
1 Project Geotechnical Engineer, Golder Associates, Inc., 18300 NE Union Hill Road, Suite 200, Redmond,
Washington, USA 98052, E-mail: [email protected] 2 University Lecturer in Geotechnical Engineering, Department of Engineering, University of Cambridge,
Schofield Centre, High Cross, Madingley Road, Cambridge CB3 0EL, UK, E-Mail: [email protected] 3 Professor, Texas A&M University, 3136 TAMU, College Station, TX 77843-3136, USA (corresponding
author). E-mail:[email protected]
*ManuscriptClick here to view linked References
Page 2 of 20
1- Introduction 18
The offshore industry is expanding farther into very deep water, leading to a number of economi-19
cal and technical challenges. Floating structures anchored to the seabed using catenary and taut-20
wire mooring systems are generally more technically feasible and cost effective than gravity based 21
platforms in these deep water environments. Anchorage for floating systems can include piles, 22
caissons and various types of plate anchors. This paper addresses performance of the latter alterna-23
tive. Under normal operating conditions, plate anchors are mainly subjected to pull-out loading in 24
an intended plane of loading, for example, the X-Z plane in Fig. 1(a). However, extreme storm 25
events may cause partial failure with the loss of one or several mooring lines resulting in substan-26
tial changes in the orientation of the intact lines, as well as to the applied resultant force [Fig. 27
1(b)]. Under these conditions the anchor must resist a general system of loads, with some compo-28
nents of load acting outside the plane of intended loading. 29
A full description of behavior of an anchor plate in a partially failed mooring system requires ade-30
quate understanding of undrained response of anchor plates subjected to general loading condi-31
tions involving six degrees of freedom. This entails characterizing anchor behavior for six com-32
ponents of uniaxial loading (3 translational and 3 rotational) as well as the interaction effects 33
amongst all possible load combinations. Much of the research in this area to date has focused on 34
in-plane loading conditions involving forces in the X and Z directions and moments about the Y-35
axis (Fig. 1) (O’Neill et al. 2003, Murff et al. 2005). This paper investigates anchor behavior for 36
loading in the X-Y plane in Fig. 1, which will be termed ‘shear-torsional’ loading. The loading 37
comprises ‘shear’ forces Hx and Hy and a torsion T; i.e., a moment acting about the Z-axis. All 38
loads act within the plane of the plate. The study presented herein does not attempt to fully charac-39
terize anchor behavior for general 6 degree of freedom loading conditions. Rather, it investigates a 40
critical component for a more general model to be developed in the future. 41

Page 3 of 20
The plate anchors considered in this paper are idealized as rectangular plates with specified aspect 42
ratios (W/L) and thickness t (Fig. 1). Some plate anchors, such as suction embedded plate anchors 43
(SEPLAs) match this idealized geometry to a reasonable degree. By contrast, drag embedded plate 44
anchors usually have relatively complex geometric configurations to facilitate embedment. The 45
findings of this paper can provide useful insights into the behavior of drag anchors, but the inher-46
ent limitations of the analyses arising from the simplified geometry must be carefully considered. 47
O’Neill et al. (2003) used plane strain finite element (2D-FE) analysis to investigate the behavior 48
of rectangular and wedge-shaped strip anchors subjected to combined in-plane translational, verti-49
cal, and rotational loading. They also developed plastic upper bound solutions to evaluate pure 50
parallel, normal, and rotational capacity factors for strip plates to validate the FE results. Using 51
two-dimensional finite element (2D-FE) analysis, they produced failure loci and plastic potentials 52
from considerations of fluke-soil interaction and then developed a design method to predict drag 53
anchor trajectory during embedment. Murff et al. (2005) used 2D-FE to develop a failure locus for 54
the ratio of plate length to thickness (L/t) of 7 and 20 with different plate roughness. Yang et al. 55
(2010) employed 3D-FE, to study the behavior of infinitely thin plate anchors subjected to loading 56
in all six degrees of freedom. They also introduced a plasticity solution for failure envelope of a 57
plate under combined translation-torsion and developed formulas to estimate pure sliding and tor-58
sional bearing capacity. This plasticity solution predicts the behavior of an infinitely thin plate, but 59
provided only an approximate solution for a plate with finite thickness. Nouri (2013) modified the 60
plastic limit solution originally developed by Yang et al. (2010) to predict more accurately the tor-61
sional collapse load and failure envelopes of a plate anchor with finite thickness. Researchers have 62
also conducted 3D-FE analysis on other types of offshore foundations under general loading con-63
dition, such as for mudmats (Feng et al. 2014) or OMNI-max anchor (Wei et al. 2015). 64
In the current study, we use 3D-FE analysis to evaluate the translational (parallel to plate) and tor-65
sional ultimate bearing capacity of plates, as well as the interaction of these two modes of loading. 66

Page 4 of 20
Results of the FE analysis are also used to validate analytical solutions to predict bearing capaci-67
ties and to confirm whether the postulated failure mechanism for the analytical solution is correct. 68
2- Material Properties for Numerical Model 69
The commercial software ABAQUS (HKS, 2008) is used in this study. The plate is assumed to be 70
deeply embedded, with localized plastic flow forming around the plate anchor and not extending 71
to the surface, resulting in capacity factors that are not affected by overburden and soil weight 72
(Song et al. 2008; Wang et al. 2010). Thus, the soil is assumed to be a weightless material without 73
loss of accuracy. Since the size of the plastic zone around the plate anchor at failure is smaller for 74
shear and torsion than for uplift and rotation, the assumption of deep embedment is valid even for 75
shallower embedment depths. This assumption also implies that the soil and plate are fully bond-76
ed. Thus, “no separation” is assumed as the normal (i.e. perpendicular to interface) contact behav-77
ior for the plate-soil interface in conjunction with “rough” for the tangential contact property to 78
realistically simulate a fully bonded condition. The interaction between soil and plate is modeled 79
using surface to surface contact pairs in which the plate outer surface is chosen as a “master sur-80
face” and the soil surface in contact with the plate as a “slave surface”. The active degrees of free-81
dom of the nodes on the slave surface are constrained to the master surface nodes through rela-82
tionships which define the tangential and normal interaction at the nodes of these two surfaces. 83
Clay under undrained conditions is modeled as a linear elastic perfectly plastic material, with 84
yielding determined by the Von Mises failure criterion with undrained shear strength, su. The 85
Young’s modulus of the soil, E, is given by a modulus ratio of E/su = 500, and Poisson’s ratio is 86
taken as 0.49 to simulate no volume change for undrained clay in total stress analysis. The ulti-87
mate capacity of the plate is not affected by the pre-failure elastic behavior of the soil (Chen and 88
Liu 1990). In addition, in studies on plate uplift bearing capacity it was observed that as the soil 89
rigidity (E/su) increases, the anchor displacement required to mobilize the maximum capacity re-90
duces, while the maximum capacity does not change (Song et al. 2008; Wang et al. 2010). There-91

Page 5 of 20
fore, the Young’s modulus of the soil is assumed constant in these studies. Since the analysis of 92
the structural behavior of the anchor is not within the scope of this work, the plate is modeled as a 93
rigid body with Young’s modulus 1010
times that of the soil, and Poisson’s ratio of 0.30. The 94
analysis is conducted using small strain displacement control, since the ultimate translational and 95
torsional capacities are developed within an anchor movement of 0.1 times the anchor length. A 96
reference node is defined in the center of the plate and prescribed displacements are applied at the 97
reference point to perform displacement controlled analysis. Standard boundary conditions are al-98
so applied to the model: the base is fixed in all directions, while the vertical boundaries are fixed 99
in the lateral direction and free to move vertically. In all the models with a plane of symmetry, the 100
nodes on the plane of symmetry are only allowed to move in the plane. 101
3- Challenges of the Numerical Modeling 102
Unrealistic stress distributions arise from the displacement discontinuities that take place at the 103
edges of a rigid structure penetrating a softer material (Van Langen and Vermeer 1991) resulting 104
in higher overall resistance. The unfavorable effect on the numerical results is more severe for 105
buried structures and materials with no volume change. There are mainly two approaches to over-106
come such loss of numerical accuracy: 107
1- Mesh refinement 108
2- Contact pairs along the corners of the plate 109
As plane strain 2D analyses take much less time and fewer memory resources, they are a reliable 110
and fast way to evaluate possible solutions for this problem. 2D-FE analyses can also be adopted 111
to develop an optimal mesh size and to verify properties and length of the contact pairs in soil 112
along the plate corners through sensitivity analysis. The plate anchor is idealized as a strip with 113
length L and thickness t in 2D space. 114
3-1- Mesh refinement around the sharp edges 115
Page 6 of 20
As the detrimental effect of the stress concentration is more pronounced in thinner plates, a plate 116
with thickness of t = L/20, is considered for the preliminary 2D analysis to calculate the ultimate 117
translational (parallel to plate) bearing capacity of the strip plate. Several 2D models with coarse, 118
fine, and very fine mesh with first order 4-node plane strain quadrilateral hybrid elements, 119
CPE4H, are created. All the soil elements are fully integrated hybrid type to accommodate the 120
constant volume constraint in undrained conditions. The whole model dimensions are 9L×9L, in 121
which L is the length of the plate. The model is divided into several zones with different mesh 122
densities to minimize the degrees of freedom of the model and avoid unnecessary computational 123
effort. The finest zone extending to t = L/20 around the plate consists of square elements with di-124
mension of L/80, L/160, L/320 for the coarse, fine, and very fine meshes, respectively. A fine 125
mesh with second order hybrid square elements (CPE8H) with dimension of L/160×L/160 is also 126
created to assess the performance of higher order elements in predicting ultimate bearing capacity. 127
Only a small difference can be observed in the maximum parallel bearing capacity of the plate for 128
the fine and very fine meshes in Fig. 2. The results from the fine mesh (elements of L/160×L/160) 129
with second order elements match exactly the values of parallel bearing capacity from the very fi-130
ne mesh with first order elements. Refining the mesh improves the results and overcomes the is-131
sues of stress concentration to some extent, but the bearing capacity values do not change signifi-132
cantly after some degree of mesh refinement. The ultimate shear capacities calculated using the 133
very fine mesh or higher order elements are still 13% higher than the value obtained from the up-134
per bound plastic limit analysis. In addition, a 3D fine mesh with elements of size L/160×L/160 135
would require significant computational effort, making the numerical analysis practically impossi-136
ble to conduct. Thus, for a reasonable computational effort it seems that excessive mesh refine-137
ment fails to provide sufficiently accurate FE results for shear bearing capacity of plate anchors 138
deeply embedded in undrained clay. 139
3-2- Contact interfaces in soil along the corners of the plate 140

Page 7 of 20
An alternative solution to enhance the stress distribution on the plate edges is using contact inter-141
faces near the corners of the plate. Rowe and Davis (1977) introduced potential rupture lines near 142
the edge of an anchor to ensure accurate modeling of the singularity at the anchor tip. This ap-143
proach attempted to overcome the inhibition of free plastic flow inherent in the usual stiffness 144
formulation of the FE method by permitting the formation of velocity discontinuities in the re-145
gions of high stress and velocity gradient near the tip of the anchor plate (Rowe and Davis, 1977). 146
Van Langen and Vermeer (1991) introduced zero-thickness interface elements to enhance the un-147
realistic stress non-uniformity on surfaces with singular points. 148
Using the same general concept, and taking advantage of ABAQUS capabilities in defining various 149
types of contact relationships, this study adopts interfaces placed vertically and horizontally in the 150
soil in the vicinity of plate corners to accommodate for vertical and horizontal displacement dis-151
continuities. Each interface is defined as a couple of master and slave surfaces in the soil that can 152
slide independently from each other according to a surface to surface contact relationship (contact 153
pairs). A coefficient of friction (μ = 0.001) and a maximum contact shear stress equal to the un-154
drained shear strength of the soil (τmax = su) are adopted to simulate frictional behavior. No separa-155
tion between the master and slave surface nodes is also assumed in the direction normal to the in-156
terface. 157
As shown by O’Neill et al. (2003) and confirmed through the 2D-FE analysis, in-plane horizontal 158
movement of the rigid plate creates a plastic zone in the soil around the plate that extends for a 159
distance from the plate approximately equal to plate thickness, t. Contours of deformation in the x 160
direction for a plate under pure sliding in the 2D-FE analysis shown in Fig. 3 also confirm the ex-161
tents of this plastic zone. The 3D-FE analysis also shows a similar zone of thickness t to be affect-162
ed by the torsional rotation (Fig. 4). The finest zone wrapping around the plate contributes the 163
most to the number of elements, i.e. the computational effort in the model. 164

Page 8 of 20
Thus, this region extends for a distance from the plate equal to the plate thickness, t, to minimize 165
the number of elements. The length of the contact is also adopted equal to plate thickness. The fi-166
nal 2D mesh and the contacts placed horizontally and vertically in the vicinity of the plate corners 167
are shown in Fig. 5. The final mesh is divided into six different zones with element size decreas-168
ing as the zones become closer to the plate. Mesh tie constraints are used to constrain each active 169
degree of freedom of the slave node on the finer zone surface to the master node on the coarser 170
zone surface. FE results for the ultimate parallel bearing capacity are compared with the plastic 171
limit analysis (PLA) value presented by O’Neill et al. (2003). For a plate with t = L/20 and 172
μ=0.001, the FE-derived value of the plane strain shear bearing capacity factor is 2.77, which ex-173
ceeds the PLA result, 2.75, by less than 1%. The effect of the interface coefficient of friction, μ, 174
on the ultimate shear capacity results is evaluated for coefficient values ranging from 0.001 to 175
1000 (Fig. 6). For higher values of friction coefficient the ultimate capacity increase to about 2.85 176
and remains constant for coefficient values larger than one (μ >1), which shows a minor impact of 177
the friction coefficient on the results. Thus, the friction coefficient of μ=0.001 is adopted for the 178
interface in all the following analysis. FE results for the ultimate parallel bearing capacity also in-179
dicate that the mesh is adequately fine, contact length and properties are reasonable and the equiv-180
alent 3D mesh could give satisfactory results. 181
4- 3D finite element analysis 182
The 3D mesh is created with the same approach used for the 2D mesh (Fig. 7). The 3D model is 183
created for anchors idealized as square and rectangular (W/L = 2.0) plates with thickness t = L/20, 184
L/14, L/10, and L/7. The model dimensions are 9L×9L×5L and 9L×12L×5L for the square and rec-185
tangular plates, respectively. The 3D mesh consists of 8-node full integration 3D hybrid first order 186
elements, C3D8H. Similarly to the 2D analyses, the Von Mises constitutive model with the same 187
elastic-plastic properties is used for the soil. The contact definition of the 2D model is used at the 188
plate corners in the soil and plate-soil interface. The length of the contact and the depth of the fine 189

Page 9 of 20
mesh zone around the plate are equal to the plate thickness in all models (Fig. 4). Taking ad-190
vantage of the symmetric nature of shear-torsion loading of the plate anchor, only half of the FE 191
mesh is simulated. Standard boundary conditions are applied to the model boundaries and plane of 192
symmetry. 193
4-1- Ultimate load capacity 194
In-plane translational (parallel to plate) displacements are applied in the direction parallel to the 195
smaller (L) and larger (W) sides of the plate (x and y directions respectively) and torsion is pre-196
scribed as the rotation of the plate about the z axis. The FE results for the pure shear and pure tor-197
sional loading are reported in Tables 1 and 2, respectively, for square and rectangular (W/L = 2) 198
plates, in their normalized forms, Nsx,max, Nsy,max, and Nt,max, where: 199
,max
,max
x
sx
u
HN
LWs (1)
,max
,max
y
sy
u
HN
LWs
(2)
max,max 2t
u
TN
L Ws
(3)
where Hx, and Hy, are the horizontal (shear) reaction force in x and y directions and T is the tor-200
sional reaction moment of the rigid anchor plate about the z axis. 201
The FE ultimate shear resistance is compared with benchmark solutions: (1) the resistance factor 202
for an infinitely thin plate, which provides the minimum values of ultimate shear resistance 203
(Nsx,max=Nsy,max=2 for Hx,max=Hy,max=2suWL); (2) A PLA formulation, developed by Yang et al. 204
(2010) to evaluate the plate thickness impact on the ultimate shear capacity (Table 1): 205
x max, 2 2sx max e
u
H L tN N
s LW W L
(1) 206
ymax
, 2 2sy max e
u
H L tN N
s LW W L
(2) 207

Page 10 of 20
where Ne is the simple plane strain bearing capacity factor, equal to 7.5 (O’Neill et al. 2003). The 208
adhesion factor, , for the fully bonded condition is assumed equal to unity. The above expression 209
for pure x-shear capacity factor, Nsx,max, for a strip plate (L/W ≈ 0) reduces to Ns,max=2(1+Ne.t/L) as 210
proposed by O’Neill et al. (2003) for ultimate parallel plate capacity in 2D plane strain condition. 211
Whereas the PLA analyses under-predict FE shear capacity factors for plate thickness of t = L/20, 212
and L/14, they over-predict FE capacity factors for t = L/10 and L/7 for both square and rectangu-213
lar plates. This could be attributed to the fact that the shear bearing capacity of thicker plates is 214
less sensitive to stress concentration on plate corners because the ultimate shear bearing capacity 215
of thick plates is larger than that of thinner ones. Overall, the 1-3% difference between PLA and 216
FE results for ultimate shear capacity is minimal. The thickness has a marked impact on the plate 217
shear resistance, resulting in an approximately 40 to 120% increase for square plates of t=L/20 and 218
L/7 respectively, compared to the t=0 plate. The typical normalized load-displacement responses 219
for square and regular plates under in-plane y-shear are also depicted in Fig. 8. 220
Table 2 summarizes the FE derived maximum torsional resistance. Torsion-rotation plots are also 221
included in Fig. 9. Yang et al. (2010) also proposed a PLA solution for pure torsion, which tends 222
to over-predict resistance for plates of finite thickness (Nouri 2013), but their formulation for an 223
infinitely thin plate (Nt,max0 ) provides a lower bound value for ultimate torsional resistance: 224
2
,max 0 0
2
2 2
/ ( )
sin cos( / ) /tan tan
6 cos 4 2 6 sin 2
t max u
o o o o
o o
N T s WL
W L L Wln ln
(3) 225
where o = tan-1
(L/W). For square and rectangular plates this analytical solution yields 0.76 and 226
1.19, respectively. Torsional resistance also increases markedly with plate thickness by approxi-227
mately 40 to 90% for t=L/20 and L/7, respectively, versus the zero thickness plate. 228
4-2- Failure envelopes 229
Page 11 of 20
In order to construct the interaction curve or failure locus, two types of displacement control 230
methods are used: the swipe test and the probe test. In the swipe test approach failure locus is ob-231
tained by a single analysis in two separate steps. In the swipe test the plate is firstly displaced in 232
the direction of the degree of freedom (DoF) under examination from zero until the ultimate ca-233
pacity in that direction is reached. In the second step, the displacement is imposed in the second 234
DoF until the ultimate capacity in the new direction is fully developed. In the finite element analy-235
sis once the ultimate force is reached in the first step, there will be no more increase in the reac-236
tion force along that DoF, thus no further expansion in overall plate failure locus as the movement 237
of the plate progresses. The disadvantage of this method is that, due to the elasto-plastic “yield-238
ing” occurring within the “failure” locus, the swipe test tracks a load path marginally inside the 239
actual overall plate failure envelope (Bransby and Randolph 1998). 240
In the probe test or fixed displacement method, a single point on the failure envelope is identified 241
for each fixed ratio of the prescribed displacements. Therefore, the failure locus can be created by 242
conducting a number of finite element analyses with different displacement ratios. The prescribed 243
fixed displacement ratio gives rise to a load path beginning at the origin with an initial gradient 244
based on the elastic stiffness of the material. The path gradient decreases as approaching failure 245
envelope to follow the interaction curve and stops where there is no further increase in the forces 246
developed in each intended degree of freedom (Bransby and Randolph 1998). This method gives 247
an accurate trace of the failure envelope, but requires several FE analyses. 248
4-2-1- Combined in-plane shear and torsion 249
Fig. 10 shows examples of the swipe and probe failure envelopes for square and rectangular plates 250
of t= L/7 subjected to in-plane y-translation and torsion (Nsy – Nt). The rest of the analyzed cases 251
are not included for brevity. Note that duy/dϕ is the prescribed fixed displacement ratio for each 252
probe path, defined as the ratio of plate displacement increment in the y direction, to the increment 253
of the plate in-plane rotation. The probe curve exceeds the shear-torsion (i.e. shear prescribed first, 254

Page 12 of 20
torsion next) swipe envelope. This difference increases significantly if a torsion-shear swipe test 255
(i.e. torsion first, shear next) is carried out instead. In the torsion-shear swipe test, at the moment 256
of full development of the torsional ultimate capacity, the soil elements in regions close to the 257
middle of the plate and the plate sides are not completely plastic yet since the maximum dis-258
placements occur in the region next to the corners of the plate (See Fig. 4). Thus, the stress state of 259
the soil elements in the center is farther from failure at the end of the first stage of pure torsion. In 260
contrast, in the shear-torsion swipe test, all the soil surrounding the plate is fully plastic at the end 261
of full mobilization of the shear resistance. All the swipe tests follow the shear-torsion sequence. 262
As Fig. 10 suggests and as it was discussed earlier in the paper, the probe test approach offers 263
more accurate values since the swipe envelope travels although marginally but still inside the 264
probe curve. Therefore, probe test values are adopted and referred as FE results hereafter in the 265
paper. 266
The failure envelope (e.g. Fig. 10) can be described by two basic components: 267
1- Maximum plate resistance under pure shear (Hx,max, Hy,max) and torsion (Tmax) which quanti-268
fies the size of the envelope (discussed in previous section). 269
2- The shape of the failure envelope defined by the shear or torsional resistance normalized 270
by the corresponding maximum value (e.g. Nsy/Nsy,max -Nt/Nt,max or Hy/Hy,max - T/Tmax). 271
Fig. 11 summarizes the FE probe results in the normalized space for all the studied cases. Interest-272
ingly, the plate thickness does not seem to affect the interaction behavior of the plate under one-273
way planar shear and torsion for the range of analyzed plate thicknesses, which is typical in prac-274
tice. The interaction response is instead affected by plate aspect ratio and the direction of transla-275
tion. Thus, a best fit for each aspect ratio and eccentric translation can be adopted as a representa-276
tive failure envelope (Fig. 11). 277
The FE derived envelopes are compared with a PLA analytical solution, which was originally de-278
veloped by Nouri et al. (2014) for surface foundations (i.e. zero embedment) under combined in-279

Page 13 of 20
plane translation and torsion. The formulation is slightly modified for a deeply embedded plate of 280
zero thickness under the same loading combination. Adopting a PLA solution for zero plate thick-281
ness (PLAt=0) has several advantages: 282
- It makes the PLA formulation easier and more manageable for excel spreadsheet applications 283
and provides a straightforward benchmark solution for FE failure envelopes. 284
- Insensitivity of the normalized interaction response to plate thickness (Fig 11), makes the 285
PLAt=0 a simple yet reliable benchmark solution to evaluate the shape of failure envelope in 286
normalized space for other plate thicknesses. Details of the proposed PLA formulation are 287
summarized in Appendix A. 288
Fig. 12 compares the PLAt=0 failure envelopes with FE values. Overall, the PLAt=0 compares very 289
well with the FE failure points for the square plate, slightly overestimates the resistance of rectan-290
gular plates under eccentric shear in x-direction, and underpredicts the bearing capacity for rectan-291
gular plates subjected to sheary-torsion. Besides providing a beneficial benchmark, PLAt=0 poten-292
tially offers a simplified, yet effective, approach for finite thickness plates, if combined with the 293
ultimate resistance factors for shear (Nsx,max and Nsy,max) for t≠0 (Nouri et al. 2014). 294
Shear capacity reduction with eccentricity 295
Plotting the plate shear resistance versus the eccentricity offers an alternative and more intuitive 296
portrayal of the plate shear capacity reduction with associated torsion. Fig. 13(a) shows examples 297
of FE shear capacity reduction plots versus eccentricity for rectangular and square plates of t =L/7. 298
The y-sliding capacity reduction plots for square and rectangular plates are equivalent to sheary-299
torsion failure envelopes in Fig. 10. Since the shear capacity in Fig. 13(a) is expressed as 300
Ns=H/WLsu, the plots include both the size and shape elements for constructing a failure envelope. 301
Similarly to Fig. 11, Fig. 13(b) summarizes all the FE results with a best fit load reduction curves, 302
but in (H/Hmax - e/L) space. Fig. 13(b) indicates that plates of higher aspect ratio are more effec-303
tive in resisting eccentric loads than square plates, irrespective of the orientation of the plate with 304
Page 14 of 20
respect to shear. However, eccentric sliding in x-direction perpendicular to the longer side of the 305
plate tends to reduce the shear capacity more significantly than eccentric y-sliding. The same trend 306
was also observed in PLA capacity reduction curves for surface foundations (Nouri et al. 2014). 307
4-2-2- Co-planar shear (combined shearx-sheary) 308
FE analyses are also conducted to determine the interaction response of square and rectangular 309
(W/L=2) plates of t= L/20 and L/7 under combined co-planar shear. Typical FE examples of swipe 310
and probe envelopes for Nsx-Nsy are summarized in Fig. 14 for rectangular plate of t = L/7. 311
The shape of the co-planar normalized failure envelope in the Hx/Hx,max-Hy/Hy,max space (Fig. 15) 312
is approximately the same for all plate thicknesses and aspect ratios. Therefore, a single curve for 313
the FE data could be used to describe the normalized interaction response of plates with various 314
thicknesses and geometries. The normalized co-planar shear (Hx/Hx,max-Hy/Hy,max) failure envelope 315
can be described using the following equation: 316
, ,
, 1 0
hyhx
yxx y
x max y max
HHf H H
H H
(4)
Curve fitting yields interaction factors of hx=hy=2.5. For a zero thickness plate moving along any 317
arbitrary in-plane direction, the plate shear resistance factor is always constant and equal to 2 re-318
gardless of the direction of plate translation. A constant resistance factor results in a circular locus 319
with radius of 2 in the Nsx-Nsy space and a circle of radius 1 in Hx/Hx,max-Hy/Hy,max space (i.e. 320
hx=hy=2.0 as shown in Fig. 15). This concept has also been validated through PLA by Nouri 321
(2013). Comparison of circular (t=0) and FE shearx-sheary envelopes in Fig. 15 suggests that even 322
a slight increase in plate thickness increases the plate shear resistance against the reduction in-323
duced by another shear force applied in the perpendicular direction. This increase tends to be in-324
sensitive to plate thickness at least for t ≤ L/7 or changes in plate aspect ratio. 325
4-3- Interaction equation 326
Eq. (4) for concentric in-plane shear forces can be generalized for eccentric planar loads: 327
Page 15 of 20
,max ,max max
( , , ) 1 0
hhyhx mz
yxx y
x y
HH Tf H H T
H H T
(5)
f (Hx, Hy, T) = 0 represents an ellipsoid in the Hx/Hx,max - Hy/Hy,max - T/Tmax normalized space. 328
Since failure envelopes in the normalized space seem to be insensitive to plate thickness, the in-329
teraction factors of hx, hy, h, and mz are determined by curve fitting Eq. (5) to all FE best fit fail-330
ure envelopes for the square and rectangular plates in Figs. 11 and 15. Table 3 summarizes the 331
calculated interaction factors. 332
5- CONCLUSIONS 333
The purpose of this study is to evaluate pure translational and torsional ultimate plate capacity, as 334
well as to study the behavior of deeply embedded square and rectangular plates of finite thickness 335
under combined co-planar shear and torsion using 2D and 3D finite element (FE) simulations. 336
This study indicates the following: 337
1. Very fine meshes and higher order elements do not sufficiently eliminate stress concentration 338
and overprediction of capacity for a deeply embedded plate in undrained condition. Applica-339
tion of contacts in the vicinity of the plate corners in soil improves bearing capacity esti-340
mates. The ultimate sliding and torsional capacities, as well as the interaction factors, are re-341
ported for a range of plate thicknesses and aspect ratios common in practice (Tables 1-2 and 342
Figs. 8-9). 343
2. Plate shear resistance begins to reduce even at small eccentricity (e.g. 5% reduction for 344
e/L=0.1 for square plate as shown in Fig. 13). Shear capacity reduces at a higher rate for 345
larger eccentricity (e.g. 50% shear capacity reduction for e=0.5L or eccentric shear force at 346
the edge of square plate). 347
3. Reduction in shear resistance is affected slightly by the plate thickness but essentially de-348
creases with plate aspect ratio, since square plates are more vulnerable to reduction of sliding 349

Page 16 of 20
capacity compared to rectangular plates (Fig. 13). In general, an eccentric shear load parallel 350
to the shorter side of the plate induces greater capacity reduction in rectangular plates. 351
4. Thickness has a marked effect on a plate shear and torsional resistance. For perspective, the 352
shear resistance factor equal to Ns=2 for a zero thickness plate, increases to about 4.4 for a 353
square plate with t=L/7 (more than 100% increase). Similarly, the torsional resistance factor 354
(Nt) increases by about 90% for square and rectangular plates with t=L/7. 355
5. The shape of the shear-torsion failure envelope in the normalized space (H/Hmax - T/Tmax) is 356
insensitive to plate thickness (Fig. 11). This facilitates the application of analytical solutions 357
developed for infinitely thin plates, PLAt=0, (Nouri et al. 2014) to estimate the shape of the 358
failure envelope, which shows a reasonable agreement with FE values (Fig. 13). As shown in 359
Fig. 11, the shape of the shear-torsion failure envelope is affected by aspect ratio and the di-360
rection of the eccentric shear force. 361
6. The shape of the co-planar shear (shearx-sheary) failure envelope is generally insensitive to 362
plate geometry and thickness, at least for the cases examined (Fig. 15). 363
7. A simple relationship is proposed to describe the failure envelope in the normalized space 364
(Hx/Hx,max - Hy/Hy,max - T/Tmax). Taking advantage of the insensitivity of the shape of the fail-365
ure envelope to thickness, a representative envelope and the associated interaction factors are 366
sufficient for practical design applications. 367
368

Page 17 of 20
APPENDIX A. PLA virtual work formulation for zero thickness plate 369
For a horizontal load H applied at a distance e from the center of the plate (Fig A.1), equating ex-370
ternal virtual work W to internal energy dissipation yields to: 371
)/( eDH (A.1) 372
where is a virtual angular velocity of the plate about a rotation center located a distance from 373
the center. The rate of internal energy dissipation D is calculated by integrating the soil resistance 374
times the local velocity over the plate area: 375
/2 /2
2 2
/2 /22 ( )
W L
uW L
D s x y dxdy
(A.2) 376
The dissipation term ( D ) in the proposed solution is two times the D for a surface foundation 377
(Nouri et al. 2014), since the energy is dissipated along both top and bottom faces of the plate. 378
This factor of 2 in the dissipation term is the only difference between this derivation and the PLA 379
formulation for surface foundations (Nouri et al. 2014). 380
A least upper bound collapse load is obtained by minimizing H with respect to , which leads to: 381
DH
1
(A.3) 382
The collapse load (H) for the case of zero plate thickness becomes: 383
/2 /2
2 2/2 /22
( )
W L opt
uW L
opt
xH s dxdy
x y
(A.4) 384
where opt is the distance to the optimal center of rotation corresponding to a least upper bound. 385
Evaluation of the integral yields the following closed-form expression for H: 386

Page 18 of 20
2 21 21 2 1 2
1 2
1
2
2 2
1 1
2 2
2 2
/ 2 / 22 ln ln ( )
/ 2 / 2
/ 2
/ 2
/ 4
/ 4
u
opt
opt
b W b WH s a a W b b
b W b W
a L
a L
b a W
b a W
(A.5) 387
The eccentricity, e, associated with any arbitrarily selected is calculated from Eq. (A.1) with D 388
and H evaluated and substituted from Eqs. (A.2) and (A.4), respectively. Analytical integration of 389
Eq. (A.2) is unwieldy; however, reduction to single integration is possible to facilitate simple de-390
sign spreadsheet calculations: 391
/22 1 1
1 1 2 2/2
2 2
1
2
2 2
1 1
2 2
2 2
2 ( ) ln
/ 2
/ 2
W
uW
opt
opt
a cD s a c a c y dy
a c
a L
a L
c a y
c a y
(A.6) 392
Eq. (A.6) can be integrated between the limits -W/2 to W/2 using classical numerical integration 393
formulas. 394
Page 19 of 20
REFERENCES 1
Bransby, M. F., and Randolph, M. F. (1998). “Combined loading of skirted foundations.” 2
Géotechnique, 48(5), 637-655. 3
Chen, W. F., and Liu, X. L. (1990). Limit analysis and soil plasticity. Elsevier Publishing 4
Co., Amsterdam, The Netherlands. 5
Feng, X., Randolph, M. F., Gourvenec, S. and Wallerand, R. (2014). “Design approach for 6
rectangular mudmats under fully three-dimensional loading”, Geotechnique, 64(1), 51-63. 7
HKS Inc. (2008). ABAQUS Version 6.6 User’s Manual. Hibbitt, Karlson and Sorensen, Inc, 8
Pawtucket, Rhode Island. 9
Murff, J. D., Randolph, M. F., Elkhatib, S., Kolk, H. J., Ruinen, R. M., Strom, P. J., and 10
Thorne, C. P. (2005). “Vertically loaded plate anchors for deepwater applications.” Proc. 11
Int. Symp. on Frontiers in Offshore Geotechnics: ISFOG 2005, Perth, Australia, 31-48. 12
Nouri, H., Biscontin, G., Aubeny, C. (2014). “Undrained bearing capacity of shallow founda-13
tions under combined sliding and torsion,” ASCE Journal of Geotechnical and 14
Geoenvironmetal Engineering. Vol. 140, No. 8. 15
Nouri., H. (2013). Numerical Methods in Offshore Geotechnics: Applications to Submarine 16
Landslides and Anchor Plates. Doctoral dissertation, Texas A&M University. 17
O’Neill, M. P., Bransby, M. F., and Randolph, M. F. (2003). “Drag anchor fluke-soil interac-18
tion in clays.” Can. Geotech. J., 40, 78-94. 19
Rowe, R. K. and Davis, E. H. (1977). Application of the finite element method to the predic-20
tion of collapse loads. Research Report R310. Sydney: University of Sydney. 21
Song, Z., Hu, Y., and Randolph, M. F. (2008). “Numerical simulation of vertical pullout of 22
plate anchors in clay.” J. Geotech. Geoenviron., 134(6), 866-875. 23
Van Langen, H., Vermeer, P.A. (1991). “Interface elements for singular plasticity points.” Int. 24
J. Numer. Anal. Met., 15(5), 301-315. 25

Page 20 of 20
Wang, D., Hu, Y., and Randolph, M. F. (2010) “Three-dimensional large deformation finite 1
element analysis of plate anchors in uniform clay.” J. Geotech. Geoenviron., 136(2), 355-2
365. 3
Wei, Q., Tian, Y., Cassidy, M. J., Gaudin, C. and O'Loughlin, C. D. (2015). “Behaviour of 4
OMNI-Max anchors under chain loading.” The 3rd International Symposium on Frontiers 5
in Offshore Geotechnics. Oslo, Norway. 6
Yang, M., J. Murff, and Aubeny, C. P., (2010). “Undrained Capacity of Plate Anchors under 7
General Loading.” J. Geotech. Geoenviron., 136(10), 1383-1393. 8

List of Figures:
Fig. 1- Applied loads to idealized plate anchor: (a) pull-out force in normal operating condition;
(b) general six degrees of freedom loading after extreme loading condition
Fig. 2- Normalized shear load-displacement for different 2D-FE meshes
Fig. 3- Section view of the x-displacement contours for a plate under pure sliding
Fig. 4- Contours of displacement magnitudes for a plate under pure torsion: (a) plan view (b)
isometric section A-A
Fig. 5- Final 2D finite element mesh for a strip plate of t =L/20
Fig. 6- Ultimate shear capacity versus log of friction coefficient
Fig. 7- A typical 3D finite element mesh for a rectangular plate
Fig. 8- Load-displacement curves for plates under y-translation: (a) square; (b) rectangular
(W/L=2) plates
Fig. 9- Torsion-rotation plots for square and rectangular plates
Fig. 10- Typical FE sheary-torsion failure envelopes for: (a) square; (b) rectangular plates
Fig. 11- FE normalized failure envelopes for plates under combined shear-torsion
Fig. 12- FE vs PLAt=0 normalized failure envelopes for plates under combined shear-torsion
Fig. 13- FE shear resistance reduction with eccentricity: (a) example of ultimate resistance for
plates of t=L/7; (b) normalized resistance for plates of various thicknesses
Fig. 14- Typical FE failure envelopes for plate subjected to co-planar shear (shearx-sheary)
Fig. 15- FE normalized failure envelopes for plates under co-planar shear
Figure A.1- Model for PLA virtual work approach for zero thickness plate (PLAt=0) under
combined sliding-torsion
List of Figures

(a)
(b)
Fig. 1- Applied loads to idealized plate anchor: (a) pull-out force in normal operating
condition; (b) general six degrees of freedom loading after extreme loading condition

Fig. 2- Normalized shear load-displacement for different 2D-FE meshes
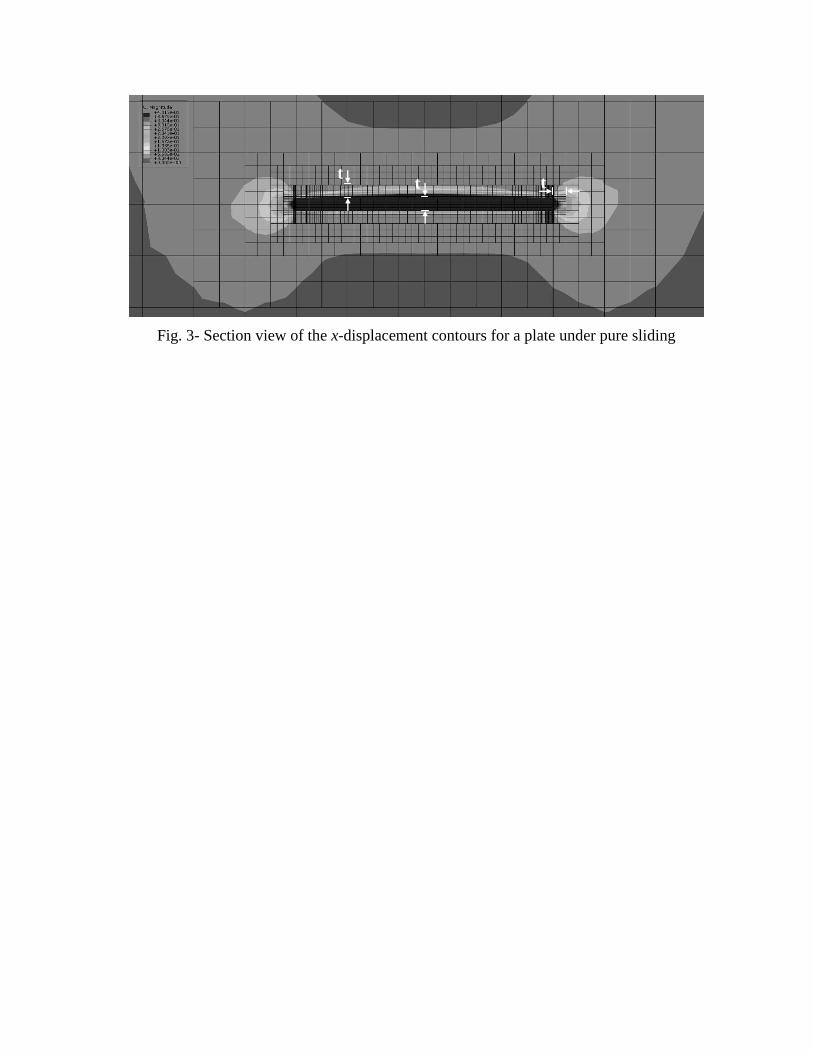
Fig. 3- Section view of the x-displacement contours for a plate under pure sliding
t t t

(a) (b)
Fig. 4- Contours of displacement magnitudes for a plate under pure torsion:
(a) plan view (b) isometric section A-A
A A
t
t
t
t
t/2
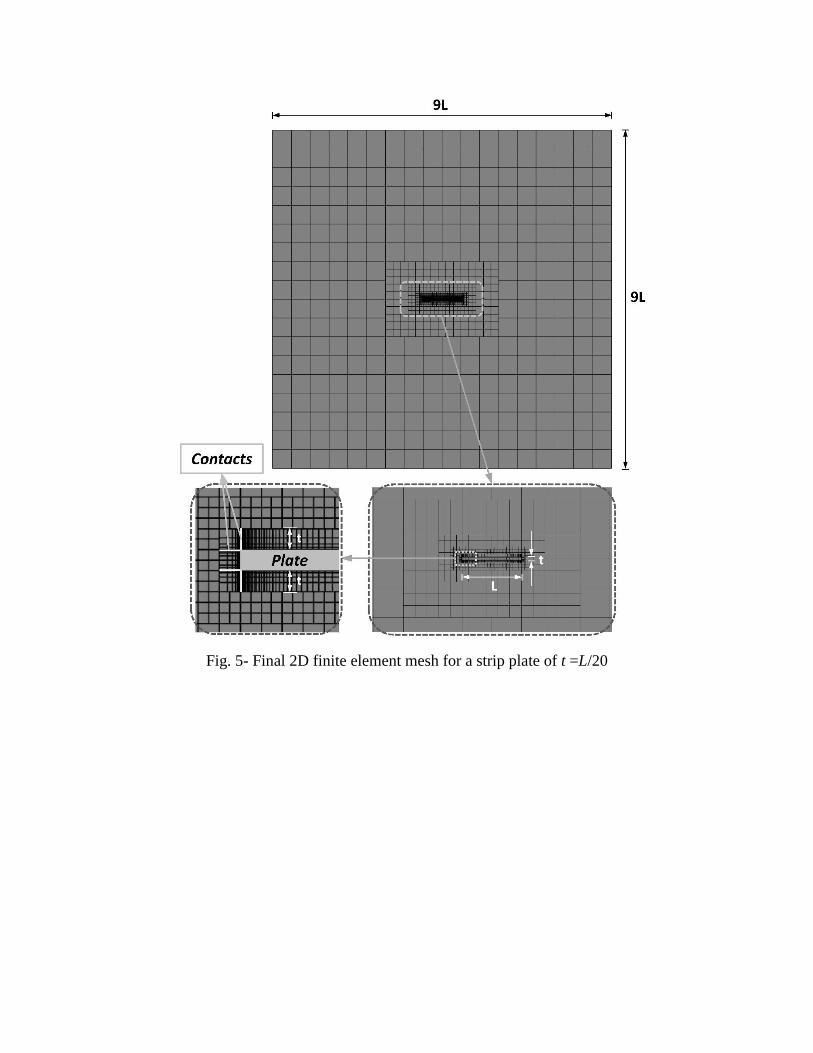
Fig. 5- Final 2D finite element mesh for a strip plate of t =L/20

Fig. 6- Ultimate shear capacity versus log of friction coefficient

Fig. 7- A typical 3D finite element mesh for a rectangular plate

(a)
(b)
Fig. 8- Load-displacement curves for plates under y-translation: (a) square; (b) rectangular (W/L=2) plates

Fig. 9- Torsion-rotation plots for square and rectangular plates

(a)
(b)
Fig. 10- Typical FE sheary-torsion failure envelopes for: (a) square; (b) rectangular plates

Fig. 11- FE normalized failure envelopes for plates under combined shear-torsion
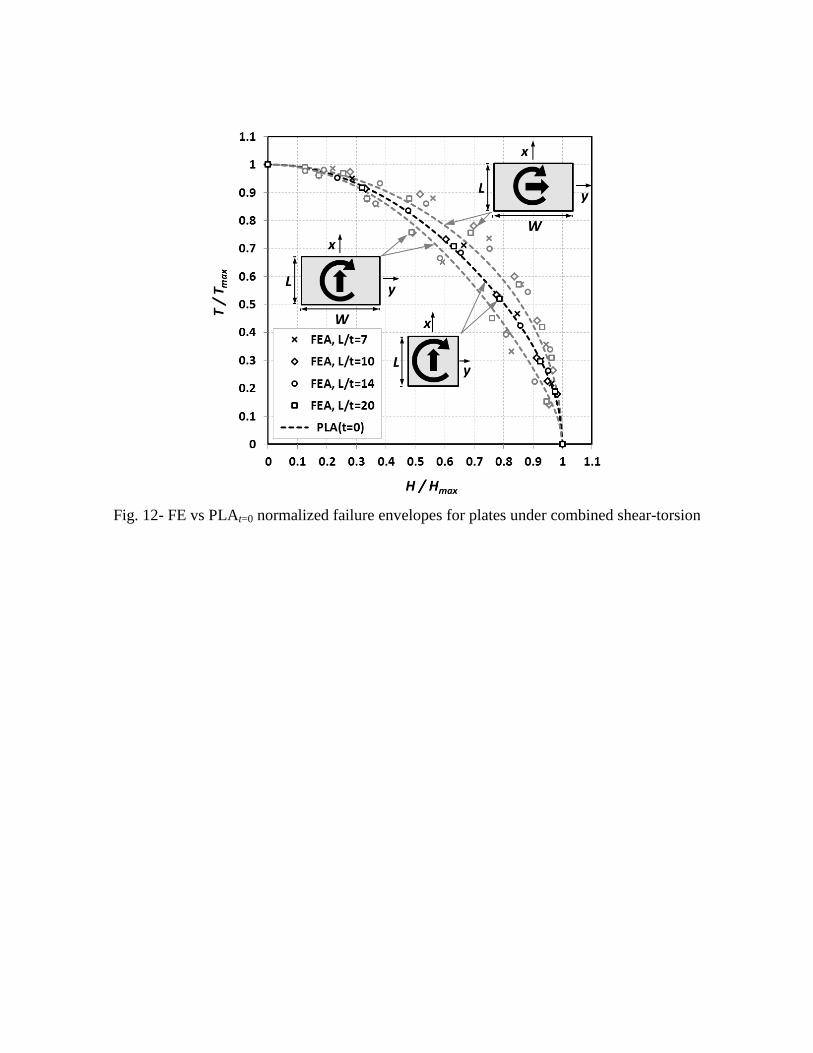
Fig. 12- FE vs PLAt=0 normalized failure envelopes for plates under combined shear-torsion

(a)
(b)
Fig. 13- FE shear resistance reduction with eccentricity: (a) example of ultimate resistance for plates of
t=L/7; (b) normalized resistance for plates of various thicknesses
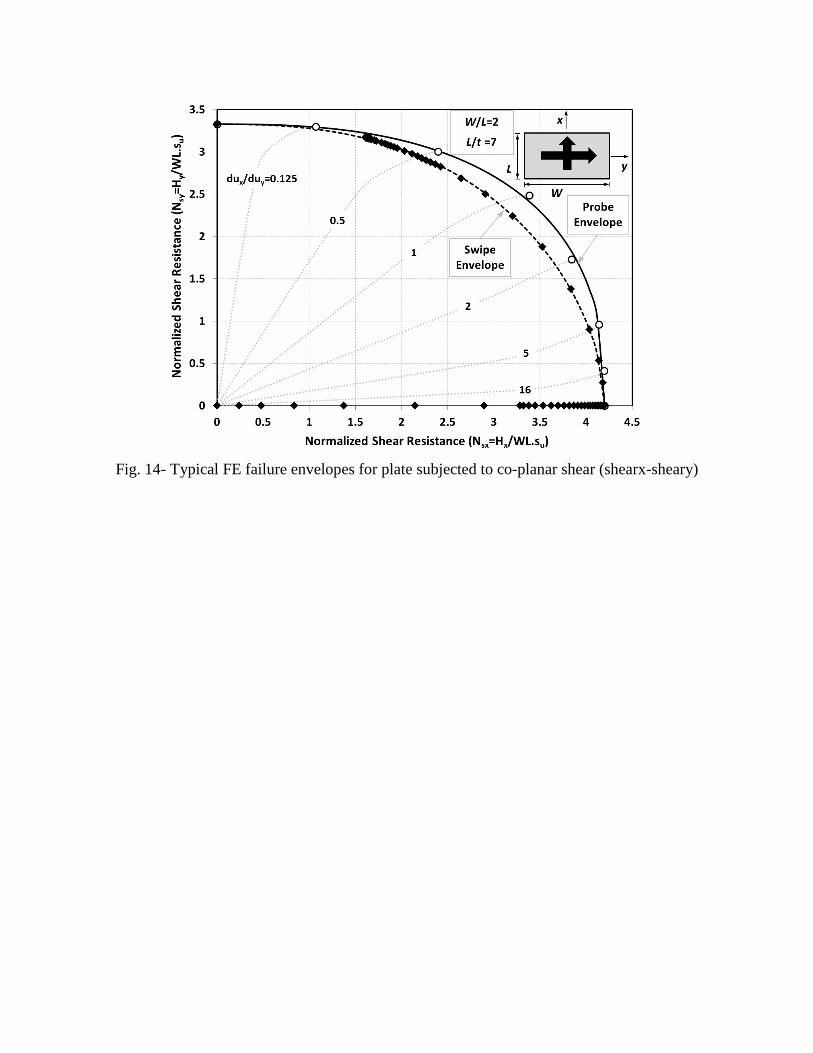
Fig. 14- Typical FE failure envelopes for plate subjected to co-planar shear (shearx-sheary)

Fig. 15- FE normalized failure envelopes for plates under co-planar shear

Figure A.1- Model for PLA virtual work approach for zero thickness plate (PLAt=0) under
combined sliding-torsion