Numerical Modelling of Riveted Railway Bridge …epubs.surrey.ac.uk/47130/2/Imam et al -...
24
1 Numerical Modelling of Riveted Railway Bridge Connections for Fatigue Evaluation Boulent M. Imam * , Timothy D. Righiniotis and Marios K. Chryssanthopoulos School of Engineering, University of Surrey, Guildford, GU2 7XH, United Kingdom * Corresponding Author. Tel: +44-1483-686652; Fax: +44-1483-450984: Email address: [email protected]; Postal address: School of Engineering (C5), University of Surrey, Guildford, Surrey, GU2 7XH, United Kingdom Abstract Past experience has shown that stringer-to-cross-girder connections in riveted railway bridges are susceptible to fatigue cracking. This fatigue damage is caused by secondary stresses, which develop in the different components of the connection. For this reason, more detailed analysis techniques are needed to capture this type of behaviour. In this paper, a finite element (FE) model of a typical riveted railway bridge is developed by incorporating the detailed local geometry of a stringer-to-cross-girder connection into the global bridge model. Prior to the development of this model, benchmark FE studies are carried out on a double-lap joint and the results are presented in terms of stress concentration factors and stress gradients. Further verification studies are carried out on a local bridge connection FE model, in terms of its rotational stiffness. Following this investigation, a refined FE model of the bridge is analysed under the passage of a freight train. Principal stress histories at different components of the connection are obtained, which are then combined with the plain material S-N curve, in order to identify the most fatigue-critical locations of the connection. These are identified as being the rivet holes and, in some cases, the angle fillet. By considering different rivet clamping stresses and different rivet defect scenarios it is found that the most damaging effects are caused by the presence of clearance between the rivet shank and the hole, and the loss of a rivet. The rivet clamping stress is also found to affect fatigue damage considerably. Keywords: Finite element method; riveted bridges; fatigue damage; S-N method. 1. Introduction During the past few decades, different research initiatives, focusing on the fatigue performance of riveted railway bridges, have been carried out. In view of the large number of these bridges in North America and
Transcript of Numerical Modelling of Riveted Railway Bridge …epubs.surrey.ac.uk/47130/2/Imam et al -...
1
Numerical Modelling of Riveted Railway Bridge Connections for
Fatigue Evaluation
Boulent M. Imam*, Timothy D. Righiniotis and Marios K. Chryssanthopoulos School of Engineering, University of Surrey, Guildford, GU2 7XH, United Kingdom
*Corresponding Author. Tel: +44-1483-686652; Fax: +44-1483-450984: Email address:
[email protected]; Postal address: School of Engineering (C5), University of Surrey, Guildford, Surrey, GU2 7XH, United Kingdom
Abstract
Past experience has shown that stringer-to-cross-girder connections in riveted railway bridges are
susceptible to fatigue cracking. This fatigue damage is caused by secondary stresses, which develop in the
different components of the connection. For this reason, more detailed analysis techniques are needed to
capture this type of behaviour. In this paper, a finite element (FE) model of a typical riveted railway
bridge is developed by incorporating the detailed local geometry of a stringer-to-cross-girder connection
into the global bridge model. Prior to the development of this model, benchmark FE studies are carried
out on a double-lap joint and the results are presented in terms of stress concentration factors and stress
gradients. Further verification studies are carried out on a local bridge connection FE model, in terms of
its rotational stiffness. Following this investigation, a refined FE model of the bridge is analysed under
the passage of a freight train. Principal stress histories at different components of the connection are
obtained, which are then combined with the plain material S-N curve, in order to identify the most
fatigue-critical locations of the connection. These are identified as being the rivet holes and, in some
cases, the angle fillet. By considering different rivet clamping stresses and different rivet defect scenarios
it is found that the most damaging effects are caused by the presence of clearance between the rivet shank
and the hole, and the loss of a rivet. The rivet clamping stress is also found to affect fatigue damage
considerably.
Keywords: Finite element method; riveted bridges; fatigue damage; S-N method.
1. Introduction
During the past few decades, different research initiatives, focusing on the fatigue performance of riveted
railway bridges, have been carried out. In view of the large number of these bridges in North America and

2
Europe, as well as their considerable age, which in many cases already exceeds 100 years, different
methodologies for their fatigue assessment have been developed [1,2]. Most of these efforts have aimed at
estimating the remaining fatigue lives of the primary bridge members, such as stringers [3-6], cross-
girders [4,6-8], truss diagonals [3] or truss hangers [4-6], employing simple structural bridge models with
beam elements. Identification of the fatigue-critical members was usually carried out empirically.
However, most of the fatigue damage that has been reported on riveted bridges has been observed on the
riveted connections between the primary members. This damage has been attributed to secondary effects
such as out-of-plane deformations [9,10]. For this reason, refined finite element (FE) models of riveted
bridge connections, consisting of an assembly of a few stringers, cross-girders and the connection
components (angle, rivets) have been investigated in the recent past [11,12]. Stress analysis of these
models, which were carried out under single point loads application, have revealed that the angle fillet
and the rivet head-to-shank junction are fatigue-critical locations where cracks may initiate. While the
criticality of these locations has been confirmed through full-scale experiments on bridge parts [13], no
quantitative estimates of fatigue damage based on full train stress histories in conjunction with detailed
connection models have been reported so far.
In a previous study [14], the FE model of a typical short-span, plate girder, riveted railway bridge was
constructed using exclusively shell elements and analysed in order to determine the most fatigue-critical
connections of the bridge. This bridge model, which is shown together with its relevant dimensions in
Fig. 1, was used to produce stress histories under historical and present day train traffic. By assuming that
the connections were fully fixed and considering the Miner damage, the inner stringer-to-cross-girder
connections were found to be the most highly-damaged, as indicated in Fig. 1 [14,15]. The fixed
connection assumption made in [14] has been shown to result in the highest fatigue damage [16].
Furthermore, previous studies have demonstrated that this assumption results in stress histories, which are
in better agreement with field measurements in similar bridges [17].
Although the type of modelling used in [14,16] permits ranking of the connections in terms of their
fatigue criticality, it does not take into account the local connection geometry. However, fatigue cracks
may develop at different locations in the connection such as holes, rivets and angle clips. These ‘hot

3
spots’ are by virtue of their local geometry stress raisers, which naturally promote fatigue crack growth.
Depending on the location of these hot spots in a connection, the fatigue life may vary considerably.
For these reasons, in this paper, the previous global bridge model shown in Fig. 1 is enhanced at the
location of one of the most fatigue-critical stringer-to-cross-girder connections. The full connection
geometry with its detailed characteristics is taken into account in this model, which is referred to in the
sequel as the ‘global-local’ model. However, three-dimensional (3-D), FE modelling of a riveted
connection involves not only its geometrical representation, but also has to take into account various
features such as contact and friction between the connecting parts as well as the clamping forces in the
rivets. Prior to the development of such a complex model, a simple double-lap, riveted joint,
incorporating these features, is investigated here using the FE method. The results of this benchmark
study are presented in the form of stress concentration factors (SCF) and stress gradients around the rivet
hole and are compared with published results. Further to this study, a 3-D FE model of a riveted bridge
connection consisting of an assembly of a cross-girder and two stringers is also developed. Comparisons
of its rotational stiffness with the results on similar types of connection presented elsewhere are carried
out.
Following these benchmark studies, the local connection geometry is incorporated in the global bridge
model shown in Fig. 1. The analyses of the global-local model are carried out under the passage of a BS
5400 [18] freight train over the bridge. Principal stress histories are obtained at various locations in the
connection and fatigue damage is estimated using the plain material S-N curve and Miner’s rule. In doing
so, the different components of the connection are ranked according to their S-N-calculated fatigue
damage. The effect of rivet clamping force and various rivet defect scenarios on fatigue damage is
investigated, and fatigue crack initiation patterns from the hot spots are presented.
2. Benchmark Studies
2.1. Riveted Double-Lap Joint
The FE model of the double-lap joint is shown in Fig. 2(a) together with its dimensions. This joint, which
was investigated by Carter [19], consists of two outer plates with a thickness of 9.5 mm each, a middle
plate with a thickness of 11.1 mm and a single 25.4 mm diameter rivet. The top and bottom plates are

4
translationally fixed on their right end faces B1-B2 and C1-C2, respectively. The load is applied on the
left face of the middle plate as a uniform pressure P. In order to enable comparisons with published
results, a very low clamping stress of 1 MPa is considered in the analysis. The FE mesh of the double-lap
joint consists of approximately 11600 elements and 45000 degrees of freedom.
The FE analyses are performed with the commercial FE-code ABAQUS [20]. Contact between the
individual parts of the assembly (plate-to-plate, rivet head-to-plate and rivet-to-hole) is modelled using
contact pairs and the master-slave surface algorithm of ABAQUS. 8-noded brick elements with full
integration are used to model the plates and rivet. A Coulomb friction model with an assumed coefficient
of friction of 0.3 is considered in the analysis. The surfaces of the rivet head are forced to remain in
contact with the plates throughout the analysis. The clamping stress in the rivet is modelled using the
*PRE-TENSION SURFACE* option of ABAQUS at the mid-length location of the rivet. The plates and
rivet are assumed to behave elastically with a Young's Modulus of 200 GPa and a Poisson's ratio of 0.3.
The FE analysis is performed in two steps. The clamping stress in the rivet is applied during the first step.
In the second step the external load is applied in addition to the clamping stress. Following the
recommendations made in [21,22], 4 layers of brick elements are used here through the thickness of each
plate and 24 elements around the perimeter of the rivet.
The results obtained from the analysis of the double-lap joint are presented here in the form of SCF, stress
distributions and stress gradients at the edge of the hole. A total of six points, two on each plate, at their
top and bottom surfaces, are investigated as shown in Fig. 2(b). Points F and G correspond to the top
plate, points H and I to the middle plate and points J and K to the bottom plate. The SCF are compared
with values given in [23], where 3-D FE analyses of a plate with a hole subjected to loading conditions
such as remote tension, remote bending and wedge loading were carried out. Wedge loading may be
assumed to be representative of a pin bearing on the hole. The compound SCF Kp, arising from the
superposition of wedge and external tension loading, may be approximated as [23]
( )2
twp
KwrKK
+= (1)
where Kw and Kt are the SCF for wedge and remote tension loading, respectively, r is the hole radius and
w is the plate half-width. The SCF for wedge loading is defined as

5
rtPK w 2
11
′=
σ (2)
where σ11 is the longitudinal stress at the point of consideration, P´ is the wedge load (= P×2w×t) and t is
the thickness of the relevant plate. Kt is defined in the usual way as
PKt
11σ= (3)
Stress concentration equations for Kt and Kw were developed in [23] by fitting the FE results to a double-
series polynomial equation in the form of
( ) ( )∑∑= =
=4
0
4
0
2
i j
jiijn tztrK α (4)
where n=t for remote tension and n=w for wedge loading and z is the depth measured along the thickness
of the plates.
Table 1 compares, at different locations indicated in Fig. 2(b), the SCF obtained from the present FE
analysis with Kp. Reasonable overall agreement may be seen between the two sets of results with the
maximum difference being 25% (top/bottom plate). The discrepancies between these results are smaller
(approximately 20%) in the case of the middle plate. These differences observed between the two sets of
results may be attributed to the fact that the pin was not modelled explicitly in [23], as was done in the
present FE analysis. Instead, pin loading was represented by applying a normal pressure loading to the
hole, having a cosine distribution throughout the plate thickness [23].
Further to the SCF results, stress gradients at the hole edge are also compared with published results. The
stress gradient at a notch is perhaps of greater importance than the SCF because fatigue crack initiation
and the crack propagation process depend primarily on the level of loading experienced ahead of the
crack tip [24]. Thus, a lower stress gradient implies a higher average stress acting over a small region
ahead of the notch and is, therefore, more critical.
Fig. 3 shows the longitudinal stress distribution, normalised by the remote stress P in each plate, along the
width of each plate from the edge of the hole (x/2w = 0.165) up to the outer edge of the plate (x/2w = 0.5).
Three sets of curves are obtained corresponding to the points shown in Fig. 2(b). The theoretical
distribution for an infinite plate with a central empty hole [25] is also shown in the figure. According to

6
the results shown in Fig. 3, a crack would be expected to initiate at the edge of the hole in the middle
plate, at the interface between the plates. This type of damage has been observed in fatigue tests carried
out on steel riveted lap joints [19,26]. Moreover, it can also be seen in Fig. 3 that a hole containing a rivet
results in a higher SCF than an empty hole and is, therefore, more fatigue-critical. This is due to the effect
of rivet bearing which is the most important source of stress concentrations in rivet-loaded holes [19].
The relative stress gradient at edge of the hole (x/2w = 0.165) can be calculated as [27]
dxd
Q 11
max
1 σσ
= (5)
where σmax is the peak stress. By using the theoretical stress distribution [25], Fuchs and Stephens derived
an expression for the relative stress gradient at the edge of the hole in an infinite plate, which is given as
[27]
rQ 33.2−= (6)
In [28], a different expression for Q was given as
rSCFQ 112 ⎟
⎠⎞
⎜⎝⎛ +−= (7)
On the other hand, the values obtained from [29] are for the case of finite width plates with a central hole.
These values were obtained by using a number of different exact analytical solutions for the stresses in
the neighbourhood of a circular hole in conjunction with Eq. (5).
Table 2 compares the relative stress gradients estimated from the FE results with different values obtained
from the literature. As can be seen, the FE results agree well with the results published in the literature
with the maximum difference being of the order of 50%. The differences observed between the FE and
the analytical results may be attributed to the fact that the latter are used for the case of a plate with an
empty hole. The lower stress gradients obtained by the FE analysis confirm the higher criticality of a
rivet-loaded hole when compared to an empty hole.
Overall, the FE results obtained from the analysis of the double-lap joint showed good agreement with
theoretical results obtained from the literature in terms of both SCF and stress gradients.
2.2. Local bridge connection model

7
Here, a local riveted bridge connection model is developed using the modelling techniques discussed
previously. The refined connection model, which consists of an assembly of a cross-girder and two
stringers, is shown in Fig. 4. The two ends of the cross-girder and the end of one stringer are modelled as
fixed. The remaining stringer is modelled as a cantilever. The connection consists of four 76×76×12.6
mm angles, each riveted to the stringer and cross-girder webs using two and three 19 mm rivets,
respectively. All the connection angles, the rivets and part of the cross-girder and the stringers are
modelled by using 8-noded brick elements with full integration. The remaining part of the assembly is
modelled using 8-noded shell elements. A shell-to-solid interface is used for the transition from the shell
elements away from the connection to the brick elements. Different clamping stresses, assumed to be
equal in all the rivets, were considered. These ranged between 50 to 200 MPa, which are in broad
agreement with field observations [30,31]. A Young's Modulus of 200 GPa, Poisson's ratio of 0.3 and
linear elastic behaviour is assumed for the FE analyses. A point load Fa is applied on one of the stringers
at an arbitrary distance from the connection as shown in Fig. 4 and is increased in steps in order to
investigate the moment-rotation behaviour of the connection.
The moment-rotation behaviour of the connection is shown in Fig. 5 for different values of the rivet
clamping stress (50-200 MPa) labelled as C50 to C200 in the legend. The rotation reported in the figure is
the relative rotation of the stringer with respect to the cross-girder, as shown in the inset of Fig. 5. The
initial slopes of the moment-rotation curves (up to approximately 0.001 rad) are slightly higher than the
slopes of the remaining part of the curves. This may be attributed to the effect of friction which is taken
into account in the FE model by defining a coefficient of friction of 0.3 between the surfaces that are in
contact. The rotational stiffness of the connection can be seen to be only marginally affected by the rivet
clamping stress. This was also observed in [12] through FE analyses of a stringer-to-cross-girder
connection.
Table 3 compares the rotational stiffness of the connection, corresponding to a 50 MPa and 200 MPa rivet
clamping stress with values published in the literature. With the exception of [32] and [36], which
considered stringer-to-cross-girder connections, the remaining published analytical models were
developed in order to represent the rotational stiffness of double-angle, beam-to-column connections. In
[32-34], the connection angle was modelled as a series of beam elements and it was assumed that it is
8
fixed at the centreline of the fasteners and that the column flange to which the beam is connected is rigid.
In [35], the part of the angle connected to the column flange was modelled as a thick plate. In [36], which
was based on a number of tests carried out on various connections, the connection stiffness was related to
the number and size of the rivets. The large differences observed in Table 3 can be attributed to the
different assumptions used in the analytical models. The results of the present FE model can be seen to lie
below the analytical results but considerably higher than the prediction of the test-based model. The
stringer-to-cross-girder connection behaviour predicted by the FE analysis is more flexible when
compared to the analytical models for beam-to-column connections. In the case of stringer-to-cross-girder
connections, the cross-girder web to which the stringer is connected is more flexible thus resulting in a
lower rotational stiffness than the beam-to-column connections where the column flange was assumed
rigid. Another reason for the high rotational stiffnesses predicted by the analytical models is the
assumption that the leg of the angle connected to the column flange is fixed at the centreline of the
fasteners. It would appear that the angle is only partially fixed at that location. The thick plate
representation in [35] can be seen to predict an even more rigid connection behaviour than the others
resulting in the highest rotational stiffness value.
3. Global-Local Fatigue Analysis
3.1. Model Description
Details on the global bridge model (Fig. 1), which was constructed using shell elements, may be found in
[14]. Fatigue studies [14] identified the inner stringer-to-cross-girder connections as the most fatigue-
critical. Here, the local FE model of Fig. 4 is incorporated in the global model in one of these critical
locations as shown in Fig. 6. This type of modelling permits fatigue damage calculations to be carried out
for the individual components of the connection (angles, rivets). Furthermore, the global-local model
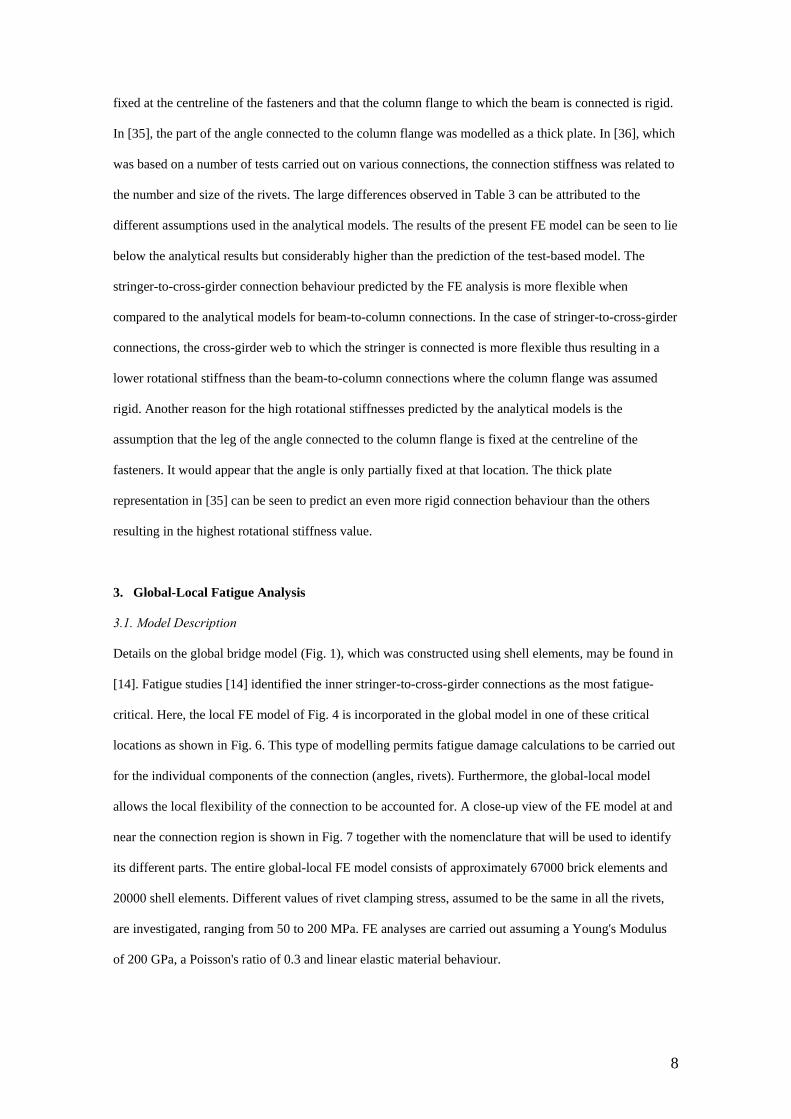
allows the local flexibility of the connection to be accounted for. A close-up view of the FE model at and
near the connection region is shown in Fig. 7 together with the nomenclature that will be used to identify
its different parts. The entire global-local FE model consists of approximately 67000 brick elements and
20000 shell elements. Different values of rivet clamping stress, assumed to be the same in all the rivets,
are investigated, ranging from 50 to 200 MPa. FE analyses are carried out assuming a Young's Modulus
of 200 GPa, a Poisson's ratio of 0.3 and linear elastic material behaviour.

9
3.2. Bridge Loading
The bridge is loaded with the BS 5400 train No 7 [18], which consists of an engine car in front followed
by ten similar wagons. This train has a maximum axle load of 25 tons. For the purposes of the analyses,
the train is traversed in 1 m steps over one track of the bridge, as shown in Fig. 6, up to the point of load
repetition, which is caused by the passage of the same wagons. Axle loads are applied directly on the top
flange of the stringers neglecting the beneficial effect of any load spread due to the rails and sleepers.
However, the self-weight of the bridge members and the superimposed dead load due to the sleepers and
rails are taken into account in the FE model. The loads are applied quasi-statically and no dynamic
amplification is considered.
3.3. Fatigue Damage Calculation
The damage caused by the passage of the train is calculated by first converting the FE principal stress
histories at various connection hot spots into stress range blocks using the rainflow counting method and
then applying Miner's rule. A design (mean minus two standard deviations) S-N curve, related to
wrought-iron plain material [37], is used for the calculation of fatigue damage. The fatigue limit for this
detail class is equal to 65 MPa at 107 cycles and the slope of the S-N curve above the fatigue limit is equal
to 1/4. A two-slope S-N curve is used as proposed by BS 5400 [18] for variable amplitude loading. The
change of slope from 1/m to 1/(m+2) occurs at 107 cycles. Accordingly, the fatigue damage for a single
train passage will be given as
( )
( )
( )
( )4444 34444 21444 3444 21
0
2
0
1
1
2
07
1 07 1010
σσσσ
σ
σ
σ
σ
Δ≤Δ
=
+
Δ≥Δ
=∑∑ ⎥
⎥⎦
⎤
⎢⎢⎣
⎡
Δ
Δ+
⎥⎥⎦
⎤
⎢⎢⎣
⎡
Δ
Δ=
jpip for
k
j
mjpj
for
k
i
mipi nn
D (8)
where (Δσp)i and (Δσp)j are the ith and jth principal stress ranges, ni and nj are the number of cycles in each
(Δσp)i and (Δσp)j, and k1 and k2 represent the number of different stress range blocks respectively above or
below the fatigue limit Δσ0.
3.4. Rivet Defect Scenarios
In addition to different rivet clamping stresses (50 to 200 MPa), the effect of different rivet defect
scenarios on fatigue damage is also investigated. These scenarios are considered for rivet 1 (see Fig. 7),
based on field observations, which have shown that fatigue damage in stringer-to-cross-girder

10
connections is more likely to occur in either the top or the bottom rivets [32]. The scenarios, which are
considered here are (i) loss of clamping force, (ii) complete loss of the rivet, (iii) partial loss of the rivet
head, (iv) offset of the rivet head and (v) presence of a clearance between the rivet and its hole.
Loss of clamping stress in a rivet may be gradual over a number of years through relaxation of the rivet
due to vibrations and fretting between the connection components [32]. Moreover, tensile overloads in the
rivets may also cause local yielding in the rivet head-to-shank junction leading to a partial or even
complete loss of clamping force. The complete loss of a rivet, which is modelled by simply removing the
rivet from the FE model, may result from its fatigue failure. A small rivet head may be caused by poor
pressing during the riveting process or due to material loss caused by corrosion. For the purposes of the
present study, a smaller rivet head of 12 mm radius, as compared to the 16 mm radius of the original rivet
head, is assumed for rivet 1. Rivet head offset may result from eccentric punching during assembly of the
connection. In the present study, a 3 mm eccentricity of the rivet 1 head towards the outer edge of the
angle is assumed. Clearances between the rivet and its hole may come about through insufficient heating
and/or punching during the riveting process or through material loss from corrosion of the rivet shank.
For the purposes of the analyses, a 0.5 mm clearance between rivet 1 and its corresponding hole is
examined.
3.5. Results and Discussion
The FE analyses of the global-local model under train loading have identified several regions of high
stress concentration in the connection. In general, the positions of these highly-stressed (hot spot) regions
vary as the train is traversed over the bridge. Despite this, hot spots were typically located along the
connection angle fillet, along the circumference of the rivet holes on the face of the connection angle
which is in contact with the cross-girder and the stringer webs, and on the rivets around their
circumference at the head-to-shank junction.
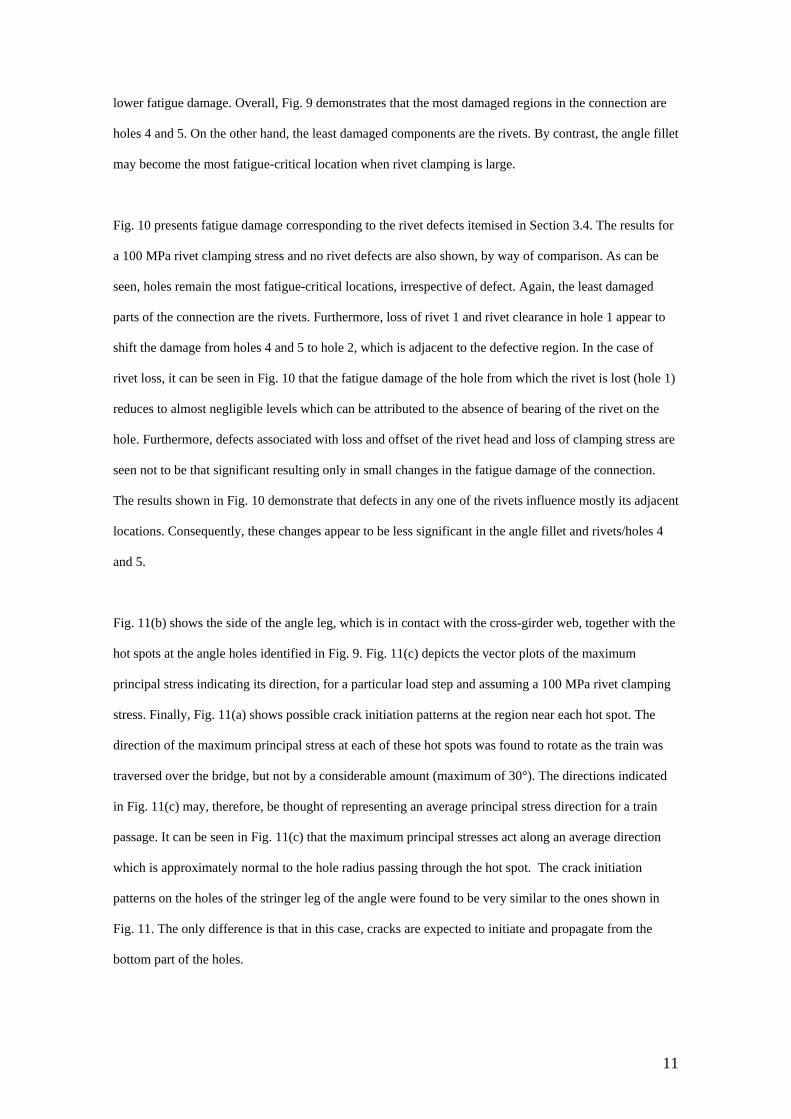
The fatigue damage was calculated using Eq. (8), for a number of points in the highly-stressed regions.
Based on these calculations the most fatigue critical hot spots are shown in Fig. 8. Fig. 9 depicts the
single train fatigue damage of the hot spots shown in Fig. 8, for different clamping stresses. As can be
seen in Fig. 9, with the exception of the angle fillet location, a higher rivet clamping stress results in
11
lower fatigue damage. Overall, Fig. 9 demonstrates that the most damaged regions in the connection are
holes 4 and 5. On the other hand, the least damaged components are the rivets. By contrast, the angle fillet
may become the most fatigue-critical location when rivet clamping is large.
Fig. 10 presents fatigue damage corresponding to the rivet defects itemised in Section 3.4. The results for
a 100 MPa rivet clamping stress and no rivet defects are also shown, by way of comparison. As can be
seen, holes remain the most fatigue-critical locations, irrespective of defect. Again, the least damaged
parts of the connection are the rivets. Furthermore, loss of rivet 1 and rivet clearance in hole 1 appear to
shift the damage from holes 4 and 5 to hole 2, which is adjacent to the defective region. In the case of
rivet loss, it can be seen in Fig. 10 that the fatigue damage of the hole from which the rivet is lost (hole 1)
reduces to almost negligible levels which can be attributed to the absence of bearing of the rivet on the
hole. Furthermore, defects associated with loss and offset of the rivet head and loss of clamping stress are
seen not to be that significant resulting only in small changes in the fatigue damage of the connection.
The results shown in Fig. 10 demonstrate that defects in any one of the rivets influence mostly its adjacent
locations. Consequently, these changes appear to be less significant in the angle fillet and rivets/holes 4
and 5.
Fig. 11(b) shows the side of the angle leg, which is in contact with the cross-girder web, together with the
hot spots at the angle holes identified in Fig. 9. Fig. 11(c) depicts the vector plots of the maximum
principal stress indicating its direction, for a particular load step and assuming a 100 MPa rivet clamping
stress. Finally, Fig. 11(a) shows possible crack initiation patterns at the region near each hot spot. The
direction of the maximum principal stress at each of these hot spots was found to rotate as the train was
traversed over the bridge, but not by a considerable amount (maximum of 30°). The directions indicated
in Fig. 11(c) may, therefore, be thought of representing an average principal stress direction for a train
passage. It can be seen in Fig. 11(c) that the maximum principal stresses act along an average direction
which is approximately normal to the hole radius passing through the hot spot. The crack initiation
patterns on the holes of the stringer leg of the angle were found to be very similar to the ones shown in
Fig. 11. The only difference is that in this case, cracks are expected to initiate and propagate from the
bottom part of the holes.

12
Fig. 12(b) shows the hot spot at the angle fillet, assuming a 100 MPa clamping stress. Also shown in Fig.
12(c) are vector plots of the maximum principal stress at the hot spot for a particular load step. Finally,
Fig. 12(a) depicts a possible crack initiation pattern at the fillet region. The direction of the maximum
principal stress at the fillet hot spot was also found to rotate as the train was traversed over the bridge, by
a maximum angle of 35°.
Although the present FE results show that the rivets are the least damaged components of the connection,
fatigue cracking in these has been reported on a number of occasions [10,32]. For this reason, fatigue
crack initiation patterns based on the present FE results are also presented for the rivets. The region of the
hot spot on rivet 1 is shown in Fig. 13(b). Fig. 13(c) shows vector plots of the maximum principal stress
at the hot spot, for a particular load step, while Fig. 13(a) depicts a possible crack initiation pattern at the
rivet. The direction of the maximum principal stress was found to rotate slightly by a maximum angle of
20° as the train was traversed over the bridge. As can be seen in Fig. 13(a), the expected crack initiation
direction is slightly inclined and will eventually lead to rivet head pop-out. This type of damage pattern
was predicted by the FE analyses for all the rivets of the connection.
The fatigue crack initiation hot spots predicted by the FE results are similar to fatigue damage cases
observed in recent field investigations in which cracks have been detected in stringer-to-cross-girder
connections initiating from either the connection angle fillet or from the rivet holes [9,10,32]. The FE-
predicted direction of the cracks initiating in the angle fillet is also in broad agreement with the crack
initiation patterns observed in a series of full-scale tests of stringer-to-cross-girder connections [10]. Rivet
head pop-outs resulting from cracks similar to the ones predicted by the FE analyses (Fig. 13) have also
been detected in the field [9,10,32].
It should be noted that the damage patterns presented in Figs. 11 to 13 are an indication of the crack
initiation phase only. These crack orientations would most certainly change as the length of the crack
increases. The present model is not able to capture crack development.
Lastly, the results presented in Figs. 9 and 10 should not be viewed as an absolute prediction of the
fatigue strength of the investigated connection. The global-local FE analysis was carried out in order to

13
investigate the relative criticality of the different connection components (angle fillet, rivet holes, rivets).
The points of crack initiation presented in Figs. 11 to 13 are also points of numerical singularities.
Convergence studies using the global-local FE model revealed that the stresses obtained from the FE
analysis do not converge with increasing mesh density. The ‘hot-spot stress method’, which has been
developed in the past, appears to overcome this inconsistency [38, 39]. However, this method has been
developed for the fatigue analysis of welded details and its applicability for non-welded details, such as
riveted connections, has not yet been established.
4. Conclusions
This paper has presented fatigue damage results obtained from FE analyses of a riveted railway bridge.
FE modelling techniques were initially verified through benchmark studies on a double-lap joint and a
local riveted bridge connection model in terms of stress concentration factors, stress gradients and
connection rotational stiffness. These benchmark studies showed good agreement between the FE results
and results published in the literature. A refined connection model was subsequently incorporated in the
global bridge model. Analyses of the global-local model under the passage of a freight train showed that
the rivet clamping stress has a considerable effect on the fatigue damage of the different components of
the connection. The most highly damaged regions of the connection were found to be the holes on the
stringer leg of the connection angle. By contrast, the rivets were found to be the least damaged
components of the connection. When rivet defects were considered, the most damaging cases were found
to be the presence of clearance between the rivet shank and rivet hole and the loss of a rivet. Fatigue crack
initiation patterns predicted by the FE analyses were found to be in broad agreement with field
observations.
Fatigue assessment of connections in large structures will always depend on physical experiments and
field observations, as the phenomena and types of behaviour involved are too complex and subject to
considerable uncertainties and factors that cannot be accounted for explicitly and quantitatively.
However, the numerical modelling methods presented in this paper can offer additional insight and can
help in planning and guiding any required tests.

14
Acknowledgements
The work described in this paper forms part of a project supported by EPSRC and Network Rail. The
opinions expressed are those of the authors and do not necessarily represent those of the sponsoring
organisations. We would like to thank Mr Brian Bell, Network Rail project officer for valuable
discussions and feedback.
References
[1] Kunz P, Hirt MA. Reliability analysis of steel railway bridges under fatigue loading. In: Proc IABSE
Colloquium: Remaining Structural Capacity. Copenhagen; 1993, 63-60.
[2] Tobias DH, Foutch DA. Reliability-based method for fatigue evaluation of railway bridges. J Bridge
Eng (ASCE) 1997;2(2):53-60.
[3] DiBattista JD, Adamson DEJ, Kulak GL. Evaluation of remaining fatigue life for riveted truss
bridges. Can J Civ Eng 1998;25(4):678-91.
[4] Garg VK, Chu KH, Wiriyachai A. Fatigue life of critical members in a railway truss bridge.
Earthquake Engineering and Structural Dynamics 1982;10:779-95.
[5] Jahren CT, Rooker JA. Fatigue life study for a railroad bascule bridge. Transportation Research
Record 1991;1371:65-74.
[6] Szeliski ZL, Elkholy IA. Fatigue investigation of a railway truss bridge. Can J Civ Eng 1984;11:625-
31.
[7] Brühwiler E. Measurements for evaluating the remaining service life of a riveted bridge. In: Proc
IABSE Symposium: Extending the lifespan of structures. San Francisco; 1995, 1023-8.
[8] Bhavnagri VS. Analysis and testing of an old lattice girder rail bridge. Australian Civil Engineering
Transactions 1995;CE37(3):229-39.
[9] Fisher JW, Yen BT, Wang D. NCHRP Report 302: Fatigue and fracture evaluation for rating riveted
bridges. Transportation Research Board, Washington DC; 1987.
[10] Al-Emrani M. Fatigue in riveted railway bridges – A study of the fatigue performance of riveted
stringers and stringer-to-floor-beam connections. PhD Thesis. Chalmers University of Technology,
Sweden, 2002.

15
[11] DePiero AH, Paasch RK, Lovejoy SC. Finite-element modelling of bridge deck connection details. J
Bridge Eng (ASCE) 2002;7(4):229-35.
[12] Al-Emrani M, Kliger R. FE analysis of stringer-to-floor-beam connections in riveted railway bridges.
J Constr Steel Res 2003;59(7):803-18.
[13] Al-Emrani M. Fatigue performance of stringer-to-floor-beam connections in riveted railway bridges.
J Bridge Eng (ASCE) 2005;10(2):179-85.
[14] Imam B, Righiniotis TD, Chryssanthopoulos MK. Fatigue assessment of riveted railway bridges. Int
J Steel Str (KSSC) 2005;5(5):485-94.
[15] Imam B. Fatigue analysis of riveted railway bridges. PhD Thesis, University of Surrey, 2006.
[16] Imam B, Righiniotis TD, Chryssanthopoulos MK. Connection fixity effects on stress histories in
riveted rail bridges. In: Proc 2nd Int conf bridge maintenance, safety and management. Kyoto; 2004.
[17] Philbrick TW, Zodo GW, Schiff SD. Fatigue assessment of through plate girder railway bridges. J Str
Eng (ASCE) 1995;121(11):1613-9.
[18] BS 5400. Steel, concrete and composite bridges: Part 10: Code of practice for fatigue. British
Standards Institute, London, 1980.
[19] Carter JW. Stress concentrations in built-up structural members. Proc American Railway Eng
Association 1952;53:1-34.
[20] ABAQUS. Standard user’s manual version 6.4, Hibbitt, Karlsson & Sorensen Inc, 2004.
[21] Bursi OS, Jaspart JP. Benchmarks for finite element modelling of bolted steel connections. J Constr
Steel Res 1997;43(1-3):17-42.
[22] Vegte GJVD. Numerical simulations of bolted connections: The implicit versus the explicit
approach. In: Proc ECCS/AISC workshop: Connections in steel structures V: Innovative steel
connections. Amsterdam; 2004.
[23] Shivakumar KN, Newman JC. Stress concentrations for straight-shank and countersunk holes in
plates subjected to tension, bending, and pin loading. Technical paper TP3192. NASA; 1992.
[24] Bellett D, Taylor D, Marco S, Mazzeo E, Guillois J, Pircher T. The fatigue behaviour of three-
dimensional stress concentrations. Int J Fatigue 2005;27(3):207-21.
[25] Timoshenko SP, Goodier JN. Theory of elasticity, New York: McGraw-Hill, 1970.
[26] Wilson WM, Thomas FP. Fatigue tests of riveted joints. Engineering Experiment Station Bulletin
1938;302, University of Illinois.

16
[27] Fuchs HO, Stephens RI. Metal fatigue in engineering, New York: John Wiley and Sons, 1980.
[28] Schijve J. Fatigue of structures and materials, The Netherlands: Kluwer Academic Publishers, 2001.
[29] Filippini M. Stress gradient calculations at notches. Int J Fatigue 2000;22(5):397-409.
[30] Akesson B. Fatigue life of riveted railway bridges, Publ. S94:6. PhD Thesis, Chalmers University of
Technology, Sweden, 1994.
[31] Zhou YE, Yen BT, Fisher JW, Sweeney RAP. Examination of fatigue strength (Sr-N) curves for
riveted bridge members. In: Proc 12th Annual Bridge Conf. Pittsburgh, 1995:102-9.
[32] Al-Emrani M. Stringer-to-floor-beam connections in riveted railway bridges – an introductory study
of fatigue performance, Publ. S99:4. Chalmers University of Technology, Sweden, 1999.
[33] Lothers JE. Elastic restraint equations for semi-rigid connections. Transactions of the ASCE
1951;116:480-94.
[34] Azizinamini A, Bradburn JH, Radziminski JB. Initial stiffness of semi-rigid steel beam-to-column
connections. J Constr Steel Res 1987;8:71-90.
[35] Kishi N, Chen WF. Moment-rotation relations of semirigid connections with angles. J Str Eng
(ASCE) 1990;116(7):1813-34.
[36] Roeder CW, MacRae GA, Kalogiros AY, Leland A. Fatigue cracking of riveted, coped, stringer-to-
floorbeam connections. Research report WA-RD 494.1, Washington State Department of
Transportation, 2001.
[37] Railtrack. RT/CE/C/025, Railtrack line code of practice: The structural assessment of underbridges,
Railtrack.
[38] Dong P. A structural stress definition and numerical implementation for fatigue analysis of welded
joints. Int J Fatigue 2001;23(10):865-76.
[39] Stress determination for fatigue analysis of welded components. IIS/IIW 1221-93. Abington,
Cambridge: Abington Publishing, 1993.

17
Table 1 SCF due to pin loading for a double-lap joint (P=30 MPa).
Location of stress concentration
Top plate Middle plate Bottom plate F G H I J K
[23] 1.08 1.08 1.07 1.07 1.08 1.08 Present study 0.97 0.86 1.32 1.32 0.86 0.97
Table 2 Stress gradients Q at the edge of the hole for a double-lap joint (P=30 MPa).
Location of stress concentration
Top plate Middle plate Bottom plate F G H I J K
FE results -0.14 -0.13 -0.14 -0.14 -0.13 -0.14 Eq. (6) [27] -0.18 -0.18 -0.18 -0.18 -0.18 -0.18 Eq. (7) [28] -0.18 -0.19 -0.18 -0.18 -0.19 -0.18
[29] -0.20 -0.20 -0.20 -0.20 -0.20 -0.20
Table 3 Rotational stiffness according to different sources.
Source Rotational stiffness (kN·m/rad)
FE (50 MPa clamping stress) 1.92×10⁴
FE (200 MPa clamping stress) 2.02×10⁴ [32] 1.00×10⁵ [33] 5.50×10⁴ [34] 4.35×10⁴ [35] 2.86×10⁵ [36] 1.42×10³

18
Figure 1 Global FE model of the bridge and relevant dimensions.
Figure 2 (a) Finite element model of a riveted double-lap joint (b) locations under consideration.
4 @ 2.4 m
1.0 m
1.0 m 1.0 m
1.0 m
1.5 m
1.5 m
Stringer (340×280 mm)
Cross-girder (320×380 mm)
Main girder (556×1220 mm)
165.1 mm
63.5 mm
79.4 mm
63.5 mm 25.4 mm
155.6 mm
77 mm
C1
C2
B2
B1
P
(a) (b)

19
0
0.5
1
1.5
2
2.5
3
3.5
4
4.5
0.165 0.2 0.235 0.27 0.305 0.34 0.375 0.41 0.445 0.48
x / 2w
σ 11/P
F and K G and J H and I Reference [25]
2w
x
P
0.5
12
Figure 3 Normalised longitudinal stress distribution along the plate width of a double-lap joint (P=30 MPa).
Figure 4 Finite element model of the stringer-to-cross-girder connection.

20
0
50
100
150
200
250
300
0 0.002 0.004 0.006 0.008 0.01 0.012 0.014 0.016 0.018 0.02
Rotation (rad)
Ben
ding
mom
ent (
kN m
)
C50 C100 C150 C200
RotationStringer
Cross-girder
12
Figure 5 Moment-rotation behaviour of the stringer-to-cross-girder connection.
Figure 6 Global-local FE model of the riveted bridge.
Local model using brick elements
Global model using shell elements Train direction
21
Figure 7 Close-up view of the global-local FE model at the connection region.
Figure 8 Hot spot locations at different parts of the stringer-to-cross-girder connection.

22
0.0E+00
5.0E-05
1.0E-04
1.5E-04
2.0E-04
2.5E-04
3.0E-04
3.5E-04
4.0E-04
Hole 4 Hole 5 Hole 1 Hole 2 AngleFillet
Hole 3 Rivet 3 Rivet 2 Rivet 1 Rivet 5 Rivet 4
Sing
le tr
ain
fatig
ue d
amag
e
50 MPa 100 MPa 150 MPa 200 MPa
C
C3
C2
B2
D4D1
B5
A1
B6
D8
D7D6 E6
E5
E3
C3
C2
Figure 9 Effect of rivet clamping stress on connection damage.
0.0E+00
5.0E-05
1.0E-04
1.5E-04
2.0E-04
2.5E-04
3.0E-04
3.5E-04
Hole 4 Hole 5 Hole 1 Hole 2 AngleFillet
Hole 3 Rivet 3 Rivet 2 Rivet 1 Rivet 5 Rivet 4
Sing
le tr
ain
fatig
ue d
amag
e
No Defects (100 MPa) Loss of clamping Rivet clearance Small rivet head Rivet head offset Rivet loss
C1
C3
B2
B1
B2
B5
B4
A1 A2
B6
D8
D7
D6 D7
D6
D4
D3
D1D5E6
E5
E2
E1 E1
Figure 10 Effect of various rivet defects on fatigue damage.

23
Figure 11 Cross-girder side of connection angle (clamping stress =100 MPa) (a) Possible crack initiation
patterns (b) Fatigue crack initiation hot spots on holes (c) Vector plot of maximum principal stresses.
Figure 12 (a) Possible crack initiation pattern on angle fillet (b) Fatigue crack initiation hot spot
(clamping stress=100 MPa) (c) Vector plot of maximum principal stress.

24
Figure 13 (a) Possible crack initiation pattern on rivet 1 (b) Fatigue crack initiation hot spot (clamping
stress=100 MPa) (c) Vector plot of maximum principal stresses.