NUMERICAL MODELLING AND DESIGN OF LOW-RISE … · 3.3.2 OpenSees beam model 26 3.4 Validation of...
126
NUMERICAL MODELLING AND DESIGN OF LOW-RISE CONCENTRICALLY BRACED FRAMES WITH DOUBLE-PIN DISSIPATIVE CONNECTIONS Nicolae Danila A Thesis in the Department of Building, Civil & Environmental Engineering Presented in Partial Fulfillment of the Requirements for the Degree of Master of Applied Science (Civil Engineering) at Concordia University Montreal, Quebec Canada December 2013 © Nicolae Danila, 2013
Transcript of NUMERICAL MODELLING AND DESIGN OF LOW-RISE … · 3.3.2 OpenSees beam model 26 3.4 Validation of...

NUMERICAL MODELLING AND DESIGN OF LOW-RISE
CONCENTRICALLY BRACED FRAMES WITH DOUBLE-PIN
DISSIPATIVE CONNECTIONS
Nicolae Danila
A Thesis in the Department of Building, Civil & Environmental Engineering
Presented in Partial Fulfillment of the Requirements for the Degree of Master of Applied Science (Civil Engineering) at
Concordia University Montreal, Quebec Canada
December 2013
© Nicolae Danila, 2013

CONCORDIA UNIVERSITY
School of Graduate Studies
This is to certify that the thesis prepared by
By: Nicolae Ionel Danila
Entitled: Numerical Modelling and Design of Low-Rise Concentrically
Braced Frames with Double-Pin Dissipative Connections
and submitted in partial fulfillment of the requirements for the degree of
Master of Applied Science (Civil Engineering)
complies with the regulations of the University and meets the accepted standards
with respect to originality and quality.
Signed by the final examining committee:
Dr. A. Bagchi Chair Dr. L. Tirca Supervisor Dr. R. Sedaghati Examiner
External (to program)
Dr. A. Bhowmick Examiner Dr. A. Bagchi Examiner
Approved by: ______________________________________________________
Chair of Department or Graduate Program Director ______________________________________________________
Dean of Faculty
Date: ______________________________________________________
ii

ABSTRACT
Numerical Modelling and Design of Low-Rise Concentrically Braced Frames
with Double-Pin Dissipative Connections
Nicolae Ionel Danila
Concentrically braced frames, CBFs, are the most popular systems used in seismic areas
in Canada, due to their large stiffness. However, after braces buckle in compression, their
stiffness is significantly reduced and their hysteresis response, displayed in terms of force-
displacement, shows an asymmetric behavior. To overcome this drawback, researchers proposed
to add fuses that were conceived to be installed either in braces or brace-to-frame connections.
The purpose of these fusses is to dissipate the earthquake input energy, while preserving braces
to respond in elastic range. In this thesis, a new type of fuse, designed to be installed in brace-to-
frame connections, is proposed. This device is labeled dissipative pin connection. Depending on
the level of axial tension/ compression force that has to be transferred from the brace to the
connection, this device can be manufactured in single-pin, double-pin and multi-pin
configurations.
The objective of this thesis was two-fold: i) to develop design rules for double-pin
connections displayed in-line and in-parallel and ii) to study the seismic response of a 4-storey
CBF building with and without dissipative connections, located in Victoria, BC.
In this thesis, the computations were carried out by means of OpenSees (open system for
earthquake engineering simulation). The numerical model developed for single-pin connection
iii

was calibrated based on experimental tests carried out at the Technical University of Lisbon.
Similarly, the double-pin connection was calibrated using the same approach. Based on
experimental test results conducted on single pin connections, design rules were proposed. It was
concluded that by doubling the pin member and employing the parallel configuration, the load-
carrying capacity of the dissipative connection increases two times, while the deflection is
similar to that experienced by an equivalent single-pin device.
The second part of this thesis emphasizes comparative results, in terms of the seismic
response of a 4-storey CBF building with and without dissipative connections. The design of the
seismic force resisting system was conducted according to CAN CSA S16-09 and NBCC 2010
provisions. The seismic response was studied under two sets of ground motions that are
representative for Victoria, BC., Canada. Both sets of crustal and subduction ground motions are
composed of seven records each.
The results have shown that forces generated in structural members were reduced due to
an increase in building period and system ductility. Thus, by lowering the axial force developed
in the CBF columns, a reduction of foundation size can be achieved, which implies reduction in
the overall building cost. The effect of earthquake type on the building response is also
discussed. However, to prove the efficiency of double-pin connections displayed in-line and in-
parallel, further experimental tests are required.
iv

Acknowledgements
Foremost, I would like to express my sincere gratitude to my advisor Prof. Lucia Tirca
for the continuous support of my Master study and research, for her patience, enthusiasm,
motivation and great knowledge. Her guidance helped me throughout the time of research and
writing of this thesis, while her iron grasp towards perfection moulded me to the present day and
forced me to strive for the very best.
Thank you to Concordia University and their precious professors, who guided, helped
me along the way and made my years in university some that I will always remember.
Mom, Dad, Alina and Cristinel you are my spiritual columns of support in a world of
shaking structural motivation.
I would like to thank the rest of my former university colleagues Cristina, Gurinderbir,
Juan David, Leon, Zhi and Aid for the moments shared during our studies and for teaching me
the foundation of a multicultural society. I hope our paths will cross again in the future!
Last but not the least, I would like to thank my wife, Diana for her immense support
throughout my thesis, spiritual enlightening and help along every step of this journey. Thank you
and I love you.
v

Table of Contents
LIST OF FIGURES viii Chapter 1. Introduction 1
1.1 General 1 1.2 Objectives and Scope 3 1.3 Description and Methodology 3 1.4 Thesis Organization 4
Chapter 2. Literature Review 7 2.1 General Overview 7 2.2 HSS Brace Fuse 8 2.3 Dissipative U-Shape Connection Device 10 2.4 Dissipative Single-Pin Connection Device 12
Chapter 3. Modelling and Design of Dissipative Pin Connections 18 3.1 Introduction of Dissipative Pin Connections 18 3.2 Dissipative Pin Connections 18 3.3 Design and Behaviour of Single-Pin Connection Device 22
3.3.1 Theoretical beam model 22 3.3.2 OpenSees beam model 26
3.4 Validation of the OpenSees model of P-A9 and P-3 joints vs. Experimental Test Results
37
3.5 Numerical Modelling of Double-Pin Connection Device 42 3.5.1 Modelling and Behaviour of Double-Pin Connection with Pins Placed In-
Parallel 42
3.5.2 Modelling and Behaviour of Double-Pin Device Placed In-Line 45 Chapter 4. Design and Behaviour of CBF in X-Bracing Configuration 50
4.1 Design of 4-Storey CBF in X-Bracing Configuration 50 4.2 Building Description 50 4.3 Members Design 56
4.3.1 Braces design 56 4.3.2 SFRS Columns and Beams Design 57
4.4 Modeling the 4-Storey CBF Building in OpenSees 59 4.4.1 The OpenSees Framework 59 4.4.2 Modeling of Beams and Columns 60 4.4.3 Braces Modeling in OpenSees 62 4.4.4 CBF model 63 4.4.5 Gusset Plates Modelling Definition 64
4.5 Dynamic Analysis of the CBF System Using OpenSees 67
vi

4.5.1 Selecting the Ground Motions 68 4.5.2 Ground Motions Scaling Procedure 71 4.5.3 Seismic Response of the Studied CBF’s 75
Chapter 5. Seismic Analysis of a 4-Storey Building Equipped with Double-pin Connections Displaced in-Parallel Using OpenSees
88
5.1 Design of the 4-storey CBF Equipped with Double-Pin Connections Displaced in-Parallel
88
5.2 Dissipative Connection Design for the 4-Storey CBF 88 5.3 Ground Motions Scaling Procedure for the 4-Storey Frame with Double-
pins Connections 91
5.4 Seismic Response of the Studied CBF with Double-pin Connections 91 5.5 CBF Frames with and without Double-pin Connections: Comparison
Results 101
5.5.1 The Analysis Run Time Under Selected Ground Motions 101 5.5.2 Interstorey Drift and Residual Inerstorey Drift resulted for all analyses 102 5.5.3 The Influence of Pinching4 Model Parameters 104
Chapter 6. Conclusions and Future work 107 6.1 Conclusions 107 6.2 Future work 111
References 113
vii

LIST OF FIGURES
Figure 2.1: HSS brace fuse configuration 9
Figure 2.2: CBF Equiped with U-Shape Connections Displaced parallel and
perpendicular to braces’s ends
10
Figure 2.3: U-Shape Connection Device 11
Figure 2.4: Pin connection configurations 12
Figure 2.5: Testing Pin Connection in CBF 13
Figure 2.6: Finite element model of the quarter connection 14
Figure 2.7: Deformation phases of the CBF brace with ends pin connections 15
Figure 2.8: Design steps of the pin member and its tri-linear curve 16
Figure 3.1: Dissipative single-pin connection, 3D view 19
Figure 3.2: Detail of dissipative single-pin connection 19
Figure 3.3: 3D view of double-pin connection with pins in parallel 21
Figure 3.4: 3D view of double-pin connection with pins in in-line 21
Figure 3.5: Theoretical elastic beam model 23
Figure 3.6: Theoretical beam deflected shape 24
Figure 3.7: Bending moment redistribution 25
Figure 3.8: Failure mechanism of theoretical beam 25
Figure 3.9: Tri-linear curve 26
Figure 3.10: OpenSees beam model of single pin device 27
Figure 3.11: The geometry of tested specimens PA-9 and P-3 30
Figure 3.12: Theoretical tri-linear curve of the PA-9 and P-3 devices 30
Figure 3.13: Strain along PA-9 pin’s height recorded at midspan 31
Figure 3.14: Stress along PA-9 pin’s height recorded at midspan 31
Figure 3.15: Numerical modeling of the PA-9 specimen; Schematic representation of pin
member in OpenSees
32
Figure 3.16: Strain-Deflection Curves of pin PA-9 33
Figure 3.17: Strain and stress of pin P-3; recorded over its height at the pin’s mid-span
length
34
viii

Figure 3.18: Numerical modeling of the P-3 specimen; Schematic representation of the
pin member in OpenSees
35
Figure 3.19: Strain-deflection curves of P-3 specimen 35
Figure 3.20: Hysteresis loops as per the OpenSees model vs. experimental test 37
Figure 3.21: Failure mechanism of specimens PA-9 and P-3 38
Figure 3.22: Pinching4 material definition 40
Figure 3.23: Normalized cumulative dissipated energy of numerical model vs. physical
test: P-A9 and P-3 specimens
41
Figure 3.24: DP-PP connection; Tri-linear curve and 3D Model 43
Figure 3.25: Stress and strain diagram of one of the two pins placed in-parallel, recorded
at pin's mid-span length
44
Figure 3.26: Strain deflection curves of one of the two pins placed in-parallel 44
Figure 3.27:3D scheme of double-pin connection device with pins placed in-line 46
Figure 3.28: The OpenSees model of double-pin connection with pins placed in-line 46
Figure 3.29: Stress and strain diagram of pins placed in-line, recorded at pins mid-span 48
Figure 3.30: Strain deflection curves of both pins placed in-line 49
Figure 4.1: Plan view of the 4-storey building 51
Figure 4.2: Elevation of the 4-storey CBF with participating gravity columns 52
Figure 4.3: Design spectrum for Victoria, B.C. 53
Figure 4.4: Members sizes of the 2D CBF with participating gravity columns 59
Figure 4.5: OpenSees Steel02 material response 61
Figure 4.6: Beams and columns cross-section fibres discretization in OpenSees 62
Figure 4.7: Fibre distribution of braces cross-section, and brace member discretization 63
Figure 4.8: OpenSees model of the 4-storey CBF with participating gravity columns 64
Figure 4.9: Brace to frame gusset plate connection 65
Figure 4.10: Selected Crustal Ground Motions Accelerations 70
Figure 4.11: Selected Subduction Ground Motions Accelerations 70
Figure 4.12: Crustal GM’s non-scaled Spectral Acceleration Sa(g) 72
Figure 4.13: Subduction GM’s non-scaled Spectral Acceleration Sa(g) 73
Figure 4.14: Spectral acceleration of scaled Crustal GM’s with the Mean and UHS 74
ix

Figure 4.15: Spectral acceleration of scaled Subduction GM’s with the Mean and UHS 74
Figure 4.16: The CBF response in terms of peak interstorey drift 75
Figure 4.17: The CBF time-history response of braces under the C5 record 78
Figure 4.18: CBF time-history response under C5 79
Figure 4.19: CBF time-history response of braces under C7 80
Figure 4.20: CBF time-history response under C7 81
Figure 4.21: CBF time-history response of braces under S2 84
Figure 4.22: CBF time-history response under S2 85
Figure 4.23: CBF time-history response of braces under S4 86
Figure 4.24: CBF time-history response under S4 87
Figure 5.1: Elevation of a 4-storey CBF equipped with double-pin brace-to-column
joists
90
Figure 5.2: Inter-storey Drift of CBF with double-pin joists displaced in parallel 92
Figure 5.3: Behaviour of braces of CBF with double-pin connections under the C7 92
Figure 5.4: Time-history response in terms of force-displacement of double-pin joints
under C5
94
Figure 5.5: Time-history series obtained for CBF with pins in-parallel under the C5 95
Figure 5.6: Time-history response in terms of force-displacement of double-pin joints
under C7
96
Figure 5.7: Time-history series obtained for CBF with pins in-parallel under the C7 97
Figure 5.8: Time-history response in terms of force-displacement of double-pin joints
under S2
99
Figure 5.9: Time-history series obtained for CBF with pins in-parallel under the S2 100
Figure 5.10: Time-history series obtained for CBF with pins in-parallel under the S4 100
Figure 5.11: Hysteretic response of double-pin joints with pins in-parallel under C7
Record obtained for different Pinching4 material parameters
104
Figure 5.12: Time-history floor displacement series resulted under C7 record when
Pinching4 material parameters rForceP received 0.65 and 0.45 value
105
Figure 6.1: Proposed Multi-Pins Connection 111
Figure 6.2: Reinforced Multi-Pin Connections 112
x

Chapter 1. Introduction
1.1 General
Concentrically braced steel frame buildings (CBF), designed to withstand earthquake
forces, are widely used in Canada. This system is characterized by a high stiffness-to-weight
ratio and limited ductility, whereas brace members are designed to yield in tension and buckle in
compression. Thus, the current design philosophy consists of sizing braces to dissipate energy
through buckling and/or yielding, while all other braced frame members behave elastically.
During the braces hysteresis response, after buckling occurred, deterioration in term of storey
shear resistance of the system is observed, as well as an unsymmetrical response. In general, the
CBF system is prone to soft-storey mechanism and the replacement of braces becomes time
consuming and the labour costs fairly high.
To overcome this drawback, researchers have proposed to add fusses in braces or brace-
to-frame joints. In this light, the hysteresis energy is dissipated in fuses, while braces are
protected against buckling. On the other hand, researchers have identified failure of brace-to-
frame connections that may be brittle when bolts fail in shear. Thus, damages observed from
seismic events indicate the stringent need to develop innovative structural systems, able to
provide high stiffness, ductility and feasibility of repair.
In order to develop a more efficient system, the concept of braced frame members equipped with
dissipative brace-to-column connections is studied. Although this concept is not new, it has not
been promoted in seismic design. In this case, the input energy is dissipated during the hysteretic
response of joints components. Related to current codes provisions, the European seismic code
(Eurocode 8, 2004) states that for concentrically braced frames “the over-strength condition for
1

connections need not apply if the connections are designed to contribute significantly to the
energy dissipation capability” of the system. However, the statement is not followed by specific
design requirements. Accordingly, the Canadian Design of Steel Structures standard (S16-09)
states that for primary framing members forming the seismic-force-resisting system of
conventional constructions, the connections can be “designed and detailed such that the
governing failure mode is ductile when the member gross section strength does not control the
connection design loads”. Through this statement, the approach of dissipative brace-to-column
connections was introduced somehow indirectly.
Initially, the concept of dissipative connections consisted of single-pin devices was proposed and
experimentally tested during the European INERD (Innovations for Earthquake Resistant
Design) project (Plumier et al., 2004). Further, this research topic has been continued in North
America (Tirca et al. 2012a, Tirca et al., 2012b, Tirca et al., 2013). From the aforementioned
studies resulted that the capacity of single-pin connections is limited and the development of
multi-pin connections is required. A detailed study on the behaviour and design of single-pin
connections was carried out by Caprarelli (2012). The main advantage of these types of
connections is the replacement costs in case of a failed brace after earthquake. Similarly to
dissipative pin connections, friction devices are installed between braces and frames and are
designed to transfer axial forces triggered in braces. The difference between friction devices and
pin devices consists in the mechanism of energy dissipation.
Therefore, the main purpose of this research is to study the behaviour of dissipative pin
connections in various configurations and to investigate the response of low-rise concentrically
braced frames equipped with these devices.
2

This study is conducted by means of the OpenSees (Open System for Earthquake
Engineering Simulation) finite element software, which provides researchers with the
opportunity to implement several building materials with diverse properties in order to simulate
and reveal their behaviour under dynamic loads.
1.2 Objectives and Scope
The first objective is to study the behaviour of dissipative pin connections in various
configurations by using numerical modelling and to propose design regulations. This task is
based on the results obtained from experimental tests conducted on single-pin device during the
INERD project. In this study, two new types of pin devices were developed. They were labelled
dissipative connections with pins displaced in- parallel and in-line.
Secondly, the seismic response of a 4-storey CBF building with and without dissipative
pin connections was studied by means of OpenSees. Furthermore, the procedure developed to
evaluate the type and size of dissipative pin connections is discussed.
Third, a comparative study on the behaviour of concentrically braced frames without and with
dissipative pin connections is carried out. This study was conducted based on nonlinear time-
history analyses and the studied building was subjected to two sets of ground motions: crustal
and subduction.
1.3 Description and Methodology
The above objectives are achieved by solving the following steps:
• Study the pin member’s behaviour using the theoretical beam model until the failure of
connection is reached. It is noted that the pin member behaves as a four-point loaded
beam and is designed to dissipate energy while deflecting in bending. 3

• Develop the OpenSees beam model and perform nonlinear time-history analysis under
quasi-static cyclic loading upon failure. The OpenSees beam model was calibrated
against experimental tests results carried out at Technical University of Lisbon, Portugal
(Calado, 2004). After calibration, conduct pushover analysis and obtain the backbone
curve. Compare the theoretical beam model with the OpenSees beam model.
• Develop the double-pin connection with pins displaced in-line and in-parallel. Then, by
following the same procedure as above, study their behaviour and capacity to dissipate
energy.
In the second part of this thesis, the behaviour of a 4-storey concentrically braced frame
structure, CBF, without and with dissipative connections was investigated. The building was
located in Victoria, BC. and was subjected to two categories of 7 ground motions each. Both, the
crustal and the subduction effect were analysed. The number of selected records per ground
motion set is in agreement with the ASCE /SEI 2007 procedure.
A comparative study is conducted on the seismic response of CBFs with and without dissipative
connections. The following parameters are discussed: building period, base shear, inter-storey
drift and residual deformation.
1.4 Thesis Organization
The research work is grouped into six chapters. The first chapter covers a brief
introduction including a general overview of this thesis’ work, a well-defined scope, objectives
and methodology. The description and steps to follow in order to complete this study are also
given.
4

Chapter two reveals past studies that was carried out on fusses and more specifically on
fusses incorporated either in braces or in brace connections. Various types of fusses reported in
the literature are presented. A general overview of experimental tests performed on dissipative
single-pin connections that were developed in the frame of INERD project is presented. In this
chapter, the impeded need for developing structural systems with dissipative connections is
emphasised.
The third chapter shows the results for the single-pin connection device as well as for the
proposed double-pin connection with pins placed in-parallel and in-line. The numerical models
of pin connections are simulated using the OpenSees finite element software and the employed
methodology is explained. A validation against the experimental test results of a single pin
connection is also performed.
In the fourth chapter, a 4-storey CBF building with typical gusset plate connections is
designed using the CSA/S16-2009 standard (CSA, 2009) and NBCC 2010 provisions. The
braced frame building located in Victoria, B.C. is subjected to two sets of scaled ground motions.
The input parameters as well as the CBF design are also discussed. Then, the seismic response is
studied based on numerical model by using OpenSees. The building response is given in terms of
interstorey drift, force-deformation hysteresis loops developed in braces and the residual
interstorey drift.
Chapter five illustrates the design of the same 4-storey CBF building where the brace-to
frame gusset plate connections were replaced by dissipative double-pin connections. The seismic
response is studied by using the OpenSees software. The same ground motions as those used in
the previous chapter are considered. The numerical model of pin connections developed in
5

Chapter three is used. The same seismic response parameters as those mentioned in Chapter four
are discussed for comparison purposes.
Lastly, the final conclusions as well as future work recommendations are given in
Chapter six.
6

Chapter 2. Literature Review
2.1 General Overview
Concentrically braced frames are used as seismic force resistant systems. They are
designed to dissipate the seismic input energy through buckling and/or yielding of braces, while
in the same time the remaining structural elements are designed to perform in elastic range. This
type of braced frame provides a high lateral stiffness, moderate to low ductility and appropriate
strength.
However, the bracing system has a few drawbacks as follows:
• high stiffness imposes increases in base shear demand which in turn requires large size of
structural members, as well as of the CBF columns’ foundations. Overall, the cost of the
structural system increases;
• the CBF is prone to concentrated deformations within a floor level which drive the system to a
storey mechanism formation;
• when subjected to earthquake loading, braces behave asymmetrical after the buckling capacity
was reached;
• replacing the damaged braces after an earthquake event means high cost;
• moderate ductility capacity.
7

To prevent the braces from buckling during an earthquake, researchers have proposed
several types of energy dissipative devices to be incorporated either in braces, (Kassis &
Tremblay, 2008), (Desjardins & Legeron, 2010), (St-Onge, 2012) or their connections (Plumier,
et al., 2006), (Vayas & Thanopoulos, 2005), (Caprarelli, 2012). In this light, other type of
dissipative connections are steel yielding fuse connections (Gray et al. 2010).
These fuses complement the behaviour of braced frame system by providing a
symmetrical response. Fuses are designed to yield at a lower force than the buckling strength of
braces. Meantime, these fuses constrain the development of tensile capacity of braces. Therefore,
structural damage that would normally be triggered in braces is diminished and the system is
able to perform in elastic range.
2.2 HSS Brace Fuse
Starting with the year 2000, a fuse system incorporated in a rectangular tube brace was
studied at École Polytechnique de Montréal (Rezai et al. 2000), (Kassis & Tremblay, 2008),
(Tremblay, et al. 2011). The fuse system consists of a cut performed in the HSS brace along a
determined length located at a close distance of the braces’ end. This hole is reinforced by four
welded angles into either side of the HSS brace. The four angles have to transfer the load
between the ends of the brace segments. The angle end legs have been trimmed so that the
desired brace tensile resistance was attained. The cut in the angles was designed in such a way
that the deformation occurring at a local level would not admit any local angle fractures. The
out of plane buckling of the brace at the area of the cut had been prevented by the built-up box
as shown in Figure 2.1.
8

Full scale quasi-static and dynamic tests were conducted for a single diagonal brace and
different types of fuse configuration designs. During the tests, the overall fuse exhibited fracture
in tension while reaching the designed ductility of its intended design.
It was noticed that the yield of the fuse connection was higher than that of the
compressive resistance resulting in the buckling of the brace in compression with the fuse still
under yield for the tension cycle side. The solution to minimize this behaviour was to increase
the width-to-thickness ratio of the brace cross-section that would then eliminate the low-cycle
fatigue failure at the plastic hinge location. The overall study concluded that the ductility demand
of the structure had increased and as a result larger deformations were attained.
Figure 2.1. HSS brace’s fuse configuration (Rezai et al. 2000)
9

2.3 Dissipative U-Shape Connection Device
In order to obtain a symmetrical response in tension and compression, dissipative U-
shape connections were proposed within the frame of the European INERD project.
This U-shape dissipative connection is illustrated in Figure 2.2 and it consists of a main steel
plate bent in U shape. This connection is able to dissipate the input energy when the U-shape
plate is subjected to bending.
This type of U-shape connection can be incorporated into a bracing system where the force
acting in the brace is transferred perpendicularly to it. To find the optimal behaviour, researchers
have proposed two positions of the U-shape member. Thus, the U-shape device was placed
perpendicular and parallel to braces as is shown in Figure 2.2. The test set-up is shown in Figure
2.3.
Figure 2.2. CBF equipped with U-shape connections displaced parallel and perpendicular to brace ‘s ends (Calado et al., 2004)
10

For the U-shape elements to work as dissipative connections, they have to yield in bending
before braces, while all other elements of the structure remain elastic.
These U-shape specimens were tested under the ECCS loading protocol (ECCS, 1986).
These U-shape connections comply with the followings:
• The design of these connections was conducted to limit the plastic strains and high residual
stresses;
• The connection was designed to have an elongation capacity consistent with the global braced
frame deformation in order to satisfy the global drift demand.
The U-shape devices that were tested at the Technical University of Lisbon were made of steel
plates with 25 mm and 30 mm thicknesses, respectively. The steel strength was S 355. The
amplitudes exerted on these devices were always 40, 80, 120 and 160 mm and the yield
displacement was obtained analytically.
It was shown that in terms of the dissipative behaviour, the U-shape devices displaced
parallel to braces behaved better than those displaced perpendicular, especially in strength, and
Figure 2.3. U-shape connection device (Calado et al. 2004)
11

that the dissipative behaviour improves with increasing the radius of the bent plate when forming
the U-shape profile.
2.4 Dissipative Single-Pin Connection Device
Another dissipative brace-to-frame connection device is the single-pin type that was also
devised and proposed during the European INERD project.
The single pin connection device was subjected to several physical testing procedures at
the Technical University of Lisbon, Portugal (Calado L, 2004). These connections were
subjected to cyclic loading. Two types of single pin connection configurations are illustrated in
Figure 2.4. As shown, the pin member has a rectangular cross-section mounted in its weak axis.
The results showed a good behaviour and a symmetrical force displacement loops with same
pinching. Then, the single pin connections were incorporated in a full scale single storey CBF in
X-bracing configuration and the experimental tests were conducted at Politecnico di Milano
Figure 2.4. Pin connection configurations (Vayas and Thanopoulos, 2005) 12

(Castiglioni, 2004). The behaviour of a single-pin brace to frame connection is shown in Figure
2.5.
Further on, a numerical finite element model that analyse the behaviour of pin connection
had been approached in Athens, Greece (Vayas & Thanopoulos, 2005) by using the software
ABAQUS. The model developed for half of single pin connection due to the symmetric shape is
presented in Figure 2.6.
The finite element model developed by Vayas and Thanopoulos (2006) was subjected to several
monotonic and cyclic loading in order to note the stress developed in the outer plate and inner
plate, as well as, in the pin member. The deflection of pin member and connection components
was investigated as well. It was concluded that the main factors that influence the connection
behaviour alongside the pin were the thickness of inner- and outer- plates that join the brace to
column through the pin member.
Figure 2.5. Testing Pin connection in CBF (Castiglioni, 2004)
13

Pinching was observed in the pin connection behaviour after the pin deflected and same
clamping forces have developed in the outer plate hole supports. The resulting conclusion was
that the pins’ yielding behaviour is influenced by its cross-sectional shape and size, as well as by
Figure 2.6. Finite element model of a quarter connection (Vayas & Thanopoulos, 2006)
14

the distance between inner-plates. In addition, the thickness of the outer-plates influences the
pin’s behaviour. The thicker the outer plate, the more clamping effect caused by the bearing
stress will occur, as well as, an increasing in the overall connection strength was observed.
Several design factors were devised. Among them, the thickness of the outer plates should be at
least 50% of that of the pin cross-sectional height, while the thickness of inner plates should be
larger than 50% of that of outer plates.
It has been observed that when the brace is subjected to tension, the outer plates in the
dissipative connection act in tension and they exhibit a deformation towards the exterior, while
when the brace is loaded in compression, the outer plates act in compression and they will
deform toward the interior as shown in Figure 2.7.
Figure 2.7. Deformation phases of the CBF brace with ends pin connections
15

In the frame of the INERD project, the single pin connection was numerically studied by
using the SOFISTIK finite element. Based on these analysis and experimental tests same design
provisions were proposed and are given in Figure 2.8.
The overall European studies concluded that dissipative pin connections provide larger
ductility to structure, while maintaining drift requirements and reducing the force induced into
the structure. The energy dissipation is higher than that of a regular CBF and all members of the
structural frame (brace, beam and column) behave elastically, while the pin connection attains a
plastic energy dissipating behaviour.
Further extensive research regarding the pin dissipative connection had been carried out
at Concordia University using the OpenSees finite element software and several other computer
Figure 2.8. Design steps of pin member and its tri-linear curve (Plumier et al., 2004)
16

programs (ETABS, Inventor, Femap). Research conducted in this field was disseminated by
Tirca et al. (2011), Tirca et al. (2012a, 2012b), Caprarelli (2012). For example Caprarelli (2012)
studied the behaviour of a single-pin connection device and its behaviour when installed in a
single and two-storey building located in Victoria, BC. All analyses were conducted in
OpenSees.
The research carried out in order to study the behaviour of a single-pin connection device
and the overall results obtained by analysing 1- and 2-storey CBFs with incorporated pin
connections concluded to the following:
• The dissipative energy capacity of connection devices increases when larger distance between
inner-plates is provided;
• Fatigue strength curves like the ones presented in Eurocode 3 (European Committee for
Standardization) allow predicting the stress range and number of stress cycles to fatigue failure.
Low cycle fatigue failure is not a typical failure mode for these devices;
• Ground motions with dominant short periods impose less deformation and less shear forces
upon the CBF with dissipative pin connection;
• For middle-rise buildings located in seismic area with high risk, pins transferring large axial
forces are required. Thus, the double-pin brace-to-column connections are recommended instead
of single-pin devices (Caprarelli, 2012).
The next Chapter will continue the work abovementioned by proposing two new
connections labelled double-pin connections with pins placed in-line and in-parallel.
17
Chapter 3. Modelling and Design of Dissipative Pin Connections
3.1 Introduction of Dissipative Pin Connections
This chapter is based on the paper “Numerical modelling of dissipative pin devices for
brace column connections” (2013) co-authored by Tirca, Danila and Caprarelli. The
computation of strain-deflection curves resulted for the single-pin connection displaced in two
configurations, all calculations regarding the double-pin connections, and the comparison
between single pin and double pin connections were carried out by Danila, while the OpenSees
model of the single-pin connection device and its calibration with the experimental test results
were developed by Caprarelli (2012).
The main purpose of this chapter is to illustrate the behaviour of dissipative double-pin
connections device versus the single-pin through numerical modelling and parametric studies by
using the OpenSees framework (McKenna et al. 2009). The proposed design methodology and
numerical models are validated by means of results obtained from existing experimental tests
that were carried out for single-pin connections only. The innovative double-pin connection with
pins displaced in-parallel and in-line, proposed herein, has large redundancy and is
recommended in design.
3.2 Dissipative Pin Connections
The single-pin fuse integrated in brace connection was initially proposed and
experimentally tested in the frame of the European INERD project (Plumier et al., 2006). The
single-pin connection that joins the brace to column (Figure 3.1) consists of two outer-plates
18

welded or bolted to column flanges, two inner-plates welded to the brace and a rectangular pin
member with rounded corners running through the four plates, as illustrated in Figure 3.2.
As illustrated in Figures 3.1 and 3.2, the configuration of the pin device depends on the
size and depth of the CBF column’s cross-section that governs the pin’s length, L, while the size
of the pin member depends on the probable compressive resistance of the connected brace, Cu,
Figure 3.1. Dissipative single-pin connection, 3D view
Figure 3.2. Detail of dissipative single-pin connection
19

and the distance between the inner-plates (L-2a). As illustrated in Figure 3.2, parameter “a” is the
distance between the outer-plate and the centerline of the inner-plate. The pin element is
proportioned to yield in flexure under a force equating 60% Cu of attached hollow structural
section (HSS) brace (Caprarelli, 2012).
In this study, the behaviour of single-pin device is analyzed through numerical modelling,
developed in the OpenSees framework version 2.2.0 (McKenna et al., 2009). Then, the
calibration of the single-pin connection model against results obtained from experimental tests,
conducted at Instituto Superior Technico of Lisbon (IST), Portugal (Plumier et al., 2006) is
discussed. When large axial forces need to be transferred from braces to CBF columns through
connections, the available sizes of single-pin member are not sufficient. To overcome this
drawback, an innovative double-pin connection with pins displaced either in-parallel or in-line is
proposed, and the 3D view of this device depicted in both configurations is illustrated in Figures
3.3 and 3.4, respectively. By employing the same design approach as that used for the single-pin
device, the double-pin connection is analyzed through theoretical and numerical modelling in the
aim of sizing the specimens and preparing the upcoming experimental tests.
20

Figure 3.3. 3D view of double-pin connection with pins in-parallel
Figure 3.4. 3D view of double-pin connection with pins in-line
21

3.3 Design and Behaviour of Single-Pin Connection Device
To validate the design method for the single-pin connection device, two numerical
models are employed and defined as follows: the theoretical beam model and the OpenSees
beam model. Regarding the theoretical beam model, the same approach considered by Vayas
and Thanopoulos (2005) and refined by (Tirca et al. 2012) is used to size the pin cross-section
and the connection’s member components. Then, the theoretical beam model was replicated in
the OpenSees framework with the aim of investigating the development of stresses versus strain
along the pin cross-section, as well as the length of plastic zone resulted under incremental static
loading up to the point of failure. By using data from both theoretical and OpenSees beam
models, two experimental tests conducted at IST Lisbon under quasi-static displacement loading
were replicated. The calibration of the model was validated when both the experimental and
simulated models match in terms of hysteresis loops generated from plotting the force versus
displacement and the cumulative dissipated energy.
3.3.1 Theoretical beam model
The behaviour of the single-pin device in terms of its capacity to dissipate energy under
cyclic loading is influenced by the following parameters: the length of the pin, Lpin, its cross-
sectional shape and size, as well as the distance between the inner-plates (L-2a). As illustrated in
Figure 3.5, the axial force developed in the brace, P, is transferred to the pin through the two
inner-plates as uniformly distributed loads which act along the thickness of the plates. For
simplicity, the pin is considered to behave as a four-point loaded beam, where the concentrated
load P/2 is the resultant of the uniformly distributed force, as illustrated. When the yielding
moment My = WyFy is reached, the pin starts to yield in bending under the applied point load
22

Py/2, where Py/2 = My/a. By employing Hooke’s law, yielding of the pin is initiated when the
maximum normal strain that is developed at the top and bottom fibre of the rectangular pin’s
cross-section (bp x hp) is εy = Fy/E, where bp and hp are the dimension of pin’s cross-section and
E is the modulus of elasticity.
Thus, under the applied Py/2 loads, the simply supported beam deflects in single
curvature as illustrated in Figure 3.6. It is noted that 1 mm clearance was provided between the
pin and the outer-plate hole, which meets the requirements of the current standard.
The deflection required to produce the material’s yielding at the pin’s mid-span is δy =ρ(1–
cos(Lpin/2ρ), where ρ is the radius of curvature and the curvature is defined as ky =1/ρ = 2 εy
/hp. However, the strain corresponding to the static yield stress may be two to five times the yield
strain εy (Ziemian, 2010). At this stage, the strain considered to compute the static yield stress,
εI, is expressed as: εI = 1.5εy, the corresponding curvature becomes kI = 2(1.5εy)/hp and ρI =
hp/(3εy). The maximum deflection computed at the pin’s mid-span is given by Equation 3.1 and
Figure 3.5. Theoretical elastic beam model
23

the maximum deflection under the point of loading may be obtained by multiplying δy with the
ratio 2a/Lpin. Although the provided deflection equation applies rigorously for the case of pure
bending, as is the segment between inner-plates, the assumption that the cross-sections remain
plane and perpendicular to the deformed axis leads to expressions for normal strain ε and stress σ
that are quite accurate in the elastic range even in the case of non-uniform bending (dM/dx =
V(x) ≠0), as are the segments between the outer- and the inner-plate.
δy = δI= (h/3εy) (1 – cos (1.5Lpinεy/hp)) (3.1)
The yielding moment, My = WyFy, is reached under the application of two Py/2 loads that
are defined in accordance with Equation 3.2.
PI = Py = 2My/a (3.2)
For a rectangular cross-section, the ratio between the plastic moment Mp and My equates
the shape factor given by Wy/Wp = 1.5. After the attainment of My, some clamping forces start
developing at the pin’s ends and in consequence the boundary conditions gradually allow the
development of end bending moment (Figure 3.7).
Figure 3.6. Theoretical beam - deflected shape
24

Figure 3.7. Bending moment redistribution
Figure 3.8. Failure mechanism of theoretical beam
By equating the external work, Pδ/2 = P(φ a)/2, with the internal work, (M1 + M2)/φ,
where φ is the rotation as illustrated in Figure 3.8, the magnitude of the ultimate load carried
by the beam, PII, is given in Equation 3.3. It is estimated that the ultimate flexural capacity of
the pin member, Mu, is computed as: Mu = WpFu, where Fu is the steel ultimate strength. Under
the two-point loads Pu/2, the ultimate strain, εII, is approximated as being equal to εII= 50εy = 0.1
and the corresponding curvature is kII = 2εII/h= 0.2/hp. The value of the ultimate plastic rotation,
ϕu, becomes φu =kIIllp = lp (0.2)/hp radians. Herein, the length of the plastic hinge, lp, is
anticipated as being 1.25 times the height of the pin’s cross-section, hp. As presented hereafter,
the development of the plastic hinge length may vary with the distance between the inner-plates
and the magnitude of the applied forces.
25

Figure 3.9. Tri-linear curve
The ultimate deflection, δII, at distance a from the pin’s support is given in Equation 3.4.
PII = Pu = 2(M1 + M2)/a ~ 4Mu/a (3.3)
𝛿𝐼𝐼 = ϕ𝐼𝐼𝑎 = 𝛿𝑢 = (𝑙𝑝/ℎ)(0.2𝑎) = 1.25(0.2𝑎) (3.4)
During the incursions in plastic range, the magnitude of load PII may slightly increase due
to material strain hardening to a value PIII, while the maximum deflection of pin at failure is
estimated to be δIII = 0.4a (Vayas & Thanopoulos, 2005); (Thanopoulos, 2006).
From the above it was found that the failure mechanism depicted in Figure 3.8 is formed when
plastic hinges are developed at the location of inner-plates where loads are applied. By
employing Equation 3.1 to Equation 3.4 and the parameters at failure: PIII and δIII, the pin
response follows a tri-linear curve as illustrated in Figure 3.9.
3.3.2 OpenSees beam model
The purpose of developing the OpenSees beam model is to simulate the behaviour of the
pin in its outer-plate supports and to measure the developed strains, stresses, and deformations.
Thus, until the yielding moment is reached, the pin behaves as a simply supported beam. Then, 26

by increasing the applied loads, the pin member behaves in the plastic range and its deformed
shape causes bearing pressure to the contact surface of the outer-plate hole, which is the pin’s
support. In this stage, bending moment is generated at both pin ends and its magnitude is
incremented until the pin reaches its failure mechanism. The development of bending moment
diagram across the pin’s length depends on the pin-to-outer-plate stiffness ratio,
(Ipin/Lpin)/(Iop/Hop). When the aforementioned ratio approaches zero, the pin member imposes no
restraint on joint rotation and it behaves as a pure fixed-fixed member, while it triggers the
largest axial compression force. It is desirable to optimize the size of outer-plates such that the
mid-span bending moment to be slightly larger than that developed at the pin’s support. To
satisfy this demand, the outer-plate should be sized to comply with the following expression:
(Ipin/Lpin)/(Iop/Hop) = 0.5.
Therefore, the OpenSees beam model was built to simulate the behaviour of the pin
member acting as a four-point loaded beam, as previously described.
The model shown in Figure 3.10 consists of eight nonlinear beam-column elements with
distributed plasticity and four integration points per element. The pin’s cross-section is made
Figure 3.10: OpenSees beam model of single pin device
27

up of 60 fibres. Among them, 12 fibres are assigned along the height of the cross-section, hp,
and 5 along its width, bp, as illustrated in Figure 3.10.
The length of the pin, Lpin, is the clear span between the outer-plates, which acts as
supports. Herein, the pin’s supports (outer-plates) are modelled as rigid links of length Hop,
which represents the free length. Theoretically, the deformation between the pin member and the
support (rigid link) can be represented by translational springs acting in the direction of pin’s
length. When the pin member is deflected downward or upward, its length is subjected to
shortening.
To simulate this behaviour, a zero-length element object that is defined between two
nodes generated at the same location is added at both pin members’ ends, as illustrated in Figure
3.10. These nodes of identical coordinates are connected by springs, with the aim to represent the
force-deformation relationship exhibited by the pin in the outer-plate supports. The uniaxial
material assigned to the pin member and rigid links is Steel02, which is also known as Giuffre-
Menegotto-Pinto material. It is recommended that the steel strength of plates to be the same with
that of the pin. Nonetheless, the length and thickness of the outer-plates influence the behaviour
of the connection, while the deflection of the pin controls the transversal deflection of outer-
plates. When the pin member behaves elastically, both links (outer-plates) act as cantilever
members with a stiffness Kop = 3EIop/Hop3, where EopIop is the flexural stiffness of the link. To
simulate the non-linear behaviour of pin member in the outer-plate supports, two translational
springs were added in the zero-length element, in the x-direction and one is the y-direction.
Among them, one spring is made of Steel02 material and others of Pinching4 material that is
defined in the OpenSees library (Mazzoni et al., 2006).
28

The Pinching4 material represents a pinched force-deformation response and it allows
users to simulate the deformed shape of the pin in the outer-plate’s hole support after the pin
member is loaded below its elastic bending capacity.
The OpenSees beam model was developed by using data from two experimental tests con-ducted
at Technical University of Lisbon, and the employed specimens, PA-9 and P-3, are shown in
Figure 3.11. The pin member considered in the experimental test has a solid rectangular shape
with rounded corners and was mounted in the weak axis as illustrated in Figure 3.11. The
difference between PA-9 and P-3 specimen is only the distance between the inner-plates. In both
cases, the pin is made of steel with the following characteristics: Fy = 396 MPa and Fu = 558
MPa, while the pin’s cross-sectional dimensions are 60x40 mm. The tri-linear curves of both
specimens, PA-9 and P-3, are built by using the theoretical values computed with Equations 3.1
to 3.4 and are plotted in Figure 3.12.
To investigate the correlation between the theoretical tri-linear curve and that resulted
from the OpenSees beam model, an incremental analysis is performed. Pairs of applied forces
and deflections recorded under the point of loading are plotted in Figure 3.12 together with the
theoretical tri-linear curve. In addition, at each incremental loading application, the strain and
stress corresponding to each one of the 12 fibres is recorded at beam’s mid-span of specimen P-
A9 and is plotted in Figure 3.13 and respectively Figure 3.14. Thus, when both forces Py/2 are
applied to the OpenSees beam model, as illustrated in Figure 3.6, the strain recorded in the
extreme fibres of the mid-span cross-section is εy and the associated stress is Fy. By using the
geometry of P-A9 specimen, the force Py computed with Equation 3.2 is 145kN. As depicted in
29

Figures 3.13 and 3.14 , under PII forces, the numerical model shows a slight difference in strain
and stress recorded at the extreme tension and compression fibre of the pin’s mid-span length.
Herein, the strain in the tensile fibres is about 12% larger than that in compression fibres, while
the variation of stresses in fibres is between Fy and Fu.
Figure 3.11. The geometry of tested specimens PA-9 and P-3
Figure 3.12. Theoretical tri-linear curve of the PA-9 and P3 connection devices
30

Figure 3.13. Strain along PA-9 pin’s height recorded at midspan
Figure 3.14. Stress along PA-9 pin’s height recorded at midspan id
31

Thus, the analytical and the OpenSees beam models show a good correlation and the stress and
strain diagrams validate the theoretical equations previously devised.
To analyze the propagation of plasticity along the pin’s length under incremented static
loads, the strain time-history series that are developed in the extreme fibres are investigated. In
this numerical model, the pin member is divided in eight force-based beam-column elements,
rigidly connected, as illustrated in Figure 3.15. These beam-column elements are made of cross-
sections based on fibre formulation, while the depth of pin’s cross-section is divided in 12 fibres,
in conformity with Figure 3.10. Each fibre made of Steel02 material is defined by an area and a
location (x, y). As shown in Figure 3.15, four Gauss-Lobatto integration points are placed along
each element and the force-deformation response at each integration point is recorded at the
defined section.
To define the length of the developed plastic zone exhibited by the pin member, the
values corresponding to the strain – deflection curve are recorded at the upper and lower fibre (1
and 12, respectively) of sections belonging to the integration points of elements number 3 and 4
(Figure 3.15). As shown in Figure 3.16, when the applied force increases above the elastic range,
the portion of the pin between the inner-plates deforms in the non-linear range under the
developed constant bending moment.
Figure 3.15. Numerical modeling of the PA-9 specimen; Schematic representation of pin member in OpenSees
32

The larger deformation is recorded at the pin’s mid-span, while the larger strain is
recorded at the location of inner-plates. Fibre 12 belonging to the tension surface shows a
slightly larger strain than fibre 1, located at the compression surface. This difference increases
with the magnitude of applied forces. For the modeled PA-9 specimen, the strain-deflection
curves of extreme fibres located between the inner-plates show a linear relationship. In this
example, the left inner-plate intersects the pin member in the vicinity of section 4 of element 3.
For the half-length pin, it is observed that the plastic region length ends close to section 2 of
element 3, which corresponds to a distance of hp/2 measured from the inner-plate, where hp is the
depth of the pin member. As illustrated in Figure 3.16, the maximum deflection at pin’s mid-
span is 36 mm. Similarly, Figure 3.17 illustrates the strain and stress diagram of the P-3
specimen model that is measured in each one of the 12 fibres located at the pin’s mid-span.
Figure 3.16. Strain-deflection curves of pin PA-9
33

The difference between the P-3 and PA-9 specimens was set by distance a, which in case
of P-3 was reduced by 13%. Thus, the pin of the P-3 specimen is able to transfer a force that is
113% larger (690 kN versus 612kN), while exhibiting lower strain. As depicted in Figure 3.17,
the strain recorded in the extreme fibres at the pin’s mid-span length displays values that are
lower by 13%.
A schematic representation of the pin member of the P-3 specimen model is shown in
Figure 3.18 and the time-history series of strain-deflection curves of the extreme tension and
compression fibres (12 and 1) are depicted in Figure 3.19.
Figure 3.17. Strain and stress of pin P-3 recorded over the pin’s height and at its mid-span length

In the case of P-3 specimen model, the strain-deflection curves show a weaving
behaviour with a sharp increasing in strain for forces larger than 612 kN. The maximum strain is
experienced by fibre 12 of element 3, section 4, located in vicinity of inner-plate. It displays a
deformation of 20 mm for a tensile strain of 0.08 or 40εy and 30 mm at failure when the
associated strain is about 0.12. In comparison with the PA-9 pin model, the fibre 12 of element 3,
section 4 of both pin specimens experienced the same strain for a 20 mm deflection, but at the
state of failure, the corresponded strain and deflection value experienced by the same fibre of pin
Figure 3.18. Numerical modelling of the P-3 specimen; Schematic representation of the pin member in OpenSees
Figure 3.19. Strain-deflection curves of P-3 specimen
35

P-3 has dropped by 13%. In addition, by comparing the tensile and compression strain recorded
at pin’s mid-span (fibres 12 and 1 of element 4, section 4) the P-3 pin developed lower strain
values (Figure 3.19).
The difference in behaviour is due to a/Lpin ratio. In the case of P-3 specimen, a/Lpin =
0.323 where a =77.5 mm and Lpin = 240 mm. By considering the pin and outer-plate cross
sections 60x40 mm and 180x30 mm, respectively, the computed pin-to-outer-plate stiffness ratio
is (Ipin/Lpin)/(Iop/Hop) = 0.5, where Ipin = 60x403/12, Iop = 180x303/12 and Hop =150 mm. When the
point of applied force moves toward the middle of the pin (PA-9 specimen), slightly larger outer-
plate stiffness is required to sustain the same applied force. In the case of PA-9, a = 87.5mm,
a/Lpin = 0.365 and the change in the a/Lpin ratio with respect to the previous case is 113% (e.g.,
0.365/0.323=1.13). As noted above, the ratio between the maximum force carried by P-3
specimen and PA-9 specimen is 1.13 (692 kN versus 612 kN). In addition, from previous studies
(Vayas & Thanopoulos, 2005) it was found that clamping effect increases until the thickness of
outer-plates reaches 0.75hp.
In the nonlinear range, axial compression force is developed in addition to bending moment
which magnitude is slightly larger at pin’s mid-span than at its support. The compression force
developed between the inner-plates is smaller than that developed between the inner-plate and
outer-plate due to the tangential component of applied load that acts in opposite direction.
Failure of pin occurs under the combined effect of axial force and bending moment. From data
collected for both specimens P-3 and PA-9 it was found that the normalized bending moment
component has the largest weight in the interaction equation while the normalized axial force
component is less than 10% in the mid-span segment and less than 15% at pin’s support.
36

To summarize, the behaviour of pin member is influenced by the distance between the inner- and
outer-plate that is expressed by parameter a, as well as by the dimensions of outer-plates. When
the distance between inner-plates (Lpin - 2a) increases (e.g. P-3 specimen vs. PA-9), the portion
of pin that is subjected to plastic deformation expands across the pin’s length, while the
maximum strain decreases. From numerical computations, the length of plastic hinge developed
over the pin member is approximated as being: (Lpin -2a + hp). However, both PA-9 and P-3 pins
experience the same deflection at the mid-span length and display larger strain in tension than in
compression. The OpenSees beam model was used to emphasise the distribution of strain and
stress across the pin’s length.
3.4 Validation of the OpenSees Model of P-A9 and P-3 Joints vs. Experimental Test
Results
The two selected specimens PA-9 and P-3 were tested on a box stand under the ECCS
cyclic quasi-static loading protocol (Technical Commitee - Structural safety and loading, 1986).
a) b)
-40 -20 0 20 40 (mm)
-600
-400
-200
0
200
400
600Force (kN)
-40 -20 0 20 40 (mm)
600
-400
-200
0
200
400
600Force (kN)
Figure 3.20, Hysteresis loops as per the OpenSees model vs. experimental test a) PA-9 and b) P-3
37

The displacement loading applied to the PA-9 sample has 25 cycles with a rate of loading of 0.45
mm/s and a maximum displacement in the last cycle of 40 mm. The displacement loading
protocol applied to the P-3 sample has 21 cycles, a rate of loading 0.33 mm/s and a maximum
displacement of 45 mm. In both cases, three consecutive cycles reaching the same displacement
amplitude were considered. The force-displacement hysteresis loops that characterize the
behaviour of specimens PA-9 and P-3 are shown in Figure 3.20.
In both cases, the failure of the pin occurred at one of the two points of load application,
when it is reloaded in tension (Plumier, et al., 2006), as illustrated in Figure 3.21. Thus, in the
case of specimen PA-9, when the distance between the outer- and inner-plate is larger than the
distance between inner-plates, the failure occurs in the longer pin segment, at the external face of
the inner-plate. In the case of specimen P-3, the failure occurred in the middle segment at the
internal face of the inner-plate. For both specimens, the same stiffness degradation occurred
during reloading. Although both specimens reached approximately the same magnitude of
maximum deformation in bending, 37 mm, the corresponding ultimate tensile forces of PA-9
Figure 3.21. Failure mechanism of specimens PA-9 and P-3 (Calado, 2004)
38

(615 kN) is lower than that recorded for P-3 (694 kN). On the other hand, for both specimens,
the capacity in tension is larger than that in compression by 13%. This difference in strength is
due to the out-of-plane bending of outer-plates, which implies an increased distance between the
pin’s supports in the outer-plate hole. In this case, the outer-plates deflect toward the exterior, as
is shown in Figure 3.21. As a result, the stiffness and the thickness of outer-plates influence the
behaviour of pin connection. As discussed above, it is recommended that the stiffness of the outer-
plate to be two times larger than the stiffness of the pin and top ≥ 0.75hp.
The purpose of developing the OpenSees model for pin connections is to study the
behaviour of CBFs equipped with pin devices placed in-line with brace members. In this light,
the rigid link (outer-plates) is fixed to the column at the location of column-to-beam joint and is
connected by means of zero-length element to brace member. Pinching4 material is assigned to
translational springs and was employed in this study with the aim of simulating the changes in
pin member behaviour, while undergoing different degrees of fixity when changing from a
pinned to a clamped support. To simulate the hysteretic response of specimens P-3 and PA-9, the
unloading stiffness degradation model for a hardening-type response envelope is used and
calibrated against experimental test results.
The hysteresis shape defined by the Pinching4 uniaxial material model is illustrated in
Figure 3.22 and it corresponds to that provided in the OpenSees manual (Mazzoni et al., 2006).
The coordinates of force-deformation corresponding to a hardening-type response envelop are
those computed for the tri-linear curve (e.g., Figure 3.12) and are depicted in Figure 3.22: (ePf1,
ePd1), (ePf2, ePd2) and (ePf3, ePd3). However, the hysteresis shape may not be symmetric when
the outer-plates behave in tension or compression as shown in Figure 3.20. To define pinching,
three additional floating points (rForceP•ePf3, rDispP•ePd3 and uForceP•ePf3) are required to be
39

identified in tension and three in compression. Points involving these coordinates are symbolized
with “X” in Figure 3.22. For example, in the case of PA-9 specimen depicted in Figure 3.20 a),
the floating point rForceP•ePf3 represents the ratio of the force at which reloading occurs, 291
kN, to the total hysteretic force demand, 615 kN. Similarly, the second floating point
rDispP•ePd3 represents the ratio of displacement where reloading begins, 24 mm, to the total
hysteretic displacement demand, 37 mm. In this light, the computed ratios are 0.47 and 0.65,
respectively. The third floating point uForceP•ePf3 is the ratio of force at negative unloading, 17
kN, to the total load during monotonic testing, 615 kN, resulting in a value of 0.03. Therefore as
is shown above, the pinching envelope is built by multiplying certain values of the skeleton
curve, better known as the tri-linear curve, with the above floating point values, defined for the
tension side. For the compressive side, the floating points are reported to a total compressive
force of 549 kN.
Figure 3.22. Pinching4 material definition
40

To validate the OpenSees pin model that is simulated for specimens PA-9 and P-3, the
normalized cumulative energy, E/Pyδy, illustrated in Figure 3.23, is computed as the summation
of the normalized energy dissipated per cycle, Ecycle/Pyδy. Herein, the energy dissipated per cycle
is calculated as the area enclosed by the associated cycle over the energy at yield, Pyδy. The
difference between the numerical model and physical test increases significantly for the last
cycle prior failure. The hysteresis response of both specimens shows the occurrence of failure
when the specimen is reloaded in tension.
Thus, the OpenSees model is able to replicate the global behaviour of single-pin
connection. The P-3 specimen was subjected to 21 cycles, while the PA-9 specimen to 25 cycles.
To summarize, under similar conditions (equal number of cycles), the single-pin connection with
larger distance between inner-plates possesses a larger dissipative energy capacity.
Figure 3.23. Normalized cumulative dissipated energy of numerical model vs. physical test: PA-9 and P-3 specimens
41

3.5 Numerical Modelling of Double-Pin Connection Device
To transfer large axial force triggered in brace members to brace-column connections, the
capacity of the single-pin device may not satisfy the demand. For this case, the double-pin
connection device with pins displaced either in-parallel (Figure 3.3) or in-line (Figure 3.4) are
proposed. The double-pin connection is analyzed through numerical models by following the
same approach that was used for the single-pin. In this study, only the case with a larger outer-
to inner-plate distance is considered (a = 87.5 mm). For comparison purposes, two small pins of
rectangular shape 40x35 mm that possess an equivalent flexural stiffness with that of single-pin
60x40 mm are selected for investigations.
3.5.1 Modelling and behaviour of double-pin connection with pins placed in-parallel
As illustrated in Figure 3.3, the double-pin connection with pins placed in-parallel (DP-
PP) has a symmetrical geometry. Due to its symmetry, the study can be conducted for half of the
device and its behaviour is expected to be similar with that for a single-pin. Thus, each pin must
be proportioned to carry half of the force triggered in the brace, while undergoing the same
deflection that is expected to be experienced by an equivalent single-pin device. In this example,
the same geometry of pin’s length, outer- and inner-plates as that illustrated for the specimen
PA-9 are considered and used in the single-pin OpenSees beam model depicted in Figure 3.10.
The theoretical tri-linear curve computed for each pin displaced in-parallel may be plotted
similarly with that developed for a single-pin. The tri-linear curve and three-dimensional model
of the DP-PP connection are illustrated in Figure 3.24. The strain and stress diagram
corresponding to each one of the two pins subjected to incremental static loading is shown in
Figure 3.25.
42

Data in Figure 3.25 was recorded for each one of the 12 fibres (Figure 3.10) that represent the
pin’s cross-section located at pin’s mid-span length.
From Figure 3.25, it is observed that slightly larger strain is developed in tension than
compression upon failure. The values of strain and stress, recorded for one of the two pins when
subjected to half of the force applied to PA-9 specimen, show almost the same values with those
plotted in Figure 3.13 and Figure 3.14. The 40x35 pin member is subdivided in 8 elements as
depicted in Figure 3.15. Similarities in the strain-deformation time-history series depicted for the
40x35 pin and shown in Figure 3.26 were also observed.
As illustrated, the maximum strain is recorded in the extreme tensile fibre (fibre 12) at the
location of section 4 that belongs to element 3. In addition, the length of plastic region is similar
with that illustrated for PA-9 pin model, while the time-history strain-deformation curves show a
linear relationship for fibres located between the inner-plates. Thus, by doubling the pin member,
Figure 3.24. DP-PP connection: Tri-linear curve and 3D Model
43

the load-carrying capacity of connection increases two times, while the deflection remains the
same as that experienced by an equivalent single-pin device.
Figure 3.25. Stress and strain diagram of one of the two pins placed in-parallel and recorded at pin’s mid-span length
Figure 3.26. Strain deflection curves for one of the two pins placed in-parallel
44

3.5.2 Modelling and behaviour of double-pin device placed in-line
The three-dimensional scheme of double-pin connection with pins placed in-line (DP-PL)
is shown in Figure 3.27 and the OpenSees model is illustrated in Figure 3.28.
Each one of the two pins is composed of 8 force-based beam-column elements with spread
plasticity along the member length as depicted in Figure 3.15. Pins cross-sections are made of 60
fibres distributed as illustrated in Figure 3.10. Steel02 material was assigned to all fibres. A zero-
length element is placed at each pin ends in order to simulate the complexity of pin’s support in
the outer-plate hole. In addition, zero-length elements are placed at the connection between pin
members and inner-plates. Through design, the pin members of the DP-PL connection are
assumed to dissipate energy in flexure, while the remaining components such as the outer- and
inner-plates behave elastically. Due to the large stiffness of the inner-plate in the plane of
loading, both pins are subjected to equal deformation, while the system composed of two pins
connected by the two inner-plates behaves as an equivalent W-shape beam where both flanges
are supported in the four outer-plates holes. In this example, the distance between the centerline
of the two pins is 2.5hp (100mm) and it can be increased to 3hp, the thickness of the outer-plates
is 30 mm (top ≥ 0.75hp), while that of inner-plate is 20 mm (tip ≥ 0.5hp). The net area of outer-
plate across the pin hole, normal to the axis of the member, shall be at least 1.33 times the cross-
sectional area of the pin member. In the same time, the distance from the edge of the pin hole to
the edge of the outer-plate member, measured transverse to the axis of the member, shall not
exceed four times the thickness of the material at the pin hole (e.g., the width of outer-plate is
bop=180mm and (180-40)/2 ≤ 4top where top=30 mm). This verification is applied to inner-plates
as well (e.g., for bip =180mm it results (180-40)/2 ≤ 4tip where tip = 20 mm).
45

To simulate the connection between the pin member and the outer-plate support, three
translational and one torsional spring are assigned in the zero-length element illustrated in Figure
3.28.
Among them, two translational springs are placed in the x-direction and one in the y-
direction, while the torsional spring assures that no twist occurs in the z-axis. One of the two
translational springs, made of Steel02 material and assigned in the x-direction, simulates the
Figure 3.27. 3D scheme of double-pin connection device with pins placed in-line
Figure 3.28. The OpenSees model of double-pin connection with pins placed in-line
46

effect of the outer-plate. The second translational spring, assigned in the x-direction, is made of
Pinching4 material and represents the pinched force-deformation relationship that controls the
pin behaviour. On the other hand, between the inner-plate and the pin member is a pinned
connection that is simulated by two translational and one torsional spring, assigned in the zero-
length element. Among the two translational springs, made of Steel02 material, one is placed in
the x- and the other in the y-direction, while the torsional spring is added to restrain torsion about
z.
However, there is a difference in the development of strain in the plastic range of the
upper and the lower pin. When pins deflect in-plane, they engage the outer-plates to bend toward
interior, whereas the outer-plates are rigidly connected to column flanges. In addition, the
deformation of the two pins is controlled by the force-deformation relationship exhibited by the
inner-plates in the process of transferring the axial force from the brace to the column.
Thus, the two pins experience equal deformation in bending, although the pin located
toward the brace (lower pin) is subjected to larger stress and strain than that on the above (upper
pin), as shown in Figure 3.29. In this light, the maximum strain that is developed in the lower pin
is about 40εy in both tension and compression. This maximum strain value is smaller than that
shown for the same pin’s size displaced in-parallel (Figure 3.25). To summarize, dissipative
connection with pins in-line shows lower demand in strains and stresses than the equivalent
connection with pins in-parallel, while carrying the same magnitude of forces.
To analyze the undergoing deformation of the pin members, the time-history series of
strain-deformation of the extreme pin’s fibres is plotted in Figure 3.30. Herein, the maximum
tensile strain recorded in fibre 12 of element 4, section 4 (mid-span length) of the upper pin is
0.06 versus 0.072 of the lower pin. However, for the same section location, the maximum
47

c) d)
a)
b)
Figure 3.29. Stress and strain diagram of pins placed in-line, recorded at pins mid-span length a) strain of upper pin, b) stress of upper pin, c) strain of lower pin, d) stress of lower pin.
compressive strain developed in fibre 1 of the lower pin is double than that developed in the
upper pin. Meanwhile, the lower pin shows a linear strain-deformation relationship, while the
upper pin shows a parabolic relationship. Each pin is made of eight non-linear beam-column
elements as illustrated in Figure 3.15. The length of the plastic region is similar with that
illustrated in Figure 3.26, while the maximum bending deformation is slightly reduced.
48

Figure 3.30. Strain deflection curves of both pins placed in-line: a) upper pin, b) lower pin.
a)
b)
49

Chapter 4. Design and Behaviour of Concentrically Braced Frame in X-
Bracing Configuration
4.1 Design of 4-Storey Concentrically Braced Frame in X-Bracing Configuration
The purpose of the previous chapter was to evaluate the behaviour of pin connections
displayed in single and double configuration.
To compare the seismic response of structures with and without dissipative pin connections, in
this chapter the behaviour of a low-rise CBF in X bracing configuration is presented and the
results are obtained by using the OpenSees software (McKenna et al., 2009).
4.2 Building Description
The selected building, with type of occupancy office, is located in Victoria, BC, on Class
C soil and its plan view and 2D frame elevation are shown in Figure 4.1 and Figure 4.2,
respectively.
In order to design the CBF building, both gravity and seismic force resisting system are
proportioned by using the National Building Code of Canada (NRCC, 2010) and the S16-2009
standards.
From specifications, if the structure is less than 60 m in height, the code allows to use the
equivalent static force procedure in order to design the seismic force resisting system. In this
light, the base shear force is computed by using Equation 4.1:
𝑉 = 𝑆(𝑇𝑎)𝑀𝑣𝐼𝐸𝑊/(𝑅𝑑𝑅0) (4.1)
50

The minimum and maximum base shear value is given in Equation 4.2 and Equation 4.3
respectively.
𝑉𝑚𝑖𝑛 = 𝑆(2.0)𝑀𝑣𝐼𝐸𝑊/(𝑅𝑑𝑅0) (4.2)
𝑉𝑚𝑎𝑥 = 2𝑆(0.2)𝑀𝑣𝐼𝐸𝑊/(3𝑅𝑑𝑅0) (4.3)
The fundamental period of the 4-storey building Ta, is evaluated by employing Equation 4.4,
where hn is the total building height and is equal to 15.2 meters.
𝑇𝑎 = 0.025ℎ𝑛 (4.4)
The value for the fundamental period of the 4-storey building is 0.38s. According to the code
requirements, if a dynamic analysis is employed, the period of the structure may be estimated to
2Ta resulting 0.76s.
Figure 4.1. Plan view of the 4-storey building
51

The acceleration and velocity based site coefficients Fa and Fv are equal to 1 (NRCC,
2010). The design spectral response acceleration S(T) is determined by using data from the
uniform hazard spectrum computed from 2% probability of excedeence in 50 years. The S(T)
ordinates are given in Appendix "C" of the (NRCC, 2010) for the following period values: 0.2s,
0.5s, 1.0s and 2.0s. For 4.0s the value is half of that given for the 2.0s ordinate. These
aforementioned spectral ordinates are given in Table 4.1 and the design spectrum is illustrated in
Figure 4.3. By linear interpolation, the spectral ordinate corresponding to Ta = 0.76s is: S(Ta) =
0.59g.
Figure 4.2. Elevation of the 4-storey CBF with participating gravity columns
52

The importance factor IE has been selected for an office building and is equal to the value
of 1. The braced frame structure is classified as Moderately Ductile. The ductility related force
modification factor is Rd = 3.0 and the overstrength related force modification factor is R0 = 1.3
Herein, Rd is a factor that takes into regard the ability of the structure to dissipate energy and
the over-strength force modification factor, R0 takes into account the reserved strength from the
members of the structure.
The specified gravity (dead, live and snow) loads are shown in Table 4.2.
T(s) 0 0.2 0.5 1.0 2.0 4.0 Sa(g) 1.2 1.2 0.82 0.38 0.18 0.09
Table 4.1. Uniform hazard spectrum for Victoria, B.C
Figure 4.3. Design spectrum for Victoria, B.C
0 0.4 0.8 1.2 1.6 2 2.4 2.8 3.2 3.6 4Period [s]
0
0.2
0.4
0.6
0.8
1
1.2
Sa
(g)
Ta
53

The seismic weight per floor is composed of the weight of composite steel deck including
partition walls, floor finishing, mechanical and ceiling, the weight of columns, cladding walls
and the 25% of the snow load at the roof level. The total seismic weight of the building is
22683.8 kN. In Equation 4.1, Mv is the factor to account for higher mode effect on base shear
and is related to the fundamental period of the building. For the 4-storey building Mv = 1.0.
Thus, the base shear computed with Equation 4.1 is: V =0.59 x 1.0 x 22683.8/(3x1.3) = 3432 kN.
The resulted base shear is smaller than Vmax computed as per Equation 4.3 and in consequence,
the structural design is conducted for V = 3432 kN. As illustrated in Figure 4.1 there are two
CBF systems in the N-S direction and two CBF systems in E-W direction. Thus, in each
direction, each CBF system has to be designed to carry 3432/2 = 1716 kN in addition to forces
generated by P-delta effect and torsion.
To establish the sensitivity to torsion of the studied buildings, the ratio B = δmax/δave must
be computed in agreement with the NBCC 2010 provisions; where δmax is the maximum storey
displacement calculated at the extreme points of the building in the direction of the applied static
lateral forces acting at distances of ±0.1Dnx from the centers of mass at each floor, and Dnx is the
dimension of the building perpendicular to the direction of the applied forces. Furthermore, δave
is the average storey displacement of these extreme points. For the cases B > 1.7, buildings are
Roof Dead Load 3.4 kPa Snow Load 1.48 kPa
Floor Dead Load 5.0kPa
Live Load 2.4 kPa
Exterior walls 1.2 kPa
Table 4.2. Building Loads
54

considered as irregular. However, due to the symmetrical shape, the B ratio is less that 1.7 and
therefore the building is not torsional sensitive. Due to building’s symmetry, the center of mass
coincides with the center of rigidity. Herein, for simplicity, the effect of accidental torsion was
neglected.
The lateral forces distribution along the building height is established according to Equation 4.5
where Wx is given in Table 4.3:
𝐹𝑥 = (𝑉 − 𝐹𝑡)𝑊𝑥ℎ𝑥
∑ 𝑊𝑖ℎ𝑖𝑛𝑖=1
(4.5)
By using the above equation, the distribution of forces per floor, as well as the shear
forces are computed and given in Table 4.4. Because Ta > 0.7s, a concentrated force computed in
agreement with NBCC 2010 provisions was considered.
Storey hx[m] Wx [kN]
4 15.2 2853.1
3 11.4 6244.8
2 7.6 6789.5
1 3.8 6796.5
Total 22683.8
Table 4.3. Seismic weight of the structure (total / frame)
55

Storey hx[m] Vx [kN]
4 15.2 918.4
3 11.4 2125.6
2 7.6 3000.7
1 3.8 3432
Total 3432
4.3 Members Design
4.3.1 Braces design
The following load combinations are considered for brace sizing: DL + 0.5*LL + E and
1.25*DL +1.5*LL. Based on limit state design method, factored forces in member should be
lower or at most equal to the member resistance. Thus, Cf < Cr and Tf < Tr, where Cf and Tf are
the factored compression and tension forces and Cr and Tr are the member resistance force in
compression and tension, respectively.
The Cr and Tr values are calculated in accordance with Equations 4.6 and 4.7, respectively
as per CSA/S16-2009.
𝐶𝑟 = 0.9 𝐴 𝐹𝑦(1 + 𝜆2𝑛)−1 𝑛� (4.6)
𝑇𝑟 = 0.9 𝐴 𝐹𝑦 (4.7)
where Fy is the yield stress of the steel, 350 MPa, and A is the cross-sectional area of the brace.
The computed slenderness is λ = 𝐾𝐿𝑟� 𝐹𝑦
π2𝐸, where r is the radius of gyration and L is the clear
length of brace.
Table 4.4. Shear force distribution over the structure height
56

The slenderness ratio of all members, KL/r, and the width-to-thickness ratio have to be
thoroughly checked. The end support conditions have to be taken into account when computing
the KL value for compression brace members. The length L of the braces is the length between
the end of brace that is welded to the gusset plates In addition, for compression members, the
ratio KL/r should be less than 200, while the selected HSS braces should be Class 1 sections. For
X-bracing configuration, the tensile brace provides mid-span support to the compressive brace.
In this light, in the computed slenderness ratio expression, half of brace length is considered.
In conformity with clause 27.5.3.2 of S16-2009, the width-to-thickness ratio of HSS members
shall not exceed 330/Fy0.5 for braces with kL/r ≤ 100 and 420/Fy
0.5 for braces with kL/r = 200.
When 100 <kL/r < 200 linear interpolation is used.
Braces were designed based on forces computed from the static equivalent method. For beams
and columns design the effect of braces was considered.
4.3.2 SFRS Columns and Beams Design
The beams and columns of the seismic force resistant system (SFRF) are selected to be
Class 1 sections and are made of W-shape cross-sections. Beams of CBFs in X-bracing
configuration behave in bending under the gravity load combination 1.25*DL +1.5*LL and in
bending and axial compression under the DL + 0.5*LL + E combination. For design, the
following interaction equation is considered:
𝐶𝑓𝐶𝑟
+ 0.85𝑈1𝑥𝑀𝑓𝑥
𝑀𝑟𝑥≤ 1 (4.8)
where Cr and Mr are the members’ compressive and bending resistance, respectively; Cf and Mf
are the factored compressive force and in-plane bending moment. In the case of seismic resistant
57

system, the width-to-thickness ratio limit for Class 1 sections in bending for W-shapes is b/t ≤
145/Fy0.5.
The columns are considered continuum over two storeys.
The selected cross-sections for structural members such as: braces, beams and columns are given
in Table 4.5 and are also depicted in Figure 4.4.
Storey Braces Beams Columns 4 HSS 127 x 127 x 9.5 W 410 x 60 W 360 x 110 3 HSS 152 x 152 x 9.5 W 460 x 74 W 360 x 110 2 HSS 178 x 178 x 9.5 W 460 x 74 W 360 x 237 1 HSS 178 x 178 x 13.0 W 460 x 82 W 360 x 237
The behaviour of the structure studied has been designed through dynamic analysis by
using the response spectrum method implemented in ETABS software and afterwards the
numerical integration nonlinear time-history method implemented in the OpenSees software
framework (McKenna, et al. 2009).
By using a 3D model developed in ETABS, the period of building in the first and second
vibration mode in the direction of calculation was T1 =0.816s and T2 = 0.21s. As resulted, the
fundamental period is very close to that considered in the hand calculation.
Table 4.5. Selected members for the 4-storey CBF frame
58

4.4 Modeling the 4-Storey CBF Building in OpenSees
The OpenSees software, version 2.3.2 was used to analyze the 4-storey structure.
4.4.1 The OpenSees framework
The OpenSees framework is an open source program developed at the University of
California, Berkeley. The software framework is used for developing applications to simulate the
performance of structure upon failure.
Figure 4.4. Members sizes of the 2D CBF with participating gravity columns
59

This software allows defining material non-linearity, elements, numerical algorithms and
visualization inputs. The framework uses the TCL computer programing language to model,
analyze and extract the output of the models built. This TCL language resembles closely to the
C++ programming language.
The application input consists of simple defined texts on which the user has to define the
elements, sections, nodes, load patterns, time series, materials and more factors that define the
structure needed to be analyzed. The program uses a central domain to store the data provided by
the definition of the model and outputs to an analysis module according to the recorder provided.
The analysis application is time dependent and acts based on a translation from an initial time ti
to an incremented time (ti + dt). The time for running the simulation is imposed by the user.
4.4.2 Modelling of beams and columns
The beams and columns selected for the structures are shown in Table 4.5. These
members are modeled in OpenSees as force based nonlinear beam-column elements, while the
Steel02 material that is known as the Giuffré-Menegotto-Pinto material was assigned. This type
of uniaxial steel material with isotropic strain hardening allows the material to yield under
developed strain while the cross-sections of the element is centered about its neutral axis.
The material definition input requires the elastic modulus, E = 200GPA and the yield stress of
the steel, Fy= 350MPa to be inserted. The element contains a series of parameters that control the
transition of the steel material from an elastic range to a plastic one as well as isotropic strain
hardening values. As seen in Figure 4.5, the material behaviour is different for each selected R
value (e.g., R equal to 5 and 20).
60

The elements that have been used to model the beams and columns are beam with hinges
witch belong to the nonlinear beam column elements category. These elements are able to
concentrate plasticity in the user defined plastic hinge sections located at element’s ends, while
the remaining middle segment zone behaves elastically. This element also provides the ability to
define the length of plastic hinges at its ends while considering two integration points per plastic
hinge that represent the linear curvature distribution.
To sum it up, in order to assign the elements that simulate the behaviour of beams and
columns in the OpenSees software, the following parameters should be defined: the member
geometry, the length of the plastic hinge and the cross-sectional properties of the structural
element.
The length of the plastic hinge is assumed to be equal to the height of member’s cross-section.
The beams and columns cross-sectional definition is composed of vertical and horizontally
placed fibres as illustrated in Figure 4.6.
Figure 4.5. OpenSees Steel02 material response (Mazzoni et al., 2007)
61

The web of the cross-section contains 6 vertical fibres and each flange has 5 horizontal
fibres which gives a total of 16 fibres.
4.4.3 Braces modeling in OpenSees
Each brace member is discretized in 16 force based nonlinear beam column element with
distributed plasticity. Because this element does not contain pre-defined integration points, four
integration points have been considered per element. The same Steel02 material is assigned to
braces. The out-of-straightness parameter is set to be equal to L/500 for HSS braces as per
Zemian recommendation (Zemian, 2010), where L is half of the brace length in the particular
case of “X-bracing”. The brace cross-section is then divided into 216 fibres, following the
discretization model with rounded corners (Tremblay, 2008) as illustrated in Figure 4.7.
Each end of individual half of brace is connected to beam and column by means of gusset
plate. Both diagonal bracing members are connected in the intersection points 5,8,11 and 14 with
Figure 4.6. Beams and columns cross-section fibres discretization in OpenSees
62

two zero-length spring elements assigned in the zero-length elements, C2 as seen in Figure 4.8
which illustrates the OpenSees model.
4.4.4 CBF model
The overall building structure has two seismic force resistance systems in both X and Y
directions. Half of the gravity columns are added to the model as is shown in Figure 4.4 in order
to simulate the behaviour of the participating stiffness in the desired load applying direction.
These gravity columns are defined as pin-ended members over two storeys and are linked at each
floor level to the seismic force resistant systems by rigid links as shown in Figure 4.8. Columns
of CBFs are pinned connected to beams and are continuum over two storeys. Beams are pinned
connected to columns, as is shown in Figure 4.2.
Figure 4.7: Fibre distribution of braces cross-section, and brace member discretization
in OpenSees
63

4.4.5 Gusset plates modelling definition
In the nonlinear range, HSS braces buckle out-of plane and plastic hinges are developed
at brace’s mid span and in gusset plates at the end of the brace. This behaviour of brace’s gusset
plate is simulated in the zero-length element as rotational springs assigned in the zero-length
elements illustrated in Figure 4.8. The zero-length element is located between the rigid link and
the brace member. These connections simulated by two rotational and one torsional spring are
numbered as C1, C3, C5 and C6.These springs allow out-of-plane rotation, in-plane rotation and
in-plane torsion.
Figure 4.8: OpenSees model of the 4-storey CBF with participating gravity columns
64

The connection between the beam and column is simulated by the rotational spring C4 as
shown in Figure 4.8. This rotational spring assigned in the zero-length element has very small
flexural stiffness in order to simulate the behaviour of beam defined theoretically as a pinned
ended member.
In order to determine the dimensions for the gusset plate we have to follow several steps,
starting by computing the length of welding, thickness of gusset plate, the Whitmore width, Ww,
and by assuming the steel strength of steel plate. The geometry of gusset plate is depicted in
Figure 4.9.
In order to meet the capacity design criteria, the compressive and tensile strength
resistance of gusset plate should be greater than that of the braces. By rephrasing, the probable
tensile and compression resistance of braces (Tu and Cu) should be lower than the gusset
Figure 4.9. Brace to frame gusset plate connection
65

resistance in tension and compression (Tr,g and Cr,g) that are given in Equation 4.9 and Equation
4.10, respectively.
𝑇𝑟,𝑔 = ∅𝐹𝑦𝑊𝑤𝑡𝑔 (4.9)
𝐶𝑟,𝑔 = ∅𝐴𝑔𝐹𝑦(1 + 𝜆𝑔2𝑛)
−1𝑛 (4.10)
where, λg is given in Equation 4.11.
𝜆𝑔 = 𝐾𝐿𝑔𝑡𝑔�12𝐹𝑦
𝜋2𝐸 (4.11)
The length of gusset plate showed in Equation 4.11 is calculated as: Lg = Lave=
(L1+L2+L3)/3 and k=0.5. The representation of L1, L2, and L3 is shown in Figure 4.9.
The length of 2tg is required to allow the plastic hinge to form in the gusset plate when the brace
buckles out-of-plane.
In the OpenSees model, the gusset plate connection is replicated by means of two rotational and
one torsional spring assigned in the zero-length element that connects the brace’s end with the
rigid link.
The out-of-plane flexural stiffness of the gusset plate, as proposed by Hsiao et al. (2012)
is EIg/Lave, where Lave is the average of the lengths: L1, L2 and L3 that have been depicted in
Figure 4.9, E is the elastic modulus of the gusset plate and Ig is the moment of inertia which is Ig
= Wwtg3/12. Thus, the stiffness assigned to one rotational spring that simulates the out-of-plane
bending of gusset is in agreement with that proposed by Hsiao et all. (2012) and the stiffness
assigned to the second rotational spring which simulates the in-plane bending is assigned to be
larger than the flexural stiffness of brace. The third spring assigned in the zero-length element is
taking into consideration the torsional stiffness of the gusset plate defined as GJ/Lave where G is
the shear modulus of steel and J the torsional constant which is given by Equation 4.12.
66

𝐽 = 0.333𝑏𝑤𝑡𝑔3 (4.12)
In this study, Fy = 350 MPa is the yield strength of steel, J is the torsional moment of inertia for
the gusset plate and I the flexural moment of inertia of the same plate. The rigid link showed in
Figure 4.8 simulates the remaining part of the gusset plate that is welded to beam and column.
Elastic steel material is assigned to all rigid links.
4.5 Dynamic Analysis of the CBF System Using OpenSees
For Victoria, B.C., the ground motions used to simulate the seismic load arrive from two
sources: crustal and subduction. In general, the time step of recording the accelerogram’s
amplitudes is 0.005s, 0.01s and 0.02s. The integration time used to run the OpenSees models is
set to 0.0005 seconds and must be smaller than the time step of the given record. The smaller the
increment is the longer time is required to complete the analysis, while the convergence problem
diminishes.
In the case of steel structures, the percentage of the critical damping applied to all of the
structures elements except braces, is 2%. The braces are excluded from being damped due to the
nature of nonlinear hysteretic behaviour when the dissipated energy is released. In order to better
correlate the results of the building, the fundamental period as well as the 2nd vibration mode
from the OpenSees software and Etabs 3D model are given in Table 4.6. Both periods of
building were calculated in elastic range based on the elastic stiffness.
Height [m] Ta [s] T1 [OpenSees] T1 [Etabs 3D] T1 T2 T1 T2
15.2 0.760 0.825 0.208 0.816 0.210
Table 4.6. CBF building period in finite elements software simulation
67

Thus, in elastic range both values resulted for T1 in OpenSees and ETABS are very close.
4.5.1 Selecting the ground motions
In general, the seismic hazard for a given location is characterized by uniform hazard
spectral ordinates, Sa, that are specified at periods of 0.2, 0.5, 1.0, and 2.0s for a return period of
2475 years or 2% probability of exceedance in 50 years. For Victoria, the spectral ordinates in
units of ground acceleration are showed in Table 4.2. Thus, in this study, all ground motions
were selected so that their spectra matched the UHS in the range delimited by the period of
interest: 0.2T1 and 1.5T1. For analyses, two assemblies of seismic ground motions given in Table
4.7 have been selected. The first assembly is composed of 7 crustal ground motions that were
selected from the PEER Ground Motion Database Beta Version (2010) in order to match the
magnitude scenarios for Victoria considered as being in the range of M6.5 to M7.2. These
records correspond to Class C soil for which the shear wave average velocity is between 360 and
760 m/s. The second assembly of ground motions is used to simulate the Cascadia Subduction
event, and consists of seven ground motions with a magnitude of M9.0. Researchers anticipate
similarities between the Tohoku records registered during the M9 Tohoku event (March 2011)
and potential records generated by Cascadia subduction fault. The seven records corresponding
to site class C were selected from the following website: www.k-net-bosai.go.jp
68

Table 4.7 reveals the list of selected records and shows the earthquake magnitude Mw, the
epicentral distance, R, the peak ground acceleration PGA, peak ground velocity PGV and the
Trifunac duration td of the earthquake. The ratio between the PGV/PGA, peak ground velocity to
peak ground acceleration is an important factor for selecting the ground motions based on their
frequency content.
ID Event Station Comp Mw Rhvp [km]
PGA [g]
PGV [m/s]
PGV/PGA [s]
td [s]
CRUSTAL GROUND MOTIONS
C1 Loma Prieta Anderson Dam 739-250 6.9 19.9 0.244 0.203 0.0832 10.51 C2 Loma Prieta Gilroy Array #3 767-0.0 6.9 36 0.555 0.358 0.0066 6.36 C3 Loma Prieta Lab Apeel 9 787-360 6.9 54 0.278 0.292 0.0107 11.57 C4 Northridge Castaic 963-90 6.7 44 0.568 0.517 0.0093 9.08 C5 Northridge Palo Alto 986-195 6.4 37 0.186 0.236 0.0129 11.43 C6 Northridge LA-UCLA
Grounds 1006-90 6.7 25 0.278 0.217 0.008 11.30
C7 Northridge Moorpark-Fire Station
1039-180 6.7 36 0.292 0.204 0.0071 14.22
SUBDUCTION GROUND MOTIONS
S1 2011/11/3 Tohoku
MYG001 EW 9 155 0.43 0.23 0.054 83
S2 2011/11/3 Tohoku
MYG004 EW 9 184 1.22 0.48 0.04 85
S3 2011/11/3 Tohoku
FKS005 EW 9 175 0.45 0.35 0.079 92
S4 2011/11/3 Tohoku
FKS010 EW 9 189 0.86 0.56 0.066 66
S5 2011/11/3 Tohoku
FKS009 EW 9 216 0.83 0.44 0.054 74
S6 2011/11/3 Tohoku
IBR004 EW 9 273 1.03 0.38 0.037 33
S7 2011/11/3 Tohoku
IBR006 EW 9 283 0.78 0.30 0.039 36
Table 4.7: Selected ground motions characteristics
69

The number of selected records per group agrees to ASCE-SEI 2007 provisions. Thus,
when three different records are considered the maximum response should be selected.
Afterwards, when seven records are considered the results are expressed as being the mean. The
selected accelerograms as recorded are illustrated in Figure 4.10 and Figure 4.11.
Figure 4.10. Selected crustal ground motions
0 20 40Time [s]
-0.6
-0.4
-0.2
0
0.2
0.4
0.6
Acc
ele
ratio
n (
g)
Anderson Dam, Loma Prieta (C1)Gilroy Array #3 (C2)Lab Apeel 9 (C3)Castaic Old Ridge R. Northridge (C4)Palo Alto (C5)LA-UCLA Grounds (C6)Moorpark-Fire Station (C7)
Figure 4.11. Selected subduction ground motions accelerations
0 20 40 60 80 100 120 140 160 180 200 220 240 260 280 300
Time [s]
-1.2-1
-0.8-0.6-0.4-0.2
00.20.40.60.8
11.2
Acce
lera
tion
(g)
Tohoku (S1)Tohoku (S2)Tohoku (S3)Tohoku (S4)Tohoku (S5)Tohoku (S6)Tohoku (S7)
70

4.5.2 Ground motions scaling procedure
The ground motions selected have to undergo a scaling procedure in order to match the
uniform hazard spectrum between 0.2*T1 and1.5*T1 at the building location. The NBCC 2010
code does not specify a procedure regarding ground motions scaling. Although, it is mentioned
that all selected ground motions should be scaled to match the UHS ordinate at the fundamental
period,T1 (ordinate S(T1)) and to be at least above the UHS at all points corresponding to the
period of higher modes. More in detail, the ASCE/SEI 2007 provisions require that the mean of
the 5% damped response spectra of a minimum of seven scaled ground motions should match or
be above the UHS, over the period of interest 0.2*T –1.5*T as depicted in Figure 4.3. Herein, the
ASCE/SEI2007 requirements are applied.
During the inelastic behaviour of structure, the structure’s stiffness starts to degrade and
the building should sustain an elongated fundamental period that may be larger than 1.5*T1
(Kalkan and Chopra, 2010).
The employed method for scaling ground motions is based on the Reyes and Kalkan
methodology (2011) which consists on minimizing the discrepancy between the scaled
acceleration response spectrum of each record and the UHS over the specified period range
(0.2*T1–1.5*T1). Thus, in the studied case, the interval of interest is between 0.2*T1 = 0.165 s
and 1.5*T1 = 1.237 s. The resulted scale factors are given in Table 4.8. It is noted that scale
factor of 1.0 was used for all subduction records.
71

For example in Figure 4.12 and Figure 4.13 the unscaled spectral accelerations of the
crustal and subduction ground motions are depicted, while in Figures 4.14 and 4.15 the scaled
acceleration spectra for crustal and subduction, respectively, are illustrated, as well as the mean
of 7 records.
Crustal Ground Motions GM ID C1 C2 C3 C4 C5 C6 C7 Scale Factor 1.82 1.00 1.62 1.032 2.16 2.31 1.98
Subduction Ground Motions GM ID S1 S2 S3 S4 S5 S6 S7 Scale Factor 1 1 1 1 1 1 1
Table 4.8: CBF scale factors for a 4-storey frame with gusset plates
Figure 4.12: Crustal GM’s non-scaled spectral accelerations Sa(g)
0 0.5 1 1.5 2 2.5 3 3.5 4Period [s]
0
0.5
1
1.5
2
2.5
Sa
(g)
Anderson Dam, Loma Prieta (C1)Gilroy Array #3 (C2)Lab Apeel 9 (C3)Castaic Old Ridge R. Northridge (C4)Palo Alto (C5)LA-UCLA Grounds (C6)Moorpark-Fire Station (C7)UHS
72

The acceleration response spectrum obtained from the selected Tohoku records exhibit
very large ordinates in the short period range 0.1-0.35s. Thus, low-rise buildings with a
fundamental period in this range may be exposed to ground motions that are two times larger
than those required by the code. However, buildings with a fundamental period larger than 1.6
seconds are not exposed to increased acceleration response spectrum ordinates. Although in the
interval of 0.7-0.8 s, the average spectrum shows a slightly lower value than that required by
code, the scale factor was not raised above 1.0 (Tirca et al. 2012). It is noted that for class C soil
the uniform hazard spectrum and the design spectrum are the same.
Figure 4.13: Subduction GM’s non-scaled spectral accelerations Sa(g)
0 0.5 1 1.5 2 2.5 3 3.5 4Period [s]
0
0.5
1
1.5
2
2.5
3
3.5
4
4.5
5
Sa (g
)
Tohoku (S1)Tohoku (S2)Tohoku (S3)Tohoku (S4)Tohoku (S5)Tohoku (S6)Tohoku (S7)UHS
73

0 0.5 1 1.5 2 2.5 3 3.5 4Period [s]
0
0.5
1
1.5
2
2.5
Sa (g
) UHSMean valueScaled records
1.5 Ta0.2 Ta
Figure 4.14: Spectral acceleration of scaled Crustal GMs with the Mean and UHS
Figure 4.15: Spectral acceleration of scaled Subduction GMs with the Mean and UHS
0 0.5 1 1.5 2 2.5 3 3.5 4Period [s]
0
0.5
1
1.5
2
2.5
3
3.5
4
4.5
5
Sa
(g)
UHSMean ValueScaled records
1.5 Ta0.2 Ta
74

Figure 4.16. The CBF response in terms of peak interstorey drift for: a)crustal, b)subduction.
0 0.5 1 1.5 2 2.5Interstorey Drift [%hs]
0
1
2
3
4
Sto
rey C1
C2C3C4C5C6C7
0 0.5 1 1.5 2 2.5Interstorey Drift [%hs]
0
1
2
3
4
Sto
rey
S1S2S3S4S5S6S7
a) b)
4.5.3 Seismic response of the studied CBF’s
The behaviour of the 4-storey CBF was analysed under the 14 records. The distribution
of inter-storey drift over storey height for each ground motion of each assembly is shown in
Figure 4.16. The results demonstrate a larger inter-storey drift values obtained under the crustal
than the subduction records.
The behaviour of a 4-storey CBF is discussed in detail by analyzing the seismic response
under two crustal and two subduction records that subjected the building to large demands.
These selected ground motions are the two Northridge records C5 (986-195) and C7 (1039-180),
as well as two of Tohoku records such as S2 (MYG004) and S4 (FKS010). It is noted that
MYG004 accelerogram is composed of two overlapping ground ruptures and FKS010 was
generated from a large ground motion energy input.
The time-history response of all braces under the C5 ground motion is illustrated in Figure 4.17
where braces are identified by the given joints according to Figure 4.8. The brace response is
showed in terms of force-displacement. As reported, braces of the bottom two floors (1st and 2nd)
75

were subjected to large inelastic deformations in tension and compression after buckling
occurred, while braces of the upper two storey have performed in the elastic range. The
maximum deformation demand occurred at the second floor where 80 mm brace deformation
was reported in compression. Braces of the 1st floor level have undergone almost the same
deformation demand as the 2nd floor braces. As depicted in Figure 4.16, the maximum interstorey
drift occurred at the 1st floor level and is about 1.7%hs. Due to the large deformation of the 2nd
floor brace, large interstorey drift was occurred at the 3rd floor, as well (1.65%hs). Further, the
time-history response series of each floor under the C5 ground motion is shown in Figure 4.18 in
terms of floor’s deformations and the corresponding interstorey drift. As illustrated in Figure
4.18b, all floors deformed on the same building’s side. At the 1st and 3rd floor level, a maximum
displacement of 80 mm and 74 mm, respectively was recorded. In addition, the maximum
interstorey drift occurred right after the time when the PGA was reached (t ~ 9.0 s). The residual
(permanent) interstorey drift values are given in Table 4.9. It is noted that five seconds of zero
accelerogram’s amplitude were added to each ground motion in order to analyse the residual
interstorey drift. From Table 4.9, the maximum residual interstorey drift occurred at the 1st floor.
Ground Motion ID Storey Interstorey drift
% hs Residual interstorey drift
% hs
C5 986-195
4 0.4 0.3 3 1.8 0.4 2 1.0 0.2 1 1.8 0.5
C7 1039-180
4 0.6 0.15 3 1.45 0.4 2 1.3 0.25 1 1.3 0.35
Table 4.9. Interstorey and residual interstorey drift under the C5 and C7
76

The response of the 4-storey CBF building in term of force-displacement experienced by
braces is illustrated in Figure 4.19 under the C7 record. This record shows 4-5 peaks between t =
8.0 s and t = 15.0 s. The maximum interstorey drift under the C7 record occurred at the 3rd floor
level and is equal to 1.45 %hs. Braces of bottom two floors experienced inelastic deformations
after buckling occurred, while the braces of the upper two floors remained in the elastic range.
The larger brace’s deformation occurred at the 2nd floor level and is about 60 mm in both tension
and compression (Figures 4.19 e and f). Similarly, all floors deformed on the same building’s
side (Figure 20 b) and the maximum residual interstorey drift occurred at the 3rd floor (e.g.
0.4%hs as per Table 4.9).
77

78
Figure 4.17. The CBF time-history response of braces under C5 record: a) 4th St. Brace 9-13, b) 4th St. Brace 10-12, c) 3rd St. Brace 6-10, d) 3rd St. Brace 7-9, e) 2nd St. Brace 2-7, f) 2nd St. Brace 3-6, g) 1st St. Brace 1-3, h) 1st St. Brace

Figure 4.18. CBF time-history response under C5: a) Scaled GM, b) Storey- displacement time-history series, c) 1st St interstorey drift,d) 2nd St. interstorey drift, e) 3rd St. interstorey drift, f) 5th St. interstorey drift 79

80
Figure 4.19. CBF time-history response of braces under C7: a) 4th St. Brace 9-13, b) 4th St. Brace 10-12, c) 3rd St. Brace 6-10, d) 3rd St. Brace 7-9, e) 2nd St. Brace 2-7, f) 2nd St. Brace 3-6, g) 1st St. Brace 1-3, h) 1st St. Brace 2-4.

Figure 4.20. CBF time-history response under C7: a) Scaled GM, b) Storey- displacement time-history series, c) 1st St. interstorey drift, d) 2nd St. interstorey drift, e) 3rd St. interstorey drift, f) 4th St. interstorey drift 81

Both selected subduction ground motions S2 and S4 demanded a similar peak interstorey
drift over the building height which is 1.8%hs and occurred at the 1st floor (Figure 4.16). Under
both records, the larger damage demand occurred at the bottom two floors where braces
experienced buckling followed by yielding in tension. In both cases the maximum demand in
brace deformation was about 80 mm at the 1st floor and about 60 mm at the 2nd floor. Braces of
the 3rd floor have experienced inelastic response but the demand was smaller than that imposed
to the floor below. Braces of the top floor level have reached buckling in compression. The
force-deformation hysteresis loops imposed by S2 record to all braces are depicted in Figure
4.21, while the time-history series of floors deformation and interstorey drift are depicted in
Figure 4.22. The S2 accelerogram showed in Figure 4.22a illustrates double peaks on both
directions that occurred about at the same time: t = 46.02 s and t = 96.42 s. It is interesting to
note that the 1st and 2nd floor experienced larger interstorey drift when the second large shock
was input into the building, while the 3rd floor experienced the same peak interstorey drift under
both socks.
Table 4.10 contains both peak interstorey drift and residual interstorey drift recorded
under both S2 and S4 records. A maximum residual interstorey drift of 0.45%hs was recorded
under S2 at the 1st floor level. The corresponding residual drift value is lower under the S4 record
(0.25%hs) and was reached at the 3rd floor. Time-history response in term of force-deformation
hysteresis loops are illustrated for all braces in Figure 4.23, while the time-history series of floors
displacement and interstorey drifts are presented in Figure 4.24. Under the S4, the peak
82

Ground Motion ID Storey Interstorey drift
% hs Residual interstorey drift
% hs
S2 MYG004
4 0.7 0.18 3 1.5 0.28 2 1.4 0.2 1 1.8 0.45
S4 FKS010
4 0.7 0.1 3 1.6 0.25 2 0.1 0.14 1 1.8 0.23
maximum floor displacement accelerograms values that occur in both positive and negative
directions were recorded at t=87.21s (t=87.15s) and t=105.4s (107.37s) as seen in Figure 4.24a.
Table 4.10. Interstorey and residual interstorey drift under S2 and S4
83

84
Figure 4.21. CBF time-history response of braces under S2: a) 4th St. Brace 9-13, b) 4th St. Brace 10-12, c) 3rd St. Brace 6-10, d) 3rd St. Brace 7-9, e) 2nd St. Brace 2-7, f) 2nd St. Brace 3-6, g) 1st St. Brace 1-3, h) 1st St. Brace 2-4

Figure 4.22. Time-history CBF response under S2: a) Scaled GM, b) Time-history series of storey –displacement, c) 1st St. interstorey drift, d) 2nd St. interstorey drift, e) 3rd St. interstorey drift, f) 4th St. interstorey drift 85

Figure 4.23. Time- history response of CBF braces under S4: a) 4th St. Brace 9-13, b) 4th St. Brace 10-12, c) 3rd St. Brace 6-10, d) 3rd St. Brace 7-9, e) 2nd St. Brace 2-7, f) 2nd St. Brace 3-6, g) 1st St. Brace 1-3, h) 1st St. Brace 2-4
86

Figure 4.24. Time-history response of CBF under S4: a) Scaled GM, b) Storey -Displacement time-history series,c) 1st St. inter-storey drift,d) 2nd St.inter-storey drift, e) 3rd St. inter-storey drift, f) 4th St. inter-storey drift 87

Chapter 5. Seismic Analysis of a 4-Storey Building Equipped with Double-
Pin Connections Displaced in-Parallel Using OpenSees
5.1 Design of the 4-storey CBF Equipped with Double-Pin Connections Displaced in-
Parallel
The 4-storey moderately ductile CBF that has been designed in Chapter 4 is employed in
this chapter in order to study the seismic response of the new proposed system: CBF with
dissipative double-pin connections.
The same ground motions that were employed in the previous chapter, and showed in Table 4.7,
are considered. A comparison between the seismic response of the two CBFs with and without
dissipative connections is conducted.
5.2 Dissipative Connection Design for the 4-Storey CBF
The same members designed for the moderately ductile CBF that are given in Table 4.5
are used herein, while the changes are only applied at the level of the brace-to-column
connections.
The design procedure of the CBF structure equipped with double-pin joints consists on
sizing these brace-to-column connections to yield and dissipate the seismic input energy before
braces reach their buckling strength. In this respect, it is recommended that the pin member
should yield in bending at an applied force that equates 60-80% of brace’s compressive strength,
Cr. In this design, the computed pins’ sizes of double-pin connections with pins displaced in-
parallel are shown in Table 5.1. For example, the compressive resistance of HSS 178x178x13
brace located at the 1st floor level is Cr=1729 kN, whereas the seismic force resulted from the
88

static equivalent method is Cf=1288.1 kN. The difference between Cf and Cr is about 35%. The
selected set of pins placed in-parallel is composed of 2 pins of a rectangular cross-section of
30mm x 45mm. Both pins have a cumulated ultimate force Pu=1580kN, which is lower than the
compression resistance of the brace and is higher that the seismic force demand. The Pu value
satisfies Equation 5.1.
𝐶𝑓 < 𝑃𝑢 < 𝐶𝑟 (5.1)
Although in the experimental tests depicted in Chapter 3 it was shown that the pin member was
located on its weak axis, in this numerical example, the pin is located on its strong axis.
However, further experimental tests have to be carried out in order to conclude on the position of
pins versus their main cross-sectional axes. In general, the cross-section of pins placed in-parallel
or in-line is smaller than that of a single pin.
St. HSS Brace Brace Cf [kN]
Brace Cr [kN]
Double-pin [mm]
Parallel Pins Pu [kN]
4 127 x 127 x 9.5 466.5 651.7 25 x 30 585.2 3 152 x 152 x 9.5 921.1 995.9 30 x 35 956 2 178 x 178 x 9.5 1165.6 1289.2 30 x 40 1248 1 178 x 178 x13.0 1288.1 1729.0 30 x 45 1580
The double-pin connection with pins displaced in-parallel replace the gusset plate
connections of brace-to-column joints, as is illustrated in Figure 5.1. However, in the OpenSees
model, the properties of the gusset plate are removed and a new axial spring made up of
Pinching4 material is added in the zeroLength element. In the case of pins placed in-parallel, two
axial springs will be added. These springs will simulate the behaviour of the proposed dissipative
Table 5.1. Pin member sizes for the 4-storey CBF with double-pin joints
89

connection discussed in Chapter 3. In the design, all structural members are intended to behave
elastically, while the pin connections are sized to dissipate the input energy.
Figure 5.1. Elevation of a 4-storey CBF equipped with double-pin brace-to-
column joints (OpenSees model)
90

5.3 Ground Motions Scaling Procedure for the 4-Storey Frame with Double-pin
Connections
The building’s fundamental period is established by evaluating the OpenSees frame
model, and is revealed to be T1=1.386s while the second period is T2=0.360s. The T1 value of the
new system is about 150% larger than the period of the CBF system given in Chapter 4.
The building was subjected to the same ground motion assemblies that are given in Table 4.7.
The calculated scale factor, as explained in the previous chapter. is given in Table 5.2. Because
the pin connection provides lower stiffness, the period increases and all crustal ground motions
were re-scaled according to the computed buildings period.
5.4 Seismic Response of the Studied CBF with Double-Pin Connections
The behaviour of the 4-storey CBF was analysed under the new scaled 14 records. The
distribution of inter-storey drift over storey height recorded under each ground motion of each
assembly is shown in Figure 5.2.
Crustal Ground Motions
GM C1 C2 C3 C4 C5 C6 C7
Scale Factor 2.23 1.04 1.45 0.81 2.26 2.26 1.52
Subduction Ground Motions
GM S1 S2 S3 S4 S5 S6 S7 Scale Factor 1 1 1 1 1 1 1
Table 5.2. Scale factors applied to GMs used to analyse the 4-storey CBF with double-pin
91

Under all ground motion excitations, the HSS braces have remained elastically as
expected. The results recorded under the C7 input are illustrated in Figure 5.3. It is demonstrated
that braces of CBF with double-pin joints behave linearly elastic at all floors in both directions:
tension and compression.
Figure 5.2. Interstorey drift of CBF with double-pin joints displaced in-parallel under: a) Crustal records b) Subduction records
0 0.5 1 1.5 2 2.5Interstorey Drift [%hs]
0
1
2
3
4S
tore
yC1C2C3C4C5C6C7
0 0.5 1 1.5 2 2.5Interstorey Drift [%hs]
0
1
2
3
4
Sto
rey
S1S2S3S4S5S6S7
a) b)
Figure 5.3. Behaviour of braces of CBF with double-pin connections under C7 record: a) 4th st. Brace 9-13, 3rd St. Brace 6-10, 2nd St. Brace 2-7, 1st St. Brace 1-3, b) 4th St. Brace 10-12, 3rd St. Brace 7-9, 2nd St. Brace 3-6, 1st St. Brace 2-4
92

Under the C5 record, pins located at the 3rd floor and made of rectangular 30x35mm
cross-section reach their cumulative ultimate strength of 956 kN at the time t =18 s when they
exhibited a maximum displacement of 35 mm, as illustrated in Figure 5.4. The maximum floor
displacement under the C5 record reaches 86 mm at the 3rd storey as depicted in Figure 5.5.
In the case of C7 record, the applied ground motion does not trigger the ultimate strength
of the cumulated value for the pin forces in the overall frame response and provides a maximum
joint displacement of 20 mm that is shown in Figure 5.6.
93
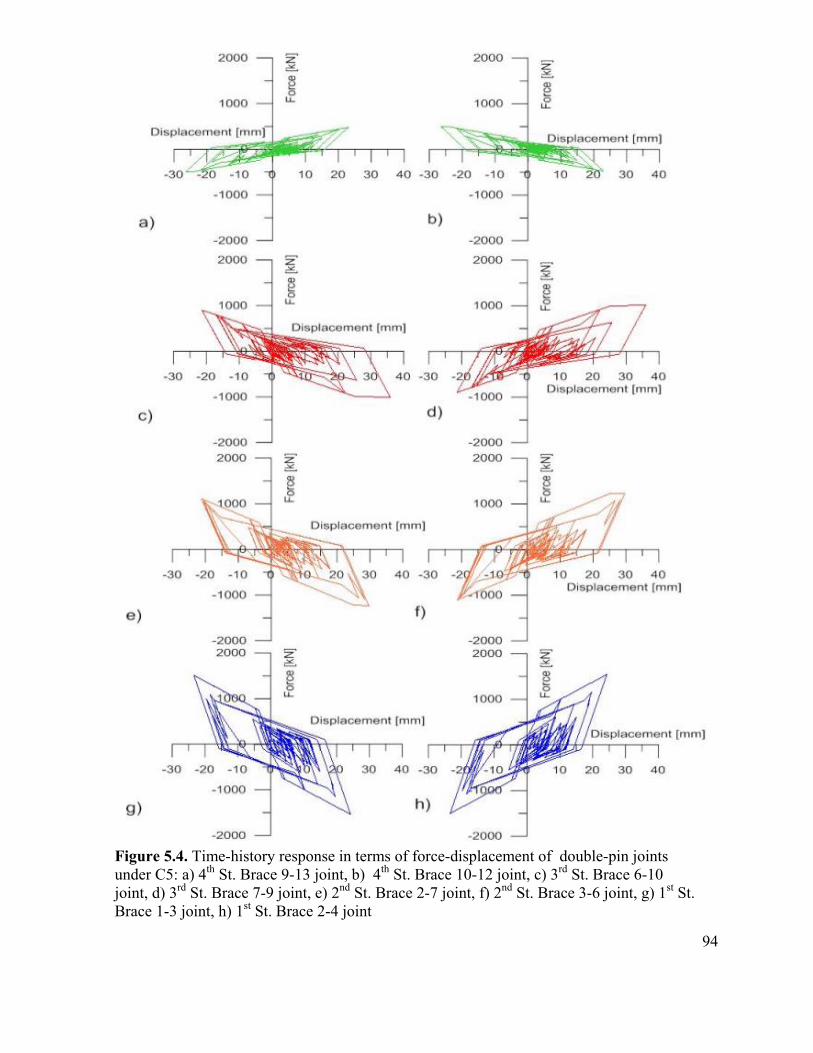
Figure 5.4. Time-history response in terms of force-displacement of double-pin joints under C5: a) 4th St. Brace 9-13 joint, b) 4th St. Brace 10-12 joint, c) 3rd St. Brace 6-10 joint, d) 3rd St. Brace 7-9 joint, e) 2nd St. Brace 2-7 joint, f) 2nd St. Brace 3-6 joint, g) 1st St. Brace 1-3 joint h) 1st St Brace 2-4 joint
Figure 5.4. Time-history response in terms of force-displacement of double-pin joints under C5: a) 4th St. Brace 9-13 joint, b) 4th St. Brace 10-12 joint, c) 3rd St. Brace 6-10 joint, d) 3rd St. Brace 7-9 joint, e) 2nd St. Brace 2-7 joint, f) 2nd St. Brace 3-6 joint, g) 1st St. Brace 1-3 joint, h) 1st St. Brace 2-4 joint
94

Figure 5.5. Time-history series obtained for CBF with pins in-parallel under C5: a) Scaled GM, b) Storey-displacement time-history series, c) 1st St. interstorey drift, d) 2nd St. interstorey drift, e) 3rd St. interstorey drift, f) 4th St. interstorey drift
95

Figure 5.6. Time-history response in terms of force-displacement of double-pin joints under C7: a) 4th St. Brace 9-13 joint, b) 4th St. 4 Brace 10-12 joint, c) 3rd St. Brace 6-10 joint, d) 3rd St. Brace 7-9 joint, e) 2nd St. Brace 2-7joint, f) 2nd St. Brace 3-6 joint, g) 1st St. Brace 1-3 joint, h) 1st St. Brace 2-4 joint
96

Figure 5.7 Time-history series obtained for CBF with pins in-parallel under C7: a) Scaled GM, b) Storey-displacement time-history series, c) 1st St. interstorey drift, d) 2nd St. interstorey drift, e) 3rd St. interstorey drift, f) 4th St. interstorey drift
97

Under the subduction S2 record even the 4th floor pins made of a rectangular 25x30mm
cross-section reach their cumulative ultimate strength of 582.2kN at the time of 125s, when
experienced a maximum displacement of 35mm, as shown in Figure 5.8. The S2 ground motion
subjected the building to premature failure at t=125s, due to the accumulation of strain in the
structural elements after the highest PGA reached at the t = 97.54 s (see S2 accelerogtam) was
passed. The storey-displacement time-history series are illustrated in Figure 5.9.
A similar premature failure was reached when the building was subjected to the S4
record. The collapse was reached at t = 126s after the building overpasses the highest
accelerogram peak. The storey-displacement time-history series are illustrated in Figure 5.10.
It is recommended to apply a lower scaling factor to subduction ground motions in order to
allow the structure to complete its inelastic cyclic incursion. Therefore, the subduction records
impose larger damage to the CBF building with dissipative pin connections.
98

Figure 5.8. Time-history response in terms of force-displacement of double-pin joints under S2: a) 4th St. Brace 9-13 joint, b) 4th St. Brace 10-12 joint, c) 3rd St. Brace 6-10 joint, d) 3rd St. Brace 7-9 joint, e) 2nd St. Brace 2-7 joint, f) 2nd St. Brace 3-6 joint, g) 1st St. Brace
Figure 5.8. Time-history response in terms of force-displacement of double-pin joints under S2: a) 4th St. Brace 9-13 joint, b) 4th St. Brace 10-12 joint, c) 3rd St. Brace 6-10 joint, d) 3rd St. Brace 7-9 joint, e) 2nd St. Brace 2-7 joint, f) 2nd St. Brace 3-6 joint, g) 1st St. Brace 1-3 joint, h) St.1 Brace 2-4.
99

Figure 5.9. Time-history series obtained for CBF with double-pin joints displaced in-parallel under S2: a) Scaled GM, b) Storey-displacement
Figure 5.10. Time-history series obtained for CBF with double-pin joints displaced in-parallel under S4: a) Scaled GM, b) Storey-displacement time-history series
Figure 5.10. Time-history series obtained for CBF with double-pin joints displaced in-parallel under S4: a) Scaled GM, b) Storey-displacement time-history series.
100

5.5 CBFs with and without Double-pin Connections: Comparative Results
5.5.1 The analysis run time under selected ground motions
The run time results from the simulation of the CBFs with gusset plates that was illustrated in
Chapter 4 and that obtained for the CBFs equipped with double-pin joints (DPP) as per Chapter 5
output are shown in Table 5.3 for the applied Crustal GMs and in Table 5.4 for the Subduction
GMs. All analyses conducted in OpenSees on the CBF system successfully runs, while several
models with incorporated double-pins fail to run completely. All ground motions have at their
end a five seconds of zero acceleration amplitude in order to analyse the response under free
vibrations.
Furthermore, in both aforementioned tables, for analyses that encountered failure are
highlighted and a reduced scale factor was proposed. As resulted, when a slightly lower scale
factor was applied (e.g. C1, C3, C4), the analysis was completed. A similar case was observed
when the building was subjected to subduction ground motions.
Ground Motion
GMs total time (s)
CBF (s)
CBF with DPP (s)
CBF with DPP Initial Scale
Factor
CBF with DPP Proposed Scale
Factor C1 39.6 44.6 27 2.2321 1.962 C2 40 45 45 1.0468 - C3 39.57 44.57 23.5 1.4566 1.197 C4 40 45 28 0.813 0.709 C5 44.8 49.8 42.5 2.265 - C6 60 65 65 2.263 - C7 40 45 45 1.5281 -
Table 5.3: Crustal GMs total run time
101

Ground Motion
GMSs total time
(s)
CBF run time (s)
CBF with DPP (s)
CBF with DPP Initial Scale
Factor
CBF with DPP Proposed Scale
Factor S1 300 305 305 1 - S2 300 305 125 1 0.876 S3 300 305 128 1 0.861 S4 300 305 126 1 0.836 S5 300 305 163 1 0.904 S6 300 305 305 1 - S7 300 305 305 1 -
5.5.2 Interstorey drift and Residual interstorey drift resulted from all analyses
The interstorey drift expressed in percentage of hs and resulted for CBFs with and
without dissipative pin connections is show in Table 5.5. The residual (permanent) interstorey
drift represents the interstorey drift of the last recorded value at the end of applied ground
motions that included the 5 seconds free vibrations. The obtained residual interstorey drift values
are given in Table 5.5 as well.
In order to collect data from the models that have initially failed the reduced scale factor
was applied to corresponding ground motions and the results are also given in Table 5.5. As
depicted in Table 5.5 a maximum residual drift of 0.6%hs resulted for both CBFs and CBFs with
dissipative connections that were subjected for either crustal or subduction records.
Table 5.4: Subduction GMs total run time
102

GM ID Storey CBF
CBF +
DPP CBF
CBF +
DPP GM Storey
CBF
CBF +
DPP CBF
CBF +
DPP
Drift % hs
Residual Drift % hs
Drift % hs
Residual Drift % hs
C1 739-250
4 0.5 1.3 0.1 0.4
MYG001
4 0.55 1.2 0.16 0.19 3 2.2 1.2 0.6 0.3 3 0.72 1.1 0.24 0.28 2 1.4 0.8 0.2 0.1 2 0.68 0.6 0.22 0.25 1 1.7 1.7 0.5 0.51 1 0.7 0.7 0.11 0.23
C2 767-0
4 1.2 1.2 0.4 0.15
MYG004
4 0.7 1.25 0.18 0.23 3 0.9 1.1 0.2 0.2 3 1.5 1 0.28 0.21 2 0.75 0.6 0.3 0.15 2 1.4 1.3 0.2 0.15 1 0.7 0.7 0.25 0.25 1 1.8 1.7 0.45 0.59
C3 787-360
4 0.5 1.2 0.1 0.25
FKS005
4 0.5 0.9 0.17 0.18 3 1.5 1.4 0.3 0.2 3 0.9 0.75 0.24 0.14 2 1.4 1.1 0.15 0.15 2 0.9 0.7 0.18 0.13 1 1.8 1.5 0.4 0.35 1 0.5 1.3 0.1 0.17
C4 963-90
4 0.6 0.9 0.3 0.2
FKS010
4 0.7 1 0.1 0.14 3 1.3 1 0.3 0.3 3 1.6 1.2 0.25 0.13 2 0.7 0.6 0.2 0.15 2 0.1 0.6 0.14 0.12 1 1.8 1.6 0.45 0.5 1 1.8 2.1 0.23 0.18
C5 986-195
4 0.4 1.3 0.3 0.12
FKS009
4 0.87 0.7 0.23 0.18 3 1.8 1.2 0.4 0.09 3 0.89 1.1 0.19 0.61 2 1 0.5 0.2 0.11 2 0.75 0.65 0.17 0.13 1 1.8 1.7 0.5 0.34 1 0.65 0.8 0.1 0.41
C6 1006-
90
4 0.6 1 0.15 0.35
IBR004
4 0.6 1 0.1 0.5 3 1.7 1.2 0.2 0.6 3 1.1 0.65 0.24 0.2 2 1.8 0.7 0.3 0.1 2 0.8 0.8 0.13 0.13 1 0.8 1.3 0.1 0.4 1 1.2 1.25 0.28 0.6
C7 1039-180
4 0.6 0.9 0.15 0.25
IBR006
4 0.95 1.1 0.17 0.26 3 1.45 0.8 0.4 0.2 3 1.3 0.7 0.26 0.13 2 1.3 0.7 0.25 0.1 2 1.4 0.55 0.1 0.05 1 1.3 1.3 0.35 0.4 1 1.2 0.8 0.15 0.38
Table 5.5. Interstorey and residual interstorey drift of CBF with and without double-pin
103

c)
a)
d)
b)
Figure 5.11. Hysteretic response of double-pin joints with pins in-parallel under C7 record obtained for different Pinching4 material parameters: rForce P = 0.65 and 0.45: a) 1st St. Brace 1-3 joint, b) 2nd St.2 Brace 2-7 joint, c) 3rd St. Brace 6-10 joint, d) 4th St. Brace 9-13 joint.
5.5.3 The Influence of Pinching4 model parameters
In Chapter 3, the properties of Pinching4 material used to model the pins behaviour have
been calibrated according to experimental test results. However, in Figure 5.11, the effect of
parameter rForceP on the overall response of CBF structure equipped with double-pin displaced
in-parallel is studied under the C7 ground motion. The rDispP value remained constant and
equal to 0.7, while two different values were assigned to the rForceP parameter such as 0.65
and 0.45. The obtained results are depicted in Figure 5.11 in terms of force-deformation
hysteresis loops generated under the C7 ground motion. The time-history displacement series
recorded at each floor are depicted for both variable Pinching4 material parameters in Figure
5.12. The same C7 record was considered.
104

Figure 5.12. Time-history floor displacement series resulted under C7 record when Pinching4 material parameter rForceP received 0.65 and 0.45 value: a) Storey 1, b) Storey 2, c) Storey 3, d) Storey 4.
a)
b)
c)
d)
105

Table 5.6. Energy ratio per cycle resulted by divided the hysteresis loops obtained for
rForce= 0.65 to those obtained with rForce= 0.45
The energy ratio obtained from the surface area of each cycle undergone by the brace equipped
with dissipative double-pin connection is shown in Table 5.6. The energy ratio was computed
when building was subjected to the C7 ground motion. The energy ratio was computed by
divided the cumulative hysteresis loop area resulted under the calculation based on rForce= 0.65
to that obtained under the calculation based on rForce= 0.45.
Cycle Storey 1 Storey 2 Storey 3 Storey 4 2 1 1 0.33 1 3 1 1 1.58 1 4 1 1 0.84 1 5 1 1 0.28 1 6 1 1 8561 1 7 1 1 2.10 1 8 0.95 1 4.53 1 9 1.05 0.76 3.25 1
10 1.82 1.25 2.90 1 11 3.19 0.67 0.39 1 12 1.22 1.21 2.88 1.10 13 0.77 1.02 18.19 1.16 14 1.04 1.08 4.36 0.87 15 0.80 0.31 1.39 16 1.47 7.64 1.13 17 0.98 1.91 1.05 18 1.00 19 1.21
106

Chapter 6. Conclusions and Future work
6.1 Conclusions
In this research, the overall behaviour of two types of dissipative pin connections are
emphasized, namely, single-pin and double-pin connections. The double-pin connection is
represented in two configurations based on the position of pin members. Thus, the behaviour of
double-pin connection with pins displaced in-line and in-parallel is discussed. Then, the seismic
response of a 4-storey moderately ductile CBF system with and without dissipative connections
is analysed, while comparative results between the behaviour of CBF systems with and without
dissipative double-pin connections are discussed.
Referring to the behaviour, design and modelling of dissipative pin connections the
following conclusions are formulated:
• Computations for pin connection design were carried out using the theoretical beam model
and the OpenSees beam model under monotonic loading and cyclic quasi-static displacement
loading. The proposed OpenSees model for the single-pin connection device was calibrated
against experimental test results. The theoretical beam model is recommended for the
preliminary design of dissipative pin connections.
• The OpenSees beam model employs the Pinching4 material which represents a pinched force-
deformation response and it allows users to simulate the deformed shape of the pin member in
the outer-plate’s hole support after it is loaded below its elastic capacity in bending.
• The dissipative energy capacity of connection devices, computed for the same number of
cycles, increase if larger distance between the inner-plates, (Lpin-2a), is provided. When the
distance between inner-plates increases, the portion of pin experiencing plastic deformation 107

expands across the pin’s length, while the maximum stress and strain decrease. In all cases, the
larger deformation was recorded at the pin’s mid-span, while the larger strain was recorded in the
vicinity of inner-plates that transfer the axial forces from the brace to the pin member. The
tensile fibres show a slightly larger strain than the compression fibres. This difference increases
with the magnitude of applied forces. By numerical studies, the distribution of plastic strains
over the pin’s length was recorded and in this light, the plastic hinge length is approximated as
being: (Lpin-2a + hp),where hp is the depth of the pin member.
• The length and thickness of the outer-plates influence the behaviour of the dissipative pin
connections and the deflection of the pin controls the transversal deflection of outer-plates.
• When the distance between the outer- and inner-plate is larger than the distance between inner-
plates, the failure of the pin member occurs in the longer pin segment at the external face of the
inner-plate. In the case showing larger distance between inner-plates, the failure occurs in the
middle segment, at the internal face of the inner-plate.
• By using double-pin connections, the load-carrying capacity of connection increases two times,
while the deflection is similar to that experienced by an equivalent single-pin devise. The
double-pin connection with pins displaced in-line shows lower strains. Due to the large stiffness
of the inner-plate in the plane of loading, both pins displaced in-line are subjected to equal
deformation. The double-pin connection device with pins in-line has large redundancy, while
displaying lower deflection, stresses and strains than an equivalent single-pin device.
• Additional experimental tests for single- and double-pin connections are required.
108

Previous research that asses the behaviour of CBFs equipped with single-pin devices is taken
further in this study. Thus, the same building plan is used for a 4-storey office building located in
Victoria, B.C., for which the seismic response is analyzed.
• The moderately ductile 4-storey CBF system without and with pin devices was subjected to two
sets of seven ground motions that are provided from crustal and subduction seismic sources. All
ground motions were scaled as per ASCE/SEI-07 procedure. The building model was analysed
using the OpenSees framework. Under crustal records, the CBF system with gusset plate brace-
to-frame connections was subjected to large inelastic demand especially at the bottom two floor
levels. Thus, braces were subjected to yielding in tension after buckled in compression.
However, braces of the upper two floors remained in elastic range. The maximum interstorey
drift was less than 2%hs, while the maximum residual interstorey drift was less then 0.6%hs.
Under the Tohoku subduction records, the demand was larger. All braces experienced inelastic
response with a larger demand at the bottom two floors. However, the maximum interstorey drift
was less than 2%hs and the maximum residual interstorey drift was less then 0.6%hs. Overall, the
subduction records imposed larger seismic demand than crustal records.
Analyses conducted on the 4-storey CBF system with dissipative double-pin connections
conduct to the following conclusions:
• The theoretical beam model can be used for preliminary design applications for low rise
buildings. The pin overall connections are designed to yield at 60~80% of the buckling strength
of braces, leading to an elastic response from the brace element. The proposed design steps are:
i) design braces as per the moderately ductile CBF system, ii) build the tri-linear curve for pin
device, iii) design the remaining structural members to remain in elastic range while pins
dissipate energy.
109

• CBF system with dissipative pin connections have larger fundamental period of vibration and
attract lower base shear forces. In general their fundamental period is 150% larger than that
corresponding to the CBF system.
• The frames with pin dissipative connections reveal residual deformations in acceptable limits.
The maximum residual interstorey drift is less than 0.6%hs under both crustal and subduction
records. The maximum interstorey drift is less than 2.5%hs.
• The CBFs with dissipative connections are sensitive to the frequency content of the ground
motions. The encountered failure of the pins in a few crustal and subduction records is due to
frequency content of ground motions. Tohoku records of magnitude 9 are too strong for the CBF
designed based on the code provisions. Under Tohoku records the low-rise CBF buildings are at
risk.
• Until further experimental tests are conducted, it is not recommended to select CBF with in-line
or in-parallel connections in seismic areas. This type of double-pin connection has large
redundancy.
• The energy dissipating capability of the dissipative pin connections is almost the same as the
brace behaving in tension or compression with the advantage of a uniform distribution of results
between tension and compression cycles. For middle-rise buildings located in high seismically
activity areas, the in-line and parallel pin connections are recommended instead of the single-pin
connection devices. The CBF systems with dissipative connections provide a reduced overall
cost. These connections are easy replaceable after the occurrence of damage.
110

6.2 Future work
For middle-rise and high-rise structures an improved dissipative connection design is
proposed in Figure 6.1 as the multi-pins connection.
The proposed connection is a combination of the in-line and in-parallel dissipative pin
connections and it merges the benefits of both of them, increasing the load carrying capacity and
decreasing the displacement of the overall connection.
The following work is proposed in order to continue and develop the advancement of research
for pin dissipative connections:
• Experimental testing of different pin dimensions is required in order to better evaluate
the forming of plastic hinges in the pin members for improving the tri-linear curve shape;
Figure 6.1: Proposed multi-pins connection
111

• Experimental testing of the dissipative connections with different outer plate and inner
plate thicknesses is required to better clarify the effect of the outer plate in bending and the inner
plate in axial force as a whole to the overall connection design;
• Numerical modelling with multi-pins connections correlated and calibrated to the
results from a testing procedure of the overall connections response and the evaluation of each
dimension in Figure 6.1 for the response of the connection.
• Overall response of the connection with the outer plates stiffened and restrained by a welded
plate as in Figure 6.2, for a better evaluation of the outer plates bearing imposed upon the
connection.
Further studies are necessary on the behaviour of the dissipative connections embedded into
higher levels of structural frames for a better evaluation of the residual deformation response in
regards to grounds motions characterised by long periods and high amplitudes.
Figure 6.2: Reinforced multi-pin connections
112

References
Calado , L. (2004). Lisbon Experimental Test Results.
Calado, L., Ferreira, J., & Feligioni, S. (2004). Characterization of Dissipative Connectios for
Concentric Bracing System in Steel Frames in Seismic Areas. Instituto Superior Tecnico.
Instituto Superiror Tecnico in Lisboa.
Caprarelli, C. (2012). Modelling and design of earthquake resistant low-rise Concentrically
Braced Frames with dissipative single-pin connections. Montreal, Canada: Concordia
University.
Castiglioni, C. (2010). Milano experimental test results.
Chou, C.-C., & Chen, P.-J. (May 2009). Compressive behavior of central gusset plate
connections for a buckling-restrained braced frame. Journal of Constructional Steel
Research, 65(5), 1138-1148.
Constantinou, M. a. (1993). Seismic Response of Structures with Supplemental damping. The
Structural Design of Tall Buildings.
CSA. (2009). Design of Steel Structures. Toronto, Ontario: Canadian Standard Association.
Desjardins, E., & Legeron, F. (2010). Method to reduce seismic demand on connections of
Concentrically Braced systems. 2nd International Structures Specialty Conf. Winnipeg,
Manitoba: CSCE.
ECCS (Ed.). (1986). Seismic Design Recommended Testing Procedure For Assessing the
Behaviour of Structural Steel Elements Under Cyclic Loads (Vol. TWG 1.3.). Brussels,
Belgium: Technical Commitee - Structural safety and loading.
113

European Committee for Standardization. (n.d.). Design of steel structures. In Eurocode 3
(EN1993-1-9-2005 ed.). Brussels, Belgium.
Federal Emergency Management Agency. (2000). Prestandard and commentary for the seismic
rehabilitation of buildings (Vol. FEMA 356). Washington, D.C., U.S.A.: Building
Seismic Safety Council of the National Institute if Building Services.
Gray, M., Christopoulos, C., & Packer, J. (2010). Cast steel yielding fuse for concentrically
braced frames. 9th U.S. Nat. & 10th Can. Conf. on Earthquake Eng., Paper No. 595.
Toronto, Ontario.
Hsiao, P., Lehman, D., & Roeder, C. (2012). Improved analytical model for special
concentrically braced frames. Journal of Constructional Steel Research, 73:80-94.
Izverani, C. (2007). The seismic behaviour of steel braces with large sections. Montréal:
Département des Génies Civil, Géologique et des Mines. École Polytechnique de
Montréal.
Kalkan, E., & Chopra, A. (2010). . Practical guidelines to select and scale earthquake records
for nonlinear response history analysis of structures. USGS.
Kassis, D., & Tremblay, R. (2008). Brace fuse system for cost effective design of low-rise steel
buildings.Paper No. 248. Quebec, QC: CSCE 2008 Annual Conference.
Mazzoni, S., McKenna, F., Scott, M., & Fenves, G. (2006). Opensees command language
manual. (P. E. Center, Ed.) Berkeley, U.S.A.: University of California.
McKenna, F., Scott, M., & Fenves, G. (2009). Open system for earthquake engineering
simulation.
NRCC. (2010). National Building Code of Canada 13th Edition. Ottawa, Ontario: National
Research Council of Canada.
114

Plumier, A., Castiglioni, C., Vayas, I., & Calado, L. (2004). Behaviour of seismic resistant
braced frame with innovative dissipative connections. EUROSteel. Maastricht, The
Netherlands.
Plumier, A., Doneux, C., Castiglioni, C., Brescianini, J., Crespi, A., Dell'Anna, S., et al. (2004).
Two innovations for earthquake resistant design. EUR 22044EN, Technical Steel
Research , European Commision.
Plumier, A., Doneux, C., Castiglioni, C., Brescianini, J., Crespi, A., Dell'Anna, S., et al. (2006).
Two innovations for earthquake resistant design. European Commission.
Rezai, M., Prion, H., Tremblay, R., Boutay, N., & Timler, P. (2000). Seismic Performance of
Brace Fuse Elements for Concetrically Steel Braced Frames. Stessa, (pp. 39-46).
Montreal.
St-Onge, E. (2012). Comportement et conception seismique des fusibles ductiles pour les
structures en acier. Montreal, Canada: Ecole Polytechnique.
Technical Commitee - Structural safety and loading. (1986). TWG 1.3 Seismic Design
Recommended Testing Procedure for Assesing the Behaviour of Structrual Steel Elements
under Cyclic Loads. Brussels, Belgium.
Thanopoulos, P. (2006). Behaviour of seismic resistant steel frame with energy absorbing
devices. Athens, Greece: National Technical University of Athens.
Tirca, L., Caprarelli, C., & Danila, N. (17 June 2011). Behaviour of a Low Rise Concentrically
Braced Frame Buildig with and without Dissipative Pin Connections. CSCE Annual.
Ottawa, ON.
115

Tirca, L., Caprarelli, C., & Danila, N. (2012, December 16). Seismic Simulation and Design of
Low-Rise CBF Buildings with and without Dissipative Connectuins using OpenSees.
STESSA, (pp. 365-371). Santiago, Chile.
Tirca, L., Caprarelli, C., Danila, N., & Calado, L. (2012). Modelling and Design of Dissipative
Connections for Brace to Column Joints. 7th International workshop on connections in
steel structures. Timisoara, Romania.
Tirca, L., Danila, N., & Caprarelli, C. (2013). Numerical Modelling for dissipative pin devices
for brace column connections. Journal of Constructional Steel Research, "in print".
Tirca, L., Morales, J., Guo, G., & Chen, L. (2010). Optimal design of friction dampers for multi-
storey buildings. 9th US National and 10th Canadian Conference on Earthquake
Engineering: Reaching Beyond Borders. Toronto, ON, Canada: EERI.
Tremblay, R., St-Onge, E., Rogers, C., Morrison, T., Legeron, F., Desjardins, E., et al. (2011).
Overview of ductile seismic brace fuse systems in Canada. EUROSteel Conf, (pp. 939-
945). Budapest.
Vayas, I., & Thanopoulos, P. (2005). Innovative dissipative (INERD) pin connections for
seismic resistant frames. int. Journal of Steel Structures, Vol. 5.
Vayas, I., & Thanopoulos, P. (2006). Dissipative (INERD) connections for seismic resistant steel
braced frames. DOI: 10.1002/stab.200610108.
Ziemian, R. (2010). Guide to stability design criteria for metal structures. J. Wiley & Sons.
116