Numerical modeling of the welding defect influence on fatigue life of the weld bead with analyzing...
8
Researc h Inventy: In ternational Journal Of Engine ering And Scie nce Vol.4, Issue 10 (October2014), PP 11-18 Issn (e): 2278-472 1, Issn (p):2319-6483 , www.researchinventy.com 11 Numerical modeling of the welding defect influence on fatigue life of the weld bead with analyzing residu al stress effects 1 Hamza KHATIB, 2 Khalifa MANSOURI, 2 Bachir Salhi, 1 Abderrahmane Yeznasni 1 (Laboratory of Physics, Condensed Matter and renewable energy, university of Science and Technology Mohammedia. Casablanca, Morocco) 2 (Laboratory of Signals, Distributed Systems and Artificial Intelligence, ENSET Mohammedia) ABSTRACT - The main objective of this work is to modeling the effect of welding defects on the fatigue strength of the weld bead with taking residual stresses into accoun t. Throughout this paper, we will present in the first part two principal approaches to predicting the stress concentration effects on the fatigue life duration, calculation methods based on each approach will be analyzed at the end of this part to determine the limitations and conditions of using each method. In the second part of this paper, we present our model based on the volumetric method to predict the fatigue life in the presence of defect in the surface of the weld bead. In the defect vicinity, the stress field distribution will be obtained with an elastoplastic material behavior, this distribution will be operated thereafter in a comparative study by introducing residual stress to illustrate the effect of the presence of these stresses on the fatigue life calculated with volumetric method. KE YWORDS - Nonlinear modeling, notch reduction factor, residual stress, volumetric method, welding defect I. INTRODUCTION During their life cycle, metallic structures are subjected to cyclic loads with significant frequency, this significantly reduces the fatigue life of the components such as railroad lines and bridges. On structures subjected to static loads, welding defect is tolerated below a limit size [1]. In the case of cyclic loading, the defect is unacceptable, these discontinuities are an area of stress concentration producing crack nucleation which can spreads out to the full fracture. New techniques for non-destructive testing is used to obtain critical information about the defect location and the geometric parameters, determining the defect influence on the fatigue life of the weld provide an answer on the impact of each defect detected and also provide criteria to accept defects in case of impact that will n ot change the desired performance of the weld. II. MECHANICAL FA TIGUE AND APPROACHES TO PREDICT LIFE DURA TION UNDER CYCLIC LOADING Evaluating the influence of welding defect on the fatigue strength can be done by considering à problem of fatigue in the presence of stress concentration. These coupled problem present diff iculties to estimate the life duration, calculating this value by conventional method give different results compared with experimentations [6]. In the l iterature, there are many models based on approaches developed from observations of experimental results. We note at this stage that the calculation models developed from these approaches are limited to specific loading conditions that must be checked before. The fatigue life of a mechanical element cannot be evaluated by a single approach since it is divided into two main phases, the first phase is more significant [2] called fatigue life that begins with the non cracked state of the material and ends with the appearance of micro crack in the order of 1mm, this duration is analyzed with mechanical fatigue tools (S-N curve).The second phase is analyzed with linear fracture mechanics tools which allow finding the required number of cycle before failure by considering the initial parameters of the micro crack and loading intensity. This article will discuss the problem of welding defects analyzed with fatigue tools to calculate the predominant part of we ld bead life. a. Stress concentration effect on fatigue life Using the maximum stress obtained by the stress concentration factor on the Wöhler curve to predict the fatigue life of notched components does not provide same results as that obtained experimentally, a new physical value called effective stress was introduced, it is this calculated stress that allow to predicts the fatigue strength by comparing it to the strength limit of the material [2] [3]. Effective stress replacing the maximum stress is calculated based on the distribution of the stress field in the notch vicinity, Similarly to determination the maximum stress by stress concentration factor (Kt), determination of the effective stress can be done by calculating the (Kf) factor, called fatigue reduction factor which is expressed by the ratio between the two loading generating same life duration (N) [3]:
Transcript of Numerical modeling of the welding defect influence on fatigue life of the weld bead with analyzing...

8/10/2019 Numerical modeling of the welding defect influence on fatigue life of the weld bead with analyzing residual stress…
http://slidepdf.com/reader/full/numerical-modeling-of-the-welding-defect-influence-on-fatigue-life-of-the-weld 1/8
Research Inventy: International Journal Of Engineering And ScienceVol.4, Issue 10 (October2014), PP 11-18 Issn (e): 2278-4721, Issn (p):2319-6483, www.researchinventy.com
11
Numerical modeling of the welding defect influence on fatigue life
of the weld bead with analyzing residual stress effects
1Hamza KHATIB, 2Khalifa MANSOURI, 2Bachir Salhi, 1Abderrahmane Yeznasni1(Laboratory of Physics, Condensed Matter and renewable energy, university of Science and
Technology Mohammedia. Casablanca, Morocco)2(Laboratory of Signals, Distributed Systems and Artificial Intelligence, ENSET Mohammedia)
ABSTRACT - The main objective of this work is to modeling the effect of welding defects on the fatigue strength of the weld bead with taking residual stresses into account. Throughout this paper, we will present in
the first part two principal approaches to predicting the stress concentration effects on the fatigue life duration,calculation methods based on each approach will be analyzed at the end of this part to determine the limitationsand conditions of using each method. In the second part of this paper, we present our model based on thevolumetric method to predict the fatigue life in the presence of defect in the surface of the weld bead. In the
defect vicinity, the stress field distribution will be obtained with an elastoplastic material behavior, thisdistribution will be operated thereafter in a comparative study by introducing residual stress to illustrate theeffect of the presence of these stresses on the fatigue life calculated with volumetric method.
KEYWORDS - Nonlinear modeling, notch reduction factor, residual stress, volumetric method, welding defect
I. INTRODUCTIONDuring their life cycle, metallic structures are subjected to cyclic loads with significant frequency, this
significantly reduces the fatigue life of the components such as railroad lines and bridges. On structuressubjected to static loads, welding defect is tolerated below a limit size [1]. In the case of cyclic loading, the
defect is unacceptable, these discontinuities are an area of stress concentration producing crack nucleation whichcan spreads out to the full fracture. New techniques for non-destructive testing is used to obtain criticalinformation about the defect location and the geometric parameters, determining the defect influence on thefatigue life of the weld provide an answer on the impact of each defect detected and also provide criteria to
accept defects in case of impact that will not change the desired performance of the weld.
II.
MECHANICAL FATIGUE AND APPROACHES TO PREDICT LIFE DURATION
UNDER CYCLIC LOADING
Evaluating the influence of welding defect on the fatigue strength can be done by considering à problem of fatigue in the presence of stress concentration. These coupled problem present difficulties to
estimate the life duration, calculating this value by conventional method give different results compared withexperimentations [6]. In the literature, there are many models based on approaches developed from observationsof experimental results. We note at this stage that the calculation models developed from these approaches arelimited to specific loading conditions that must be checked before. The fatigue life of a mechanical element
cannot be evaluated by a single approach since it is divided into two main phases, the first phase is moresignificant [2] called fatigue life that begins with the non cracked state of the material and ends with the
appearance of micro crack in the order of 1mm, this duration is analyzed with mechanical fatigue tools (S-Ncurve).The second phase is analyzed with linear fracture mechanics tools which allow finding the requirednumber of cycle before failure by considering the initial parameters of the micro crack and loading intensity.This article will discuss the problem of welding defects analyzed with fatigue tools to calculate the predominant
part of weld bead life.
a.
Stress concentration effect on fatigue life
Using the maximum stress obtained by the stress concentration factor on the Wöhler curve to predict
the fatigue life of notched components does not provide same results as that obtained experimentally, a new physical value called effective stress was introduced, it is this calculated stress that allow to predicts the fatiguestrength by comparing it to the strength limit of the material [2] [3]. Effective stress replacing the maximum
stress is calculated based on the distribution of the stress field in the notch vicinity, Similarly to determinationthe maximum stress by stress concentration factor (Kt), determination of the effective stress can be done bycalculating the (Kf) factor, called fatigue reduction factor which is expressed by the ratio between the twoloading generating same life duration (N) [3]:

8/10/2019 Numerical modeling of the welding defect influence on fatigue life of the weld bead with analyzing residual stress…
http://slidepdf.com/reader/full/numerical-modeling-of-the-welding-defect-influence-on-fatigue-life-of-the-weld 2/8
Numerical modeling of the welding …
12
e
l
f K
(1)
Where (σl) is the nominal load applied on a smooth specimen and resulting (N) cycle to fatigue failure, and (σe)
the nominal load applied on the notched specimen generating the same number of cycle (N) to fatigue failure. In
general, the fatigue reduction factor is less than the stress concentration factor and the relationship between
these two factors is expressed by the sensitivity factor q [3].
1
1
t
f
K
K q (2)
b.
Approaches based on the notch effect in the prediction of the fatigue lifetime
The models based on this approach consider that the decrease in life time caused by notch depending
on geometric parameters of the notch, these models are developed from experimental results that show an effect
of reinforcement provided by notch under cyclic loading, this give a value of Kf lower than the coefficient of
static stress concentration Kt. the calculation of Kf can be done by considering the nominal applied load and
stress at a particular point in the vicinity of the notch or average stress observed in reinforced area.
σeff
d
Y
Xρ
σ YY max
σN
σN Figure .1. Notch geometry and load applied
Neuber’s Model [4] :
fatigue Life duration obtained experimentally is greater than that obtained by considering the maximum stressobserved, Neuber justify this observation by the micro-support effect, this effect was described by calculatingthe average stress on reinforced area on very short distance (micro-support length ρ*) in the vicinity of circularnotch with radius ρ.
The average stress can be calculated by integration where the quantity ρ* is known. In order to avoid theanalytical integral calculus, Neuber has developed a direct method of calculation to determine a fictitious notchradius (ρf), the maximum stress at this fictitious notch is exactly the same as the average stress. Expression ofthe (ρf) is given by equation (3), where (ρ) is the notch radius and (s) is the micro-support factor:
* s
f
(3)Therefore, determination of the fatigue strength requires the two factors s and ρ *. A large number of
experimental work show that the extent of the micro-support area ρ * is closely related to the material properties(yield strength σY0,2), while the factor s is related to the geometry of the notch (the notch of radius ρ, and the
opening angle α) (figure 2).
(a) (b)
Figure. 2.
(a) : Evolution of micro-support distance as function of the material properties
(b) : Evolution of support factor as function of notch geometric properties

8/10/2019 Numerical modeling of the welding defect influence on fatigue life of the weld bead with analyzing residual stress…
http://slidepdf.com/reader/full/numerical-modeling-of-the-welding-defect-influence-on-fatigue-life-of-the-weld 3/8
Numerical modeling of the welding …
13
Another form of these results [5] joins the fatigue reduction factor Kf in relation with the stress concentration
factor, material properties and the notch radius:
n
t
f
a
K K
1
11 (4)
Figure.3. Neuber factor as function of tensile strength
Where (an) is the coefficient that depend of the material behavior and (Kt) is the stress concentration factor.
Peterson model [5] :
In developing his model, Peterson suggest that the stress that affect the fatigue life is located in a point awayfrom a notch tip with distance (d), this distance is characterized by the fact that the fatigue fracture appearswhen the stress at this distance exceed the endurance limit of the material.
D yy d )0,( (5)
Area between the notch tip and point at the distance (d) can be assimilated as a reinforcement area discussed before in the Neuber’s Model, this area can resist to the crack nucleation even if the stress at the notch tipexceed the endurance limit, PETERSON consider that the nature of the material has a large influence on the
extent of this area. We note that the expression of the stress reduction factor developed in this model is obtained by considering the assumption of a perfectly linear material behavior, this expression is given as a function ofthe geometrical parameter of the notch but also depending on the material and the stress concentrationcoefficient.
p
t
f a
K K
1
11 (6)
Where (Kt) is the stress concentration factor, (ap) is the parameter characterizing the material and (ρ) the notch
radius, The Kt value can be deduced by finite element method whereas the (ap) coefficient may be obtained bythe following expression using ultimate tensile strength (Rm):
8,1270
Rma p (7)
c. Approach based on the gradient effect - Volumetric method
Gradient effect:The recent development in fatigue calculation (stress field intensity method, volumetric method ...) was
motivated by experimental results showed that the fatigue life is not influenced by the presence or absence of ageometric notch, but a more general effect which can be summarized in the variations of stress in the notchvicinity in the area of crack initiation, the effect of the stress variation on the fatigue life is known as thegradient effect. Experimental work of Palin-Luc [6] showed the effect of the gradient, they were carried out on
smooth fatigue specimens (Figure-4), a part of these test specimens were subjected to cyclic tensile stresses,another family to rotating bending load. The tests are conducted to find the endurance limit in each case byimposing the number of cycles to failure (between 106 and 107). The results obtained by Palin-Luc are groupedfor different materials in Table-1.
(a) (b)
Figure .4.
(a) : Tensile-compressive fatigue load
(b) : Rotating-bending fatigue load

8/10/2019 Numerical modeling of the welding defect influence on fatigue life of the weld bead with analyzing residual stress…
http://slidepdf.com/reader/full/numerical-modeling-of-the-welding-defect-influence-on-fatigue-life-of-the-weld 4/8
Numerical modeling of the welding …
14
Table 1: Experimental results under tensile-compression and rotating bending load.
AlloyEndurance limit in tension
compression -1 (MPa)
Endurance limit in rotating
bending f-1 (MPa)
Proportional variation
between -1 and f-1 (%)
Steel 30NCD16 560 658 17,5
Cast iron XC18 273 310 13,6
Cast iron GS61 245 280 14,3Steel 35CD4 558 581 4,1
These results are obtained on smooth test specimen with identical geometry and were subjected to the same
maximum tensile stress, it can be concluded from this results the influence of stress variation created by bendingload on the fatigue life.
Volumetric method [10]:
The volumetric method is based on the relative stress gr adient (χ) to calculate the fatigue reduction factor Kf,Calculus start with a particular finite element analysis to determine the elastic-plastic stress field near the notchtip, the numerical results of this analysis are used to obtain the evolution of the stress gradient. The Kf factor iscalculated as the ratio between the average effective stress (σeff) and the nominal load applied (σn), theeffective stress is calculated by integrating the opening stress multiplied by weight function, the integration area
is limited in a cylindrical volume, the diameter of the volume is located between the notch tip and the pointwhere the relative stress gradient is minimum.
dx
(x)dσ
(x)σ
1χ(x)
yy
yy
Stress relative gradient (8)
)(1)( x x x Weight function (9)
eff X
yy
eff
eff dx x x
X 0
1)(1
Effective stress (10)
Fatigue reduction factor can be calculated as below:
eff X
yy
eff n
f dx x x X
K
0
1)(1
(11)
Where (Xef f) is the extent of the fatigue process area, σyy (x) is the crack opening stress.
III.
MODELING THE INFLUENCE OF THE DEFECT ON FATIGUE LIFE IN THE
PRESENCE OF RESIDUAL STRESSES.
In this section, we will carry out a model to estimate the impact of the porosity defects on the fatigue strength ofa weld bead with residual stresses. This defect is modeled by a semi-spherical discontinuity, the influence of thissingularity on the fatigue strength will be carried out by calculating the fatigue reduction factor (Kf). This
influence will be studied by determining (Kf) in the presence and absence of residual stress to illustrate the
impact of these stresses on the fatigue strength of the weld bead.a. Geometric description of analyzed model
The considered model is a butt welding of two plates. The thickness of the plates is 6 mm and the widthof the weld bead is set equal to 10mm. porosity defect is present on the surface of the weld, the radius is set to 1
mm (Figure-5).
(a) 750
1 0
6 0 0
e=6mm
Vx=3mm/s
X
Y
(b)
R=1
6 σn
Y
Z
Figure.5.:
(a) Overview of the surface of the two plates
(b): Local geometry of weld defect and direction of applied load
8/10/2019 Numerical modeling of the welding defect influence on fatigue life of the weld bead with analyzing residual stress…
http://slidepdf.com/reader/full/numerical-modeling-of-the-welding-defect-influence-on-fatigue-life-of-the-weld 5/8
Numerical modeling of the welding …
15
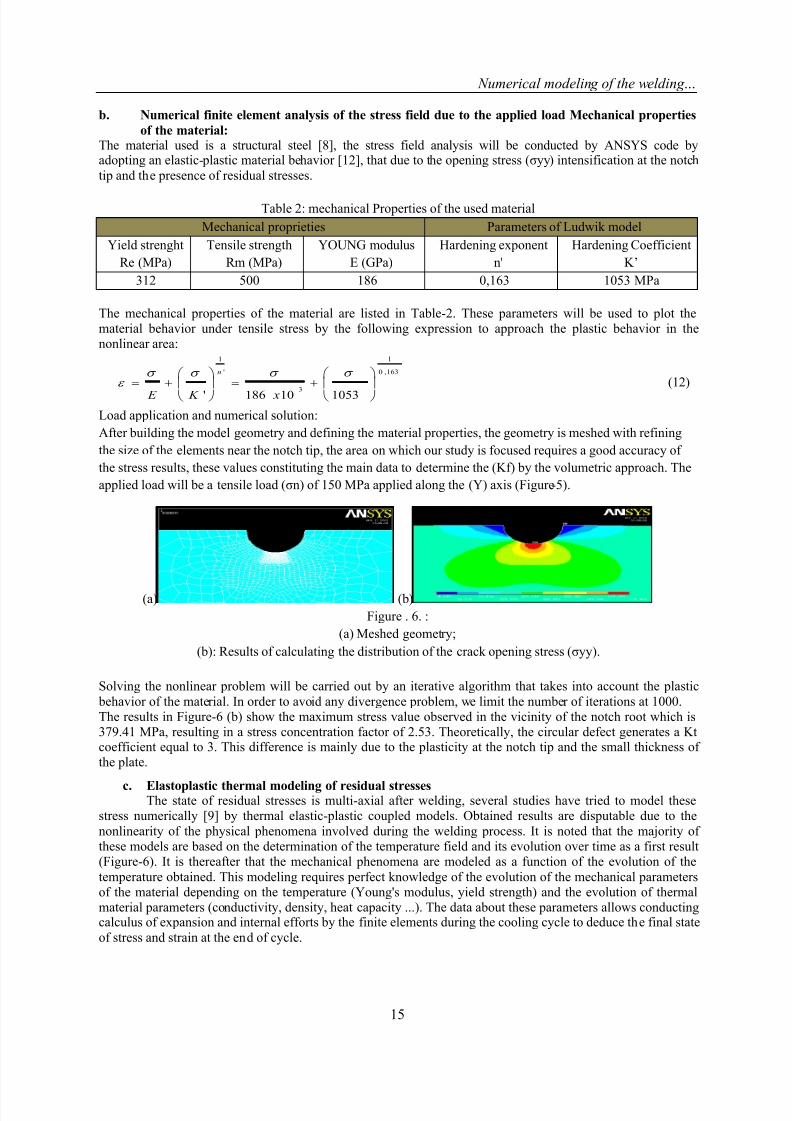
b.
Numerical finite element analysis of the stress field due to the applied load Mechanical properties
of the material:The material used is a structural steel [8], the stress field analysis will be conducted by ANSYS code byadopting an elastic- plastic material behavior [12], that due to the opening stress (σyy) intensification at the notch
tip and the presence of residual stresses.
Table 2: mechanical Properties of the used material
Mechanical proprieties Parameters of Ludwik model
Yield strenght
Re (MPa)
Tensile strength
Rm (MPa)
YOUNG modulus
E (GPa)
Hardening exponent
n'
Hardening Coefficient
K’
312 500 186 0,163 1053 MPa
The mechanical properties of the material are listed in Table-2. These parameters will be used to plot thematerial behavior under tensile stress by the following expression to approach the plastic behavior in thenonlinear area:
163,0
1
3
'
1
105310186'
x K E
n
(12)
Load application and numerical solution:
After building the model geometry and defining the material properties, the geometry is meshed with refining
the size of the elements near the notch tip, the area on which our study is focused requires a good accuracy of
the stress results, these values constituting the main data to determine the (Kf) by the volumetric approach. The
applied load will be a tensile load (σn) of 150 MPa applied along the (Y) axis (Figure-5).
(a) (b)
Figure . 6. :
(a) Meshed geometry;
(b): Results of calculating the distribution of the crack opening stress (σyy).
Solving the nonlinear problem will be carried out by an iterative algorithm that takes into account the plastic
behavior of the material. In order to avoid any divergence problem, we limit the number of iterations at 1000.The results in Figure-6 (b) show the maximum stress value observed in the vicinity of the notch root which is379.41 MPa, resulting in a stress concentration factor of 2.53. Theoretically, the circular defect generates a Ktcoefficient equal to 3. This difference is mainly due to the plasticity at the notch tip and the small thickness ofthe plate.
c.
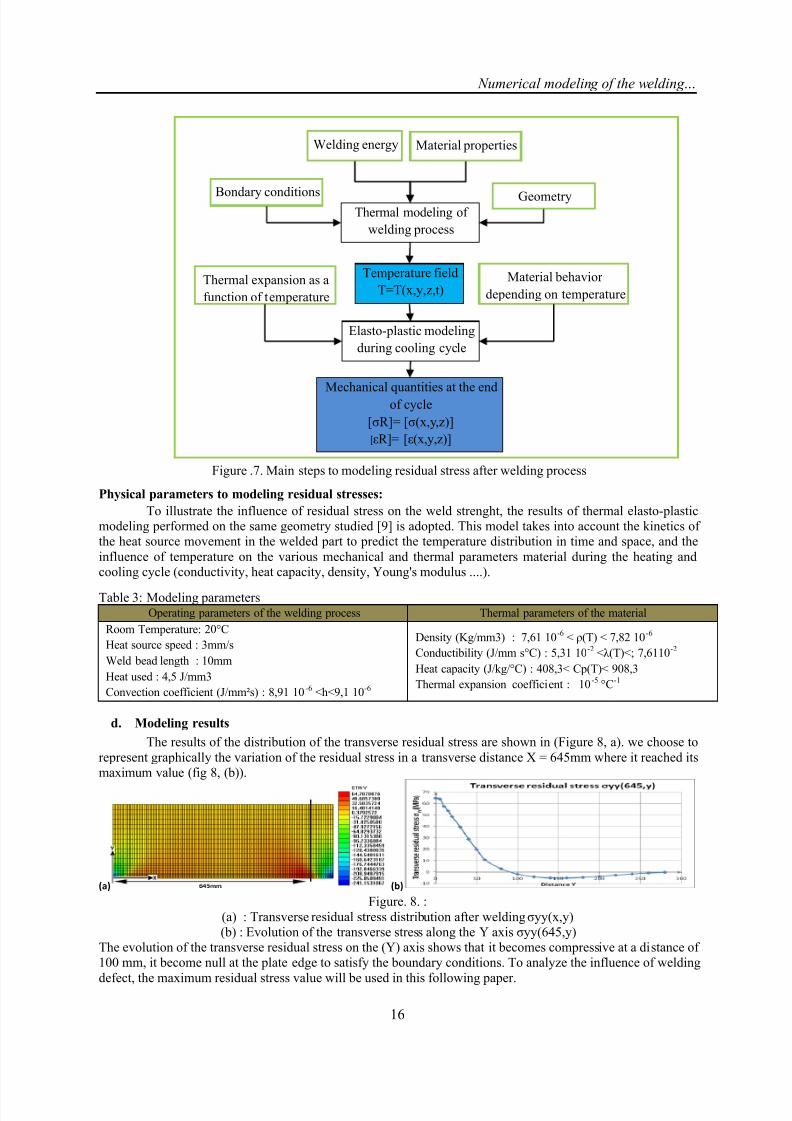
Elastoplastic thermal modeling of residual stressesThe state of residual stresses is multi-axial after welding, several studies have tried to model these
stress numerically [9] by thermal elastic-plastic coupled models. Obtained results are disputable due to the
nonlinearity of the physical phenomena involved during the welding process. It is noted that the majority ofthese models are based on the determination of the temperature field and its evolution over time as a first result(Figure-6). It is thereafter that the mechanical phenomena are modeled as a function of the evolution of the
temperature obtained. This modeling requires perfect knowledge of the evolution of the mechanical parametersof the material depending on the temperature (Young's modulus, yield strength) and the evolution of thermalmaterial parameters (conductivity, density, heat capacity ...). The data about these parameters allows conductingcalculus of expansion and internal efforts by the finite elements during the cooling cycle to deduce the final state
of stress and strain at the end of cycle.
8/10/2019 Numerical modeling of the welding defect influence on fatigue life of the weld bead with analyzing residual stress…
http://slidepdf.com/reader/full/numerical-modeling-of-the-welding-defect-influence-on-fatigue-life-of-the-weld 6/8
Numerical modeling of the welding …
16
Physical parameters to modeling residual stresses:
To illustrate the influence of residual stress on the weld strenght, the results of thermal elasto-plasticmodeling performed on the same geometry studied [9] is adopted. This model takes into account the kinetics ofthe heat source movement in the welded part to predict the temperature distribution in time and space, and the
influence of temperature on the various mechanical and thermal parameters material during the heating andcooling cycle (conductivity, heat capacity, density, Young's modulus ....).
Table 3: Modeling parametersOperating parameters of the welding process Thermal parameters of the material
Room Temperature: 20°C
Heat source speed : 3mm/s
Weld bead length : 10mm
Heat used : 4,5 J/mm3
Convection coefficient (J/mm²s) : 8,91 10-6 <h<9,1 10-6
Density (Kg/mm3) : 7,61 10-6 < ρ(T) < 7,82 10-6
Conductibility (J/mm s°C) : 5,31 10-2 <λ(T)<; 7,6110-2
Heat capacity (J/kg/°C) : 408,3< Cp(T)< 908,3
Thermal expansion coefficient : 10-5 °C-1
d. Modeling results
The results of the distribution of the transverse residual stress are shown in (Figure 8, a). we choose to
represent graphically the variation of the residual stress in a transverse distance X = 645mm where it reached itsmaximum value (fig 8, (b)).
(a) (b)
Figure. 8. :
(a) : Transverse residual stress distribution after welding σyy(x,y) (b) : Evolution of the transverse stress along the Y axis σyy(645,y)
The evolution of the transverse residual stress on the (Y) axis shows that it becomes compressive at a distance of100 mm, it become null at the plate edge to satisfy the boundary conditions. To analyze the influence of welding
defect, the maximum residual stress value will be used in this following paper.
Thermal modeling of
welding process
Temperature field
T=T(x,y,z,t)
Elasto-plastic modeling
during cooling cycle
Mechanical quantities at the endof cycle
[σR]= [σ(x,y,z)]
[εR]= [ε(x,y,z)]
GeometryBondary conditions
Material propertiesWelding energy
Material behavior
depending on temperatureThermal expansion as a
function of temperature
Figure .7. Main steps to modeling residual stress after welding process

8/10/2019 Numerical modeling of the welding defect influence on fatigue life of the weld bead with analyzing residual stress…
http://slidepdf.com/reader/full/numerical-modeling-of-the-welding-defect-influence-on-fatigue-life-of-the-weld 7/8
Numerical modeling of the welding …
17
Calculating the fatigue reduction factor by volumetric approach:
The first step is to determine the effective distance graphically by σyy(z) curve plotted along the
reverse direction of the (Z) axis. Determining (Zeff) allow us to calculate (σeff) by numerical integration of thestress values of (σyy(z)) obtained by the finite element analysis.
Figure. 9. Evolution of stress and its relative gradient on the vicinity of the notch
On the curve of the resulting σyy(z) stress on figure-9, we find that this stress does not reach itsasymptotic value of 150 MPa, this is due to the small thickness of the sheet compared to the defect radius. The
curve of the two gradients plotted in the presence and absence of the residual stresses show the differenceintroduced by this stresses in calculus. If this stress is taken at a constant value it does not cause any variation inthe gradient, on the other side the variation will be observed on the stress which is located in the χ (z)denominator. The difference between the two curves is observed mainly in the vicinity of the effective distance
and is reduced in the area of maximum and minimum stress.
Fatigue reduction factor in the presence of residual stresses :
Using volumetric approach, reduction factor is calculated using the following expression [10].
Zeff
yy
N eff
f dz z z
Z K
0
)1)((1
(13)
Using the numerical calculus of the integral based on the results obtained by the finite element calculation, we
find the two values of the fatigue reduction factor Kf in the absence and presence of residual stresses. Withoutany residual stress we obtain 2.604 as a value of (Kf), while in case of the presence of these stresses we find thatthis factor is about 3.036, this increase is due to stability of the effective distance and raising of the residual
stress values. Other methods of calculation can be used to estimate Kf, by the NEUBER method we find a valueof 2.895, whereas the expression of PETERSON give a value of 2.824. The disparity between these results andthe values of the volumetric method is mainly caused by theoretical foundation of PETERON and NEUBERmodels, developed for linear elastic behavior of the studied area.
IV. CONCLUSIONIn the volume of welded assembly, the residual stresses are present due to heat cycle imposed by this
process. The prediction of these stresses is complex mainly due to the nonlinear and coupled physical
phenomena that are involved, which makes the results limited to specific materials and geometries. The impactof residual stress on the welds bead presenting defects on fatigue strength is a process studied following the
reverse direction of the (Z) axis penetrating the plate. The determination of the distribution of residual stressestriaxial towards welded plates is a complex process, it is therefore necessary, as a first approach, to take thetransverse residual stress as constant at least in the region of fatigue process very limited in a distance not morethan 1mm in the majority of cases. The adoption of this assumption of stability give us the ability to apply the
volumetric method by exploiting the stress field calculated statically which was added on the maximumtransverse residual stress. Curves of the relative gradients calculated from the transverse stress allowed us todetermine the size of the area of fatigue process was extended over a distance of 0.467 mm.Calculations that followed, demonstrate the detrimental effect of residual stresses revealed by a significantincrease in Kf factor. It should be noted that we calculate the maximum value of Kf factor in this previouswork, this is due to relaxation of the residual stresses observed in fatigue process which reduces significantly the
intensity of these stress after the first cycles of load application [11].

8/10/2019 Numerical modeling of the welding defect influence on fatigue life of the weld bead with analyzing residual stress…
http://slidepdf.com/reader/full/numerical-modeling-of-the-welding-defect-influence-on-fatigue-life-of-the-weld 8/8
Numerical modeling of the welding …
18
REFERENCES[1] C.Hazard, F.Lelong, B.Quinzain, mémothech structures métallique (Edition CASTEILLA, 2002)
[2] I. STEPHENS, A. FATEMI, R. STEPHENS, O. FUCHS, metal fatigue in engineering (Wiley-Interscience Publication, 2001)
[3] Les Pook , metal fatigue (SPRINGER, 2007)
[4] D.Radaj, P.Lazzarin, F.Berto, Generalised Neuber concept of fictitious notch rounding, International journal of fatigue 2013 , P105-
115
[5]
S.W. Becker and G.F. Carpenter, asm handbook-fatigue and fracture, (ASM International, 1996)
[6] D.H.Luu, M.H.Maitournam, Q.S.Nguyen, formulation of gradient multiaxial fatigue criteria, International journal of fatigue 2014 ,
P170-173.
[7] Association française de normalisation, eurocode 3-calcul des structures en acier (AFNOR, 1992)
[8] Gentil QILAFKU, effet d’entaille en fatigue de grand nombre de Cycles, Effet du Gradient , Université de METZ, 2000
[9] Y.Ueda, H.Murakawa, N.Ma, welding deformation and residualstress prevention (ELSEVIER, 2012)
[10] H. Adib, G. Pluvinage, Theoretical and numerical aspects of the volumetric approach for fatigue life prediction in notched
components, International Journal of Fatigue, 2003, P67-76
[11] M.Farajian-Sohi, Th.Nitschke-Pagel, K.Dilger, Residual stress relaxation in welded joints under Static and cyclic loading, Institute
of Joining and Welding, University of Braunschweig, Germany, 2009, P585-P592
[12] ANSYS Release 9.0 Documentation, chapitre 8.3 Modeling Material Nonlinearities.