Numerical Model Calibration for Simulating Coal Pillars, Gob
12
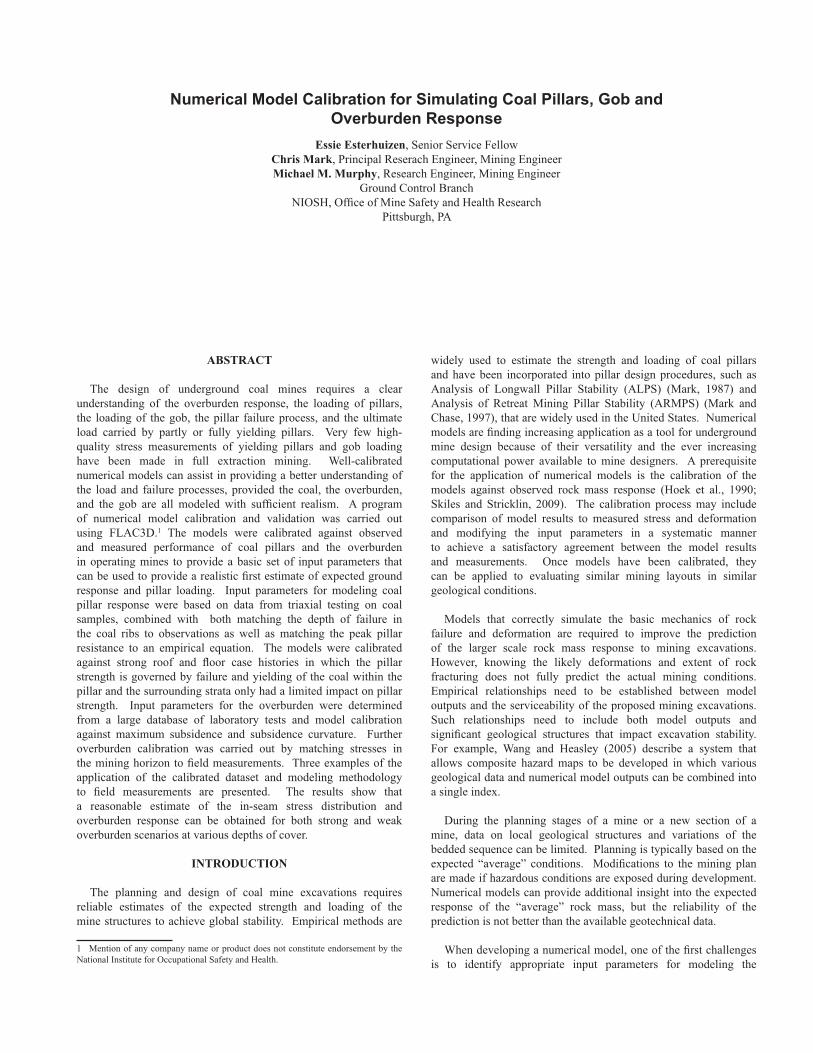
Numerical Model Calibration for Simulating Coal Pillars, Gob and Overburden Response Essie Esterhuizen, Senior Service Fellow Chris Mark, Principal Reserach Engineer, Mining Engineer Michael M. Murphy, Research Engineer, Mining Engineer Ground Control Branch NIOSH, Offce of Mine Safety and Health Research Pittsburgh, PA ABSTRACT The design of underground coal mines requires a clear understanding of the overburden response, the loading of pillars, the loading of the gob, the pillar failure process, and the ultimate load carried by partly or fully yielding pillars. Very few high- quality stress measurements of yielding pillars and gob loading have been made in full extraction mining. Well-calibrated numerical models can assist in providing a better understanding of the load and failure processes, provided the coal, the overburden, and the gob are all modeled with suffcient realism. A program of numerical model calibration and validation was carried out using FLAC3D. 1 1 Mention of any company name or product does not constitute endorsement by the National Institute for Occupational Safety and Health. The models were calibrated against observed and measured performance of coal pillars and the overburden in operating mines to provide a basic set of input parameters that can be used to provide a realistic frst estimate of expected ground response and pillar loading. Input parameters for modeling coal pillar response were based on data from triaxial testing on coal samples, combined with both matching the depth of failure in the coal ribs to observations as well as matching the peak pillar resistance to an empirical equation. The models were calibrated against strong roof and foor case histories in which the pillar strength is governed by failure and yielding of the coal within the pillar and the surrounding strata only had a limited impact on pillar strength. Input parameters for the overburden were determined from a large database of laboratory tests and model calibration against maximum subsidence and subsidence curvature. Further overburden calibration was carried out by matching stresses in the mining horizon to feld measurements. Three examples of the application of the calibrated dataset and modeling methodology to feld measurements are presented. The results show that a reasonable estimate of the in-seam stress distribution and overburden response can be obtained for both strong and weak overburden scenarios at various depths of cover. INTRODUCTION The planning and design of coal mine excavations requires reliable estimates of the expected strength and loading of the mine structures to achieve global stability. Empirical methods are widely used to estimate the strength and loading of coal pillars and have been incorporated into pillar design procedures, such as Analysis of Longwall Pillar Stability (ALPS) (Mark, 1987) and Analysis of Retreat Mining Pillar Stability (ARMPS) (Mark and Chase, 1997), that are widely used in the United States. Numerical models are fnding increasing application as a tool for underground mine design because of their versatility and the ever increasing computational power available to mine designers. A prerequisite for the application of numerical models is the calibration of the models against observed rock mass response (Hoek et al., 1990; Skiles and Stricklin, 2009). The calibration process may include comparison of model results to measured stress and deformation and modifying the input parameters in a systematic manner to achieve a satisfactory agreement between the model results and measurements. Once models have been calibrated, they can be applied to evaluating similar mining layouts in similar geological conditions. Models that correctly simulate the basic mechanics of rock failure and deformation are required to improve the prediction of the larger scale rock mass response to mining excavations. However, knowing the likely deformations and extent of rock fracturing does not fully predict the actual mining conditions. Empirical relationships need to be established between model outputs and the serviceability of the proposed mining excavations. Such relationships need to include both model outputs and signifcant geological structures that impact excavation stability. For example, Wang and Heasley (2005) describe a system that allows composite hazard maps to be developed in which various geological data and numerical model outputs can be combined into a single index. During the planning stages of a mine or a new section of a mine, data on local geological structures and variations of the bedded sequence can be limited. Planning is typically based on the " expected "average conditions. Modifcations to the mining plan are made if hazardous conditions are exposed during development. Numerical models can provide additional insight into the expected " response of the "average rock mass, but the reliability of the prediction is not better than the available geotechnical data. When developing a numerical model, one of the frst challenges is to identify appropriate input parameters for modeling the
Transcript of Numerical Model Calibration for Simulating Coal Pillars, Gob
Numerical Model Calibration for Simulating Coal Pillars Gob and Overburden Response
Essie Esterhuizen Senior Service Fellow Chris Mark Principal Reserach Engineer Mining Engineer Michael M Murphy Research Engineer Mining Engineer
Ground Control Branch NIOSH Offce of Mine Safety and Health Research
Pittsburgh PA
ABSTRACT
The design of underground coal mines requires a clear understanding of the overburden response the loading of pillars the loading of the gob the pillar failure process and the ultimate load carried by partly or fully yielding pillars Very few high-quality stress measurements of yielding pillars and gob loading have been made in full extraction mining Well-calibrated numerical models can assist in providing a better understanding of the load and failure processes provided the coal the overburden and the gob are all modeled with suffcient realism A program of numerical model calibration and validation was carried out using FLAC3D1
1 Mention of any company name or product does not constitute endorsement by the National Institute for Occupational Safety and Health
The models were calibrated against observed and measured performance of coal pillars and the overburden in operating mines to provide a basic set of input parameters that can be used to provide a realistic frst estimate of expected ground response and pillar loading Input parameters for modeling coal pillar response were based on data from triaxial testing on coal samples combined with both matching the depth of failure in the coal ribs to observations as well as matching the peak pillar resistance to an empirical equation The models were calibrated against strong roof and foor case histories in which the pillar strength is governed by failure and yielding of the coal within the pillar and the surrounding strata only had a limited impact on pillar strength Input parameters for the overburden were determined from a large database of laboratory tests and model calibration against maximum subsidence and subsidence curvature Further overburden calibration was carried out by matching stresses in the mining horizon to feld measurements Three examples of the application of the calibrated dataset and modeling methodology to feld measurements are presented The results show that a reasonable estimate of the in-seam stress distribution and overburden response can be obtained for both strong and weak overburden scenarios at various depths of cover
INTRODUCTION
The planning and design of coal mine excavations requires reliable estimates of the expected strength and loading of the mine structures to achieve global stability Empirical methods are
widely used to estimate the strength and loading of coal pillars and have been incorporated into pillar design procedures such as Analysis of Longwall Pillar Stability (ALPS) (Mark 1987) and Analysis of Retreat Mining Pillar Stability (ARMPS) (Mark and Chase 1997) that are widely used in the United States Numerical models are fnding increasing application as a tool for underground mine design because of their versatility and the ever increasing computational power available to mine designers A prerequisite for the application of numerical models is the calibration of the models against observed rock mass response (Hoek et al 1990 Skiles and Stricklin 2009) The calibration process may include comparison of model results to measured stress and deformation and modifying the input parameters in a systematic manner to achieve a satisfactory agreement between the model results and measurements Once models have been calibrated they can be applied to evaluating similar mining layouts in similar geological conditions
Models that correctly simulate the basic mechanics of rock failure and deformation are required to improve the prediction of the larger scale rock mass response to mining excavations However knowing the likely deformations and extent of rock fracturing does not fully predict the actual mining conditions Empirical relationships need to be established between model outputs and the serviceability of the proposed mining excavations Such relationships need to include both model outputs and signifcant geological structures that impact excavation stability For example Wang and Heasley (2005) describe a system that allows composite hazard maps to be developed in which various geological data and numerical model outputs can be combined into a single index
During the planning stages of a mine or a new section of a mine data on local geological structures and variations of the bedded sequence can be limited Planning is typically based on the
expected average conditions Modifcations to the mining plan are made if hazardous conditions are exposed during development Numerical models can provide additional insight into the expected
response of the average rock mass but the reliability of the prediction is not better than the available geotechnical data
When developing a numerical model one of the frst challenges is to identify appropriate input parameters for modeling the
rock mass The large-scale strength of the rock mass needs to be known as well as the initial loading conditions Establishing appropriate values for rock mass strength can be a challenge because laboratory-determined test results do not necessarily represent the properties of the large-scale rock mass Methods of relating laboratory tests to the large-scale rock mass strength have been developed (Hoek and Brown 1997) and can be used as a frst estimate However these relationships are more appropriate for a relatively homogeneous jointed rock mass rather than the strongly bedded and highly variable rock layering that is found in coal mine strata The initial stress conditions in coal strata can also be more complex than in more homogeneous rock masses In the eastern and midwestern United States the in situ horizontal stress appears to be caused by current-day tectonic loading (Zoback and Zoback 1989 Dolinar 2003 Mark and Gadde 2008) resulting in horizontal stress that is greater in stiffer rock strata The resulting variation in horizontal stress should be included in numerical models Further issues exist when attempting to model the gob response Little is known about the extent of caved rock above the mining horizon and the properties of the fully caved and partially caved material Nevertheless numerical models have found wide acceptance in coal mine design in spite of the diffculties and challenges associated with model development and calibration
This paper addresses the need for a basic set of model parameters to provide a frst estimate of the expected rock mass response in US coal mines The models were calibrated against published case histories of in situ monitoring of the rock mass response to coal mining as well as laboratory testing of coal intact rock and gob materials This paper does not however provide relationships between model outputs and excavation serviceability indices
The modeling software used in this paper is FLAC3D (Anon 2007) The model parameters will be useful as initial estimates when using other modeling techniques but each technique should be calibrated independently
PILLAR STRENGTH MODELING
The strength of pillars is affected by the properties of the coal within the pillars the contact between the coal and the surrounding rock mass and the response of the surrounding rock mass to the pillar stress Therefore the pillar-roof-foor system should be considered as a unit when assessing pillar strength
Strength of the Coal
The scale dependence of rock strength particularly coal has received much attention in rock engineering literature (Hoek and Brown 1980 Bieniawski 1968) Coal is one of the few rock materials that has been extensively tested at various scales and the results indicate that its strength reduces as the sample size increases For modeling purposes the coal strength as well as the residual strength and the rate of strength decay need to be known
The Hoek-Brown constitutive model that is available in FLAC3D was used to model the coal strength The peak strength is assumed to follow the Hoek-Brown rock mass strength criterion (Hoek et al 2002) and yield is modeled based on strain softening and non-associated plastic fow rules The Hoek-Brown criterion
describes a non-linear relationship between confnement and stress and can be written as follows in its general form
mσ 3 aσ 1 = σ 3 + σ ( + s)σ (1)
where I1 and I3 are the effective principal stresses I c is the strength of the intact rock and m s and a are empirically derived parameters The parameters can be determined by laboratory testing of small samples of rock However obtaining the parameters for the large-scale rock mass cannot be practically done by direct testing Methods for estimating these parameters from rock mass classifcation data and small-scale laboratory tests have been proposed (Hoek and Brown 1997)
To obtain a set of realistic coal strength parameters for the Hoek-Brown criterion the strength of laboratory-scale coal samples was frst considered Unpublished triaxial test data available to the authors supplemented by published data (Atkinson and Ko 1977 Morsy and Peng 2001 Newman and Hoelle 1993) were used to determine an initial set of parameters describing laboratory coal strength There was a considerable scatter in the results and each data set was assessed individually The s-parameter was set to 10 which represents intact rock material and the a-parameter was set at either 050 or 065 depending on which value provided the best ft The resulting m-parameter for the intact coal (m)was determined for each data set The resulting m-values ranged between a low of 50 and a high value of 176 and the uniaxial compressive strength (UCS) of the coal varied between 16 MPa and 0 MPa (2321 and 5802 psi)
The next step was to modify the m- and s-parameters so that they would be representative of a large-scale (1-m (33-ft) edge) coal sample The literature contains several approaches to estimate this value since it is impractical to determine it by direct testing For example Gadde et al (2007) estimated the large-scale m-parameter for coal through rock classifcation considerations Barron and Yang (1992) showed that the coal type and rank result in an m-parameter variation and proposed that the large-scale m-parameter can be estimated from the coal rank number Medhurst and Brown (1988) conducted triaxial strength tests on laboratory samples with diameters of 61 mm (2 in) up to 300 mm (12 in) and extrapolated the results to large-scale coal They
assumed that the 61-mm (2 in) samples represent intact coal and the larger samples were considered to represent increasingly fractured coal as the number of cleats and faws in the samples increased The results of the study showed that the m-value decreases with sample size For medium rank mid-brightness coal samples they found that setting the a-parameter to 065 gives the best ft to the test results and the following relationship can be used to estimate the in situ m-value for large-scale coal
m = 015 m (2)
Using the above relationship the m-parameter for US coal can be calculated Based on the review of triaxial tests on US coal
samples the m-parameter for average US coal was calculated to be 98 which is the average of the laboratory derived values The m-parameter for the large-scale coal can then be calculated to be 17 using Equation 2 This value of the m-parameter was used in all the pillar models described in this paper
Further parameters that are required for modeling large-scale coal are the s-parameter of the large-scale coal the residual m- and s-parameters and the rate of strain softening from the peak to the residual strength These parameters have not been determined in the laboratory due to practical problems with preparing handling and crushing such large blocks of material An alternative approach may be to use rock classifcation methods to estimate the s-parameter and the residual values of m and s However rock classifcation methods are poorly suited to classifying coal material In addition the relationships between classifcation values and the Hoek-Brown parameters are not necessarily valid for coal materials Therefore the fnal estimates of the unknown parameters were obtained through numerical model calibration against empirically derived pillar strength equations observed failure of coal in pillar ribs and measurements of stress distributions in coal pillars
Numerical Model Testing to Obtain Unknown Parameters
The unknown strength parameters of the coal were determined by creating numerical models of coal pillars and subjecting them to increasing loads while monitoring their stress-strain response The pillar response was compared to empirical strength equations and to feld monitoring data and the unknown parameters were varied until satisfactory agreement was obtained between model response and observed pillar performance At all times the reasonableness of the inputs was considered against measured values
Numerical models were created in which a portion of the roof strata the coal pillar and the foor strata were simulated Pillars with width-to-height ratios of 3 6 8 and 10 were modeled Interface elements were used to model the contacts between the coal and the surrounding rocks The surrounding rocks were elastic having a Youngs modulus of 20 GPa (2901 ksi) and Poissons ratio of 025 Figure 1 shows a pillar model with the coal roof and foor strata included only a quarter of a full pillar was modeled because of symmetry
Coal pillar
Figure 1 Example of a three dimensional model of a coal pillar and the surrounding roof and foor strata
The model pillars were loaded by gradual compression in the vertical direction The rate of compression was controlled so that the unbalanced forces in the model remained within pre-defned limits As the stress in the model increased failure and deformation of the coal was allowed to occur based on the defned strength properties and assumed unknown parameters The model pillars were tested up to their peak strength and were allowed to yield to a residual value Some of the wider pillars displayed strain hardening characteristics and the tests were typically stopped when the model deformation became excessive
Bieniawskis (1992) empirical pillar strength equation was used for comparing the peak strength of the numerical models to actual pillar strength The comparisons were carried out for pillars with width-to-height ratios of 30 to 80 Beyond a width-to-height ratio of 80 the empirical data are sparse The large-scale coal strength
used in the Bieniawski equation was set at 62 MPa (899 psi) being representative of the typical coal strength in US coal mines after Mark and Chase (1997)
Field monitoring data in the form of stress measurements in pillars adjacent to longwall panels were used to verify that the extent of coal failure and the stress gradient at the edge of the pillars were acceptable The calibration of the models against coal rib failure was carried out by comparing the model results to a series of pillar stress measurements from feld study sites in the US (Iannacchione 1990a Campoli et al 1990 Koehler et al 1996 Oram 1996) shown in Figure 2 Vertical stress values in excess of 80 MPa (11603 psi) were measured within the coal ribs at some of the sites The depth of coal yield can be seen to extend about 5 m into the pillar where these peak stress values were measured The fgure also shows a collection of stress profles determined by the numerical models after fnal calibration of the coal properties It can be seen that the peak stress in the model profles follow a similar path as the measured results For a peak stress of about 80 MPa (11603 psi) the model shows the peak located at about 5 m (16 ft) into the pillar which falls within the range of feld results It was concluded that the pillar models were satisfactory and were producing realistic peak strength values at the edges of pillars and depths of failure into the coal ribs
Sensitivity studies of the effect of the interface properties showed similar to the experience of other researchers (Gale 1999 Iannacchione 1990b Lu et al 2008) that the interface properties can have a signifcant effect on the strength of a pillar However if a similar stress gradient is desired at the edge of the pillar as measured in underground trials a friction angle of about 25deg is required with a nominal interface cohesion value of 01 MPa (15 psi) The friction angle of 25deg is lower than the internal friction angle of most coal types and seems to be a reasonable value to represent a typical coal-rock interface
After conducting many combinations of inputs and always evaluating the assumptions for reasonableness and the outcomes
against empirical results the following set of input parameters was found to be satisfactory for modeling coal pillars based on the requirements of matching the Bieniawski strength equation and achieving similar depths of failure and stress gradients as observed in the feld
UCS (lab scale) = 20 MPa (2901 psi)
Youngs modulus = 3 GPa (35 ksi)
Poissons ratio = 025
m-value = 17
s-value = 007
m-residual = 10
s-residual = 0001
Interface friction angle = 25deg
Interface cohesion = 01 MPa (15 psi)
Interface tensile strength = 00
Interface normal stiffness = 1000 GPam (150 ksim)
Interface shear stiffness = 50 GPam (7252 ksim)
The strength decrease of the coal from the peak to a residual value was allowed to take place over a plastic strain value of 00 for element sizes in the range of 030 to 033 m (1 to 11 ft) This value is affected by the element size used in the models and needs to be adjusted if models are created using a signifcantly different element size The FLAC3D software also has a dilation parameter that is used in the implementation of the Hoek-Brown criterion This parameter was set to zero mainly because non-zero values appeared to cause large geometric distortions of the yielding elements which were considered to be excessive It is recognized that the fnal set of inputs is not unique and it is possible that a different combination of input values can equally satisfy the empirical data
100
ea
sre
st
ress
Qa)
Pillar 1 Pillar 2 Pillar 3 Pillar 4 Model results
0 1 2 3 4 5 6 7 8 9
90
80
70
60
50
40
30
20
10
0
Distance into coal rib m)
Figure 2 Stress at the edge of coal pillars subject to increased loading Solid lines indicate model results of the stress profle at the edge of a WH = 16 pillar at various loading stages Symbols indicate feld measurements at the edges of four longwall chain pillars
Resulting Model Pillar Strength and Stress-Strain Response
Figure 3 shows the resulting stress-strain curves obtained from the pillar models
500
450
400
350
Stre
ss
Qa) 300
250
200
150
100
50
00
0 1 2 3 4 5 6 7 8 9 10
Strain
Figure 3 Stress-strain curves obtained from calibrated numerical models of pillars with width-to-height ratios of 30 to 100
It can be seen that when the width-to-height ratio is 60 and below the pillars exhibit a clear peak strength followed by strain softening behavior as the pillars continue to be compressed However for the width-to-height ratios of 80 and 100 the pillars do not display strain softening behavior but become strain hardening This type of behavior has been observed in laboratory tests on coal samples (Das 1986) and is predicted by some pillar strength theories (Wilson 1972 Salamon and Wagner 1985)
The peak pillar resistance produced by the numerical models is compared to the Bieniawski pillar strength equation up to a width-to-height ratio of 80 in Figure The results show that satisfactory agreement has been achieved between the model results and the empirical equation which was the target of the model calibration exercise
0
5
10
15
20
25
30
_ie ia_-i e_uatio_
Numerical models
ea-
pill
ar t
re g
th
a
0 2 4 6 8 10 12
Width-to-height ratio
Figure 4 Pillar strength results obtained by numerical models after calibrating the models to the empirical pillar strength equation of Bieniawski (1989)
The Effect of Weak Surrounding Rocks
The above results were all obtained using models of coal that is contained between elastic roof and foor strata The elastic material was not allowed to fail in the models A number of analyses were carried out to evaluate the impact of weak and moderate strength roof and foor rocks on pillar strength which showed that the peak pillar strength will be reduced if bedding slip occurs in the roof or foor Other issues also arose such as punching of the pillar core into the surrounding strata and pillar weakening if the roof collapses between the pillars These phenomena have been observed in the feld and can be analyzed using foundation engineering principles or numerical models (Chugh and Pytel 1992 Gadde 2009) Pillar design issues related to weak roof and foor strata fall beyond the scope of this paper The results shown here assume that the pillar strength is governed by failure and yielding of the coal within the pillar and the surrounding strata have only a limited impact on the strength
GOB RESPONSE MODELING
When modeling full extraction mining such as longwall or pillar extraction it is necessary to realistically simulate the gob (caved rock) in the mined out areas The characteristics of the gob are diffcult to measure in the feld because of the large displacements that occur and fragmented nature of the caved rocks Attempts have been made to locate load cells within the gob and measurements have been made in the foor strata below the gob (Iannacchione 1990b) Laboratory tests on rock fragments have also provided valuable insight into the compaction behavior of fragmented gob materials (Pappas and Mark 1993)
Gob Characteristics
The gob is usually subdivided into two zones a lower fully caved zone and an upper fractured zone (Peng and Chiang 198) The fully caved zone can be expected to extend vertically to about 2 to 3 times the mining height and behaves as a granulated material with a relatively high void ratio The rock in the fractured zone has a relatively low void ratio but the overall strength is reduced
owing to the presence of fracturing associated with the passage of the longwall panel face stress abutment
Laboratory tests on coal measure shale and sandstone fragments showed that the stress-strain response of confned gob material follows an exponential hardening curve (Pappas and Mark 1993) The tests were carried out on rock fragments that resembled a fully caved gob having void ratios in the region of 30 to 0 It was found that the stronger sandstone gob material had a stiffer response than the weaker shale material as one would expect A hyperbolic equation after Salamon (1990) was found to adequately represent the gob stress-strain behavior which can be expressed as follows
a timesεσ = b minus ε (3)
where a and b are empirically derived parameters and E is the vertical strain The b-parameter is related to the void ratio and the a-parameter is the gob stress when the strain is equal to b12 For shale gob the laboratory tests (Pappas and Mark 1993) showed that a = 765 MPa (1110 psi) and b = 02 and for sandstone gob a = 1303 MPa (1890 psi) and b = 027
Modeling Gob as a Strain Hardening Material
Gob modeling can follow two approaches In the frst approach the intent may be to study roof fracturing caving and gob development in response to mining In this approach it is necessary to explicitly model the gob formation process so that variations in geology and loading conditions can be studied A second approach may be modeling of the effect of the gob on the surrounding coal mine entries and pillars In the second situation the gob is implicitly modeled that is the effect of the gob is modeled accurately so that the load redistribution to the surrounding rock and coal is correct and the large-scale overburden defection and subsidence is correct This paper addresses the second scenario in which rock fracture and gob development is not explicitly modeled but the effect of the gob needs to be included in a model
When using the FLAC3D software it is possible to simulate the effects of the fully-caved gob as a strain-hardening granulated
material using double-yield elements These elements can model the compaction of granulated materials under increased loading using a cap-plasticity criterion and have been successfully used to model gob compaction and response (Esterhuizen and Barczak 2006) Alternatively when a large-scale model is set up equivalent gob elements can be created by simply following the gob response curve without attempting to simulate the complex material behavior that forms the response curve (Board and Damjanac 2003 Esterhuizen and Mark 2009)
All the model calibrations presented in this paper were done using equivalent gob elements that follow the hyperbolic stress-strain curves (Equation 3) The gob response to various depths of cover mining geometries and overburden types was investigated
OVERBURDEN RESPONSE MODELING
The defection and potential subsidence or collapse of the overburden has a signifcant impact on the load redistribution around coal mine panels When full extraction mining is carried out the overburden will settle onto the gob and stress will be regenerated in the mined area The amount of stress regeneration depends on the gob stiffness as well as the stiffness of the overburden Subsidence is also directly affected by the overburden properties and the panel width-to-depth ratio Strong overburden strata can form a stable arch over a mined panel which can result in signifcantly higher stress in the unmined coal while reducing the gob stress and magnitude of subsidence The overburden stiffness also determines how stresses will be distributed over the unmined coal Stiff overburden can be expected to transfer stress over a greater lateral distance than softer strata When modeling the overburden the characteristics of the overburden materials must be captured as accurately as possible to reproduce the observed response The accuracy of the overburden models can be verifed against feld measurements of subsidence and of stress magnitudes in the coal surrounding mined panels
Modeling Bedded Strata
The bedded overburden rocks were modeled using the strain softening ubiquitous joint elements available in the FLAC3D software These elements consist of a strain softening Coulomb material that represents the rock matrix and planes of weakness representing the bedding The orientation and strength of the planes of weakness can be defned separately from the matrix properties and can also exhibit strain softening behavior These elements allow a reasonable approximation of the characteristics of bedded strata to be made
For the purpose of model calibration a suite of rock strengths and bedding types was created which could be combined to model any rock type from a strong limestone with no bedding weaknesses to a low strength shale or claystone with smooth bedding planes The initial properties of the strata were based on extensive databases of rock properties available at NIOSH as well as published data (Zipf 2007 Rusnak and Mark 2000) The approach was to simulate the rock matrix without any bedding
effects or rock mass effects The matrix strength of the in-situ rocks was determined from the laboratory scale strength using the relationship suggested by Hoek and Brown (1980)
50 018σ = σ 50 ( )()d
where I 50 is the laboratory sample diameter in mm and d is the feld-scale sample diameter in mm Assuming the laboratory sample size is nominally 50 mm (2 in) the strength of a 1000 mm ( in) sample will be 058 times the laboratory sample size
Initial Stress
The initial stresses in the models were defned to closely match the current understanding of stress in the coal measures in the United States The pre-mining vertical stress is gravity driven and
is determined by the depth of the overburden The horizontal stress is also depth dependent but there is a tectonic component that is caused by the movement of the North American plate (Zoback and Zoback 1989 Dolinar 2003 Mark and Gadde 2008) According to current understanding the tectonic component of the horizontal stress is higher in stiff strata than in softer strata (Dolinar 2003) In the numerical models the pre-mining horizontal stress is calculated in each layer of rock depending on its modulus of elasticity The following equations are used after Mark and Gadde (2008) to calculate the maximum and minimum horizontal stress components in MPa units
σ h1 = 12σ v + 26 + 0003E (5)
σ h2 = 12σ v + 00015E (6)
where E is the elastic modulus of the rock and I(v is the vertical overburden stress
OVERBURDEN AND GOB MODEL CALIBRATION
Calibration of the models was carried out by simulating total extraction mining of panels at various depths of cover and with various excavation spans The model results were compared to predicted and measured subsidence profles and empirically determined stress distributions from published case studies from around the United States Correct modeling of the subsidence profle helps to confrm that the large-scale stiffness and deformation properties of the overburden and gob are reasonable During the calibration stage many combinations of rock strength properties and geometric scenarios were tested Ultimately it was found that a single set of overburden material properties and gob properties could be used to obtain satisfactory agreement between model results and feld observations for modeling the large-scale rock mass response and pillar response around full extraction panels
Overburden Properties
The rock strength deformation properties and bedding strength properties suggested for modeling large-scale coal measure rocks in the United States are presented in Table 1 These properties can be used for panel scale models where a single element can include both intact rock and weak bedding planes Element sizes in the overburden models typically varied between 5 and 10 m (16 and 33 ft) Figure 5 shows a typical large-scale model that was used in the calibration exercises the models always extended up to the ground surface and rock layering was modeled down to approximately 5-m (16-ft) bed thicknesses Model element thickness varied between about 5 and 10 m (16 and 33 ft) in the proximity of the coal seam and was sometimes larger when modeling thick beds near the ground surface
The uniaxial compressive strength shown in Table 1 is the laboratory-scale strength which was reduced by the 058 factor from Equation to simulate the large-scale strength in the models Strength reduction owing to strain softening was achieved by reducing the rock cohesion only the friction component of the
strength was not altered The Poissons ratio was set at 025 and tensile strength set to 10 of the large-scale rock compressive strength Bedding tensile strength was set at 10 of the large-scale rock tensile strength The bedding friction angles may seem to be relatively low compared to small-scale laboratory test results However the presence of weak clayey materials especially in shale beds can have a signifcant impact on the overall shear resistance of a strata layer The presence of moisture in these clayey materials can result in excess pore pressure when the rock stress increases and in reduced apparent friction angles Field observations have shown that lateral sliding between beds can occur up to about 150
m (92 ft) ahead of a longwall face which can partly be explained by the presence of low friction glide planes within the rock (Listak et al 1987) When modeling the large-scale rock mass it is necessary to include the effect of these weak planes in the rock mass strength
Table1 Representative rock properties
Rock type
Limestone 1
Laboratory sample In situ rock material In situ bedding planes
UCS (MPa)
10
Elasticmodulus
(GPa)
0
Frictionangle (deg)
2
Cohesion (MPa)
1893
Tensile strength (MPa)
812
Dilationangle(deg)
10
Bedding friction
angle (deg)
Bedding cohesion (MPa)
Beddingtensile
strength (Mpa)
32 97 650 Limestone 2 100 35 2 1510 58 10 30 755 6 Limestone 3 80 30 0 1339 6 10 28 670 371 Sandstone 1 120 0 2 1623 696 11 30 811 557 Sandstone 2 100 0 0 1352 58 12 30 676 6 Sandstone 3 80 35 37 1208 6 13 27 60 06 Sandstone 60 35 35 906 38 1 25 53 035 Sandstone 5 0 30 30 670 232 15 20 335 023 Shale 1 80 25 32 178 6 16 10 296 06 Shale 2 60 20 30 1218 38 17 7 2 035 Shale 3 0 15 25 890 232 18 7 178 023 Shale 30 10 20 730 17 19 7 050 017 Shale 5 20 10 20 87 116 20 5 030 012 Shale 6 10 5 20 266 058 21 5 020 006 Shale 7 5 20 135 029 22 5 010 003
i ed pa el
Figure 5 Example of a numerical model used to evaluate gob and overburden response Layering represents different lithologies modeled Gob is shown in green and unmined coal in dark blue
Mined panels
Gob Properties
The subsidence profle is useful for calibrating the gob compaction characteristics The maximum subsidence over a super-critical panel (panel width exceeds 12 times the panel depth) can be used to verify the gob compaction assumptions When a panel is super-critical the full overburden weight is carried by the gob and the resulting subsidence is directly related to gob compaction characteristics The SDPS subsidence prediction software (Newman et al 2001) was initially used to create a suite of subsidence curves for various super-critical longwall geometries and geologies Final verifcation was done by modeling published feld trials and comparing the model results to actual subsidence measurements
It was found that the gob compaction characteristics depend on the type of rock material in the gob Gob that consists of the stronger rock types is less compressible than the weaker gob materials To assist in selecting the appropriate gob parameters an approach similar to that followed by the authors of the SDPS software was followed in which the gob is characterized by
the ratio of the thickness of strong to weak rocks in the overburden Weak rocks include shales and claystones that have a uniaxial compressive strength of less than about 0 MPa (5802 psi) while limestone sandstones and siltstones with strengths above 0 MPa (5802 psi) would be classifed as strong rocks Figure 6 shows the stress-strain behavior of the various gob materials used in the models The fgure shows that the laboratory-
determined curves fall within the range of curves used in the models Interestingly the strong rock gob curve derived from full-scale subsidence is almost identical to the laboratory-determined curve for sandstone materials Table 2 summarizes parameters for describing the gob curves using Equation 3 as used in the models
Table 2 Parameters for modeling various gob types using Equation 3
Overburden type
Ratio of strong weak
rocks
a parameter
(MPa)
b parameter
Weak 25 59 0 Moderate 35 86 0 Strong 50 128 0 Very strong 65 252 0
25
30
35
15
10
5
Stre
ss (M
paI
20
0 0 005 01 015 02 025 03 035 04
Strain
Figure 6 Stress-strain curves for gob materials determined through model calibration and results of laboratory tests on gob materials after Pappas and Mark (1998)
Very strong overburdenStrong overburdenModerate overburdenWeak overburdenLaboratory test sandstoneLaboratory test shale
VERIFICATION OF CALIBRATED MODELS
After completing the calibration exercises a number of the case histories that were used for calibration were re-evaluated using the fnal set of input parameters and modeling technique Three examples are presented here showing a variety of longwall mining and pillar extraction scenarios The frst example shows stress and subsidence results for a supercritical longwall panel under relatively weak overburden strata typical of the Northern Appalachian coal felds The second is a sub-critical longwall panel under strong strata found in the western United States The third compares monitoring of pillar stress adjacent to a longwall with strong overburden strata
Supercritical Longwall Panel
The frst model simulates a longwall in the Pittsburgh seam where detailed subsidence measurements have been made (Zimmerman and Fritschen 2007) The depth of cover is 180 m (591 ft) and the panel width is 350 m (118 ft) with a three-entry gate road system The chain pillars were 2-m (79 ft) wide and the mining height was 17 m (56 ft)
The chain pillars the solid abutments and the gob were modeled using the equivalent pillar approach (Esterhuizen and Mark 2009) in which model elements are prescribed to follow the stress-strain relationships of the pillars gob and abutment edges The pillars were specifed to follow the stress-strain relationships derived from numerical models using the approach described in this paper The gob was modeled as a weak material associated with 25 strong overburden using the parameters listed in Table 2 The overburden in this area consists of alternating layers of shale siltstone sandstone and limestone The limestone is typically strong and massive with poorly developed bedding planes The limestone was modeled without any weak bedding planes but vertical joints were included The extraction of the longwall was modeled by extracting the coal elements and replacing them with gob elements and allowing the overburden to settle onto the gob The model results were evaluated against the measured surface subsidence and empirical predictions of the likely extent of the abutment stress and the stress distribution in the chain pillars
The subsidence results are presented in Figure 7 which shows that excellent agreement is achieved between the vertical displacements in the model and subsidence measurements
350 450 550 650
Distance (mI
Field meaureme t
Locatio of lo g_all pa el
50
02
250
00
-02
-04
-06
Subs
iden
ce (m
I
-08
-10
-12
-14
Figure 7 Comparison of model subsidence results and feld measurements for a supercritical panel in the Pittsburgh coal bed Subsidence measurements after Zimmerman and Fritschen (2007)
7
Model results
This confrms that the gob compaction curve is realistic since the maximum subsidence agrees with observations In addition the curvature of the overburden at the edges of the subsidence trough and the location of the subsidence trough relative to the edge of the longwall panel are satisfactory This indicates that the large-scale stiffness and deformation of the overburden is modeled with suffcient accuracy
The stress distribution on the mining horizon determined from the model results and from the Marks (1987) empirical equation is shown in Figure 8 The columns showing the model results are 12-m (39-ft) wide representing the width of the elements The results show that the extent of the abutment zone extends about 72 m (236 ft) away from the edge of the gob which is the same as the value predicted by the empirical equation of Peng and Chiang (198) The empirical curve predicts the average stress on the 2-m-wide chain pillar marked A in Figure 8 to be 236 MPa (3229 psi) while the model result is 227 MPa (3292 psi) which is a satisfactory outcome The results for the second chain
pillar marked B in Figure 8 differ by a greater amount mainly because the empirical equation does not take into account the fact that this pillar is adjacent to the stiffer unmined abutment and assumes the pillar carries the full tributary loading
300
100
200
250
150
Stre
ss
Qa)
50
00
169
158
146
134
123
111
-99
-88
-76
-64
-52
-41
-29
-17 6 6 18 30 42 54 66 78 90 102
114
126
138
150
162
174
Distance from ege of panel m)
Figure 8 Comparison of empirical and numerical model derived stress distribution on the seam level for a 350 m (1150 ft) wide longwall at 180 m (600 ft) depth of cover in the Pittsburgh coal bed
Gob stress
Chain pillar B
Chain pillar A
Numerical model results
Empirical equation
Solid abutment
The results show that for this test case the developed input parameters for modeling the coal pillar overburden and gob performed very satisfactorily against the measured subsidence and expected stress distributions on the coal seam
Subsidence Over a Sub-Critical Longwall Panel
The second example shows numerical model results for a longwall in strong overburden in central Utah The subsidence was measured during the mining of a number of longwall panels (Allgaier 1988) The average depth of cover was about 50 m (176 ft) and the average mining height was 3 m (10 ft) in the Blind Canyon coal bed The subsidence related to the frst two panels panel 5E and 6E of a series of four longwall panels was selected for analysis The panel widths were 16 and 16 m (79 and 538 ft) for the 5E and 6E panels respectively The panels were separated by two rows of small chain pillars that had a width-to-height ratio of 32 and are considered to be yield pillars The general geology is described as sandstones in thick beds and sandstone interbedded with siltstone It is estimated that 5 of the overburden consists of sandstone
Subsidence monitoring revealed vertical displacements of only about 60 mm (2 in) after mining the frst panel as shown in Figure 9
000
-020
-040
-060
Measured first pa_el
Modelfirst pa_el
Measured seco_d pa_el
Modelseco_d pa_el
First pa_el seco_d pa_el
Sbs
ien
ce m
)
-080
-100
-120
-140
-160
0 100 200 300 400 500 600 700 800 900 1000 Distance (m)
Figure 9 Comparison of model subsidence results and feld measurements for two subcritical panels in a Utah coal mine Subsidence measurements after Allgaier (1988)
The panel width-to-depth ratio was 032 which is highly sub-critical therefore the subsidence probably only refected the elastic defection of the strata After mining the second panel a subsidence trough developed with a maximum subsidence of just over 10 m (33 ft) that was centered over the frst panel (see Figure 9) The location of the yield pillars between the two panels was not visible in the subsidence curve The width-to-depth ratio of the two panels and the intervening yield pillars was 075 which is still sub-critical
The two longwalls and the overburden geology were modeled by simulating the published geologic profle using the calibrated set of input parameters for the overburden and gob Sandstone strengths were set at 100 MPa (150 psi) and interbedded siltstone and sandstone materials were modeled with strengths between 60 MPa (702 psi) and 80 MPa (11603 psi) The longwall extraction was modeled in stages with the coal being removed and replaced by strong gob properties shown in Table 2 Subsidence results were obtained after mining of the frst panel and the second panel The results are also presented in Figure 9 which shows that for frst-panel mining the model results are very similar to the feld measurements The displacements are small refecting elastic displacement of the ground surface Overburden failure and shearing along bedding planes was limited to the lower half of the model with the upper rocks being undisturbed in terms of shearing or failure After mining the second panel the failure progressed up to the ground surface and the subsidence increased considerably to a maximum of 116 m (381 ft) nearly symmetrically located over the mined area The subsidence profle in the model also shows no sign of the yield pillars between the two panels similar to the measurements
The shape of the subsidence curve is satisfactory from the point of view of providing a reasonable agreement with the extent and maximum subsidence More importantly however the modeled overburden responded correctly by arching over the frst panel resulting in negligible subsidence and then subsiding to about 1 m (33 ft) when the second panel was extracted This outcome demonstrates that the overburden modeling approach is reasonable and it is able to capture the initial arching of the strata over the frst panel followed by the failure of the arch when the second panel was mined
Pillar Stress Case Study in Strong Rock
The third case study presents a comparison of numerical model results to in-mine stress measurements in strong overburden strata The stress changes cable bolt performance and entry deformations were monitored in a yield-abutment pillar system in the Hiawatha seam at the Crandall Canyon mine in Utah (Koehler et al 1996) Two longwall panels at depths of cover of 396 m to 57 m (1299 to 199 ft) were separated by a 91- (30-ft) wide yield pillar and a 366-m-wide abutment pillar The longwall panels were overlain by strong sandstone and siltstone with occasional thin shale bands
The strength of the roof strata generally fall between 69 Mpa (10008 psi) and 138 MPa (20015 psi) and several less competent zones with strengths below 50 MPa (7252 psi) were reported Monitoring results showed that the peak abutment stress of 5-50 MPa (6527-7252 psi) was located very near the edge of the abutment pillar and there was a rapid drop off over about half the abutment pillar width unlike the gradual decay one would expect from the Marks (1987) empirical equation
A numerical model was created that simulated the mining of the two panels again using the equivalent pillar approach to model the pillars adjacent to the panels The gob was modeled using the strong rock parameters in Table 2 and the overburden was modeled using the higher strength rock types in Table 1 interspersed with thin bands of weaker materials The massive Castlegate sandstone in the upper part of the geologic profle was also included in the model
Figure 10 shows the stress distribution predicted by the model and measured underground after the frst longwall had mined past the monitoring site by about 260 m (85 ft) and the pillar system was subject to side loading from the frst gob
500
450
400
350
300
250
200
150
100
50
00
Field meaureme t
Numerical model reult
-10 10 30 46 58 4 3 112 131 150 16 188 20 226 245 264 283 302 322
Dita ce from edge of pa el m
Stre
7
Figure 10 Comparison of numerical model results and feld measurements of the stress at the edge of a longwall panel in the Western United States after Koehler et al (1996)
(Mpa
)
Abutment pillar
Yield pillar
Overburden stress
It can be seen that the measurements show a peak stress of 8 MPa (6962 psi) which drops down very rapidly to less than 20 MPa (2901 psi) within the 36-m (118 ft) wide abutment pillar The model results show a similar pattern of high stress an average of 3 MPa (931 psi) in the portion of the pillar nearest the gob dropping down to 17 MPa (7252 psi) away from the gob The yield pillar in the model yielded to a greater degree than the observations This might be explained by the fact that the coal in the model was assumed to have a uniaxial compressive strength of 20 MPa (2901 psi) while laboratory tests indicated that the coal at this mine was likely to be about 30 MPa (351 psi) The model stress results for the solid abutment is similar to the measured results It is interesting to note that the model shows a long tail to the stress decay which can explain the fact that forward abutment pressures were identifed by the monitoring instruments up to 87 m (285 ft) ahead of the longwall face
This case study shows that the model parameters can also provide satisfactory results for evaluating stress changes in
longwall panels under stiff overburden Although no subsidence data was available for this case the model showed a dish shaped subsidence bowl forming over the two longwall panels and the expression of the yield-abutment pillar system was not visible on the surface which indicates that the strata were likely arching over the two panels
The outcome of the third case study was again very satisfactory showing that the input parameters and modeling approach is able to capture the stress distribution in both a weak rock scenario shown in the frst case study as well as this strong rock scenario The good agreement with measured stresses in the pillars is further verifcation that the numerical models are performing satisfactorily
CONCLUSIONS
Modeling the large-scale response of coal measure rocks due to mining can be satisfactorily achieved using well-calibrated numerical models provided the main characteristics of the coal pillars the overburden and the gob are captured in the models This paper demonstrates how the FLAC3D software was used to obtain a base set of input parameters that can be used to evaluate the stress and deformation associated with mining in a variety of geological conditions ranging from super-critical panels in weak overburden to sub-critical panels in strong rocks
The calibration process described had the objective to obtain good agreement between model results and pillar strength surface subsidence and in-seam stress distributions The models of individual pillars were calibrated against strong roof and foor case histories in which the pillar strength is governed by failure and yielding of the coal within the pillar and the strong surrounding strata had a limited impact on pillar strength Subsidence matching assisted in verifying that the large-scale rock mass parameters and the gob compaction characteristics are realistic Further calibration was carried out against stress measurements in coal pillars and in the unmined coal abutments Good agreement was achieved between model results and actual measurements which demonstrated that the interaction between the pillars and the surrounding strata was adequately captured in the models
The paper provides a basic set of input data and a modeling approach that can be used for numerical modeling investigations of various coal mine designs using the FLAC3D software package The models can be expected to provide realistic stress and deformation results but further calibration would be required to determine the relationship between model results and actual mining conditions
The model parameters presented are applicable for the FLAC3D software package The parameters will be useful as initial estimates when using other modeling techniques but each technique should be calibrated independently
DISCLAIMER
The fndings and conclusions in this paper have not been formally disseminated by the National Institute for Occupational Safety and Health and should not be construed to represent any agency determination or policy
REFERENCES
Allgaier F K (1988) Surface Subsidence Over Longwall Panels in the Western United States - Final Results at the Deer Creek Mine Utah US Bureau of Mines IC 919 17 p
Anon (2007) Fast Lagrangian Analysis of Continua in 3 Dimension (FLAC-3D V31) Itasca Consulting Group Minnesota
Atkinson R H and Ko H (1977) Strength Characteristics of US Coals Proceedings of the 18th US Symposium on Rock Mechanics Keystone CO pp 2B3-1-2B3-6
Barron K and Yang T (1992) Infuence of Specimen Size and Shape on Strength of Coal Proceedings of the Workshop in Coal Pillar Mechanics and Design US Bureau of Mines IC 9315 pp 5-2
Bieniawski ZT (1968) The Effect of Specimen Size on the Strength of Coal Int J Rock Mech Min Sci 4 325-335
Bieniawski Z T (1992) A Method Revisited Coal Pillar Strength Formula Based on Field Investigations Proceedings of the Workshop in Coal Pillar Mechanics and Design US Bureau of Mines IC 9315 pp 158-165
Board M and Damjanac B (2003) Development of a Methodology for Analysis of Instability in Room and Pillar Mines 2003 Swedish Rock Mechanics Day Conference Ed O Stephansson Stockholm Svebefo pp 1-22
Campoli A A Barton T M Van Dyke F C and Gauna M (1990) Mitigating Destructive Longwall Bumps Through Conventional Gate Entry Design US Bureau of Mines RI 9325 38 p
Chugh Y P and Pytel W M (1992) Design of Partial Extraction Coal Mine Layouts for Weak Floor Strata Conditions Proceedings of the Workshop in Coal Pillar Mechanics and Design US Bureau of Mines IC 9315 pp 32-9
Das MN (1986) Infuence of WidthHeight Ratio on Post Failure Behavior of Coal Int J Min and Geol Eng 479-97
Dolinar D (2003) Variation of Horizontal Stresses and Strains in Mines in Bedded Deposits in the Eastern and Midwestern United States Proceedings of the 22nd International Conference on Ground Control in Mining pp 178-185
Esterhuizen G S and Barczak T M (2006) Development of Ground Response Curves for Longwall Tailgate Support Design Proceedings of the 1st US Rock Mechanics Symposium Golden CO Paper 06-935
Esterhuizen G S and Mark C (2009) Three-Dimensional Modeling of Large Arrays of Pillars for Coal Mine Design Proceedings of the International Workshop on Numerical Modeling for Underground Mine Excavation Design Esterhuizen Mark Klemetti Tuchman eds NIOSH IC 9512 pp 37-6
Gadde M M (2009) Numerical Model Evaluation of Floor Bearing Capacity in Coal Mines Proceedings of the International Workshop on Numerical Modeling for Underground Mine Excavation Design NIOSH IC 9512 pp 7-5
Gadde M Rusnak J Honse J and Peng SS (2007) On Rock Failure Criteria for Coal Measure Rocks Proceedings of the 26th International Conference on Ground Control in Mining pp 361-369
Gale W J (1999) Experience of Field Measurement and Computer Simulation Methods of Pillar Design Proceedings of the Second International Workshop on Coal Pillar Mechanics and Design NIOSH IC 98 pp 9-61
Hoek E and Brown E T (1980) Underground Excavations in Rock Inst Min Metallurgy London 527 p
Hoek E and Brown E T (1997) Practical Estimates of Rock Mass Strength Int J Rock Mech amp Min Sci amp Geomech Abstr 341165-1186
Hoek E T Grabinsky M W and Diederichs M S (1990) Numerical Modelling for Underground Excavation Design Trans Inst Min Metall Section A Mining Industry 100A22-A30
Hoek E Carranza-Torres C and Corkum B (2002) Hoek-Brown Failure Criterion - 2002 Edition Proceedings of the 5th North American Rock Mechanics Symposium Toronto pp 267-273
Iannacchione A T (1990a) Behavior of a Coal Pillar Prone To Burst in the Southern Appalachian Basin of the United States Rockburst and Seismicity in Mines Balkema Rotterdam pp 295-300
Iannacchione AT (1990b) The Effects of Roof and Floor Interface Slip on Coal Pillar Behavior Rock Mechanics Contributions and Challenges A A Balkema Rotterdam pp 153-160
Koehler J Demarco M Marshall R and Fielder J (1996) Performance Evaluation of a Cable Bolted Yield-Abutment Gate Road System at the Crandall Canyon No 1 Mine Genwall Resources Inc Huntington Utah Proceedings of the 15th International Conference on Ground Control in Mining pp 77-95
Listak J M Hill J L and Zelanko J C (1987) Characterization and Measurement of Longwall Rock Mass Movement US Bureau of Mines IC 9137 26 p
Lu J Ray A Morsy K and Peng S S (2008) Effects of Coal Rock Interface Property on Coal Pillar Strength Proceedings of the 27th International Conference on Ground Control in Mining pp 262-267
Mark C (1987) Analysis of Longwall Pillar Stability PhD Thesis Pennsylvania State University 1 p
Mark C and Chase F E (1997) Analysis of Retreat Mining Pillar Stability Proceedings of the New Technology for Ground Control in Retreat Mining NIOSH IC 96 pp 17-3
Mark C and Gadde M (2008) Global Trends in Coal Mine Horizontal Stress Measurements Proceedings of the 27th International Conference on Ground Control in Mining pp 319-331
Medhurst T P and Brown E T (1988) A Study of the Mechanical Behaviour of Coal for Pillar Design Int J Rock Mech Min Sci 351087-1105
Morsy K and Peng S S (2001) Typical Complete Stress-Strain Curves of Coal Proceedings of the 20th International Conference on Ground Control in Mining pp 210-217
Newman D A and Hoelle J L (1993) The Impact of Variability in Coal Strength on Mine Planning and Design - A Case History Proceedings of the 12th International Conference on Ground Control in Mining pp 237-23
Newman D A Agioutantis Z and Karmis M (2001) SDPS for Windows An Integrated Approach to Ground Deformation Prediction Proceedings of the 20th International Conference on Ground Control in Mining pp 157-162
Oram J (1996) An Investigation Into the Behavior of Yield Pillar Multi Entry System at JWR No 7 Mine Part Unpublished Report By Rock Mechanics Technologies United Kingdom 31 p
Pappas D M and Mark C (1993) Behavior of Simulated Gob Material US Bureau of Mines RI 958
Peng S S and Chiang (198) Longwall Mining Wiley New York
Rusnak J and Mark C (2000) Using the Point Load Test To Determine the Uniaxial Compressive Strength of Coal Measure
Rock Proceedings of the 19th International Conference on Ground Control in Mining pp 362-371
Salamon M D G and Wagner H (1985) Practical Experiences in the Design of Coal Pillars Proceedings of the 21st International Conference of Safety in Mines Research Institutes Sydney Australia pp 3-10
Salamon M D G (1990) Mechanism of Caving in Longwall Coal Mining Proceedings of the 31st US Rock Mechanics Symposium Denver CO A A Balkema pp 161-168
Skiles M and Stricklin K (2009) General Guidelines for the Use of Numerical Modeling to Evaluate Ground Control Aspects of Proposed Coal Mining Plans Washington DC Mine Safety and Health Administration Program Information Bulletin No P09-03 Issue Date March 16 2009 7 p
Wang Q and Heasley K (2005) Stability Mapping System Proceedings of the 2th International Conference on Ground Control in Mining pp 23-29
Wilson A H (1972) A Hypothesis Concerning Pillar Stability The Mining Engineer 13109-17
Zimmerman K and Fritschen R (2007) Study About the Dynamic Infuence of Longwall Mining in the US on Surface Structures Proceedings of the 26th International Conference on Ground Control in Mining pp 79-8
Zipf R K (2007) Numerical Modeling Procedures for Practical Coal Mine Design Proceedings of the International Workshop on Rock Mass Classifcation in Underground Mine Design NIOSH IC 998 pp 153-162
Zoback M L and Zoback M D (1989) Tectonic Stress Field of the Continental United States Geol Soc of American Memoir 172 pp 523-539

0
5
10
15
20
25
30
_ie ia_-i e_uatio_
Numerical models
ea-
pill
ar t
re g
th
a
0 2 4 6 8 10 12
Width-to-height ratio
Figure 4 Pillar strength results obtained by numerical models after calibrating the models to the empirical pillar strength equation of Bieniawski (1989)
The Effect of Weak Surrounding Rocks
The above results were all obtained using models of coal that is contained between elastic roof and foor strata The elastic material was not allowed to fail in the models A number of analyses were carried out to evaluate the impact of weak and moderate strength roof and foor rocks on pillar strength which showed that the peak pillar strength will be reduced if bedding slip occurs in the roof or foor Other issues also arose such as punching of the pillar core into the surrounding strata and pillar weakening if the roof collapses between the pillars These phenomena have been observed in the feld and can be analyzed using foundation engineering principles or numerical models (Chugh and Pytel 1992 Gadde 2009) Pillar design issues related to weak roof and foor strata fall beyond the scope of this paper The results shown here assume that the pillar strength is governed by failure and yielding of the coal within the pillar and the surrounding strata have only a limited impact on the strength
GOB RESPONSE MODELING
When modeling full extraction mining such as longwall or pillar extraction it is necessary to realistically simulate the gob (caved rock) in the mined out areas The characteristics of the gob are diffcult to measure in the feld because of the large displacements that occur and fragmented nature of the caved rocks Attempts have been made to locate load cells within the gob and measurements have been made in the foor strata below the gob (Iannacchione 1990b) Laboratory tests on rock fragments have also provided valuable insight into the compaction behavior of fragmented gob materials (Pappas and Mark 1993)
Gob Characteristics
The gob is usually subdivided into two zones a lower fully caved zone and an upper fractured zone (Peng and Chiang 198) The fully caved zone can be expected to extend vertically to about 2 to 3 times the mining height and behaves as a granulated material with a relatively high void ratio The rock in the fractured zone has a relatively low void ratio but the overall strength is reduced
owing to the presence of fracturing associated with the passage of the longwall panel face stress abutment
Laboratory tests on coal measure shale and sandstone fragments showed that the stress-strain response of confned gob material follows an exponential hardening curve (Pappas and Mark 1993) The tests were carried out on rock fragments that resembled a fully caved gob having void ratios in the region of 30 to 0 It was found that the stronger sandstone gob material had a stiffer response than the weaker shale material as one would expect A hyperbolic equation after Salamon (1990) was found to adequately represent the gob stress-strain behavior which can be expressed as follows
a timesεσ = b minus ε (3)
where a and b are empirically derived parameters and E is the vertical strain The b-parameter is related to the void ratio and the a-parameter is the gob stress when the strain is equal to b12 For shale gob the laboratory tests (Pappas and Mark 1993) showed that a = 765 MPa (1110 psi) and b = 02 and for sandstone gob a = 1303 MPa (1890 psi) and b = 027
Modeling Gob as a Strain Hardening Material
Gob modeling can follow two approaches In the frst approach the intent may be to study roof fracturing caving and gob development in response to mining In this approach it is necessary to explicitly model the gob formation process so that variations in geology and loading conditions can be studied A second approach may be modeling of the effect of the gob on the surrounding coal mine entries and pillars In the second situation the gob is implicitly modeled that is the effect of the gob is modeled accurately so that the load redistribution to the surrounding rock and coal is correct and the large-scale overburden defection and subsidence is correct This paper addresses the second scenario in which rock fracture and gob development is not explicitly modeled but the effect of the gob needs to be included in a model
When using the FLAC3D software it is possible to simulate the effects of the fully-caved gob as a strain-hardening granulated
material using double-yield elements These elements can model the compaction of granulated materials under increased loading using a cap-plasticity criterion and have been successfully used to model gob compaction and response (Esterhuizen and Barczak 2006) Alternatively when a large-scale model is set up equivalent gob elements can be created by simply following the gob response curve without attempting to simulate the complex material behavior that forms the response curve (Board and Damjanac 2003 Esterhuizen and Mark 2009)
All the model calibrations presented in this paper were done using equivalent gob elements that follow the hyperbolic stress-strain curves (Equation 3) The gob response to various depths of cover mining geometries and overburden types was investigated
OVERBURDEN RESPONSE MODELING
The defection and potential subsidence or collapse of the overburden has a signifcant impact on the load redistribution around coal mine panels When full extraction mining is carried out the overburden will settle onto the gob and stress will be regenerated in the mined area The amount of stress regeneration depends on the gob stiffness as well as the stiffness of the overburden Subsidence is also directly affected by the overburden properties and the panel width-to-depth ratio Strong overburden strata can form a stable arch over a mined panel which can result in signifcantly higher stress in the unmined coal while reducing the gob stress and magnitude of subsidence The overburden stiffness also determines how stresses will be distributed over the unmined coal Stiff overburden can be expected to transfer stress over a greater lateral distance than softer strata When modeling the overburden the characteristics of the overburden materials must be captured as accurately as possible to reproduce the observed response The accuracy of the overburden models can be verifed against feld measurements of subsidence and of stress magnitudes in the coal surrounding mined panels
Modeling Bedded Strata
The bedded overburden rocks were modeled using the strain softening ubiquitous joint elements available in the FLAC3D software These elements consist of a strain softening Coulomb material that represents the rock matrix and planes of weakness representing the bedding The orientation and strength of the planes of weakness can be defned separately from the matrix properties and can also exhibit strain softening behavior These elements allow a reasonable approximation of the characteristics of bedded strata to be made
For the purpose of model calibration a suite of rock strengths and bedding types was created which could be combined to model any rock type from a strong limestone with no bedding weaknesses to a low strength shale or claystone with smooth bedding planes The initial properties of the strata were based on extensive databases of rock properties available at NIOSH as well as published data (Zipf 2007 Rusnak and Mark 2000) The approach was to simulate the rock matrix without any bedding
effects or rock mass effects The matrix strength of the in-situ rocks was determined from the laboratory scale strength using the relationship suggested by Hoek and Brown (1980)
50 018σ = σ 50 ( )()d
where I 50 is the laboratory sample diameter in mm and d is the feld-scale sample diameter in mm Assuming the laboratory sample size is nominally 50 mm (2 in) the strength of a 1000 mm ( in) sample will be 058 times the laboratory sample size
Initial Stress
The initial stresses in the models were defned to closely match the current understanding of stress in the coal measures in the United States The pre-mining vertical stress is gravity driven and
is determined by the depth of the overburden The horizontal stress is also depth dependent but there is a tectonic component that is caused by the movement of the North American plate (Zoback and Zoback 1989 Dolinar 2003 Mark and Gadde 2008) According to current understanding the tectonic component of the horizontal stress is higher in stiff strata than in softer strata (Dolinar 2003) In the numerical models the pre-mining horizontal stress is calculated in each layer of rock depending on its modulus of elasticity The following equations are used after Mark and Gadde (2008) to calculate the maximum and minimum horizontal stress components in MPa units
σ h1 = 12σ v + 26 + 0003E (5)
σ h2 = 12σ v + 00015E (6)
where E is the elastic modulus of the rock and I(v is the vertical overburden stress
OVERBURDEN AND GOB MODEL CALIBRATION
Calibration of the models was carried out by simulating total extraction mining of panels at various depths of cover and with various excavation spans The model results were compared to predicted and measured subsidence profles and empirically determined stress distributions from published case studies from around the United States Correct modeling of the subsidence profle helps to confrm that the large-scale stiffness and deformation properties of the overburden and gob are reasonable During the calibration stage many combinations of rock strength properties and geometric scenarios were tested Ultimately it was found that a single set of overburden material properties and gob properties could be used to obtain satisfactory agreement between model results and feld observations for modeling the large-scale rock mass response and pillar response around full extraction panels
Overburden Properties
The rock strength deformation properties and bedding strength properties suggested for modeling large-scale coal measure rocks in the United States are presented in Table 1 These properties can be used for panel scale models where a single element can include both intact rock and weak bedding planes Element sizes in the overburden models typically varied between 5 and 10 m (16 and 33 ft) Figure 5 shows a typical large-scale model that was used in the calibration exercises the models always extended up to the ground surface and rock layering was modeled down to approximately 5-m (16-ft) bed thicknesses Model element thickness varied between about 5 and 10 m (16 and 33 ft) in the proximity of the coal seam and was sometimes larger when modeling thick beds near the ground surface
The uniaxial compressive strength shown in Table 1 is the laboratory-scale strength which was reduced by the 058 factor from Equation to simulate the large-scale strength in the models Strength reduction owing to strain softening was achieved by reducing the rock cohesion only the friction component of the
strength was not altered The Poissons ratio was set at 025 and tensile strength set to 10 of the large-scale rock compressive strength Bedding tensile strength was set at 10 of the large-scale rock tensile strength The bedding friction angles may seem to be relatively low compared to small-scale laboratory test results However the presence of weak clayey materials especially in shale beds can have a signifcant impact on the overall shear resistance of a strata layer The presence of moisture in these clayey materials can result in excess pore pressure when the rock stress increases and in reduced apparent friction angles Field observations have shown that lateral sliding between beds can occur up to about 150
m (92 ft) ahead of a longwall face which can partly be explained by the presence of low friction glide planes within the rock (Listak et al 1987) When modeling the large-scale rock mass it is necessary to include the effect of these weak planes in the rock mass strength
Table1 Representative rock properties
Rock type
Limestone 1
Laboratory sample In situ rock material In situ bedding planes
UCS (MPa)
10
Elasticmodulus
(GPa)
0
Frictionangle (deg)
2
Cohesion (MPa)
1893
Tensile strength (MPa)
812
Dilationangle(deg)
10
Bedding friction
angle (deg)
Bedding cohesion (MPa)
Beddingtensile
strength (Mpa)
32 97 650 Limestone 2 100 35 2 1510 58 10 30 755 6 Limestone 3 80 30 0 1339 6 10 28 670 371 Sandstone 1 120 0 2 1623 696 11 30 811 557 Sandstone 2 100 0 0 1352 58 12 30 676 6 Sandstone 3 80 35 37 1208 6 13 27 60 06 Sandstone 60 35 35 906 38 1 25 53 035 Sandstone 5 0 30 30 670 232 15 20 335 023 Shale 1 80 25 32 178 6 16 10 296 06 Shale 2 60 20 30 1218 38 17 7 2 035 Shale 3 0 15 25 890 232 18 7 178 023 Shale 30 10 20 730 17 19 7 050 017 Shale 5 20 10 20 87 116 20 5 030 012 Shale 6 10 5 20 266 058 21 5 020 006 Shale 7 5 20 135 029 22 5 010 003
i ed pa el
Figure 5 Example of a numerical model used to evaluate gob and overburden response Layering represents different lithologies modeled Gob is shown in green and unmined coal in dark blue
Mined panels
Gob Properties
The subsidence profle is useful for calibrating the gob compaction characteristics The maximum subsidence over a super-critical panel (panel width exceeds 12 times the panel depth) can be used to verify the gob compaction assumptions When a panel is super-critical the full overburden weight is carried by the gob and the resulting subsidence is directly related to gob compaction characteristics The SDPS subsidence prediction software (Newman et al 2001) was initially used to create a suite of subsidence curves for various super-critical longwall geometries and geologies Final verifcation was done by modeling published feld trials and comparing the model results to actual subsidence measurements
It was found that the gob compaction characteristics depend on the type of rock material in the gob Gob that consists of the stronger rock types is less compressible than the weaker gob materials To assist in selecting the appropriate gob parameters an approach similar to that followed by the authors of the SDPS software was followed in which the gob is characterized by
the ratio of the thickness of strong to weak rocks in the overburden Weak rocks include shales and claystones that have a uniaxial compressive strength of less than about 0 MPa (5802 psi) while limestone sandstones and siltstones with strengths above 0 MPa (5802 psi) would be classifed as strong rocks Figure 6 shows the stress-strain behavior of the various gob materials used in the models The fgure shows that the laboratory-
determined curves fall within the range of curves used in the models Interestingly the strong rock gob curve derived from full-scale subsidence is almost identical to the laboratory-determined curve for sandstone materials Table 2 summarizes parameters for describing the gob curves using Equation 3 as used in the models
Table 2 Parameters for modeling various gob types using Equation 3
Overburden type
Ratio of strong weak
rocks
a parameter
(MPa)
b parameter
Weak 25 59 0 Moderate 35 86 0 Strong 50 128 0 Very strong 65 252 0
25
30
35
15
10
5
Stre
ss (M
paI
20
0 0 005 01 015 02 025 03 035 04
Strain
Figure 6 Stress-strain curves for gob materials determined through model calibration and results of laboratory tests on gob materials after Pappas and Mark (1998)
Very strong overburdenStrong overburdenModerate overburdenWeak overburdenLaboratory test sandstoneLaboratory test shale
VERIFICATION OF CALIBRATED MODELS
After completing the calibration exercises a number of the case histories that were used for calibration were re-evaluated using the fnal set of input parameters and modeling technique Three examples are presented here showing a variety of longwall mining and pillar extraction scenarios The frst example shows stress and subsidence results for a supercritical longwall panel under relatively weak overburden strata typical of the Northern Appalachian coal felds The second is a sub-critical longwall panel under strong strata found in the western United States The third compares monitoring of pillar stress adjacent to a longwall with strong overburden strata
Supercritical Longwall Panel
The frst model simulates a longwall in the Pittsburgh seam where detailed subsidence measurements have been made (Zimmerman and Fritschen 2007) The depth of cover is 180 m (591 ft) and the panel width is 350 m (118 ft) with a three-entry gate road system The chain pillars were 2-m (79 ft) wide and the mining height was 17 m (56 ft)
The chain pillars the solid abutments and the gob were modeled using the equivalent pillar approach (Esterhuizen and Mark 2009) in which model elements are prescribed to follow the stress-strain relationships of the pillars gob and abutment edges The pillars were specifed to follow the stress-strain relationships derived from numerical models using the approach described in this paper The gob was modeled as a weak material associated with 25 strong overburden using the parameters listed in Table 2 The overburden in this area consists of alternating layers of shale siltstone sandstone and limestone The limestone is typically strong and massive with poorly developed bedding planes The limestone was modeled without any weak bedding planes but vertical joints were included The extraction of the longwall was modeled by extracting the coal elements and replacing them with gob elements and allowing the overburden to settle onto the gob The model results were evaluated against the measured surface subsidence and empirical predictions of the likely extent of the abutment stress and the stress distribution in the chain pillars
The subsidence results are presented in Figure 7 which shows that excellent agreement is achieved between the vertical displacements in the model and subsidence measurements
350 450 550 650
Distance (mI
Field meaureme t
Locatio of lo g_all pa el
50
02
250
00
-02
-04
-06
Subs
iden
ce (m
I
-08
-10
-12
-14
Figure 7 Comparison of model subsidence results and feld measurements for a supercritical panel in the Pittsburgh coal bed Subsidence measurements after Zimmerman and Fritschen (2007)
7
Model results
This confrms that the gob compaction curve is realistic since the maximum subsidence agrees with observations In addition the curvature of the overburden at the edges of the subsidence trough and the location of the subsidence trough relative to the edge of the longwall panel are satisfactory This indicates that the large-scale stiffness and deformation of the overburden is modeled with suffcient accuracy
The stress distribution on the mining horizon determined from the model results and from the Marks (1987) empirical equation is shown in Figure 8 The columns showing the model results are 12-m (39-ft) wide representing the width of the elements The results show that the extent of the abutment zone extends about 72 m (236 ft) away from the edge of the gob which is the same as the value predicted by the empirical equation of Peng and Chiang (198) The empirical curve predicts the average stress on the 2-m-wide chain pillar marked A in Figure 8 to be 236 MPa (3229 psi) while the model result is 227 MPa (3292 psi) which is a satisfactory outcome The results for the second chain
pillar marked B in Figure 8 differ by a greater amount mainly because the empirical equation does not take into account the fact that this pillar is adjacent to the stiffer unmined abutment and assumes the pillar carries the full tributary loading
300
100
200
250
150
Stre
ss
Qa)
50
00
169
158
146
134
123
111
-99
-88
-76
-64
-52
-41
-29
-17 6 6 18 30 42 54 66 78 90 102
114
126
138
150
162
174
Distance from ege of panel m)
Figure 8 Comparison of empirical and numerical model derived stress distribution on the seam level for a 350 m (1150 ft) wide longwall at 180 m (600 ft) depth of cover in the Pittsburgh coal bed
Gob stress
Chain pillar B
Chain pillar A
Numerical model results
Empirical equation
Solid abutment
The results show that for this test case the developed input parameters for modeling the coal pillar overburden and gob performed very satisfactorily against the measured subsidence and expected stress distributions on the coal seam
Subsidence Over a Sub-Critical Longwall Panel
The second example shows numerical model results for a longwall in strong overburden in central Utah The subsidence was measured during the mining of a number of longwall panels (Allgaier 1988) The average depth of cover was about 50 m (176 ft) and the average mining height was 3 m (10 ft) in the Blind Canyon coal bed The subsidence related to the frst two panels panel 5E and 6E of a series of four longwall panels was selected for analysis The panel widths were 16 and 16 m (79 and 538 ft) for the 5E and 6E panels respectively The panels were separated by two rows of small chain pillars that had a width-to-height ratio of 32 and are considered to be yield pillars The general geology is described as sandstones in thick beds and sandstone interbedded with siltstone It is estimated that 5 of the overburden consists of sandstone
Subsidence monitoring revealed vertical displacements of only about 60 mm (2 in) after mining the frst panel as shown in Figure 9
000
-020
-040
-060
Measured first pa_el
Modelfirst pa_el
Measured seco_d pa_el
Modelseco_d pa_el
First pa_el seco_d pa_el
Sbs
ien
ce m
)
-080
-100
-120
-140
-160
0 100 200 300 400 500 600 700 800 900 1000 Distance (m)
Figure 9 Comparison of model subsidence results and feld measurements for two subcritical panels in a Utah coal mine Subsidence measurements after Allgaier (1988)
The panel width-to-depth ratio was 032 which is highly sub-critical therefore the subsidence probably only refected the elastic defection of the strata After mining the second panel a subsidence trough developed with a maximum subsidence of just over 10 m (33 ft) that was centered over the frst panel (see Figure 9) The location of the yield pillars between the two panels was not visible in the subsidence curve The width-to-depth ratio of the two panels and the intervening yield pillars was 075 which is still sub-critical
The two longwalls and the overburden geology were modeled by simulating the published geologic profle using the calibrated set of input parameters for the overburden and gob Sandstone strengths were set at 100 MPa (150 psi) and interbedded siltstone and sandstone materials were modeled with strengths between 60 MPa (702 psi) and 80 MPa (11603 psi) The longwall extraction was modeled in stages with the coal being removed and replaced by strong gob properties shown in Table 2 Subsidence results were obtained after mining of the frst panel and the second panel The results are also presented in Figure 9 which shows that for frst-panel mining the model results are very similar to the feld measurements The displacements are small refecting elastic displacement of the ground surface Overburden failure and shearing along bedding planes was limited to the lower half of the model with the upper rocks being undisturbed in terms of shearing or failure After mining the second panel the failure progressed up to the ground surface and the subsidence increased considerably to a maximum of 116 m (381 ft) nearly symmetrically located over the mined area The subsidence profle in the model also shows no sign of the yield pillars between the two panels similar to the measurements
The shape of the subsidence curve is satisfactory from the point of view of providing a reasonable agreement with the extent and maximum subsidence More importantly however the modeled overburden responded correctly by arching over the frst panel resulting in negligible subsidence and then subsiding to about 1 m (33 ft) when the second panel was extracted This outcome demonstrates that the overburden modeling approach is reasonable and it is able to capture the initial arching of the strata over the frst panel followed by the failure of the arch when the second panel was mined
Pillar Stress Case Study in Strong Rock
The third case study presents a comparison of numerical model results to in-mine stress measurements in strong overburden strata The stress changes cable bolt performance and entry deformations were monitored in a yield-abutment pillar system in the Hiawatha seam at the Crandall Canyon mine in Utah (Koehler et al 1996) Two longwall panels at depths of cover of 396 m to 57 m (1299 to 199 ft) were separated by a 91- (30-ft) wide yield pillar and a 366-m-wide abutment pillar The longwall panels were overlain by strong sandstone and siltstone with occasional thin shale bands
The strength of the roof strata generally fall between 69 Mpa (10008 psi) and 138 MPa (20015 psi) and several less competent zones with strengths below 50 MPa (7252 psi) were reported Monitoring results showed that the peak abutment stress of 5-50 MPa (6527-7252 psi) was located very near the edge of the abutment pillar and there was a rapid drop off over about half the abutment pillar width unlike the gradual decay one would expect from the Marks (1987) empirical equation
A numerical model was created that simulated the mining of the two panels again using the equivalent pillar approach to model the pillars adjacent to the panels The gob was modeled using the strong rock parameters in Table 2 and the overburden was modeled using the higher strength rock types in Table 1 interspersed with thin bands of weaker materials The massive Castlegate sandstone in the upper part of the geologic profle was also included in the model
Figure 10 shows the stress distribution predicted by the model and measured underground after the frst longwall had mined past the monitoring site by about 260 m (85 ft) and the pillar system was subject to side loading from the frst gob
500
450
400
350
300
250
200
150
100
50
00
Field meaureme t
Numerical model reult
-10 10 30 46 58 4 3 112 131 150 16 188 20 226 245 264 283 302 322
Dita ce from edge of pa el m
Stre
7
Figure 10 Comparison of numerical model results and feld measurements of the stress at the edge of a longwall panel in the Western United States after Koehler et al (1996)
(Mpa
)
Abutment pillar
Yield pillar
Overburden stress
It can be seen that the measurements show a peak stress of 8 MPa (6962 psi) which drops down very rapidly to less than 20 MPa (2901 psi) within the 36-m (118 ft) wide abutment pillar The model results show a similar pattern of high stress an average of 3 MPa (931 psi) in the portion of the pillar nearest the gob dropping down to 17 MPa (7252 psi) away from the gob The yield pillar in the model yielded to a greater degree than the observations This might be explained by the fact that the coal in the model was assumed to have a uniaxial compressive strength of 20 MPa (2901 psi) while laboratory tests indicated that the coal at this mine was likely to be about 30 MPa (351 psi) The model stress results for the solid abutment is similar to the measured results It is interesting to note that the model shows a long tail to the stress decay which can explain the fact that forward abutment pressures were identifed by the monitoring instruments up to 87 m (285 ft) ahead of the longwall face
This case study shows that the model parameters can also provide satisfactory results for evaluating stress changes in
longwall panels under stiff overburden Although no subsidence data was available for this case the model showed a dish shaped subsidence bowl forming over the two longwall panels and the expression of the yield-abutment pillar system was not visible on the surface which indicates that the strata were likely arching over the two panels
The outcome of the third case study was again very satisfactory showing that the input parameters and modeling approach is able to capture the stress distribution in both a weak rock scenario shown in the frst case study as well as this strong rock scenario The good agreement with measured stresses in the pillars is further verifcation that the numerical models are performing satisfactorily
CONCLUSIONS
Modeling the large-scale response of coal measure rocks due to mining can be satisfactorily achieved using well-calibrated numerical models provided the main characteristics of the coal pillars the overburden and the gob are captured in the models This paper demonstrates how the FLAC3D software was used to obtain a base set of input parameters that can be used to evaluate the stress and deformation associated with mining in a variety of geological conditions ranging from super-critical panels in weak overburden to sub-critical panels in strong rocks
The calibration process described had the objective to obtain good agreement between model results and pillar strength surface subsidence and in-seam stress distributions The models of individual pillars were calibrated against strong roof and foor case histories in which the pillar strength is governed by failure and yielding of the coal within the pillar and the strong surrounding strata had a limited impact on pillar strength Subsidence matching assisted in verifying that the large-scale rock mass parameters and the gob compaction characteristics are realistic Further calibration was carried out against stress measurements in coal pillars and in the unmined coal abutments Good agreement was achieved between model results and actual measurements which demonstrated that the interaction between the pillars and the surrounding strata was adequately captured in the models
The paper provides a basic set of input data and a modeling approach that can be used for numerical modeling investigations of various coal mine designs using the FLAC3D software package The models can be expected to provide realistic stress and deformation results but further calibration would be required to determine the relationship between model results and actual mining conditions
The model parameters presented are applicable for the FLAC3D software package The parameters will be useful as initial estimates when using other modeling techniques but each technique should be calibrated independently
DISCLAIMER
The fndings and conclusions in this paper have not been formally disseminated by the National Institute for Occupational Safety and Health and should not be construed to represent any agency determination or policy
REFERENCES
Allgaier F K (1988) Surface Subsidence Over Longwall Panels in the Western United States - Final Results at the Deer Creek Mine Utah US Bureau of Mines IC 919 17 p
Anon (2007) Fast Lagrangian Analysis of Continua in 3 Dimension (FLAC-3D V31) Itasca Consulting Group Minnesota
Atkinson R H and Ko H (1977) Strength Characteristics of US Coals Proceedings of the 18th US Symposium on Rock Mechanics Keystone CO pp 2B3-1-2B3-6
Barron K and Yang T (1992) Infuence of Specimen Size and Shape on Strength of Coal Proceedings of the Workshop in Coal Pillar Mechanics and Design US Bureau of Mines IC 9315 pp 5-2
Bieniawski ZT (1968) The Effect of Specimen Size on the Strength of Coal Int J Rock Mech Min Sci 4 325-335
Bieniawski Z T (1992) A Method Revisited Coal Pillar Strength Formula Based on Field Investigations Proceedings of the Workshop in Coal Pillar Mechanics and Design US Bureau of Mines IC 9315 pp 158-165
Board M and Damjanac B (2003) Development of a Methodology for Analysis of Instability in Room and Pillar Mines 2003 Swedish Rock Mechanics Day Conference Ed O Stephansson Stockholm Svebefo pp 1-22
Campoli A A Barton T M Van Dyke F C and Gauna M (1990) Mitigating Destructive Longwall Bumps Through Conventional Gate Entry Design US Bureau of Mines RI 9325 38 p
Chugh Y P and Pytel W M (1992) Design of Partial Extraction Coal Mine Layouts for Weak Floor Strata Conditions Proceedings of the Workshop in Coal Pillar Mechanics and Design US Bureau of Mines IC 9315 pp 32-9
Das MN (1986) Infuence of WidthHeight Ratio on Post Failure Behavior of Coal Int J Min and Geol Eng 479-97
Dolinar D (2003) Variation of Horizontal Stresses and Strains in Mines in Bedded Deposits in the Eastern and Midwestern United States Proceedings of the 22nd International Conference on Ground Control in Mining pp 178-185
Esterhuizen G S and Barczak T M (2006) Development of Ground Response Curves for Longwall Tailgate Support Design Proceedings of the 1st US Rock Mechanics Symposium Golden CO Paper 06-935
Esterhuizen G S and Mark C (2009) Three-Dimensional Modeling of Large Arrays of Pillars for Coal Mine Design Proceedings of the International Workshop on Numerical Modeling for Underground Mine Excavation Design Esterhuizen Mark Klemetti Tuchman eds NIOSH IC 9512 pp 37-6
Gadde M M (2009) Numerical Model Evaluation of Floor Bearing Capacity in Coal Mines Proceedings of the International Workshop on Numerical Modeling for Underground Mine Excavation Design NIOSH IC 9512 pp 7-5
Gadde M Rusnak J Honse J and Peng SS (2007) On Rock Failure Criteria for Coal Measure Rocks Proceedings of the 26th International Conference on Ground Control in Mining pp 361-369
Gale W J (1999) Experience of Field Measurement and Computer Simulation Methods of Pillar Design Proceedings of the Second International Workshop on Coal Pillar Mechanics and Design NIOSH IC 98 pp 9-61
Hoek E and Brown E T (1980) Underground Excavations in Rock Inst Min Metallurgy London 527 p
Hoek E and Brown E T (1997) Practical Estimates of Rock Mass Strength Int J Rock Mech amp Min Sci amp Geomech Abstr 341165-1186
Hoek E T Grabinsky M W and Diederichs M S (1990) Numerical Modelling for Underground Excavation Design Trans Inst Min Metall Section A Mining Industry 100A22-A30
Hoek E Carranza-Torres C and Corkum B (2002) Hoek-Brown Failure Criterion - 2002 Edition Proceedings of the 5th North American Rock Mechanics Symposium Toronto pp 267-273
Iannacchione A T (1990a) Behavior of a Coal Pillar Prone To Burst in the Southern Appalachian Basin of the United States Rockburst and Seismicity in Mines Balkema Rotterdam pp 295-300
Iannacchione AT (1990b) The Effects of Roof and Floor Interface Slip on Coal Pillar Behavior Rock Mechanics Contributions and Challenges A A Balkema Rotterdam pp 153-160
Koehler J Demarco M Marshall R and Fielder J (1996) Performance Evaluation of a Cable Bolted Yield-Abutment Gate Road System at the Crandall Canyon No 1 Mine Genwall Resources Inc Huntington Utah Proceedings of the 15th International Conference on Ground Control in Mining pp 77-95
Listak J M Hill J L and Zelanko J C (1987) Characterization and Measurement of Longwall Rock Mass Movement US Bureau of Mines IC 9137 26 p
Lu J Ray A Morsy K and Peng S S (2008) Effects of Coal Rock Interface Property on Coal Pillar Strength Proceedings of the 27th International Conference on Ground Control in Mining pp 262-267
Mark C (1987) Analysis of Longwall Pillar Stability PhD Thesis Pennsylvania State University 1 p
Mark C and Chase F E (1997) Analysis of Retreat Mining Pillar Stability Proceedings of the New Technology for Ground Control in Retreat Mining NIOSH IC 96 pp 17-3
Mark C and Gadde M (2008) Global Trends in Coal Mine Horizontal Stress Measurements Proceedings of the 27th International Conference on Ground Control in Mining pp 319-331
Medhurst T P and Brown E T (1988) A Study of the Mechanical Behaviour of Coal for Pillar Design Int J Rock Mech Min Sci 351087-1105
Morsy K and Peng S S (2001) Typical Complete Stress-Strain Curves of Coal Proceedings of the 20th International Conference on Ground Control in Mining pp 210-217
Newman D A and Hoelle J L (1993) The Impact of Variability in Coal Strength on Mine Planning and Design - A Case History Proceedings of the 12th International Conference on Ground Control in Mining pp 237-23
Newman D A Agioutantis Z and Karmis M (2001) SDPS for Windows An Integrated Approach to Ground Deformation Prediction Proceedings of the 20th International Conference on Ground Control in Mining pp 157-162
Oram J (1996) An Investigation Into the Behavior of Yield Pillar Multi Entry System at JWR No 7 Mine Part Unpublished Report By Rock Mechanics Technologies United Kingdom 31 p
Pappas D M and Mark C (1993) Behavior of Simulated Gob Material US Bureau of Mines RI 958
Peng S S and Chiang (198) Longwall Mining Wiley New York
Rusnak J and Mark C (2000) Using the Point Load Test To Determine the Uniaxial Compressive Strength of Coal Measure
Rock Proceedings of the 19th International Conference on Ground Control in Mining pp 362-371
Salamon M D G and Wagner H (1985) Practical Experiences in the Design of Coal Pillars Proceedings of the 21st International Conference of Safety in Mines Research Institutes Sydney Australia pp 3-10
Salamon M D G (1990) Mechanism of Caving in Longwall Coal Mining Proceedings of the 31st US Rock Mechanics Symposium Denver CO A A Balkema pp 161-168
Skiles M and Stricklin K (2009) General Guidelines for the Use of Numerical Modeling to Evaluate Ground Control Aspects of Proposed Coal Mining Plans Washington DC Mine Safety and Health Administration Program Information Bulletin No P09-03 Issue Date March 16 2009 7 p
Wang Q and Heasley K (2005) Stability Mapping System Proceedings of the 2th International Conference on Ground Control in Mining pp 23-29
Wilson A H (1972) A Hypothesis Concerning Pillar Stability The Mining Engineer 13109-17
Zimmerman K and Fritschen R (2007) Study About the Dynamic Infuence of Longwall Mining in the US on Surface Structures Proceedings of the 26th International Conference on Ground Control in Mining pp 79-8
Zipf R K (2007) Numerical Modeling Procedures for Practical Coal Mine Design Proceedings of the International Workshop on Rock Mass Classifcation in Underground Mine Design NIOSH IC 998 pp 153-162
Zoback M L and Zoback M D (1989) Tectonic Stress Field of the Continental United States Geol Soc of American Memoir 172 pp 523-539
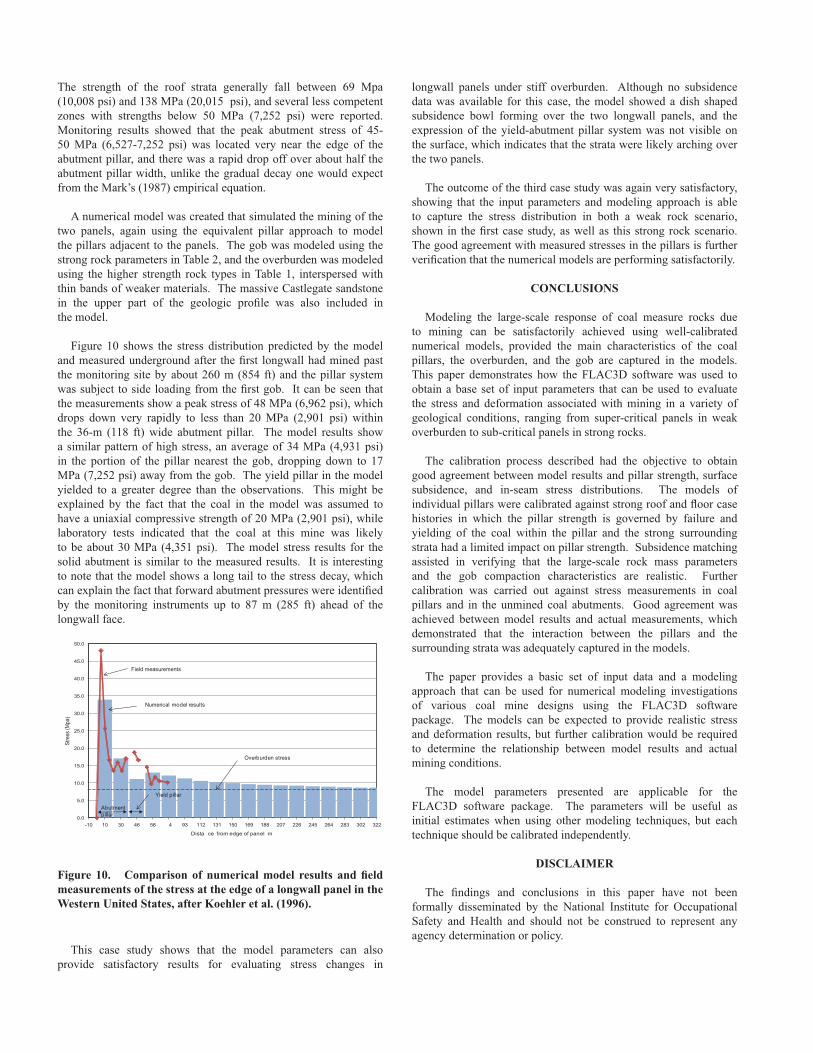