Numerical investigations of apatite 4He/3He thermochronometry
18
Article Volume 11, Number 10 6 October 2010 Q10001, doi:10.1029/2010GC003243 ISSN: 15252027 Numerical investigations of apatite 4 He/ 3 He thermochronometry K. A. Farley Division of Geological and Planetary Sciences, California Institute of Technology, MS 17025, Pasadena, California 91125, USA ( [email protected]) D. L. Shuster Berkeley Geochronology Center, 2455 Ridge Road, Berkeley, California 94709, USA E. B. Watson Department of Earth and Environmental Sciences, Rensselaer Polytechnic Institute, Troy, New York 121803590, USA K. H. Wanser Department of Physics, California State University, Fullerton, California 92831, USA G. Balco Berkeley Geochronology Center, 2455 Ridge Road, Berkeley, California 94709, USA [1] Apatite 4 He/ 3 He thermochronometry has the potential to constrain cooling histories for individual samples provided that several presently untested assumptions are valid. Here we simulate the sensitivity of 4 He/ 3 He spectra to assumptions regarding geometric model, crystallographic anisotropy, broken grain terminations, parent nuclide zonation, and the accuracy of results obtained from analyses of aggregates of multiple crystals. We find that 4 He/ 3 He spectra obtained from a cylinder with isotropic diffusion are almost indistinguishable from those obtained from an equivalent sphere with an equivalent initial 4 He dis- tribution. Under similar conditions anisotropic diffusion from the cylinder can greatly bias 4 He/ 3 He spectra, but only if diffusion is >10 times faster in the axial than the radial direction. Existing data argue against anisotropy of this magnitude. We find that analysis of apatites with broken terminations will also bias 4 He/ 3 He spectra, but not greatly so. In contrast, we find that zonation of a factor of 3 in parent nuclide concentration produces 4 He/ 3 He spectra that deviate substantially from the homogeneous model. When parent nuclides are highly concentrated near the grain rim and/or cooling is fast, the resulting 4 He/ 3 He spec- tra will be readily identified as aberrant. However, more subtle zonation, higher concentrations in the grain interior, or samples that have cooled slowly regardless of zonation style can yield 4 He/ 3 He spectra that look acceptable but will lead to inaccurate thermochronometric interpretation if parent homogeneity is assumed. Finally, we find that analysis of an aggregate of crystals with identical 4 He distributions can yield 4 He/ 3 He spectra (and diffusion Arrhenius arrays) that are very different from those that would be obtained on the individual crystals if even small variations in He diffusion exist among the grains. Overall, our observations suggest that modeling tools that assume spherical geometry and isotropic diffusion are appropriate for interpreting apatite 4 He/ 3 He spectra. However, it is essential to analyze only individual crystals and to assess the degree of parent nuclide zonation in those crystals. Components: 8600 words, 7 figures. Keywords: geochronology; He dating; 4 He/ 3 He. Copyright 2010 by the American Geophysical Union 1 of 18
Transcript of Numerical investigations of apatite 4He/3He thermochronometry

Article
Volume 11, Number 10
6 October 2010
Q10001, doi:10.1029/2010GC003243
ISSN: 1525‐2027
Numerical investigations of apatite 4He/3Hethermochronometry
K. A. FarleyDivision of Geological and Planetary Sciences, California Institute of Technology, MS 170‐25, Pasadena, California91125, USA ( [email protected])
D. L. ShusterBerkeley Geochronology Center, 2455 Ridge Road, Berkeley, California 94709, USA
E. B. WatsonDepartment of Earth and Environmental Sciences, Rensselaer Polytechnic Institute, Troy, New York 12180‐3590, USA
K. H. WanserDepartment of Physics, California State University, Fullerton, California 92831, USA
G. BalcoBerkeley Geochronology Center, 2455 Ridge Road, Berkeley, California 94709, USA
[1] Apatite 4He/3He thermochronometry has the potential to constrain cooling histories for individualsamples provided that several presently untested assumptions are valid. Here we simulate the sensitivityof 4He/3He spectra to assumptions regarding geometric model, crystallographic anisotropy, broken grainterminations, parent nuclide zonation, and the accuracy of results obtained from analyses of aggregatesof multiple crystals. We find that 4He/3He spectra obtained from a cylinder with isotropic diffusion arealmost indistinguishable from those obtained from an equivalent sphere with an equivalent initial 4He dis-tribution. Under similar conditions anisotropic diffusion from the cylinder can greatly bias 4He/3He spectra,but only if diffusion is >10 times faster in the axial than the radial direction. Existing data argue againstanisotropy of this magnitude. We find that analysis of apatites with broken terminations will also bias4He/3He spectra, but not greatly so. In contrast, we find that zonation of a factor of 3 in parent nuclideconcentration produces 4He/3He spectra that deviate substantially from the homogeneous model. Whenparent nuclides are highly concentrated near the grain rim and/or cooling is fast, the resulting 4He/3He spec-tra will be readily identified as aberrant. However, more subtle zonation, higher concentrations in the graininterior, or samples that have cooled slowly regardless of zonation style can yield 4He/3He spectra that lookacceptable but will lead to inaccurate thermochronometric interpretation if parent homogeneity is assumed.Finally, we find that analysis of an aggregate of crystals with identical 4He distributions can yield 4He/3Hespectra (and diffusion Arrhenius arrays) that are very different from those that would be obtained on theindividual crystals if even small variations in He diffusion exist among the grains. Overall, our observationssuggest that modeling tools that assume spherical geometry and isotropic diffusion are appropriate forinterpreting apatite 4He/3He spectra. However, it is essential to analyze only individual crystals and toassess the degree of parent nuclide zonation in those crystals.
Components: 8600 words, 7 figures.
Keywords: geochronology; He dating; 4He/3He.
Copyright 2010 by the American Geophysical Union 1 of 18

Index Terms: 1140 Geochronology: Thermochronology; 1115 Geochronology: Radioisotope geochronology.
Received 27 May 2010; Revised 2 August 2010; Accepted 18 August 2010; Published 6 October 2010.
Farley, K. A., D. L. Shuster, E. B. Watson, K. H. Wanser, and G. Balco (2010), Numerical investigations of apatite 4He/3Hethermochronometry, Geochem. Geophys. Geosyst., 11, Q10001, doi:10.1029/2010GC003243.
1. Introduction
[2] Over the last decade both the mechanistic un-derpinnings and the applications of apatite (U‐Th)/He dating have expanded greatly. The method isbased on the ingrowth of 4He from a decay of Uand Th series nuclides and 147Sm, which are typi-cally found at ppm levels in apatite and commonlyassumed to have a uniform spatial distribution.Laboratory diffusion experiments indicate a Heclosure temperature of about 60–70°C for typicalapatites [Farley, 2000; Wolf et al., 1996a], increas-ing with the abundance of radiation damage in theapatite [Shuster et al., 2006]. A central premise ofthe method is that the observed 4He concentrationarises from the competing effects of radiogenicingrowth and diffusive loss integrated over the time‐temperature history of the sample. Thus coolingpaths can be constrained by a crystal’s (U‐Th)/Heage [Wolf et al., 1998].
[3] In most circumstances the resulting coolingpaths are nonunique. For example, a volcanicapatite would yield a (U‐Th)/He age of 2 Ma if itwas erupted at that time and never experienced Hediffusion. An identical age would be obtained onan intrusive apatite residing at ∼70°C for 100 Ma,during which production and diffusion achieve asteady state [Wolf et al., 1998]. In most geologicapplications of low‐temperature thermochronometrythe problem of nonuniqueness is overcome by usingage‐elevation relationships [Fitzgerald et al., 1995;Wagner and Reimer, 1972; Wolf et al., 1996b] thatprovide information on relative cooling histories ofsamples that are spatially related to one another. Inthis case the quantity usually being constrained isthe exhumation rate of a package of rocks throughisotherms rather than the cooling path of any onerock.
[4] An additional constraint on the permissiblecooling paths of a single sample lies in the shape(rather than just the integral) of the 4He concen-tration distribution (Figure 1a). Returning to theexample described above, the 4He concentration inthe volcanic grain would be uniform except for the
effects of a ejection [Farley et al., 1996], while theintrusive grain at steady state would have anextremely rounded profile (Figure 1a). Numericalmodeling confirms that the 4He concentration pro-file is a very rich source of information on an apa-tite’s cooling history [Shuster and Farley, 2004].
[5] At present there are no microbeam or laser‐based techniques with adequate spatial resolutionand sensitivity to measure this profile in apatite,although some success has now been achieved withlarger spot sizes [Boyce and Hodges, 2005]. As analternative, Shuster et al. [2004] proposed anindirect approach referred to as 4He/3He thermo-chronometry. Irradiation with ∼200 MeV protonscreates a uniform distribution of 3He within acrystal without disturbing the 4He distribution. Theirradiated sample is then thermally degassed in aseries of steps in which the evolved He is mea-sured. The result is a 4He/3He spectrum, i.e., a plotof the 4He/3He ratio of each step (normalized to the4He/3He ratio of the bulk sample) plotted as afunction of the cumulative fraction of 3He releasedup to and including that step (SF3He).
[6] The 4He/3He spectrum can either be formallyinverted for the 4He profile, or more commonly,the spectrum can be compared with spectra for-ward modeled for specific time‐temperature pathsusing a He diffusion kinetic model [Shuster andFarley, 2005]. The 4He/3He method is sensitiveacross the entire temperature range from ∼30°C to∼90°C. Recent efforts have applied 4He/3He ther-mochronometry to constrain the timing and rates ofglacial erosion [Shuster et al., 2005], fluvial ero-sion [Schildgen et al., 2010], and normal faulting[Colgan et al., 2008].
[7] Over the last several years we have workedto improve and simplify the 4He/3He analyticalmethod, and have analyzed a fairly large numberof apatites. While many samples, such as thosedescribed above, yield sensible 4He/3He spectra,others do not. In this work we identify several fac-tors that can (and several that cannot) be responsiblefor the anomalous spectra. The results obtained aredirectly relevant for understanding 4He/3He spectra,
GeochemistryGeophysicsGeosystems G3G3 FARLEY ET AL.: APATITE 4He/3He THERMOCHRONOMETRY 10.1029/2010GC003243
2 of 18

Figure 1. Limiting 4He/3He spectra and examples. (a) Spectra for the two limiting cases of a ejection‐only andproduction‐diffusion‐a ejection steady state evolved from (b) the limiting concentration profiles (C, normalizedconcentration; R, normalized radial coordinate). All 4He/3He spectra that conform to assumptions (see section 1for details) must lie within uncertainty of the shaded region and not in the regions labeled “forbidden.” Alsoshown in Figure 1a are two spectra that plot within error of the allowed region. (c) Two obviously anomalousmeasured 4He/3He spectra (sample and data details in Data Set S1). These spectra were measured on multiple grainaliquots. Note that measured spectra are plotted as a series of steps reflecting the amount of gas released in each step,whereas the model curves here are continuous curves that would apply to very small steps. For clarity the uncertaintieson measured data are not shown, but a typical 1 s uncertainty estimate is indicated in Figure 1c.
GeochemistryGeophysicsGeosystems G3G3 FARLEY ET AL.: APATITE 4He/3He THERMOCHRONOMETRY 10.1029/2010GC003243
3 of 18

and more broadly, are useful for evaluating some ofthe basic assumptions underlying apatite (U‐Th)/Hedating.
[8] 4He/3He spectra that conform to the assump-tions of a uniform distribution of parent nuclidesand 4He production‐diffusion in a sphere must plotwithin tight bounds (Figure 1a [Shuster and Farley,2004]). One bound is defined by a sample that hasexperienced no diffusion whatsoever. If the decayenergies were very small, this would simply be aline plotting at a 4He/3He ratio of unity across thefull range of SF3He. In reality a particles producedin apatite have a range of about 20 mm; this causesa fraction of the a particles produced within 20 mmof the edge of the grain to be ejected [Farley et al.,1996]. The diffusion domain in apatite is theentire crystal [Farley, 2000], so this clipped profileis the production function subjected to diffusion(Figure 1b). Thus the “a ejection‐only” profileyields one limit to the 4He/3He spectrum producedin an apatite, i.e., one that has experienced no dif-fusional modification of the 4He distribution. Theother bound is dictated by the steady state conditionthat 4He production and diffusion are preciselybalanced. This yields a highly rounded diffusionprofile that is independent of diffusivity. (Forpresent purposes we ignore the case of recent“flash” heating, which could produce profiles evenmore rounded than that arising from steady stateproduction‐diffusion). Figure 1a illustrates thesebounds for an apatite with a radius of 75 mm andincludes the effects of a ejection.
[9] The key point here is that 4He in an apatiteaccurately described by a spherical diffusion model,with a uniform distribution of parent nuclides andarising solely from production and diffusion, musthave a 4He/3He spectrum plotting between thesetwo bounds. An additional expectation arising fromthese assumptions is that 4He/3He spectra shouldvary smoothly and should increase monotonicallywith SF3He.
[10] Figure 1a shows examples of two previouslyunpublished 4He/3He spectra that obey these ex-pectations: one that lies very close to the a ejec-tion‐only limit, and another that has apparentlyexperienced more diffusive loss. In contrast tothese acceptable profiles, Figure 1c shows previ-ously unpublished 4He/3He spectra for two samplesthat plot in the forbidden region: one with a“hump” at low SF3He, and the other with a strongdeviation to low ratios at high SF3He. The goal ofthis paper is to identify what might cause theseunanticipated spectra. Factors that we will considerare sensitivity to the assumed geometric model
(sphere, cylinder), possible diffusional anisotropy inapatite, analysis of recently broken crystals, analysisof aliquots of multiple crystals among which Hediffusivity varies, and U‐Th‐Sm zonation.
2. General MathematicalApproximations
[11] In the scenarios considered below we simulate4He/3He spectra under various assumptions. Forthese simulations we use approximations for thesolution to the diffusion equation for the sphere andfor the finite cylinder. For the cylinder, we adoptthe analytical approximations given by Watsonet al. [2010]. While in most cases we considerisotropic diffusion, in several instances we requirethe more general formulae for anisotropic diffusion.The cylinder has height h and radius a, with radialdiffusion coefficient D11 and axial diffusion coef-ficient D33. We use the dimensionless releasecoordinates:
y1 tð Þ ¼Z t
0
D11 t0ð Þa2
dt0 y3 tð Þ ¼Z t
0
D33 t0ð Þh2
dt0
where the subscripts on y refer to the radial (1) oraxial (3) dimension, t is the interval over whichdiffusion has occurred and t′ is the integrationvariable. From Watson et al. [2010], the fraction Fof helium released from the anisotropic cylinderstarting with an initially uniform concentration is:
F y1; y3ð Þ ¼ F1 y1ð Þ þ F3 y3ð Þ % F1 y1ð ÞF3 y3ð Þ
where F1 and F3 are equivalent to the fractionallosses for the infinite cylinder and infinite slab,respectively, and are approximated by:
F1 ffi 4
ffiffiffiffiffiy1!
r% y1 %
y3=21
3ffiffiffi!
p % 0:244122y21valid for F1 < 0:78
F1 ffi 1% 4"21e%"2
1y1
valid for F1 ' 0:78
where a1 = 2.404826.
F3 ffi 4
ffiffiffiffiffiy3!
r
valid for F3 < 0:52
F3 ffi 1% 8!2
e%!2y3
valid for F3 ' 0:52
GeochemistryGeophysicsGeosystems G3G3 FARLEY ET AL.: APATITE 4He/3He THERMOCHRONOMETRY 10.1029/2010GC003243
4 of 18

In the case of the sphere of radius r, we use theapproximations for fractional release F given byFechtig and Kalbitzer [1966]:
F ffi 6ffiffiffi!
p ffiffiffiy
p % 3y
valid for F < 0:85
F ffi 1% 6!2 e
%!2y
valid for F ' 0:85
Where the release coordinate y for the sphere isgiven by:
y tð Þ ¼Z t
0
D t 0ð Þr2
dt 0
These equations allow computation of the frac-tional loss of diffusant from a sphere or cylindersubjected to a diffusion interval characterized byrelease coordinate y (for the sphere) or y1, y3 (forthe anisotropic cylinder). These equations alsoapply to a simulated step heating experiment, inwhich there are a series of such intervals whichprogressively degas the sample. By subtracting thecumulative yield obtained in heating step i − 1from the cumulative yield obtained in heating step i,we can compute the fractional yield Fi associatedwith degassing step i. Note here that subscript irefers to step number and should not be confusedwiththe direction−related release fractions F1 and F3.
[12] To generate the synthetic 4He/3He spectrumthat would be obtained from a step heat experi-ment, we first compute the table of Fi valuesstarting with a uniform initial distribution.We use anarbitrary “step heating schedule” (in reality, a seriesof monotonically increasing release coordinates)that insures an appropriate distribution of fractionalyield values up to near‐total degassing (>99%).This simulates the release of the uniformly dis-tributed 3He.
[13] To simulate the initially diffusionally modified4He distribution, we simply add an additional stepprior to the schedule used for 3He. The releasecoordinate for this “zeroth” step is chosen so as toproduce a specified fractional yield Fo. We refer tothis as “prior degassing.” The table of Fi values forthe remainder of the schedule is computed usingthe same approximations as for 3He. However,because there was prior degassing, we need toadjust the fractional yield data accordingly, i.e., ifwe are simulating 10% prior degassing, then thetotal yield in the simulation is 0.9 rather than unity,so we scale each computed yield upward by afactor 1/(1 − Fo). Note that the result of this
approach is a purely diffusive 4He profile, ratherthan one arising from production and diffusion.The two helium isotopes are assumed to haveidentical diffusivity [Shuster et al., 2004].
[14] We also employ a modified version of theprogram Cylmod described byWatson et al. [2010].This program (CylmodE) provides a numericalsolution to anisotropic diffusion from a finite cyl-inder starting with an a ejection distribution, aninitial condition which currently available analyticalsolutions cannot accommodate. This distribution isapproximated by a linear decrease in concentrationfrom unity at depths >20 mm from the nearest edge,to a value of 0.45 on the grain surface. For nodesthat lie within 20 mm of both radial and axial sur-faces, the computation uses the distance to thenearest edge.
[15] Last, we use a numerical He production‐diffusion model [Schildgen et al., 2010] to compute4He/3He spectra arising from grains with a spatiallyheterogeneous (but only radially varying) distribu-tion of parent nuclides, here referred to as zoned ineffective U (eU). This model generates the 4Heproduction profile from an assumed eU distributionin a spherical domain including a ejection, thencalculates the 4He/3He spectrum arising from thatdistribution using a finite difference solution to thespherical diffusion equation.
[16] For all of these approaches we obtain a4He/3He spectrum with a finite number of discretesteps rather than a continuum of points. In this sensethe models mimic a 4He/3He spectrum obtained inthe laboratory. For both laboratory and modelspectra we thus use step plots rather than smoothlines connecting individual points.
3. Results
3.1. Sensitivity to Geometric Model[17] Typical apatite grains are hexagonal prismswith a length/radius ratio of about 6 [e.g., Farley etal., 1996]. Under most circumstances in (U‐Th)/Hethermochronometry a sphere is thought to provide asufficiently accurate geometric model for bulkdiffusion calculations from the hexagonal prism,provided the radius of the model sphere has thesame surface to volume ratio as the analyzed prism[Gautheron and Tassan‐Got, 2010; Meesters andDunai, 2002; Watson et al., 2010]. Current com-puter codes [Ketcham, 2005; Schildgen et al., 2010]assume that this “equivalent sphere” remains anadequate geometric model for computation of
GeochemistryGeophysicsGeosystems G3G3 FARLEY ET AL.: APATITE 4He/3He THERMOCHRONOMETRY 10.1029/2010GC003243
5 of 18

4He/3He spectra as well. However, it is not obviousthat this assumption is valid.
[18] To investigate this question we computedmodel 4He/3He spectra for different geometries. Inthe absence of analytical solutions for diffusionfrom a hexagonal prism, we approximate the prismas a cylinder with isotropic diffusion, and withh/a = 6. In one set of simulations we assume varyingdegrees of prior loss (1%, 5%, 10%, and 50%) froman initially uniform profile from the sphere andfrom the cylinder using the analytical approxima-tions described previously. We also comparespectra for a cylinder and its equivalent sphere thathave experienced only a ejection; in this case weuse CylmodE for the cylinder. Unlike the previousexamples of pure diffusion profiles, this exampleimposes a true physical dimension, the a ejectionlength scale of ∼20 mm, on the problem. So here wespecify a cylindrical geometry measuring 55 by330 mm (equivalent sphere radius of 76 mm).
[19] Full details of these simulations are listed inData Set S2.1 Figure 2a shows results for the purediffusion profiles. Regardless of the degree of priorrelease, 1% to 50%, the 4He/3He spectra for the twogeometric models are in nearly perfect agreement.This applies throughout the entire range of SF3He.Figure 2b shows the result for the a ejection‐onlyinitial profile. In this case the spectra are veryslightly offset from each other, but the effect isremarkably small.
[20] Since actual 4He concentration profiles inapatites will lie between the a ejection‐only profileand a purely diffused profile, we conclude thatthese results confirm that the equivalent spheregeometry provides an accurate approximation ofthe 4He/3He spectrum produced from a cylinder.Given the geometric similarity between a cylinderand a hexagonal prism [Meesters and Dunai, 2002;Watson et al., 2010], we further conclude that asphere provides an adequate geometry for modelingof 4He/3He spectra evolved from natural apatites. Thegeneral validity of the equivalent sphere approachhas recently been reinforced by Gautheron andTassan‐Got [2010].
3.2. Anisotropy[21] Use of a spherical geometric model for theinterpretation of 4He/3He spectra implicitly as-sumes that He diffusion is crystallographicallyisotropic. Anisotropic diffusion of He has been
observed or predicted in zircon [Cherniak et al.,2009; Reich et al., 2007; Saadoune et al., 2009]and zircon structure orthophosphates [Farley,2007]. In the case of apatite, neither bulk degas-sing of crystallographically oriented slabs nor pro-filing of implanted helium [Cherniak et al., 2009;Farley, 2000] indicate substantial anisotropy.While this previous work did not set a limit on thepossible magnitude of anisotropy, it is probablyless than a factor of a few in the temperaturerange 200–450°C.
[22] To assess how a 4He/3He spectrum would beaffected by anisotropic diffusion, we used theCylmodE code to produce spectra for a finite cyl-inder characterized by an a ejection‐only initial4He profile and dimensions as in section 3.1. Weassumed that anisotropy arises only from variationsin diffusivity at infinite temperature (Do), with nodistinction in activation energy (Ea), i.e., the ratioof diffusivities along the two axes is a constant withtemperature that we vary in our experiments. Whilethese are restrictive assumptions, modeling of sce-narios involving variations in activation energy,and/or 4He profiles arising from such variationsbecome extremely dependent on parameter choicesand assumed time‐temperature path and heatingschedule. Our choice of assumption is sufficient toestablish conditions under which diffusion anisot-ropy will noticeably influence 4He/3He spectra.
[23] Computational details and results are given inData Set S3. Results for the limiting cases of pureradial diffusion and pure axial diffusion are com-pared with the isotropic case in Figure 3a. Pureradial diffusion yields a profile that is nearlyindistinguishable from the isotropic case. Thissimilarity arises from the fact that in the isotropiccase ∼90% of the helium exits through the cylindersidewall anyway (CylmodE reports cumulative Heloss in each crystallographic direction [Watsonet al., 2010]). This 90% is roughly in proportionto the relative surface area of the sidewalls versus theendcaps of the cylinder. Thus eliminating the ∼10%exiting the axial faces by adopting pure radial dif-fusion has almost no impact on the final result.
[24] However the reverse is not true. The 4He/3Hespectrum for pure axial diffusion rises much moresharply and flattens earlier than the isotropic orpure radial case. This behavior arises from the factthat the ejection region penetrates just 20 mm into ah/2 = 165 mm deep axial profile, or 12% of theentire profile length; in the radial case it penetrates20 mm into a r = 55 mm profile, or 36% of thelength of the profile. Figure 3b shows 4He/3He
1Auxiliary materials are available at ftp://ftp.agu.org/apend/gc/2010gc003243.
GeochemistryGeophysicsGeosystems G3G3 FARLEY ET AL.: APATITE 4He/3He THERMOCHRONOMETRY 10.1029/2010GC003243
6 of 18

spectra for axial/radial diffusivity ratios of 10and 50. These spectra indicate that 10‐fold higherdiffusivity in the axial direction would probably gounnoticed, but 50‐fold would certainly be detected.We believe that existing diffusion coefficientmeasurements rule out even 10‐fold axially favored
diffusivity in apatite. Furthermore, we note that thecommon occurrence of measured 4He/3He spectrathat lie on the “a ejection‐only” boundary for iso-tropic diffusion from a sphere (e.g., the “KingsRiver A” sample in Figure 1a as well as severalpublished spectra [Shuster et al., 2005] would be
Figure 2. Comparison of spectra obtained from the spherical model with those obtained from the isotropic cylindermodel assuming the same initial condition. (a) Results assuming diffusion‐only profiles with prior loss of the mag-nitude indicated by the label beside each curve. (b) Results for a ejection‐only profiles. In both cases the cylindricaland spherical models yield nearly identical spectra, validating the use of the spherical geometry when modeling4He/3He spectra from apatite.
GeochemistryGeophysicsGeosystems G3G3 FARLEY ET AL.: APATITE 4He/3He THERMOCHRONOMETRY 10.1029/2010GC003243
7 of 18
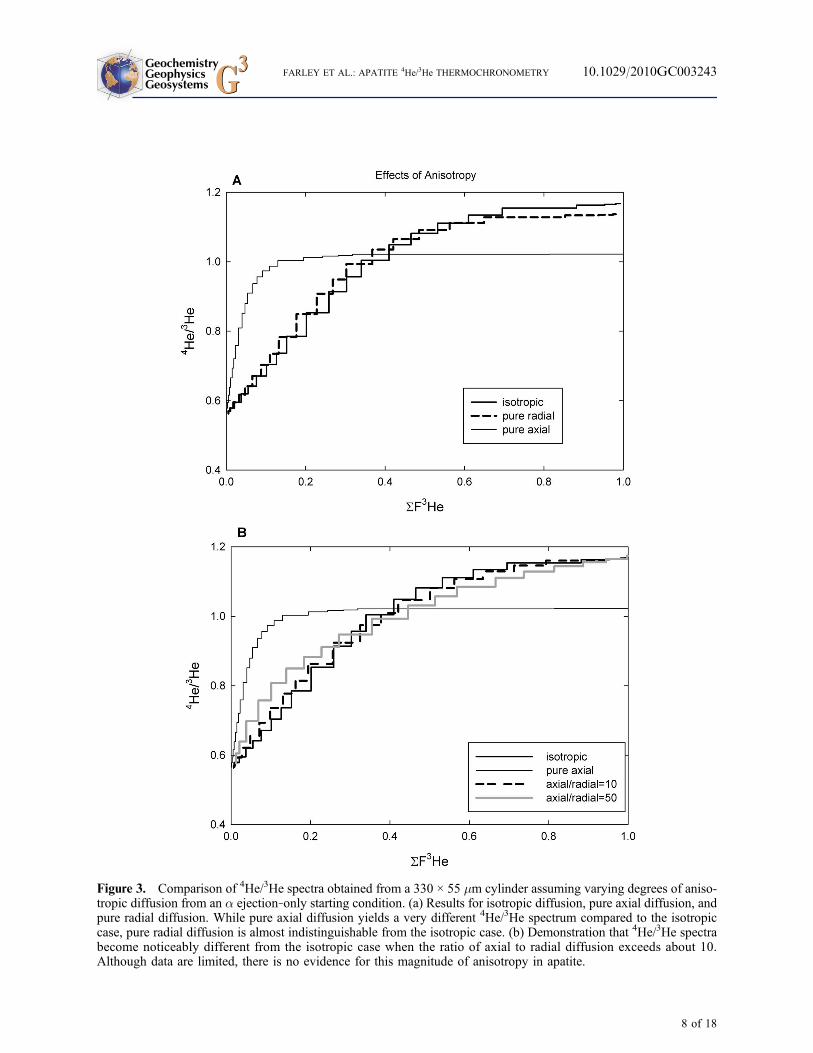
Figure 3. Comparison of 4He/3He spectra obtained from a 330 × 55 mm cylinder assuming varying degrees of aniso-tropic diffusion from an a ejection‐only starting condition. (a) Results for isotropic diffusion, pure axial diffusion, andpure radial diffusion. While pure axial diffusion yields a very different 4He/3He spectrum compared to the isotropiccase, pure radial diffusion is almost indistinguishable from the isotropic case. (b) Demonstration that 4He/3He spectrabecome noticeably different from the isotropic case when the ratio of axial to radial diffusion exceeds about 10.Although data are limited, there is no evidence for this magnitude of anisotropy in apatite.
GeochemistryGeophysicsGeosystems G3G3 FARLEY ET AL.: APATITE 4He/3He THERMOCHRONOMETRY 10.1029/2010GC003243
8 of 18

fortuitous if diffusion in apatite is much faster in theaxial compared to the radial direction. Thus weconclude that anisotropy is not likely important ingenerating anomalous apatite 4He/3He spectra.However, this may be an important considerationwere one to apply the 4He/3He method to zircon.
3.3. Effect of Broken Terminations[25] In some rock samples it is easy to find wholeeuhedral apatite crystals readily distinguished bythe presence of pointed or rounded terminations onboth ends of the prism. In other rocks most or all ofthe crystals lack one or both of these terminations,and instead have a flat termination perpendicular tothe long axis. It is usually impossible to establishwhether these missing terminations represent theoriginal growth morphology within the rock, or ifinstead the grain terminations were broken off,possibly during the mineral separation process. Theimportance for 4He/3He thermochronometry is thata grain broken after the natural development of adiffusion profile will have a fraction of its surfacecharacterized by an anomalously “square” concen-tration profile (higher concentration at the edge).Intuition suggests that the result will be a 4He/3Hespectrum that begins at values higher than anunbroken grain would yield, and that the magnitudeof this discrepancy increases with the degree ofrounding of the natural 4He profile.
[26] To quantify this effect, we can model the4He/3He spectrum of a crystal with broken termi-nations and compare it to an unbroken equivalentin the following manner. We wish to investigate themost extreme effect of breakage, which occurswhen the break is located in the uniform concen-tration interior of the grain. This gives the “broken”surface the maximum possible concentration con-trast with the natural surfaces.
[27] To develop this initial condition for a purediffusion profile (no a ejection) we can use theapproximations for diffusion from an anisotropiccylinder. We again assume h/a = 6. In the priorrelease step, we set the axial diffusion coefficient tozero and pick a release coordinate that causes 10%loss. This creates a starting condition for the sim-ulated step heat experiment in which both ends ofthe prism are characterized by a square concentra-tion profile for 4He, while the radial edges havevery low concentrations. For the simulated step-wise degassing, the diffusivity is assumed isotro-pic. For the unbroken (reference) case, we repeatthe same prior loss simulation in terms of radialrelease coordinate, but with isotropic diffusion.Because the radial and axial components of the
diffusive loss interact very little at this degree ofdegassing (see Watson et al. [2010] for a discus-sion), we wind up with a nearly identical radialconcentration profile and an appropriately roundedaxial profile. We then apply the same simulatedstepwise degassing schedule. For both the brokenand unbroken cases, 3He diffusivity is assumedisotropic, and no prior release step is used.
[28] Details of this simulation are listed in Data SetS4 and the resulting 4He/3He spectra are shown inFigure 4a. As expected, 4He/3He spectra evolvedfrom grains with broken terminations start out withanomalously high 4He/3He ratios, about 0.17 ver-sus values of nearly zero expected in the first stepof an unbroken crystal. This initial value is aboutwhat one would predict based on surface areaalone: the h/a = 6 cylinder has 14% of its surfacearea in the endcaps, so in the limit of the very first4He released we expect a mixture of 14% heliumwith concentration unity from the endcaps and 86%with concentration zero from the cylinder side-walls. The slightly higher value actually obtainedfrom the broken grains reflects the fact that the firststep in this example interrogates a finite depth,rather than solely the crystal surface.
[29] Indeed a comparison of the model spectra withone obtained by simply assuming a linear combi-nation consisting of 86% of the 4He/3He ratio of theunbroken crystal with 14% of a 4He/3He ratio ofunity matches the entire spectrum remarkablywell, as illustrated for the 25% prior release case(Figure 4b). This demonstrates the relative insig-nificance of diffusion out the ends of the prism.We can take advantage of this similarity to esti-mate the consequences of breakage for an a ejec-tion‐only profile. Figure 4a shows the results of86% of the cylindrical a ejection‐only profile and14% 4He/3He = 1.
[30] The effects shown in Figure 4 assume that bothends of the prism are broken. In our experience thisis far less common than a single (possibly) bro-ken termination. Thus a more likely case to beencountered is analysis of a crystal with a singlebroken termination. Such a crystal would yield a4He/3He spectrum that plots halfway between thetwo curves in Figure 4a. While there is certainlyan effect arising from analyses of a grain with abroken termination, it is relatively small. Themaximum effect occurs in highly rounded profiles.While it is desirable to avoid grains with brokenends, it may be possible to use such grains withoutintroducing large errors.
GeochemistryGeophysicsGeosystems G3G3 FARLEY ET AL.: APATITE 4He/3He THERMOCHRONOMETRY 10.1029/2010GC003243
9 of 18
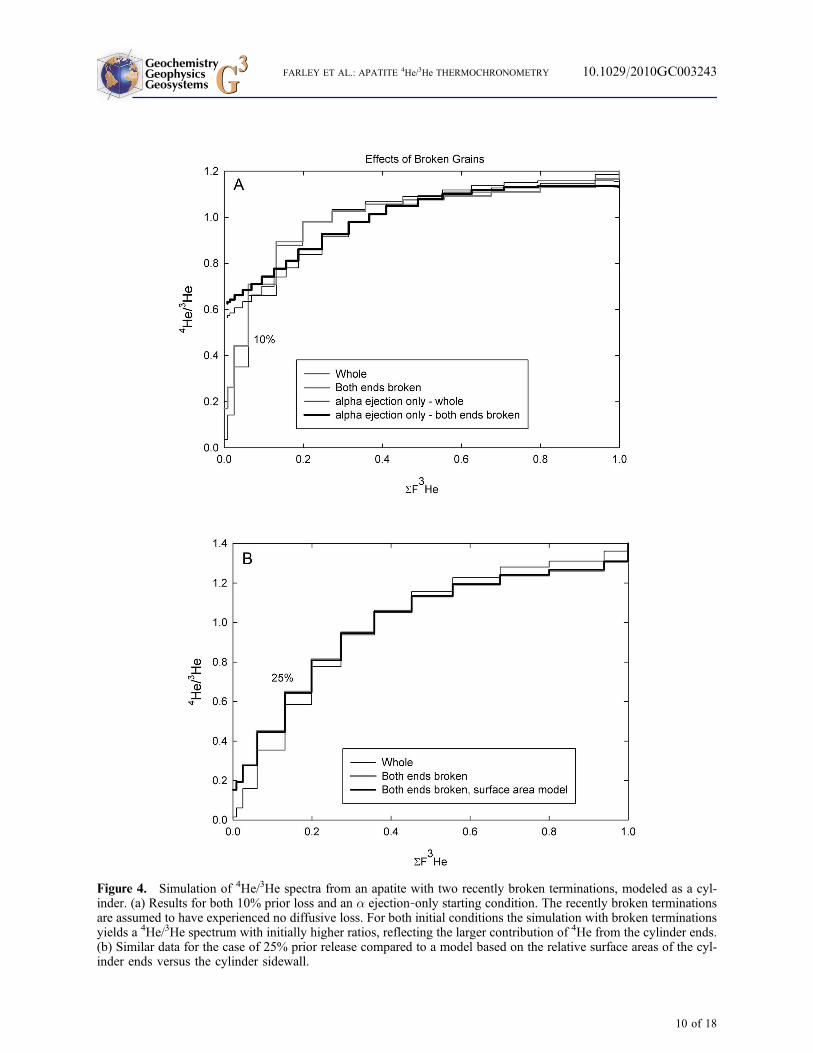
Figure 4. Simulation of 4He/3He spectra from an apatite with two recently broken terminations, modeled as a cyl-inder. (a) Results for both 10% prior loss and an a ejection‐only starting condition. The recently broken terminationsare assumed to have experienced no diffusive loss. For both initial conditions the simulation with broken terminationsyields a 4He/3He spectrum with initially higher ratios, reflecting the larger contribution of 4He from the cylinder ends.(b) Similar data for the case of 25% prior release compared to a model based on the relative surface areas of the cyl-inder ends versus the cylinder sidewall.
GeochemistryGeophysicsGeosystems G3G3 FARLEY ET AL.: APATITE 4He/3He THERMOCHRONOMETRY 10.1029/2010GC003243
10 of 18

3.4. Effects of Zonation[31] Spatial heterogeneity in parent nuclide distri-bution within an apatite crystal has consequencesfor bulk (U‐Th)/He ages both because it compro-mises the a ejection correction [Farley et al., 1996;Hourigan et al., 2005] and also modifies the 4Heconcentration distribution on which diffusion acts[Farley, 2000; Meesters and Dunai, 2002]. Parentheterogeneity must also impact 4He/3He spectra[Shuster and Farley, 2004], but in a way that hasnot yet been quantitatively described. One chal-lenge for assessing the consequences of heteroge-neity is that its frequency and magnitude in apatiteshave not been well documented. Induced fissiontrack maps can provide an indication of U hetero-geneity in some apatites, but this method has lim-ited spatial resolution and does not document Th(or Sm) heterogeneity. U and Th concentrations inapatite are almost always too low to measure byelectron probe, leaving only SIMS or LA‐ICPMSmeasurements as adequate for the task. To ourknowledge such data are not yet available in theliterature. As an alternative, more easily measuredrare earth elements (e.g., Ce) or cathodolumines-cence intensity may suffice as a proxy for eU vari-ability [Dobson et al., 2008; Jolivet et al., 2003].Limited data [Jolivet et al., 2003; K. A. Farley,unpublished data, 2010] suggest that variability ineU of a factor of a few may occur in some apatites.An additional factor to recognize is that the distri-bution of eU is not the same as the initial distributionof 4He, owing to the 20 mm stopping distance ofthe a particle.
[32] The most extreme consequences of eU het-erogeneity on 4He/3He spectra will occur for pro-files which are least modified by diffusion, becausediffusion will act to smoothen the production het-erogeneity. Intuition also suggests that concentriczonation will yield more dramatic consequencesthan patchy heterogeneity or sector zoning that getsscrambled together during the He extraction pro-cess. In addition the consequences will be greaterwhen the physical dimensions of the zones arelarge relative to the a ejection length scale (forexample, oscillatory zoning of a few mm wave-length will be totally smoothed by a particleredistribution [Hourigan et al., 2005]). Note thatthe choice of concentric zoning, although perhapsunrealistic, is required by our radially symmetricdiffusion model. The recent model of Gautheronand Tassan‐Got [2010] could be used to relax thisassumption.
[33] Given these considerations we arbitrarily choseto model an apatite with r = 75 mm and a factor of3 zonation in eU. The zone boundary was locatedat 60 mm from the grain center (Figure 5a), whichrepresents the midpoint by volume (i.e., half ofthe spherical volume occurs within this radius). Thissource function was then converted to an a particleproduction function by assuming a 20 mm stoppingdistance and no diffusion (Figure 5b); this profilewas the starting condition for calculating the4He/3He spectrum. We explicitly assume that thegrain is homogeneous in He diffusivity: local radi-ation damage accumulations in the eU‐rich zonesdo not modify diffusivity. Quantitative details areprovided in Data Set S5.
[34] As shown in Figure 5c, the 4He/3He spectra forthe zoned apatites are quite different from theunzoned spectrum. When the higher concentrationis located toward the rim, the spectrum clearlyviolates the expected behavior for a uniform eUdistribution: the initial part of the spectrum plotswell in the upper forbidden zone, and the spectrumdecreases at high SF3He. When the higher con-centrations are located in the core of the grain, thespectrum is substantially steeper than the uniformeU case, but does not cross into the forbiddenzone. Thus this sense of zonation would not beidentified as aberrant. In this case inversion of the4He/3He spectrum for a temperature history wouldyield a result indicating slower cooling thanactually pertained.
[35] Figure 5c also shows results for these samezonation patterns but assuming the initial conditionat the start of the 4He/3He experiment arose from aproduction‐diffusion profile evolved during cool-ing at a rate of 1°C/Ma and using Durango apatitediffusion kinetics [Farley, 2000]. In this case dif-fusion tends to lessen the consequences of parentnuclide zonation. Nevertheless these spectra wouldyield erroneous constraints on cooling history ifinterpreted assuming a homogeneous parent dis-tribution. Comparison of these results with thespectrum of aberrant sample Grand Canyon B inFigure 1c suggests this sample may have a high eUrim, a fact confirmed by LA‐ICPMS measurements(K. A. Farley, unpublished data, 2010).
[36] These models indicate that eU zonation at thelevel likely present in some apatites can produceboth clearly aberrant spectra (plotting in the for-bidden zone, and with nonmonotonically increas-ing 4He/3He evolution) as well as spectra that looknormal. This observation confirms that zonation isa potentially serious source of error in 4He/3He
GeochemistryGeophysicsGeosystems G3G3 FARLEY ET AL.: APATITE 4He/3He THERMOCHRONOMETRY 10.1029/2010GC003243
11 of 18

Figure 5. Simulation of 4He/3He spectra for 75 mm radius spherical grains concentrically zoned in eU. (a) The twodifferent eU zonation patterns assumed (factor of 3 contrast and factor of 1/3 contrast between rim and core). (b) Theresulting distribution of 4He within these grains following a redistribution and ejection but assuming no diffusive loss(fine solid line is the no zonation reference case). (c) The 4He/3He spectra for the two zonation styles compared to theallowed region shown in Figure 1. Two cooling scenarios are illustrated, one assuming no diffusion (a ejection only)and the other starting with a 4He distribution created by a constant cooling rate of 1°C/Ma (see section 3.4 for details).The grain with the enriched rim plots in the forbidden region regardless of cooling scenario. In contrast the grain withthe enriched core yields an acceptable spectrum in both cooling scenarios.
GeochemistryGeophysicsGeosystems G3G3 FARLEY ET AL.: APATITE 4He/3He THERMOCHRONOMETRY 10.1029/2010GC003243
12 of 18

thermochronometry and suggests that further inves-tigation of zonation ofU andTh in apatites, especiallythose subjected to 4He/3He analysis, is warranted.Implantation of alpha particles from high eU neigh-bors [Spiegel et al., 2009] would be expected toproduce spectra broadly similar to the rim‐enrichedmodel in Figure 5.
3.5. Multiple‐Crystal Aliquots: 4He/3HeSpectra and 3He Diffusion Parameters[37] In our early efforts to measure 4He/3He spectra[Shuster and Farley, 2004; Shuster et al., 2005] weaggregated multiple crystals into a single stepwisedegassing analysis. This was motivated mainly bythe desire to obtain enough He for a minimal blankcorrection. While the mass 3 blank is usuallyunimportant even for small single crystals, the mass4 blank can be a significant fraction of the totalsignal, especially for low eU apatites and/or thosewith low (U‐Th)/He ages.
[38] There are two assumptions that must be met toobtain a meaningful 4He/3He spectrum from anaggregate of crystals: each crystal must have asimilar 4He concentration profile, and each musthave equivalent He diffusivity during each stepof the degassing analysis. Note that these twoassumptions are closely related because the 4Heconcentration profile reflects the crystal’s diffu-sivity in nature. Although aggregates of crystalsyield reproducible He diffusivities in the labora-tory, we are not aware of any work establishing thedegree of variability in He diffusivity among indi-vidual apatite crystals from a single rock. In addi-tion, recent work [Shuster and Farley, 2009; Shusteret al., 2006] shows that He diffusivity varies withaccumulated radiation damage, making theseassumptions suspect if crystals vary in eU concen-tration. Thus it is worth exploring the consequencesof differing He diffusivity among crystals aggre-gated for a 4He/3He run.
[39] The goal of our quantitative model is to com-pare the 4He/3He spectrum obtained on the aggre-gate with the spectrum that would be obtained onthe crystals individually. Here we assumed isotro-pic diffusion in a cylinder with h/a = 1. We wouldobtain indistinguishable results assuming sphericalgeometry. To keep matters simple, we make thefollowing assumptions:
[40] 1. The aggregate consists of two crystals ofequivalent mass, referred to as A and B.
[41] 2. Both crystals have exactly the same nor-malized 4He concentration profile, and that profileis either uniform or the result of 25% prior loss.
[42] 3. The crystals differ in absolute 4He concen-tration by a factor of x, where x = CA/CB and canhave values of 1/3, 1, or 3. The crystals have thesame 3He concentration.
[43] 4. The crystals differ in diffusivity by a con-stant factor of 2 at all temperatures, i.e., DA/DB = 2.We assume an activation energy of 138 kJ/mol andln(Do/a
2) values of 13.6 and 14.3 for crystals Aand B, respectively. These values are typical ofDurango apatite and correspond to closure tem-peratures of 70 and 66°C (i.e., they differ by onlya small amount).
[44] An arbitrary prograde stepwise heating sched-ule was assumed. The fraction of 3He and 4Hereleased in each step were computed for each crystal,and summed to get the aggregated yields. Theaggregated yields were used to compute the aggre-gate normalized 4He/3He spectrum. In addition thefractional yield data for 3He were used to compute adiffusion Arrhenius plot following the equationsof Fechtig and Kalbitzer [1966] recomputed forcylindrical geometry using Watson et al. [2010,equation 49]. As we will show, this plot is usefulbecause it demonstrates that the Arrhenius arrayobtained from an aggregate is sensitive to inter-crystal heterogeneity in diffusivity. Full details andresults are listed in Data Set S6.
[45] In the first set of simulations we considered aninitially uniform 4He distribution, and varied CA/CB.Results are shown in Figure 6a. When CA/CB = 1,the normalized 4He/3He spectrum of the aggregateis uniform at unity, and thus is identical to thespectra from the individual crystals. However, whenCA/CB = 3, the aggregate spectrum is extremelydifferent: it has a strong positive slope, and deviatesfrom unity by up to ∼40%. This arises from the factthat the initial release in the aggregate is dominatedby the less retentive and lower 4He (and 4He/3He)crystal, while the final steps are dominated by themore retentive and high 4He (and 4He/3He) crystal.A mirror image of this profile is obtained whenCA/CB = 1/3 for exactly the same reason.
[46] Figure 6b shows similar results for the case of25% prior loss. The same effect is seen: when theless retentive crystal has more 4He, the profileinitially overestimates the 4He/3He ratio, then athigh SF3He it underestimates it, and vice versa.
[47] While our modeling in Figure 6 consideredvariations only in Do/a
2 and not in activation
GeochemistryGeophysicsGeosystems G3G3 FARLEY ET AL.: APATITE 4He/3He THERMOCHRONOMETRY 10.1029/2010GC003243
13 of 18

energy, the same general pattern would be seenwhen both parameters vary: the relative contribu-tions from the two crystals will differ in each step,so the aggregate 4He/3He spectrum does not accu-rately represent the spectrum in the individual
crystals. The characteristic signature of this effect issharply anomalous deviations in 4He/3He at highSF3He, either to low or high values. In addition, iftemperatures are cycled during the experiment, it ispossible that the relative contributions from the two
Figure 6. Simulated 4He/3He spectra for an aggregate of two crystals that differ by a factor of 2 in diffusivity (DA/DB= 2) and have relative concentrations CA/CB. (a) Results for a uniform initial profile and (b) results assuming 25%prior diffusive loss. Regardless of initial condition the aggregate yields a 4He/3He spectrum that differs from the spec-trum that would be obtained on either crystal individually. This distinction arises because the less retentive grain givesup more of its helium in the early steps, while the more retentive grain dominates the later steps. This simulationargues strongly against analyzing multigrain aggregates for 4He/3He.
GeochemistryGeophysicsGeosystems G3G3 FARLEY ET AL.: APATITE 4He/3He THERMOCHRONOMETRY 10.1029/2010GC003243
14 of 18

crystals will reverse, leading to positive or negative“spikes” in the spectrum. 4He/3He spectra witheither of these behaviors are readily identified as illbehaved. Positive or negative spikes cannot beproduced by stepwise degassing of a simple pro-duction‐diffusion distribution, and the deviations athigh SF3He will in general plot outside the allowedregion (Figure 1).
[48] Each of these patterns has been observed inour unpublished early experiments using multiplecrystal aggregates. For example, compare Figure 6with the aberrant Kings River B results in Figure 1c.We suspect that this is the origin of many of the dis-crepant 4He/3He spectrawe have obtained onmultiplecrystal aliquots. Clearly it is necessary to analyze4He/3He spectra on single crystals. McDougalland Harrison [1988] present similar considera-tions when measuring Ar/Ar age spectra of poly-minerallic aggregates.
[49] Figure 7 presents an additional observationthat arises from this modeling: even small differ-ences in diffusivity among the crystals can yield anaggregate Arrhenius plot that does not accuratelycapture the diffusion parameters of either crystal.Figure 7 shows Arrhenius plots obtained fromsimulated step heat results for 3He as in the pre-vious examples, but for DA/DB = 4 to make theeffect more readily apparent. This corresponds tocrystals with closure temperatures of 70 and 61°C.(Note that since we are considering only 3He,neither the initial 4He profile nor the absolute 4Heconcentration matter for this example.) In the caseof a monotonically increasing temperature schedule(Figure 7a), the result is an Arrhenius array whichlies between that of the two individual crystals. Asthe experiment proceeds the less retentive crystaldepletes more rapidly than the more retentivecrystal, causing the array to curve downward towardthe more retentive crystal’s diffusion characteristics.This behavior is analogous to the effect described byLovera et al. [1991] and by Fulda and Lippolt[2000] for the case of a distribution in diffusiondomain radii in an analyzed sample.
[50] Figure 7b shows the results of making thesame assumptions as in Figure 7a, but using dif-ferent heating schedules. The filled squares depictthe case of a relatively small number of stepsconcentrated at the high end of the original tem-perature schedule. Here the aggregate Arrheniusarray looks roughly linear (arrow shown), yet itwould indicate an activation energy and closuretemperature significantly lower than either crystalbeing analyzed. The second simulation (filled
symbols) shows the same effect revealed by acycled step heat experiment: the Arrhenius arraydefines a declining zigzag pattern. The point here isthat the Arrhenius parameters of an aggregate neednot be the mean of the crystals that compose theaggregate. Furthermore, a downward curving and/or zigzag array are evidence for this phenomenon.
[51] These effects provide one possible explanationfor the recent observation that 3He‐based diffusiv-ities become unreliable (low activation energy,zigzag Arrhenius array) in highly radiation dam-aged samples [Shuster and Farley, 2009]. Vari-ability in the eU concentration and hence thedegree of radiation damage among crystals couldyield varying diffusivities among grains in thealiquot. Experiments to establish the He diffusivityon individual crystals of these samples is needed toevaluate this possibility.
4. Conclusions
[52] Numerical simulations demonstrate that 4He/3Hespectra evolved from a cylinder with isotropic Hediffusion and its equivalent spherical representationare nearly indistinguishable, an observation thatjustifies the use of the simpler spherical approxima-tions. In contrast, 4He/3He spectra evolved from acylinder with strongly anisotropic diffusion (Daxial/Dradial > ∼10) are distinctly different from thespherical case. While this degree and sense of Hediffusion anisotropy may occur in zircons, it can beruled out in apatite on the basis of laboratory diffu-sion experiments [Farley, 2000; Cherniak et al.,2009] and the good match of some observed4He/3He spectra to the spherical a ejection‐only4He/3He bound (e.g., Figure 1a). These observationsjustify the assumptions used in available interpretivemodels of (U‐Th)/He ages (e.g., HeFTy [Ketcham,2005]) and 4He/3He spectra [e.g., Schildgen et al.,2010].
[53] These models of necessity assume that theanalyzed grain is entirely unbroken, yet many rocksyield apatites which have terminations suggestingrecent breakage. Because recently exposed surfaceswill have experienced less diffusive loss, they willbias initial steps in a 4He/3He experiment towardhigher ratios. The magnitude of the effect isroughly proportional to the fraction of surface arearecently exposed. In the case of breakage of grainterminations (which are a small fraction of theentire grain surface), the consequences are suffi-ciently small as to be routinely ignored. However,apatites that have large chips or significant abrasion
GeochemistryGeophysicsGeosystems G3G3 FARLEY ET AL.: APATITE 4He/3He THERMOCHRONOMETRY 10.1029/2010GC003243
15 of 18

Figure 7. Arrhenius plots simulated for a two‐crystal aggregate with DA/DB = 4 and a uniform and identical con-centration of helium in the two crystals. (a) Comparison of the results obtained on the aggregate to the diffusivitiesassumed for the individual grains, assuming a monotonic heating schedule spanning a large temperature range. Theaggregate diffusivity is curved because it is initially dominated by the less retentive grain, but as the experiment pro-ceeds this grain becomes depleted and the diffusivity declines toward that of the more retentive grain. (b) Comparisonstarting with the same assumptions as in Figure 7a but using two different heating schedules described in section 3.5.These simulations show that mixtures of grains with different diffusivities analyzed together need not yield accuratediffusion parameters (as suggested by arrow in Figure 7b). The telltale signs of this effect are a curved Arrhenius arrayand, for cycled experiments, a declining zigzag pattern.
GeochemistryGeophysicsGeosystems G3G3 FARLEY ET AL.: APATITE 4He/3He THERMOCHRONOMETRY 10.1029/2010GC003243
16 of 18

or chemical pitting produced late in the grain’shistory may yield unacceptably biased 4He/3Hespectra.
[54] In contrast to these relatively minor effects,modeling reveals two factors of great significancefor producing and accurately interpreting 4He/3Hespectra. First, simultaneous analysis of multiplecrystals in a 4He/3He analysis can yield wildlyerroneous spectra given even modest variation inHe diffusivity between grains. Such experimentscan also yield invalid 3He diffusion Arrheniusparameters. This problem is readily solved byanalysis of individual crystals provided sufficientsignal can be obtained to overcome analyticalblanks. A bigger problem is presented by inho-mogeneous parent nuclide distribution. Modelingshows that concentric zonation at the level of afactor of 3 can yield 4He/3He spectra that in thebest case can be identified as aberrant, and in theworst case look acceptable but would not yieldaccurate time‐temperature histories if interpretedassuming homogeneity. This observation suggeststhat apatites subjected to 4He/3He analysis beevaluated for zonation, either by characterizing thepopulation from which the selected apatite isdrawn, or even better, by analysis of parent nuclidevariability in the analyzed grain after the stepwisedegassing 4He/3He analysis is completed. Thedegree to which parent nuclide heterogeneity is acommon problem is difficult to evaluate in the neartotal absence of detailed measurements in apatite.
Acknowledgments
[55] This work was supported by NSF grants to K.A.F. (EAR‐0738627), D.L.S. (EAR‐0738474), and E.B.W. (EAR‐0440228 and EAR‐0738843). D.L.S. also acknowledges theAnn and Gordon Getty Foundation.
References
Boyce, J. W., and K. V. Hodges (2005), U and Th zoning inCerro de Mercado (Durango, Mexico) fluorapatite: Insightsregarding the impact of recoil redistribution of radiogenicHe‐4 on (U‐Th)/He thermochronology, Chem. Geol.,219(1–4), 261–274, doi:10.1016/j.chemgeo.2005.02.007.
Cherniak, D. J., E. B. Watson, and J. B. Thomas (2009),Diffusion of helium in zircon and apatite, Chem. Geol.,268(1–2), 155–166, doi:10.1016/j.chemgeo.2009.08.011.
Colgan, J. P., D. L. Shuster, and P. W. Reiners (2008),Two‐phase Neogene extension in the northwestern Basinand Range recorded in a single thermochronology sample,Geology, 36(8), 631–634, doi:10.1130/G24897A.1.
Dobson, K. J., F. M. Stuart, T. J. Dempster, and EIMF (2008),U and Th zonation in Fish Canyon Tuff zircons: Implications
for a zircon (U‐Th)/He standard, Geochim. Cosmochim.Acta, 72(19), 4745–4755, doi:10.1016/j.gca.2008.07.015.
Farley, K. A. (2000), Helium diffusion from apatite: Generalbehavior as illustrated by Durango fluorapatite, J. Geophys.Res., 105(B2), 2903–2914, doi:10.1029/1999JB900348.
Farley, K. A. (2007), He diffusion systematics in minerals:Evidence from synthetic monazite and zircon structure phos-phates, Geochim. Cosmochim. Acta, 71(16), 4015–4024,doi:10.1016/j.gca.2007.05.022.
Farley, K. A., R. A. Wolf, and L. T. Silver (1996), The effectsof long alpha‐stopping distances on (U‐Th)/He ages,Geochim.Cosmochim. Acta, 60, 4223–4229, doi:10.1016/S0016-7037(96)00193-7.
Fechtig, H., and S. Kalbitzer (1966), The diffusion of argon inpotassium‐bearing solids, in Potassium Argon Dating, com-piled by O. A. Schaeffer and J. Zahringer, pp. 68–107,Springer, New York.
Fitzgerald, P., R. Sorkhabi, T. Redfield, and E. Stump (1995),Uplift and denudation of the central Alaska Range: A casestudy in the use of apatite fission track thermochronologyto determine absolute uplift parameters, J. Geophys. Res.,100, 20,175–20,191, doi:10.1029/95JB02150.
Fulda, C., and H. J. Lippolt (2000), Diffusion coefficients ofnoble gases in natural minerals: An apparent experimentaltime dependence caused by domain size spectra, Math.Geol., 32(1), 31–47, doi:10.1023/A:1007550600841.
Gautheron, C., and L. Tassan‐Got (2010), A Monte Carloapproach to diffusion applied to noble gas/helium thermo-chronology, Chem. Geol., 273(3–4), 212–224, doi:10.1016/j.chemgeo.2010.02.023.
Hourigan, J. K., P.W. Reiners, andM. T. Brandon (2005), U‐Thzonation‐dependent alpha‐ejection in (U‐Th)/He chro-nometry, Geochim. Cosmochim. Acta, 69(13), 3349–3365,doi:10.1016/j.gca.2005.01.024.
Jolivet, M., T. Dempster, and R. Cox (2003), Distribution ofU and Th in apatites: Implications for U‐Th/He thermochro-nology, C. R. Geosci., 335(12), 899–906, doi:10.1016/j.crte.2003.08.010.
Ketcham, R. A. (2005), Forward and inverse modeling of low‐temperature thermochronometry data, in Low‐TemperatureThermochronology: Techniques, Interpretations, and Appli-cations, Rev. Mineral. Geochem., vol. 58, pp. 275–314,doi:10.2138/rmg.2005.58.11, Mineral. Soc. of Am.,Washington, D. C.
Lovera, O., F. Richter, and T. Harrison (1991), Diffusiondomains determined by 39Ar released during step heating,J. Geophys. Res., 96, 2057–2069, doi:10.1029/90JB02217.
McDougall, I., and T. M. Harrison (1988), Geochronology andThermochronology by the 40Ar/39Ar Method, Oxford Univ.Press, New York.
Meesters, A., and T. J. Dunai (2002), Solving the production‐diffusion equation for finite diffusion domains of variousshapes: Part 1. Implications for low‐temperature (U‐Th)/Hethermochronology, Chem. Geol., 186(3–4), 333–344,doi:10.1016/S0009-2541(01)00422-3.
Reich, M., R. C. Ewing, T. A. Ehlers, and U. Becker (2007),Low‐temperature anisotropic diffusion of helium in zircon:Implications for zircon (U‐Th)/He thermochronometry,Geochim. Cosmochim. Acta, 71, 3119–3130, doi:10.1016/j.gca.2007.03.033.
Saadoune, I., J. A. Purton, and N. H. de Leeuw (2009), Heincorporation and diffusion pathways in pure and defective zir-con ZrSiO4: A density functional theory study, Chem. Geol.,258(3–4), 182–196, doi:10.1016/j.chemgeo.2008.10.015.
GeochemistryGeophysicsGeosystems G3G3 FARLEY ET AL.: APATITE 4He/3He THERMOCHRONOMETRY 10.1029/2010GC003243
17 of 18

Schildgen, T. F., G. Balco, and D. L. Shuster (2010), Canyonincision and knickpoint propagation recorded by apatite4He/3He thermochronometry, Earth Planet. Sci. Lett.,293(3–4), 377–387, doi:10.1016/j.epsl.2010.03.009.
Shuster, D. L., and K. A. Farley (2004), 4He/3He thermochro-nometry, Earth Planet. Sci. Lett. , 217(1–2), 1–17,doi:10.1016/S0012-821X(03)00595-8.
Shuster, D. L., and K. A. Farley (2005), 4He/3He thermochro-nometry: Theory, practice, and potential complications, inLow‐Temperature Thermochronology: Techniques, Interpre-tations, and Applications, Rev. Mineral. Geochem., vol. 58,pp. 181–203, doi:10.2138/rmg.2005.58.7, Mineral. Soc. ofAm., Washington, D. C.
Shuster, D. L., and K. A. Farley (2009), The influence of arti-ficial radiation damage and thermal annealing on helium dif-fusion kinetics in apatite, Geochim. Cosmochim. Acta, 73(1),183–196, doi:10.1016/j.gca.2008.10.013.
Shuster, D. L., K. A. Farley, J. M. Sisterson, and D. S. Burnett(2004), Quantifying the diffusion kinetics and spatial distri-butions of radiogenic 4He in minerals containing proton‐induced 3He, Earth Planet. Sci. Lett., 217(1–2), 19–32,doi:10.1016/S0012-821X(03)00594-6.
Shuster, D. L., T. A. Ehlers, M. E. Rusmore, and K. A. Farley(2005), Rapid glacial erosion at 1.8 Ma revealed by 4He/3Hethermochronometry, Science, 310(5754), 1668–1670,doi:10.1126/science.1118519.
Shuster, D. L., R. M. Flowers, and K. A. Farley (2006), Theinfluence of natural radiation damage on helium diffusion
kinetics in apatite, Earth Planet. Sci. Lett., 249(3–4),148–161, doi:10.1016/j.epsl.2006.07.028.
Spiegel, C., B. Kohn, D. Belton, Z. Berner, and A. Gleadow(2009), Apatite (U‐Th‐Sm)/He thermochronology of rapidlycooled samples: The effect of He implantation, Earth Planet.Sci. Lett., 285(1–2), 105–114, doi:10.1016/j.epsl.2009.05.045.
Wagner, G., and G. Reimer (1972), Fission track tectonics:The tectonic interpretation of fission track apatite ages, EarthPlanet. Sci. Lett., 14, 263–268, doi:10.1016/0012-821X(72)90018-0.
Watson, E. B., K. H. Wanser, and K. A. Farley (2010), Aniso-tropic diffusion in a finite cylinder, with geochemical appli-cations, Geochim. Cosmochim. Acta, 74(2), 614–633,doi:10.1016/j.gca.2009.10.013.
Wolf, R. A., K. A. Farley, and L. T. Silver (1996a), Heliumdiffusion and low‐temperature thermochronometry of apatite,Geochim. Cosmochim. Acta , 60 (21) , 4231–4240,doi:10.1016/S0016-7037(96)00192-5.
Wolf, R. A., K. A. Farley, and L. T. Silver (1996b), Assessmentof (U‐Th)/He thermochronometry: The low‐temperaturehistory of the San Jacinto Mountains, Calif. Geol., 25, 65–68.
Wolf, R. A., K. A. Farley, and D. M. Kass (1998), Modeling ofthe temperature sensitivity of the apatite (U‐Th)/He thermo-chronometer, Chem. Geol., 148(1–2), 105–114, doi:10.1016/S0009-2541(98)00024-2.
GeochemistryGeophysicsGeosystems G3G3 FARLEY ET AL.: APATITE 4He/3He THERMOCHRONOMETRY 10.1029/2010GC003243
18 of 18