Numerical investigation on the progressive collapse...
12
Acta Technica Napocensis: Civil Engineering & Architecture Volume 59, No. 2, (2016) Journal homepage: http://constructii.utcluj.ro/ActaCivilEng ISSN 1221-5848 Numerical investigation on the progressive collapse behavior of the RC frames dependent on the damage cases Adrian G. Marchis *1 , Adrian M. Ioani 2 1,2 Technical University of Cluj-Napoca, Faculty of Civil Engineering. 15 C Daicoviciu Str., 400020, Cluj- Napoca, Romania (Received 15 July 2015; Accepted 17 June 2016) Abstract In this paper the ultimate load bearing capacity to progressive collapse of RC frames subjected to different damage cases is investigated. A reinforced concrete planar frame, previously tested during an experimental program performed by Yi et al. (2008), is considered herein for validation. The 3D finite element model is created using the Midas FEA software. A nonlinear static “push-down” analysis is conducted considering three distinct damage cases: the removal of a first-storey column located at the middle, near the middle, respectively at the corner of the frame. The response of the numerical model subjected to middle column failure is similar with the response of the frame during the experimental test. For each damage case, the ultimate load associated to the structural collapse is compared with the load associated to the three hinge failure mechanism (yield load). Thus, the contribution of two supplementary resisting mechanisms (the compressive arch action and the catenary action) to better resist progressive collapse of the RC frames is investigated with respect to three damage cases. Rezumat În această lucrare se studiază capacitatea portantă ultimă la colaps progresiv a structurilor în cadre din beton armat supuse diferitelor cazuri de avarie. Pentru validare, se consideră un cadru plan din beton armat testat anterior de Yi și alții (2008) în cadrul unui program experimental. Modelul 3D de element finit este creat în programul de calcul Midas FEA. Se rulează câte o analiză statică neliniară pentru modelul numeric supus la trei cazuri de avarie structurală, astfel: îndepărtarea unui stâlp de la primul nivel amplasat la mijlocul deschiderii, în apropiere de mijlocul deschiderii, respectiv la colțul cadrului. Răspunsul modelului numeric supus cedării stâlpului amplasat la mijlocul deschiderii este similar cu răspunsul structurii reale din cadrul programului experimental. Încărcarea ultimă asociată colapsului structural este comparată cu încărcarea asociată formării mecanismului de cedare prin trei articulații, pentru fiecare caz de avarie. Astfel, se evidențiază contribuția celor două mecanisme suplimentare de rezistență (efectul de arc comprimat și efectul de lănțișor) asupra capacitătii portante ultime la colaps progresiv a structurilor în cadre din beton armat în funcție de cazul de avarie considerat. * Corresponding author: Tel./ Fax.:0264 401 345 E-mail address: [email protected]
Transcript of Numerical investigation on the progressive collapse...

Acta Technica Napocensis: Civil Engineering & Architecture Volume 59, No. 2, (2016)
Journal homepage: http://constructii.utcluj.ro/ActaCivilEng
ISSN 1221-5848
Numerical investigation on the progressive collapse behavior of the
RC frames dependent on the damage cases
Adrian G. Marchis*1
, Adrian M. Ioani2
1,2 Technical University of Cluj-Napoca, Faculty of Civil Engineering. 15 C Daicoviciu Str., 400020, Cluj-
Napoca, Romania
(Received 15 July 2015; Accepted 17 June 2016)
Abstract
In this paper the ultimate load bearing capacity to progressive collapse of RC frames subjected to
different damage cases is investigated. A reinforced concrete planar frame, previously tested during
an experimental program performed by Yi et al. (2008), is considered herein for validation. The 3D
finite element model is created using the Midas FEA software. A nonlinear static “push-down”
analysis is conducted considering three distinct damage cases: the removal of a first-storey column
located at the middle, near the middle, respectively at the corner of the frame. The response of the
numerical model subjected to middle column failure is similar with the response of the frame during
the experimental test. For each damage case, the ultimate load associated to the structural collapse
is compared with the load associated to the three hinge failure mechanism (yield load). Thus, the
contribution of two supplementary resisting mechanisms (the compressive arch action and the
catenary action) to better resist progressive collapse of the RC frames is investigated with respect
to three damage cases.
Rezumat
În această lucrare se studiază capacitatea portantă ultimă la colaps progresiv a structurilor în
cadre din beton armat supuse diferitelor cazuri de avarie. Pentru validare, se consideră un cadru
plan din beton armat testat anterior de Yi și alții (2008) în cadrul unui program experimental.
Modelul 3D de element finit este creat în programul de calcul Midas FEA. Se rulează câte o
analiză statică neliniară pentru modelul numeric supus la trei cazuri de avarie structurală, astfel:
îndepărtarea unui stâlp de la primul nivel amplasat la mijlocul deschiderii, în apropiere de mijlocul
deschiderii, respectiv la colțul cadrului. Răspunsul modelului numeric supus cedării stâlpului
amplasat la mijlocul deschiderii este similar cu răspunsul structurii reale din cadrul programului
experimental. Încărcarea ultimă asociată colapsului structural este comparată cu încărcarea
asociată formării mecanismului de cedare prin trei articulații, pentru fiecare caz de avarie. Astfel,
se evidențiază contribuția celor două mecanisme suplimentare de rezistență (efectul de arc
comprimat și efectul de lănțișor) asupra capacitătii portante ultime la colaps progresiv a
structurilor în cadre din beton armat în funcție de cazul de avarie considerat.
* Corresponding author: Tel./ Fax.:0264 401 345
E-mail address: [email protected]
A.G. Marchis & A.M. Ioani / Acta Technica Napocensis: Civil Engineering & Architecture Vol. 59 No 2 (2016) 30-41
31
Keywords: progressive collapse, RC frame, nonlinear static analysis, compressive arch action,
catenary action
1. Introduction
Progressive collapse is defined as a situation where a local failure of primary structural components
leads to the collapse of adjoining members which, in turn, leads to additional collapse, the total
damage being disproportionate with the original cause [1]. The engineering community had been
engage in preventing progressive collapse of building after the structural failure of the Ronan Point
Apartment Building from London, England (1968). The interest in this field has been intensified
after the collapse of the Murrah Federal Building (Oklahoma, U.S.A, 1995) and after the total
failure of the World Trade Center (New York, U.S.A, 2001). Therefore, in order to minimize the
human losses, it is essential to design the buildings (especially those classified as of major
importance) to resist progressive collapse when subjected to abnormal loads (terrorist attacks, gas
explosion impact by vehicle, etc). In this category are included all the loads not considered in the
initial phase of the structural design.
However, from an economical point of view, since abnormal loads are extremely rare events that
can occur during the lifetime of a building, it is more appropriate to minimize the risk for
progressive collapse in buildings than to design them to resist for all possible threats: gas explosion,
terrorist attack, impact by vehicle, etc. In this context, two major guidelines [2, 3] for progressive
collapse analysis of the new and existing buildings, released by the U.S General Service
Administration (GSA) and the U.S Department of Defense (DoD) are available. The Alternative
Path Method has been selected by both agencies as the basic approach for providing resistance to
progressive collapse. A structure should be capable of developing alternative load paths over a
vertical support suddenly removed as a result of abnormal loading. This means that a structure
should be designed with an adequate level of continuity, ductility and redundancy, characteristics
which are found in the seismic design codes, too: Eurocode 8 [4], ASCE 41-06 [5] and P100/1-2013
[6].
Recent numerical studies [7, 8, 9, 10] have indicated the beneficial influence of the seismic design
to better resist progressive collapse when subjected to column removal. These results were
validated by experimental studies [11, 12, 13, 14] carried out on RC beam column sub-
assemblages; it was shown that the specimen with seismic detailing could develop supplementary
resisting mechanisms – the compressive arch action and the catenary action - before failure, which
increases the ultimate load bearing capacity to progressive collapse of the tested specimens. Yi et al.
(2008) [15] had shown that a four-bays three-stories RC planar frame is capable to resist for a peak
load of Fu=105kN, which is 35% higher than the yield load (Fy) associated to the development of
the three hinge failure mechanism. Also, Sadek et al (2011) [12] had shown that a seismically
designed beam-column subassemblage is capable of resisting for a peak load Fu=1092kN which is
50% higher than Fy. In this context, the ultimate load bearing capacity to progressive collapse of RC
planar frames dependent on the damage cases is investigated herein. The RC planar frame
experimentally tested by Yi et al. (2008) [15] is modeled using the Midas FEA software [16]. A
nonlinear static “push-down” analysis is performed for the numerical model considering three
distinct damage cases: the removal of a first-storey column located at the middle, near the middle,
respectively at the corner of the frame. For each case, the peak load attained before failure is
compared with the yield load when the three hinge failure mechanism is activated. Thus, the
contribution of the supplementary resisting mechanisms – the compressive arch action and the
catenary action – to better resist progressive collapse is discussed.

A.G. Marchis & A.M. Ioani / Acta Technica Napocensis: Civil Engineering & Architecture Vol. 59 No 2 (2016) 30-41
32
A secondary objective of this study is to test the ability of the Midas FEA (available for the
researchers from the Faculty of Civil Engineering from Cluj-Napoca), in order to capture the
response of the RC frames in the large displacement range during the progressive collapse analysis.
The Extreme loading for Structures software was successfully tested in a previous paper [17].
2. Numerical model
2.1 Details of the experiment (Yi et al., 2008)
A four-bay and three-storey one-third scale model representing a segment of a larger planar RC
frame was experimentally tested by Yi et al. (2008) [15]. The frame consists of four 2667mm bays
and three stories. The storey height was 1100mm except for the first one which has 1567mm height.
Dimensions of the structural components as well as the longitudinal and transverse reinforcement
are provided in Table 1.
Table 1. Design details of the planar frame (Yi et al., 2008) [15].
Element Dimensions w•h
[mm]
Bottom rebars Top rebars Shear rebars
Beam 100x200 2Φ12mm 2Φ12mm Φ6/150mm
Column 200x200 4Φ12mm
The material parameters provided by the experiment are given in the following. The concrete
compressive strength f’c measured on 15x15x15cm cube was 25MPa. The yield and ultimate
strength for steel was fy=416MPa respectively fyu=526MPa. The ultimate strain for steel Ɛsu of 23%
was measured with strain gauges having 120mm length. For strain gauge length of 60mm Ɛsu was
measured as 27.5%. The gradual failure of the first-storey middle column C3 was performed in a
displacement controlled manner, as follows. First, a vertical load F=109kN (refer to Fig. 1) was
applied on the top of the middle column by a servo-hydraulic actuator in order to simulate the
gravity loads of the upper stories not considered in the experiment. Then, while maintaining the
load at the maximum value, the progressive failure of the first-storey middle column was simulated
by lowering the mechanical jacks located on the bottom of the middle column C3.
Figure 1. Test setup for the RC planar frame (Yi et al, 2008) [15].

A.G. Marchis & A.M. Ioani / Acta Technica Napocensis: Civil Engineering & Architecture Vol. 59 No 2 (2016) 30-41
33
2.2 Validation of the FEM model
A computer program Midas FEA [16] was used to develop the 3-D finite element model for the RC
planar frame under investigation. Solid elements were considered for the FEM model; the concrete
and reinforcement bars are modeled separately, as illustrated in Fig. 2. A mesh size of 2.5cm was
considered for each structural component.
(a) (b)
Figure 2. Modeling of the frame with Midas FEA: (a) concrete, (b) reinforcement.
Nonlinear behavior is adopted for the constitutive models (refer to Fig. 3). A Total Strain Crack
model was considered for the behavior of concrete which assumes that the generated cracks are
scattered over a wide surface [16]. The Hordijk model was adopted for the behavior of concrete in
tension as illustrated in Fig. 3(a). The tensile strength was considered as ft =2.2MPa. The softening
function is governed by the ratio Gf/h, where Gf is the fracture energy and is related to the
compressive strength (fck) and the maximum aggregate size (Dmax).
(a) (b)
Figure 3. Constitutive models for concrete: (a) in tension – Hordijk model, (b) in compression –
Thorenfeldt model [16].
For the numerical model under investigation Gf=0.069kN/m, considering fck=25MPa and
Dmax=16mm; h represents the total crack band width which is taken as the mesh size of the finite
element (h=0.025m). For concrete behavior in compression, a Thorenfeldt model was adopted (refer
to Fig.3b), where fck =25MPa, a value provided by the experiment. Since the Young’s modulus for
concrete is not given by the experimental test, it is calculated using the relation provided by ACI
A.G. Marchis & A.M. Ioani / Acta Technica Napocensis: Civil Engineering & Architecture Vol. 59 No 2 (2016) 30-41
34
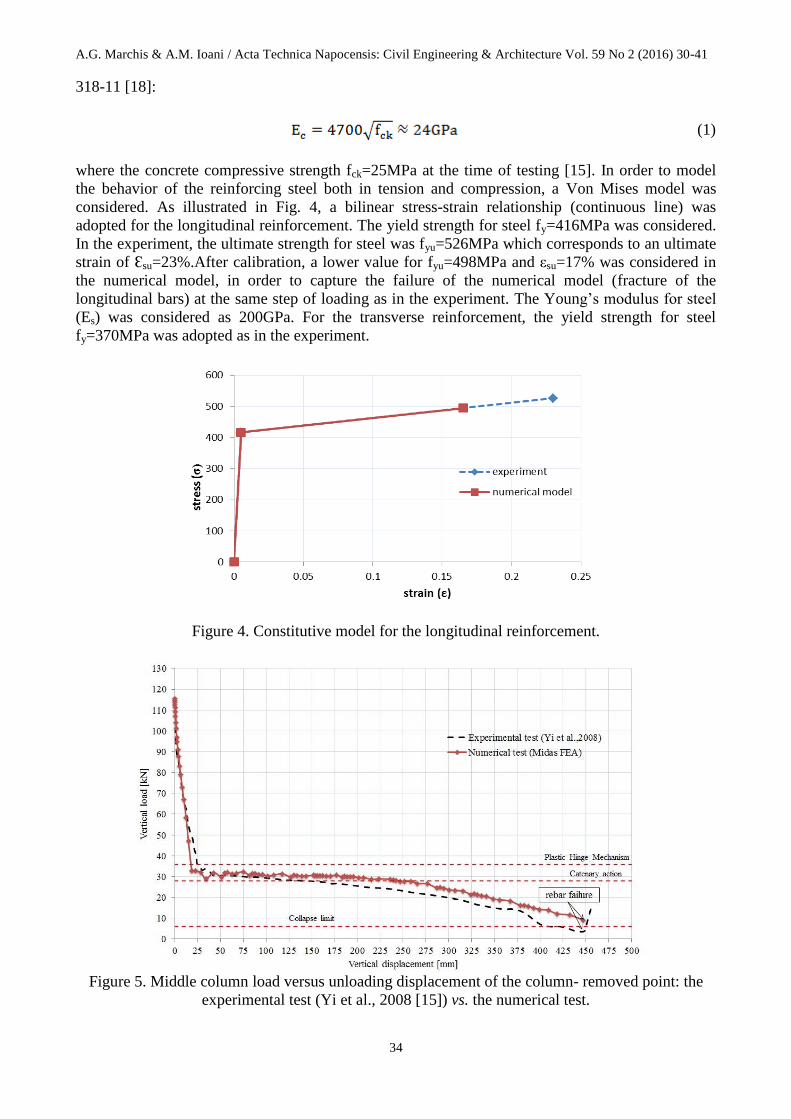
318-11 [18]:
(1)
where the concrete compressive strength fck=25MPa at the time of testing [15]. In order to model
the behavior of the reinforcing steel both in tension and compression, a Von Mises model was
considered. As illustrated in Fig. 4, a bilinear stress-strain relationship (continuous line) was
adopted for the longitudinal reinforcement. The yield strength for steel fy=416MPa was considered.
In the experiment, the ultimate strength for steel was fyu=526MPa which corresponds to an ultimate
strain of Ɛsu=23%.After calibration, a lower value for fyu=498MPa and εsu=17% was considered in
the numerical model, in order to capture the failure of the numerical model (fracture of the
longitudinal bars) at the same step of loading as in the experiment. The Young’s modulus for steel
(Es) was considered as 200GPa. For the transverse reinforcement, the yield strength for steel
fy=370MPa was adopted as in the experiment.
Figure 4. Constitutive model for the longitudinal reinforcement.
Figure 5. Middle column load versus unloading displacement of the column- removed point: the
experimental test (Yi et al., 2008 [15]) vs. the numerical test.
A.G. Marchis & A.M. Ioani / Acta Technica Napocensis: Civil Engineering & Architecture Vol. 59 No 2 (2016) 30-41
35
The numerical test was performed in a displacement controlled manner by applying a target
displacement ∆=50cm at the bottom of the middle column (C3). 400 steps were set up in the
nonlinear static analysis. Fig. 5 displays the load-displacement curve obtain for the numerical model
(continuous line) in comparison with the one provided by Yi et al. (2008) [15] in the experiment
(dashed line). The response of the FEM model subjected to column failure is in very good
agreement with the response of the tested structure during the experiment. When the vertical
displacement of the middle column measured ∆=450mm, the longitudinal rebars from the critical
beams of the first storey (C3-C4) ruptured, indicating the collapse of the planar frame. In the
numerical test, the analysis stops when the ultimate strain for steel Ɛsu=0.17 is attained in the
longitudinal rebars from the beams of the third storey, indicating the failure of the FEM model.
3. Progressive collapse resistance with respect to different damage cases
The aim of this study is to investigate the ultimate load bearing capacity to progressive collapse of
RC planar frames with respect to different damage cases. After the mechanism of three hinge type
is formed, two supplementary resisting mechanisms may develop which improves the ultimate load
bearing capacity to progressive collapse of the RC frame when subjected to column removal.
The numerical model considered herein, was validated in the previous section with the experimental
failure test performed by Yi et al. (2008) [15]. In addition to the damage case considered in the
experiment (column loss C3), two supplementary damage cases were accounted for: the removal of
the first-storey column C4 (near the middle) and C5 (the corner column).
3.1 Column loss C3
In order to establish the ultimate load bearing capacity to progressive collapse, the numerical model
was subjected to three distinct damage cases: the removal of the first-storey columns C3, C4 and C5,
each in turn. A nonlinear static “push-down” analysis was performed by considering a target
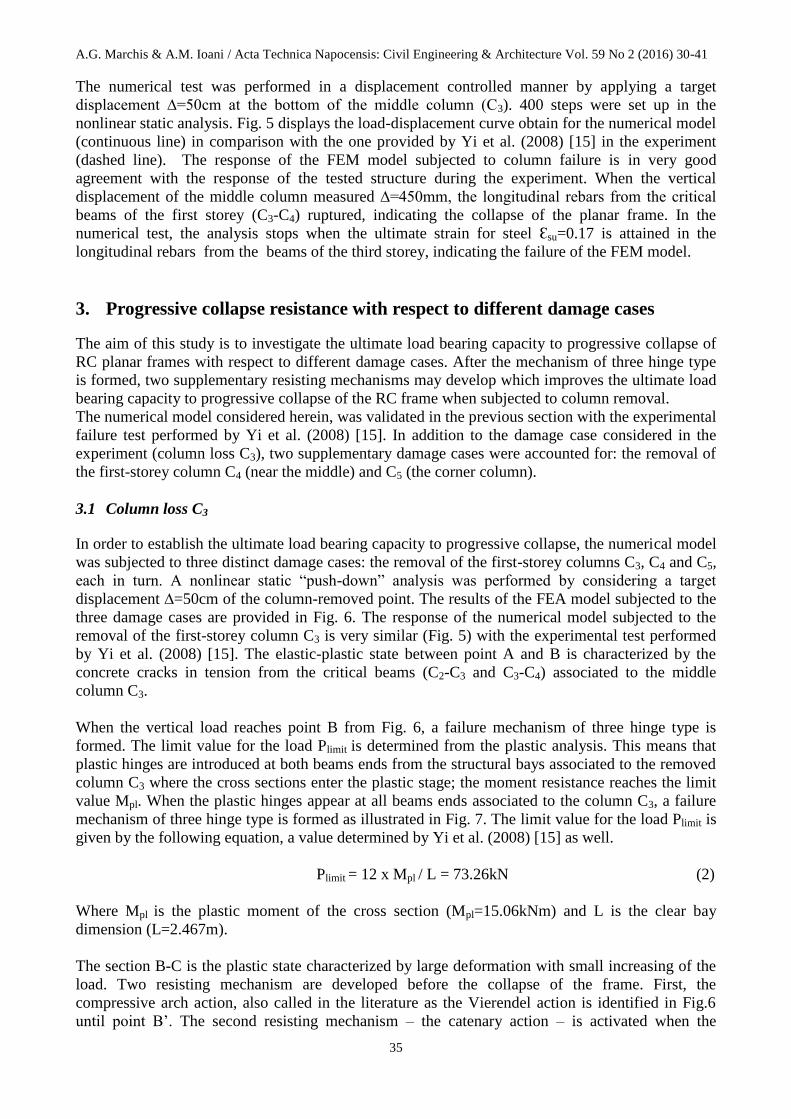
displacement ∆=50cm of the column-removed point. The results of the FEA model subjected to the
three damage cases are provided in Fig. 6. The response of the numerical model subjected to the
removal of the first-storey column C3 is very similar (Fig. 5) with the experimental test performed
by Yi et al. (2008) [15]. The elastic-plastic state between point A and B is characterized by the
concrete cracks in tension from the critical beams (C2-C3 and C3-C4) associated to the middle
column C3.
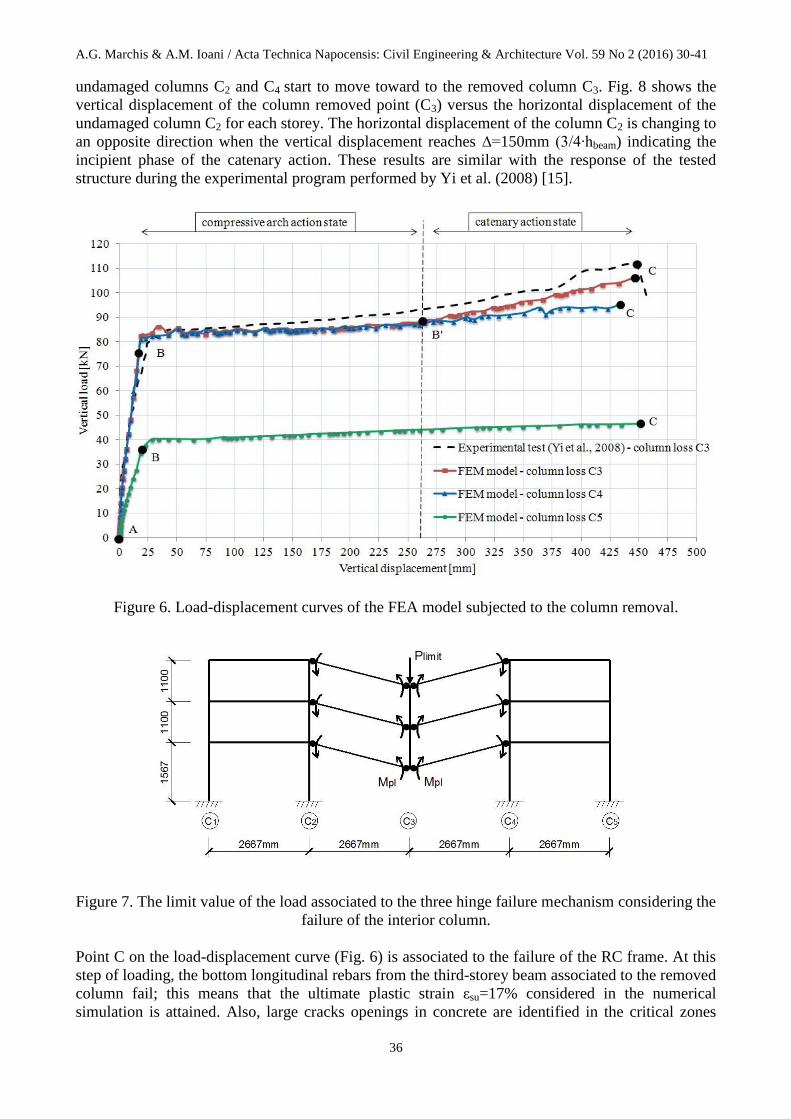
When the vertical load reaches point B from Fig. 6, a failure mechanism of three hinge type is
formed. The limit value for the load Plimit is determined from the plastic analysis. This means that
plastic hinges are introduced at both beams ends from the structural bays associated to the removed
column C3 where the cross sections enter the plastic stage; the moment resistance reaches the limit
value Mpl. When the plastic hinges appear at all beams ends associated to the column C3, a failure
mechanism of three hinge type is formed as illustrated in Fig. 7. The limit value for the load Plimit is
given by the following equation, a value determined by Yi et al. (2008) [15] as well.
Plimit = 12 x Mpl / L = 73.26kN (2)
Where Mpl is the plastic moment of the cross section (Mpl=15.06kNm) and L is the clear bay
dimension (L=2.467m).
The section B-C is the plastic state characterized by large deformation with small increasing of the
load. Two resisting mechanism are developed before the collapse of the frame. First, the
compressive arch action, also called in the literature as the Vierendel action is identified in Fig.6
until point B’. The second resisting mechanism – the catenary action – is activated when the
A.G. Marchis & A.M. Ioani / Acta Technica Napocensis: Civil Engineering & Architecture Vol. 59 No 2 (2016) 30-41
36
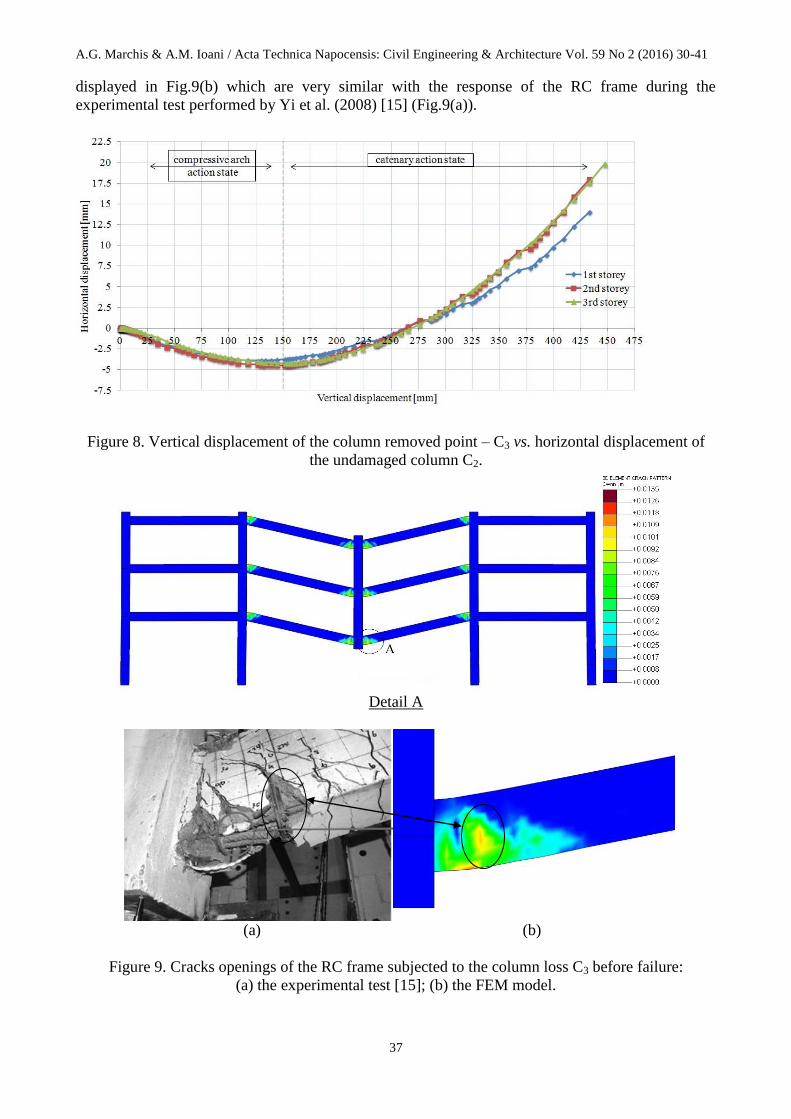
undamaged columns C2 and C4 start to move toward to the removed column C3. Fig. 8 shows the
vertical displacement of the column removed point (C3) versus the horizontal displacement of the
undamaged column C2 for each storey. The horizontal displacement of the column C2 is changing to
an opposite direction when the vertical displacement reaches ∆=150mm (3/4∙hbeam) indicating the
incipient phase of the catenary action. These results are similar with the response of the tested
structure during the experimental program performed by Yi et al. (2008) [15].
Figure 6. Load-displacement curves of the FEA model subjected to the column removal.
Figure 7. The limit value of the load associated to the three hinge failure mechanism considering the
failure of the interior column.
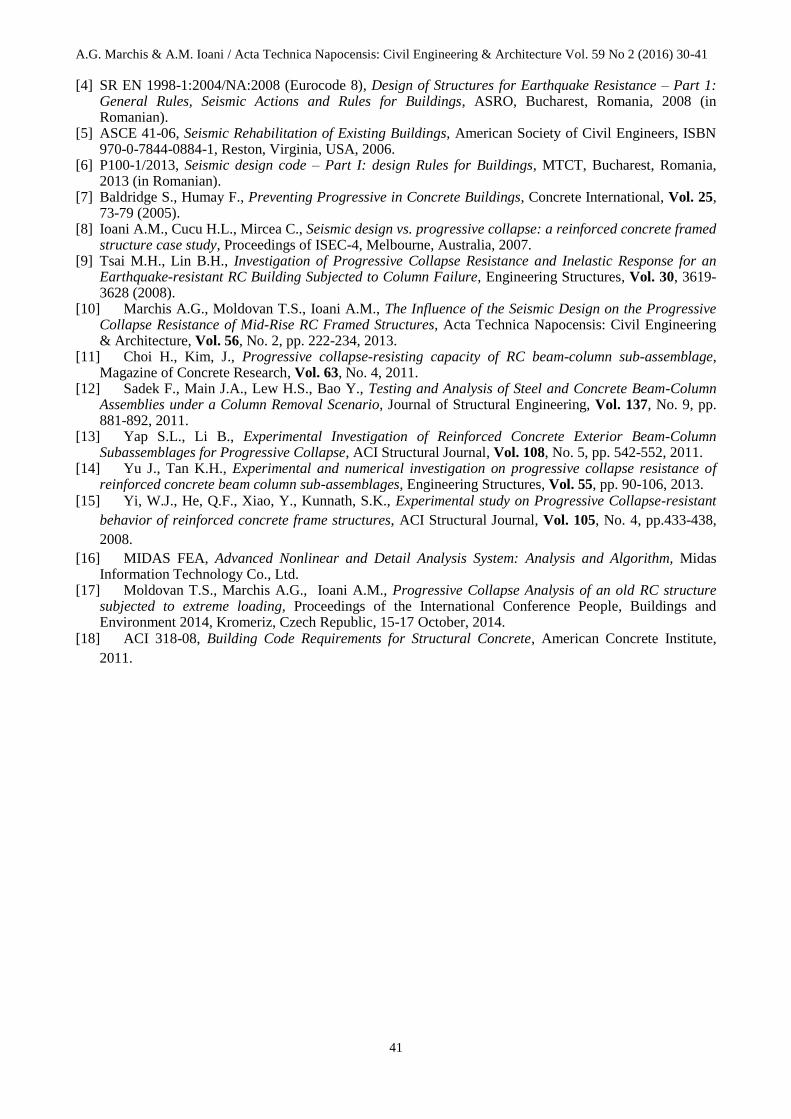
Point C on the load-displacement curve (Fig. 6) is associated to the failure of the RC frame. At this
step of loading, the bottom longitudinal rebars from the third-storey beam associated to the removed
column fail; this means that the ultimate plastic strain εsu=17% considered in the numerical
simulation is attained. Also, large cracks openings in concrete are identified in the critical zones
A.G. Marchis & A.M. Ioani / Acta Technica Napocensis: Civil Engineering & Architecture Vol. 59 No 2 (2016) 30-41
37
displayed in Fig.9(b) which are very similar with the response of the RC frame during the
experimental test performed by Yi et al. (2008) [15] (Fig.9(a)).
Figure 8. Vertical displacement of the column removed point – C3 vs. horizontal displacement of
the undamaged column C2.
Detail A
(a) (b)
Figure 9. Cracks openings of the RC frame subjected to the column loss C3 before failure:
(a) the experimental test [15]; (b) the FEM model.

A.G. Marchis & A.M. Ioani / Acta Technica Napocensis: Civil Engineering & Architecture Vol. 59 No 2 (2016) 30-41
38
Therefore, due to the developing of the two supplementary resisting mechanisms – the compressive
arch action and the catenary action, the FEM model subjected to the column loss C3, is capable of
resisting for an ultimate load of Fu=106.5kN which is 45% higher than the load associated to the
formation of the three hinge failure mechanism – Fy (refer to Fig. 10).
Figure 10. The progressive collapse resistance of the planar frame dependent on the damage case.
3.2 Column loss C4
When the FEM model is subjected to the removal of the column C4, its response is similar with the
previous case (column loss C3). When the vertical load reaches point B from Fig. 6, a failure
mechanism of three hinge type is formed.
(a)
(b)
Figure 11. Vertical displacement of the column removed point – C4 vs. horizontal displacement of
the undamaged columns: (a) C3, (b) C5.

A.G. Marchis & A.M. Ioani / Acta Technica Napocensis: Civil Engineering & Architecture Vol. 59 No 2 (2016) 30-41
39
The limit value for the load associated to this mechanism is determined with Eq. (2): Plimit=73.26kN
considering the failure of an interior column. As in the previous case, two resisting mechanism are
developed before the collapse of the frame. The compressive arch action is identified in Fig. 6 until
point B’. The catenary action activates when the undamaged columns C3 and C5 start to move
toward to the removed column C4. Fig. 11 shows the vertical displacement of the column removed
point (C4) versus the horizontal displacement of the undamaged columns C3 (Fig. 11(a)) and C5
(Fig. 11(b)) for each storey. As in the previous case, the horizontal displacement of the column
C3/C5 is changing to an opposite direction when the vertical displacement reaches ∆=150mm
(3/4∙hbeam) indicating the incipient phase of the catenary action. The differences between the
horizontal displacements of the undamaged columns C3 and C5 (refer to Fig. 11) is due to the fact
that the column C3 is horizontally restrained by the structural bays C1-C3, unlike the column C5
which is located at the corner of the frame. From this step (∆>150mm), the loads associated to the
removed column C4 are transmitted by the critical beams (which exhibit only tension behavior) to
the adjacent (undamaged) columns C3 and C5 (Fig. 12). Also, large cracks openings are identified at
both ends of the critical beams associated to the removed column C4.
The analysis stops when the vertical displacement reaches ∆=435mm (point C on Fig. 6). As in the
previous case, the bottom longitudinal rebars from the third-storey beam associated to the removed
column fail and thus the collapse limit state is attained. The FEM model subjected to the column
loss C4 is capable of resisting for an ultimate load of Fu=95.23kN, which is 30% higher than the
load associated to the three hinge failure mechanism – Fy (refer to Fig. 10).
Figure 12. Loads redistribution of the FEM model subjected to the column loss C4 in the large
displacement range: ∆>150mm.
3.3 Column loss C5
The response of the FEM model subjected to the corner column removal (C5) is similar with the
previous cases (Fig. 6). When the vertical load reaches point B from Fig. 6, a failure mechanism of
three hinge type is formed as illustrated in Fig. 13. The limit value for the load (Plimit) associated to
this mechanism is given by the following equation:
Plimit = 6 x Mpl / L = 36.63kN (3)
Where Mpl is the plastic moment of the cross section (Mpl=15.06kNm) and L is the clear bay
dimension (L=2.467m). The analysis stops when the vertical displacement reaches ∆=450mm. The
bottom longitudinal rebars from the first-storey beam near the removed column C5 fail indicating
the collapse initiation of the planar frame. The ultimate load attained associated to point C on the
load-displacement curve from Fig. 6 is Fu=46.4kN which is 27% higher than Fy (refer to Fig. 10).

A.G. Marchis & A.M. Ioani / Acta Technica Napocensis: Civil Engineering & Architecture Vol. 59 No 2 (2016) 30-41
40
Figure 13. The limit value of the load associated to the three hinge failure mechanism considering
the failure of the corner column.
4. Concluding remarks
The ultimate load bearing capacity to progressive collapse of RC planar frames dependent on the
damage case considered was investigated in this study. A reinforced concrete planar frame
modelled in Midas FEA [16] was previously experimentally tested by Yi et al. (2008) [15]. A
nonlinear static “push-down” analysis was performed for the FEM model considering three distinct
damage cases: the removal of a first-storey column located at the middle (C3), near the middle (C4),
respectively at the corner of the frame (C5).
Based on the results obtained herein the following conclusions can be drawn:
The planar RC frame subjected to the damage case C3 is capable of resisting for a maximum
load of 106.44kN which is 12% higher than in the case C4, respectively 129% higher than in
the case C5, as indicated in the numerical investigation.
Irrespective of the damage case considered, the RC frame can support a higher load than the
load associated to the development of the failure mechanism of three hinge type before
collapse. This is due to the activation of the supplementary resisting mechanisms: the
compressive arch action and the catenary action.
The additional load resistance to progressive collapse due to the initiation of the
supplementary resisting mechanisms is 27% for the damage case C5, 30% for the case C4
and 45% for the case C3, with respect to the load associated to the initiation of the three
hinge failure mechanism.
Consequently, the suddenly removal of the first-storey column located at the middle (case C3) when
subjected to an abnormal loading assumes a lower risk for progressive collapse for the RC frame
than for the other damage cases (C4 and C5). Therefore, a higher supplementary load resistance is
obtained with respect to the limit value of the load associated to the three hinge failure mechanism.
When the planar frame is subjected to the corner column removal (damage case C5) a lower
supplementary load resistance is obtained unlike the other damage cases considered herein.
6. References [1] General Service Administration (GSA), Progressive Collapse Analysis and Design Guidelines for New
Federal Office Buildings and Major Modernization Projects, GSA, Washington, U.S.A, 2003. [2] General Service Administration (GSA), Alternate Path Analysis and Design Guidelines for Progressive
Collapse Resistance, GSA, Washington, U.S.A, 2013. [3] Department of Defense (DoD), Design of Building to Resist Progressive Collapse, Unified Facility
Criteria, UFC-4-023-03, Washington, U.S.A, 2013.
A.G. Marchis & A.M. Ioani / Acta Technica Napocensis: Civil Engineering & Architecture Vol. 59 No 2 (2016) 30-41
41
[4] SR EN 1998-1:2004/NA:2008 (Eurocode 8), Design of Structures for Earthquake Resistance – Part 1: General Rules, Seismic Actions and Rules for Buildings, ASRO, Bucharest, Romania, 2008 (in Romanian).
[5] ASCE 41-06, Seismic Rehabilitation of Existing Buildings, American Society of Civil Engineers, ISBN 970-0-7844-0884-1, Reston, Virginia, USA, 2006.
[6] P100-1/2013, Seismic design code – Part I: design Rules for Buildings, MTCT, Bucharest, Romania, 2013 (in Romanian).
[7] Baldridge S., Humay F., Preventing Progressive in Concrete Buildings, Concrete International, Vol. 25, 73-79 (2005).
[8] Ioani A.M., Cucu H.L., Mircea C., Seismic design vs. progressive collapse: a reinforced concrete framed structure case study, Proceedings of ISEC-4, Melbourne, Australia, 2007.
[9] Tsai M.H., Lin B.H., Investigation of Progressive Collapse Resistance and Inelastic Response for an Earthquake-resistant RC Building Subjected to Column Failure, Engineering Structures, Vol. 30, 3619-3628 (2008).
[10] Marchis A.G., Moldovan T.S., Ioani A.M., The Influence of the Seismic Design on the Progressive Collapse Resistance of Mid-Rise RC Framed Structures, Acta Technica Napocensis: Civil Engineering & Architecture, Vol. 56, No. 2, pp. 222-234, 2013.
[11] Choi H., Kim, J., Progressive collapse-resisting capacity of RC beam-column sub-assemblage, Magazine of Concrete Research, Vol. 63, No. 4, 2011.
[12] Sadek F., Main J.A., Lew H.S., Bao Y., Testing and Analysis of Steel and Concrete Beam-Column Assemblies under a Column Removal Scenario, Journal of Structural Engineering, Vol. 137, No. 9, pp. 881-892, 2011.
[13] Yap S.L., Li B., Experimental Investigation of Reinforced Concrete Exterior Beam-Column Subassemblages for Progressive Collapse, ACI Structural Journal, Vol. 108, No. 5, pp. 542-552, 2011.
[14] Yu J., Tan K.H., Experimental and numerical investigation on progressive collapse resistance of reinforced concrete beam column sub-assemblages, Engineering Structures, Vol. 55, pp. 90-106, 2013.
[15] Yi, W.J., He, Q.F., Xiao, Y., Kunnath, S.K., Experimental study on Progressive Collapse-resistant
behavior of reinforced concrete frame structures, ACI Structural Journal, Vol. 105, No. 4, pp.433-438,
2008.
[16] MIDAS FEA, Advanced Nonlinear and Detail Analysis System: Analysis and Algorithm, Midas Information Technology Co., Ltd.
[17] Moldovan T.S., Marchis A.G., Ioani A.M., Progressive Collapse Analysis of an old RC structure subjected to extreme loading, Proceedings of the International Conference People, Buildings and Environment 2014, Kromeriz, Czech Republic, 15-17 October, 2014.
[18] ACI 318-08, Building Code Requirements for Structural Concrete, American Concrete Institute,
2011.