![Reducing Architecture Limitations for Efficient Blue ...€¦ · 26/10/2017 · previous reports of improved film quality on top of PFI with low surface energy.[21] The nanocrystals](https://static.fdocuments.us/doc/165x107/607281c83ec3c01d773b007b/reducing-architecture-limitations-for-efficient-blue-26102017-previous.jpg)
Number 6007, 13 May 2015researchbriefings.files.parliament.uk/documents/SN06007/SN06007.pdf ·...
18
www.parliament.uk/commons-library | intranet.parliament.uk/commons-library | [email protected] | @commonslibrary BRIEFING PAPER Number 6007, 13 May 2015 PFI: costs and benefits By Lorna Booth Vasilisa Starodubtseva Inside: 1. Summary 2. Background to PFI 3. Advantages and limitations of PFI 4. Costs associated with PFIs 5. The future of Private Finance and PF2 6. Further information -15 -10 -5 0 5 10 2000/01 2010/11 2020/21 2030/31 2040/41 2050/51 £ billion Date project agreed Capital value and unitary charge figures for signed PFI projects Unitary charges (includes payments for e.g. maintenance, cleaning, security) Capital value (includes construction costs)
Transcript of Number 6007, 13 May 2015researchbriefings.files.parliament.uk/documents/SN06007/SN06007.pdf ·...
www.parliament.uk/commons-library | intranet.parliament.uk/commons-library | [email protected] | @commonslibrary
BRIEFING PAPER Number 6007, 13 May 2015
PFI: costs and benefits By Lorna Booth Vasilisa Starodubtseva
Inside: 1. Summary2. Background to PFI3. Advantages and limitations
of PFI4. Costs associated with PFIs5. The future of Private
Finance and PF26. Further information
-15
-10
-5
0
5
10
2000/01 2010/11 2020/21 2030/31 2040/41 2050/51
£ billion
Date project agreed
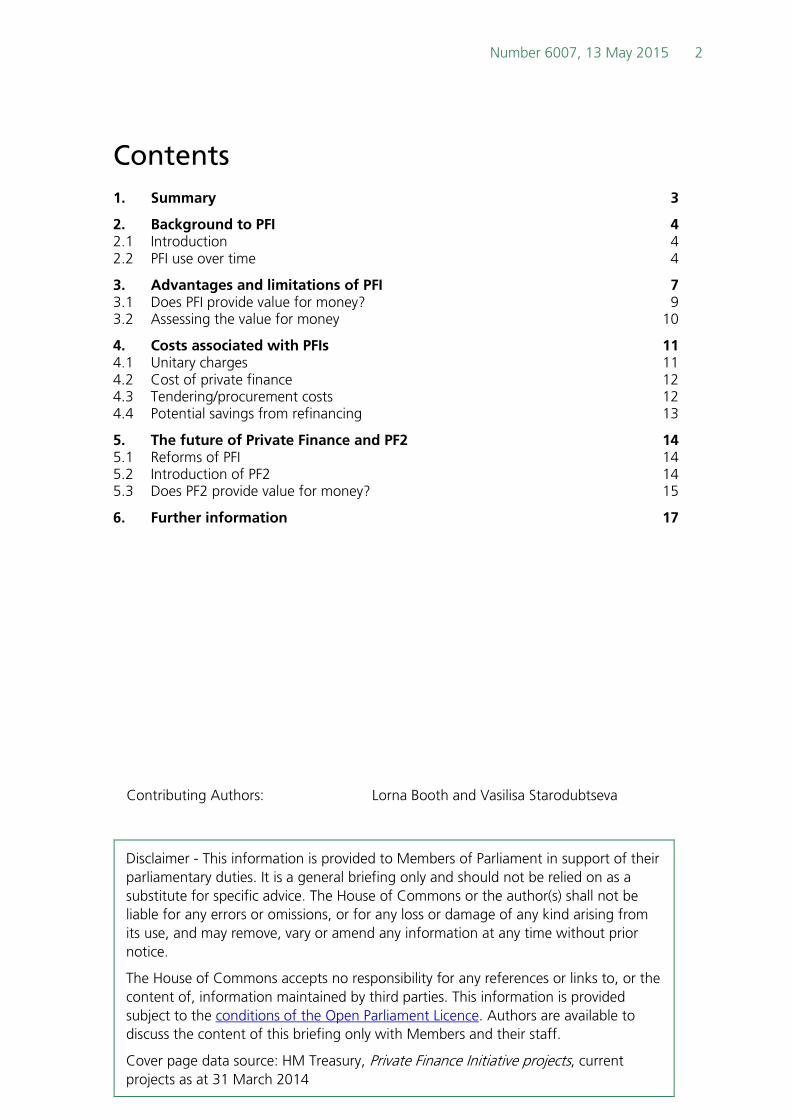
Capital value and unitary charge figures for signed PFI projects
Unitary charges (includespayments for e.g. maintenance, cleaning, security)
Capital value (includes construction costs)
Number 6007, 13 May 2015 2
Contents 1. Summary 3
2. Background to PFI 4 2.1 Introduction 4 2.2 PFI use over time 4
3. Advantages and limitations of PFI 7 3.1 Does PFI provide value for money? 9 3.2 Assessing the value for money 10
4. Costs associated with PFIs 11 4.1 Unitary charges 11 4.2 Cost of private finance 12 4.3 Tendering/procurement costs 12 4.4 Potential savings from refinancing 13
5. The future of Private Finance and PF2 14 5.1 Reforms of PFI 14 5.2 Introduction of PF2 14 5.3 Does PF2 provide value for money? 15
6. Further information 17
Contributing Authors: Lorna Booth and Vasilisa Starodubtseva
Disclaimer - This information is provided to Members of Parliament in support of their parliamentary duties. It is a general briefing only and should not be relied on as a substitute for specific advice. The House of Commons or the author(s) shall not be liable for any errors or omissions, or for any loss or damage of any kind arising from its use, and may remove, vary or amend any information at any time without prior notice.
The House of Commons accepts no responsibility for any references or links to, or the content of, information maintained by third parties. This information is provided subject to the conditions of the Open Parliament Licence. Authors are available to discuss the content of this briefing only with Members and their staff.
Cover page data source: HM Treasury, Private Finance Initiative projects, current projects as at 31 March 2014
3 PFI
1. Summary
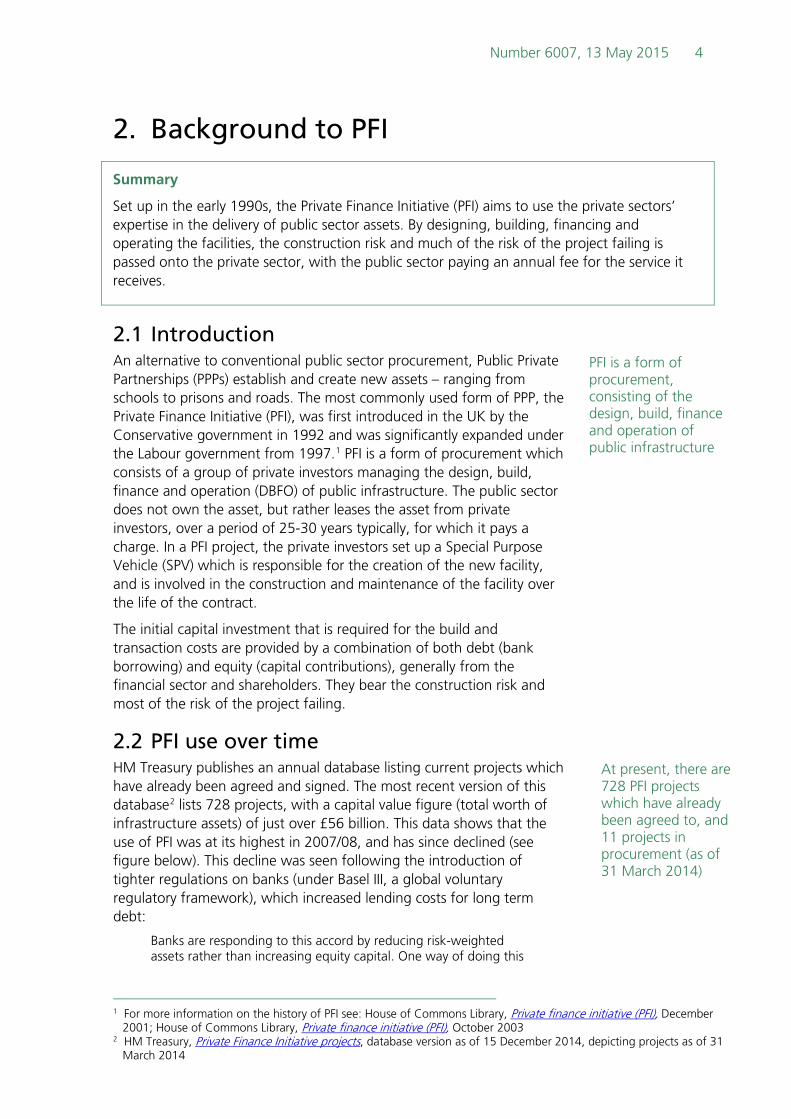
The Private Finance Initiative (PFI) was first introduced in the UK in the early 1990s, and was later expanded under the Labour government. As of March 2014, there were 728 active projects and a further 11 projects in procurement.
There is a lack of consensus on whether PFI projects offer value for money and it remains a controversial scheme. Supporters of PFI argue that risk is transferred to the private sector and that its performance is better than that of traditional public procurement. On the other hand, PFI is criticised for being inflexible and carrying higher costs. It is also argued there is scope for making savings in PFI projects.
PFI was used widely by departments in the period leading up to its peak in 2007/2008. Its use has declined since considerably, following the financial crisis and tighter banking regulations.
A major reform on PFI was announced by HM Treasury in 2012, resulting in the creation of Private Finance 2 (PF2). PF2 is a form of PFI but with a number of amendments. It was designed to speed up and simplify the procurement process. To date, only a small number of projects have been agreed to under the new regime.
Number 6007, 13 May 2015 4
At present, there are 728 PFI projects which have already been agreed to, and 11 projects in procurement (as of 31 March 2014)
PFI is a form of procurement, consisting of the design, build, finance and operation of public infrastructure
2. Background to PFI
Summary
Set up in the early 1990s, the Private Finance Initiative (PFI) aims to use the private sectors’ expertise in the delivery of public sector assets. By designing, building, financing and operating the facilities, the construction risk and much of the risk of the project failing is passed onto the private sector, with the public sector paying an annual fee for the service it receives.
2.1 Introduction An alternative to conventional public sector procurement, Public Private Partnerships (PPPs) establish and create new assets – ranging from schools to prisons and roads. The most commonly used form of PPP, the Private Finance Initiative (PFI), was first introduced in the UK by the Conservative government in 1992 and was significantly expanded under the Labour government from 1997.1 PFI is a form of procurement which consists of a group of private investors managing the design, build, finance and operation (DBFO) of public infrastructure. The public sector does not own the asset, but rather leases the asset from private investors, over a period of 25-30 years typically, for which it pays a charge. In a PFI project, the private investors set up a Special Purpose Vehicle (SPV) which is responsible for the creation of the new facility, and is involved in the construction and maintenance of the facility over the life of the contract.
The initial capital investment that is required for the build and transaction costs are provided by a combination of both debt (bank borrowing) and equity (capital contributions), generally from the financial sector and shareholders. They bear the construction risk and most of the risk of the project failing.
2.2 PFI use over time HM Treasury publishes an annual database listing current projects which have already been agreed and signed. The most recent version of this database2 lists 728 projects, with a capital value figure (total worth of infrastructure assets) of just over £56 billion. This data shows that the use of PFI was at its highest in 2007/08, and has since declined (see figure below). This decline was seen following the introduction of tighter regulations on banks (under Basel III, a global voluntary regulatory framework), which increased lending costs for long term debt:
Banks are responding to this accord by reducing risk-weighted assets rather than increasing equity capital. One way of doing this
1 For more information on the history of PFI see: House of Commons Library, Private finance initiative (PFI), December 2001; House of Commons Library, Private finance initiative (PFI), October 2003
2 HM Treasury, Private Finance Initiative projects, database version as of 15 December 2014, depicting projects as of 31 March 2014

5 PFI
PFI was widely used in mid 2000s, but has declined since its peak in 2007/08
is to reduce lending to sectors such as infrastructure, which require funding instruments with long maturities.3
Additionally, PFI projects experienced an increase in costs and charges following the financial crisis, due to a reduction in available financing.4
In 2013/14, nine projects were agreed, with a capital value of £1.4bn. In comparison, in 2007/08, 62 projects were agreed, with a capital value of £8.4bn. There are 11 projects in procurement at present.
Capital value of PFI projects agreed in each year (£ billion)
Source: HM Treasury, Private Finance Initiative projects, current projects as at 31 March 2014
Broken down further by government department, five departments account for 75% of the total capital value, and have procured a total of 477 projects out of the 728 projects reported in HM Treasury’s database (table below). The projects vary greatly in size, from a school for £3m to aircraft costing over £2.5bn.
Current PFI projects
Department Capital value
(£ million)
Unitary charge payments: 2015/16
(£ million)
Total unitary charge payments: 2015/16
onwards (£ million)
Number of PFI
projects
Department of Health 12,083 2,025 66,315 123
Of which NHS 11,845 1,961 64,944 105
Ministry of Defence 9,043 1,838 31,871 41
Department for Transport 7,879 1,238 27,592 62
Department for Education 7,800 1,082 22,254 168
Scottish Government 5,690 985 22,284 83
Other departments 14,060 3,299 51,878 251
Total 56,554 10,467 222,194 728
Notes: NHS figures are for all projects listed under the Department of Health with the exception of social care projects
3 Treasury Committee, Private Finance 2 Volume II, Tenth Report of Session 2013–14, June 2014, Ev w6 4 Treasury Committee, Private Finance 2 Volume II, Tenth Report of Session 2013–14, June 2014, Ev w6
0
1
2
3
4
5
6
7
8
9

Number 6007, 13 May 2015 6
Source: HM Treasury, Private Finance Initiative projects, current projects as at 31 March 2014.
Box 1: Accounting for PFI projects in the National Accounts
National Accounts use the European System of accounts (ESA) to distinguish between on and off balance sheet debt. If the risks and reward of a project is believed to be passed to the private sector, it is not recorded in the government borrowing figures, and remains off balance sheet. Approximately 90% of all PFI investment is off balance sheet, and is not recorded in National Accounts.5 Public spending statistics, such as the Public Sector Net Debt, also follow ESA.
The Office for Budgetary responsibility (OBR) states the following in relation to the off balance sheet classification for the majority of PFIs:
As well as lacking transparency, this generates a perception that PFI has been used as a way to hold down official estimates of public sector indebtedness for a given amount of overall capital spending, rather than to achieve value for money.6
Only the PFI contracts recorded on the balance sheet of the National Accounts feed into Public Sector Net Debt figures. The OBR has stated that if all of the investment carried out through PFI was carried out through conventional debt financing, Public Sector Net Debt would have increased by 2% of GDP.7
5 National Audit Office, Choice of finance for capital investment, March 2015, p31 6 Office for Budget Responsibility, Fiscal sustainability report, July 2014, para 2.72 7 Office for Budget Responsibility, Fiscal sustainability report, July 2014, para 2.78
7 PFI
3. Advantages and limitations ofPFI
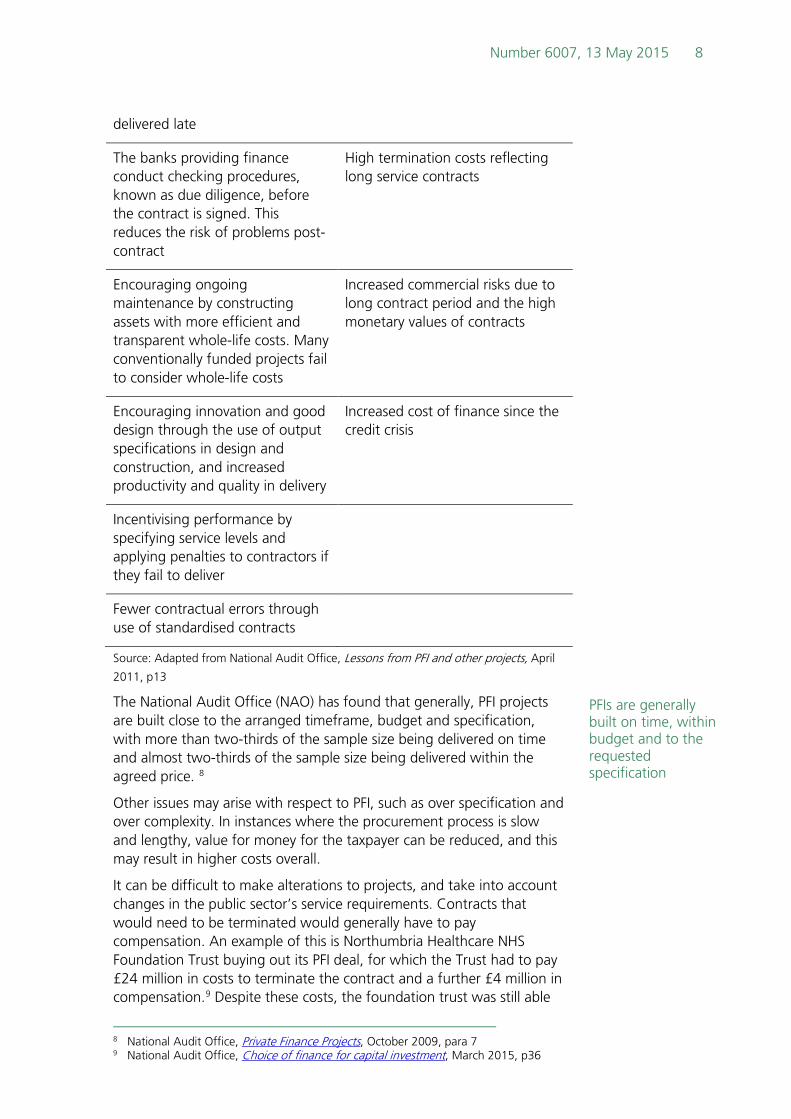
Summary
PFI projects can deliver benefits but are complex.
Potential benefits include:
• Risk transfer to the private sector from the public sector
• Provides an opportunity to deliver an asset which may be difficult to finance or procureconventionally.
• Encourages ongoing maintenance via more transparent whole-life costs
Limitations of PFIs include:
• Higher cost of finance
• Inflexible contracts
• Ultimate risk lies with public sector
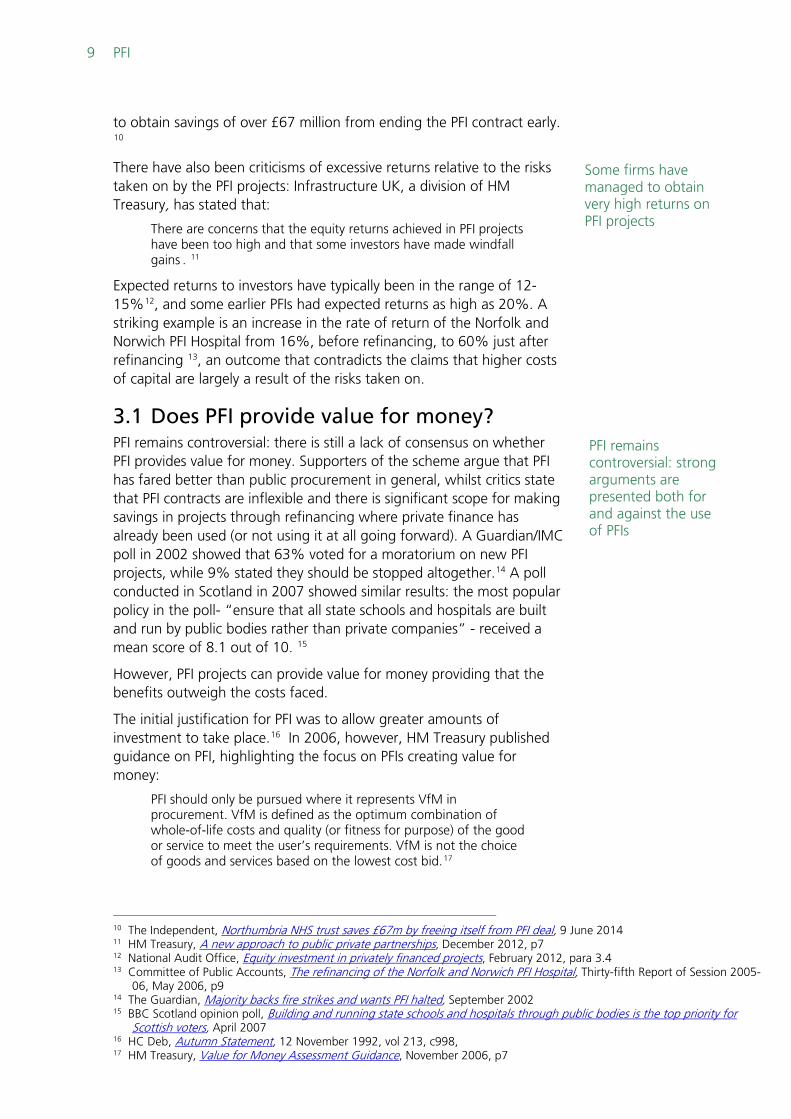
The National Audit Office produced a report in 2011 outlining both the potential benefits and disadvantages of PFI, drawing on prior research conducted:
Potential benefits include: Potential disadvantages include:
The delivery of an asset which might be difficult to finance conventionally
Assumptions that using PFI reduces the need for a robust value for money assessment to be conducted
Potential to do things that would be difficult using conventional routes. For example, encouraging the development of a new private sector industry
Reduced contract flexibility – the bank loans used to finance construction require a long payback period. This results in long service contracts which may be difficult to change
Encouraging the allocation of risks to those most able to manage them, achieving overall cost efficiencies and greater certainty of success
The public sector pays for the risk transfer inherent in private finance contracts but ultimate risk lies with the public sector
Delivery to time and price. The private sector is not paid until the asset has been delivered which encourages timely delivery. PFI construction contracts are fixed price contracts with financial consequences for contractors if
Private finance is inherently complicated which can add to timescales and reliance on advisers
Number 6007, 13 May 2015 8
PFIs are generally built on time, within budget and to the requested specification
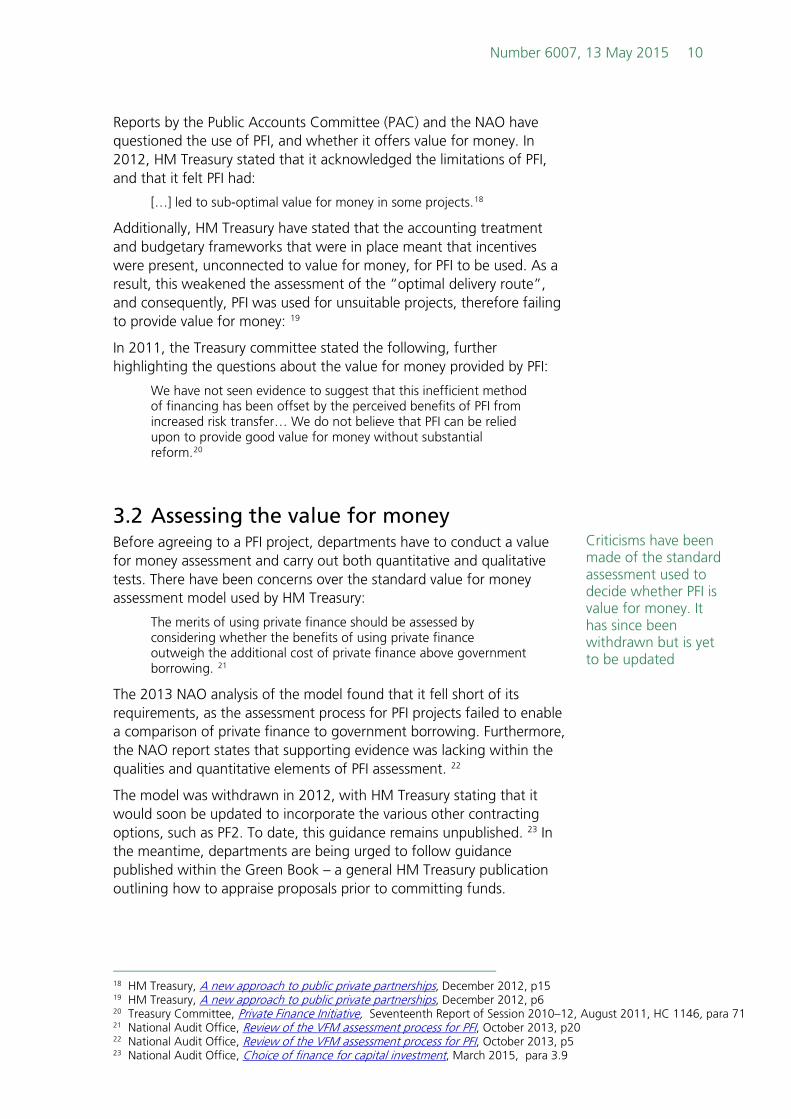
delivered late
The banks providing finance conduct checking procedures, known as due diligence, before the contract is signed. This reduces the risk of problems post-contract
High termination costs reflecting long service contracts
Encouraging ongoing maintenance by constructing assets with more efficient and transparent whole-life costs. Many conventionally funded projects fail to consider whole-life costs
Increased commercial risks due to long contract period and the high monetary values of contracts
Encouraging innovation and good design through the use of output specifications in design and construction, and increased productivity and quality in delivery
Increased cost of finance since the credit crisis
Incentivising performance by specifying service levels and applying penalties to contractors if they fail to deliver
Fewer contractual errors through use of standardised contracts
Source: Adapted from National Audit Office, Lessons from PFI and other projects, April
2011, p13
The National Audit Office (NAO) has found that generally, PFI projects are built close to the arranged timeframe, budget and specification, with more than two-thirds of the sample size being delivered on time and almost two-thirds of the sample size being delivered within the agreed price. 8
Other issues may arise with respect to PFI, such as over specification and over complexity. In instances where the procurement process is slow and lengthy, value for money for the taxpayer can be reduced, and this may result in higher costs overall.
It can be difficult to make alterations to projects, and take into account changes in the public sector’s service requirements. Contracts that would need to be terminated would generally have to pay compensation. An example of this is Northumbria Healthcare NHS Foundation Trust buying out its PFI deal, for which the Trust had to pay £24 million in costs to terminate the contract and a further £4 million in compensation.9 Despite these costs, the foundation trust was still able
8 National Audit Office, Private Finance Projects, October 2009, para 7 9 National Audit Office, Choice of finance for capital investment, March 2015, p36
9 PFI
Some firms have managed to obtain very high returns on PFI projects
PFI remains controversial: strong arguments are presented both for and against the use of PFIs
to obtain savings of over £67 million from ending the PFI contract early. 10
There have also been criticisms of excessive returns relative to the risks taken on by the PFI projects: Infrastructure UK, a division of HM Treasury, has stated that:
There are concerns that the equity returns achieved in PFI projects have been too high and that some investors have made windfall gains . 11
Expected returns to investors have typically been in the range of 12-15%12, and some earlier PFIs had expected returns as high as 20%. A striking example is an increase in the rate of return of the Norfolk and Norwich PFI Hospital from 16%, before refinancing, to 60% just after refinancing 13, an outcome that contradicts the claims that higher costs of capital are largely a result of the risks taken on.
3.1 Does PFI provide value for money? PFI remains controversial: there is still a lack of consensus on whether PFI provides value for money. Supporters of the scheme argue that PFI has fared better than public procurement in general, whilst critics state that PFI contracts are inflexible and there is significant scope for making savings in projects through refinancing where private finance has already been used (or not using it at all going forward). A Guardian/IMC poll in 2002 showed that 63% voted for a moratorium on new PFI projects, while 9% stated they should be stopped altogether.14 A poll conducted in Scotland in 2007 showed similar results: the most popular policy in the poll- “ensure that all state schools and hospitals are built and run by public bodies rather than private companies” - received a mean score of 8.1 out of 10. 15
However, PFI projects can provide value for money providing that the benefits outweigh the costs faced.
The initial justification for PFI was to allow greater amounts of investment to take place.16 In 2006, however, HM Treasury published guidance on PFI, highlighting the focus on PFIs creating value for money:
PFI should only be pursued where it represents VfM in procurement. VfM is defined as the optimum combination of whole-of-life costs and quality (or fitness for purpose) of the good or service to meet the user’s requirements. VfM is not the choice of goods and services based on the lowest cost bid.17
10 The Independent, Northumbria NHS trust saves £67m by freeing itself from PFI deal, 9 June 2014 11 HM Treasury, A new approach to public private partnerships, December 2012, p7 12 National Audit Office, Equity investment in privately financed projects, February 2012, para 3.4 13 Committee of Public Accounts, The refinancing of the Norfolk and Norwich PFI Hospital, Thirty-fifth Report of Session 2005-
06, May 2006, p9 14 The Guardian, Majority backs fire strikes and wants PFI halted, September 2002 15 BBC Scotland opinion poll, Building and running state schools and hospitals through public bodies is the top priority for
Scottish voters, April 2007 16 HC Deb, Autumn Statement, 12 November 1992, vol 213, c998, 17 HM Treasury, Value for Money Assessment Guidance, November 2006, p7
Number 6007, 13 May 2015 10
Criticisms have been made of the standard assessment used to decide whether PFI is value for money. It has since been withdrawn but is yet to be updated
Reports by the Public Accounts Committee (PAC) and the NAO have questioned the use of PFI, and whether it offers value for money. In 2012, HM Treasury stated that it acknowledged the limitations of PFI, and that it felt PFI had:
[…] led to sub-optimal value for money in some projects.18
Additionally, HM Treasury have stated that the accounting treatment and budgetary frameworks that were in place meant that incentives were present, unconnected to value for money, for PFI to be used. As a result, this weakened the assessment of the “optimal delivery route”, and consequently, PFI was used for unsuitable projects, therefore failing to provide value for money: 19
In 2011, the Treasury committee stated the following, further highlighting the questions about the value for money provided by PFI:
We have not seen evidence to suggest that this inefficient method of financing has been offset by the perceived benefits of PFI from increased risk transfer… We do not believe that PFI can be relied upon to provide good value for money without substantial reform.20
3.2 Assessing the value for money Before agreeing to a PFI project, departments have to conduct a value for money assessment and carry out both quantitative and qualitative tests. There have been concerns over the standard value for money assessment model used by HM Treasury:
The merits of using private finance should be assessed by considering whether the benefits of using private finance outweigh the additional cost of private finance above government borrowing. 21
The 2013 NAO analysis of the model found that it fell short of its requirements, as the assessment process for PFI projects failed to enable a comparison of private finance to government borrowing. Furthermore, the NAO report states that supporting evidence was lacking within the qualities and quantitative elements of PFI assessment. 22
The model was withdrawn in 2012, with HM Treasury stating that it would soon be updated to incorporate the various other contracting options, such as PF2. To date, this guidance remains unpublished. 23 In the meantime, departments are being urged to follow guidance published within the Green Book – a general HM Treasury publication outlining how to appraise proposals prior to committing funds.
18 HM Treasury, A new approach to public private partnerships, December 2012, p15 19 HM Treasury, A new approach to public private partnerships, December 2012, p6 20 Treasury Committee, Private Finance Initiative, Seventeenth Report of Session 2010–12, August 2011, HC 1146, para 71 21 National Audit Office, Review of the VFM assessment process for PFI, October 2013, p20 22 National Audit Office, Review of the VFM assessment process for PFI, October 2013, p5 23 National Audit Office, Choice of finance for capital investment, March 2015, para 3.9
11 PFI
The unitary charge figures for all PFIs will peak at 0.5% of GDP in 2017/18
4. Costs associated with PFIs
Summary
PFIs have a number of costs associated with them: unitary charges, financing costs and tendering costs. Unitary charges are paid in return for the service the public sector obtains. The financing cost is the interest and other charges which are incurred as a result of borrowing funds. The financing cost for PFIs includes a premium for using private finance. Tendering and procurement costs are applicable to private finance much as they are to traditional procurement.
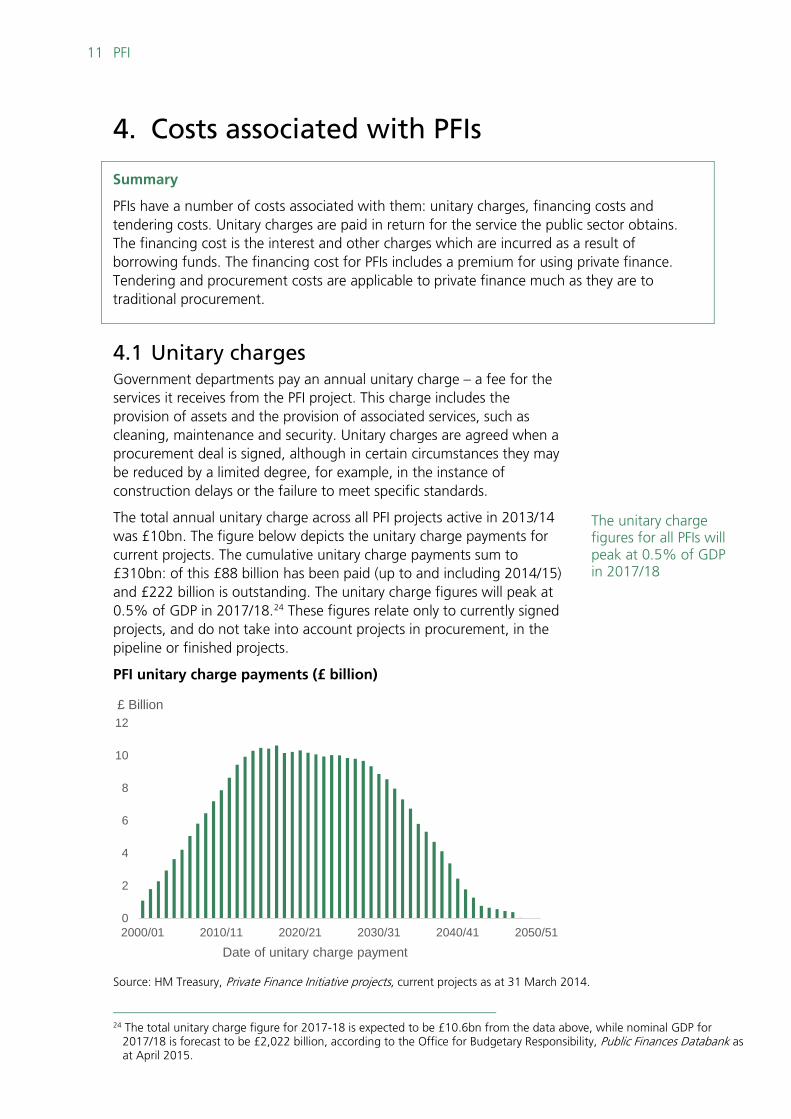
4.1 Unitary charges Government departments pay an annual unitary charge – a fee for the services it receives from the PFI project. This charge includes the provision of assets and the provision of associated services, such as cleaning, maintenance and security. Unitary charges are agreed when a procurement deal is signed, although in certain circumstances they may be reduced by a limited degree, for example, in the instance of construction delays or the failure to meet specific standards.
The total annual unitary charge across all PFI projects active in 2013/14 was £10bn. The figure below depicts the unitary charge payments for current projects. The cumulative unitary charge payments sum to £310bn: of this £88 billion has been paid (up to and including 2014/15) and £222 billion is outstanding. The unitary charge figures will peak at 0.5% of GDP in 2017/18.24 These figures relate only to currently signed projects, and do not take into account projects in procurement, in the pipeline or finished projects.
PFI unitary charge payments (£ billion)
Source: HM Treasury, Private Finance Initiative projects, current projects as at 31 March 2014.
24 The total unitary charge figure for 2017-18 is expected to be £10.6bn from the data above, while nominal GDP for 2017/18 is forecast to be £2,022 billion, according to the Office for Budgetary Responsibility, Public Finances Databank as at April 2015.
0
2
4
6
8
10
12
2000/01 2010/11 2020/21 2030/31 2040/41 2050/51
£ Billion
Date of unitary charge payment
Number 6007, 13 May 2015 12
Cost of private finance is double the cost of government borrowing
Delays in the procurement of projects may worsen financing costs
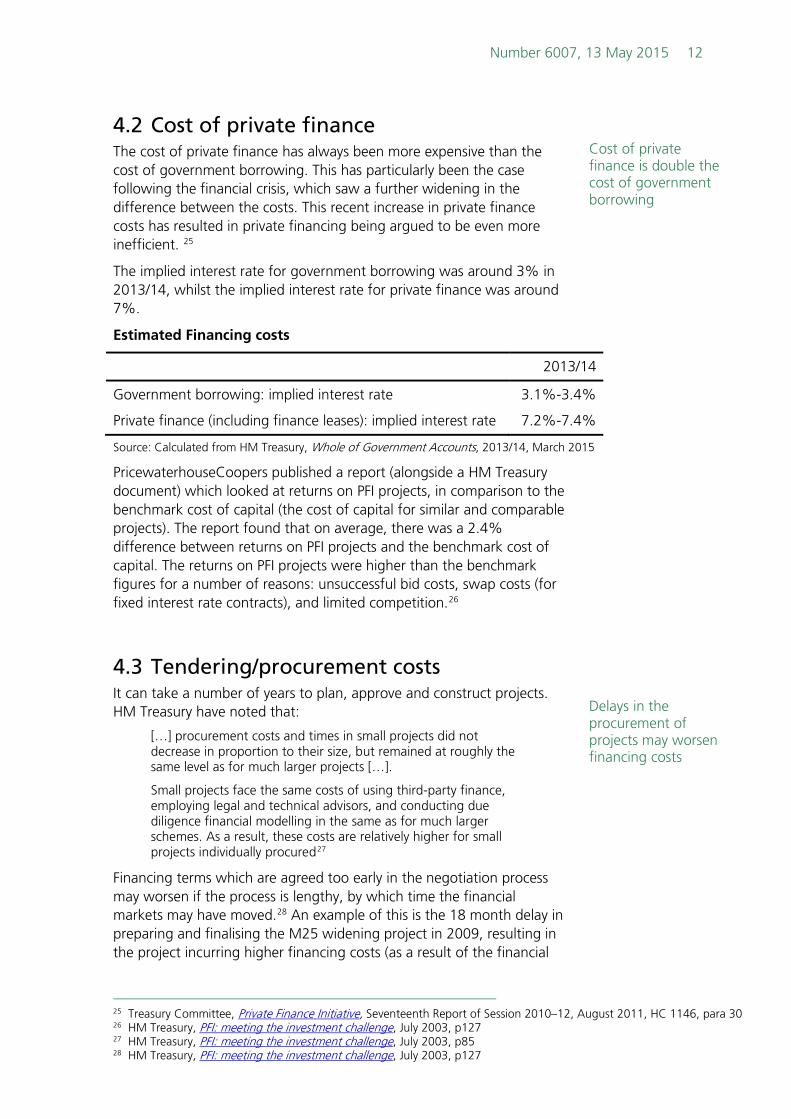
4.2 Cost of private finance The cost of private finance has always been more expensive than the cost of government borrowing. This has particularly been the case following the financial crisis, which saw a further widening in the difference between the costs. This recent increase in private finance costs has resulted in private financing being argued to be even more inefficient. 25
The implied interest rate for government borrowing was around 3% in 2013/14, whilst the implied interest rate for private finance was around 7%.
Estimated Financing costs
2013/14
Government borrowing: implied interest rate 3.1%-3.4%
Private finance (including finance leases): implied interest rate 7.2%-7.4%
Source: Calculated from HM Treasury, Whole of Government Accounts, 2013/14, March 2015
PricewaterhouseCoopers published a report (alongside a HM Treasury document) which looked at returns on PFI projects, in comparison to the benchmark cost of capital (the cost of capital for similar and comparable projects). The report found that on average, there was a 2.4% difference between returns on PFI projects and the benchmark cost of capital. The returns on PFI projects were higher than the benchmark figures for a number of reasons: unsuccessful bid costs, swap costs (for fixed interest rate contracts), and limited competition.26
4.3 Tendering/procurement costs It can take a number of years to plan, approve and construct projects. HM Treasury have noted that:
[…] procurement costs and times in small projects did not decrease in proportion to their size, but remained at roughly the same level as for much larger projects […].
Small projects face the same costs of using third-party finance, employing legal and technical advisors, and conducting due diligence financial modelling in the same as for much larger schemes. As a result, these costs are relatively higher for small projects individually procured27
Financing terms which are agreed too early in the negotiation process may worsen if the process is lengthy, by which time the financial markets may have moved.28 An example of this is the 18 month delay in preparing and finalising the M25 widening project in 2009, resulting in the project incurring higher financing costs (as a result of the financial
25 Treasury Committee, Private Finance Initiative, Seventeenth Report of Session 2010–12, August 2011, HC 1146, para 30 26 HM Treasury, PFI: meeting the investment challenge, July 2003, p127 27 HM Treasury, PFI: meeting the investment challenge, July 2003, p85 28 HM Treasury, PFI: meeting the investment challenge, July 2003, p127

13 PFI
There is potential to make savings from previously signed PFIs
crisis) by £660 million. 29 Additionally, analysis of the procurement timescales shows that the time taken for a PFI project to be agreed and signed has increased in recent years. For large projects, it can take as long as five years between the date the project is agreed and the financing decision being made30, however these limitations were addressed in the design and features of PF2- see Section 5.2: Introduction of PF2.
There have also been instances where the decision to use private finance was made whilst private finance costs were relatively low, but had increased significantly by the time financial close was reached, by which point the relevant departments were not able to use traditional procurement instead.31
4.4 Potential savings from refinancing To date, some savings have been made from previously signed PFI projects. In 2006, HM Treasury issued guidance to assist departments and public authorities to be able to implement strategies which are cost effective, in addition to managing successfully risks arising from both interest rate and inflation.32 NAO analysis shows that the majority of PFI projects have used interest rate swaps to ensure future costs are fixed.33 However, although swaps provide certainty over future costs, swaps also reduce potential gains from refinancing if interest rates were to fall.
Gain-sharing agreements were introduced in 2008 – this enabled departments to benefit from any gains made through refinancing, renegotiations or buy-outs of private finance deals. Additionally, authorities obtained the right to request refinancing.34 However, there have been few such examples. To date, four refinancings have been identified, with the most recent – Thameslink rolling stock, completed in February 2015 – potentially leading to taxpayer savings due to lower borrowing costs. 35
There have also been some recent efficiency savings in PFI projects- see Section 5.1 Reform of PFI.
29 National Audit Office, Procurement of the M25 private finance contract, November 2011, HC 566, para 22 30 National Audit Office, Choice of finance for capital investment, March 2015, para 3.17 31 National Audit Office, Choice of finance for capital investment, March 2015, paras 3.16-3.17 32 HM Treasury, Application Note – interest rate and inflation risks in PFI contracts, May 2006 33 National Audit Office, Choice of finance for capital investment, March 2015, paras 4.6 34 HM Treasury, Public Private Partnerships- Technical Update 2010, para 2.21 35 National Audit Office, Choice of finance for capital investment, March 2015, paras 14, 3.18
Number 6007, 13 May 2015 14
PF2 was designed to deal with limitations of PFI, allow greater transparency and reliability
A number of reforms of PFIs have been implemented already
5. The future of Private Financeand PF2
Summary
Following a review of PFIs in 2011, a number a reforms have been implemented, alongside the introduction of Private Finance 2 (PF2). PF2 is an amended form of PFI, which takes into account criticisms and concerns raised with PFI.
5.1 Reforms of PFI A number of reforms were introduced by the Coalition government of 2010-15 to address the issues with PFI:
• The launch of the Operational PFI Savings Programme, aprogramme aiming to maximise efficiency savings from PFIprojects. The Coalition government was looking to make savingsof at least £1.5 billion, a figure which was exceeded by December2012. (By June 2013, £1.6bn36 of savings had been reported bydepartments to HM Treasury). In March 2015, HM Treasuryreported that the programme secured £2.1 billion in savings, andis seeking a further £2 billion in savings.37
• The introduction of new arrangements to strengthen scrutiny andcontrol of major projects and their approval, including thestandardisation of documents
• The introduction of a number of initiatives aiming to supportinfrastructure delivery, such as the UK Guarantee scheme
• The introduction of a £70 billion control total, limiting thepayments under future PFI and PF2 contracts over the five yearsfrom 2015-2016 onwards, allowing around £1 billion of new PF2projects each year.38
The Coalition government, however, also acknowledged the need to address the limitations of PFIs and the concerns raised over the value for money component in particular. In 2011 the Coalition government undertook a call for evidence on the reform of PFI, and received 155 responses. These responses were used as evidence in the review of PFI.
5.2 Introduction of PF2 Following the review of evidence submitted on PFIs, in 2012 the Coalition government introduced a new initiative – Private Finance 2 (PF2). PF2 is an amended form of PFI. The scheme would continue to draw on private sector expertise and finance but would also address previously raised concerns with PFIs. PF2 is also expected to respond to changes in the economic context, and aims to increase financial
36 Of the reported £1.6 billion of forecast signed savings, there is sufficient evidence for £1.2billion, and partial evidence for £0.5 billion. The £1.3bn savings pipeline is anticipated to deliver future savings. National Audit Office, Savings from operational PFI contracts, November 2013, paras 10-12
37 HM Treasury, Efficiency drive by government on PPPs nets £2.1 billion, 27 March 2015 38 Treasury Committee, Private Finance 2, Tenth Report of Session 2013-14, HC 97, March 2014, para 34
15 PFI
There is a lack of consensus on whether the added aspects of PF2 will provide value for money
transparency, hence enforcing greater accountability for project delivery and operation. The Coalition government planned to achieve greater levels of transparency and decision making by holding a minority equity stake in the project, of between 25% and 49%.39 Other distinctions from traditional PFI include a limitation on the tendering phase to 18-months and the removal of soft services (such as cleaning and security), management services and other services (such as IT, reception, telephone services) from projects. PF2 is also expected to be simplified and faster generally, streamlining the procurement process by introducing new standardised documentation. 40
Since its introduction in 2012, only a small number of projects have been agreed via PF2, the first of which was the Priority School Building Programme (PSBP), a programme set up to address the needs of the schools in most urgent need of repair. The PF2 programme consisted of 46 schools split into five batches, of which three were agreed in March 2015, and the remaining two batches are anticipated to be agreed by the end of 2015. The total funding requirement is £700 million. Other PF2 projects that have reached financial close include the Papworth Hospital – New Cardiothoracic Centre, Hull City Council Extra Care Housing (both projects procured by Department of Health), and housing projects procured by Department for Communities and Local Government.
5.3 Does PF2 provide value for money? PF2 has been designed to ensure that it is more flexible that PFI, by reducing the provision of soft services, such as cleaning, catering and security, and hence ensuring the contractor continues to be incentivised to take into account operational costs that may arise in the future. Instead, such soft services are to be provided separately through separate contracts or directly by the relevant authority. It is believed that this will provide the public sector with greater flexibility to amend service requirements as necessary. 41
HM Treasury have stated that holding a minority stake in the project will significantly strengthen the collaboration between the public and private sectors. Additionally, it is anticipated that this will enable increased financial transparency and visibility for the public sector, and stronger involvement in decision making. Finally, value for money is expected to be improved: by holding a minority equity stake, the public sector will receive a proportion of investment returns, subject to proper management of project risk, consequently reducing the cost to the public sector.42 It is important to note, however, that there is no guaranteed return on the public sector’s investment.
39 Companies Act 2006 states that certain constitutional matters can be blocked by shareholders with 25% stake or more, hence a stake of 25%-49% ensures the public sector has some control but remains a minority investor.
40 HM Treasury, A new approach to public private partnerships, December 2012, p9 41 HM Treasury, A new approach to public private partnerships, December 2012, para 4.5 42 HM Treasury, A new approach to public private partnerships, December 2012, p7
Number 6007, 13 May 2015 16
There are concerns that increasing the equity proportion of the project will increase the overall cost of capital of the project: cost of equity is higher than the cost of debt, partly because it carries greater risk.43 On the other hand, by increasing the amount of equity within the project, the new structure may enhance the debt rating, making it more attractive to a wider range of providers of long-term debt and therefore bring down the costs. 44
The transfer of risk to the private sector is perceived to be lower than under PFI45, limiting the value of money PF2 will deliver:
Witnesses told us that PF2 will involve less risk transfer than PFI. Witnesses also said that PF2 would increase the cost of capital still further. If they are right, the value for money of PF2 contracts for the taxpayer will—unless PF2 delivers savings in other areas, such as construction—be even lower than that of PFI for money of the scheme.46
It is also important to take into account any benefits or opportunities that may be missed as a result of the public sector’s money being used for equity investment rather than elsewhere, such as in the reduction of public sector debt.47 If this investment could instead be allocated to another source which would result in better returns for the taxpayer, the PF2 project would represent lower value for money.
43 HM Treasury, A new approach to public private partnerships, December 2012, para 2.9 44 HM Treasury, A new approach to public private partnerships, December 2012, para 2.8 45 Treasury Committee, Private Finance 2, Tenth Report of Session 2013-14, HC 97, March 2014, paras 51-53 46 Treasury Committee, Private Finance 2, Tenth Report of Session 2013-14, HC 97, March 2014, para 53 47 Treasury Committee, Private Finance 2, Tenth Report of Session 2013-14, HC 97, March 2014, para 50
17 PFI
6. Further information
Information on PFI projects is available within HM Treasury’s Private Finance Initiative projects page, which contains a dataset of PFI deals and a summary of the dataset.
The dataset contains PFI projects for all government departments which have been agreed as of 31 March 2014. The database also contains information on unitary charges and when they fall due, capital value figures and equity holders’ details.
The webpage also provides a brief database of projects which are in procurement as of 31 March 2014.
The database is released on an annual basis, usually in December, containing data for PFI projects as of the previous March. The most recent version of the database used within this briefing paper was released in December 2014.
Information on the most recent PFI/PF2 projects is also available, within HMT PFI/PF2 business case approval trackers. This webpage lists the departments that are currently in the process of procuring a new PFI/PF2 project, and gives a timeline for each, showing the stage the project has reached.

BRIEFING PAPER Number 6007, 13 May 2015
The House of Commons Library research service provides MPs and their staff with the impartial briefing and evidence base they need to do their work in scrutinising Government, proposing legislation, and supporting constituents.
As well as providing MPs with a confidential service we publish open briefing papers, which are available on the Parliament website.
Every effort is made to ensure that the information contained in these publically available research briefings is correct at the time of publication. Readers should be aware however that briefings are not necessarily updated or otherwise amended to reflect subsequent changes.
If you have any comments on our briefings please email [email protected]