Nuclei Detection in Skin Whole-Slide Histopathological Images
7
Nuclei Detection in Skin Whole-Slide Histopathological Images Wenjun Wu Department of Biomedical Informatics and Medical Education University of Washington Seattle, WA, 98195 [email protected] Shima Nofallah Paul G. Allen school of Computer Science and Engineering University of Washington Seattle, WA 98195 [email protected] Abstract Skin cancer is one of the most malignant types of cancer and melanoma is the most aggressive type among skin cancers. In melanoma diagnosis, analysis of various processes on the images in cellular and architectural levels are needed and the collection of information resulted from these processes is the basis of diagnosis of melanoma stage. Nuclei are important for both diagnosis and detecting other entities in cellular level; thus, we aimed to detect nuclei in histopathological images of skin biopsies, using an AdaBoost classifier. First, a set of features containing intensity-based and structure-based features was created. Then, we used AdaBoost to train on features and create a strong learner from a series of rules from weak learners based on pixel features. As a post-process step, morphological functions were applied to the results. 1 Introduction The incidence of melanoma is rising faster than any other cancer, and 1 in 50 U.S. adults will be diagnosed with melanoma this year alone. The gold standard for diagnosis of skin cancer is the histopathological examination which the specimen is examined by pathologist manually [Cire¸ san et al., 2013]. However, the whole slide image of one tissue sample usually has the size of 2.2 × 10 9 pixels, which impose large difficulty for the pathologist to analyze the image completely. Thus, manual diagnosis only based on a small portion of the image is often subjective and prone to variability and automated diagnosis based on the entire slide is more desired [Lu and Mandal, 2012]. In melanoma diagnosis, analysis of various processes on the images in cellular and architectural levels are needed and the collection of information resulted from these processes is the basis of diagnosis of melanoma stage. Nuclei are important for both diagnosis and detecting other entities (i.e. melanocytes, mitotic figures) in cellular level. Many publications on nucleus detection are available. A simple and often used technique is thresh- olding. Other techniques contain fuzzy c-means clustering [Hafiane et al., 2008] and and adaptive thresholding [Petushi et al., 2006]. However, thresholding techniques require images with a well- defined, preferably uniform background. Due to the large variation in staining uptake within an image, this is often not possible [Gurcan et al., 2009].
Transcript of Nuclei Detection in Skin Whole-Slide Histopathological Images

Nuclei Detection in Skin Whole-SlideHistopathological Images
Wenjun WuDepartment of Biomedical Informatics and Medical Education
University of WashingtonSeattle, WA, [email protected]
Shima NofallahPaul G. Allen school of Computer Science and Engineering
University of WashingtonSeattle, WA 98195
Abstract
Skin cancer is one of the most malignant types of cancer and melanoma is the mostaggressive type among skin cancers. In melanoma diagnosis, analysis of variousprocesses on the images in cellular and architectural levels are needed and thecollection of information resulted from these processes is the basis of diagnosisof melanoma stage. Nuclei are important for both diagnosis and detecting otherentities in cellular level; thus, we aimed to detect nuclei in histopathological imagesof skin biopsies, using an AdaBoost classifier. First, a set of features containingintensity-based and structure-based features was created. Then, we used AdaBoostto train on features and create a strong learner from a series of rules from weaklearners based on pixel features. As a post-process step, morphological functionswere applied to the results.
1 Introduction
The incidence of melanoma is rising faster than any other cancer, and 1 in 50 U.S. adults will bediagnosed with melanoma this year alone. The gold standard for diagnosis of skin cancer is thehistopathological examination which the specimen is examined by pathologist manually [Ciresanet al., 2013]. However, the whole slide image of one tissue sample usually has the size of 2.2× 10⁹
pixels, which impose large difficulty for the pathologist to analyze the image completely. Thus,manual diagnosis only based on a small portion of the image is often subjective and prone to variabilityand automated diagnosis based on the entire slide is more desired [Lu and Mandal, 2012].
In melanoma diagnosis, analysis of various processes on the images in cellular and architecturallevels are needed and the collection of information resulted from these processes is the basis ofdiagnosis of melanoma stage. Nuclei are important for both diagnosis and detecting other entities (i.e.melanocytes, mitotic figures) in cellular level.
Many publications on nucleus detection are available. A simple and often used technique is thresh-olding. Other techniques contain fuzzy c-means clustering [Hafiane et al., 2008] and and adaptivethresholding [Petushi et al., 2006]. However, thresholding techniques require images with a well-defined, preferably uniform background. Due to the large variation in staining uptake within animage, this is often not possible [Gurcan et al., 2009].

Edge-based segmentation techniques, which try to connect local maxima of the gradient image,like the h-maxima transform [Wählby et al., 2004], are overly sensitive to image texture. Finally, amore sophisticated approach using edge-information is the Hough transform [Ortiz de Solorzanoet al., 2001]. However, the performance of this method drops for noncircular nuclei and has a highcomputational complexity.
There are also approaches using Machine Learning reported by in literature. Wang et al. [Wang et al.,2006] and Vink et al. [Vink and de Haan, 2011] both used Adaboost and report better performanceover support vector machine, which is the baseline method for classification task. Also, it would bepossible to construct a efficient classifier with a small subset of features from a large set of potentiallyuseful feature sets, which could provide insights into good features as well.
Based on our findings, We proposed to use Adaboost for constructing the nuclues detector in skinwhole-slide histopathological images.
2 Dataset
We had access to 240 cases of skin biopsy images, acquired by University of Washington Schoolof Medicine in their MPATH study (R01 CA151306). This dataset contains 5 different diagnoses:Benign, Atypia, Melanoma in-situ, Invasive melanoma stage T1a, Invasive melanoma ≥ stage T1b.Figure 1. shows an example of a melanoma stage T1a case. Layers of the skin on biopsy specimensare as follow: the epidermis on top, the dermis below it, and the hypodermis below that layer. Weused one large image of size about 8000x4500 pixels, labeled it and divided it to training, validationand testing crops.
Figure 1: An example of a skin biopsy image, melanoma stage T1a (left) and a zoomed sample ofdermis-epidermis region (right)
3 Method
Nuclei are important for both diagnosis and detecting other entities in cellular level; thus, we aimed todetect nuclei in histopathological images of skin biopsies, using AdaBoost classifier with two featuresset. The schematic flow of our proposed system can be seen in Figure 2. First, a set of features foreach pixel was calculated. In addition to that, we also calculated structure-based features for theimage. Since we had a very large feature space, we ran PCA on it. Then, we splitted the data andused validation set to optimize hyperparameters. Next, the optimal Adaboost classifier was trained onfeatures to create a strong learner from a series of rules from weak learners. Then, morphologicalfunctions was applied to the output to fill the holes and have a better result. Finally, we identified theconnected components in the nucleus mask and the centroid of the identified nucleus. We’ll go intodetails of methodology in the following subsections.
3.1 Feature Sets
To train a detector, AdaBoost requires a set of features. Two sets of features were calculated fromthe images in order to train and test the classifier, as shown in Figure 3. First set of features wasintensity-based [Vink et al., 2013] and the second one was structure-based features [Li and Allinson,2008]. For the intensity-based features, we used several window sizes of S = 3, 5, 9, 15, 19, 25. Hereare the features in each set:
2

Figure 2: An overview of proposed method.
Figure 3: Detail view of feature extraction.
3.1.1 Intensity-Based Features:
This set of features was applied to a window WS of size SxS for each pixel pi,j . The set containedSum, Dynamic Range (i.e. absolute difference between the maximum and minimum pixel valuesin the window), Variance, Median and Haar-like (HL) features. HL features are used for takingthe contrast of background and nuclei into account. These features are two types: adjacent andnonadjacent features and are calculates as below:
Haar Like Features:
• adjacent HL:
HLW1,W2(pi,j) = SqSum(W12, pi,j)− η.SqSum(W1, pi,j)
W12 =W1 + 2 ·W2
(1)
3

• nonadjacent HL:
HLNAW1,W2,W3(pi,j) = SqSum(W123, pi,j)
− SqSum(W12, pi,j)
− η′.SqSum(W1, pi,j)
W123 =W1 + 2 · (W2 +W3)
(2)
• nonadjacent HL2:
HLNA2W1,W2,W3,W4(pi,j) = SqSum(W1234, pi,j)
− SqSum(W123, pi,j)
− η′′.SqSum(W12, pi,j)
− SqSum(W1, pi,j)
W1234 =W123 + 2 ·W4
(3)
Where SqSum(W,pi,j) is the sum of a square of size WxW centered around pixel pi,j and η, η′, η
′′
represent the normalization factors. Figure 4 might be helpful to understand the calculation of thisfeatures [Vink et al., 2013].
Figure 4: Haar-like box features The sum of pixel values of the green box is subtracted from the sumof pixel values of the red box.
3.1.2 Structure-Based Features:
The features in this set were basically edge detector features. Gaussian gradient magnitude, Laplacianof Gaussian, eigenvalues of Hessian matrix and the eigenvalues of the structure tensor were includedin this set.
3.2 PCA
After feature extraction part, we had a very large feature set since we had to calculate these featuresfor three channel of color (i.e. RGB) with various window sizes. Therefore, we decided to use PCAto reduce the feature space size. We set the PCA to get the feature with the condition that varianceratio would be higher than 0.99.
3.3 Splitting the Data
The dataset after PCA was splitted to training, validation and testing dataset. The ratio for doingthis was 70% of the whole data for training and validation together and remaining 30% for testing.Then the training and validation was splitted to 90% for training and 10% for validation. We neededvalidation set to optimize the hyperparameters we had in our classifier.
4

3.4 Hyperparameter Optimization
We used AdaBoost to create a strong learner from a series of weak learners. In order have an optimalAdaBoost, we used validation data to find the hyperparameters we had, which are the number ofestimaters and the learning rate of AdaBoost. We itearted over learning rate with these values: [0.1,0.3, 0.5, 0.6, 0.65, 0.7, 0.75, 0.8, 0.9, 0.95, 1] and the number of estimaters as follows: range(10, 500,step = 20). The best parameter values found to be: number of estimaters = 30, learning rate = 1.
3.5 AdaBoost Classifier
AdaBboost (short for Adaptive Boosting) is a classifier which can combine the output of otherlearning algorithms (weak learners) with weighted sum and output a boosted classifier. It has beenaddressed in literature [Wang et al., 2006] and [Casagrande, 2006] that AdaBoost is more efficient andperforms significantly better that SVM. The psuedocode of Adaboost is summerized in Algorithm 1.
Algorithm 1 AdaBoost Algorithm
1. Initialize the observation weights wi = 1/N, i =, 2, ..., N.
2. For m = 1...M :
(a) Fit a classifier Gm(x) to the training data using weights wi.(b) Compute:
errm =∑N
i=1 wiI(yi 6=Gm(xi))∑Ni=1 wi
.
(c) Compute αm = log((1− errm)/errm)
(d) Set wi ← wi.exp[αmI(yi 6= Gm(xi))], i = 1, 2, ...N.
(e) Output G(x) = sign[∑M
m=1 αmGm(x)]
Since it has been proven that AdaBoost can be very useful and efficient classifier, we implemented itto detect nuclei using the aforementioned feature sets.
3.6 Morphological Functions
In order to fill the holes and have a better output, we used morphological functions as a post-processing step. First we applied an opening function which is the dilation of the erosion of a set Aby a structuring element B. Then, a closing function was applied to the result of opening function.Closing is the erosion of the dilation of a set of a binary image.
With on trial and error, we found out that using a opening function of size 8x8 followed bya closing of size 2x2 generates decent outputs with high accuracy.
3.7 Finding Cell Centroid
The final step of our proposed method is to label the individual nuclei in the image so that we coulduse the number of nucleus as a feature in future diagnosis task. An schematic overview of thesteps followed can be seen in Figure 5. To do this, we first label the connected components in theclassified mask. Then, using a area threshold (700 pixels in results presented), we identified the largecomponents that could contain multiple cells. Finally, we apply watershed segmentation method toseparate connected nucleus and label each nuclei, as shown in Figure 2 and Figure 5.
4 Results
4.1 Visualization
The AdaBoost was applied with different feature sets, with and without morphological functions aspost-processing. We also label the nuclei according to each results. Figure 6 shows the samples ofthe results we got in each case.
5
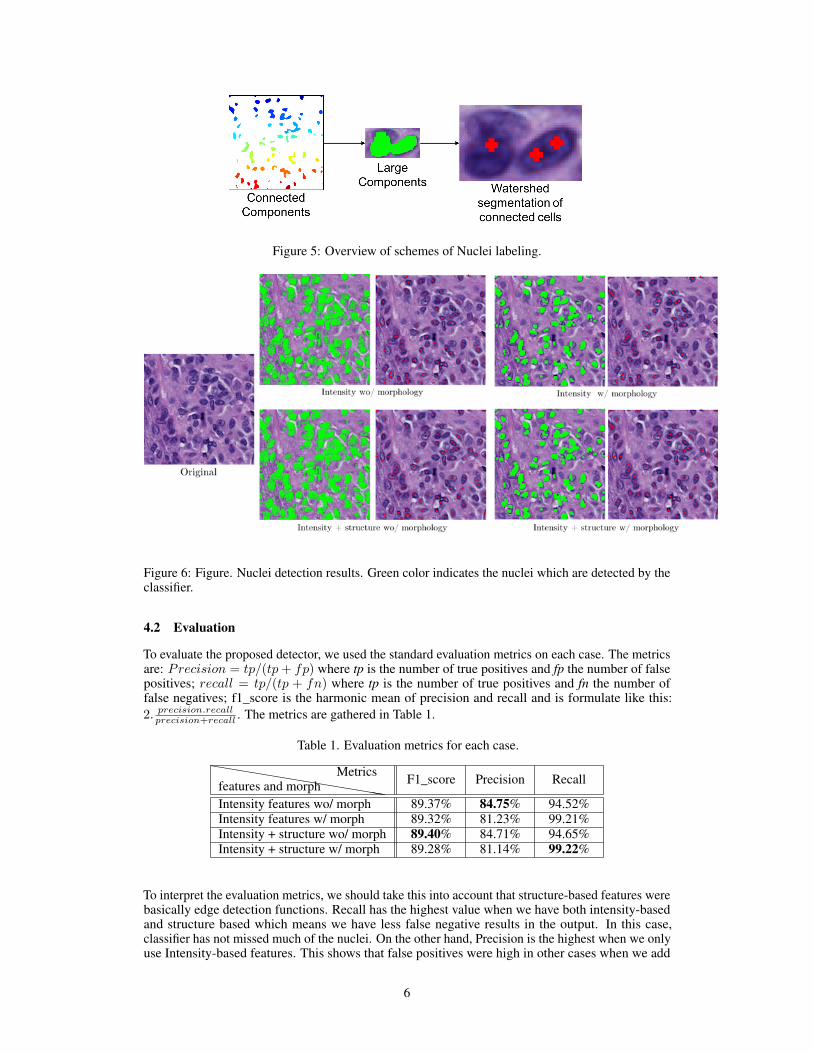
Figure 5: Overview of schemes of Nuclei labeling.
Figure 6: Figure. Nuclei detection results. Green color indicates the nuclei which are detected by theclassifier.
4.2 Evaluation
To evaluate the proposed detector, we used the standard evaluation metrics on each case. The metricsare: Precision = tp/(tp+ fp) where tp is the number of true positives and fp the number of falsepositives; recall = tp/(tp + fn) where tp is the number of true positives and fn the number offalse negatives; f1_score is the harmonic mean of precision and recall and is formulate like this:2. precision.recallprecision+recall . The metrics are gathered in Table 1.
Table 1. Evaluation metrics for each case.hhhhhhhhhhhhhhfeatures and morph
Metrics F1_score Precision Recall
Intensity features wo/ morph 89.37% 84.75% 94.52%Intensity features w/ morph 89.32% 81.23% 99.21%Intensity + structure wo/ morph 89.40% 84.71% 94.65%Intensity + structure w/ morph 89.28% 81.14% 99.22%
To interpret the evaluation metrics, we should take this into account that structure-based features werebasically edge detection functions. Recall has the highest value when we have both intensity-basedand structure based which means we have less false negative results in the output. In this case,classifier has not missed much of the nuclei. On the other hand, Precision is the highest when we onlyuse Intensity-based features. This shows that false positives were high in other cases when we add
6

structure-based features. It means that the classifier assume some of the non-nuclei pixels, probablyaround the boarder of nuclei, to be nucleus.
5 Conclusion
In this project, we were able to detect the nuclei in the skin biopsy images using AdaBoost withintensity-based and structure-based features. We ran the AdaBoost two separate times and thenpost-process the results with morphological functions. It turned out that using both intensity-basedfeatures and structure-based features and applying morphological functions on them gives the bestrecall while using only intensity-based features gives the best precision value. The results fromnucleus labeling (finding the centroid of nucleus detected) is not perfect, as shown in Figure 6. If wehave more time, we could iterate through the calculated centroids, find those with area that is toosmall and combine those with their closest centroids.
As a future work, we can try these tasks:
• Finding the boundary: for examining the shape and area of nuclei.• Using nuclei to train a CNN for mitotic figures detection.
ReferencesNorman Casagrande. Automatic music classification using boosting algorithms and auditory features. 2006.
Dan C Ciresan, Alessandro Giusti, Luca M Gambardella, and Jürgen Schmidhuber. Mitosis detection in breastcancer histology images with deep neural networks. In International Conference on Medical Image Computingand Computer-assisted Intervention, pages 411–418. Springer, 2013.
Metin N Gurcan, Laura E Boucheron, Ali Can, Anant Madabhushi, Nasir M Rajpoot, and Bulent Yener.Histopathological image analysis: A review. IEEE reviews in biomedical engineering, 2:147–171, 2009.
Adel Hafiane, Filiz Bunyak, and Kannappan Palaniappan. Fuzzy clustering and active contours for histopathologyimage segmentation and nuclei detection. In Advanced concepts for intelligent vision systems, pages 903–914.Springer, 2008.
Jing Li and Nigel M Allinson. A comprehensive review of current local features for computer vision. Neurocom-puting, 71(10):1771–1787, 2008.
Cheng Lu and Mrinal Mandal. Automated segmentation and analysis of the epidermis area in skin histopatholog-ical images. In Engineering in Medicine and Biology Society (EMBC), 2012 Annual International Conferenceof the IEEE, pages 5355–5359. IEEE, 2012.
C Ortiz de Solorzano, R Malladi, SA Lelievre, and SJ Lockett. Segmentation of nuclei and cells using membranerelated protein markers. journal of Microscopy, 201(3):404–415, 2001.
Sokol Petushi, Fernando U Garcia, Marian M Haber, Constantine Katsinis, and Aydin Tozeren. Large-scalecomputations on histology images reveal grade-differentiating parameters for breast cancer. BMC medicalimaging, 6(1):14, 2006.
Jelte Peter Vink and Gerard de Haan. No-reference metric design with machine learning for local videocompression artifact level. IEEE Journal of Selected Topics in Signal Processing, 5(2):297–308, 2011.
JP Vink, MB Van Leeuwen, CHM Van Deurzen, and G De Haan. Efficient nucleus detector in histopathologyimages. Journal of microscopy, 249(2):124–135, 2013.
Carolina Wählby, I-M SINTORN, Fredrik Erlandsson, Gunilla Borgefors, and Ewert Bengtsson. Combiningintensity, edge and shape information for 2d and 3d segmentation of cell nuclei in tissue sections. Journal ofmicroscopy, 215(1):67–76, 2004.
Ying Wang, Ping Han, Xiaoguang Lu, Renbiao Wu, and Jingxiong Huang. The performance comparison ofadaboost and svm applied to sar atr. In Radar, 2006. CIE’06. International Conference on, pages 1–4. IEEE,2006.
7