NUCLEAR BATTERY USING D- CLUSTERS IN NANO-MATERIALS --- PLUS SOME
56
NUCLEAR BATTERY USING D- CLUSTERS IN NANO-MATERIALS --- PLUS SOME COMMENTS ABOUT PRIOR H 2 -Ni POWER CELL STUDIES George H. Miley 1,3 , Xiaoling. Yang 1 , Heinrich Hora 2 1, Department of Nuclear, Plasma and Radiological Engineering, Univ. of Illinois, Urbana, IL 2. Dep. Theoretical Physics University of New South Wales, Sydney, Australia 3. NPL Associates, INC., Champaign, IL 61821 1 New Energy Times Archives
Transcript of NUCLEAR BATTERY USING D- CLUSTERS IN NANO-MATERIALS --- PLUS SOME

NUCLEAR BATTERY USING D-CLUSTERS IN NANO-MATERIALS --- PLUS SOME COMMENTS ABOUT PRIOR H2-Ni POWER CELL STUDIES
George H. Miley1,3, Xiaoling. Yang1 , Heinrich Hora2
1, Department of Nuclear, Plasma and Radiological Engineering, Univ. of Illinois, Urbana, IL
2. Dep. Theoretical Physics University of New South Wales, Sydney, Australia
3. NPL Associates, INC., Champaign, IL 61821
1
New Energy Times Archives

OutlineComments re prior light water Ni studies – Patterson CellMore recent experiments using thin-film plate type electrodes conditioned for cluster formation.Evidence for D-clusters and comments about theoryPossible triggering methods the initiate nuclear reactions in these high density clustersPreliminary gas loading nanoparticle experiment Road Map and Future goal of the LENR study for Nuclear Battery applications
2
New Energy Times Archives

SEL Theory lead the design of our early experiments. Patterson had already used multilayer films so that work fit right in also.
Electrolytic loading used instead of gas pressure – but once loaded themechanisms should be much the same.
Pd
Ni
Pd
Ni
PdSubstrate
Swimming Electron Layer (SEL) Theory
Substrate
ee
+ n ee
+ n ee
+ nee
+ nee
+ n ee
+ nee
+ n
ee
+ n ee
+ n ee
+ nee
+ nee
+ n ee
+ nee
+ nee
+ n ee
+ n ee
+ nee
+ nee
+ n ee
+ nee
+ n
ee
+ n ee
+ n ee
+ nee
+ nee
+ n ee
+ nee
+ n
e
e
+ n
Zoom-in View
e
e
+ n
e
e+n
e
e
+n+ n
SEL - High density electron clouds – exists between metals of different Fermi energy, providing the necessary screening
3
New Energy Times Archives

Comments – Patterson Cell Studies – Light water- Ni systemKey point – identification of reaction products andconnection to heat release.
[Jim Patterson and his grandson, Jim Redding, founded CETI to develop this power cell. Various demonstrations of a 1-kW unit were done and Jim appeared on the “today” TV show. They had a contract with a hot water heater company as a first “application”. Avoided energy conversion integration problems. His grandson’s sudden death, followed several years later by Jim’s ended their efforts. But the results are documented and I was involved in the work as reported here.
4
New Energy Times Archives
Process Flow Sheet of ElectrolysisProcess Flow Sheet of Electrolysis
EXPERI
MENTS
5
New Energy Times Archives

Patterson Power CellPatterson Power Cell™™DesignDesign
EXPERI
MENTS
6
New Energy Times Archives

SEL Theory and Experiments to SEL Theory and Experiments to Design Multilayer ThinDesign Multilayer Thin--film film ElectrodesElectrodes
BACKGROUND
Fusion of two nuclei, shielded by the swimming electron layer
Multilayer thin-film electrode design with alternating layers of Pd & Ni or Ti with a topcoat of Cr
7
New Energy Times Archives

Microsphere DesignMicrosphere Design
BACKGROUND
CETI uses an electrolytic coating process to coat metals on the microspheres. My sputter coating technique achieves better control of coating thickness and sharp interfaces compared to the electrolytic process. – however the ecess heat is cut by an order of magnitude!
8
New Energy Times Archives

EXCESS HEATS OF 1-2 KW WERE CONSISTENTLY PRODUCED WITH THESE CELLS. HOW? LIGHT WATER AND NI SHOULD NOT PRODUCE A REACTION!! THE NEXT SLIDES EXPLAIN MY SEARCH FOR AN ANSWER. I PROPOSE THAT SIMILAR STUDIES SHOULD BE DONE FOR ROSSI’S CELL.
9
New Energy Times Archives

Rational for Combined SIMS-NAA
Analysis for a large number of isotopes needed. NAA is time consuming and was limited to nine elements with appropriate cross sections where reference standards were available. SIMS, with ultra low detection limits, could detect all isotopes rapidly, but it provides relative isotope concentrations and abundance ratios are more precisely than it does absolute concentrations. Thus the SIMS concentration values were normalized to the more accurate NAA results.
10
New Energy Times Archives

SIMS AnalysisInitial runs done in low resolution.conditions (off-set voltage, entrance/exit slits,
field aperture, energy slit) optimized to minimize interferences.Isotopes of interest with possible interference then selected for high resolution.Error analysis considers interference effects, fractionalization, non-uniformity, small sample numbers.
11
New Energy Times Archives

Operating Characteristics of Dual Focusing SIMS (CAMECA IMS 5f)
12
New Energy Times Archives

Quantification of Isotopes by Quantification of Isotopes by Combined SIMS & NAACombined SIMS & NAA
DIAGNOSTICS Mass Spectrum of a sample, indicates relative concentrations of
species. Compare spectrum before and after electrolysis. 13
New Energy Times Archives
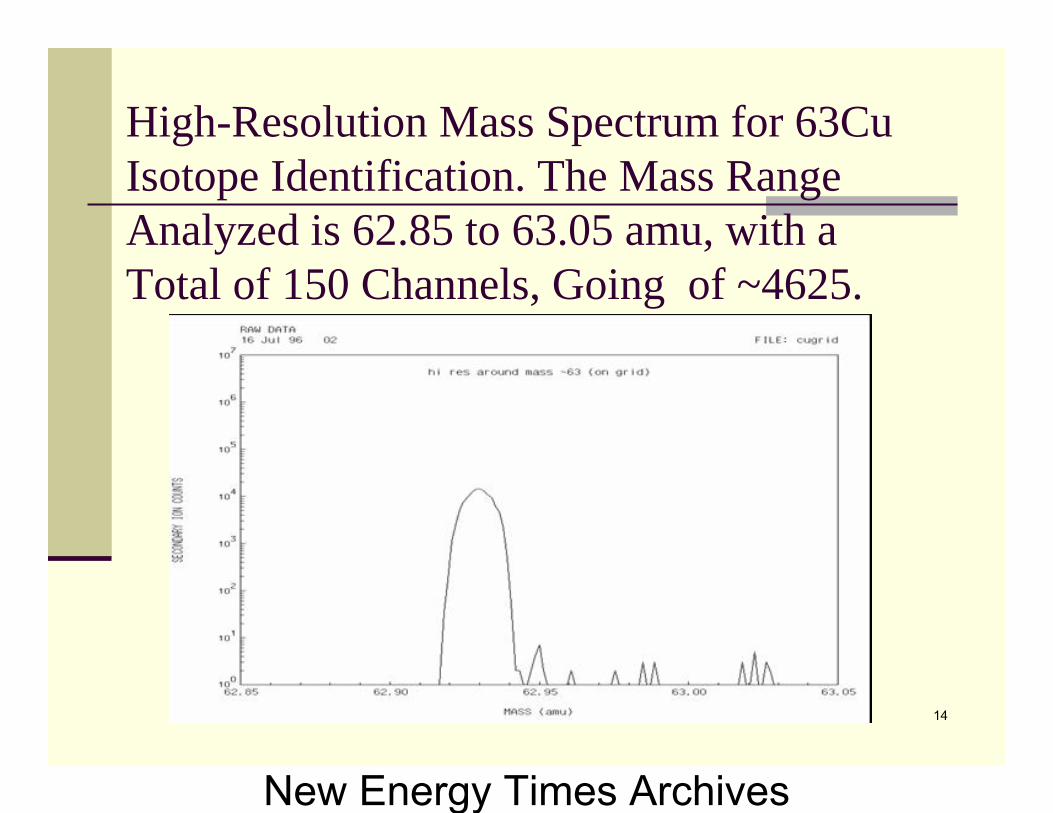
High-Resolution Mass Spectrum for 63Cu Isotope Identification. The Mass Range Analyzed is 62.85 to 63.05 amu, with a Total of 150 Channels, Going of ~4625.
14
New Energy Times Archives

Parameters for NAA Runs
Analytical Procedure Method Irradiation facility (flux, n cm-2 s-1) Irradiation
time Decay time
Counting time
Thermal short-lived PS (3.7E+12) 10 - 300 sec.
5 - 20 min.
10 - 20 min.
Epithermal medium-lived
CLNAT (2.1E+11)
2 - 8 hrs. 2 - 5 days. 1 - 10 hrs.
Thermal long-lived LS (3.4E+12) 2 - 6 hrs. 15 - 35 hrs.
3 - 6 hrs.
15
New Energy Times Archives

NAA Detection System and AnalysisThe gamma-ray detector system had: a liquid N2 cooled high purity germanium (HPGe) crystal detector with an 18% relative efficiency (1.9-keV resolution for the 1332-keV photopeak of 60Co); A large NaI(T1) crystal ring detector outside the main detector; An ORTEC ADCAM PC-based mutichannel analyzer.Compton suppression was used to further minimize the background.A reference standard method was used to determine the comparative method for measuring the concentration of the element(s). This used simultaneous irradiation and -counting of a prepared NIST sample (one standard for each element to be estimated) along with the test sample.The spectrum data was processed using the Neutron Activation Data Analysis (NADA) code. The output included concentration values in %, ppm, g or ppb units and associated errors.Flux variations, high deadtime corrections, counting geometry, spectral and nuclear interference, as well as uranium fission interference were accounted for in analysis.
16
New Energy Times Archives
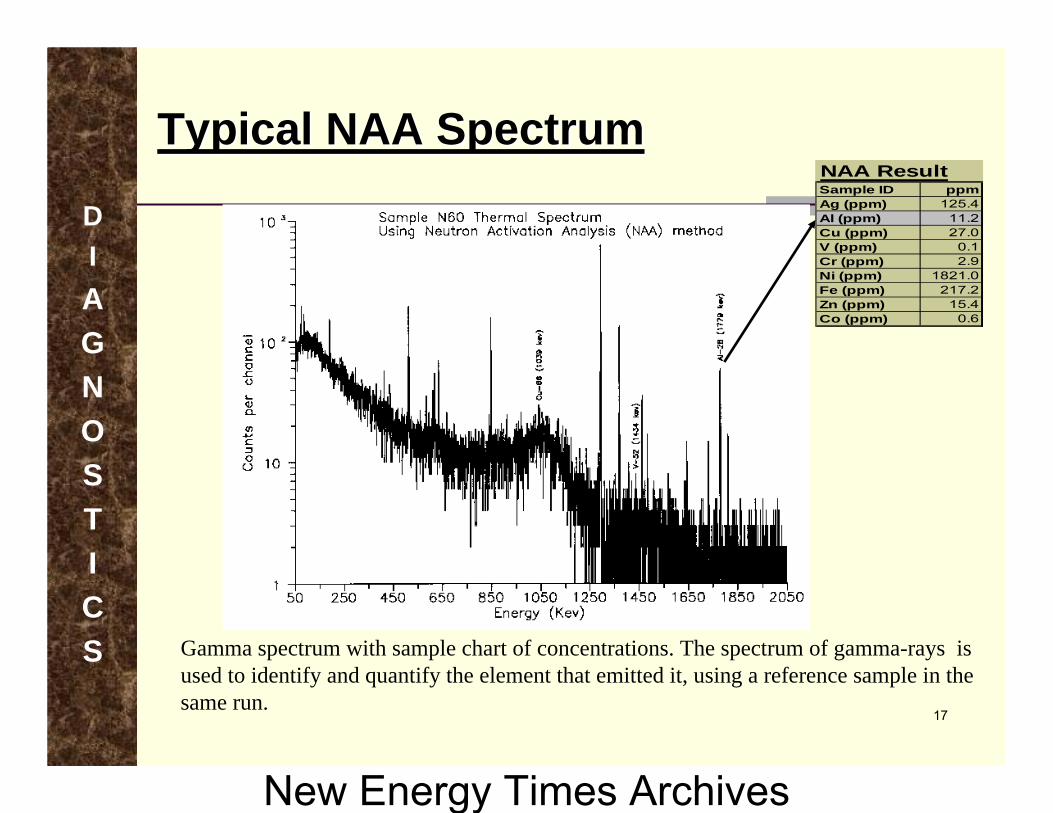
Typical NAA SpectrumTypical NAA Spectrum
DIAGNOSTICS
NAA ResultSample ID ppmAg (ppm) 125.4Al (ppm) 11.2Cu (ppm) 27.0V (ppm) 0.1Cr (ppm) 2.9Ni (ppm) 1821.0Fe (ppm) 217.2Zn (ppm) 15.4Co (ppm) 0.6
Gamma spectrum with sample chart of concentrations. The spectrum of gamma-rays is used to identify and quantify the element that emitted it, using a reference sample in the same run.
17
New Energy Times Archives
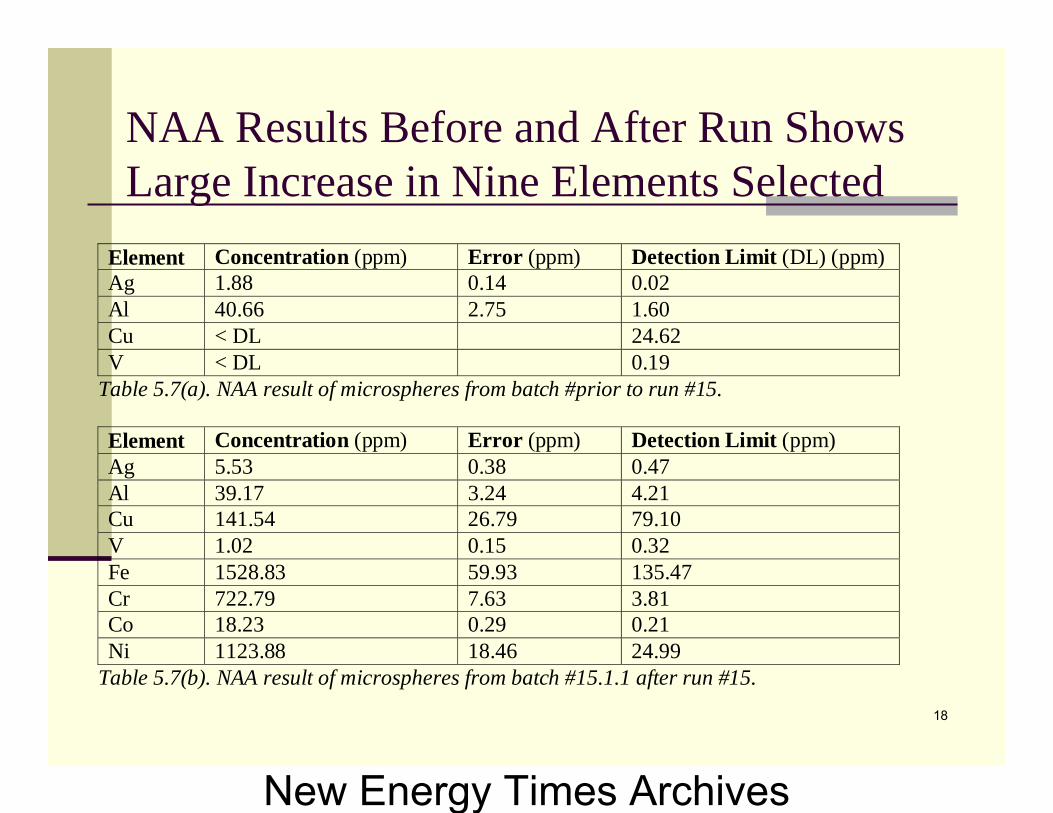
NAA Results Before and After Run Shows Large Increase in Nine Elements Selected
Element Concentration (ppm) Error (ppm) Detection Limit (DL) (ppm) Ag 1.88 0.14 0.02 Al 40.66 2.75 1.60 Cu < DL 24.62 V < DL 0.19
Table 5.7(a). NAA result of microspheres from batch #prior to run #15.
Element Concentration (ppm) Error (ppm) Detection Limit (ppm) Ag 5.53 0.38 0.47 Al 39.17 3.24 4.21 Cu 141.54 26.79 79.10 V 1.02 0.15 0.32 Fe 1528.83 59.93 135.47 Cr 722.79 7.63 3.81 Co 18.23 0.29 0.21 Ni 1123.88 18.46 24.99
Table 5.7(b). NAA result of microspheres from batch #15.1.1 after run #15. 18
New Energy Times Archives
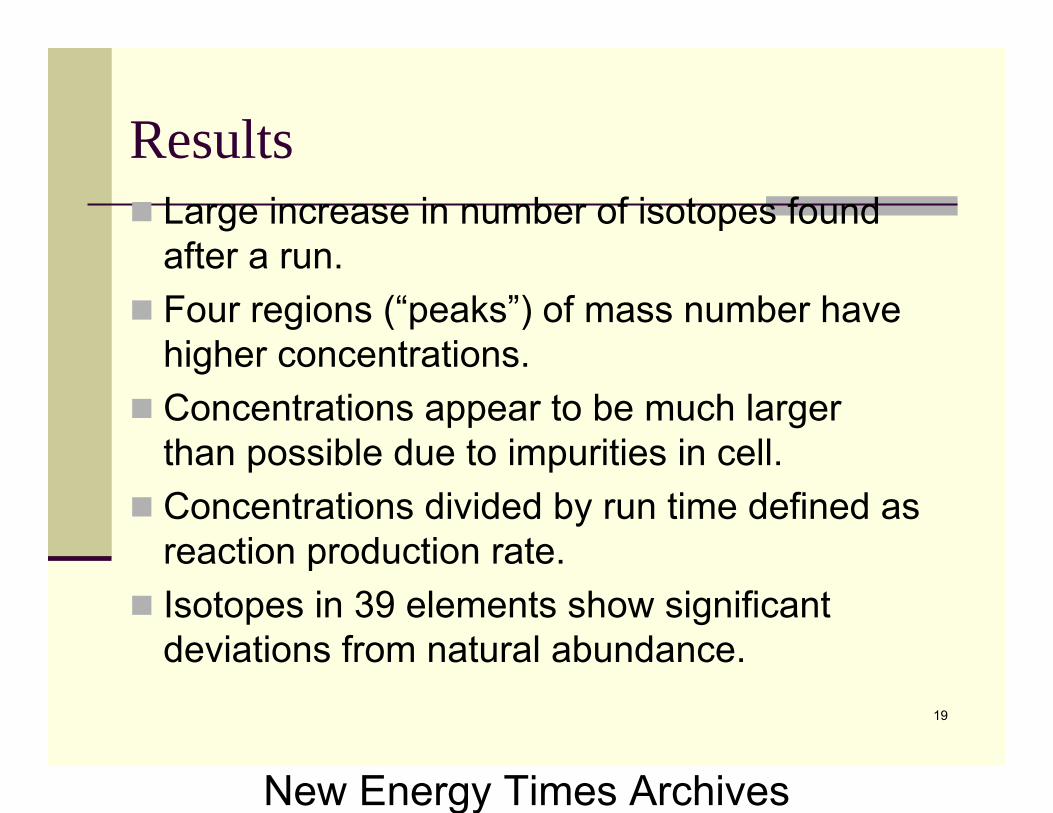
Results Large increase in number of isotopes found after a run.Four regions (“peaks”) of mass number have higher concentrations.Concentrations appear to be much larger than possible due to impurities in cell.Concentrations divided by run time defined as reaction production rate.Isotopes in 39 elements show significant deviations from natural abundance.
19
New Energy Times Archives

Isotope Production Rates Show Large Yields of Key Elements and 4 “peak” Pattern
1.00E+08
1.00E+10
1.00E+12
1.00E+14
1.00E+16
0 50 100 150 200 250
Mass Number (A)
Prod
uctio
n R
ate
(ato
ms/
s-cc
)
20
New Energy Times Archives
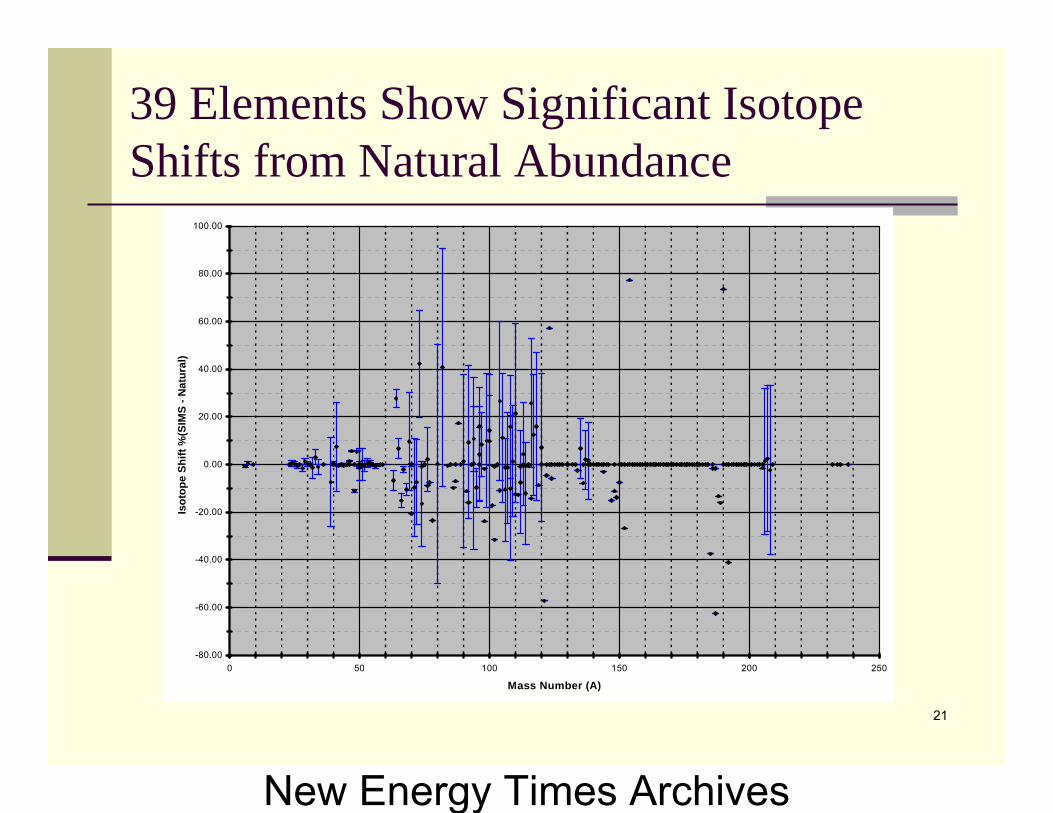
39 Elements Show Significant Isotope Shifts from Natural Abundance
-80.00
-60.00
-40.00
-20.00
0.00
20.00
40.00
60.00
80.00
100.00
0 50 100 150 200 250
Mass Number (A)
Isot
ope
Shift
%(S
IMS
- Nat
ural
)
21
New Energy Times Archives

Comparison of Ti Run with Prior Data for Other Coatings Such as Ni
107
109
1011
1013
1015
1017
0 50 100 150 200 250
Run #: 5, 7A, 8, 11, 13, 18C and 15Run #5Run #7aRun #8Run #11Run #13Run #18CRun #15
Pro
duct
ion
Rat
e (a
tom
/s-c
c)
Mass Number (A)
22
New Energy Times Archives

Conclusions and relation to RossiTo summarize, this research developed a unique SIMS-NAA analysis technique for studies of isotopes in thin films after undergoing electrolysis in a packed bed cell.This technique combines the broad coverage of elements with SIMS and the absolute precision capability of NAA.This technique should be applicable to a broad range of analysisproblems of interest.I would suggest that this technique be applied to the Rossi cellA key issue – are these product & associated reactions responsible for the excess heat? As shown in later slides, the answer seems to be that these reactions are a major contributor.
23
New Energy Times Archives

OTHER LESSONS LEARNED
Ideal smoothed coated films not as good as “rough” ones. Implied local defects played a role. Reaction products highly concentrated near interfaces, perhaps due to anchoring of dislocations there.
24
New Energy Times Archives
OutlineComments re prior light water Ni studies – Patterson CellMore recent experiments using thin-film plate type electrodes conditioned for cluster formation.Evidence for D-clusters and comments about theoryPossible triggering methods the initiate nuclear reactions in these high density clustersPreliminary gas loading nanoparticle experiment Road Map and Future goal of the LENR study for Nuclear Battery applications
25
New Energy Times Archives

SEL Theory Lead to Multilayer Thin-film electrodes- went to flat plates vs. beads to obtain better control over manufacturing film & defects
Concept
Pd/Ni
Pt
Multilayer thin-film electrode design with alternating layers of Pd & Ni.Planar A-K structure used to maximize H2 concentration via electrodiffusion
Pt
26
New Energy Times Archives

Results #1 -- Calorimetry Shows During Electrolysis Thin-Film Electrodes Produce Significant Excess Heat
Heat measurement for two layers electrode: 8000Å Pd and 1000Å Ni on Alumina.
Ptherm: Measured Heat power; P*=I (U-U0): Input electrical Power 27
New Energy Times Archives

Results #2 -- Transmutation Products
Reaction Product Yield vs. Mass Curve D-D Reactions % branching hot fusion “P-F” type T + p 50 < 0.1
D-D He-3 + n 50 < 10-6
He-4 + gamma < 10 -5 99+
Transmutations
proton + metal products or “fission” product 28
New Energy Times Archives

Computation of excess power from reaction product measurements gives order of magnitude agreement with measurement.
Equation Equation Results from Energy Balance Results from Energy Balance Calculations for Three earlier Calculations for Three earlier ThinThin--Film experiments. Film experiments.
All experiments used LiAll experiments used Li22SOSO44 in Hin H22O for the electrolyte and O for the electrolyte and thinthin--film Ni coated cathodes.film Ni coated cathodes.
29
New Energy Times Archives

Results #3 -- MeV charged-particles Alpha-Particles and Protons
Tracks in CRTracks in CR--39 from 12.0 39 from 12.0 MeV MeV αα--particles; image area particles; image area S= 0.2x0.2 mm, (X 700)S= 0.2x0.2 mm, (X 700)
-5
0
5
10
15
20
25
0 5 10 15 20 25E,alpha [MeV]
Num
ber o
f Cou
nts
Open CR-39detectors25 mcmCu/CR39detectors
0
30
60
90
120
150
0.5 1 1.5 2 2.5E, proton [MeV]
Num
ber o
f cou
nts
Open CR-39 Cu/CR-39
After background After background subtractingsubtracting
HighHigh--energy charged particles: energy charged particles: 1.5 1.5 -- 1.7 MeV protons and 111.7 MeV protons and 11--16 MeV alphas.16 MeV alphas.
30
New Energy Times Archives

OutlineComments re prior light water Ni studies – Patterson CellMore recent experiments using thin-film plate type electrodes conditioned for cluster formation.Evidence for D-clusters and comments about theoryPossible triggering methods the initiate nuclear reactions in these high density clustersPreliminary gas loading nanoparticle experiment Road Map and Future goal of the LENR study for Nuclear Battery applications
31
New Energy Times Archives
Comment -
Propose search for charged particle and soft x-ray emission from Rossi
New Energy Times Archives

Our Recent Dislocation-Loop-Cluster StudiesPd thin foil – 12 µmLoading and unloading deuterium/hydrogen was done by cyclically cathodizing and anodizing Pd foil dislocation loop and cluster formation
PdPdO
PdO
33
New Energy Times Archives
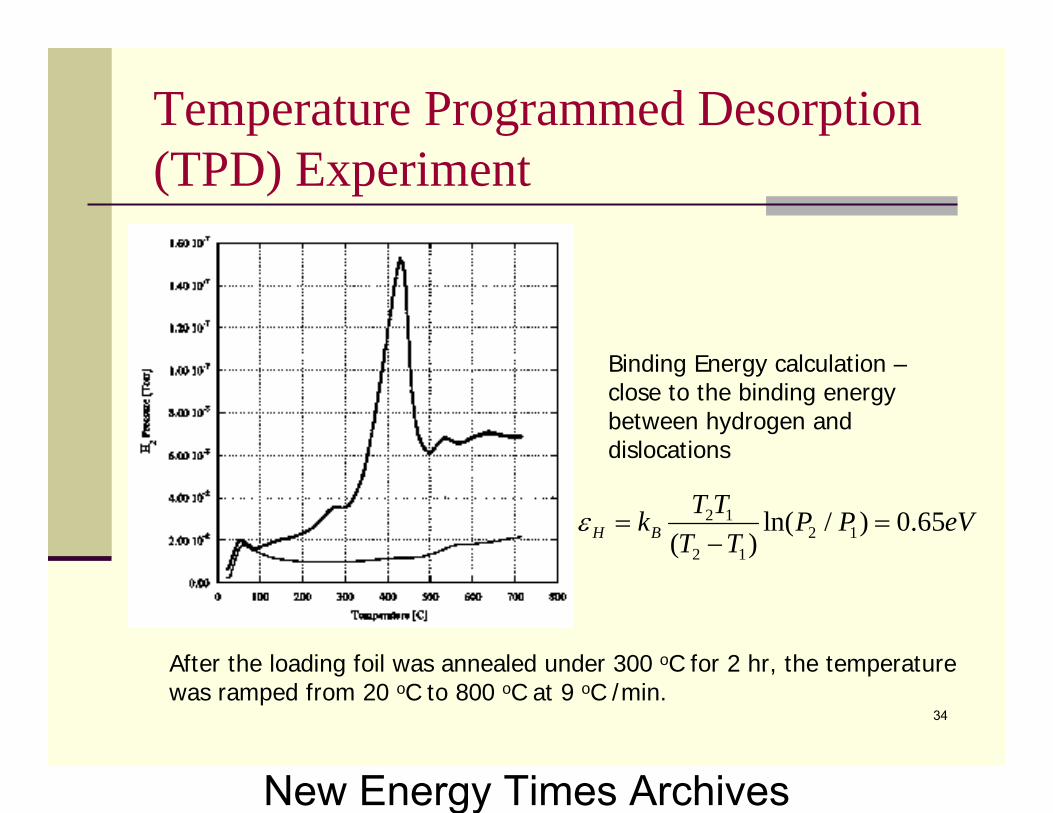
Temperature Programmed Desorption (TPD) Experiment
After the loading foil was annealed under 300 oC for 2 hr, the temperature was ramped from 20 oC to 800 oC at 9 oC /min.
2 12 1
2 1
ln( / ) 0.65( )H B
T Tk P P eVT T
ε = =−
Binding Energy calculation –close to the binding energy between hydrogen and dislocations
34
New Energy Times Archives

Experimental Magnetic Moment Measurements of Pd:H sample show superconducting state
The magnetic moment of H2- cycled PdHx samples in the temperature range of 2 ≤ T < 50 K is significantly
lower than M(T) for the original Pd/PdO.
-3 .E -0 6
-2 .E -0 6
-2 .E -0 6
-1 .E -0 6
-5 .E -0 7
0 .E + 0 0
5 .E -0 7
1 .E -0 6
2 .E -0 6
0 2 0 4 0 6 0 8 0T e m p e ra tu re [K ]
Mom
ent [
emu]
P d /P dO :H xP d /P dOP d /P dO :H x - P d /P dO
A. Lipson, B.I. Heuser, C. Castano, G.H. Miley, B. Lyakov & A. Mitin, Physical Review B 72, 212507/1-6 (2005): 35
New Energy Times Archives

ANOTHER PROOF OF CLUSTERS – PETAWATT LASER BEAM EXTRACTION
We are funded to do experiments at LANL to study the extraction of MeV D+ ions from these clusters using the TRIDENT petawatt laser
36
New Energy Times Archives
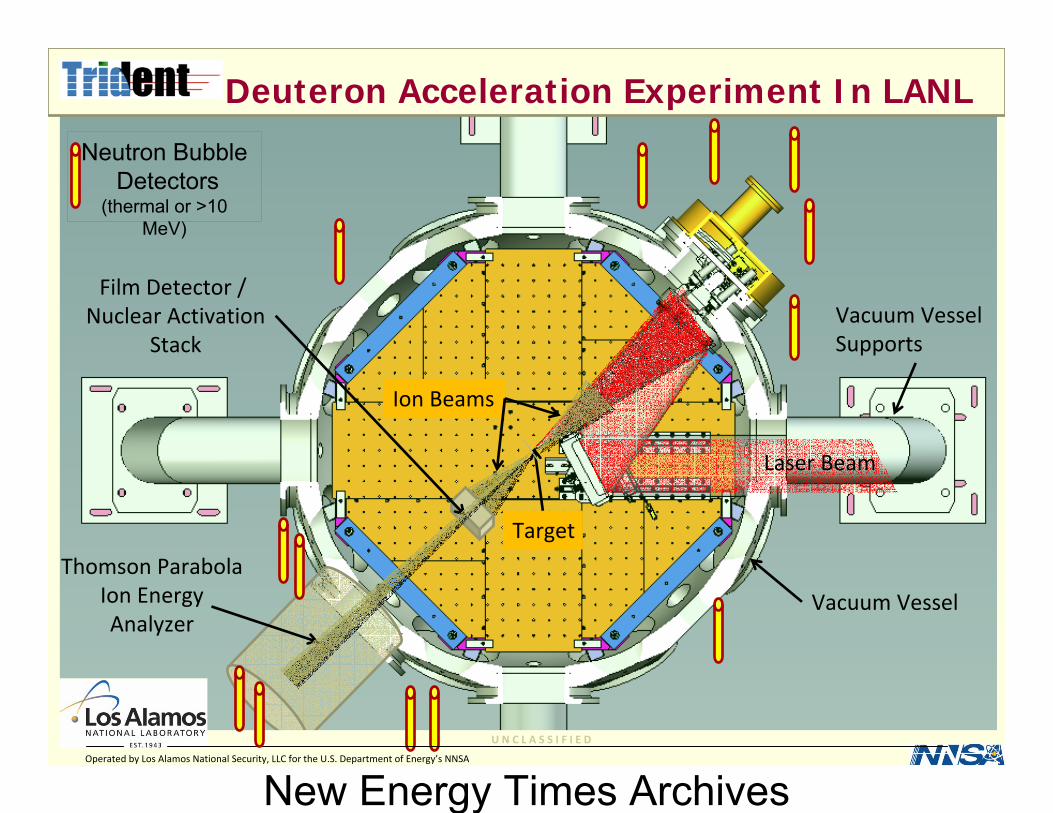
37
Ion Beams
Film Detector / Nuclear Activation
Stack
Target
Neutron BubbleDetectors
(thermal or >10 MeV)
Operated by Los Alamos National Security, LLC for the U.S. Department of Energy’s NNSA
U N C L A S S I F I E D
Thomson Parabola Ion Energy Analyzer
Deuteron Acceleration Experiment In LANL
Vacuum Vessel
Vacuum Vessel Supports
Laser Beam
New Energy Times Archives

38
Ion Trace of PdD Separated by Thompson Parabola WITH Ti Filter
D+
P
Zoom In View
Laser Energy in 81.9 J out 67.1
Image Plate
New Energy Times Archives

Comments –TRIDENT results
Demonstrate acceleration from clustersFlux and energy depressed, probably by impurity protons (and C?) Next experimental campaign
Continue to improved cluster packing fractionReduce contamination (p and C).Obtain more insight from ongoing supporting simulation studies.
39
New Energy Times Archives

Conclusion: High density deuterium cluster formation (Pseudo Bose-Einstein Condensation) at room temperature occurs and is fundamental as a way to create nuclear reactive sites for LENR
40
New Energy Times Archives

Theory
Pd
Ni
Pd
Ni
PdSubstrate
Swimming Electron Layer (SEL) Theory
Zoom-in View
Pd
Ni
Substrate
D D D D DD D D D D
D D D D DD D D D D
Anchored D Loops
Substrate
ee
+ n ee
+ n ee
+ nee
+ nee
+ n ee
+ nee
+ n
ee
+ n ee
+ n ee
+ nee
+ nee
+ n ee
+ nee
+ nee
+ n ee
+ n ee
+ nee
+ nee
+ n ee
+ nee
+ n
ee
+ n ee
+ n ee
+ nee
+ nee
+ n ee
+ nee
+ n
e
e
+ n
Zoom-in View
e
e
+ n
e
e+n
e
e
+n+ n
Bose-Einstein Condensation in a sub-nano scale
Yeong E. Kim, Theory of Bose–Einstein condensation mechanism for deuteron-induced nuclear reactions in micro/nano-scale metal grains and particles, Naturwissenschaften, 96(7):803-11 (2009)
41
New Energy Times Archives

OutlineComments re prior light water Ni studies – Patterson CellMore recent experiments using thin-film plate type electrodes conditioned for cluster formation.Evidence for D-clusters and comments about theoryPossible triggering methods the initiate nuclear reactions in these high density clustersPreliminary gas loading nanoparticle experiment Road Map and Future goal of the LENR study for Nuclear Battery applications
42
New Energy Times Archives

Recent work is designed to extend the thin-film technique to nanoparticles.
For applications this will allow high temperatures with gas loading – i.e. improved performance when energy conversion is integrated into the cell
43
New Energy Times Archives

Cluster Formation in Nanomaterials
Clusters mainly forms at the places that is close to the material surface.Nanomaterials have more surface area, thus have good ability to form abundant clusters
44
NanoparticlesBulk material
Almost no clustersPd
Clusters zoom in
New Energy Times Archives

Triggering The Reaction
Electrolysis (pulse or ramp)Gas loading (pulse pressure)
Smaller heat capacityHigher temperature change as compared with an electrolysis system.Without the constraint of being limited by the boiling temperature of the fluid
Glow Discharge (bombardment)Low energy laser; ultrasound; em radiation,…..
45
New Energy Times Archives

Our Gas Loading System
2.2cm inner diameter25cm3 total volume
46
New Energy Times Archives

Inside View
To vacuum pump
To vacuum pump
Heating coil
Sample ChamberOuter Chamber
D2 or H2gas
Valve Valve
47
New Energy Times Archives

Preliminary Excess Heat Measurement Using Our Gas Loading Calorimetry System
Time (seconds)0 50 100 150 200 250 300 350 400
Tem
pera
ture
(o C)
0
20
40
60
80
100
120
140
160
Side No. 1Side No. 2Bottom
60 psi D2
loading starts
D2 unloading starts
High purity (99.999%) D2 gas at 60 psi 20g ZrO2Pd35 nano powder Gas loaded under room temperature and then unloaded.
Actual measured energy -- 1479J
exothermal energy from chemical reaction --- 690J
Calculation: Energy =ΔT(Mchamber Schamber + MpowderSpowder)
Δ T is temperature change, M is mass, and S is the specific heat
Calculation: Energy = ∆H×MD2
∆H = -35,100J per mole of D2 for the formation of PdDx for x < 0.6; MD2 is the total moles of D2 that combined with Pd
48
New Energy Times Archives
The result show was from June –we have continued this work but I do not have slides to show of this work in progress
Most effort has been to develop improved nanoparticles by comparing and down
selecting a series of triple alloys.
New Energy Times Archives

Summary – gas loading
Experimental evidence confirms cluster formation in dislocation loops.Methods to fabricate high loop density under study.Further experiments should consider nanomaterials of different size and composition
50
New Energy Times Archives

OutlineComments re prior light water Ni studies – Patterson CellMore recent experiments using thin-film plate type electrodes conditioned for cluster formation.Evidence for D-clusters and comments about theoryPossible triggering methods the initiate nuclear reactions in these high density clustersPreliminary gas loading nanoparticle experiment Road Map and Future goal of the LENR study for Nuclear Battery applications
51
New Energy Times Archives

Road Map to a Prototype LENR Unit Development
Experimental Discovery of UHD D cluster at UIUC
Demonstration of the Feasibility of LENR Power Source
Nano‐manufacture to further increase the cluster number per cc
Down select cluster materials by Gas loading method for the electrodes of practical LENR power unit
Demonstration of packaging the selected electrodes into a power unit with proper
energy conversion element.
52
New Energy Times Archives
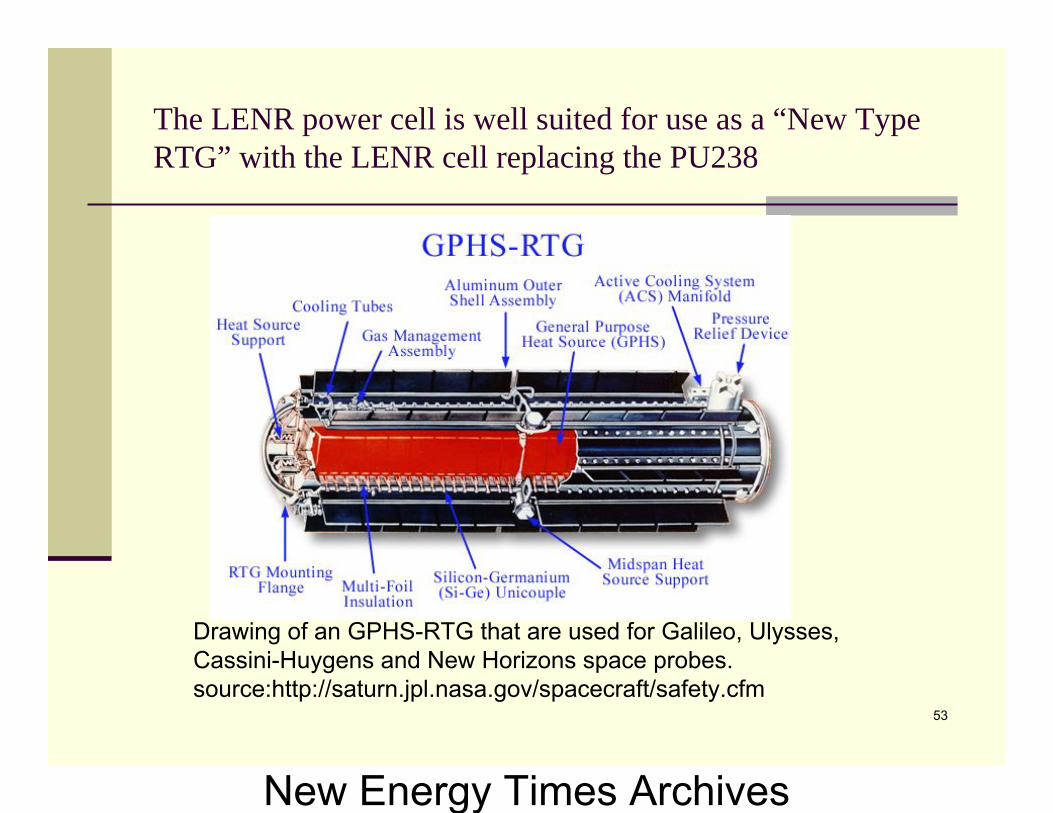
The LENR power cell is well suited for use as a “New Type RTG” with the LENR cell replacing the PU238
53
Drawing of an GPHS-RTG that are used for Galileo, Ulysses, Cassini-Huygens and New Horizons space probes.source:http://saturn.jpl.nasa.gov/spacecraft/safety.cfm
New Energy Times Archives

Many issues remain
54
• What is the energy producing reaction and can it be optimized?• Alternate metals (reduce costs, improve operation, etc.• Alternate gaseous fuel? H2,D2, Tritium, D-T, etc?• Are there any radioactive products?• Any emissions? Soft x-rays, charged particles, gammas?• Lifetime issues – radiation damage to the electrode materials?
Effect of reaction production structure and also on stopping later reactions?
• Burn up of fuel? Burn up of fuel in local sites?• Is there any direct energy conversion possibility?• If heat, what is the optimum temperate-conversion method.• Control methods?• ……………..
New Energy Times Archives

Acknowledgment
This work is supported by the New York Community Trust and NPL Associate Inc.Recent experimental work was under the assistance of Monish Singh, Erik Ziehm, Chi Gyun Kim, Ittinop Dumnernchanvanit, and Seth Hartman.
55
New Energy Times Archives

FOR FURTHER INFORMATION, FOR FURTHER INFORMATION, CONTACTCONTACT
GEORGE H. MILEY GEORGE H. MILEY [email protected]@UIUC.EDU217217--33337723333772
XIAOLING YANG XIAOLING YANG [email protected]@ILLINOIS.EDU
56
New Energy Times Archives