ntrs.nasa.gov · 4. Add 15 ml of Teepol-phosphate to each flask, washing any plasma from the sides...
26
NASA Technical Memorandum 86834 NASA- TM-86834 19860003488 Plasma Volume Methodology: Evans Blue, Hemoglobin- Hematocrit, and Mass Density Transformations J.E. Greenleaf and H. Hinghofer-Szalkay November 1985 NI\SI\ National Aeronautics and Space Admlntstratton OCT 3 1 198') L1BR;f/Y, 'lL-iGIl"11 \ 111111111111111111111111111111111111111111111 NF00075 https://ntrs.nasa.gov/search.jsp?R=19860003488 2019-07-19T03:26:08+00:00Z
Transcript of ntrs.nasa.gov · 4. Add 15 ml of Teepol-phosphate to each flask, washing any plasma from the sides...

NASA Technical Memorandum 86834
NASA-TM-86834 19860003488
Plasma Volume Methodology: Evans Blue, HemoglobinHematocrit, and Mass Density Transformations J.E. Greenleaf and H. Hinghofer-Szalkay
November 1985
NI\SI\ National Aeronautics and Space Admlntstratton
OCT 3 1 198')
L1BR;f/Y, N~.'of\ ~'r\l\'1PTON 'lL-iGIl"11 \
111111111111111111111111111111111111111111111 NF00075
https://ntrs.nasa.gov/search.jsp?R=19860003488 2019-07-19T03:26:08+00:00Z
NASA Technical Memorandum 86834
Plasma Volume Methodology: Evans Blue, HemoglobinHematocrit, and Mass Density Transformations J E Greenleaf, H Hlnghofer-Szalkay, Ames Research Center, Moffett Field, California
November 1985
NI\S/\ National Aeronautics and Space Administration
Ames Research Center Moffett Field, California 94035
SUMMARY
Deta1led descriptions of methods for measuring absolute levels and changes in plasma volume are presented along with derivations of pertinent equations. Reduction in variability of the Evans blue dye dilution technique using chromatographlc column pur1fication suggests that the day-to-day variability in the plasma volume in humans 1S less than ±20 mI. Mass density determination using the mechanicalosc1llator technique provides a method for measuring vascular fluid shifts continuously for assess1ng the density of the filtrate, and for quantifying movements of prote1n across microvascular walls. Equations for the calculation of volume and density of shifted fluid are presented.
INTRODUCTION
Determination of plasma volume (PV) w1th Evans blue dye (T-1824) llnked to album1n and measured spectrophotometrically was f1rst reported by Gregersen (ref. 1-3). Th1S techn1que was developed pr1marily for the Armed Forces. Essent1ally the same techn1que, w1th some refinement on the separat10n and analys1s of the dye, is 1n use today. The accuracy and rel1ab1lity of this dye method depends upon the stab1lity of plasma album1n content over the perlod of measurement, as well as upon the k1netics of the bond between the dye and album1n molecule. Slmilar results are obtained when the Evans blue techn1que 1S compared with the radio-10d1nated (1-131) labeled album1n technique (refs. 4-7). When the PV is determ1ned from analys1s of one 10-m1n post1njection dye sample, good agreement is obta1ned w1th the zero-t1me extrapolation techn1que, uS1ng multiple postinjection blood samples (ref. 6). Evans blue dye subjected to the Ames test for carc1nogen1c1ty (refs. 8 and 9) gave negat1ve results (ref. 10).
W1th the advent of radioact1ve tracers, PV has usually been measured with one of the 10dine 1sotopes (1-125, 1-131). The problem then ar1ses of the appropr1ateness of uS1ng even tracer quantities of radioisotopes in humans in nonl1fethreaten1ng situations. It 1S possible that "the r1sks of low levels of rad1ation are much greater than llnear extrapolations would 1nd1cate" (ref. 11).
For these reasons we w1sh to reemphasize the usefulness of Evans blue dye for the measurement of PV and to present a technique Slightly modified from that of Campbell, Frohman, and Reeve (ref. 7) for analyzing the dye concentration.
A second problem 1S the measurement of changes 1n PV over minutes and hours. Repeated dye 1njections result in saturation of the albumin-binding sites, creat1ng such h1gh pre1nfus1on plasma concentrations that injection of additional dye cannot
be measured accurately. As a result, the short-term (hourly) changes in plasma volume have been calculated from sequential measurements of hematocrit (Hct) and hemoglobin (Hb) concentrations (refs. 12-14) and the Hct alone (refs. 15-17). In addition to the errors incurred in the measurement of Hct and Hb, and the probable error in using antecubital v.nou. blood values as representative of total blood volume levels, the act of drawine blood samples through a catheter may cause a change in vascular hemodynamics and change the Hct and Hb concentrations. In spite of these probable sources of error, use of the Hb-hct and Hct equations for calculating ohanges in PV have proven useful and will continue to be used. Derivations of these equations are presented.
Recently, the development of instruments (ref. 18) for very accurate measurement of blood and plasma density has made possible not only a fast and precise method for measuring ohanges In these volumes from discrete blood samples (refs. 19 and 20), but it also provides for the first time a continuous measurement of changes in PV (refs. 21-23). This measurement technique is also described fully.
EVANS BLUE DYE AND ISOTOPE LABELING
Evans Blue Dye and 1-131 Labeled Albumin
Gregersen and associates (ref. 2) were the first to use Evans blue dye (first obtained from Dr. H. M. Evans) to measure PV and, subsequently, they developed the method in detail (refs. 1 and 3). Measurement of dye diluted in untreated plasma results in rather large errors caused by lipemia or other Interfering substances which absorb at 615 nm. Allen and colleagues (refs. 24 and 25) were probably the first to use a detergent, which displaces the dye from albumin, and a cellulose pulp matrix to absorb the unbound dye. This basic technique was refined by Campbell et al. (ref. 26) and forms the basis for our technique, WhiCh is described here in detail.
Reagents:
1. Disodium hydrogen phosphate, Na2HP04 (anhydrous): 2~ solution (20 g/1000 ml).
2. Teepol-phosphate [Teepol 610 ooncentrate, Particle Data Laboratories, Ltd., 115 Hahn St., Elmhurst, IL 60126, (312) 832-5658]: Add 20 g Na2HP04 to 30 ml Teepol and make up to 1000 ml with distilled water.
3. Potassium phosphate, monobaSIC, KH2P04 (anhydrous): B% solution (8 g/100 ml).
4. 1:1 Acetone-water solution.
5. Solka Floc BW-40 (60 ~) suspenSion of purified Corp., 650 Main St., Berlin, NH 03570, (603) 752-4600]: Solka Floc in 1000 ml 2% Na2HP04 (Reagent 1).
2
wood cellulose [James River Suspend approximately 10 g

6. Evans blue dye (T-1824) standard [Harvey Laboratory and Pharmaceuticals, 113 West Wyoming St., Philadelphia, PA 19140, (215) 451-1600]: Same lot number that 1S used for injection. Refrigerate. (If in doubt about the lot number being the same, a quantity of dye will always be left over from the vial used for injection.)
Preparat10n of columns:
1. Prepare five columns for each subject: one for the standard, one for the blank uS1ng the "pre" sample, and three for the "post" samples. The columns can be fabricated by a glassblower; they are 25 cm long and have a burette stopcock on the lower end of a 13-cm glass tube with a 1-cm ins1de diameter; attached to the top of th1S tube 1S a larger glass tube 7 cm long with a 2.5-cm ins1de diameter.
2. Insert approx1mately 100 mg (3 cm) of uncompressed glass wool 1nto each column, wash the tube with distilled water, and pack the glass wool firmly above the small constr1ct10n above the stopcock w1th a large stirring rod to a he1ght of about 0.5 cm.
3. With a pipette (upside down), pipette about 12 ml of the Solka Floc suspenSlon 1nto the column to a height of about 5 cm. (The p1petting should be carr led out qU1ckly after shak1ng the Solka Floc suspension, as 1t tends to settle very qU1ckly.)
4. Wash each column using pack the column. (If poss1ble, that they w111 be packed well. reused.)
a pipette w1th approx1mately 10 ml of 2% Na2HP04 to prepare the columns a day in advance of the test so When washed well with 2% Na2HP04' the columns can be
Preparation of Evans blue for 1nject10n:
1. After the dye has dra1ned to the bottom of the vial, w1pe the outs1de w1th alcohol and break open. Fill a ster11e, 10-ml syringe w1th the dye, using a ster1le 1B-gauge needle. Remove the needle and expel all air from the barrel of the syr1nge. Push the level of the dye to the very tip of the syringe and attach a ster11e 20-gauge needle, bevel up. Replace cover over the needle, and label the syr1nge w1th the subject's name. W1pe away fingerpr1nts, and we1gh the syr1nge, needle, and cover on an analytical balance. Record th1S we1ght to four deC1mal places.
2. Del1ver the loaded and we1ghed syr1nge to the person doing the 1nJection. Be sure the needle cover is returned w1th the empty syringe.
3. Wipe f1ngerpr1nts from empty syr1nge and needle, and cover and rewe1gh the syringe apparatus. Subtract the empty we1ght (minus the weight of dye in needle) from the filled we1ght to determ1ne the exact weight of dye injected.
3
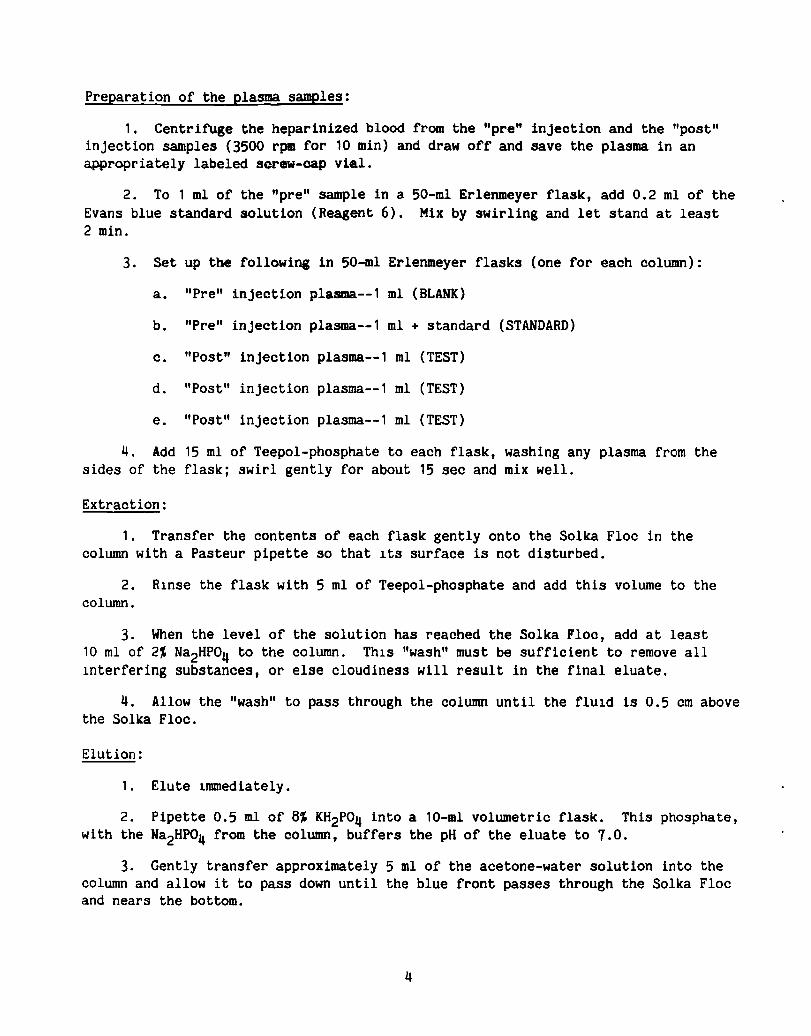
Preparation of the plasma samples:
1. Centrifuge the heparinized blood from the "pre" injection and the "post" injection samples (3500 rpm for 10 min) and draw off and save the plasma in an appropriately labeled screw-cap vial.
2. To 1 ml of the "pre" sample in a 50-ml Erlenmeyer flask, add 0.2 ml of the Evans blue standard solution (Reagent 6). Mix by swirling and let stand at least 2 min.
3. Set up the following in 50-ml Erlenmeyer flasks (one for each column):
a. "Pre" injection plasma.--1 ml (BLANK)
b. "Pre" injection plasma--1 ml + standard (STANDARD)
c. "Post" injection plasma--1 ml (TEST)
d. "Post" injection plasma--1 ml (TEST)
e. "Post" injection plasma--1 ml (TEST)
4. Add 15 ml of Teepol-phosphate to each flask, washing any plasma from the sides of the flask; swirl gently for about 15 sec and mix well.
Extraction:
1. Transfer the contents of each flask gently onto the Solka Floc in the column with a Pasteur pipette so that Its surface is not disturbed.
2. RInse the flask with 5 ml of Teepol-phosphate and add this volume to the column.
3. When the level of the solution has reached the Solka Floo, add at least 10 ml of 2% Na2HP04 to the column. ThIS "wash" must be sufficient to remove all lnterfering substances, or else cloudiness will result in the final eluate.
4. Allow the "wash" to pass through the column until the flUId is 0.5 cm above the Solka Floc.
Elution:
1. Elute Immediately.
2. Pipette 0.5 ml of 8% KH2P04 into a 10-ml volumetric flask. This phosphate, with the Na2HP04 from the column, buffers the pH of the eluate to 7.0.
3. Gently transfer approximately 5 ml of the acetone-water solution into the column and allow it to pass down until the blue front passes through the Solka Floc and nears the bottom.
4

4. Place the 10-ml volumetric flask with K2P04 under the column and allow the blue front to pass it. (Do not let the top of the column become dry; add more acetone-water if needed.)
5. Allow the columns to stand 15 min before completing the elution.
6. Add 4-5 ml of the acetone-water solut1on 1nto the column and cont1nue the elution unt11 the eluate fills the flask to the 10-ml mark; all the blue dye should have passed out of the plasma.
7. Read the solutions in a spectrophotometer at 615 nm.
Calculation:
where
v = D =
St = v = T =
1.03 =
Plasma volume (ml) =
volume (wt) of T-1824 1njected
v x 0 x St x v T x 1.03
d1lution of STANDARD (0.2 ml of 1:50; therefore d1lut1on = 1:250) absorbance of STANDARD volume of sample extracted (1 ml) absorbance of TEST sample m1nus absorbance of BLANK factor introduced to correct for slow dye uptake by the t1ssues
Blood volume = PV x 100 100 - (0.87 Hct)
(1)
(2)
where 0.87 1S a correction factor (about 4% of the Hct is trapped plasma; therefore, the true volume of packed cells 1S 0.96 Hct; whole-body Hct is 0.91 x true packed cell volume; hence, 0.96 x 0.91 = 0.87), and Hct is the raw Hct.
Ames Test for Carc1nogen1c1ty of T-1824
The Ames assay procedure (refs. 8,9) uS1ng Salmonella typh1murium (LT2) stra1ns TA1535, TA1537, TA1538, TA98, and TA100 is about 80% to 90% rel1able in detect1ng carc1nogens as mutagens. The test has about the same reliab1lity 1n 1dentifying chem1cals that are not carc1nogen1c. Therefore, neither a positive nor a negative response proves conclus1vely that a chem1cal 1S or 1S not carcinogenic to humans. The test consists of compar1ng the number of h1st1d1ne-1ndependent colonies on treated agar plates w1th the number found on control plates. Since all the plated Salmonella 1ndicator organ1sms undergo a few cell diV1s1ons in the presence of the test chem1cal, the assay procedure must be cons1dered sem1quant1tat1ve. The estab-11shment of mutagen1c1ty (carcinogenlc1ty) rel1es on the demonstrat1on of a mutagen1c dose-response relationship. The test chem1cals are assayed at several dose levels w1th1n a nontox1c dose range. Toxic1ty is present 1f there 1S clearing of the background growth "lawn," a decrease In the number of "revertent" colonies below the spontaneous baCkground, or formation of pinpo1nt colonies of surv1v1ng cells.
5
The test chemicals are considered mutagenic in the Salmonella/microsome pre1ncubation assay if they elicit a reproducible dose-related increase in the number of histidine revertents per plate in one or more of the five test trains. The dye samples (General Diagnostics Lot 4018031 and Harvey Laboratories Lot 10810) were tested initially in strain TA9S up to 200 pI/plate, then in all five strains up to 200 p/plate, and, finally, 1n all five strains up to a dose of 1000 pI/plate (approximately 4600 ~g of anhydrous dye). Each dose for human injection contains 22.6 mg of dye that 1S diluted into 2.5 to 4.0 liters of plasma. Neither of the two Evans blue dye samples caused any tOX1C or mutagenic effects in any of the three assay tests.
Errors in T-1824 Technique
The repeatability of PV measurements with T-1824 depends upon the constancy of the plasma albumin content over the tracer equilibrium period, and from one measurement per10d to the next. Results from our stud1es (refs. 6 and 13) have indicated that: (a) Both T-1824 space and 1-131 space, determ1ned from a single sample obta1ned 10 min after InjectIon, were comparable with the zero-time extrapolation values determined from ser1al sampling. (b) Four consecutive inject10ns of T-1824 on alternate days, resultIng In residual dye bUIldup to 87% of one dose, d1d not SIgnIficantly affect the accuracy of measurement of Evans blue space. (c) Four consecutive injections of 1-131 on alternate days resulting in reSIdual radiation buildup of 85% of one dose, d1d not slgnificantly affect the accuracy of measurement of 1-131 space, and (d) T-1824 and 1-131 did not Interfere with each other when the two tracers were used simultaneously, and their results were comparable (refs. 6 and 13). We have studIed the var1abllity of the basal PV (Evans blue space) in normal, healthy humans at varIOUS inte~vals up to 28 days (Table 1). The variability (±SE) between subjects ranges from 16 to 112 ml, whereas the constancy of the PV over 28 days ranges between -31 and +28 mI. The mean (±SE) of the absolute dlfferences between the seven palred measurements lS 8 ±7 mI. These f1ndings emphaSlze the constancy of the day-to-day PV in men and women llvlng their normal lives (Table 1).
There are two additional problems wlth the albumin-labeled tracer methods. One lnvolves the constancy of the albumin content over the per10d of measurement. The net exchange of album1n can vary from 4 to 7% within a 60-min period wlth subjects at rest or undergoing mild exerCIse (refs. 27), and there can be an addlt10nal Sh1ft of albumin (-4% to -8%) durlng 10 min of maximal exercise (refs. 15,27,28). A comparIson was made between the percent change ln PV, determined from control and postmaximal-exercise Evans blue spaces, and the change in PV from the Hb-Hct equatlon. The postexerc1se Evans blue value was the concentration of res1dual dye remaining after the single preexerclse injection. There was essentially no positive relationship between the PV determ1ned from the two methods, which suggests that analysis of residual dye 1S useless as an estimate of PV immediately after heavy exerClse (ref. 29) and after 8 hr of water immerSIon (ref. 30). The second problem is that the use of these tracer techn1ques is limited when one must make repeated measurements of PV over short time intervals. Since the minimum equilibratlon tlme
6

for these tracers is 10 min, PV determ1nations at shorter intervals are d1fficult to perform accurately. It is doubtful whether determinations made at consecutive 10-m1n 1ntervals would be accurate because of the progressively increasing tracer concentrat1ons in the succeeding pre1njection basel1ne samples. Clearly, another analytical techn1que for est1mating changes 1n PV at shorter intervals is needed.
HemoglobIn-HematocrIt and Hematocrit Transformat1ons
It is interest1ng that the early methods for estimat1ng PV and total blood volumes 1nvolved the measurement of Hb concentrat1on before and after the 1nject1on of hemoblobin Solut1ons (ref. 31). The relat1ve constancy of the number of red blood cells and their content of Hb prov1des the baS1S for two related alternat1ve methods for calculat1ng changes 1n PV over short-term 1ntervals (hours). They 1nvolve the measurement of the Hb concentrat1on and Hct (the ratio of the packed cell volume to the cell volume plus PV), and measurement of the Hct alone.
The first equat10n for the calculat10n of changes in PV uS1ng the Hb and Hct was publ1shed by Elk1nton, Danowski, and Winkler (ref. 12):
rewr1tten as
PV a
(1 - Hkt2) = x (1 Hkt 1)
(1 - Hct ) a x
(1 - Hctb)
Strauss et al. (49) put 1t 1n the form of percent change:
(1 - Hct2) x x 100 (1 - Hct 1)
rewr1tten as
% 6PV = 100 (1 - Hcta )
x (1 Hctb)
where a = after fluid Sh1ft and b = before fluid Sh1ft.
(3)
(4)
(5)
(6)
If the right-hand side of equat10n (6) is subtracted from 100, the percent change In PV 1S obta1ned directly. The derivation of the equat10n 1S presented in Table 2. In this equat10n the change in PV 1S calculated from the Hct, assum1ng the red cell volume and the Fcell rat10 (total body Hct/large vessel Hct) rema1n
7
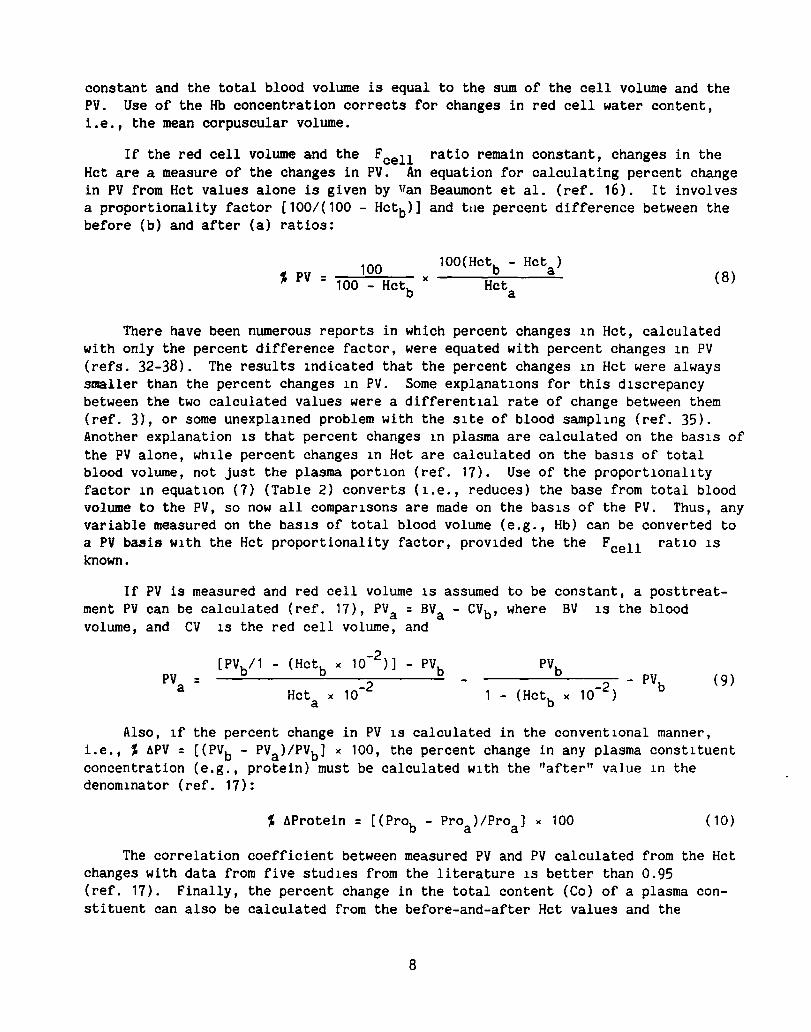
constant and the total blood volume is equal to the sum of the cell volume and the PV. Use of the Hb concentration corrects for changes in red cell water content, i.e., the mean corpuscular volume.
If the red cell volume and the Fcell Hct are a measure of the changes in PV. An in PV from Hct values alone is given by "an a proportionality factor [100/(100 - Hctb)] before (b) and after (a) ratios:
% PV 100 = x 100 - Hctb
ratio remain constant, changes in the equation for calculating percent change Beaumont et ale (ref. 16). It involves and tue percent difference between the
100(Hctb - Hcta )
Hcta (8)
There have been numerous reports in which percent changes 1n Hct, calculated with only the percent difference factor, were equated with percent changes 1n PV (refs. 32-38). The results 1ndicated that the percent changes 1n Hct were always smaller than the percent changes 1n PV. Some explanat10ns for this d1screpancy between the two calculated values were a different1al rate of change between them (ref. 3), or some unexpla1ned problem with the slte of blood sampl1ng (ref. 35). Another explanation 1S that percent changes 1n plasma are calculated on the baS1S of the PV alone, wh1le percent changes 1n Hct are calculated on the baS1S of total blood volume, not just the plasma port1on (ref. 11). Use of the proport10nal1ty factor 1n equat10n (1) (Table 2) converts (l.e., reduces) the base from total blood volume to the PV, so now all compar1sons are made on the bas1s of the PV. ThUS, any variable measured on the baS1S of total blood volume (e.g., Hb) can be converted to a PV basis w1th the Hct proportionality factor, prov1ded the the Fcell rat10 1S known.
If PV is measured and red cell volume 1S assumed to be constant, a posttreatment PV can be calculated (ref. 11), PYa = BVa - CVb , where BV 1S the blood volume, and CV 1S the red cell volume, and
PV = a
-2 [PVb/1 - (Hctb x 10 )] - PVb
Hct x 10-2 a 10
- 2 ) - PVb - (Hctb x
(9)
Also, 1f the percent change in PV 1S calculated in the convent1onal manner, i.e., % ~PV = [(PVb - PVa)/PVb] x 100, the percent change in any plasma const1tuent concentration (e.g., protein) must be calculated w1th the "after" value 1n the denom1nator (ref. 11):
( 10)
The correlation coefficient between measured PV and PV calculated from the Hct changes with data from five stud1es from the literature 1S better than 0.95 (ref. 17). Finally, the percent change in the total content (Co) of a plasma constituent can also be calculated from the before-and-after Hct values and the
8
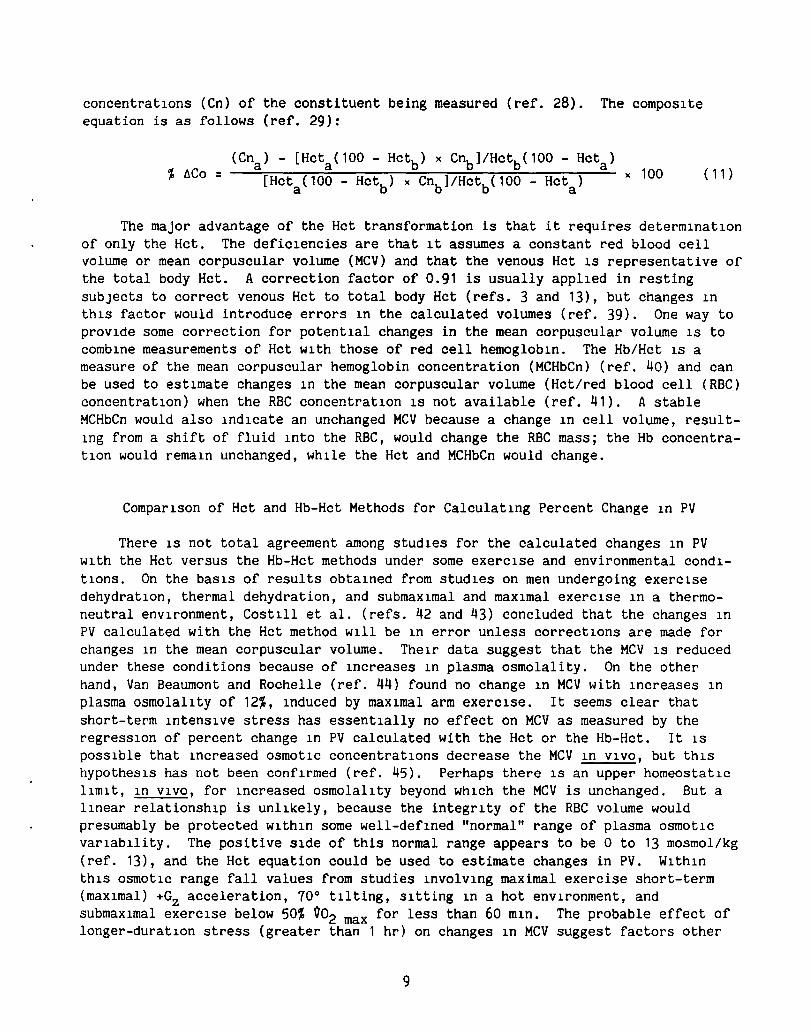
concentrat1ons (Cn) of the constituent being measured (ref. 28). The compos1te equation is as follows (ref. 29):
% ~Co = ( 11)
The major advantage of the Hct transformation is that it requires determ1nat1on of only the Hct. The deficIencies are that 1t assumes a constant red blood cell volume or mean corpuscular volume (MCV) and that the venous Hct 1S representative of the total body Hct. A correction factor of 0.91 is usually appl1ed in resting subjects to correct venous Hct to total body Hct (refs. 3 and 13), but changes 1n th1S factor would introduce errors 1n the calculated volumes (ref. 39). One way to prov1de some correction for potent1al changes in the mean corpuscular volume 1S to comb1ne measurements of Hct w1th those of red cell hemoglob1n. The Hb/Hct 1S a measure of the mean corpuscular hemoglobin concentration (MCHbCn) (ref. 40) and can be used to est1mate changes 1n the mean corpuscular volume (Hct/red blood cell (RBC) concentrat1on) when the RBC concentrat1on 1S not available (ref. 41). A stable MCHbCn would also 1nd1cate an unchanged MCV because a change 1n cell volume, result-1ng from a shift of fluid 1nto the RBC, would change the RBC mass; the Hb concentrat10n would rema1n unchanged, wh1le the Hct and MCHbCn would change.
Compar1son of Hct and Hb-Hct Methods for Calculat1ng Percent Change 1n PV
There 1S not total agreement among stud1es for the calculated changes 1n PV w1th the Hct versus the Hb-Hct methods under some exerC1se and environmental cond1-t1ons. On the bas1s of results obta1ned from stud1es on men undergoing exerC1se dehydrat1on, thermal dehydration, and submax1mal and max1mal exerC1se 1n a thermoneutral env1ronment, Cost111 et al. (refs. 42 and 43) concluded that the changes 1n PV calculated with the Hct method w1II be 1n error unless correct1ons are made for changes 1n the mean corpuscular volume. The1r data suggest that the MCV 1S reduced under these conditions because of 1ncreases 1n plasma osmolality. On the other hand, Van Beaumont and Rochelle (ref. 44) found no change 1n MCV with 1ncreases 1n plasma osmolallty of 12%, lnduced by maxlmal arm exerClse. It seems clear that short-term 1ntenS1ve stress has essent1ally no effect on MCV as measured by the regress10n of percent change In PV calculated with the Hct or the Hb-Hct. It 1S poss1ble that 1ncreased osmot1c concentrat1ons decrease the MCV 1n V1VO, but th1S hypothes1s has not been conf1rmed (ref. 45). Perhaps there 1S an upper homeostat1c Ilm1t, 1n V1VO, for 1ncreased osmolal1ty beyond WhlCh the MCV is unchanged. But a 11near relationsh1p is unl1kely, because the integr1ty of the RBC volume would presumably be protected w1thln some well-def1ned "normal" range of plasma osmot1c var1ab1lity. The positive SIde of this normal range appears to be 0 to 13 mosmol/kg (ref. 13), and the Hct equation could be used to estimate changes in PV. W1th1n th1S osmot1c range fall values from studies 1nvolv1ng maximal exercise short-term (max1mal) +Gz acceleration, 10° tllting, SItting 1n a hot env1ronment, and submaxlmal exerC1se below 50% ~02 max for less than 60 mln. The probable effect of longer-durat1on stress (greater than 1 hr) on changes 1n MCV suggest factors other
9
than just an increase in plasma osmolality are involved, because osmotic equillbrium between plasma and RBe probably occurs within minutes, not hours.
While the Hct and Hb-Hct transformations provide a method for estimating changes in PV at much shorter intervals than with Evans blue dye or lodine isotope dllution, they cannot be used to measure changes in PV continuously. Measurement of changes in blood density on-line can be ~sed to estimate changes in plasma or blood volumes continuously. This method wlil be discu&~ed in the followlng sectlon.
BLOOD DENSITOMETRt
Densitometry on Biologic Fluids
Blood denslty (BO) measurements were first performed in 1881 with the fall Ingdrop method (ref. 46). In the late 1940s, slmilar technlques were used to estimate Hct, Hb, and plasma proteln concentrations (refs. 41 and 48). But because all early density technlques (refractometry, faillng-drop method) were elther Impreclse or laborious, densltometry had been abandoned for use in physiological research. For physical and industrial research purposes, the reliable mass and volume measurements, often hard to perform with the required accuracy, remained the method of chOlce for determlnatlons of a sample's mass density, l.e., mass per unlt volume.
In 1966 a new method was introduced--the mechanical osclilator technique (MOT)--which was first used for high-precision measurements on homogenous flulds and gases in conjunctlon wlth X-ray refractlon analysis of molecular structure (ref. 18). Shortly thereafter, the MOT was used to measure the denslty of beverages, gasoline, tritiated water, inorganiC and organlc solutions, etc. Recently, ItS use for contlnuous measurement on blood (refs. 21-23,49-51) and lymph (ref. 52) was introduced.
The MOT combines the advantages of hlgh accuracy (up to 10-6 g/ml); small volumes (~50 ~l); appllcabillty for contlnuous recordings; short measurlng tlme (~1 s per measuring cycle in the contlnuous mode, dependlng upon the dimenSlons of the osc1llator used); and independence from an external acceleratlon fleld, which allows its use in welghtless condlt1ons. With the Introduction of th1S method In biology, physiology, and clin1cal med1clne, h1gh-prec1sion denslty measurements of blood and its constItuents have rega1ned their usefulness for biomedical research.
How the Mechanlcal Osc1llator Techn1que Works
Mass density determinations with the denslty-measuring apparatus (OMA) employ the MOT, which 1S based on the mass-sprlng principle: the actual resonant frequency (f) of an oscillating U-shaped glass tube, comparable to a tunlng fork In shape and phYSIcal features, is determined accordlng to
f = 1/2 ~/c/(M + O·V) o
10
(12)
where c lS the constant of elasticity for the glass tube, Mo is the inertial mass of the empty tube (the oscillator), D is the density (mass per un1t volume), and V the volume of the sample contained in the tube.
The tube lS brought to bend lng-type osclilatlons perpendicular to the plane of the U by a variable electromagnetic sinuso1dal field, and the movements of ltS tlP are sensed by an optical system. The resonant frequency is tracked by a feedback loop. The osclilation duration is determined precisely for each measurlng perlod by sensing and averaging several hundred slngle cycles on-line. The length of the measurlng period can be preset (e.g., =1, 2, 4, or 8 sec ln the case of low-volume DMAs). The MOT lS based on high-resolution oscillation time determlnatlons.
Before startlng a set of density recordings, the system is callbrated wlth two medla of known denslty, usually alr and water. Then, density values are computed by the bUllt-ln microprocessor from the average oscillation time. The denslty slgnal can be dlrectly fed to a dlgltal/analog output for continuous recordlngs. Thus, hlgh-preclsion density measurements can be made on small volumes of blOloglC flulds wlthout mass or volume measurements.
The vlbratlon of the DMA's glass tube creates centrifugal forces, the resultant of WhlCh 1S directed toward the tlP of the oscillator. Since thlS force lS «1 gram 1n the normal operating range (ref. 53), no lnterference in terms of blood sedimentatlon occurs during BD measurements, particularly in the cont1nuous mode.
Deposltlon of plasma protelns and corpuscular elements (e.g., thrombocyte aggregates) can be prevented by coatlng the glass surface wlth slilcon prlor to measurement uSlng Surfasll™ (Plerce Co.). No difference between contlnuously determlned BD and values from synchronously obtalned blood samples could be observed when coated osc1llators were used, especially for operation exceedlng several hours (ref. 21).
Slgnlflcance of the Mass Denslty of B10log1C Fluids
The denslty of lsotonlC flulds at a given temperature is a llnear function of the fluld's total proteln concentratlon (refs. 54 and 55); for blood thlS lS approXlmately
BPC = PPC(1 - HctR - HctW) + MCHbCn . HctR + MLPC . HctW ( 13)
where BPC lS the blood proteln concentratlon, PPC is the plasma proteln concentratIon, MCHbCn lS the mean corpuscular hemoglobln concentrat10n, MLPC lS the mean leukocyte proteln concentration, HctR lS the red cell hematocrlt, and HctW 1S the whlte cell hematocrit (given as volume fract10n). The contrlbutlon of blood platelets 1S lncorporated lnto the plasma protein concentratlon after mlld centr1fugatlon (platelet-rlch plasma), and into the mean leukocyte proteln concentratlon after lntense centrifugation of blood. If hemolysls occurs, the influence of additlonal Hb on the plasma density can be compensated for by colorimetrlc means (ref. 56) to determme the "true" plasma denslty.
11

The plasma protein and mean corpuscular hemoglobin concentrations are regulated within narrow limits under normal physiological conditions whereas Hct may vary more wIdely; Hctw is usually low «0.01). Since the mean corpuscular Hb concentration IS four to five times greater (300-400 gram/liter) than the plasma protein concentration (60-80 gil), blood protein and Hct are closely correlated. Consequently, the BD WhICh is a function of the blood proteIn concentration, is correlated lInearly with Hct (refs. 19,20,54). However, PD--~t a given temperature and proteIn concentration--is influenced by plasma lipid, glucose, and urea concentratIon (ref. 55). Further, the leukocyte density becomes more Important in cases of leukocytosis. These confoundIng factors may diminIsh the accuracy ~: densItometry for the determInation of protein concentratIon and Hct, although It remains effectIve for rough estimatIons, particularly on a screenIng basIs.
In a single experIment, In which the amount of these potentially confounding factors can be assumed to remaIn constant, densIty alteratIons are a precise measure of plasma proteIn and Hb concentratIon shifts. Moreover, the densIty of fluId shifted between the extravascular and Intravascular compartments can be computed, SInce this "fIltrate" densIty differs from both blood and plasma densItIes (refs. 21 and 39). ExperIments WhICh combine this technique WIth the advantage of contInuous BD measurements reveal new Insight not only Into the amount but also Into the timecourse of rapid mIcrovascular fluId exchange (refs. 21,23,50,51). Dur1ng contInuous densItometry, proper compensatIon of possIble thermal deviatIons becomes most Important. Recent studies (refs. 19 and 57) have provided data for correct1ons of temperature-induced errors In on-line density recordIngs.
DensIty Shifts WIth Changes In Posture
Blood volume regulat10n In humans IS serIously challenged by assuming an uprIght posture. QUIet standIng leads to rapid and persistent hemoconcentration, whIch may result in PV losses in excess of 20%. Calculation of the densIty of flUId leavIng or enterIng the cIrculatory system, under IsotonIC conditIons, allows for the assessment of the amount of proteIn WhICh moves across the cap1llary walls durIng orthostat1cally Induced capIllary filtratIon.
The mass densIty of red cells does not change WIth alterations of posture 1n euhydrated man (ref. 58). ThIS observation helps to valIdate the calculatIon of the density and volume of flUId shIfted between 1ntra- and extravascular compartments, USIng formulae WhICh assume no net fluid transfer between the corpuscular and plasma compartments. For both Inward fIltratIon (from assumpt10n of the supIne poslt1on after the upright) and outward movement of flUId (uprIght POSItIon after supIne), essentially the same fluid denslty (1008 gram/liter, 37°C) IS found wlth an unchanged Fcell ratIO. This result lndicates a proteln concentration of ~30 gil In the shifted fluid, or approxImately 40% of that in the blood plasma (39).
12
Continuous Blood Density Measurements
The MOT has been employed for continuous measurements on arterial blood in animals (refs. 21,23,50) and during blood dialysis in patients (refs. 23 and 49). Recently, coronary sinus blood in dogs was used for on-line densit~ recordings (ref. 51). The accuracy of the density data was better than 1·10- g/ml in these stud1es.
Changes in the plasma protein concentration after blood volume alteratIons provide an accurate measure of volume replacement only if the net protein concentration of the shifted flu1d is known. Results from different hemorrhage studies are contradictory and demonstrate that filtrate protein content ranges from zero to about half of the plasma concentration after hemorrhage. If a slgn1ficant amount of prote1n moves with the filtrate, then the degree of fluid replacement 1S underestimated from calculations which are based on the assumption that the observed plasma prote1n concentration changes are due to an admixture of prote1n-free fluid. Continuous monitoring of the mass density of flow1ng blood, combined w1th plasma dens1ty and Hct determinat1ons, can help to elucidate the volume and prote1n concentration of even small flu1d shifts. Results from a recent study on the effects of moderate hemorrhage (ref. 21) suggested that e1ther the 1nward-shlfted flu1d had a h1gher density than normal ultrafiltrate, and/or there was a rise of the rat10 of whole-body to large-vessel Hct (Fcell ratio).
The investigation of rapid compensatory mechanisms after blood loss 1S complicated by the poss1bility of simultaneous shifts in the Fcell rat10. If It IS altered, the observed changes in measured Hct are due only in part to transcapillary fluid flux, and volume shift results from the Hct data may be 1n error.
If the Fcell ratio is constant, as dur1ng pass1ve body t1ltlng, the denSIty of transcap1llary exchanged fluid can be calculated from blood denSIty (BD) and plasma dens1ty (PO) changes (refs. 21 and 39) uS1ng the formulae:
Hct'(1 - HctO) FD = PdO - Hct
o _ Hct' (PDO - PO') (14)
or
FD = BD - Hct' (BD B ') o Hcto - Hct' 0 - 0 (15)
where PDO' HctO' and BOO refer to the state wIth the larger blood volume (after volume repletion, or before outward shift), whereas PO', Hct', and BD' refer to the hemoconcentrated condit1on. Hct 1S corrected for whole body hematocrIt. Provided there are no measur1ng errors and the red cell volume rema1ned constant, the flu1d density (FD) from both equations should be identical.
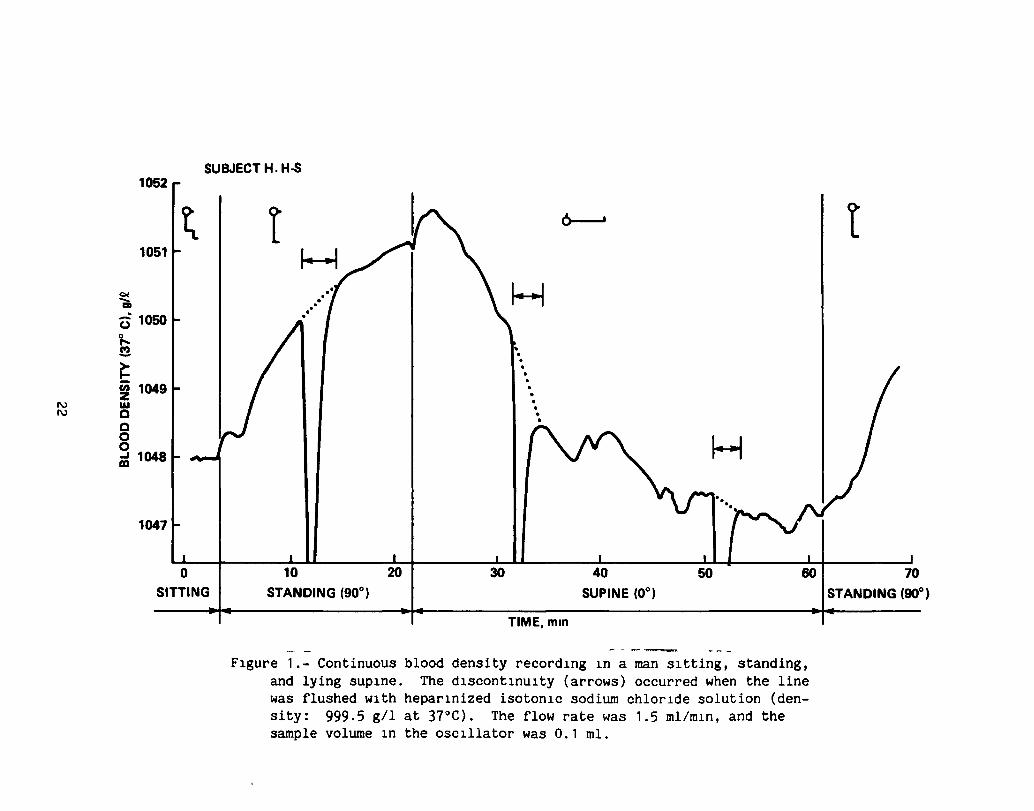
Whereas plasma density and Hct cannot be measured continuously, the mechanical oscillator techn1que provides the advantage of precise on-line measurement of blood density changes. As an example, figure 1 shows the first blood density curve
13
measured in a human which was obtained from venous (cubital) blood when the subject changed from the sitting to the standing and the supine positions. There are transient deviations from a simple exponential time-course curve immediately after the postural changes which may be caused by baroreflex-driven dynamic resettings of the peripheral reSistance, thus influencing the capillary filtration pressure on a minute-by-m1nute basls, 1n addltlpn to the normal hydrostatic effects on mIcrovascular fluid exchange.
From the magnitude of the density alterations, the volume of the exchanged fluid (FV) can be calculated from
BOO - BO' FV ; ~~---",.,,-
BO' - FO (fraction of BVO) (16)
Thus, WIth use of blood densitometry, not only the magnitude, but also the continuous time-course of flUId ShIfts can be detected. Use of this technIque should result In sIgnificant advances in our knowledge of fluId-electrolyte-proteln physiology.
14

REFERENCES
1. Gregersen, M. I.: A Practical Method for the DetermInation of Blood Volume WIth the Dye T-1824. A Survey of the Present Basis of the Dye-Method and Its ClinIcal ApplicatIons. J. Lab. Clin. Med., vol. 29, 1944, pp. 1266-1286.
2. Gregersen, M. I.; Gibson, J. G.; and Stead, E. A.: Plasma Volume DetermInatIon With Dyes; Errors in Colorimetry; the Use of the Blue Dye T-1824. Am. J. PhYSIOl., vol. 113, 1935, pp. 54-55.
3. Gregersen, M. I.; and Rawson, R. A.: Blood Volume. Physiol. Rev., vol. 39, 1959, pp. 301-342.
4. Schultz, A. L.; Hammarsten, J. F.; Heller, B. I.; and Ebert, R. V.: A CrItlcal Comparison of the T-1824 Dye and Iodinated Albumin Methods for Plasma Volume Measurement. J. Clin. Invest., vol. 32, 1953, pp. 101-112.
5. Sear, H.; Allen, T. H.; and Gregersen, M. I.: Simultaneous Measurement In Dogs of the Plasma Volume With 1131 Human AlbumIn and T-1824 With Comparisons of Thelr Long Term Disappearance From the Plasma. Am. J. PhYSlOl., vol. 115, 1953, pp. 240-242.
6. Young, H. L.; Juhos, L.; Castle, B. L.; Yusken, J.; and Greenleaf, J. E.: Body Water Compartments During Bed Rest: Evaluation of Analytlcal Methods. NASA Tech. Rept. R-406, WashIngton, DC, 1913, 19 pp.
1. Zlpf, R. E.; Webber, J. M.; and Grove, G. R.: A Comparlson of Routine Plasma Volume Determlnatlon Methods USlng Radioiodinated Human Serum AlbumIn and Evans Blue Dye {T-1824}. J. Lab. Clln. Med., vol. 45, 1955, pp. 800-805.
8. Ames, B. N.; Durston, W. E.; Yamasaki, E.; and Lee, F. D.: Carcinogens Are Mutagens: A Slmple Test System Comblning LIver Homogenates for Actlvatlon and Bacterla for Detection. Proc. Natl. Acad. Sci., vol. 10, 1913, pp. 2281-2285.
9. Ames, B. N.; Lee, F. D.; and Durston, W. E.: An Improved Bacterlal Test System for the Detectlon and Classlflcation of Mutagens and CarCInogens. Proc. Natl. Acad. Sci., vol. 10, 1913, pp. 182-186.
10. Juhos, L. T.; Mortelmans, K. E.; and Shepherd, G. F.: In Vltro Mlcroblologlcal MutagenIcIty Assays of Evans Blue. Stanford Res. Inst. Int. Rept., LSU-1449, 1980, 12 pp.
11. Marx, J. L.: Low-Level Radlation: Just How Bad Is It? SClence, vol. 204, 1919, pp. 160-164.
15

12. Elkinton, J. R.; Danowski, T. S.; and Winkler, A. W.: Hemodynamic Changes ln Salt Depletion and in Dehydratlon. J. Clin. Invest., vol. 25, 1946, pp. 120-169.
13. Greenleaf, J. E.; Convertino, V. A.; and Hangseth, G. R.: Plasma Volume During Stress 1n Han: Osmolality and Red Cell Volume. J. Appl. Physiol., vol. 47, 1979, pp. 1031-1038.
14. Strauss, H. B.; Davis, R. K.; Rosenbaum, J. D.; and R08smeisl, E. C.: "Water Diuresis" Produced During Recumbency by the Int~Qvenous Infuslon of Isotonlc Sal1ne Solution. J. Clin. Invest., vol. 30, 1951, pp. 862-868.
15. Greenleaf, J. E.; Bernauer, E. M.; Adams, W. C.; and Juhos, L.: Fluidelectrolyte shift and V02 max ln Han at Slmulated Alt1tude (2,287 m). J. Appl. Physiol., vol. 44, 1978, pp. 652-658.
16.
17.
18.
19.
20.
21.
Van Beaumont, W.: Evaluation of Hemoconcentration From Hematocrlt Measurements. J. Appl. Physiol., vol. 32, 1972, pp. 712-713.
Van Beaumont, W.; Greenleaf, J. E.; and Juhos, L.: Disproportlonal Changes ln Hematocrit, Plasma Volume, and Protelns During Exercise and Bed Rest. J. Appl. Physiol., vol. 33, 1972, pp. 55-61.
Kratky, 0.; Leopold, H.; and Stablnger, H.: Dichtemessung an Flusslgkelten und Gassen auf 10-6 g/cm3 bei 0.6 cm3 Probenvolumen. Zeit. Angew. Physlk, vol. 27, 1966, pp. 273-277.
Hinghofer-Szalkay, H.; and Holzer, H.: The Calculation of Hemoglobln Concentration from Blood and Plasma Densltles, Measured by the Mechanlcal Oscillator Technlque. J. Clln. Chem. Clln. Biochem., vol. 17, 1979, pp. 613-618.
Hinghofer-Szalkay, T.; Kenner, T.; Leopold, H.; and Holzer, H.: Ole Anwendung der Blegeschw1ngermethode zur Messung von Blutdichte und Hamatokr1t. KIln. Wochenschr., vol. 57, 1979, pp. 1163-1167.
Hinghofer-Szalkay, H.: Contlnuous Blood Densltometry: Flu1d Shlfts After Graded Hemorrhage in Animals. Am. J. Physiol.: Heart eirc. Physlol., 1985. In press.
22. Kenner, T.; Hinghofer-Szalkay, H.; Leopold, H.; and Pogglitsch, H.: Verhalten der Blutdichte ln Relatlon zum Blutdruck im Tierversuch und bel Hamodialyse von Patienten. Zelt. Kardiologle, vol. 66, 1977, pp. 399-401.
23. Kenner, T.; Leopold, H.; and Hinghofer-Szalkay, H.: The Contlnuous HlghPreclsion Measurement of the Denslty of Flowing Blood. Pfluegers Arch., vol. 370, 1977, pp. 25-29.
16

24. Allen, T. Lipemia.
J.: Extraction of T-1824 in the Presence of Gross Hemolysis and Proc. Soc. Exp. Biol. Med., vol. 16, 1951, pp. 145-141.
25. Allen, T. H.; and Orahovats, P. D.: Cellophane Measurement of T-1824. Am. J. PhYSI01., vol. 154, 1948, pp. 21-37.
26. Campbell, T. J.; Frohman, B.; and E. B. Reeve: A SImple, RapId, and Accurate Method of Extracting T-1824 from Plasma, Adapted to the Routine Measurement of Blood Volume. J. Lab. Clin. Med., vol. 52, 1958, pp. 768-777.
27. Greenleaf, J. E., Convertino, V. A.; C.; Vignau, S. R.; and Brock, P. J.: and Thermoregulat1on During Exercise pp. 1026-1032.
Stremel, R. W.; Bernauer, E. M.; Adams, W. Plasma [Na+], [Ca2+] and Volume Sh1fts
in Man. J. Appl. Physiol., vol. 43, 1977,
28. Van Beaumont, W.; Strand, J. C.; Petrofsky, J. S.; Hipskind, S. G.; and Greenleaf, J. E.: Changes in Total Plasma Content of Electrolytes and Prote1ns w1th MaxImal Exerc1se. J. Appl. Physiol., vol. 34, 1973, pp. 102-106.
29. Greenleaf, J. E.; Van Beaumont, W.; Brock, P. J.; Morse, J. T.; and Mangseth, G. R.: Plasma Volume and Electrolyte Sh1fts With Heavy Exerc1se 1n Sltting and Supine POS1tions. Am. J. Physiol., vol. 236 (Regulatory IntegratIve Compo PhYS10l., vol. 5), 1979, pp. R206-R214.
30. Greenleaf, J. E.; Shvartz, E.; and Keil, L. C.: Hemod1lutlon, VasopreSSin Suppression, and D1uresis Dur1ng Water Immers10n in Man. AVlat. Space Env1ron. Med., vol. 52, 1981, pp. 329-336.
31. Barratt, J. 0. W.; and Yorke, W.: A Method of Estimat1ng the Total Volume of Blood Contained 1n the LIv1ng Body. Proc. Roy. Soc. London, vol. 81, 1909, pp. 381-394.
32. Bullard, R. W.; D1ll, D. B.; and Yousef, M. K.: Responses of the Burro to Desert Heat Stress. J. Appl. PhYS10l., vol. 29, 1970, pp. 159-161.
33. Joye, H.; and Poortmans, J. R.: HematocrIt and Serum Prote1ns Dur1ng Arm ExerCIse. Med. Sci. Sports, vol. 2, 1970, pp. 187-190.
34. Poortmans, J. R.: Serum Prote1n Determ1nat1on During Short Exhaustive Phys1cal Act1Vity. J. Appl. PhYS10l., vol. 30, 1970, pp. 190-192.
35. Saltin, B.: Circulatory Response to Submaximal and MaXImal Exerc1se After Thermal Dehydration. J. Appl. PhYSIOl., vol. 19, 1964, pp. 1125-1132.
36. Senay, L. C., Jr.: Movement of Water, Protein and Crystalloids Between Vascular and Extravascular Compartments 1n Heat-Exposed Men DurIng Dehydrat10n and FollowIng Lim1ted Relief of Dehydration. J. PhYS10l. (London), vol. 210, 1970, pp. 617-635.
17

37. Senay, L. c., Jr.; and Christensen, H. L.: Changes in Blood Plasma DurIng Progressive Dehydration. J. Appl. Physiol., vol. 20, 1965, pp. 1136-1140.
38. Stein, H. J.; Eliot, J. W.; and Bader, R. A.: Physiological Reactions to Cold and Their Effects on the Retention of Acclimatization to Heat. J. Appl. Physiol., vol. 1, 1949, pp. 575-585.
39. Harrison, H. H.; Graveney, H. J.; and Cochraue, L. A.: in the Calculation of Relative Change in Plasma Volume. Physiol., vol. 50, 1982, pp. 13-21.
Some Sources of Error Eur. J. Appl.
40. Wlntrobe, H. H.: The Size and Hemoglobin Content of the Erythrocyte. J. Lab. Clin. Hed., vol. 17, 1932, pp. 899-912.
41. Streeten, D. H. P.; and Thorn, G. W.: Use of Changes in the Hean Corpuscular Hemoglobin Concentration as an Index of Erythrocyte Hydration. J. Lab. Clln. Hed., vol. 49, 1957, pp. 661-671.
42. Costill, D. L.; Branam, L.; Eddy, D.; and Fink, W.: AlteratIons In Red Cell Volume Following Exercise and Dehydration. J. Appl. Physiol., vol. 37, 1974, pp. 912-916.
43. Costill, D. L.; and Fink, W. J.: Plasma Volume Changes FollOWIng ExerCIse and Thermal Dehydration. J. Appl. Physiol., vol. 37, 1974, pp. 521-525.
44. Van Beaumont, W.; and Rochelle, R. H.: Erythrocyte Volume Stability WIth Plasma Osmolarity Changes in ExerCIsing Man. Proc. Soc. Exp. BioI. Hed., vol. 145, 1974, pp. 240-243.
45. Eisenman, A. J.; MacKenZIe, L. B.; and Peters, J. P.: ProteIn and Water of Serum and Cells of Human Blood, With a Note on the Heasurement of Red Blood Cell Volume. J. BIOI. Chem., vol. 116, 1936, pp. 33-45.
46. Lloyd Jones, E.: On the VarIations in the SpeCIfIC GraVIty of the Blood In Health and Disease. J. PhYSlOl. (London), vol. 8, 1887, pp. 1-14.
47. PhIllips, R. A.; Van Slyke, D.; Hamilton, P.; Dole, V. P.; Emerson, K.; and Archibald, R. H.: Measurement of Specific GraVIties of Whole Blood and Plasma by Standard Copper Sulfate Solutions. J. BioI. Chern., vol. 183, 1950, pp. 305-330.
48. Van Slyke, D. D.; Hiller, A.; Phlllips, R. A.; Hamllton, P. B.; Dole, V. P.; Archibald, R. H.; and Eder, H. A.: The Estimation of Plasma Protein Concentratlon From Plasma Specific GraVIty. J. BIoI. Chern., vol. 183, 1950, pp. 331-348.
18
49. Holzer, H.; Pogglitsch, H.; Hinghofer-Szalkay, H.; Kenner, T.; Leopold, H.; and Passath, A.: Die kontinuierliche Messung der Blutdlchte wahrend der Hamodlalyse. Wiener Klln. Wochenschr., vol. 91, 1979, pp. 762-765.
50. Kenner, T.; Moser, M.; and Hinghofer-Szalkay, H.: Determination of Cardlac Output and of Transcapillary Fluid Exchange by Continuous Recordlng of Blood Denslty. Basic Res. Cardiol., vol. 75, 1980, pp. 501-509.
51. Kenner, T.; Moser, M.; Hinghofer-Szalkay, H.; and Mohl, W.: Indlrect Determination of Fluid Filtration and Reabsorption In the Microcirculatlon of the Myocardium. Blomed. Tech. (Berlin), vol. 29, 1984, pp. 108-116.
52. Hlnghofer-Szalkay, H., Martensen, I., and Vogel, G.: Contlnuous Recordlngs of the Mass Denslty of Lymph: Introductlon of a New Method. Pfluegers Arch., vol. 392 S: R 10, 1982.
53. Leopold, H.; Hinghofer-Szalkay, H.; Kenner, T.; and Holzer, H.: Rapld Determlnatlon of the Sedlmentatlon Rate of Blood Free From the Influence of Gravlty. Blomed. Tech. (Berlln), vol. 23, 1978, pp. 99-103.
54. Hlnghofer-Szalkay, H.; Leopold, T.; Kenner, T.; and Holzer, H.: tiber den thermlschen Ausdehnungskoefflzlenten des Blutes und selner Komponenten. Blomed. Technlk (Berlln), vol. 25, 1980, pp. 151-157.
55. Holzer, H.; Leopold, H.; Hlnghofer-Szalkay, H.; Stubchenkirchner, H.; and Maurer, E.: GesamtelwelSbestlmmung im Serum durch Dichtemessung nach der Blegeschwingermethode. J. Clin. Chern. Clin. Blochem., vol. 16, 1978, pp. 391-395.
56. Hlnghofer-Szalkay, H.; and Wurm, H.: Der Einflus von Hamolyse auf hochgenaue Dichtemessungen an Kaplilarblutplasma mlttels der Blegesonwingermethode. J. Clin. Chern. Clin. Biochem., vol. 18, 1980, pp. 615-619.
57. Hinghofer-Szalkay, H.: Volume and Density Changes of BIologIcal FlUIds WIth Temperature. J. Appl. Physlol., 1985. In press.
58. Hinghofer-Szalkay, H.: Fluld and Proteln Shlfts After 'Postural Changes In Humans. Am. J. PhYSIOI.: Heart Circ. Physlol., 1985. In press.
19

TABLE 1, Variability (X tSE) of Evans blue space (plasma volume) in normal males (m, 18-32 yr) and females (f, 30-41 yr) in the basal state in 3- tQ 21-day periods, [A] ~ XD - XD aYn aY1
SubJ. Day 1 Day 4 Pay 8 Day 14 Day 24 Day 28
12 (m) 3531 3556 [ ... 25]
±BO ±19
17 (JII) 3489 3461 [-28)
±76 ±Bl
19 (m) 3112 3115 [+3]
t120 ±105
7 (m) 3453 3459 [+6] 3422 [ -311
±160 ±157 ±172
23 (m) 2971 2989 [+18]
±97 ±90
1 (f) 2678 2683 [+5]
±98 ±91
20
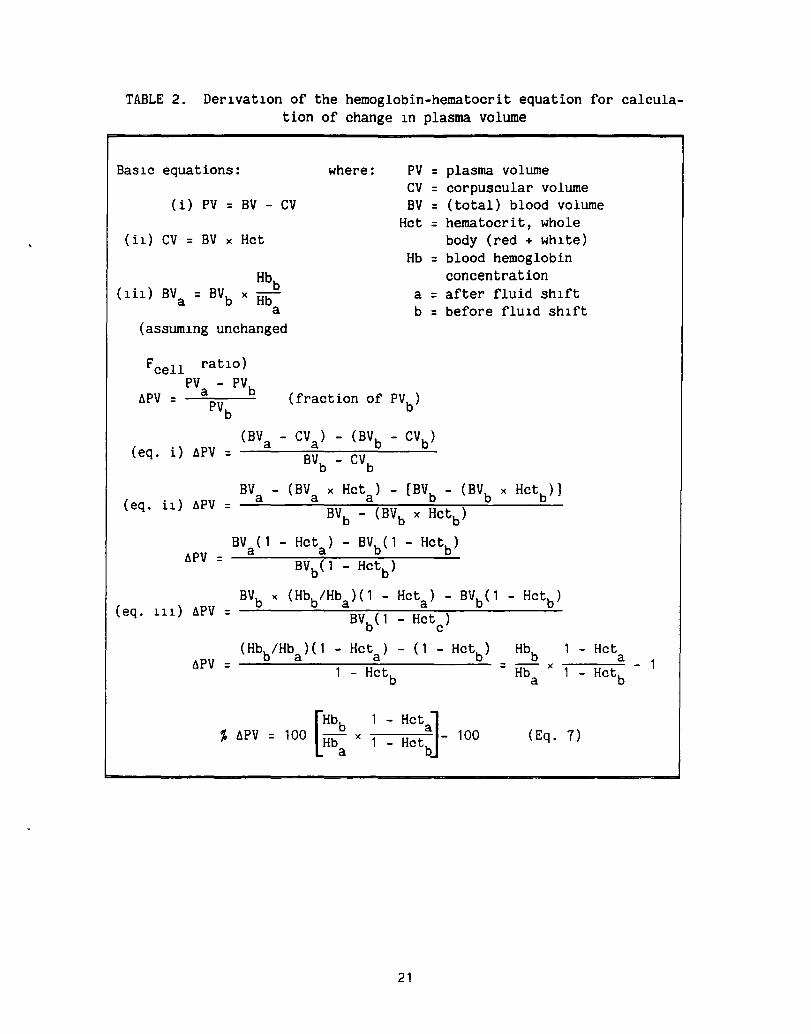
TABLE 2. Derlvatlon of the hemoglobin-hematocrit equation for calculation of change In plasma volume
BaSlc equations: where: PV = plasma volume ev = corpuscular volume
(i) PV = BV - ev BV = (total) blood volume Hct = hematocrit, whole
(i1) ev = BV x Hct body (red + whlte) Hb = blood hemoglobin
concentration a = after fluid Shlft b = before fluld ShIft
. Hbb (Ill) BVa = BVb x Hb
a (assumlng unchanged
Fcell ratIO) PVa - PVb llPV = -;;.;.......-
PVb
(fraction of PVb
)
(eq. i) llPV = (BVa - eVa) - (BVb - evb )
BVb - eVb
BV - (BV x Hcta ) - [BVb - (BVb x Hct
b)]
(eq. il) llPV a a = BVb - (BVb x Hctb )
BV (1 - Hcta ) - BVb(l - Hctb ) llPV a
= BVb(l - Hctb )
( eq . 111) llPV BVb x (Hbb/Hba )( 1 - Hcta ) - BVb(l - Hctb )
= BVb(l Hct ) c
(Hbb/Hba )( 1 - Hct ) - (1 - Hct ) Hbb - Hct a b =
a llPV - Hctb
= Hba x
- Hctb
% hPV • 100 [::: • ~ ~ ::~:]- 100 (Eq. 7)
21
- 1
N N
SUBJECT H. H-S
1051
~ ci 1050
'l... ~
~ en 1049 Z w Q
Q o o ... 1048 CD
1047
~
o SITTING
t
10
STANDING (900)
20 30
~
-. . . .
6----
40 SUPINE (00
)
TIME, min
50 60
FIgure 1.- Continuous blood density recordIng In a man sItting, standing, and lying supIne. The dIscontInuIty (arrows) occurred when the line was flushed wIth heparInized isotonIc sodium chlorIde solution (density: 999.5 gil at 37°C). The flow rate was 1.5 mllmln, and the sample volume In the oscIllator was 0.1 mI.
t
70 STANDING (900
)

1 Report No 2 Government ~OII No 3 ReciPIent's Catalog No
NASA TM-86834 4 Title and Subtitle 5 Report OIIte
PLASMA VOLUME METHODOLOGY: EVANS BLUE, HEMOGLOBIN- November 1985 HEMATOCRIT,AND MASS DENSITY TRANSFORMATIONS 6 Pwformlng OrglnlHtIOll Code
7 Author(s) 8 Performing OrglnllatlOll Report No
J. E. Greenleaf and H. Hinghofer-Szalkay 85406 10 Work Unot No
9 Performing Organozatlon Name and Address
Ames Research Center 11 Contrlet or Grant No
Moffett Field, CA 94035 13 Type of Report and Period Covered
12 Sponsoring Agency Name and Address Technical Memorandum National Aeronautics and Space Administration 14 Sponsoring Agency Code Washington, DC 20546 199-21-12-07
15 Supplementary Notes
Point of Contact: J. E. Greenleaf, Ames Research Center, MS 239A-1, Moffett Field, CA 94035, (415)694-6604 or FTS 464-6604
16 Abstract
Detailed descriptions of methods for measuring absolute levels and changes in plasma volume are presented along with derivations of pertinent equations. Reduction in variability of the Evans blue dye dilution tech-nique using chromatographic column purification suggests that the day-to-day variability in the plasma volume in humans is less than ±20 mI. Mass density determination using the mechanical-oscillator technique provides a method for measuring vascular fluid shifts continuously for assessing the density of the filtrate, and for quantifying movements of protein across microvascular walls. Equations for the calculation of volume and density of shifted fluid are presented.
17 Key Words (Suggested by Author(s)) 18 DlStrobutlon Statement
T-1824 Microcirculation Unclassified - unlimited Blood density Posture Plasma density Exercise Specific density Subject category - 52
19 Securoty a_,f (of thIS report) 20 Security o-f (of thiS ~, 21 No of PIgIS I 22 Price'
Unclassified Unclassified 24 A02
"For sale by the National TechnlCiI Information StrvlCl, Springfield, Vlrglnl. 22161

End of Document