NSW Mothers and Babies 2017 - health.nsw.gov.au · Hepatitis B 28 Table 34: Hepatitis B dose given...
88
NSW Mothers and Babies 2017
Transcript of NSW Mothers and Babies 2017 - health.nsw.gov.au · Hepatitis B 28 Table 34: Hepatitis B dose given...

NSW Mothers and Babies 2017

NSW MINISTRY OF HEALTH
73 Miller Street
Locked Mail Bag 961
NORTH SYDNEY NSW 2060
Tel: +61 2 9391 9142
Fax. +61 2 9391 9232
Email: [email protected]
Copyright © NSW Ministry of Health 2018
This work is copyright. It may be reproduced in whole or in part
for study or training purposes subject to the inclusion of an
acknowledgement of the source. It may not be reproduced for
commercial usage or sale. Reproduction for purposes other than
those indicated above requires written permission from the NSW
Ministry of Health.
SHPN (CEE) 180630
ISBN 978-1-76000-959-5
Produced by:
Centre for Epidemiology and Evidence
Population and Public Health Division
Suggested citation:
Centre for Epidemiology and Evidence. New South Wales Mothers
and Babies 2017. Sydney: NSW Ministry of Health, 2018.
Further copies of this document can be downloaded
from the NSW Ministry of Health website at
www.health.nsw.gov.au/hsnsw/Pages/
mothers-and-babies-reports.aspx.
November 2018

CONTENTS
1. ACKNOWLEDGEMENTS 7
2. EXECUTIVE SUMMARY 8
3. METHODS 9
Data sources 9
Map of NSW Local Health Districts 11
4. TRENDS IN NEW SOUTH WALES 12
Confinements and births by plurality 12 Table 1: Plurality, NSW 2013–2017 12
Local Health District of residence 12 Table 2: Maternal Local Health District of residence, NSW 2013–2017 12
Maternal age 13 Table 3: Maternal age, NSW 2013–2017 13 Figure 1: Mothers aged less than 20 years and 35 years and over, NSW 2013–2017 13
Maternal country of birth 14 Table 4: Maternal country of birth, NSW 2013–2017 14
Aboriginal and Torres Strait Islander mothers 15 Table 5: Aboriginal and Torres Strait Islander mothers, NSW 2013–2017 15
Previous pregnancies 15 Table 6: Previous pregnancies, NSW 2013–2017 15
Duration of pregnancy at first antenatal visit 15 Table 7: Duration of pregnancy at first antenatal visit, NSW 2013–2017 15
Smoking in pregnancy 16 Table 8: Smoking in pregnancy, NSW 2013–2017 16 Table 9: Mothers who smoked at all during pregnancy by number of cigarettes smoked in the second half of pregnancy, NSW 2013–2017 16
Place of birth 16 Table 10: Maternal place of birth, NSW 2013–2017 16
Diabetes 17 Table 11: Maternal diabetes, NSW 2013–2017 17
Hypertension 17 Table 12: Maternal hypertension, NSW 2013–2017 17
Labour 17 Table 13: Onset and augmentation of labour, NSW 2013–2017 17
Type of birth 18 Table 14: Type of birth, NSW 2013–2017 18 Table 15: Maternal health insurance by type of birth, NSW 2012–2016 18
NSW HEALTH | NSW Mothers and Babies 2017 | 1

Baby sex 19
Gestational age 19 Table 16: Gestational age, NSW 2013–2017 19
Birth weight 19 Table 17: Birth weight, NSW 2013–2017 19
Apgar score 19 Table 18: Apgar score at 5 minutes, NSW 2013–2017 19
Hepatitis B 20 Table 19: Hepatitis B dose given to liveborn babies, NSW 2013–2017 20
Infant feeding 20 Table 20: Live births by type of infant feeding, NSW 2013–2017 20
Perinatal outcome 20 Table 21: Perinatal outcomes, NSW 2013–2017 20
Maternal deaths 21 Table 22: Maternal deaths by year, NSW 1990-2016 21 Table 23: Maternal deaths by cause, NSW 2016 21
5. LOCAL HEALTH DISTRICTS 22
Confinements 22
Maternal age 22 Table 24: Maternal age by Local Health District of residence, NSW 2017 22
Maternal country of birth 23 Table 25: Maternal country of birth by Local Health District of residence, NSW 2017 23
Aboriginal and Torres Strait Islander mothers 24 Table 26: Aboriginal and Torres Strait Islander mothers by Local Health District of residence, NSW 2017 24
Duration of pregnancy at first antenatal visit 24 Table 27: Duration of pregnancy at first antenatal visit by Local Health District of residence, NSW 2017 24
Smoking in pregnancy 25 Table 28: Smoking in pregnancy by Local Health District of residence, NSW 2017 25
Place of birth 25 Table 29: Place of birth by Local Health District of residence, NSW 2017 25
Labour 26 Table 30: Onset and augmentation of labour by Local Health District of residence, NSW 2017 26
Type of birth 26 Table 31: Type of birth by Local Health District of residence, NSW 2017 26
Birth weight 27 Table 32: Birth weight by Local Health District of residence, NSW 2017 27
Gestational age 27 Table 33: Gestational age by Local Health District of residence, NSW 2017 27
2 | NSW HEALTH | NSW Mothers and Babies 2017
Hepatitis B 28 Table 34: Hepatitis B dose given to liveborn babies, NSW 2017 28
Infant feeding 28 Table 35: Live births by infant feeding on discharge and Local Health District of residence, NSW 2017 28
Perinatal mortality 29 Table 36: Perinatal outcomes by Local Health District of residence, NSW 2017 29
Live births by statistical area of residence 30 Table 37: Live births by Local Health District and statistical area of residence, NSW 2017 30
6. NSW HOSPITALS 32
Onset and augmentation of labour 32 Table 38: Onset and augmentation of labour by Local Health District of hospital, NSW 2017 32 Table 39: Onset and augmentation of labour by hospital and peer group, NSW 2017 32
Type of birth 34 Table 40: Type of birth by Local Health District of hospital, NSW 2017 34 Table 41: Type of birth by hospital and peer group, NSW 2017 34
Pain relief 36 Table 42: Pain relief by Local Health District of hospital, NSW 2017 36 Table 43: Pain relief by hospital and peer group 2017, NSW 2017 36
Perineal status 38 Table 44: Perineal status among vaginal births by Local Health District of hospital, NSW 2017 38 Table 45: Perineal status among vaginal births by hospital and peer group, NSW 2017 38
Birth weight 40 Table 46: Births by birth weight and Local Health District of hospital, NSW 2017 40 Table 47: Births by birth weight, hospital and peer group, NSW 2017 40
Gestational age 42 Table 48: Births by gestational age and Local Health District of hospital, NSW 2017 42 Table 49: Births by gestational age, hospital and peer group, NSW 2017 42
Neonatal resuscitation 44 Table 50: Births by type of resuscitation and Local Health District of hospital, NSW 2017 44 Table 51: Births by type of resuscitation, hospital and peer group, NSW 2017 44
Infant feeding 46 Table 52: Live births by type of infant feeding and Local Health District of hospital, NSW 2017 46 Table 53: Live births by type of infant feeding, hospital and peer group, NSW 2017 46
Baby discharge status 48 Table 54: Baby discharge status by hospital and Local Health District of hospital, NSW 2017 48 Table 55: Baby discharge status by hospital and peer group, NSW 2017 48
Postnatal length of stay 50 Table 56: Average maternal postnatal length of stay in hospital of birth, NSW 2013–2017 50
NSW HEALTH | NSW Mothers and Babies 2017 | 3

7. CLINICAL INDICATORS 51
Outcome of selected primipara 51
Indicator 1.1 51 Table 57: 1.1 Selected primipara who have a spontaneous vaginal birth by Local Health District and hospital, NSW 2013–2017 51
Indicator 1.2 53 Table 58: 1.2 Selected primipara who undergo induction of labour by Local Health District and hospital, NSW 2013–2017 53
Indicator 1.3 54 Table 59: 1.3 Selected primipara who undergo an instrumental vaginal birth by Local Health District and hospital, NSW 2013–2017 54
Indicator 1.4 55 Table 60: 1.4 Selected primipara undergoing caesarean section by Local Health District and hospital, NSW 2013–2017 55
Vaginal birth following caesarean section 56
Indicator 2.1 56 Table 61: 2.1 Vaginal delivery after previous primary caesarean section by Local Health District and hospital, NSW 2013–2017 56
Major perineal tears and surgical repair of the perineum 57
Indicator 3.1 57 Table 62: 3.1 Selected primipara delivering vaginally with an intact perineum by Local Health District and hospital, NSW 2013–2017 57
Indicator 3.2 58 Table 63: 3.2 Selected primipara undergoing episiotomy and no perineal tear by Local Health District and hospital, NSW 2013–2017 58
Indicator 3.3 59 Table 64: 3.3 Selected primipara sustaining a perineal tear and no episiotomy by Local Health District and hospital, NSW 2013–2017 59
Indicator 3.4 60 Table 65: 3.4 Selected primipara undergoing episiotomy and sustaining a perineal tear by Local Health District and hospital, NSW 2013–2017 60
Indicator 3.5 61 Table 66: 3.5 Selected primipara undergoing surgical repair of the perineum for third degree tear by Local Health District and hospital, NSW 2013–2017 61
Indicator 3.6 62 Table 67: 3.6 Selected primipara undergoing surgical repair of the perineum for fourth degree tear by Local Health District and hospital, NSW 2013–2017 62
General anaesthesia for caesarean section 63
Indicator 4.1 63 Table 68: 4.1 General anaesthesia for caesarean section by Local Health District and hospital, NSW 2013–2017 63
Full breastfeeding 64
Indicator 6.1 64 Table 69: Selected primipara full breastfeeding by Local Health District and hospital, NSW 2013–2017 64
4 | NSW HEALTH | NSW Mothers and Babies 2017

Postpartum haemorrhage and blood transfusion after vaginal birth 66
Indicator 7.1 66 Table 70: 7.1 Postpartum haemorrhage and blood transfusion following vaginal birth by Local Health District and hospital, NSW 2013–2017 66
Postpartum haemorrhage and blood transfusion after caesarean section 67
Indicator 7.2 67 Table 71: 7.2 Postpartum haemorrhage and blood transfusion following caesarean section by Local Health District and hospital, NSW 2013–2017 67
Intrauterine growth restriction 68
Indicator 8.1 68 Table 72: 8.1 Intrauterine growth restriction at 40 weeks gestation or more by Local Health District and hospital, NSW 2013–2017 68
Apgar score 69
Indicator 9.1 69 Table 73: 9.1 Apgar score of 7 or less in term babies by Local Health District and hospital, NSW 2013–2017 69
8. ABORIGINAL AND TORRES STRAIT ISLANDER MOTHERS AND BABIES 70
Reporting of Aboriginality 70 Figure 2: Estimated level of reporting of births to Aboriginal or Torres Strait Islander mothers by year of birth and Local Health District of residence, NSW 2016 70
Table 74: Aboriginal or Torres Strait Islander mothers and estimated level of reporting by year of birth and Local Health District of residence, NSW 2014–2016 71
Table 75: Aboriginal or Torres Strait Islander babies and estimated level of reporting by year of birth and Local Health District of residence, NSW 2014–2016 72
Trends in births 73 Table 76: Aboriginal and Torres Strait Islander mothers and babies, NSW 2013–2017 73
Plurality 73 Table 77: Aboriginal and Torres Strait Islander mothers and babies by plurality, NSW 2013–2017 73
Previous pregnancies 73 Table 78: Previous pregnancies among Aboriginal and Torres Strait Islander mothers, NSW 2013–2017 73
Maternal age 74 Table 79: Age of Aboriginal and Torres Strait Islander mothers, NSW 2013–2017 74
Local Health District of residence 74 Table 80: Local Health District of residence of Aboriginal and Torres Strait Islander mothers, NSW 2013–2017 74 Table 81: Local Health District of residence of Aboriginal and Torres Strait Islander mothers by age, NSW 2017 75
Duration of pregnancy at first antenatal visit 75 Table 82: Duration of pregnancy at first antenatal visit among Aboriginal and Torres Strait Islander mothers, NSW 2013–2017 75 Table 83: Duration of pregnancy at first antenatal visit among Aboriginal and Torres Strait Islander mothers by Local Health District of residence, NSW 2017 76
Smoking in pregnancy 76 Figure 3: Smoking in the second half of pregnancy among Aboriginal and Torres Strait Islander mothers by amount smoked and Local Health District of residence, NSW 2017 76
NSW HEALTH | NSW Mothers and Babies 2017 | 5

Diabetes and hypertension 77 Table 84: Diabetes among Aboriginal and non-Aboriginal mothers, NSW 2017 77 Table 85: Hypertension among Aboriginal and non-Aboriginal mothers, NSW 2017 77
Labour and birth 78 Table 86: Labour onset for Aboriginal and Torres Strait Islander mothers, NSW 2013–2017 78 Table 87: Type of birth among Aboriginal and Torres Strait Islander mothers, NSW 2013–2017 78
Birth weight 79 Table 88: Weight of babies born to Aboriginal and Torres Strait Islander mothers, NSW 2013–2017 79 Table 89: Weight of babies born to Aboriginal and Torres Strait Islander mothers by Local Health District of residence, NSW 2017 79
Gestational age 80 Table 90: Gestational age of babies born to Aboriginal and Torres Strait Islander mothers, NSW 2013–2017 80 Table 91: Gestational age of babies born to Aboriginal and Torres Strait Islander mothers by Local Health District of residence, NSW 2017 80
Apgar score 81 Table 92: Apgar score of babies born to Aboriginal and Torres Strait Islander mothers, NSW 2013–2017 81
Infant feeding 81 Table 93: Infant feeding among liveborn babies of Aboriginal and Torres Strait Islander mothers by Local Health District of residence, NSW 2017 81
Perinatal mortality 82 Table 94: Perinatal deaths among babies born to Aboriginal and Torres Strait Islander mothers, NSW 2013–2017 82
9. APPENDICES 83
Appendix 1: Glossary of terms 83
Appendix 2: Explanatory notes 84
Appendix 3: Maternal countries of birth and country of birth groups 85
6 | NSW HEALTH | NSW Mothers and Babies 2017
NSW Perinatal Data Collection Komala GouthamNSW hospitals’ midwives and independent midwives NSW hospitals’ medical record departments
Maternal death reviews NSW Maternal and Perinatal Mortality Review Committee
Record linkage Centre for Health Record Linkage
Report preparation Martin Drummond, Maria Alfaro-Ramirez
Editors Dr Lee Taylor, Tim Harrold, Kristy Goldsworthy
NSW Maternal and Perinatal Mortality Review Committee 2017 Professor Jonathan Morris (Chair), Dr Susan Arbuckle, Professor Marie-Paule Austin, Dr Andrew Berry AM, Professor Hannah Dahlen, Ms Kate Dyer AM, Ms Alison Goodfellow, Dr John Hobbs, Ms Deb Matha, Associate Professor Elisabeth Murphy, Professor Michael Nicholl, Professor John Smoleniec, Dr Lee Taylor, Dr Greg Whittaker.
1. ACKNOWLEDGEMENTS
NSW HEALTH | NSW Mothers and Babies 2017 | 7

This is the twentieth annual report on mothers and babies in NSW. The key findings are:
• The number of births in NSW fell from 96,971 in 2013 to 95,825 in 2017, an overall decrease of 1.2%. The largest percentage decrease occurred in Northern NSW Local Health District, where the number of births decreased by 9.3% between 2013 and 2017.
• The percentage of mothers who were teenagers fell from 3.0% in 2013 to 2.0% in 2017. Over the same period the percentage of mothers aged 35 years and over remained stable and was 24.7% in 2017.
• The rate of normal vaginal birth decreased from 56.8% in 2013 to 54.5% in 2017. The caesarean section rate increased from 31.5% to 33.8%, while the rate of instrumental birth remained steady at about 11%.
• Operative and instrumental births were more common among privately than publicly insured mothers. Among privately insured mothers the rate of normal vaginal birth decreased from 45.3% in 2012 to 44.0% in 2016 and the caesarean section rate increased from 40.7% to 42.1%. Among publicly insured mothers the rate of normal vaginal birth decreased from 63.2% to 61.4% and the caesarean section rate increased from 26.1% to 27.8%.
• The proportion of mothers that reported smoking at some time during pregnancy declined from 9.7% in 2013 to 8.8% in 2017. Of mothers who smoked during pregnancy in 2017, 24.8% stopped smoking in the first half of pregnancy.
• In 2017, the majority of mothers planned to give birth in a hospital labour ward, and 6.3% of mothers planned to give birth in a birth centre. Sixty-eight per cent of mothers who planned to give birth in a birth centre actually did so. There were 198 homebirths in NSW reported in 2017.
• In 2017, 7.4% of babies were born prematurely (less than 37 weeks gestation), similar to 7.6% reported in 2013.
• Since 2013, the rate of low birth weight (less than 2,500 grams) has remained stable, ranging from 6.3% to 6.7%. The rate of low birth weight was 6.7% in 2017.
• Between 2013 and 2017, the reported number of Aboriginal or Torres Strait Islander mothers giving birth increased from 3,492 to 4,183, an increase from 3.7% to 4.4% of all mothers.
• The percentage of Aboriginal or Torres Strait Islander mothers who were teenagers fell substantially from 17.6% in 2013 to 12.3% in 2017. The percentage of Aboriginal or Torres Strait Islander mothers giving birth at 35 years of age or more has remained stable and was 9.6% in 2017.
• In 2017, 42.4% of Aboriginal or Torres Strait Islander mothers reported smoking at some time during pregnancy.
• Since 2013, rates of low birth weight and prematurity in Aboriginal or Torres Strait Islander babies have been over 10%. In 2017, 11.1% of Aboriginal or Torres Strait Islander babies were low birth weight and 11.7% were premature.
• The perinatal mortality rate of 12.7 per 1,000 births in Aboriginal or Torres Strait Islander mothers in 2017 is higher than the rate of 8.2 per 1,000 births experienced among babies born to non-Aboriginal or Torres Strait Islander mothers.
2. EXECUTIVE SUMMARY
8 | NSW HEALTH | NSW Mothers and Babies 2017

Data sourcesNSW Perinatal Data Collection
The New South Wales Perinatal Data Collection (PDC) is a population-based surveillance system covering all births in NSW public and private hospitals, as well as home births. It encompasses all live births, and stillbirths of at least 20 weeks gestation or at least 400 grams birth weight.
The PDC relies on the attending midwife or doctor to complete an electronic notification when a birth occurs. The electronic notification captures items described in PD2015_025 NSW Perinatal Data Collection (PDC) Reporting and Submission Requirements from 1 January 2016.1 These items include demographic, maternal health, pregnancy, labour, birth, and perinatal outcomes. Completed notifications are transferred electronically to the state database, which is managed by System Information and Analytics Branch within the System Purchasing and Performance Division of the NSW Ministry of Health. The PDC data dictionary can be found at http://www.cherel.org.au/data-dictionaries.
In 2017, 100.0% of PDC records were received electronically from public and private hospitals information systems. There are several source systems that generate the PDC data. The largest source of PDC records was ObstetriX, which supplied 33.8% of all PDC records and covered all public hospitals in South Eastern Sydney, Illawarra Shoalhaven, Hunter New England, Nepean Blue Mountains and Western Sydney Local Health Districts, as well as some hospitals in Murrumbidgee, Southern NSW, Western NSW and Far West Local Health Districts for part of 2017. Cerner systems supplied 18.9% of PDC records (public hospitals in Sydney and South Western Sydney Local Health Districts). In 2017, four Local Health Districts reported all births via eMaternity (Northern Sydney, Central Coast, Northern NSW and Mid North Coast). A further nine Local Health Districts transitioned to eMaternity during 2017 (public hospitals in South Eastern Sydney, Illawarra Shoalhaven, Hunter New England, Nepean Blue Mountains and Western Sydney Local Health Districts, as well as some hospitals in Murrumbidgee, Southern NSW, Western NSW and Far West Local Health Districts). In total, eMaternity supplied 25.2% of all PDC records. Healthscope Hospitals (Prince of Wales Private Hospital, Norwest Private Hospital, Sydney South West Private Hospital, Nepean Private Hospital and Newcastle Private Hospital) supplied 8.0% of PDC records. Meditech, which includes five Ramsay Private Hospitals (North Shore Private Hospital, Westmead Private Hospital, St George Private Hospital, Kareena Private Hospital and Wollongong Private Hospital), supplied 8.1% of all PDC records. The Mater Hospital, North Sydney database supplied 2.3% of PDC records, and 2.0% of PDC records were supplied from the Sydney Adventist Hospital database.
The PDC receives notifications of women whose usual place of residence is outside NSW but who give birth in NSW. However, the PDC does not receive notifications of births outside NSW to women usually resident in NSW.
Maternal and Child Health Register
The Maternal and Child Health Register is a dataset of linked de-identified records that has been established under the Public Health and Disease Registers provisions of the NSW Public Health Act 2010. It includes records from the following data collections for children and young people aged less than 16 years and women aged 12 to 55 years:
• NSW PDC for the period 1994 onwards (all records)
• NSW Admitted Patient Data Collection (public hospitals and the NSW Private Hospital Inpatient Statistics Collection) for the period 1 July 2001 onwards (children and young people aged less than 16 years and women aged 12 to 55 years)
• NSW Emergency Department Data Collection for the period 1 July 2005 onwards (children and young people aged less than 16 years and women aged 12 to 55 years)
• NSW Register of Congenital Conditions for the most recently available 6-year period (all records)
• NSW Perinatal Death Review database for the period 1 January 2000 onwards (all records)
• Notifiable Conditions Information Management System for the period 1994 onwards (children and young people aged less than 16 years and women aged 12 to 55 years)
• NSW Registry of Births, Deaths and Marriages death registrations for the period 1994 onwards (children and young people aged less than 16 years and women aged 12 to 55 years)
• Australian Coordinating Registry Cause of Death Unit Record File for the period 1994 onwards (children and young people aged less than 16 years and women aged 12 to 55 years).
An Enhanced Reporting of Aboriginality (ERA) variable is available on the Maternal and Child Heath Register. This variable uses linkage with routinely collected population-based health and health-related data collections in NSW to obtain more accurate information about Aboriginal people than is currently available in individual collections, and thus is able to more accurately identify and monitor risk factors for diseases and conditions that are different for Aboriginal people compared to non-Aboriginal people.
3. METHODS
(Continued on next page)
NSW HEALTH | NSW Mothers and Babies 2017 | 9

Enhanced reporting relies on having independent sources of information on whether a person is Aboriginal or Torres Strait Islander.2 Each independent report is counted as a “unit of information” that contributed to the weight of evidence as to whether a person is reported as Aboriginal or Torres Strait Islander. ERA uses the following algorithm to determine whether a person is reported as Aboriginal:
1. If a person is consistently reported as Aboriginal or Torres Strait Islander on all contributing sources of data, then the person is reported as Aboriginal or Torres Strait Islander.
2. If the person is not consistently reported as Aboriginal or Torres Strait Islander, then:
i) if the person has three or more units of information across all contributing data sets, at least two indicating that the person is Aboriginal or Torres Strait Islander are required to report the person as Aboriginal or Torres Strait Islander
ii) otherwise, if the person has one or two units of information in all contributing data sets, one is sufficient to report the person as Aboriginal or Torres Strait Islander.
3. If a person is consistently reported as unknown, not stated or the information is missing on all contributing data sets, then the person’s Aboriginality is reported as “missing”.
For mothers and babies, ERA is based on the weight of evidence from linked records of the PDC, Admitted Patient Data Collection (APDC), Emergency Department Data Collection, Australian Coordinating Registry Cause of Death Unit Record File, and Register of Births, Deaths and Marriages (RBDM) birth registration data. In this report, APDC records do not contribute to the mother’s or baby’s ERA where there is a corresponding linked PDC birth record. This is because, from 2012, information on a person’s Aboriginality as reported on the PDC is usually obtained from the hospital’s patient administration system and is not an independent source of information.
The Maternal and Child Health Register linkage is updated regularly for all years of data. Reported numbers of Aboriginal mothers and babies according to ERA for a particular birth year may vary when subsequently reported.
NSW Maternal and Perinatal Mortality Review Committee
The NSW Maternal and Perinatal Mortality Review Committee is established under the NSW Health Administration Act 1982, and is privileged under the Act to carry out confidential reviews of both maternal and perinatal deaths. Members are appointed by the Minister for Health.
The Committee reviews each maternal death to classify the death, identify the cause of death, ascertain any possible avoidable factors and identify lessons to be learnt. The Committee also reviews perinatal deaths among liveborn babies, and stillbirths of at least 20 weeks gestation or at least 400 grams birth weight. The information obtained from these reviews assists in the development of policies aimed at improving the health of mothers and newborns in NSW. Information considered by the Committee is confidential.
References
1. NSW Ministry of Health. NSW Perinatal Data Collection (PDC) Reporting and Submission Requirements from 1 January 2016. Available at https://www1.health.nsw.gov.au/pds/ActivePDSDocuments/PD2015_025.pdf. Accessed 26 September 2018.
2. Population and Public Health Division. Improved reporting of Aboriginal and Torres Strait Islander peoples on population datasets in New South Wales using record linkage – a feasibility study. Sydney: NSW Ministry of Health, 2012.
10 | NSW HEALTH | NSW Mothers and Babies 2017

Map of NSW Local Health Districts
CENTRAL COAST
NORTHERN SYDNEY
SYDNEY
SOUTH EASTERN SYDNEY
SOUTH WESTERN SYDNEY
ILLAWARRA SHOALHAVEN
NEPEAN BLUE MOUNTAINS
WESTERN SYDNEY
Penrith
Wollongong
Liverpool
Gosford
FAR WEST
WESTERN NSW
MURRUMBIDGEE
HUNTER NEW ENGLAND
NORTHERN NSW
ILLAWARRA SHOALHAVEN
SOUTHERN NSWNetwork with Vic
ACT
MID NORTH COAST
METROPOLITAN (see breakout map)
Dubbo
Albury
Queanbeyan
Newcastle
Lismore
NSW HEALTH | NSW Mothers and Babies 2017 | 11

Confinements and births by pluralityThe number of births in NSW fell from 96,971 in 2013 to 95,825 in 2017, a decrease of 1.2%. In 2017, 95,825 births to 94,449 mothers were reported (Table 1). The percentage of multiple (twin and triplet) pregnancies has remained stable over recent years at 1.4%.
Local Health District of residenceThe largest percentage increase occurred in the South Western Sydney Local Health District, where the number of births increased by 5.5% between 2013 and 2017. The largest percentage decrease occurred in the Northern NSW Local Health District, where the number of births decreased by 9.3% between 2013 and 2017. In 2017, 29.7% of mothers giving birth were residents in South Western Sydney and Western Sydney Local Health Districts, similar to previous years (Table 2).
4. TRENDS IN NEW SOUTH WALES
TABLE 1: PLURALITY, NSW 2013–2017
Plurality
Year
2013 2014 2015 2016 2017
No. % No. % No. % No. % No. %
Confinements Singleton 94128 98.5 94543 98.6 93609 98.5 95906 98.6 93098 98.6
Twins 1384 1.4 1367 1.4 1358 1.4 1379 1.4 1326 1.4
Triplets 25 0.0 16 0.0 22 0.0 21 0.0 25 0.0
TOTAL 95537 100.0 95926 100.0 94989 100.0 97306 100.0 94449 100.0
Births Singleton 94128 97.1 94543 97.1 93609 97.1 95906 97.1 93098 97.2
Twins 2768 2.9 2734 2.8 2716 2.8 2758 2.8 2652 2.8
Triplets 75 0.1 48 0.0 66 0.1 63 0.1 75 0.1
TOTAL 96971 100.0 97325 100.0 96391 100.0 98727 100.0 95825 100.0
Source: NSW Perinatal Data Collection (SAPHaRI). Centre for Epidemiology and Evidence, NSW Ministry of Health.
TABLE 2: MATERNAL LOCAL HEALTH DISTRICT OF RESIDENCE, NSW 2013–2017
Local Health District
Year
2013 2014 2015 2016 2017
No. % No. % No. % No. % No. %
Sydney 8331 8.7 8401 8.8 8249 8.7 8345 8.6 8008 8.5
South Western Sydney 12842 13.4 13220 13.8 12996 13.7 13750 14.1 13554 14.4
South Eastern Sydney 11396 11.9 11460 11.9 11077 11.7 11318 11.6 10644 11.3
Illawarra Shoalhaven 4398 4.6 4363 4.5 4507 4.7 4534 4.7 4475 4.7
Western Sydney 14515 15.2 14877 15.5 14640 15.4 14667 15.1 14479 15.3
Nepean Blue Mountains 4743 5.0 4820 5.0 4929 5.2 5042 5.2 4908 5.2
Northern Sydney 10310 10.8 10454 10.9 10270 10.8 10804 11.1 10146 10.7
Central Coast 3922 4.1 3738 3.9 3813 4.0 3816 3.9 3832 4.1
Hunter New England 10931 11.4 10717 11.2 10797 11.4 10690 11.0 10543 11.2
Northern NSW 2785 2.9 2631 2.7 2557 2.7 2327 2.4 2526 2.7
Mid North Coast 2235 2.3 2151 2.2 2183 2.3 1900 2.0 2163 2.3
Southern NSW 1368 1.4 1339 1.4 1360 1.4 1372 1.4 1363 1.4
Murrumbidgee 2305 2.4 2435 2.5 2377 2.5 2370 2.4 2345 2.5
Western NSW 3707 3.9 3805 4.0 3678 3.9 3740 3.8 3581 3.8
Far West 226 0.2 230 0.2 222 0.2 234 0.2 205 0.2
Other-not stated 1523 1.6 1285 1.3 1334 1.4 2397 2.5 1677 1.8
TOTAL 95537 100.0 95926 100.0 94989 100.0 97306 100.0 94449 100.0
Source: NSW Perinatal Data Collection (SAPHaRI). Centre for Epidemiology and Evidence, NSW Ministry of Health.
12 | NSW HEALTH | NSW Mothers and Babies 2017

Maternal ageThe percentage of mothers who were teenagers fell from 3.0% in 2013 to 2.0% in 2017. Between 2013 and 2017, the percentage of mothers aged 35 years and over remained stable and was 24.7% in 2017 (Figure 1, Table 3).
The mean maternal age rose from 30.3 to 30.7 years between 2013 and 2017. The mean maternal age rose from 28.9 to 29.4 years for primiparous mothers and remained stable for multiparous mothers (31.8 years in 2017).
The proportion of mothers giving birth for the first time who were aged 35 years or more was 15.7% in 2013 and 16.6% in 2017. The proportion of multiparous mothers who were aged 35 years or more was 29.5% in 2013 and 30.8% in 2017.
TABLE 3: MATERNAL AGE, NSW 2013–2017
Maternal age (years)
Year
2013 2014 2015 2016 2017
No. % No. % No. % No. % No. %
Less than 15 15 0.0 14 0.0 15 0.0 8 0.0 8 0.0
15–19 2832 3.0 2616 2.7 2362 2.5 2106 2.2 1859 2.0
20–24 12097 12.7 11699 12.2 11358 12.0 11007 11.3 10541 11.2
25–29 25801 27.0 25995 27.1 25476 26.8 25926 26.6 25036 26.5
30–34 32411 33.9 33300 34.7 33569 35.3 35126 36.1 33642 35.6
35–39 17841 18.7 17939 18.7 17776 18.7 18627 19.1 19043 20.2
40–44 4282 4.5 4115 4.3 4163 4.4 4142 4.3 4011 4.2
45+ 240 0.3 241 0.3 268 0.3 328 0.3 285 0.3
Not stated 18 0.0 7 0.0 2 0.0 36 0.0 24 0.0
TOTAL 95537 100.0 95926 100.0 94989 100.0 97306 100.0 94449 100.0
Source: NSW Perinatal Data Collection (SAPHaRI). Centre for Epidemiology and Evidence, NSW Ministry of Health.
FIGURE 1: MOTHERS AGED LESS THAN 20 YEARS AND 35 YEARS AND OVER, NSW 2013–2017
YEAR
Less than 20 years
35 years and over
Source: NSW Perinatal Data Collection (SAPHaRI). Centre for Epidemiology and Evidence. NSW Ministry of Health.
20130
5
10
15
20
25
30
35
40
2014 2015 2016 2017
PER
CEN
T
NSW HEALTH | NSW Mothers and Babies 2017 | 13

Maternal country of birthThe percentage of mothers born in Australia decreased between 2013 and 2017, from 65.1% to 61.6%. In 2017, mothers born in India, China, New Zealand, the United Kingdom, the Philippines, Vietnam, Iraq, and Nepal together accounted for 18.9% of all mothers (Table 4).
TABLE 4: MATERNAL COUNTRY OF BIRTH, NSW 2013–2017#
Country of birth
Year
2013 2014 2015 2016 2017
No. % No. % No. % No. % No. %
Australia 62165 65.1 60761 63.3 60769 64.0 60429 62.1 58187 61.6
India 3328 3.5 3634 3.8 3860 4.1 4247 4.4 4393 4.7
China 3856 4.0 4753 5.0 3830 4.0 5079 5.2 4385 4.6
New Zealand 2188 2.3 2128 2.2 2060 2.2 2081 2.1 2008 2.1
United Kingdom 1968 2.1 1816 1.9 1704 1.8 1825 1.9 1805 1.9
Philippines 1465 1.5 1450 1.5 1513 1.6 1626 1.7 1624 1.7
Vietnam 1436 1.5 1537 1.6 1478 1.6 1499 1.5 1391 1.5
Iraq 1014 1.1 1092 1.1 1021 1.1 1152 1.2 1112 1.2
Nepal 636 0.7 766 0.8 824 0.9 1059 1.1 1094 1.2
Lebanon 1280 1.3 1289 1.3 1159 1.2 1081 1.1 1049 1.1
Pakistan 646 0.7 733 0.8 800 0.8 902 0.9 992 1.1
Bangladesh 761 0.8 827 0.9 846 0.9 901 0.9 943 1.0
Indonesia 823 0.9 778 0.8 787 0.8 796 0.8 749 0.8
South Korea 728 0.8 690 0.7 768 0.8 747 0.8 745 0.8
South Africa 610 0.6 598 0.6 580 0.6 587 0.6 572 0.6
Thailand 535 0.6 535 0.6 528 0.6 606 0.6 563 0.6
United States of America 473 0.5 498 0.5 514 0.5 504 0.5 555 0.6
Iran 295 0.3 369 0.4 425 0.4 512 0.5 531 0.6
Hong Kong 452 0.5 456 0.5 441 0.5 500 0.5 515 0.5
Fiji 621 0.7 590 0.6 582 0.6 552 0.6 486 0.5
Sri Lanka 442 0.5 452 0.5 432 0.5 448 0.5 484 0.5
Ireland 441 0.5 471 0.5 455 0.5 514 0.5 476 0.5
Afghanistan 340 0.4 405 0.4 415 0.4 423 0.4 471 0.5
Malaysia 420 0.4 441 0.5 440 0.5 426 0.4 447 0.5
Brazil 242 0.3 267 0.3 282 0.3 317 0.3 354 0.4
Japan 392 0.4 404 0.4 363 0.4 382 0.4 348 0.4
Germany 309 0.3 349 0.4 304 0.3 293 0.3 306 0.3
Canada 333 0.3 290 0.3 307 0.3 334 0.3 279 0.3
Egypt 214 0.2 242 0.3 263 0.3 260 0.3 274 0.3
Cambodia 267 0.3 274 0.3 290 0.3 256 0.3 269 0.3
Syria 132 0.1 192 0.2 177 0.2 214 0.2 258 0.3
France 173 0.2 233 0.2 223 0.2 221 0.2 256 0.3
Russian Federation (not USSR) 169 0.2 243 0.3 240 0.3 244 0.3 248 0.3
Western Samoa 239 0.3 222 0.2 217 0.2 250 0.3 232 0.2
Taiwan 187 0.2 191 0.2 182 0.2 244 0.3 224 0.2
Sudan 284 0.3 265 0.3 250 0.3 236 0.2 208 0.2
Poland 204 0.2 181 0.2 182 0.2 199 0.2 186 0.2
Italy 86 0.1 74 0.1 116 0.1 120 0.1 169 0.2
Saudi Arabia 116 0.1 120 0.1 139 0.1 138 0.1 153 0.2
Turkey 179 0.2 176 0.2 173 0.2 147 0.2 152 0.2
Colombia 135 0.1 136 0.1 157 0.2 151 0.2 148 0.2
Burma (Myanmar) 108 0.1 146 0.2 116 0.1 102 0.1 143 0.2
Bosnia and Herzegovina 113 0.1 134 0.1 137 0.1 126 0.1 142 0.2
Tonga 166 0.2 148 0.2 176 0.2 158 0.2 139 0.1
Serbia (includes Kosovo) 60 0.1 75 0.1 83 0.1 133 0.1 134 0.1
Jordan 105 0.1 116 0.1 112 0.1 105 0.1 125 0.1
Chile 124 0.1 135 0.1 130 0.1 137 0.1 125 0.1
Singapore 135 0.1 137 0.1 154 0.2 147 0.2 124 0.1
Former Yugoslavia 104 0.1 121 0.1 116 0.1 125 0.1 121 0.1
Macedonia 125 0.1 150 0.2 114 0.1 128 0.1 116 0.1
Nigeria 56 0.1 43 0.0 74 0.1 100 0.1 105 0.1
Netherlands 88 0.1 98 0.1 86 0.1 99 0.1 104 0.1
Peru 130 0.1 116 0.1 98 0.1 112 0.1 103 0.1
Other/Not stated 3639 3.8 3579 3.7 3497 3.7 3332 3.4 3327 3.5
TOTAL 95537 100.0 95926 100.0 94989 100.0 97306 100.0 94449 100.0
Source: NSW Perinatal Data Collection (SAPHaRI). Centre for Epidemiology and Evidence, NSW Ministry of Health.# Countries of birth for which 100 or more women gave birth in 2017.
14 | NSW HEALTH | NSW Mothers and Babies 2017

Aboriginal and Torres Strait Islander mothersThe reported number of Aboriginal or Torres Strait Islander mothers giving birth increased from 3,492 in 2013 to 4,183 in 2017, an increase from 3.7% to 4.4% of all mothers (Table 5). Further information on Aboriginal and Torres Strait Islander mothers and babies is shown in Chapter 8.
Previous pregnanciesIn recent years there has been a slight decrease in the percentage of mothers giving birth for the first time, from 44.2% in 2013 to 42.8% in 2017 (Table 6), and an increase in the proportion of mothers giving birth to a subsequent baby, from 55.7% in 2013 to 57.0% in 2017.
Duration of pregnancy at first antenatal visitBetween 2013 and 2017, the proportion of mothers starting antenatal care at less than 14 weeks gestation substantially increased from 60.0% to 73.1% (Table 7). In 2017, 90.6% of mothers commenced antenatal care at less than 20 weeks gestation.
TABLE 5: ABORIGINAL AND TORRES STRAIT ISLANDER MOTHERS, NSW 2013–2017
Aboriginal or Torres Strait Islander
Year
2013 2014 2015 2016 2017
No. % No. % No. % No. % No. %
Aboriginal or Torres Strait Islander 3492 3.7 3756 3.9 3823 4.0 4118 4.2 4183 4.4
Non-Aboriginal or Torres Strait Islander 91986 96.3 92158 96.1 91166 96.0 92623 95.2 89836 95.1
Not stated 59 0.1 12 0.0 0 0.0 565 0.6 430 0.5
TOTAL 95537 100.0 95926 100.0 94989 100.0 97306 100.0 94449 100.0
Source: NSW Perinatal Data Collection (SAPHaRI). Centre for Epidemiology and Evidence, NSW Ministry of Health.
TABLE 6: PREVIOUS PREGNANCIES, NSW 2013–2017
No. previous pregnancies (>20 weeks gestation)
Year
2013 2014 2015 2016 2017
No. % No. % No. % No. % No. %
0 42257 44.2 42338 44.1 41547 43.7 42272 43.4 40469 42.8
1–4 51831 54.3 52070 54.3 52034 54.8 53486 55.0 52447 55.5
5+ 1429 1.5 1491 1.6 1390 1.5 1426 1.5 1387 1.5
Not stated 20 0.0 27 0.0 18 0.0 122 0.1 146 0.2
TOTAL 95537 100.0 95926 100.0 94989 100.0 97306 100.0 94449 100.0
Source: NSW Perinatal Data Collection (SAPHaRI). Centre for Epidemiology and Evidence, NSW Ministry of Health.
TABLE 7: DURATION OF PREGNANCY AT FIRST ANTENATAL VISIT, NSW 2013–2017
Duration of pregnancy (weeks)
Year
2013 2014 2015 2016 2017
No. % No. % No. % No. % No. %
0–13 57336 60.0 57293 59.7 61073 64.3 65988 67.8 69062 73.1
14–19 22916 24.0 24062 25.1 21869 23.0 20404 21.0 16473 17.4
20+ 14507 15.2 14164 14.8 11685 12.3 10033 10.3 8324 8.8
Not stated 778 0.8 407 0.4 362 0.4 881 0.9 590 0.6
TOTAL 95537 100.0 95926 100.0 94989 100.0 97306 100.0 94449 100.0
Source: NSW Perinatal Data Collection (SAPHaRI). Centre for Epidemiology and Evidence, NSW Ministry of Health.
NSW HEALTH | NSW Mothers and Babies 2017 | 15

Smoking in pregnancyThe proportion of mothers that reported any smoking during pregnancy declined from 9.7% in 2013 to 8.8% in 2017 (Table 8). Of those mothers who smoked during pregnancy in 2017, 24.8% stopped smoking in the first half of pregnancy. Over the 5-year period, among those who smoked in the second half of pregnancy, there was a trend towards smoking fewer cigarettes per day (Table 9).
Place of birthIn 2017, the majority of mothers planned to give birth in a hospital labour ward, and 6.3% planned to give birth in a birth centre (Table 10). Sixty-eight per cent of mothers who planned to give birth in a birth centre actually did so. The total number of reported planned homebirths remained stable at 236 in 2013 and 239 in 2017, and the reported number of planned homebirths that occurred at home fell from 217 in 2013 to 198 in 2017.
TABLE 8: SMOKING IN PREGNANCY, NSW 2013–2017
Smoking in pregnancy
Year
2013 2014 2015 2016 2017
No. % No. % No. % No. % No. %
Did not smoke 86251 90.3 87041 90.7 86547 91.1 88000 90.4 85189 90.2
Smoked 9285 9.7 8883 9.3 8442 8.9 8083 8.3 8279 8.8
Not stated 1 0.0 2 0.0 0 0.0 1223 1.3 981 1.0
TOTAL 95537 100.0 95926 100.0 94989 100.0 97306 100.0 94449 100.0
Source: NSW Perinatal Data Collection (SAPHaRI). Centre for Epidemiology and Evidence, NSW Ministry of Health.
TABLE 10: MATERNAL PLACE OF BIRTH, NSW 2013–2017
Place of birth
Year
2013 2014 2015 2016 2017
No. % No. % No. % No. % No. %
Hospital 92012 96.3 92596 96.5 91830 96.7 94025 96.6 87687 92.8
Birth centre 2392 2.5 2202 2.3 2095 2.2 2128 2.2 4043 4.3
Planned birth centre-hospital admission 354 0.4 381 0.4 323 0.3 341 0.4 1913 2.0
Planned homebirth 217 0.2 228 0.2 187 0.2 196 0.2 198 0.2
Planned homebirth-hospital admission 19 0.0 30 0.0 16 0.0 23 0.0 41 0.0
Born before arrival 543 0.6 488 0.5 538 0.6 542 0.6 544 0.6
Not stated 0 0.0 1 0.0 0 0.0 51 0.1 23 0.0
TOTAL 95537 100.0 95926 100.0 94989 100.0 97306 100.0 94449 100.0
Source: NSW Perinatal Data Collection (SAPHaRI). Centre for Epidemiology and Evidence, NSW Ministry of Health.
TABLE 9: MOTHERS WHO SMOKED AT ALL DURING PREGNANCY BY NUMBER OF CIGARETTES SMOKED IN THE SECOND HALF OF PREGNANCY, NSW 2013–2017
Cigarettes smoked in the second half of pregnancy
Year
2013 2014 2015 2016 2017
No. % No. % No. % No. % No. %
None 2446 26.3 2306 26.0 2292 27.1 2156 26.7 2053 24.8
1–10 per day 5069 54.6 4948 55.7 4691 55.6 4738 58.6 5090 61.5
> 10 per day 1510 16.3 1319 14.8 1202 14.2 1065 13.2 1012 12.2
Smoked, amount not stated 260 2.8 310 3.5 257 3.0 15 0.2 13 0.2
Not stated 0 0.0 0 0.0 0 0.0 109 1.3 111 1.3
TOTAL 9285 100.0 8883 100.0 8442 100.0 8083 100.0 8279 100.0
Source: NSW Perinatal Data Collection (SAPHaRI). Centre for Epidemiology and Evidence, NSW Ministry of Health.
16 | NSW HEALTH | NSW Mothers and Babies 2017

Diabetes The reported rate of gestational diabetes rose from 7.0% in 2013 to 13.1% in 2017, following widespread implementation of the Australasian Diabetes in Pregnancy Society (ADIPS) Consensus Guidelines for the Testing and Diagnosis of Gestational Diabetes Mellitus during 2016.1 The rate of pre-existing diabetes mellitus was just over 1.0% (Table 11) over the 5-year period.
HypertensionThe reported rate of gestational hypertension was 2.7% in 2017, similar to previous years. The overall rate of hypertension in pregnancy remained steady at about 5% over the 5-year period (Table 12).
LabourThe rate of spontaneous onset of labour fell from 52.2% in 2013 to 46.3% in 2017 and the rate of induction of labour rose from 29.2% in 2013 to 32.3% in 2017 (Table 13). The most common reported reason for induction of labour in 2017 was prelabour rupture of membranes (15.5%), followed by diabetes (14.1%), prolonged pregnancy (41 or more weeks) (13.9%), hypertensive disease (6.7%), suspected intrauterine growth retardation (5.8%), fetal distress (2.7%) and fetal death (0.7%).
TABLE 11: MATERNAL DIABETES, NSW 2013–2017
Condition
Year
2013 2014 2015 2016 2017
No. % No. % No. % No. % No. %
Pre-existing diabetes mellitus 1170 1.2 1358 1.4 1398 1.5 886 0.9 900 1.0
Type 1† - - - - - - 281 0.3 256 0.3
Type 2† - - - - - - 332 0.3 377 0.4
Gestational diabetes mellitus 6710 7.0 7242 7.5 7918 8.3 12260 12.6 12375 13.1
Other† - - - - - - 273 0.3 267 0.3
Total diabetes* 7857 8.2 8600 9.0 9316 9.8 13146 13.5 13275 14.1
Source: NSW Perinatal Data Collection (SAPHaRI). Centre for Epidemiology and Evidence, NSW Ministry of Health.* Total diabetes refers to the number of mothers with a diagnosis of any type of diabetes mellitus.† Pre-existing diabetes mellitus type 1, 2 and other newly captured from 2016.
TABLE 12: MATERNAL HYPERTENSION, NSW 2013–2017
Condition
Year
2013 2014 2015 2016 2017
No. % No. % No. % No. % No. %
Chronic hypertension 741 0.8 745 0.8 731 0.8 716 0.7 694 0.7
Pre-eclampsia 1577 1.7 1458 1.5 1463 1.5 1557 1.6 1352 1.4
Eclampsia† - - - - - - 27 0.0 35 0.0
Gestational hypertension 2766 2.9 2810 2.9 2909 3.1 2860 2.9 2592 2.7
Total hypertension* 4999 5.2 4925 5.1 5018 5.3 5062 5.2 4526 4.8
Source: NSW Perinatal Data Collection (SAPHaRI). Centre for Epidemiology and Evidence, NSW Ministry of Health.* Total hypertension refers to the number of mothers with a diagnosis of any of the following conditions: Chronic hypertension, pre-eclampsia, eclampsia and gestational hypertension.† Eclampsia newly captured from 2016.
TABLE 13: ONSET AND AUGMENTATION OF LABOUR, NSW 2013–2017
Onset of labour
Year
2013 2014 2015 2016 2017
No. % No. % No. % No. % No. %
Spontaneous 35970 37.7 35398 36.9 34176 36.0 33947 34.9 31411 33.3
Spontaneous augmented with ARM 5965 6.2 5645 5.9 5533 5.8 5932 6.1 5286 5.6
Spontaneous augmented with oxytocics#† 7888 8.3 7680 8.0 7501 7.9 7311 7.5 7060 7.5
No labour 17818 18.7 18812 19.6 18827 19.8 19710 20.3 20132 21.3
Induced – oxytocics/prostaglandins 10028 10.5 10343 10.8 9971 10.5 9673 9.9 10473 11.1
Induced – ARM only 1884 2.0 1887 2.0 1869 2.0 3335 3.4 2797 3.0
Induced – ARM + oxytocics/prostaglandins 15822 16.6 15940 16.6 16719 17.6 16879 17.3 16957 18.0
Induced – other‡ 159 0.2 216 0.2 390 0.4 384 0.4 266 0.3
Not stated 3 0.0 5 0.0 3 0.0 135 0.1 67 0.1
TOTAL 95537 100.0 95926 100.0 94989 100.0 97306 100.0 94449 100.0
Source: NSW Perinatal Data Collection (SAPHaRI). Centre for Epidemiology and Evidence, NSW Ministry of Health.ARM: Artificial Rupture of Membranes.# May include prostaglandins for 2015 and earlier.† May include artificial rupture of membranes.‡ This category includes other forms of induction such as Foley’s catheter.
NSW HEALTH | NSW Mothers and Babies 2017 | 17
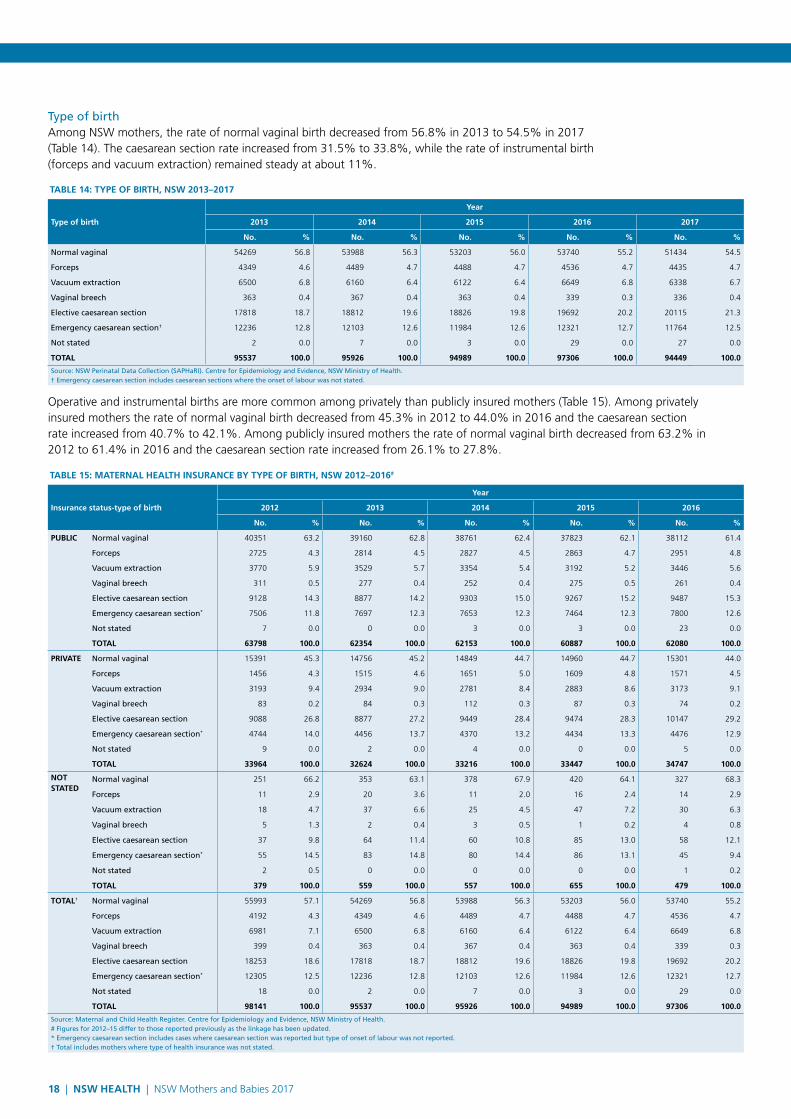
Type of birthAmong NSW mothers, the rate of normal vaginal birth decreased from 56.8% in 2013 to 54.5% in 2017 (Table 14). The caesarean section rate increased from 31.5% to 33.8%, while the rate of instrumental birth (forceps and vacuum extraction) remained steady at about 11%.
Operative and instrumental births are more common among privately than publicly insured mothers (Table 15). Among privately insured mothers the rate of normal vaginal birth decreased from 45.3% in 2012 to 44.0% in 2016 and the caesarean section rate increased from 40.7% to 42.1%. Among publicly insured mothers the rate of normal vaginal birth decreased from 63.2% in 2012 to 61.4% in 2016 and the caesarean section rate increased from 26.1% to 27.8%.
TABLE 14: TYPE OF BIRTH, NSW 2013–2017
Type of birth
Year
2013 2014 2015 2016 2017
No. % No. % No. % No. % No. %
Normal vaginal 54269 56.8 53988 56.3 53203 56.0 53740 55.2 51434 54.5
Forceps 4349 4.6 4489 4.7 4488 4.7 4536 4.7 4435 4.7
Vacuum extraction 6500 6.8 6160 6.4 6122 6.4 6649 6.8 6338 6.7
Vaginal breech 363 0.4 367 0.4 363 0.4 339 0.3 336 0.4
Elective caesarean section 17818 18.7 18812 19.6 18826 19.8 19692 20.2 20115 21.3
Emergency caesarean section† 12236 12.8 12103 12.6 11984 12.6 12321 12.7 11764 12.5
Not stated 2 0.0 7 0.0 3 0.0 29 0.0 27 0.0
TOTAL 95537 100.0 95926 100.0 94989 100.0 97306 100.0 94449 100.0
Source: NSW Perinatal Data Collection (SAPHaRI). Centre for Epidemiology and Evidence, NSW Ministry of Health.† Emergency caesarean section includes caesarean sections where the onset of labour was not stated.
TABLE 15: MATERNAL HEALTH INSURANCE BY TYPE OF BIRTH, NSW 2012–2016#
Insurance status-type of birth
Year
2012 2013 2014 2015 2016
No. % No. % No. % No. % No. %
PUBLIC Normal vaginal 40351 63.2 39160 62.8 38761 62.4 37823 62.1 38112 61.4
Forceps 2725 4.3 2814 4.5 2827 4.5 2863 4.7 2951 4.8
Vacuum extraction 3770 5.9 3529 5.7 3354 5.4 3192 5.2 3446 5.6
Vaginal breech 311 0.5 277 0.4 252 0.4 275 0.5 261 0.4
Elective caesarean section 9128 14.3 8877 14.2 9303 15.0 9267 15.2 9487 15.3
Emergency caesarean section* 7506 11.8 7697 12.3 7653 12.3 7464 12.3 7800 12.6
Not stated 7 0.0 0 0.0 3 0.0 3 0.0 23 0.0
TOTAL 63798 100.0 62354 100.0 62153 100.0 60887 100.0 62080 100.0
PRIVATE Normal vaginal 15391 45.3 14756 45.2 14849 44.7 14960 44.7 15301 44.0
Forceps 1456 4.3 1515 4.6 1651 5.0 1609 4.8 1571 4.5
Vacuum extraction 3193 9.4 2934 9.0 2781 8.4 2883 8.6 3173 9.1
Vaginal breech 83 0.2 84 0.3 112 0.3 87 0.3 74 0.2
Elective caesarean section 9088 26.8 8877 27.2 9449 28.4 9474 28.3 10147 29.2
Emergency caesarean section* 4744 14.0 4456 13.7 4370 13.2 4434 13.3 4476 12.9
Not stated 9 0.0 2 0.0 4 0.0 0 0.0 5 0.0
TOTAL 33964 100.0 32624 100.0 33216 100.0 33447 100.0 34747 100.0
NOT STATED
Normal vaginal 251 66.2 353 63.1 378 67.9 420 64.1 327 68.3
Forceps 11 2.9 20 3.6 11 2.0 16 2.4 14 2.9
Vacuum extraction 18 4.7 37 6.6 25 4.5 47 7.2 30 6.3
Vaginal breech 5 1.3 2 0.4 3 0.5 1 0.2 4 0.8
Elective caesarean section 37 9.8 64 11.4 60 10.8 85 13.0 58 12.1
Emergency caesarean section* 55 14.5 83 14.8 80 14.4 86 13.1 45 9.4
Not stated 2 0.5 0 0.0 0 0.0 0 0.0 1 0.2
TOTAL 379 100.0 559 100.0 557 100.0 655 100.0 479 100.0
TOTAL† Normal vaginal 55993 57.1 54269 56.8 53988 56.3 53203 56.0 53740 55.2
Forceps 4192 4.3 4349 4.6 4489 4.7 4488 4.7 4536 4.7
Vacuum extraction 6981 7.1 6500 6.8 6160 6.4 6122 6.4 6649 6.8
Vaginal breech 399 0.4 363 0.4 367 0.4 363 0.4 339 0.3
Elective caesarean section 18253 18.6 17818 18.7 18812 19.6 18826 19.8 19692 20.2
Emergency caesarean section* 12305 12.5 12236 12.8 12103 12.6 11984 12.6 12321 12.7
Not stated 18 0.0 2 0.0 7 0.0 3 0.0 29 0.0
TOTAL 98141 100.0 95537 100.0 95926 100.0 94989 100.0 97306 100.0
Source: Maternal and Child Health Register. Centre for Epidemiology and Evidence, NSW Ministry of Health.# Figures for 2012–15 differ to those reported previously as the linkage has been updated.* Emergency caesarean section includes cases where caesarean section was reported but type of onset of labour was not reported.† Total includes mothers where type of health insurance was not stated.
18 | NSW HEALTH | NSW Mothers and Babies 2017

Birth weightSince 2013, the pattern of birth weight has remained stable, with the rate of low birth weight (less than 2,500 grams) ranging from 6.3% to 6.7% (Table 17). The rate of low birth weight was 6.7% in 2017.
Baby sexThere was no significant change in the pattern of baby sex since 2013, with slightly more male babies born than females in each year. In 2017, 49,068 (51.2%) babies were male, 46,738 (48.8%) were female, and 15 were of indeterminate sex. This compares with babies born in 2013, when 49,980 (51.5%) babies were male, 46,966 (48.4%) were female, and six were of indeterminate sex.
Gestational ageIn 2017, 7.4% of babies were born prematurely (less than 37 weeks gestation), similar to 7.6% reported in 2013 (Table 16). Over the 5-year period, around 92% of babies were born at term (37-41 weeks gestation). The percentage of post-term babies (42-plus weeks gestation) was 0.5% in 2013 and 0.9% in 2017.
TABLE 17: BIRTH WEIGHT, NSW 2013–2017
Birth weight (grams)
Year
2013 2014 2015 2016 2017
No. % No. % No. % No. % No. %
Less than 500 232 0.2 225 0.2 283 0.3 326 0.3 341 0.4
500–999 413 0.4 433 0.4 411 0.4 411 0.4 455 0.5
1,000–1,499 524 0.5 552 0.6 545 0.6 534 0.5 503 0.5
1,500–1,999 1129 1.2 1096 1.1 1193 1.2 1191 1.2 1154 1.2
2,000–2,499 3856 4.0 3839 3.9 3918 4.1 3931 4.0 3952 4.1
2,500–2,999 15089 15.6 15598 16.0 15931 16.5 16272 16.5 16011 16.7
3,000–3,499 36118 37.2 36528 37.5 36122 37.5 37290 37.8 36263 37.8
3,500–3,999 29191 30.1 28986 29.8 28315 29.4 29171 29.5 28051 29.3
4,000–4,499 8860 9.1 8606 8.8 8330 8.6 8348 8.5 7942 8.3
4,500+ 1460 1.5 1393 1.4 1276 1.3 1182 1.2 1106 1.2
Not stated 99 0.1 69 0.1 67 0.1 71 0.1 47 0.0
TOTAL 96971 100.0 97325 100.0 96391 100.0 98727 100.0 95825 100.0
Source: NSW Perinatal Data Collection (SAPHaRI). Centre for Epidemiology and Evidence, NSW Ministry of Health.
TABLE 16: GESTATIONAL AGE, NSW 2013–2017
Gestational age (weeks)
Year
2013 2014 2015 2016 2017
No. % No. % No. % No. % No. %
< 28 690 0.7 659 0.7 733 0.8 696 0.7 713 0.7
28–31 659 0.7 696 0.7 690 0.7 619 0.6 642 0.7
32–36 6059 6.2 6140 6.3 6200 6.4 5865 5.9 5754 6.0
37–41 89086 91.9 89435 91.9 88397 91.7 90270 91.4 87768 91.6
42 + 466 0.5 391 0.4 367 0.4 1065 1.1 885 0.9
Not stated 11 0.0 4 0.0 4 0.0 212 0.2 63 0.1
TOTAL 96971 100.0 97325 100.0 96391 100.0 98727 100.0 95825 100.0
Source: NSW Perinatal Data Collection (SAPHaRI). Centre for Epidemiology and Evidence, NSW Ministry of Health.
Apgar scoreIn 2017, 2.2% of babies were born with an Apgar score of less than seven at 5 minutes and 1.0% were born with an Apgar score of less than five (Table 18). These rates are similar to those of previous years.
TABLE 18: APGAR SCORE AT 5 MINUTES, NSW 2013–2017#
Apgar score
Year
2013 2014 2015 2016 2017
No. % No. % No. % No. % No. %
0-4 1053 1.1 1050 1.1 1025 1.1 1047 1.1 1003 1.0
5-6 1184 1.2 1206 1.2 1200 1.2 1209 1.2 1083 1.1
7+ 94673 97.6 94861 97.5 93864 97.4 95844 97.1 93157 97.2
Not stated 61 0.1 208 0.2 302 0.3 627 0.6 582 0.6
TOTAL 96971 100.0 97325 100.0 96391 100.0 98727 100.0 95825 100.0
Source: NSW Perinatal Data Collection (SAPHaRI). Centre for Epidemiology and Evidence, NSW Ministry of Health.# Includes stillbirths and live births.
NSW HEALTH | NSW Mothers and Babies 2017 | 19

Perinatal outcomeAcross the period 2013–2017 the perinatal mortality rate varied from 7.5 to 8.4 per 1,000 births and was 8.4 per 1,000 in 2017 (Table 21). In 2017, 73.7% of all reported perinatal deaths were stillbirths and 26.3% were neonatal deaths.
Of the 802 perinatal deaths in 2017 in NSW, 669 (83.4%) were reported among planned hospital births, 112 (14.0%) among planned birth centre births and 19 deaths were among babies born before arrival at hospital (2.4%). There were no perinatal deaths reported among planned or actual homebirths.
Hepatitis BThe percentage of babies given a hepatitis B vaccination at birth remained stable at about 94% between 2013 and 2017 (Table 19).
Infant feedingThe percentage of babies fully breastfed at the time of discharge from hospital decreased from 79.8% to 73.7% between 2013 and 2017. The percentage of babies that received any breastfeeding rose from 8.8% in 2013 to 14.7% in 2017. In the same 5-year period, the percentage of babies receiving infant formula only fell from 10.3% to 8.3% (Table 20).
TABLE 21: PERINATAL OUTCOMES, NSW 2013–2017#
YearLiveborn surviving Stillborn Neonatal death Death–age not stated Not stated Total births
Perinatal death rate/1,000 births†
No. % No. % No. % No. % No. % No. % No.
2013 96174 99.2 562 0.6 212 0.2 2 0.0 21 0.0 96971 100.0 8.0
2014 96553 99.2 534 0.5 221 0.2 2 0.0 15 0.0 97325 100.0 7.8
2015 95571 99.1 602 0.6 186 0.2 1 0.0 31 0.0 96391 100.0 8.2
2016 97983 99.2 543 0.6 201 0.2 0 0.0 0 0.0 98727 100.0 7.5
2017 95023 99.2 591 0.6 211 0.2 0 0.0 0 0.0 95825 100.0 8.4
Source: NSW Perinatal Data Collection (SAPHaRI). Centre for Epidemiology and Evidence, NSW Ministry of Health.# Perinatal deaths include deaths reported to the PDC only. As the PDC form is completed at discharge or transfer of the baby, deaths occurring after this time may not be reported to the PDC.†The perinatal death rate excludes deaths where the age at death was not stated.
TABLE 19: HEPATITIS B DOSE GIVEN TO LIVEBORN BABIES, NSW 2013–2017
Hepatitis B dose given
Year
2013 2014 2015 2016 2017
No. % No. % No. % No. % No. %
No 5441 5.6 5207 5.4 5366 5.6 4956 5.0 5220 5.5
Yes 90921 94.3 91538 94.6 90378 94.4 92013 93.7 89070 93.5
Not stated 26 0.0 31 0.0 14 0.0 1215 1.2 944 1.0
TOTAL 96388 100.0 96776 100.0 95758 100.0 98184 100.0 95234 100.0
Source: NSW Perinatal Data Collection (SAPHaRI). Centre for Epidemiology and Evidence, NSW Ministry of Health.
TABLE 20: LIVE BIRTHS BY TYPE OF INFANT FEEDING, NSW 2013–2017
Infant feeding
Year
2013 2014 2015 2016 2017
No. % No. % No. % No. % No. %
Full breastfeeding 76912 79.8 76018 78.6 75562 78.9 73524 74.9 70234 73.7
Any breastfeeding 8457 8.8 10132 10.5 10047 10.5 13177 13.4 14031 14.7
Infant formula only 9935 10.3 9577 9.9 9270 9.7 8305 8.5 7921 8.3
Not stated 1084 1.1 1049 1.1 879 0.9 3178 3.2 3048 3.2
TOTAL 96388 100.0 96776 100.0 95758 100.0 98184 100.0 95234 100.0
Source: NSW Perinatal Data Collection (SAPHaRI). Centre for Epidemiology and Evidence, NSW Ministry of Health.
20 | NSW HEALTH | NSW Mothers and Babies 2017

TABLE 23: MATERNAL DEATHS BY CAUSE, NSW 2016#
Classification Cause No.
Indirect Meningococcal septicaemia 1
Indirect Laryngospasm leading to respiratory arrest 1
Indirect Suicide 1
Direct Suicide 1
Direct Intracranial haemorrhage associated with pre-eclampsia 1
TOTAL 5
Source: NSW Maternal and Perinatal Mortality Review Committee.# Includes all deaths of women who were pregnant at the time of death, or who died within 42 days of childbirth. Direct deaths include those resulting from obstetric complications of the pregnant state, including its management. Indirect deaths include those resulting from pre-existing disease or disease which developed during pregnancy and was not due to direct obstetric causes but which may have been aggravated by the physiological effects of pregnancy. Incidental deaths are those where the pregnancy is unlikely to have contributed significantly to the death.2
Maternal deathsIn the period 1990–2016, 239 deaths were reported among pregnant women or women who gave birth less than 6 weeks previously. Of these, 69 (28.9%) died of incidental causes not related to the pregnancy or its management, 103 (43.1%) deaths were found to be directly due to pregnancy or its management, and 63 (26.4%) were found to result from pre-existing disease or disease which developed during pregnancy (not due to direct obstetric causes), but which may have been aggravated by the physiological effects of pregnancy (Table 22). Table 23 shows maternal deaths by cause in NSW for 2016.
TABLE 22: MATERNAL DEATHS BY YEAR, NSW 1990-2016#
Year
Classification
Direct IndirectTotal
Direct & IndirectIncidental TOTAL
No. Ratio/100,000 No. Ratio/100,000 No. Ratio/100,000 No. Ratio/100,000 No. Ratio/100,000
1990 4 4.6 6 6.9 10 11.6 2 2.3 12 13.9
1991 4 4.7 1 1.2 5 5.8 1 1.2 6 7.0
1992 5 5.7 1 1.1 6 6.8 5 5.7 11 12.5
1993 6 6.9 1 1.2 7 8.1 6 6.9 13 15.0
1994 8 9.2 1 1.2 9 10.4 3 3.5 12 13.8
1995 7 8.1 2 2.3 9 10.4 6 7.0 15 17.4
1996 6 7.0 1 1.2 7 8.2 5 5.9 12 14.1
1997 7 8.1 2 2.3 9 10.5 5 5.8 14 16.1
1998 4 4.7 4 4.7 8 9.4 3 3.5 11 12.9
1999† 4 4.7 1 1.2 5 5.8 6 7.0 12 14.0
2000 4 4.7 5 5.9 9 10.7 1 1.2 10 11.9
2001 4 4.7 4 4.7 8 9.5 1 1.2 9 10.7
2002 2 2.4 2 2.4 4 4.7 1 1.2 5 5.9
2003 1 1.2 3 3.5 4 4.7 3 3.5 7 8.2
2004† 2 2.3 2 2.3 4 4.7 2 2.3 7 8.2
2005† 4 4.5 4 4.5 8 9.0 2 2.2 11 12.3
2006 4 4.4 3 3.3 7 7.7 3 3.3 10 11.0
2007 1 1.1 0 0.0 1 1.1 0 0.0 1 1.1
2008 0 0.0 4 4.2 4 4.2 1 1.1 5 5.3
2009 5 5.3 2 2.1 7 7.4 3 3.2 10 10.5
2010 4 4.2 2 2.1 6 6.3 2 2.1 8 8.4
2011 3 3.1 5 5.2 8 8.3 2 2.1 10 10.4
2012 3 3.1 2 2.0 5 5.1 2 2.0 7 7.1
2013 2 2.1 1 1.0 3 3.1 2 2.1 5 5.2
2014 4 4.2 1 1.0 5 5.2 2 2.1 7 7.3
2015† 3 3.2 0 0.0 4 4.2 0 0.0 4 4.2
2016 2 2.1 3 3.1 5 5.1 0 0.0 5 5.1
Source: NSW Maternal and Perinatal Mortality Review Committee.# Includes all deaths of women who were pregnant at the time of death, or who died within 42 days of childbirth. Direct deaths include those resulting from obstetric complications of the pregnant state, including its management. Indirect deaths include those resulting from pre-existing disease or disease which developed during pregnancy and was not due to direct obstetric causes but which may have been aggravated by the physiological effects of pregnancy. Incidental deaths are those where the pregnancy is unlikely to have contributed significantly to the death.2
† Totals for the year include one death that was unable to be classified.
References
1. Australasian Diabetes in Pregnancy Society. ADIPS Consensus Guidelines for the Testing and Diagnosis of Gestational Diabetes Mellitus in Australia 2014. Available at www.adips.org. Accessed 12 January 2018.
2. Australian Institute of Health and Welfare. Maternal deaths in Australia 2012-2014. Cat. No. PER 70. Canberra: AIHW, 2017.
NSW HEALTH | NSW Mothers and Babies 2017 | 21

Information on the health of Aboriginal and Torres Strait Islander mothers is shown in Chapter 8.
ConfinementsThe largest numbers of mothers who gave birth in 2017 were resident in the Western Sydney Local Health District (n = 14,479, 15.3%), followed by the South Western Sydney Local Health District (n = 13,554, 14.4%) and the South Eastern Sydney Local Health District (n = 10,644, 11.3%) (Table 24).
Maternal ageIn 2017, the proportion of women giving birth at less than 20 years of age varied from 0.2% in the Northern Sydney Local Health District to 5.9% in the Far West Local Health District, while the proportion of mothers giving birth at 35 years of age or more ranged from 13.7% in the Far West Local Health District to 40.1% in the Northern Sydney Local Health District (Table 24).
5. LOCAL HEALTH DISTRICTS
TABLE 24: MATERNAL AGE BY LOCAL HEALTH DISTRICT OF RESIDENCE, NSW 2017
Local Health District
Maternal age (years)
12–19 20–24 25–29 30–34 35–39 40–44 45+ Not stated TOTAL
No. % No. % No. % No. % No. % No. % No. % No. % No. %
Sydney 28 0.3 426 5.3 1602 20.0 3257 40.7 2180 27.2 482 6.0 32 0.4 1 0.0 8008 100.0
South Western Sydney 252 1.9 1855 13.7 4240 31.3 4379 32.3 2287 16.9 504 3.7 36 0.3 1 0.0 13554 100.0
South Eastern Sydney 52 0.5 460 4.3 2131 20.0 4348 40.8 2924 27.5 665 6.2 63 0.6 1 0.0 10644 100.0
Illawarra Shoalhaven 122 2.7 587 13.1 1305 29.2 1564 34.9 753 16.8 136 3.0 8 0.2 0 0.0 4475 100.0
Western Sydney 223 1.5 1487 10.3 4114 28.4 5452 37.7 2707 18.7 465 3.2 31 0.2 0 0.0 14479 100.0
Nepean Blue Mountains 116 2.4 757 15.4 1538 31.3 1565 31.9 761 15.5 155 3.2 12 0.2 4 0.1 4908 100.0
Northern Sydney 17 0.2 235 2.3 1532 15.1 4298 42.4 3244 32.0 775 7.6 45 0.4 0 0.0 10146 100.0
Central Coast 98 2.6 529 13.8 1085 28.3 1307 34.1 650 17.0 139 3.6 11 0.3 13 0.3 3832 100.0
Hunter New England 400 3.8 1711 16.2 3205 30.4 3387 32.1 1531 14.5 289 2.7 19 0.2 1 0.0 10543 100.0
Northern NSW 96 3.8 481 19.0 730 28.9 698 27.6 417 16.5 97 3.8 7 0.3 0 0.0 2526 100.0
Mid North Coast 92 4.3 394 18.2 642 29.7 624 28.8 330 15.3 73 3.4 8 0.4 0 0.0 2163 100.0
Southern NSW 49 3.6 233 17.1 447 32.8 424 31.1 190 13.9 18 1.3 2 0.1 0 0.0 1363 100.0
Murrumbidgee 109 4.6 423 18.0 760 32.4 701 29.9 287 12.2 62 2.6 3 0.1 0 0.0 2345 100.0
Western NSW 181 5.1 733 20.5 1144 31.9 1000 27.9 435 12.1 85 2.4 3 0.1 0 0.0 3581 100.0
Far West 12 5.9 47 22.9 65 31.7 53 25.9 26 12.7 2 1.0 0 0.0 0 0.0 205 100.0
Other-not stated 20 1.2 183 10.9 496 29.6 585 34.9 321 19.1 64 3.8 5 0.3 3 0.2 1677 100.0
TOTAL 1867 2.0 10541 11.2 25036 26.5 33642 35.6 19043 20.2 4011 4.2 285 0.3 24 0.0 94449 100.0
Source: NSW Perinatal Data Collection (SAPHaRI). Centre for Epidemiology and Evidence, NSW Ministry of Health.
22 | NSW HEALTH | NSW Mothers and Babies 2017

Maternal country of birthSixty-eight per cent of women who gave birth in NSW in 2017 were born in English speaking countries, 20.8% were born in Asian countries, and 5.3% were born in the Middle East or Africa (Table 25). The highest proportions of mothers born in non-English speaking countries were in the Western Sydney, Sydney and South Western Sydney Local Health Districts.
TABLE 25: MATERNAL COUNTRY OF BIRTH BY LOCAL HEALTH DISTRICT OF RESIDENCE, NSW 2017
Local Health District
Country of birth group
English speaking
Central & South America
Melanesia, Micronesia & Polynesia
Southern Europe
Western & Northern Europe
Eastern Europe, Russia, Central Asian &
Baltic States
Middle East & Africa
South East Asia
North East Asia
Southern Asia
TOTAL†
No. % No. % No. % No. % No. % No. % No. % No. % No. % No. % No. %
Sydney 4246 53.0 127 1.6 60 0.7 146 1.8 129 1.6 128 1.6 425 5.3 666 8.3 1079 13.5 975 12.2 8008 100.0
South Western Sydney 7731 57.0 133 1.0 381 2.8 246 1.8 44 0.3 118 0.9 1995 14.7 1578 11.6 369 2.7 940 6.9 13554 100.0
South Eastern Sydney 6638 62.4 258 2.4 63 0.6 236 2.2 247 2.3 267 2.5 339 3.2 685 6.4 1070 10.1 681 6.4 10644 100.0
Illawarra Shoalhaven 3940 88.0 24 0.5 12 0.3 54 1.2 30 0.7 17 0.4 119 2.7 100 2.2 77 1.7 81 1.8 4475 100.0
Western Sydney 6123 42.3 95 0.7 298 2.1 91 0.6 46 0.3 423 2.9 1367 9.4 913 6.3 1571 10.9 3523 24.3 14479 100.0
Nepean Blue Mountains 4087 83.3 20 0.4 62 1.3 20 0.4 19 0.4 37 0.8 167 3.4 153 3.1 64 1.3 250 5.1 4908 100.0
Northern Sydney 5966 58.8 249 2.5 41 0.4 141 1.4 236 2.3 219 2.2 316 3.1 551 5.4 1691 16.7 648 6.4 10146 100.0
Central Coast 3472 90.6 22 0.6 13 0.3 14 0.4 36 0.9 26 0.7 17 0.4 72 1.9 58 1.5 80 2.1 3832 100.0
Hunter New England 9684 91.9 28 0.3 26 0.2 20 0.2 59 0.6 38 0.4 126 1.2 214 2.0 119 1.1 200 1.9 10543 100.0
Northern NSW 2310 91.4 22 0.9 8 0.3 8 0.3 37 1.5 8 0.3 11 0.4 45 1.8 32 1.3 21 0.8 2526 100.0
Mid North Coast 1965 90.8 10 0.5 8 0.4 10 0.5 13 0.6 11 0.5 21 1.0 47 2.2 17 0.8 54 2.5 2163 100.0
Southern NSW 1244 91.3 3 0.2 4 0.3 5 0.4 10 0.7 1 0.1 7 0.5 29 2.1 15 1.1 43 3.2 1363 100.0
Murrumbidgee 2109 89.9 2 0.1 25 1.1 3 0.1 5 0.2 10 0.4 28 1.2 48 2.0 25 1.1 90 3.8 2345 100.0
Western NSW 3363 93.9 7 0.2 4 0.1 4 0.1 15 0.4 5 0.1 21 0.6 43 1.2 20 0.6 88 2.5 3581 100.0
Far West 195 95.1 0 0.0 0 0.0 0 0.0 0 0.0 1 0.5 0 0.0 3 1.5 0 0.0 5 2.4 205 100.0
Other-not stated 813 48.5 34 2.0 29 1.7 16 1.0 21 1.3 23 1.4 79 4.7 205 12.2 206 12.3 236 14.1 1677 100.0
TOTAL 63886 67.6 1034 1.1 1034 1.1 1014 1.1 947 1.0 1332 1.4 5038 5.3 5352 5.7 6413 6.8 7915 8.4 94449 100.0
Source: NSW Perinatal Data Collection (SAPHaRI). Centre for Epidemiology and Evidence, NSW Ministry of Health.† Includes 484 mothers in NSW for whom country of birth was not stated. Maternal countries of birth and birth groups are shown in Appendix 3.
NSW HEALTH | NSW Mothers and Babies 2017 | 23

Aboriginal and Torres Strait Islander mothersIn 2017, 4.4% of mothers were reported to be Aboriginal or Torres Strait Islander (Table 26). The reported proportion of Aboriginal or Torres Strait Islander mothers varied from 0.4% in the Northern Sydney Local Health District to 17.1% in the Far West Local Health District.
TABLE 26: ABORIGINAL AND TORRES STRAIT ISLANDER MOTHERS BY LOCAL HEALTH DISTRICT OF RESIDENCE, NSW 2017
Local Health DistrictAboriginal or Torres Strait Islander
Non-Aboriginal or Torres Strait Islander
Not stated TOTAL
No. % No. % No. % No. %
Sydney 99 1.2 7884 98.5 25 0.3 8008 100.0
South Western Sydney 295 2.2 13239 97.7 20 0.1 13554 100.0
South Eastern Sydney 113 1.1 10518 98.8 13 0.1 10644 100.0
Illawarra Shoalhaven 276 6.2 4197 93.8 2 0.0 4475 100.0
Western Sydney 289 2.0 14134 97.6 56 0.4 14479 100.0
Nepean Blue Mountains 229 4.7 4672 95.2 7 0.1 4908 100.0
Northern Sydney 36 0.4 9905 97.6 205 2.0 10146 100.0
Central Coast 230 6.0 3597 93.9 5 0.1 3832 100.0
Hunter New England 1100 10.4 9413 89.3 30 0.3 10543 100.0
Northern NSW 231 9.1 2284 90.4 11 0.4 2526 100.0
Mid North Coast 262 12.1 1894 87.6 7 0.3 2163 100.0
Southern NSW 91 6.7 1267 93.0 5 0.4 1363 100.0
Murrumbidgee 204 8.7 2134 91.0 7 0.3 2345 100.0
Western NSW 666 18.6 2906 81.2 9 0.3 3581 100.0
Far West 35 17.1 170 82.9 0 0.0 205 100.0
Other-not stated 27 1.6 1622 96.7 28 1.7 1677 100.0
TOTAL 4183 4.4 89836 95.1 430 0.5 94449 100.0
Source: NSW Perinatal Data Collection (SAPHaRI). Centre for Epidemiology and Evidence, NSW Ministry of Health.
Duration of pregnancy at first antenatal visitIn 2017, 90.6% of mothers commenced antenatal care prior to 20 weeks gestation and 73.1% commenced antenatal care prior to 14 weeks gestation. The percentage of mothers commencing antenatal care prior to 20 weeks gestation varied from 73.1% in the Southern NSW Local Health District to 95.9% in the Sydney and Northern Sydney Local Health Districts (Table 27).
TABLE 27: DURATION OF PREGNANCY AT FIRST ANTENATAL VISIT BY LOCAL HEALTH DISTRICT OF RESIDENCE, NSW 2017
Local Health District
Duration of pregnancy at first antenatal visit (weeks)
0–13 14–19 20+ Not stated TOTAL
No. % No. % No. % No. % No. %
Sydney 6781 84.7 898 11.2 294 3.7 35 0.4 8008 100.0
South Western Sydney 10070 74.3 2021 14.9 1272 9.4 191 1.4 13554 100.0
South Eastern Sydney 7527 70.7 2455 23.1 627 5.9 35 0.3 10644 100.0
Illawarra Shoalhaven 2466 55.1 1337 29.9 659 14.7 13 0.3 4475 100.0
Western Sydney 8733 60.3 3741 25.8 1931 13.3 74 0.5 14479 100.0
Nepean Blue Mountains 3067 62.5 1304 26.6 515 10.5 22 0.4 4908 100.0
Northern Sydney 8200 80.8 1533 15.1 367 3.6 46 0.5 10146 100.0
Central Coast 2840 74.1 699 18.2 280 7.3 13 0.3 3832 100.0
Hunter New England 9044 85.8 772 7.3 640 6.1 87 0.8 10543 100.0
Northern NSW 2153 85.2 227 9.0 139 5.5 7 0.3 2526 100.0
Mid North Coast 1760 81.4 158 7.3 234 10.8 11 0.5 2163 100.0
Southern NSW 669 49.1 327 24.0 354 26.0 13 1.0 1363 100.0
Murrumbidgee 1660 70.8 277 11.8 399 17.0 9 0.4 2345 100.0
Western NSW 2725 76.1 476 13.3 367 10.2 13 0.4 3581 100.0
Far West 117 57.1 79 38.5 9 4.4 0 0.0 205 100.0
Other-not stated 1250 74.5 169 10.1 237 14.1 21 1.3 1677 100.0
TOTAL 69062 73.1 16473 17.4 8324 8.8 590 0.6 94449 100.0
Source: NSW Perinatal Data Collection (SAPHaRI). Centre for Epidemiology and Evidence, NSW Ministry of Health.
24 | NSW HEALTH | NSW Mothers and Babies 2017

Smoking in pregnancyIn 2017, 8.8% of mothers reported smoking at all during pregnancy. The percentage of mothers that reported smoking at all during pregnancy varied from 1.7% in the Northern Sydney Local Health District to 26.8% in the Far West Local Health District (Table 28). A total of 6.5% of mothers reported smoking in the second half of pregnancy. The lowest rate was reported among mothers living in the Northern Sydney Local Health District (0.9%) and the highest rate was reported among residents of the Far West Local Health District (21.5%).
TABLE 28: SMOKING IN PREGNANCY BY LOCAL HEALTH DISTRICT OF RESIDENCE, NSW 2017
Local Health District
Smoking during pregnancy
Smoked in first half of pregnancy Smoked in second half of pregnancy Smoked at all during pregnancy TOTAL
No. % No. % No. % No. %
Sydney 213 2.7 128 1.6 223 2.8 8008 100.0
South Western Sydney 1066 7.9 758 5.6 1124 8.3 13554 100.0
South Eastern Sydney 304 2.9 190 1.8 321 3.0 10644 100.0
Illawarra Shoalhaven 509 11.4 397 8.9 538 12.0 4475 100.0
Western Sydney 937 6.5 633 4.4 984 6.8 14479 100.0
Nepean Blue Mountains 538 11.0 348 7.1 552 11.2 4908 100.0
Northern Sydney 163 1.6 89 0.9 173 1.7 10146 100.0
Central Coast 494 12.9 419 10.9 522 13.6 3832 100.0
Hunter New England 1429 13.6 1285 12.2 1533 14.5 10543 100.0
Northern NSW 415 16.4 367 14.5 437 17.3 2526 100.0
Mid North Coast 371 17.2 322 14.9 393 18.2 2163 100.0
Southern NSW 175 12.8 160 11.7 192 14.1 1363 100.0
Murrumbidgee 390 16.6 306 13.0 419 17.9 2345 100.0
Western NSW 710 19.8 619 17.3 744 20.8 3581 100.0
Far West 51 24.9 44 21.5 55 26.8 205 100.0
Other-not stated 66 4.0 49 3.6 69 4.2 1677 100.0
TOTAL 7831 8.3 6114 6.5 8279 8.8 94449 100.0
Source: NSW Perinatal Data Collection (SAPHaRI). Centre for Epidemiology and Evidence, NSW Ministry of Health.
Place of birthNinety-three per cent of mothers chose to give birth in a hospital birthing suite in 2017, compared to 6.3% who planned a birth centre birth and 0.3% who planned a home birth (Table 29). Planned birth centre births were most commonly reported in the Northern NSW Local Health District (16.7%).
TABLE 29: PLACE OF BIRTH BY LOCAL HEALTH DISTRICT OF RESIDENCE, NSW 2017
Local Health District
Place of birth
Hospital Birth centrePlanned
birth centre– hospital admission
Planned homebirthPlanned
homebirth– hospital admission
Born before arrival TOTAL†
No. % No. % No. % No. % No. % No. % No. %
Sydney 7679 95.9 254 3.2 30 0.4 6 0.1 0 0.0 35 0.4 8008 100.0
South Western Sydney 13324 98.3 57 0.4 79 0.6 11 0.1 1 0.0 77 0.6 13554 100.0
South Eastern Sydney 9912 93.1 503 4.7 158 1.5 8 0.1 2 0.0 56 0.5 10644 100.0
Illawarra Shoalhaven 4278 95.6 95 2.1 71 1.6 8 0.2 2 0.0 21 0.5 4475 100.0
Western Sydney 13708 94.7 510 3.5 183 1.3 4 0.0 1 0.0 73 0.5 14479 100.0
Nepean Blue Mountains 4730 96.4 116 2.4 28 0.6 14 0.3 0 0.0 20 0.4 4908 100.0
Northern Sydney 9329 91.9 375 3.7 377 3.7 19 0.2 7 0.1 39 0.4 10146 100.0
Central Coast 3258 85.0 367 9.6 161 4.2 3 0.1 3 0.1 39 1.0 3832 100.0
Hunter New England 9266 87.9 919 8.7 181 1.7 69 0.7 7 0.1 96 0.9 10543 100.0
Northern NSW 2044 80.9 289 11.4 134 5.3 28 1.1 8 0.3 22 0.9 2526 100.0
Mid North Coast 1829 84.6 139 6.4 177 8.2 3 0.1 3 0.1 12 0.6 2163 100.0
Southern NSW 1269 93.1 38 2.8 37 2.7 3 0.2 1 0.1 13 1.0 1363 100.0
Murrumbidgee 2199 93.8 75 3.2 60 2.6 0 0.0 2 0.1 9 0.4 2345 100.0
Western NSW 3117 87.0 244 6.8 194 5.4 0 0.0 4 0.1 22 0.6 3581 100.0
Far West 182 88.8 15 7.3 6 2.9 0 0.0 0 0.0 2 1.0 205 100.0
Other-not stated 1563 93.2 47 2.8 37 2.2 22 1.3 0 0.0 8 0.5 1677 100.0
TOTAL 87687 92.8 4043 4.3 1913 2.0 198 0.2 41 0.0 544 0.6 94449 100.0
Source: NSW Perinatal Data Collection (SAPHaRI). Centre for Epidemiology and Evidence, NSW Ministry of Health.† Includes 23 mothers in NSW for whom place of birth was not stated.
NSW HEALTH | NSW Mothers and Babies 2017 | 25

LabourIn 2017, the onset of labour was spontaneous in 46.3% of confinements (Table 30). Labour was induced in 32.3% of confinements and no labour (elective caesarean section) was reported in 21.3%. The rate of spontaneous onset of labour was highest among residents of the Southern NSW Local Health District (57.3%). The highest rate of induction of labour was among residents of the Nepean Blue Mountains Local Health District (36.6%).
TABLE 30: ONSET AND AUGMENTATION OF LABOUR BY LOCAL HEALTH DISTRICT OF RESIDENCE, NSW 2017
Local Health District
Onset of labour
SpontaneousSpontaneous augmented with ARM
Spontaneous augmented with
oxytocics†
No labourInduced– oxytocics/
prostaglandins
Induced–ARM only
Induced–ARM + oxytocics/
prostaglandinsInduced–other‡ Not stated TOTAL
No. % No. % No. % No. % No. % No. % No. % No. % No. % No. %
Sydney 2220 27.7 484 6.0 846 10.6 1904 23.8 1143 14.3 345 4.3 1036 12.9 28 0.3 2 0.0 8008 100.0
South Western Sydney 4699 34.7 1076 7.9 1113 8.2 2505 18.5 1854 13.7 797 5.9 1424 10.5 77 0.6 9 0.1 13554 100.0
South Eastern Sydney 3245 30.5 592 5.6 872 8.2 2488 23.4 1175 11.0 297 2.8 1944 18.3 15 0.1 16 0.2 10644 100.0
Illawarra Shoalhaven 1504 33.6 198 4.4 323 7.2 884 19.8 411 9.2 105 2.3 1042 23.3 8 0.2 0 0.0 4475 100.0
Western Sydney 4816 33.3 910 6.3 1118 7.7 2939 20.3 1251 8.6 206 1.4 3191 22.0 38 0.3 10 0.1 14479 100.0
Nepean Blue Mountains 1548 31.5 255 5.2 179 3.6 1122 22.9 528 10.8 108 2.2 1151 23.5 7 0.1 10 0.2 4908 100.0
Northern Sydney 3046 30.0 483 4.8 938 9.2 2763 27.2 1007 9.9 224 2.2 1648 16.2 35 0.3 2 0.0 10146 100.0
Central Coast 1264 33.0 192 5.0 311 8.1 810 21.1 464 12.1 44 1.1 737 19.2 8 0.2 2 0.1 3832 100.0
Hunter New England 3683 34.9 450 4.3 460 4.4 2116 20.1 1149 10.9 328 3.1 2324 22.0 25 0.2 8 0.1 10543 100.0
Northern NSW 1082 42.8 129 5.1 157 6.2 351 13.9 291 11.5 66 2.6 447 17.7 3 0.1 0 0.0 2526 100.0
Mid North Coast 896 41.4 87 4.0 113 5.2 409 18.9 225 10.4 43 2.0 388 17.9 2 0.1 0 0.0 2163 100.0
Southern NSW 628 46.1 59 4.3 94 6.9 203 14.9 128 9.4 27 2.0 216 15.8 1 0.1 7 0.5 1363 100.0
Murrumbidgee 903 38.5 101 4.3 117 5.0 544 23.2 230 9.8 62 2.6 383 16.3 4 0.2 1 0.0 2345 100.0
Western NSW 1255 35.0 164 4.6 225 6.3 732 20.4 392 10.9 82 2.3 719 20.1 12 0.3 0 0.0 3581 100.0
Far West 75 36.6 16 7.8 18 8.8 37 18.0 25 12.2 1 0.5 33 16.1 0 0.0 0 0.0 205 100.0
Other-not stated 547 32.6 90 5.4 176 10.5 325 19.4 200 11.9 62 3.7 274 16.3 3 0.2 0 0.0 1677 100.0
TOTAL 31411 33.3 5286 5.6 7060 7.5 20132 21.3 10473 11.1 2797 3.0 16957 18.0 266 0.3 67 0.1 94449 100.0
Source: NSW Perinatal Data Collection (SAPHaRI). Centre for Epidemiology and Evidence, NSW Ministry of Health.ARM: Artificial Rupture of Membranes.† May include artificial rupture of membranes.‡ This category includes other forms of induction such as Foley’s catheter.
Type of birthFifty-five per cent of births were normal vaginal births in 2017, 11.4% were instrumental and 33.8% were by caesarean section (Table 31). The highest rate of normal vaginal birth was 67.1% among residents of the Northern NSW Local Health District, while the highest rate of instrumental birth was 15.0% among residents of the South Eastern Sydney Local Health District. The caesarean section rate varied from 24.0% among mothers resident in the Northern NSW Local Health District to 39.1% in the Northern Sydney Local Health District.
TABLE 31: TYPE OF BIRTH BY LOCAL HEALTH DISTRICT OF RESIDENCE, NSW 2017
Local Health District
Type of birth
Normal vaginal Forceps Vacuum extraction Vaginal breechElective caesarean
sectionEmergency
caesarean section† Not stated TOTAL
No. % No. % No. % No. % No. % No. % No. % No. %
Sydney 3816 47.7 499 6.2 681 8.5 15 0.2 1904 23.8 1093 13.6 0 0.0 8008 100.0
South Western Sydney 8235 60.8 429 3.2 906 6.7 49 0.4 2503 18.5 1430 10.6 2 0.0 13554 100.0
South Eastern Sydney 5060 47.5 717 6.7 882 8.3 32 0.3 2485 23.3 1464 13.8 4 0.0 10644 100.0
Illawarra Shoalhaven 2464 55.1 208 4.6 295 6.6 12 0.3 884 19.8 612 13.7 0 0.0 4475 100.0
Western Sydney 8123 56.1 725 5.0 883 6.1 80 0.6 2934 20.3 1729 11.9 5 0.0 14479 100.0
Nepean Blue Mountains 2615 53.3 103 2.1 337 6.9 15 0.3 1122 22.9 716 14.6 0 0.0 4908 100.0
Northern Sydney 4754 46.9 699 6.9 694 6.8 29 0.3 2763 27.2 1207 11.9 0 0.0 10146 100.0
Central Coast 2084 54.4 218 5.7 243 6.3 18 0.5 810 21.1 459 12.0 0 0.0 3832 100.0
Hunter New England 5993 56.8 390 3.7 585 5.5 46 0.4 2112 20.0 1408 13.4 9 0.1 10543 100.0
Northern NSW 1696 67.1 82 3.2 127 5.0 13 0.5 350 13.9 257 10.2 1 0.0 2526 100.0
Mid North Coast 1310 60.6 73 3.4 118 5.5 5 0.2 409 18.9 248 11.5 0 0.0 2163 100.0
Southern NSW 844 61.9 56 4.1 75 5.5 3 0.2 202 14.8 180 13.2 3 0.2 1363 100.0
Murrumbidgee 1297 55.3 30 1.3 158 6.7 4 0.2 543 23.2 312 13.3 1 0.0 2345 100.0
Western NSW 2114 59.0 112 3.1 199 5.6 9 0.3 732 20.4 415 11.6 0 0.0 3581 100.0
Far West 125 61.0 7 3.4 9 4.4 0 0.0 37 18.0 27 13.2 0 0.0 205 100.0
Other-not stated 904 53.9 87 5.2 146 8.7 6 0.4 325 19.4 207 12.3 2 0.1 1677 100.0
TOTAL 51434 54.5 4435 4.7 6338 6.7 336 0.4 20115 21.3 11764 12.5 27 0.0 94449 100.0
Source: NSW Perinatal Data Collection (SAPHaRI). Centre for Epidemiology and Evidence, NSW Ministry of Health.† Emergency caesarean section includes caesarean sections where the onset of labour was not stated.
26 | NSW HEALTH | NSW Mothers and Babies 2017

Birth weightIn 2017, 6.7% of babies were low birth weight (less than 2,500 grams). These comprised 0.8% of babies with a birth weight less than 1,000 grams, 0.5% in the 1,000 to 1,499 gram range and 5.3% in the 1,500 to 2,499 gram range (Table 32). Rates of low birth weight ranged from 3.1% in the Southern NSW Local Health District to 7.6% in the Mid North Coast Local Health District.
TABLE 32: BIRTH WEIGHT BY LOCAL HEALTH DISTRICT OF RESIDENCE, NSW 2017
Local Health District
Birth weight (grams)
Less than 500
500–999 1,000–1,499 1,500–1,999 2,000–2,499 2,500–2,999 3,000–3,499 3,500–3,999 4,000–4,499 4,500+ Not stated TOTAL
No. % No. % No. % No. % No. % No. % No. % No. % No. % No. % No. % No. %
Sydney 30 0.4 32 0.4 46 0.6 92 1.1 379 4.7 1572 19.4 3222 39.7 2160 26.6 517 6.4 64 0.8 1 0.0 8115 100.0
South Western Sydney 52 0.4 64 0.5 76 0.6 172 1.2 621 4.5 2421 17.5 5312 38.5 3899 28.3 1036 7.5 133 1.0 11 0.1 13797 100.0
South Eastern Sydney 53 0.5 40 0.4 46 0.4 137 1.3 424 3.9 1830 16.9 4347 40.2 3062 28.3 749 6.9 117 1.1 4 0.0 10809 100.0
Illawarra Shoalhaven 11 0.2 17 0.4 16 0.4 58 1.3 173 3.8 683 15.0 1667 36.7 1441 31.7 417 9.2 58 1.3 0 0.0 4541 100.0
Western Sydney 66 0.4 85 0.6 81 0.6 206 1.4 623 4.2 2827 19.2 5747 39.1 3888 26.5 1014 6.9 147 1.0 6 0.0 14690 100.0
Nepean Blue Mountains 17 0.3 25 0.5 28 0.6 89 1.8 203 4.1 804 16.1 1816 36.4 1480 29.7 456 9.1 60 1.2 6 0.1 4984 100.0
Northern Sydney 23 0.2 36 0.4 45 0.4 69 0.7 380 3.7 1683 16.4 4099 39.9 3070 29.9 779 7.6 96 0.9 2 0.0 10282 100.0
Central Coast 10 0.3 25 0.6 20 0.5 45 1.2 141 3.6 568 14.6 1314 33.8 1255 32.3 441 11.3 70 1.8 1 0.0 3890 100.0
Hunter New England 39 0.4 72 0.7 76 0.7 135 1.3 469 4.4 1544 14.4 3688 34.5 3435 32.1 1087 10.2 151 1.4 7 0.1 10703 100.0
Northern NSW 15 0.6 10 0.4 3 0.1 27 1.1 91 3.6 367 14.4 870 34.1 817 32.0 302 11.8 48 1.9 3 0.1 2553 100.0
Mid North Coast 9 0.4 20 0.9 15 0.7 19 0.9 104 4.8 297 13.6 797 36.4 667 30.5 218 10.0 41 1.9 0 0.0 2187 100.0
Southern NSW 1 0.1 3 0.2 0 0.0 1 0.1 38 2.8 181 13.2 492 35.9 475 34.7 156 11.4 20 1.5 3 0.2 1370 100.0
Murrumbidgee 3 0.1 2 0.1 10 0.4 22 0.9 102 4.3 354 14.9 849 35.8 733 30.9 254 10.7 40 1.7 1 0.0 2370 100.0
Western NSW 9 0.2 15 0.4 27 0.7 65 1.8 137 3.8 527 14.5 1332 36.7 1109 30.5 370 10.2 41 1.1 0 0.0 3632 100.0
Far West 0 0.0 1 0.5 0 0.0 2 1.0 8 3.9 28 13.5 72 34.8 75 36.2 19 9.2 2 1.0 0 0.0 207 100.0
Other-not stated 3 0.2 8 0.5 14 0.8 15 0.9 59 3.5 325 19.2 639 37.7 485 28.6 127 7.5 18 1.1 2 0.1 1695 100.0
TOTAL 341 0.4 455 0.5 503 0.5 1154 1.2 3952 4.1 16011 16.7 36263 37.8 28051 29.3 7942 8.3 1106 1.2 47 0.0 95825 100.0
Source: NSW Perinatal Data Collection (SAPHaRI). Centre for Epidemiology and Evidence, NSW Ministry of Health.
Gestational ageThe majority of births (91.6%) were at term, and 0.9% were post-term (42-plus weeks). The 7.4% of preterm births comprised 0.7% born at less than 28 weeks, 0.7% at 28–31 weeks, and 6.0% at 32–36 weeks. The highest rate of preterm birth was 8.9% in the Nepean Blue Mountains Local Health District, while the lowest was 4.0% in the Southern NSW Local Health District (Table 33).
TABLE 33: GESTATIONAL AGE BY LOCAL HEALTH DISTRICT OF RESIDENCE, NSW 2017
Local Health District
Gestational age (weeks)
< 28 28–31 32–36 37–41 42 + Not stated TOTAL
No. % No. % No. % No. % No. % No. % No. %
Sydney 53 0.7 65 0.8 524 6.5 7450 91.8 20 0.2 3 0.0 8115 100.0
South Western Sydney 99 0.7 96 0.7 932 6.8 12622 91.5 33 0.2 15 0.1 13797 100.0
South Eastern Sydney 80 0.7 61 0.6 559 5.2 10011 92.6 91 0.8 7 0.1 10809 100.0
Illawarra Shoalhaven 25 0.6 20 0.4 289 6.4 4140 91.2 67 1.5 0 0.0 4541 100.0
Western Sydney 141 1.0 105 0.7 759 5.2 13570 92.4 114 0.8 1 0.0 14690 100.0
Nepean Blue Mountains 30 0.6 47 0.9 364 7.3 4510 90.5 28 0.6 5 0.1 4984 100.0
Northern Sydney 56 0.5 49 0.5 537 5.2 9562 93.0 77 0.7 1 0.0 10282 100.0
Central Coast 29 0.7 25 0.6 248 6.4 3492 89.8 91 2.3 5 0.1 3890 100.0
Hunter New England 113 1.1 99 0.9 711 6.6 9615 89.8 160 1.5 5 0.0 10703 100.0
Northern NSW 15 0.6 8 0.3 152 6.0 2296 89.9 76 3.0 6 0.2 2553 100.0
Mid North Coast 26 1.2 20 0.9 121 5.5 1988 90.9 29 1.3 3 0.1 2187 100.0
Southern NSW 3 0.2 2 0.1 50 3.6 1290 94.2 23 1.7 2 0.1 1370 100.0
Murrumbidgee 3 0.1 7 0.3 180 7.6 2147 90.6 31 1.3 2 0.1 2370 100.0
Western NSW 27 0.7 24 0.7 240 6.6 3304 91.0 33 0.9 4 0.1 3632 100.0
Far West 1 0.5 1 0.5 7 3.4 198 95.7 0 0.0 0 0.0 207 100.0
Other-not stated 12 0.7 13 0.8 81 4.8 1573 92.8 12 0.7 4 0.2 1695 100.0
TOTAL 713 0.7 642 0.7 5754 6.0 87768 91.6 885 0.9 63 0.1 95825 100.0
Source: NSW Perinatal Data Collection (SAPHaRI). Centre for Epidemiology and Evidence, NSW Ministry of Health.
NSW HEALTH | NSW Mothers and Babies 2017 | 27

Hepatitis BNinety-four per cent of babies born in NSW in 2017 were given a hepatitis B vaccination at birth. The highest rate of hepatitis B vaccinations at birth was 97.1% in the Far West Local Health District, while the lowest was 79.8% in the Northern NSW Local Health District (Table 34).
TABLE 34: HEPATITIS B DOSE GIVEN TO LIVEBORN BABIES, NSW 2017
Local Health District
Hepatitis B dose given
No Yes Not stated TOTAL
No. % No. % No. % No. %
Sydney 439 5.4 7582 93.9 54 0.7 8075 100.0
South Western Sydney 336 2.5 12604 92.1 751 5.5 13691 100.0
South Eastern Sydney 934 8.7 9790 91.1 20 0.2 10744 100.0
Illawarra Shoalhaven 213 4.7 4303 95.2 3 0.1 4519 100.0
Western Sydney 529 3.6 14018 96.1 42 0.3 14589 100.0
Nepean Blue Mountains 229 4.6 4710 95.0 19 0.4 4958 100.0
Northern Sydney 732 7.1 9504 92.8 2 0.0 10238 100.0
Central Coast 224 5.8 3621 93.9 10 0.3 3855 100.0
Hunter New England 479 4.5 10136 95.4 12 0.1 10627 100.0
Northern NSW 512 20.1 2028 79.8 2 0.1 2542 100.0
Mid North Coast 204 9.4 1964 90.6 0 0.0 2168 100.0
Southern NSW 81 5.9 1281 93.8 4 0.3 1366 100.0
Murrumbidgee 74 3.1 2283 96.8 1 0.0 2358 100.0
Western NSW 105 2.9 3502 97.0 4 0.1 3611 100.0
Far West 6 2.9 199 97.1 0 0.0 205 100.0
Other-not stated 123 7.3 1545 91.5 20 1.2 1688 100.0
TOTAL 5220 5.5 89070 93.5 944 1.0 95234 100.0
Source: NSW Perinatal Data Collection (SAPHaRI). Centre for Epidemiology and Evidence, NSW Ministry of Health.
Infant feedingIn 2017, infant feeding on discharge from hospital was reported for 92,186 liveborn babies (Table 35). The majority of babies (73.7%) were reported to be fully breastfed, 8.3% were receiving infant formula only, and a further 14.7% were being partially breastfed. Rates of full breastfeeding varied from 59.7% in the South Western Sydney Local Health District to 86.3% in the Northern NSW Local Health District.
TABLE 35: LIVE BIRTHS BY INFANT FEEDING ON DISCHARGE AND LOCAL HEALTH DISTRICT OF RESIDENCE, NSW 2017
Local Health District
Infant feeding
Full breastfeeding Any breastfeeding Infant formula only Not stated TOTAL
No. % No. % No. % No. % No. %
Sydney 6002 74.3 1636 20.3 310 3.8 127 1.6 8075 100.0
South Western Sydney 8167 59.7 3004 21.9 1564 11.4 956 7.0 13691 100.0
South Eastern Sydney 8364 77.8 1743 16.2 443 4.1 194 1.8 10744 100.0
Illawarra Shoalhaven 3468 76.7 350 7.7 605 13.4 96 2.1 4519 100.0
Western Sydney 10591 72.6 2317 15.9 1174 8.0 507 3.5 14589 100.0
Nepean Blue Mountains 3621 73.0 549 11.1 581 11.7 207 4.2 4958 100.0
Northern Sydney 7959 77.7 1701 16.6 322 3.1 256 2.5 10238 100.0
Central Coast 3024 78.4 400 10.4 342 8.9 89 2.3 3855 100.0
Hunter New England 7989 75.2 1127 10.6 1190 11.2 321 3.0 10627 100.0
Northern NSW 2193 86.3 158 6.2 138 5.4 53 2.1 2542 100.0
Mid North Coast 1788 82.5 188 8.7 164 7.6 28 1.3 2168 100.0
Southern NSW 1124 82.3 93 6.8 106 7.8 43 3.1 1366 100.0
Murrumbidgee 1759 74.6 206 8.7 360 15.3 33 1.4 2358 100.0
Western NSW 2738 75.8 278 7.7 515 14.3 80 2.2 3611 100.0
Far West 166 81.0 8 3.9 27 13.2 4 2.0 205 100.0
Other-not stated 1281 75.9 273 16.2 80 4.7 54 3.2 1688 100.0
TOTAL 70234 73.7 14031 14.7 7921 8.3 3048 3.2 95234 100.0
Source: NSW Perinatal Data Collection (SAPHaRI). Centre for Epidemiology and Evidence, NSW Ministry of Health.
28 | NSW HEALTH | NSW Mothers and Babies 2017

Perinatal mortalityThe perinatal mortality rate in 2017 was 8.4 per 1,000 births. This rate includes all live births, and stillbirths of at least 400 grams birth weight or at least 20 weeks gestation (Table 36). The perinatal mortality rate varied from 3.6 per 1,000 births in the Southern NSW Local Health District to 11.6 per 1,000 births in the Central Coast Local Health District.
TABLE 36: PERINATAL OUTCOMES BY LOCAL HEALTH DISTRICT OF RESIDENCE, NSW 2017#
Local Health DistrictLiveborn surviving Stillborn Neonatal death Death–age not stated Not stated Total births
Perinatal death rate/1,000 births†
No. % No. % No. % No. % No. % No. % No.
Sydney 8059 99.3 40 0.5 16 0.2 0 0.0 0 0.0 8115 100.0 6.9
South Western Sydney 13669 99.1 106 0.8 22 0.2 0 0.0 0 0.0 13797 100.0 9.3
South Eastern Sydney 10723 99.2 65 0.6 21 0.2 0 0.0 0 0.0 10809 100.0 8.0
Illawarra Shoalhaven 4513 99.4 22 0.5 6 0.1 0 0.0 0 0.0 4541 100.0 6.2
Western Sydney 14543 99.0 101 0.7 46 0.3 0 0.0 0 0.0 14690 100.0 10.0
Nepean Blue Mountains 4945 99.2 26 0.5 13 0.3 0 0.0 0 0.0 4984 100.0 7.8
Northern Sydney 10217 99.4 44 0.4 21 0.2 0 0.0 0 0.0 10282 100.0 6.3
Central Coast 3845 98.8 35 0.9 10 0.3 0 0.0 0 0.0 3890 100.0 11.6
Hunter New England 10592 99.0 76 0.7 35 0.3 0 0.0 0 0.0 10703 100.0 10.4
Northern NSW 2537 99.4 11 0.4 5 0.2 0 0.0 0 0.0 2553 100.0 6.3
Mid North Coast 2163 98.9 19 0.9 5 0.2 0 0.0 0 0.0 2187 100.0 11.0
Southern NSW 1365 99.6 4 0.3 1 0.1 0 0.0 0 0.0 1370 100.0 3.6
Murrumbidgee 2358 99.5 12 0.5 0 0.0 0 0.0 0 0.0 2370 100.0 5.1
Western NSW 3603 99.2 21 0.6 8 0.2 0 0.0 0 0.0 3632 100.0 8.0
Far West 205 99.0 2 1.0 0 0.0 0 0.0 0 0.0 207 100.0 9.7
Other-not stated 1686 99.5 7 0.4 2 0.1 0 0.0 0 0.0 1695 100.0 384.0
TOTAL 95023 99.2 591 0.6 211 0.2 0 0.0 0 0.0 95825 100.0 8.4
Source: NSW Perinatal Data Collection (SAPHaRI). Centre for Epidemiology and Evidence, NSW Ministry of Health.# Perinatal deaths include deaths reported to the PDC only. As the PDC electronic form is completed at discharge or transfer of the baby, deaths occurring after this time may not be reported to the PDC.† The perinatal death rate excludes deaths where the age at death was not stated.
NSW HEALTH | NSW Mothers and Babies 2017 | 29

Live births by statistical area of residence
Local Health District–Statistical Area 3† No. %
Sydney Bankstown* 23 0.3
Canada Bay 1187 14.7
Canterbury* 2052 25.4
Hurstville* 121 1.5
Leichhardt 832 10.3
Marrickville–Sydenham– Petersham
661 8.2
Strathfield–Burwood–Ashfield 1711 21.2
Sydney Inner City* 1488 18.4
TOTAL 8075 100.0
South Western Sydney Auburn* 9 0.1
Bankstown* 2500 18.3
Bringelly–Green Valley 1840 13.4
Camden 1019 7.4
Campbelltown 2461 18.0
Canterbury* 133 1.0
Fairfield* 2150 15.7
Liverpool* 2009 14.7
Merrylands–Guildford* 458 3.3
Penrith* 79 0.6
Southern Highlands 432 3.2
Wollondilly 595 4.3
TOTAL 13691 100.0
South Eastern Sydney Botany 665 6.2
Cronulla–Miranda–Caringbah 1290 12.0
Eastern Suburbs–North 1814 16.9
Eastern Suburbs–South 1735 16.1
Hurstville* 1343 12.5
Kogarah–Rockdale 2033 18.9
Liverpool* 4 0.0
Sutherland–Menai–Heathcote 1224 11.4
Sydney Inner City* 631 5.9
TOTAL 10744 100.0
Illawarra Shoalhaven Dapto–Port Kembla 1020 22.6
Kiama–Shellharbour 1047 23.2
Shoalhaven 998 22.1
Wollongong 1451 32.1
TOTAL 4519 100.0
Western Sydney Auburn* 1734 11.9
Baulkham Hills* 1138 7.8
Blacktown 2197 15.1
Blacktown–North 1573 10.8
Carlingford* 673 4.6
Dural–Wisemans Ferry* 80 0.5
Merrylands–Guildford* 2291 15.7
Mount Druitt 1984 13.6
Parramatta 2444 16.8
Pennant Hills–Epping* 119 0.8
Rouse Hill–McGraths Hill* 309 2.1
Ryde–Hunters Hill* 35 0.2
TOTAL 14589 100.0
Local Health District–Statistical Area 3† No. %
Nepean Blue Mountains Blue Mountains 755 15.2
Dural–Wisemans Ferry* 6 0.1
Fairfield* 13 0.3
Hawkesbury 261 5.3
Lithgow–Mudgee* 200 4.0
Penrith* 2147 43.3
Richmond–Windsor 511 10.3
Rouse Hill–McGraths Hill* 159 3.2
St Marys 904 18.2
TOTAL 4958 100.0
Northern Sydney Baulkham Hills* 156 1.5
Carlingford* 70 0.7
Chatswood–Lane Cove 1452 14.2
Dural–Wisemans Ferry* 124 1.2
Hornsby 1081 10.6
Ku-ring-gai 979 9.6
Manly 559 5.5
North Sydney–Mosman 1293 12.6
Pennant Hills–Epping* 313 3.1
Pittwater 629 6.1
Ryde–Hunters Hill* 1642 16.0
Warringah 1936 18.9
TOTAL 10238 100.0
Central Coast Gosford 1836 47.6
Wyong 2019 52.4
TOTAL 3855 100.0
Hunter New England Armidale 403 3.8
Great Lakes 229 2.2
Inverell–Tenterfield* 364 3.4
Kempsey–Nambucca 2 0.0
Lake Macquarie–East 1395 13.1
Lake Macquarie–West 936 8.8
Lower Hunter 1174 11.0
Maitland 1087 10.2
Moree–Narrabri 352 3.3
Newcastle 1994 18.8
Port Stephens 705 6.6
Tamworth–Gunnedah 1063 10.0
Taree–Gloucester 507 4.8
Upper Hunter 404 3.8
TOTAL 10627 100.0
Northern NSW Clarence Valley 482 19.0
Coffs Harbour* 5 0.2
Richmond Valley–Coastal 623 24.5
Richmond Valley–Hinterland 740 29.1
Tweed Valley 691 27.2
TOTAL 2542 100.0
Mid North Coast Coffs Harbour* 925 42.7
Kempsey–Nambucca 556 25.6
Port Macquarie 680 31.4
TOTAL 2168 100.0
TABLE 37: LIVE BIRTHS BY LOCAL HEALTH DISTRICT AND STATISTICAL AREA OF RESIDENCE, NSW 2017#
(Continued on next page)
30 | NSW HEALTH | NSW Mothers and Babies 2017

Local Health District–Statistical Area 3† No. %
Southern NSW Goulburn–Yass* 321 23.5
Queanbeyan 380 27.8
Snowy Mountains 137 10.0
South Coast* 528 38.7
TOTAL 1366 100.0
Murrumbidgee Albury 13 0.6
Goulburn–Yass* 167 7.1
Griffith–Murrumbidgee (West) 669 28.4
Lachlan Valley* 64 2.7
Lower Murray* 38 1.6
Tumut–Tumbarumba 136 5.8
Upper Murray excluding Albury 92 3.9
Wagga Wagga 1179 50.0
TOTAL 2358 100.0
Western NSW Bathurst 572 15.8
Bourke–Cobar–Coonamble 312 8.6
Dubbo 1014 28.1
Lachlan Valley* 620 17.2
Lithgow–Mudgee* 321 8.9
Orange 762 21.1
TOTAL 3611 100.0
Far West Broken Hill and Far West 205 100.0
TOTAL 205 100.0
Other-not stated 767 100.0
TOTAL 95234 100.0
Source: NSW Perinatal Data Collection (SAPHaRI). Centre for Epidemiology and Evidence, NSW Ministry of Health.# Statistical Area assigned according to the Australian Bureau of Statistics Australian Statistical Geographical Standard, 2011 (Cat No. 1270.0.55.001).* Geographical boundaries of Statistical Area Level 3 (SA3) occur within two Local Health Districts.† Totals include live births where Statistical Area was unknown.
TABLE 37: (Continued)
NSW HEALTH | NSW Mothers and Babies 2017 | 31

Onset and augmentation of labour Table 38 shows onset or augmentation of labour for local health districts, and Table 39 for individual hospitals by peer group where at least 200 mothers gave birth in 2017.
6. NSW HOSPITALS
TABLE 38: ONSET AND AUGMENTATION OF LABOUR BY LOCAL HEALTH DISTRICT OF HOSPITAL, NSW 2017
Local Health District
Onset and augmentation of labour
SpontaneousSpontaneous augmented with ARM
Spontaneous augmented
with oxytocics†
No labourInduced – oxytocics/
prostaglandins
Induced – ARM only
Induced – ARM + oxytocics/
prostaglandins
Induced – other‡ Not stated TOTAL
No. % No. % No. % No. % No. % No. % No. % No. % No. % No. %
Sydney 1884 27.5 488 7.1 805 11.7 1289 18.8 1165 17.0 361 5.3 835 12.2 31 0.5 0 0.0 6858 100.0
South Western Sydney 4092 37.2 911 8.3 978 8.9 1747 15.9 1551 14.1 761 6.9 875 8.0 72 0.7 0 0.0 10987 100.0
South Eastern Sydney 2644 35.0 447 5.9 673 8.9 1190 15.8 911 12.1 162 2.1 1509 20.0 11 0.1 2 0.0 7549 100.0
Illawarra Shoalhaven 1210 36.2 189 5.7 227 6.8 554 16.6 350 10.5 78 2.3 723 21.7 7 0.2 0 0.0 3338 100.0
Western Sydney 3771 36.7 636 6.2 874 8.5 1723 16.8 892 8.7 132 1.3 2224 21.6 25 0.2 0 0.0 10277 100.0
Nepean Blue Mountains 1808 35.6 256 5.0 216 4.3 1098 21.6 539 10.6 85 1.7 1072 21.1 6 0.1 0 0.0 5080 100.0
Northern Sydney 2043 35.8 273 4.8 529 9.3 1081 18.9 784 13.7 86 1.5 910 15.9 7 0.1 0 0.0 5713 100.0
Central Coast 1146 39.0 142 4.8 237 8.1 484 16.5 401 13.7 28 1.0 494 16.8 4 0.1 0 0.0 2936 100.0
Hunter New England 3327 37.9 302 3.4 448 5.1 1547 17.6 981 11.2 184 2.1 1953 22.3 17 0.2 8 0.1 8767 100.0
Northern NSW 1211 42.7 144 5.1 191 6.7 379 13.4 330 11.6 73 2.6 505 17.8 3 0.1 0 0.0 2836 100.0
Mid North Coast 891 40.9 89 4.1 116 5.3 400 18.3 235 10.8 45 2.1 402 18.4 2 0.1 0 0.0 2180 100.0
Southern NSW 679 46.5 63 4.3 106 7.3 210 14.4 137 9.4 28 1.9 229 15.7 1 0.1 7 0.5 1460 100.0
Murrumbidgee 842 40.9 102 5.0 114 5.5 393 19.1 191 9.3 58 2.8 357 17.3 2 0.1 1 0.0 2060 100.0
Western NSW 1186 35.8 157 4.7 213 6.4 644 19.4 369 11.1 70 2.1 665 20.1 9 0.3 0 0.0 3313 100.0
Far West 74 36.5 16 7.9 19 9.4 34 16.7 25 12.3 1 0.5 34 16.7 0 0.0 0 0.0 203 100.0
Private Hospitals 4503 21.7 1070 5.1 1313 6.3 7358 35.4 1611 7.8 644 3.1 4170 20.1 69 0.3 46 0.2 20784 100.0
TOTAL* 31411 33.3 5286 5.6 7060 7.5 20132 21.3 10473 11.1 2797 3.0 16957 18.0 266 0.3 67 0.1 94449 100.0
Source: NSW Perinatal Data Collection (SAPHaRI). Centre for Epidemiology and Evidence, NSW Ministry of Health.ARM: Artificial Rupture of Membranes.† May include artificial rupture of membranes.‡ This category includes other forms of induction such as Foley’s catheter.* Total includes births at home assisted by independent midwives.
TABLE 39: ONSET AND AUGMENTATION OF LABOUR BY HOSPITAL AND PEER GROUP, NSW 2017#
Peer Group–hospital
Onset and augmentation of labour
SpontaneousSpontaneous augmented with ARM
Spontaneous augmented
with oxytocics†
No labourInduced – oxytocics/
prostaglandins
Induced – ARM only
Induced – ARM + oxytocics/
prostaglandins
Induced – other‡ Not stated TOTAL
No. % No. % No. % No. % No. % No. % No. % No. % No. % No. %
Peer Group A
Royal Prince Alfred 1399 27.7 336 6.7 622 12.3 993 19.7 758 15.0 272 5.4 643 12.7 25 0.5 0 0.0 5048 100.0
Gosford 1056 37.2 134 4.7 236 8.3 484 17.1 401 14.1 28 1.0 494 17.4 4 0.1 0 0.0 2837 100.0
Royal North Shore 872 31.8 121 4.4 241 8.8 605 22.1 360 13.1 36 1.3 507 18.5 1 0.0 0 0.0 2743 100.0
St. George 730 30.0 154 6.3 245 10.1 333 13.7 312 12.8 65 2.7 591 24.3 3 0.1 2 0.1 2435 100.0
Royal Hospital for Women
1456 37.8 212 5.5 276 7.2 650 16.9 477 12.4 78 2.0 693 18.0 8 0.2 0 0.0 3850 100.0
Liverpool 1281 36.3 339 9.6 306 8.7 601 17.0 510 14.5 174 4.9 279 7.9 38 1.1 0 0.0 3528 100.0
Nepean 1341 33.8 199 5.0 176 4.4 896 22.6 428 10.8 67 1.7 858 21.6 6 0.2 0 0.0 3971 100.0
Westmead 2020 35.2 356 6.2 514 9.0 1040 18.1 472 8.2 89 1.6 1235 21.5 10 0.2 0 0.0 5736 100.0
Bankstown-Lidcombe 696 37.6 159 8.6 187 10.1 278 15.0 256 13.8 122 6.6 139 7.5 14 0.8 0 0.0 1851 100.0
Wollongong 889 35.9 146 5.9 160 6.5 401 16.2 254 10.2 58 2.3 564 22.8 7 0.3 0 0.0 2479 100.0
John Hunter 1365 33.7 138 3.4 202 5.0 792 19.5 522 12.9 84 2.1 937 23.1 11 0.3 4 0.1 4055 100.0
TOTAL 13105 34.0 2294 6.0 3165 8.2 7073 18.4 4750 12.3 1073 2.8 6940 18.0 127 0.3 6 0.0 38533 100.0
Peer Group B
Canterbury 485 26.8 152 8.4 183 10.1 296 16.4 407 22.5 89 4.9 192 10.6 6 0.3 0 0.0 1810 100.0
Hornsby 462 37.6 77 6.3 125 10.2 204 16.6 188 15.3 19 1.5 150 12.2 5 0.4 0 0.0 1230 100.0
Manly 304 34.0 31 3.5 95 10.6 146 16.3 138 15.4 19 2.1 160 17.9 1 0.1 0 0.0 894 100.0
Mona Vale 310 41.6 39 5.2 68 9.1 126 16.9 98 13.1 12 1.6 93 12.5 0 0.0 0 0.0 746 100.0
Sutherland 458 36.2 81 6.4 152 12.0 207 16.4 122 9.7 19 1.5 225 17.8 0 0.0 0 0.0 1264 100.0
Auburn 555 42.4 67 5.1 108 8.2 165 12.6 144 11.0 8 0.6 260 19.8 3 0.2 0 0.0 1310 100.0
Blacktown 1196 37.0 213 6.6 252 7.8 518 16.0 276 8.5 35 1.1 729 22.6 12 0.4 0 0.0 3231 100.0
Fairfield 575 34.2 172 10.2 176 10.5 266 15.8 232 13.8 111 6.6 144 8.6 3 0.2 0 0.0 1679 100.0
(Continued on next page)
32 | NSW HEALTH | NSW Mothers and Babies 2017

TABLE 39: (Continued)
Peer Group–hospital
Onset and augmentation of labour
SpontaneousSpontaneous augmented with ARM
Spontaneous augmented
with oxytocics†
No labourInduced - oxytocics/
prostaglandins
Induced - ARM only
Induced - ARM + oxytocics/
prostaglandins
Induced - other‡ Not stated TOTAL
No. % No. % No. % No. % No. % No. % No. % No. % No. % No. %
Campbelltown 1389 39.4 189 5.4 269 7.6 537 15.2 512 14.5 329 9.3 282 8.0 17 0.5 0 0.0 3524 100.0
Coffs Harbour 415 37.6 46 4.2 68 6.2 234 21.2 108 9.8 27 2.4 206 18.7 0 0.0 0 0.0 1104 100.0
Lismore Base 502 41.9 76 6.3 70 5.8 165 13.8 151 12.6 32 2.7 203 16.9 0 0.0 0 0.0 1199 100.0
Tweed Heads 397 36.4 43 3.9 101 9.3 141 12.9 130 11.9 32 2.9 245 22.5 1 0.1 0 0.0 1090 100.0
Port Macquarie Base 264 35.4 28 3.8 39 5.2 136 18.2 90 12.1 9 1.2 179 24.0 1 0.1 0 0.0 746 100.0
Tamworth Base 330 33.5 42 4.3 47 4.8 197 20.0 102 10.3 11 1.1 254 25.8 2 0.2 1 0.1 986 100.0
Manning Base 237 38.2 22 3.5 28 4.5 82 13.2 36 5.8 27 4.4 185 29.8 3 0.5 0 0.0 620 100.0
Dubbo Base 384 31.6 42 3.5 103 8.5 226 18.6 172 14.2 22 1.8 263 21.6 3 0.2 0 0.0 1215 100.0
Orange Base 259 27.6 41 4.4 61 6.5 217 23.1 85 9.0 27 2.9 245 26.1 5 0.5 0 0.0 940 100.0
Shoalhaven 320 37.3 43 5.0 67 7.8 153 17.8 96 11.2 20 2.3 159 18.5 0 0.0 0 0.0 858 100.0
Maitland 570 38.1 31 2.1 97 6.5 235 15.7 185 12.4 27 1.8 348 23.3 1 0.1 2 0.1 1496 100.0
Wagga Wagga Base 349 33.0 47 4.4 65 6.1 249 23.5 101 9.5 23 2.2 225 21.2 0 0.0 0 0.0 1059 100.0
Other hospitals 90 90.9 8 8.1 1 1.0 0 0.0 0 0.0 0 0.0 0 0.0 0 0.0 0 0.0 99 100.0
TOTAL 9851 36.4 1490 5.5 2175 8.0 4500 16.6 3373 12.4 898 3.3 4747 17.5 63 0.2 3 0.0 27100 100.0
Peer Group C
Blue Mountains 129 57.6 8 3.6 6 2.7 35 15.6 20 8.9 2 0.9 24 10.7 0 0.0 0 0.0 224 100.0
Hawkesbury 274 38.8 36 5.1 28 4.0 142 20.1 61 8.6 11 1.6 154 21.8 0 0.0 0 0.0 706 100.0
Grafton Base 146 38.7 21 5.6 20 5.3 73 19.4 49 13.0 9 2.4 57 15.1 2 0.5 0 0.0 377 100.0
Kempsey 144 55.0 15 5.7 9 3.4 30 11.5 37 14.1 9 3.4 17 6.5 1 0.4 0 0.0 262 100.0
Armidale 186 44.5 8 1.9 29 6.9 73 17.5 52 12.4 6 1.4 64 15.3 0 0.0 0 0.0 418 100.0
Inverell 64 28.2 11 4.8 25 11.0 55 24.2 19 8.4 2 0.9 51 22.5 0 0.0 0 0.0 227 100.0
Mudgee 109 47.2 15 6.5 8 3.5 39 16.9 20 8.7 4 1.7 36 15.6 0 0.0 0 0.0 231 100.0
Bathurst Base 241 48.6 22 4.4 17 3.4 84 16.9 58 11.7 7 1.4 66 13.3 1 0.2 0 0.0 496 100.0
Bega 108 43.0 2 0.8 10 4.0 43 17.1 35 13.9 2 0.8 50 19.9 0 0.0 1 0.4 251 100.0
Goulburn Base 140 51.5 18 6.6 34 12.5 45 16.5 18 6.6 4 1.5 13 4.8 0 0.0 0 0.0 272 100.0
Moruya 161 54.9 11 3.8 10 3.4 38 13.0 25 8.5 8 2.7 39 13.3 0 0.0 1 0.3 293 100.0
Queanbeyan 201 38.9 26 5.0 48 9.3 71 13.7 53 10.3 8 1.5 106 20.5 1 0.2 3 0.6 517 100.0
Bowral 151 37.3 52 12.8 40 9.9 65 16.0 41 10.1 25 6.2 31 7.7 0 0.0 0 0.0 405 100.0
Griffith Base 255 47.2 23 4.3 31 5.7 78 14.4 55 10.2 18 3.3 78 14.4 2 0.4 0 0.0 540 100.0
Broken Hill Base 74 36.5 16 7.9 19 9.4 34 16.7 25 12.3 1 0.5 34 16.7 0 0.0 0 0.0 203 100.0
Other hospitals 1220 59.4 117 5.7 59 2.9 215 10.5 136 6.6 56 2.7 248 12.1 0 0.0 3 0.1 2054 100.0
TOTAL 3603 48.2 401 5.4 393 5.3 1120 15.0 704 9.4 172 2.3 1068 14.3 7 0.1 8 0.1 7476 100.0
Peer Group D
TOTAL 248 55.5 30 6.7 13 2.9 80 17.9 34 7.6 9 2.0 32 7.2 0 0.0 1 0.2 447 100.0
Private
Mater, North Sydney 437 20.4 107 5.0 216 10.1 875 40.9 100 4.7 54 2.5 351 16.4 0 0.0 0 0.0 2140 100.0
North Shore Private 681 27.9 0 0.0 180 7.4 999 41.0 153 6.3 82 3.4 327 13.4 15 0.6 0 0.0 2437 100.0
Sydney Adventist 369 19.8 189 10.1 222 11.9 588 31.5 98 5.2 39 2.1 344 18.4 18 1.0 0 0.0 1867 100.0
North Gosford Private 67 10.0 40 6.0 61 9.1 234 35.1 47 7.0 16 2.4 199 29.8 2 0.3 1 0.1 667 100.0
Hurstville Community 142 24.3 51 8.7 77 13.2 146 25.0 38 6.5 5 0.9 121 20.7 2 0.3 3 0.5 585 100.0
Kareena Private 166 23.4 0 0.0 77 10.9 255 36.0 32 4.5 13 1.8 162 22.8 4 0.6 0 0.0 709 100.0
St. George Private 343 23.5 0 0.0 152 10.4 494 33.8 216 14.8 82 5.6 168 11.5 6 0.4 0 0.0 1461 100.0
Prince of Wales Private 445 20.5 173 8.0 0 0.0 962 44.2 161 7.4 71 3.3 346 15.9 1 0.0 17 0.8 2176 100.0
Norwest Private 345 18.1 232 12.1 0 0.0 550 28.8 142 7.4 38 2.0 590 30.9 4 0.2 10 0.5 1911 100.0
Sydney Southwest Private
204 22.7 92 10.2 0 0.0 272 30.3 122 13.6 15 1.7 187 20.8 0 0.0 6 0.7 898 100.0
Nepean Private 111 15.3 37 5.1 0 0.0 232 32.0 76 10.5 39 5.4 219 30.2 1 0.1 9 1.2 724 100.0
Westmead Private 527 25.2 0 0.0 237 11.3 698 33.4 177 8.5 11 0.5 437 20.9 4 0.2 0 0.0 2091 100.0
Wollongong Private 231 24.6 0 0.0 82 8.7 273 29.0 46 4.9 21 2.2 287 30.5 0 0.0 0 0.0 940 100.0
Newcastle Private 363 19.9 145 8.0 0 0.0 602 33.0 161 8.8 150 8.2 393 21.6 9 0.5 0 0.0 1823 100.0
Calvary, Wagga Wagga 72 21.8 4 1.2 9 2.7 154 46.5 42 12.7 8 2.4 39 11.8 3 0.9 0 0.0 331 100.0
Other hospitals 0 0.0 0 0.0 0 0.0 24 100.0 0 0.0 0 0.0 0 0.0 0 0.0 0 0.0 24 100.0
TOTAL 4503 21.7 1070 5.1 1313 6.3 7358 35.4 1611 7.8 644 3.1 4170 20.1 69 0.3 46 0.2 20784 100.0
TOTAL NSW* 31411 33.3 5286 5.6 7060 7.5 20132 21.3 10473 11.1 2797 3.0 16957 18.0 266 0.3 67 0.1 94449 100.0Source: NSW Perinatal Data Collection (SAPHaRI). Centre for Epidemiology and Evidence, NSW Ministry of Health.ARM: Artificial Rupture of Membranes.# Hospitals with more than 200 births in 2017 are identified individually. Peer group levels are described on page 84 in Appendix 2: Explanatory notes.† May include artificial rupture of membranes.‡ This category includes other forms of induction such as Foley’s catheter.* Total NSW includes births at home assisted by independent midwives.
NSW HEALTH | NSW Mothers and Babies 2017 | 33

Type of birth Table 40 shows type of birth for local health districts, and Table 41 for individual hospitals by peer group where at least 200 mothers gave birth in 2017.
TABLE 40: TYPE OF BIRTH BY LOCAL HEALTH DISTRICT OF HOSPITAL, NSW 2017
Local Health District
Type of birth
Normal vaginal ForcepsVacuum
extractionVaginal breech
Elective caesarean section
Emergency caesarean section† Not stated TOTAL
No. % No. % No. % No. % No. % No. % No. % No. %
Sydney 3544 51.7 489 7.1 587 8.6 15 0.2 1289 18.8 934 13.6 0 0.0 6858 100.0
South Western Sydney 7053 64.2 293 2.7 683 6.2 42 0.4 1745 15.9 1169 10.6 2 0.0 10987 100.0
South Eastern Sydney 3988 52.8 639 8.5 586 7.8 34 0.5 1189 15.8 1112 14.7 1 0.0 7549 100.0
Illawarra Shoalhaven 1961 58.7 188 5.6 162 4.9 8 0.2 554 16.6 465 13.9 0 0.0 3338 100.0
Western Sydney 6160 59.9 528 5.1 577 5.6 86 0.8 1718 16.7 1203 11.7 5 0.0 10277 100.0
Nepean Blue Mountains 2802 55.2 96 1.9 325 6.4 12 0.2 1098 21.6 747 14.7 0 0.0 5080 100.0
Northern Sydney 3087 54.0 537 9.4 305 5.3 24 0.4 1081 18.9 679 11.9 0 0.0 5713 100.0
Central Coast 1766 60.1 184 6.3 158 5.4 14 0.5 484 16.5 330 11.2 0 0.0 2936 100.0
Hunter New England 5239 59.8 341 3.9 385 4.4 47 0.5 1543 17.6 1203 13.7 9 0.1 8767 100.0
Northern NSW 1914 67.5 93 3.3 148 5.2 13 0.5 378 13.3 289 10.2 1 0.0 2836 100.0
Mid North Coast 1334 61.2 77 3.5 118 5.4 3 0.1 400 18.3 248 11.4 0 0.0 2180 100.0
Southern NSW 903 61.8 60 4.1 88 6.0 3 0.2 209 14.3 194 13.3 3 0.2 1460 100.0
Murrumbidgee 1204 58.4 32 1.6 144 7.0 5 0.2 392 19.0 282 13.7 1 0.0 2060 100.0
Western NSW 1990 60.1 107 3.2 183 5.5 6 0.2 644 19.4 383 11.6 0 0.0 3313 100.0
Far West 126 62.1 7 3.4 10 4.9 0 0.0 34 16.7 26 12.8 0 0.0 203 100.0
Private Hospitals 8261 39.7 764 3.7 1879 9.0 23 0.1 7356 35.4 2499 12.0 2 0.0 20784 100.0
TOTAL* 51434 54.5 4435 4.7 6338 6.7 336 0.4 20115 21.3 11764 12.5 27 0.0 94449 100.0
Source: NSW Perinatal Data Collection (SAPHaRI). Centre for Epidemiology and Evidence, NSW Ministry of Health.† Emergency caesarean section includes caesarean sections where the onset of labour was not stated.* Total NSW includes births at home assisted by independent midwives.
TABLE 41: TYPE OF BIRTH BY HOSPITAL AND PEER GROUP, NSW 2017#
Peer Group–hospital
Type of birth
Normal vaginal ForcepsVacuum
extractionVaginal breech
Elective caesarean section
Emergency caesarean section† Not stated TOTAL
No. % No. % No. % No. % No. % No. % No. % No. %
Peer Group A
Royal Prince Alfred 2602 51.5 389 7.7 399 7.9 13 0.3 993 19.7 652 12.9 0 0.0 5048 100.0
Gosford 1667 58.8 184 6.5 158 5.6 14 0.5 484 17.1 330 11.6 0 0.0 2837 100.0
Royal North Shore 1375 50.1 323 11.8 92 3.4 15 0.5 605 22.1 333 12.1 0 0.0 2743 100.0
St. George 1288 52.9 160 6.6 260 10.7 12 0.5 333 13.7 382 15.7 0 0.0 2435 100.0
Royal Hospital for Women
1943 50.5 402 10.4 255 6.6 19 0.5 649 16.9 581 15.1 1 0.0 3850 100.0
Liverpool 2162 61.3 152 4.3 201 5.7 23 0.7 600 17.0 389 11.0 1 0.0 3528 100.0
Nepean 2146 54.0 83 2.1 247 6.2 12 0.3 896 22.6 587 14.8 0 0.0 3971 100.0
Westmead 3316 57.8 347 6.0 317 5.5 71 1.2 1040 18.1 645 11.2 0 0.0 5736 100.0
Bankstown–Lidcombe 1219 65.9 53 2.9 105 5.7 6 0.3 277 15.0 190 10.3 1 0.1 1851 100.0
Wollongong 1441 58.1 152 6.1 120 4.8 7 0.3 401 16.2 358 14.4 0 0.0 2479 100.0
John Hunter 2269 56.0 197 4.9 189 4.7 36 0.9 789 19.5 572 14.1 3 0.1 4055 100.0
TOTAL 21428 55.6 2442 6.3 2343 6.1 228 0.6 7067 18.3 5019 13.0 6 0.0 38533 100.0
Peer Group B
Canterbury 942 52.0 100 5.5 188 10.4 2 0.1 296 16.4 282 15.6 0 0.0 1810 100.0
Hornsby 723 58.8 119 9.7 46 3.7 3 0.2 204 16.6 135 11.0 0 0.0 1230 100.0
Manly 465 52.0 63 7.0 95 10.6 4 0.4 146 16.3 121 13.5 0 0.0 894 100.0
Mona Vale 424 56.8 32 4.3 72 9.7 2 0.3 126 16.9 90 12.1 0 0.0 746 100.0
Sutherland 757 59.9 77 6.1 71 5.6 3 0.2 207 16.4 149 11.8 0 0.0 1264 100.0
Auburn 891 68.0 38 2.9 60 4.6 3 0.2 161 12.3 153 11.7 4 0.3 1310 100.0
Blacktown 1953 60.4 143 4.4 200 6.2 12 0.4 517 16.0 405 12.5 1 0.0 3231 100.0
Fairfield 1136 67.7 24 1.4 88 5.2 3 0.2 266 15.8 162 9.6 0 0.0 1679 100.0
Campbelltown 2310 65.6 37 1.0 267 7.6 7 0.2 537 15.2 366 10.4 0 0.0 3524 100.0
Coffs Harbour 648 58.7 31 2.8 60 5.4 0 0.0 234 21.2 131 11.9 0 0.0 1104 100.0
Lismore Base 806 67.2 47 3.9 59 4.9 11 0.9 165 13.8 111 9.3 0 0.0 1199 100.0
Tweed Heads 706 64.8 41 3.8 72 6.6 2 0.2 141 12.9 128 11.7 0 0.0 1090 100.0
Port Macquarie Base 438 58.7 44 5.9 44 5.9 2 0.3 136 18.2 82 11.0 0 0.0 746 100.0
Tamworth Base 545 55.3 43 4.4 41 4.2 2 0.2 196 19.9 154 15.6 5 0.5 986 100.0
Manning Base 384 61.9 29 4.7 48 7.7 1 0.2 82 13.2 76 12.3 0 0.0 620 100.0
Dubbo Base 738 60.7 61 5.0 59 4.9 1 0.1 226 18.6 130 10.7 0 0.0 1215 100.0
Orange Base 499 53.1 28 3.0 63 6.7 2 0.2 217 23.1 131 13.9 0 0.0 940 100.0
Shoalhaven 519 60.5 36 4.2 42 4.9 1 0.1 153 17.8 107 12.5 0 0.0 858 100.0
Maitland 960 64.2 37 2.5 39 2.6 3 0.2 235 15.7 222 14.8 0 0.0 1496 100.0
(Continued on next page)
34 | NSW HEALTH | NSW Mothers and Babies 2017

TABLE 41: (Continued)
Peer Group–hospital
Type of birth
Normal vaginal ForcepsVacuum
extractionVaginal breech
Elective caesarean section
Emergency caesarean section† Not stated TOTAL
No. % No. % No. % No. % No. % No. % No. % No. %
Wagga Wagga Base 547 51.7 23 2.2 64 6.0 1 0.1 249 23.5 175 16.5 0 0.0 1059 100.0
Other hospitals 99 100.0 0 0.0 0 0.0 0 0.0 0 0.0 0 0.0 0 0.0 99 100.0
TOTAL 16490 60.8 1053 3.9 1678 6.2 65 0.2 4494 16.6 3310 12.2 10 0.0 27100 100.0
Peer Group C
Blue Mountains 148 66.1 0 0.0 14 6.3 0 0.0 35 15.6 27 12.1 0 0.0 224 100.0
Hawkesbury 387 54.8 12 1.7 59 8.4 0 0.0 142 20.1 106 15.0 0 0.0 706 100.0
Grafton Base 232 61.5 5 1.3 17 4.5 0 0.0 72 19.1 50 13.3 1 0.3 377 100.0
Kempsey 184 70.2 2 0.8 10 3.8 1 0.4 30 11.5 35 13.4 0 0.0 262 100.0
Armidale 244 58.4 21 5.0 15 3.6 1 0.2 73 17.5 64 15.3 0 0.0 418 100.0
Inverell 139 61.2 9 4.0 8 3.5 0 0.0 55 24.2 16 7.0 0 0.0 227 100.0
Mudgee 152 65.8 1 0.4 12 5.2 1 0.4 39 16.9 26 11.3 0 0.0 231 100.0
Bathurst Base 315 63.5 16 3.2 26 5.2 1 0.2 84 16.9 54 10.9 0 0.0 496 100.0
Bega 151 60.2 11 4.4 11 4.4 0 0.0 43 17.1 34 13.5 1 0.4 251 100.0
Goulburn Base 170 62.5 12 4.4 11 4.0 1 0.4 45 16.5 33 12.1 0 0.0 272 100.0
Moruya 192 65.5 15 5.1 15 5.1 0 0.0 38 13.0 33 11.3 0 0.0 293 100.0
Queanbeyan 297 57.4 20 3.9 46 8.9 2 0.4 70 13.5 80 15.5 2 0.4 517 100.0
Bowral 226 55.8 27 6.7 22 5.4 3 0.7 65 16.0 62 15.3 0 0.0 405 100.0
Griffith Base 336 62.2 3 0.6 51 9.4 2 0.4 77 14.3 70 13.0 1 0.2 540 100.0
Broken Hill Base 126 62.1 7 3.4 10 4.9 0 0.0 34 16.7 26 12.8 0 0.0 203 100.0
Other hospitals 1545 75.2 13 0.6 98 4.8 7 0.3 215 10.5 175 8.5 1 0.0 2054 100.0
TOTAL 4844 64.8 174 2.3 425 5.7 19 0.3 1117 14.9 891 11.9 6 0.1 7476 100.0
Peer Group D
TOTAL 308 68.9 2 0.4 13 2.9 0 0.0 80 17.9 44 9.8 0 0.0 447 100.0
Private
Mater, North Sydney 708 33.1 59 2.8 208 9.7 0 0.0 875 40.9 290 13.6 0 0.0 2140 100.0
North Shore Private 798 32.7 89 3.7 194 8.0 1 0.0 999 41.0 356 14.6 0 0.0 2437 100.0
Sydney Adventist 860 46.1 83 4.4 139 7.4 1 0.1 588 31.5 196 10.5 0 0.0 1867 100.0
North Gosford Private 229 34.3 23 3.4 73 10.9 1 0.1 234 35.1 107 16.0 0 0.0 667 100.0
Hurstville Community 271 46.3 16 2.7 65 11.1 1 0.2 146 25.0 86 14.7 0 0.0 585 100.0
Kareena Private 265 37.4 45 6.3 58 8.2 0 0.0 253 35.7 86 12.1 2 0.3 709 100.0
St. George Private 543 37.2 54 3.7 178 12.2 1 0.1 494 33.8 191 13.1 0 0.0 1461 100.0
Prince of Wales Private 730 33.5 66 3.0 180 8.3 3 0.1 962 44.2 235 10.8 0 0.0 2176 100.0
Norwest Private 928 48.6 90 4.7 140 7.3 4 0.2 550 28.8 199 10.4 0 0.0 1911 100.0
Sydney Southwest Private
416 46.3 40 4.5 105 11.7 0 0.0 272 30.3 65 7.2 0 0.0 898 100.0
Nepean Private 333 46.0 12 1.7 72 9.9 2 0.3 232 32.0 73 10.1 0 0.0 724 100.0
Westmead Private 893 42.7 130 6.2 123 5.9 6 0.3 698 33.4 241 11.5 0 0.0 2091 100.0
Wollongong Private 400 42.6 16 1.7 126 13.4 0 0.0 273 29.0 125 13.3 0 0.0 940 100.0
Newcastle Private 767 42.1 41 2.2 197 10.8 3 0.2 602 33.0 213 11.7 0 0.0 1823 100.0
Calvary, Wagga Wagga 120 36.3 0 0.0 21 6.3 0 0.0 154 46.5 36 10.9 0 0.0 331 100.0
Other hospitals 0 0.0 0 0.0 0 0.0 0 0.0 24 100.0 0 0.0 0 0.0 24 100.0
TOTAL 8261 39.7 764 3.7 1879 9.0 23 0.1 7356 35.4 2499 12.0 2 0.0 20784 100.0
TOTAL NSW* 51434 54.5 4435 4.7 6338 6.7 336 0.4 20115 21.3 11764 12.5 27 0.0 94449 100.0
Source: NSW Perinatal Data Collection (SAPHaRI). Centre for Epidemiology and Evidence, NSW Ministry of Health.# Hospitals with more than 200 births in 2017 are identified individually. Peer group levels are described on page 84 in Appendix 2: Explanatory notes.† Emergency caesarean section includes caesarean sections where the onset of labour was not stated.* Total NSW includes births at home assisted by independent midwives.
NSW HEALTH | NSW Mothers and Babies 2017 | 35
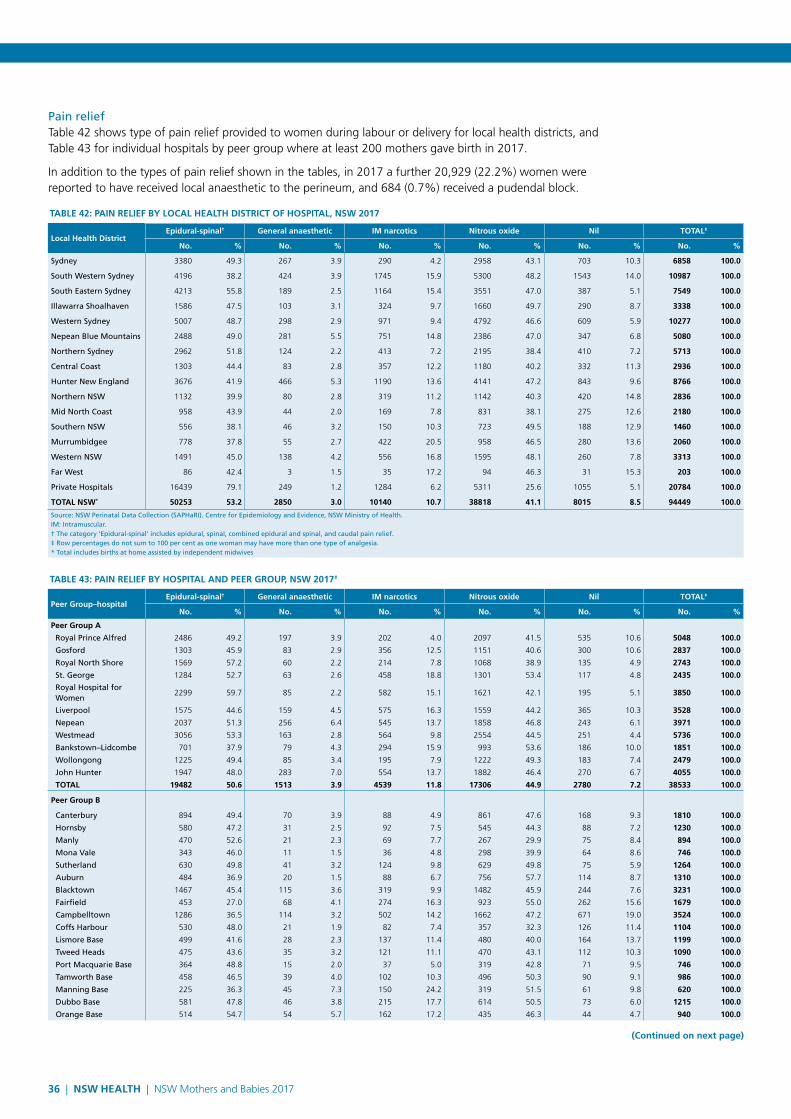
Pain relief Table 42 shows type of pain relief provided to women during labour or delivery for local health districts, and Table 43 for individual hospitals by peer group where at least 200 mothers gave birth in 2017.
In addition to the types of pain relief shown in the tables, in 2017 a further 20,929 (22.2%) women were reported to have received local anaesthetic to the perineum, and 684 (0.7%) received a pudendal block.
TABLE 42: PAIN RELIEF BY LOCAL HEALTH DISTRICT OF HOSPITAL, NSW 2017
Local Health DistrictEpidural-spinal† General anaesthetic IM narcotics Nitrous oxide Nil TOTAL‡
No. % No. % No. % No. % No. % No. %
Sydney 3380 49.3 267 3.9 290 4.2 2958 43.1 703 10.3 6858 100.0
South Western Sydney 4196 38.2 424 3.9 1745 15.9 5300 48.2 1543 14.0 10987 100.0
South Eastern Sydney 4213 55.8 189 2.5 1164 15.4 3551 47.0 387 5.1 7549 100.0
Illawarra Shoalhaven 1586 47.5 103 3.1 324 9.7 1660 49.7 290 8.7 3338 100.0
Western Sydney 5007 48.7 298 2.9 971 9.4 4792 46.6 609 5.9 10277 100.0
Nepean Blue Mountains 2488 49.0 281 5.5 751 14.8 2386 47.0 347 6.8 5080 100.0
Northern Sydney 2962 51.8 124 2.2 413 7.2 2195 38.4 410 7.2 5713 100.0
Central Coast 1303 44.4 83 2.8 357 12.2 1180 40.2 332 11.3 2936 100.0
Hunter New England 3676 41.9 466 5.3 1190 13.6 4141 47.2 843 9.6 8766 100.0
Northern NSW 1132 39.9 80 2.8 319 11.2 1142 40.3 420 14.8 2836 100.0
Mid North Coast 958 43.9 44 2.0 169 7.8 831 38.1 275 12.6 2180 100.0
Southern NSW 556 38.1 46 3.2 150 10.3 723 49.5 188 12.9 1460 100.0
Murrumbidgee 778 37.8 55 2.7 422 20.5 958 46.5 280 13.6 2060 100.0
Western NSW 1491 45.0 138 4.2 556 16.8 1595 48.1 260 7.8 3313 100.0
Far West 86 42.4 3 1.5 35 17.2 94 46.3 31 15.3 203 100.0
Private Hospitals 16439 79.1 249 1.2 1284 6.2 5311 25.6 1055 5.1 20784 100.0
TOTAL NSW* 50253 53.2 2850 3.0 10140 10.7 38818 41.1 8015 8.5 94449 100.0
Source: NSW Perinatal Data Collection (SAPHaRI). Centre for Epidemiology and Evidence, NSW Ministry of Health.IM: Intramuscular.† The category ‘Epidural-spinal’ includes epidural, spinal, combined epidural and spinal, and caudal pain relief.‡ Row percentages do not sum to 100 per cent as one woman may have more than one type of analgesia.* Total includes births at home assisted by independent midwives
TABLE 43: PAIN RELIEF BY HOSPITAL AND PEER GROUP, NSW 2017#
Peer Group–hospitalEpidural-spinal† General anaesthetic IM narcotics Nitrous oxide Nil TOTAL‡
No. % No. % No. % No. % No. % No. %
Peer Group A
Royal Prince Alfred 2486 49.2 197 3.9 202 4.0 2097 41.5 535 10.6 5048 100.0
Gosford 1303 45.9 83 2.9 356 12.5 1151 40.6 300 10.6 2837 100.0
Royal North Shore 1569 57.2 60 2.2 214 7.8 1068 38.9 135 4.9 2743 100.0
St. George 1284 52.7 63 2.6 458 18.8 1301 53.4 117 4.8 2435 100.0
Royal Hospital for Women
2299 59.7 85 2.2 582 15.1 1621 42.1 195 5.1 3850 100.0
Liverpool 1575 44.6 159 4.5 575 16.3 1559 44.2 365 10.3 3528 100.0
Nepean 2037 51.3 256 6.4 545 13.7 1858 46.8 243 6.1 3971 100.0
Westmead 3056 53.3 163 2.8 564 9.8 2554 44.5 251 4.4 5736 100.0
Bankstown–Lidcombe 701 37.9 79 4.3 294 15.9 993 53.6 186 10.0 1851 100.0
Wollongong 1225 49.4 85 3.4 195 7.9 1222 49.3 183 7.4 2479 100.0
John Hunter 1947 48.0 283 7.0 554 13.7 1882 46.4 270 6.7 4055 100.0
TOTAL 19482 50.6 1513 3.9 4539 11.8 17306 44.9 2780 7.2 38533 100.0
Peer Group B
Canterbury 894 49.4 70 3.9 88 4.9 861 47.6 168 9.3 1810 100.0
Hornsby 580 47.2 31 2.5 92 7.5 545 44.3 88 7.2 1230 100.0
Manly 470 52.6 21 2.3 69 7.7 267 29.9 75 8.4 894 100.0
Mona Vale 343 46.0 11 1.5 36 4.8 298 39.9 64 8.6 746 100.0
Sutherland 630 49.8 41 3.2 124 9.8 629 49.8 75 5.9 1264 100.0
Auburn 484 36.9 20 1.5 88 6.7 756 57.7 114 8.7 1310 100.0
Blacktown 1467 45.4 115 3.6 319 9.9 1482 45.9 244 7.6 3231 100.0
Fairfield 453 27.0 68 4.1 274 16.3 923 55.0 262 15.6 1679 100.0
Campbelltown 1286 36.5 114 3.2 502 14.2 1662 47.2 671 19.0 3524 100.0
Coffs Harbour 530 48.0 21 1.9 82 7.4 357 32.3 126 11.4 1104 100.0
Lismore Base 499 41.6 28 2.3 137 11.4 480 40.0 164 13.7 1199 100.0
Tweed Heads 475 43.6 35 3.2 121 11.1 470 43.1 112 10.3 1090 100.0
Port Macquarie Base 364 48.8 15 2.0 37 5.0 319 42.8 71 9.5 746 100.0
Tamworth Base 458 46.5 39 4.0 102 10.3 496 50.3 90 9.1 986 100.0
Manning Base 225 36.3 45 7.3 150 24.2 319 51.5 61 9.8 620 100.0
Dubbo Base 581 47.8 46 3.8 215 17.7 614 50.5 73 6.0 1215 100.0
Orange Base 514 54.7 54 5.7 162 17.2 435 46.3 44 4.7 940 100.0
(Continued on next page)
36 | NSW HEALTH | NSW Mothers and Babies 2017

TABLE 43: (Continued)
Peer Group–hospitalEpidural-spinal† General anaesthetic IM narcotics Nitrous oxide Nil TOTAL‡
No. % No. % No. % No. % No. % No. %
Shoalhaven 361 42.1 18 2.1 129 15.0 438 51.0 106 12.4 858 100.0
Maitland 598 40.0 61 4.1 140 9.4 771 51.5 155 10.4 1496 100.0
Wagga Wagga Base 512 48.3 39 3.7 203 19.2 453 42.8 107 10.1 1059 100.0
Other hospitals 0 0.0 0 0.0 1 1.0 29 29.3 32 32.3 99 100.0
TOTAL 11724 43.3 892 3.3 3071 11.3 12604 46.5 2902 10.7 27100 100.0
Peer Group C
Blue Mountains 75 33.5 4 1.8 27 12.1 100 44.6 18 8.0 224 100.0
Hawkesbury 304 43.1 19 2.7 144 20.4 338 47.9 64 9.1 706 100.0
Grafton Base 156 41.4 17 4.5 61 16.2 169 44.8 44 11.7 377 100.0
Kempsey 64 24.4 8 3.1 43 16.4 130 49.6 52 19.8 262 100.0
Armidale 163 39.0 9 2.2 118 28.2 180 43.1 52 12.4 418 100.0
Inverell 70 30.8 2 0.9 36 15.9 105 46.3 29 12.8 227 100.0
Mudgee 77 33.3 8 3.5 13 5.6 81 35.1 39 16.9 231 100.0
Bathurst Base 187 37.7 18 3.6 66 13.3 240 48.4 53 10.7 496 100.0
Bega 90 35.9 6 2.4 34 13.5 118 47.0 39 15.5 251 100.0
Goulburn Base 99 36.4 8 2.9 52 19.1 166 61.0 13 4.8 272 100.0
Moruya 93 31.7 9 3.1 14 4.8 144 49.1 47 16.0 293 100.0
Queanbeyan 242 46.8 16 3.1 36 7.0 238 46.0 70 13.5 517 100.0
Bowral 181 44.7 4 1.0 100 24.7 163 40.2 59 14.6 405 100.0
Griffith Base 166 30.7 12 2.2 137 25.4 270 50.0 81 15.0 540 100.0
Broken Hill Base 86 42.4 3 1.5 35 17.2 94 46.3 31 15.3 203 100.0
Other hospitals 441 21.5 40 1.9 297 14.5 854 41.6 471 22.9 2054 100.0
TOTAL 2494 33.4 183 2.4 1213 16.2 3390 45.3 1162 15.5 7476 100.0
Peer Group D
TOTAL 112 25.1 13 2.9 33 7.4 206 46.1 74 16.6 447 100.0
Private
Mater, North Sydney 1724 80.6 18 0.8 67 3.1 441 20.6 105 4.9 2140 100.0
North Shore Private 2008 82.4 20 0.8 41 1.7 533 21.9 93 3.8 2437 100.0
Sydney Adventist 1405 75.3 24 1.3 210 11.2 529 28.3 72 3.9 1867 100.0
North Gosford Private 522 78.3 5 0.7 28 4.2 179 26.8 13 1.9 667 100.0
Hurstville Community 439 75.0 7 1.2 33 5.6 168 28.7 15 2.6 585 100.0
Kareena Private 617 87.0 12 1.7 1 0.1 116 16.4 30 4.2 709 100.0
St. George Private 1238 84.7 21 1.4 43 2.9 274 18.8 45 3.1 1461 100.0
Prince of Wales Private 1890 86.9 16 0.7 80 3.7 559 25.7 101 4.6 2176 100.0
Norwest Private 1463 76.6 31 1.6 158 8.3 517 27.1 142 7.4 1911 100.0
Sydney Southwest Private
613 68.3 24 2.7 209 23.3 227 25.3 83 9.2 898 100.0
Nepean Private 500 69.1 9 1.2 115 15.9 254 35.1 61 8.4 724 100.0
Westmead Private 1646 78.7 21 1.0 94 4.5 576 27.5 52 2.5 2091 100.0
Wollongong Private 765 81.4 16 1.7 1 0.1 286 30.4 33 3.5 940 100.0
Newcastle Private 1363 74.8 21 1.2 182 10.0 570 31.3 167 9.2 1823 100.0
Calvary, Wagga Wagga 222 67.1 4 1.2 22 6.6 82 24.8 43 13.0 331 100.0
Other hospitals 24 100.0 0 0.0 0 0.0 0 0.0 0 0.0 24 100.0
TOTAL 16439 79.1 249 1.2 1284 6.2 5311 25.6 1055 5.1 20784 100.0
TOTAL NSW* 50253 53.2 2850 3.0 10140 10.7 38818 41.1 8015 8.5 94449 100.0Source: NSW Perinatal Data Collection (SAPHaRI). Centre for Epidemiology and Evidence, NSW Ministry of Health.IM: Intramuscular.# Hospitals with more than 200 births in 2017 are identified individually. Peer group levels are described on page 84 in Appendix 2: Explanatory notes.† The category ‘Epidural-spinal’ includes epidural, spinal, combined epidural and spinal, and caudal pain relief.‡ Row percentages do not sum to 100 per cent as one woman may have more than one type of analgesia.* Total NSW includes births at home assisted by independent midwives.
NSW HEALTH | NSW Mothers and Babies 2017 | 37

Perineal status Table 44 shows the perineal status in vaginal births for local health districts, and Table 45 for individual hospitals by peer group where at least 200 mothers gave birth in 2017.
In 2017, there were 1,856 cases of third degree tear and 84 cases of fourth degree tear reported among women who gave birth vaginally, including tears associated with an episiotomy.
TABLE 44: PERINEAL STATUS AMONG VAGINAL BIRTHS BY LOCAL HEALTH DISTRICT OF HOSPITAL, NSW 2017
Local Health District
Perineal status
Intact1st degree tear/
graze2nd degree tear
3rd or 4th degree tear
EpisiotomyCombined tear and episiotomy
Other Not stated TOTAL
No. % No. % No. % No. % No. % No. % No. % No. % No. %
Sydney 681 14.7 994 21.4 1611 34.8 152 3.3 866 18.7 209 4.5 122 2.6 0 0.0 4635 100.0
South Western Sydney 1704 21.1 1947 24.1 2385 29.6 195 2.4 1350 16.7 173 2.1 317 3.9 0 0.0 8071 100.0
South Eastern Sydney 640 12.2 1197 22.8 1757 33.5 138 2.6 997 19.0 387 7.4 125 2.4 6 0.1 5247 100.0
Illawarra Shoalhaven 526 22.7 665 28.7 656 28.3 43 1.9 258 11.1 72 3.1 96 4.1 3 0.1 2319 100.0
Western Sydney 946 12.9 1841 25.0 2097 28.5 129 1.8 1533 20.9 673 9.2 131 1.8 1 0.0 7351 100.0
Nepean Blue Mountains 429 13.3 1148 35.5 950 29.4 66 2.0 371 11.5 205 6.3 62 1.9 4 0.1 3235 100.0
Northern Sydney 400 10.1 909 23.0 1413 35.7 135 3.4 739 18.7 142 3.6 215 5.4 0 0.0 3953 100.0
Central Coast 282 13.3 614 28.9 672 31.7 43 2.0 287 13.5 40 1.9 184 8.7 0 0.0 2122 100.0
Hunter New England 1133 18.8 2101 34.9 1565 26.0 151 2.5 630 10.5 267 4.4 156 2.6 9 0.1 6012 100.0
Northern NSW 376 17.3 684 31.5 613 28.3 69 3.2 225 10.4 23 1.1 178 8.2 0 0.0 2168 100.0
Mid North Coast 311 20.3 409 26.7 457 29.8 31 2.0 176 11.5 22 1.4 126 8.2 0 0.0 1532 100.0
Southern NSW 223 21.2 349 33.1 285 27.0 31 2.9 110 10.4 30 2.8 24 2.3 2 0.2 1054 100.0
Murrumbidgee 294 21.2 540 39.0 311 22.5 25 1.8 138 10.0 45 3.2 30 2.2 2 0.1 1385 100.0
Western NSW 414 18.1 844 36.9 474 20.7 63 2.8 292 12.8 83 3.6 115 5.0 1 0.0 2286 100.0
Far West 34 23.8 62 43.4 26 18.2 3 2.1 8 5.6 1 0.7 9 6.3 0 0.0 143 100.0
Private Hospitals 1611 14.7 1954 17.9 3443 31.5 100 0.9 2892 26.5 208 1.9 694 6.4 25 0.2 10927 100.0
TOTAL* 10051 16.1 16290 26.0 18734 30.0 1375 2.2 10872 17.4 2580 4.1 2588 4.1 53 0.1 62543 100.0
Source: NSW Perinatal Data Collection (SAPHaRI). Centre for Epidemiology and Evidence, NSW Ministry of Health.* Total includes births at home assisted by independent midwives.
TABLE 45: PERINEAL STATUS AMONG VAGINAL BIRTHS BY HOSPITAL AND PEER GROUP, NSW 2017#
Peer Group–hospital
Perineal status
Intact1st degree tear/
graze2nd degree tear
3rd or 4th degree tear
EpisiotomyCombined tear and episiotomy
Other Not stated TOTAL
No. % No. % No. % No. % No. % No. % No. % No. % No. %
Peer Group A
Royal Prince Alfred 462 13.6 741 21.8 1247 36.6 115 3.4 616 18.1 138 4.1 84 2.5 0 0.0 3403 100.0
Gosford 274 13.5 557 27.5 648 32.0 43 2.1 283 14.0 39 1.9 179 8.8 0 0.0 2023 100.0
Royal North Shore 145 8.0 372 20.6 652 36.1 62 3.4 421 23.3 75 4.2 78 4.3 0 0.0 1805 100.0
St. George 211 12.3 352 20.5 567 33.0 48 2.8 342 19.9 162 9.4 35 2.0 3 0.2 1720 100.0
Royal Hospital for Women
315 12.0 614 23.4 908 34.7 76 2.9 470 17.9 171 6.5 65 2.5 0 0.0 2619 100.0
Liverpool 487 19.2 614 24.2 751 29.6 81 3.2 447 17.6 48 1.9 110 4.3 0 0.0 2538 100.0
Nepean 308 12.4 870 35.0 737 29.6 50 2.0 291 11.7 184 7.4 48 1.9 0 0.0 2488 100.0
Westmead 503 12.4 936 23.1 1153 28.5 47 1.2 931 23.0 429 10.6 52 1.3 0 0.0 4051 100.0
Bankstown–Lidcombe 291 21.0 318 23.0 372 26.9 22 1.6 256 18.5 57 4.1 67 4.8 0 0.0 1383 100.0
Wollongong 353 20.5 473 27.5 517 30.1 33 1.9 208 12.1 56 3.3 80 4.7 0 0.0 1720 100.0
John Hunter 400 14.9 870 32.3 771 28.7 99 3.7 341 12.7 149 5.5 60 2.2 1 0.0 2691 100.0
TOTAL 3749 14.2 6717 25.4 8323 31.5 676 2.6 4606 17.4 1508 5.7 858 3.2 4 0.0 26441 100.0
Peer Group B
Canterbury 219 17.8 253 20.5 364 29.5 37 3.0 250 20.3 71 5.8 38 3.1 0 0.0 1232 100.0
Hornsby 91 10.2 195 21.9 338 37.9 33 3.7 143 16.0 36 4.0 55 6.2 0 0.0 891 100.0
Manly 60 9.6 133 21.2 230 36.7 22 3.5 108 17.2 18 2.9 56 8.9 0 0.0 627 100.0
Mona Vale 85 16.0 165 31.1 161 30.4 17 3.2 66 12.5 13 2.5 23 4.3 0 0.0 530 100.0
Sutherland 114 12.6 231 25.4 282 31.1 14 1.5 185 20.4 54 5.9 25 2.8 3 0.3 908 100.0
Auburn 168 16.9 258 26.0 277 27.9 21 2.1 182 18.3 61 6.1 24 2.4 1 0.1 992 100.0
Blacktown 275 11.9 647 28.0 667 28.9 61 2.6 420 18.2 183 7.9 55 2.4 0 0.0 2308 100.0
Fairfield 301 24.1 300 24.0 327 26.1 40 3.2 224 17.9 36 2.9 23 1.8 0 0.0 1251 100.0
Campbelltown 553 21.1 638 24.3 875 33.4 48 1.8 381 14.5 29 1.1 97 3.7 0 0.0 2621 100.0
Coffs Harbour 150 20.3 188 25.4 247 33.4 10 1.4 82 11.1 10 1.4 52 7.0 0 0.0 739 100.0
Lismore Base 163 17.7 287 31.1 259 28.1 31 3.4 115 12.5 10 1.1 58 6.3 0 0.0 923 100.0
Tweed Heads 127 15.5 215 26.2 250 30.5 30 3.7 99 12.1 13 1.6 87 10.6 0 0.0 821 100.0
Port Macquarie Base 94 17.8 120 22.7 151 28.6 16 3.0 86 16.3 10 1.9 51 9.7 0 0.0 528 100.0
Tamworth Base 123 19.5 219 34.7 161 25.5 9 1.4 69 10.9 26 4.1 20 3.2 4 0.6 631 100.0
Manning Base 81 17.5 182 39.4 100 21.6 12 2.6 47 10.2 25 5.4 15 3.2 0 0.0 462 100.0
Dubbo Base 168 19.6 312 36.3 137 15.9 20 2.3 142 16.5 31 3.6 49 5.7 0 0.0 859 100.0
Orange Base 90 15.2 204 34.5 133 22.5 16 2.7 84 14.2 38 6.4 27 4.6 0 0.0 592 100.0
(Continued on next page)
38 | NSW HEALTH | NSW Mothers and Babies 2017

TABLE 45: (Continued)
Peer Group–hospital
Perineal status
Intact1st degree tear/
graze2nd degree tear
3rd or 4th degree tear
EpisiotomyCombined tear and episiotomy
Other Not stated TOTAL
No. % No. % No. % No. % No. % No. % No. % No. % No. %
Shoalhaven 173 28.9 191 31.9 139 23.2 10 1.7 50 8.4 16 2.7 16 2.7 3 0.5 598 100.0
Maitland 202 19.4 396 38.1 267 25.7 19 1.8 77 7.4 43 4.1 31 3.0 4 0.4 1039 100.0
Wagga Wagga Base 97 15.3 252 39.7 158 24.9 16 2.5 68 10.7 30 4.7 13 2.0 1 0.2 635 100.0
Other hospitals 8 8.1 57 57.6 24 24.2 0 0.0 4 4.0 1 1.0 5 5.1 0 0.0 99 100.0
TOTAL 3342 17.3 5443 28.2 5547 28.8 482 2.5 2882 14.9 754 3.9 820 4.3 16 0.1 19286 100.0
Peer Group C
Blue Mountains 15 9.3 59 36.4 69 42.6 2 1.2 7 4.3 2 1.2 6 3.7 2 1.2 162 100.0
Hawkesbury 82 17.9 158 34.5 124 27.1 13 2.8 61 13.3 16 3.5 2 0.4 2 0.4 458 100.0
Grafton Base 59 23.2 102 40.2 56 22.0 4 1.6 10 3.9 0 0.0 23 9.1 0 0.0 254 100.0
Kempsey 47 23.9 69 35.0 50 25.4 4 2.0 7 3.6 1 0.5 19 9.6 0 0.0 197 100.0
Armidale 55 19.6 102 36.3 68 24.2 3 1.1 25 8.9 16 5.7 12 4.3 0 0.0 281 100.0
Inverell 50 32.1 47 30.1 15 9.6 1 0.6 35 22.4 3 1.9 5 3.2 0 0.0 156 100.0
Mudgee 34 20.5 58 34.9 53 31.9 2 1.2 12 7.2 0 0.0 7 4.2 0 0.0 166 100.0
Bathurst Base 52 14.5 142 39.7 83 23.2 17 4.7 34 9.5 7 2.0 23 6.4 0 0.0 358 100.0
Bega 35 20.2 59 34.1 52 30.1 4 2.3 8 4.6 7 4.0 8 4.6 0 0.0 173 100.0
Goulburn Base 42 21.6 46 23.7 60 30.9 3 1.5 39 20.1 1 0.5 3 1.5 0 0.0 194 100.0
Moruya 49 22.1 84 37.8 55 24.8 6 2.7 20 9.0 3 1.4 5 2.3 0 0.0 222 100.0
Queanbeyan 63 17.3 124 34.0 98 26.8 15 4.1 40 11.0 18 4.9 5 1.4 2 0.5 365 100.0
Bowral 72 25.9 77 27.7 60 21.6 4 1.4 42 15.1 3 1.1 20 7.2 0 0.0 278 100.0
Griffith Base 85 21.7 162 41.3 93 23.7 2 0.5 38 9.7 5 1.3 7 1.8 0 0.0 392 100.0
Broken Hill Base 34 23.8 62 43.4 26 18.2 3 2.1 8 5.6 1 0.7 9 6.3 0 0.0 143 100.0
Other hospitals 446 26.8 666 40.0 368 22.1 26 1.6 87 5.2 21 1.3 47 2.8 2 0.1 1663 100.0
TOTAL 1220 22.3 2017 36.9 1330 24.4 109 2.0 473 8.7 104 1.9 201 3.7 8 0.1 5462 100.0
Peer Group D
TOTAL 82 25.4 126 39.0 72 22.3 7 2.2 19 5.9 6 1.9 11 3.4 0 0.0 323 100.0
Private
Mater, North Sydney 142 14.6 247 25.3 294 30.2 9 0.9 267 27.4 12 1.2 4 0.4 0 0.0 975 100.0
North Shore Private 143 13.2 232 21.4 362 33.5 21 1.9 273 25.2 4 0.4 33 3.0 14 1.3 1082 100.0
Sydney Adventist 191 17.6 275 25.4 319 29.5 0 0.0 267 24.7 0 0.0 31 2.9 0 0.0 1083 100.0
North Gosford Private 70 21.5 44 13.5 104 31.9 0 0.0 93 28.5 9 2.8 6 1.8 0 0.0 326 100.0
Hurstville Community 69 19.5 79 22.4 118 33.4 0 0.0 84 23.8 1 0.3 2 0.6 0 0.0 353 100.0
Kareena Private 31 8.4 70 19.0 143 38.9 6 1.6 95 25.8 0 0.0 17 4.6 6 1.6 368 100.0
St. George Private 130 16.8 170 21.9 298 38.4 10 1.3 137 17.7 0 0.0 26 3.4 5 0.6 776 100.0
Prince of Wales Private 128 13.1 134 13.7 293 29.9 2 0.2 273 27.9 41 4.2 108 11.0 0 0.0 979 100.0
Norwest Private 206 17.7 155 13.3 347 29.9 7 0.6 274 23.6 37 3.2 136 11.7 0 0.0 1162 100.0
Sydney Southwest Private
74 13.2 91 16.2 143 25.5 7 1.2 168 29.9 24 4.3 54 9.6 0 0.0 561 100.0
Nepean Private 49 11.7 47 11.2 114 27.2 2 0.5 147 35.1 17 4.1 43 10.3 0 0.0 419 100.0
Westmead Private 135 11.7 178 15.5 269 23.4 5 0.4 515 44.7 6 0.5 44 3.8 0 0.0 1152 100.0
Wollongong Private 65 12.0 77 14.2 187 34.5 3 0.6 181 33.4 0 0.0 29 5.4 0 0.0 542 100.0
Newcastle Private 156 15.5 127 12.6 397 39.4 26 2.6 91 9.0 55 5.5 156 15.5 0 0.0 1008 100.0
Calvary, Wagga Wagga 22 15.6 28 19.9 55 39.0 2 1.4 27 19.1 2 1.4 5 3.5 0 0.0 141 100.0
TOTAL 1611 14.7 1954 17.9 3443 31.5 100 0.9 2892 26.5 208 1.9 694 6.4 25 0.2 10927 100.0
TOTAL NSW* 10051 16.1 16290 26.0 18734 30.0 1375 2.2 10872 17.4 2580 4.1 2588 4.1 53 0.1 62543 100.0
Source: NSW Perinatal Data Collection (SAPHaRI). Centre for Epidemiology and Evidence, NSW Ministry of Health.# Hospitals with more than 200 births in 2017 are identified individually. Peer group levels are described on page 84 in Appendix 2: Explanatory notes.* Total NSW includes births at home assisted by independent midwives.
NSW HEALTH | NSW Mothers and Babies 2017 | 39

Birth weightTable 46 shows the birth weight of babies for local health districts, and Table 47 for individual hospitals by peer group where at least 200 mothers gave birth in 2017.
TABLE 46: BIRTHS BY BIRTH WEIGHT AND LOCAL HEALTH DISTRICT OF HOSPITAL, NSW 2017
Local Health District
Birth weight (grams)
Less than 1,000 1,000–1,499 1,500–2,499 2,500+ Not stated TOTAL
No. % No. % No. % No. % No. % No. %
Sydney 81 1.2 67 1.0 435 6.2 6377 91.6 2 0.0 6962 100.0
South Western Sydney 101 0.9 60 0.5 660 5.9 10339 92.6 7 0.1 11167 100.0
South Eastern Sydney 107 1.4 56 0.7 468 6.1 7070 91.8 1 0.0 7702 100.0
Illawarra Shoalhaven 16 0.5 6 0.2 181 5.4 3180 94.0 0 0.0 3383 100.0
Western Sydney 137 1.3 84 0.8 622 6.0 9595 91.9 0 0.0 10438 100.0
Nepean Blue Mountains 58 1.1 59 1.1 371 7.2 4679 90.5 2 0.0 5169 100.0
Northern Sydney 57 1.0 48 0.8 285 4.9 5412 93.3 0 0.0 5802 100.0
Central Coast 14 0.5 5 0.2 134 4.5 2819 94.9 0 0.0 2972 100.0
Hunter New England 115 1.3 85 1.0 582 6.5 8126 91.2 5 0.1 8913 100.0
Northern NSW 26 0.9 2 0.1 124 4.3 2709 94.6 2 0.1 2863 100.0
Mid North Coast 16 0.7 5 0.2 110 5.0 2070 94.0 0 0.0 2201 100.0
Southern NSW 4 0.3 1 0.1 41 2.8 1418 96.7 3 0.2 1467 100.0
Murrumbidgee 4 0.2 7 0.3 103 5.0 1962 94.5 1 0.0 2077 100.0
Western NSW 15 0.4 9 0.3 158 4.7 3174 94.6 0 0.0 3356 100.0
Far West 1 0.5 0 0.0 9 4.4 195 95.1 0 0.0 205 100.0
Private Hospitals 44 0.2 9 0.0 823 3.9 20144 95.7 20 0.1 21040 100.0
TOTAL* 796 0.8 503 0.5 5106 5.3 89373 93.3 47 0.0 95825 100.0
Source: NSW Perinatal Data Collection (SAPHaRI). Centre for Epidemiology and Evidence, NSW Ministry of Health.* Total includes births at home assisted by independent midwives.
TABLE 47: BIRTHS BY BIRTH WEIGHT, HOSPITAL AND PEER GROUP, NSW 2017#
Peer Group–hospital
Birth weight (grams)
Less than 1,000 1,000–1,499 1,500–2,499 2,500+ Not stated TOTAL
No. % No. % No. % No. % No. % No. %
Peer Group A
Royal Prince Alfred 73 1.4 65 1.3 348 6.8 4659 90.6 0 0.0 5145 100.0
Gosford 14 0.5 5 0.2 134 4.7 2720 94.7 0 0.0 2873 100.0
Royal North Shore 45 1.6 46 1.6 196 7.0 2522 89.8 0 0.0 2809 100.0
St. George 25 1.0 1 0.0 163 6.6 2293 92.3 1 0.0 2483 100.0
Royal Hospital for Women
75 1.9 53 1.3 270 6.8 3555 89.9 0 0.0 3953 100.0
Liverpool 71 2.0 54 1.5 308 8.5 3195 88.0 3 0.1 3631 100.0
Nepean 56 1.4 58 1.4 335 8.3 3604 88.9 0 0.0 4053 100.0
Westmead 99 1.7 78 1.3 413 7.0 5270 89.9 0 0.0 5860 100.0
Bankstown–Lidcombe 7 0.4 2 0.1 88 4.7 1778 94.8 0 0.0 1875 100.0
Wollongong 14 0.6 5 0.2 156 6.2 2344 93.1 0 0.0 2519 100.0
John Hunter 98 2.4 79 1.9 377 9.0 3613 86.7 0 0.0 4167 100.0
TOTAL 577 1.5 446 1.1 2788 7.1 35553 90.3 4 0.0 39368 100.0
Peer Group B
Canterbury 8 0.4 2 0.1 87 4.8 1718 94.6 2 0.1 1817 100.0
Hornsby 3 0.2 0 0.0 49 4.0 1188 95.8 0 0.0 1240 100.0
Manly 6 0.7 2 0.2 22 2.4 871 96.7 0 0.0 901 100.0
Mona Vale 3 0.4 0 0.0 18 2.4 731 97.2 0 0.0 752 100.0
Sutherland 7 0.6 2 0.2 35 2.8 1222 96.5 0 0.0 1266 100.0
Auburn 9 0.7 0 0.0 40 3.0 1263 96.3 0 0.0 1312 100.0
Blacktown 29 0.9 6 0.2 169 5.2 3062 93.8 0 0.0 3266 100.0
Fairfield 4 0.2 1 0.1 76 4.5 1604 95.1 1 0.1 1686 100.0
Campbelltown 18 0.5 3 0.1 184 5.2 3361 94.2 2 0.1 3568 100.0
Coffs Harbour 6 0.5 0 0.0 62 5.6 1049 93.9 0 0.0 1117 100.0
Lismore Base 7 0.6 2 0.2 72 5.9 1133 93.3 1 0.1 1215 100.0
Tweed Heads 7 0.6 0 0.0 37 3.4 1056 96.0 0 0.0 1100 100.0
Port Macquarie Base 6 0.8 3 0.4 41 5.4 704 93.4 0 0.0 754 100.0
Tamworth Base 5 0.5 3 0.3 58 5.8 931 93.2 2 0.2 999 100.0
Manning Base 3 0.5 0 0.0 30 4.8 594 94.6 1 0.2 628 100.0
Dubbo Base 7 0.6 5 0.4 77 6.2 1144 92.8 0 0.0 1233 100.0
Orange Base 7 0.7 0 0.0 49 5.1 900 94.1 0 0.0 956 100.0
Shoalhaven 2 0.2 1 0.1 25 2.9 835 96.8 0 0.0 863 100.0
Maitland 4 0.3 1 0.1 61 4.1 1437 95.6 0 0.0 1503 100.0
Wagga Wagga Base 2 0.2 5 0.5 67 6.3 992 93.0 1 0.1 1067 100.0
Other hospitals 0 0.0 0 0.0 0 0.0 99 100.0 0 0.0 99 100.0
TOTAL 143 0.5 36 0.1 1259 4.6 25894 94.7 10 0.0 27342 100.0
(Continued on next page)
40 | NSW HEALTH | NSW Mothers and Babies 2017

TABLE 47: (Continued)
Peer Group–hospital
Birth weight (grams)
Less than 1,000 1,000–1,499 1,500–2,499 2,500+ Not stated TOTAL
No. % No. % No. % No. % No. % No. %
Peer Group C
Blue Mountains 0 0.0 0 0.0 2 0.9 221 98.7 1 0.4 224 100.0
Hawkesbury 2 0.3 1 0.1 27 3.8 681 95.6 1 0.1 712 100.0
Grafton Base 11 2.9 0 0.0 15 4.0 351 92.9 1 0.3 378 100.0
Kempsey 4 1.5 2 0.8 6 2.3 250 95.4 0 0.0 262 100.0
Armidale 1 0.2 2 0.5 34 8.0 387 91.3 0 0.0 424 100.0
Inverell 3 1.3 0 0.0 5 2.2 219 96.5 0 0.0 227 100.0
Mudgee 1 0.4 0 0.0 4 1.7 227 97.8 0 0.0 232 100.0
Bathurst Base 0 0.0 4 0.8 25 5.0 475 94.2 0 0.0 504 100.0
Bega 0 0.0 0 0.0 6 2.4 244 97.2 1 0.4 251 100.0
Goulburn Base 2 0.7 0 0.0 7 2.6 264 96.7 0 0.0 273 100.0
Moruya 2 0.7 1 0.3 10 3.4 283 95.3 1 0.3 297 100.0
Queanbeyan 0 0.0 0 0.0 12 2.3 504 97.5 1 0.2 517 100.0
Bowral 1 0.2 0 0.0 4 1.0 401 98.5 1 0.2 407 100.0
Griffith Base 2 0.4 2 0.4 24 4.4 520 94.9 0 0.0 548 100.0
Broken Hill Base 1 0.5 0 0.0 9 4.4 195 95.1 0 0.0 205 100.0
Other hospitals 2 0.1 0 0.0 38 1.8 2015 98.0 2 0.1 2057 100.0
TOTAL 32 0.4 12 0.2 228 3.0 7237 96.3 9 0.1 7518 100.0
Peer Group D
TOTAL 0 0.0 0 0.0 8 1.8 440 98.2 0 0.0 448 100.0
Private
Mater, North Sydney 1 0.0 2 0.1 87 4.0 2075 95.8 0 0.0 2165 100.0
North Shore Private 7 0.3 3 0.1 114 4.6 2348 94.9 1 0.0 2473 100.0
Sydney Adventist 3 0.2 0 0.0 65 3.4 1817 96.4 0 0.0 1885 100.0
North Gosford Private 3 0.4 0 0.0 21 3.1 649 96.3 1 0.1 674 100.0
Hurstville Community 0 0.0 0 0.0 27 4.6 561 94.8 4 0.7 592 100.0
Kareena Private 0 0.0 0 0.0 20 2.8 696 97.2 0 0.0 716 100.0
St. George Private 6 0.4 1 0.1 61 4.1 1411 95.4 0 0.0 1479 100.0
Prince of Wales Private 2 0.1 1 0.0 89 4.1 2105 95.8 0 0.0 2197 100.0
Norwest Private 2 0.1 0 0.0 75 3.9 1854 95.5 10 0.5 1941 100.0
Sydney Southwest Private
2 0.2 1 0.1 30 3.3 874 96.1 2 0.2 909 100.0
Nepean Private 3 0.4 0 0.0 27 3.7 704 95.9 0 0.0 734 100.0
Westmead Private 4 0.2 0 0.0 102 4.8 2011 95.0 0 0.0 2117 100.0
Wollongong Private 1 0.1 1 0.1 27 2.8 924 97.0 0 0.0 953 100.0
Newcastle Private 9 0.5 0 0.0 63 3.4 1772 96.0 2 0.1 1846 100.0
Calvary, Wagga Wagga 1 0.3 0 0.0 15 4.5 319 95.2 0 0.0 335 100.0
Other hospitals 0 0.0 0 0.0 0 0.0 24 100.0 0 0.0 24 100.0
TOTAL 44 0.2 9 0.0 823 3.9 20144 95.7 20 0.1 21040 100.0
TOTAL NSW* 796 0.8 503 0.5 5106 5.3 89373 93.3 47 0.0 95825 100.0Source: NSW Perinatal Data Collection (SAPHaRI). Centre for Epidemiology and Evidence, NSW Ministry of Health.# Hospitals with more than 200 births in 2017 are identified individually. Peer group levels are described on page 84 in Appendix 2: Explanatory notes.* Total NSW includes births at home assisted by independent midwives.
NSW HEALTH | NSW Mothers and Babies 2017 | 41
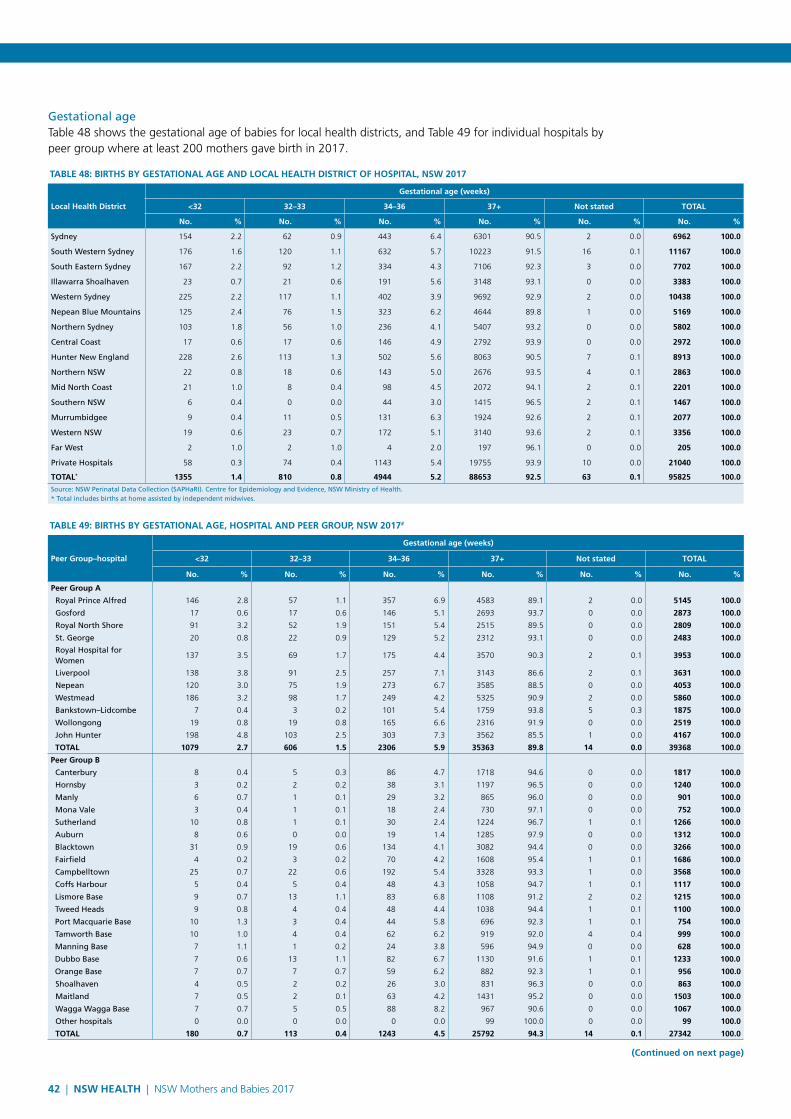
Gestational age Table 48 shows the gestational age of babies for local health districts, and Table 49 for individual hospitals by peer group where at least 200 mothers gave birth in 2017.
TABLE 48: BIRTHS BY GESTATIONAL AGE AND LOCAL HEALTH DISTRICT OF HOSPITAL, NSW 2017
Local Health District
Gestational age (weeks)
<32 32–33 34–36 37+ Not stated TOTAL
No. % No. % No. % No. % No. % No. %
Sydney 154 2.2 62 0.9 443 6.4 6301 90.5 2 0.0 6962 100.0
South Western Sydney 176 1.6 120 1.1 632 5.7 10223 91.5 16 0.1 11167 100.0
South Eastern Sydney 167 2.2 92 1.2 334 4.3 7106 92.3 3 0.0 7702 100.0
Illawarra Shoalhaven 23 0.7 21 0.6 191 5.6 3148 93.1 0 0.0 3383 100.0
Western Sydney 225 2.2 117 1.1 402 3.9 9692 92.9 2 0.0 10438 100.0
Nepean Blue Mountains 125 2.4 76 1.5 323 6.2 4644 89.8 1 0.0 5169 100.0
Northern Sydney 103 1.8 56 1.0 236 4.1 5407 93.2 0 0.0 5802 100.0
Central Coast 17 0.6 17 0.6 146 4.9 2792 93.9 0 0.0 2972 100.0
Hunter New England 228 2.6 113 1.3 502 5.6 8063 90.5 7 0.1 8913 100.0
Northern NSW 22 0.8 18 0.6 143 5.0 2676 93.5 4 0.1 2863 100.0
Mid North Coast 21 1.0 8 0.4 98 4.5 2072 94.1 2 0.1 2201 100.0
Southern NSW 6 0.4 0 0.0 44 3.0 1415 96.5 2 0.1 1467 100.0
Murrumbidgee 9 0.4 11 0.5 131 6.3 1924 92.6 2 0.1 2077 100.0
Western NSW 19 0.6 23 0.7 172 5.1 3140 93.6 2 0.1 3356 100.0
Far West 2 1.0 2 1.0 4 2.0 197 96.1 0 0.0 205 100.0
Private Hospitals 58 0.3 74 0.4 1143 5.4 19755 93.9 10 0.0 21040 100.0
TOTAL* 1355 1.4 810 0.8 4944 5.2 88653 92.5 63 0.1 95825 100.0Source: NSW Perinatal Data Collection (SAPHaRI). Centre for Epidemiology and Evidence, NSW Ministry of Health.* Total includes births at home assisted by independent midwives.
TABLE 49: BIRTHS BY GESTATIONAL AGE, HOSPITAL AND PEER GROUP, NSW 2017#
Peer Group–hospital
Gestational age (weeks)
<32 32–33 34–36 37+ Not stated TOTAL
No. % No. % No. % No. % No. % No. %
Peer Group A
Royal Prince Alfred 146 2.8 57 1.1 357 6.9 4583 89.1 2 0.0 5145 100.0
Gosford 17 0.6 17 0.6 146 5.1 2693 93.7 0 0.0 2873 100.0
Royal North Shore 91 3.2 52 1.9 151 5.4 2515 89.5 0 0.0 2809 100.0
St. George 20 0.8 22 0.9 129 5.2 2312 93.1 0 0.0 2483 100.0
Royal Hospital for Women
137 3.5 69 1.7 175 4.4 3570 90.3 2 0.1 3953 100.0
Liverpool 138 3.8 91 2.5 257 7.1 3143 86.6 2 0.1 3631 100.0
Nepean 120 3.0 75 1.9 273 6.7 3585 88.5 0 0.0 4053 100.0
Westmead 186 3.2 98 1.7 249 4.2 5325 90.9 2 0.0 5860 100.0
Bankstown–Lidcombe 7 0.4 3 0.2 101 5.4 1759 93.8 5 0.3 1875 100.0
Wollongong 19 0.8 19 0.8 165 6.6 2316 91.9 0 0.0 2519 100.0
John Hunter 198 4.8 103 2.5 303 7.3 3562 85.5 1 0.0 4167 100.0
TOTAL 1079 2.7 606 1.5 2306 5.9 35363 89.8 14 0.0 39368 100.0
Peer Group B
Canterbury 8 0.4 5 0.3 86 4.7 1718 94.6 0 0.0 1817 100.0
Hornsby 3 0.2 2 0.2 38 3.1 1197 96.5 0 0.0 1240 100.0
Manly 6 0.7 1 0.1 29 3.2 865 96.0 0 0.0 901 100.0
Mona Vale 3 0.4 1 0.1 18 2.4 730 97.1 0 0.0 752 100.0
Sutherland 10 0.8 1 0.1 30 2.4 1224 96.7 1 0.1 1266 100.0
Auburn 8 0.6 0 0.0 19 1.4 1285 97.9 0 0.0 1312 100.0
Blacktown 31 0.9 19 0.6 134 4.1 3082 94.4 0 0.0 3266 100.0
Fairfield 4 0.2 3 0.2 70 4.2 1608 95.4 1 0.1 1686 100.0
Campbelltown 25 0.7 22 0.6 192 5.4 3328 93.3 1 0.0 3568 100.0
Coffs Harbour 5 0.4 5 0.4 48 4.3 1058 94.7 1 0.1 1117 100.0
Lismore Base 9 0.7 13 1.1 83 6.8 1108 91.2 2 0.2 1215 100.0
Tweed Heads 9 0.8 4 0.4 48 4.4 1038 94.4 1 0.1 1100 100.0
Port Macquarie Base 10 1.3 3 0.4 44 5.8 696 92.3 1 0.1 754 100.0
Tamworth Base 10 1.0 4 0.4 62 6.2 919 92.0 4 0.4 999 100.0
Manning Base 7 1.1 1 0.2 24 3.8 596 94.9 0 0.0 628 100.0
Dubbo Base 7 0.6 13 1.1 82 6.7 1130 91.6 1 0.1 1233 100.0
Orange Base 7 0.7 7 0.7 59 6.2 882 92.3 1 0.1 956 100.0
Shoalhaven 4 0.5 2 0.2 26 3.0 831 96.3 0 0.0 863 100.0
Maitland 7 0.5 2 0.1 63 4.2 1431 95.2 0 0.0 1503 100.0
Wagga Wagga Base 7 0.7 5 0.5 88 8.2 967 90.6 0 0.0 1067 100.0
Other hospitals 0 0.0 0 0.0 0 0.0 99 100.0 0 0.0 99 100.0
TOTAL 180 0.7 113 0.4 1243 4.5 25792 94.3 14 0.1 27342 100.0
(Continued on next page)
42 | NSW HEALTH | NSW Mothers and Babies 2017

TABLE 49: (Continued)
Peer Group–hospital
Gestational age (weeks)
<32 32–33 34–36 37+ Not stated TOTAL
No. % No. % No. % No. % No. % No. %
Peer Group C
Blue Mountains 0 0.0 0 0.0 1 0.4 223 99.6 0 0.0 224 100.0
Hawkesbury 4 0.6 1 0.1 39 5.5 667 93.7 1 0.1 712 100.0
Grafton Base 4 1.1 1 0.3 12 3.2 360 95.2 1 0.3 378 100.0
Kempsey 6 2.3 0 0.0 4 1.5 252 96.2 0 0.0 262 100.0
Armidale 3 0.7 2 0.5 34 8.0 385 90.8 0 0.0 424 100.0
Inverell 2 0.9 0 0.0 5 2.2 220 96.9 0 0.0 227 100.0
Mudgee 3 1.3 1 0.4 2 0.9 226 97.4 0 0.0 232 100.0
Bathurst Base 2 0.4 2 0.4 22 4.4 478 94.8 0 0.0 504 100.0
Bega 0 0.0 0 0.0 5 2.0 245 97.6 1 0.4 251 100.0
Goulburn Base 2 0.7 0 0.0 11 4.0 260 95.2 0 0.0 273 100.0
Moruya 4 1.3 0 0.0 14 4.7 279 93.9 0 0.0 297 100.0
Queanbeyan 0 0.0 0 0.0 6 1.2 510 98.6 1 0.2 517 100.0
Bowral 2 0.5 1 0.2 12 2.9 385 94.6 7 1.7 407 100.0
Griffith Base 2 0.4 5 0.9 33 6.0 508 92.7 0 0.0 548 100.0
Broken Hill Base 2 1.0 2 1.0 4 2.0 197 96.1 0 0.0 205 100.0
Other hospitals 2 0.1 0 0.0 42 2.0 2010 97.7 3 0.1 2057 100.0
TOTAL 38 0.5 15 0.2 246 3.3 7205 95.8 14 0.2 7518 100.0
Peer Group D
TOTAL 0 0.0 2 0.4 6 1.3 439 98.0 1 0.2 448 100.0
Private
Mater, North Sydney 3 0.1 11 0.5 119 5.5 2031 93.8 1 0.0 2165 100.0
North Shore Private 11 0.4 14 0.6 146 5.9 2302 93.1 0 0.0 2473 100.0
Sydney Adventist 3 0.2 10 0.5 90 4.8 1782 94.5 0 0.0 1885 100.0
North Gosford Private 4 0.6 1 0.1 41 6.1 624 92.6 4 0.6 674 100.0
Hurstville Community 1 0.2 2 0.3 22 3.7 565 95.4 2 0.3 592 100.0
Kareena Private 0 0.0 8 1.1 28 3.9 680 95.0 0 0.0 716 100.0
St. George Private 7 0.5 8 0.5 82 5.5 1382 93.4 0 0.0 1479 100.0
Prince of Wales Private 3 0.1 3 0.1 92 4.2 2099 95.5 0 0.0 2197 100.0
Norwest Private 5 0.3 7 0.4 106 5.5 1823 93.9 0 0.0 1941 100.0
Sydney Southwest Private
3 0.3 2 0.2 43 4.7 861 94.7 0 0.0 909 100.0
Nepean Private 1 0.1 0 0.0 65 8.9 668 91.0 0 0.0 734 100.0
Westmead Private 6 0.3 5 0.2 105 5.0 2001 94.5 0 0.0 2117 100.0
Wollongong Private 2 0.2 1 0.1 45 4.7 905 95.0 0 0.0 953 100.0
Newcastle Private 9 0.5 0 0.0 131 7.1 1706 92.4 0 0.0 1846 100.0
Calvary, Wagga Wagga 0 0.0 2 0.6 28 8.4 305 91.0 0 0.0 335 100.0
Other hospitals 0 0.0 0 0.0 0 0.0 21 87.5 3 12.5 24 100.0
TOTAL 58 0.3 74 0.4 1143 5.4 19755 93.9 10 0.0 21040 100.0
TOTAL NSW* 1355 1.4 810 0.8 4944 5.2 88653 92.5 63 0.1 95825 100.0Source: NSW Perinatal Data Collection (SAPHaRI). Centre for Epidemiology and Evidence, NSW Ministry of Health.# Hospitals with more than 200 births in 2017 are identified individually. Peer group levels are described on page 84 in Appendix 2: Explanatory notes.* Total NSW includes births at home assisted by independent midwives.
NSW HEALTH | NSW Mothers and Babies 2017 | 43

Neonatal resuscitationTable 50 shows the type of neonatal resuscitation for local health districts, and Table 51 for individual hospitals by peer group where at least 200 mothers gave birth in 2017.
TABLE 50: BIRTHS BY TYPE OF RESUSCITATION AND LOCAL HEALTH DISTRICT OF HOSPITAL, NSW 2017
Local Health District
Resuscitation of baby
None/Minimal Suction O2 Therapy IPPR by maskIntubation and
IPPR
External cardiac massage and ventilation
CPAP ventilation TOTAL†
No. % No. % No. % No. % No. % No. % No. % No. %
Sydney 5801 83.3 164 2.4 155 2.2 634 9.1 42 0.6 28 0.4 136 2.0 6962 100.0
South Western Sydney 9879 88.5 265 2.4 269 2.4 551 4.9 13 0.1 45 0.4 139 1.2 11167 100.0
South Eastern Sydney 6008 78.0 447 5.8 128 1.7 239 3.1 60 0.8 27 0.4 793 10.3 7702 100.0
Illawarra Shoalhaven 2906 85.9 89 2.6 66 2.0 89 2.6 3 0.1 13 0.4 217 6.4 3383 100.0
Western Sydney 8190 78.5 903 8.7 117 1.1 222 2.1 81 0.8 37 0.4 886 8.5 10438 100.0
Nepean Blue Mountains 4074 78.8 320 6.2 152 2.9 161 3.1 40 0.8 15 0.3 407 7.9 5169 100.0
Northern Sydney 4735 81.6 234 4.0 67 1.2 144 2.5 26 0.4 12 0.2 584 10.1 5802 100.0
Central Coast 2417 81.3 97 3.3 60 2.0 175 5.9 5 0.2 10 0.3 208 7.0 2972 100.0
Hunter New England 7088 79.5 192 2.2 65 0.7 287 3.2 24 0.3 33 0.4 1219 13.7 8913 100.0
Northern NSW 2355 82.3 60 2.1 28 1.0 63 2.2 8 0.3 8 0.3 340 11.9 2863 100.0
Mid North Coast 1855 84.3 39 1.8 20 0.9 49 2.2 7 0.3 7 0.3 224 10.2 2201 100.0
Southern NSW 1266 86.3 10 0.7 10 0.7 38 2.6 0 0.0 5 0.3 135 9.2 1467 100.0
Murrumbidgee 1783 85.8 29 1.4 46 2.2 105 5.1 3 0.1 15 0.7 96 4.6 2077 100.0
Western NSW 2844 84.7 61 1.8 73 2.2 140 4.2 6 0.2 25 0.7 207 6.2 3356 100.0
Far West 179 87.3 6 2.9 3 1.5 12 5.9 0 0.0 2 1.0 3 1.5 205 100.0
Private Hospitals 19010 90.4 460 2.2 637 3.0 627 3.0 10 0.0 21 0.1 214 1.0 21040 100.0
TOTAL* 80489 84.0 3378 3.5 1899 2.0 3539 3.7 328 0.3 303 0.3 5808 6.1 95825 100.0
Source: NSW Perinatal Data Collection (SAPHaRI). Centre for Epidemiology and Evidence, NSW Ministry of Health.IPPR: Intermittent Positive Pressure Respiration. CPAP: Continuous Positive Airway Pressure.† Total includes births where resuscitation type was not stated.* Total includes births at home assisted by independent midwives.
TABLE 51: BIRTHS BY TYPE OF RESUSCITATION, HOSPITAL AND PEER GROUP, NSW 2017#
Peer Group–hospital
Resuscitation of baby
None/Minimal Suction O2 Therapy IPPR by maskIntubation and
IPPR
External cardiac massage and ventilation
CPAP ventilation
Not stated TOTAL†
No. % No. % No. % No. % No. % No. % No. % No. % No. %
Peer Group A
Royal Prince Alfred 4243 82.5 104 2.0 100 1.9 516 10.0 41 0.8 19 0.4 122 2.4 0 0.0 5145 100.0
Gosford 2323 80.9 96 3.3 60 2.1 174 6.1 5 0.2 10 0.3 205 7.1 0 0.0 2873 100.0
Royal North Shore 2138 76.1 186 6.6 26 0.9 60 2.1 24 0.9 4 0.1 371 13.2 0 0.0 2809 100.0
St. George 2115 85.2 42 1.7 25 1.0 68 2.7 0 0.0 9 0.4 224 9.0 0 0.0 2483 100.0
Royal Hospital for Women
2815 71.2 371 9.4 96 2.4 139 3.5 59 1.5 16 0.4 457 11.6 0 0.0 3953 100.0
Liverpool 3051 84.0 145 4.0 128 3.5 245 6.7 9 0.2 7 0.2 43 1.2 3 0.1 3631 100.0
Nepean 3106 76.6 277 6.8 94 2.3 147 3.6 36 0.9 12 0.3 381 9.4 0 0.0 4053 100.0
Westmead 4524 77.2 376 6.4 51 0.9 120 2.0 78 1.3 19 0.3 690 11.8 2 0.0 5860 100.0
Bankstown-Lidcombe 1685 89.9 33 1.8 20 1.1 103 5.5 2 0.1 12 0.6 20 1.1 0 0.0 1875 100.0
Wollongong 2151 85.4 73 2.9 46 1.8 69 2.7 3 0.1 10 0.4 167 6.6 0 0.0 2519 100.0
John Hunter 3129 75.1 92 2.2 15 0.4 110 2.6 20 0.5 17 0.4 784 18.8 0 0.0 4167 100.0
TOTAL 31280 79.5 1795 4.6 661 1.7 1751 4.4 277 0.7 135 0.3 3464 8.8 5 0.0 39368 100.0
Peer Group B
Canterbury 1558 85.7 60 3.3 55 3.0 118 6.5 1 0.1 9 0.5 14 0.8 2 0.1 1817 100.0
Hornsby 1053 84.9 29 2.3 13 1.0 30 2.4 2 0.2 3 0.2 110 8.9 0 0.0 1240 100.0
Manly 796 88.3 10 1.1 19 2.1 25 2.8 0 0.0 4 0.4 47 5.2 0 0.0 901 100.0
Mona Vale 659 87.6 8 1.1 5 0.7 25 3.3 0 0.0 0 0.0 55 7.3 0 0.0 752 100.0
Sutherland 1078 85.2 34 2.7 7 0.6 32 2.5 1 0.1 2 0.2 112 8.8 0 0.0 1266 100.0
Auburn 1200 91.5 57 4.3 22 1.7 21 1.6 2 0.2 5 0.4 5 0.4 0 0.0 1312 100.0
Blacktown 2466 75.5 470 14.4 44 1.3 81 2.5 1 0.0 13 0.4 191 5.8 0 0.0 3266 100.0
Fairfield 1527 90.6 44 2.6 45 2.7 38 2.3 1 0.1 2 0.1 28 1.7 1 0.1 1686 100.0
Campbelltown 3265 91.5 41 1.1 58 1.6 144 4.0 0 0.0 20 0.6 39 1.1 1 0.0 3568 100.0
Coffs Harbour 947 84.8 25 2.2 15 1.3 16 1.4 1 0.1 2 0.2 111 9.9 0 0.0 1117 100.0
Lismore Base 975 80.2 24 2.0 18 1.5 31 2.6 6 0.5 2 0.2 159 13.1 0 0.0 1215 100.0
Tweed Heads 900 81.8 32 2.9 6 0.5 21 1.9 2 0.2 5 0.5 134 12.2 0 0.0 1100 100.0
Port Macquarie Base 612 81.2 12 1.6 4 0.5 29 3.8 6 0.8 4 0.5 87 11.5 0 0.0 754 100.0
Tamworth Base 742 74.3 47 4.7 11 1.1 48 4.8 2 0.2 6 0.6 140 14.0 3 0.3 999 100.0
Manning Base 524 83.4 7 1.1 3 0.5 27 4.3 1 0.2 6 1.0 60 9.6 0 0.0 628 100.0
Dubbo Base 1015 82.3 34 2.8 23 1.9 45 3.6 3 0.2 8 0.6 105 8.5 0 0.0 1233 100.0
Orange Base 808 84.5 17 1.8 26 2.7 47 4.9 0 0.0 11 1.2 47 4.9 0 0.0 956 100.0
Shoalhaven 754 87.4 16 1.9 20 2.3 20 2.3 0 0.0 3 0.3 50 5.8 0 0.0 863 100.0
(Continued on next page)
44 | NSW HEALTH | NSW Mothers and Babies 2017

TABLE 51: (Continued)
Peer Group–hospital
Resuscitation of baby
None/Minimal Suction O2 Therapy IPPR by maskIntubation and
IPPR
External cardiac massage and ventilation
CPAP ventilation
Not stated TOTAL†
No. % No. % No. % No. % No. % No. % No. % No. % No. %
Maitland 1334 88.8 11 0.7 6 0.4 36 2.4 0 0.0 4 0.3 112 7.5 0 0.0 1503 100.0
Wagga Wagga Base 897 84.1 22 2.1 9 0.8 57 5.3 1 0.1 5 0.5 76 7.1 0 0.0 1067 100.0
Other hospitals 94 94.9 1 1.0 0 0.0 1 1.0 0 0.0 0 0.0 3 3.0 0 0.0 99 100.0
TOTAL 23204 84.9 1001 3.7 409 1.5 892 3.3 30 0.1 114 0.4 1685 6.2 7 0.0 27342 100.0
Peer Group C
Blue Mountains 197 87.9 6 2.7 2 0.9 3 1.3 0 0.0 0 0.0 16 7.1 0 0.0 224 100.0
Hawkesbury 618 86.8 33 4.6 46 6.5 5 0.7 1 0.1 3 0.4 6 0.8 0 0.0 712 100.0
Grafton Base 323 85.4 4 1.1 2 0.5 9 2.4 0 0.0 1 0.3 38 10.1 1 0.3 378 100.0
Kempsey 231 88.2 1 0.4 1 0.4 4 1.5 0 0.0 1 0.4 24 9.2 0 0.0 262 100.0
Armidale 326 76.9 6 1.4 7 1.7 17 4.0 0 0.0 0 0.0 68 16.0 0 0.0 424 100.0
Inverell 163 71.8 21 9.3 11 4.8 26 11.5 0 0.0 0 0.0 6 2.6 0 0.0 227 100.0
Mudgee 214 92.2 2 0.9 3 1.3 7 3.0 0 0.0 1 0.4 5 2.2 0 0.0 232 100.0
Bathurst Base 417 82.7 6 1.2 9 1.8 32 6.3 1 0.2 4 0.8 35 6.9 0 0.0 504 100.0
Bega 226 90.0 0 0.0 3 1.2 13 5.2 0 0.0 0 0.0 8 3.2 1 0.4 251 100.0
Goulburn Base 232 85.0 8 2.9 4 1.5 13 4.8 0 0.0 1 0.4 14 5.1 1 0.4 273 100.0
Moruya 274 92.3 0 0.0 2 0.7 4 1.3 0 0.0 1 0.3 16 5.4 0 0.0 297 100.0
Queanbeyan 411 79.5 1 0.2 1 0.2 8 1.5 0 0.0 3 0.6 92 17.8 1 0.2 517 100.0
Bowral 351 86.2 2 0.5 18 4.4 21 5.2 1 0.2 4 1.0 9 2.2 1 0.2 407 100.0
Griffith Base 472 86.1 2 0.4 29 5.3 34 6.2 2 0.4 3 0.5 6 1.1 0 0.0 548 100.0
Broken Hill Base 179 87.3 6 2.9 3 1.5 12 5.9 0 0.0 2 1.0 3 1.5 0 0.0 205 100.0
Other hospitals 1856 90.2 18 0.9 38 1.8 47 2.3 5 0.2 6 0.3 85 4.1 2 0.1 2057 100.0
TOTAL 6490 86.3 116 1.5 179 2.4 255 3.4 10 0.1 30 0.4 431 5.7 7 0.1 7518 100.0
Peer Group D
TOTAL 405 90.4 4 0.9 10 2.2 11 2.5 1 0.2 3 0.7 14 3.1 0 0.0 448 100.0
Private
Mater, North Sydney 1933 89.3 43 2.0 90 4.2 96 4.4 1 0.0 2 0.1 0 0.0 0 0.0 2165 100.0
North Shore Private 2257 91.3 89 3.6 66 2.7 36 1.5 2 0.1 0 0.0 1 0.0 22 0.9 2473 100.0
Sydney Adventist 1748 92.7 16 0.8 47 2.5 37 2.0 1 0.1 2 0.1 34 1.8 0 0.0 1885 100.0
North Gosford Private 611 90.7 11 1.6 15 2.2 30 4.5 0 0.0 2 0.3 3 0.4 2 0.3 674 100.0
Hurstville Community 534 90.2 10 1.7 34 5.7 11 1.9 0 0.0 0 0.0 0 0.0 3 0.5 592 100.0
Kareena Private 605 84.5 21 2.9 53 7.4 25 3.5 0 0.0 0 0.0 6 0.8 6 0.8 716 100.0
St. George Private 1154 78.0 69 4.7 166 11.2 45 3.0 1 0.1 0 0.0 24 1.6 20 1.4 1479 100.0
Prince of Wales Private 2075 94.4 12 0.5 16 0.7 72 3.3 1 0.0 0 0.0 21 1.0 0 0.0 2197 100.0
Norwest Private 1838 94.7 2 0.1 17 0.9 76 3.9 0 0.0 3 0.2 5 0.3 0 0.0 1941 100.0
Sydney Southwest Private 880 96.8 1 0.1 2 0.2 23 2.5 0 0.0 2 0.2 1 0.1 0 0.0 909 100.0
Nepean Private 675 92.0 0 0.0 24 3.3 22 3.0 0 0.0 4 0.5 9 1.2 0 0.0 734 100.0
Westmead Private 1923 90.8 68 3.2 55 2.6 53 2.5 3 0.1 3 0.1 5 0.2 7 0.3 2117 100.0
Wollongong Private 784 82.3 96 10.1 46 4.8 23 2.4 1 0.1 1 0.1 1 0.1 1 0.1 953 100.0
Newcastle Private 1665 90.2 18 1.0 4 0.2 54 2.9 0 0.0 1 0.1 104 5.6 0 0.0 1846 100.0
Calvary, Wagga Wagga 305 91.0 4 1.2 2 0.6 23 6.9 0 0.0 1 0.3 0 0.0 0 0.0 335 100.0
Other hospitals 23 95.8 0 0.0 0 0.0 1 4.2 0 0.0 0 0.0 0 0.0 0 0.0 24 100.0
TOTAL 19010 90.4 460 2.2 637 3.0 627 3.0 10 0.0 21 0.1 214 1.0 61 0.3 21040 100.0
TOTAL NSW † 80489 84.0 3378 3.5 1899 2.0 3539 3.7 328 0.3 303 0.3 5808 6.1 81 0.1 95825 100.0Source: NSW Perinatal Data Collection (SAPHaRI). Centre for Epidemiology and Evidence, NSW Ministry of Health.IPPR: Intermittent Positive Pressure Respiration. CPAP: Continuous Positive Airway Pressure.# Hospitals with more than 200 births in 2017 are identified individually. Peer group levels are described on page 84 in Appendix 2: Explanatory notes.† Total includes births where resuscitation type was not stated.* Total NSW includes births at home assisted by independent midwives.
NSW HEALTH | NSW Mothers and Babies 2017 | 45

Infant feedingTable 52 shows infant feeding at discharge from the hospital of birth for local health districts, and Table 53 for individual hospitals by peer group where at least 200 mothers gave birth in 2017.
TABLE 52: LIVE BIRTHS BY TYPE OF INFANT FEEDING AND LOCAL HEALTH DISTRICT OF HOSPITAL, NSW 2017
Local Health District
Infant feeding
Full breastfeeding Any breastfeeding Infant formula only Not stated TOTAL
No. % No. % No. % No. % No. %
Sydney 5226 75.6 1332 19.3 243 3.5 114 1.6 6915 100.0
South Western Sydney 6465 58.3 2387 21.5 1440 13.0 789 7.1 11081 100.0
South Eastern Sydney 6178 80.9 998 13.1 349 4.6 107 1.4 7632 100.0
Illawarra Shoalhaven 2603 77.3 203 6.0 485 14.4 75 2.2 3366 100.0
Western Sydney 7712 74.5 1404 13.6 807 7.8 434 4.2 10357 100.0
Nepean Blue Mountains 3643 71.0 523 10.2 864 16.8 99 1.9 5129 100.0
Northern Sydney 4903 84.9 611 10.6 187 3.2 72 1.2 5773 100.0
Central Coast 2259 76.7 327 11.1 311 10.6 50 1.7 2947 100.0
Hunter New England 6625 74.9 840 9.5 1207 13.7 168 1.9 8840 100.0
Northern NSW 2470 86.6 169 5.9 155 5.4 57 2.0 2851 100.0
Mid North Coast 1820 83.2 178 8.1 166 7.6 23 1.1 2187 100.0
Southern NSW 1216 83.1 100 6.8 107 7.3 40 2.7 1463 100.0
Murrumbidgee 1509 73.1 178 8.6 349 16.9 29 1.4 2065 100.0
Western NSW 2576 77.1 239 7.2 464 13.9 61 1.8 3340 100.0
Far West 163 80.3 8 3.9 28 13.8 4 2.0 203 100.0
Private Hospitals 14764 70.4 4533 21.6 759 3.6 921 4.4 20977 100.0
TOTAL* 70234 73.7 14031 14.7 7921 8.3 3048 3.2 95234 100.0
Source: NSW Perinatal Data Collection (SAPHaRI). Centre for Epidemiology and Evidence, NSW Ministry of Health.* Total includes births at home assisted by independent midwives.
TABLE 53: LIVE BIRTHS BY TYPE OF INFANT FEEDING, HOSPITAL AND PEER GROUP, NSW 2017#
Peer Group–hospital
Infant feeding
Full breastfeeding Any breastfeeding Infant formula only Not stated TOTAL
No. % No. % No. % No. % No. %
Peer Group A
Royal Prince Alfred 3862 75.6 1012 19.8 158 3.1 74 1.4 5106 100.0
Gosford 2171 76.2 325 11.4 305 10.7 47 1.7 2848 100.0
Royal North Shore 2343 83.9 326 11.7 89 3.2 35 1.3 2793 100.0
St. George 1878 76.3 399 16.2 134 5.4 51 2.1 2462 100.0
Royal Hospital for Women
3209 82.0 518 13.2 152 3.9 34 0.9 3913 100.0
Liverpool 2074 57.8 829 23.1 450 12.5 237 6.6 3590 100.0
Nepean 2724 67.8 473 11.8 747 18.6 72 1.8 4016 100.0
Westmead 4422 76.2 612 10.5 400 6.9 368 6.3 5802 100.0
Bankstown–Lidcombe 1223 65.5 378 20.2 227 12.2 39 2.1 1867 100.0
Wollongong 1885 75.3 173 6.9 405 16.2 41 1.6 2504 100.0
John Hunter 3034 73.7 448 10.9 582 14.1 55 1.3 4119 100.0
TOTAL 28825 73.9 5493 14.1 3649 9.4 1053 2.7 39020 100.0
Peer Group B
Canterbury 1364 75.4 320 17.7 85 4.7 40 2.2 1809 100.0
Hornsby 1051 84.9 128 10.3 45 3.6 14 1.1 1238 100.0
Manly 752 84.1 96 10.7 33 3.7 13 1.5 894 100.0
Mona Vale 663 88.6 61 8.2 19 2.5 5 0.7 748 100.0
Sutherland 1091 86.8 81 6.4 63 5.0 22 1.8 1257 100.0
Auburn 867 66.3 334 25.6 77 5.9 29 2.2 1307 100.0
Blacktown 2423 74.6 458 14.1 330 10.2 37 1.1 3248 100.0
Fairfield 690 41.2 670 40.0 188 11.2 128 7.6 1676 100.0
Campbelltown 2172 61.3 485 13.7 533 15.0 352 9.9 3542 100.0
Coffs Harbour 911 82.1 127 11.5 65 5.9 6 0.5 1109 100.0
Lismore Base 1026 84.8 91 7.5 75 6.2 18 1.5 1210 100.0
Tweed Heads 970 88.6 58 5.3 44 4.0 23 2.1 1095 100.0
Port Macquarie Base 624 83.1 43 5.7 70 9.3 14 1.9 751 100.0
Tamworth Base 695 70.0 98 9.9 146 14.7 54 5.4 993 100.0
Manning Base 496 79.5 48 7.7 69 11.1 11 1.8 624 100.0
Dubbo Base 883 72.3 89 7.3 231 18.9 19 1.6 1222 100.0
Orange Base 737 77.4 101 10.6 94 9.9 20 2.1 952 100.0
Shoalhaven 717 83.3 30 3.5 80 9.3 34 3.9 861 100.0
Maitland 1118 74.7 117 7.8 242 16.2 19 1.3 1496 100.0
Wagga Wagga Base 744 70.3 95 9.0 203 19.2 17 1.6 1059 100.0
Other hospitals 88 88.9 2 2.0 6 6.1 3 3.0 99 100.0
TOTAL 20082 73.9 3532 13.0 2698 9.9 878 3.2 27190 100.0
(Continued on next page)
46 | NSW HEALTH | NSW Mothers and Babies 2017

TABLE 53: (Continued)
Peer Group–hospital
Infant feeding
Full breastfeeding Any breastfeeding Infant formula only Not stated TOTAL
No. % No. % No. % No. % No. %
Peer Group C
Blue Mountains 190 84.8 8 3.6 9 4.0 17 7.6 224 100.0
Hawkesbury 584 82.4 34 4.8 84 11.8 7 1.0 709 100.0
Grafton Base 313 83.2 20 5.3 34 9.0 9 2.4 376 100.0
Kempsey 221 85.3 6 2.3 29 11.2 3 1.2 259 100.0
Armidale 348 82.9 33 7.9 31 7.4 8 1.9 420 100.0
Inverell 168 74.3 27 11.9 29 12.8 2 0.9 226 100.0
Mudgee 189 81.5 9 3.9 26 11.2 8 3.4 232 100.0
Bathurst Base 416 82.7 24 4.8 57 11.3 6 1.2 503 100.0
Bega 194 77.3 26 10.4 27 10.8 4 1.6 251 100.0
Goulburn Base 215 79.3 21 7.7 28 10.3 7 2.6 271 100.0
Moruya 248 84.1 15 5.1 22 7.5 10 3.4 295 100.0
Queanbeyan 452 87.4 31 6.0 21 4.1 13 2.5 517 100.0
Bowral 306 75.4 25 6.2 42 10.3 33 8.1 406 100.0
Griffith Base 390 71.6 67 12.3 81 14.9 7 1.3 545 100.0
Broken Hill Base 163 80.3 8 3.9 28 13.8 4 2.0 203 100.0
Other hospitals 1701 82.8 103 5.0 202 9.8 48 2.3 2054 100.0
TOTAL 6098 81.4 457 6.1 750 10.0 186 2.5 7491 100.0
Peer Group D
TOTAL 362 81.0 15 3.4 65 14.5 5 1.1 447 100.0
Private
Mater, North Sydney 1413 65.5 654 30.3 82 3.8 9 0.4 2158 100.0
North Shore Private 1742 70.6 606 24.6 109 4.4 9 0.4 2466 100.0
Sydney Adventist 1216 64.6 383 20.4 62 3.3 220 11.7 1881 100.0
North Gosford Private 596 89.0 48 7.2 23 3.4 3 0.4 670 100.0
Hurstville Community 334 56.5 196 33.2 57 9.6 4 0.7 591 100.0
Kareena Private 611 85.5 57 8.0 41 5.7 6 0.8 715 100.0
St. George Private 868 59.0 489 33.2 106 7.2 8 0.5 1471 100.0
Prince of Wales Private 1677 76.4 423 19.3 0 0.0 95 4.3 2195 100.0
Norwest Private 1381 71.4 359 18.6 0 0.0 195 10.1 1935 100.0
Sydney Southwest Private
542 59.9 256 28.3 0 0.0 107 11.8 905 100.0
Nepean Private 512 69.9 128 17.5 0 0.0 92 12.6 732 100.0
Westmead Private 1465 69.4 487 23.1 144 6.8 14 0.7 2110 100.0
Wollongong Private 720 75.6 108 11.3 119 12.5 5 0.5 952 100.0
Newcastle Private 1380 75.1 303 16.5 0 0.0 154 8.4 1837 100.0
Calvary, Wagga Wagga 286 85.4 35 10.4 14 4.2 0 0.0 335 100.0
Other hospitals 21 87.5 1 4.2 2 8.3 0 0.0 24 100.0
TOTAL 14764 70.4 4533 21.6 759 3.6 921 4.4 20977 100.0
TOTAL NSW* 70234 73.7 14031 14.7 7921 8.3 3048 3.2 95234 100.0Source: NSW Perinatal Data Collection (SAPHaRI). Centre for Epidemiology and Evidence, NSW Ministry of Health.# Hospitals with more than 200 births in 2017 are identified individually. Peer group levels are described on page 84 in Appendix 2: Explanatory notes.* Total NSW includes births at home assisted by independent midwives.
NSW HEALTH | NSW Mothers and Babies 2017 | 47

Baby discharge status Table 54 shows the discharge status of babies for local health districts, and Table 55 for individual hospitals by peer group where at least 200 mothers gave birth in 2017.
TABLE 54: BABY DISCHARGE STATUS BY HOSPITAL AND LOCAL HEALTH DISTRICT OF HOSPITAL, NSW 2017
Local Health District
Baby discharge status
Discharged Stillborn Neonatal death Transferred Not stated TOTAL
No. % No. % No. % No. % No. % No. %
Sydney 6738 96.8 47 0.7 27 0.4 148 2.1 2 0.0 6962 100.0
South Western Sydney 10748 96.2 86 0.8 18 0.2 309 2.8 6 0.1 11167 100.0
South Eastern Sydney 7419 96.3 70 0.9 23 0.3 129 1.7 61 0.8 7702 100.0
Illawarra Shoalhaven 3258 96.3 17 0.5 3 0.1 54 1.6 51 1.5 3383 100.0
Western Sydney 9729 93.2 81 0.8 51 0.5 314 3.0 263 2.5 10438 100.0
Nepean Blue Mountains 4842 93.7 40 0.8 17 0.3 212 4.1 58 1.1 5169 100.0
Northern Sydney 5620 96.9 29 0.5 17 0.3 136 2.3 0 0.0 5802 100.0
Central Coast 2894 97.4 25 0.8 2 0.1 51 1.7 0 0.0 2972 100.0
Hunter New England 8284 92.9 73 0.8 45 0.5 435 4.9 76 0.9 8913 100.0
Northern NSW 2783 97.2 12 0.4 5 0.2 29 1.0 34 1.2 2863 100.0
Mid North Coast 2117 96.2 14 0.6 3 0.1 67 3.0 0 0.0 2201 100.0
Southern NSW 1409 96.0 4 0.3 1 0.1 40 2.7 13 0.9 1467 100.0
Murrumbidgee 1918 92.3 12 0.6 0 0.0 138 6.6 9 0.4 2077 100.0
Western NSW 3167 94.4 16 0.5 5 0.1 165 4.9 3 0.1 3356 100.0
Far West 198 96.6 2 1.0 0 0.0 5 2.4 0 0.0 205 100.0
Private Hospitals 20823 99.0 62 0.3 7 0.0 147 0.7 1 0.0 21040 100.0
TOTAL* 92049 96.1 590 0.6 224 0.2 2380 2.5 582 0.6 95825 100.0
Source: NSW Perinatal Data Collection (SAPHaRI). Centre for Epidemiology and Evidence, NSW Ministry of Health.* Total includes births at home assisted by independent midwives.
TABLE 55: BABY DISCHARGE STATUS BY HOSPITAL AND PEER GROUP, NSW 2017#
Peer Group–hospital
Baby discharge status
Discharged Stillborn Neonatal death Transferred Not stated TOTAL
No. % No. % No. % No. % No. % No. %
Peer Group A
Royal Prince Alfred 4961 96.4 39 0.8 24 0.5 121 2.4 0 0.0 5145 100.0
Gosford 2801 97.5 25 0.9 2 0.1 45 1.6 0 0.0 2873 100.0
Royal North Shore 2673 95.2 16 0.6 17 0.6 103 3.7 0 0.0 2809 100.0
St. George 2407 96.9 21 0.8 4 0.2 12 0.5 39 1.6 2483 100.0
Royal Hospital for Women
3780 95.6 40 1.0 19 0.5 111 2.8 3 0.1 3953 100.0
Liverpool 3346 92.2 41 1.1 16 0.4 225 6.2 3 0.1 3631 100.0
Nepean 3764 92.9 37 0.9 17 0.4 194 4.8 41 1.0 4053 100.0
Westmead 5249 89.6 58 1.0 33 0.6 270 4.6 250 4.3 5860 100.0
Bankstown–Lidcombe 1846 98.5 8 0.4 0 0.0 19 1.0 2 0.1 1875 100.0
Wollongong 2434 96.6 15 0.6 3 0.1 43 1.7 24 1.0 2519 100.0
John Hunter 3824 91.8 48 1.2 39 0.9 243 5.8 13 0.3 4167 100.0
TOTAL 37085 94.2 348 0.9 174 0.4 1386 3.5 375 1.0 39368 100.0
Peer Group B
Canterbury 1777 97.8 8 0.4 3 0.2 27 1.5 2 0.1 1817 100.0
Hornsby 1227 99.0 2 0.2 0 0.0 11 0.9 0 0.0 1240 100.0
Manly 880 97.7 7 0.8 0 0.0 14 1.6 0 0.0 901 100.0
Mona Vale 746 99.2 4 0.5 0 0.0 2 0.3 0 0.0 752 100.0
Sutherland 1232 97.3 9 0.7 0 0.0 6 0.5 19 1.5 1266 100.0
Auburn 1277 97.3 5 0.4 4 0.3 13 1.0 13 1.0 1312 100.0
Blacktown 3203 98.1 18 0.6 14 0.4 31 0.9 0 0.0 3266 100.0
Fairfield 1656 98.2 10 0.6 0 0.0 19 1.1 1 0.1 1686 100.0
Campbelltown 3503 98.2 26 0.7 2 0.1 37 1.0 0 0.0 3568 100.0
Coffs Harbour 1079 96.6 8 0.7 0 0.0 30 2.7 0 0.0 1117 100.0
Lismore Base 1187 97.7 5 0.4 2 0.2 9 0.7 12 1.0 1215 100.0
Tweed Heads 1069 97.2 5 0.5 1 0.1 11 1.0 14 1.3 1100 100.0
Port Macquarie Base 725 96.2 3 0.4 3 0.4 23 3.1 0 0.0 754 100.0
Tamworth Base 895 89.6 6 0.6 4 0.4 48 4.8 46 4.6 999 100.0
Manning Base 611 97.3 4 0.6 0 0.0 12 1.9 1 0.2 628 100.0
Dubbo Base 1146 92.9 11 0.9 1 0.1 75 6.1 0 0.0 1233 100.0
Orange Base 892 93.3 4 0.4 4 0.4 56 5.9 0 0.0 956 100.0
Shoalhaven 823 95.4 2 0.2 0 0.0 11 1.3 27 3.1 863 100.0
Maitland 1412 93.9 7 0.5 0 0.0 74 4.9 10 0.7 1503 100.0
Wagga Wagga Base 981 91.9 8 0.7 0 0.0 72 6.7 6 0.6 1067 100.0
Other hospitals 93 93.9 0 0.0 0 0.0 6 6.1 0 0.0 99 100.0
TOTAL 26414 96.6 152 0.6 38 0.1 587 2.1 151 0.6 27342 100.0
(Continued on next page)
48 | NSW HEALTH | NSW Mothers and Babies 2017

TABLE 55: (Continued)
Peer Group–hospital
Baby discharge status
Discharged Stillborn Neonatal death Transferred Not stated TOTAL
No. % No. % No. % No. % No. % No. %
Peer Group C
Blue Mountains 207 92.4 0 0.0 0 0.0 3 1.3 14 6.3 224 100.0
Hawkesbury 698 98.0 3 0.4 0 0.0 8 1.1 3 0.4 712 100.0
Grafton Base 366 96.8 2 0.5 2 0.5 7 1.9 1 0.3 378 100.0
Kempsey 249 95.0 3 1.1 0 0.0 10 3.8 0 0.0 262 100.0
Armidale 407 96.0 4 0.9 1 0.2 12 2.8 0 0.0 424 100.0
Inverell 222 97.8 1 0.4 1 0.4 3 1.3 0 0.0 227 100.0
Mudgee 222 95.7 0 0.0 0 0.0 10 4.3 0 0.0 232 100.0
Bathurst Base 496 98.4 1 0.2 0 0.0 7 1.4 0 0.0 504 100.0
Bega 246 98.0 0 0.0 0 0.0 5 2.0 0 0.0 251 100.0
Goulburn Base 264 96.7 2 0.7 1 0.4 6 2.2 0 0.0 273 100.0
Moruya 283 95.3 2 0.7 0 0.0 11 3.7 1 0.3 297 100.0
Queanbeyan 496 95.9 0 0.0 0 0.0 12 2.3 9 1.7 517 100.0
Bowral 397 97.5 1 0.2 0 0.0 9 2.2 0 0.0 407 100.0
Griffith Base 500 91.2 3 0.5 0 0.0 45 8.2 0 0.0 548 100.0
Broken Hill Base 198 96.6 2 1.0 0 0.0 5 2.4 0 0.0 205 100.0
Other hospitals 1950 94.8 3 0.1 0 0.0 84 4.1 20 1.0 2057 100.0
TOTAL 7201 95.8 27 0.4 5 0.1 237 3.2 48 0.6 7518 100.0
Peer Group D
TOTAL 424 94.6 1 0.2 0 0.0 21 4.7 2 0.4 448 100.0
Private
Mater, North Sydney 2145 99.1 7 0.3 1 0.0 12 0.6 0 0.0 2165 100.0
North Shore Private 2453 99.2 7 0.3 4 0.2 9 0.4 0 0.0 2473 100.0
Sydney Adventist 1874 99.4 4 0.2 1 0.1 6 0.3 0 0.0 1885 100.0
North Gosford Private 663 98.4 3 0.4 0 0.0 8 1.2 0 0.0 674 100.0
Hurstville Community 589 99.5 1 0.2 0 0.0 2 0.3 0 0.0 592 100.0
Kareena Private 707 98.7 1 0.1 0 0.0 8 1.1 0 0.0 716 100.0
St. George Private 1460 98.7 8 0.5 0 0.0 11 0.7 0 0.0 1479 100.0
Prince of Wales Private 2180 99.2 2 0.1 0 0.0 14 0.6 1 0.0 2197 100.0
Norwest Private 1930 99.4 6 0.3 0 0.0 5 0.3 0 0.0 1941 100.0
Sydney Southwest Private
900 99.0 4 0.4 0 0.0 5 0.6 0 0.0 909 100.0
Nepean Private 715 97.4 2 0.3 0 0.0 17 2.3 0 0.0 734 100.0
Westmead Private 2090 98.7 7 0.3 1 0.0 19 0.9 0 0.0 2117 100.0
Wollongong Private 937 98.3 1 0.1 0 0.0 15 1.6 0 0.0 953 100.0
Newcastle Private 1824 98.8 9 0.5 0 0.0 13 0.7 0 0.0 1846 100.0
Calvary, Wagga Wagga 332 99.1 0 0.0 0 0.0 3 0.9 0 0.0 335 100.0
Other hospitals 24 100.0 0 0.0 0 0.0 0 0.0 0 0.0 24 100.0
TOTAL 20823 99.0 62 0.3 7 0.0 147 0.7 1 0.0 21040 100.0
TOTAL NSW* 92049 96.1 590 0.6 224 0.2 2380 2.5 582 0.6 95825 100.0Source: NSW Perinatal Data Collection (SAPHaRI). Centre for Epidemiology and Evidence, NSW Ministry of Health.# Hospitals with more than 200 births in 2017 are identified individually. Peer group levels are described on page 84 in Appendix 2: Explanatory notes.* Total NSW includes births at home assisted by independent midwives.
NSW HEALTH | NSW Mothers and Babies 2017 | 49

Postnatal length of stayTable 56 shows the mother’s postnatal length of stay in the hospital of birth for hospitals where at least 200 mothers gave birth in 2017.
Local Health District–HospitalAverage postnatal length of stay (days)
2013 2014 2015 2016 2017
Sydney Canterbury 2.6 2.6 2.7 2.6 2.5
Royal Prince Alfred
3.1 3.1 3.1 3.2 3.2
TOTAL 3.0 3.0 3.0 3.0 3.0
South Western Sydney
Fairfield 2.3 2.3 2.5 2.5 2.5
Liverpool 2.9 2.9 2.7 2.6 2.5
Campbelltown 2.3 2.3 2.3 2.1 2.1
Bankstown–Lidcombe
2.6 2.4 2.4 2.4 2.4
Bowral 2.8 2.8 2.8 2.7 2.6
TOTAL 2.6 2.5 2.5 2.4 2.4
South Eastern Sydney
St. George 2.8 2.5 2.4 2.2 2.3
Sutherland 2.6 2.6 2.2 2.0 2.1
Royal Hospital for Women
3.0 2.9 2.9 3.0 3.0
Other hospitals 4.0 0.0 0.0 0.0 0.0
TOTAL 2.9 2.7 2.7 2.6 2.6
Illawarra Shoalhaven
Shoalhaven 2.2 2.0 2.2 2.3 2.2
Wollongong 2.5 2.5 2.4 2.4 2.4
Other hospitals 2.2 1.7 1.7 1.4 2.0
TOTAL 2.4 2.3 2.3 2.3 2.3
Western Sydney Auburn 1.9 1.9 1.9 1.9 1.9
Blacktown 2.2 2.2 2.2 2.1 2.1
Westmead 2.1 2.0 2.1 2.1 2.1
TOTAL 2.1 2.0 2.1 2.1 2.1
Nepean Blue Mountains
Blue Mountains 2.2 2.0 2.2 2.5 2.1
Nepean 2.0 2.0 2.2 2.0 2.1
Hawkesbury 3.0 3.0 3.0 2.9 2.8
Other hospitals 3.0 2.8 2.8 2.7 2.8
TOTAL 2.2 2.2 2.3 2.2 2.3
Northern Sydney
Hornsby 2.0 2.0 2.0 2.1 2.2
Manly 2.4 2.2 2.4 2.4 2.4
Mona Vale 2.5 2.5 2.4 2.3 2.3
Royal North Shore
2.8 2.7 2.9 2.8 2.8
Other hospitals 0.1 0.2 0.1 0.1 0.2
TOTAL 2.5 2.4 2.5 2.5 2.5
Central Coast Gosford 2.2 2.1 2.1 2.1 2.1
Other hospitals 0.4 0.2 0.1 0.2 0.3
TOTAL 2.1 2.0 2.0 2.0 2.1
Hunter New England
Armidale 2.4 2.4 2.4 2.5 2.8
Inverell 2.8 3.3 2.8 2.9 3.1
Tamworth Base 2.7 2.3 2.5 2.4 2.8
Manning Base 2.7 2.6 2.7 2.7 2.6
Maitland 2.1 2.2 2.0 2.0 2.1
John Hunter 2.6 2.5 2.4 2.4 2.4
Other hospitals 2.3 2.3 2.3 2.3 2.3
TOTAL 2.5 2.4 2.4 2.4 2.4
Northern NSW Grafton Base 3.1 3.3 3.0 3.0 3.1
Lismore Base 2.8 2.6 2.3 2.3 2.4
Tweed Heads 2.6 2.6 2.5 2.5 2.4
Other hospitals 2.8 3.2 1.8 1.8 1.2
TOTAL 2.7 2.7 2.5 2.4 2.4
Local Health District–HospitalAverage postnatal length of stay (days)
2013 2014 2015 2016 2017
Mid North Coast
Coffs Harbour 2.8 2.5 2.6 2.7 2.7
Kempsey 2.6 2.5 2.3 2.4 2.8
Port Macquarie Base
2.8 2.6 2.6 2.4 2.4
Other hospitals 2.7 2.6 2.0 2.3 2.1
TOTAL 2.8 2.6 2.6 2.6 2.6
Southern NSW Bega 2.1 2.3 2.4 2.3 2.4
Goulburn Base 2.8 2.6 2.5 2.4 2.8
Moruya 2.4 2.2 2.2 2.2 2.1
Queanbeyan 2.7 2.8 2.8 2.8 2.7
Other hospitals 3.3 3.3 3.6 2.9 3.6
TOTAL 2.6 2.6 2.6 2.5 2.6
Murrumbidgee Griffith Base 2.8 2.9 2.8 2.9 2.6
Wagga Wagga Base
2.6 2.5 2.5 2.4 2.7
Other hospitals 3.0 3.0 2.7 2.8 3.0
TOTAL 2.8 2.8 2.6 2.6 2.7
Western NSW Dubbo Base 2.5 2.2 2.2 2.2 2.2
Mudgee 3.0 2.8 2.5 2.4 2.3
Bathurst Base 2.6 2.5 2.7 2.3 2.5
Orange Base 2.5 2.5 2.3 2.5 2.5
Other hospitals 2.9 2.6 2.6 3.0 2.7
TOTAL 2.6 2.4 2.4 2.4 2.4
Far West Broken Hill Base 2.5 2.8 2.3 2.1 2.4
TOTAL 2.5 2.8 2.3 2.1 2.4
Private Hospitals
Mater, North Sydney
4.6 4.7 4.4 4.5 4.6
North Shore Private
4.5 4.5 4.5 4.5 4.5
Sydney Adventist
4.6 4.7 4.7 4.7 4.8
North Gosford Private
4.8 4.9 4.3 4.3 4.3
Hurstville Community
4.3 4.4 4.2 4.5 4.3
Kareena Private 4.3 4.4 4.4 4.4 4.4
St. George Private
4.4 4.4 4.4 4.3 4.4
Prince of Wales Private
4.6 4.6 4.5 4.5 4.6
Norwest Private 4.4 4.5 4.3 4.2 4.2
Sydney Southwest Private
4.4 4.2 4.0 3.8 3.8
Nepean Private 4.5 4.3 4.1 4.2 4.3
Westmead Private
4.3 4.3 4.3 4.2 4.0
Wollongong Private† - - - 5.3 5.3
Newcastle Private
4.3 4.3 4.2 4.3 4.2
Calvary, Wagga Wagga
4.5 4.8 4.6 4.5 4.4
Other hospitals 5.2 5.2 5.2 4.5 4.4
TOTAL 4.5 4.5 4.4 4.4 4.4
TOTAL NSW* 3.0 3.0 2.9 2.9 2.9
Source: NSW Perinatal Data Collection (SAPHaRI). Centre for Epidemiology and Evidence, NSW Ministry of Health.# Hospitals with more than 200 births in 2017 are identified individually.* Total NSW includes births at home assisted by independent midwives.† Wollongong Private Hospital opened in 2016.
TABLE 56: AVERAGE MATERNAL POSTNATAL LENGTH OF STAY IN HOSPITAL OF BIRTH, NSW 2013–2017#
50 | NSW HEALTH | NSW Mothers and Babies 2017

Selected clinical indicators for obstetrics are reported in this section. The definitions of the clinical indicators follow those described in Version 8 of the Australian Council on Healthcare Standards Clinical Indicator User Manual for data collected in 2017.1
Outcome of selected primiparaIndicator 1.1Definition: The total number of selected primipara who have a spontaneous vaginal birth as a percentage of the total number of selected primipara who give birth.
A selected primipara is defined as a woman who is 20–34 years of age at the time of giving birth; giving birth for the first time at 20 weeks or greater gestation; singleton pregnancy; cephalic presentation; and at 370 to 406 weeks gestation. Spontaneous vaginal birth is defined as a vaginal birth (regardless of onset of labour) that is not assisted by forceps or vacuum and not a vaginal breech delivery.
Table 57 shows information for hospitals where at least 200 mothers gave birth in 2017, totals for hospitals for each local health district, and the NSW total.
7. CLINICAL INDICATORS
Reference
1. Australian Council on Healthcare Standards. Clinical Indicators User Manual. Maternity Version 8. Sydney: ACHS, 2017.
Local Health District–Hospital2013 2014 2015 2016 2017
% % % % %
Sydney Canterbury 54.4 51.7 49.7 42.6 37.5
Royal Prince Alfred
52.9 52.4 52.2 51.4 50.5
TOTAL 53.3 52.2 51.5 49.5 47.4
South Western Sydney
Fairfield 79.9 76.4 69.6 64.1 62.2
Liverpool 63.2 58.8 59.9 56.0 52.9
Campbelltown 65.7 62.1 61.5 56.4 58.7
Bankstown–Lidcombe
64.0 64.4 59.6 48.6 57.5
Bowral 57.1 45.3 48.4 39.8 51.0
TOTAL 66.7 63.2 61.3 55.5 56.9
South Eastern Sydney
St. George 52.6 50.7 46.3 44.9 43.9
Sutherland 57.9 57.9 52.9 56.4 54.7
Royal Hospital for Women
50.5 48.7 47.4 49.9 45.6
TOTAL 52.5 50.9 48.0 49.4 46.4
Illawarra Shoalhaven
Shoalhaven 52.6 57.8 49.1 52.9 49.6
Wollongong 52.0 50.6 52.2 52.6 46.4
Other hospitals 50.0 88.2 100.0 0.0 0.0
TOTAL 52.1 53.2 51.5 52.6 47.2
Western Sydney Auburn 64.2 66.0 61.7 63.5 61.1
Blacktown 48.3 48.9 50.8 51.4 50.9
Westmead 50.0 52.6 52.4 53.9 53.8
TOTAL 51.6 53.5 53.3 54.5 54.0
Nepean Blue Mountains
Blue Mountains 46.7 75.8 52.9 52.0 60.7
Nepean 44.9 45.7 43.1 46.2 49.2
Hawkesbury 43.4 44.2 43.4 47.8 46.8
Other hospitals 61.0 55.3 55.6 62.0 56.3
TOTAL 45.5 47.3 44.3 47.2 49.6
Northern Sydney
Hornsby 61.5 59.7 54.2 50.6 50.6
Manly 53.2 48.9 48.9 45.6 47.0
Mona Vale 43.4 53.4 59.9 52.2 54.2
Royal North Shore
45.7 49.3 52.9 47.8 47.8
Other hospitals 100.0 97.3 100.0 100.0 100.0
TOTAL 50.9 52.6 54.2 49.2 49.8
Central Coast Gosford 44.0 44.1 51.2 49.7 49.3
Other hospitals 100.0 100.0 100.0 100.0 100.0
TOTAL 47.6 46.1 53.1 51.9 50.8
Local Health District–Hospital2013 2014 2015 2016 2017
% % % % %
Hunter New England
Armidale 62.6 39.2 44.6 51.6 51.3
Inverell 35.6 46.9 43.3 50.9 59.7
Tamworth Base 50.8 57.1 50.8 51.1 44.5
Manning Base 56.6 54.8 48.4 54.7 50.6
Maitland 56.3 61.3 58.4 62.3 58.3
John Hunter 54.2 54.2 53.9 51.1 52.8
Other hospitals 66.0 67.5 65.5 71.0 65.2
TOTAL 55.6 56.4 54.5 55.6 54.2
Northern NSW Grafton Base 52.4 60.3 53.4 58.3 62.1
Lismore Base 56.0 59.1 64.3 54.2 67.4
Tweed Heads 61.6 53.8 61.6 63.0 58.2
Other hospitals 96.5 98.4 98.2 84.5 100.0
TOTAL 60.8 59.8 64.1 61.3 64.8
Mid North Coast
Coffs Harbour 54.3 54.6 56.2 48.0 52.3
Kempsey 70.5 60.3 58.6 64.4 66.7
Port Macquarie Base
57.0 50.0 49.7 52.1 56.1
Other hospitals 66.7 63.6 100.0 100.0 80.0
TOTAL 56.9 53.9 55.1 51.7 55.5
Southern NSW Bega 49.2 54.2 54.0 54.4 50.7
Goulburn Base 48.8 48.5 42.1 40.0 43.4
Moruya 65.1 62.7 51.5 59.4 51.2
Queanbeyan 52.0 44.6 49.3 51.9 44.5
Other hospitals 57.5 73.2 83.0 78.3 76.9
TOTAL 53.5 53.4 53.4 54.4 49.1
Murrumbidgee Griffith Base 52.1 44.4 49.1 49.0 57.7
Wagga Wagga Base
53.0 52.3 43.2 49.8 46.2
Other hospitals 65.2 62.7 66.1 53.8 65.8
TOTAL 56.4 53.8 50.5 50.5 53.5
Western NSW Dubbo Base 51.7 48.8 52.1 51.3 50.6
Mudgee 73.2 59.0 56.2 56.5 46.7
Bathurst Base 57.0 50.7 65.5 57.6 61.4
Orange Base 46.7 48.7 52.8 49.6 47.4
Other hospitals 58.3 56.9 68.3 66.7 61.5
TOTAL 53.7 50.9 56.7 54.1 52.4
TABLE 57: 1.1 SELECTED PRIMIPARA WHO HAVE A SPONTANEOUS VAGINAL BIRTH BY LOCAL HEALTH DISTRICT AND HOSPITAL, NSW 2013–2017#
(Continued on next page)
NSW HEALTH | NSW Mothers and Babies 2017 | 51
Local Health District–Hospital2013 2014 2015 2016 2017
% % % % %
Norwest Private 40.4 46.4 39.9 42.8 42.4
Sydney Southwest Private
47.7 46.3 36.2 39.4 40.5
Nepean Private 31.6 40.8 42.2 37.9 42.4
Westmead Private
36.4 35.4 37.2 40.2 39.2
Wollongong Private† - - - 32.0 39.7
Newcastle Private
42.9 38.8 40.8 34.9 35.2
Calvary, Wagga Wagga
23.5 23.0 25.5 35.8 33.3
Other hospitals 35.2 33.4 33.6 0.0 0.0
TOTAL 37.4 36.6 36.9 35.7 34.8
TOTAL NSW* 50.6 50.0 49.8 48.5 48.1
Source: NSW Perinatal Data Collection (SAPHaRI). Centre for Epidemiology and Evidence, NSW Ministry of Health.# Hospitals with more than 200 births in 2017 are identified individually.* Total NSW includes births at home assisted by independent midwives.† Wollongong Private Hospital opened in 2016.
Local Health District–Hospital2013 2014 2015 2016 2017
% % % % %
Far West Broken Hill Base 46.5 65.0 67.7 63.3 47.5
TOTAL 46.5 65.0 67.7 63.3 47.5
Private HospitalsMater, North Sydney
35.4 35.8 34.5 28.1 27.8
North Shore Private
36.0 31.3 30.3 31.2 29.8
Sydney Adventist
51.9 51.2 52.4 45.3 45.5
North Gosford Private
35.3 27.6 33.5 28.6 22.4
Hurstville Community
38.3 36.6 46.4 46.4 44.0
Kareena Private 34.9 27.9 34.2 28.9 30.6
St. George Private
33.0 27.8 32.8 33.2 28.0
Prince of Wales Private
28.6 29.7 30.9 30.7 26.9
TABLE 57: (Continued)
52 | NSW HEALTH | NSW Mothers and Babies 2017

Indicator 1.2Definition: The total number of selected primipara who undergo induction of labour as a percentage of the total number of selected primipara who give birth.
A selected primipara is defined as a woman who is 20–34 years of age at the time of giving birth; giving birth for the first time at 20 weeks or greater gestation; singleton pregnancy; cephalic presentation; and at 370 to 406 weeks gestation. Induction of labour is defined as surgical and/or medical induction.
Table 58 shows information for hospitals where at least 200 mothers gave birth in 2017, totals for hospitals for each local health district, and the NSW total.
TABLE 58: 1.2 SELECTED PRIMIPARA WHO UNDERGO INDUCTION OF LABOUR BY LOCAL HEALTH DISTRICT AND HOSPITAL, NSW 2013–2017#
Local Health District–Hospital2013 2014 2015 2016 2017
% % % % %
Sydney Canterbury 39.7 44.8 47.6 46.5 53.8
Royal Prince Alfred 34.6 36.3 38.2 38.4 42.9
TOTAL 35.7 38.4 40.5 40.2 45.5
South Western Sydney
Fairfield 25.9 30.4 28.9 30.8 38.0
Liverpool 33.0 33.2 34.3 39.8 41.6
Campbelltown 40.9 36.2 37.8 38.3 43.2
Bankstown–Lidcombe
34.0 33.6 39.6 41.1 41.7
Bowral 38.8 33.3 27.0 31.4 25.2
TOTAL 34.6 33.7 35.4 37.7 40.8
South Eastern Sydney
St. George 44.9 47.2 49.1 46.7 52.0
Sutherland 36.5 38.7 39.7 41.2 39.6
Royal Hospital for Women
41.9 40.5 37.7 38.4 44.6
TOTAL 41.9 42.4 41.7 41.6 46.4
Illawarra Shoalhaven
Shoalhaven 47.0 41.3 43.1 47.6 46.5
Wollongong 38.2 46.4 44.2 44.2 49.0
Other hospitals 18.8 11.8 0.0 0.0 0.0
TOTAL 39.7 44.4 43.7 45.1 48.4
Western Sydney
Auburn 34.1 38.8 43.0 40.4 49.7
Blacktown 46.0 43.9 45.8 45.9 48.4
Westmead 45.2 48.2 46.3 48.3 47.5
TOTAL 43.8 45.7 45.6 46.4 48.1
Nepean Blue Mountains
Blue Mountains 35.0 27.3 36.8 18.7 24.6
Nepean 45.5 48.4 48.1 45.6 48.3
Hawkesbury 47.3 47.0 44.3 51.1 44.4
Other hospitals 59.3 53.2 61.9 54.0 58.3
TOTAL 46.0 47.3 47.5 45.2 47.0
Northern Sydney
Hornsby 31.6 37.8 33.0 37.9 41.1
Manly 43.6 42.3 48.0 42.2 42.3
Mona Vale 37.4 30.8 36.0 31.0 39.1
Royal North Shore 45.2 45.1 44.2 45.1 48.7
Other hospitals 0.0 0.0 0.0 0.0 0.0
TOTAL 40.5 40.6 40.9 40.9 44.2
Central Coast Gosford 45.5 42.7 43.8 42.7 41.9
Other hospitals 0.0 0.0 0.0 0.0 0.0
TOTAL 42.5 41.2 42.1 40.8 40.7
Hunter New England
Armidale 39.6 32.0 29.8 28.4 43.6
Inverell 28.8 39.1 35.0 41.8 40.3
Tamworth Base 48.8 45.6 46.6 45.6 53.7
Manning Base 42.8 40.1 43.4 52.7 54.2
Maitland 48.0 43.9 45.6 49.1 49.6
John Hunter 43.1 46.0 47.1 51.0 52.5
Other hospitals 25.2 25.7 24.9 27.6 25.4
TOTAL 42.0 42.2 42.9 46.1 48.8
Northern NSW Grafton Base 41.9 39.7 42.0 38.5 42.5
Lismore Base 34.0 33.0 34.5 40.7 37.6
Tweed Heads 33.4 39.8 44.5 38.2 44.4
Other hospitals 1.8 0.0 0.0 16.9 0.0
TOTAL 32.7 34.6 37.9 37.2 38.8
Local Health District–Hospital2013 2014 2015 2016 2017
% % % % %
Mid North Coast
Coffs Harbour 37.4 34.3 36.0 44.4 42.1
Kempsey 36.4 27.6 34.5 22.0 29.6
Port Macquarie Base
39.6 41.5 45.0 47.4 48.8
Other hospitals 16.7 0.0 0.0 0.0 0.0
TOTAL 38.0 35.2 38.2 42.7 42.6
Southern NSW Bega 23.0 30.6 27.0 47.1 50.7
Goulburn Base 30.5 31.8 30.3 28.0 21.1
Moruya 30.2 27.1 30.3 31.9 29.3
Queanbeyan 23.7 30.6 30.0 39.0 43.1
Other hospitals 27.5 28.6 30.2 17.4 35.9
TOTAL 26.4 30.0 29.7 34.7 37.7
Murrumbidgee Griffith Base 30.7 41.0 45.5 37.1 38.9
Wagga Wagga Base 43.5 44.8 49.4 45.7 45.8
Other hospitals 30.3 28.0 27.4 27.4 22.5
TOTAL 35.5 38.7 42.7 39.3 39.0
Western NSW Dubbo Base 43.8 51.2 53.4 52.5 46.8
Mudgee 40.8 32.8 32.9 34.8 36.7
Bathurst Base 30.3 38.2 28.2 41.7 41.7
Orange Base 48.3 45.8 48.0 48.8 50.6
Other hospitals 23.3 33.0 28.7 30.6 26.9
TOTAL 40.2 43.7 43.0 45.7 44.0
Far West Broken Hill Base 25.6 46.7 30.6 40.0 35.6
TOTAL 25.6 46.7 30.6 40.0 35.6
Private Hospitals
Mater, North Sydney
29.1 32.0 27.8 28.2 27.7
North Shore Private 27.3 29.9 29.1 26.1 27.4
Sydney Adventist 31.3 28.1 30.5 29.4 32.7
North Gosford Private
45.4 44.8 47.7 45.2 52.6
Hurstville Community
41.1 29.6 34.0 26.8 31.4
Kareena Private 33.6 31.4 30.4 35.1 35.3
St. George Private 33.3 35.4 42.7 37.8 39.7
Prince of Wales Private
26.5 27.5 31.9 33.3 34.2
Norwest Private 49.8 49.2 51.8 55.5 51.5
Sydney Southwest Private
48.0 38.7 48.6 46.6 47.4
Nepean Private 45.3 53.8 57.8 62.5 63.9
Westmead Private 37.0 38.0 41.9 40.8 42.1
Wollongong Private† - - - 45.7 46.1
Newcastle Private 39.4 41.7 46.3 50.2 50.1
Calvary, Wagga Wagga
47.0 37.2 40.9 41.1 39.7
Other hospitals 47.3 49.3 49.8 0.0 0.0
TOTAL 36.4 36.7 39.4 38.8 39.7
TOTAL NSW* 38.6 39.5 40.8 41.3 43.7
Source: NSW Perinatal Data Collection (SAPHaRI). Centre for Epidemiology and Evidence, NSW Ministry of Health.# Hospitals with more than 200 births in 2017 are identified individually.* Total NSW includes births at home assisted by independent midwives.† Wollongong Private Hospital opened in 2016.
NSW HEALTH | NSW Mothers and Babies 2017 | 53

Indicator 1.3Definition: The total number of selected primipara who undergo an instrumental vaginal birth as a percentage of the total number of selected primipara who give birth.
A selected primipara is defined as a woman who is 20–34 years of age at the time of giving birth; giving birth for the first time at 20 weeks or greater gestation; singleton pregnancy; cephalic presentation; and at 370 to 406 weeks gestation. Instrumental vaginal birth is defined as forceps or vacuum.
Table 59 shows information for hospitals where at least 200 mothers gave birth in 2017, totals for hospitals for each local health district, and the NSW total.
TABLE 59: 1.3 SELECTED PRIMIPARA WHO UNDERGO AN INSTRUMENTAL VAGINAL BIRTH BY LOCAL HEALTH DISTRICT AND HOSPITAL, NSW 2013– 2017#
Local Health District–Hospital2013 2014 2015 2016 2017
% % % % %
Sydney Canterbury 19.9 22.8 24.6 27.6 32.0
Royal Prince Alfred 24.6 25.6 25.8 21.9 27.3
TOTAL 23.5 24.9 25.5 23.2 28.5
South Western Sydney
Fairfield 7.6 8.4 10.5 14.4 15.6
Liverpool 19.1 22.4 21.8 21.9 24.7
Campbelltown 13.4 14.3 17.2 21.4 18.9
Bankstown–Lidcombe
14.9 14.9 20.6 17.4 19.4
Bowral 19.7 22.6 25.4 24.6 23.2
TOTAL 14.6 16.2 18.5 19.7 20.4
South Eastern Sydney
St. George 24.7 26.8 27.2 29.7 30.7
Sutherland 23.2 23.9 25.8 23.8 22.9
Royal Hospital for Women
30.6 31.7 30.5 27.6 29.4
TOTAL 27.4 28.8 28.6 27.6 28.8
Illawarra Shoalhaven
Shoalhaven 22.8 15.7 15.4 17.8 22.2
Wollongong 21.0 21.0 21.7 24.5 24.8
Other hospitals 25.0 0.0 0.0 0.0 0.0
TOTAL 21.6 19.2 19.9 22.9 24.1
Western Sydney
Auburn 17.5 13.4 15.0 14.0 15.9
Blacktown 22.1 21.2 21.6 22.9 24.5
Westmead 26.9 23.2 21.2 22.6 24.8
TOTAL 24.1 21.2 20.4 21.5 23.4
Nepean Blue Mountains
Blue Mountains 18.3 9.1 19.1 25.3 9.8
Nepean 22.4 21.0 21.3 19.0 20.3
Hawkesbury 19.0 18.6 22.6 18.3 19.5
Other hospitals 6.8 6.4 11.1 10.0 6.3
TOTAL 20.8 19.5 20.9 19.0 19.3
Northern Sydney
Hornsby 18.4 22.2 28.2 24.4 28.1
Manly 25.3 26.3 27.7 27.5 30.6
Mona Vale 32.3 27.3 17.6 24.3 25.6
Royal North Shore 26.0 29.0 25.3 27.3 27.8
Other hospitals 0.0 2.7 0.0 0.0 0.0
TOTAL 24.6 26.6 24.9 26.1 27.7
Central Coast Gosford 30.8 29.0 26.7 26.4 26.2
Other hospitals 0.0 0.0 0.0 0.0 0.0
TOTAL 28.8 27.9 25.7 25.3 25.5
Hunter New England
Armidale 13.2 23.7 16.5 15.8 19.7
Inverell 11.9 10.9 23.3 21.8 14.9
Tamworth Base 25.6 26.7 21.1 21.3 23.4
Manning Base 26.4 30.6 28.3 26.0 29.5
Maitland 17.2 15.3 20.0 17.5 11.6
John Hunter 19.9 21.7 22.7 23.3 20.5
Other hospitals 16.7 13.7 14.9 14.0 10.7
TOTAL 19.6 20.5 21.2 20.8 18.7
Northern NSW Grafton Base 15.2 16.4 20.5 22.9 12.6
Lismore Base 23.6 18.3 16.9 23.6 19.0
Tweed Heads 18.4 21.2 20.9 18.8 21.1
Other hospitals 1.8 0.0 0.0 7.0 0.0
TOTAL 18.8 18.0 18.1 19.9 18.0
Local Health District–Hospital2013 2014 2015 2016 2017
% % % % %
Mid North Coast
Coffs Harbour 16.5 17.5 18.4 22.0 20.5
Kempsey 11.4 15.5 8.6 16.9 7.4
Port Macquarie Base
24.6 23.3 23.8 17.2 23.4
Other hospitals 33.3 36.4 0.0 0.0 20.0
TOTAL 19.6 19.6 18.8 19.5 20.3
Southern NSW Bega 24.6 18.1 17.5 16.2 19.4
Goulburn Base 28.0 27.3 32.9 20.0 22.4
Moruya 12.7 15.3 21.2 15.9 24.4
Queanbeyan 29.6 29.3 22.0 29.9 24.6
Other hospitals 10.0 8.9 3.8 10.9 10.3
TOTAL 23.9 22.2 20.8 21.4 22.3
Murrumbidgee Griffith Base 25.7 23.9 21.8 23.8 18.8
Wagga Wagga Base 20.8 15.4 20.3 20.8 19.4
Other hospitals 13.6 15.5 19.4 20.5 18.9
TOTAL 20.2 17.3 20.4 21.6 19.1
Western NSW Dubbo Base 21.7 23.0 20.9 25.8 21.5
Mudgee 11.3 19.7 19.2 26.1 18.3
Bathurst Base 12.7 20.1 16.2 20.9 18.9
Orange Base 23.4 23.9 26.6 18.1 21.9
Other hospitals 12.6 16.5 6.9 14.4 14.4
TOTAL 18.7 21.7 20.0 21.4 20.1
Far West Broken Hill Base 30.2 23.3 14.5 10.0 20.3
TOTAL 30.2 23.3 14.5 10.0 20.3
Private Hospitals
Mater, North Sydney
24.7 23.7 23.8 25.0 21.4
North Shore Private 26.1 24.7 26.4 22.7 20.8
Sydney Adventist 16.2 16.4 15.3 23.6 23.3
North Gosford Private
25.2 27.1 27.2 25.8 32.8
Hurstville Community
28.0 25.4 19.6 23.8 25.7
Kareena Private 26.2 32.8 24.5 26.9 28.5
St. George Private 29.6 29.3 28.9 28.0 30.7
Prince of Wales Private
26.0 22.0 24.2 24.7 23.3
Norwest Private 31.2 27.1 26.4 27.1 24.7
Sydney Southwest Private
28.1 24.8 35.6 33.4 30.8
Nepean Private 25.9 26.5 18.9 23.3 25.4
Westmead Private 25.3 24.1 25.6 22.1 24.5
Wollongong Private† - - - 36.0 29.0
Newcastle Private 29.0 26.7 25.4 30.1 25.1
Calvary, Wagga Wagga
17.4 23.0 24.8 22.1 16.7
Other hospitals 30.5 24.7 25.4 0.0 0.0
TOTAL 26.2 24.7 24.8 25.9 25.0
TOTAL NSW* 22.9 22.7 22.8 23.3 23.7
Source: NSW Perinatal Data Collection (SAPHaRI). Centre for Epidemiology and Evidence, NSW Ministry of Health.# Hospitals with more than 200 births in 2017 are identified individually.* Total NSW includes births at home assisted by independent midwives.† Wollongong Private Hospital opened in 2016.
54 | NSW HEALTH | NSW Mothers and Babies 2017

Indicator 1.4Definition: The total number of selected primipara undergoing caesarean section as a percentage of the total number of selected primipara who give birth.
A selected primipara is defined as a woman who is 20–34 years of age at the time of giving birth; giving birth for the first time at 20 weeks or greater gestation; singleton pregnancy; cephalic presentation; and at 370 to 406 weeks gestation.
Table 60 shows information for hospitals where at least 200 mothers gave birth in 2017, totals for hospitals for each local health district, and the NSW total.
TABLE 60: 1.4 SELECTED PRIMIPARA UNDERGOING CAESAREAN SECTION BY LOCAL HEALTH DISTRICT AND HOSPITAL, NSW 2013–2017#
Local Health District–Hospital2013 2014 2015 2016 2017
% % % % %
Sydney Canterbury 25.4 25.5 25.8 29.8 30.4
Royal Prince Alfred 22.5 22.0 22.0 26.6 22.1
TOTAL 23.1 22.8 23.0 27.3 24.1
South Western Sydney
Fairfield 12.5 15.2 20.0 21.3 22.2
Liverpool 17.7 18.8 18.3 22.0 22.5
Campbelltown 20.9 23.6 21.3 22.2 22.4
Bankstown–Lidcombe
21.1 20.7 19.9 33.9 23.1
Bowral 23.1 32.1 26.2 34.7 25.8
TOTAL 18.7 20.6 20.1 24.6 22.7
South Eastern Sydney
St. George 22.7 22.5 26.5 25.5 25.4
Sutherland 18.9 18.2 21.4 19.8 22.4
Royal Hospital for Women
18.9 19.6 22.1 22.5 25.1
TOTAL 20.1 20.3 23.4 23.0 24.8
Illawarra Shoalhaven
Shoalhaven 24.7 26.5 35.6 29.3 28.3
Wollongong 27.0 28.4 26.0 22.9 28.8
Other hospitals 25.0 11.8 0.0 0.0 0.0
TOTAL 26.3 27.6 28.5 24.5 28.7
Western Sydney
Auburn 18.3 20.6 23.3 22.2 23.0
Blacktown 29.7 29.9 27.7 25.7 24.5
Westmead 23.1 24.2 26.4 23.5 21.3
TOTAL 24.3 25.3 26.3 24.0 22.5
Nepean Blue Mountains
Blue Mountains 35.0 15.2 27.9 22.7 29.5
Nepean 32.7 33.3 35.6 34.8 30.5
Hawkesbury 37.6 37.2 33.9 33.9 33.7
Other hospitals 32.2 38.3 33.3 28.0 37.5
TOTAL 33.7 33.2 34.8 33.8 31.1
Northern Sydney
Hornsby 20.1 18.1 17.6 24.9 21.4
Manly 21.5 24.9 23.4 26.9 22.4
Mona Vale 24.2 19.4 22.5 23.5 20.2
Royal North Shore 28.2 21.6 21.8 24.9 24.3
Other hospitals 0.0 0.0 0.0 0.0 0.0
TOTAL 24.5 20.9 20.9 24.7 22.6
Central Coast Gosford 25.2 26.9 22.0 23.9 24.4
Other hospitals 0.0 0.0 0.0 0.0 0.0
TOTAL 23.6 26.0 21.2 22.9 23.7
Hunter New England
Armidale 24.2 37.1 38.8 32.6 29.1
Inverell 52.5 42.2 33.3 27.3 25.4
Tamworth Base 23.6 16.1 28.2 27.6 32.1
Manning Base 17.0 14.6 23.3 19.3 19.9
Maitland 26.5 23.4 21.6 20.2 30.1
John Hunter 25.9 24.1 23.4 25.6 26.7
Other hospitals 17.4 18.9 19.5 15.0 24.1
TOTAL 24.7 23.0 24.2 23.6 27.2
Northern NSWGrafton Base 32.4 23.3 26.1 18.8 25.3
Lismore Base 20.4 22.6 18.8 22.2 13.6
Tweed Heads 20.0 24.9 17.6 18.2 20.7
Other hospitals 1.8 1.6 1.8 8.5 0.0
TOTAL 20.4 22.2 17.8 18.8 17.3
Local Health District–Hospital2013 2014 2015 2016 2017
% % % % %
Mid North Coast
Coffs Harbour 29.1 27.9 25.5 29.6 27.2
Kempsey 18.2 24.1 32.8 18.6 25.9
Port Macquarie Base
18.4 26.7 26.5 30.7 20.5
Other hospitals 0.0 0.0 0.0 0.0 0.0
TOTAL 23.5 26.5 26.0 28.6 24.2
Southern NSW Bega 26.2 27.8 28.6 29.4 29.9
Goulburn Base 23.2 24.2 25.0 40.0 34.2
Moruya 22.2 22.0 27.3 24.6 24.4
Queanbeyan 18.4 26.1 28.7 18.2 30.8
Other hospitals 32.5 17.9 13.2 10.9 12.8
TOTAL 22.6 24.4 25.7 24.3 28.6
Murrumbidgee Griffith Base 22.1 31.6 29.1 27.3 23.5
Wagga Wagga Base 26.2 32.4 36.5 29.4 34.4
Other hospitals 21.2 21.7 14.5 25.6 15.3
TOTAL 23.4 28.9 29.1 28.0 27.4
Western NSW Dubbo Base 26.6 28.2 27.1 22.9 27.9
Mudgee 15.5 21.3 24.7 17.4 35.0
Bathurst Base 30.3 29.2 18.3 21.6 19.7
Orange Base 29.9 27.3 20.6 32.3 30.8
Other hospitals 29.1 26.6 24.8 18.9 24.0
TOTAL 27.6 27.4 23.3 24.5 27.5
Far West Broken Hill Base 23.3 11.7 17.7 26.7 32.2
TOTAL 23.3 11.7 17.7 26.7 32.2
Private Hospitals
Mater, North Sydney
39.5 40.1 41.6 47.0 50.8
North Shore Private 37.9 44.0 43.2 46.1 49.4
Sydney Adventist 31.9 32.4 32.3 30.9 31.2
North Gosford Private
38.5 45.2 39.3 45.6 44.8
Hurstville Community
33.6 38.0 34.0 29.8 30.4
Kareena Private 38.4 39.3 41.4 44.2 40.4
St. George Private 37.4 42.9 38.3 38.9 41.3
Prince of Wales Private
45.2 48.2 44.9 44.6 49.8
Norwest Private 28.1 26.2 33.7 30.1 32.8
Sydney Southwest Private
23.8 28.9 28.2 27.1 28.7
Nepean Private 42.5 32.8 39.0 38.7 32.2
Westmead Private 38.3 40.5 37.0 37.8 36.3
Wollongong Private† - - - 32.0 31.3
Newcastle Private 28.0 33.9 33.8 34.9 39.7
Calvary, Wagga Wagga
59.1 53.4 49.6 42.1 50.0
Other hospitals 34.3 41.9 41.0 100.0 0.0
TOTAL 36.3 38.5 38.2 38.4 40.2
TOTAL NSW* 26.5 27.3 27.4 28.2 28.2
Source: NSW Perinatal Data Collection (SAPHaRI). Centre for Epidemiology and Evidence, NSW Ministry of Health.# Hospitals with more than 200 births in 2017 are identified individually.* Total NSW includes births at home assisted by independent midwives.† Wollongong Private Hospital opened in 2016.
NSW HEALTH | NSW Mothers and Babies 2017 | 55

Vaginal birth following caesarean sectionIndicator 2.1Definition: Total number of women delivering vaginally following a previous primary caesarean section at 20 weeks or greater gestation as a percentage of the total number of women delivering by any route who have had a previous primary caesarean section at 20 weeks or greater gestation and no intervening pregnancies.
Table 61 shows information for hospitals where at least 200 mothers gave birth in 2017, totals for hospitals for each local health district, and the NSW total.
TABLE 61: 2.1 VAGINAL DELIVERY AFTER PREVIOUS PRIMARY CAESAREAN SECTION BY LOCAL HEALTH DISTRICT AND HOSPITAL, NSW 2013–2017#
Local Health District–Hospital2013 2014 2015 2016 2017
% % % % %
Sydney Canterbury 8.2 10.9 12.2 22.4 16.4
Royal Prince Alfred 15.4 11.3 13.9 12.0 14.5
TOTAL 13.5 11.2 13.5 15.7 15.1
South Western Sydney
Fairfield 1.9 4.6 1.8 0.0 3.4
Liverpool 13.8 14.8 8.9 20.7 17.8
Campbelltown 20.1 20.6 19.0 22.4 22.9
Bankstown–Lidcombe
15.6 18.9 13.0 19.7 21.0
Bowral 5.4 15.2 4.2 10.3 13.0
TOTAL 14.2 16.0 11.7 18.1 18.2
South Eastern Sydney
St. George 14.6 17.9 13.3 13.3 11.1
Sutherland 0.0 3.4 1.2 1.3 0.0
Royal Hospital for Women
12.0 9.7 10.5 10.4 8.9
Other hospitals 0.0 0.0 0.0 0.0 0.0
TOTAL 11.6 11.9 10.4 10.4 8.3
Illawarra Shoalhaven
Shoalhaven 16.1 19.8 6.8 7.4 6.1
Wollongong 12.3 13.6 10.2 14.9 16.3
Other hospitals 0.0 0.0 0.0 0.0 0.0
TOTAL 13.5 15.5 9.3 13.1 13.3
Western Sydney
Auburn 2.8 1.2 2.6 4.9 2.2
Blacktown 13.0 11.0 9.9 12.4 12.1
Westmead 15.9 15.1 15.0 12.4 13.3
TOTAL 14.0 12.7 12.5 11.9 12.1
Nepean Blue Mountains
Blue Mountains 12.5 6.5 0.0 0.0 0.0
Nepean 12.0 9.3 12.7 12.1 10.9
Hawkesbury 10.7 5.1 14.4 14.4 11.2
Other hospitals 6.3 10.0 0.0 0.0 0.0
TOTAL 11.6 8.5 11.9 11.4 10.5
Northern Sydney
Hornsby 12.9 14.4 13.0 15.4 16.0
Manly 16.0 8.4 7.3 14.0 4.8
Mona Vale 5.6 4.1 11.1 16.2 15.6
Royal North Shore 10.0 12.1 8.8 12.3 4.2
TOTAL 11.3 11.1 9.7 13.6 8.7
Central Coast Gosford 14.2 11.9 12.9 13.4 12.9
TOTAL 14.2 11.9 12.9 13.4 12.9
Hunter New England
Armidale 18.2 7.1 22.9 8.9 12.5
Inverell 11.1 11.4 12.0 14.0 11.5
Tamworth Base 18.9 4.3 10.0 15.6 12.5
Manning Base 22.6 14.5 20.6 21.9 7.4
Maitland 17.1 20.1 21.3 11.5 8.0
John Hunter 19.4 17.8 14.3 14.8 16.7
Other hospitals 11.5 12.0 10.0 3.7 6.7
TOTAL 18.0 15.3 15.4 13.5 13.1
Northern NSW Grafton Base 16.3 11.8 16.7 13.0 7.0
Lismore Base 16.2 20.6 20.4 26.8 21.2
Tweed Heads 21.1 35.2 11.1 18.9 26.1
Other hospitals 0.0 0.0 0.0 25.0 0.0
TOTAL 16.6 22.8 15.2 21.5 21.0
Local Health District–Hospital2013 2014 2015 2016 2017
% % % % %
Mid North Coast
Coffs Harbour 5.9 5.8 6.7 6.3 9.4
Kempsey 30.0 27.3 22.2 21.7 0.0
Port Macquarie Base
15.9 17.9 11.0 12.5 14.3
TOTAL 11.9 12.2 10.1 9.8 10.6
Southern NSW Bega 5.3 18.8 8.7 13.3 3.8
Goulburn Base 15.6 32.5 22.2 13.8 24.0
Moruya 10.3 8.6 20.0 10.3 16.7
Queanbeyan 3.2 11.8 0.0 7.3 4.1
Other hospitals 9.1 16.7 15.8 50.0 8.3
TOTAL 9.0 18.3 13.2 14.3 10.6
Murrumbidgee Griffith Base 20.5 20.8 10.7 15.3 24.1
Wagga Wagga Base 6.9 5.3 8.1 11.4 4.4
Other hospitals 7.5 10.2 14.3 16.7 5.6
TOTAL 10.1 10.4 10.5 13.4 9.5
Western NSW Dubbo Base 17.8 9.7 13.8 11.2 16.3
Mudgee 3.7 4.3 4.8 7.7 26.1
Bathurst Base 12.0 8.8 19.0 11.1 10.0
Orange Base 13.2 14.5 12.3 18.5 11.7
Other hospitals 8.5 28.9 20.0 17.1 13.6
TOTAL 12.8 13.3 14.1 14.4 14.2
Far West Broken Hill Base 16.0 6.7 15.8 8.7 11.8
TOTAL 16.0 6.7 15.8 8.7 11.8
Private Hospitals
Mater, North Sydney
5.7 1.9 4.1 4.4 2.5
North Shore Private 5.1 4.5 6.0 2.8 4.7
Sydney Adventist 8.8 7.3 5.3 5.7 6.7
North Gosford Private
7.9 7.7 5.5 5.1 1.6
Hurstville Community
5.2 5.6 4.7 5.6 1.3
Kareena Private 7.9 4.7 3.1 7.1 7.7
St. George Private 4.7 3.5 4.3 3.7 2.6
Prince of Wales Private
2.8 2.5 2.8 1.5 2.1
Norwest Private 5.0 5.9 5.6 5.6 7.3
Sydney Southwest Private
0.8 1.4 0.0 0.9 0.0
Nepean Private 5.2 6.0 4.7 7.1 1.5
Westmead Private 5.0 3.8 5.4 3.4 3.5
Wollongong Private† - - - 2.5 4.5
Newcastle Private 5.6 6.5 3.3 6.3 4.3
Calvary, Wagga Wagga
5.7 0.0 3.3 1.1 2.8
Other hospitals 4.1 2.4 4.8 0.0 0.0
TOTAL 5.2 4.3 4.4 4.1 3.9
TOTAL NSW* 10.8 10.2 9.6 10.5 10.1
Source: NSW Perinatal Data Collection (SAPHaRI). Centre for Epidemiology and Evidence, NSW Ministry of Health.# Hospitals with more than 200 births in 2017 are identified individually.* Total NSW includes births at home assisted by independent midwives.† Wollongong Private Hospital opened in 2016.
56 | NSW HEALTH | NSW Mothers and Babies 2017

Major perineal tears and surgical repair of the perineumIndicator 3.1Definition: Total number of selected primipara with an intact perineum (other than superficial grazes) while giving birth vaginally as a percentage of the total number of selected primipara delivering vaginally.
A selected primipara is defined as a woman who is 20–34 years of age at the time of giving birth; giving birth for the first time at 20 weeks or greater gestation; singleton pregnancy; cephalic presentation; and at 370 to 406 weeks gestation.
Table 62 shows information for hospitals where at least 200 mothers gave birth in 2017, totals for hospitals for each local health district, and the NSW total.
TABLE 62: 3.1 SELECTED PRIMIPARA DELIVERING VAGINALLY WITH AN INTACT PERINEUM BY LOCAL HEALTH DISTRICT AND HOSPITAL, NSW 2013–2017#
Local Health District–Hospital2013 2014 2015 2016 2017
% % % % %
Sydney Canterbury 10.5 6.2 7.0 5.4 4.7
Royal Prince Alfred 9.6 8.8 8.0 7.8 7.8
TOTAL 9.8 8.2 7.7 7.3 7.1
South Western Sydney
Fairfield 24.6 21.0 19.3 13.1 12.6
Liverpool 11.4 15.4 12.1 10.8 8.3
Campbelltown 23.6 20.4 20.0 10.7 9.9
Bankstown–Lidcombe
14.9 14.7 14.0 7.5 11.1
Bowral 28.3 21.3 18.9 17.1 22.3
TOTAL 18.8 17.9 16.2 10.8 10.6
South Eastern Sydney
St. George 9.9 8.3 8.0 5.0 3.3
Sutherland 13.0 11.9 10.2 5.2 6.5
Royal Hospital for Women
11.4 9.6 11.9 10.3 8.9
TOTAL 11.2 9.6 10.4 7.6 6.6
Illawarra Shoalhaven
Shoalhaven 40.1 38.4 43.0 21.4 26.1
Wollongong 13.7 10.1 12.6 8.0 7.4
Other hospitals 25.0 40.0 33.3 0.0 0.0
TOTAL 20.7 18.1 20.1 11.1 12.1
Western Sydney
Auburn 16.2 10.3 11.3 5.6 7.5
Blacktown 6.8 6.3 9.1 4.4 5.2
Westmead 7.3 7.7 6.5 5.2 4.8
TOTAL 8.6 7.7 8.0 5.0 5.3
Nepean Blue Mountains
Blue Mountains 15.4 19.6 24.5 10.3 2.3
Nepean 12.1 10.5 11.9 7.5 8.1
Hawkesbury 25.5 28.1 23.3 21.1 16.9
Other hospitals 15.0 24.1 9.5 5.6 13.3
TOTAL 14.8 14.3 14.4 9.4 9.3
Northern Sydney
Hornsby 15.4 11.4 9.5 5.6 4.9
Manly 11.0 15.6 12.7 9.4 7.3
Mona Vale 15.3 22.1 23.8 15.9 17.4
Royal North Shore 9.3 7.2 9.2 6.2 4.8
Other hospitals 51.6 48.6 34.3 46.2 30.8
TOTAL 12.5 12.3 12.2 8.5 7.4
Central Coast Gosford 9.6 11.7 12.1 8.6 7.1
Other hospitals 49.0 44.8 28.1 25.7 27.3
TOTAL 13.0 13.3 12.8 9.6 7.9
Hunter New England
Armidale 24.6 16.4 28.4 18.8 22.9
Inverell 42.9 37.8 32.5 40.0 40.0
Tamworth Base 21.1 18.1 14.1 13.7 11.5
Manning Base 30.3 20.1 21.3 19.0 9.0
Maitland 24.3 22.4 19.2 13.9 12.8
John Hunter 12.6 11.8 13.1 9.9 5.5
Other hospitals 28.8 26.2 27.1 27.6 31.2
TOTAL 19.9 17.4 17.6 15.1 12.1
Northern NSW Grafton Base 39.4 39.3 35.4 35.9 38.5
Lismore Base 25.7 27.8 27.5 15.4 17.4
Tweed Heads 25.5 17.3 11.0 15.7 12.4
Other hospitals 42.9 46.7 50.9 32.3 46.5
Local Health District–Hospital2013 2014 2015 2016 2017
% % % % %
TOTAL 28.0 26.5 22.0 19.7 19.8
Mid North Coast
Coffs Harbour 14.4 15.3 15.6 16.5 11.8
Kempsey 36.1 31.8 25.6 27.1 17.5
Port Macquarie Base
20.1 8.5 12.2 10.5 8.6
Other hospitals 33.3 36.4 25.0 50.0 40.0
TOTAL 19.2 15.5 15.7 16.1 11.8
Southern NSW Bega 37.8 28.8 24.4 16.7 23.4
Goulburn Base 14.3 12.0 12.3 11.1 16.0
Moruya 32.7 32.6 35.4 21.2 22.6
Queanbeyan 29.8 35.3 29.9 26.2 17.1
Other hospitals 48.1 45.7 58.7 58.5 52.9
TOTAL 29.9 31.6 31.0 26.0 22.4
Murrumbidgee Griffith Base 34.9 28.8 32.1 24.0 24.6
Wagga Wagga Base 25.8 25.8 20.3 17.4 11.2
Other hospitals 43.3 37.3 31.1 32.2 30.9
TOTAL 34.1 30.4 26.4 22.6 19.9
Western NSW Dubbo Base 23.5 25.7 23.5 17.8 9.3
Mudgee 21.7 25.0 23.6 21.1 12.8
Bathurst Base 23.2 17.6 23.3 11.9 12.7
Orange Base 14.2 12.1 16.5 10.8 12.3
Other hospitals 27.4 28.8 39.5 20.0 22.8
TOTAL 20.9 20.9 23.2 15.6 12.7
Far West Broken Hill Base 21.2 45.3 47.1 45.5 22.5
TOTAL 21.2 45.3 47.1 45.5 22.5
Private Hospitals
Mater, North Sydney
15.1 13.9 11.1 7.0 6.9
North Shore Private 12.4 12.5 10.0 5.2 4.8
Sydney Adventist 14.2 10.7 12.5 10.3 9.3
North Gosford Private
11.9 11.3 11.0 9.3 5.7
Hurstville Community
11.3 12.1 10.2 15.8 6.0
Kareena Private 7.8 7.2 9.4 6.7 4.3
St. George Private 8.9 8.2 10.4 7.3 6.0
Prince of Wales Private
12.3 11.0 11.0 6.4 6.0
Norwest Private 12.3 12.0 12.7 5.5 6.4
Sydney Southwest Private
10.0 12.8 6.9 5.9 4.9
Nepean Private 6.3 3.8 5.9 1.3 1.4
Westmead Private 3.0 4.7 6.1 2.3 3.3
Wollongong Private† - - - 2.9 2.3
Newcastle Private 13.8 17.2 8.7 4.9 6.9
Calvary, Wagga Wagga
11.1 14.5 15.9 12.7 7.7
Other hospitals 4.8 5.2 6.3 0.0 0.0
TOTAL 10.7 10.7 9.8 6.2 5.6
TOTAL NSW* 14.7 13.7 13.4 9.7 8.9
Source: NSW Perinatal Data Collection (SAPHaRI). Centre for Epidemiology and Evidence, NSW Ministry of Health.# Hospitals with more than 200 births in 2017 are identified individually.* Total NSW includes births at home assisted by independent midwives.† Wollongong Private Hospital opened in 2016.
NSW HEALTH | NSW Mothers and Babies 2017 | 57
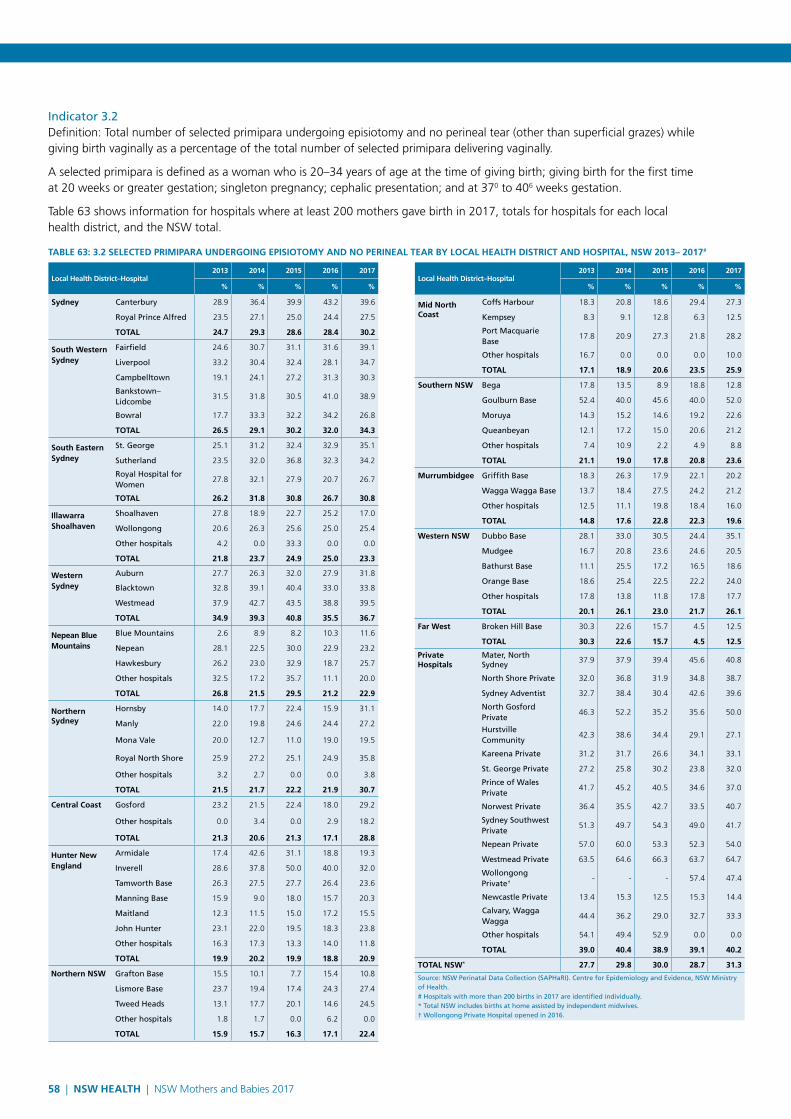
Indicator 3.2Definition: Total number of selected primipara undergoing episiotomy and no perineal tear (other than superficial grazes) while giving birth vaginally as a percentage of the total number of selected primipara delivering vaginally.
A selected primipara is defined as a woman who is 20–34 years of age at the time of giving birth; giving birth for the first time at 20 weeks or greater gestation; singleton pregnancy; cephalic presentation; and at 370 to 406 weeks gestation.
Table 63 shows information for hospitals where at least 200 mothers gave birth in 2017, totals for hospitals for each local health district, and the NSW total.
TABLE 63: 3.2 SELECTED PRIMIPARA UNDERGOING EPISIOTOMY AND NO PERINEAL TEAR BY LOCAL HEALTH DISTRICT AND HOSPITAL, NSW 2013– 2017#
Local Health District–Hospital2013 2014 2015 2016 2017
% % % % %
Sydney Canterbury 28.9 36.4 39.9 43.2 39.6
Royal Prince Alfred 23.5 27.1 25.0 24.4 27.5
TOTAL 24.7 29.3 28.6 28.4 30.2
South Western Sydney
Fairfield 24.6 30.7 31.1 31.6 39.1
Liverpool 33.2 30.4 32.4 28.1 34.7
Campbelltown 19.1 24.1 27.2 31.3 30.3
Bankstown–Lidcombe
31.5 31.8 30.5 41.0 38.9
Bowral 17.7 33.3 32.2 34.2 26.8
TOTAL 26.5 29.1 30.2 32.0 34.3
South Eastern Sydney
St. George 25.1 31.2 32.4 32.9 35.1
Sutherland 23.5 32.0 36.8 32.3 34.2
Royal Hospital for Women
27.8 32.1 27.9 20.7 26.7
TOTAL 26.2 31.8 30.8 26.7 30.8
Illawarra Shoalhaven
Shoalhaven 27.8 18.9 22.7 25.2 17.0
Wollongong 20.6 26.3 25.6 25.0 25.4
Other hospitals 4.2 0.0 33.3 0.0 0.0
TOTAL 21.8 23.7 24.9 25.0 23.3
Western Sydney
Auburn 27.7 26.3 32.0 27.9 31.8
Blacktown 32.8 39.1 40.4 33.0 33.8
Westmead 37.9 42.7 43.5 38.8 39.5
TOTAL 34.9 39.3 40.8 35.5 36.7
Nepean Blue Mountains
Blue Mountains 2.6 8.9 8.2 10.3 11.6
Nepean 28.1 22.5 30.0 22.9 23.2
Hawkesbury 26.2 23.0 32.9 18.7 25.7
Other hospitals 32.5 17.2 35.7 11.1 20.0
TOTAL 26.8 21.5 29.5 21.2 22.9
Northern Sydney
Hornsby 14.0 17.7 22.4 15.9 31.1
Manly 22.0 19.8 24.6 24.4 27.2
Mona Vale 20.0 12.7 11.0 19.0 19.5
Royal North Shore 25.9 27.2 25.1 24.9 35.8
Other hospitals 3.2 2.7 0.0 0.0 3.8
TOTAL 21.5 21.7 22.2 21.9 30.7
Central Coast Gosford 23.2 21.5 22.4 18.0 29.2
Other hospitals 0.0 3.4 0.0 2.9 18.2
TOTAL 21.3 20.6 21.3 17.1 28.8
Hunter New England
Armidale 17.4 42.6 31.1 18.8 19.3
Inverell 28.6 37.8 50.0 40.0 32.0
Tamworth Base 26.3 27.5 27.7 26.4 23.6
Manning Base 15.9 9.0 18.0 15.7 20.3
Maitland 12.3 11.5 15.0 17.2 15.5
John Hunter 23.1 22.0 19.5 18.3 23.8
Other hospitals 16.3 17.3 13.3 14.0 11.8
TOTAL 19.9 20.2 19.9 18.8 20.9
Northern NSW Grafton Base 15.5 10.1 7.7 15.4 10.8
Lismore Base 23.7 19.4 17.4 24.3 27.4
Tweed Heads 13.1 17.7 20.1 14.6 24.5
Other hospitals 1.8 1.7 0.0 6.2 0.0
TOTAL 15.9 15.7 16.3 17.1 22.4
Local Health District–Hospital2013 2014 2015 2016 2017
% % % % %
Mid North Coast
Coffs Harbour 18.3 20.8 18.6 29.4 27.3
Kempsey 8.3 9.1 12.8 6.3 12.5
Port Macquarie Base
17.8 20.9 27.3 21.8 28.2
Other hospitals 16.7 0.0 0.0 0.0 10.0
TOTAL 17.1 18.9 20.6 23.5 25.9
Southern NSW Bega 17.8 13.5 8.9 18.8 12.8
Goulburn Base 52.4 40.0 45.6 40.0 52.0
Moruya 14.3 15.2 14.6 19.2 22.6
Queanbeyan 12.1 17.2 15.0 20.6 21.2
Other hospitals 7.4 10.9 2.2 4.9 8.8
TOTAL 21.1 19.0 17.8 20.8 23.6
Murrumbidgee Griffith Base 18.3 26.3 17.9 22.1 20.2
Wagga Wagga Base 13.7 18.4 27.5 24.2 21.2
Other hospitals 12.5 11.1 19.8 18.4 16.0
TOTAL 14.8 17.6 22.8 22.3 19.6
Western NSW Dubbo Base 28.1 33.0 30.5 24.4 35.1
Mudgee 16.7 20.8 23.6 24.6 20.5
Bathurst Base 11.1 25.5 17.2 16.5 18.6
Orange Base 18.6 25.4 22.5 22.2 24.0
Other hospitals 17.8 13.8 11.8 17.8 17.7
TOTAL 20.1 26.1 23.0 21.7 26.1
Far West Broken Hill Base 30.3 22.6 15.7 4.5 12.5
TOTAL 30.3 22.6 15.7 4.5 12.5
Private Hospitals
Mater, North Sydney
37.9 37.9 39.4 45.6 40.8
North Shore Private 32.0 36.8 31.9 34.8 38.7
Sydney Adventist 32.7 38.4 30.4 42.6 39.6
North Gosford Private
46.3 52.2 35.2 35.6 50.0
Hurstville Community
42.3 38.6 34.4 29.1 27.1
Kareena Private 31.2 31.7 26.6 34.1 33.1
St. George Private 27.2 25.8 30.2 23.8 32.0
Prince of Wales Private
41.7 45.2 40.5 34.6 37.0
Norwest Private 36.4 35.5 42.7 33.5 40.7
Sydney Southwest Private
51.3 49.7 54.3 49.0 41.7
Nepean Private 57.0 60.0 53.3 52.3 54.0
Westmead Private 63.5 64.6 66.3 63.7 64.7
Wollongong Private† - - - 57.4 47.4
Newcastle Private 13.4 15.3 12.5 15.3 14.4
Calvary, Wagga Wagga
44.4 36.2 29.0 32.7 33.3
Other hospitals 54.1 49.4 52.9 0.0 0.0
TOTAL 39.0 40.4 38.9 39.1 40.2
TOTAL NSW* 27.7 29.8 30.0 28.7 31.3
Source: NSW Perinatal Data Collection (SAPHaRI). Centre for Epidemiology and Evidence, NSW Ministry of Health.# Hospitals with more than 200 births in 2017 are identified individually.* Total NSW includes births at home assisted by independent midwives.† Wollongong Private Hospital opened in 2016.
58 | NSW HEALTH | NSW Mothers and Babies 2017

Indicator 3.3Definition: Total number of selected primipara sustaining a perineal tear and no episiotomy while giving birth vaginally as a percentage of the total number of selected primipara delivering vaginally.
A selected primipara is defined as a woman who is 20–34 years of age at the time of giving birth; giving birth for the first time at 20 weeks or greater gestation; singleton pregnancy; cephalic presentation; and at 370 to 406 weeks gestation.
Table 64 shows information for hospitals where at least 200 mothers gave birth in 2017, totals for hospitals for each local health district, and the NSW total.
TABLE 64: 3.3 SELECTED PRIMIPARA SUSTAINING A PERINEAL TEAR AND NO EPISIOTOMY BY LOCAL HEALTH DISTRICT AND HOSPITAL, NSW 2013–2017#
Local Health District–Hospital2013 2014 2015 2016 2017
% % % % %
Sydney Canterbury 59.2 51.4 48.1 42.4 40.3
Royal Prince Alfred 60.9 56.9 61.7 63.2 59.5
TOTAL 60.5 55.6 58.4 58.8 55.2
South Western Sydney
Fairfield 54.2 50.8 53.6 53.9 48.1
Liverpool 53.9 53.0 51.0 59.8 51.5
Campbelltown 63.7 61.5 57.2 58.5 59.7
Bankstown–Lidcombe
47.8 47.6 49.9 43.3 41.9
Bowral 58.4 43.5 50.0 56.6 50.9
TOTAL 55.8 53.5 53.1 55.5 52.1
South Eastern Sydney
St. George 56.1 51.0 52.6 48.2 45.3
Sutherland 57.8 49.9 47.8 50.9 47.4
Royal Hospital for Women
57.5 53.7 55.7 62.2 56.6
TOTAL 57.1 52.2 53.4 55.6 51.2
Illawarra Shoalhaven
Shoalhaven 56.2 63.4 51.7 62.9 61.8
Wollongong 61.8 61.9 59.1 61.9 62.6
Other hospitals 75.0 80.0 33.3 0.0 0.0
TOTAL 60.9 62.7 57.2 62.2 62.4
Western Sydney
Auburn 57.7 60.9 51.9 52.9 48.0
Blacktown 50.7 44.6 44.4 44.3 45.4
Westmead 43.5 35.9 39.4 38.6 37.1
TOTAL 47.7 42.0 42.8 42.4 41.1
Nepean Blue Mountains
Blue Mountains 87.2 69.6 73.5 77.6 72.1
Nepean 56.0 62.5 54.1 57.4 57.1
Hawkesbury 56.7 61.5 50.0 63.4 61.0
Other hospitals 52.5 62.1 54.8 75.0 56.7
TOTAL 57.5 62.8 54.5 60.1 58.4
Northern Sydney
Hornsby 69.6 70.9 58.3 63.8 51.6
Manly 59.6 58.9 53.6 58.5 54.9
Mona Vale 66.0 69.6 70.3 64.1 60.5
Royal North Shore 55.6 55.1 57.3 55.1 50.2
Other hospitals 96.8 81.1 88.6 88.5 84.6
TOTAL 61.4 61.2 59.2 59.0 53.3
Central Coast Gosford 57.4 59.9 60.6 65.8 53.6
Other hospitals 86.3 86.2 87.5 94.3 68.2
TOTAL 59.8 61.1 61.9 67.4 54.2
Hunter New England
Armidale 65.2 41.0 52.7 68.8 57.8
Inverell 57.1 45.9 35.0 50.0 44.0
Tamworth Base 59.3 54.9 57.6 55.8 58.1
Manning Base 66.7 72.4 63.9 66.9 63.9
Maitland 70.8 70.7 69.4 71.4 66.9
John Hunter 61.9 63.0 65.1 65.6 59.7
Other hospitals 60.1 64.4 65.2 67.9 72.9
TOTAL 63.4 63.3 63.9 65.6 61.9
Northern NSW Grafton Base 56.3 73.0 73.8 69.2 64.6
Lismore Base 59.3 69.0 69.1 61.2 62.7
Tweed Heads 69.9 62.5 67.1 71.8 54.8
Other hospitals 78.6 91.7 80.0 86.2 86.0
TOTAL 65.9 68.8 69.5 69.4 61.4
Local Health District–Hospital2013 2014 2015 2016 2017
% % % % %
Mid North Coast
Coffs Harbour 65.0 67.3 68.3 57.2 54.1
Kempsey 69.4 77.3 69.2 77.1 60.0
Port Macquarie Base
63.9 65.9 49.6 69.2 50.3
Other hospitals 66.7 100.0 83.3 100.0 80.0
TOTAL 65.0 68.9 62.2 64.4 53.8
Southern NSW Bega 60.0 57.7 68.9 64.6 66.0
Goulburn Base 30.2 46.0 42.1 46.7 36.0
Moruya 69.4 71.7 62.5 75.0 66.1
Queanbeyan 67.7 50.9 74.8 63.5 62.3
Other hospitals 63.0 60.9 71.7 63.4 67.6
TOTAL 58.8 55.8 65.3 63.1 60.2
Murrumbidgee Griffith Base 65.1 56.3 66.7 60.6 65.8
Wagga Wagga Base 67.7 61.3 55.6 58.9 60.3
Other hospitals 55.8 59.5 55.7 58.6 62.8
TOTAL 63.2 59.6 58.2 59.3 62.5
Western NSW Dubbo Base 49.5 44.7 54.5 62.0 46.7
Mudgee 75.0 58.3 65.5 64.9 61.5
Bathurst Base 76.8 63.7 66.4 66.1 64.7
Orange Base 61.7 57.2 58.0 54.5 55.6
Other hospitals 61.6 58.8 67.1 62.2 62.0
TOTAL 61.5 54.4 60.0 61.0 55.0
Far West Broken Hill Base 51.5 66.0 76.5 81.8 75.0
TOTAL 51.5 66.0 76.5 81.8 75.0
Private Hospitals
Mater, North Sydney
38.8 38.6 42.6 47.4 52.0
North Shore Private 53.5 45.2 56.2 50.6 52.3
Sydney Adventist 51.9 48.9 55.4 47.1 50.3
North Gosford Private
35.8 28.7 40.7 39.8 33.0
Hurstville Community
43.7 44.7 50.8 57.6 64.7
Kareena Private 56.0 56.1 63.3 52.6 53.2
St. George Private 62.1 64.6 59.4 65.7 60.1
Prince of Wales Private
40.3 35.9 36.7 39.6 39.8
Norwest Private 43.9 40.1 35.0 39.9 36.1
Sydney Southwest Private
37.0 27.2 28.0 30.2 36.4
Nepean Private 28.2 25.0 26.3 27.1 28.8
Westmead Private 28.5 25.9 23.1 27.8 26.9
Wollongong Private† - - - 35.3 43.2
Newcastle Private 62.4 50.2 55.8 52.9 53.2
Calvary, Wagga Wagga
37.0 46.4 46.4 49.1 56.4
Other hospitals 38.6 43.6 38.5 0.0 0.0
TOTAL 45.2 41.4 43.6 44.2 44.8
TOTAL NSW* 55.4 53.0 53.5 54.8 52.0
Source: NSW Perinatal Data Collection (SAPHaRI). Centre for Epidemiology and Evidence, NSW Ministry of Health.# Hospitals with more than 200 births in 2017 are identified individually.* Total NSW includes births at home assisted by independent midwives.† Wollongong Private Hospital opened in 2016.
NSW HEALTH | NSW Mothers and Babies 2017 | 59

Indicator 3.4Definition: Total number of selected primipara undergoing episiotomy and sustaining a perineal tear while giving birth vaginally as a percentage of the total number of selected primipara delivering vaginally.
A selected primipara is defined as a woman who is 20–34 years of age at the time of giving birth; giving birth for the first time at 20 weeks or greater gestation; singleton pregnancy; cephalic presentation; and at 370 to 406 weeks gestation.
Table 65 shows information for hospitals where at least 200 mothers gave birth in 2017, totals for hospitals for each local health district, and the NSW total.
TABLE 65: 3.4 SELECTED PRIMIPARA UNDERGOING EPISIOTOMY AND SUSTAINING A PERINEAL TEAR BY LOCAL HEALTH DISTRICT AND HOSPITAL, NSW 2013–2017#
Local Health District–Hospital2013 2014 2015 2016 2017
% % % % %
Sydney Canterbury 4.53 6.87 6.57 9.82 14.43
Royal Prince Alfred 8.68 9.83 8.20 6.61 6.95
TOTAL 7.77 9.14 7.80 7.30 8.61
South Western Sydney
Fairfield 3.63 2.47 2.96 4.04 6.43
Liverpool 4.53 4.43 5.52 4.43 5.00
Campbelltown 3.16 1.77 1.68 2.20 2.22
Bankstown–Lidcombe
7.91 6.51 8.75 7.73 9.09
Bowral 1.77 1.85 2.22 2.63 1.79
TOTAL 4.55 3.67 4.48 4.11 4.82
South Eastern Sydney
St. George 13.30 13.76 9.72 16.64 16.49
Sutherland 10.23 10.85 8.33 13.58 10.46
Royal Hospital for Women
7.76 9.14 9.08 12.21 10.95
TOTAL 9.93 10.91 9.15 13.88 12.76
Illawarra Shoalhaven
Shoalhaven 1.23 1.83 4.65 5.03 6.67
Wollongong 7.94 5.03 6.03 9.28 6.24
Other hospitals 4.17 0.00 0.00 0.00 0.00
TOTAL 6.13 4.09 5.67 8.30 6.34
Western Sydney
Auburn 8.09 7.43 9.94 16.43 14.25
Blacktown 13.00 12.01 10.14 21.36 16.48
Westmead 13.98 16.10 13.25 20.23 20.59
TOTAL 12.76 13.71 11.85 20.00 18.46
Nepean Blue Mountains
Blue Mountains 5.13 1.79 8.16 6.90 4.65
Nepean 8.10 10.39 9.47 17.74 15.90
Hawkesbury 3.55 2.22 4.11 10.57 7.35
Other hospitals 10.00 6.90 9.52 11.11 6.67
TOTAL 7.25 8.44 8.49 15.89 13.88
Northern Sydney
Hornsby 8.03 4.01 12.20 18.27 6.36
Manly 12.65 12.55 13.49 14.96 4.47
Mona Vale 6.67 7.84 6.98 8.72 4.74
Royal North Shore 14.97 14.06 13.56 17.75 7.65
Other hospitals 0.00 2.70 0.00 3.85 0.00
TOTAL 11.80 10.84 12.16 16.03 6.33
Central Coast Gosford 13.79 12.39 10.63 12.61 3.65
Other hospitals 0.00 0.00 3.13 2.86 4.55
TOTAL 12.62 11.79 10.27 12.05 3.68
Hunter New England
Armidale 10.14 11.48 5.41 6.25 13.25
Inverell 3.57 2.70 2.50 5.00 6.00
Tamworth Base 4.64 8.24 6.81 12.18 9.46
Manning Base 2.27 4.48 4.92 9.09 12.03
Maitland 7.69 7.48 9.31 8.06 10.69
John Hunter 9.04 9.87 9.82 13.57 11.99
Other hospitals 8.15 3.96 8.57 5.35 1.76
TOTAL 7.67 8.08 8.59 10.61 10.39
Northern NSW Grafton Base 2.82 3.37 3.08 3.85 0.00
Lismore Base 6.32 3.70 6.28 6.07 1.24
Tweed Heads 6.80 10.25 5.79 6.27 2.90
Other hospitals 0.00 0.00 1.82 0.00 0.00
TOTAL 5.81 6.17 5.34 5.28 1.69
Local Health District–Hospital2013 2014 2015 2016 2017
% % % % %
Mid North Coast
Coffs Harbour 6.67 6.44 7.54 7.22 3.64
Kempsey 0.00 0.00 5.13 10.42 0.00
Port Macquarie Base
10.06 8.53 12.95 7.52 6.13
Other hospitals 0.00 0.00 0.00 0.00 0.00
TOTAL 7.42 6.22 9.00 7.65 4.16
Southern NSW Bega 2.22 7.69 13.33 4.17 6.38
Goulburn Base 7.94 6.00 1.75 2.22 2.00
Moruya 0.00 8.70 8.33 0.00 3.23
Queanbeyan 3.23 8.62 4.67 11.11 10.27
Other hospitals 7.41 2.17 2.17 2.44 2.94
TOTAL 3.90 7.10 5.61 5.77 6.49
Murrumbidgee Griffith Base 1.83 7.50 3.85 8.65 2.63
Wagga Wagga Base 5.65 6.75 11.11 13.16 12.29
Other hospitals 5.77 6.35 7.55 9.20 5.32
TOTAL 4.45 6.78 8.31 11.02 7.75
Western NSW Dubbo Base 7.14 4.85 4.69 8.26 8.89
Mudgee 3.33 6.25 3.64 1.75 0.00
Bathurst Base 4.04 2.94 6.03 11.01 4.90
Orange Base 15.30 13.29 11.50 17.61 12.28
Other hospitals 6.85 6.25 6.58 10.00 5.06
TOTAL 8.67 7.22 7.12 10.83 8.12
Far West Broken Hill Base 9.09 1.89 1.96 4.55 2.50
TOTAL 9.09 1.89 1.96 4.55 2.50
Private Hospitals
Mater, North Sydney
3.88 6.47 5.29 1.17 1.63
North Shore Private 0.72 1.66 0.71 1.93 0.00
Sydney Adventist 1.44 1.60 1.47 0.00 0.00
North Gosford Private
2.24 3.48 9.66 6.78 7.55
Hurstville Community
2.11 2.27 4.69 1.82 0.75
Kareena Private 0.71 0.72 0.00 0.74 0.00
St. George Private 0.26 0.80 0.00 0.29 0.00
Prince of Wales Private
4.72 5.37 5.13 8.86 6.27
Norwest Private 4.57 4.99 3.84 7.10 5.63
Sydney Southwest Private
1.74 2.01 5.17 6.27 6.31
Nepean Private 4.23 5.63 6.58 11.61 5.04
Westmead Private 0.74 0.78 0.82 0.64 0.67
Wollongong Private† - - - 0.00 0.00
Newcastle Private 2.45 14.29 9.69 10.23 9.77
Calvary, Wagga Wagga
1.85 4.35 2.90 0.00 5.13
Other hospitals 0.00 0.00 0.00 0.00 0.00
TOTAL 2.22 3.93 3.60 3.85 3.02
TOTAL NSW* 7.09 7.68 7.38 9.93 8.32
Source: NSW Perinatal Data Collection (SAPHaRI). Centre for Epidemiology and Evidence, NSW Ministry of Health.# Hospitals with more than 200 births in 2017 are identified individually.* Total NSW includes births at home assisted by independent midwives.† Wollongong Private Hospital opened in 2016.
60 | NSW HEALTH | NSW Mothers and Babies 2017

TABLE 66: 3.5 SELECTED PRIMIPARA UNDERGOING SURGICAL REPAIR OF THE PERINEUM FOR THIRD DEGREE TEAR BY LOCAL HEALTH DISTRICT AND HOSPITAL, NSW 2013–2017#
Indicator 3.5Definition: Total number of selected primipara undergoing surgical repair of the perineum for third degree tear while giving birth vaginally as a percentage of the total number of selected primipara delivering vaginally.
A selected primipara is defined as a woman who is 20–34 years of age at the time of giving birth; giving birth for the first time at 20 weeks or greater gestation; singleton pregnancy; cephalic presentation; and at 370 to 406 weeks gestation. Surgical repair is defined as suture of the perineum following delivery.
Table 66 shows information for hospitals where at least 200 mothers gave birth in 2017, totals for hospitals for each local health district, and the NSW total.
Local Health District–Hospital2013 2014 2015 2016 2017
% % % % %
Sydney Canterbury 10.26 5.54 10.09 7.75 8.96
Royal Prince Alfred 6.17 8.08 8.87 8.51 6.31
TOTAL 7.08 7.49 9.17 8.35 6.90
South Western Sydney
Fairfield 8.87 6.79 5.93 8.08 9.51
Liverpool 5.96 6.77 5.64 9.27 8.47
Campbelltown 2.65 5.58 3.36 5.43 3.71
Bankstown–Lidcombe
4.68 5.31 8.38 5.67 5.30
Bowral 4.42 2.78 3.33 1.32 2.68
TOTAL 5.21 5.97 5.45 6.97 6.27
South Eastern Sydney
St. George 9.12 11.80 6.94 10.24 6.09
Sutherland 8.95 7.75 11.02 3.95 6.15
Royal Hospital for Women
5.57 4.92 7.36 7.62 6.76
TOTAL 7.29 7.60 7.87 7.78 6.43
Illawarra Shoalhaven
Shoalhaven 1.85 3.66 5.81 3.77 4.85
Wollongong 3.43 4.60 3.58 5.30 5.23
Other hospitals 4.17 0.00 0.00 0.00 0.00
TOTAL 3.07 4.25 4.11 4.95 5.14
Western Sydney
Auburn 4.44 5.43 6.35 4.18 5.59
Blacktown 8.72 4.93 5.53 5.52 8.60
Westmead 6.99 4.80 6.04 4.38 5.42
TOTAL 7.04 4.93 5.95 4.68 6.36
Nepean Blue Mountains
Blue Mountains 7.69 12.50 8.16 6.90 2.33
Nepean 6.03 6.36 3.85 6.14 8.22
Hawkesbury 4.96 4.44 1.37 7.32 5.15
Other hospitals 0.00 3.45 0.00 0.00 3.33
TOTAL 5.63 6.36 3.49 6.11 7.36
Northern Sydney
Hornsby 5.02 8.36 9.15 6.31 6.01
Manly 8.57 6.84 11.51 9.83 7.32
Mona Vale 6.00 8.33 12.79 8.72 5.26
Royal North Shore 11.73 10.84 8.08 8.29 7.36
Other hospitals 0.00 2.70 0.00 0.00 0.00
TOTAL 8.81 9.19 9.26 8.05 6.68
Central Coast Gosford 9.62 6.98 7.30 4.84 4.69
Other hospitals 5.88 6.90 3.13 0.00 0.00
TOTAL 9.30 6.98 7.10 4.56 4.52
Hunter New England
Armidale 4.35 3.28 2.70 4.69 2.41
Inverell 0.00 2.70 0.00 2.50 2.00
Tamworth Base 5.15 5.49 4.19 4.06 2.70
Manning Base 2.27 3.73 8.20 3.31 9.77
Maitland 7.69 6.23 8.71 7.33 3.79
John Hunter 8.06 10.11 8.62 9.05 9.74
Other hospitals 3.86 4.46 3.81 4.12 3.53
TOTAL 6.44 7.39 7.15 6.81 6.87
Northern NSW Grafton Base 0.00 0.00 0.00 2.56 1.54
Lismore Base 2.37 5.09 5.80 2.34 5.39
Tweed Heads 5.58 5.65 5.49 5.23 5.81
Other hospitals 3.57 0.00 0.00 0.00 2.33
TOTAL 3.91 4.17 4.58 3.42 4.92
Local Health District–Hospital2013 2014 2015 2016 2017
% % % % %
Mid North Coast
Coffs Harbour 6.11 5.94 3.52 4.64 1.82
Kempsey 5.56 4.55 5.13 10.42 2.50
Port Macquarie Base
12.43 9.30 5.04 7.52 8.59
Other hospitals 0.00 0.00 0.00 0.00 10.00
TOTAL 8.70 6.74 4.11 6.33 4.62
Southern NSWBega 4.44 5.77 4.44 2.08 6.38
Goulburn Base 1.59 4.00 3.51 4.44 4.00
Moruya 8.16 10.87 12.50 9.62 6.45
Queanbeyan 3.23 4.31 3.74 7.94 10.96
Other hospitals 7.41 4.35 4.35 0.00 5.88
TOTAL 4.22 5.48 5.28 5.77 7.96
Murrumbidgee Griffith Base 1.83 2.50 2.56 6.73 1.75
Wagga Wagga Base 8.06 7.36 6.54 5.26 8.38
Other hospitals 3.85 4.76 9.43 2.30 2.13
TOTAL 4.75 5.42 6.53 4.99 4.91
Western NSW Dubbo Base 2.04 3.40 4.23 3.72 5.33
Mudgee 0.00 6.25 1.82 3.51 5.13
Bathurst Base 4.04 5.88 6.90 6.42 9.80
Orange Base 9.29 10.40 8.50 7.39 11.70
Other hospitals 4.11 8.75 6.58 7.78 5.06
TOTAL 4.58 6.73 6.06 5.64 7.79
Far West Broken Hill Base 3.03 0.00 1.96 2.27 5.00
TOTAL 3.03 0.00 1.96 2.27 5.00
Private Hospitals
Mater, North Sydney
1.83 2.16 4.50 1.46 1.96
North Shore Private 1.91 1.11 2.38 2.79 1.86
Sydney Adventist 0.72 0.91 1.96 0.00 0.00
North Gosford Private
2.99 0.00 4.14 1.69 1.89
Hurstville Community
1.41 2.27 1.56 1.21 0.00
Kareena Private 3.55 2.16 1.44 2.22 1.44
St. George Private 3.39 2.93 1.89 2.93 2.85
Prince of Wales Private
2.36 0.85 2.05 2.49 2.19
Norwest Private 2.91 3.39 2.16 3.10 2.56
Sydney Southwest Private
2.61 2.01 3.45 1.96 4.37
Nepean Private 2.82 0.63 3.95 5.81 5.04
Westmead Private 0.93 0.58 0.82 0.85 1.11
Wollongong Private† - - - 0.98 1.41
Newcastle Private 5.12 5.67 5.67 7.42 6.32
Calvary, Wagga Wagga
0.00 4.35 0.00 0.00 2.56
Other hospitals 0.97 0.58 0.00 0.00 0.00
TOTAL 2.33 2.04 2.57 2.47 2.33
TOTAL NSW* 5.53 5.64 5.78 5.65 5.62
Source: NSW Perinatal Data Collection (SAPHaRI). Centre for Epidemiology and Evidence, NSW Ministry of Health.# Hospitals with more than 200 births in 2017 are identified individually.* Total NSW includes births at home assisted by independent midwives.† Wollongong Private Hospital opened in 2016.
NSW HEALTH | NSW Mothers and Babies 2017 | 61

Indicator 3.6Definition: Total number of selected primipara undergoing surgical repair of the perineum for fourth degree tear while giving birth vaginally as a percentage of the total number of selected primipara delivering vaginally.
A selected primipara is defined as a woman who is 20–34 years of age at the time of giving birth; giving birth for the first time at 20 weeks or greater gestation; singleton pregnancy; cephalic presentation; and at 370 to 406 weeks gestation. Surgical repair is defined as suture of the perineum following delivery.
Table 67 shows information for hospitals where at least 200 mothers gave birth in 2017, totals for hospitals for each local health district, and the NSW total.
TABLE 67: 3.6 SELECTED PRIMIPARA UNDERGOING SURGICAL REPAIR OF THE PERINEUM FOR FOURTH DEGREE TEAR BY LOCAL HEALTH DISTRICT AND HOSPITAL, NSW 2013–2017#
Local Health District–Hospital2013 2014 2015 2016 2017
% % % % %
Sydney Canterbury 0.95 0.22 0.00 0.52 0.00
Royal Prince Alfred 0.34 0.34 0.30 0.14 0.28
TOTAL 0.48 0.31 0.23 0.22 0.22
South Western Sydney
Fairfield 0.00 0.21 0.00 0.24 1.29
Liverpool 0.26 0.12 0.12 0.55 0.14
Campbelltown 0.25 0.25 0.36 0.00 0.37
Bankstown–Lidcombe
0.36 0.34 0.00 0.52 0.00
Bowral 0.00 0.93 0.00 0.00 0.00
TOTAL 0.22 0.25 0.15 0.29 0.37
South Eastern Sydney
St. George 0.15 0.28 0.46 0.43 0.00
Sutherland 0.26 0.00 0.81 0.00 0.31
Royal Hospital for Women
0.46 0.35 0.73 0.18 0.20
TOTAL 0.32 0.27 0.66 0.23 0.15
Illawarra Shoalhaven
Shoalhaven 0.62 0.00 0.00 0.63 0.00
Wollongong 0.43 0.00 0.75 0.19 0.20
Other hospitals 0.00 0.00 0.00 0.00 0.00
TOTAL 0.46 0.00 0.57 0.29 0.15
Western Sydney
Auburn 0.26 0.57 0.28 0.00 0.84
Blacktown 1.27 1.15 0.46 0.14 0.14
Westmead 0.45 0.44 0.23 0.37 0.07
TOTAL 0.64 0.65 0.30 0.25 0.21
Nepean Blue Mountains
Blue Mountains 0.00 0.00 0.00 0.00 0.00
Nepean 0.52 0.62 0.48 0.27 0.27
Hawkesbury 0.00 0.00 0.68 0.00 0.74
Other hospitals 2.50 0.00 0.00 0.00 0.00
TOTAL 0.50 0.46 0.47 0.21 0.32
Northern Sydney
Hornsby 0.00 0.67 0.34 1.00 0.35
Manly 0.00 0.38 0.00 0.00 0.00
Mona Vale 0.67 0.00 0.00 0.00 1.05
Royal North Shore 0.00 0.65 0.43 0.65 0.29
Other hospitals 0.00 0.00 0.00 0.00 0.00
TOTAL 0.07 0.51 0.28 0.52 0.35
Central Coast Gosford 0.18 1.05 0.63 0.35 0.00
Other hospitals 3.92 0.00 0.00 0.00 0.00
TOTAL 0.50 1.00 0.60 0.33 0.00
Hunter New England
Armidale 0.00 0.00 0.00 0.00 0.00
Inverell 0.00 0.00 0.00 0.00 0.00
Tamworth Base 0.52 1.10 0.00 1.02 0.00
Manning Base 0.00 0.75 0.00 0.83 0.00
Maitland 0.62 1.25 0.60 0.73 0.34
John Hunter 0.61 0.61 0.72 0.25 0.25
Other hospitals 0.43 0.99 0.00 0.41 0.00
TOTAL 0.50 0.80 0.44 0.46 0.18
Northern NSW Grafton Base 0.00 1.12 1.54 1.28 1.54
Lismore Base 0.00 0.93 0.48 0.00 0.00
Tweed Heads 0.49 0.35 0.30 0.35 0.00
Other hospitals 0.00 0.00 0.00 0.00 0.00
TOTAL 0.25 0.62 0.46 0.31 0.17
Local Health District–Hospital2013 2014 2015 2016 2017
% % % % %
Mid North Coast
Coffs Harbour 0.00 0.50 0.50 0.00 0.00
Kempsey 0.00 0.00 0.00 4.17 0.00
Port Macquarie Base
0.00 0.00 0.00 0.00 0.61
Other hospitals 0.00 0.00 0.00 0.00 0.00
TOTAL 0.00 0.26 0.26 0.53 0.23
Southern NSW Bega 2.22 1.92 0.00 0.00 2.13
Goulburn Base 0.00 0.00 0.00 0.00 0.00
Moruya 0.00 0.00 2.08 0.00 0.00
Queanbeyan 0.00 0.86 0.00 0.00 0.00
Other hospitals 0.00 0.00 0.00 0.00 0.00
TOTAL 0.32 0.65 0.33 0.00 0.29
Murrumbidgee Griffith Base 0.00 0.00 0.00 0.00 0.00
Wagga Wagga Base 0.00 0.00 0.00 0.00 0.00
Other hospitals 0.00 1.59 0.00 1.15 2.13
TOTAL 0.00 0.54 0.00 0.26 0.52
Western NSW Dubbo Base 0.00 0.00 0.94 0.41 0.00
Mudgee 0.00 0.00 1.82 0.00 0.00
Bathurst Base 0.00 0.00 1.72 0.00 0.98
Orange Base 0.00 0.00 0.50 0.00 0.00
Other hospitals 4.11 0.00 1.32 0.00 1.27
TOTAL 0.49 0.00 1.06 0.15 0.32
Far West Broken Hill Base 0.00 0.00 0.00 0.00 0.00
TOTAL 0.00 0.00 0.00 0.00 0.00
Private Hospitals
Mater, North Sydney
0.00 0.24 0.00 0.29 0.00
North Shore Private 0.00 0.28 0.00 0.43 0.00
Sydney Adventist 0.48 0.00 0.25 0.23 0.00
North Gosford Private
0.75 0.00 0.69 0.00 0.00
Hurstville Community
0.00 0.00 0.00 0.00 0.75
Kareena Private 0.00 0.00 0.00 0.00 0.00
St. George Private 0.78 0.00 0.00 0.00 0.00
Prince of Wales Private
0.00 0.28 0.00 0.00 0.00
Norwest Private 0.00 0.00 0.00 0.22 0.00
Sydney Southwest Private
0.43 0.00 0.00 0.00 0.49
Nepean Private 0.00 0.63 0.00 0.65 0.00
Westmead Private 0.00 0.00 0.00 0.00 0.00
Wollongong Private† - - - 0.00 0.00
Newcastle Private 0.00 0.00 0.00 0.00 0.00
Calvary, Wagga Wagga
0.00 0.00 0.00 0.00 0.00
Other hospitals 0.00 0.58 0.00 0.00 0.00
TOTAL 0.15 0.11 0.05 0.14 0.05
TOTAL NSW* 0.33 0.37 0.32 0.27 0.21
Source: NSW Perinatal Data Collection (SAPHaRI). Centre for Epidemiology and Evidence, NSW Ministry of Health.# Hospitals with more than 200 births in 2017 are identified individually.* Total NSW includes births at home assisted by independent midwives.† Wollongong Private Hospital opened in 2016.
62 | NSW HEALTH | NSW Mothers and Babies 2017

TABLE 68: 4.1 GENERAL ANAESTHESIA FOR CAESAREAN SECTION BY LOCAL HEALTH DISTRICT AND HOSPITAL, NSW 2013–2017#
General anaesthesia for caesarean sectionIndicator 4.1Definition: Total number of women having a general anaesthetic for a caesarean section as a percentage of women having a caesarean section.
Table 68 shows information for hospitals where at least 200 mothers gave birth in 2017, totals for hospitals for each local health district, and the NSW total.
Local Health District–Hospital2013 2014 2015 2016 2017
% % % % %
Sydney Canterbury 13.47 10.52 10.61 8.62 10.03
Royal Prince Alfred 10.08 10.09 11.13 10.54 9.12
TOTAL 10.87 10.19 11.00 10.07 9.36
South Western Sydney
Fairfield 14.48 11.82 12.43 12.65 10.28
Liverpool 14.68 15.08 13.67 15.54 13.55
Campbelltown 9.39 10.73 13.14 12.74 11.07
Bankstown–Lidcombe
12.72 10.26 10.68 13.27 12.85
Bowral 11.90 10.56 10.53 8.89 2.36
TOTAL 12.61 12.26 12.62 13.58 11.70
South Eastern Sydney
St. George 9.91 7.01 7.47 6.22 6.29
Sutherland 8.94 10.94 9.69 6.62 8.43
Royal Hospital for Women
4.51 4.15 3.88 4.49 5.37
Other hospitals 0.00 0.00 0.00 0.00 0.00
TOTAL 6.85 6.03 5.88 5.35 6.13
Illawarra Shoalhaven
Shoalhaven 6.51 7.87 5.90 6.18 4.62
Wollongong 9.12 9.54 7.26 9.72 9.22
Other hospitals 11.76 20.00 0.00 50.00 0.00
TOTAL 8.42 9.15 6.81 8.87 8.05
Western Sydney
Auburn 5.64 7.74 8.33 4.53 5.10
Blacktown 12.77 12.73 11.89 10.27 9.87
Westmead 9.30 9.95 8.40 8.96 8.43
TOTAL 10.07 10.67 9.53 8.91 8.52
Nepean Blue Mountains
Blue Mountains 8.33 6.58 3.53 6.58 1.61
Nepean 16.19 15.25 13.90 12.00 13.96
Hawkesbury 7.48 7.94 8.49 8.20 4.84
Other hospitals 3.28 6.15 4.69 1.52 3.85
TOTAL 13.91 13.45 12.34 10.93 12.03
Northern Sydney
Hornsby 6.40 5.50 6.92 7.92 3.24
Manly 4.20 7.43 7.43 6.69 6.74
Mona Vale 6.08 8.42 8.25 9.01 2.31
Royal North Shore 5.16 5.16 5.62 5.29 5.76
TOTAL 5.32 5.97 6.46 6.42 5.00
Central Coast Gosford 7.74 6.54 6.33 10.97 7.86
TOTAL 7.74 6.54 6.33 10.97 7.86
Hunter New England
Armidale 5.38 4.84 5.84 5.30 5.11
Inverell 2.13 3.09 1.27 2.53 0.00
Tamworth Base 9.82 13.50 14.78 9.24 9.43
Manning Base 13.64 11.88 11.11 14.57 12.66
Maitland 9.79 10.74 6.78 14.25 9.19
John Hunter 18.25 15.36 12.49 16.28 14.25
Other hospitals 20.36 24.00 15.00 11.11 10.38
TOTAL 14.48 13.92 11.30 13.54 11.58
Northern NSW Grafton Base 9.23 8.49 11.40 6.90 7.38
Lismore Base 6.55 6.44 4.92 6.72 5.43
Tweed Heads 7.23 12.01 7.82 7.07 8.92
Other hospitals 0.00 2.17 0.00 15.38 0.00
TOTAL 6.73 8.63 6.93 7.06 7.20
Local Health District–Hospital2013 2014 2015 2016 2017
% % % % %
Mid North Coast
Coffs Harbour 8.22 7.67 7.87 7.61 3.84
Kempsey 1.92 15.38 0.00 15.52 9.23
Port Macquarie Base
9.05 10.17 11.11 7.34 5.96
Other hospitals 0.00 0.00 0.00 0.00 0.00
TOTAL 7.97 9.19 8.42 8.13 5.09
Southern NSW Bega 15.38 3.17 5.88 4.11 0.00
Goulburn Base 2.74 2.94 7.78 7.69 6.41
Moruya 8.96 6.25 4.05 6.10 11.27
Queanbeyan 12.04 5.05 3.39 2.78 5.33
Other hospitals 2.22 18.18 11.76 4.76 14.81
TOTAL 8.70 5.83 5.73 5.07 6.20
Murrumbidgee Griffith Base 6.02 10.53 5.96 7.06 6.12
Wagga Wagga Base 6.84 8.33 12.72 7.62 7.08
Other hospitals 7.69 4.40 3.54 1.75 3.88
TOTAL 6.86 7.85 9.30 6.40 6.38
Western NSW Dubbo Base 18.42 21.36 17.11 15.51 10.39
Mudgee 7.94 1.61 8.57 3.51 9.23
Bathurst Base 13.51 5.71 10.67 5.79 8.70
Orange Base 11.21 11.05 5.98 11.83 12.93
Other hospitals 10.00 0.93 7.45 7.14 5.83
TOTAL 13.43 11.89 11.01 11.54 10.42
Far West Broken Hill Base 14.52 8.33 8.00 7.58 5.00
TOTAL 14.52 8.33 8.00 7.58 5.00
Private Hospitals
Mater, North Sydney
2.25 2.60 1.62 1.05 1.46
North Shore Private 1.28 1.80 1.62 1.62 1.48
Sydney Adventist 6.34 3.75 3.87 2.37 2.93
North Gosford Private
3.95 2.61 2.85 2.26 1.17
Hurstville Community
4.22 2.24 4.36 1.22 3.02
Kareena Private 1.76 2.62 3.63 2.38 3.54
St. George Private 3.23 4.04 3.42 3.53 3.07
Prince of Wales Private
0.67 2.12 2.01 2.32 1.25
Norwest Private 6.92 4.50 6.09 4.31 4.14
Sydney Southwest Private
4.26 4.11 3.67 2.47 7.12
Nepean Private 5.12 4.33 4.60 5.11 2.95
Westmead Private 3.24 3.70 2.84 2.67 2.02
Wollongong Private† - - - 4.56 4.02
Newcastle Private 2.07 1.78 2.59 2.25 2.58
Calvary, Wagga Wagga
4.02 3.94 1.04 1.35 2.11
Other hospitals 3.78 3.46 4.02 4.55 0.00
TOTAL 3.10 3.03 2.98 2.48 2.47
TOTAL NSW* 7.97 7.86 7.40 7.42 6.95
Source: NSW Perinatal Data Collection (SAPHaRI). Centre for Epidemiology and Evidence, NSW Ministry of Health.# Hospitals with more than 200 births in 2017 are identified individually.* Total NSW includes births at home assisted by independent midwives.† Wollongong Private Hospital opened in 2016.
NSW HEALTH | NSW Mothers and Babies 2017 | 63

Full breastfeeding Indicator 6.1Definition: The total number of breastfeeding selected primipara who are discharged and their neonate has never received formula as a percentage of the total number of selected primipara who breastfed and are discharged.
The Perinatal Data Collection captures information on the feeding status of the infant, that is, whether the infant is breastfeeding, or consuming expressed breast milk or infant formula, at discharge from the birth hospital.
A selected primipara is defined as a woman who is 20–34 years of age at the time of giving birth; giving birth for the first time at 20 weeks or greater gestation; singleton pregnancy; cephalic presentation; and at 370 to 406 weeks gestation.
Table 69 shows information for hospitals where at least 200 mothers gave birth in 2017, totals for hospitals for each local health district, and the NSW total.
TABLE 69: 6.1 SELECTED PRIMIPARA FULL BREASTFEEDING BY LOCAL HEALTH DISTRICT AND HOSPITAL, NSW 2013–2017# ‡
Local Health District–Hospital2013 2014 2015 2016 2017
% % % % %
Sydney Canterbury 95.7 88.5 85.4 80.3 81.0
Royal Prince Alfred 96.5 86.7 83.2 82.2 79.2
TOTAL 96.3 87.2 83.8 81.8 79.7
South Western Sydney
Fairfield 74.4 64.8 57.7 47.4 50.7
Liverpool 84.2 77.2 75.3 75.3 71.4
Campbelltown 91.9 84.2 85.4 82.6 81.7
Bankstown–Lidcombe
92.1 82.0 74.1 74.2 76.4
Bowral 97.9 95.1 93.4 91.4 92.4
TOTAL 86.8 78.8 75.8 73.1 73.0
South Eastern Sydney
St. George 83.2 85.7 87.3 85.8 82.5
Sutherland 95.2 95.1 94.3 93.5 93.1
Royal Hospital for Women
88.7 87.2 89.4 87.8 86.1
Other hospitals 100.0 0.0 0.0 0.0 0.0
TOTAL 88.1 88.1 89.5 88.1 86.1
Illawarra Shoalhaven
Shoalhaven 94.9 95.9 96.3 95.9 96.0
Wollongong 94.8 93.9 92.5 94.4 91.6
Other hospitals 98.9 100.0 100.0 100.0 100.0
TOTAL 95.0 94.6 93.6 94.9 92.8
Western Sydney
Auburn 83.0 78.5 72.0 73.0 72.2
Blacktown 90.7 89.2 89.3 87.8 84.1
Westmead 86.6 87.1 86.3 88.0 87.8
TOTAL 87.4 86.5 85.3 85.9 84.6
Nepean Blue Mountains
Blue Mountains 95.6 95.3 96.1 96.2 96.0
Nepean 87.9 86.6 87.2 86.2 85.2
Hawkesbury 95.6 94.9 93.5 95.4 94.5
Other hospitals 93.6 91.5 94.2 93.0 94.8
TOTAL 89.9 88.6 88.9 88.2 87.4
Northern Sydney
Hornsby 91.0 89.8 91.4 90.8 89.1
Manly 94.6 94.3 92.4 91.4 88.7
Mona Vale 92.6 92.9 94.3 94.7 91.6
Royal North Shore 91.0 91.5 91.3 90.0 87.8
Other hospitals 100.0 100.0 99.2 100.0 100.0
TOTAL 92.0 92.0 92.1 91.1 88.9
Central Coast Gosford 93.5 92.1 92.9 92.2 87.0
Other hospitals 99.4 100.0 97.8 99.2 97.8
TOTAL 93.9 92.5 93.2 92.5 87.4
Local Health District–Hospital2013 2014 2015 2016 2017
% % % % %
Hunter New England
Armidale 95.5 95.1 94.9 91.7 91.3
Inverell 90.8 90.6 85.6 88.2 86.2
Tamworth Base 93.3 92.8 91.7 90.7 87.6
Manning Base 95.7 93.0 93.3 91.9 91.2
Maitland 93.2 92.4 95.6 93.2 90.5
John Hunter 92.2 92.4 92.3 88.1 87.1
Other hospitals 97.1 96.0 96.2 94.3 91.7
TOTAL 93.5 93.0 93.3 90.4 88.7
Northern NSW Grafton Base 96.9 97.3 97.6 91.6 94.0
Lismore Base 95.8 94.8 96.5 93.7 91.9
Tweed Heads 96.4 97.7 95.9 96.2 94.4
Other hospitals 99.0 98.2 99.5 98.6 100.0
TOTAL 96.5 96.6 96.6 94.9 93.6
Mid North Coast
Coffs Harbour 94.8 94.7 93.7 91.7 87.8
Kempsey 98.0 97.2 98.1 97.4 97.4
Port Macquarie Base
95.5 94.7 94.4 93.3 93.6
Other hospitals 98.2 100.0 96.2 97.7 97.0
TOTAL 95.5 95.1 94.5 93.0 91.1
Southern NSW Bega 95.2 93.6 94.0 94.3 88.2
Goulburn Base 96.3 95.2 95.2 94.6 91.1
Moruya 96.5 99.2 98.5 96.3 94.3
Queanbeyan 97.1 93.2 95.0 95.3 93.6
Other hospitals 95.7 94.8 91.8 98.4 93.9
TOTAL 96.4 95.0 95.3 95.5 92.4
Murrumbidgee Griffith Base 91.5 85.2 88.4 87.9 85.3
Wagga Wagga Base 94.7 91.1 92.1 91.1 88.7
Other hospitals 96.3 95.6 95.9 97.1 95.9
TOTAL 94.4 91.1 92.3 91.8 89.4
Western NSW Dubbo Base 95.5 94.6 95.4 92.9 90.8
Mudgee 98.6 98.0 97.8 97.6 95.5
Bathurst Base 96.4 97.0 96.4 96.1 94.5
Orange Base 91.8 91.9 89.3 90.6 87.9
Other hospitals 95.3 96.4 95.9 95.7 95.6
TOTAL 94.6 94.7 93.9 93.3 91.5
Far West Broken Hill Base 93.1 94.5 96.6 94.0 95.3
TOTAL 93.1 94.5 96.6 94.0 95.3
(Continued on next page)
64 | NSW HEALTH | NSW Mothers and Babies 2017

Local Health District–Hospital2013 2014 2015 2016 2017
% % % % %
Private Hospitals
Mater, North Sydney
82.1 77.1 76.3 71.0 68.4
North Shore Private 79.4 79.8 76.7 74.5 74.2
Sydney Adventist 100.0 100.0 98.9 81.0 76.0
North Gosford Private
91.8 91.5 92.0 90.3 92.5
Hurstville Community
76.2 77.0 78.3 70.6 63.0
Kareena Private 92.5 93.6 89.4 89.9 91.5
St. George Private 69.1 66.9 66.8 67.8 64.0
Prince of Wales Private
88.9 90.4 100.0 80.8 79.9
Norwest Private 87.5 90.2 100.0 80.4 79.4
Sydney Southwest Private
85.5 99.8 100.0 66.4 67.9
Local Health District–Hospital2013 2014 2015 2016 2017
% % % % %
Nepean Private 86.2 89.2 100.0 78.8 80.0
Westmead Private 75.4 70.9 73.7 72.7 75.1
Wollongong Private† - - - 90.6 87.0
Newcastle Private 96.4 94.7 100.0 82.2 82.0
Calvary, Wagga Wagga
99.8 100.0 99.8 87.4 89.1
Other hospitals 91.6 92.3 91.2 94.4 95.5
TOTAL 85.7 85.8 88.3 77.5 76.5
TOTAL NSW* 90.1 88.2 88.3 84.8 83.3
Source: NSW Perinatal Data Collection (SAPHaRI). Centre for Epidemiology and Evidence, NSW Ministry of Health.# Hospitals with more than 200 births in 2017 are identified individually.* Total NSW includes births at home assisted by independent midwives.† Wollongong Private Hospital opened in 2016.‡ The Perinatal Data Collection captures breastfeeding information on the date of discharge.
TABLE 69: (Continued)
NSW HEALTH | NSW Mothers and Babies 2017 | 65

Postpartum haemorrhage and blood transfusion after vaginal birthIndicator 7.1Definition: Total number of women who give birth vaginally who receive a blood transfusion during the same admission as a percentage of women who give birth vaginally.
Table 70 shows information for hospitals where at least 200 mothers gave birth in 2017, totals for hospitals for each local health district, and the NSW total.
TABLE 70: 7.1 POSTPARTUM HAEMORRHAGE AND BLOOD TRANSFUSION FOLLOWING VAGINAL BIRTH BY LOCAL HEALTH DISTRICT AND HOSPITAL, NSW 2013–2017#
Local Health District–Hospital2013 2014 2015 2016 2017
% % % % %
Sydney Canterbury 1.68 1.52 0.99 1.13 1.95
Royal Prince Alfred 1.10 0.93 0.96 1.69 1.15
TOTAL 1.26 1.09 0.97 1.54 1.36
South Western Sydney
Fairfield 0.48 0.61 0.85 1.16 0.64
Liverpool 0.69 0.82 0.48 0.65 1.14
Campbelltown 1.00 1.01 1.07 0.94 0.72
Bankstown–Lidcombe
1.10 1.35 0.84 0.78 1.01
Bowral 0.00 0.61 1.39 0.00 0.00
TOTAL 0.79 0.94 0.82 0.83 0.87
South Eastern Sydney
St. George 1.54 1.73 1.83 1.11 1.34
Sutherland 2.13 1.46 1.75 1.12 0.77
Royal Hospital for Women
1.54 1.53 1.24 0.81 1.30
TOTAL 1.65 1.58 1.52 0.96 1.22
Illawarra Shoalhaven
Shoalhaven 1.95 1.46 1.58 1.32 1.00
Wollongong 1.86 1.50 1.53 1.31 0.99
Other hospitals 1.27 0.00 0.00 0.00 0.00
TOTAL 1.86 1.45 1.53 1.30 0.99
Western Sydney
Auburn 0.76 1.43 0.81 1.34 0.71
Blacktown 0.74 1.13 1.17 1.49 1.52
Westmead 2.20 1.88 1.49 1.24 1.14
TOTAL 1.53 1.59 1.30 1.33 1.20
Nepean Blue Mountains
Blue Mountains 3.01 2.81 2.35 0.63 0.62
Nepean 1.65 2.18 1.49 1.13 1.69
Hawkesbury 0.98 1.05 2.71 1.43 0.00
Other hospitals 1.76 0.00 0.00 0.00 2.36
TOTAL 1.62 1.95 1.64 1.09 1.42
Northern Sydney
Hornsby 0.86 0.89 1.14 0.88 0.45
Manly 1.98 1.34 1.59 1.17 0.80
Mona Vale 2.04 0.86 2.52 0.74 1.51
Royal North Shore 1.27 1.17 1.03 1.68 0.33
Other hospitals 0.00 0.00 0.81 0.97 0.00
TOTAL 1.36 1.07 1.33 1.28 0.58
Central Coast Gosford 1.01 1.08 1.36 0.96 0.49
Other hospitals 1.19 0.70 0.00 0.00 0.00
TOTAL 1.02 1.05 1.26 0.90 0.47
Hunter New England
Armidale 0.32 1.40 1.78 1.10 1.42
Inverell 2.59 0.56 2.01 1.80 1.92
Tamworth Base 1.44 2.54 2.17 0.43 1.27
Manning Base 2.54 2.20 3.61 1.20 2.81
Maitland 1.71 1.72 1.78 1.67 0.96
John Hunter 2.23 1.87 2.77 0.85 1.30
Other hospitals 0.95 1.08 1.73 0.34 0.53
TOTAL 1.82 1.78 2.39 0.94 1.28
Northern NSW Grafton Base 1.54 1.85 1.02 0.33 1.97
Lismore Base 1.66 2.19 1.89 0.69 1.63
Tweed Heads 1.69 2.45 1.96 1.61 1.22
Other hospitals 1.15 1.68 0.54 0.00 1.18
TOTAL 1.61 2.20 1.71 0.94 1.48
Local Health District–Hospital2013 2014 2015 2016 2017
% % % % %
Mid North Coast
Coffs Harbour 0.69 0.72 0.85 1.57 0.41
Kempsey 2.50 1.92 3.50 0.00 1.52
Port Macquarie Base
1.33 1.33 2.62 1.58 0.95
Other hospitals 0.00 0.00 1.85 0.00 0.00
TOTAL 1.14 1.08 1.87 1.30 0.72
Southern NSW Bega 1.23 2.70 2.65 1.09 0.58
Goulburn Base 0.00 1.97 1.38 0.00 1.03
Moruya 1.31 1.01 2.20 3.21 1.80
Queanbeyan 4.04 5.63 0.34 1.46 0.82
Other hospitals 0.00 1.64 0.00 0.79 2.00
TOTAL 1.72 3.02 1.27 1.41 1.14
Murrumbidgee Griffith Base 2.58 3.29 1.19 1.41 1.02
Wagga Wagga Base 2.04 1.68 1.91 2.38 1.57
Other hospitals 1.32 1.68 2.04 1.36 0.56
TOTAL 1.94 2.08 1.77 1.87 1.16
Western NSW Dubbo Base 1.91 1.61 1.58 1.82 1.28
Mudgee 0.00 1.10 2.27 1.58 0.60
Bathurst Base 1.92 1.80 1.34 1.36 0.28
Orange Base 1.65 1.64 0.85 0.70 0.51
Other hospitals 0.84 0.55 1.73 1.61 0.32
TOTAL 1.55 1.45 1.40 1.38 0.74
Far West Broken Hill Base 3.73 2.92 1.78 0.61 2.10
TOTAL 3.73 2.92 1.78 0.61 2.10
Private Hospitals
Mater, North Sydney
2.32 1.43 0.91 0.26 0.92
North Shore Private 0.41 0.10 0.51 0.58 0.00
Sydney Adventist 2.80 3.14 2.94 0.49 1.20
North Gosford Private
2.10 3.86 1.09 0.83 0.31
Hurstville Community
1.68 1.20 0.98 0.20 0.28
Kareena Private 0.23 0.49 0.26 0.49 0.27
St. George Private 0.21 0.44 0.46 0.35 0.13
Prince of Wales Private
2.21 1.82 0.27 0.19 0.41
Norwest Private 1.74 1.28 0.71 0.54 0.26
Sydney Southwest Private
2.45 0.00 0.17 0.30 0.53
Nepean Private 2.48 2.54 0.00 0.23 0.24
Westmead Private 0.39 0.78 0.88 1.06 0.69
Wollongong Private† - - - 0.60 0.37
Newcastle Private 0.86 1.81 0.34 0.35 0.20
Calvary, Wagga Wagga
2.35 2.02 0.98 0.00 1.42
Other hospitals 0.00 0.21 0.38 0.00 0.00
TOTAL 1.44 1.38 0.80 0.47 0.47
TOTAL NSW* 1.45 1.45 1.32 1.02 0.97
Source: NSW Perinatal Data Collection (SAPHaRI). Centre for Epidemiology and Evidence, NSW Ministry of Health.# Hospitals with more than 200 births in 2017 are identified individually.* Total NSW includes births at home assisted by independent midwives.† Wollongong Private Hospital opened in 2016.
66 | NSW HEALTH | NSW Mothers and Babies 2017

Postpartum haemorrhage and blood transfusion after caesarean sectionIndicator 7.2Definition: Total number of women who undergo caesarean section who receive a blood transfusion during the same admission as a percentage of women who undergo caesarean section.
Table 71 shows information for hospitals where at least 200 mothers gave birth in 2017, totals for hospitals for each local health district, and the NSW total.
TABLE 71: 7.2 POSTPARTUM HAEMORRHAGE AND BLOOD TRANSFUSION FOLLOWING CAESAREAN SECTION BY LOCAL HEALTH DISTRICT AND HOSPITAL, NSW 2013–2017#
Local Health District–Hospital2013 2014 2015 2016 2017
% % % % %
Sydney Canterbury 1.89 1.24 1.02 1.15 0.69
Royal Prince Alfred 1.47 0.81 0.73 1.18 1.22
TOTAL 1.57 0.91 0.80 1.18 1.08
South Western Sydney
Fairfield 1.61 0.99 1.35 0.72 0.70
Liverpool 0.62 1.66 0.43 0.73 1.31
Campbelltown 0.41 0.54 1.24 0.88 0.22
Bankstown–Lidcombe
1.16 1.21 0.89 1.42 2.36
Bowral 0.00 0.70 0.00 1.48 0.79
TOTAL 0.79 1.12 0.86 0.95 1.03
South Eastern Sydney
St. George 2.94 1.96 2.35 0.95 0.98
Sutherland 1.66 2.19 0.94 0.32 1.12
Royal Hospital for Women
2.16 2.41 1.77 0.90 1.79
Other hospitals 0.00 0.00 0.00 0.00 0.00
TOTAL 2.33 2.24 1.84 0.83 1.43
Illawarra Shoalhaven
Shoalhaven 3.83 3.15 2.80 2.32 1.15
Wollongong 2.99 1.88 2.22 1.11 1.58
Other hospitals 5.88 20.00 0.00 0.00 0.00
TOTAL 3.28 2.31 2.40 1.43 1.47
Western Sydney
Auburn 3.01 1.35 1.92 0.97 0.64
Blacktown 0.91 1.02 1.26 1.28 1.19
Westmead 2.54 1.98 2.30 1.54 1.66
TOTAL 2.05 1.59 1.92 1.40 1.40
Nepean Blue Mountains
Blue Mountains 3.33 1.32 1.18 0.00 0.00
Nepean 3.41 2.57 2.88 1.17 0.61
Hawkesbury 1.36 1.08 0.74 1.17 0.40
Other hospitals 3.28 1.54 1.56 1.52 0.00
TOTAL 3.04 2.25 2.45 1.13 0.54
Northern Sydney
Hornsby 2.02 2.27 0.38 1.32 1.18
Manly 2.29 1.12 1.12 3.34 1.12
Mona Vale 0.00 0.53 0.52 0.90 1.39
Royal North Shore 1.68 1.12 1.49 1.53 1.28
TOTAL 1.69 1.27 1.13 1.72 1.25
TOTAL 1.59 1.69 1.27 1.13 1.72
Central Coast Gosford 1.11 1.15 1.01 0.90 1.72
TOTAL 1.11 1.15 1.01 0.90 1.72
Hunter New England
Armidale 0.77 0.81 2.92 0.76 0.00
Inverell 4.26 2.06 2.53 0.00 0.00
Tamworth Base 2.46 2.55 2.06 1.32 0.86
Manning Base 1.30 2.50 3.17 1.32 3.16
Maitland 3.73 2.39 1.41 1.61 0.88
John Hunter 4.58 3.75 3.43 1.62 1.84
Other hospitals 0.90 3.11 2.27 1.33 1.89
TOTAL 3.46 3.04 2.78 1.44 1.49
Northern NSW Grafton Base 2.31 0.94 1.75 2.59 1.64
Lismore Base 2.98 2.03 0.38 1.49 0.36
Tweed Heads 2.71 2.47 1.63 1.01 1.12
Other hospitals 0.00 0.00 0.00 0.00 0.00
TOTAL 2.55 1.92 1.11 1.44 0.90
Local Health District–Hospital2013 2014 2015 2016 2017
% % % % %
Mid North Coast
Coffs Harbour 0.57 1.92 0.87 0.25 0.27
Kempsey 5.77 1.92 1.64 3.45 3.08
Port Macquarie Base
3.33 2.12 1.15 1.54 0.46
Other hospitals 0.00 0.00 0.00 0.00 0.00
TOTAL 1.95 1.99 1.05 0.98 0.62
Southern NSW Bega 1.92 0.00 2.94 0.00 1.30
Goulburn Base 0.00 0.00 1.11 3.30 0.00
Moruya 1.49 3.75 0.00 1.22 0.00
Queanbeyan 8.33 2.02 0.00 0.93 0.00
Other hospitals 0.00 0.00 0.00 0.00 3.70
TOTAL 3.19 1.46 0.78 1.33 0.50
Murrumbidgee Griffith Base 0.75 1.32 0.66 0.59 1.36
Wagga Wagga Base 3.85 1.74 2.66 1.17 0.71
Other hospitals 4.90 5.66 5.31 1.75 1.94
TOTAL 3.33 2.67 2.66 1.12 1.04
Western NSW Dubbo Base 2.30 2.08 2.06 2.67 1.40
Mudgee 1.59 1.61 2.86 0.00 4.62
Bathurst Base 1.35 1.71 1.33 0.00 0.00
Orange Base 1.15 0.58 1.66 0.85 0.57
Other hospitals 2.50 0.00 1.06 0.00 0.00
TOTAL 1.73 1.27 1.78 1.29 0.97
Far West Broken Hill Base 0.00 0.00 2.00 0.00 3.33
TOTAL 0.00 0.00 2.00 0.00 3.33
Private Hospitals
Mater, North Sydney
0.87 0.93 0.45 0.88 0.77
North Shore Private 0.18 0.28 0.00 0.23 0.07
Sydney Adventist 0.43 0.25 0.40 0.37 0.00
North Gosford Private
1.13 0.58 0.32 0.85 0.59
Hurstville Community
0.90 1.60 0.67 0.61 0.00
Kareena Private 0.00 0.00 0.00 0.53 0.29
St. George Private 0.26 0.48 0.71 0.71 0.44
Prince of Wales Private
2.07 1.46 0.42 0.43 0.33
Norwest Private 0.85 0.82 0.25 0.92 0.67
Sydney Southwest Private
0.00 0.51 0.52 0.00 0.30
Nepean Private 2.70 0.31 0.00 0.28 0.66
Westmead Private 0.31 0.40 0.55 0.59 0.75
Wollongong Private† - - - 0.25 0.75
Newcastle Private 0.83 0.63 0.13 0.35 0.25
Calvary, Wagga Wagga
0.40 0.39 0.35 0.00 0.00
Other hospitals 0.24 0.92 0.67 0.00 0.00
TOTAL 0.80 0.68 0.35 0.51 0.41
TOTAL NSW* 1.72 1.43 1.25 0.99 0.94
Source: NSW Perinatal Data Collection (SAPHaRI). Centre for Epidemiology and Evidence, NSW Ministry of Health.# Hospitals with more than 200 births in 2017 are identified individually.* Total NSW includes births at home assisted by independent midwives.† Wollongong Private Hospital opened in 2016.
NSW HEALTH | NSW Mothers and Babies 2017 | 67
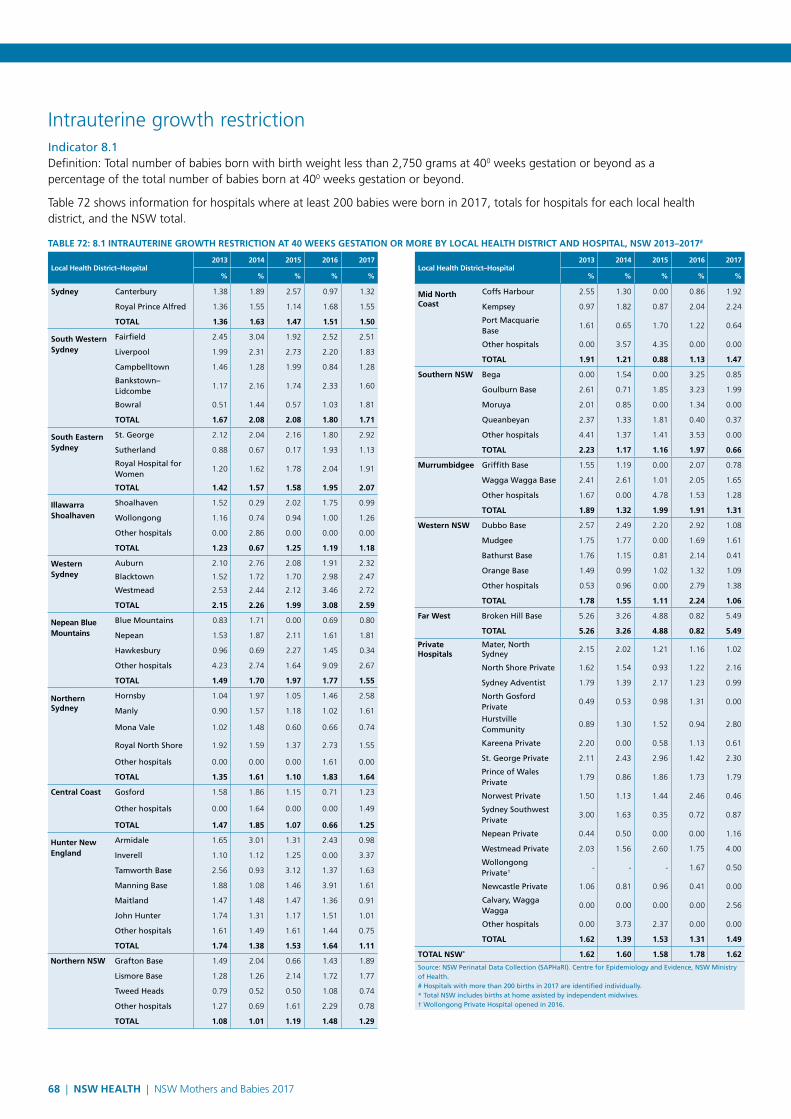
Intrauterine growth restrictionIndicator 8.1Definition: Total number of babies born with birth weight less than 2,750 grams at 400 weeks gestation or beyond as a percentage of the total number of babies born at 400 weeks gestation or beyond.
Table 72 shows information for hospitals where at least 200 babies were born in 2017, totals for hospitals for each local health district, and the NSW total.
TABLE 72: 8.1 INTRAUTERINE GROWTH RESTRICTION AT 40 WEEKS GESTATION OR MORE BY LOCAL HEALTH DISTRICT AND HOSPITAL, NSW 2013–2017#
Local Health District–Hospital2013 2014 2015 2016 2017
% % % % %
Sydney Canterbury 1.38 1.89 2.57 0.97 1.32
Royal Prince Alfred 1.36 1.55 1.14 1.68 1.55
TOTAL 1.36 1.63 1.47 1.51 1.50
South Western Sydney
Fairfield 2.45 3.04 1.92 2.52 2.51
Liverpool 1.99 2.31 2.73 2.20 1.83
Campbelltown 1.46 1.28 1.99 0.84 1.28
Bankstown–Lidcombe
1.17 2.16 1.74 2.33 1.60
Bowral 0.51 1.44 0.57 1.03 1.81
TOTAL 1.67 2.08 2.08 1.80 1.71
South Eastern Sydney
St. George 2.12 2.04 2.16 1.80 2.92
Sutherland 0.88 0.67 0.17 1.93 1.13
Royal Hospital for Women
1.20 1.62 1.78 2.04 1.91
TOTAL 1.42 1.57 1.58 1.95 2.07
Illawarra Shoalhaven
Shoalhaven 1.52 0.29 2.02 1.75 0.99
Wollongong 1.16 0.74 0.94 1.00 1.26
Other hospitals 0.00 2.86 0.00 0.00 0.00
TOTAL 1.23 0.67 1.25 1.19 1.18
Western Sydney
Auburn 2.10 2.76 2.08 1.91 2.32
Blacktown 1.52 1.72 1.70 2.98 2.47
Westmead 2.53 2.44 2.12 3.46 2.72
TOTAL 2.15 2.26 1.99 3.08 2.59
Nepean Blue Mountains
Blue Mountains 0.83 1.71 0.00 0.69 0.80
Nepean 1.53 1.87 2.11 1.61 1.81
Hawkesbury 0.96 0.69 2.27 1.45 0.34
Other hospitals 4.23 2.74 1.64 9.09 2.67
TOTAL 1.49 1.70 1.97 1.77 1.55
Northern Sydney
Hornsby 1.04 1.97 1.05 1.46 2.58
Manly 0.90 1.57 1.18 1.02 1.61
Mona Vale 1.02 1.48 0.60 0.66 0.74
Royal North Shore 1.92 1.59 1.37 2.73 1.55
Other hospitals 0.00 0.00 0.00 1.61 0.00
TOTAL 1.35 1.61 1.10 1.83 1.64
Central Coast Gosford 1.58 1.86 1.15 0.71 1.23
Other hospitals 0.00 1.64 0.00 0.00 1.49
TOTAL 1.47 1.85 1.07 0.66 1.25
Hunter New England
Armidale 1.65 3.01 1.31 2.43 0.98
Inverell 1.10 1.12 1.25 0.00 3.37
Tamworth Base 2.56 0.93 3.12 1.37 1.63
Manning Base 1.88 1.08 1.46 3.91 1.61
Maitland 1.47 1.48 1.47 1.36 0.91
John Hunter 1.74 1.31 1.17 1.51 1.01
Other hospitals 1.61 1.49 1.61 1.44 0.75
TOTAL 1.74 1.38 1.53 1.64 1.11
Northern NSW Grafton Base 1.49 2.04 0.66 1.43 1.89
Lismore Base 1.28 1.26 2.14 1.72 1.77
Tweed Heads 0.79 0.52 0.50 1.08 0.74
Other hospitals 1.27 0.69 1.61 2.29 0.78
TOTAL 1.08 1.01 1.19 1.48 1.29
Local Health District–Hospital2013 2014 2015 2016 2017
% % % % %
Mid North Coast
Coffs Harbour 2.55 1.30 0.00 0.86 1.92
Kempsey 0.97 1.82 0.87 2.04 2.24
Port Macquarie Base
1.61 0.65 1.70 1.22 0.64
Other hospitals 0.00 3.57 4.35 0.00 0.00
TOTAL 1.91 1.21 0.88 1.13 1.47
Southern NSW Bega 0.00 1.54 0.00 3.25 0.85
Goulburn Base 2.61 0.71 1.85 3.23 1.99
Moruya 2.01 0.85 0.00 1.34 0.00
Queanbeyan 2.37 1.33 1.81 0.40 0.37
Other hospitals 4.41 1.37 1.41 3.53 0.00
TOTAL 2.23 1.17 1.16 1.97 0.66
Murrumbidgee Griffith Base 1.55 1.19 0.00 2.07 0.78
Wagga Wagga Base 2.41 2.61 1.01 2.05 1.65
Other hospitals 1.67 0.00 4.78 1.53 1.28
TOTAL 1.89 1.32 1.99 1.91 1.31
Western NSW Dubbo Base 2.57 2.49 2.20 2.92 1.08
Mudgee 1.75 1.77 0.00 1.69 1.61
Bathurst Base 1.76 1.15 0.81 2.14 0.41
Orange Base 1.49 0.99 1.02 1.32 1.09
Other hospitals 0.53 0.96 0.00 2.79 1.38
TOTAL 1.78 1.55 1.11 2.24 1.06
Far West Broken Hill Base 5.26 3.26 4.88 0.82 5.49
TOTAL 5.26 3.26 4.88 0.82 5.49
Private Hospitals
Mater, North Sydney
2.15 2.02 1.21 1.16 1.02
North Shore Private 1.62 1.54 0.93 1.22 2.16
Sydney Adventist 1.79 1.39 2.17 1.23 0.99
North Gosford Private
0.49 0.53 0.98 1.31 0.00
Hurstville Community
0.89 1.30 1.52 0.94 2.80
Kareena Private 2.20 0.00 0.58 1.13 0.61
St. George Private 2.11 2.43 2.96 1.42 2.30
Prince of Wales Private
1.79 0.86 1.86 1.73 1.79
Norwest Private 1.50 1.13 1.44 2.46 0.46
Sydney Southwest Private
3.00 1.63 0.35 0.72 0.87
Nepean Private 0.44 0.50 0.00 0.00 1.16
Westmead Private 2.03 1.56 2.60 1.75 4.00
Wollongong Private† - - - 1.67 0.50
Newcastle Private 1.06 0.81 0.96 0.41 0.00
Calvary, Wagga Wagga
0.00 0.00 0.00 0.00 2.56
Other hospitals 0.00 3.73 2.37 0.00 0.00
TOTAL 1.62 1.39 1.53 1.31 1.49
TOTAL NSW* 1.62 1.60 1.58 1.78 1.62
Source: NSW Perinatal Data Collection (SAPHaRI). Centre for Epidemiology and Evidence, NSW Ministry of Health.# Hospitals with more than 200 births in 2017 are identified individually.* Total NSW includes births at home assisted by independent midwives.† Wollongong Private Hospital opened in 2016.
68 | NSW HEALTH | NSW Mothers and Babies 2017

Apgar scoreIndicator 9.1Definition: Total number of term babies born with an Apgar score of less than seven at 5 minutes post-delivery as a percentage of the total number of term babies born.
Table 73 shows information for hospitals where at least 200 babies were born in 2017, totals for hospitals for each local health district, and the NSW total.
TABLE 73: 9.1 APGAR SCORE OF 7 OR LESS IN TERM BABIES BY LOCAL HEALTH DISTRICT AND HOSPITAL, NSW 2013–2017#
Local Health District–Hospital2013 2014 2015 2016 2017
% % % % %
Sydney Canterbury 1.51 1.43 1.40 1.42 0.87
Royal Prince Alfred 2.01 2.08 1.94 1.15 1.27
TOTAL 1.88 1.91 1.79 1.22 1.16
South Western Sydney
Fairfield 0.96 0.72 1.26 0.88 0.94
Liverpool 1.48 1.38 1.12 0.90 0.73
Campbelltown 1.69 1.41 1.32 1.46 1.29
Bankstown–Lidcombe
0.53 0.73 0.93 1.02 0.91
Bowral 1.31 1.54 0.26 1.43 1.30
TOTAL 1.24 1.14 1.13 1.11 1.00
South Eastern Sydney
St. George 1.69 1.82 2.26 1.61 1.26
Sutherland 2.75 0.93 0.88 1.64 1.47
Royal Hospital for Women
1.88 1.98 1.63 1.88 1.74
Other hospitals 0.00 0.00 0.00 0.00 0.00
TOTAL 1.97 1.74 1.71 1.75 1.54
Illawarra Shoalhaven
Shoalhaven 1.08 1.55 1.17 1.92 1.68
Wollongong 1.88 1.21 1.03 1.00 1.39
Other hospitals 1.08 0.00 0.00 0.00 0.00
TOTAL 1.64 1.28 1.06 1.24 1.46
Western Sydney
Auburn 1.10 0.54 0.40 0.46 0.86
Blacktown 0.69 0.82 0.62 1.01 0.81
Westmead 0.95 0.97 1.51 1.29 1.56
TOTAL 0.89 0.86 1.08 1.09 1.23
Nepean Blue Mountains
Blue Mountains 0.45 0.00 1.61 1.69 1.79
Nepean 0.64 0.92 1.19 1.22 1.17
Hawkesbury 0.79 0.83 0.28 0.77 0.15
Other hospitals 2.31 2.05 3.21 1.98 2.37
TOTAL 0.74 0.90 1.17 1.21 1.10
Northern Sydney
Hornsby 1.41 1.64 1.56 2.13 1.42
Manly 1.38 1.76 0.76 1.90 0.93
Mona Vale 1.14 1.72 1.24 0.81 1.10
Royal North Shore 1.53 1.58 1.39 1.95 1.55
Other hospitals 0.78 0.00 0.81 0.00 1.00
TOTAL 1.41 1.61 1.28 1.79 1.35
Central Coast Gosford 2.34 1.57 1.76 2.19 1.97
Other hospitals 1.20 0.00 0.00 1.47 1.01
TOTAL 2.27 1.49 1.67 2.16 1.94
Hunter New England
Armidale 1.67 1.57 1.06 1.84 0.78
Inverell 0.38 0.40 0.00 1.72 0.45
Tamworth Base 2.37 2.25 2.83 2.44 2.62
Manning Base 2.60 1.82 2.59 1.59 1.34
Maitland 1.60 2.40 2.16 1.79 1.40
John Hunter 2.15 2.67 1.83 2.24 1.66
Other hospitals 0.79 0.98 0.98 1.02 0.84
TOTAL 1.84 2.16 1.87 1.94 1.53
Northern NSW Grafton Base 2.66 1.44 1.06 1.97 1.95
Lismore Base 1.65 1.21 1.82 2.03 1.90
Tweed Heads 1.81 1.68 1.36 1.62 1.74
Other hospitals 0.31 0.35 0.00 0.41 0.00
TOTAL 1.71 1.35 1.38 1.72 1.72
Local Health District–Hospital2013 2014 2015 2016 2017
% % % % %
Mid North Coast
Coffs Harbour 1.75 1.81 1.74 1.08 0.95
Kempsey 1.27 4.82 3.64 3.02 0.79
Port Macquarie Base
1.59 1.82 1.48 1.27 0.86
Other hospitals 0.00 0.00 0.00 2.08 0.00
TOTAL 1.58 2.14 1.84 1.42 0.87
Southern NSW Bega 1.46 0.84 0.94 1.61 0.82
Goulburn Base 1.09 2.32 2.41 0.73 1.16
Moruya 0.70 0.76 1.05 0.00 0.36
Queanbeyan 0.94 1.21 1.74 1.13 1.57
Other hospitals 1.97 1.40 2.56 2.04 0.00
TOTAL 1.12 1.29 1.70 1.00 0.99
Murrumbidgee Griffith Base 1.77 2.23 1.57 1.81 1.57
Wagga Wagga Base 2.74 3.02 2.05 1.80 1.66
Other hospitals 0.87 0.97 1.48 0.42 1.56
TOTAL 1.86 2.13 1.75 1.46 1.61
Western NSW Dubbo Base 1.66 1.46 1.23 2.01 2.39
Mudgee 1.27 1.26 2.07 1.23 0.00
Bathurst Base 1.63 1.85 2.00 1.08 1.26
Orange Base 1.30 1.49 1.94 0.81 0.91
Other hospitals 0.22 1.78 1.20 1.00 1.42
TOTAL 1.32 1.56 1.62 1.33 1.50
Far West Broken Hill Base 3.24 2.24 1.42 1.79 1.53
TOTAL 3.24 2.24 1.42 1.79 1.53
Private Hospitals
Mater, North Sydney
0.30 0.32 0.38 0.18 0.20
North Shore Private 0.46 0.57 0.66 0.25 0.52
Sydney Adventist 0.93 1.19 1.07 4.94 1.23
North Gosford Private
0.40 0.14 0.93 1.52 0.48
Hurstville Community
0.99 1.01 1.19 1.16 1.06
Kareena Private 0.41 1.15 1.25 1.22 1.91
St. George Private 1.29 0.54 0.75 1.01 0.72
Prince of Wales Private
0.61 0.54 0.36 0.48 0.29
Norwest Private 0.57 0.25 0.36 0.36 0.27
Sydney Southwest Private
0.62 0.42 0.53 0.60 0.58
Nepean Private 0.39 0.13 0.40 0.68 0.30
Westmead Private 0.65 0.78 0.77 0.33 0.40
Wollongong Private† - - - 0.58 0.44
Newcastle Private 0.56 0.39 0.71 0.70 0.59
Calvary, Wagga Wagga
0.92 0.65 0.90 0.85 0.98
Other hospitals 0.53 0.80 0.22 0.00 0.00
TOTAL 0.63 0.58 0.65 0.96 0.57
TOTAL NSW* 1.29 1.28 1.26 1.33 1.16
Source: NSW Perinatal Data Collection (SAPHaRI). Centre for Epidemiology and Evidence, NSW Ministry of Health.# Hospitals with more than 200 births in 2017 are identified individually.* Total NSW includes births at home assisted by independent midwives.† Wollongong Private Hospital opened in 2016.
NSW HEALTH | NSW Mothers and Babies 2017 | 69
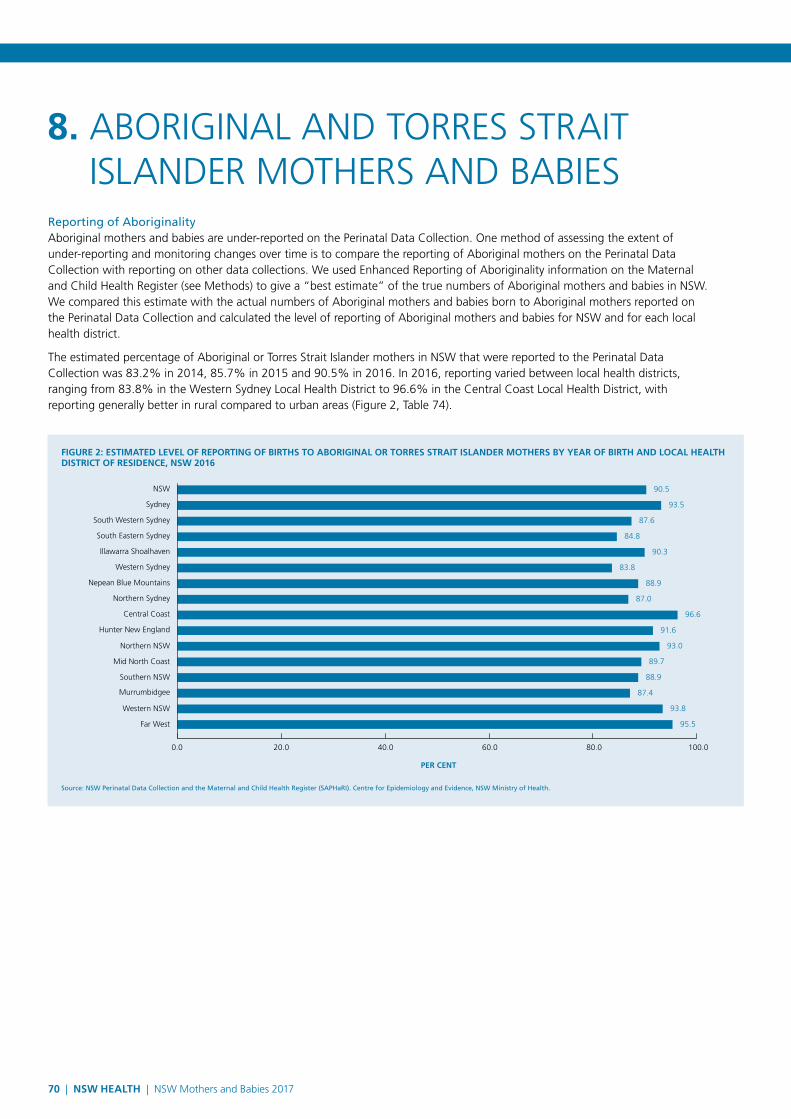
Reporting of AboriginalityAboriginal mothers and babies are under-reported on the Perinatal Data Collection. One method of assessing the extent of under-reporting and monitoring changes over time is to compare the reporting of Aboriginal mothers on the Perinatal Data Collection with reporting on other data collections. We used Enhanced Reporting of Aboriginality information on the Maternal and Child Health Register (see Methods) to give a “best estimate” of the true numbers of Aboriginal mothers and babies in NSW. We compared this estimate with the actual numbers of Aboriginal mothers and babies born to Aboriginal mothers reported on the Perinatal Data Collection and calculated the level of reporting of Aboriginal mothers and babies for NSW and for each local health district.
The estimated percentage of Aboriginal or Torres Strait Islander mothers in NSW that were reported to the Perinatal Data Collection was 83.2% in 2014, 85.7% in 2015 and 90.5% in 2016. In 2016, reporting varied between local health districts, ranging from 83.8% in the Western Sydney Local Health District to 96.6% in the Central Coast Local Health District, with reporting generally better in rural compared to urban areas (Figure 2, Table 74).
8. ABORIGINAL AND TORRES STRAIT ISLANDER MOTHERS AND BABIES
FIGURE 2: ESTIMATED LEVEL OF REPORTING OF BIRTHS TO ABORIGINAL OR TORRES STRAIT ISLANDER MOTHERS BY YEAR OF BIRTH AND LOCAL HEALTH DISTRICT OF RESIDENCE, NSW 2016
Source: NSW Perinatal Data Collection and the Maternal and Child Health Register (SAPHaRI). Centre for Epidemiology and Evidence, NSW Ministry of Health.
100.080.060.040.020.00.0
PER CENT
NSW 90.5
Sydney 93.5
South Western Sydney 87.6
South Eastern Sydney 84.8
Illawarra Shoalhaven 90.3
Western Sydney 83.8
Nepean Blue Mountains 88.9
Northern Sydney 87.0
Central Coast 96.6
Hunter New England 91.6
Northern NSW 93.0
Mid North Coast 89.7
Southern NSW 88.9
Murrumbidgee 87.4
Western NSW 93.8
Far West 95.5
70 | NSW HEALTH | NSW Mothers and Babies 2017

TABLE 74: ABORIGINAL OR TORRES STRAIT ISLANDER MOTHERS AND ESTIMATED LEVEL OF REPORTING BY YEAR OF BIRTH AND LOCAL HEALTH DISTRICT OF RESIDENCE 2014–2016
Year of birth–Local Health DistrictPDC mothers Estimated Aboriginal mothers Level of reporting
No. No. %
2014 Sydney 120 135 88.9
South Western Sydney 235 343 68.5
South Eastern Sydney 99 126 78.6
Illawarra Shoalhaven 212 260 81.5
Western Sydney 301 390 77.2
Nepean Blue Mountains 196 243 80.7
Northern Sydney 29 45 64.4
Central Coast 217 237 91.6
Hunter New England 932 1106 84.3
Northern NSW 235 266 88.3
Mid North Coast 251 284 88.4
Southern NSW 86 101 85.1
Murrumbidgee 190 229 83.0
Western NSW 583 667 87.4
Far West 46 51 90.2
Other-not stated 23 28 82.1
NSW 3756 4512 83.2
2015 Sydney 111 134 82.8
South Western Sydney 237 309 76.7
South Eastern Sydney 110 139 79.1
Illawarra Shoalhaven 220 261 84.3
Western Sydney 246 324 75.9
Nepean Blue Mountains 243 289 84.1
Northern Sydney 32 42 76.2
Central Coast 222 242 91.7
Hunter New England 975 1095 89.0
Northern NSW 241 268 89.9
Mid North Coast 248 277 89.5
Southern NSW 93 108 86.1
Murrumbidgee 172 202 85.1
Western NSW 610 701 87.0
Far West 43 48 89.6
Other-not stated 19 20 95.0
NSW 3823 4460 85.7
2016 Sydney 86 92 93.5
South Western Sydney 318 363 87.6
South Eastern Sydney 112 132 84.8
Illawarra Shoalhaven 241 267 90.3
Western Sydney 258 308 83.8
Nepean Blue Mountains 232 261 88.9
Northern Sydney 40 46 87.0
Central Coast 226 234 96.6
Hunter New England 1052 1148 91.6
Northern NSW 225 242 93.0
Mid North Coast 234 261 89.7
Southern NSW 96 108 88.9
Murrumbidgee 215 246 87.4
Western NSW 630 672 93.8
Far West 42 44 95.5
Other-not stated 35 39 89.7
NSW 4118 4552 90.5
Source: NSW Perinatal Data Collection (SAPHaRI). Centre for Epidemiology and Evidence, NSW Ministry of Health.
96.6
NSW HEALTH | NSW Mothers and Babies 2017 | 71

Table 75 shows the number of babies born to Aboriginal or Torres Strait Islander mothers as reported to the Perinatal Data Collection and the number of Aboriginal or Torres Strait Islander babies born in NSW according to Enhanced Reporting of Aboriginality information on the Maternal and Child Health Register (see Methods). The estimated percentage of Aboriginal or Torres Strait Islander babies born in NSW that were reported to the Perinatal Data Collection was 70.3% in 2016. Reporting ranged from 62.7% in the Hunter New England Local Health District to 85.7% in the Far West Local Health District. There are therefore a substantial number of Aboriginal babies with non-Aboriginal or Torres Strait Islander mothers who are not represented in the numbers reported in this chapter.
Numbers of Aboriginal mothers and babies born to Aboriginal mothers shown in the tables and figures in this chapter are based on the actual numbers reported to the Perinatal Data Collection. The true numbers of Aboriginal mothers and babies are likely to be higher than shown and should therefore be interpreted with caution.
TABLE 75: ABORIGINAL OR TORRES STRAIT ISLANDER BABIES AND ESTIMATED LEVEL OF REPORTING BY YEAR OF BIRTH AND LOCAL HEALTH DISTRICT OF RESIDENCE, NSW 2014–2016#
Year of birth–Local Health DistrictPDC babies# Estimated Aboriginal babies# Level of reporting
No. No. %
2014 Sydney 122 169 72.2
South Western Sydney 238 414 57.5
South Eastern Sydney 99 179 55.3
Illawarra Shoalhaven 213 418 51.0
Western Sydney 305 422 72.3
Nepean Blue Mountains 199 320 62.2
Northern Sydney 30 64 46.9
Central Coast 217 321 67.6
Hunter New England 948 1586 59.8
Northern NSW 238 308 77.3
Mid North Coast 256 363 70.5
Southern NSW 87 133 65.4
Murrumbidgee 193 285 67.7
Western NSW 592 815 72.6
Far West 46 53 86.8
Other-not stated 24 38 63.2
NSW 3808 5890 64.7
2015 Sydney 111 155 71.6
South Western Sydney 246 428 57.5
South Eastern Sydney 110 187 58.8
Illawarra Shoalhaven 223 377 59.2
Western Sydney 252 388 64.9
Nepean Blue Mountains 246 371 66.3
Northern Sydney 32 62 51.6
Central Coast 223 360 61.9
Hunter New England 990 1593 62.1
Northern NSW 242 304 79.6
Mid North Coast 254 356 71.3
Southern NSW 94 138 68.1
Murrumbidgee 174 262 66.4
Western NSW 612 810 75.6
Far West 43 50 86.0
Other-not stated 19 30 63.3
NSW 3872 5872 65.9
2016 Sydney 86 113 76.1
South Western Sydney 325 471 69.0
South Eastern Sydney 113 175 64.6
Illawarra Shoalhaven 247 352 70.2
Western Sydney 263 359 73.3
Nepean Blue Mountains 232 324 71.6
Northern Sydney 41 65 63.1
Central Coast 232 350 66.3
Hunter New England 1062 1695 62.7
Northern NSW 226 304 74.3
Mid North Coast 237 312 76.0
Southern NSW 97 139 69.8
Murrumbidgee 218 282 77.3
Western NSW 640 801 79.9
Far West 42 49 85.7
Other-not stated 36 48 75.0
NSW 4174 5935 70.3
Source: NSW Perinatal Data Collection (SAPHaRI). Centre for Epidemiology and Evidence, NSW Ministry of Health.# PDC babies: Babies recorded on the PDC as being born to Aboriginal mothers. Estimated Aboriginal babies: Babies born in NSW according to Enhanced Reporting of Aboriginality information on the Maternal and Child Health Register.
72 | NSW HEALTH | NSW Mothers and Babies 2017

Trends in birthsBetween 2013 and 2017, the number of reported births to Aboriginal or Torres Strait Islander mothers rose from 3,542 to 4,251, representing 3.7% and 4.4% respectively of all babies born in NSW. In 2017, 4,063 babies were born to Aboriginal mothers, 62 babies were born to Torres Strait Islander mothers and 126 babies were born to mothers of both Aboriginal and Torres Strait Islander background (Table 76).
TABLE 76: ABORIGINAL AND TORRES STRAIT ISLANDER MOTHERS AND BABIES, NSW 2013–2017#
Aboriginal and Torres Strait Islander
Year
2013 2014 2015 2016 2017
No. % No. % No. % No. % No. %
Confinements
Aboriginal but not Torres Strait Islander 3359 96.2 3596 95.7 3686 96.4 3938 95.6 3998 95.6
Torres Strait Islander but not Aboriginal 53 1.5 51 1.4 43 1.1 50 1.2 61 1.5
Both Aboriginal and Torres Strait Islander 80 2.3 109 2.9 94 2.5 130 3.2 124 3.0
TOTAL 3492 100.0 3756 100.0 3823 100.0 4118 100.0 4183 100.0
Births
Aboriginal but not Torres Strait Islander 3406 96.2 3647 95.8 3735 96.5 3990 95.6 4063 95.6
Torres Strait Islander but not Aboriginal 55 1.6 51 1.3 43 1.1 51 1.2 62 1.5
Both Aboriginal and Torres Strait Islander 81 2.3 110 2.9 94 2.4 133 3.2 126 3.0
TOTAL 3542 100.0 3808 100.0 3872 100.0 4174 100.0 4251 100.0
Source: NSW Perinatal Data Collection (SAPHaRI). Centre for Epidemiology and Evidence, NSW Ministry of Health.# Due to under-reporting of Aboriginal mothers to the PDC, it is likely that the true numbers of mothers and babies are higher than shown (Table 74).
PluralityBetween 2013 and 2017, multiple pregnancies (twins, triplets etc.) were reported for about 1.4% of all pregnancies. In 2017, 3.0% of babies born to Aboriginal or Torres Strait Islander mothers were twins (Table 77).
TABLE 77: ABORIGINAL AND TORRES STRAIT ISLANDER MOTHERS AND BABIES BY PLURALITY, NSW 2013–2017#
Plurality
Year
2013 2014 2015 2016 2017
No. % No. % No. % No. % No. %
Confinements Singleton 3442 98.6 3705 98.6 3774 98.7 4062 98.6 4117 98.4
Twins 50 1.4 50 1.3 49 1.3 56 1.4 64 1.5
Triplets 0 0.0 1 0.0 0 0.0 0 0.0 2 0.0
TOTAL 3492 100.0 3756 100.0 3823 100.0 4118 100.0 4183 100.0
Births Singleton 3442 97.2 3705 97.3 3774 97.5 4062 97.3 4117 96.8
Twins 100 2.8 100 2.6 98 2.5 112 2.7 128 3.0
Triplets 0 0.0 3 0.1 0 0.0 0 0.0 6 0.1
TOTAL 3542 100.0 3808 100.0 3872 100.0 4174 100.0 4251 100.0
Source: NSW Perinatal Data Collection (SAPHaRI). Centre for Epidemiology and Evidence, NSW Ministry of Health.# Due to under-reporting of Aboriginal mothers to the PDC, it is likely that the true numbers of mothers and babies are higher than shown (Table 74).
Previous pregnanciesIn 2017, one-third of Aboriginal or Torres Strait Islander mothers gave birth for the first time, 59.8% of mothers reported between one and four previous births and 6.1% of mothers had previously given birth to five or more babies (Table 78). Between 2013 and 2017, the percentage of mothers who had previously given birth to five or more babies declined from 6.8% to 6.1%.
TABLE 78: PREVIOUS PREGNANCIES AMONG ABORIGINAL AND TORRES STRAIT ISLANDER MOTHERS, NSW 2013–2017#
No. previous pregnancies (>20 weeks gestation)
Year
2013 2014 2015 2016 2017
No. % No. % No. % No. % No. %
0 1235 35.4 1241 33.0 1322 34.6 1412 34.3 1412 33.8
1–4 2019 57.8 2262 60.2 2251 58.9 2441 59.3 2503 59.8
5+ 237 6.8 252 6.7 248 6.5 259 6.3 257 6.1
Not stated 1 0.0 1 0.0 2 0.1 6 0.1 11 0.3
TOTAL 3492 100.0 3756 100.0 3823 100.0 4118 100.0 4183 100.0
Source: NSW Perinatal Data Collection (SAPHaRI). Centre for Epidemiology and Evidence, NSW Ministry of Health.# Due to under-reporting of Aboriginal mothers to the PDC, it is likely that the true numbers of mothers are higher than shown (Table 74).
NSW HEALTH | NSW Mothers and Babies 2017 | 73

Maternal ageThe percentage of Aboriginal or Torres Strait Islander mothers who were teenagers fell substantially from 17.6% in 2013 to 12.3% in 2017. Between 2013 and 2017, the percentage of Aboriginal or Torres Strait Islander mothers giving birth at 35 years of age or more has remained stable and was 9.6% in 2017 (Table 79).
TABLE 79: AGE OF ABORIGINAL AND TORRES STRAIT ISLANDER MOTHERS, NSW 2013–2017#
Maternal age (years)
Year
2013 2014 2015 2016 2017
No. % No. % No. % No. % No. %
12–19 615 17.6 592 15.8 587 15.4 526 12.8 513 12.3
20–34 2546 72.9 2850 75.9 2905 76.0 3198 77.7 3268 78.1
35+ 331 9.5 314 8.4 331 8.7 393 9.5 401 9.6
Not stated 0 0.0 0 0.0 0 0.0 1 0.0 1 0.0
TOTAL 3492 100.0 3756 100.0 3823 100.0 4118 100.0 4183 100.0
Source: NSW Perinatal Data Collection (SAPHaRI). Centre for Epidemiology and Evidence, NSW Ministry of Health.# Due to under-reporting of Aboriginal mothers to the PDC, it is likely that the true numbers of mothers are higher than shown (Table 74).
Local Health District of residenceThe reported number of Aboriginal or Torres Strait Islander mothers who gave birth in 2017 ranged from 35 in the Far West Local Health District to 1,100 in the Hunter New England Local Health District (Table 80). The proportion of Aboriginal or Torres Strait Islander mothers who were teenagers varied from 6.2% in the South Eastern Sydney Local Health District to 16.2% in the Murrumbidgee Local Health District (Table 81).
TABLE 80: LOCAL HEALTH DISTRICT OF RESIDENCE OF ABORIGINAL AND TORRES STRAIT ISLANDER MOTHERS, NSW 2013–2017#
Local Health District
Year
2013 2014 2015 2016 2017
No. % No. % No. % No. % No. %
Sydney 90 2.6 120 3.2 111 2.9 86 2.1 99 2.4
South Western Sydney 199 5.7 235 6.3 237 6.2 318 7.7 295 7.1
South Eastern Sydney 92 2.6 99 2.6 110 2.9 112 2.7 113 2.7
Illawarra Shoalhaven 227 6.5 212 5.6 220 5.8 241 5.9 276 6.6
Western Sydney 256 7.3 301 8.0 246 6.4 258 6.3 289 6.9
Nepean Blue Mountains 193 5.5 196 5.2 243 6.4 232 5.6 229 5.5
Northern Sydney 28 0.8 29 0.8 32 0.8 40 1.0 36 0.9
Central Coast 188 5.4 217 5.8 222 5.8 226 5.5 230 5.5
Hunter New England 893 25.6 932 24.8 975 25.5 1052 25.5 1100 26.3
Northern NSW 257 7.4 235 6.3 241 6.3 225 5.5 231 5.5
Mid North Coast 228 6.5 251 6.7 248 6.5 234 5.7 262 6.3
Southern NSW 64 1.8 86 2.3 93 2.4 96 2.3 91 2.2
Murrumbidgee 160 4.6 190 5.1 172 4.5 215 5.2 204 4.9
Western NSW 548 15.7 583 15.5 610 16.0 630 15.3 666 15.9
Far West 46 1.3 46 1.2 43 1.1 42 1.0 35 0.8
Other-not stated 23 0.7 24 0.6 20 0.5 111 2.7 27 0.6
TOTAL 3492 100.0 3756 100.0 3823 100.0 4118 100.0 4183 100.0
Source: NSW Perinatal Data Collection (SAPHaRI). Centre for Epidemiology and Evidence, NSW Ministry of Health.# Due to under-reporting of Aboriginal mothers to the PDC, it is likely that the true numbers of mothers are higher than shown. The level of under-reporting varies between Local Health Districts (Table 74).
74 | NSW HEALTH | NSW Mothers and Babies 2017
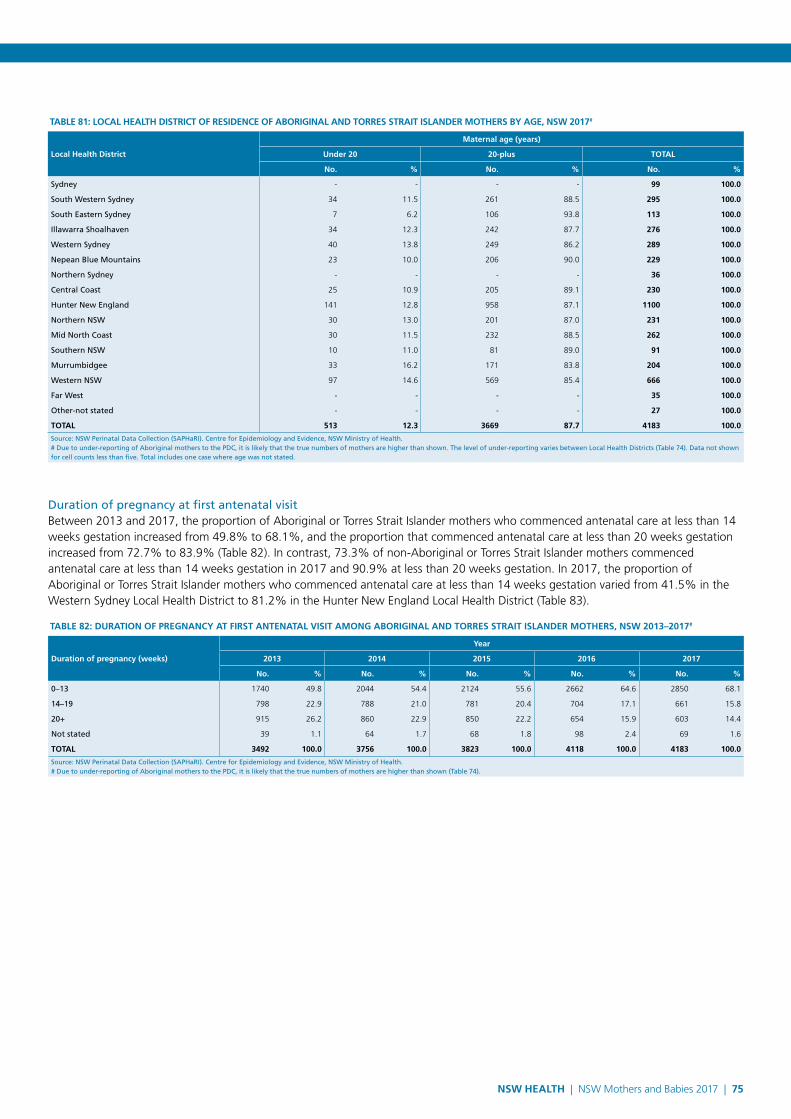
TABLE 81: LOCAL HEALTH DISTRICT OF RESIDENCE OF ABORIGINAL AND TORRES STRAIT ISLANDER MOTHERS BY AGE, NSW 2017#
Local Health District
Maternal age (years)
Under 20 20-plus TOTAL
No. % No. % No. %
Sydney - - - - 99 100.0
South Western Sydney 34 11.5 261 88.5 295 100.0
South Eastern Sydney 7 6.2 106 93.8 113 100.0
Illawarra Shoalhaven 34 12.3 242 87.7 276 100.0
Western Sydney 40 13.8 249 86.2 289 100.0
Nepean Blue Mountains 23 10.0 206 90.0 229 100.0
Northern Sydney - - - - 36 100.0
Central Coast 25 10.9 205 89.1 230 100.0
Hunter New England 141 12.8 958 87.1 1100 100.0
Northern NSW 30 13.0 201 87.0 231 100.0
Mid North Coast 30 11.5 232 88.5 262 100.0
Southern NSW 10 11.0 81 89.0 91 100.0
Murrumbidgee 33 16.2 171 83.8 204 100.0
Western NSW 97 14.6 569 85.4 666 100.0
Far West - - - - 35 100.0
Other-not stated - - - - 27 100.0
TOTAL 513 12.3 3669 87.7 4183 100.0
Source: NSW Perinatal Data Collection (SAPHaRI). Centre for Epidemiology and Evidence, NSW Ministry of Health.# Due to under-reporting of Aboriginal mothers to the PDC, it is likely that the true numbers of mothers are higher than shown. The level of under-reporting varies between Local Health Districts (Table 74). Data not shown for cell counts less than five. Total includes one case where age was not stated.
Duration of pregnancy at first antenatal visitBetween 2013 and 2017, the proportion of Aboriginal or Torres Strait Islander mothers who commenced antenatal care at less than 14 weeks gestation increased from 49.8% to 68.1%, and the proportion that commenced antenatal care at less than 20 weeks gestation increased from 72.7% to 83.9% (Table 82). In contrast, 73.3% of non-Aboriginal or Torres Strait Islander mothers commenced antenatal care at less than 14 weeks gestation in 2017 and 90.9% at less than 20 weeks gestation. In 2017, the proportion of Aboriginal or Torres Strait Islander mothers who commenced antenatal care at less than 14 weeks gestation varied from 41.5% in the Western Sydney Local Health District to 81.2% in the Hunter New England Local Health District (Table 83).
TABLE 82: DURATION OF PREGNANCY AT FIRST ANTENATAL VISIT AMONG ABORIGINAL AND TORRES STRAIT ISLANDER MOTHERS, NSW 2013–2017#
Duration of pregnancy (weeks)
Year
2013 2014 2015 2016 2017
No. % No. % No. % No. % No. %
0–13 1740 49.8 2044 54.4 2124 55.6 2662 64.6 2850 68.1
14–19 798 22.9 788 21.0 781 20.4 704 17.1 661 15.8
20+ 915 26.2 860 22.9 850 22.2 654 15.9 603 14.4
Not stated 39 1.1 64 1.7 68 1.8 98 2.4 69 1.6
TOTAL 3492 100.0 3756 100.0 3823 100.0 4118 100.0 4183 100.0
Source: NSW Perinatal Data Collection (SAPHaRI). Centre for Epidemiology and Evidence, NSW Ministry of Health.# Due to under-reporting of Aboriginal mothers to the PDC, it is likely that the true numbers of mothers are higher than shown (Table 74).
NSW HEALTH | NSW Mothers and Babies 2017 | 75

TABLE 83: DURATION OF PREGNANCY AT FIRST ANTENATAL VISIT AMONG ABORIGINAL AND TORRES STRAIT ISLANDER MOTHERS BY LOCAL HEALTH DISTRICT OF RESIDENCE, NSW 2017#
Local Health District
Duration of pregnancy at first antenatal visit (weeks)
0–13 14–19 20+ Not stated TOTAL
No. % No. % No. % No. % No. %
Sydney 78 78.8 12 12.1 9 9.1 0 0.0 99 100.0
South Western Sydney 206 69.8 48 16.3 34 11.5 7 2.4 295 100.0
South Eastern Sydney 65 57.5 42 37.2 5 4.4 1 0.9 113 100.0
Illawarra Shoalhaven 156 56.5 62 22.5 53 19.2 5 1.8 276 100.0
Western Sydney 120 41.5 81 28.0 76 26.3 12 4.2 289 100.0
Nepean Blue Mountains 136 59.4 58 25.3 32 14.0 3 1.3 229 100.0
Northern Sydney 26 72.2 6 16.7 - - - - 36 100.0
Central Coast 152 66.1 47 20.4 28 12.2 3 1.3 230 100.0
Hunter New England 893 81.2 90 8.2 97 8.8 20 1.8 1100 100.0
Northern NSW 166 71.9 34 14.7 30 13.0 1 0.4 231 100.0
Mid North Coast 196 74.8 26 9.9 35 13.4 5 1.9 262 100.0
Southern NSW 60 65.9 15 16.5 14 15.4 2 2.2 91 100.0
Murrumbidgee 126 61.8 27 13.2 49 24.0 2 1.0 204 100.0
Western NSW 429 64.4 102 15.3 128 19.2 7 1.1 666 100.0
Far West 22 62.9 8 22.9 5 14.3 0 0.0 35 100.0
Other-not stated 19 70.4 - - - - - - 27 100.0
TOTAL 2850 68.1 661 15.8 603 14.4 69 1.6 4183 100.0
Source: NSW Perinatal Data Collection (SAPHaRI). Centre for Epidemiology and Evidence, NSW Ministry of Health.# Due to under-reporting of Aboriginal mothers to the PDC, it is likely that the true numbers of mothers are higher than shown. The level of under-reporting varies between Local Health Districts (Table 74). Data not shown for cell counts less than five.
Smoking in pregnancyIn 2017, 42.4% of Aboriginal or Torres Strait Islander mothers reported smoking at some time during pregnancy, compared to 46.6% in 2013. This compares with 7.2% of non-Aboriginal or Torres Strait Islander mothers who reported smoking at some time during pregnancy in 2017.
Smoking in the second half of pregnancy poses the greatest risk to the health of both mother and baby. In 2017, 35.7% of Aboriginal or Torres Strait Islander mothers reported smoking in the second half of pregnancy. This percentage varied from 8.3% in the Northern Sydney Local Health District to 65.7% in the Far West Local Health District (Figure 3).
Source: NSW Perinatal Data Collection (SAPHaRI). Centre for Epidemiology and Evidence, NSW Ministry of Health.
FIGURE 3: SMOKING IN THE SECOND HALF OF PREGNANCY AMONG ABORIGINAL AND TORRES STRAIT ISLANDER MOTHERS BY AMOUNT SMOKED AND LOCAL HEALTH DISTRICT OF RESIDENCE, NSW 2017
1–10 per day More than 10 per day
PER CENT
Sydney
South Western Sydney
South Eastern Sydney
Illawarra Shoalhaven
Western Sydney
Nepean Blue Mountains
Northern Sydney
Central Coast
Hunter New England
Northern NSW
Mid North Coast
Southern NSW
Murrumbidgee
Western NSW
Far West
NSW
100.080.060.040.020.00.0
76 | NSW HEALTH | NSW Mothers and Babies 2017

Diabetes and hypertensionIn 2017, there were similar reported rates of pre-existing diabetes mellitus reported among Aboriginal or Torres Strait Islander mothers compared with non-Aboriginal or Torres Strait Islander mothers. However, the reported rate of gestational diabetes was lower among Aboriginal or Torres Strait Islander mothers (10.0%) than non-Aboriginal or Torres Strait Islander mothers (13.2%) (Table 84).
In 2017, there were similar rates of chronic hypertension reported among Aboriginal or Torres Strait Islander mothers compared with non-Aboriginal or Torres Strait Islander mothers. Overall, the rate of hypertension in pregnancy was higher in Aboriginal or Torres Strait Islander mothers (5.9%) compared with non-Aboriginal or Torres Strait Islander mothers (4.7%) (Table 85).
The number of Aboriginal or Torres Strait Islander mothers with medical conditions and obstetric complications reported to the Perinatal Data Collection is low, even after taking into account under-reporting of Aboriginal mothers. The low numbers may be due to under-detection and/or under-reporting.
TABLE 84: DIABETES AMONG ABORIGINAL AND NON-ABORIGINAL MOTHERS, NSW 2017#
Condition
Aboriginal or Torres Strait Islander
Non-Aboriginal or Torres Strait Islander
Not stated TOTAL
No. % No. % No. % No. %
Pre-existing diabetes mellitus 49 1.2 849 0.9 2 0.5 900 1.0
Type 1† 14 0.3 240 0.3 2 0.5 256 0.3
Type 2† 26 0.6 351 0.4 0 0.0 377 0.4
Gestational diabetes mellitus 419 10.0 11881 13.2 75 17.4 12375 13.1
Other† 9 0.2 258 0.3 0 0.0 267 0.3
TOTAL DIABETES* 468 11.2 12730 14.2 77 17.9 13275 14.1
Source: NSW Perinatal Data Collection (SAPHaRI). Centre for Epidemiology and Evidence, NSW Ministry of Health.# Due to under-reporting of Aboriginal mothers to the PDC, it is likely that the true numbers of mothers are higher than shown (Table 74).* Total diabetes refers to the number of mothers with a diagnosis of any type of diabetes mellitus.† Pre-existing diabetes mellitus type 1, 2 and other newly captured from 2016.
TABLE 85: HYPERTENSION AMONG ABORIGINAL AND NON-ABORIGINAL MOTHERS, NSW 2017#
Condition
Aboriginal or Torres Strait Islander
Non-Aboriginal or Torres Strait Islander
Not stated TOTAL
No. % No. % No. % No. %
Chronic hypertension 35 0.8 657 0.7 2 0.5 694 0.7
Pre-eclampsia 82 2.0 1266 1.4 4 0.9 1352 1.4
Eclampsia† 0 0.0 35 0.0 0 0.0 35 0.0
Gestational hypertension 137 3.3 2438 2.7 17 4.0 2592 2.7
TOTAL HYPERTENSION* 245 5.9 4258 4.7 23 5.3 4526 4.8
Source: NSW Perinatal Data Collection (SAPHaRI). Centre for Epidemiology and Evidence, NSW Ministry of Health.# Due to under-reporting of Aboriginal mothers to the PDC, it is likely that the true numbers of mothers are higher than shown (Table 74).* Total hypertension refers to the number of mothers with a diagnosis of any of the following conditions: Chronic hypertension, pre-eclampsia, eclampsia and gestational hypertension.† Eclampsia newly captured from 2016.
NSW HEALTH | NSW Mothers and Babies 2017 | 77

Labour and birthThe rate of spontaneous onset of labour among Aboriginal or Torres Strait Islander mothers fell from 57.1% in 2013 to 49.7% in 2017, while the rate of induction of labour increased from 28.5% to 33.4% (Table 86). The rate of spontaneous onset of labour was slightly higher among Aboriginal or Torres Strait Islander mothers compared to the rate of 46.2% reported among non-Aboriginal or Torres Strait Islander mothers in 2017.
Between 2013 and 2017, the rate of normal vaginal birth fell from 66.8% to 63.3%. The caesarean section rate rose from 25.5% to 29.4% (Table 87). The rate of instrumental delivery was stable at about 7.0%, and there was a slight fall in the rate of vaginal breech births from 0.7% to 0.3%.
TABLE 86: LABOUR ONSET FOR ABORIGINAL AND TORRES STRAIT ISLANDER MOTHERS, NSW 2013–2017#
Labour onset
Year
2013 2014 2015 2016 2017
No. % No. % No. % No. % No. %
Spontaneous 1993 57.1 2028 54.0 2038 53.3 2157 52.4 2080 49.7
Induced 996 28.5 1152 30.7 1202 31.4 1284 31.2 1399 33.4
No labour* 503 14.4 575 15.3 583 15.2 671 16.3 702 16.8
Not stated 0 0.0 1 0.0 0 0.0 6 0.1 2 0.0
TOTAL 3492 100.0 3756 100.0 3823 100.0 4118 100.0 4183 100.0
Source: NSW Perinatal Data Collection (SAPHaRI). Centre for Epidemiology and Evidence, NSW Ministry of Health.# Due to under-reporting of Aboriginal mothers to the PDC, it is likely that the true numbers of mothers are higher than shown (Table 74).* No labour indicates elective caesarean section.
TABLE 87: TYPE OF BIRTH AMONG ABORIGINAL AND TORRES STRAIT ISLANDER MOTHERS, NSW 2013–2017#
Type of birth
Year
2013 2014 2015 2016 2017
No. % No. % No. % No. % No. %
Normal vaginal 2332 66.8 2456 65.4 2519 65.9 2642 64.2 2649 63.3
Forceps 102 2.9 99 2.6 94 2.5 111 2.7 114 2.7
Vacuum extraction 143 4.1 145 3.9 160 4.2 178 4.3 173 4.1
Vaginal breech 26 0.7 16 0.4 16 0.4 19 0.5 14 0.3
Elective caesarean section 503 14.4 575 15.3 583 15.2 671 16.3 701 16.8
Emergency caesarean section* 386 11.1 464 12.4 451 11.8 496 12.0 530 12.7
Not stated 0 0.0 1 0.0 0 0.0 1 0.0 2 0.0
TOTAL 3492 100.0 3756 100.0 3823 100.0 4118 100.0 4183 100.0
Source: NSW Perinatal Data Collection (SAPHaRI). Centre for Epidemiology and Evidence, NSW Ministry of Health.# Due to under-reporting of Aboriginal mothers to the PDC, it is likely that the true numbers of mothers are higher than shown (Table 74).* Emergency caesarean section includes caesarean section where the onset of labour was not stated.
78 | NSW HEALTH | NSW Mothers and Babies 2017

Birth weightSince 2013, the rate of low birth weight (less than 2,500 grams) in Aboriginal or Torres Strait Islander babies has been 10% or greater and was 11.1% in 2017 (Table 88). This is higher than the rate for babies born to non-Aboriginal or Torres Strait Islander mothers, which was 6.5% in 2017. The largest number of low birth weight babies in 2017 was in the Hunter New England Local Health District (Table 89).
TABLE 88: WEIGHT OF BABIES BORN TO ABORIGINAL AND TORRES STRAIT ISLANDER MOTHERS, NSW 2013–2017#
Birth weight (grams)
Year
2013 2014 2015 2016 2017
No. % No. % No. % No. % No. %
Less than 1,000 33 0.9 42 1.1 29 0.7 54 1.3 61 1.4
1,000–1,499 36 1.0 37 1.0 45 1.2 39 0.9 42 1.0
1,500–2,499 334 9.4 350 9.2 363 9.4 357 8.6 367 8.6
2,500+ 3136 88.5 3374 88.6 3431 88.6 3722 89.2 3780 88.9
Not stated 3 0.1 5 0.1 4 0.1 2 0.0 1 0.0
TOTAL 3542 100.0 3808 100.0 3872 100.0 4174 100.0 4251 100.0
Source: NSW Perinatal Data Collection (SAPHaRI). Centre for Epidemiology and Evidence, NSW Ministry of Health.# Due to under-reporting of Aboriginal mothers to the PDC, it is likely that the true numbers of babies are higher than shown (Table 74).
TABLE 89: WEIGHT OF BABIES BORN TO ABORIGINAL AND TORRES STRAIT ISLANDER MOTHERS BY LOCAL HEALTH DISTRICT OF RESIDENCE, NSW 2017#
Local Health District
Birth weight (grams)
< 2,500 2,500+ Not stated TOTAL
No. % No. % No. % No. %
Sydney 9 9.0 91 91.0 0 0.0 100 100.0
South Western Sydney - - 272 91.6 - - 297 100.0
South Eastern Sydney 9 7.9 105 92.1 0 0.0 114 100.0
Illawarra Shoalhaven 29 10.4 251 89.6 0 0.0 280 100.0
Western Sydney 48 16.1 250 83.9 0 0.0 298 100.0
Nepean Blue Mountains 20 8.7 211 91.3 0 0.0 231 100.0
Northern Sydney - - 33 91.7 - - 36 100.0
Central Coast 23 9.9 210 90.1 0 0.0 233 100.0
Hunter New England 136 12.1 990 87.9 0 0.0 1126 100.0
Northern NSW 23 9.9 209 90.1 0 0.0 232 100.0
Mid North Coast 36 13.5 231 86.5 0 0.0 267 100.0
Southern NSW 7 7.6 85 92.4 0 0.0 92 100.0
Murrumbidgee 25 12.1 182 87.9 0 0.0 207 100.0
Western NSW 72 10.7 604 89.3 0 0.0 676 100.0
Far West 5 14.3 30 85.7 0 0.0 35 100.0
Other-not stated - - 26 96.3 - - 27 100.0
TOTAL 470 11.1 3780 88.9 - 0.0 4251 100.0
Source: NSW Perinatal Data Collection (SAPHaRI). Centre for Epidemiology and Evidence, NSW Ministry of Health.# Due to under-reporting of Aboriginal mothers to the PDC, it is likely that the true numbers of babies are higher than shown. The level of under-reporting varies between Local Health Districts (Table 74). Data not shown for cell counts less than five.
NSW HEALTH | NSW Mothers and Babies 2017 | 79

TABLE 91: GESTATIONAL AGE OF BABIES BORN TO ABORIGINAL AND TORRES STRAIT ISLANDER MOTHERS BY LOCAL HEALTH DISTRICT OF RESIDENCE, NSW 2017#
Local Health District
Gestational age (weeks)
Less than 37 37+ Not stated TOTAL
No. % No. % No. % No. %
Sydney 13 13.0 87 87.0 0 0.0 100 100.0
South Western Sydney 23 7.7 274 92.3 0 0.0 297 100.0
South Eastern Sydney 9 7.9 105 92.1 0 0.0 114 100.0
Illawarra Shoalhaven 33 11.8 247 88.2 0 0.0 280 100.0
Western Sydney 41 13.8 257 86.2 0 0.0 298 100.0
Nepean Blue Mountains 25 10.8 206 89.2 0 0.0 231 100.0
Northern Sydney - - 35 97.2 - - 36 100.0
Central Coast 26 11.2 207 88.8 0 0.0 233 100.0
Hunter New England 142 12.6 983 87.3 1 0.1 1126 100.0
Northern NSW 32 13.8 200 86.2 0 0.0 232 100.0
Mid North Coast 37 13.9 229 85.8 1 0.4 267 100.0
Southern NSW 5 5.4 87 94.6 0 0.0 92 100.0
Murrumbidgee 29 14.0 178 86.0 0 0.0 207 100.0
Western NSW 73 10.8 602 89.1 1 0.1 676 100.0
Far West 5 14.3 30 85.7 0 0.0 35 100.0
Other-not stated - - 24 88.9 - - 27 100.0
TOTAL 497 11.7 3751 88.2 3 0.1 4251 100.0
Source: NSW Perinatal Data Collection (SAPHaRI). Centre for Epidemiology and Evidence, NSW Ministry of Health.# Due to under-reporting of Aboriginal mothers to the PDC, it is likely that the true numbers of babies are higher than shown. The level of under-reporting varies between Local Health Districts (Table 74). Data not shown for cell counts less than five.
Gestational ageSince 2013, over 11% of Aboriginal or Torres Strait Islander babies have been premature (less than 37 weeks gestation) (Table 90). The rate of prematurity was 11.7% in 2017, compared with a rate of 7.2% for babies born to non-Aboriginal or Torres Strait Islander mothers. In 2017, the largest number of premature babies was in the Hunter New England Local Health District (Table 91).
TABLE 90: GESTATIONAL AGE OF BABIES BORN TO ABORIGINAL AND TORRES STRAIT ISLANDER MOTHERS, NSW 2013–2017#
Gestational age (weeks)
Year
2013 2014 2015 2016 2017
No. % No. % No. % No. % No. %
< 28 35 1.0 39 1.0 36 0.9 49 1.2 58 1.4
28–31 44 1.2 54 1.4 60 1.5 53 1.3 52 1.2
32–36 369 10.4 400 10.5 396 10.2 364 8.7 387 9.1
37–41 3076 86.8 3299 86.6 3361 86.8 3651 87.5 3714 87.4
42 + 17 0.5 15 0.4 17 0.4 49 1.2 37 0.9
Not stated 1 0.0 1 0.0 2 0.1 8 0.2 3 0.1
TOTAL 3542 100.0 3808 100.0 3872 100.0 4174 100.0 4251 100.0
Source: NSW Perinatal Data Collection (SAPHaRI). Centre for Epidemiology and Evidence, NSW Ministry of Health.# Due to under-reporting of Aboriginal mothers to the PDC, it is likely that the true numbers of babies are higher than shown (Table 74).
80 | NSW HEALTH | NSW Mothers and Babies 2017

Apgar scoreIn 2017, 3.0% of Aboriginal or Torres Strait Islander babies had an Apgar score less than seven at 5 minutes (Table 92), which is higher than the rate of 2.1% for babies born to non-Aboriginal or Torres Strait Islander mothers.
TABLE 92: APGAR SCORE OF BABIES BORN TO ABORIGINAL AND TORRES STRAIT ISLANDER MOTHERS, NSW 2013–2017#
Apgar score at 5 minutes
Year
2013 2014 2015 2016 2017
No. % No. % No. % No. % No. %
0–4 58 1.6 61 1.6 58 1.5 63 1.5 69 1.6
5–6 46 1.3 75 2.0 75 1.9 82 2.0 60 1.4
7+ 3434 97.0 3657 96.0 3720 96.1 3977 95.3 4070 95.7
Not stated 4 0.1 15 0.4 19 0.5 52 1.2 52 1.2
TOTAL 3542 100.0 3808 100.0 3872 100.0 4174 100.0 4251 100.0
Source: NSW Perinatal Data Collection (SAPHaRI). Centre for Epidemiology and Evidence, NSW Ministry of Health.# Due to under-reporting of Aboriginal mothers to the PDC, it is likely that the true numbers of babies are higher than shown (Table 74).
Infant feedingIn 2017, 61.7% of babies born to Aboriginal or Torres Strait Islander mothers were fully breastfed at discharge from hospital, 10.1% were partially breastfed and 25.0% received infant formula only (Table 93). This compares with 74.4% of babies born to non-Aboriginal or Torres Strait Islander mothers who were fully breastfed in 2017. Rates of full breastfeeding ranged from 51.0% in the Western Sydney Local Health District to 80.6% in the Northern Sydney Local Health District.
TABLE 93: INFANT FEEDING AMONG LIVEBORN BABIES OF ABORIGINAL AND TORRES STRAIT ISLANDER MOTHERS BY LOCAL HEALTH DISTRICT OF RESIDENCE, NSW 2017#
Local Health District
Infant feeding
Full breastfeeding Any breastfeeding Infant formula only Not stated TOTAL
No. % No. % No. % No. % No. %
Sydney 64 64.6 11 11.1 22 22.2 2 2.0 99 100.0
South Western Sydney 156 52.5 41 13.8 75 25.3 25 8.4 297 100.0
South Eastern Sydney 82 71.9 10 8.8 17 14.9 5 4.4 114 100.0
Illawarra Shoalhaven 177 63.2 13 4.6 75 26.8 15 5.4 280 100.0
Western Sydney 148 51.0 26 9.0 104 35.9 12 4.1 290 100.0
Nepean Blue Mountains 157 68.3 19 8.3 48 20.9 6 2.6 230 100.0
Northern Sydney - - - - - - - - 36 100.0
Central Coast 157 68.0 24 10.4 41 17.7 9 3.9 231 100.0
Hunter New England 687 61.7 131 11.8 270 24.2 26 2.3 1114 100.0
Northern NSW 164 71.0 24 10.4 37 16.0 6 2.6 231 100.0
Mid North Coast 187 71.1 26 9.9 43 16.3 7 2.7 263 100.0
Southern NSW 72 78.3 7 7.6 11 12.0 2 2.2 92 100.0
Murrumbidgee 112 54.4 17 8.3 74 35.9 3 1.5 206 100.0
Western NSW 365 54.6 65 9.7 223 33.3 16 2.4 669 100.0
Far West 23 67.6 - - 7 20.6 - - 34 100.0
Other-not stated - - - - - - - - 27 100.0
TOTAL 2600 61.7 424 10.1 1052 25.0 137 3.3 4213 100.0
Source: NSW Perinatal Data Collection (SAPHaRI). Centre for Epidemiology and Evidence, NSW Ministry of Health.# Due to under-reporting of Aboriginal mothers to the PDC, it is likely that the true numbers of babies are higher than shown. The level of under-reporting varies between Local Health Districts (Table 74). Data not shown for cell counts less than five.
NSW HEALTH | NSW Mothers and Babies 2017 | 81

Perinatal mortalityBetween 2013 and 2017, the perinatal mortality rate among Aboriginal or Torres Strait Islander babies varied between 9.6 and 12.7 per 1,000 births (Table 94). The rate of 12.7 per 1,000 births in Aboriginal or Torres Strait Islander mothers in 2017 is higher than the rate of 8.2 per 1,000 births experienced among babies born to non-Aboriginal or Torres Strait Islander mothers.
TABLE 94: PERINATAL DEATHS AMONG BABIES BORN TO ABORIGINAL AND TORRES STRAIT ISLANDER MOTHERS, NSW 2013–2017#
Perinatal deaths
Year
2013 2014 2015 2016 2017
No. Rate/ 1,000 No. Rate/ 1,000 No. Rate/ 1,000 No. Rate/ 1,000 No. Rate/ 1,000
Stillborn 26 7.3 33 8.7 34 8.8 36 8.6 38 8.9
Neonatal death 13 3.7 14 3.7 3 0.8 15 3.6 16 3.8
TOTAL 39 11.0 47 12.3 37 9.6 51 12.2 54 12.7
Source: NSW Perinatal Data Collection (SAPHaRI). Centre for Epidemiology and Evidence, NSW Ministry of Health.# Perinatal deaths include deaths reported to the PDC only. As the PDC form is completed at discharge or transfer of the baby, deaths occurring after this time may not be reported to the PDC.Due to under-reporting of Aboriginal mothers to the PDC, it is likely that the true numbers of perinatal deaths are higher than shown (Table 74).
82 | NSW HEALTH | NSW Mothers and Babies 2017

9. APPENDICES
Appendix 1: Glossary of terms
Aboriginal and Torres Strait IslanderWomen who identify themselves as Australian Aboriginal or Torres Strait Islander.
Apgar scoreA numerical scoring system routinely administered 1 and 5 minutes after birth to evaluate the condition of the baby. The score ranges from zero to 10 (10 being perfect). It takes account of five physical signs, each of which is assigned a component score of zero, one or two: heart rate, respiration, muscle tone, reflexes, and colour.
AugmentationArtificial rupture of the membranes or use of oxytocic drugs after spontaneous onset of labour.
Birth weightThe newborn infant’s first bare weight in grams. Low birth weight: birth weight less than 2,500 grams.Very low birth weight: birth weight less than 1,500 grams. Extremely low birth weight: birth weight less than 1,000 grams.
Caesarean sectionBirth of the fetus through an abdominal incision. Elective caesarean section: a caesarean section (planned or unplanned) performed before the onset of labour. Emergency caesarean section: a caesarean section performed after the onset of labour, whether or not the onset of labour was spontaneous.
ConfinementRefers to a woman having given birth. In a multiple pregnancy, one confinement will result in more than one birth.
EpiduralInjection of analgesic agent outside the dura mater which covers the spinal canal; includes lumbar, spinal, and epidural anaesthetics.
EpisiotomyAn incision of the perineum and vagina to enlarge the vulval orifice.
Gestational ageThe duration of pregnancy in completed weeks from the first day of the last normal menstrual period. Where accurate information on the date of the last menstrual period is not available, a clinical estimate of gestational age may be obtained from ultrasound during the first half of pregnancy or by examination of the newborn infant. The “best estimate” is used in this report.
Induction of labourOxytocics–prostaglandins: the initiation of labour by the use of oxytocic agents, prostaglandins, or their derivatives (oral, intravaginal or intravenous).
ARM only: the initiation of labour by artificial rupture of membranes.
Oxytocics–prostaglandins and ARM: both medical and surgical induction as defined above (combined medical and surgical induction).
Live birthThe complete expulsion or extraction from its mother of a baby who, after being born, breathes or shows any evidence of life such as a heartbeat.
ParityThe total number of live births and stillbirths of the mother before the pregnancy or birth under consideration.
Perinatal deathA stillbirth or neonatal death.
Perinatal mortality rateThe number of perinatal deaths (stillbirths and neonatal deaths) per 1,000 total births in a year (live births and stillbirths combined).
Perineal status1st degree tear: a perineal graze / laceration or tear involving: the fourchette, hymen, labia, skin, vagina, or vulva.
2nd degree tear: a perineal laceration or tear involving the pelvic floor or perineal muscles or vaginal muscles.
3rd degree tear: a perineal laceration/tear involving the anal sphincter or rectovaginal septum.
4th degree tear: a third degree perineal laceration or tear which also involves the anal mucosa or rectal mucosa.
PluralityThe number of fetuses in utero at 20 weeks gestation that are subsequently born separately. On this basis pregnancy may be classified as single or multiple.
Premature infantAn infant born before 37 completed weeks gestation.
StillbirthThe complete expulsion or extraction from its mother of a product of conception of at least 20 weeks gestation or 400 grams birth weight who did not, at any time after birth, breathe, or show any evidence of life such as a heartbeat.
NSW HEALTH | NSW Mothers and Babies 2017 | 83

Appendix 2: Explanatory notes
BreastfeedingInfant feeding is reported via three tick-box categories: breastfeeding, expressed breast milk and infant formula. More than one type of feeding may be reported by ticking multiple boxes. In this report, infant feeding is classified into three categories: full breastfeeding, which includes babies who were reported to be breastfed or to be receiving expressed breast milk; any breastfeeding, which includes babies who were reported to be receiving breast milk and infant formula; and infant formula only (no breastfeeding).
Place of residence of motherThe mother’s usual residence was the basis for coding to statistical areas of residence and NSW Local Health Districts.
LabourThe category labour—spontaneous with oxytocics—prostaglandins was used where labour was augmented with artificial rupture of membranes as well as oxytocics or prostaglandins.
Peer groupThe hospital peer group levels for 2017 have been applied to the data in this report.
These are explained in the NSW Health Information Bulletin, NSW Hospital Peer Groups 2016, which provides a consistent language for describing clinical services delivered by public hospitals and health services. The aim of the peer grouping is to identify hospitals with similar characteristics, predominantly for comparative reporting and service planning.
For the purposes of this report, peer groups were collapsed into five reporting groupings as follows:
Peer group A: includes all births in Principal referral (A1), paediatric specialist (A2) and Ungrouped acute – tertiary referral (A3) hospitals.
Peer group B: includes all births in Major hospitals group 1 (B1) and Major hospitals group 2 (B2).
Peer group C: includes all births in District group 1 (D1a) and District group 2 (D1b) hospitals.
Peer group D: includes Community with surgery (D1a) and Community without surgery (D1b) hospitals.
Private hospitals: all private hospital births.
All births, including births in hospitals that have not been assigned a peer group, have been included in table totals.
Type of birthThe “vaginal breech” category covers all forms of vaginal breech birth, including forceps to the after-coming head.
Perinatal mortality ratePerinatal deaths include deaths reported to the PDC only. As the PDC record is completed at discharge or transfer of the baby, deaths occurring after this time may not be reported to the PDC. Birth and perinatal death registration data held by the Australian Bureau of Statistics (ABS) give the most complete overall ascertainment of perinatal deaths for calculation of rates.
84 | NSW HEALTH | NSW Mothers and Babies 2017

Appendix 3: Maternal countries of birth and country of birth groups
English speakingAustraliaAustralian External Territories, NEC*BermudaCanadaEnglandGuernseyIrelandIsle of ManJerseyNew ZealandNorfolk IslandNorthern IrelandScotlandSouth AfricaSt Pierre and MiquelonUnited States of AmericaWales
Melanesia, Micronesia & PolynesiaCook IslandsFijiFrench PolynesiaGuamKiribatiMarshall IslandsMicronesia, Federated States ofNauruNew CaledoniaNiueNorthern Mariana IslandsPalauPapua New GuineaPitcairn IslandsPolynesia (excludes Hawaii), NEC*SamoaSamoa, AmericanSolomon IslandsTokelauTongaTuvaluVanuatuWallis and Futuna
Southern EuropeAlbaniaAndorraBosnia and HerzegovinaBulgariaCroatiaCyprusFormer Yugoslav Republic of Macedonia (FYROM)GibraltarGreeceHoly SeeItalyKosovoMaltaMoldovaMontenegroPortugalRomaniaSan MarinoSerbiaSloveniaSpain
Western and Northern EuropeAland IslandsAustriaBelgiumDenmarkFaroe IslandsFinlandFranceGermanyGreenlandIcelandLiechtensteinLuxembourgMonacoNetherlandsNorwaySwedenSwitzerland
Eastern Europe, Russia and Central Asian StatesAfghanistanArmeniaAzerbaijanBelarus
Czech RepublicEstoniaGeorgiaHungaryKazakhstanKyrgyzstanLatviaLithuaniaPolandRussian Federation (not USSR)SlovakiaTajikistanTurkmenistanUkraineUzbekistan
Middle East and AfricaAlgeriaAngolaBahrainBeninBotswanaBurkina FasoBurundiCameroonCape VerdeCentral African RepublicChadComorosCongo, Democratic Republic ofCongo, Republic ofCote d’IvoireDjiboutiEgyptEquatorial GuineaEritreaEthiopiaGabonGambia, Republic ofGaza Strip and West BankGhanaGuineaGuinea-BissauIranIraqIsraelJordanKenya
KuwaitLebanonLesothoLiberiaLibyaMadagascarMalawiMaliMauritaniaMauritiusMayotteMoroccoMozambiqueNamibiaNigerNigeriaOmanQatarReunionRwandaSao Tome and PrincipeSaudi ArabiaSenegalSeychellesSierra LeoneSomaliaSouth SudanSouthern and East Africa, NEC*Spanish North AfricaSt HelenaSudanSwazilandSyriaTanzaniaTogoTunisiaTurkeyUgandaUnited Arab EmiratesWestern SaharaYemenZambiaZimbabwe
South East AsiaBrunei DarussalamCambodiaIndonesiaLaosMalaysia
Myanmar, The Republic of the Union of PhilippinesSingaporeThailandTimor-LesteVietnam
North East AsiaChina (excludes SARs and Taiwan) Hong Kong (SAR of China)JapanKorea, Democratic People’s Republic of (North)Korea, Republic of (South)Macau (SAR of China)MongoliaTaiwan
Southern AsiaBangladeshBhutanIndiaMaldivesNepalPakistanSri Lanka
Central and South AmericaAnguillaAntigua and BarbudaArgentinaArubaBahamasBarbadosBelizeBolivia, Plurinational State ofBonaire, Sint Eustatius and SabaBrazilCayman IslandsChileColombiaCosta RicaCuba
CuracaoDominicaDominican RepublicEcuadorEl SalvadorFalkland IslandsFrench GuianaGrenadaGuadeloupeGuatemalaGuyanaHaitiHondurasJamaicaMartiniqueMexicoMontserratNicaraguaPanamaParaguayPeruPuerto RicoSint Maarten (Dutch part)South America, NEC*St BarthelemySt Kitts and NevisSt LuciaSt Martin (French part)St Vincent and the GrenadinesSurinameTrinidad and TobagoTurks and Caicos IslandsUruguayVenezuela, Bolivarian Republic ofVirgin Islands, British Virgin Islands, United States
* NEC = Not elsewhere classified
* NEC = Not elsewhere classified.
NSW HEALTH | NSW Mothers and Babies 2017 | 85

SHPN (CEE) 180630