NSW INJURY PROFILE: A REvIEW OF INJURY … report/IRMRC... · Struck by or struck aga nst njur es...
95
Andrew Hayen and Rebecca Mitchell NSW Injury Risk Management Research Centre The University of New South Wales Sydney, Australia NSW INJURY PROFILE: A REVIEW OF INJURY HOSPITALISATIONS DURING 1989–1990 TO 2003–2004 NSW INJURY RISK MANAGEMENT RESEARCH CENTRE I R M R C ISBN 0 7334 2301 9 June 2006
Transcript of NSW INJURY PROFILE: A REvIEW OF INJURY … report/IRMRC... · Struck by or struck aga nst njur es...

Andrew Hayen and Rebecca MitchellNSW Injury Risk Management Research CentreThe University of New South WalesSydney, Australia
NSW INJURY PROFILE:A REvIEW OF INJURY HOSPItALISAtIONSDURINg 1989–1990 tO 2003–2004
N S W I N j u r y r I S k MaNageMeNt reSearch ceNtre
I R M R C
ISBN 0 7334 2301 9June 2006

Copyright © The University of New South Wales.
Suggested citation:Hayen, A. Mitchell, R. NSW Injury Profile: A Review of Injury Hospitalisations During 1989–1990 to 2003–2004. Sydney: NSW Injury Risk Management Research Centre, The University of New South Wales, 2006.

/ �
Contents
L�st of tables _______________________________________________ ���
L�st of F�gures ______________________________________________ v�
Abbrev�at�ons _____________________________________________ v���
Acknowledgements __________________________________________ �x
Execut�ve Summary _________________________________________ x�
1. Introduct�on ______________________________________________ 1
2. Methods ________________________________________________ 3
2.1 Definitions ___________________________________________ 3
2.1.1 Injury ____________________________________________________________ 3
2.1.2 Injury mechanism ___________________________________________________ 3
2.1.3 Injury hospitalisation ________________________________________________ 4
2.1.4 Population data source _______________________________________________ 5
2.1.5 Injury data coding issues _____________________________________________ 5
2.2 Analysis _____________________________________________ 6
2.2.1 Top 10 causes of hospitalisation for NSW residents _________________________ 7
2.2.2 Time trends ________________________________________________________ 7
2.2.3 Age- and sex-specific rates ____________________________________________ 7
2.2.4 Injury mechanism subcategory-specific frequencies and rates_________________ 7
3. Injury hosp�tal�sat�ons �n NSW _______________________________ 8
4. Falls __________________________________________________ 12
5. Motor veh�cle transport ___________________________________ 16
6. Struck by or struck aga�nst �njur�es __________________________ 21
7. Self-harm ______________________________________________ 25
8. Cut or p�erce-related �njur�es _______________________________ 29
9. Interpersonal v�olence ____________________________________ 33
10. Po�son�ng _____________________________________________ 37
11. Non-motor veh�cle road transport __________________________ 41
12. Natural and env�ronmental factors __________________________ 45
contents

�� / NSW INJURY PROFILE: A REvIEW OF INJURY HOSPITALISATIONS DURINg 1989–1990 TO 2003–2004
13. Fore�gn bod�es _________________________________________ 50
14. F�re and burns __________________________________________ 53
15. Mach�nery �njur�es ______________________________________ 57
16. Near-drown�ng _________________________________________ 61
17. Conclus�ons and recommendat�ons _________________________ 65
18. References ____________________________________________ 70
Append�x 1. L�st of Ecodes by mechan�sm _______________________ 72
Append�x 2. L�st of d�sease and �njury categor�es for
top 10 causes of hosp�tal�sat�on _______________________________ 73
Append�x 3. L�st of Ecodes by �njury mechan�sm and
�njury mechan�sm subcategory _______________________________ 74
Append�x 4. Age-spec�fic rates of hosp�tal�sat�on
by age group and mechan�sm _________________________________ 77
/ ���
List of tables
table 1. Significant changes in injury-related hospitalisation rates
by mechanism, NSW, 1989–1990 to 2003–2004 ___________________ x��
table 2. Top 10 leading causes of hospitalisation by age group, NSW,
1999–2000 to 2003–2004 _____________________________________ 9
table 3. Injury hospitalisations by mechanism in NSW,
number, rate and CI, 1999–2000 to 2003–2004 ___________________ 11
table 4. Injury hospitalisations by fall submechanism, NSW,
number, rate and CI, 1999–2000 to 2003–2004 ___________________ 14
table 5. Number of hospitalisations for falls
by age group and cause, NSW, 1999–2000 to 2003–2004 ___________ 15
table 6. Injury hospitalisations by motor vehicle transport road
user class, NSW, number, rate and CI, 1999–2000 to 2003–2004 ______ 18
table 7. Number of hospitalisations for motor vehicle transport
incidents by age group and cause, NSW, 1999–2000 to 2003–2004 ____ 20
table 8. Injury hospitalisations by struck by/struck against injury
cause, NSW, number, rate and CI, 1999–2000 to 2003–2004 _________ 23
table 9. Number of hospitalisations for struck by/struck against
injuries by age group and cause, NSW, 1999–2000 to 2003–2004 _____ 24
table 10. Injury hospitalisations by method of self-harm, NSW,
number, rate and CI, 1999–2000 to 2003–2004 ___________________ 27
table 11. Number of hospitalisations for self-harm by age group
and cause, NSW, 1999–2000 to 2003–2004 ______________________ 28
table 12. Injury hospitalisations by cut/pierce injury cause, NSW,
number, rate and CI, 1999–2000 to 2003–2004 ___________________ 31
table 13. Number of hospitalisations for cut/pierce injuries
by age group and cause, NSW, 1999–2000 to 2003–2004 ___________ 32
table 14. Injury hospitalisations by interpersonal violence method,
NSW, number, rate and CI, 1999–2000 to 2003–2004 _______________ 35
table 15. Number of hospitalisations for interpersonal violence
by age group and cause, NSW, 1999–2000 to 2003–2004 ___________ 36
list of tables
�v / NSW INJURY PROFILE: A REvIEW OF INJURY HOSPITALISATIONS DURINg 1989–1990 TO 2003–2004
table 16. Injury hospitalisations by poisoning substance, NSW,
number, rate and CI, 1999–2000 to 2003–2004 ___________________ 39
table 17. Number of hospitalisations for poisoning by age group
and cause, NSW, 1999–2000 to 2003–2004 ______________________ 40
table 18. Injury hospitalisations by non-motor vehicle road
transport-related cause, NSW, number, rate and CI,
1999–2000 to 2003–2004 ____________________________________ 43
table 19. Number of hospitalisations for non-motor vehicle road
transport-related injuries by age group and cause, NSW,
1999–2000 to 2003–2004 ____________________________________ 44
table 20. Injury hospitalisations by natural and environmental
factor-related cause, NSW, number, rate and CI,
1999–2000 to 2003–2004 ____________________________________ 47
table 21. Number of hospitalisations for natural and environmental
factor-related injuries by age group and cause, NSW,
1999–2000 to 2003–2004 ____________________________________ 49
table 22. Injury hospitalisations for foreign bodies, NSW,
number, rate and CI, 1999–2000 to 2003–2004 ___________________ 51
table 23. Number of hospitalisations for foreign body-related
injuries by age group, NSW, 1999–2000 to 2003–2004______________ 52
table 24. Injury hospitalisations by fire/burns type, NSW,
number, rate and CI, 1999–2000 to 2003–2004 ___________________ 55
table 25. Number of hospitalisations for injury due to fire/burns
by age group and cause, NSW, 1999–2000 to 2003–2004 ___________ 56
table 26. Injury hospitalisations by machinery-related cause, NSW,
number, rate and CI, 1999–2000 to 2003–2004 ___________________ 59
table 27. Number of hospitalisations for machinery-related injuries
by age group and cause, NSW, 1999–2000 to 2003–2004 ___________ 60
table 28. Injury hospitalisations by near-drowning location, NSW,
number, rate and CI, 1999–2000 to 2003–2004 ___________________ 63
table 29. Number of hospitalisations for near-drowning
by age group and cause, NSW, 1999–2000 to 2003–2004 ___________ 64
table 30. Significant changes in injury-related hospitalisation rates
by mechanism, NSW, 1989–1990 to 2003–2004 ___________________ 66

/ v
table 31. Age-specific rates of hospitalisation per 100,000
population by age group and mechanism for all persons, NSW,
1999–2000 to 2003–2004 ____________________________________ 78
table 32. Age-specific rates of hospitalisation per 100,000 population
by age group and mechanism for males, NSW,
1999–2000 to 2003–2004 ____________________________________ 79
table 33. Age-specific rates of hospitalisation per 100,000 population
by age group and mechanism for females, NSW,
1999–2000 to 2003–2004 ____________________________________ 80
list of tables

v� / NSW INJURY PROFILE: A REvIEW OF INJURY HOSPITALISATIONS DURINg 1989–1990 TO 2003–2004
List of figures
F�gure 1. Injury hospitalisation rates by sex, NSW,
1989–1990 to 2003–2004 _____________________________________ 8
F�gure 2. Injury hospitalisation rates by age group and sex, NSW,
1999–2000 to 2003–2004 ____________________________________ 10
F�gure 3. Hospitalisation rate for injury due to falls by sex, NSW,
1989–1990 to 2003–2004 ____________________________________ 13
F�gure 4. Age-specific hospitalisation rate for falls by sex, NSW,
1999–2000 to 2003–2004 ____________________________________ 13
F�gure 5. Hospitalisation rate for injury due to motor vehicle
transport by sex, NSW 1989–1990 to 2003–2004 __________________ 17
F�gure 6. Age-specific hospitalisation rate for motor vehicle
transport by sex, NSW, 1999–2000 to 2003–2004 _________________ 17
F�gure 7. Hospitalisation rate for injury due to struck by/struck
against injuries by sex, NSW 1989–1990 to 2003–2004 _____________ 22
F�gure 8. Age-specific hospitalisation rate for struck by/struck
against injuries by sex, NSW, 1999–2000 to 2003–2004 _____________ 22
F�gure 9. Hospitalisation rate for injury due to self-harm by sex,
NSW 1989–1990 to 2003–2004 _______________________________ 26
F�gure 10. Age-specific hospitalisation rate for self-harm by sex,
NSW, 1999–2000 to 2003–2004 _______________________________ 26
F�gure 11. Hospitalisation rate for injury due to cut/pierce injuries
by sex, NSW 1989–1990 to 2003–2004 _________________________ 29
F�gure 12. Age-specific hospitalisation rate for cut/pierce injuries
by sex, NSW, 1999–2000 to 2003–2004 _________________________ 30
F�gure 13. Hospitalisation rate for injury due to interpersonal
violence by sex, NSW 1989–1990 to 2003–2004 __________________ 34
F�gure 14. Age-specific hospitalisation rate for interpersonal
violence by sex, NSW, 1999–2000 to 2003–2004 __________________ 34
F�gure 15. Hospitalisation rate for injury due to poisoning by sex,
NSW 1989–1990 to 2003–2004 _______________________________ 38
/ v��list of figures
F�gure 16. Age-specific hospitalisation rate for poisoning by sex,
NSW, 1999–2000 to 2003–2004 _______________________________ 38
F�gure 17. Hospitalisation rate for injury due to non-motor vehicle
road transport-related injuries by sex, NSW 1989–1990 to 2003–2004 _ 42
F�gure 18. Age-specific hospitalisation rate for non-motor vehicle road
transport-related injuries by sex, NSW, 1999–2000 to 2003–2004 _____ 42
F�gure 19. Hospitalisation rate for injury due to natural and
environmental factor-related injuries by sex, NSW
1989–1990 to 2003–2004 ____________________________________ 46
F�gure 20. Age-specific hospitalisation rate for natural and
environmental factor-related injuries by sex, NSW,
1999–2000 to 2003–2004 ____________________________________ 46
F�gure 21. Hospitalisation rate for injury due to foreign body-related
injuries by sex, NSW 1989–1990 to 2003–2004 ___________________ 50
F�gure 22. Age-specific hospitalisation rate for foreign
body-related injuries by sex, NSW, 1999–2000 to 2003–2004 ________ 51
F�gure 23. Hospitalisation rate for injury due to fire/burns by sex,
NSW 1989–1990 to 2003–2004 _______________________________ 55
F�gure 24. Age-specific hospitalisation rate for injury due to
fire/burns by sex, NSW, 1999–2000 to 2003–2004 _________________ 55
F�gure 25. Hospitalisation rate for injury due to machinery-related
injuries by sex, NSW 1989–1990 to 2003–2004 ___________________ 58
F�gure 26. Age-specific hospitalisation rate for machinery-related
injuries by sex, NSW, 1999–2000 to 2003–2004 ___________________ 58
F�gure 27. Hospitalisation rate for injury due to near-drowning
by sex, NSW 1989–1990 to 2003–2004 _________________________ 62
F�gure 28. Age-specific hospitalisation rate for near-drowning by sex,
NSW, 1999–2000 to 2003–2004 _______________________________ 62

v��� / NSW INJURY PROFILE: A REvIEW OF INJURY HOSPITALISATIONS DURINg 1989–1990 TO 2003–2004
Abbreviations
ABS Australian Bureau of Statistics
CI Confidence interval
Ecode External cause of injury code
HOISt Health Outcomes and Information Statistical Toolkit
ICD International Classification of Disease
ICD-10 International Classification of Diseases and Related Health Problems, 10th Revision
ICD-10-AM International Classification of Disease, 10th Revision, Australian Modification
ICD-9 International Classification of Disease, 9th Revision
ICD-9-CM International Classification of Disease, 9th Revision, Clinical Modification
IPv Interpersonal violence
IRMRC NSW Injury Risk Management Research Centre
ISC Inpatient Statistics Collection
Mv Motor vehicle
Mvt Motor vehicle transport
NCC National Coding Centre
NCCH National Centre for Classification in Health
Ncode Nature of medical condition or injury
NEC Not elsewhere classified
NEF Natural and environmental factors
NSW New South Wales
WHO World Health Organization
/ �x
Acknowledgements
The NSW Injury Risk Management Research Centre (IRMRC) is funded by the NSW Department of
Health, the NSW Roads and Traffic Authority, and the NSW Motor Accidents Authority and supported
by the University of New South Wales. Production of this report was funded through the IRMRC’s
core research program. The Centre for Epidemiology and Research of the NSW Department of Health
provided the data used in this report, which were accessed via HOIST. We are also grateful for the use
of some SAS macros developed by the Centre for Epidemiology and Research.
Comments on the draft report were received from:
• Pam Albany, NSW Department of Health
• Kwame Atsu, Motor Accidents Authority
• Caroline Finch, NSW Injury Risk Management Research Centre
• gwen Cosier, NSW Department of Health
• Andrew graham, Roads and Traffic Authority
• Claire Monger, NSW Department of Health
• Maureen Owen, NSW Department of Health

/ x�
Executive Summary
This report provides an overview of injury-related hospitalisations of NSW residents during 1989–1990
to 2003–2004. Injury-related morbidity data for this report were obtained from the NSW Inpatient
Statistics Collection of the NSW Health Department. This report describes in detail the 12 most common
injury-related mechanisms which represent 85.1% of injury-related hospitalisations, along with near-
drowning events that resulted in hospitalisation.
Injury, poisoning and certain other consequences of external causes represent a large proportion of all
admissions to hospital for NSW residents, and were the sixth highest cause of hospitalisation for NSW
residents for all age groups during 1999–2000 to 2003–2004. During this period, there were 503,530
admissions to hospital that were injury-related, giving a hospitalisation rate of 1,523 per 100,000
population. Males had one-and-a-half times the injury hospitalisation rate of females. Individuals 65
years and older (predominantly for fall-related injuries) and 15–24 years (particularly for motor vehicle
transport and fall-related injuries) had the highest hospitalisation rates compared to all other age
groups.
Falls, motor vehicle transport-related injuries, struck by/struck against injuries, injuries resulting from
self-harm, cut/pierce injuries, and injuries resulting from interpersonal violence were the most common
injury-related hospitalisations during 1999–2000 to 2003–2004.
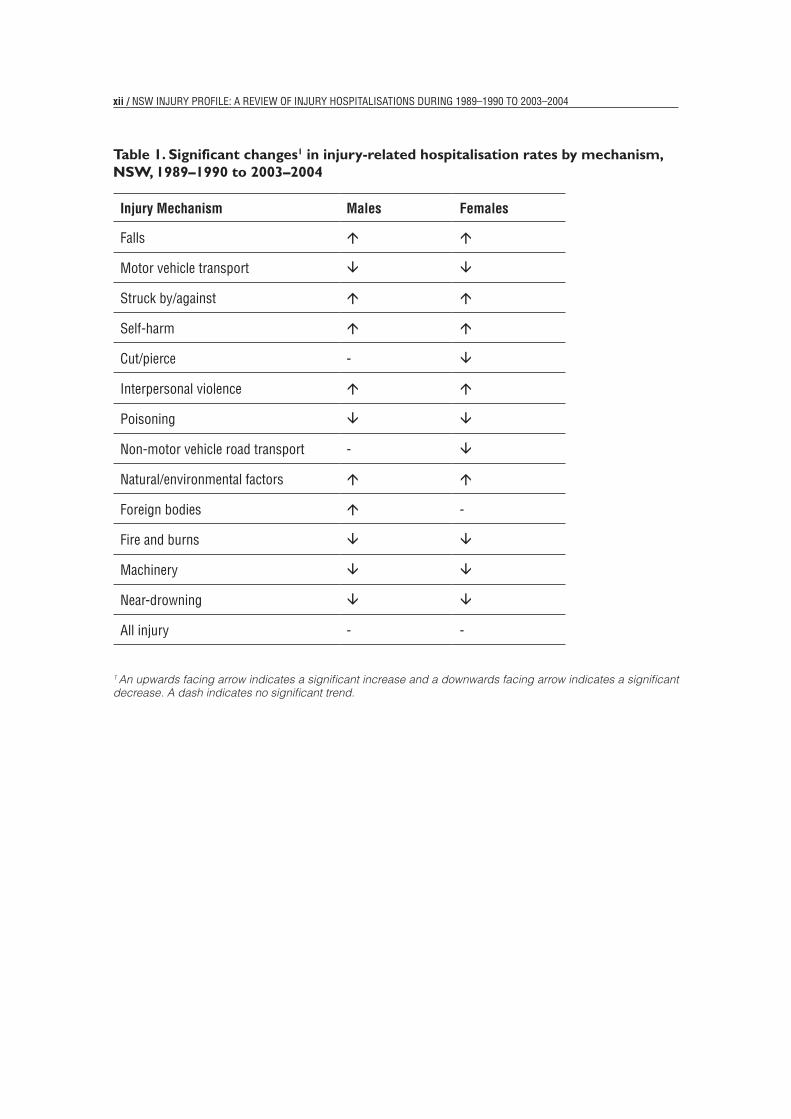
Over the period 1989–1990 to 2003–2004, the overall injury rate remained fairly constant. However,
yearly hospitalisation rates significantly decreased or increased for a number of injury mechanisms
(Table 1).
Priority areas identified for prevention activities are:
• falls
• motor vehicle transport incidents
• struck by/struck against injuries
• injuries sustained during an attempt at self-harm
• cut/pierce-related injuries
• injuries as a result of interpersonal violence.
eXecutiVe suMMarY
x�� / NSW INJURY PROFILE: A REvIEW OF INJURY HOSPITALISATIONS DURINg 1989–1990 TO 2003–2004
Table 1. Significant changes1 in injury-related hospitalisation rates by mechanism, NSW, 1989–1990 to 2003–2004
Injury Mechan�sm Males Females
Falls
Motor vehicle transport
Struck by/against
Self-harm
Cut/pierce -
Interpersonal violence
Poisoning
Non-motor vehicle road transport -
Natural/environmental factors
Foreign bodies -
Fire and burns
Machinery
Near-drowning
All injury - -
1 An upwards facing arrow indicates a significant increase and a downwards facing arrow indicates a significant decrease. A dash indicates no significant trend.
/ x���eXecutiVe suMMarY
Recommendations to enhance the information collected regarding particular injury mechanisms
include:
• recording the date of injury
• incorporating additional detail into the ICD-10-AM classification system for injuries resulting
from:
- falls
- foreign bodies
- fire and burns
- struck by/struck against injuries
- cutting/piercing injuries.

/ 1
1 Introduction
Injuries are a significant public health issue with over five million injury-related deaths worldwide each
year (Krug et al, 2000). In Australia, injury is the leading cause of death for individuals aged 44 years
or less (Kreisfeld and Harrison, 2005). Around 2,500 individuals are fatally injured in New South Wales
(NSW) each year (Schmertmann et al, 2004). While injury-related mortality represents a portion of the
injury burden in NSW, many more individuals are hospitalised in NSW following an injury. Together
lifetime injury-related mortality and morbidity were estimated to cost $3.53 billion in NSW during 1998–
1999 (Potter-Forbes and Aisbett, 2003).
Injuries are preventable occurrences and through examining their frequency and causes, appropriate
injury prevention strategies can be developed. There has been a range of interventions developed that
are effective in preventing injuries, such as changes in legislation, regulation or policies, improved
enforcement, environmental changes, improvements in design, and changes in individual behaviour
(National Injury Prevention Advisory Council, 1999). The prevention of injury-related morbidity and
associated disability in the community leads to cost savings in both direct and indirect costs associated
with these incidents, including cost savings associated with medical treatment and long term care (Miller
and Levey, 2000).
Access to information on hospitalised injury and detailed analysis and reporting of this information
assists in establishing the magnitude of hospitalised injury and in the identification of areas for injury
prevention activities. This report provides an overview of the causes of hospitalisation for NSW residents.
It describes the trend of hospitalised injury of NSW residents for selected injury mechanisms from
1989–1990 to 2003–2004, and presents a detailed analysis of select injury mechanisms during 1999–
2000 to 2003–2004.
INTRODUCTION

2 / NSW INJURY PROFILE: A REvIEW OF INJURY HOSPITALISATIONS DURINg 1989–1990 TO 2003–2004
/ 3
2 Methods
2.1 Definitions
The following sections present the case definitions of injury, injury mechanism and morbidity used for
the purposes of this report.
2.1.1 injury
According to Robertson (1998), “An injury results when too much or too little energy (in the case
of asphyxiation) is transferred to the human body, at rates or amounts that are above or below the
tolerance of human tissues, resulting in damage”. The World Health Organization (WHO) defines an
injury similarly. An injury is “a bodily lesion at the organic level resulting from acute exposure to energy
(this energy can be mechanical, thermal, electrical, chemical, or radiant) interacting with the body in
amounts or rates that exceed the threshold of physiological tolerance” (Peden et al, 2001). Section 2.1.3
outlines the criteria used for putting into practice the definitions of injury used in this report.
In order to recognise the physical nature of an injury (e.g. a broken leg) and the external cause of
the injury (e.g. a fall), two separate sets of codes were developed by WHO as part of its work on
an International Classification of Disease (ICD) coding structure (WHO, 1977; WHO, 1992). One set,
known as diagnostic codes or Ncodes, describes the physical nature of an injury and provides important
information from a clinical standpoint. The other set, known as external cause codes or Ecodes, provides
important information for prevention purposes, by identifying the type of energy that caused the physical
injury. Section 2.1.3 describes the case selection process using these codes for this report.
2.1.2 injurymechanism
Injuries are usually classified in terms of their external cause and intent. An injury mechanism
(represented by an Ecode) is defined as the external object or circumstance that caused the injury, such
as motor vehicle transport or drowning. The intent can be unintentional, intentional or undetermined. For
example, the intent of an injury caused by a firearm could be unintentional, intentional (e.g. homicide,
self-harm) or not able to be determined.
Injury mechanisms that are intentional are either self-inflicted or inflicted by another person or persons.
All injuries that are intentionally self-inflicted are grouped under an injury mechanism called self-harm.
For example, a poisoning that is self-inflicted is considered to be self-harm and is therefore separated
from poisonings that have occurred unintentionally. However, for this report, if the individual was aged
less than 10 years the ingestion of a poisonous substance(s) was not considered to be a self-harm
event and was included in the other injuries category as a young child’s understanding of the concept of
METHODS

4 / NSW INJURY PROFILE: A REvIEW OF INJURY HOSPITALISATIONS DURINg 1989–1990 TO 2003–2004
death and living is thought to be immature (Mishara, 1999). All injuries that are intentionally inflicted by
another person or persons are grouped under an injury mechanism called interpersonal violence. Injury
caused by the intentional use of a firearm on another person is considered to be interpersonal violence
and is therefore separate from unintentional firearm injuries.
Thirteen injury mechanisms are described in this report. Twelve of the mechanisms each resulted in
more than 2,000 hospitalisations of NSW residents during 1999–2000 to 2003–2004, and accounted
for 85.1% of injury-related hospitalisations. The remaining injury mechanism, near-drowning, resulted
in fewer than 2,000 hospitalisations over this period, but is regarded as a national priority area and is
included in this report (Australian Water Safety Council, 2004).
The International Classification of Disease, version 9 clinical modification (ICD-9-CM) and the
International Classification of Diseases, version 10 Australian modification (ICD-10-AM) Ecodes for the
injury mechanisms included in this report are listed in Appendix 1. During the period of the report,
various editions of ICD-10-AM were used to code hospital separations in NSW.
2.1.3 injuryhospitalisation
Hospitalisation data were obtained from the NSW Inpatient Statistics Collection (ISC), a census (since
July 1, 1993) of all services for admitted patients to public and private hospitals, private day procedures,
and public psychiatric hospitals. The ISC is a financial year collection from 1 July through to 30 June of
the following year. The ISC is maintained by the NSW Department of Health. Data were obtained via the
Health Outcomes and Information Statistical Toolkit (HOIST).
The ISC also contains data on hospitalisations of NSW residents that occurred in another state. However,
these data were not available for 2003–2004. The number of interstate hospitalisations for this year was
imputed based on hospitalisations for the previous three years. Details of the method used may be found
in the ‘The health of the people of NSW: Report of the Chief Health Officer’ (Population Health Division,
2004).
Data for 1998–1999 and following years are for episodes of care in hospital, which end with the discharge,
transfer or death of the patient, or when the service category for the admitted patient changed. Data for
the years 1989–1990 to 1997–1998 are for periods of stay. Periods of stay end with the discharge,
transfer, or death of the patient. The change from period of stay to episodes of care may cause a small
rise in the apparent number of hospitalisations in the later years.
Since 1998–1999, ISC data have been coded using the ICD-10-AM (National Centre for Classification in
Health, 2000). For the years 1989–1990 to 1997–1998, ISC data were coded using ICD-9-CM (National
Coding Centre, 1996).
/ 5
Hospitalisations that satisfied the following criteria were included in the report:
• The hospitalisation was for a patient who was a resident of NSW
• A principal diagnosis in the ICD-10-AM range S00-T98 (1998–1999 to 2003–2004) or in the
ICD-9-CM range 800-999 (for 1989–1990 to 1997–1998)
• An external cause code in the ICD-10-AM range v01-Y39 or Y85-Y98 (1998–1999 to
2003–2004) or in the ICD-9-CM range E800-E869, E880-E929, E950-E999 (for 1989–1990
to 1997–1998).
In addition, hospital separations relating to transfers or statistical discharges were excluded. This was to
partly eliminate ‘multiple counts’, which occur when an injured person has more than one hospitalisation
for a given injury.
In Table 2, hospitalisations with a principal diagnosis in the ICD-10-AM range S00-T98 and with an
external cause of ‘complications of care’ (ICD-10-AM: Y40-Y84, Y88; ICD-9-CM: E870-E879, E930-
E948) are also included, along with those described above. These hospitalisations (i.e. including
‘complications of care’) are referred to as ‘Injury, poisoning and certain other consequences of external
causes’ to distinguish these analyses from those presented in the rest of this report.
Data in this report include 16,974 NSW residents who died whilst hospitalised due to injury, poisoning
and certain other consequences of external causes between 1989–1990 and 2003–2004.
2.1.4 Populationdatasource
Age- and sex-specific population estimates as at 30 December of each year were obtained from the NSW
Department of Health. These estimates are based on the Australian Bureau of Statistics (ABS) population
estimates as at 30 June. More detail regarding ABS population estimates may be found in ‘The Health of
the People of NSW: Report of the Chief Health Officer’ (Population Health Division, 2004).
2.1.5 injurydatacodingissues
The data used in this report span a change in the coding scheme used to classify injury and disease. The
ICD was initially formalised in 1893. Since 1948, it has been revised in its entirety approximately every
10 years by WHO. The two ICD revisions covered in this report are ICD-9-CM (NCC, 1996), which was
in use in the ISC from 1989–1990 to 1997–1998, and ICD-10-AM (NCCH, 2000) used from 1998–1999
onward.
In ICD-10 alphanumeric codes were introduced (e.g. A37, R01) to represent an injury or disease,
superseding the numeric codes (e.g. 125, 802) used in ICD-9. The external cause of injury codes have
been included within the alphanumeric structure of ICD-10, as opposed to the separate scheme in ICD-9
(i.e., use of E800-E999).
METHODS

6 / NSW INJURY PROFILE: A REvIEW OF INJURY HOSPITALISATIONS DURINg 1989–1990 TO 2003–2004
At the time of separation from hospital, a consequence or ‘nature of injury’ code is assigned by a
medical coder on the patient’s medical record. In ICD-9, there was a specific Ncode for each injury (i.e.,
800–999) and the codes were organised by the type of injury (e.g. fracture, dislocation). In ICD-10, a
unique Ncode still exists, but the codes are organised by the location of the body part injured (e.g. head)
instead of the type of injury.
For each injury Ncode and a few other disease Ncodes, an external cause of injury code (Ecode) must
also be supplied to identify the cause or mechanism of the injury (e.g. drowning, fall, burn). Two major
changes regarding Ecodes occurred between ICD-9 and ICD-10. In ICD-9, the person injured in a transport
incident (e.g. motor vehicle) was secondary to the type of incident (e.g. collision with other motor
vehicle). However, in ICD-10, the coding structure focuses firstly on the person injured and secondly on
the type of incident. The second change in ICD-10 was the introduction of codes for the place where the
injury occurred (e.g. home) and the activity at the time of the injury (e.g. playing sport).
2.2 AnAlysis
Each of the following sections briefly describes the types of analysis conducted using the hospitalisation
data. Three types of epidemiological analyses were conducted:
• number of hospitalisations
• age- and sex-specific rate of hospitalisations
• age-adjusted rates of hospitalisations.
Age-specific rates were calculated by dividing the number of hospitalisations for a particular age
group (e.g. under five years) by the population of the age group. Rates are presented as the number of
hospitalisations per 100,000 population, except in the case of self-harm where rates are presented as
the number of hospitalisations per 100,000 population aged 10 years or older.
Age-adjustment is used to adjust for the effects of differences in the age-composition of populations
across time or geographic region. In this report, age-adjustment was calculated using direct age-
standardisation. An age-adjusted rate is a weighted sum of age-specific rates, where each weight is an
age-specific population in the standard population. The estimated Australian residential population as at
30 June 2001 was used in this report as the standard population. Confidence intervals were calculated
using the method of Dobson et al (1991).
The following analyses are provided in this report.
2.2.1 top10causesofhospitalisationfornsWresidents
All hospitalisations for 1999–2000 to 2003–2004 were grouped into disease and injury categories, using
the principal diagnosis. The disease categories were based on the disease chapter headings in ICD-10.

/ 7
The list of disease and injury categories used is at Appendix 2. The top 10 causes of hospitalisation
tables were generated by ranking the frequencies of each disease and injury by age group. The following
age groups were used to present frequencies for the top 10 leading causes of hospitalisation tables:
under 1, 1–4, 5–9, 10–14, 15–24, 25–34, 35–44, 45–54, 55–64, and 65+ years.
Note that the numbers of injury hospitalisations in the top 10 causes of hospitalisation table (Table
2) will differ substantially from those given in the rest of the report, because this table includes all
hospitalisations with a principal diagnosis of injury, poisoning and certain other consequences of external
causes. However, in the rest of this report, those hospitalisations with a principal diagnosis of injury,
poisoning and certain other consequences of external causes must also have an external cause code in
the range in the ICD-10-AM range v01-Y39, Y85-Y87 or Y89-Y98 (1998–1999 to 2003–2004) or in the
ICD-9-CM range E800-E869, E880-E929, E950-E999 (for 1989–1990 to 1997–1998) to be considered
as an injury-related hospitalisation (see section 2.1.3).
2.2.2 timetrends
Age-adjusted rates for each injury mechanism were calculated annually from 1989–1990 to 2003–2004.
A Poisson or negative binomial regression analysis (with population as an offset) was performed to
examine the statistical significance of changes in the trend over the time period, and to calculate the
annual percentage change in the rate of hospitalisations. This method takes into account changes in
the age-structure of the population. Because of coding changes and changes in admission practices of
hospitals, caution needs to be exercised in the interpretation of these trends.
2.2.3 Age-andsex-specificrates
Age and sex-specific rates for five-year age groups were calculated for each injury mechanism for 1999–
2000 to 2003–2004 and presented by sex and age group.
2.2.4 injurymechanismsubcategory-specificfrequenciesandrates
The total number of hospitalisations for 1999–2000 to 2003–2004 for each injury mechanism was divided
into subcategories specific to each injury mechanism. The list of injury mechanism subcategories by
Ecode is at Appendix 3. The period 1999–2000 to 2003–2004 was chosen because hospital separations
throughout this period were coded according to ICD-10-AM.
Frequencies for the injury mechanism subcategories were also ranked by age group and presented in a
“Top 10” table format. The following age groups were used to present frequencies for the top 10 leading
causes of injury hospitalisation tables: under 1, 1–4, 5–9, 10–14, 15–24, 25–34, 35–44, 45–54, 55–64,
and 65+ years.
Frequencies and rates for all persons, males and females were also calculated for each injury mechanism.
This information was presented in a table and the subcategories were ranked by the number of
hospitalisations in each subcategory.
METHODS

8 / NSW INJURY PROFILE: A REvIEW OF INJURY HOSPITALISATIONS DURINg 1989–1990 TO 2003–2004
3. Injury hospitalisations in NSW
During the period 1999–2000 to 2003–2004, injury, poisoning and certain other consequences of external
causes were the sixth leading cause of hospitalisation of all NSW residents (Table 2). Injury, poisoning
and certain other consequences of external causes were the leading cause of hospitalisation in those aged
10–14 years, the second leading cause of hospitalisation in those aged 5–9 years, and the third leading
cause in those aged 1–4 years and 15–24 years. Injury, poisoning and certain other consequences of
external causes were one of the top 10 leading causes of hospitalisation in all age groups. There were
606,954 hospitalisations with a principal diagnosis of injury, poisoning and certain other consequences
of external causes during this period, which represented 6.3% of all hospitalisations.
Data from 1989–1990 to 2003–2004 were used to describe the profile of injury-related hospitalisations
for NSW residents. Hospitalisation data from 1999–2000 to 2003–2004 were used in the majority of the
analyses, except for the trend analyses, which used hospitalisation data from 1989–1990 to 2003–2004.
Hospitalisations for which the external cause was a complication of care are not reported in the following
analyses.
Over the period 1989–1990 to 2003–2004, there was no significant trend in the age-adjusted hospitalisation
rate for injury (Figure 1). Hospitalisation rates for injury in males were significantly higher than those in
females for every year in this period.
Figure 1. Injury hospitalisation rates by sex, NSW, 1989–1990 to 2003–2004
7
3. Injury hospitalisations in NSW
During the period 1999–2000 to 2003–2004, injury, poisoning and certain other consequences of external causes were the sixth leading cause of hospitalisation of all NSW residents (Table 2). Injury, poisoning and certain other consequences of external causes were the leading cause of hospitalisation in those aged 10–14 years, the second leading cause of hospitalisation in those aged 5–9 years, and the third leading cause in those aged 1–4 years and 15–24 years. Injury, poisoning and certain other consequences of external causes were one of the top 10 leading causes of hospitalisation in all age groups. There were 606,954 hospitalisations with a principal diagnosis of injury, poisoning and certain other consequences of external causes during this period, which represented 6.3% of all hospitalisations.
Data from 1989–1990 to 2003–2004 were used to describe the profile of injury-related hospitalisations for NSW residents. Hospitalisation data from 1999–2000 to 2003–2004 were used in the majority of the analyses, except for the trend analyses, which used hospitalisation data from 1989–1990 to 2003–2004. Hospitalisations for which the external cause was a complication of care are not reported in the following analyses.
Over the period 1989–1990 to 2003–2004, there was no significant trend in the age-adjusted hospitalisation rate for injury (Figure 1). Hospitalisation rates for injury in males were significantly higher than those in females for every year in this period.
Figure 1. Injury hospitalisation rates by sex, NSW, 1989–1990 to 2003–2004
050
010
0015
0020
00
Year
Rat
e pe
r 100
,000
89-90 90-91 91-92 92-93 93-94 94-95 95-96 96-97 97-98 98-99 99-00 00-01 01-02 02-03 03-04
Males Females

/ 9INJURY HOSPITALISATIONS IN NSW
8
tab
le2
.to
p1
0le
adin
gca
use
so
fho
spit
alis
atio
nb
yag
egr
ou
p1 ,n
sW
,199
9–20
00t
o2
003–
2004
Age
grou
p
Ra nk
<1
1–4
5–9
10–1
4 15
–24
25–3
4 35
–44
45–5
4 55
–64
65+
Tota
l
1Fa
ctor
s af
fect
ing
heal
th s
tatu
s
289,
309
Res
pira
tory
dise
ases
79,1
18
Res
pira
tory
dise
ases
39,7
40
Inju
ry, p
oiso
ning
an
d ce
rtai
n ot
her
cons
eque
nces
of
exte
rnal
cau
ses
36,6
59
Preg
nanc
y
155,
576
Preg
nanc
y
398,
268
Fact
ors
affe
ctin
g he
alth
sta
tus
187,
319
Fact
ors
affe
ctin
g he
alth
sta
tus
229,
991
Fact
ors
affe
ctin
g he
alth
sta
tus
327,
087
Fact
ors
affe
ctin
g he
alth
sta
tus
821,
799
Fact
ors
affe
ctin
g he
alth
sta
tus
2,06
6,08
7
2
Perin
atal
con
ditio
ns
129,
082
Infe
ctio
us d
isea
ses
41,1
91
Inju
ry, p
oiso
ning
an
d ce
rtai
n ot
her
cons
eque
nces
of
exte
rnal
cau
ses
31,7
84
Dis
ease
s of
the
dige
stiv
e sy
stem
20,4
90
Dis
ease
s of
the
dige
stiv
e sy
stem
105,
441
Fact
ors
affe
ctin
g he
alth
sta
tus
125,
492
Dis
ease
s of
the
dige
stiv
e sy
stem
142,
753
Dis
ease
s of
the
dige
stiv
e sy
stem
180,
880
Dis
ease
s of
the
dige
stiv
e sy
stem
18
6,32
3
Dis
ease
s of
ci
rcul
ator
y sy
stem
363,
239
Dis
ease
s of
the
dige
stiv
e sy
stem
1,12
5,18
7
3Co
ngen
ital
Abno
rmal
ities
34,2
14
Inju
ry, p
oiso
ning
an
d ce
rtai
n ot
her
cons
eque
nces
of
exte
rnal
cau
ses
29,1
62
Dis
ease
s of
the
dige
stiv
e sy
stem
21,1
16
Res
pira
tory
dise
ases
18,4
14
Inju
ry, p
oiso
ning
an
d ce
rtai
n ot
her
cons
eque
nces
of
exte
rnal
cau
ses
96,4
12
Dis
ease
s of
the
dige
stiv
e sy
stem
115,
463
Preg
nanc
y
129,
734
Gen
itour
inar
y di
seas
e
96,8
05
Canc
er
125,
831
Dis
ease
s of
the
dige
stiv
e sy
stem
326,
239
Preg
nanc
y
685,
587
4R
espi
rato
rydi
seas
es
34,2
41
Dis
ease
s of
the
ear
22,5
28
Dis
ease
s of
the
ear
15,8
67
Men
tal d
isor
ders
12,8
40
Men
tal d
isor
ders
61,6
41
Inju
ry, p
oiso
ning
an
d ce
rtai
n ot
her
cons
eque
nces
of
exte
rnal
cau
ses
85,4
84
Gen
itour
inar
y di
seas
e
101,
985
Canc
er
96,4
89
Dis
ease
s of
ci
rcul
ator
y sy
stem
113,
257
Canc
er
218,
653
Canc
er
657,
684
5Ill
-def
ined
co
nditi
ons
23,2
26
Ill-d
efin
ed
cond
ition
s 22
,200
Infe
ctio
us d
isea
ses
15,8
67
Ill-d
efin
ed
cond
ition
s
10,6
90
Fact
ors
affe
ctin
g he
alth
sta
tus
45,8
63
Gen
itour
inar
y di
seas
e
80,6
29
Inju
ry, p
oiso
ning
an
d ce
rtai
n ot
her
cons
eque
nces
of
exte
rnal
cau
ses
73,2
85
Mus
culo
skel
etal
83,5
98
Mus
culo
skel
etal
87,5
57
Dis
ease
s of
the
eye
230,
143
Dis
ease
s of
ci
rcul
ator
y sy
stem
626,
927
6
Infe
ctio
us d
isea
ses
16,0
42
Dis
ease
s of
the
dige
stiv
e sy
stem
18,6
92
Fact
ors
affe
ctin
g he
alth
sta
tus
11,8
72
Fact
ors
affe
ctin
g he
alth
sta
tus
10,1
99
Gen
itour
inar
y di
seas
e
37,9
78
Men
tal d
isor
ders
73,1
96
Men
tal d
isor
ders
69,0
42
Dis
ease
s of
ci
rcul
ator
y sy
stem
78,6
85
Ill-d
efin
ed
cond
ition
s
78,8
14
Ill-d
efin
ed
cond
ition
s
181,
100
Inju
ry, p
oiso
ning
an
d ce
rtai
n ot
her
cons
eque
nces
of
exte
rnal
cau
ses
606,
954
7D
isea
ses
of th
e di
gest
ive
syst
em
7,80
8
Fact
ors
affe
ctin
g he
alth
sta
tus
16,1
56
Ill-d
efin
ed
cond
ition
s
10,4
08
Skin
dis
ease
s
7,13
8
Res
pira
tory
dise
ases
37,1
26
Mus
culo
skel
etal
48,2
04
Mus
culo
skel
etal
66,9
30
Ill-d
efin
ed
cond
ition
s
77,3
52
Gen
itour
inar
y di
seas
e
75,9
11
Res
pira
tory
dise
ases
168,
040
Gen
itour
inar
y di
seas
e
556,
867
8G
enito
urin
ary
dise
ase
5,19
7
Cong
enita
l Ab
norm
aliti
es
13,9
20
Men
tal d
isor
ders
9,49
9
Mus
culo
skel
etal
7,06
6
Ill-d
efin
ed
cond
ition
s 34
,634
Ill-d
efin
ed
cond
ition
s
47,7
91
Ill-d
efin
ed
cond
ition
s
62,3
11
Men
tal d
isor
ders
63,8
77
Inju
ry, p
oiso
ning
an
d ce
rtai
n ot
her
cons
eque
nces
of
exte
rnal
cau
ses
50,4
77
Mus
culo
skel
etal
153,
310
Ill-d
efin
ed
cond
ition
s
548,
527
9In
jury
, poi
soni
ng
and
cert
ain
othe
r co
nseq
uenc
es o
f ex
tern
al c
ause
s
4,00
2
Gen
itour
inar
y di
seas
e
9,63
4
Cong
enita
l Ab
norm
aliti
es
7,25
2
Infe
ctio
us d
isea
ses
6,84
0M
uscu
losk
elet
al
33,5
70
Res
pira
tory
dise
ases
30,3
12
Canc
er
56,0
18
Inju
ry, p
oiso
ning
an
d ce
rtai
n ot
her
cons
eque
nces
of
exte
rnal
cau
ses
61,5
68
Res
pira
tory
dise
ases
45,5
22
Inju
ry, p
oiso
ning
an
d ce
rtai
n ot
her
cons
eque
nces
of
exte
rnal
cau
ses
138,
121
Res
pira
tory
dise
ases
515,
487
10M
enta
l dis
orde
rs3,
354
Ner
vous
sys
tem
di
seas
es
7,42
0
Ner
vous
sys
tem
di
seas
es
7,14
6
Canc
er
5,83
5
Skin
dis
ease
s
21,4
00
Canc
er
27,2
18
Dis
ease
s of
ci
rcul
ator
y sy
stem
41,9
97
Ner
vous
sys
tem
di
seas
es
35,3
15
Men
tal d
isor
ders
37,5
93
Gen
itour
inar
y di
seas
e
136,
763
Mus
culo
skel
etal
487,
887
1 The
num
ber o
f inj
ury,
poi
soni
ng a
nd c
onse
quen
ces
of e
xter
nal c
ause
s’ h
ospi
talis
atio
ns in
clud
es a
sm
all p
ropo
rtio
n of
hos
pita
lisat
ions
with
a p
rinci
pal d
iagn
osis
of i
njur
y (S
00-
T98)
that
did
not
hav
e an
ext
erna
l cau
se a
ssig
ned.
8
Tab
le 2
. Top
10
lead
ing
caus
es o
f hos
pita
lisat
ion
by a
ge g
roup
1 , N
SW, 1
999–
2000
to
2003
–200
4
Age
grou
p
Ran
k <1
1–
4 5–
9 10
–14
15–2
4 25
–34
35–4
4 45
–54
55–6
4 65
+ To
tal
1Fa
ctor
s af
fect
ing
heal
th s
tatu
s
289,
309
Res
pira
tory
dise
ases
79,1
18
Res
pira
tory
dise
ases
39,7
40
Inju
ry, p
oiso
ning
an
d ce
rtai
n ot
her
cons
eque
nces
of
exte
rnal
cau
ses
36,6
59
Preg
nanc
y
155,
576
Preg
nanc
y
398,
268
Fact
ors
affe
ctin
g he
alth
sta
tus
187,
319
Fact
ors
affe
ctin
g he
alth
sta
tus
229,
991
Fact
ors
affe
ctin
g he
alth
sta
tus
327,
087
Fact
ors
affe
ctin
g he
alth
sta
tus
821,
799
Fact
ors
affe
ctin
g he
alth
sta
tus
2,06
6,08
7
2
Perin
atal
con
ditio
ns
129,
082
Infe
ctio
us d
isea
ses
41,1
91
Inju
ry, p
oiso
ning
an
d ce
rtai
n ot
her
cons
eque
nces
of
exte
rnal
cau
ses
31,7
84
Dis
ease
s of
the
dige
stiv
e sy
stem
20,4
90
Dis
ease
s of
the
dige
stiv
e sy
stem
105,
441
Fact
ors
affe
ctin
g he
alth
sta
tus
125,
492
Dis
ease
s of
the
dige
stiv
e sy
stem
142,
753
Dis
ease
s of
the
dige
stiv
e sy
stem
180,
880
Dis
ease
s of
the
dige
stiv
e sy
stem
18
6,32
3
Dis
ease
s of
ci
rcul
ator
y sy
stem
363,
239
Dis
ease
s of
the
dige
stiv
e sy
stem
1,12
5,18
7
3Co
ngen
ital
Abno
rmal
ities
34,2
14
Inju
ry, p
oiso
ning
an
d ce
rtai
n ot
her
cons
eque
nces
of
exte
rnal
cau
ses
29,1
62
Dis
ease
s of
the
dige
stiv
e sy
stem
21,1
16
Res
pira
tory
dise
ases
18,4
14
Inju
ry, p
oiso
ning
an
d ce
rtai
n ot
her
cons
eque
nces
of
exte
rnal
cau
ses
96,4
12
Dis
ease
s of
the
dige
stiv
e sy
stem
115,
463
Preg
nanc
y
129,
734
Gen
itour
inar
y di
seas
e
96,8
05
Canc
er
125,
831
Dis
ease
s of
the
dige
stiv
e sy
stem
326,
239
Preg
nanc
y
685,
587
4R
espi
rato
rydi
seas
es
34,2
41
Dis
ease
s of
the
ear
22,5
28
Dis
ease
s of
the
ear
15,8
67
Men
tal d
isor
ders
12,8
40
Men
tal d
isor
ders
61,6
41
Inju
ry, p
oiso
ning
an
d ce
rtai
n ot
her
cons
eque
nces
of
exte
rnal
cau
ses
85,4
84
Gen
itour
inar
y di
seas
e
101,
985
Canc
er
96,4
89
Dis
ease
s of
ci
rcul
ator
y sy
stem
113,
257
Canc
er
218,
653
Canc
er
657,
684
5Ill
-def
ined
co
nditi
ons
23,2
26
Ill-d
efin
ed
cond
ition
s 22
,200
Infe
ctio
us d
isea
ses
15,8
67
Ill-d
efin
ed
cond
ition
s
10,6
90
Fact
ors
affe
ctin
g he
alth
sta
tus
45,8
63
Gen
itour
inar
y di
seas
e
80,6
29
Inju
ry, p
oiso
ning
an
d ce
rtai
n ot
her
cons
eque
nces
of
exte
rnal
cau
ses
73,2
85
Mus
culo
skel
etal
83,5
98
Mus
culo
skel
etal
87,5
57
Dis
ease
s of
the
eye
230,
143
Dis
ease
s of
ci
rcul
ator
y sy
stem
626,
927
6
Infe
ctio
us d
isea
ses
16,0
42
Dis
ease
s of
the
dige
stiv
e sy
stem
18,6
92
Fact
ors
affe
ctin
g he
alth
sta
tus
11,8
72
Fact
ors
affe
ctin
g he
alth
sta
tus
10,1
99
Gen
itour
inar
y di
seas
e
37,9
78
Men
tal d
isor
ders
73,1
96
Men
tal d
isor
ders
69,0
42
Dis
ease
s of
ci
rcul
ator
y sy
stem
78,6
85
Ill-d
efin
ed
cond
ition
s
78,8
14
Ill-d
efin
ed
cond
ition
s
181,
100
Inju
ry, p
oiso
ning
an
d ce
rtai
n ot
her
cons
eque
nces
of
exte
rnal
cau
ses
606,
954
7D
isea
ses
of th
e di
gest
ive
syst
em
7,80
8
Fact
ors
affe
ctin
g he
alth
sta
tus
16,1
56
Ill-d
efin
ed
cond
ition
s
10,4
08
Skin
dis
ease
s
7,13
8
Res
pira
tory
dise
ases
37,1
26
Mus
culo
skel
etal
48,2
04
Mus
culo
skel
etal
66,9
30
Ill-d
efin
ed
cond
ition
s
77,3
52
Gen
itour
inar
y di
seas
e
75,9
11
Res
pira
tory
dise
ases
168,
040
Gen
itour
inar
y di
seas
e
556,
867
8G
enito
urin
ary
dise
ase
5,19
7
Cong
enita
l Ab
norm
aliti
es
13,9
20
Men
tal d
isor
ders
9,49
9
Mus
culo
skel
etal
7,06
6
Ill-d
efin
ed
cond
ition
s 34
,634
Ill-d
efin
ed
cond
ition
s
47,7
91
Ill-d
efin
ed
cond
ition
s
62,3
11
Men
tal d
isor
ders
63,8
77
Inju
ry, p
oiso
ning
an
d ce
rtai
n ot
her
cons
eque
nces
of
exte
rnal
cau
ses
50,4
77
Mus
culo
skel
etal
153,
310
Ill-d
efin
ed
cond
ition
s
548,
527
9In
jury
, poi
soni
ng
and
cert
ain
othe
r co
nseq
uenc
es o
f ex
tern
al c
ause
s
4,00
2
Gen
itour
inar
y di
seas
e
9,63
4
Cong
enita
l Ab
norm
aliti
es
7,25
2
Infe
ctio
us d
isea
ses
6,84
0M
uscu
losk
elet
al
33,5
70
Res
pira
tory
dise
ases
30,3
12
Canc
er
56,0
18
Inju
ry, p
oiso
ning
an
d ce
rtai
n ot
her
cons
eque
nces
of
exte
rnal
cau
ses
61,5
68
Res
pira
tory
dise
ases
45,5
22
Inju
ry, p
oiso
ning
an
d ce
rtai
n ot
her
cons
eque
nces
of
exte
rnal
cau
ses
138,
121
Res
pira
tory
dise
ases
515,
487
10M
enta
l dis
orde
rs3,
354
Ner
vous
sys
tem
di
seas
es
7,42
0
Ner
vous
sys
tem
di
seas
es
7,14
6
Canc
er
5,83
5
Skin
dis
ease
s
21,4
00
Canc
er
27,2
18
Dis
ease
s of
ci
rcul
ator
y sy
stem
41,9
97
Ner
vous
sys
tem
di
seas
es
35,3
15
Men
tal d
isor
ders
37,5
93
Gen
itour
inar
y di
seas
e
136,
763
Mus
culo
skel
etal
487,
887
1 The
num
ber o
f inj
ury,
poi
soni
ng a
nd c
onse
quen
ces
of e
xter
nal c
ause
s’ h
ospi
talis
atio
ns in
clud
es a
sm
all p
ropo
rtio
n of
hos
pita
lisat
ions
with
a p
rinci
pal d
iagn
osis
of i
njur
y (S
00-T
98)
that
did
not
hav
e an
ext
erna
l cau
se a
ssig
ned.
10 / NSW INJURY PROFILE: A REvIEW OF INJURY HOSPITALISATIONS DURINg 1989–1990 TO 2003–2004
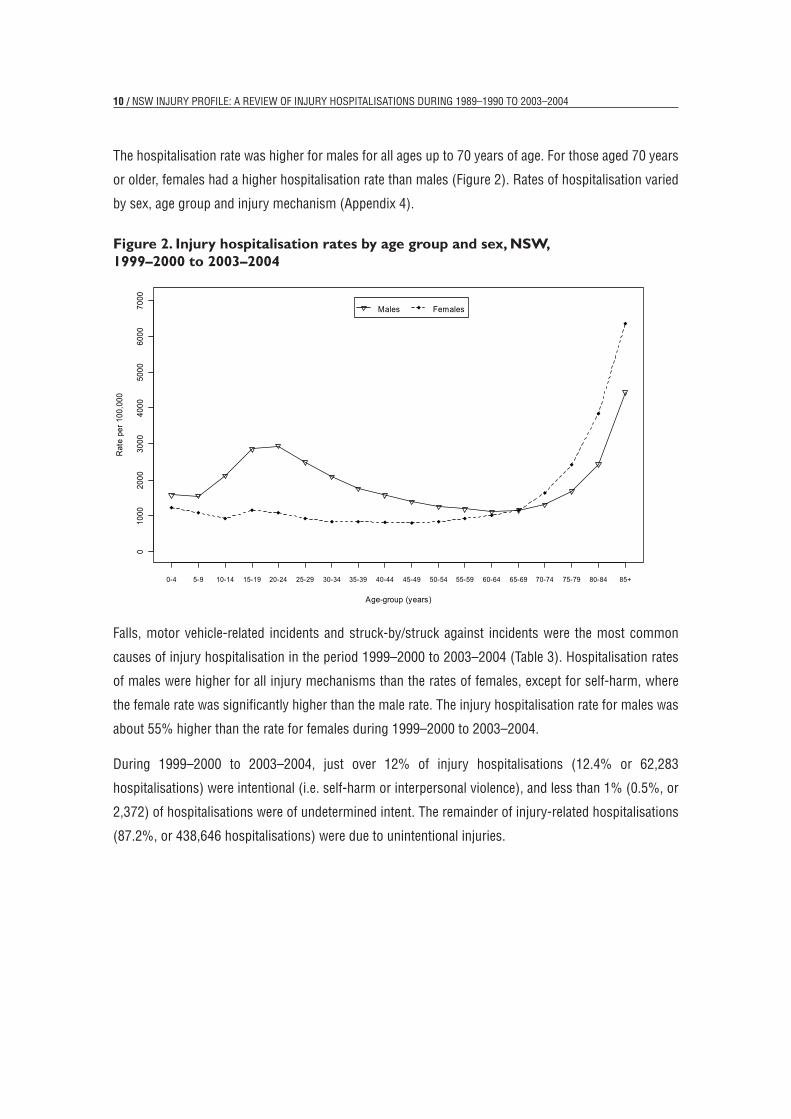
The hospitalisation rate was higher for males for all ages up to 70 years of age. For those aged 70 years
or older, females had a higher hospitalisation rate than males (Figure 2). Rates of hospitalisation varied
by sex, age group and injury mechanism (Appendix 4).
Figure 2. Injury hospitalisation rates by age group and sex, NSW, 1999–2000 to 2003–2004
Falls, motor vehicle-related incidents and struck-by/struck against incidents were the most common
causes of injury hospitalisation in the period 1999–2000 to 2003–2004 (Table 3). Hospitalisation rates
of males were higher for all injury mechanisms than the rates of females, except for self-harm, where
the female rate was significantly higher than the male rate. The injury hospitalisation rate for males was
about 55% higher than the rate for females during 1999–2000 to 2003–2004.
During 1999–2000 to 2003–2004, just over 12% of injury hospitalisations (12.4% or 62,283
hospitalisations) were intentional (i.e. self-harm or interpersonal violence), and less than 1% (0.5%, or
2,372) of hospitalisations were of undetermined intent. The remainder of injury-related hospitalisations
(87.2%, or 438,646 hospitalisations) were due to unintentional injuries.
9
The hospitalisation rate was higher for males for all ages up to 70 years of age. For those aged 70 years or older, females had a higher hospitalisation rate than males (Figure 2). Rates of hospitalisation varied by sex, age group and injury mechanism (Appendix 4).
Figure 2. Injury hospitalisation rates by age group and sex, NSW, 1999–2000 to 2003–2004
010
0020
0030
0040
0050
0060
0070
00
Age-group (years)
Rat
e pe
r 100
,000
0-4 5-9 10-14 15-19 20-24 25-29 30-34 35-39 40-44 45-49 50-54 55-59 60-64 65-69 70-74 75-79 80-84 85+
Males Females
Falls, motor vehicle-related incidents and struck-by/struck against incidents were the most common causes of injury hospitalisation in the period 1999–2000 to 2003–2004 (Table 3). Hospitalisation rates of males were higher for all injury mechanisms than the rates of females, except for self-harm, where the female rate was significantly higher than the male rate. The injury hospitalisation rate for males was about 55% higher than the rate for females during 1999–2000 to 2003–2004.
During 1999–2000 to 2003–2004, just over 12% of injury hospitalisations (12.4% or 62,283 hospitalisations) were intentional (i.e. self-harm or interpersonal violence), and less than 1% (0.5%, or 2,372) of hospitalisations were of undetermined intent. The remainder of injury-related hospitalisations (87.2%, or 438,646 hospitalisations) were due to unintentional injuries.

/ 11
Table 3. Injury hospitalisations by mechanism in NSW, number, rate and CI, 1999–2000 to 2003–2004
1 Age-adjusted rate per 100,000 population.
2 95% confidence interval.
3 The rate for self-harm was calculated per 100,000 population aged 10 years of age or older.
4 The number of NSW residents hospitalised interstate during 2003–2004 was imputed and as a result the sum of the number of hospitalisations due to injury mechanisms may not equal the all injury total.
summAry
Injury, poisoning and certain other consequences of external causes was the sixth leading cause of
hospitalisation involving NSW residents over the period 1999–2000 and 2003–2004, accounting for
6.3% of all hospitalisations.
The yearly hospitalisation rate for injuries was stable over the period 1989–1990 to 2003–2004 and
during 1999–2000 to 2003–2004 the rate of hospitalisation was 1,522.9 per 100,000 population.
In 2003–2004, there were 103,640 hospitalisations of NSW residents following an injury, giving a
hospitalisation rate of 1,534.9 per 100,000 population.
Falls, motor vehicle transport and struck-by/struck against were the injury mechanisms that most
commonly led to a hospitalisation during 1999–2000 to 2003–2004. These were also the most common
mechanisms that led to the hospitalisation of males. For females, the most common mechanisms leading
to hospitalisation were falls, self-harm, and motor vehicle transport.
INJURY HOSPITALISATIONS IN NSW10
Table 3. Injury hospitalisations by mechanism in NSW, number, rate and CI, 1999–2000 to 2003–2004
All Persons Male Female Injury
mechanism N Rate1 95%CI2 N Rate1 95%CI2 N Rate1 95%CI2
Falls 175,077 522.8 (520.4,525.3) 84,743 537.1 (533.4,540.7) 90,333 487.7 (484.5,491.0)
Motor vehicle transport
53,211 162.1 (160.7,163.4) 36,299 221.7 (219.4,224.0) 16,912 101.8 (100.3,103.4)
Struck by/against 35,642 108.8 (107.7,109.9) 27,394 166.4 (164.5,168.4) 8,248 49.8 (48.7,50.9)
Self-harm3 32,582 115.1 (113.9,116.4) 12,941 91.5 (89.9,93.1) 19,640 139.6 (137.6,141.5)
Cut/pierce 31,054 94.6 (93.6,95.7) 23,472 142.7 (140.8,144.5) 7,583 46.3 (45.3,47.4)
Interpersonal violence 29,701 90.8 (89.8,91.8) 23,356 142.1 (140.3,143.9) 6,343 38.8 (37.8,39.8)
Poisoning 16,828 51.2 (50.4,51.9) 8,739 53.3 (52.2,54.5) 8,088 49.0 (47.9,50.0)
Non-motor vehicle road transport 15,177 46.6 (45.8,47.3) 10,216 61.9 (60.7,63.1) 4,961 30.9 (30.0,31.8)
Natural/environmental factors 13,789 41.9 (41.2,42.6) 8,332 50.8 (49.7,51.9) 5,457 32.9 (32.0,33.8)
Foreign bodies 8,628 26.1 (25.6,26.7) 5,214 31.9 (31.0,32.8) 3,414 20.4 (19.8,21.1)
Fire and burns 7,892 24.0 (23.5,24.5) 5,184 31.5 (30.7,32.4) 2,708 16.4 (15.8,17.0)
Machinery 7,656 23.3 (22.7,23.8) 7,055 42.9 (41.9,43.9) 601 3.7 (3.4,4.0)
Near-drowning 914 2.8 (2.6,3.0) 636 3.8 (3.5,4.1) 278 1.7 (1.5,1.9)
Other injuries 75,150 228.3 (226.7,230.0) 50,511 308.5 (305.8,311.2) 24,636 145.3 (143.5,147.1)
All injury4 503,301 1,552.9 (1,518.7,1,527.1) 304,092 1873.8 (1867.1,1,880.5) 199,202 1,145.6 (1,140.5,1,1150.7)
1 Age-adjusted rate per 100,000 population.2 95% confidence interval. 3 The rate for self-harm was calculated per 100,000 population aged 10 years of age or older. 4 The number of NSW residents hospitalised interstate during 2003–2004 was imputed and as a result
the sum of the number of hospitalisations due to injury mechanisms may not equal the all injury total.
SummaryInjury, poisoning and certain other consequences of external causes was the sixth leading cause of hospitalisation involving NSW residents over the period 1999–2000 and 2003–2004, accounting for 6.3% of all hospitalisations.
The yearly hospitalisation rate for injuries was stable over the period 1989–1990 to 2003–2004 and during 1999–2000 to 2003–2004 the rate of hospitalisation was 1,522.9 per 100,000 population.
In 2003–2004, there were 103,640 hospitalisations of NSW residents following an injury, giving a hospitalisation rate of 1,534.9 per 100,000 population.
Falls, motor vehicle transport and struck-by/struck against were the injury mechanisms that most commonly led to a hospitalisation during 1999–2000 to 2003–2004. These were also the most common mechanisms that led to the hospitalisation of males. For females, the most common mechanisms leading to hospitalisation were falls, self-harm, and motor vehicle transport.

12 / NSW INJURY PROFILE: A REvIEW OF INJURY HOSPITALISATIONS DURINg 1989–1990 TO 2003–2004
4. Falls
This section describes injury hospitalisations due to unintentional falls. WHO classifies the cause of
fall-related hospitalisations by the circumstance in which the fall occurs. The types of falls include falls
on the same level (for example, due to tripping, stumbling), from one level to another, from a building or
other structure, on stairs, while being carried, and on a ladder/scaffolding (WHO, 1977; WHO, 1992).
In NSW, falls were the fourth leading cause of injury-related death during 1998-2002, with 1,093 deaths,
giving a mortality rate of 3.4 per 100,000 population (Schmertmann et al, 2004). The lifetime cost of
fatal and non-fatal falls in NSW has been estimated at $644 million—$333 million in direct costs and
$311 million in mortality and morbidity costs (Potter-Forbes & Aisbett, 2003).
Data from 1989–1990 to 2003–2004 were used to describe the profile of hospitalisations due to falls
for NSW residents. Hospitalisation data from 1999–2000 to 2003–2004 were used in the majority of
the analyses, except for the trend analyses, which used hospitalisation data from 1989–1990 to 2003–
2004.
Falls were the leading cause of injury hospitalisation during 1999–2000 to 2003–2004, and accounted
for approximately 34.8% of all hospitalisations due to injury (Table 3). During this period, there were
175,077 hospitalisations due to a fall. The age-adjusted hospitalisation rate for fall-related injuries was
522.8 per 100,000 population.
Figure 3 shows the trend in the hospitalisation rate for falls from 1989–1990 to 2003–2004. The yearly
hospitalisation rate was estimated to have increased significantly by 3.0% per year (95% confidence
interval: 2.2% to 3.9%) for males and to significantly increase by 1.1% (95% confidence interval for the
increase: 0.3% to 2.0%) for females over this period.
Figure 4 shows the age-specific hospitalisation rate for falls between 1999–2000 and 2003–2004. People
aged 65 years or older were at greatest risk of being hospitalised for a fall-related injury. Those aged 5
to 14 years also showed a slight increase in hospitalisation rates compared to individuals aged 15 to
65 years. Males had higher rates than females till 49 years, then females 55 years or older had higher
hospitalisation rates than men.

/ 13
Figure 3. Hospitalisation rate for injury due to falls by sex, NSW, 1989–1990 to 2003–2004
Falls on the same level were the most common type of fall-related hospitalisations, accounting for
nearly half of all fall-related hospitalisations (46.6%). The rate of hospitalisation for males for falls from
a building and from ladders and scaffolding were both more than four times higher than the rate for
females (Table 4). The age-adjusted hospitalisation rate for males was 10.1% higher than the rate for
females between 1999–2000 and 2003–2004.
Figure 4. Age-specific hospitalisation rate for falls by sex, NSW, 1999–2000 to 2003–2004
FALLS11
Figure 3. Hospitalisation rate for injury due to falls by sex, NSW, 1989–1990 to 2003–2004 0
100
200
300
400
500
600
Year
Rat
e pe
r 100
,000
89-90 90-91 91-92 92-93 93-94 94-95 95-96 96-97 97-98 98-99 99-00 00-01 01-02 02-03 03-04
Males Females
Figure 4. Age-specific hospitalisation rate for falls by sex, NSW, 1999–2000 to 2003–2004
010
0020
0030
0040
0050
0060
00
Age-group (years)
Rat
e pe
r 100
,000
0-4 5-9 10-14 15-19 20-24 25-29 30-34 35-39 40-44 45-49 50-54 55-59 60-64 65-69 70-74 75-79 80-84 85+
Males Females
Falls on the same level were the most common type of fall-related hospitalisations, accounting for nearly half of all fall-related hospitalisations (46.6%). The rate of hospitalisation for males for falls from a building and from ladders and scaffolding
11
Figure 3. Hospitalisation rate for injury due to falls by sex, NSW, 1989–1990 to 2003–2004
010
020
030
040
050
060
0
Year
Rat
e pe
r 100
,000
89-90 90-91 91-92 92-93 93-94 94-95 95-96 96-97 97-98 98-99 99-00 00-01 01-02 02-03 03-04
Males Females
Figure 4. Age-specific hospitalisation rate for falls by sex, NSW, 1999–2000 to 2003–2004
010
0020
0030
0040
0050
0060
00
Age-group (years)
Rat
e pe
r 100
,000
0-4 5-9 10-14 15-19 20-24 25-29 30-34 35-39 40-44 45-49 50-54 55-59 60-64 65-69 70-74 75-79 80-84 85+
Males Females
Falls on the same level were the most common type of fall-related hospitalisations, accounting for nearly half of all fall-related hospitalisations (46.6%). The rate of hospitalisation for males for falls from a building and from ladders and scaffolding
14 / NSW INJURY PROFILE: A REvIEW OF INJURY HOSPITALISATIONS DURINg 1989–1990 TO 2003–2004
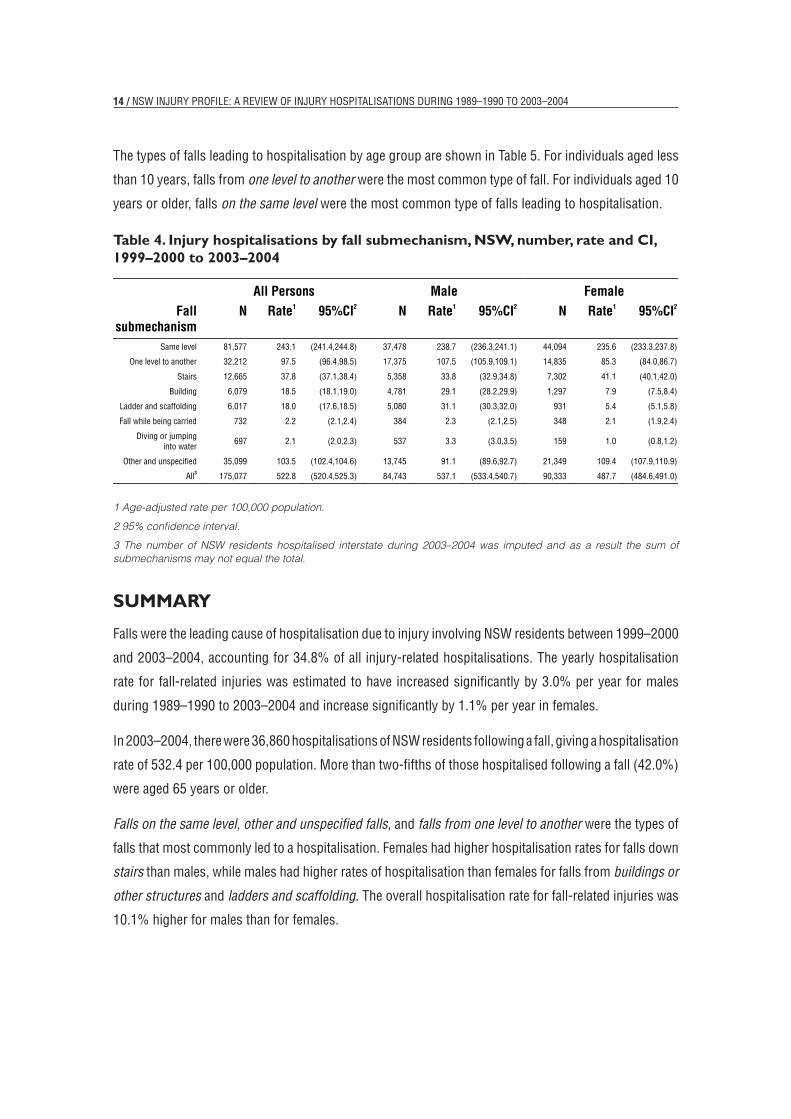
The types of falls leading to hospitalisation by age group are shown in Table 5. For individuals aged less
than 10 years, falls from one level to another were the most common type of fall. For individuals aged 10
years or older, falls on the same level were the most common type of falls leading to hospitalisation.
Table 4. Injury hospitalisations by fall submechanism, NSW, number, rate and CI, 1999–2000 to 2003–2004
1 Age-adjusted rate per 100,000 population.
2 95% confidence interval.
3 The number of NSW residents hospitalised interstate during 2003–2004 was imputed and as a result the sum of submechanisms may not equal the total.
summAry
Falls were the leading cause of hospitalisation due to injury involving NSW residents between 1999–2000
and 2003–2004, accounting for 34.8% of all injury-related hospitalisations. The yearly hospitalisation
rate for fall-related injuries was estimated to have increased significantly by 3.0% per year for males
during 1989–1990 to 2003–2004 and increase significantly by 1.1% per year in females.
In 2003–2004, there were 36,860 hospitalisations of NSW residents following a fall, giving a hospitalisation
rate of 532.4 per 100,000 population. More than two-fifths of those hospitalised following a fall (42.0%)
were aged 65 years or older.
Falls on the same level, other and unspecified falls, and falls from one level to another were the types of
falls that most commonly led to a hospitalisation. Females had higher hospitalisation rates for falls down
stairs than males, while males had higher rates of hospitalisation than females for falls from buildings or
other structures and ladders and scaffolding. The overall hospitalisation rate for fall-related injuries was
10.1% higher for males than for females.
13
were both more than four times higher than the rate for females (Table 4). The age-adjusted hospitalisation rate for males was 10.1% higher than the rate for females between 1999–2000 and 2003–2004.
The types of falls leading to hospitalisation by age group are shown in Table 5. For individuals aged less than 10 years, falls from one level to another were the most common type of fall. For individuals aged 10 years or older, falls on the same levelwere the most common type of falls leading to hospitalisation.
Table 4. Injury hospitalisations by fall submechanism, NSW, number, rate and CI, 1999–2000 to 2003–2004
All Persons Male Female Fall
submechanism N Rate1 95%CI2 N Rate1 95%CI2 N Rate1 95%CI2
Same level 81,577 243.1 (241.4,244.8) 37,478 238.7 (236.3,241.1) 44,094 235.6 (233.3,237.8)
One level to another 32,212 97.5 (96.4,98.5) 17,375 107.5 (105.9,109.1) 14,835 85.3 (84.0,86.7)
Stairs 12,665 37.8 (37.1,38.4) 5,358 33.8 (32.9,34.8) 7,302 41.1 (40.1,42.0)
Building 6,079 18.5 (18.1,19.0) 4,781 29.1 (28.2,29.9) 1,297 7.9 (7.5,8.4)
Ladder and scaffolding 6,017 18.0 (17.6,18.5) 5,080 31.1 (30.3,32.0) 931 5.4 (5.1,5.8)
Fall while being carried 732 2.2 (2.1,2.4) 384 2.3 (2.1,2.5) 348 2.1 (1.9,2.4)
Diving or jumping into water
697 2.1 (2.0,2.3) 537 3.3 (3.0,3.5) 159 1.0 (0.8,1.2)
Other and unspecified 35,099 103.5 (102.4,104.6) 13,745 91.1 (89.6,92.7) 21,349 109.4 (107.9,110.9)
All3 175,077 522.8 (520.4,525.3) 84,743 537.1 (533.4,540.7) 90,333 487.7 (484.6,491.0)
1 Rate per 100,000 population. 2 95% confidence interval. 3 The number of NSW residents hospitalised interstate during 2003–2004 was imputed and as a result
the sum of submechanisms may not equal the total.
SummaryFalls were the leading cause of hospitalisation due to injury involving NSW residents between 1999–2000 and 2003–2004, accounting for 34.8% of all injury-related hospitalisations. The yearly hospitalisation rate for fall-related injuries was estimated to have increased significantly by 3.0% per year for males during 1989–1990 to 2003–2004 and increase significantly by 1.1% per year in females.
In 2003–2004, there were 36,860 hospitalisations of NSW residents following a fall, giving a hospitalisation rate of 532.4 per 100,000 population. More than two-fifths of those hospitalised following a fall (42.0%) were aged 65 years or older.
Falls on the same level, other and unspecified falls, and falls from one level to anotherwere the types of falls that most commonly led to a hospitalisation. Females had higher hospitalisation rates for falls down stairs than males, while males had higher rates of hospitalisation than females for falls from buildings or other structures and ladders and scaffolding. The overall hospitalisation rate for fall-related injuries was 10.1% higher for males than for females.

/ 15FALLS14
Tab
le 5
. Num
ber
of h
ospi
talis
atio
ns fo
r fa
lls1
by a
ge g
roup
and
cau
se, N
SW, 1
999–
2000
to
2003
–200
4
Age
grou
p
Ran
k 0-
4 5–
9 10
–14
15–2
4 25
–34
35–4
4 45
–54
55–6
4 65
+ To
tal
1O
ne le
vel t
o an
othe
r 6,
293
One
leve
l to
anot
her
8,22
9
Sam
e le
vel
8,21
6 Sa
me
leve
l 8,
329
Sam
e le
vel
5,44
0 Sa
me
leve
l 4,
541
Sam
e le
vel
5,35
2 Sa
me
leve
l 6,
580
Sam
e le
vel
36,1
32
Sam
e le
vel
81,5
73
2Sa
me
leve
l 2,
371
Sam
e le
vel
4,37
1 O
ne le
vel t
o an
othe
r 3,
017
One
leve
l to
anot
her
1,53
5
One
leve
l to
anot
her
1,40
9
One
leve
l to
anot
her
1,54
3
One
leve
l to
anot
her
1,61
4
Stai
rs1,
538
One
leve
l to
anot
her
7,07
2
One
leve
l to
anot
her
32,2
10
3St
airs
752
Build
ing
750
Build
ing
464
Build
ing
945
Stai
rs1,
079
Stai
rs1,
272
Stai
rs1,
598
One
leve
l to
anot
her
1,43
6
Stai
rs4,
793
Stai
rs12
,660
4Bu
ildin
g 64
2 St
airs
350
Stai
rs35
1 St
airs
833
Build
ing
964
Ladd
er a
nd
scaf
fold
ing
1,01
5
Ladd
er a
nd
scaf
fold
ing
1,28
9
Ladd
er a
nd
scaf
fold
ing
1,27
0
Ladd
er a
nd
scaf
fold
ing
1,42
3
Build
ing
6,07
9
5Fa
ll w
hile
be
ing
carr
ied
516
Fall
whi
le
bein
g ca
rrie
d 79
Div
ing
110
Ladd
er a
nd
scaf
fold
ing
271
Ladd
er a
nd
scaf
fold
ing
565
Build
ing
802
Build
ing
646
Build
ing
434
Build
ing
408
Ladd
er a
nd
scaf
fold
ing
6,01
1 6
Ladd
er a
nd
scaf
fold
ing
56
Ladd
er a
nd
scaf
fold
ing
75
Fall
whi
le
bein
g ca
rrie
d 41
Div
ing
216
Div
ing
120
Div
ing
71D
ivin
g45
Div
ing
22Fa
ll w
hile
be
ing
carr
ied
26
Fall
whi
le
bein
g ca
rrie
d 73
2 7
Div
ing
16D
ivin
g66
Ladd
er a
nd
scaf
fold
ing
32
Fall
whi
le
bein
g ca
rrie
d 36
Fall
whi
le
bein
g ca
rrie
d 19
Fall
whi
le
bein
g ca
rrie
d #
Fall
whi
le
bein
g ca
rrie
d #
–D
ivin
g21
Div
ing
695
Oth
er a
nd
unsp
ecifi
ed
1,23
1
Oth
er a
nd
unsp
ecifi
ed
1,53
5
Oth
er a
nd
unsp
ecifi
ed
1,39
2
Oth
er a
nd
unsp
ecifi
ed
1,52
5
Oth
er a
nd
unsp
ecifi
ed
1,55
8
Oth
er a
nd
unsp
ecifi
ed
1,85
9
Oth
er a
nd
unsp
ecifi
ed
2,33
6
Oth
er a
nd
unsp
ecifi
ed
2,69
0
Oth
er a
nd
unsp
ecifi
ed
20,8
68
Oth
er a
nd
unsp
ecifi
ed
35,0
94
1#
Cell
size
s re
pres
ent f
ewer
than
five
hos
pita
lisat
ions
or d
ata
have
bee
n re
mov
ed to
pre
vent
iden
tific
atio
n of
cel
l size
s le
ss th
an fi
ve.
14
Tab
le 5
. Num
ber
of h
ospi
talis
atio
ns fo
r fa
lls1
by a
ge g
roup
and
cau
se, N
SW, 1
999–
2000
to
2003
–200
4
Age
grou
p
Ran
k 0-
4 5–
9 10
–14
15–2
4 25
–34
35–4
4 45
–54
55–6
4 65
+ To
tal
1O
ne le
vel t
o an
othe
r 6,
293
One
leve
l to
anot
her
8,22
9
Sam
e le
vel
8,21
6 Sa
me
leve
l 8,
329
Sam
e le
vel
5,44
0 Sa
me
leve
l 4,
541
Sam
e le
vel
5,35
2 Sa
me
leve
l 6,
580
Sam
e le
vel
36,1
32
Sam
e le
vel
81,5
73
2Sa
me
leve
l 2,
371
Sam
e le
vel
4,37
1 O
ne le
vel t
o an
othe
r 3,
017
One
leve
l to
anot
her
1,53
5
One
leve
l to
anot
her
1,40
9
One
leve
l to
anot
her
1,54
3
One
leve
l to
anot
her
1,61
4
Stai
rs1,
538
One
leve
l to
anot
her
7,07
2
One
leve
l to
anot
her
32,2
10
3St
airs
752
Build
ing
750
Build
ing
464
Build
ing
945
Stai
rs1,
079
Stai
rs1,
272
Stai
rs1,
598
One
leve
l to
anot
her
1,43
6
Stai
rs4,
793
Stai
rs12
,660
4Bu
ildin
g 64
2 St
airs
350
Stai
rs35
1 St
airs
833
Build
ing
964
Ladd
er a
nd
scaf
fold
ing
1,01
5
Ladd
er a
nd
scaf
fold
ing
1,28
9
Ladd
er a
nd
scaf
fold
ing
1,27
0
Ladd
er a
nd
scaf
fold
ing
1,42
3
Build
ing
6,07
9
5Fa
ll w
hile
be
ing
carr
ied
516
Fall
whi
le
bein
g ca
rrie
d 79
Div
ing
110
Ladd
er a
nd
scaf
fold
ing
271
Ladd
er a
nd
scaf
fold
ing
565
Build
ing
802
Build
ing
646
Build
ing
434
Build
ing
408
Ladd
er a
nd
scaf
fold
ing
6,01
1 6
Ladd
er a
nd
scaf
fold
ing
56
Ladd
er a
nd
scaf
fold
ing
75
Fall
whi
le
bein
g ca
rrie
d 41
Div
ing
216
Div
ing
120
Div
ing
71D
ivin
g45
Div
ing
22Fa
ll w
hile
be
ing
carr
ied
26
Fall
whi
le
bein
g ca
rrie
d 73
2 7
Div
ing
16D
ivin
g66
Ladd
er a
nd
scaf
fold
ing
32
Fall
whi
le
bein
g ca
rrie
d 36
Fall
whi
le
bein
g ca
rrie
d 19
Fall
whi
le
bein
g ca
rrie
d #
Fall
whi
le
bein
g ca
rrie
d #
–D
ivin
g21
Div
ing
695
Oth
er a
nd
unsp
ecifi
ed
1,23
1
Oth
er a
nd
unsp
ecifi
ed
1,53
5
Oth
er a
nd
unsp
ecifi
ed
1,39
2
Oth
er a
nd
unsp
ecifi
ed
1,52
5
Oth
er a
nd
unsp
ecifi
ed
1,55
8
Oth
er a
nd
unsp
ecifi
ed
1,85
9
Oth
er a
nd
unsp
ecifi
ed
2,33
6
Oth
er a
nd
unsp
ecifi
ed
2,69
0
Oth
er a
nd
unsp
ecifi
ed
20,8
68
Oth
er a
nd
unsp
ecifi
ed
35,0
94
1#
Cell
size
s re
pres
ent f
ewer
than
five
hos
pita
lisat
ions
or d
ata
have
bee
n re
mov
ed to
pre
vent
iden
tific
atio
n of
cel
l size
s le
ss th
an fi
ve.

16 / NSW INJURY PROFILE: A REvIEW OF INJURY HOSPITALISATIONS DURINg 1989–1990 TO 2003–2004
5. Motor vehicle transport
This section describes hospitalisations due to unintentional motor vehicle transport-related injuries.
WHO classifies the cause of motor vehicle transport-related hospitalisations according to a number
of criteria (WHO, 1977; WHO, 1992). Injury hospitalisations due to motor vehicle transport occur in
either traffic situations (i.e., occurring on a public highway or street, which includes both the roadway
and other land between property lines (NCCH (2000)) or non-traffic situations (i.e., occurring anywhere
other than a public highway or street). Motor vehicle transport-related hospitalisations are also classified
according to the type of road user involved (e.g. pedestrian, motorcyclists). Motor vehicle transport
road-user classes include motor vehicle occupants (drivers and passengers), motorcyclists (riders and
passengers), pedal cyclists, and pedestrians. The person who is injured is usually referred to by both
the type of traffic situation (i.e., traffic or non-traffic) of the incident and their road-user class (e.g.
pedestrian).
In NSW, motor vehicle transport-related incidents were the second leading cause of death in NSW during
1998-2002, with 2,765 deaths, giving a mortality rate of 8.5 per 100,000 population (Schmertmann et
al, 2004). The lifetime cost of fatal and non-fatal motor vehicle transport-related incidents in NSW has
been estimated at $554 million - $61.6 million in direct costs and $493 million in mortality and morbidity
costs (Potter-Forbes & Aisbett, 2003).
Motor vehicle transport-related injury hospitalisation data from 1989–1990 to 2003–2004 were used to
describe the profile of motor vehicle-related hospitalisations of NSW residents. Data from 1999–20000
to 2003–2004 were used in the majority of analyses, except for the trend analysis, which used data from
1989–1990 to 2003–2004.
Motor vehicle transport was the second leading cause of injury hospitalisation for the period 1999–
2000 to 2003–2004 and accounted for 10.6% of all injury hospitalisations (Table 3). During this period,
there were 53,211 injury-related hospitalisations following a motor vehicle transport incident, at an
age-adjusted hospitalisation rate of 162.1 per 100,000 population (Table 6). There were approximately
10,642 hospitalisations per year due to motor vehicle transport during 1999–2000 to 2003–2004.
The age-adjusted hospitalisation rate for motor vehicle transport-related injury declined in both males
and females during the period 1989–1990 to 2003–2004 (Figure 5). For males, the age-adjusted
hospitalisation rate decreased significantly by 1.0% per year (95% confidence interval for the decrease:
0.4% to 1.5%). For females, the rate of hospitalisation decreased significantly by 1.9% per year during
this period (95% confidence interval for the decrease: 1.4% to 2.5%).
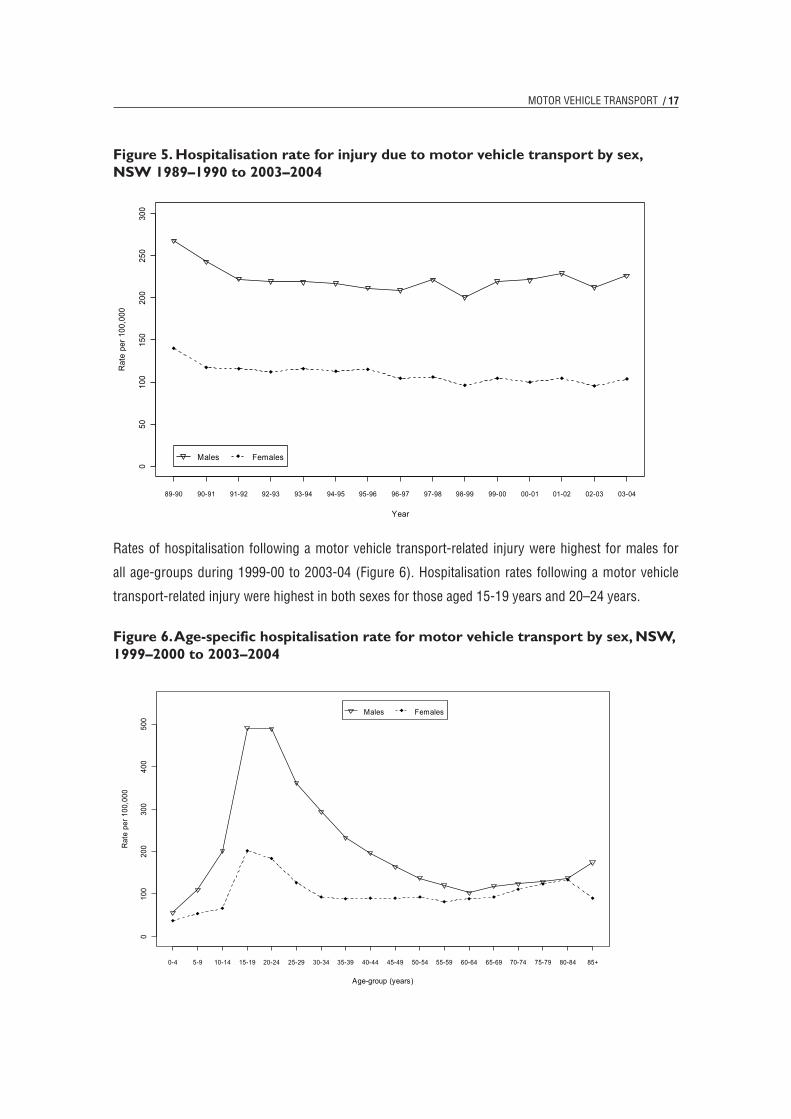
/ 17
Figure 5. Hospitalisation rate for injury due to motor vehicle transport by sex, NSW 1989–1990 to 2003–2004
Rates of hospitalisation following a motor vehicle transport-related injury were highest for males for
all age-groups during 1999-00 to 2003-04 (Figure 6). Hospitalisation rates following a motor vehicle
transport-related injury were highest in both sexes for those aged 15-19 years and 20–24 years.
Figure 6. Age-specific hospitalisation rate for motor vehicle transport by sex, NSW, 1999–2000 to 2003–2004
MOTOR vEHICLE TRANSPORT
20
Figure 7. Hospitalisation rate for injury due to motor vehicle transport by sex, NSW 1989–1990 to 2003–2004
050
100
150
200
250
300
Year
Rat
e pe
r 100
,000
89-90 90-91 91-92 92-93 93-94 94-95 95-96 96-97 97-98 98-99 99-00 00-01 01-02 02-03 03-04
Males Females
Rates of hospitalisation following a motor vehicle transport-related injury were highest for males for all age-groups during 1999-00 to 2003-04 (Error! Reference source not found.). Hospitalisation rates following a motor vehicle transport-related injury were highest in both sexes for those aged 15-19 years and 20–24 years.
Figure 8. Age-specific hospitalisation rate for motor vehicle transport by sex, NSW, 1999–2000 to 2003–2004
010
020
030
040
050
0
Age-group (years)
Rat
e pe
r 100
,000
0-4 5-9 10-14 15-19 20-24 25-29 30-34 35-39 40-44 45-49 50-54 55-59 60-64 65-69 70-74 75-79 80-84 85+
Males Females
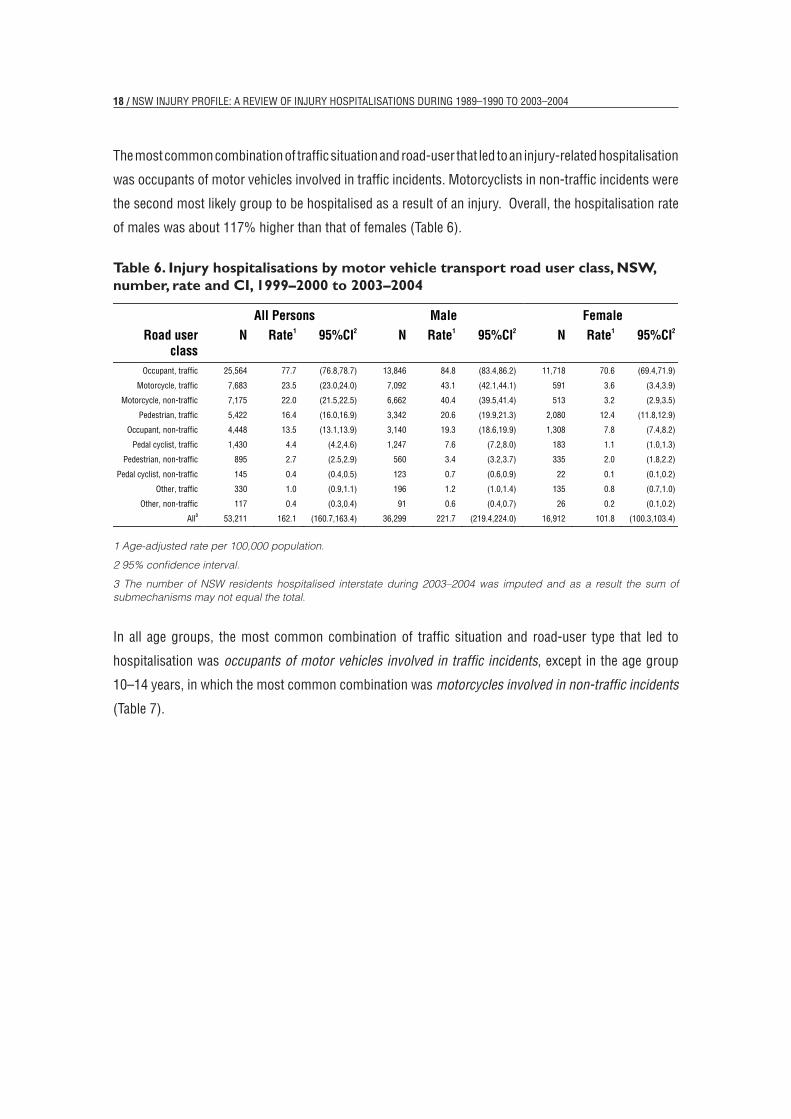
18 / NSW INJURY PROFILE: A REvIEW OF INJURY HOSPITALISATIONS DURINg 1989–1990 TO 2003–2004
The most common combination of traffic situation and road-user that led to an injury-related hospitalisation
was occupants of motor vehicles involved in traffic incidents. Motorcyclists in non-traffic incidents were
the second most likely group to be hospitalised as a result of an injury. Overall, the hospitalisation rate
of males was about 117% higher than that of females (Table 6).
Table 6. Injury hospitalisations by motor vehicle transport road user class, NSW, number, rate and CI, 1999–2000 to 2003–2004
1 Age-adjusted rate per 100,000 population.
2 95% confidence interval.
3 The number of NSW residents hospitalised interstate during 2003–2004 was imputed and as a result the sum of submechanisms may not equal the total.
In all age groups, the most common combination of traffic situation and road-user type that led to
hospitalisation was occupants of motor vehicles involved in traffic incidents, except in the age group
10–14 years, in which the most common combination was motorcycles involved in non-traffic incidents
(Table 7).
17
The most common combination of traffic situation and road-user that led to an injury-related hospitalisation was occupants of motor vehicles involved in traffic incidents.Motorcyclists in non-traffic incidents were the second most likely group to be hospitalised as a result of an injury. Overall, the hospitalisation rate of males was about 117% higher than that of females (Table 6).
Table 6. Injury hospitalisations by motor vehicle transport road user class, NSW, number, rate and CI, 1999–2000 to 2003–2004
All Persons Male Female Road user
classN Rate1 95%CI2 N Rate1 95%CI2 N Rate1 95%CI2
Occupant, traffic 25,564 77.7 (76.8,78.7) 13,846 84.8 (83.4,86.2) 11,718 70.6 (69.4,71.9)
Motorcycle, traffic 7,683 23.5 (23.0,24.0) 7,092 43.1 (42.1,44.1) 591 3.6 (3.4,3.9)
Motorcycle, non-traffic 7,175 22.0 (21.5,22.5) 6,662 40.4 (39.5,41.4) 513 3.2 (2.9,3.5)
Pedestrian, traffic 5,422 16.4 (16.0,16.9) 3,342 20.6 (19.9,21.3) 2,080 12.4 (11.8,12.9)
Occupant, non-traffic 4,448 13.5 (13.1,13.9) 3,140 19.3 (18.6,19.9) 1,308 7.8 (7.4,8.2)
Pedal cyclist, traffic 1,430 4.4 (4.2,4.6) 1,247 7.6 (7.2,8.0) 183 1.1 (1.0,1.3)
Pedestrian, non-traffic 895 2.7 (2.5,2.9) 560 3.4 (3.2,3.7) 335 2.0 (1.8,2.2)
Pedal cyclist, non-traffic 145 0.4 (0.4,0.5) 123 0.7 (0.6,0.9) 22 0.1 (0.1,0.2)
Other, traffic 330 1.0 (0.9,1.1) 196 1.2 (1.0,1.4) 135 0.8 (0.7,1.0)
Other, non-traffic 117 0.4 (0.3,0.4) 91 0.6 (0.4,0.7) 26 0.2 (0.1,0.2)
All3 53,211 162.1 (160.7,163.4) 36,299 221.7 (219.4,224.0) 16,912 101.8 (100.3,103.4)
1 Age-adjusted rate per 100,000 population. 2 95% confidence interval. 3 The number of NSW residents hospitalised interstate during 2003–2004 was imputed and as a result
the sum of submechanisms may not equal the total.
In all age groups, the most common combination of traffic situation and road-user type that led to hospitalisation was occupants of motor vehicles involved in traffic incidents, except in the age group 10–14 years, in which the most common combination was motorcycles involved in non-traffic incidents (Table 7).
SummaryMotor vehicle transport-related injuries were the second leading cause of injury-related hospitalisation involving NSW residents during 1999–2000 and 2003–2004, accounting for 10.6% of all injury-related hospitalisations. The yearly hospitalisation rate for motor vehicle transport-related injuries was estimated to have decreased by 1.9% per year for females, and by 1.0% per year for males, during 1989–1990 to 2003–2004.
In 2003–2004, there were 11,066 hospitalisations of NSW residents following a motor vehicle transport-related injury, giving a hospitalisation rate of 165.5 per 100,000 population. Around one-quarter (28.1%) of those hospitalised following a motor vehicle transport-related injury were aged 15–24 years.
Occupants in traffic incidents, motorcycles in traffic incidents, motorcycles in non-traffic incidents and pedestrians in traffic incidents were the most common types of motor vehicle transport-related injuries that led to a hospitalisation. Males were more likely to be hospitalised following all types of motor vehicle transport-related injury than females, except in other and unspecified motor vehicle transport-related
/ 19MOTOR vEHICLE TRANSPORT
summAry
Motor vehicle transport-related injuries were the second leading cause of injury-related hospitalisation
involving NSW residents during 1999–2000 and 2003–2004, accounting for 10.6% of all injury-related
hospitalisations. The yearly hospitalisation rate for motor vehicle transport-related injuries was estimated
to have decreased by 1.9% per year for females, and by 1.0% per year for males, during 1989–1990 to
2003–2004.
In 2003–2004, there were 11,066 hospitalisations of NSW residents following a motor vehicle transport-
related injury, giving a hospitalisation rate of 165.5 per 100,000 population. Around one-quarter (28.1%)
of those hospitalised following a motor vehicle transport-related injury were aged 15–24 years.
Occupants in traffic incidents, motorcycles in traffic incidents, motorcycles in non-traffic incidents and
pedestrians in traffic incidents were the most common types of motor vehicle transport-related injuries
that led to a hospitalisation. Males were more likely to be hospitalised following all types of motor vehicle
transport-related injury than females, except in other and unspecified motor vehicle transport-related
incidents. The overall hospitalisation rate for motor-vehicle transport-related injury was about 117%
higher for males than for females.
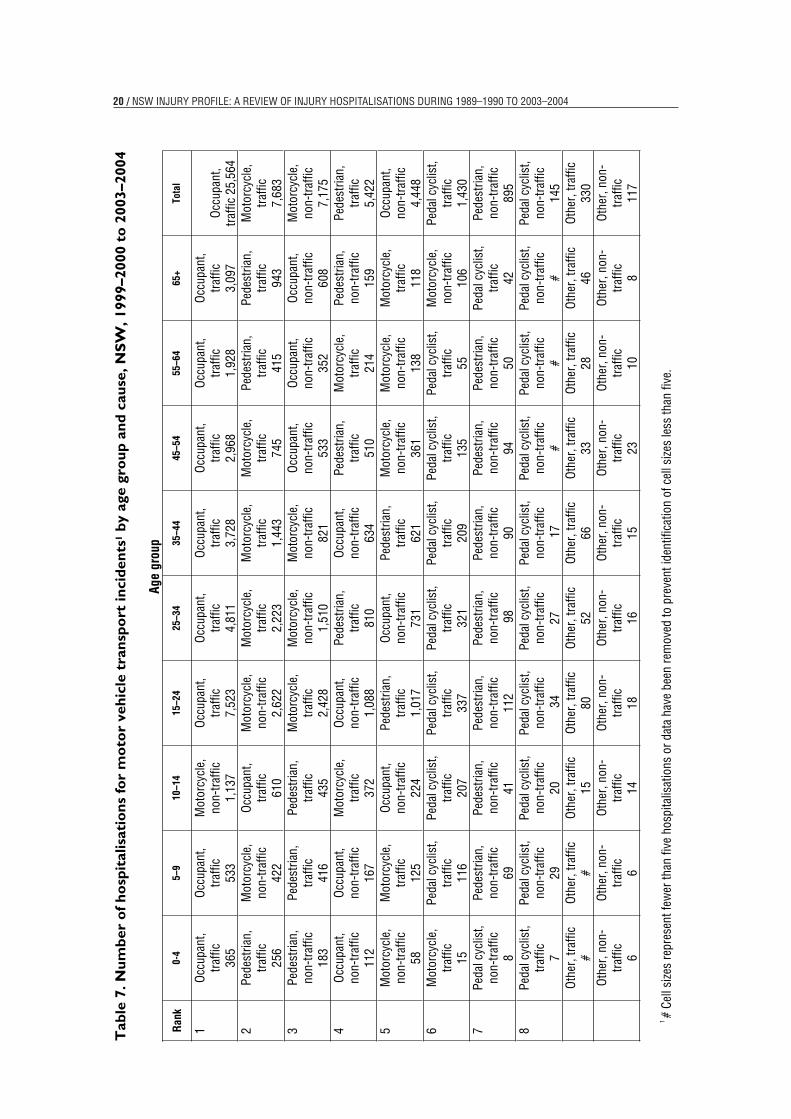
20 / NSW INJURY PROFILE: A REvIEW OF INJURY HOSPITALISATIONS DURINg 1989–1990 TO 2003–200423
Tab
le7.
Num
ber
of h
ospi
talis
atio
ns fo
r m
otor
veh
icle
tra
nspo
rt in
cide
nts1
by
age
grou
p an
d ca
use,
NSW
, 199
9–20
00 t
o 20
03–2
004
Age
grou
p
Ran
k0-
4 5–
9 10
–14
15–2
4 25
–34
35–4
4 45
–54
55–6
4 65
+ To
tal
1 O
ccup
ant,
traf
fic36
5
Occ
upan
t, tr
affic
533
Mot
orcy
cle,
non-
traf
fic
1,13
7
Occ
upan
t, tr
affic
7,52
3
Occ
upan
t, tr
affic
4,81
1
Occ
upan
t, tr
affic
3,72
8
Occ
upan
t, tr
affic
2,96
8
Occ
upan
t, tr
affic
1,92
8
Occ
upan
t, tr
affic
3,09
7 O
ccup
ant,
traf
fic 2
5,56
4 2
Pede
stria
n,
traf
fic25
6
Mot
orcy
cle,
non-
traf
fic
422
Occ
upan
t, tr
affic
610
Mot
orcy
cle,
non-
traf
fic
2,62
2
Mot
orcy
cle,
traf
fic2,
223
Mot
orcy
cle,
traf
fic1,
443
Mot
orcy
cle,
traf
fic74
5
Pede
stria
n,
traf
fic41
5
Pede
stria
n,
traf
fic94
3
Mot
orcy
cle,
traf
fic7,
683
3 Pe
dest
rian,
no
n-tr
affic
18
3
Pede
stria
n,
traf
fic41
6
Pede
stria
n,
traf
fic43
5
Mot
orcy
cle,
traf
fic2,
428
Mot
orcy
cle,
non-
traf
fic
1,51
0
Mot
orcy
cle,
non-
traf
fic
821
Occ
upan
t, no
n-tr
affic
53
3
Occ
upan
t, no
n-tr
affic
35
2
Occ
upan
t, no
n-tr
affic
608
Mot
orcy
cle,
non-
traf
fic
7,17
5 4
Occ
upan
t, no
n-tr
affic
11
2
Occ
upan
t, no
n-tr
affic
16
7
Mot
orcy
cle,
traf
fic37
2
Occ
upan
t, no
n-tr
affic
1,
088
Pede
stria
n,
traf
fic81
0
Occ
upan
t, no
n-tr
affic
63
4
Pede
stria
n,
traf
fic51
0
Mot
orcy
cle,
traf
fic21
4
Pede
stria
n,
non-
traf
fic15
9
Pede
stria
n,
traf
fic5,
422
5 M
otor
cycl
e,
non-
traf
fic
58
Mot
orcy
cle,
traf
fic12
5
Occ
upan
t, no
n-tr
affic
22
4
Pede
stria
n,
traf
fic1,
017
Occ
upan
t, no
n-tr
affic
73
1
Pede
stria
n,
traf
fic62
1
Mot
orcy
cle,
non-
traf
fic
361
Mot
orcy
cle,
non-
traf
fic
138
Mot
orcy
cle,
traf
fic11
8
Occ
upan
t, no
n-tr
affic
4,
448
6 M
otor
cycl
e,
traf
fic15
Peda
l cyc
list,
traf
fic11
6
Peda
l cyc
list,
traf
fic20
7
Peda
l cyc
list,
traf
fic33
7
Peda
l cyc
list,
traf
fic32
1
Peda
l cyc
list,
traf
fic20
9
Peda
l cyc
list,
traf
fic13
5
Peda
l cyc
list,
traf
fic55
Mot
orcy
cle,
non-
traf
fic10
6
Peda
l cyc
list,
traf
fic1,
430
7 Pe
dal c
yclis
t, no
n-tr
affic
8
Pede
stria
n,
non-
traf
fic
69
Pede
stria
n,
non-
traf
fic
41
Pede
stria
n,
non-
traf
fic
112
Pede
stria
n,
non-
traf
fic
98
Pede
stria
n,
non-
traf
fic
90
Pede
stria
n,
non-
traf
fic
94
Pede
stria
n,
non-
traf
fic
50
Peda
l cyc
list,
traf
fic42
Pede
stria
n,
non-
traf
fic
895
8 Pe
dal c
yclis
t, tr
affic 7
Peda
l cyc
list,
non-
traf
fic
29
Peda
l cyc
list,
non-
traf
fic
20
Peda
l cyc
list,
non-
traf
fic
34
Peda
l cyc
list,
non-
traf
fic
27
Peda
l cyc
list,
non-
traf
fic
17
Peda
l cyc
list,
non-
traf
fic
#
Peda
l cyc
list,
non-
traf
fic
#
Peda
l cyc
list,
non-
traf
fic#
Peda
l cyc
list,
non-
traf
fic
145
O
ther
, tra
ffic
#O
ther
, tra
ffic
#O
ther
, tra
ffic
15O
ther
, tra
ffic
80O
ther
, tra
ffic
52O
ther
, tra
ffic
66O
ther
, tra
ffic
33O
ther
, tra
ffic
28O
ther
, tra
ffic
46O
ther
, tra
ffic
330
O
ther
, non
-tr
affic 6
Oth
er, n
on-
traf
fic 6
Oth
er, n
on-
traf
fic14
Oth
er, n
on-
traf
fic18
Oth
er, n
on-
traf
fic16
Oth
er, n
on-
traf
fic15
Oth
er, n
on-
traf
fic23
Oth
er, n
on-
traf
fic10
Oth
er, n
on-
traf
fic 8
Oth
er, n
on-
traf
fic11
7
1#
Cell
size
s re
pres
ent f
ewer
than
five
hos
pita
lisat
ions
or d
ata
have
bee
n re
mov
ed to
pre
vent
iden
tific
atio
n of
cel
l size
s le
ss th
an fi
ve.
23
Tab
le7.
Num
ber
of h
ospi
talis
atio
ns fo
r m
otor
veh
icle
tra
nspo
rt in
cide
nts1
by
age
grou
p an
d ca
use,
NSW
, 199
9–20
00 t
o 20
03–2
004
Age
grou
p
Ran
k0-
4 5–
9 10
–14
15–2
4 25
–34
35–4
4 45
–54
55–6
4 65
+ To
tal
1 O
ccup
ant,
traf
fic36
5
Occ
upan
t, tr
affic
533
Mot
orcy
cle,
non-
traf
fic
1,13
7
Occ
upan
t, tr
affic
7,52
3
Occ
upan
t, tr
affic
4,81
1
Occ
upan
t, tr
affic
3,72
8
Occ
upan
t, tr
affic
2,96
8
Occ
upan
t, tr
affic
1,92
8
Occ
upan
t, tr
affic
3,09
7 O
ccup
ant,
traf
fic 2
5,56
4 2
Pede
stria
n,
traf
fic25
6
Mot
orcy
cle,
non-
traf
fic
422
Occ
upan
t, tr
affic
610
Mot
orcy
cle,
non-
traf
fic
2,62
2
Mot
orcy
cle,
traf
fic2,
223
Mot
orcy
cle,
traf
fic1,
443
Mot
orcy
cle,
traf
fic74
5
Pede
stria
n,
traf
fic41
5
Pede
stria
n,
traf
fic94
3
Mot
orcy
cle,
traf
fic7,
683
3 Pe
dest
rian,
no
n-tr
affic
18
3
Pede
stria
n,
traf
fic41
6
Pede
stria
n,
traf
fic43
5
Mot
orcy
cle,
traf
fic2,
428
Mot
orcy
cle,
non-
traf
fic
1,51
0
Mot
orcy
cle,
non-
traf
fic
821
Occ
upan
t, no
n-tr
affic
53
3
Occ
upan
t, no
n-tr
affic
35
2
Occ
upan
t, no
n-tr
affic
608
Mot
orcy
cle,
non-
traf
fic
7,17
5 4
Occ
upan
t, no
n-tr
affic
11
2
Occ
upan
t, no
n-tr
affic
16
7
Mot
orcy
cle,
traf
fic37
2
Occ
upan
t, no
n-tr
affic
1,
088
Pede
stria
n,
traf
fic81
0
Occ
upan
t, no
n-tr
affic
63
4
Pede
stria
n,
traf
fic51
0
Mot
orcy
cle,
traf
fic21
4
Pede
stria
n,
non-
traf
fic15
9
Pede
stria
n,
traf
fic5,
422
5 M
otor
cycl
e,
non-
traf
fic
58
Mot
orcy
cle,
traf
fic12
5
Occ
upan
t, no
n-tr
affic
22
4
Pede
stria
n,
traf
fic1,
017
Occ
upan
t, no
n-tr
affic
73
1
Pede
stria
n,
traf
fic62
1
Mot
orcy
cle,
non-
traf
fic
361
Mot
orcy
cle,
non-
traf
fic
138
Mot
orcy
cle,
traf
fic11
8
Occ
upan
t, no
n-tr
affic
4,
448
6 M
otor
cycl
e,
traf
fic15
Peda
l cyc
list,
traf
fic11
6
Peda
l cyc
list,
traf
fic20
7
Peda
l cyc
list,
traf
fic33
7
Peda
l cyc
list,
traf
fic32
1
Peda
l cyc
list,
traf
fic20
9
Peda
l cyc
list,
traf
fic13
5
Peda
l cyc
list,
traf
fic55
Mot
orcy
cle,
non-
traf
fic10
6
Peda
l cyc
list,
traf
fic1,
430
7 Pe
dal c
yclis
t, no
n-tr
affic
8
Pede
stria
n,
non-
traf
fic
69
Pede
stria
n,
non-
traf
fic
41
Pede
stria
n,
non-
traf
fic
112
Pede
stria
n,
non-
traf
fic
98
Pede
stria
n,
non-
traf
fic
90
Pede
stria
n,
non-
traf
fic
94
Pede
stria
n,
non-
traf
fic
50
Peda
l cyc
list,
traf
fic42
Pede
stria
n,
non-
traf
fic
895
8 Pe
dal c
yclis
t, tr
affic 7
Peda
l cyc
list,
non-
traf
fic
29
Peda
l cyc
list,
non-
traf
fic
20
Peda
l cyc
list,
non-
traf
fic
34
Peda
l cyc
list,
non-
traf
fic
27
Peda
l cyc
list,
non-
traf
fic
17
Peda
l cyc
list,
non-
traf
fic
#
Peda
l cyc
list,
non-
traf
fic
#
Peda
l cyc
list,
non-
traf
fic#
Peda
l cyc
list,
non-
traf
fic
145
O
ther
, tra
ffic
#O
ther
, tra
ffic
#O
ther
, tra
ffic
15O
ther
, tra
ffic
80O
ther
, tra
ffic
52O
ther
, tra
ffic
66O
ther
, tra
ffic
33O
ther
, tra
ffic
28O
ther
, tra
ffic
46O
ther
, tra
ffic
330
O
ther
, non
-tr
affic 6
Oth
er, n
on-
traf
fic 6
Oth
er, n
on-
traf
fic14
Oth
er, n
on-
traf
fic18
Oth
er, n
on-
traf
fic16
Oth
er, n
on-
traf
fic15
Oth
er, n
on-
traf
fic23
Oth
er, n
on-
traf
fic10
Oth
er, n
on-
traf
fic 8
Oth
er, n
on-
traf
fic11
7
1#
Cell
size
s re
pres
ent f
ewer
than
five
hos
pita
lisat
ions
or d
ata
have
bee
n re
mov
ed to
pre
vent
iden
tific
atio
n of
cel
l size
s le
ss th
an fi
ve.

/ 21
6. Struck by or struck against injuries
This section describes hospitalisations due to unintentional struck by or struck against-related injuries.
Struck by/struck against injuries are sustained as a result of contact made between one person and
another person(s) or object(s) (WHO, 1977; WHO, 1992). For example, struck by injuries can refer to the
type of unintentional contact that may occur between players while they are participating in a sporting
activity. There are two main events that cause contact to occur and these are struck by/struck against a
person or object and caught between two objects (WHO, 1977; WHO, 1992).
Struck by/struck against injury-related hospitalisations can also be intentional. A struck by/struck
against injury inflicted on one person by another that results in an admission to hospital is classified
as an interpersonal violence injury (WHO, 1977; WHO, 1992). Hospitalisations due to intentional struck
by/struck against events are described in Section 9 of this report on interpersonal violence.
In NSW, struck by/struck against incidents were the tenth leading cause of death in NSW during 1998-
2002, with 111 deaths, giving a mortality rate of 0.3 per 100,000 population (Schmertmann et al,
2004).
Struck by/struck against hospitalisation data were used to describe the profile of struck by/struck
against injuries to NSW residents. Hospitalisation data during 1999–2000 to 2003–2004 were used
for the majority of the analyses, except for the trend analyses, which used data from 1989–1990 to
2003–2004.
Struck by/struck against injuries were the third leading cause of injury hospitalisation in the period
1999–2000 to 2003–2004, and accounted for 7.1% of all injury-related hospitalisations (Table 3). During
this period, there were 35,642 hospitalisations for struck by/struck against injuries, at a rate of 108.8 per
100,000 population. There were approximately 7,128 hospitalisations per year due to struck by/struck
against injuries during 1999–2000 to 2003–2004.
Males had an age-adjusted hospitalisation rate for struck by/struck against injuries at least three times
the rate for females during 1989–1990 to 2003–2004. For males the rate of hospitalisations for struck by/
struck against injuries remained fairly constant from 1989–1990 to 1996-97 then rose from 1997–1998
to 1999–2000 (Figure 7). Overall, the hospitalisation rate was estimated to have increased significantly
by 4.2% per year during 1989–1990 to 2003–2004 (95% confidence interval for the increase: 3.5% to
5.0%).
STRUCK BY OR STRUCK AgAINST INJURIES

22 / NSW INJURY PROFILE: A REvIEW OF INJURY HOSPITALISATIONS DURINg 1989–1990 TO 2003–2004
Figure 7. Hospitalisation rate for injury due to struck by/struck against injuries by sex, NSW 1989–1990 to 2003–2004
For males, the 15–24 year age group had the highest rates of age-specific hospitalisation for struck
by/struck against injuries during the period 1999–2000 to 2003–2004. In comparison, the highest
hospitalisation rate for struck by/struck against injuries for females during the same timeframe was for
children aged 0–4 years (Figure 8).
Figure 8. Age-specific hospitalisation rate for struck by/struck against injuries by sex, NSW, 1999–2000 to 2003–2004
25
Figure 9. Hospitalisation rate for injury due to struck by/struck against injuries by sex, NSW 1989–1990 to 2003–2004
050
100
150
200
Year
Rat
e pe
r 100
,000
89-90 90-91 91-92 92-93 93-94 94-95 95-96 96-97 97-98 98-99 99-00 00-01 01-02 02-03 03-04
Males Females
For males, the 15–24 year age group had the highest rates of age-specific hospitalisation for struck by/struck against injuries during the period 1999–2000 to 2003–2004. In comparison, the highest hospitalisation rate for struck by/struck against injuries for females during the same timeframe was for children aged 0–4 years (Error! Reference source not found.).
Figure 10. Age-specific hospitalisation rate for struck by/struck against injuries by sex, NSW, 1999–2000 to 2003–2004
050
100
150
200
250
300
350
Age-group (years)
Rat
e pe
r 100
,000
0-4 5-9 10-14 15-19 20-24 25-29 30-34 35-39 40-44 45-49 50-54 55-59 60-64 65-69 70-74 75-79 80-84 85+
Males Females

/ 23STRUCK BY OR STRUCK AgAINST INJURIES
Struck by/struck against a person or object accounted for at least three-quarters of the struck by/struck
against hospitalisations for both males (80.3%) and females (75.4%). Overall, the hospitalisation for
struck-by/against injuries was 234% higher for males than for females (Table 8).
Table 8. Injury hospitalisations by struck by/struck against injury cause, NSW, number, rate and CI, 1999–2000 to 2003–2004
1 Age-adjusted rate per 100,000 population.
2 95% confidence interval.
3 The number of NSW residents hospitalised interstate during 2003–2004 was imputed and as a result the sum of submechanisms may not equal the total.
Table 9 shows the number of hospitalisations due to struck by/struck against injuries by age group for
the period 1999–2000 to 2003–2004. Struck by/against a person or object was the most common type
of struck by/struck against hospitalised injury for all age groups. The number of struck by/struck against
injuries was highest for males aged 15–24 years and for females aged 1 to 4 years.
summAry
Struck by/struck against injuries were the third leading cause of injury-related hospitalisation involving
NSW residents between 1999–2000 and 2003–2004, accounting for 7.1% of all injury-related
hospitalisations. The yearly hospitalisation rate for struck by/struck against injuries was estimated to
have increased significantly by 4.2% per year during 1989–1990 to 2003–2004.
In 2003–2004, there were 7,154 hospitalisations of NSW residents following struck by/struck against
injuries, giving a hospitalisation rate of 107.7 per 100,000 population. Around one-half (50.9%) of those
hospitalised following a struck by/struck against injury were aged 10–34 years.
Struck by/struck against a person or object accounted for around 80% of the struck by/struck against
hospitalisations. Males were more likely than females to be hospitalised for a struck by/struck against
injury. In particular, males were almost four times more likely to be hospitalised after being struck by/
struck against a person or object than females. The overall hospitalisation rate was about 234% higher
for males than for females.
22
Struck by/struck against a person or object accounted for at least three-quarters of the struck by/struck against hospitalisations for both males (80.3%) and females (75.4%). Overall, the hospitalisation for struck-by/against injuries was 234% higher for males than for females (Table 8).
Table 8. Injury hospitalisations by struck by/struck against injury cause, NSW, number, rate and CI, 1999–2000 to 2003–2004
All Persons Male Female Cause N Rate1 95%CI2 N Rate1 95%CI2 N Rate1 95%CI2
Struck by/against a person or object
28,226 86.2 (85.2,87.2) 22,005 133.7 (132.0,135.5) 6,221 37.4 (36.5,38.3)
Caught between two objects
7,416 22.6 (22.1,23.1) 5,389 32.7 (31.8,33.6) 2,027 12.4 (11.8,12.9)
All3 35,642 108.8 (107.7,109.9) 27,394 166.4 (164.5,168.4) 8,248 49.8 (48.7,50.9)
1 Rate per 100,000 population. 2 95% confidence interval. 3 The number of NSW residents hospitalised interstate during 2003–2004 was imputed and as a result
the sum of submechanisms may not equal the total.
Table 9 shows the number of hospitalisations due to struck by/struck against injuries by age group for the period 1999–2000 to 2003–2004. Struck by/against a person or object was the most common type of struck by/struck against hospitalised injury for all age groups. The number of struck by/struck against injuries was highest for males aged 15–24 years and for females aged 1 to 4 years.
SummaryStruck by/struck against injuries were the third leading cause of injury-related hospitalisation involving NSW residents between 1999–2000 and 2003–2004, accounting for 7.1% of all injury-related hospitalisations. The yearly hospitalisation rate for struck by/struck against injuries was estimated to have increased significantly by 4.2% per year during 1989–1990 to 2003–2004.
In 2003–2004, there were 7,154 hospitalisations of NSW residents following struck by/struck against injuries, giving a hospitalisation rate of 107.7 per 100,000 population. Around one-half (50.9%) of those hospitalised following a struck by/struck against injury were aged 10–34 years.
Struck by/struck against a person or object accounted for around 80% of the struck by/struck against hospitalisations. Males were more likely than females to be hospitalised for a struck by/struck against injury. In particular, males were almost four times more likely to be hospitalised after being struck by/struck against a person or object than females. The overall hospitalisation rate was about 234% higher for males than for females.

24 / NSW INJURY PROFILE: A REvIEW OF INJURY HOSPITALISATIONS DURINg 1989–1990 TO 2003–200427
Tab
le9.
Num
ber
of h
ospi
talis
atio
ns fo
r st
ruck
by/
stru
ck a
gain
st in
juri
es b
y ag
e gr
oup
and
caus
e, N
SW, 1
999–
2000
to
2003
–200
4
Age
grou
p
Ran
k 0-
4 5–
9 10
–14
15–2
4 25
–34
35–4
4 45
–54
55–6
4 65
+ To
tal
1St
ruck
by
/aga
inst
pe
rson
or
obje
ct
2,09
2
Stru
ck
by/a
gain
st
pers
on o
r ob
ject
2,
199
Stru
ck
by/a
gain
st
pers
on o
r ob
ject
3,
260
Stru
ck
by/a
gain
st
pers
on o
r ob
ject
7,
122
Stru
ck
by/a
gain
st
pers
on o
r ob
ject
5,
268
Stru
ck
by/a
gain
st
pers
on o
r ob
ject
3,
342
Stru
ck
by/a
gain
st
pers
on o
r ob
ject
2,
146
Stru
ck
by/a
gain
st
pers
on o
r ob
ject
1,
075
Stru
ck
by/a
gain
st
pers
on o
r ob
ject
1,
721
Stru
ck
by/a
gain
st
pers
on o
r ob
ject
28
,226
2
Caug
ht
betw
een
2 ob
ject
s1,
299
Caug
ht
betw
een
2 ob
ject
s75
3
Caug
ht
betw
een
2 ob
ject
s42
8
Caug
ht
betw
een
2 ob
ject
s90
9
Caug
ht
betw
een
2 ob
ject
s1,
144
Caug
ht
betw
een
2 ob
ject
s1,
017
Caug
ht
betw
een
2 ob
ject
s85
8
Caug
ht
betw
een
2 ob
ject
s53
4
Caug
ht
betw
een
2 ob
ject
s47
4
Caug
ht
betw
een
2 ob
ject
s7,
416
27
Tab
le9.
Num
ber
of h
ospi
talis
atio
ns fo
r st
ruck
by/
stru
ck a
gain
st in
juri
es b
y ag
e gr
oup
and
caus
e, N
SW, 1
999–
2000
to
2003
–200
4
Age
grou
p
Ran
k 0-
4 5–
9 10
–14
15–2
4 25
–34
35–4
4 45
–54
55–6
4 65
+ To
tal
1St
ruck
by
/aga
inst
pe
rson
or
obje
ct
2,09
2
Stru
ck
by/a
gain
st
pers
on o
r ob
ject
2,
199
Stru
ck
by/a
gain
st
pers
on o
r ob
ject
3,
260
Stru
ck
by/a
gain
st
pers
on o
r ob
ject
7,
122
Stru
ck
by/a
gain
st
pers
on o
r ob
ject
5,
268
Stru
ck
by/a
gain
st
pers
on o
r ob
ject
3,
342
Stru
ck
by/a
gain
st
pers
on o
r ob
ject
2,
146
Stru
ck
by/a
gain
st
pers
on o
r ob
ject
1,
075
Stru
ck
by/a
gain
st
pers
on o
r ob
ject
1,
721
Stru
ck
by/a
gain
st
pers
on o
r ob
ject
28
,226
2
Caug
ht
betw
een
2 ob
ject
s1,
299
Caug
ht
betw
een
2 ob
ject
s75
3
Caug
ht
betw
een
2 ob
ject
s42
8
Caug
ht
betw
een
2 ob
ject
s90
9
Caug
ht
betw
een
2 ob
ject
s1,
144
Caug
ht
betw
een
2 ob
ject
s1,
017
Caug
ht
betw
een
2 ob
ject
s85
8
Caug
ht
betw
een
2 ob
ject
s53
4
Caug
ht
betw
een
2 ob
ject
s47
4
Caug
ht
betw
een
2 ob
ject
s7,
416
/ 25
7. Self-harm
Self-harm is the term used to describe purposely self-inflicted injury (WHO, 1977; WHO, 1992). This
category includes suicide attempts that did not result in death and self-maiming attempts. WHO
classifies self-harm according to the method used: hanging, strangulation or suffocation, poisoning by
overdose, shooting by firearm, jumping from a high place, jumping or lying in front of a moving object,
near-drowning and using a sharp or blunt object. Only people aged 10 years or older are included in the
analyses for this section.
In NSW, suicide was the leading cause of injury-related death in NSW during 1998-2002, with 3,822
deaths, giving a mortality rate of 11.7 per 100,000 population (Schmertmann et al, 2004). The lifetime
cost of fatal and attempted self-harm in NSW has been estimated at $588 million—$25 million in direct
costs and $563 million in mortality and morbidity costs (Potter-Forbes & Aisbett, 2003).
Hospitalisation data for self-harm were used to describe the profile of self-harm-related injuries of
NSW residents. Hospitalisation data during 1999–2000 to 2003–2004 were used for the majority of the
analyses, except for the trend analyses, which used data from 1989–1990 to 2003–2004.
Self-harm was the fourth leading cause of injury hospitalisation during the period 1999–2000 to 2003–
2004, and accounted for 6.5% of all injury hospitalisations (Table 3). During this period, there were
32,582 hospitalisations for self-harm, at a rate of 115.1 per 100,000 population aged 10 years or older.
Hospitalisation rates for self-harm were higher for females than for males for the period 1989–1990 to
2003–2004 (Figure 9). The rate of self-harm-related hospitalisation increased significantly by 5.9% per
year (95% confidence interval for the increase: 5.2% to 6.6%) from 1989–1990 to 2003–2004.
For females, age-specific hospitalisation rates for self-harm for the period 1999–2000 to 2003–2004
were highest in those aged 15-19 and 20–24 years. In males, age-specific hospitalisation rates were
highest in those aged 20–24, 25–29, and 30-34 years (Figure 10). The overall hospitalisation rate was
about 53% higher for females than for males.
SELF-HARM

26 / NSW INJURY PROFILE: A REvIEW OF INJURY HOSPITALISATIONS DURINg 1989–1990 TO 2003–2004
Figure 9. Hospitalisation rate for injury due to self-harm by sex, NSW 1989–1990 to 2003–2004
Figure 10. Age-specific hospitalisation rate for self-harm by sex, NSW, 1999–2000 to 2003–2004
Poisoning and use of a sharp or blunt object were the most commonly used methods of self-harm.
Approximately 85% of all hospitalisations due to self-harm were caused by poisoning. The hospitalisation
rate for females for self-harm by poisoning was about 74% higher than the rate for males. The overall
hospitalisation rate for females was about 53% higher for females than for males (Table 10).
29
Figure 11. Hospitalisation rate for injury due to self-harm by sex, NSW 1989–1990 to 2003–2004 0
5010
015
0
Year
Rat
e pe
r 100
,000
89-90 90-91 91-92 92-93 93-94 94-95 95-96 96-97 97-98 98-99 99-00 00-01 01-02 02-03 03-04
Males Females
Figure 12. Age-specific hospitalisation rate for self-harm by sex, NSW, 1999–2000 to 2003–2004
010
020
030
0
Age-group (years)
Rat
e pe
r 100
,000
10-14 15-19 20-24 25-29 30-34 35-39 40-44 45-49 50-54 55-59 60-64 65-69 70-74 75-79 80-84 85+
Males Females
Poisoning and use of a sharp or blunt object were the most commonly used methods of self-harm (Error! Reference source not found.). Approximately 85% of all hospitalisations due to self-harm were caused by poisoning. The hospitalisation rate for females for self-harm by poisoning was about 74% higher than the rate for males. The overall hospitalisation rate for females was about 53% higher for females than for males (Error! Reference source not found.).
29
Figure 11. Hospitalisation rate for injury due to self-harm by sex, NSW 1989–1990 to 2003–2004
050
100
150
Year
Rat
e pe
r 100
,000
89-90 90-91 91-92 92-93 93-94 94-95 95-96 96-97 97-98 98-99 99-00 00-01 01-02 02-03 03-04
Males Females
Figure 12. Age-specific hospitalisation rate for self-harm by sex, NSW, 1999–2000 to 2003–2004
010
020
030
0
Age-group (years)
Rat
e pe
r 100
,000
10-14 15-19 20-24 25-29 30-34 35-39 40-44 45-49 50-54 55-59 60-64 65-69 70-74 75-79 80-84 85+
Males Females
Poisoning and use of a sharp or blunt object were the most commonly used methods of self-harm (Error! Reference source not found.). Approximately 85% of all hospitalisations due to self-harm were caused by poisoning. The hospitalisation rate for females for self-harm by poisoning was about 74% higher than the rate for males. The overall hospitalisation rate for females was about 53% higher for females than for males (Error! Reference source not found.).
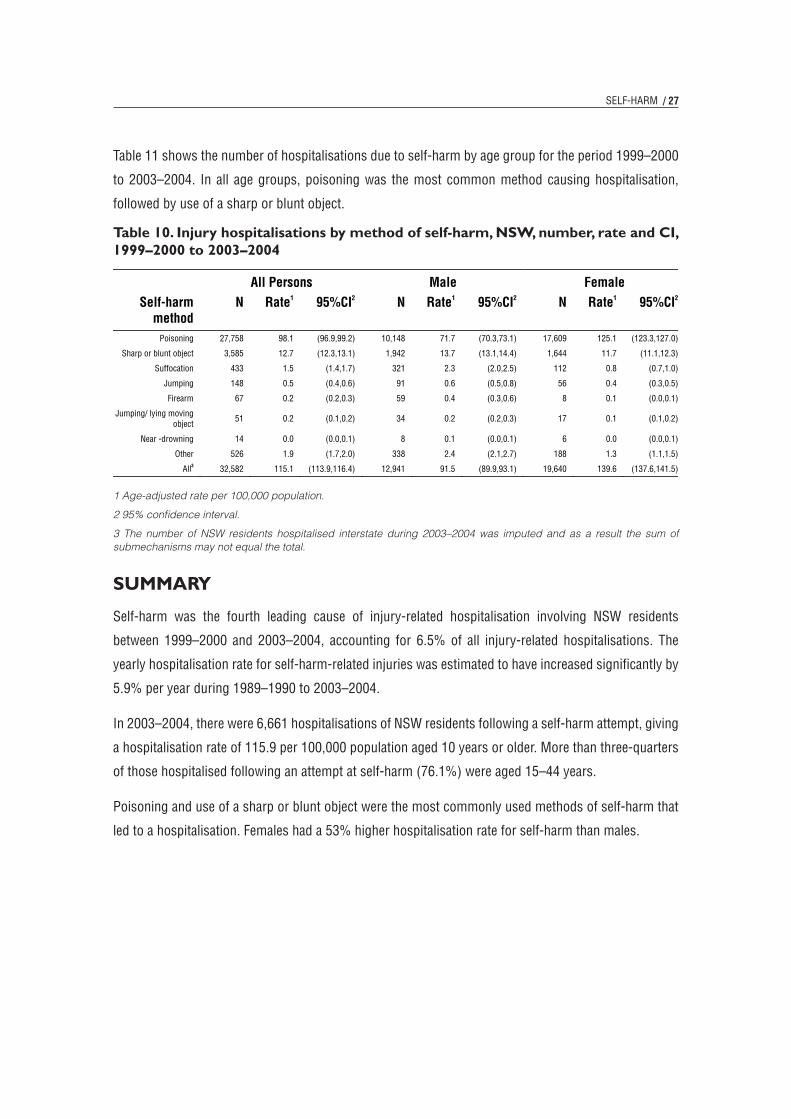
/ 27SELF-HARM
Table 11 shows the number of hospitalisations due to self-harm by age group for the period 1999–2000
to 2003–2004. In all age groups, poisoning was the most common method causing hospitalisation,
followed by use of a sharp or blunt object.
Table 10. Injury hospitalisations by method of self-harm, NSW, number, rate and CI, 1999–2000 to 2003–2004
1 Age-adjusted rate per 100,000 population.
2 95% confidence interval.
3 The number of NSW residents hospitalised interstate during 2003–2004 was imputed and as a result the sum of submechanisms may not equal the total.
summAry
Self-harm was the fourth leading cause of injury-related hospitalisation involving NSW residents
between 1999–2000 and 2003–2004, accounting for 6.5% of all injury-related hospitalisations. The
yearly hospitalisation rate for self-harm-related injuries was estimated to have increased significantly by
5.9% per year during 1989–1990 to 2003–2004.
In 2003–2004, there were 6,661 hospitalisations of NSW residents following a self-harm attempt, giving
a hospitalisation rate of 115.9 per 100,000 population aged 10 years or older. More than three-quarters
of those hospitalised following an attempt at self-harm (76.1%) were aged 15–44 years.
Poisoning and use of a sharp or blunt object were the most commonly used methods of self-harm that
led to a hospitalisation. Females had a 53% higher hospitalisation rate for self-harm than males.
26
Table 11 shows the number of hospitalisations due to self-harm by age group for the period 1999–2000 to 2003–2004. In all age groups, poisoning was the most common method causing hospitalisation, followed by use of a sharp or blunt object.
Table 10. Injury hospitalisations by method of self-harm, NSW, number, rate and CI, 1999–2000 to 2003–2004
All Persons Male Female Self-harm
method N Rate1 95%CI2 N Rate1 95%CI2 N Rate1 95%CI2
Poisoning 27,758 98.1 (96.9,99.2) 10,148 71.7 (70.3,73.1) 17,609 125.1 (123.3,127.0)
Sharp or blunt object 3,585 12.7 (12.3,13.1) 1,942 13.7 (13.1,14.4) 1,644 11.7 (11.1,12.3)
Suffocation 433 1.5 (1.4,1.7) 321 2.3 (2.0,2.5) 112 0.8 (0.7,1.0)
Jumping 148 0.5 (0.4,0.6) 91 0.6 (0.5,0.8) 56 0.4 (0.3,0.5)
Firearm 67 0.2 (0.2,0.3) 59 0.4 (0.3,0.6) 8 0.1 (0.0,0.1)
Jumping/ lying moving object
51 0.2 (0.1,0.2) 34 0.2 (0.2,0.3) 17 0.1 (0.1,0.2)
Near -drowning 14 0.0 (0.0,0.1) 8 0.1 (0.0,0.1) 6 0.0 (0.0,0.1)
Other 526 1.9 (1.7,2.0) 338 2.4 (2.1,2.7) 188 1.3 (1.1,1.5)
All3 32,582 115.1 (113.9,116.4) 12,941 91.5 (89.9,93.1) 19,640 139.6 (137.6,141.5)
1 Age-adjusted rate per 100,000 population aged 10 years or older. 2 95% confidence interval. 3 The number of NSW residents hospitalised interstate during 2003–2004 was imputed and as a result
the sum of submechanisms may not equal the total.
SummarySelf-harm was the fourth leading cause of injury-related hospitalisation involving NSW residents between 1999–2000 and 2003–2004, accounting for 6.5% of all injury-related hospitalisations. The yearly hospitalisation rate for self-harm-related injuries was estimated to have increased significantly by 5.9% per year during 1989–1990 to 2003–2004.
In 2003–2004, there were 6,661 hospitalisations of NSW residents following a self-harm attempt, giving a hospitalisation rate of 115.9 per 100,000 population aged 10 years or older. More than three-quarters of those hospitalised following an attempt at self-harm (76.1%) were aged 15–44 years.
Poisoning and use of a sharp or blunt object were the most commonly used methods of self-harm that led to a hospitalisation. Females had a 53% higher hospitalisationrate for self-harm than males.
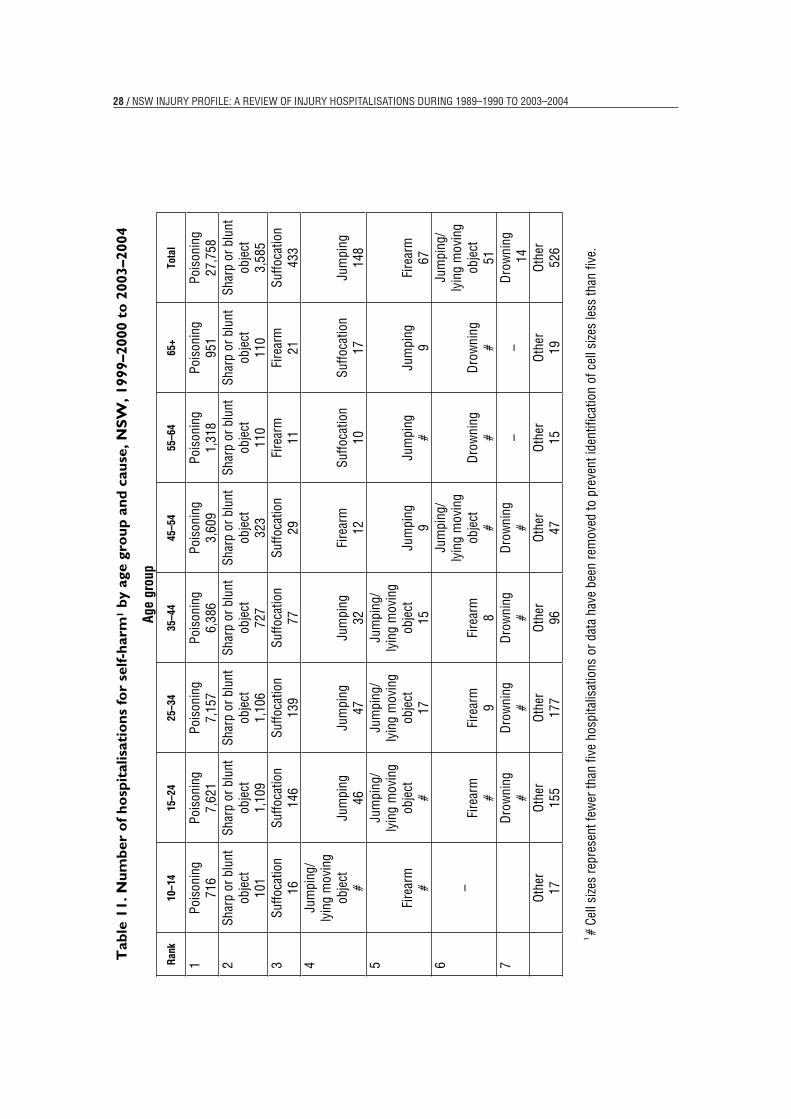
28 / NSW INJURY PROFILE: A REvIEW OF INJURY HOSPITALISATIONS DURINg 1989–1990 TO 2003–200431
Tab
le 1
1. N
umbe
r of
hos
pita
lisat
ions
for
self-
harm
1 by
age
gro
up a
nd c
ause
, NSW
, 199
9–20
00 t
o 20
03–2
004
Age
grou
p
Ran
k 10
–14
15–2
4 25
–34
35–4
4 45
–54
55–6
4 65
+ To
tal
1 Po
ison
ing
716
Pois
onin
g 7,
621
Pois
onin
g 7,
157
Pois
onin
g 6,
386
Pois
onin
g 3,
609
Pois
onin
g 1,
318
Pois
onin
g 95
1 Po
ison
ing
27,7
58
2 Sh
arp
or b
lunt
ob
ject
10
1
Shar
p or
blu
nt
obje
ct
1,10
9
Shar
p or
blu
nt
obje
ct
1,10
6
Shar
p or
blu
nt
obje
ct
727
Shar
p or
blu
nt
obje
ct
323
Shar
p or
blu
nt
obje
ct
110
Shar
p or
blu
nt
obje
ct
110
Shar
p or
blu
nt
obje
ct
3,58
5 3
Suffo
catio
n 16
Suffo
catio
n 14
6 Su
ffoca
tion
139
Suffo
catio
n77
Suffo
catio
n 29
Fire
arm
11Fi
rear
m21
Suffo
catio
n 43
3 4
Jum
ping
/ ly
ing
mov
ing
obje
ct
#Ju
mpi
ng46
Jum
ping
47Ju
mpi
ng32
Fire
arm
12Su
ffoca
tion
10Su
ffoca
tion
17Ju
mpi
ng14
8 5
Fire
arm
#
Jum
ping
/ly
ing
mov
ing
obje
ct
#
Jum
ping
/ly
ing
mov
ing
obje
ct
17
Jum
ping
/ly
ing
mov
ing
obje
ct
15Ju
mpi
ng9
Jum
ping
#Ju
mpi
ng9
Fire
arm
676
–Fi
rear
m#
Fire
arm
9Fi
rear
m8
Jum
ping
/ly
ing
mov
ing
obje
ct
#D
row
ning
#
Dro
wni
ng
#
Jum
ping
/ly
ing
mov
ing
obje
ct
517
D
row
ning
#
Dro
wni
ng
#D
row
ning
#
Dro
wni
ng
#–
– D
row
ning
1
4
Oth
er
17O
ther
155
Oth
er17
7 O
ther
96O
ther
47O
ther
15O
ther
19O
ther
526
1#
Cell
size
s re
pres
ent f
ewer
than
five
hos
pita
lisat
ions
or d
ata
have
bee
n re
mov
ed to
pre
vent
iden
tific
atio
n of
cel
l size
s le
ss th
an fi
ve.

/ 29
8. Cut or pierce-related injuries
This section describes hospitalisations due to unintentional cut or pierce-related injuries. WHO classifies
the cause of cut/pierce-related injury hospitalisations by the mechanism that caused the injury (WHO,
1977; WHO, 1992). These mechanisms include sharp glass, knives, other hand tools, lawn mowers,
other powered household goods, and other mechanisms.
Cut or pierce injury-related hospitalisations can also be intentional. A cut or pierce-related injury inflicted
on one person by another that results in an admission to hospital is classified as an interpersonal
violence injury (WHO, 1977; WHO, 1992). Hospitalisations due to intentional cut or pierce-related injury
events inflicted on one person by another are described in Section 9 of this report on interpersonal
violence. A self-inflicted cut or pierce-related injury that results in an admission to hospital is classified
as self-harm injury (WHO, 1977; WHO, 1992). Hospitalisations due to self-inflicted cut or pierce-related
injury events are described in Section 7 of this report on self-harm.
Hospitalisation data for cut/pierce-related injuries were used to describe the profile of cut/pierce injuries
for NSW residents. Hospitalisation data during 1999–2000 to 2003–2004 were used for the majority of
the analyses, except for the trend analyses, which used data from 1989–1990 to 2003–2004.
Cut/pierce injuries were the fifth leading cause of injury hospitalisation during the period 1999–2000 to
2003–2004, and accounted for 6.2% of all injury-related hospitalisations (Table 3). During this period,
there were 31,054 hospitalisations for cut/pierce injuries, at a rate of 94.6 per 100,000 population. There
were approximately 6,211 hospitalisations per year due to cut/pierce-related injuries during 1999–2000
to 2003–2004.
Males had an age-adjusted hospitalisation rate for cut/pierce injuries almost three times that of females
during 1989–1990 to 2003–2004. The hospitalisation rate for cut/pierce injuries for males has remained
fairly constant across the 15-year period (Figure 11). The hospitalisation rate was estimated to decrease
significantly for females by 1.1% per year during 1989–1990 to 2003–2004 (95% confidence interval
for the decrease: 0.5% to 1.7%).
CUT OR PIERCE-RELATED INJURIES
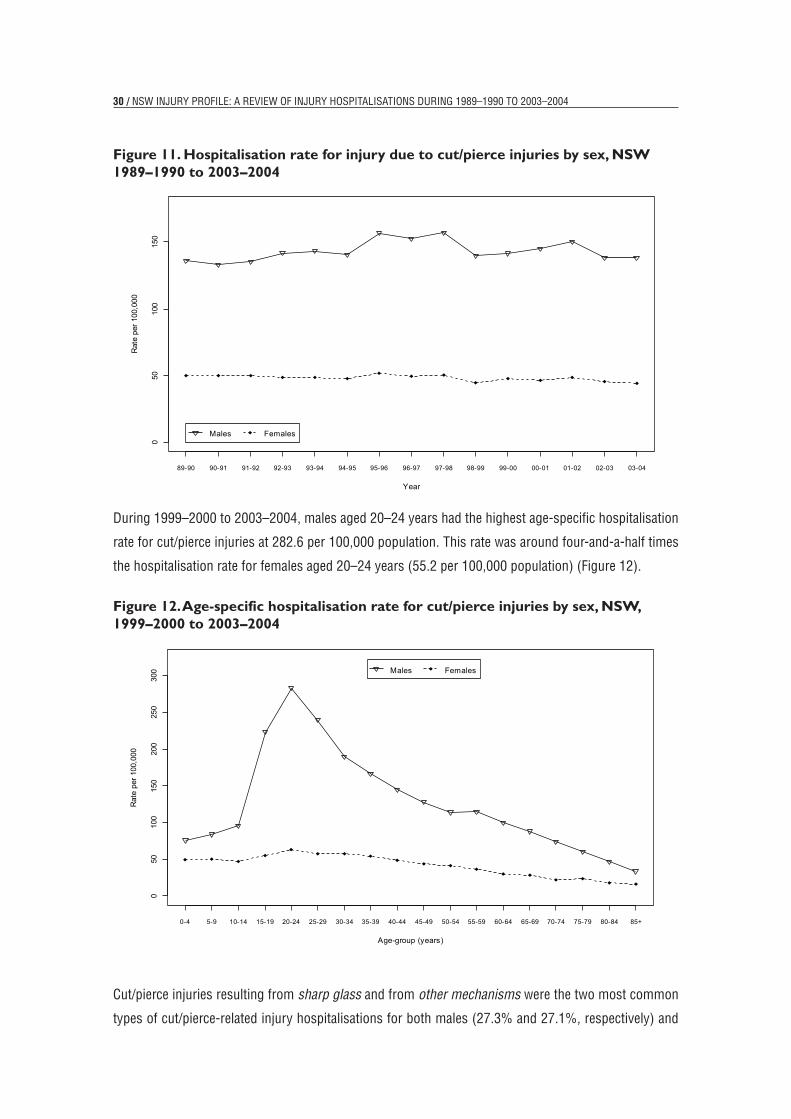
30 / NSW INJURY PROFILE: A REvIEW OF INJURY HOSPITALISATIONS DURINg 1989–1990 TO 2003–2004
Figure 11. Hospitalisation rate for injury due to cut/pierce injuries by sex, NSW 1989–1990 to 2003–2004
During 1999–2000 to 2003–2004, males aged 20–24 years had the highest age-specific hospitalisation
rate for cut/pierce injuries at 282.6 per 100,000 population. This rate was around four-and-a-half times
the hospitalisation rate for females aged 20–24 years (55.2 per 100,000 population) (Figure 12).
Figure 12. Age-specific hospitalisation rate for cut/pierce injuries by sex, NSW, 1999–2000 to 2003–2004
Cut/pierce injuries resulting from sharp glass and from other mechanisms were the two most common
types of cut/pierce-related injury hospitalisations for both males (27.3% and 27.1%, respectively) and
33
During 1999–2000 to 2003–2004, males aged 20–24 years had the highest age-specific hospitalisation rate for cut/pierce injuries at 282.6 per 100,000 population. This rate was around four-and-a-half times the hospitalisation rate for females aged 20–24 years (55.2 per 100,000 population) (Error! Reference source not found.).
Figure 14. Age-specific hospitalisation rate for cut/pierce injuries by sex, NSW, 1999–2000 to 2003–2004
050
100
150
200
250
300
Age-group (years)
Rat
e pe
r 100
,000
0-4 5-9 10-14 15-19 20-24 25-29 30-34 35-39 40-44 45-49 50-54 55-59 60-64 65-69 70-74 75-79 80-84 85+
Males Females
Cut/pierce injuries resulting from sharp glass and from other mechanisms were the two most common types of cut/pierce-related injury hospitalisations for both males (27.3% and 27.1%, respectively) and females (33.1% and 30.1%, respectively) (Error! Reference source not found.). The overall hospitalisation was about 208% higher for males than for females (Error! Reference source not found.).
Error! Reference source not found. shows the number of hospitalisations due to cut/pierce injuries by age group for the period 1999–2000 to 2003–2004. The number of cut/pierce-related hospitalisations varied by age group. Other mechanisms and sharp glass were the two most common mechanisms that caused a cut/pierce injury in individuals aged 44 years or less. Other mechanisms and other powered household goods were the two most common mechanisms resulting in hospitalisation for cut/pierce-related injuries in individuals aged 45 years or older.
32
9. Cut or pierce-related injuries
Cut or pierce-related injuries are an unintentional cause of injury hospitalisation (WHO, 1977; WHO, 1992). WHO classifies the cause of cut/pierce-related injury hospitalisations by the mechanism that caused the injury. These mechanisms include sharp glass, knives, other hand tools, lawn mowers, other powered household goods,and other mechanisms.
Hospitalisation data for cut/pierce-related injuries were used to describe the profile of cut/pierce injuries for NSW residents. Hospitalisation data during 1999–2000 to 2003–2004 were used for the majority of the analyses, except for the trend analyses, which used data from 1989–1990 to 2003–2004.
Cut/pierce injuries were the sixth leading cause of injury hospitalisation during the period 1999–2000 to 2003–2004, and accounted for 5.2% of all injury-related hospitalisations (Table 3). During this period, there were 31,054 hospitalisations for cut/pierce injuries, at a rate of 94.6 per 100,000 population. There were approximately 6,211 hospitalisations per year due to cut/pierce-related injuries during 1999–2000 to 2003–2004.
Males had an age-adjusted hospitalisation rate for cut/pierce injuries almost three times that of females during 1989–1990 to 2003–2004. The hospitalisation rate for cut/pierce injuries for males has remained fairly constant across the 15-year period (Error! Reference source not found.). The hospitalisation rate was estimated to decrease significantly for females by 1.1% per year during 1989–1990 to 2003–2004 (95% confidence interval for the decrease: 0.5% to 1.7%).
Figure 13. Hospitalisation rate for injury due to cut/pierce injuries by sex, NSW 1989–1990 to 2003–2004
050
100
150
Year
Rat
e pe
r 100
,000
89-90 90-91 91-92 92-93 93-94 94-95 95-96 96-97 97-98 98-99 99-00 00-01 01-02 02-03 03-04
Males Females
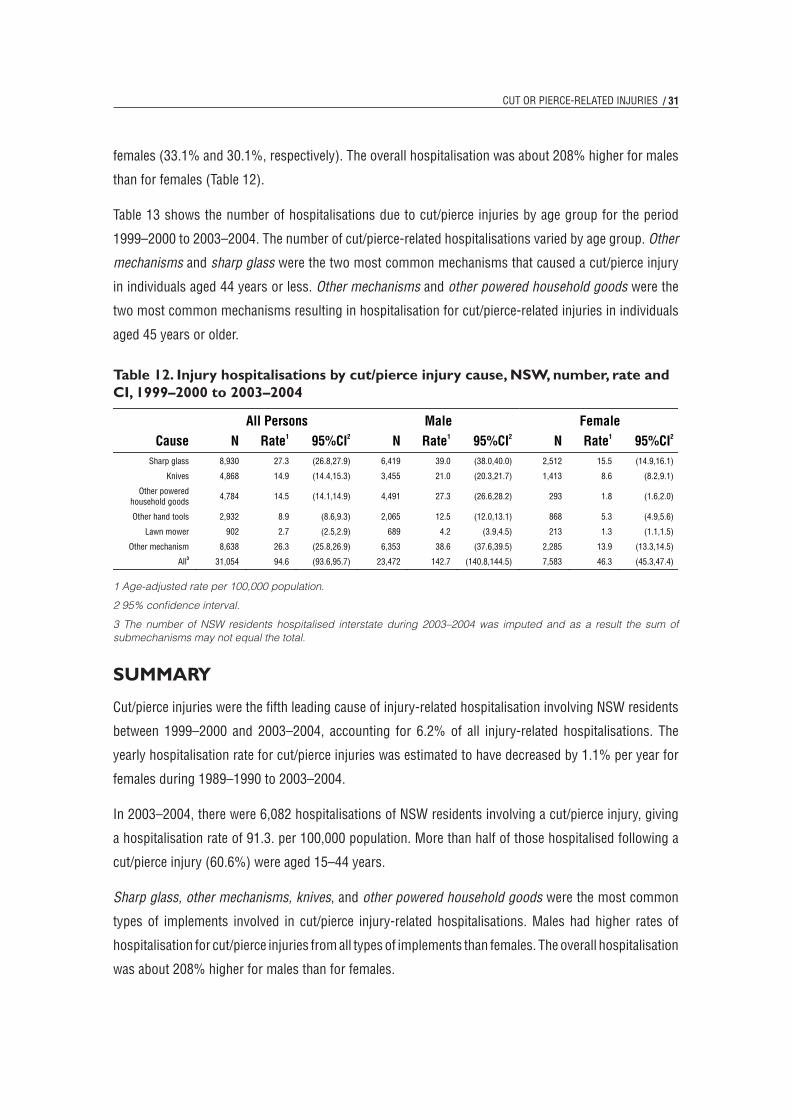
/ 31CUT OR PIERCE-RELATED INJURIES
females (33.1% and 30.1%, respectively). The overall hospitalisation was about 208% higher for males
than for females (Table 12).
Table 13 shows the number of hospitalisations due to cut/pierce injuries by age group for the period
1999–2000 to 2003–2004. The number of cut/pierce-related hospitalisations varied by age group. Other
mechanisms and sharp glass were the two most common mechanisms that caused a cut/pierce injury
in individuals aged 44 years or less. Other mechanisms and other powered household goods were the
two most common mechanisms resulting in hospitalisation for cut/pierce-related injuries in individuals
aged 45 years or older.
Table 12. Injury hospitalisations by cut/pierce injury cause, NSW, number, rate and CI, 1999–2000 to 2003–2004
1 Age-adjusted rate per 100,000 population.
2 95% confidence interval.
3 The number of NSW residents hospitalised interstate during 2003–2004 was imputed and as a result the sum of submechanisms may not equal the total.
summAry
Cut/pierce injuries were the fifth leading cause of injury-related hospitalisation involving NSW residents
between 1999–2000 and 2003–2004, accounting for 6.2% of all injury-related hospitalisations. The
yearly hospitalisation rate for cut/pierce injuries was estimated to have decreased by 1.1% per year for
females during 1989–1990 to 2003–2004.
In 2003–2004, there were 6,082 hospitalisations of NSW residents involving a cut/pierce injury, giving
a hospitalisation rate of 91.3. per 100,000 population. More than half of those hospitalised following a
cut/pierce injury (60.6%) were aged 15–44 years.
Sharp glass, other mechanisms, knives, and other powered household goods were the most common
types of implements involved in cut/pierce injury-related hospitalisations. Males had higher rates of
hospitalisation for cut/pierce injuries from all types of implements than females. The overall hospitalisation
was about 208% higher for males than for females.
33
During 1999–2000 to 2003–2004, males aged 20–24 years had the highest age-specific hospitalisation rate for cut/pierce injuries at 282.6 per 100,000 population. This rate was around four-and-a-half times the hospitalisation rate for females aged 20–24 years (55.2 per 100,000 population) (Error! Reference source not found.).
Figure 14. Age-specific hospitalisation rate for cut/pierce injuries by sex, NSW, 1999–2000 to 2003–2004
050
100
150
200
250
300
Age-group (years)
Rat
e pe
r 100
,000
0-4 5-9 10-14 15-19 20-24 25-29 30-34 35-39 40-44 45-49 50-54 55-59 60-64 65-69 70-74 75-79 80-84 85+
Males Females
Cut/pierce injuries resulting from sharp glass and from other mechanisms were the two most common types of cut/pierce-related injury hospitalisations for both males (27.3% and 27.1%, respectively) and females (33.1% and 30.1%, respectively) (Error! Reference source not found.). The overall hospitalisation was about 208% higher for males than for females (Error! Reference source not found.).
Error! Reference source not found. shows the number of hospitalisations due to cut/pierce injuries by age group for the period 1999–2000 to 2003–2004. The number of cut/pierce-related hospitalisations varied by age group. Other mechanisms and sharp glass were the two most common mechanisms that caused a cut/pierce injury in individuals aged 44 years or less. Other mechanisms and other powered household goods were the two most common mechanisms resulting in hospitalisation for cut/pierce-related injuries in individuals aged 45 years or older.
31
Table 12. Injury hospitalisations by cut/pierce injury cause, NSW, number, rate and CI, 1999–2000 to 2003–2004
All Persons Male Female Cause N Rate1 95%CI2 N Rate1 95%CI2 N Rate1 95%CI2
Sharp glass 8,930 27.3 (26.8,27.9) 6,419 39.0 (38.0,40.0) 2,512 15.5 (14.9,16.1)
Knives 4,868 14.9 (14.4,15.3) 3,455 21.0 (20.3,21.7) 1,413 8.6 (8.2,9.1)
Other powered household goods
4,784 14.5 (14.1,14.9) 4,491 27.3 (26.6,28.2) 293 1.8 (1.6,2.0)
Other hand tools 2,932 8.9 (8.6,9.3) 2,065 12.5 (12.0,13.1) 868 5.3 (4.9,5.6)
Lawn mower 902 2.7 (2.5,2.9) 689 4.2 (3.9,4.5) 213 1.3 (1.1,1.5)
Other mechanism 8,638 26.3 (25.8,26.9) 6,353 38.6 (37.6,39.5) 2,285 13.9 (13.3,14.5)
All3 31,054 94.6 (93.6,95.7) 23,472 142.7 (140.8,144.5) 7,583 46.3 (45.3,47.4)
1 Age-adjusted rate per 100,000 population. 2 95% confidence interval. 3 The number of NSW residents hospitalised interstate during 2003–2004 was imputed and as a result
the sum of submechanisms may not equal the total.
SummaryCut/pierce injuries were the fifth leading cause of injury-related hospitalisation involving NSW residents between 1999–2000 and 2003–2004, accounting for 6.2% of all injury-related hospitalisations. The yearly hospitalisation rate for cut/pierce injuries was estimated to have decreased by 1.1% per year for females during 1989–1990 to 2003–2004.
In 2003–2004, there were 6,082 hospitalisations of NSW residents involving a cut/pierce injury, giving a hospitalisation rate of 91.3. per 100,000 population. More than half of those hospitalised following a cut/pierce injury (60.6%) were aged 15–44 years.
Sharp glass, other mechanisms, knives, and other powered household goods were the most common types of implements involved in cut/pierce injury-related hospitalisations. Males had higher rates of hospitalisation for cut/pierce injuries from all types of implements than females. The overall hospitalisation was about 208% higher for males than for females.
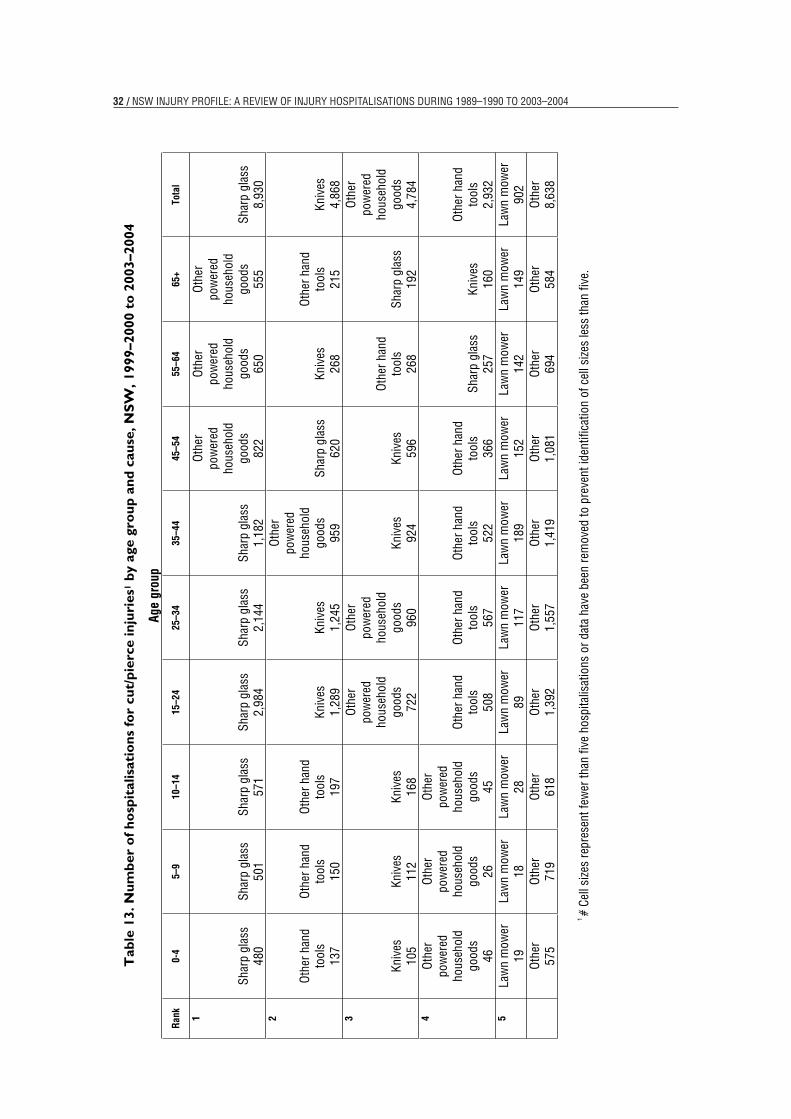
32 / NSW INJURY PROFILE: A REvIEW OF INJURY HOSPITALISATIONS DURINg 1989–1990 TO 2003–200435
Tab
le 1
3. N
umbe
r of
hos
pita
lisat
ions
for
cut/
pier
ce in
juri
es1
by a
ge g
roup
and
cau
se, N
SW, 1
999–
2000
to
2003
–200
4
Age
grou
p
Ran
k 0-
4 5–
9 10
–14
15–2
4 25
–34
35–4
4 45
–54
55–6
4 65
+ To
tal
1
Shar
p gl
ass
480
Shar
p gl
ass
501
Shar
p gl
ass
571
Shar
p gl
ass
2,98
4 Sh
arp
glas
s 2,
144
Shar
p gl
ass
1,18
2
Oth
erpo
wer
ed
hous
ehol
d go
ods
822
Oth
erpo
wer
ed
hous
ehol
d go
ods
650
Oth
erpo
wer
ed
hous
ehol
d go
ods
555
Shar
p gl
ass
8,
930
2
Oth
er h
and
tool
s 13
7
Oth
er h
and
tool
s 15
0
Oth
er h
and
tool
s 19
7 Kn
ives
1,28
9 Kn
ives
1,24
5
Oth
erpo
wer
ed
hous
ehol
d go
ods
959
Shar
p gl
ass
620
Kniv
es26
8
Oth
er h
and
tool
s 21
5 Kn
ives
4,86
8 3
Kniv
es10
5 Kn
ives
112
Kniv
es16
8
Oth
erpo
wer
ed
hous
ehol
d go
ods
722
Oth
erpo
wer
ed
hous
ehol
d go
ods
960
Kniv
es92
4 Kn
ives
596
Oth
er h
and
tool
s 26
8 Sh
arp
glas
s 19
2
Oth
erpo
wer
ed
hous
ehol
d go
ods
4,78
4 4
Oth
erpo
wer
ed
hous
ehol
d go
ods
46
Oth
erpo
wer
ed
hous
ehol
d go
ods
26
Oth
erpo
wer
ed
hous
ehol
d go
ods
45
Oth
er h
and
tool
s 50
8
Oth
er h
and
tool
s 56
7
Oth
er h
and
tool
s 52
2
Oth
er h
and
tool
s 36
6 Sh
arp
glas
s 25
7 Kn
ives
160
Oth
er h
and
tool
s 2,
932
5La
wn
mow
er
19La
wn
mow
er
18La
wn
mow
er
28La
wn
mow
er
89La
wn
mow
er
117
Law
n m
ower
18
9 La
wn
mow
er
152
Law
n m
ower
14
2 La
wn
mow
er
149
Law
n m
ower
90
2 O
ther
575
Oth
er71
9 O
ther
618
Oth
er1,
392
Oth
er1,
557
Oth
er1,
419
Oth
er1,
081
Oth
er69
4 O
ther
584
Oth
er8,
638
1#
Cell
size
s re
pres
ent f
ewer
than
five
hos
pita
lisat
ions
or d
ata
have
bee
n re
mov
ed to
pre
vent
iden
tific
atio
n of
cel
l size
s le
ss th
an fi
ve.

/ 33
9. Interpersonal violence
Interpersonal violence is the term used to describe injury purposely inflicted by one or more persons
on another person (WHO, 1977; WHO, 1992). WHO classifies the cause of interpersonal violence
hospitalisations by the method used to inflict injury on another person: using a sharp or blunt object
to hit, cut or stab another person causing bleeding or other type of injury, shooting by firearm, struck
by/struck against a person or object, hanging, strangulation or suffocation, and poisoning.
In NSW, interpersonal violence was the fifth leading cause of death in NSW during 1998-2002, with 513
deaths, giving a mortality rate of 1.6 per 100,000 population (Schmertmann et al, 2004). The lifetime cost
of fatal and non-fatal interpersonal violence in NSW has been estimated at $133.9 million—$21.9 million
in direct costs and $112 million in mortality and morbidity costs (Potter-Forbes & Aisbett, 2003).
Interpersonal violence hospitalisation data were used to describe the profile of hospitalisation for NSW
residents. Hospitalisation data from 1999–2000 to 2003–2004 were used for the majority of analyses,
except for the trend analyses, which used data from 1989–1990 to 2003–2004.
Injury due to interpersonal violence was the sixth leading cause of injury hospitalisation for the period
1999–2000 to 2003–2004, and accounted for 5.9% of all injury hospitalisations (Table 3). During this
period, there were 29,701 hospitalisations due to interpersonal violence, at a rate of 90.8 per 100,000
population. There were approximately 5,940 hospitalisations per year during 1999–2000 to 2003–2004
due to interpersonal violence.
Rates of hospitalisation for interpersonal violence were almost three times higher in males than females
for the period 1989–1990 to 2003–2004 (Figure 13). The hospitalisation rate was estimated to have
increased significantly by 0.9% per year for males (95% confidence interval for the increase: 0.3% to
1.5%), and increased significantly by 2.7% per year (95% confidence interval for the increase: 1.9% to
3.5%) for females.
INTERPERSONAL vIOLENCE

34 / NSW INJURY PROFILE: A REvIEW OF INJURY HOSPITALISATIONS DURINg 1989–1990 TO 2003–2004
Figure 13. Hospitalisation rate for injury due to interpersonal violence by sex, NSW 1989–1990 to 2003–2004
Rates of hospitalisation for interpersonal violence were higher in males than females for all age groups
during 1999–2000 to 2003–2004 (Figure 14). Males aged 20–24 years had the highest hospitalisation
rates for injuries due to interpersonal violence.
Figure 14. Age-specific hospitalisation rate for interpersonal violence by sex, NSW, 1999–2000 to 2003–2004
Interpersonal violence using bodily force accounted for just over half (58.0%) of the hospitalisations
due to interpersonal violence (Table 14). For males, bodily force represented over three-quarters of the
hospitalisations for interpersonal violence. The overall hospitalisation rate for males was about 266%
higher than for females.
37
Figure 15. Hospitalisation rate for injury due to interpersonal violence by sex, NSW 1989–1990 to 2003–2004
050
100
150
Year
Rat
e pe
r 100
,000
89-90 90-91 91-92 92-93 93-94 94-95 95-96 96-97 97-98 98-99 99-00 00-01 01-02 02-03 03-04
Males Females
Rates of hospitalisation for interpersonal violence were higher in males than females for all age groups during 1999–2000 to 2003–2004 (Error! Reference source not found.). Males aged 20–24 years had the highest hospitalisation rates for injuries due to interpersonal violence.
Figure 16. Age-specific hospitalisation rate for interpersonal violence by sex, NSW, 1999–2000 to 2003–2004
010
020
030
040
0
Age-group (years)
Rat
e pe
r 100
,000
0-4 5-9 10-14 15-19 20-24 25-29 30-34 35-39 40-44 45-49 50-54 55-59 60-64 65-69 70-74 75-79 80-84 85+
Males Females

/ 35INTERPERSONAL vIOLENCE
Table 15 shows the number of hospitalisations by age group and method used for the period 1999–2000
to 2003–2004. In all age groups, bodily force was the most common method of interpersonal violence
that caused hospitalisation.
Table 14. Injury hospitalisations by interpersonal violence method, NSW, number, rate and CI, 1999–2000 to 2003–2004
1 Age-adjusted rate per 100,000 population.
2 95% confidence interval.
3 The number of NSW residents hospitalised interstate during 2003–2004 was imputed and as a result the sum of submechanisms may not equal the total.
summAry
Injury due to interpersonal violence was the sixth leading cause of hospitalisation due to injury
involving NSW residents between 1999–2000 and 2003–2004, accounting for 5.9% of all injury-related
hospitalisations. The yearly hospitalisation rate for interpersonal violence-related injuries was estimated
to significantly increase by 0.9% per year for males and 2.7% per year for females during 1989–1990
to 2003–2004.
In 2003–2004, there were 5,500 hospitalisations of NSW residents following interpersonal violence,
giving a hospitalisation rate of 82.9 per 100,000 population. More than four-fifths of those hospitalised
following an injury due to interpersonal violence (80.5%) were aged 15-44 years.
Bodily force and sharp or blunt objects were the two most common methods of interpersonal violence
that led to a hospitalisation. Males had higher hospitalisation rates for all types of interpersonal violence
than females, except for poisoning and suffocation. The overall hospitalisation rate for males was about
266% higher than for females.
35
represented over three-quarters of the hospitalisations for interpersonal violence. The overall hospitalisation rate for males was about 266% higher than for females.
Table 15 shows the number of hospitalisations by age group and method used for the period 1999–2000 to 2003–2004. In all age groups, bodily force was the most common method of interpersonal violence that caused hospitalisation.
Table 14. Injury hospitalisations by interpersonal violence method, NSW, number, rate and CI, 1999–2000 to 2003–2004
All Persons Male Female IPV method N Rate1 95%CI2 N Rate1 95%CI2 N Rate1 95%CI2
Bodily force 17,238 52.7 (51.9,53.5) 13,000 79.1 (77.7,80.4) 4,239 26.0 (25.2,26.8)
Sharp or blunt object 6,830 20.9 (20.4,21.4) 5,870 35.7 (34.8,36.7) 960 5.9 (5.5,6.3)
Firearm 308 0.9 (0.8,1.1) 286 1.7 (1.5,1.9) 22 0.1 (0.1,0.2)
Poisoning 113 0.3 (0.3,0.4) 54 0.3 (0.2,0.4) 59 0.4 (0.3,0.5)
Suffocation 39 0.1 (0.1,0.2) 15 0.1 (0.1,0.1) 24 0.1 (0.1,0.2)
Other 5,172 15.8 (15.4,16.2) 4,132 25.1 (24.4,25.9) 1,039 6.3 (5.9,6.7)
All3 29,701 90.8 (89.8,91.8) 23,356 142.1 (140.3,143.9) 6,343 38.8 (37.8,39.8)
1 Age-adjusted rate per 100,000 population. 2 95% confidence interval. 3 The number of NSW residents hospitalised interstate during 2003–2004 was imputed and as a result
the sum of submechanisms may not equal the total.
SummaryInjury due to interpersonal violence was the sixth leading cause of hospitalisation due to injury involving NSW residents between 1999–2000 and 2003–2004, accounting for 5.9% of all injury-related hospitalisations. The yearly hospitalisation rate for interpersonal violence-related injuries was estimated to significantly increase by 0.9% per year for males and 2.7% per year for females during 1989–1990 to 2003–2004.
In 2003–2004, there were 5,500 hospitalisations of NSW residents following interpersonal violence, giving a hospitalisation rate of 82.9 per 100,000 population. More than four-fifths of those hospitalised following an injury due to interpersonal violence (80.5%) were aged 15-44 years.
Bodily force and sharp or blunt objects were the two most common methods of interpersonal violence that led to a hospitalisation. Males had higher hospitalisation rates for all types of interpersonal violence than females, except for poisoning and suffocation. The overall hospitalisation rate for males was about 266% higher than for females.

36 / NSW INJURY PROFILE: A REvIEW OF INJURY HOSPITALISATIONS DURINg 1989–1990 TO 2003–200439
Tab
le 1
5. N
umbe
r of
hos
pita
lisat
ions
for
inte
rper
sona
l vio
lenc
e1 b
y ag
e gr
oup
and
caus
e, N
SW, 1
999–
2000
to
2003
–200
4
Age
grou
p
Ran
k 0-
4 5–
9 10
–14
15–2
4 25
–34
35–4
4 45
–54
55–6
4 65
+ To
tal
1Bo
dily
forc
e 41
0 Bo
dily
forc
e 10
7 Bo
dily
forc
e 45
7 Bo
dily
forc
e 5,
790
Bodi
ly fo
rce
4,89
8 Bo
dily
forc
e 3,
271
Bodi
ly fo
rce
1,47
5 Bo
dily
forc
e 48
3 Bo
dily
forc
e 34
8 Bo
dily
forc
e 17
,238
2
Shar
p or
blu
nt
obje
ct
11
Shar
p or
blu
nt
obje
ct
22
Shar
p or
blu
nt
obje
ct
72
Shar
p or
blu
nt
obje
ct
2,22
8
Shar
p or
blu
nt
obje
ct
2,14
6
Shar
p or
blu
nt
obje
ct
1,42
7
Shar
p or
blu
nt
obje
ct
612
Shar
p or
blu
nt
obje
ct
188
Shar
p or
blu
nt
obje
ct
122
Shar
p or
blu
nt
obje
ct
6,83
0 3
Pois
onin
g 5
Fire
arm
#Su
ffoca
tion
#Fi
rear
m14
2 Fi
rear
m81
Fire
arm
51Fi
rear
m18
Fire
arm
9Po
ison
ing
#Fi
rear
m30
8 4
Suffo
catio
n#
Pois
onin
g #
Pois
onin
g #
Pois
onin
g 45
Pois
onin
g 25
Pois
onin
g 15
Pois
onin
g 12
Pois
onin
g #
Fire
arm
#Po
ison
ing
113
5
Suffo
catio
n #
Fire
arm
#Su
ffoca
tion
7Su
ffoca
tion
11Su
ffoca
tion
7Su
ffoca
tion
#Su
ffoca
tion
#Su
ffoca
tion
#Su
ffoca
tion
39O
ther
86O
ther
20O
ther
77O
ther
1,50
7 O
ther
1,54
5 O
ther
1,07
5 O
ther
499
Oth
er20
4 O
ther
160
Oth
er5,
172
1#
Cell
size
s re
pres
ent f
ewer
than
five
hos
pita
lisat
ions
or d
ata
have
bee
n re
mov
ed to
pre
vent
iden
tific
atio
n of
cel
l size
s le
ss th
an fi
ve.
39
Tab
le 1
5. N
umbe
r of
hos
pita
lisat
ions
for
inte
rper
sona
l vio
lenc
e1 b
y ag
e gr
oup
and
caus
e, N
SW, 1
999–
2000
to
2003
–200
4
Age
grou
p
Ran
k 0-
4 5–
9 10
–14
15–2
4 25
–34
35–4
4 45
–54
55–6
4 65
+ To
tal
1Bo
dily
forc
e 41
0 Bo
dily
forc
e 10
7 Bo
dily
forc
e 45
7 Bo
dily
forc
e 5,
790
Bodi
ly fo
rce
4,89
8 Bo
dily
forc
e 3,
271
Bodi
ly fo
rce
1,47
5 Bo
dily
forc
e 48
3 Bo
dily
forc
e 34
8 Bo
dily
forc
e 17
,238
2
Shar
p or
blu
nt
obje
ct
11
Shar
p or
blu
nt
obje
ct
22
Shar
p or
blu
nt
obje
ct
72
Shar
p or
blu
nt
obje
ct
2,22
8
Shar
p or
blu
nt
obje
ct
2,14
6
Shar
p or
blu
nt
obje
ct
1,42
7
Shar
p or
blu
nt
obje
ct
612
Shar
p or
blu
nt
obje
ct
188
Shar
p or
blu
nt
obje
ct
122
Shar
p or
blu
nt
obje
ct
6,83
0 3
Pois
onin
g 5
Fire
arm
#Su
ffoca
tion
#Fi
rear
m14
2 Fi
rear
m81
Fire
arm
51Fi
rear
m18
Fire
arm
9Po
ison
ing
#Fi
rear
m30
8 4
Suffo
catio
n#
Pois
onin
g #
Pois
onin
g #
Pois
onin
g 45
Pois
onin
g 25
Pois
onin
g 15
Pois
onin
g 12
Pois
onin
g #
Fire
arm
#Po
ison
ing
113
5
Suffo
catio
n #
Fire
arm
#Su
ffoca
tion
7Su
ffoca
tion
11Su
ffoca
tion
7Su
ffoca
tion
#Su
ffoca
tion
#Su
ffoca
tion
#Su
ffoca
tion
39O
ther
86O
ther
20O
ther
77O
ther
1,50
7 O
ther
1,54
5 O
ther
1,07
5 O
ther
499
Oth
er20
4 O
ther
160
Oth
er5,
172
1#
Cell
size
s re
pres
ent f
ewer
than
five
hos
pita
lisat
ions
or d
ata
have
bee
n re
mov
ed to
pre
vent
iden
tific
atio
n of
cel
l size
s le
ss th
an fi
ve.
/ 37
10. Poisoning
This section describes hospitalisations due to unintentional poisoning. WHO classifies the cause of
poisoning hospitalisations by the substance that caused the poisoning (WHO, 1977; WHO, 1992). These
substances include narcotics and hallucinogens, other pharmaceuticals, antidepressants, gases and
vapours, alcohol and other and unspecified substances. A poisoning event can also be intentional. A
self-inflicted poisoning is classified as self-harm, and a poisoning inflicted on one person by another is
classified as interpersonal violence. Hospitalisations due to intentional poisoning are covered in other
sections of this report (see Section 7 on self-harm and Section 9 on interpersonal violence).
In NSW, poisoning was the third leading cause of death in NSW during 1998-2002, with 1,118 deaths,
giving a mortality rate of 3.4 per 100,000 population (Schmertmann et al, 2004). The lifetime cost of
fatal and non-fatal poisoning in NSW has been estimated at $245 million—$13.2 million in direct costs
and $232 million in mortality and morbidity costs (Potter-Forbes & Aisbett, 2003).
Poisoning-related hospitalisation data from 1989–1990 to 2003–2004 were used to describe the profile
of poisoning-related hospitalisations of NSW residents. Hospitalisation data from 1999–2000 to 2003–
2004 were used in the majority of the analyses, except for the trend analyses, which used data from
1989–1990 to 2003–2004.
Poisoning was the seventh leading cause of injury hospitalisation for the period 1999–2000 to 2003–
2004, and accounted for 3.3% of all injury-related hospitalisations. During these years, there were
16,828 hospitalisations due to poisoning, at a rate of 51.2 per 100,000 population (Table 3). There were
approximately 3,365 hospitalisations per year due to poisoning during 1999–2000 to 2003–2004.
The age-adjusted hospitalisation rate for poisoning for both females and males decreased from 101.0
and 82.9 per 100,000 population respectively in 1991-92 to 46.7 and 48.8 per 100,000 population
respectively in 2003–2004 (Figure 15). The hospitalisation rate for both males and females decreased
significantly during 1989–1990 to 2003–2004. For males, the rate decreased by 3.0% per year (95%
confidence interval for the decrease: 2.4% to 3.6%) and for females the rate decreased by 5.2% per year
(95% confidence interval for the decrease: 4.6% to 5.7%).
POISONINg

38 / NSW INJURY PROFILE: A REvIEW OF INJURY HOSPITALISATIONS DURINg 1989–1990 TO 2003–2004
Figure 15. Hospitalisation rate for injury due to poisoning by sex, NSW 1989–1990 to 2003–2004
Young children aged 0-4 years had the highest rate of poisoning-related hospitalisation at 147.3 per
100,000 population during 1999–2000 to 2003–2004. Individuals aged 20–24 years had the second
highest rate of hospitalisation (86.0 per 100,000 population) during this same time period (Figure 16).
Figure 16. Age-specific hospitalisation rate for poisoning by sex, NSW, 1999–2000 to 2003–2004
The hospitalisation rate was slightly higher in males (53.3 per 100,000 population) than for females
(49.0 per 100,000 population), with males accounting for 52% of poisoning-related hospitalisations
during 1999–2000 to 2003–2004 (Table 16).
Other pharmaceuticals (31.3%) and anti-depressants, barbiturates and tranquilizers (30.0%) were the
two substances that accounted for almost two-thirds of the poisoning-related hospitalisations during
1999–2000 to 2003–2004.
41
Figure 17. Hospitalisation rate for injury due to poisoning by sex, NSW 1989–1990 to 2003–2004 0
2040
6080
100
Year
Rat
e pe
r 100
,000
89-90 90-91 91-92 92-93 93-94 94-95 95-96 96-97 97-98 98-99 99-00 00-01 01-02 02-03 03-04
Males Females
Young children aged 0-4 years had the highest rate of poisoning-related hospitalisation at 147.3 per 100,000 population during 1999–2000 to 2003–2004. Individuals aged 20–24 years had the second highest rate of hospitalisation (86.0 per 100,000 population) during this same time period (Error! Reference source not found.).
Figure 18. Age-specific hospitalisation rate for poisoning by sex, NSW, 1999–2000 to 2003–2004
050
100
150
Age-group (years)
Rat
e pe
r 100
,000
0-4 5-9 10-14 15-19 20-24 25-29 30-34 35-39 40-44 45-49 50-54 55-59 60-64 65-69 70-74 75-79 80-84 85+
Males Females
41
Figure 17. Hospitalisation rate for injury due to poisoning by sex, NSW 1989–1990 to 2003–2004
020
4060
8010
0
Year
Rat
e pe
r 100
,000
89-90 90-91 91-92 92-93 93-94 94-95 95-96 96-97 97-98 98-99 99-00 00-01 01-02 02-03 03-04
Males Females
Young children aged 0-4 years had the highest rate of poisoning-related hospitalisation at 147.3 per 100,000 population during 1999–2000 to 2003–2004. Individuals aged 20–24 years had the second highest rate of hospitalisation (86.0 per 100,000 population) during this same time period (Error! Reference source not found.).
Figure 18. Age-specific hospitalisation rate for poisoning by sex, NSW, 1999–2000 to 2003–2004
050
100
150
Age-group (years)
Rat
e pe
r 100
,000
0-4 5-9 10-14 15-19 20-24 25-29 30-34 35-39 40-44 45-49 50-54 55-59 60-64 65-69 70-74 75-79 80-84 85+
Males Females
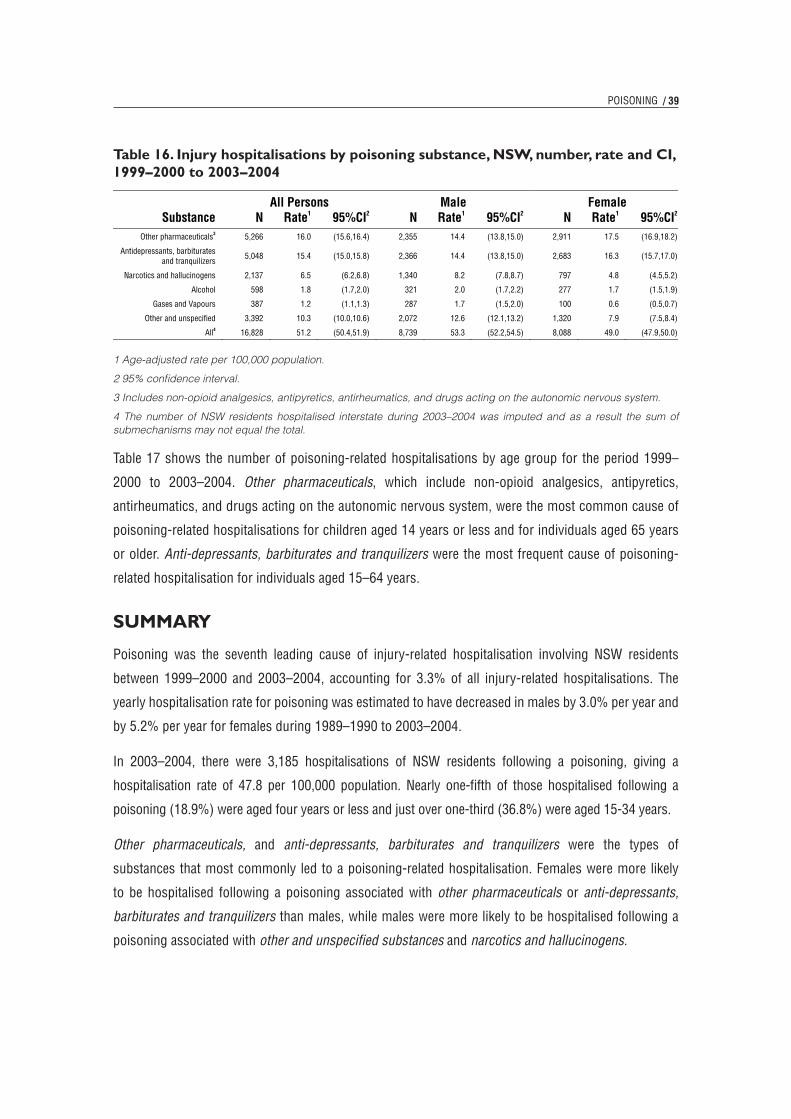
/ 39POISONINg
Table 16. Injury hospitalisations by poisoning substance, NSW, number, rate and CI, 1999–2000 to 2003–2004
1 Age-adjusted rate per 100,000 population.
2 95% confidence interval.
3 Includes non-opioid analgesics, antipyretics, antirheumatics, and drugs acting on the autonomic nervous system.
4 The number of NSW residents hospitalised interstate during 2003–2004 was imputed and as a result the sum of submechanisms may not equal the total.
Table 17 shows the number of poisoning-related hospitalisations by age group for the period 1999–
2000 to 2003–2004. Other pharmaceuticals, which include non-opioid analgesics, antipyretics,
antirheumatics, and drugs acting on the autonomic nervous system, were the most common cause of
poisoning-related hospitalisations for children aged 14 years or less and for individuals aged 65 years
or older. Anti-depressants, barbiturates and tranquilizers were the most frequent cause of poisoning-
related hospitalisation for individuals aged 15–64 years.
summAry
Poisoning was the seventh leading cause of injury-related hospitalisation involving NSW residents
between 1999–2000 and 2003–2004, accounting for 3.3% of all injury-related hospitalisations. The
yearly hospitalisation rate for poisoning was estimated to have decreased in males by 3.0% per year and
by 5.2% per year for females during 1989–1990 to 2003–2004.
In 2003–2004, there were 3,185 hospitalisations of NSW residents following a poisoning, giving a
hospitalisation rate of 47.8 per 100,000 population. Nearly one-fifth of those hospitalised following a
poisoning (18.9%) were aged four years or less and just over one-third (36.8%) were aged 15-34 years.
Other pharmaceuticals, and anti-depressants, barbiturates and tranquilizers were the types of
substances that most commonly led to a poisoning-related hospitalisation. Females were more likely
to be hospitalised following a poisoning associated with other pharmaceuticals or anti-depressants,
barbiturates and tranquilizers than males, while males were more likely to be hospitalised following a
poisoning associated with other and unspecified substances and narcotics and hallucinogens.
39
The hospitalisation rate was slightly higher in males (53.3 per 100,000 population) than for females (49.0 per 100,000 population), with males accounting for 52% of poisoning-related hospitalisations during 1999–2000 to 2003–2004 (Table 16).
Other pharmaceuticals (31.3%) and anti-depressants, barbiturates and tranquilizers(30.0%) were the two substances that accounted for almost two-thirds of the poisoning-related hospitalisations during 1999–2000 to 2003–2004.
Table 16. Injury hospitalisations by poisoning substance, NSW, number, rate and CI, 1999–2000 to 2003–2004
All Persons Male Female Substance N Rate1 95%CI2 N Rate1 95%CI2 N Rate1 95%CI2
Other pharmaceuticals3 5,266 16.0 (15.6,16.4) 2,355 14.4 (13.8,15.0) 2,911 17.5 (16.9,18.2)
Antidepressants, barbiturates and tranquilizers
5,048 15.4 (15.0,15.8) 2,366 14.4 (13.8,15.0) 2,683 16.3 (15.7,17.0)
Narcotics and hallucinogens 2,137 6.5 (6.2,6.8) 1,340 8.2 (7.8,8.7) 797 4.8 (4.5,5.2)
Alcohol 598 1.8 (1.7,2.0) 321 2.0 (1.7,2.2) 277 1.7 (1.5,1.9)
Gases and Vapours 387 1.2 (1.1,1.3) 287 1.7 (1.5,2.0) 100 0.6 (0.5,0.7)
Other and unspecified 3,392 10.3 (10.0,10.6) 2,072 12.6 (12.1,13.2) 1,320 7.9 (7.5,8.4)
All4 16,828 51.2 (50.4,51.9) 8,739 53.3 (52.2,54.5) 8,088 49.0 (47.9,50.0)
1 Age-adjusted rate per 100,000 population. 2 95% confidence interval. 3 Includes non-opioid analgesics, antipyretics, antirheumatics, and drugs acting on the autonomic
nervous system. 4 The number of NSW residents hospitalised interstate during 2003–2004 was imputed and as a result
the sum of submechanisms may not equal the total.
Table 17 shows the number of poisoning-related hospitalisations by age group for the period 1999–2000 to 2003–2004. Other pharmaceuticals, which include non-opioid analgesics, antipyretics, antirheumatics, and drugs acting on the autonomic nervous system, were the most common cause of poisoning-related hospitalisations for children aged 14 years or less and for individuals aged 65 years or older. Anti-depressants, barbiturates and tranquilizers were the most frequent cause of poisoning-related hospitalisation for individuals aged 15–64 years.
SummaryPoisoning was the seventh leading cause of injury-related hospitalisation involving NSW residents between 1999–2000 and 2003–2004, accounting for 3.3% of all injury-related hospitalisations. The yearly hospitalisation rate for poisoning was estimated to have decreased in males by 3.0% per year and by 5.2% per year for females during 1989–1990 to 2003–2004.
In 2003–2004, there were 3,185 hospitalisations of NSW residents following a poisoning, giving a hospitalisation rate of 47.8 per 100,000 population. Nearly one-fifth of those hospitalised following a poisoning (18.9%) were aged four years or less and just over one-third (36.8%) were aged 15-34 years.
Other pharmaceuticals, and anti-depressants, barbiturates and tranquilizers were the types of substances that most commonly led to a poisoning-related hospitalisation. Females were more likely to be hospitalised following a poisoning associated with
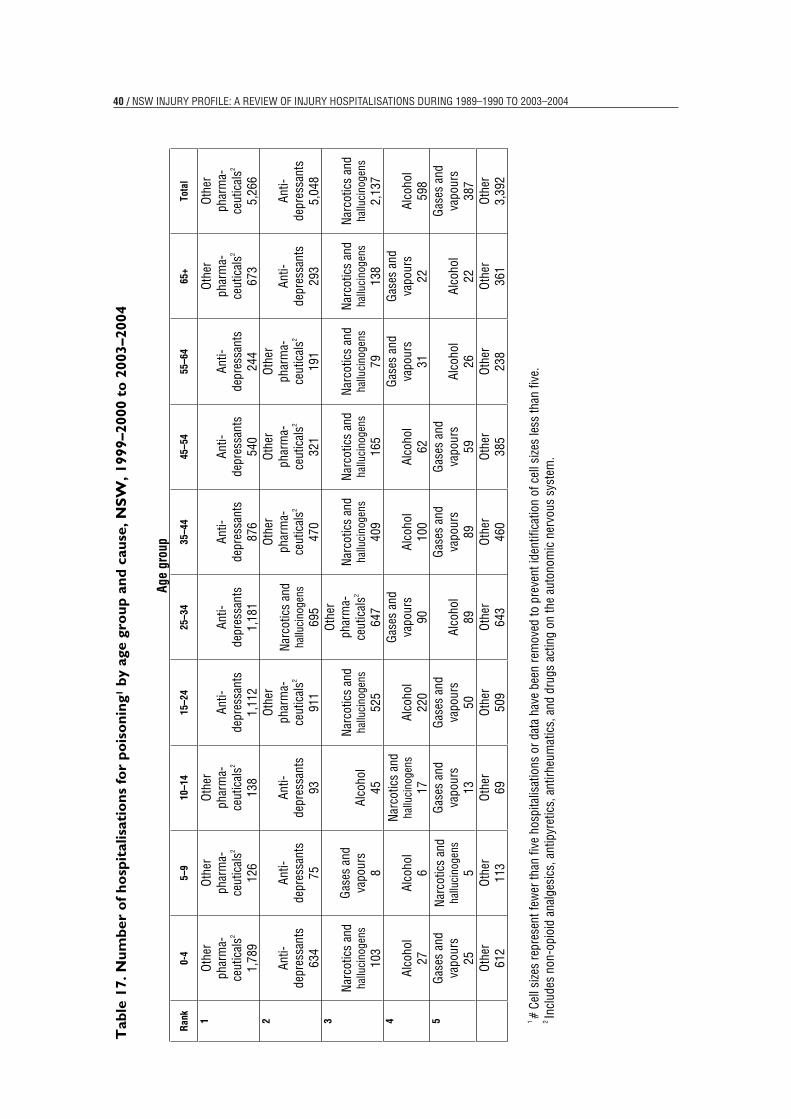
40 / NSW INJURY PROFILE: A REvIEW OF INJURY HOSPITALISATIONS DURINg 1989–1990 TO 2003–200444
Tab
le 1
7. N
umbe
r of
hos
pita
lisat
ions
for
pois
onin
g1 b
y ag
e gr
oup
and
caus
e, N
SW, 1
999–
2000
to
2003
–200
4
Age
grou
p
Ran
k 0-
4 5–
9 10
–14
15–2
4 25
–34
35–4
4 45
–54
55–6
4 65
+ To
tal
1O
ther
phar
ma-
ceut
ical
s2
1,78
9
Oth
erph
arm
a-ce
utic
als2
126
Oth
erph
arm
a-ce
utic
als2
138
Anti-
depr
essa
nts
1,11
2
Anti-
depr
essa
nts
1,18
1
Anti-
depr
essa
nts
876
Anti-
depr
essa
nts
540
Anti-
depr
essa
nts
244
Oth
erph
arm
a-
ceut
ical
s2
673
Oth
erph
arm
a-ce
utic
als2
5,26
6 2
Anti-
depr
essa
nts
634
Anti-
depr
essa
nts
75
Anti-
depr
essa
nts
93
Oth
erph
arm
a-ce
utic
als2
911
Nar
cotic
s an
d ha
lluci
noge
ns69
5
Oth
erph
arm
a-ce
utic
als2
470
Oth
erph
arm
a-ce
utic
als2
321
Oth
erph
arm
a-ce
utic
als2
191
Anti-
depr
essa
nts
293
Anti-
depr
essa
nts
5,04
8 3
Nar
cotic
s an
d ha
lluci
noge
ns10
3
Gas
es a
nd
vapo
urs
8Al
coho
l 45
Nar
cotic
s an
d ha
lluci
noge
ns52
5
Oth
erph
arm
a-ce
utic
als2
647
Nar
cotic
s an
d ha
lluci
noge
ns40
9
Nar
cotic
s an
d ha
lluci
noge
ns16
5
Nar
cotic
s an
d ha
lluci
noge
ns79
Nar
cotic
s an
d ha
lluci
noge
ns13
8
Nar
cotic
s an
d ha
lluci
noge
ns2,
137
4
Alco
hol
27Al
coho
l 6
Nar
cotic
s an
d ha
lluci
noge
ns17
Alco
hol
220
Gas
es a
nd
vapo
urs
90Al
coho
l 10
0 Al
coho
l 62
Gas
es a
nd
vapo
urs
31
Gas
es a
nd
vapo
urs
22Al
coho
l 59
8 5
Gas
es a
nd
vapo
urs
25
Nar
cotic
s an
d ha
lluci
noge
ns5
Gas
es a
nd
vapo
urs
13
Gas
es a
nd
vapo
urs
50Al
coho
l 89
Gas
es a
nd
vapo
urs
89
Gas
es a
nd
vapo
urs
59Al
coho
l 26
Alco
hol
22
Gas
es a
nd
vapo
urs
387
Oth
er61
2 O
ther
113
Oth
er69
Oth
er50
9 O
ther
643
Oth
er46
0 O
ther
385
Oth
er23
8 O
ther
361
Oth
er3,
392
1#
Cell
size
s re
pres
ent f
ewer
than
five
hos
pita
lisat
ions
or d
ata
have
bee
n re
mov
ed to
pre
vent
iden
tific
atio
n of
cel
l size
s le
ss th
an fi
ve.
2In
clud
es n
on-o
pioi
d an
alge
sics
, ant
ipyr
etic
s, a
ntirh
eum
atic
s, a
nd d
rugs
act
ing
on th
e au
tono
mic
ner
vous
sys
tem
.
44
Tab
le 1
7. N
umbe
r of
hos
pita
lisat
ions
for
pois
onin
g1 b
y ag
e gr
oup
and
caus
e, N
SW, 1
999–
2000
to
2003
–200
4
Age
grou
p
Ran
k 0-
4 5–
9 10
–14
15–2
4 25
–34
35–4
4 45
–54
55–6
4 65
+ To
tal
1O
ther
phar
ma-
ceut
ical
s2
1,78
9
Oth
erph
arm
a-ce
utic
als2
126
Oth
erph
arm
a-ce
utic
als2
138
Anti-
depr
essa
nts
1,11
2
Anti-
depr
essa
nts
1,18
1
Anti-
depr
essa
nts
876
Anti-
depr
essa
nts
540
Anti-
depr
essa
nts
244
Oth
erph
arm
a-
ceut
ical
s2
673
Oth
erph
arm
a-ce
utic
als2
5,26
6 2
Anti-
depr
essa
nts
634
Anti-
depr
essa
nts
75
Anti-
depr
essa
nts
93
Oth
erph
arm
a-ce
utic
als2
911
Nar
cotic
s an
d ha
lluci
noge
ns69
5
Oth
erph
arm
a-ce
utic
als2
470
Oth
erph
arm
a-ce
utic
als2
321
Oth
erph
arm
a-ce
utic
als2
191
Anti-
depr
essa
nts
293
Anti-
depr
essa
nts
5,04
8 3
Nar
cotic
s an
d ha
lluci
noge
ns10
3
Gas
es a
nd
vapo
urs
8Al
coho
l 45
Nar
cotic
s an
d ha
lluci
noge
ns52
5
Oth
erph
arm
a-ce
utic
als2
647
Nar
cotic
s an
d ha
lluci
noge
ns40
9
Nar
cotic
s an
d ha
lluci
noge
ns16
5
Nar
cotic
s an
d ha
lluci
noge
ns79
Nar
cotic
s an
d ha
lluci
noge
ns13
8
Nar
cotic
s an
d ha
lluci
noge
ns2,
137
4
Alco
hol
27Al
coho
l 6
Nar
cotic
s an
d ha
lluci
noge
ns17
Alco
hol
220
Gas
es a
nd
vapo
urs
90Al
coho
l 10
0 Al
coho
l 62
Gas
es a
nd
vapo
urs
31
Gas
es a
nd
vapo
urs
22Al
coho
l 59
8 5
Gas
es a
nd
vapo
urs
25
Nar
cotic
s an
d ha
lluci
noge
ns5
Gas
es a
nd
vapo
urs
13
Gas
es a
nd
vapo
urs
50Al
coho
l 89
Gas
es a
nd
vapo
urs
89
Gas
es a
nd
vapo
urs
59Al
coho
l 26
Alco
hol
22
Gas
es a
nd
vapo
urs
387
Oth
er61
2 O
ther
113
Oth
er69
Oth
er50
9 O
ther
643
Oth
er46
0 O
ther
385
Oth
er23
8 O
ther
361
Oth
er3,
392
1#
Cell
size
s re
pres
ent f
ewer
than
five
hos
pita
lisat
ions
or d
ata
have
bee
n re
mov
ed to
pre
vent
iden
tific
atio
n of
cel
l size
s le
ss th
an fi
ve.
2In
clud
es n
on-o
pioi
d an
alge
sics
, ant
ipyr
etic
s, a
ntirh
eum
atic
s, a
nd d
rugs
act
ing
on th
e au
tono
mic
ner
vous
sys
tem
.

/ 41
11. Non-motor vehicle road transport
This section describes hospitalisations due to non-motor vehicle road transport-related injuries. Non-
motor vehicle road transport-related injuries include incidents involving pedestrians, pedal cyclists, and
animal riders (WHO, 1977; WHO, 1992). For example, an incident in which a pedestrian is injured in
a collision with a pedal cyclist is included in this section; incidents involving injuries to pedestrians
caused by collisions with motor vehicles are covered in Section 5 on motor vehicle transport. Animal
riders or pedal cyclists who are injured in incidents that do not involve motor vehicles are included in
this section.
Hospitalisation data for non-motor vehicle road transport-related injuries were used to describe the
profile of non-motor vehicle road transport-related injuries involving NSW residents. Hospitalisation
data during 1999–2000 to 2003–2004 were used for the majority of the analyses, except for the trend
analyses, which used data from 1989–1990 to 2003–2004.
Non-motor vehicle road transport-related injuries were the eighth leading cause of injury-related
hospitalisation in the period 1999–2000 to 2003–2004, and accounted for 3.0% of all injury-related
hospitalisations (Table 3). During this period, there were 15,177 hospitalisations for non-motor vehicle
road transport-related injuries, at a rate of 46.6 per 100,000 population.
Age-adjusted hospitalisation rates were higher in males than females in all years between 1989–1990
and 2003–2004 (Figure 17). There was no change in the hospitalisation rate for males between 1989–
1990 and 2003–2004, but for females the rate decreased significantly by 1.7% per year (95% confidence
interval for the decrease: 1.1% to 2.2%).
NON-MOTOR vEHICLE ROAD TRANSPORT
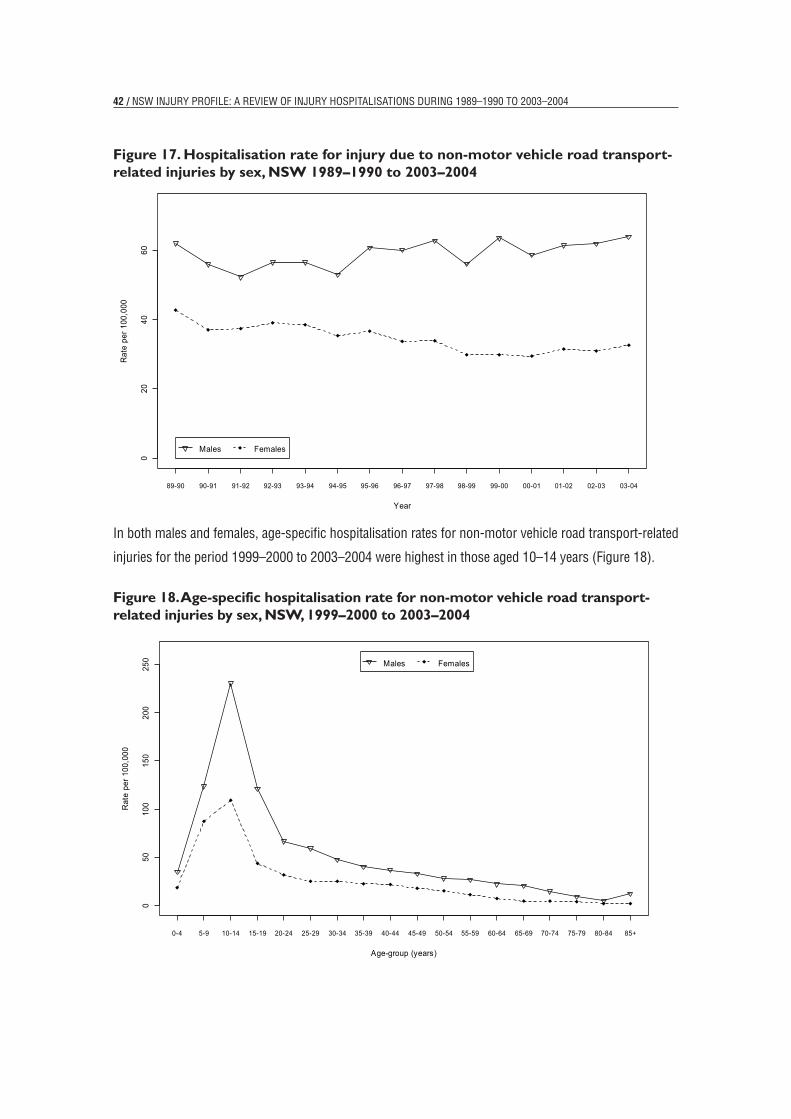
42 / NSW INJURY PROFILE: A REvIEW OF INJURY HOSPITALISATIONS DURINg 1989–1990 TO 2003–2004
Figure 17. Hospitalisation rate for injury due to non-motor vehicle road transport-related injuries by sex, NSW 1989–1990 to 2003–2004
In both males and females, age-specific hospitalisation rates for non-motor vehicle road transport-related
injuries for the period 1999–2000 to 2003–2004 were highest in those aged 10–14 years (Figure 18).
Figure 18. Age-specific hospitalisation rate for non-motor vehicle road transport-related injuries by sex, NSW, 1999–2000 to 2003–2004
46
Figure 19. Hospitalisation rate for injury due to non-motor vehicle road transport-related injuries by sex, NSW 1989–1990 to 2003–2004
020
4060
Year
Rat
e pe
r 100
,000
89-90 90-91 91-92 92-93 93-94 94-95 95-96 96-97 97-98 98-99 99-00 00-01 01-02 02-03 03-04
Males Females
In both males and females, age-specific hospitalisation rates for non-motor vehicle road transport-related injuries for the period 1999–2000 to 2003–2004 were highest in those aged 10–14 years (Error! Reference source not found.).
Figure 20. Age-specific hospitalisation rate for non-motor vehicle road transport-related injuries by sex, NSW, 1999–2000 to 2003–2004
050
100
150
200
250
Age-group (years)
Rat
e pe
r 100
,000
0-4 5-9 10-14 15-19 20-24 25-29 30-34 35-39 40-44 45-49 50-54 55-59 60-64 65-69 70-74 75-79 80-84 85+
Males Females

/ 43
Injuries to pedal cyclists accounted for almost two-thirds (65.0%) of injury-related hospitalisations by
non-motor vehicle road transport-related causes for the period 1999–2000 to 2003–2004, and rates
for males were about four times higher than rates for females (Table 18). Injuries to animal riders were
the second most common cause of non-motor vehicle road transport-related injury hospitalisation, and
these injuries were more common in females than in males. Overall, the hospitalisation rate was about
100% higher for males than for females.
Table 18. Injury hospitalisations by non-motor vehicle road transport-related cause, NSW, number, rate and CI, 1999–2000 to 2003–2004
1 Age-adjusted rate per 100,000 population.
2 95% confidence interval.
3 The number of NSW residents hospitalised interstate during 2003–2004 was imputed and as a result the sum of submechanisms may not equal the total.
Table 19 shows the number of hospitalisations due to non-motor vehicle road transport-related injuries
by age group for the period 1999–2000 to 2003–2004. Injuries to pedal cyclists were the most common
non-motor vehicle road transport-related hospitalisation in those aged 1–44 years and 65 years or
older.
summAry
Non-motor vehicle road transport-related injuries were the eighth leading cause of hospitalisation due
to injury involving NSW residents between 1999–2000 and 2003–2004, accounting for 3.0% of all
injury-related hospitalisations. The yearly hospitalisation rate for non-motor vehicle road transport-
related injuries was estimated to have decreased by 1.7% per year for females during 1989–1990 to
2003–2004.
In 2003–2004, there were 3,195 hospitalisations of NSW residents following non-motor vehicle road
transport-related incidents, giving a hospitalisation rate of 48.4 per 100,000 population. More than
two-fifths (43.4%) of those hospitalised as a result of an other transport-related injury were aged 5–19
years.
Pedal cyclists and animal riders were the types of non-motor vehicle transport-related incidents that had
the highest hospitalisation rates. Males had higher rates of hospitalisation for cycling-related injuries,
while females had higher rates of hospitalisation for injuries related to incidents as an animal rider (e.g.
equestrian). The overall hospitalisation rate was about 100% higher for males than for females.
NON-MOTOR vEHICLE ROAD TRANSPORT44
Injuries to pedal cyclists accounted for almost two-thirds (65.0%) of injury-related hospitalisations by non-motor vehicle road transport-related causes for the period 1999–2000 to 2003–2004, and rates for males were about four times higher than rates for females (Table 18). Injuries to animal riders were the second most common cause of non-motor vehicle road transport-related injury hospitalisation, and these injuries were more common in females than in males. Overall, the hospitalisation rate was about 100% higher for males than for females.
Table 18. Injury hospitalisations by non-motor vehicle road transport-related cause, NSW, number, rate and CI, 1999–2000 to 2003–2004
All Persons Male Female Cause N Rate1 95%CI2 N Rate1 95%CI2 N Rate1 95%CI2
Pedal cyclist 10,026 30.8 (30.2,31.4) 8,032 48.6 (47.5,49.7) 1,994 12.5 (11.9,13.0)
Animal rider 4,556 13.9 (13.5,14.4) 1,811 11.0 (10.5,11.5) 2,745 17.1 (16.4,17.7)
Pedestrian 595 1.8 (1.7,2.0) 373 2.3 (2.1,2.5) 222 1.3 (1.2,1.5)
All3 15,177 46.6 (45.8,47.3) 10,216 61.9 (60.7,63.1) 4,961 30.9 (30.0,31.8)
1 Age-adjusted rate per 100,000 population. 2 95% confidence interval. 3 The number of NSW residents hospitalised interstate during 2003–2004 was imputed and as a result
the sum of submechanisms may not equal the total.
Table 19 shows the number of hospitalisations due to non-motor vehicle road transport-related injuries by age group for the period 1999–2000 to 2003–2004. Injuries to pedal cyclists were the most common non-motor vehicle road transport-related hospitalisation in those aged 1–44 years and 65 years or older.
SummaryNon-motor vehicle road transport-related injuries were the eighth leading cause of hospitalisation due to injury involving NSW residents between 1999–2000 and 2003–2004, accounting for 3.0% of all injury-related hospitalisations. The yearly hospitalisation rate for non-motor vehicle road transport-related injuries was estimated to have decreased by 1.7% per year for females during 1989–1990 to 2003–2004.
In 2003–2004, there were 3,195 hospitalisations of NSW residents following non-motor vehicle road transport-related incidents, giving a hospitalisation rate of 48.4 per 100,000 population. More than two-fifths (43.4%) of those hospitalised as a result of an other transport-related injury were aged 5–19 years.
Pedal cyclists and animal riders were the types of non-motor vehicle transport-related incidents that had the highest hospitalisation rates. Males had higher rates of hospitalisation for cycling-related injuries, while females had higher rates of hospitalisation for injuries related to incidents as an animal rider (e.g. equestrian). The overall hospitalisation rate was about 100% higher for males than for females.

44 / NSW INJURY PROFILE: A REvIEW OF INJURY HOSPITALISATIONS DURINg 1989–1990 TO 2003–2004
48
Tab
le19
. Num
ber
of h
ospi
talis
atio
ns fo
r no
n-m
otor
veh
icle
roa
d tr
ansp
ort-
rela
ted
inju
ries
1 by
age
grou
p an
d ca
use,
NSW
, 19
99–2
000
to 2
003–
2004
Age
grou
p
Ran
k 0-
4 5–
9 10
–14
15–2
4 25
–34
35–4
4 45
–54
55–6
4 65
+ To
tal
1Pe
dal c
yclis
t 45
1 Pe
dal c
yclis
t 1,
957
Peda
l cyc
list
3,00
0 Pe
dal c
yclis
t 1,
811
Peda
l cyc
list
1,10
9 Pe
dal c
yclis
t 77
2 Pe
dal c
yclis
t 51
9 An
imal
ride
r 25
9 Pe
dal c
yclis
t 15
1 Pe
dal c
yclis
t 10
,026
2
Anim
al ri
der
69An
imal
ride
r 37
4 An
imal
ride
r 81
7 An
imal
ride
r 1,
031
Anim
al ri
der
722
Anim
al ri
der
684
Anim
al ri
der
482
Peda
l cyc
list
256
Anim
al ri
der
118
Anim
al ri
der
4,55
6 3
Pede
stria
n 59
Pe
dest
rian
55
Pede
stria
n 62
Pe
dest
rian
105
Pede
stria
n 71
Pe
dest
rian
62
Pede
stria
n 50
Pe
dest
rian
43
Pede
stria
n 85
Pe
dest
rian
595
1#
Cell
size
s re
pres
ent f
ewer
than
five
hos
pita
lisat
ions
or d
ata
have
bee
n re
mov
ed to
pre
vent
iden
tific
atio
n of
cel
l size
s le
ss th
an fi
ve.
/ 45
12. Natural and environmental factors
This section describes injury hospitalisations due to natural and environmental factors. Natural and
environmental factors can contribute to injury-related hospitalisations in a number of ways, including:
excessive temperatures (i.e., very hot and very cold temperature), natural events (e.g. mudslides, floods)
and venomous plants or animals (WHO, 1977; WHO, 1992).
In NSW, natural and environmental factors were the twelfth leading cause of death in NSW during 1998-
2002, with 67 deaths, giving a mortality rate of 0.2 per 100,000 population (Schmertmann et al, 2004).
The lifetime cost of fatal and non-fatal injury associated with natural and environmental factors in NSW
has been estimated at $27.8 million—$13.7 million in direct costs and $14.2 million in mortality and
morbidity costs (Potter-Forbes & Aisbett, 2003).
Hospitalisation data for natural and environmental factor-related injuries were used to describe the profile
of natural and environmental factor-related injuries involving NSW residents. Hospitalisation data during
1999–2000 to 2003–2004 were used for the majority of the analyses, except for the trend analyses,
which used data from 1989–1990 to 2003–2004.
Natural and environmental factor-related injuries were the ninth leading cause of injury hospitalisation in
the period 1999–2000 to 2003–2004, and accounted for 2.7% of all injury-related hospitalisations (Table
3). During this period, there were 13,789 hospitalisations for natural and environmental factor-related
injuries, at a rate of 41.9 per 100,000 population. There were approximately 2,758 hospitalisations per
year due to natural and environmental factor-related injuries during 1999–2000 to 2003–2004.
The age-adjusted hospitalisation rate for natural and environmental factor-related injuries has been
gradually increasing from 34.2 per 100,000 population in 1989–1990 to 42.0 per 100,000 population
in 2003–2004. The hospitalisation rate for both males and females increased significantly during 1989–
1990 to 2003–2004 (Figure 19). For males the rate significantly increased by 1.1% per year (95%
confidence interval for the increase: 0.7% to 1.5%) and for females the rate increased significantly by
2.0% per year (95% confidence interval for the increase: 1.5% to 2.4%).
NATURAL AND ENvIRONMENTAL FACTORS

46 / NSW INJURY PROFILE: A REvIEW OF INJURY HOSPITALISATIONS DURINg 1989–1990 TO 2003–2004
Figure 19. Hospitalisation rate for injury due to natural and environmental factor-related injuries by sex, NSW 1989–1990 to 2003–2004
Children aged 0-4 and 5–9 years had the highest age-specific hospitalisation rates for natural and
environmental factor-related injuries for the period 1999–2000 to 2003–2004 at 62.8 per 100,000
population and 49.6 per 100,000 population, respectively (Figure 20).
Figure 20. Age-specific hospitalisation rate for natural and environmental factor-related injuries by sex, NSW, 1999–2000 to 2003–2004
50
Figure 21. Hospitalisation rate for injury due to natural and environmental factor-related injuries by sex, NSW 1989–1990 to 2003–2004
010
2030
4050
60
Year
Rat
e pe
r 100
,000
89-90 90-91 91-92 92-93 93-94 94-95 95-96 96-97 97-98 98-99 99-00 00-01 01-02 02-03 03-04
Males Females
Children aged 0-4 and 5–9 years had the highest age-specific hospitalisation rates for natural and environmental factor-related injuries for the period 1999–2000 to 2003–2004 at 62.8 per 100,000 population and 49.6 per 100,000 population, respectively (Error! Reference source not found.).
Figure 22. Age-specific hospitalisation rate for natural and environmental factor-related injuries by sex, NSW, 1999–2000 to 2003–2004
020
4060
80
Age-group (years)
Rat
e pe
r 100
,000
0-4 5-9 10-14 15-19 20-24 25-29 30-34 35-39 40-44 45-49 50-54 55-59 60-64 65-69 70-74 75-79 80-84 85+
Males Females
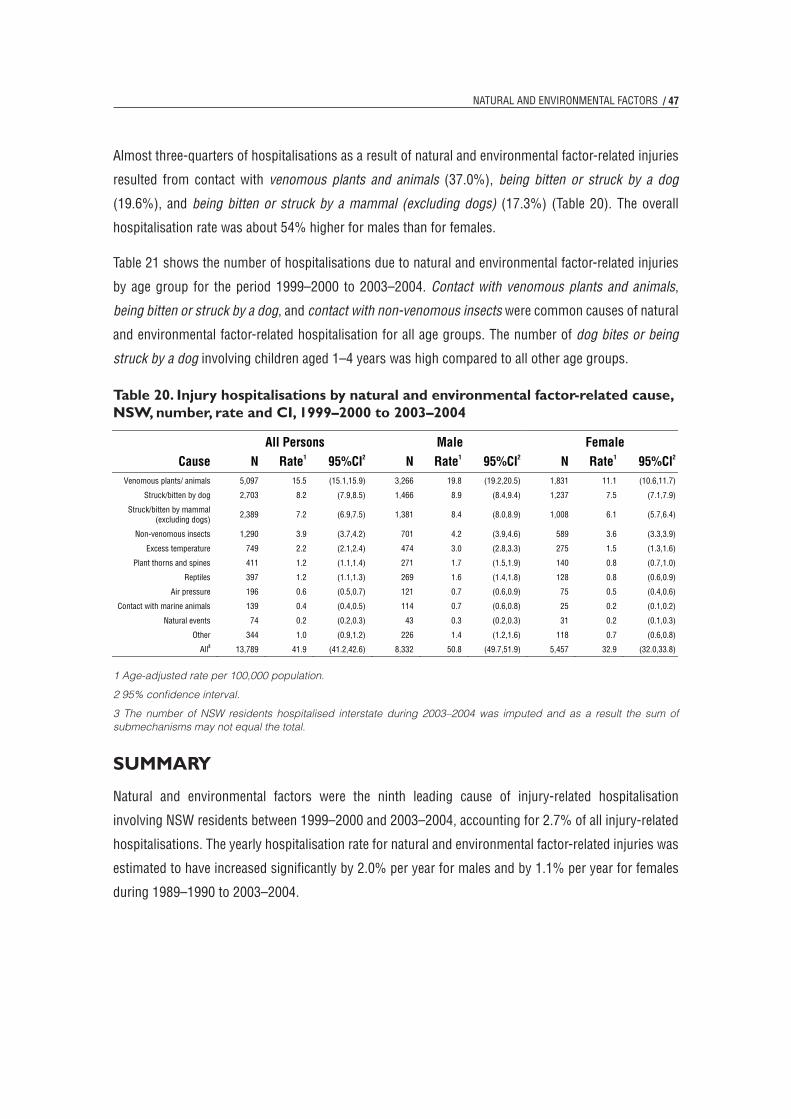
/ 47
Almost three-quarters of hospitalisations as a result of natural and environmental factor-related injuries
resulted from contact with venomous plants and animals (37.0%), being bitten or struck by a dog
(19.6%), and being bitten or struck by a mammal (excluding dogs) (17.3%) (Table 20). The overall
hospitalisation rate was about 54% higher for males than for females.
Table 21 shows the number of hospitalisations due to natural and environmental factor-related injuries
by age group for the period 1999–2000 to 2003–2004. Contact with venomous plants and animals,
being bitten or struck by a dog, and contact with non-venomous insects were common causes of natural
and environmental factor-related hospitalisation for all age groups. The number of dog bites or being
struck by a dog involving children aged 1–4 years was high compared to all other age groups.
Table 20. Injury hospitalisations by natural and environmental factor-related cause, NSW, number, rate and CI, 1999–2000 to 2003–2004
1 Age-adjusted rate per 100,000 population.
2 95% confidence interval.
3 The number of NSW residents hospitalised interstate during 2003–2004 was imputed and as a result the sum of submechanisms may not equal the total.
summAry
Natural and environmental factors were the ninth leading cause of injury-related hospitalisation
involving NSW residents between 1999–2000 and 2003–2004, accounting for 2.7% of all injury-related
hospitalisations. The yearly hospitalisation rate for natural and environmental factor-related injuries was
estimated to have increased significantly by 2.0% per year for males and by 1.1% per year for females
during 1989–1990 to 2003–2004.
NATURAL AND ENvIRONMENTAL FACTORS
48
Almost three-quarters of hospitalisations as a result of natural and environmental factor-related injuries resulted from contact with venomous plants and animals(37.0%), being bitten or struck by a dog (19.6%), and being bitten or struck by a mammal (excluding dogs) (17.3%) (Table 20). The overall hospitalisation rate was about 54% higher for males than for females.
Table 21 shows the number of hospitalisations due to natural and environmental factor-related injuries by age group for the period 1999–2000 to 2003–2004. Contact with venomous plants and animals, being bitten or struck by a dog, and contact with non-venomous insects were common causes of natural and environmental factor-related hospitalisation for all age groups. The number of dog bites or being struck by a dog involving children aged 1–4 years was high compared to all other age groups.
Table 20. Injury hospitalisations by natural and environmental factor-related cause, NSW, number, rate and CI, 1999–2000 to 2003–2004
All Persons Male Female Cause N Rate1 95%CI2 N Rate1 95%CI2 N Rate1 95%CI2
Venomous plants/ animals 5,097 15.5 (15.1,15.9) 3,266 19.8 (19.2,20.5) 1,831 11.1 (10.6,11.7)
Struck/bitten by dog 2,703 8.2 (7.9,8.5) 1,466 8.9 (8.4,9.4) 1,237 7.5 (7.1,7.9)
Struck/bitten by mammal (excluding dogs)
2,389 7.2 (6.9,7.5) 1,381 8.4 (8.0,8.9) 1,008 6.1 (5.7,6.4)
Non-venomous insects 1,290 3.9 (3.7,4.2) 701 4.2 (3.9,4.6) 589 3.6 (3.3,3.9)
Excess temperature 749 2.2 (2.1,2.4) 474 3.0 (2.8,3.3) 275 1.5 (1.3,1.6)
Plant thorns and spines 411 1.2 (1.1,1.4) 271 1.7 (1.5,1.9) 140 0.8 (0.7,1.0)
Reptiles 397 1.2 (1.1,1.3) 269 1.6 (1.4,1.8) 128 0.8 (0.6,0.9)
Air pressure 196 0.6 (0.5,0.7) 121 0.7 (0.6,0.9) 75 0.5 (0.4,0.6)
Contact with marine animals 139 0.4 (0.4,0.5) 114 0.7 (0.6,0.8) 25 0.2 (0.1,0.2)
Natural events 74 0.2 (0.2,0.3) 43 0.3 (0.2,0.3) 31 0.2 (0.1,0.3)
Other 344 1.0 (0.9,1.2) 226 1.4 (1.2,1.6) 118 0.7 (0.6,0.8)
All3 13,789 41.9 (41.2,42.6) 8,332 50.8 (49.7,51.9) 5,457 32.9 (32.0,33.8)
1 Age-adjusted rate per 100,000 population. 2 95% confidence interval. 3 The number of NSW residents hospitalised interstate during 2003–2004 was imputed and as a result
the sum of submechanisms may not equal the total.
SummaryNatural and environmental factors were the ninth leading cause of injury-related hospitalisation involving NSW residents between 1999–2000 and 2003–2004, accounting for 2.7% of all injury-related hospitalisations. The yearly hospitalisation rate for natural and environmental factor-related injuries was estimated to have increased significantly by 2.0% per year for males and by 1.1% per year for females during 1989–1990 to 2003–2004.
In 2003–2004, there were 2,818 hospitalisations of NSW residents after being injured due to natural and environmental factors, giving a hospitalisation rate of 42.0 per 100,000 population. Around one-quarter (23.1%) of those hospitalised following an injury due to natural and environmental factors were aged 15 years or less.
Venomous plants and animals, being bitten or struck by a dog and being bitten or struck by a mammal (excluding dogs) were the types of natural and environmental

48 / NSW INJURY PROFILE: A REvIEW OF INJURY HOSPITALISATIONS DURINg 1989–1990 TO 2003–2004
In 2003–2004, there were 2,818 hospitalisations of NSW residents after being injured due to natural and
environmental factors, giving a hospitalisation rate of 42.0 per 100,000 population. Around one-quarter
(23.1%) of those hospitalised following an injury due to natural and environmental factors were aged
15 years or less.
Venomous plants and animals, being bitten or struck by a dog and being bitten or struck by a mammal
(excluding dogs) were the types of natural and environmental factors that had the highest hospitalisation
rates. The overall hospitalisation rate was about 54% higher for males than for females.
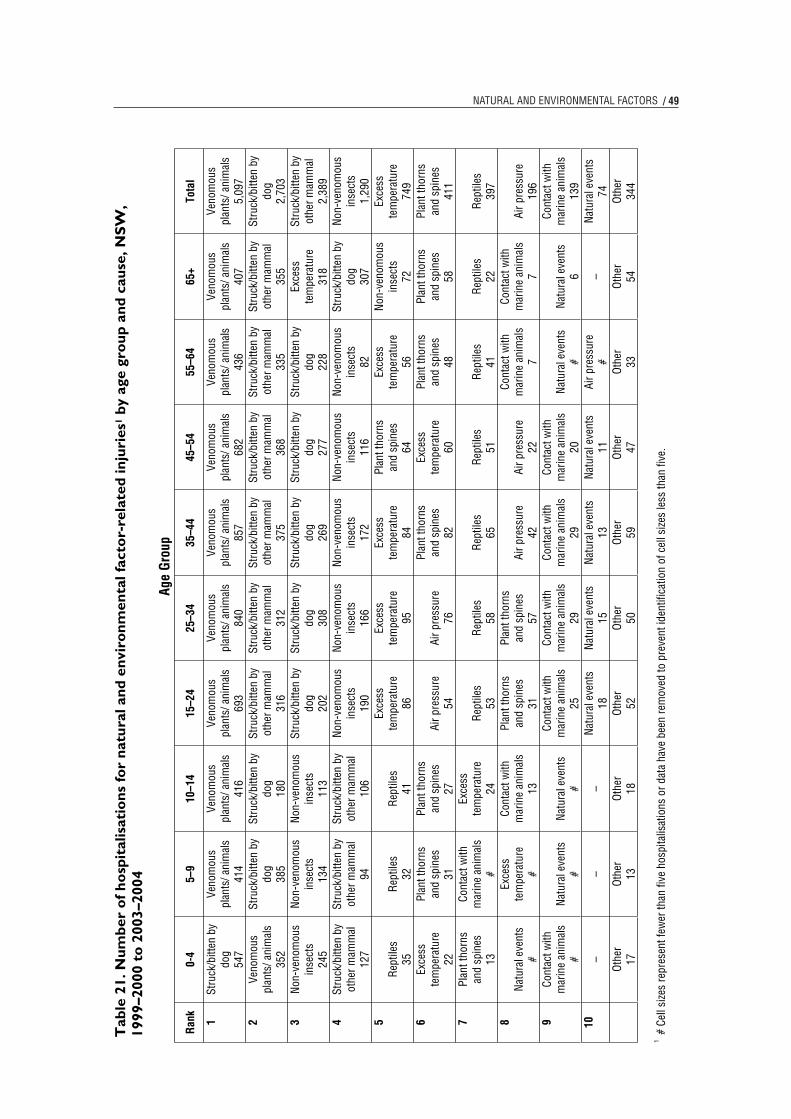
/ 49NATURAL AND ENvIRONMENTAL FACTORS53
Tab
le 2
1. N
umbe
r of
hos
pita
lisat
ions
for
natu
ral a
nd e
nvir
onm
enta
l fac
tor-
rela
ted
inju
ries
1 by
age
grou
p an
d ca
use,
NSW
, 19
99–2
000
to 2
003–
2004
Age
Gro
up
Ran
k 0-
4 5–
9 10
–14
15–2
4 25
–34
35–4
4 45
–54
55–6
4 65
+ To
tal
1D
og b
ites
547
Veno
mou
spl
ants
/ ani
mal
s 41
4
Veno
mou
spl
ants
/ ani
mal
s 41
6
Veno
mou
spl
ants
/ ani
mal
s 69
3
Veno
mou
spl
ants
/ ani
mal
s 84
0
Veno
mou
spl
ants
/ ani
mal
s 85
7
Veno
mou
spl
ants
/ ani
mal
s 68
2
Veno
mou
spl
ants
/ ani
mal
s 43
6
Veno
mou
spl
ants
/ ani
mal
s 40
7
Veno
mou
spl
ants
/ ani
mal
s 5,
097
2 Ve
nom
ous
plan
ts/ a
nim
als
352
Dog
bite
s 38
5D
og b
ites
180
Oth
er m
amm
al
bite
s31
6
Oth
er m
amm
al
bite
s31
0
Oth
er m
amm
al
bite
s37
3
Oth
er m
amm
al
bite
s36
8
Oth
er m
amm
al
bite
s33
5
Oth
er m
amm
al
bite
s35
5D
og b
ites
2,70
33
Non
-ven
omou
s in
sect
s 24
5
Non
-ven
omou
s in
sect
s 13
4
Non
-ven
omou
s in
sect
s 11
3D
og b
ites
202
Dog
bite
s 30
8D
og b
ites
269
Dog
bite
s 27
7D
og b
ites
228
Exce
ss
tem
pera
ture
31
8
Oth
er m
amm
al
bite
s2,
382
4 O
ther
mam
mal
bi
tes
126
Oth
er m
amm
al
bite
s93
Oth
er m
amm
al
bite
s10
5
Non
-ven
omou
s in
sect
s 19
0
Non
-ven
omou
s in
sect
s 16
6
Non
-ven
omou
s in
sect
s 17
2
Non
-ven
omou
s in
sect
s 11
6
Non
-ven
omou
s in
sect
s 82
Dog
bite
s 30
7
Non
-ven
omou
s in
sect
s 1,
290
5R
eptil
es35
Rep
tiles
32R
eptil
es41
Exce
ss
tem
pera
ture
86
Exce
ss
tem
pera
ture
95
Exce
ss
tem
pera
ture
84
Plan
t tho
rns
and
spin
es
64
Exce
ss
tem
pera
ture
56
Non
-ven
omou
s in
sect
s 72
Exce
ss
tem
pera
ture
74
96
Exce
ss
tem
pera
ture
22
Plan
t tho
rns
and
spin
es
31
Plan
t tho
rns
and
spin
es
27Ai
r pre
ssur
e 54
Air p
ress
ure
76
Plan
t tho
rns
and
spin
es
82
Exce
ss
tem
pera
ture
60
Plan
t tho
rns
and
spin
es
48
Plan
t tho
rns
and
spin
es
58
Plan
t tho
rns
and
spin
es
411
7 Pl
ant t
horn
s an
d sp
ines
13
Cont
act w
ith
mar
ine
anim
als
#
Exce
ss
tem
pera
ture
24
Rep
tiles
53R
eptil
es58
Rep
tiles
65R
eptil
es50
Rep
tiles
41R
eptil
es22
Rep
tiles
396
8N
atur
al e
vent
s #
Exce
ss
tem
pera
ture
#
Cont
act w
ith
mar
ine
anim
als
13
Plan
t tho
rns
and
spin
es
31
Plan
t tho
rns
and
spin
es
57Ai
r pre
ssur
e 42
Air p
ress
ure
22
Cont
act w
ith
mar
ine
anim
als
7
Cont
act w
ith
mar
ine
anim
als
7Ai
r pre
ssur
e 19
69
Cont
act w
ith
mar
ine
anim
als
#N
atur
al e
vent
s #
Nat
ural
eve
nts
#
Cont
act w
ith
mar
ine
anim
als
25
Cont
act w
ith
mar
ine
anim
als
29
Cont
act w
ith
mar
ine
anim
als
29
Cont
act w
ith
mar
ine
anim
als
20N
atur
al e
vent
s #
Nat
ural
eve
nts
6
Cont
act w
ith
mar
ine
anim
als
139
10–
– –
Nat
ural
eve
nts
18N
atur
al e
vent
s 15
Nat
ural
eve
nts
13N
atur
al e
vent
s 11
Air p
ress
ure
#–
Nat
ural
eve
nts
74
Oth
er
18O
ther
14O
ther
19O
ther
52O
ther
52O
ther
61O
ther
48O
ther
33O
ther
54O
ther
352
1#
Cell
size
s re
pres
ent f
ewer
than
five
hos
pita
lisat
ions
or d
ata
have
bee
n re
mov
ed to
pre
vent
iden
tific
atio
n of
cel
l size
s le
ss th
an fi
ve.
51
tab
le2
1.n
um
ber
ofh
osp
ital
isat
ion
sfo
rn
atu
rala
nd
en
viro
nm
enta
lfac
tor-
rela
ted
inju
ries
1 by
age
gro
up
an
dc
ause
,ns
W,1
999–
2000
to
200
3–20
04
Age
Gro
up
Ran
k 0-
4 5–
9 10
–14
15–2
4 25
–34
35–4
4 45
–54
55–6
4 65
+ To
tal
1St
ruck
/bitt
en b
y do
g54
7
Veno
mou
spl
ants
/ ani
mal
s 41
4
Veno
mou
spl
ants
/ ani
mal
s 41
6
Veno
mou
spl
ants
/ ani
mal
s 69
3
Veno
mou
spl
ants
/ ani
mal
s 84
0
Veno
mou
spl
ants
/ ani
mal
s 85
7
Veno
mou
spl
ants
/ ani
mal
s 68
2
Veno
mou
spl
ants
/ ani
mal
s 43
6
Veno
mou
spl
ants
/ ani
mal
s 40
7
Veno
mou
spl
ants
/ ani
mal
s 5,
097
2Ve
nom
ous
plan
ts/ a
nim
als
352
Stru
ck/b
itten
by
dog
385
Stru
ck/b
itten
by
dog
180
Stru
ck/b
itten
by
othe
r mam
mal
31
6
Stru
ck/b
itten
by
othe
r mam
mal
31
2
Stru
ck/b
itten
by
othe
r mam
mal
37
5
Stru
ck/b
itten
by
othe
r mam
mal
36
8
Stru
ck/b
itten
by
othe
r mam
mal
33
5
Stru
ck/b
itten
by
othe
r mam
mal
35
5
Stru
ck/b
itten
by
dog
2,70
33
Non
-ven
omou
s in
sect
s 24
5
Non
-ven
omou
s in
sect
s 13
4
Non
-ven
omou
s in
sect
s 11
3
Stru
ck/b
itten
by
dog
202
Stru
ck/b
itten
by
dog
308
Stru
ck/b
itten
by
dog
269
Stru
ck/b
itten
by
dog
277
Stru
ck/b
itten
by
dog
228
Exce
ss
tem
pera
ture
31
8
Stru
ck/b
itten
by
othe
r mam
mal
2,
389
4St
ruck
/bitt
en b
y ot
her m
amm
al
127
Stru
ck/b
itten
by
othe
r mam
mal
94
Stru
ck/b
itten
by
othe
r mam
mal
10
6
Non
-ven
omou
s in
sect
s 19
0
Non
-ven
omou
s in
sect
s 16
6
Non
-ven
omou
s in
sect
s 17
2
Non
-ven
omou
s in
sect
s 11
6
Non
-ven
omou
s in
sect
s 82
Stru
ck/b
itten
by
dog
307
Non
-ven
omou
s in
sect
s 1,
290
5R
eptil
es35
Rep
tiles
32R
eptil
es41
Exce
ss
tem
pera
ture
86
Exce
ss
tem
pera
ture
95
Exce
ss
tem
pera
ture
84
Plan
t tho
rns
and
spin
es
64
Exce
ss
tem
pera
ture
56
Non
-ven
omou
s in
sect
s 72
Exce
ss
tem
pera
ture
74
96
Exce
ss
tem
pera
ture
22
Plan
t tho
rns
and
spin
es
31
Plan
t tho
rns
and
spin
es
27Ai
r pre
ssur
e 54
Air p
ress
ure
76
Plan
t tho
rns
and
spin
es
82
Exce
ss
tem
pera
ture
60
Plan
t tho
rns
and
spin
es
48
Plan
t tho
rns
and
spin
es
58
Plan
t tho
rns
and
spin
es
411
7Pl
ant t
horn
s an
d sp
ines
13
Cont
act w
ith
mar
ine
anim
als
#
Exce
ss
tem
pera
ture
24
Rep
tiles
53R
eptil
es58
Rep
tiles
65R
eptil
es51
Rep
tiles
41R
eptil
es22
Rep
tiles
397
8N
atur
al e
vent
s #
Exce
ss
tem
pera
ture
#
Cont
act w
ith
mar
ine
anim
als
13
Plan
t tho
rns
and
spin
es
31
Plan
t tho
rns
and
spin
es
57Ai
r pre
ssur
e 42
Air p
ress
ure
22
Cont
act w
ith
mar
ine
anim
als
7
Cont
act w
ith
mar
ine
anim
als
7Ai
r pre
ssur
e 19
69
Cont
act w
ith
mar
ine
anim
als
#N
atur
al e
vent
s #
Nat
ural
eve
nts
#
Cont
act w
ith
mar
ine
anim
als
25
Cont
act w
ith
mar
ine
anim
als
29
Cont
act w
ith
mar
ine
anim
als
29
Cont
act w
ith
mar
ine
anim
als
20N
atur
al e
vent
s #
Nat
ural
eve
nts
6
Cont
act w
ith
mar
ine
anim
als
139
10–
– –
Nat
ural
eve
nts
18N
atur
al e
vent
s 15
Nat
ural
eve
nts
13N
atur
al e
vent
s 11
Air p
ress
ure
#–
Nat
ural
eve
nts
74
Oth
er
17O
ther
13O
ther
18O
ther
52O
ther
50O
ther
59O
ther
47O
ther
33O
ther
54O
ther
344
1
# Ce
ll si
zes
repr
esen
t few
er th
an fi
ve h
ospi
talis
atio
ns o
r dat
a ha
ve b
een
rem
oved
to p
reve
nt id
entif
icat
ion
of c
ell s
izes
less
than
five
.
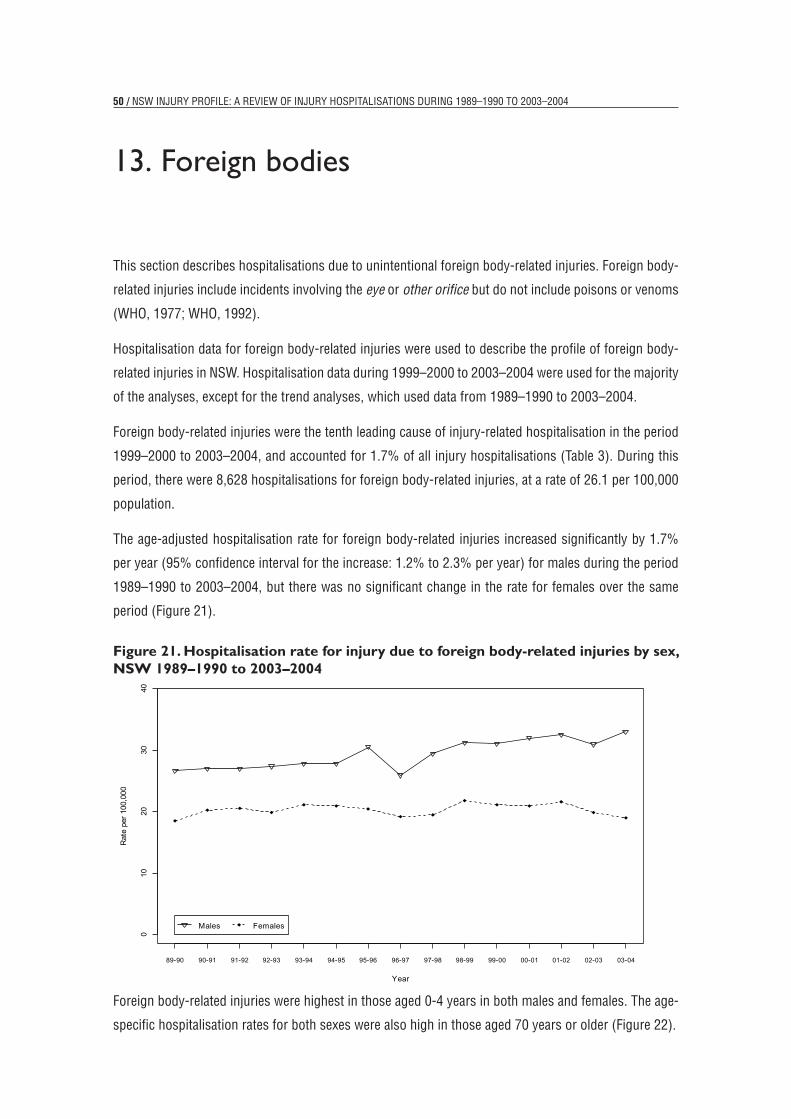
50 / NSW INJURY PROFILE: A REvIEW OF INJURY HOSPITALISATIONS DURINg 1989–1990 TO 2003–2004
13. Foreign bodies
This section describes hospitalisations due to unintentional foreign body-related injuries. Foreign body-
related injuries include incidents involving the eye or other orifice but do not include poisons or venoms
(WHO, 1977; WHO, 1992).
Hospitalisation data for foreign body-related injuries were used to describe the profile of foreign body-
related injuries in NSW. Hospitalisation data during 1999–2000 to 2003–2004 were used for the majority
of the analyses, except for the trend analyses, which used data from 1989–1990 to 2003–2004.
Foreign body-related injuries were the tenth leading cause of injury-related hospitalisation in the period
1999–2000 to 2003–2004, and accounted for 1.7% of all injury hospitalisations (Table 3). During this
period, there were 8,628 hospitalisations for foreign body-related injuries, at a rate of 26.1 per 100,000
population.
The age-adjusted hospitalisation rate for foreign body-related injuries increased significantly by 1.7%
per year (95% confidence interval for the increase: 1.2% to 2.3% per year) for males during the period
1989–1990 to 2003–2004, but there was no significant change in the rate for females over the same
period (Figure 21).
Figure 21. Hospitalisation rate for injury due to foreign body-related injuries by sex, NSW 1989–1990 to 2003–2004
Foreign body-related injuries were highest in those aged 0-4 years in both males and females. The age-
specific hospitalisation rates for both sexes were also high in those aged 70 years or older (Figure 22).
54
14. Foreign bodies
Foreign body-related injuries are an unintentional cause of injury-related hospitalisation (WHO, 1977; WHO, 1992). Foreign body-related injuries include incidents involving the eye or other orifice but do not include poisons or venoms (WHO, 1977; WHO, 1992).
Hospitalisation data for foreign body-related injuries were used to describe the profile of foreign body-related injuries in NSW. Hospitalisation data during 1999–2000 to 2003–2004 were used for the majority of the analyses, except for the trend analyses, which used data from 1989–1990 to 2003–2004.
Foreign body-related injuries were the eleventh leading cause of injury-related hospitalisation in the period 1999–2000 to 2003–2004, and accounted for 1.4% of all injury hospitalisations (Table 3). During this period, there were 8,628 hospitalisations for foreign body-related injuries, at a rate of 26.1 per 100,000 population.
The age-adjusted hospitalisation rate for foreign body-related injuries increased significantly by 1.7% per year (95% confidence interval for the increase: 1.2% to 2.3% per year) for males during the period 1989–1990 to 2003–2004, but there was no significant change in the rate for females over the same period (Error! Reference source not found.).
Figure 23. Hospitalisation rate for injury due to foreign body-related injuries by sex, NSW 1989–1990 to 2003–2004
010
2030
40
Year
Rat
e pe
r 100
,000
89-90 90-91 91-92 92-93 93-94 94-95 95-96 96-97 97-98 98-99 99-00 00-01 01-02 02-03 03-04
Males Females

/ 51FOREIgN BODIES
Figure 22. Age-specific hospitalisation rate for foreign body-related injuries by sex, NSW, 1999–2000 to 2003–2004
Around 60% of all foreign body-related hospitalisations were of males (Table 22). The alimentary tract
(e.g. the oesophagus and mouth) and the respiratory tract were the two most common locations where
foreign body-related injuries leading to hospitalisation occurred. The overall hospitalisation rate was
about 56% higher in males than in females.
Table 22. Injury hospitalisations for foreign bodies, NSW, number, rate and CI, 1999–2000 to 2003–2004
1 Age-adjusted rate per 100,000 population.
2 95% confidence interval.
Table 23 shows the number of hospitalisations due to foreign body-related injuries by age group for the
period 1999–2000 to 2003–2004. Young children 1–4 years and individuals aged 65 years and older had
the highest number of hospitalisations for foreign body-related injuries.
summAry
Foreign body-related injuries were the tenth leading cause of hospitalisation due to injury involving NSW
residents between 1999–2000 and 2003–2004, accounting for 1.7% of all injury-related hospitalisations.
The yearly hospitalisation rate for foreign body-related injuries was estimated to have increased
significantly by 1.7% per year for males during 1989–1990 to 2003–2004.
In 2003–2004, there were 1,737 hospitalisations of NSW residents following a foreign body-related
injury, giving a hospitalisation rate of 25.9 per 100,000 population. Around one-fifth (20.2%) of those
hospitalised following a foreign body-related injury were aged 4 years or less.
55
Foreign body-related injuries were highest in those aged 0-4 years in both males and females. The age-specific hospitalisation rates for both sexes were also high in those aged 70 years or older (Error! Reference source not found.).
Figure 24. Age-specific hospitalisation rate for foreign body-related injuries by sex, NSW, 1999–2000 to 2003–2004
020
4060
8010
0
Age-group (years)
Rat
e pe
r 100
,000
0-4 5-9 10-14 15-19 20-24 25-29 30-34 35-39 40-44 45-49 50-54 55-59 60-64 65-69 70-74 75-79 80-84 85+
Males Females
Around 60% of all foreign body-related hospitalisations were of males (Error!Reference source not found.). The alimentary tract (e.g. the oesophagus and mouth) and the respiratory tract were the two most common locations where foreign body-related injuries leading to hospitalisation occurred. The overall hospitalisation rate was about 56% higher in males than in females.
Table 24. Injury hospitalisations for foreign bodies, NSW, number, rate and CI, 1999–2000 to 2003–2004
All Persons Male Female Type N Rate1 95%CI2 N Rate1 95%CI2 N Rate1 95%CI2
All8,628 26.1 (25.6,26.7) 5,214 31.9 (31.0,32.8) 3,414 20.4 (19.8,21.1)
1 Rate per 100,000 population. 2 95% confidence interval.
Error! Reference source not found. shows the number of hospitalisations due to foreign body-related injuries by age group for the period 1999–2000 to 2003–2004. Young children 1–4 years and individuals aged 65 years and older had the highest number of hospitalisations for foreign body-related injuries.
52
Foreign body-related injuries were highest in those aged 0-4 years in both males and females. The age-specific hospitalisation rates for both sexes were also high in those aged 70 years or older (Figure 22).
Figure 22. Age-specific hospitalisation rate for foreign body-related injuries by sex, NSW, 1999–2000 to 2003–2004
020
4060
8010
0
Age-group (years)
Rat
e pe
r 100
,000
0-4 5-9 10-14 15-19 20-24 25-29 30-34 35-39 40-44 45-49 50-54 55-59 60-64 65-69 70-74 75-79 80-84 85+
Males Females
Around 60% of all foreign body-related hospitalisations were of males (Table 22). The alimentary tract (e.g. the oesophagus and mouth) and the respiratory tract were the two most common locations where foreign body-related injuries leading to hospitalisation occurred. The overall hospitalisation rate was about 56% higher in males than in females.
Table 22. Injury hospitalisations for foreign bodies, NSW, number, rate and CI, 1999–2000 to 2003–2004
All Persons Male Female
Type N Rate1 95%CI2 N Rate1 95%CI2 N Rate1 95%CI2
All 8,628 26.1 (25.6,26.7) 5,214 31.9 (31.0,32.8) 3,414 20.4 (19.8,21.1)
1 Rate per 100,000 population. 2 95% confidence interval.
Table 23 shows the number of hospitalisations due to foreign body-related injuries by age group for the period 1999–2000 to 2003–2004. Young children 1–4 years and individuals aged 65 years and older had the highest number of hospitalisations for foreign body-related injuries.
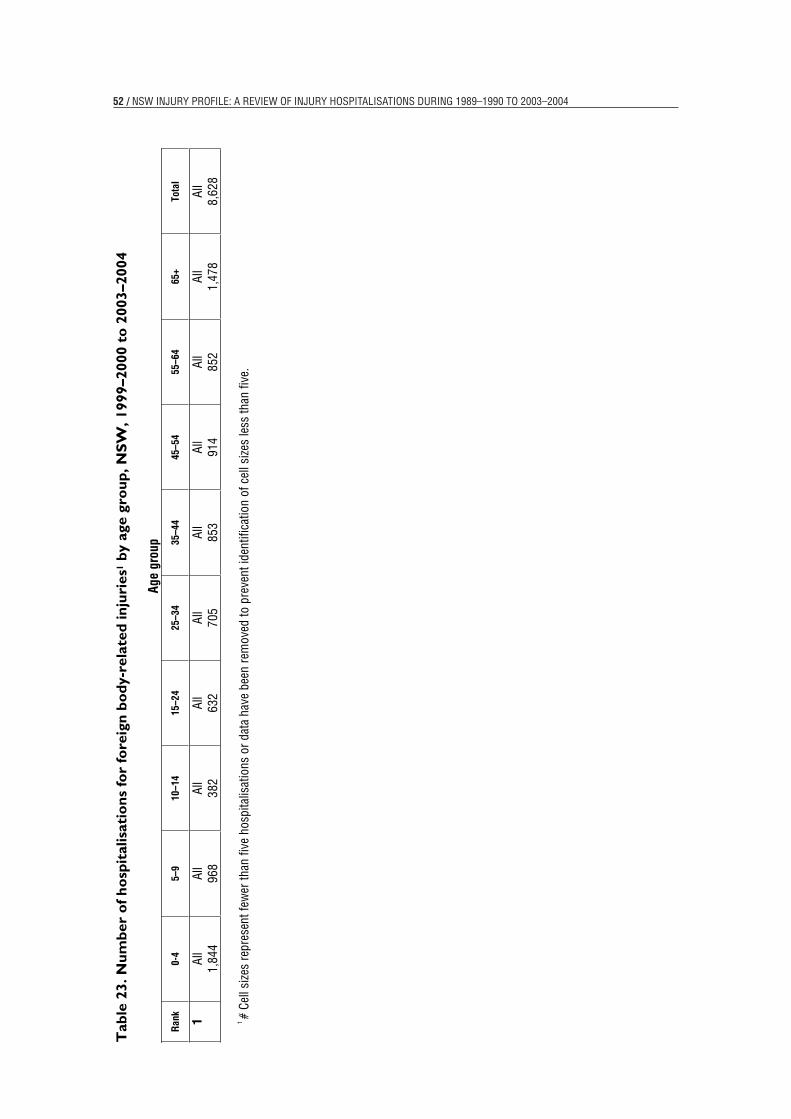
52 / NSW INJURY PROFILE: A REvIEW OF INJURY HOSPITALISATIONS DURINg 1989–1990 TO 2003–200457
Tab
le 2
3. N
umbe
r of
hos
pita
lisat
ions
for
fore
ign
body
-rel
ated
inju
ries
1 by
age
gro
up, N
SW, 1
999–
2000
to
2003
–200
4
Age
grou
p
Ran
k 0-
4 5–
9 10
–14
15–2
4 25
–34
35–4
4 45
–54
55–6
4 65
+ To
tal
1Al
l1,
844
All
968
All
382
All
632
All
705
All
853
All
914
All
852
All
1,47
8 Al
l8,
628
1#
Cell
size
s re
pres
ent f
ewer
than
five
hos
pita
lisat
ions
or d
ata
have
bee
n re
mov
ed to
pre
vent
iden
tific
atio
n of
cel
l size
s le
ss th
an fi
ve.
57
Tab
le 2
3. N
umbe
r of
hos
pita
lisat
ions
for
fore
ign
body
-rel
ated
inju
ries
1 by
age
gro
up, N
SW, 1
999–
2000
to
2003
–200
4
Age
grou
p
Ran
k 0-
4 5–
9 10
–14
15–2
4 25
–34
35–4
4 45
–54
55–6
4 65
+ To
tal
1Al
l1,
844
All
968
All
382
All
632
All
705
All
853
All
914
All
852
All
1,47
8 Al
l8,
628
1#
Cell
size
s re
pres
ent f
ewer
than
five
hos
pita
lisat
ions
or d
ata
have
bee
n re
mov
ed to
pre
vent
iden
tific
atio
n of
cel
l size
s le
ss th
an fi
ve.
/ 53
14. Fire and burns
This section describes injury hospitalisations due to fire and burns. WHO classifies the cause of fire/
burns-related hospitalisations by the location or circumstance in which the fire/burn occurred (WHO,
1977; WHO, 1992). These locations and circumstances include fires in buildings and other structures,
fires not in buildings, ignition of flammable material, burns (contact with heat and hot substances,
including scalds), and ignition of clothing and nightwear.
In NSW, fire/burns were the eighth leading cause of death in NSW during 1998-2002, with 180 deaths,
giving a mortality rate of 0.6 per 100,000 population (Schmertmann et al, 2004). The lifetime cost of
fatal and non-fatal fire/burns in NSW has been estimated at $75.2 million—$14.3 million in direct costs
and $60.9 million in mortality and morbidity costs (Potter-Forbes & Aisbett, 2003).
Fire/burns hospitalisation data were used to describe the profile of fire/burns hospitalisation involving
NSW residents. Hospitalisation data from 1999–2000 to 2003–2004 were used for the majority of
analyses, except for the trend analyses, which used data from 1989–1990 to 2003–2004.
Fire/burns were the eleventh leading cause of injury hospitalisation from 1999–2000 to 2003–2004, and
accounted for approximately 1.6% of all injury-related hospitalisations. During this period, there were
7,892 hospitalisations due to fire/burns in NSW at a rate of 24.0 per 100,000 population (Table 3). The
overall hospitalisation rate was about 92% higher for males than for females. There were approximately
1,578 hospitalisations per year due to fire/burns during 1999–2000 to 2003–2004.
The age-adjusted hospitalisation rate for injury due to fire/burns has been gradually decreasing from
28.5 per 100,000 population in 1989–1990 to 23.6 per 100,000 population in 2003–2004 (Figure 23).
The hospitalisation rate was estimated to have decreased significantly by 1.1% per year during 1989–
1990 to 2003–2004 (95% confidence interval for the decrease: 0.6% to 1.6%).
FIRE AND BURNS

54 / NSW INJURY PROFILE: A REvIEW OF INJURY HOSPITALISATIONS DURINg 1989–1990 TO 2003–2004
Figure 23. Hospitalisation rate for injury due to fire/burns by sex, NSW 1989–1990 to 2003–2004
Children aged four years or less had the highest age-specific hospitalisation rate for fire/burns at 99.1
per 100,000 population during 1999–2000 to 2003–2004. Males aged 15-19 and 20–24 years (41.5 per
100,000 population and 41.4 per 100,000 population, respectively) and males aged 85 years or older
(34.6 per 100,000 population) also had high hospitalisation rates for injuries resulting from fire/burns
compared to all other age groups during this same period (Figure 24).
Figure 24. Age-specific hospitalisation rate for injury due to fire/burns by sex, NSW, 1999–2000 to 2003–2004
59
Figure 25. Hospitalisation rate for injury due to fire/burns by sex, NSW 1989–1990 to 2003–2004 0
1020
3040
Year
Rat
e pe
r 100
,000
89-90 90-91 91-92 92-93 93-94 94-95 95-96 96-97 97-98 98-99 99-00 00-01 01-02 02-03 03-04
Males Females
Children aged four years or less had the highest age-specific hospitalisation rate for fire/burns at 99.1 per 100,000 population during 1999–2000 to 2003–2004. Males aged 15-19 and 20–24 years (41.5per 100,000 population and 41.4 per 100,000 population, respectively) and males aged 85 years or older (34.6 per 100,000 population) also had high hospitalisation rates for injuries resulting from fire/burns compared to all other age groups during this same period (Error! Reference source not found.).
Figure 26. Age-specific hospitalisation rate for injury due to fire/burns by sex, NSW, 1999–2000 to 2003–2004
020
4060
8010
012
0
Age-group (years)
Rat
e pe
r 100
,000
0-4 5-9 10-14 15-19 20-24 25-29 30-34 35-39 40-44 45-49 50-54 55-59 60-64 65-69 70-74 75-79 80-84 85+
Males Females
59
Figure 25. Hospitalisation rate for injury due to fire/burns by sex, NSW 1989–1990 to 2003–2004
010
2030
40
Year
Rat
e pe
r 100
,000
89-90 90-91 91-92 92-93 93-94 94-95 95-96 96-97 97-98 98-99 99-00 00-01 01-02 02-03 03-04
Males Females
Children aged four years or less had the highest age-specific hospitalisation rate for fire/burns at 99.1 per 100,000 population during 1999–2000 to 2003–2004. Males aged 15-19 and 20–24 years (41.5per 100,000 population and 41.4 per 100,000 population, respectively) and males aged 85 years or older (34.6 per 100,000 population) also had high hospitalisation rates for injuries resulting from fire/burns compared to all other age groups during this same period (Error! Reference source not found.).
Figure 26. Age-specific hospitalisation rate for injury due to fire/burns by sex, NSW, 1999–2000 to 2003–2004
020
4060
8010
012
0
Age-group (years)
Rat
e pe
r 100
,000
0-4 5-9 10-14 15-19 20-24 25-29 30-34 35-39 40-44 45-49 50-54 55-59 60-64 65-69 70-74 75-79 80-84 85+
Males Females
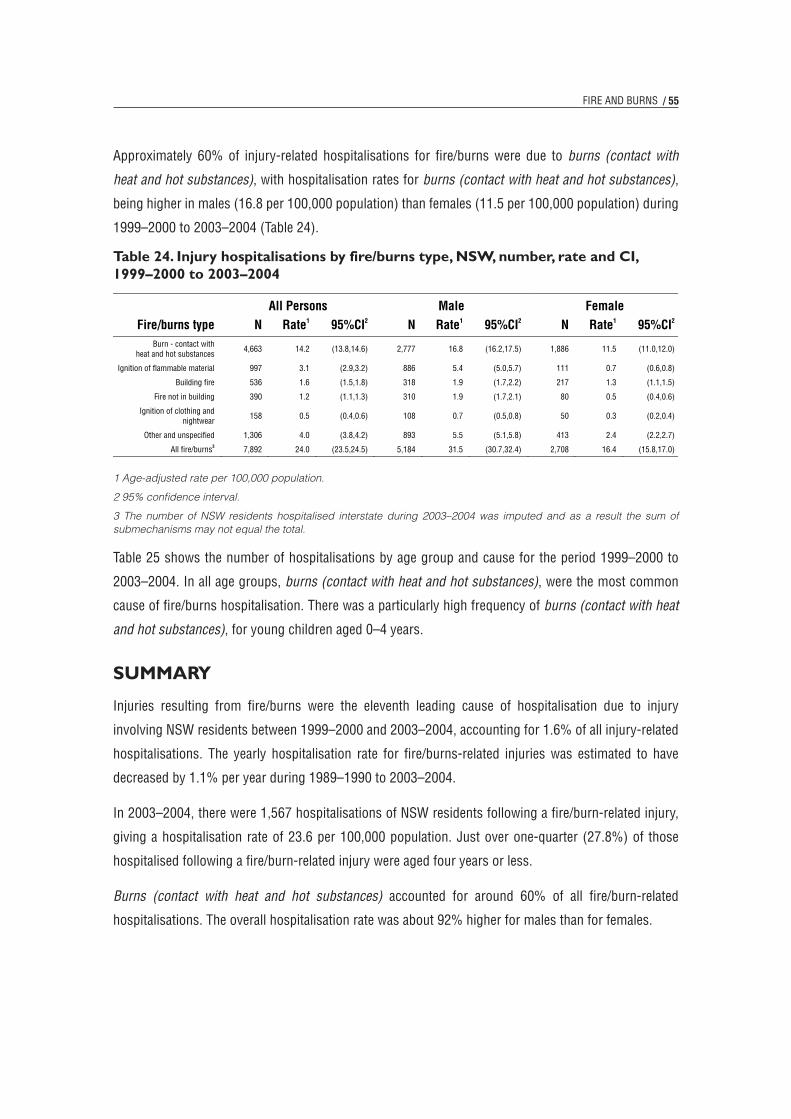
/ 55
Approximately 60% of injury-related hospitalisations for fire/burns were due to burns (contact with
heat and hot substances), with hospitalisation rates for burns (contact with heat and hot substances),
being higher in males (16.8 per 100,000 population) than females (11.5 per 100,000 population) during
1999–2000 to 2003–2004 (Table 24).
Table 24. Injury hospitalisations by fire/burns type, NSW, number, rate and CI, 1999–2000 to 2003–2004
1 Age-adjusted rate per 100,000 population.
2 95% confidence interval.
3 The number of NSW residents hospitalised interstate during 2003–2004 was imputed and as a result the sum of submechanisms may not equal the total.
Table 25 shows the number of hospitalisations by age group and cause for the period 1999–2000 to
2003–2004. In all age groups, burns (contact with heat and hot substances), were the most common
cause of fire/burns hospitalisation. There was a particularly high frequency of burns (contact with heat
and hot substances), for young children aged 0–4 years.
summAry
Injuries resulting from fire/burns were the eleventh leading cause of hospitalisation due to injury
involving NSW residents between 1999–2000 and 2003–2004, accounting for 1.6% of all injury-related
hospitalisations. The yearly hospitalisation rate for fire/burns-related injuries was estimated to have
decreased by 1.1% per year during 1989–1990 to 2003–2004.
In 2003–2004, there were 1,567 hospitalisations of NSW residents following a fire/burn-related injury,
giving a hospitalisation rate of 23.6 per 100,000 population. Just over one-quarter (27.8%) of those
hospitalised following a fire/burn-related injury were aged four years or less.
Burns (contact with heat and hot substances) accounted for around 60% of all fire/burn-related
hospitalisations. The overall hospitalisation rate was about 92% higher for males than for females.
FIRE AND BURNS57
Approximately 60% of injury-related hospitalisations for fire/burns were due to burns(contact with heat and hot substances), with hospitalisation rates for burns (contactwith heat and hot substances), being higher in males (16.8 per 100,000 population) than females (11.5 per 100,000 population) during 1999–2000 to 2003–2004 (Table 24).
Table 24. Injury hospitalisations by fire/burns type, NSW, number, rate and CI, 1999–2000 to 2003–2004
All Persons Male Female Fire/burns type N Rate1 95%CI2 N Rate1 95%CI2 N Rate1 95%CI2
Burn - contact with heat and hot substances
4,663 14.2 (13.8,14.6) 2,777 16.8 (16.2,17.5) 1,886 11.5 (11.0,12.0)
Ignition of flammable material 997 3.1 (2.9,3.2) 886 5.4 (5.0,5.7) 111 0.7 (0.6,0.8)
Building fire 536 1.6 (1.5,1.8) 318 1.9 (1.7,2.2) 217 1.3 (1.1,1.5)
Fire not in building 390 1.2 (1.1,1.3) 310 1.9 (1.7,2.1) 80 0.5 (0.4,0.6)
Ignition of clothing and nightwear
158 0.5 (0.4,0.6) 108 0.7 (0.5,0.8) 50 0.3 (0.2,0.4)
Other and unspecified 1,306 4.0 (3.8,4.2) 893 5.5 (5.1,5.8) 413 2.4 (2.2,2.7)
All fire/burns3 7,892 24.0 (23.5,24.5) 5,184 31.5 (30.7,32.4) 2,708 16.4 (15.8,17.0)
1 Age-adjusted rate per 100,000 population. 2 95% confidence interval. 3 The number of NSW residents hospitalised interstate during 2003–2004 was imputed and as a result
the sum of submechanisms may not equal the total.
Table 25 shows the number of hospitalisations by age group and cause for the period 1999–2000 to 2003–2004. In all age groups, burns (contact with heat and hot substances), were the most common cause of fire/burns hospitalisation. There was a particularly high frequency of burns (contact with heat and hot substances), for young children aged 0–4 years.
SummaryInjuries resulting from fire/burns were the eleventh leading cause of hospitalisation due to injury involving NSW residents between 1999–2000 and 2003–2004, accounting for 1.6% of all injury-related hospitalisations. The yearly hospitalisation rate for fire/burns-related injuries was estimated to have decreased by 1.1% per year during 1989–1990 to 2003–2004.
In 2003–2004, there were 1,567 hospitalisations of NSW residents following a fire/burn-related injury, giving a hospitalisation rate of 23.6 per 100,000 population. Just over one-quarter (27.8%) of those hospitalised following a fire/burn-related injury were aged four years or less.
Burns (contact with heat and hot substances) accounted for around 60% of all fire/burn-related hospitalisations. The overall hospitalisation rate was about 92% higher for males than for females.
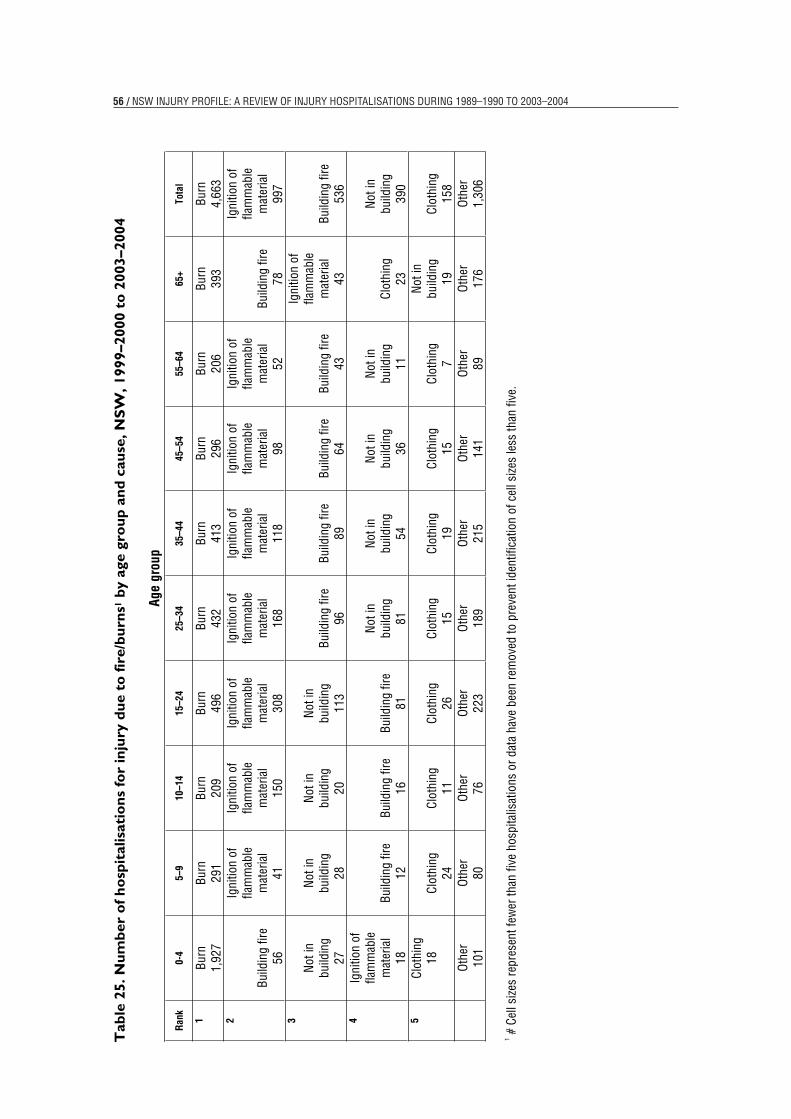
56 / NSW INJURY PROFILE: A REvIEW OF INJURY HOSPITALISATIONS DURINg 1989–1990 TO 2003–200461
Tab
le 2
5. N
umbe
r of
hos
pita
lisat
ions
for
inju
ry d
ue t
o fir
e/bu
rns1
by
age
grou
p an
d ca
use,
NSW
, 199
9–20
00 t
o 20
03–2
004
Age
grou
p
Ran
k 0-
4 5–
9 10
–14
15–2
4 25
–34
35–4
4 45
–54
55–6
4 65
+ To
tal
1Bu
rn1,
927
Burn
291
Burn
209
Burn
496
Burn
432
Burn
413
Burn
296
Burn
206
Burn
393
Burn
4,66
3 2
Priv
ate
dwel
ling
56
Igni
tion
of
flam
mab
lem
ater
ial
41
Igni
tion
of
flam
mab
lem
ater
ial
150
Igni
tion
of
flam
mab
lem
ater
ial
308
Igni
tion
of
flam
mab
lem
ater
ial
168
Igni
tion
of
flam
mab
lem
ater
ial
118
Igni
tion
of
flam
mab
lem
ater
ial
98
Igni
tion
of
flam
mab
lem
ater
ial
52
Priv
ate
dwel
ling
78
Igni
tion
of
flam
mab
lem
ater
ial
997
3
Not
in
build
ing
27
Not
in
build
ing
28
Not
in
build
ing
20
Not
in
build
ing
113
Priv
ate
dwel
ling
96
Priv
ate
dwel
ling
89
Priv
ate
dwel
ling
64
Priv
ate
dwel
ling
43
Igni
tion
of
flam
mab
lem
ater
ial
43
Priv
ate
dwel
ling
536
4Ig
nitio
n of
fla
mm
able
mat
eria
l18
Priv
ate
dwel
ling
12
Priv
ate
dwel
ling
16
Priv
ate
dwel
ling
81
Not
in
build
ing
81
Not
in
build
ing
54
Not
in
build
ing
36
Not
in
build
ing
11
Not
in
build
ing
19
Not
in
build
ing
390
Oth
er11
8 O
ther
80O
ther
76O
ther
223
Oth
er18
9 O
ther
215
Oth
er14
1 O
ther
89O
ther
176
Oth
er1,
306
1#
Cell
size
s re
pres
ent f
ewer
than
five
hos
pita
lisat
ions
or d
ata
have
bee
n re
mov
ed to
pre
vent
iden
tific
atio
n of
cel
l size
s le
ss th
an fi
ve.
60
tab
le2
5.n
um
ber
ofh
osp
ital
isat
ion
sfo
rin
jury
du
eto
fire
/bu
rns1 b
yag
egr
ou
pa
nd
cau
se,n
sW
,199
9–20
00t
o2
003–
2004
Age
grou
p
Ran
k 0-
4 5–
9 10
–14
15–2
4 25
–34
35–4
4 45
–54
55–6
4 65
+ To
tal
1Bu
rn1,
927
Burn
291
Burn
209
Burn
496
Burn
432
Burn
413
Burn
296
Burn
206
Burn
393
Burn
4,66
3 2
Build
ing
fire
56
Igni
tion
of
flam
mab
lem
ater
ial
41
Igni
tion
of
flam
mab
lem
ater
ial
150
Igni
tion
of
flam
mab
lem
ater
ial
308
Igni
tion
of
flam
mab
lem
ater
ial
168
Igni
tion
of
flam
mab
lem
ater
ial
118
Igni
tion
of
flam
mab
lem
ater
ial
98
Igni
tion
of
flam
mab
lem
ater
ial
52Bu
ildin
g fir
e 78
Igni
tion
of
flam
mab
lem
ater
ial
997
3
Not
in
build
ing
27
Not
in
build
ing
28
Not
in
build
ing
20
Not
in
build
ing
113
Build
ing
fire
96Bu
ildin
g fir
e 89
Build
ing
fire
64Bu
ildin
g fir
e 43
Igni
tion
of
flam
mab
lem
ater
ial
43Bu
ildin
g fir
e 53
6 4
Igni
tion
of
flam
mab
lem
ater
ial
18Bu
ildin
g fir
e 12
Build
ing
fire
16Bu
ildin
g fir
e 81
Not
in
build
ing
81
Not
in
build
ing
54
Not
in
build
ing
36
Not
in
build
ing
11Cl
othi
ng
23
Not
in
build
ing
390
5Cl
othi
ng
18Cl
othi
ng
24Cl
othi
ng
11Cl
othi
ng
26Cl
othi
ng
15Cl
othi
ng
19Cl
othi
ng
15Cl
othi
ng
7
Not
in
build
ing
19Cl
othi
ng
158
Oth
er10
1 O
ther
80O
ther
76O
ther
223
Oth
er18
9 O
ther
215
Oth
er14
1 O
ther
89O
ther
176
Oth
er1,
306
1#
Cell
size
s re
pres
ent f
ewer
than
five
hos
pita
lisat
ions
or d
ata
have
bee
n re
mov
ed to
pre
vent
iden
tific
atio
n of
cel
l size
s le
ss th
an fi
ve.

/ 57
15. Machinery injuries
This section describes hospitalisations due to unintentional machinery-related injuries. Different types
of machinery can cause injury-related hospitalisations. These types of machinery include agricultural
and lifting and transmission, and other types of machinery (WHO, 1977; WHO, 1992). For example,
machinery-related injuries could result from contact with lifting and transmission devices, such as
chain hoists or winches, or from contact with agricultural machinery, like harvesting machinery, such
as threshers.
In NSW, machinery-related incidents were the fourteenth leading cause of death in NSW during 1998-
2002, with 40 deaths, giving a mortality rate of 0.1 per 100,000 population (Schmertmann et al, 2004).
The lifetime cost of fatal and non-fatal machinery-related incidents in NSW has been estimated at $35.6
million—$8.4 million in direct costs and $27.3 million in mortality and morbidity costs (Potter-Forbes
& Aisbett, 2003).
Hospitalisation data for machinery-related injuries were used to describe the profile of machinery-
related injuries involving NSW residents. Hospitalisation data during 1999–2000 to 2003–2004 were
used for the majority of the analyses, except for the trend analyses, which used data from 1989–1990
to 2003–2004.
Machinery-related injuries were the twelfth leading cause of injury hospitalisation in the period 1999–
2000 to 2003–2004, and accounted for 1.5% of all injury hospitalisations (Table 3). During this period,
there were 7,656 hospitalisations for machinery-related injuries, at a rate of 23.3 per 100,000 population.
There were about 1,531 hospitalisations each year in the period 1999–2000 to 2003–2004.
The age-adjusted hospitalisation rate for machinery-related injuries by year decreased significantly
between 1989–1990 and 2003–2004 (Figure 25) by 3.0% each year for both males and females (95%
confidence interval for the decrease: 2.6% to 3.3%).
MACHINERY INJURIES

58 / NSW INJURY PROFILE: A REvIEW OF INJURY HOSPITALISATIONS DURINg 1989–1990 TO 2003–2004
Figure 25. Hospitalisation rate for injury due to machinery-related injuries by sex, NSW 1989–1990 to 2003–2004
The age-specific hospitalisation rates for machinery-related injuries for the period 1999–2000 to 2003–
2004 were highest for males aged 20–24 years and 25–29 years (Figure 26). Hospitalisation rates for
males were higher than rates for females for all age groups, with the overall hospitalisation rate for
males being about 1059% higher than for females.
Figure 26. Age-specific hospitalisation rate for machinery-related injuries by sex, NSW, 1999–2000 to 2003–2004
63
Figure 27. Hospitalisation rate for injury due to machinery-related injuries by sex, NSW 1989–1990 to 2003–2004
010
2030
4050
6070
Year
Rat
e pe
r 100
,000
89-90 90-91 91-92 92-93 93-94 94-95 95-96 96-97 97-98 98-99 99-00 00-01 01-02 02-03 03-04
Males Females
The age-specific hospitalisation rates for machinery-related injuries for the period 1999–2000 to 2003–2004 were highest for males aged 20–24 years and 25–29 years (Error! Reference source not found.). Hospitalisation rates for males were higher than rates for females for all age groups, with the overall hospitalisation rate for males being about 1059% higher than for females.
Figure 28. Age-specific hospitalisation rate for machinery-related injuries by sex, NSW, 1999–2000 to 2003–2004
020
4060
80
Age-group (years)
Rat
e pe
r 100
,000
0-4 5-9 10-14 15-19 20-24 25-29 30-34 35-39 40-44 45-49 50-54 55-59 60-64 65-69 70-74 75-79 80-84 85+
Males Females

/ 59
Rates of hospitalisations were highest for other machinery-related causes (Table 26). This category
included hospitalisations due to injuries caused by woodworking and metalworking machinery, although
the number of hospitalisations due to these causes was not able to be extracted individually for all
of the period 1999–2000 to 2003–2004. For 2002-03 and 2003–2004, the most common causes of
hospitalisation due to ‘other machinery’ were injuries due to woodworking machinery (30.7%), other
specified machinery (27.7%) and metalworking machinery (10.7%).
Table 26. Injury hospitalisations by machinery-related cause, NSW, number, rate and CI, 1999–2000 to 2003–2004
1 Age-adjusted rate per 100,000 population.
2 95% confidence interval.
3 The number of NSW residents hospitalised interstate during 2003–2004 was imputed and as a result the sum of submechanisms may not equal the total.
Table 27 shows the number of hospitalisations due to machinery-related injuries by age group for the
period 1999–2000 to 2003–2004. For all age groups, other machine-related injuries were the most
common. For those aged 15–64 years, injuries due to lifting and transmission machinery were the
second most common cause of machinery-related hospitalisation.
summAry
Machinery-related injuries were the twelfth leading cause of injury-related hospitalisation involving NSW
residents between 1999–2000 and 2003–2004, accounting for 1.5% of all injury-related hospitalisations.
The yearly hospitalisation rate for fall-related injuries was estimated to have decreased by 3.0% per year
for both males and females during 1989–1990 to 2003–2004.
In 2003–2004, there were 1,516 hospitalisations of NSW residents following a machinery-related injury,
giving a hospitalisation rate of 22.5 per 100,000 population. More than four-fifths (84.8%) of those
hospitalised following a machinery-related injury were aged 15–59 years.
Other types of machinery were the types of machinery that most commonly led to a hospitalisation. The
overall hospitalisation rate was about 1059% higher for males than for females.
MACHINERY INJURIES
61
Rates of hospitalisations were highest for other machinery-related causes (Table 26). This category included hospitalisations due to injuries caused by woodworking and metalworking machinery, although the number of hospitalisations due to these causes was not able to be extracted individually for all of the period 1999–2000 to 2003–2004. For 2002-03 and 2003–2004, the most common causes of hospitalisation due to ‘other machinery’ were injuries due to woodworking machinery (30.7%), other specified machinery (27.7%) and metalworking machinery (10.7%).
Table 26. Injury hospitalisations by machinery-related cause, NSW, number, rate and CI, 1999–2000 to 2003–2004
All Persons Male Female Cause N Rate1 95%CI2 N Rate1 95%CI2 N Rate1 95%CI2
Lifting and transmission 907 2.8 (2.6,2.9) 827 5.0 (4.7,5.4) 79 0.5 (0.4,0.6)
Agricultural 550 1.7 (1.5,1.8) 508 3.1 (2.8,3.4) 42 0.3 (0.2,0.3)
Other 6,199 18.8 (18.4,19.3) 5,719 34.8 (33.9,35.7) 480 2.9 (2.7,3.2)
All3 7,656 23.3 (22.7,23.8) 7,055 42.9 (41.9,43.9) 601 3.7 (3.4,4.0)
1 Age-adjusted rate per 100,000 population. 2 95% confidence interval. 3 The number of NSW residents hospitalised interstate during 2003–2004 was imputed and as a result
the sum of submechanisms may not equal the total.
Table 27 shows the number of hospitalisations due to machinery-related injuries by age group for the period 1999–2000 to 2003–2004. For all age groups, other machine-related injuries were the most common. For those aged 15–64 years, injuries due to lifting and transmission machinery were the second most common cause of machinery-related hospitalisation.
SummaryMachinery-related injuries were the twelfth leading cause of injury-related hospitalisation involving NSW residents between 1999–2000 and 2003–2004, accounting for 1.5% of all injury-related hospitalisations. The yearly hospitalisation rate for fall-related injuries was estimated to have decreased by 3.0% per year for both males and females during 1989–1990 to 2003–2004.
In 2003–2004, there were 1,516 hospitalisations of NSW residents following a machinery-related injury, giving a hospitalisation rate of 22.5 per 100,000 population. More than four-fifths (84.8%) of those hospitalised following a machinery-related injury were aged 15–59 years.
Other types of machinery were the types of machinery that most commonly led to a hospitalisation. The overall hospitalisation rate was about 1059% higher for males than for females.

60 / NSW INJURY PROFILE: A REvIEW OF INJURY HOSPITALISATIONS DURINg 1989–1990 TO 2003–200465
Tab
le 2
7. N
umbe
r of
hos
pita
lisat
ions
for
mac
hine
ry-r
elat
ed1
inju
ries
by
age
grou
p an
d ca
use,
NSW
, 199
9–20
00 t
o 20
03–2
004
Age
grou
p
Ran
k 0-
4 5–
9 10
–14
15–2
4 25
–34
35–4
4 45
–54
55–6
4 65
+ To
tal
1Ag
ricul
tura
l 17
Lifti
ng a
nd
tran
smis
sion
12
Agric
ultu
ral
13
Lifti
ng a
nd
tran
smis
sion
13
8
Lifti
ng a
nd
tran
smis
sion
21
9
Lifti
ng a
nd
tran
smis
sion
20
0
Lifti
ng a
nd
tran
smis
sion
15
0
Lifti
ng a
nd
tran
smis
sion
10
9 Ag
ricul
tura
l 69
Lifti
ng a
nd
tran
smis
sion
90
7 2
Lifti
ng a
nd
tran
smis
sion
14
Agric
ultu
ral
10
Lifti
ng a
nd
tran
smis
sion
11
Agric
ultu
ral
65Ag
ricul
tura
l 80
Agric
ultu
ral
98Ag
ricul
tura
l 11
3 Ag
ricul
tura
l 85
Lifti
ng a
nd
tran
smis
sion
54
Agric
ultu
ral
550
Oth
er74
Oth
er53
Oth
er81
Oth
er1,
108
Oth
er1,
346
Oth
er1,
325
Oth
er1,
142
Oth
er66
1 O
ther
409
Oth
er6,
199
1#
Cell
size
s re
pres
ent f
ewer
than
five
hos
pita
lisat
ions
or d
ata
have
bee
n re
mov
ed to
pre
vent
iden
tific
atio
n of
cel
l size
s le
ss th
an fi
ve.
65
Tab
le 2
7. N
umbe
r of
hos
pita
lisat
ions
for
mac
hine
ry-r
elat
ed1
inju
ries
by
age
grou
p an
d ca
use,
NSW
, 199
9–20
00 t
o 20
03–2
004
Age
grou
p
Ran
k 0-
4 5–
9 10
–14
15–2
4 25
–34
35–4
4 45
–54
55–6
4 65
+ To
tal
1Ag
ricul
tura
l 17
Lifti
ng a
nd
tran
smis
sion
12
Agric
ultu
ral
13
Lifti
ng a
nd
tran
smis
sion
13
8
Lifti
ng a
nd
tran
smis
sion
21
9
Lifti
ng a
nd
tran
smis
sion
20
0
Lifti
ng a
nd
tran
smis
sion
15
0
Lifti
ng a
nd
tran
smis
sion
10
9 Ag
ricul
tura
l 69
Lifti
ng a
nd
tran
smis
sion
90
7 2
Lifti
ng a
nd
tran
smis
sion
14
Agric
ultu
ral
10
Lifti
ng a
nd
tran
smis
sion
11
Agric
ultu
ral
65Ag
ricul
tura
l 80
Agric
ultu
ral
98Ag
ricul
tura
l 11
3 Ag
ricul
tura
l 85
Lifti
ng a
nd
tran
smis
sion
54
Agric
ultu
ral
550
Oth
er74
Oth
er53
Oth
er81
Oth
er1,
108
Oth
er1,
346
Oth
er1,
325
Oth
er1,
142
Oth
er66
1 O
ther
409
Oth
er6,
199
1#
Cell
size
s re
pres
ent f
ewer
than
five
hos
pita
lisat
ions
or d
ata
have
bee
n re
mov
ed to
pre
vent
iden
tific
atio
n of
cel
l size
s le
ss th
an fi
ve.
/ 61
16. Near-drowning
This section describes hospitalisations due to unintentional near-drowning WHO classifies the cause of
a near-drowning hospitalisation by the location in which the near-drowning event occurred (WHO, 1977;
WHO, 1992). The locations of near-drowning include a bathtub, swimming pool, natural water, boat-
related or other location. Near-drowning may also be intentional, but a self-inflicted near-drowning event
that results in hospitalisation is classified as an attempt at self-harm and is included in Section 7.
In NSW, drowning was the sixth leading cause of death in NSW during 1998-2002, with 468 deaths,
giving a mortality rate of 1.4 per 100,000 population (Schmertmann et al, 2004). The lifetime cost of
drowning and near-drowning in NSW has been estimated at $71.8 million—$682,336 in direct costs and
$71.1 million in mortality and morbidity costs (Potter-Forbes & Aisbett, 2003).
Near-drowning data from 1989–1990 to 2003–2004 were used to describe the profile of near-drowning
hospitalisation involving NSW residents. Hospitalisation data from 1999–2000 to 2003–2004 were used
for the majority of analyses, except for the trend analyses, which used data from 1989–1990 to 2003–
2004.
Near-drowning was the thirteenth leading cause of injury hospitalisation during 1999–2000 to 2003–
2004, and accounted for approximately 0.2% of all injury-related hospitalisations. During this period,
there were 914 people hospitalised for near-drowning at a rate of 2.8 per 100,000 population (Table 3).
Approximately 183 people were hospitalised each year as the result of near-drowning during 1999–2000
to 2003–2004. Around 70% of near-drowning hospitalisations were of males.
Males had a hospitalisation rate for near-drowning during 1989–1990 to 2003–2004 at least two-and-
a-half times the rate for females. Between 1998–1999 and 1999–2000 there was a noticeable decrease
in the near-drowning hospitalisation rate for males (Figure 27). The hospitalisation rate was estimated
to have decreased significantly by 2.4% per year during 1989–1990 to 2003–2004 (95% confidence
interval for the decrease: 1.2% to 3.5%).
NEAR-DROWNINg
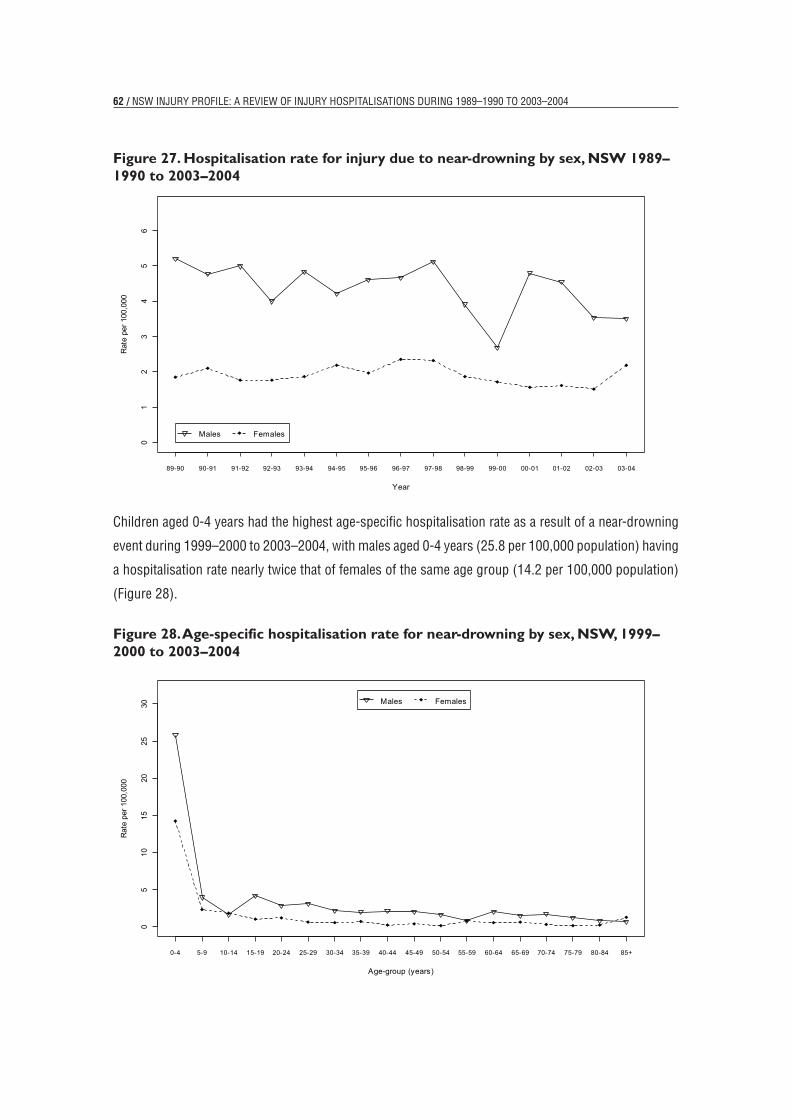
62 / NSW INJURY PROFILE: A REvIEW OF INJURY HOSPITALISATIONS DURINg 1989–1990 TO 2003–2004
Figure 27. Hospitalisation rate for injury due to near-drowning by sex, NSW 1989–1990 to 2003–2004
Children aged 0-4 years had the highest age-specific hospitalisation rate as a result of a near-drowning
event during 1999–2000 to 2003–2004, with males aged 0-4 years (25.8 per 100,000 population) having
a hospitalisation rate nearly twice that of females of the same age group (14.2 per 100,000 population)
(Figure 28).
Figure 28. Age-specific hospitalisation rate for near-drowning by sex, NSW, 1999–2000 to 2003–2004
67
Figure 29. Hospitalisation rate for injury due to near-drowning by sex, NSW 1989–1990 to 2003–2004
01
23
45
6
Year
Rat
e pe
r 100
,000
89-90 90-91 91-92 92-93 93-94 94-95 95-96 96-97 97-98 98-99 99-00 00-01 01-02 02-03 03-04
Males Females
Children aged 0-4 years had the highest age-specific hospitalisation rate as a result of a near-drowning event during 1999–2000 to 2003–2004, with males aged 0-4 years (25.8 per 100,000 population) having a hospitalisation rate nearly twice that of females of the same age group (14.2 per 100,000 population) (Error! Reference source not found.).
Figure 30. Age-specific hospitalisation rate for near-drowning by sex, NSW, 1999–2000 to 2003–2004
05
1015
2025
30
Age-group (years)
Rat
e pe
r 100
,000
0-4 5-9 10-14 15-19 20-24 25-29 30-34 35-39 40-44 45-49 50-54 55-59 60-64 65-69 70-74 75-79 80-84 85+
Males Females

/ 63NEAR-DROWNINg
Swimming pools and natural water were the two locations that led to a near-drowning hospitalisation
most frequently, and accounted for 38.1% and 29.3% of all near-drowning hospitalisations, respectively.
Hospitalisation rates were higher for males than females for all locations except for near-drowning in
bathtubs (Table 28).
Table 28. Injury hospitalisations by near-drowning location, NSW, number, rate and CI, 1999–2000 to 2003–2004
1 Age-adjusted rate per 100,000 population.
2 95% confidence interval.
3 The number of NSW residents hospitalised interstate during 2003–2004 was imputed and as a result the sum of submechanisms may not equal the total.
Table 29 shows near-drowning hospitalisations by age group and location for NSW residents during
1999–2000 to 2003–2004. Bathtubs were the location of the majority of near-drowning in children aged
less than 1 year. Swimming pools were the location where most near-drowning that led to hospitalisation
occurred in children aged 1–4 and 5–9 years. For people aged 10 years and older, natural water was the
most common location where near-drowning occurred that led to hospitalisation.
summAry
Near-drowning was the thirteenth leading cause of injury-related hospitalisation involving NSW residents
between 1999–2000 and 2003–2004, accounting for 0.2% of all injury-related hospitalisations. The
yearly hospitalisation rate for near-drowning was estimated to decrease for both males and females by
2.7% per year during 1989–1990 to 2003–2004.
In 2003–2004, there were 188 hospitalisations of NSW residents following a near-drowning event,
giving a hospitalisation rate of 2.8 per 100,000 population. Just less than one-half (43.9%) of those
hospitalised following a near-drowning event were aged 4 years or less.
Swimming pools and natural water were the most common locations of a near-drowning event that led
to a hospitalisation. Males had higher rates of hospitalisation due to near-drowning in all locations than
females, except bathtubs.
65
Swimming pools and natural water were the two locations that led to a near-drowning hospitalisation most frequently, and accounted for 38.1% and 29.3% of all near-drowning hospitalisations, respectively. Hospitalisation rates were higher for males than females for all locations except for near-drowning in bathtubs (Table 28).
Table 28. Injury hospitalisations by near-drowning location, NSW, number, rate and CI, 1999–2000 to 2003–2004
All Persons Male Female Location N Rate1 95%CI2 N Rate1 95%CI2 N Rate1 95%CI2
Pools 348 1.1 (1.0,1.2) 223 1.3 (1.2,1.5) 126 0.8 (0.7,0.9)
Natural water 268 0.8 (0.7,0.9) 206 1.3 (1.1,1.4) 61 0.4 (0.3,0.5)
Bathtub 68 0.2 (0.2,0.3) 35 0.2 (0.1,0.3) 33 0.2 (0.1,0.3)
Boat-related 62 0.2 (0.1,0.2) 47 0.3 (0.2,0.4) 15 0.1 (0.0,0.1)
Other 168 0.5 (0.4,0.6) 124 0.7 (0.6,0.9) 43 0.3 (0.2,0.4)
All3 914 2.8 (2.6,3.0) 636 3.8 (3.5,4.1) 278 1.7 (1.5,1.9)
1 Age-adjusted rate per 100,000 population. 2 95% confidence interval. 3 The number of NSW residents hospitalised interstate during 2003–2004 was imputed and as a result
the sum of submechanisms may not equal the total.
Table 29 shows near-drowning hospitalisations by age group and location for NSW residents during 1999–2000 to 2003–2004. Bathtubs were the location of the majority of near-drowning in children aged less than 1 year. Swimming pools were the location where most near-drowning that led to hospitalisation occurred in children aged 1–4 and 5–9 years. For people aged 10 years and older, natural water was the most common location where near-drowning occurred that led to hospitalisation.
SummaryNear-drowning was the thirteenth leading cause of injury-related hospitalisation involving NSW residents between 1999–2000 and 2003–2004, accounting for 0.2% of all injury-related hospitalisations. The yearly hospitalisation rate for near-drowning was estimated to decrease for both males and females by 2.7% per year during 1989–1990 to 2003–2004.
In 2003–2004, there were 188 hospitalisations of NSW residents following a near-drowning event, giving a hospitalisation rate of 2.8 per 100,000 population. Just less than one-half (43.9%) of those hospitalised following a near-drowning event were aged 4 years or less.
Swimming pools and natural water were the most common locations of a near-drowning event that led to a hospitalisation. Males had higher rates of hospitalisationdue to near-drowning in all locations than females, except bathtubs.

64 / NSW INJURY PROFILE: A REvIEW OF INJURY HOSPITALISATIONS DURINg 1989–1990 TO 2003–200469
Tab
le29
. Num
ber
of h
ospi
talis
atio
ns fo
r ne
ar-d
row
ning
1 by
age
grou
p an
d ca
use,
NSW
, 199
9–20
00 t
o 20
03–2
004
Age
grou
p
Ran
k 0-
4 5–
9 10
–14
15–2
4 25
–34
35–4
4 45
–54
55–6
4 65
+ To
tal
1Po
ol25
2 Po
ol44
Nat
ural
wat
er
16N
atur
al w
ater
63
Nat
ural
wat
er
42N
atur
al w
ater
42
Nat
ural
wat
er
24N
atur
al w
ater
15
Nat
ural
wat
er
17Po
ol34
8 2
Nat
ural
wat
er
32N
atur
al w
ater
14
Pool
16Po
ol 9Bo
at re
late
d 19
Pool 7
Boat
rela
ted
9 Bo
at re
late
d 10
Boat
rela
ted
8 N
atur
al w
ater
26
8 3
Bath
tub
59Ba
thtu
b #
Bath
tub
#Bo
at re
late
d 8
Pool 6
Boat
rela
ted
# Po
ol #Po
ol #Po
ol 7Ba
thtu
b68
4Bo
at re
late
d #
Bath
tub
#
Bath
tub
#Ba
thtu
b #
Boat
rela
ted
62O
ther
89O
ther
11O
ther #
Oth
er23
Oth
er12
Oth
er 9O
ther
10O
ther #
Oth
er #O
ther
168
1#
Cell
size
s re
pres
ent f
ewer
than
five
hos
pita
lisat
ions
or d
ata
have
bee
n re
mov
ed to
pre
vent
iden
tific
atio
n of
cel
l size
s le
ss th
an fi
ve.
69
Tab
le29
. Num
ber
of h
ospi
talis
atio
ns fo
r ne
ar-d
row
ning
1 by
age
grou
p an
d ca
use,
NSW
, 199
9–20
00 t
o 20
03–2
004
Age
grou
p
Ran
k 0-
4 5–
9 10
–14
15–2
4 25
–34
35–4
4 45
–54
55–6
4 65
+ To
tal
1Po
ol25
2 Po
ol44
Nat
ural
wat
er
16N
atur
al w
ater
63
Nat
ural
wat
er
42N
atur
al w
ater
42
Nat
ural
wat
er
24N
atur
al w
ater
15
Nat
ural
wat
er
17Po
ol34
8 2
Nat
ural
wat
er
32N
atur
al w
ater
14
Pool
16Po
ol 9Bo
at re
late
d 19
Pool 7
Boat
rela
ted
9 Bo
at re
late
d 10
Boat
rela
ted
8 N
atur
al w
ater
26
8 3
Bath
tub
59Ba
thtu
b #
Bath
tub
#Bo
at re
late
d 8
Pool 6
Boat
rela
ted
# Po
ol #Po
ol #Po
ol 7Ba
thtu
b68
4Bo
at re
late
d #
Bath
tub
#
Bath
tub
#Ba
thtu
b #
Boat
rela
ted
62O
ther
89O
ther
11O
ther #
Oth
er23
Oth
er12
Oth
er 9O
ther
10O
ther #
Oth
er #O
ther
168
1#
Cell
size
s re
pres
ent f
ewer
than
five
hos
pita
lisat
ions
or d
ata
have
bee
n re
mov
ed to
pre
vent
iden
tific
atio
n of
cel
l size
s le
ss th
an fi
ve.

/ 65
17 Conclusions and recommendations
This report describes the profiles of thirteen injury mechanisms that resulted in hospitalisation of NSW
residents. Information on only a small proportion of the burden of non-fatal injury in NSW is presented
in this report, because most injuries do not require admission to hospital. For example, injuries are also
treated by general practitioners, by ambulance services, by emergency departments, or by allied health
professionals (e.g. physiotherapists).
During the period 1989–1990 to 2003–2004, the overall injury hospitalisation rate of NSW residents did
not change significantly. However, yearly hospitalisation rates significantly decreased or increased for a
number of injury mechanisms (Table 30).
Priority areas identified for prevention activities from the analysis of injury-related hospitalisations of
NSW residents from 1999–2000 to 2003–2004 based on hospitalisation rates in the population are
listed below.
fAlls
Falls were the leading cause of injury-related hospitalisation in NSW between 1999–2000 and 2003–
2004, with on average 35,015 fall-related hospitalisations per year during this period. Just over one-
third (34.8%) of injury-related hospitalisations were due to falls. Falls on the same level and from one
level to another for both males and females, particularly for individuals aged 65 years or older, were
the main significant causes of hospitalisation. In addition, falls from buildings and from ladders and
scaffolding are leading causes of hospitalisation for males.
motorvehicletrAnsPort
Motor vehicle transport was the second leading cause of injury-related hospitalisation in NSW. Injuries
related to motor vehicle transport accounted for on average 10,640 hospitalisations per year in NSW
between 1999–2000 and 2003–2004, and accounted for about 10.6% of injury-related hospitalisations.
Leading causes of motor-vehicle related injury were vehicle occupants involved in a traffic incident for
both males and females, and motorcycle incidents in both traffic and non-traffic situations for males,
particularly those aged 15–54 years. Of concern was the particularly high rate of motor vehicle transport-
related injuries in males aged 15–24 years (502.3 per 100,000 population), compared to the overall rate
for all age groups (169.3 per 100,000 population).
CONCLUSIONS AND RECOMMENDATIONS
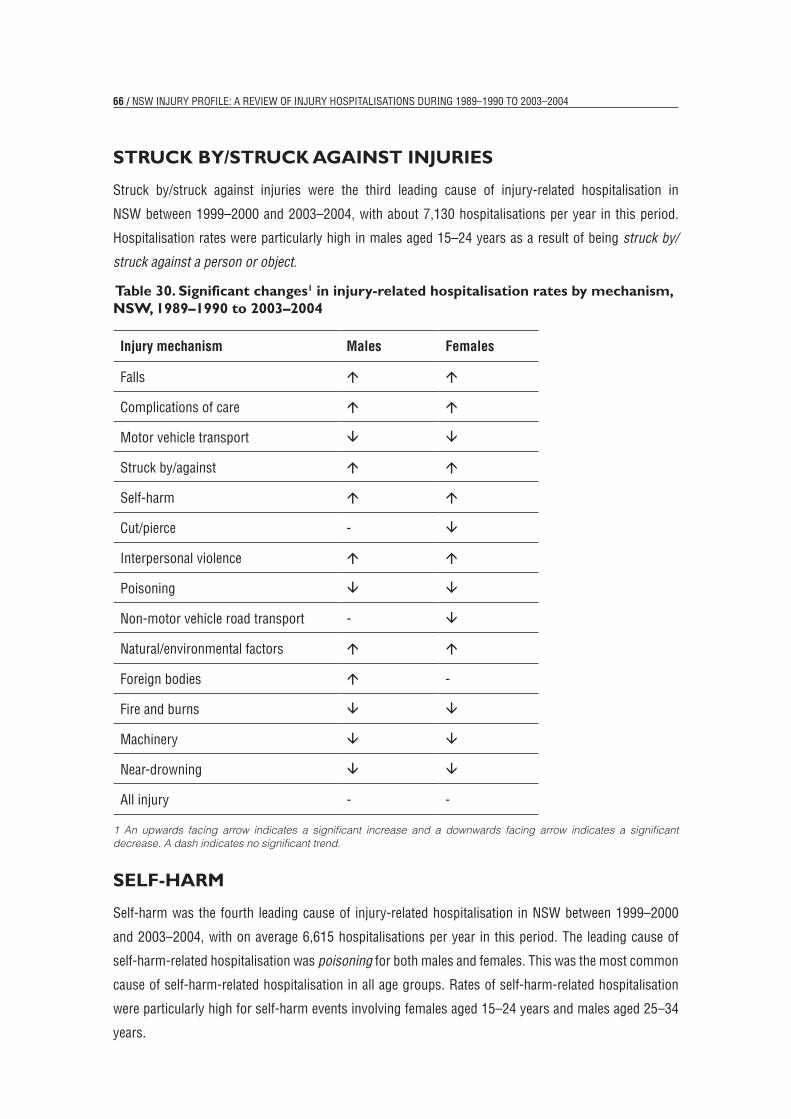
66 / NSW INJURY PROFILE: A REvIEW OF INJURY HOSPITALISATIONS DURINg 1989–1990 TO 2003–2004
struckby/struckAgAinstinjuries
Struck by/struck against injuries were the third leading cause of injury-related hospitalisation in
NSW between 1999–2000 and 2003–2004, with about 7,130 hospitalisations per year in this period.
Hospitalisation rates were particularly high in males aged 15–24 years as a result of being struck by/
struck against a person or object.
Table 30. Significant changes1 in injury-related hospitalisation rates by mechanism, NSW, 1989–1990 to 2003–2004
Injury mechan�sm Males Females
Falls
Complications of care
Motor vehicle transport
Struck by/against
Self-harm
Cut/pierce -
Interpersonal violence
Poisoning
Non-motor vehicle road transport -
Natural/environmental factors
Foreign bodies -
Fire and burns
Machinery
Near-drowning
All injury - -
1 An upwards facing arrow indicates a significant increase and a downwards facing arrow indicates a significant decrease. A dash indicates no significant trend.
self-hArm
Self-harm was the fourth leading cause of injury-related hospitalisation in NSW between 1999–2000
and 2003–2004, with on average 6,615 hospitalisations per year in this period. The leading cause of
self-harm-related hospitalisation was poisoning for both males and females. This was the most common
cause of self-harm-related hospitalisation in all age groups. Rates of self-harm-related hospitalisation
were particularly high for self-harm events involving females aged 15–24 years and males aged 25–34
years.
/ 67
cut/Pierce-relAteDinjuries
Cut/pierce-related injuries were the fifth leading cause of injury-related hospitalisation in NSW 2003–
2004, with about 6,210 hospitalisations per year in this period. The leading causes of cutting and
piercing injuries were contact with sharp glass in both males and females, and knives and other powered
household goods for males particularly those aged 15-44 years.
interPersonAlviolence
Interpersonal violence was the sixth leading cause of injury hospitalisation in NSW between 1999–
2000 and 2003–2004, and accounted for approximately 5,940 hospitalisations per year. Assault by
bodily force or by sharp or blunt objects were the leading causes of interpersonal violence-related injury
between 1999–2000 and 2003–2004. Males aged 15-44 years had particularly high rates of interpersonal
violence-related injury hospitalisations.
imProveDDAtAcollection
Details regarding the causal factors and the circumstances surrounding the injury event are not often
captured in routinely collected hospital administration datasets, such as the NSW ISC. High quality
information is necessary for monitoring the incidence of injury among the residents of NSW. Listed
below are recommendations for changes to injury classification and data collection systems in NSW
that would improve our knowledge of the incidence of injury events and their causes, and subsequently
improve injury prevention activities in NSW.
DAteofinjury
The number of injury-related hospitalisations is not equivalent to the number of incident injury cases that
result in hospitalisation, even after excluding transfers and statistical discharges. Some patients have
several admissions to hospital for ongoing treatment and rehabilitation for the same injury. Multiple
admissions are also a problem because of differing criteria among hospitals for admission over time
and across geographical regions. The NSW ISC does not capture information relating to date of injury.
If such a variable were introduced, it could be used with probabilistic data linkage methods (or a unique
patient identifier) to determine whether a given episode of care for a patient was the first admission to
hospital for a particular injury.
imProveDinjuryclAssificAtion
falls
The second most common type of fall leading to hospitalisation is other and unspecified. This category
accounted for about 7,000 hospitalisations each year between 1999–2000 and 2003–2004, at a rate of
103.5 per 100,000. The lack of detail provided by this code regarding the type of fall that occurred limits
CONCLUSIONS AND RECOMMENDATIONS

68 / NSW INJURY PROFILE: A REvIEW OF INJURY HOSPITALISATIONS DURINg 1989–1990 TO 2003–2004
the identification of appropriate fall-related injury prevention strategies. An assessment of the feasibility
of developing and incorporating additional detail into the ICD-10-AM classification system regarding the
type of fall that occurred is strongly recommended.
cutandpierce-relatedinjuries
The second most common type of cut/pierce-related injury leading to hospitalisation was other mechanism,
which corresponds to ICD-10-AM external cause code W29 “Contact with other powered hand tools and
household machinery”. This code includes injuries due to can-openers, knives, sewing machines and
chain-saws. Lack of detail about the particular tool causing the injury limits injury prevention activities
aimed at reducing the incidence of cut/pierce-related injuries due to these devices. An assessment of the
feasibility of developing and incorporating additional detail into the classification system regarding the
type of tool that resulted in the cut/pierce-related injury is recommended.
foreignbodies
This mechanism corresponds to ICD-10-AM external cause code W44 “Foreign body entering into
or through eye or natural orifice”. Lack of detail about the particular foreign body causing the injury
limits injury prevention activities aimed at reducing the incidence of injuries due to foreign bodies. An
assessment of the feasibility of developing and incorporating additional detail into the classification
system regarding the type of foreign body that resulted in the injury is recommended.
struckby/struckagainst
The lack of information regarding the type of object that struck the person or the details regarding the
two objects that the person was caught between limits injury prevention activities aimed at reducing
the incidence of injuries due to struck by/struck against injuries. An assessment of the feasibility of
developing and incorporating additional detail into the classification system regarding the type of object
that resulted in the struck by/struck against injury is recommended.
fireandburns
There were 1,149 hospitalisations during 1999–2000 to 2003–2004 as a result of an other and unspecified
fire/burn. This represented 14.6% of fire and burn-related hospitalisations during this period. The lack of
detail provided by this category regarding the type of fire/burn involved in the incident is likely to hamper
the development of injury prevention strategies. An assessment of the feasibility of developing and
incorporating additional detail into the classification system regarding the type of fire/burn that resulted
in the injury is recommended.

/ 69CONCLUSIONS AND RECOMMENDATIONS
18. References
Australian Bureau of Statistics. Labour statistics: Concepts, sources and methods, Cat no. 6102.0.55.001
www.abs.gov.au – accessed 13 May 2005.
Australian Water Safety Council. National water safety plan: 2004-2007. Sydney: Australian Water Safety
Council; 2004.
Dobson, A., Kuulasmaa, K., Eberle, E., Schere, J. Confidence intervals for weighted sums of Poisson
parameters. Statistics in Medicine 1991; 10: 457-62.
Kreisfeld, R., and Harrison, J. Injury deaths, Australia 1999. Adelaide: AIHW; 2005. (Injury Research and
Statistics Series Number 24).
Krug, E., Sharma, g., and Lozano, R. The global burden of injuries. American Journal of Public Health
2000;9(4):523-526.
Miller, T,. and Levey, D. Cost outcome analysis in injury prevention and control: eighty-four recent
estimates for the United States. Medical Care 2000; 38(6):562-582.
Mishara, B. Conceptions of death and suicide in children aged 6-12 and their implications for suicide
prevention 1999; 29(2): 105-118.
National Centre for Classification in Health. ICD-10-AM, 2nd Edition. Sydney: National Centre for
Classification in Health, 2000.
National Coding Centre. The Australian version of the international classification of diseases, 9th revision,
clinical modification (ICD-9-CM). Sydney: University of Sydney, 1996.
National Injury Prevention Advisory Council. Directions in injury prevention. Report 2: Injury prevention
interventions - good buys for the next decade. Canberra: Commonwealth of Australia, 1999.
Peden, M., Mcgee, K., Sharma, g. The injury chart book: A graphical overview of the global burden of
injuries. geneva, WHO, 2002.
Population Health Division. The health of the people of New South Wales: Report of the Chief Health
Officer, 2004. Sydney: NSW Department of Health, 2004.
Potter-Forbes, M., and Aisbett, C. Injury costs! A valuation of the burden of injury in New South Wales
1998-1999. Sydney: NSW Injury Risk Management Research Centre, 2004.

70 / NSW INJURY PROFILE: A REvIEW OF INJURY HOSPITALISATIONS DURINg 1989–1990 TO 2003–2004
Robertson, L. Injury epidemiology: Research and control strategies. New York, Oxford University Press,
1998.
Schmertmann, M., Finch, C., and Williamson, A. NSW Injury profile: A review of injury deaths during
1998–2002. Sydney: NSW Injury Risk Management Research Centre, 2004.
World Health Organization. International classification of diseases 9th Revision. geneva: WHO, 1977.
World Health Organization. International classification of diseases and related health problems 10th
Revision. geneva: WHO, 1992.

/ 71REFERENCES
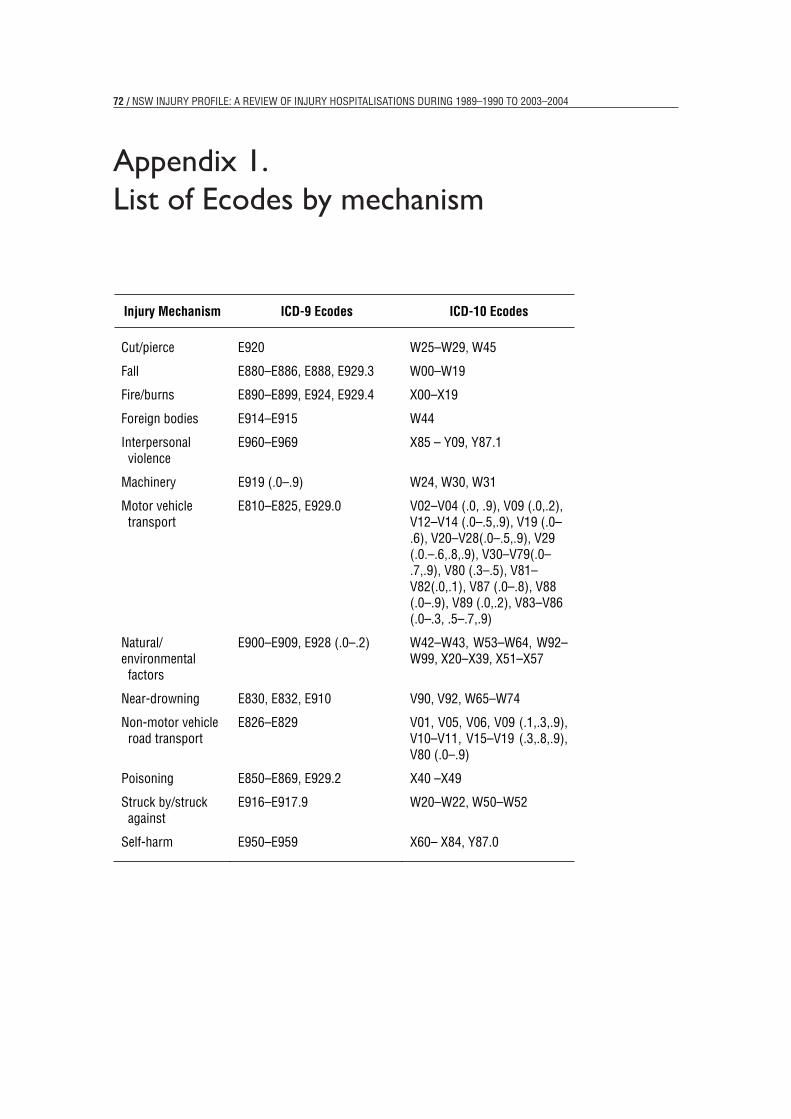
72 / NSW INJURY PROFILE: A REvIEW OF INJURY HOSPITALISATIONS DURINg 1989–1990 TO 2003–2004
Appendix 1. List of Ecodes by mechanism 75
Appendix 1. List of Ecodes by mechanism
Injury Mechanism ICD-9 Ecodes ICD-10 Ecodes
Cut/pierce E920 W25–W29, W45
Fall E880–E886, E888, E929.3 W00–W19
Fire/burns E890–E899, E924, E929.4 X00–X19
Foreign bodies E914–E915 W44
Interpersonal violence
E960–E969 X85 – Y09, Y87.1
Machinery E919 (.0–.9) W24, W30, W31
Motor vehicle transport
E810–E825, E929.0 V02–V04 (.0, .9), V09 (.0,.2), V12–V14 (.0–.5,.9), V19 (.0– .6), V20–V28(.0–.5,.9), V29 (.0.–.6,.8,.9), V30–V79(.0–.7,.9), V80 (.3–.5), V81–V82(.0,.1), V87 (.0–.8), V88 (.0–.9), V89 (.0,.2), V83–V86 (.0–.3, .5–.7,.9)
Natural/environmental factors
E900–E909, E928 (.0–.2) W42–W43, W53–W64, W92–W99, X20–X39, X51–X57
Near-drowning E830, E832, E910 V90, V92, W65–W74
Non-motor vehicleroad transport
E826–E829 V01, V05, V06, V09 (.1,.3,.9), V10–V11, V15–V19 (.3,.8,.9), V80 (.0–.9)
Poisoning E850–E869, E929.2 X40 –X49
Struck by/struck against
E916–E917.9 W20–W22, W50–W52
Self-harm E950–E959 X60– X84, Y87.0
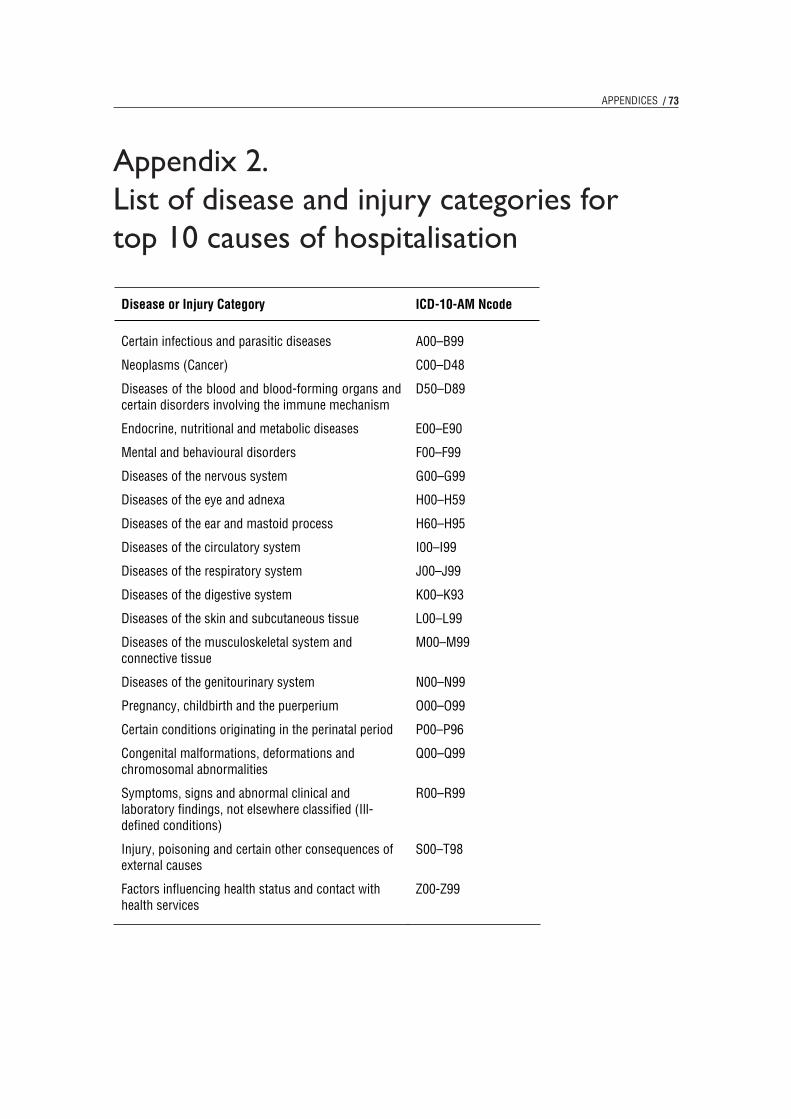
/ 73APPENDICES
Appendix 2. List of disease and injury categories for top 10 causes of hospitalisation
76
Appendix 2. List of disease and injury categories for top 10 causes of hospitalisation
Disease or Injury Category ICD-10-AM Ncode
Certain infectious and parasitic diseases A00–B99
Neoplasms (Cancer) C00–D48
Diseases of the blood and blood-forming organs and certain disorders involving the immune mechanism
D50–D89
Endocrine, nutritional and metabolic diseases E00–E90
Mental and behavioural disorders F00–F99
Diseases of the nervous system G00–G99
Diseases of the eye and adnexa H00–H59
Diseases of the ear and mastoid process H60–H95
Diseases of the circulatory system I00–I99
Diseases of the respiratory system J00–J99
Diseases of the digestive system K00–K93
Diseases of the skin and subcutaneous tissue L00–L99
Diseases of the musculoskeletal system and connective tissue
M00–M99
Diseases of the genitourinary system N00–N99
Pregnancy, childbirth and the puerperium O00–O99
Certain conditions originating in the perinatal period P00–P96
Congenital malformations, deformations and chromosomal abnormalities
Q00–Q99
Symptoms, signs and abnormal clinical and laboratory findings, not elsewhere classified (Ill-defined conditions)
R00–R99
Injury, poisoning and certain other consequences of external causes
S00–T98
Factors influencing health status and contact with health services
Z00-Z99

74 / NSW INJURY PROFILE: A REvIEW OF INJURY HOSPITALISATIONS DURINg 1989–1990 TO 2003–2004
Appendix 3. List of Ecodes by injury mechanism and injury mechanism subcategory
77
Appendix 3. List of Ecodes by injury mechanism and injury mechanism subcategory
Injury Mechanism Injury Mechanism
Subcategory
ICD-10 Ecodes
Cut/pierce W25–W29, W45 Sharp glass W25 Knives W26 Other hand tools W27 Lawnmower W28 Other powered household
goods W29
Other mechanism All remaining cut/pierce Ecodes
Fall W00–W19 Same level W00-W03, W18 While being carried W04 One level to another W05–W09,W14,W15,W17 Stairs/steps W10 Ladder or scaffolding W11, W12 Building or other structure W13 Diving or jumping into water W16 Unspecified type All remaining falls Ecodes
Fire/burns X00–X19Building fire X00, X02 Fire-not in a building X01, X03 Ignition of flammable material X04 Burn - contact with heat and
hot substances X10–X19
Other and unspecified type All remaining fire/burn Ecodes
Foreign bodies W44 Interpersonal
violence (IPV) X85 – Y09, Y87.1
Poisoning X85, X87–X90 Suffocation X91 Firearm X93–X95 Sharp or blunt object X99, Y00 Bodily force Y04–Y05, Y07 Other and unspecified means All remaining IPV Ecodes
Machinery W24, W30, W31 Agricultural W30 Lifting and transmission W24 Other and unspecified W31 Motor vehicle
transport (MVT) V02–V04 (.0, .9), V09 (.0,.2), V12–V14 (.0–.5,.9), V19 (.0– .6), V20–V28(.0–.5,.9), V29 (.0.–.6,.8,.9), V30–V79(.0–.7,.9), V80 (.3–.5), V81–V82(.0,.1), V87 (.0–.8), V88 (.0–.9), V89 (.0,.2), V83–V86 (.0–.3, .5–.7,.9)

/ 75APPENDICES
77
Appendix 3. List of Ecodes by injury mechanism and injury mechanism subcategory
Injury Mechanism Injury Mechanism
Subcategory
ICD-10 Ecodes
Cut/pierce W25–W29, W45 Sharp glass W25 Knives W26 Other hand tools W27 Lawnmower W28 Other powered household
goods W29
Other mechanism All remaining cut/pierce Ecodes
Fall W00–W19 Same level W00-W03, W18 While being carried W04 One level to another W05–W09,W14,W15,W17 Stairs/steps W10 Ladder or scaffolding W11, W12 Building or other structure W13 Diving or jumping into water W16 Unspecified type All remaining falls Ecodes
Fire/burns X00–X19Building fire X00, X02 Fire-not in a building X01, X03 Ignition of flammable material X04 Burn - contact with heat and
hot substances X10–X19
Other and unspecified type All remaining fire/burn Ecodes
Foreign bodies W44 Interpersonal
violence (IPV) X85 – Y09, Y87.1
Poisoning X85, X87–X90 Suffocation X91 Firearm X93–X95 Sharp or blunt object X99, Y00 Bodily force Y04–Y05, Y07 Other and unspecified means All remaining IPV Ecodes
Machinery W24, W30, W31 Agricultural W30 Lifting and transmission W24 Other and unspecified W31 Motor vehicle
transport (MVT) V02–V04 (.0, .9), V09 (.0,.2), V12–V14 (.0–.5,.9), V19 (.0– .6), V20–V28(.0–.5,.9), V29 (.0.–.6,.8,.9), V30–V79(.0–.7,.9), V80 (.3–.5), V81–V82(.0,.1), V87 (.0–.8), V88 (.0–.9), V89 (.0,.2), V83–V86 (.0–.3, .5–.7,.9)
78
Injury Mechanism Injury Mechanism
Subcategory
ICD-10 Ecodes
MV occupant—traffic V30–V79(.4–.7,.9), V83–V86 (.0–.3)
MV occupant—non-traffic V30–V79(.0–.3), V83–V86 (.5–.7,.9)
Motorcycle—traffic V20–V28(.3–.5,.9), V29 (.4.–.6,.8,.9)
Motorcycle—non-traffic V20–V28 (.0–.2), V29 (.0–.3) Pedal cyclist—traffic V12–V14 (.3–.5,.9), V19 (.4–
.6)Pedal cyclist –non-traffic V12–V14 (.0–.2), V19 (.0–.2) Pedestrian—traffic V02–V04 (.1, .9), V09 (.2) Pedestrian—non-traffic V02–V04 (.0), V09 (.0) Other and unspecified user—
trafficV80 (.3–.5), V81–V82 (.1), V87 (.0–.8), V89 (.2)
Other and unspecified user—non-traffic
V81–V82 (.0), V88 (.0–.9), V89 (.0)
Natural/ environmental factors
W42–W43, W53–W64, W92–W99, X20–X39, X51–X57
Venomous plants/ animals X20-X29 Bitten or struck by dog W54 Bitten or struck by other
mammals (excluding dogs) W53, W55
Non-venomous insects W57 Excess temperature W92-W93, X30-X31 Plant thorns and spines W60 Reptiles W58-W59 Air pressure W94 Contact with marine animals W56 Natural events X32-X39 Other All remaining
natural/environmental Ecodes
Near-drowning V90, V92, W65–W74 Boat-related V90.0–.9, V92.0–.9 Bathtub W65, W66 Pools W67, W68 Natural water W69, W70 Other and unspecified
locationAll remaining drowning Ecodes
Non-motor vehicle road transport
V01, V05, V06, V09 (.1,.3,.9), V10–V11,V15–V19 (.3,.8,.9), V80 (.0–.9)
Pedestrian V01, V05, V06, V09 (.1,.3,.9) Pedal cyclist V10, V11, V15–V19 (.3,.8,.9)
Animal rider V80 (.0–.9)
Poisoning X40 –X49 Other pharmaceuticals X40, X43–X44 Antidepressants, barbiturates,
tranquilisers X41
Narcotics and hallucinogens X42 Alcohol X45

76 / NSW INJURY PROFILE: A REvIEW OF INJURY HOSPITALISATIONS DURINg 1989–1990 TO 2003–2004
78
Injury Mechanism Injury Mechanism
Subcategory
ICD-10 Ecodes
MV occupant—traffic V30–V79(.4–.7,.9), V83–V86 (.0–.3)
MV occupant—non-traffic V30–V79(.0–.3), V83–V86 (.5–.7,.9)
Motorcycle—traffic V20–V28(.3–.5,.9), V29 (.4.–.6,.8,.9)
Motorcycle—non-traffic V20–V28 (.0–.2), V29 (.0–.3) Pedal cyclist—traffic V12–V14 (.3–.5,.9), V19 (.4–
.6)Pedal cyclist –non-traffic V12–V14 (.0–.2), V19 (.0–.2) Pedestrian—traffic V02–V04 (.1, .9), V09 (.2) Pedestrian—non-traffic V02–V04 (.0), V09 (.0) Other and unspecified user—
trafficV80 (.3–.5), V81–V82 (.1), V87 (.0–.8), V89 (.2)
Other and unspecified user—non-traffic
V81–V82 (.0), V88 (.0–.9), V89 (.0)
Natural/ environmental factors
W42–W43, W53–W64, W92–W99, X20–X39, X51–X57
Venomous plants/ animals X20-X29 Bitten or struck by dog W54 Bitten or struck by other
mammals (excluding dogs) W53, W55
Non-venomous insects W57 Excess temperature W92-W93, X30-X31 Plant thorns and spines W60 Reptiles W58-W59 Air pressure W94 Contact with marine animals W56 Natural events X32-X39 Other All remaining
natural/environmental Ecodes
Near-drowning V90, V92, W65–W74 Boat-related V90.0–.9, V92.0–.9 Bathtub W65, W66 Pools W67, W68 Natural water W69, W70 Other and unspecified
locationAll remaining drowning Ecodes
Non-motor vehicle road transport
V01, V05, V06, V09 (.1,.3,.9), V10–V11,V15–V19 (.3,.8,.9), V80 (.0–.9)
Pedestrian V01, V05, V06, V09 (.1,.3,.9) Pedal cyclist V10, V11, V15–V19 (.3,.8,.9)
Animal rider V80 (.0–.9)
Poisoning X40 –X49 Other pharmaceuticals X40, X43–X44 Antidepressants, barbiturates,
tranquilisers X41
Narcotics and hallucinogens X42 Alcohol X45
77
Appendix 3. List of Ecodes by injury mechanism and injury mechanism subcategory
Injury Mechanism Injury Mechanism
Subcategory
ICD-10 Ecodes
Cut/pierce W25–W29, W45 Sharp glass W25 Knives W26 Other hand tools W27 Lawnmower W28 Other powered household
goods W29
Other mechanism All remaining cut/pierce Ecodes
Fall W00–W19 Same level W00-W03, W18 While being carried W04 One level to another W05–W09,W14,W15,W17 Stairs/steps W10 Ladder or scaffolding W11, W12 Building or other structure W13 Diving or jumping into water W16 Unspecified type All remaining falls Ecodes
Fire/burns X00–X19Building fire X00, X02 Fire-not in a building X01, X03 Ignition of flammable material X04 Burn - contact with heat and
hot substances X10–X19
Other and unspecified type All remaining fire/burn Ecodes
Foreign bodies W44 Interpersonal
violence (IPV) X85 – Y09, Y87.1
Poisoning X85, X87–X90 Suffocation X91 Firearm X93–X95 Sharp or blunt object X99, Y00 Bodily force Y04–Y05, Y07 Other and unspecified means All remaining IPV Ecodes
Machinery W24, W30, W31 Agricultural W30 Lifting and transmission W24 Other and unspecified W31 Motor vehicle
transport (MVT) V02–V04 (.0, .9), V09 (.0,.2), V12–V14 (.0–.5,.9), V19 (.0– .6), V20–V28(.0–.5,.9), V29 (.0.–.6,.8,.9), V30–V79(.0–.7,.9), V80 (.3–.5), V81–V82(.0,.1), V87 (.0–.8), V88 (.0–.9), V89 (.0,.2), V83–V86 (.0–.3, .5–.7,.9)
79
Injury Mechanism Injury Mechanism
Subcategory
ICD-10 Ecodes
Gases and vapours X47 Other and unspecified drug or
substance All remaining poisoning Ecodes
Self-harm X60– X84, Y87.0 Poisoning X60-–X69 Suffocation X70 Drowning X71 Firearm X72–X74 Sharp or blunt object X78 Jumping from building or
other high structure X80, X81
Jumping/lying in front of moving object
X81
Other and unspecified means All remaining suicide Ecodes
Struck by/against W20–W22, W50–W52 Falling object W20 Caught between two objects W23 Other/unspecified All remaining struck by/struck
against Ecodes
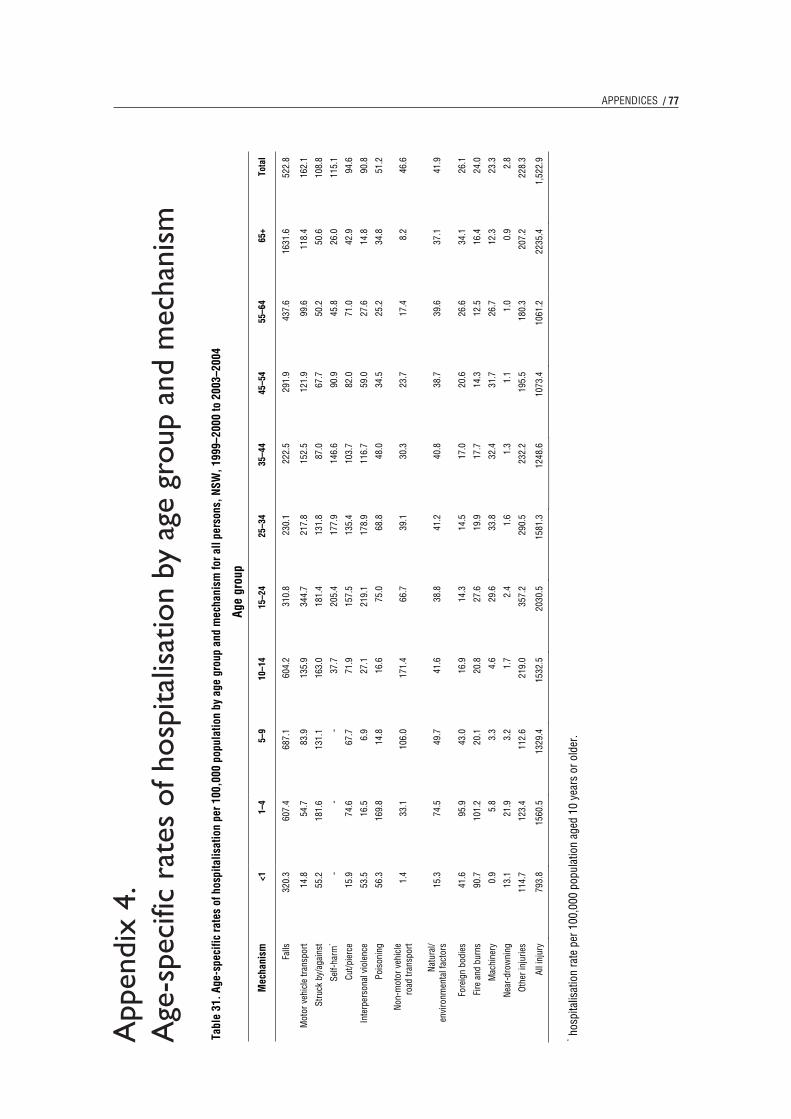
/ 77
App
endi
x 4.
A
ge-s
peci
fic r
ates
of h
ospi
talis
atio
n by
age
gro
up a
nd m
echa
nism
APPENDICES
78
App
endi
x 4.
Age
-spe
cific
rat
es o
f hos
pita
lisat
ion
by a
ge g
roup
and
mec
hani
sm
Tab
le 3
1. A
ge-s
peci
fic ra
tes
of h
ospi
talis
atio
n pe
r 100
,000
pop
ulat
ion
by a
ge g
roup
and
mec
hani
sm fo
r all
pers
ons,
NSW
, 199
9–20
00 to
200
3–20
04
Age
grou
p
Mec
hani
sm<1
1–
4 5–
9 10
–14
15–2
4 25
–34
35–4
4 45
–54
55–6
4 65
+ To
tal
Falls
32
0.3
607.
4 68
7.1
604.
2 31
0.8
230.
1 22
2.5
291.
9 43
7.6
1631
.6
522.
8
Mot
or v
ehic
le tr
ansp
ort
14.8
54
.7
83.9
13
5.9
344.
7 21
7.8
152.
5 12
1.9
99.6
11
8.4
162.
1
Stru
ck b
y/ag
ains
t 55
.2
181.
6 13
1.1
163.
0 18
1.4
131.
8 87
.0
67.7
50
.2
50.6
10
8.8
Self-
harm
* -
- -
37.7
20
5.4
177.
9 14
6.6
90.9
45
.8
26.0
11
5.1
Cut/p
ierc
e 15
.9
74.6
67
.7
71.9
15
7.5
135.
4 10
3.7
82.0
71
.0
42.9
94
.6
Inte
rper
sona
l vio
lenc
e 53
.5
16.5
6.
9 27
.1
219.
1 17
8.9
116.
7 59
.0
27.6
14
.8
90.8
Pois
onin
g 56
.3
169.
8 14
.8
16.6
75
.0
68.8
48
.0
34.5
25
.2
34.8
51
.2
Non
-mot
or v
ehic
le
road
tran
spor
t 1.
4 33
.1
106.
0 17
1.4
66.7
39
.1
30.3
23
.7
17.4
8.
2 46
.6
Nat
ural
/ en
viro
nmen
tal f
acto
rs
15.3
74
.5
49.7
41
.6
38.8
41
.2
40.8
38
.7
39.6
37
.1
41.9
Fore
ign
bodi
es
41.6
95
.9
43.0
16
.9
14.3
14
.5
17.0
20
.6
26.6
34
.1
26.1
Fire
and
bur
ns
90.7
10
1.2
20.1
20
.8
27.6
19
.9
17.7
14
.3
12.5
16
.4
24.0
Mac
hine
ry
0.9
5.8
3.3
4.6
29.6
33
.8
32.4
31
.7
26.7
12
.3
23.3
Nea
r-dr
owni
ng
13.1
21
.9
3.2
1.7
2.4
1.6
1.3
1.1
1.0
0.9
2.8
Othe
r inj
urie
s 11
4.7
123.
4 11
2.6
219.
0 35
7.2
290.
5 23
2.2
195.
5 18
0.3
207.
2 22
8.3
All i
njur
y 79
3.8
1560
.5
1329
.4
1532
.5
2030
.5
1581
.3
1248
.6
1073
.4
1061
.2
2235
.4
1,52
2.9
* h
ospi
talis
atio
n ra
te p
er 1
00,0
00 p
opul
atio
n ag
ed 1
0 ye
ars
or o
lder
.
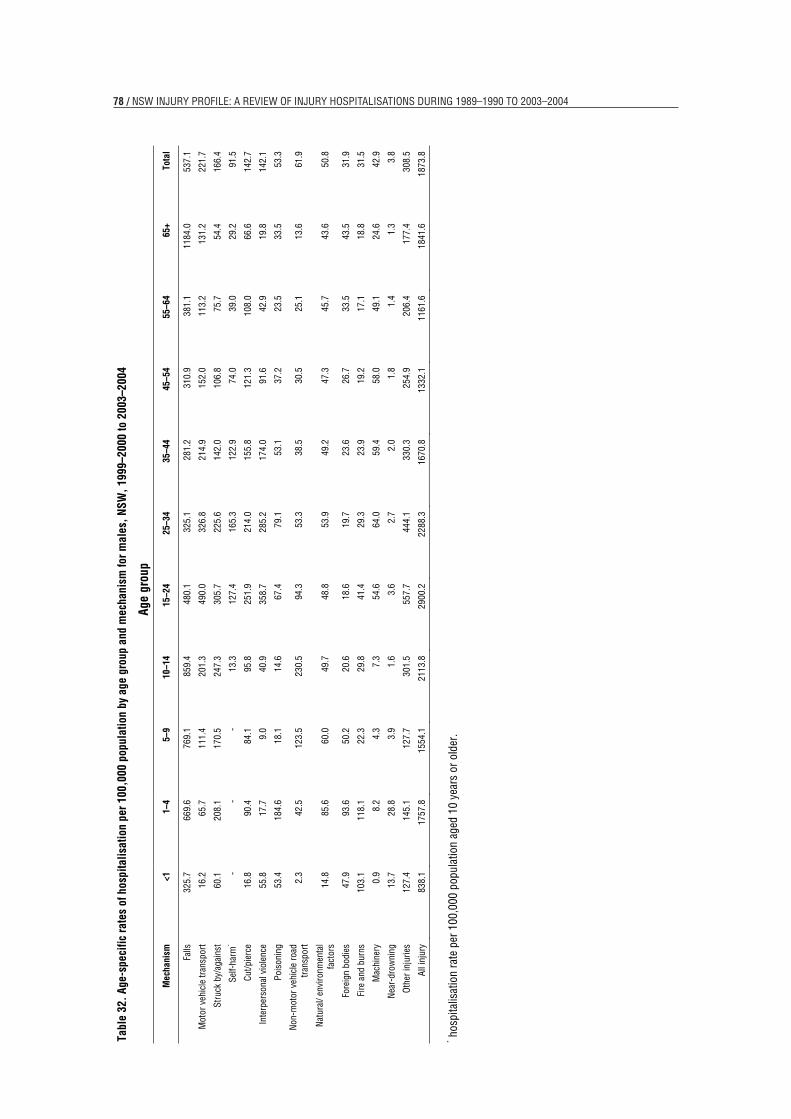
78 / NSW INJURY PROFILE: A REvIEW OF INJURY HOSPITALISATIONS DURINg 1989–1990 TO 2003–200479
Tabl
e 32
. Age
-spe
cific
rate
s of
hos
pita
lisat
ion
per 1
00,0
00 p
opul
atio
n by
age
gro
up a
nd m
echa
nism
for m
ales
, NSW
, 199
9–20
00 to
200
3–20
04
Age
grou
p
Mec
hani
sm
<1
1–4
5–9
10–1
4 15
–24
25–3
4 35
–44
45–5
4 55
–64
65+
Tota
l
Falls
32
5.7
669.
6 76
9.1
859.
4 48
0.1
325.
1 28
1.2
310.
9 38
1.1
1184
.0
537.
1
Mot
or v
ehic
le tr
ansp
ort
16.2
65
.7
111.
4 20
1.3
490.
0 32
6.8
214.
9 15
2.0
113.
2 13
1.2
221.
7
Stru
ck b
y/ag
ains
t 60
.1
208.
1 17
0.5
247.
3 30
5.7
225.
6 14
2.0
106.
8 75
.7
54.4
16
6.4
Self-
harm
* -
- -
13.3
12
7.4
165.
3 12
2.9
74.0
39
.0
29.2
91
.5
Cut/p
ierc
e 16
.8
90.4
84
.1
95.8
25
1.9
214.
0 15
5.8
121.
3 10
8.0
66.6
14
2.7
Inte
rper
sona
l vio
lenc
e 55
.8
17.7
9.
0 40
.9
358.
7 28
5.2
174.
0 91
.6
42.9
19
.8
142.
1
Pois
onin
g 53
.4
184.
6 18
.1
14.6
67
.4
79.1
53
.1
37.2
23
.5
33.5
53
.3
Non
-mot
or v
ehic
le ro
ad
tran
spor
t2.
3 42
.5
123.
5 23
0.5
94.3
53
.3
38.5
30
.5
25.1
13
.6
61.9
Nat
ural
/ env
ironm
enta
l fa
ctor
s14
.8
85.6
60
.0
49.7
48
.8
53.9
49
.2
47.3
45
.7
43.6
50
.8
Fore
ign
bodi
es
47.9
93
.6
50.2
20
.6
18.6
19
.7
23.6
26
.7
33.5
43
.5
31.9
Fire
and
bur
ns
103.
1 11
8.1
22.3
29
.8
41.4
29
.3
23.9
19
.2
17.1
18
.8
31.5
Mac
hine
ry
0.9
8.2
4.3
7.3
54.6
64
.0
59.4
58
.0
49.1
24
.6
42.9
Nea
r-dr
owni
ng
13.7
28
.8
3.9
1.6
3.6
2.7
2.0
1.8
1.4
1.3
3.8
Othe
r inj
urie
s 12
7.4
145.
1 12
7.7
301.
5 55
7.7
444.
1 33
0.3
254.
9 20
6.4
177.
4 30
8.5
All i
njur
y 83
8.1
1757
.8
1554
.1
2113
.8
2900
.2
2288
.3
1670
.8
1332
.1
1161
.6
1841
.6
1873
.8
* h
ospi
talis
atio
n ra
te p
er 1
00,0
00 p
opul
atio
n ag
ed 1
0 ye
ars
or o
lder
.

/ 79APPENDICES80
Tabl
e 33
. Age
-spe
cific
rate
s of
hos
pita
lisat
ion
per 1
00,0
00 p
opul
atio
n by
age
gro
up a
nd m
echa
nism
for f
emal
es, N
SW, 1
999–
2000
to 2
003–
2004
Age
grou
p
Mec
hani
sm
<1
1–4
5–9
10–1
4 15
–24
25–3
4 35
–44
45–5
4 55
–64
65+
Tota
l
Falls
31
4.6
541.
8 60
0.8
336.
0 13
3.9
135.
9 16
3.7
273.
1 49
5.1
1930
.3
487.
7
Mot
or v
ehic
le tr
ansp
ort
13.3
43
.1
55.0
67
.1
193.
1 10
9.8
90.1
91
.7
85.7
10
9.8
101.
8
Stru
ck b
y/ag
ains
t 50
.0
153.
8 89
.6
74.3
51
.7
38.7
32
.0
28.5
24
.1
45.2
49
.8
Self-
harm
* -
- -
63.3
28
7.1
190.
2 17
0.2
107.
8 52
.8
24.0
13
9.6
Cut/p
ierc
e 14
.9
58.0
50
.5
46.8
59
.1
57.5
51
.6
42.6
33
.2
22.8
46
.3
Inte
rper
sona
l vio
lenc
e 51
.2
15.2
4.
6 12
.6
73.7
73
.6
59.4
26
.3
12.0
10
.7
38.8
Pois
onin
g 59
.3
154.
1 11
.2
18.7
83
.0
58.5
42
.9
31.8
27
.0
35.6
49
.0
Non
-mot
or v
ehic
le ro
ad
tran
spor
t0.
5 23
.2
87.6
10
9.3
37.9
25
.0
22.1
16
.8
9.5
3.8
30.9
Nat
ural
/ env
ironm
enta
l fa
ctor
s15
.9
62.9
38
.8
33.1
28
.4
28.7
32
.4
30.1
33
.5
31.5
32
.9
Fore
ign
bodi
es
35.0
98
.3
35.5
12
.9
9.7
9.3
10.4
14
.5
19.4
26
.2
20.4
Fire
and
bur
ns
77.5
83
.4
17.7
11
.3
13.1
10
.5
11.6
9.
4 7.
8 14
.3
16.4
Mac
hine
ry
1.0
3.3
2.3
1.8
3.5
3.9
5.4
5.3
3.7
1.8
3.7
Nea
r-dr
owni
ng
12.5
14
.7
2.3
1.9
1.1
0.6
0.5
0.3
0.7
0.5
1.7
Oth
er in
jurie
s 10
1.3
100.
6 96
.7
132.
4 14
8.0
138.
2 13
4.0
135.
9 15
3.5
226.
4 14
5.3
All i
njur
y 74
6.9
1352
.4
1092
.6
921.
6 11
23.3
88
0.3
826.
4 81
4.1
958.
1 24
83.1
11
45.6
* h
ospi
talis
atio
n ra
te p
er 1
00,0
00 p
opul
atio
n ag
ed 1
0 ye
ars
or o
lder
.