
NSIAD-98-57 Defense Spending and Employment: Information
69
United States General Accounting Office GAO Report to the Chairman, Committee on the Budget, U.S. Senate January 1998 DEFENSE SPENDING AND EMPLOYMENT Information Limitations Impede Thorough Assessments GAO/NSIAD-98-57
Transcript of NSIAD-98-57 Defense Spending and Employment: Information
United States General Accounting Office
GAO Report to the Chairman, Committee onthe Budget, U.S. Senate
January 1998 DEFENSE SPENDINGAND EMPLOYMENT
InformationLimitations ImpedeThorough Assessments
GAO/NSIAD-98-57

GAO United States
General Accounting Office
Washington, D.C. 20548
National Security and
International Affairs Division
B-276819
January 14, 1998
The Honorable Pete V. DomeniciChairman, Committee on the BudgetUnited States Senate
Dear Mr. Chairman:
The size of the defense budget is a pressing issue in the wake of thepost-Cold War reduction in defense spending and the priorities ofbalancing the federal budget. Moreover, the difficulties of determining theimpacts and outcomes of budget decisions add to existing challenges.Congress and other decisionmakers have a practical and continuous needfor information on defense-related expenditures and employment in states.In response to your request, and discussions with your office, weexamined defense and other federal spending in the state of New Mexico.Specifically, we examined (1) characteristics of New Mexico’s economyand changes in it; (2) the amount of direct defense-related andnondefense-related federal spending in the state and the direct federalemployment associated with both, over time; and (3) the extent to whichavailable government data can provide reliable information on defensespending and employment. The last issue became a major component ofour study, since the quality of the data directly affects what can beconcluded about defense spending and employment.
Background In 1996, the federal government spent $1.4 trillion in U.S. states andterritories to procure products and services, to fund grants and otherassistance, to pay salaries and wages to federal employees, to providepublic assistance, and to fund federal retirement programs and SocialSecurity, among other things. Some states rank relatively high on the percapita distribution of different types of federal dollars. Governmentreports indicate that in 1996, Maryland, Virginia, and Alaska were the onlythree states to rank among the top five in each of the following categories:(1) total federal expenditures, (2) total federal procurement expenditures,and (3) total salary and wage expenditures for federal workers. The onlyother state that ranked among the top 10 states in all these categories wasNew Mexico.
Interest in the economic magnitude of defense and other federalexpenditures in states has been amplified by concerns over anticipatedoutcomes of the post-Cold War drawdown. In hearings before the Joint
GAO/NSIAD-98-57 Defense Spending and EmploymentPage 1
B-276819
Economic Committee of the 101st Congress, 12 state governors1 submittedto the leadership of the Senate and House a plan for responding toexpected adverse economic impacts in states that were believed to beparticularly vulnerable to reductions in defense spending. In 1992,President Bush issued Executive Order 12788, requiring the Secretary ofDefense to identify the problems of states, regions, and other areas thatresult from base closures and Department of Defense (DOD)contract-related adjustments. The Office of Economic Adjustment is DOD’sprimary office responsible for providing assistance to communities,regions, and states “adversely impacted by significant Defense programchanges.”
The federal government tracks defense-related and other federal spendingand associated employment through various sources. Centralizedreporting of this information is done by the Census Bureau in itsConsolidated Federal Funds Report (CFFR) series. The CFFR includes theFederal Expenditures by State (FES) report and a separate two-reportvolume that presents information at the county and subcounty level. TheFES report presents the most comprehensive information on federalexpenditures at the state level that can actually be attributed to specificfederal agencies or programs. Agencies involved in collecting andreporting various types of employment information include the Office ofPersonnel Management (OPM) and the Bureau of Labor Statistics.
Expenditure information reported in the CFFR also appears inagency-specific publications or data sources. DOD reports information onits total procurement expenditures and the salaries and wages paid to DOD
personnel, by state, in the Atlas/Data Abstract for the United States andSelected Areas. In compiling information for the CFFR, DOD’s procurementdata are first sent to the Federal Procurement Data System (FPDS) and thensent to Census. Therefore, Census, DOD, and the FPDS can and do reportDOD procurement expenditures.
Federal expenditure and employment data are available to users in andoutside the government and are regularly used in policy formulation andevaluation. DOD contractors, including the Logistics Management Institute,have used federal government data in support of their work for DOD on theeconomic impacts of base realignment and closure actions. The Office ofEconomic Conversion Information, a collaborative effort between theEconomic Development Administration of the Department of Commerce
1Governors from Arkansas, Colorado, Connecticut, Louisiana, Maryland, Massachusetts, Michigan,Mississippi, New Jersey, New York, Ohio, and Washington.
GAO/NSIAD-98-57 Defense Spending and EmploymentPage 2
B-276819
and DOD, uses existing federal data to provide information to communities,businesses, and individuals adjusting to the effects of defense downsizingand other changing economic conditions. The Congressional Budget Officeand the Congressional Research Service have also used DOD procurementexpenditure data in examining the expected effects of planned reductionsin the national defense budget. DOD uses its prime contract awardexpenditure data to track the status and progress of goals associated withcontracts made to small businesses. Researchers at think tanks,universities, and state government offices also use government data in awide array of research projects and publications.
Results in Brief New Mexico is home to two Department of Energy (DOE) nationallaboratories and four DOD military installations, among other federalactivities. State officials indicate that New Mexico’s economy is “heavilydependent” upon federal expenditures. In 1996, New Mexico was fourthamong states in the per capita distribution of federal dollars and first inreturn on federal tax dollars, receiving $1.93 in federal outlays for every$1.00 paid in federal taxes. While parts of the state have relatively strongand growing economies, in 1994 New Mexico’s poverty rate was thesecond highest in the country and its per capita income was 48th in thecountry. Although defense-related spending has been declining, NewMexico’s gross state product and total per capita income have beenincreasing, indicating that the economy is growing and that efforts todiversify the economy may be having a positive effect.
One can learn several things from the available federal governmentexpenditure and employment data for New Mexico. DOD and DOE
expenditures have consistently represented the largest share of all federalexpenditures for procurement and salaries and wages in New Mexico.Defense-related employment has also consistently represented the largestshare of total federal employment in New Mexico, including retired federalworkers. DOD and DOE do not contribute equally on types of defense-relatedspending or defense-related employment, revealing relevant distinctionsbetween the types of direct economic contributions made by theseagencies. DOE contributes most in federal procurement expenditures andprivate contractor employment. DOD contributes most in federal salariesand wages and federal employment, namely active duty military andretired DOD employees.
Existing government data, however, contributes to only a partialunderstanding of the type of federal dollars that enter a state’s economy
GAO/NSIAD-98-57 Defense Spending and EmploymentPage 3
B-276819
and the employment supported by the expenditures. Our research basedon New Mexico shows that the data have multiple limitations that restrictthe ability to determine the total amount and distribution of federalfunding and jobs in the state. Key limitations that generally apply includereporting thresholds that exclude millions in procurement expenditures;the reporting of the value of an obligation, rather than the money actuallyspent; the absence of any comprehensive source of primary data thatsystematically identifies private sector employment associated withfederal contracts; and DOD’s lack of data on subcontracts. Since these datasources are not unique to New Mexico, these limitations would also applyto assessments of federal funding and employment in other states.Existing data are not without value, but those who rely on federal dataneed to be alert to their drawbacks and exercise discretion when usingthem.
Federal DollarsContribute to NewMexico Economy, butEconomy IsDiversifying
DOE and DOD military activities have contributed substantially to theeconomy of New Mexico for about 50 years. Government data show thatbetween 1988 and 1996, New Mexico was ranked second, third, or fourth,among U.S. states in per capita distribution of federal dollars. In terms ofper capita federal procurement expenditures only, New Mexico wasranked first among U.S. states during 1988-94 and second in 1995-96. In1996, New Mexico was ranked first among states in return on federal taxdollars, receiving $1.93 in federal outlays for every $1.00 in federal taxespaid. The state was also ranked first in return on federal tax dollars in1995. In 1996, 5 of the 6 major federal facilities were among the top 10 employers in the state.
This federal revenue comes largely from the six major federal facilities inNew Mexico, including two DOE national laboratories, Los Alamos NationalLaboratory and Sandia National Laboratory; Cannon, Holloman, andKirtland Air Force Bases; and White Sands Missile Range, a test range thatsupports missile development and test programs for all the services, theNational Aeronautics and Space Administration (NASA); and othergovernment agencies and private industry. New Mexico’s geography andclimate, including relative isolation from major population centers,year-round good weather, and open airspace, have made the stateattractive for some military activities. In May 1996, the Secretary ofDefense and the German Defense Minister activated the German Air ForceTactical Training Center at Holloman Air Force Base in Alamogordo. Thetraining opportunities provided by the vast airspace in and aroundHolloman and its proximity to Fort Bliss, Texas—the headquarters
GAO/NSIAD-98-57 Defense Spending and EmploymentPage 4
B-276819
location for German air force operations in North America—were factorsin Germany’s decision to invest in a tactical training center at the base.State officials estimate that the training center will result in a populationincrease to the Alamogordo area of about 7 percent and investment byGermany of $155 million by 1999.
Services and trade are distinct components of New Mexico’s economy. In1993, the largest employment sectors in New Mexico were services,government, and trade: these were reported as accounting forapproximately 76 percent of the total average annual state employment.2
Businesses involved in trade and/or services accounted for 67 percent ofall businesses in New Mexico in 1993. Revenue from the gross receipts taxis the highest source of tax revenue in New Mexico, and in 1996, grossreceipt taxes from services and trade accounted for more than half of allgross receipts tax revenue. DOE reports show that between 1990 and 1995,it made more expenditures in the services and trade sectors of the NewMexico economy. New Mexico Department of Labor projections indicatethat by 2005, the services sector will alone account for about 41 percent oftotal employment while employment in the trade sector is projected toremain stable and government employment is expected to decline. Theprojections indicate that jobs in services and trade will account for70 percent of the new jobs between 1993 and 2005.
New Mexico state officials have been focusing on “achieving economicdiversification to protect against dramatic negative changes in the state’seconomy,” believed to be linked to changes in federal spending in thestate. Efforts in 1996 to recruit select industries to the state have initiallyresulted in at least 7 businesses locating to New Mexico, creating 230 newjobs. In terms of other efforts, New Mexico was 8th among U.S. states inhigh-technology employment growth between 1990 and 1995.3 The singleleading high-technology industry in the state is semiconductormanufacturing, which accounts for 34 percent of total high-technologyjobs. Intel Corporation has three advanced computer chip manufacturingsites that employ at least 6,500 people making it the state’s second-largest
2The service sector includes employment associated with hotels and other lodging places, personalservices, business services, health services, legal services, educational services, and others. The tradesector includes wholesale trade of durable and nondurable goods and retail trade at generalmerchandise stories, food stores, automobile dealers and service stations, eating and drinking places,and other retail trade. The government sector includes federal, state, and local governmentemployment.
3Cyberstates: A State-By-State Overview of the High-Technology Industry. American ElectronicsAssociation, Washington, D.C., 1997. There is no conventional, standard accepted definition ofhigh-technology or high-technology industry. Thus, definitions of high-technology industries can varygreatly depending upon what combination of products and services are selected.
GAO/NSIAD-98-57 Defense Spending and EmploymentPage 5

B-276819
private sector employer and contributing to the growth in New Mexico’shigh-technology employment. In 1995, Intel was also the leadingmanufacturing employer in the state. High-technology exports account forthe largest percentage of New Mexico exports to other countries, withexports to Korea leading other nations.4 Currently, about 10 percent of allNew Mexico manufacturers are exporting. The leading exporters in NewMexico are Intel, Motorola, and Honeywell Defense Avionics.
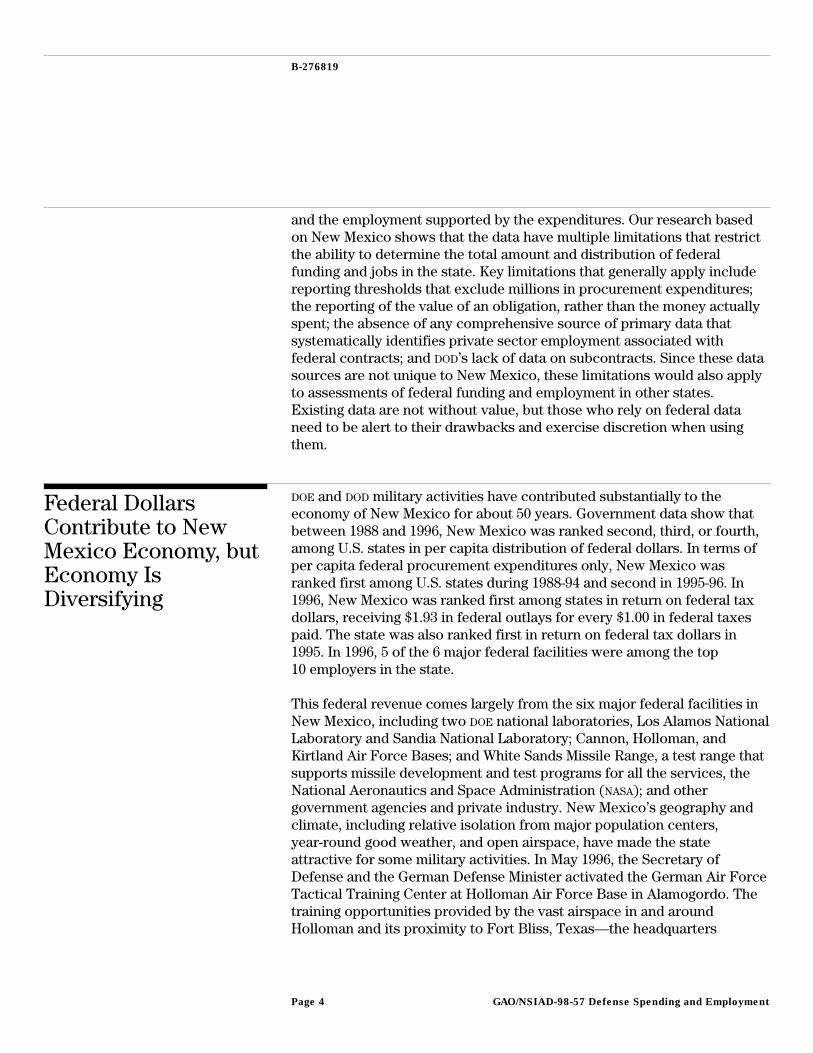
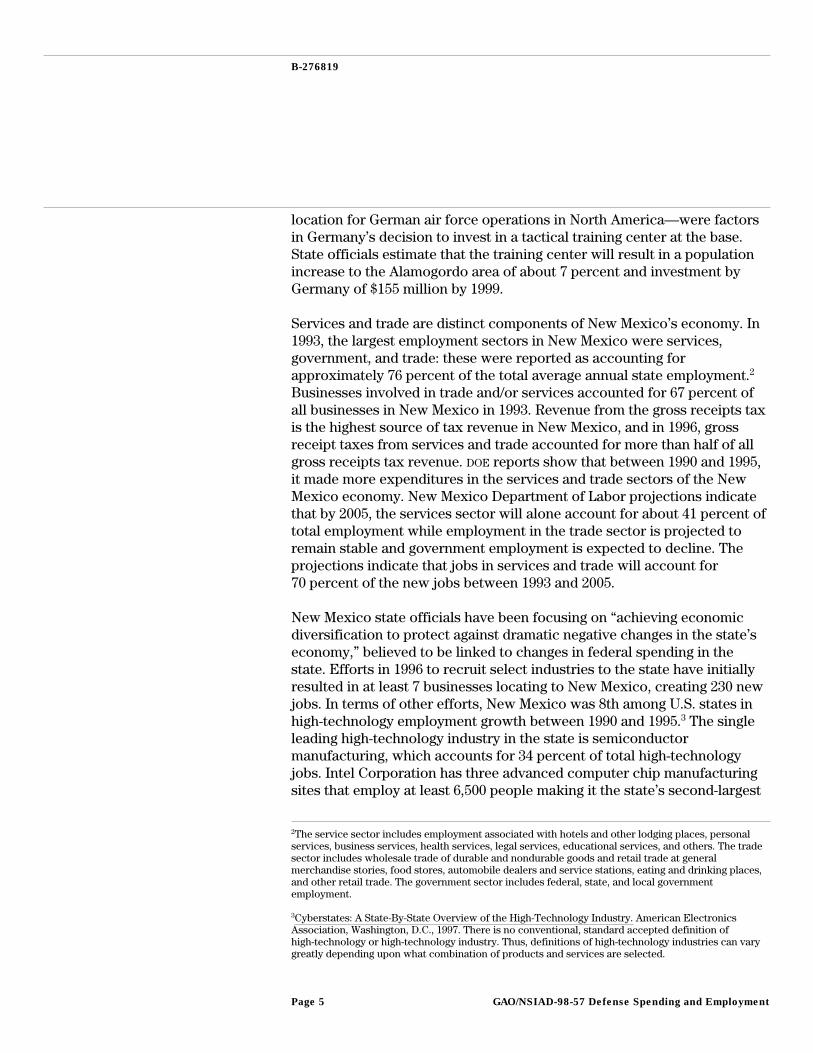
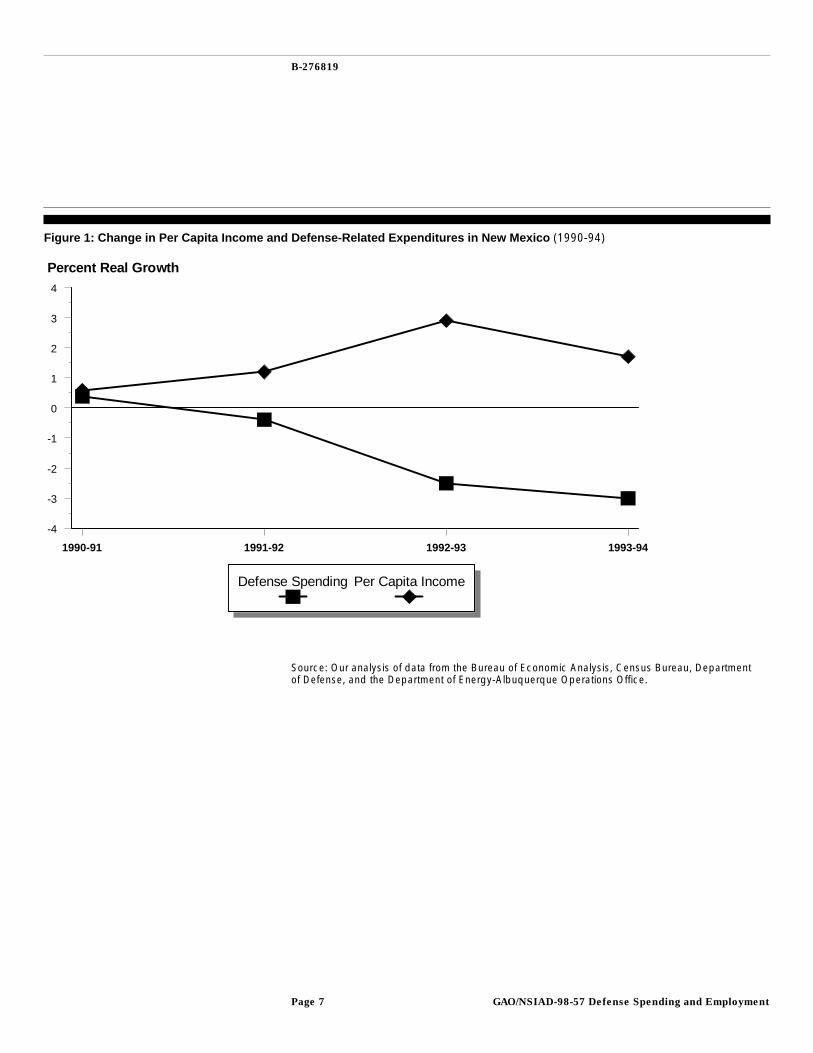
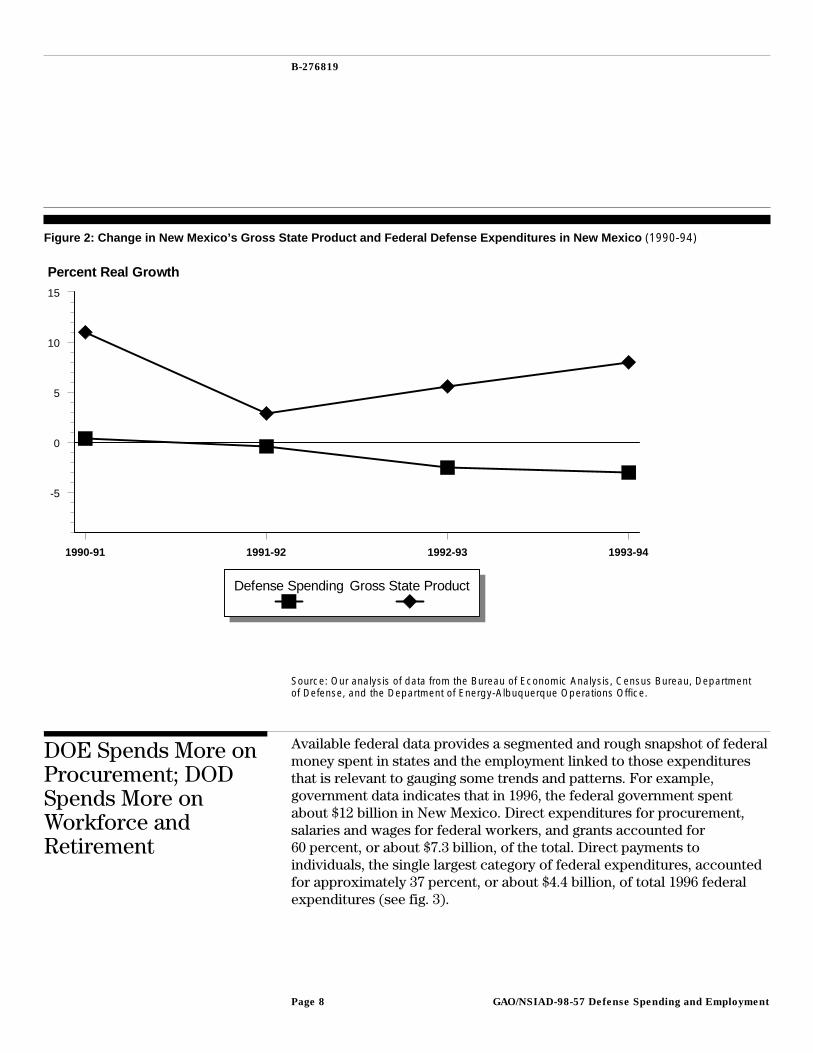
A comparison of the percent change in New Mexico’s per capita incomeand total defense-related spending (DOE and DOD) in the state during1990-94 shows that real growth occurred in per capita income, while totaldefense expenditures declined (see fig.1). A comparison between percentreal growth in New Mexico’s gross state product and total defense-relatedfederal expenditures reveals the same pattern, suggesting that efforts todiversify the state’s economy may be having a positive effect (see fig. 2).Based on the average rate of growth in the gross state product during1987-94, the Bureau of Economic Analysis identified New Mexico as thethird-fastest-growing state.
4The Trade Division of the New Mexico Economic Development Department defines high-technologyindustry as the composite of all exports originating from three industry sectors: electronic and otherelectric equipment and components, except computer equipment; industrial machinery and computerequipment; and measuring analyzing and controlling instruments, photographic, medical, and opticalgoods, and watches and clocks.
GAO/NSIAD-98-57 Defense Spending and EmploymentPage 6
B-276819
Figure 1: Change in Per Capita Income and Defense-Related Expenditures in New Mexico (1990-94)
1990-91 1991-92 1992-93 1993-94
-4
-3
-2
-1
0
1
2
3
4
Percent Real Growth
Defense Spending Per Capita Income
Source: Our analysis of data from the Bureau of Economic Analysis, Census Bureau, Departmentof Defense, and the Department of Energy-Albuquerque Operations Office.
GAO/NSIAD-98-57 Defense Spending and EmploymentPage 7
B-276819
Figure 2: Change in New Mexico’s Gross State Product and Federal Defense Expenditures in New Mexico (1990-94)
1990-91 1991-92 1992-93 1993-94
-5
0
5
10
15
Percent Real Growth
Defense Spending Gross State Product
Source: Our analysis of data from the Bureau of Economic Analysis, Census Bureau, Departmentof Defense, and the Department of Energy-Albuquerque Operations Office.
DOE Spends More onProcurement; DODSpends More onWorkforce andRetirement
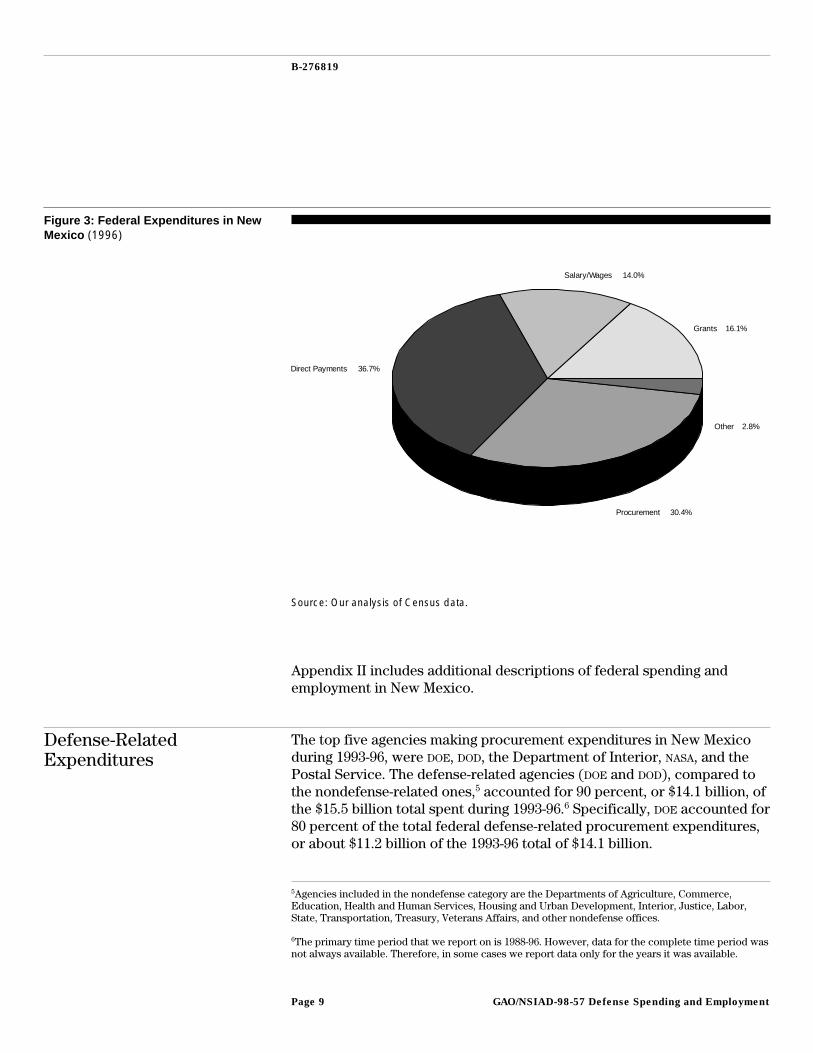
Available federal data provides a segmented and rough snapshot of federalmoney spent in states and the employment linked to those expendituresthat is relevant to gauging some trends and patterns. For example,government data indicates that in 1996, the federal government spentabout $12 billion in New Mexico. Direct expenditures for procurement,salaries and wages for federal workers, and grants accounted for 60 percent, or about $7.3 billion, of the total. Direct payments toindividuals, the single largest category of federal expenditures, accountedfor approximately 37 percent, or about $4.4 billion, of total 1996 federalexpenditures (see fig. 3).
GAO/NSIAD-98-57 Defense Spending and EmploymentPage 8
B-276819
Figure 3: Federal Expenditures in NewMexico (1996)
Grants
Salary/Wages
Direct Payments
Procurement
Other
16.1%
14.0%
36.7%
30.4%
2.8%
Source: Our analysis of Census data.
Appendix II includes additional descriptions of federal spending andemployment in New Mexico.
Defense-RelatedExpenditures
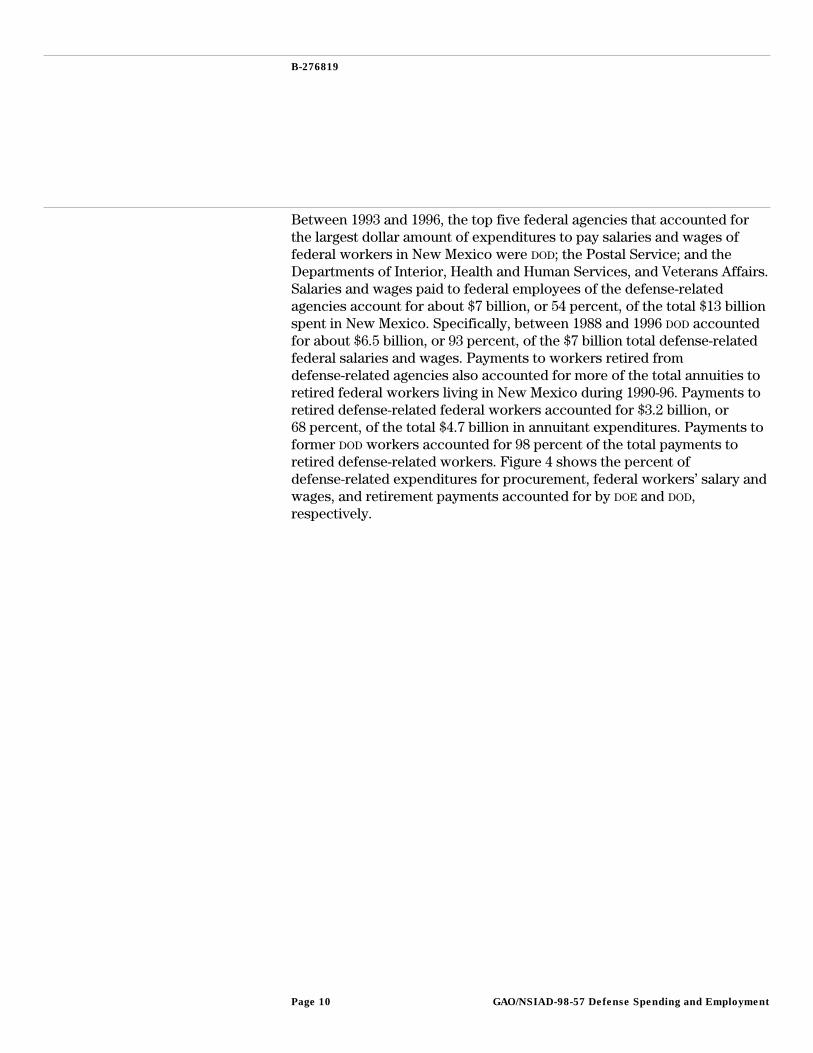
The top five agencies making procurement expenditures in New Mexicoduring 1993-96, were DOE, DOD, the Department of Interior, NASA, and thePostal Service. The defense-related agencies (DOE and DOD), compared tothe nondefense-related ones,5 accounted for 90 percent, or $14.1 billion, ofthe $15.5 billion total spent during 1993-96.6 Specifically, DOE accounted for80 percent of the total federal defense-related procurement expenditures,or about $11.2 billion of the 1993-96 total of $14.1 billion.
5Agencies included in the nondefense category are the Departments of Agriculture, Commerce,Education, Health and Human Services, Housing and Urban Development, Interior, Justice, Labor,State, Transportation, Treasury, Veterans Affairs, and other nondefense offices.
6The primary time period that we report on is 1988-96. However, data for the complete time period wasnot always available. Therefore, in some cases we report data only for the years it was available.
GAO/NSIAD-98-57 Defense Spending and EmploymentPage 9
B-276819
Between 1993 and 1996, the top five federal agencies that accounted forthe largest dollar amount of expenditures to pay salaries and wages offederal workers in New Mexico were DOD; the Postal Service; and theDepartments of Interior, Health and Human Services, and Veterans Affairs.Salaries and wages paid to federal employees of the defense-relatedagencies account for about $7 billion, or 54 percent, of the total $13 billionspent in New Mexico. Specifically, between 1988 and 1996 DOD accountedfor about $6.5 billion, or 93 percent, of the $7 billion total defense-relatedfederal salaries and wages. Payments to workers retired fromdefense-related agencies also accounted for more of the total annuities toretired federal workers living in New Mexico during 1990-96. Payments toretired defense-related federal workers accounted for $3.2 billion, or 68 percent, of the total $4.7 billion in annuitant expenditures. Payments toformer DOD workers accounted for 98 percent of the total payments toretired defense-related workers. Figure 4 shows the percent ofdefense-related expenditures for procurement, federal workers’ salary andwages, and retirement payments accounted for by DOE and DOD,respectively.
GAO/NSIAD-98-57 Defense Spending and EmploymentPage 10
B-276819
Figure 4: Defense-RelatedExpenditures Accounted for by DOEand DOD
80%
20%
Procurement
7%
93%
Salaries
2%98%
Retirement
DOE DOD
Note: Procurement expenditure data is the total during 1993-96, salary expenditure data is thetotal during 1988-96, and retirement payment data is the total during 1990-96.
Defense-RelatedEmployment
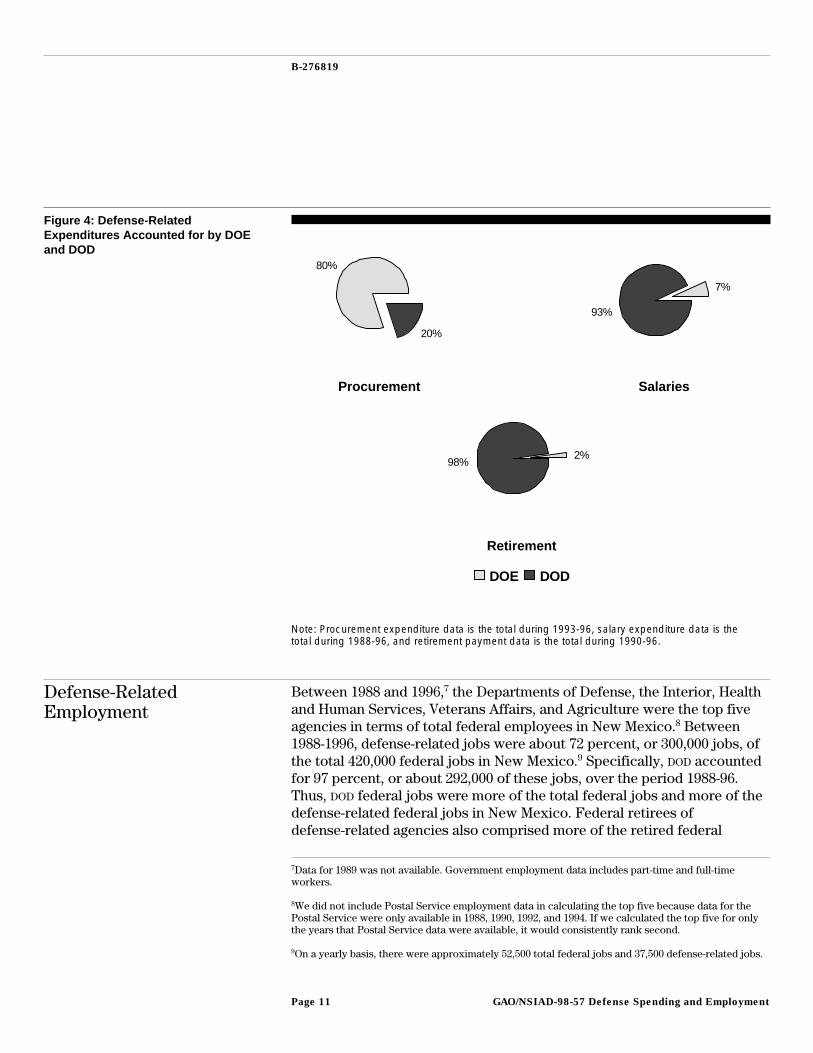
Between 1988 and 1996,7 the Departments of Defense, the Interior, Healthand Human Services, Veterans Affairs, and Agriculture were the top fiveagencies in terms of total federal employees in New Mexico.8 Between1988-1996, defense-related jobs were about 72 percent, or 300,000 jobs, ofthe total 420,000 federal jobs in New Mexico.9 Specifically, DOD accountedfor 97 percent, or about 292,000 of these jobs, over the period 1988-96.Thus, DOD federal jobs were more of the total federal jobs and more of thedefense-related federal jobs in New Mexico. Federal retirees ofdefense-related agencies also comprised more of the retired federal
7Data for 1989 was not available. Government employment data includes part-time and full-timeworkers.
8We did not include Postal Service employment data in calculating the top five because data for thePostal Service were only available in 1988, 1990, 1992, and 1994. If we calculated the top five for onlythe years that Postal Service data were available, it would consistently rank second.
9On a yearly basis, there were approximately 52,500 total federal jobs and 37,500 defense-related jobs.
GAO/NSIAD-98-57 Defense Spending and EmploymentPage 11
B-276819
workers living in New Mexico: 68 percent of the total between 1990 and1996. Specifically, DOD accounted for 99 percent of all retirees from thedefense-related agencies. Figure 5 shows the percent of defense-relatedjobs and retirees in New Mexico accounted for by DOE and DOD.
Figure 5: Defense-Related Jobs and Retirees Accounted for by DOE and DOD (1990-96)
3%
97%
Federal Jobs
1%99%
Federal Retirees
DOE DOD
The existing data provides information on federal employees only. This isan important point because although the overall ratio of DOD federalworkers to DOE federal workers was 44:1 between 1988 and 1996, ourresearch also shows that more of the DOE employment is linked to privatecontractors that manage and operate the laboratories and other DOE
facilities than to the number of DOE federal employees. Private contractorsworking on government contracts are not considered or counted asfederal employees. However, even when we compared the total DOE
employment, which included direct DOE prime contractor, subcontractor,and federal employees, to the total DOD federal employment DOD’s directfederal employment was higher than DOE’s in each year between 1990 and1996.
GAO/NSIAD-98-57 Defense Spending and EmploymentPage 12
B-276819
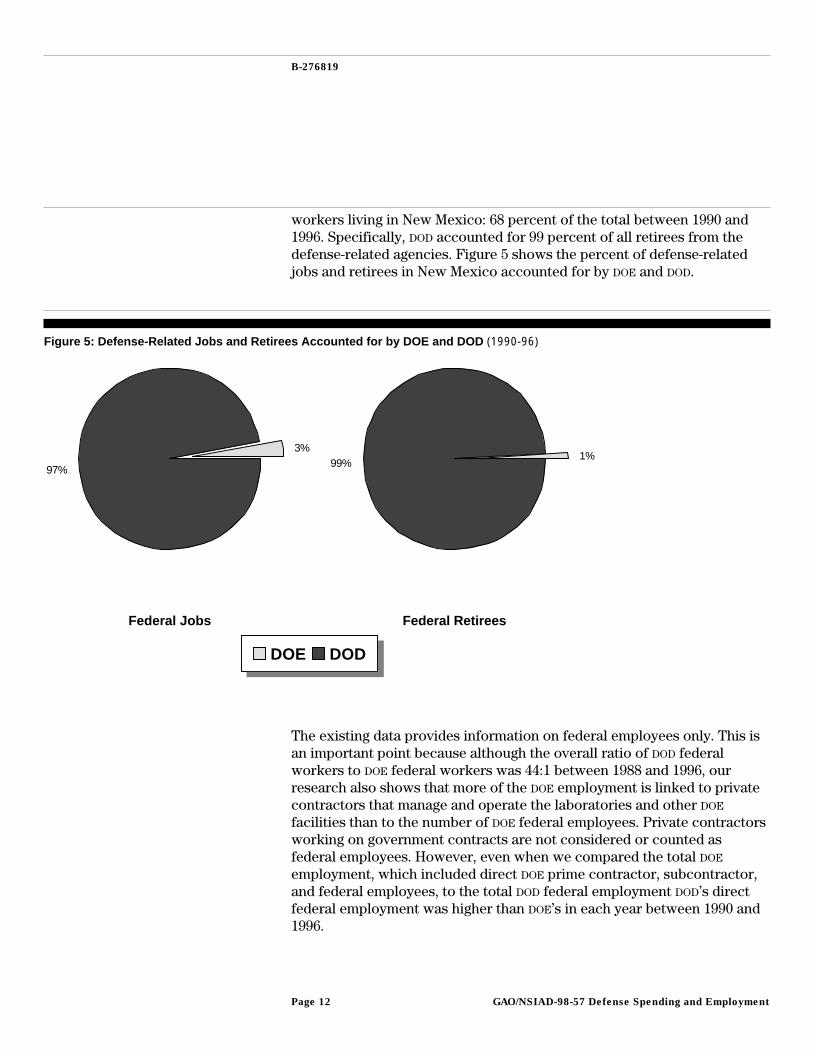
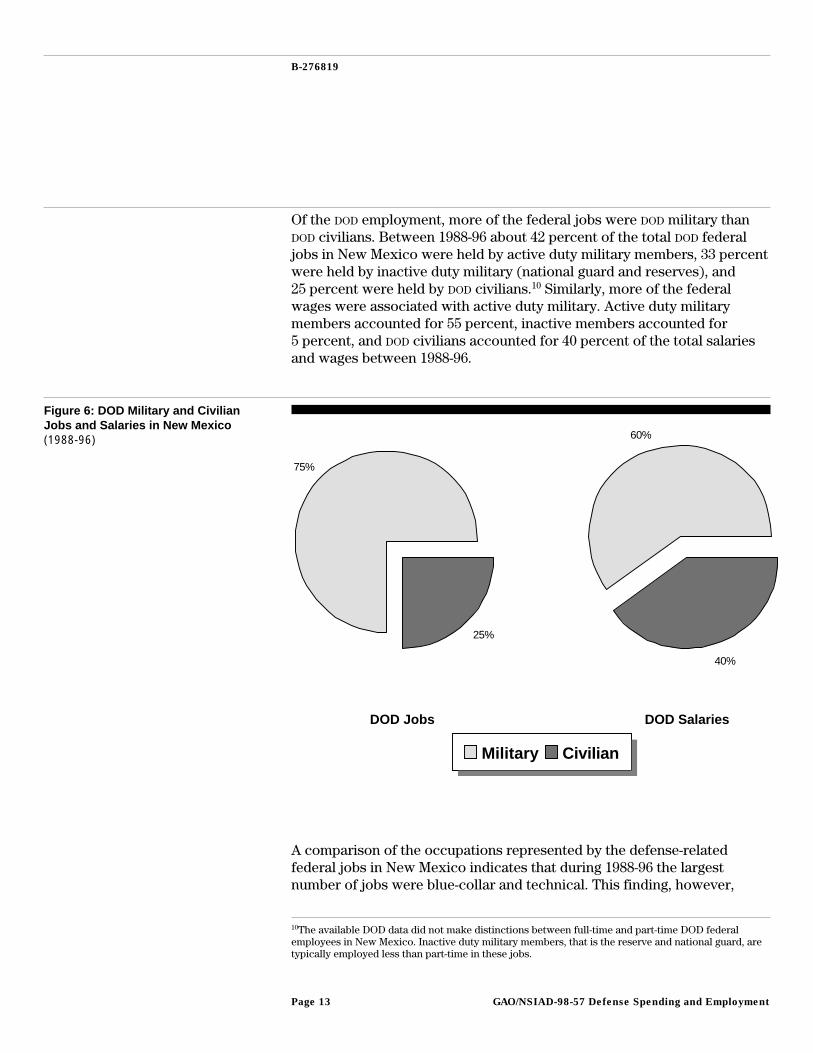
Of the DOD employment, more of the federal jobs were DOD military thanDOD civilians. Between 1988-96 about 42 percent of the total DOD federaljobs in New Mexico were held by active duty military members, 33 percentwere held by inactive duty military (national guard and reserves), and25 percent were held by DOD civilians.10 Similarly, more of the federalwages were associated with active duty military. Active duty militarymembers accounted for 55 percent, inactive members accounted for5 percent, and DOD civilians accounted for 40 percent of the total salariesand wages between 1988-96.
Figure 6: DOD Military and CivilianJobs and Salaries in New Mexico(1988-96)
75%
25%
DOD Jobs
60%
40%
DOD Salaries
Military Civilian
A comparison of the occupations represented by the defense-relatedfederal jobs in New Mexico indicates that during 1988-96 the largestnumber of jobs were blue-collar and technical. This finding, however,
10The available DOD data did not make distinctions between full-time and part-time DOD federalemployees in New Mexico. Inactive duty military members, that is the reserve and national guard, aretypically employed less than part-time in these jobs.
GAO/NSIAD-98-57 Defense Spending and EmploymentPage 13
B-276819
largely represents the patterns for the DOD active duty employment in NewMexico, for which technical and blue-collar jobs comprise about70 percent of the total jobs. Among DOD civilian employees, the twocategories that accounted for the largest number of jobs over the period1988-96 were professional (23 percent of the total jobs) and blue-collar(20 percent of the total jobs).11 The two occupational categories thataccount for more of the DOE direct federal employment in New Mexico areadministrative (30 percent of total jobs) and professional (37 percent oftotal jobs).12
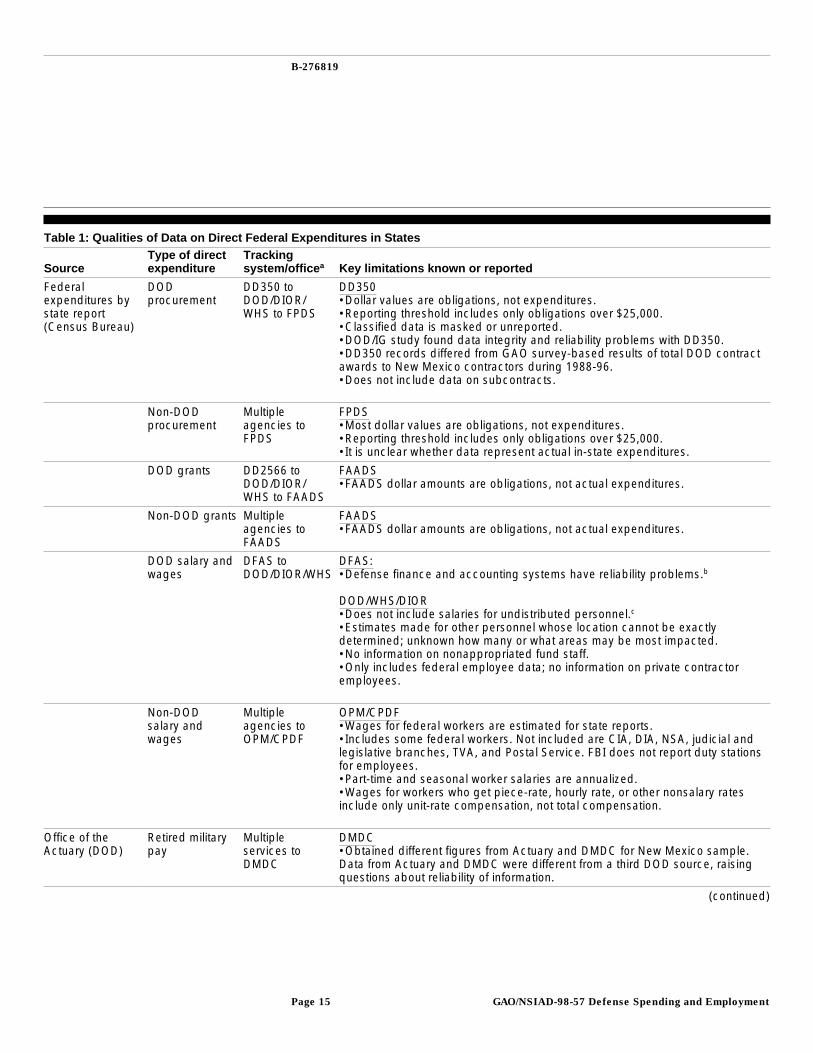
Federal Expenditureand Employment DataAre Incomplete
Official federal data sources are useful for gaining a preliminaryunderstanding of the composition of federal expenditures in states.However, fundamental characteristics of the federal data make it difficultto determine the direct economic impact of federal activities on states. Forexample, our analysis of defense-related expenditures and employmentdid not include information on DOD contractor employment because thereis no official DOD or other federal source of such information. Federalgovernment data sources provide insufficient evidence for determiningwhere federal dollars are actually spent, how much is actually spent, andthe number or type of jobs that the federal dollars directly generatebecause of numerous limitations in scope and coverage and in reportingrequirements or procedures. Our related findings that pertain to the datasources used and reviewed in our work are summarized in tables 1 and 2.
11Occupational categorizations are based on OPM definitions. At New Mexico military installations,examples of occupation titles in the blue-collar category include general aircraft worker, ammunitionrepair worker, general construction worker, electrician, and missile mechanic, among others.Examples of occupation titles in the technical occupational category include air traffic control,medical care and treatment worker, operators/analysts, flight operations, general nuclear weaponsequipment repair, and auditing and accounting, among others. Examples of civilian occupation titles inthe professional category include general engineering, contracting, operations research, physics,accounting, computer engineering, social science, and aerospace engineering, among others.
12Examples of occupation titles in the professional category for DOE employees include generalengineering and general physical science, among others. Examples of occupation titles in theadministrative category include security administration and management program analyst, amongothers.
GAO/NSIAD-98-57 Defense Spending and EmploymentPage 14
B-276819
Table 1: Qualities of Data on Direct Federal Expenditures in States
SourceType of directexpenditure
Trackingsystem/office a Key limitations known or reported
Federalexpenditures bystate report(Census Bureau)
DODprocurement
DD350 toDOD/DIOR/WHS to FPDS
DD350•Dollar values are obligations, not expenditures.•Reporting threshold includes only obligations over $25,000.•Classified data is masked or unreported.•DOD/IG study found data integrity and reliability problems with DD350.•DD350 records differed from GAO survey-based results of total DOD contractawards to New Mexico contractors during 1988-96.•Does not include data on subcontracts.
Non-DODprocurement
Multipleagencies toFPDS
FPDS•Most dollar values are obligations, not expenditures.•Reporting threshold includes only obligations over $25,000.•It is unclear whether data represent actual in-state expenditures.
DOD grants DD2566 toDOD/DIOR/WHS to FAADS
FAADS•FAADS dollar amounts are obligations, not actual expenditures.
Non-DOD grants Multipleagencies toFAADS
FAADS•FAADS dollar amounts are obligations, not actual expenditures.
DOD salary andwages
DFAS toDOD/DIOR/WHS
DFAS:•Defense finance and accounting systems have reliability problems.b
DOD/WHS/DIOR•Does not include salaries for undistributed personnel.c•Estimates made for other personnel whose location cannot be exactlydetermined; unknown how many or what areas may be most impacted.•No information on nonappropriated fund staff.•Only includes federal employee data; no information on private contractoremployees.
Non-DODsalary andwages
Multipleagencies toOPM/CPDF
OPM/CPDF•Wages for federal workers are estimated for state reports.•Includes some federal workers. Not included are CIA, DIA, NSA, judicial andlegislative branches, TVA, and Postal Service. FBI does not report duty stationsfor employees.•Part-time and seasonal worker salaries are annualized.•Wages for workers who get piece-rate, hourly rate, or other nonsalary ratesinclude only unit-rate compensation, not total compensation.
Office of theActuary (DOD)
Retired militarypay
Multipleservices toDMDC
DMDC•Obtained different figures from Actuary and DMDC for New Mexico sample.Data from Actuary and DMDC were different from a third DOD source, raisingquestions about reliability of information.
(continued)
GAO/NSIAD-98-57 Defense Spending and EmploymentPage 15
B-276819
SourceType of directexpenditure
Trackingsystem/office a Key limitations known or reported
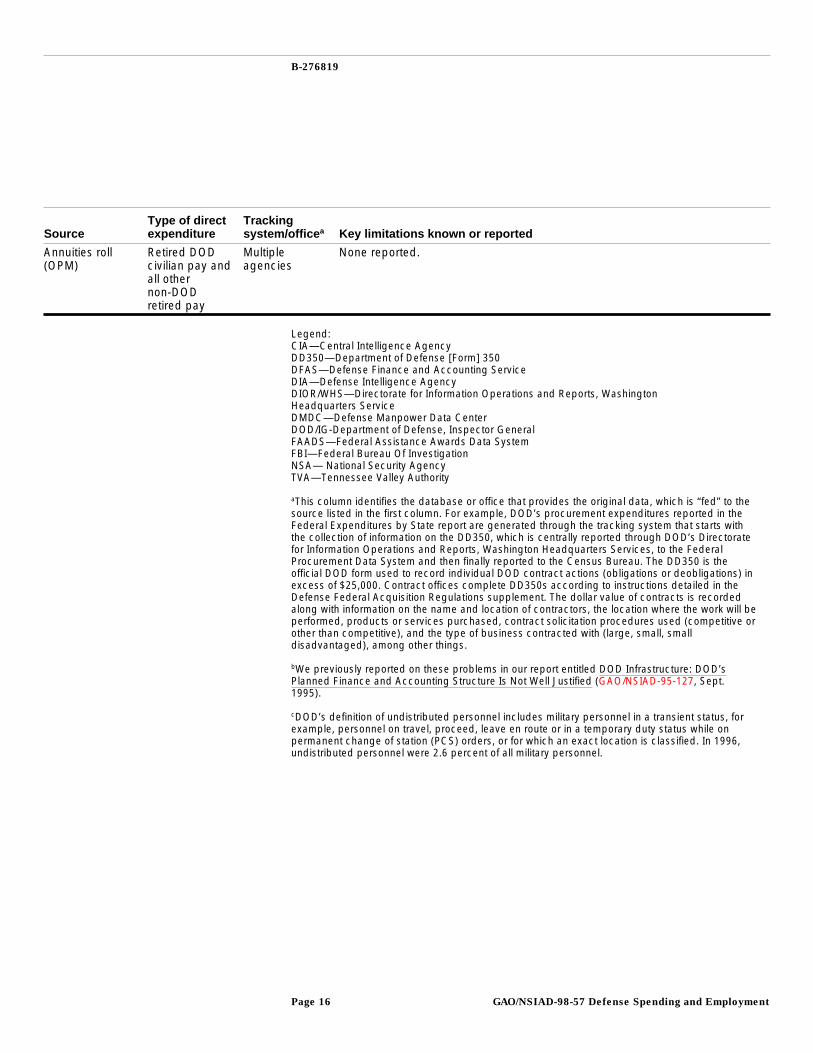
Annuities roll(OPM)
Retired DODcivilian pay andall othernon-DODretired pay
Multipleagencies
None reported.
Legend:CIA—Central Intelligence AgencyDD350—Department of Defense [Form] 350DFAS—Defense Finance and Accounting ServiceDIA—Defense Intelligence AgencyDIOR/WHS—Directorate for Information Operations and Reports, WashingtonHeadquarters ServiceDMDC—Defense Manpower Data CenterDOD/IG-Department of Defense, Inspector GeneralFAADS—Federal Assistance Awards Data SystemFBI—Federal Bureau Of InvestigationNSA— National Security AgencyTVA—Tennessee Valley Authority
aThis column identifies the database or office that provides the original data, which is “fed” to thesource listed in the first column. For example, DOD’s procurement expenditures reported in theFederal Expenditures by State report are generated through the tracking system that starts withthe collection of information on the DD350, which is centrally reported through DOD’s Directoratefor Information Operations and Reports, Washington Headquarters Services, to the FederalProcurement Data System and then finally reported to the Census Bureau. The DD350 is theofficial DOD form used to record individual DOD contract actions (obligations or deobligations) inexcess of $25,000. Contract offices complete DD350s according to instructions detailed in theDefense Federal Acquisition Regulations supplement. The dollar value of contracts is recordedalong with information on the name and location of contractors, the location where the work will beperformed, products or services purchased, contract solicitation procedures used (competitive orother than competitive), and the type of business contracted with (large, small, smalldisadvantaged), among other things.
bWe previously reported on these problems in our report entitled DOD Infrastructure: DOD’sPlanned Finance and Accounting Structure Is Not Well Justified (GAO/NSIAD-95-127, Sept.1995).
cDOD’s definition of undistributed personnel includes military personnel in a transient status, forexample, personnel on travel, proceed, leave en route or in a temporary duty status while onpermanent change of station (PCS) orders, or for which an exact location is classified. In 1996,undistributed personnel were 2.6 percent of all military personnel.
GAO/NSIAD-98-57 Defense Spending and EmploymentPage 16

B-276819
Table 2: Qualities of Data on Direct Federal Employment in States
SourceType of directemployment
Trackingsystem/office Known limitations
Atlas/dataabstractfor the U.S. andselected areas(DOD)
Number of DODactive, inactive,and civilianemployees
DFAS/otherDOD offices toDOD/DIOR/WHS
DFAS:•Defense finance and accounting systems have reliability problems.a
DOD/WHS/DIOR•Does not include undistributed personnel.•Estimates conducted for other personnel whose location cannot be exactlydetermined; unknown how many or what areas may be most impacted.•No information on nonappropriated fund staff.•Only includes federal employee data; no information on private contractoremployees.•No program/system-level contractor employment.
Office of theActuary (DOD)
Number ofretired militarypersonnelreceiving pay
Multipleservices/agencies toDMDC
DMDC•Obtained different figures for total retirees from Actuary and DMDC for NewMexico sample, raising questions about reliability of information.
Annuities Roll(OPM)
Number ofretired DODcivilians and allother non-DODretiredpersonnelreceiving pay
Multipleagencies
None reported.
OPM/CPDF Number of allnon-DODcivilian federalemployees
Multipleagencies
OPM/CPDF•Includes only the number of federal employees; no data on private contractoremployees.•Includes only some federal workers. Does not include CIA, DIA, NSA, judicialand legislative branches, TVA, and Postal Service. FBI does not report dutystations for employees.
Office of Workerand CommunityTransition (DOE)
Number of DOEprimecontractoremployees
Multiple DOEfield offices orfacilities
Office of Worker and Community Transition•Employee counts are not provided by specific location but by major employer,so actual number at specific locations must be assumed.•Some contractor employment is “work for others” and “other work,” not part offunded DOE major program activities.
aWe previously reported on these problems in our report entitled DOD Infrastructure: DOD’sPlanned Finance and Accounting Structure Is Not Well Justified (GAO/NSIAD-95-127, Sept.1995).
To gain further insights into the reliability of the federal government’s datawe focused on characteristics of existing DOD data. Although DOD’sprocurement expenditure data (DD350) is used in broad policy contextsand used to evaluate the status of programs that are believed to beimportant to economic security, the form is not designed to provide
GAO/NSIAD-98-57 Defense Spending and EmploymentPage 17

B-276819
information on all DOD expenditures in a single state or at the nationallevel. Procurement contracts under $25,000 are not included, noinformation on DOD subcontracts of any value are included, and financialdata related to classified programs may or may not be reported or beaccurate.
DOD acknowledges that the DD350 does not completely account for allprocurement expenditures, and although this limitation is generallyunderstood and acknowledged by informed users, the possibleimplications are not. We surveyed the top five DOD contractors in NewMexico to determine how much money they received in DOD primecontracts and subcontracts and compared their responses to DOD’s records(the DD350 data) of their total contracts.13 The comparisons revealed thatin no case were the DOD records of the dollar value of contracts awardedto these companies the same as the contractors’ records. Differencesbetween DOD and contractors’ records ranged from $20 million for primecontracts to $80 million for total contracts. In some cases, the DOD recordsappeared to overstate the amount the contractors received, while in othercases the DOD records appeared to understate the amount.
Our research suggests several possible reasons for the inconsistenciesbetween contractor records and DOD records. For example, expendituresassociated with procurement contracts can leak from a state’s economy ifa company subcontracts part of the work elsewhere. One study reportedthat of $5.2 billion in DOD prime contracts received by McDonnell Douglasin St. Louis, Missouri, less than 3 percent, or $156 million, stayed inMissouri due to out-of-state subcontracting.14 However, from our survey ofcontractors in New Mexico we determined that leakages were moreprevalent for certain types of procurement contracts. While our surveyshowed overall that more than 80 percent of the total DOD prime contractdollars remained in the state, for every year between 1988 and 1996, it alsoshowed that the businesses that predominantly received service contracts,rather than supply and equipment contracts (i.e., major hardgoods/weapons), kept nearly all of the DOD contract money they receivedin the state. This is particularly relevant because other DOD data indicatethat in every year between 1988 and 1996, DOD procurement contracts for
13In order, the top five contractors in New Mexico in 1996 were Lockheed Martin, Honeywell DefenseAvionics, DynCorp, EG&G, and Kit Pack Company. We obtained complete survey data from four of thetop contractors. Lockheed Martin was unable to provide reliable information on the value of DODcontracts they received for work performed in New Mexico. See appendix III for a completediscussion of the contractor survey methods and results.
14R. Atkinson, “Defense Spending Cuts and Regional Economic Impact: An Overview. “ EconomicGeography, 69(2), (1993), pp. 107-122.
GAO/NSIAD-98-57 Defense Spending and EmploymentPage 18
B-276819
services account for the largest dollar volume of contracts to NewMexico.15
Also, service contracts may more likely be under DOD’s $25,000 reportingthreshold16 and therefore excluded from total expenditures as officiallyreported by DOD. Furthermore, injections of dollars from subcontracts without-of-state firms or with other in-state firms are not tracked by DOD, yetwould have been included in the contractors’ records.
Finally, the DOD Inspector General reported in 1989 that the DD350 datahad reliability problems due to instances of unreported contractobligations and other errors in reported data. The Inspector General madeno recommendations and has not assessed the reliability and validity ofthe DD350 contract tracking system since then.
The existing data that track defense-related employment are limited intheir scope, coverage, and reliability. Among the most notable limitation inthe data is the lack of a central or official source of data on private-sectoremployment associated with DOD contracts. Information on the number ofjobs associated with particular defense contracts or weapon programs arerepeatedly discussed in the media and in Congress. Further, DOD has statedthat defense procurement dollars promote the creation of jobs. However,DOD officials have also indicated that they do not collect information onthe job impacts of particular DOD budget decisions.
To obtain information on the employment associated with defensecontracts or the employment linked to particular defense programs, it isnecessary to contact individual defense contractors and/or DOD systemprogram offices directly. The contractor employment data we obtainedfrom our survey of defense contractors in New Mexico is summarized inappendix III, along with other survey findings. The responses from the topfour contractors who provided us data indicated that the total number ofdirect jobs associated with DOD contracts was approximately 19,200 during
15DOD categories of service contracts include the operation of government-owned facilities; automaticdata processing and telecommunications services; architect and engineering services; social services;medical services; and lease or rental of facilities, among others. Other broad categories of DODcontracts include supply and equipment contracts (e.g., weapons) and research, development, testing,and evaluation contracts.
16J.R. Crump, “Sectoral Composition and Spatial Distribution of Department of Defense ServicesProcurement,” Professional Geographer, 45(2), (1993), pp. 286-296.
GAO/NSIAD-98-57 Defense Spending and EmploymentPage 19
B-276819
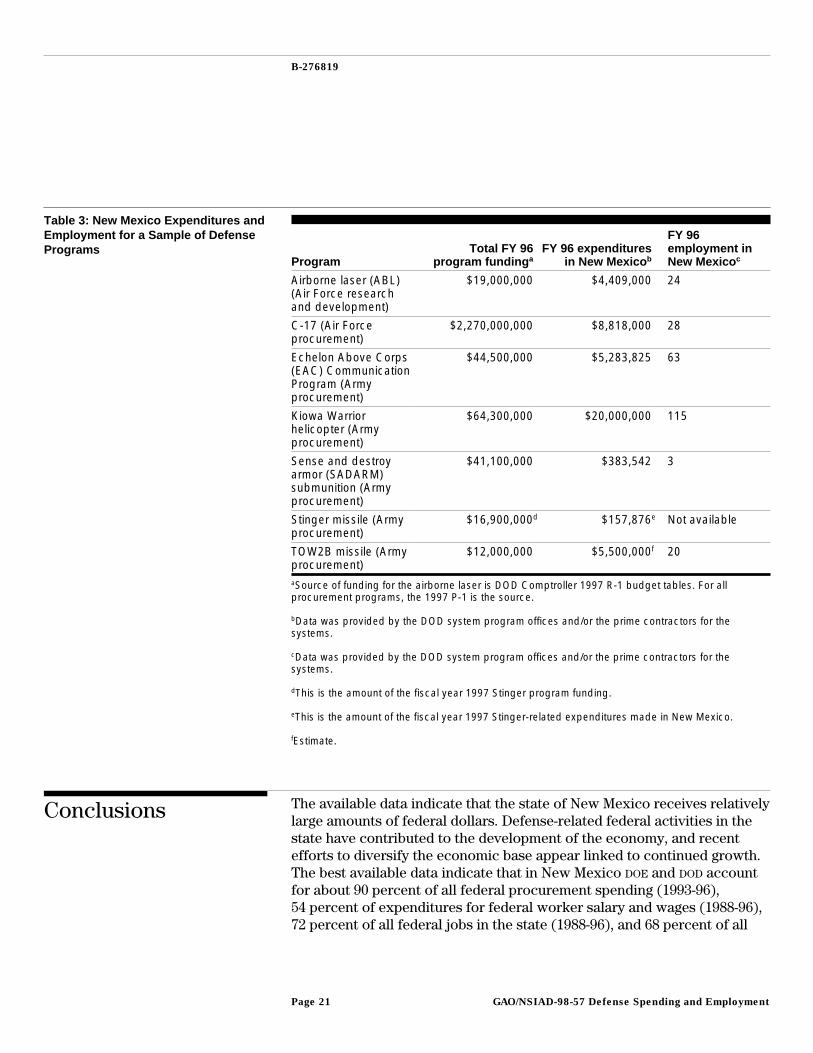
1988-96.17 The total DOD federal employment (active duty, inactive, andcivilians) in the state for the same period (1989 data included) wasapproximately 328,000.18 A comparison of employment data from three topDOE prime contractors to the data from the top four DOD prime contractorsindicates that, over the period 1994-96, DOE had about eight primecontractor employees to every one DOD prime contractor employee in NewMexico.19 We also obtained employment and expenditure data for asample of specific defense programs that were known to have someinvolvement with New Mexico contractors (see table 3).20
17This is approximately 2,100 defense contractor employees on a yearly basis. In its 1996 review of theNew Mexico economy, Sunwest Bank lists New Mexico’s 132 largest employers. Of the top five NewMexico defense contractors we contacted for our survey, only Honeywell appears on the list with aranking as the state’s 45th largest employer.
18This is approximately 36,000 DOD federal employees on a yearly basis.
19This includes DOE prime contractor employment at the Los Alamos and Sandia National laboratoriesand at the Waste Isolation Pilot Plant in Carlsbad.
20DOD’s public affairs office publishes summaries of each contract it awards that exceed $5 million.These DOD summaries, referred to as Blue Tops, are distributed to Congress, the public, the mediaand industry. The contract summaries include information on who the contract was awarded to, thetotal amount of the contract, what the contract is for, and where the work will be done. Thesesummaries can be useful for current event information; however, the information reported can also bemisleading if one is attempting to determine the DOD contract dollars directed to specific states. Forexample, a summary from September 1996 indicated that the Navajo Refining Company in Artesia,New Mexico was awarded an $86-million contract. Although the summary indicated that the workwould be performed in Roswell, New Mexico and El Paso, Texas, data we obtained from other DODoffices indicated that $36,000 of the work was done in New Mexico, whereas $85 million was done inTexas.
GAO/NSIAD-98-57 Defense Spending and EmploymentPage 20
B-276819
Table 3: New Mexico Expenditures andEmployment for a Sample of DefensePrograms
ProgramTotal FY 96
program funding aFY 96 expenditures
in New Mexico b
FY 96employment inNew Mexico c
Airborne laser (ABL)(Air Force researchand development)
$19,000,000 $4,409,000 24
C-17 (Air Forceprocurement)
$2,270,000,000 $8,818,000 28
Echelon Above Corps(EAC) CommunicationProgram (Armyprocurement)
$44,500,000 $5,283,825 63
Kiowa Warriorhelicopter (Armyprocurement)
$64,300,000 $20,000,000 115
Sense and destroyarmor (SADARM)submunition (Armyprocurement)
$41,100,000 $383,542 3
Stinger missile (Armyprocurement)
$16,900,000d $157,876e Not available
TOW2B missile (Armyprocurement)
$12,000,000 $5,500,000f 20
aSource of funding for the airborne laser is DOD Comptroller 1997 R-1 budget tables. For allprocurement programs, the 1997 P-1 is the source.
bData was provided by the DOD system program offices and/or the prime contractors for thesystems.
cData was provided by the DOD system program offices and/or the prime contractors for thesystems.
dThis is the amount of the fiscal year 1997 Stinger program funding.
eThis is the amount of the fiscal year 1997 Stinger-related expenditures made in New Mexico.
fEstimate.
Conclusions The available data indicate that the state of New Mexico receives relativelylarge amounts of federal dollars. Defense-related federal activities in thestate have contributed to the development of the economy, and recentefforts to diversify the economic base appear linked to continued growth.The best available data indicate that in New Mexico DOE and DOD accountfor about 90 percent of all federal procurement spending (1993-96),54 percent of expenditures for federal worker salary and wages (1988-96),72 percent of all federal jobs in the state (1988-96), and 68 percent of all
GAO/NSIAD-98-57 Defense Spending and EmploymentPage 21
B-276819
retired federal workers living in the state (1990-96). Specifically, DOE
accounts for 80 percent of the defense-related procurement expenditures,and DOD accounts for 93 percent of the defense-related salary and wageexpenditures, 97 percent of the defense-related federal jobs, and99 percent of the federal workers retired from defense-related agenciesand living in New Mexico. The largest component of DOE employment isprivate contractor employment, while the largest component of DOD
employment is federal employment, namely active duty military members.
On one hand, determining the full and complete economic magnitude offederal expenditures in states, whether defense or nondefense, and therelated employment is not possible with existing data. Trying to reconciledifferences among data sources and account for gaps or questionable datais very resource-intensive and does not necessarily yield benefits inprecision or accuracy. On the other hand, the existing data are not withoutvalue, nor should the government necessarily strive for increased datacollection that could actually entail more costs than benefits. Thelimitations in federal data may, in part, reflect the fact that data collectiontrails behind changes in federal policy or shifts in policy relevance. Thosewho rely on federal data need to be alert to their drawbacks and exercisediscretion when using them.
Agency Comments In oral comments on a draft of this report, DOD concurred with our findingsand conclusions. It also provided several technical comments, which weincorporated in the text where appropriate.
Scope andMethodology
In conducting our work, we contacted and interviewed officials andexperts from federal and state government offices and the private sector.Because the scope of the work covered all federal expenditures andrelated employment in New Mexico over an 8-year period, there was alarge range and number of contacts and outreach efforts we made incompleting our work. We made over 50 contacts throughout federal andstate governments and the private sector. Our final results were producedfrom databases from four separate federal agencies; our survey of NewMexico defense contractors encompassing 8 years of financial andbusiness information; information obtained from a review of more than 30 publications; and information we obtained from numerous documentedinterviews with key officials. A list of the offices we contacted is inappendix I.
GAO/NSIAD-98-57 Defense Spending and EmploymentPage 22
B-276819
To determine the characteristics of the New Mexico economy and recentchanges in the economy, we reviewed and analyzed economic data andinformation we obtained from interviews with New Mexico state officials,federal government officials, and available federal and state data sources,including the Bureau of Economic Analysis and the Bureau of Businessand Economic Research at the University of New Mexico.
To determine the direct defense-related and nondefense-related federalexpenditures and employment in New Mexico over the period 1988-199621
we contacted multiple federal offices and obtained official data from DOD
and DOE. We obtained data on all other nondefense-related federalexpenditures from the Census Bureau. All available data on DOD and DOE
expenditures were categorized as defense-related.22 We obtained totalnondefense-related employment data from OPM’s Central Personnel DataFile. All expenditure figures were adjusted for inflation and are presentedin constant 1996 dollars. Appendix II contains the complete overview andfigures depicting our findings related to direct federal expenditures andemployment in New Mexico.
To determine the extent to which available government data providesreliable information on defense spending and employment, we evaluatedthe qualities of the existing federal data. We reviewed technicaldocumentation for the sources used, interviewed agency officials aboutthe data sources, conducted crosschecks of data that appeared in multiplesources but had been derived from the same source, and in the case of DOD
procurement expenditures, compared the results of DOD data to our surveyresults. Survey results are discussed in appendix III. Given the outcome ofour review, federal data limitations and data reliability concerns arediscussed in our findings and reflected in the report’s conclusions.
Our work was conducted between November 1996 and October 1997 inaccordance with generally accepted government standards.
21We did not report on indirect or induced effects of federal expenditures. Direct expenditures include,for example, the actual amount of a contract awarded to a business, and direct employment includesthe actual number of jobs created by that contract. Direct expenditures and employment producesome indirect and induced effects. Indirect expenditures include, for example, purchases of suppliesor services that support the contract or the initial direct expenditure. Indirect employment includesthe number of jobs that are created from the indirect expenditures. Induced expenditures andemployment include the effects created by spending from wages earned on retail purchases, housing,and restaurants, among others.
22Some DOD expenditures may be for civil functions not directly related to national defense. DOEprograms include defense, environmental management, and energy research, among others. Thepredominant mission of the national laboratories in New Mexico focus on nuclear weapons researchand engineering. Since the predominant mission of the DOD programs and the DOE programs in NewMexico are defense-related we categorized all the expenditures and employment as defense-related.
GAO/NSIAD-98-57 Defense Spending and EmploymentPage 23
B-276819
As agreed with your office, unless you publicly announce its contentsearlier, we plan no further distribution of this report until 14 days from itsissue date. At that time, we will send copies of this report to otherinterested congressional committees and members. Copies will also bemade available to others upon request.
Please contact me at (202) 512-3092 if you or your staff have any questionsconcerning this report. Major contributors to this report were CarolynCopper, John Oppenheim, and David Bernet.
Sincerely yours,
Kwai-Cheung ChanDirector, Special Studies and Evaluations
GAO/NSIAD-98-57 Defense Spending and EmploymentPage 24

GAO/NSIAD-98-57 Defense Spending and EmploymentPage 25

Contents
Letter 1
Appendix I Offices We Contacted
30Department of Defense, Washington, D.C. 30Department of Energy, Washington, D.C. 30Department of Commerce, Washington, D.C. 30Congressional Agencies, Washington, D.C. 30Federal Facilities, New Mexico 30State Government Offices 31Universities 31Defense Contractors 31Others 31
Appendix II Direct FederalExpenditures andEmployment in NewMexico
32Federal Expenditures in New Mexico 32Defense-Related and Nondefense-Related Federal Expenditures
in New Mexico36
Defense-Related and Nondefense-Related Federal Employment inNew Mexico
41
DOD and DOE Share of Defense-Related Expenditures in NewMexico
42
DOD and DOE Share of Defense-Related Employment in NewMexico
47
Appendix III Survey of Top DefenseContractors in NewMexico
53Survey Methods 53Contractor Background 53Key Limitations 55Survey Findings 56Survey Results Compared to DOD Records 62Summary 64
Tables Table 1: Qualities of Data on Direct Federal Expenditures inStates
15
Table 2: Qualities of Data on Direct Federal Employment inStates
17
Table 3: New Mexico Expenditures and Employment for aSample of Defense Programs
21
GAO/NSIAD-98-57 Defense Spending and EmploymentPage 26
Contents
Figures Figure 1: Change in Per Capita Income and Defense-RelatedExpenditures in New Mexico (1990-94)
7
Figure 2: Change in New Mexico’s Gross State Product andFederal Defense Expenditures in New Mexico (1990-94)
8
Figure 3: Federal Expenditures in New Mexico (1996) 9Figure 4: Defense-Related Expenditures Accounted for by DOE
and DOD11
Figure 5: Defense-Related Jobs and Retirees Accounted for byDOE and DOD (1990-96)
12
Figure 6: DOD Military and Civilian Jobs and Salaries in NewMexico (1988-96)
13
Figure II.1: Federal Expenditures in New Mexico (1988-96) 33Figure II.2: New Mexico Federal Employment (1988-96) 34Figure II.3: Total Federal Spending on Procurement, Grants,
Federal Employee Salaries and Wages, and Direct Payments inNew Mexico (1988-96)
35
Figure II.4: Defense-Related and Nondefense-Related FederalProcurement Expenditures in New Mexico (1993-96)
36
Figure II.5: Defense-Related and Nondefense-Related FederalGrant Expenditures in New Mexico (1988-96)
37
Figure II.6: Salaries and Wages to Defense-Related andNondefense-Related Federal Workers in New Mexico (1988-96)
38
Figure II.7: Distribution of Federal Direct Payments in NewMexico, by Federal Program (1988-96)
39
Figure II.8: Total Annuities for Federal Workers Living in NewMexico and Retired From Defense-Related andNondefense-Related Agencies (1988-96)
40
Figure II.9: Defense-Related and Nondefense-Related FederalEmployment in New Mexico (1988-96)
41
Figure II.10: Federal Retired Workers from Defense andNondefense-Related Agencies Living in New Mexico (1988-96)
42
Figure II.11: DOD and DOE Procurement Expenditures in NewMexico (1993-96)
43
Figure II.12: Annuities to Workers Retired From DOD and DOEand Living in New Mexico (1990-96)
44
Figure II.13: DOD and DOE Retired Federal Workers in NewMexico (1990-96)
45
Figure II.14: DOD and DOE Federal Employee Salary and WageExpenditures in New Mexico (1988-96)
46
Figure II.15: DOE and DOD Employment in New Mexico(1988-96)
47
GAO/NSIAD-98-57 Defense Spending and EmploymentPage 27
Contents
Figure II.16: DOD Active, Inactive, and Civilian Employment inNew Mexico (1988-96)
48
Figure II.17: Salary and Wages for DOD Active and Inactive DutyMembers and DOD Civilians in New Mexico (1988-96)
49
Figure II.18: Job Occupations of DOD Active Duty Military in NewMexico (1988-96)
50
Figure II.19: Job Occupations of DOD Civilians in New Mexico(1988-96)
51
Figure II.20: Job Occupations of DOE Federal Employees in NewMexico (1988-96)
52
Figure III.1: DOD Contracts Awarded to the Top Four NewMexico Defense Contractors (1988-96)
57
Figure III.2: Contract Dollars Received by the Top Four NewMexico Defense Contractors That Stayed in-State (1988-96)
58
Figure III.3: Differences in Percent of Prime Contract DollarsThat Remained in-State (1988-96)
59
Figure III.4: Subcontract Dollars That Stayed in-State (1988-96) 60Figure III.5: DOD Prime Contract and Subcontract Jobs That
Stayed in-State (1988-96)61
Figure III.6: Wages for DOD Prime Contract and SubcontractWork That Stayed in-State (1988-96)
62
Figure III.7: DOD Records of Total Contract Awards ReceivedCompared with Our Survey Results of Contractor Records
63
Abbreviations
CFFR Consolidated Federal Funds ReportDOD Defense of DefenseDOE Department of EnergyFES Federal Expenditures by StateFPDS Federal Procurement Data SystemFTE full-time equivalentsHHS Department of Health and Human ServicesNASA National Aeronautics and Space AdministrationOPM Office of Personnel Management
GAO/NSIAD-98-57 Defense Spending and EmploymentPage 28

GAO/NSIAD-98-57 Defense Spending and EmploymentPage 29
Appendix I
Offices We Contacted
Department ofDefense, Washington,D.C.
Directorate for Information Operations and Reports, Washington Headquarters ServicesOffice of Program Analysis and EvaluationOffice of the ComptrollerOffice of Economic AdjustmentDefense Manpower Data CenterOffice of the ActuarySecretary of the Air ForceIndustrial Affairs and InstallationsOffice of Nonappropriated Fund PersonnelDefense Finance and Accounting ServicePublic AffairsInspector General
Department ofEnergy, Washington,D.C.
Office of Worker and Community TransitionOffice of Human Resources and AdministrationOffice of the Budget
Department ofCommerce,Washington, D.C.
Bureau of the CensusBureau of Economic Analysis
CongressionalAgencies, Washington,D.C.
Congressional Budget OfficeCongressional Research Service
Federal Facilities,New Mexico
Cannon Air Force Base, Clovis, New MexicoHolloman Air Force Base, Alamogordo, New MexicoKirtland Air Force Base, Albuquerque, New MexicoWhite Sands Missile Range, White Sands, New MexicoAlbuquerque Operations Office, Department of Energy, Albuquerque, New MexicoBureau of Land Management, Department of the Interior, Las Cruces and Albuquerque, New Mexico
GAO/NSIAD-98-57 Defense Spending and EmploymentPage 30
Appendix I
Offices We Contacted
State GovernmentOffices
Santa Fe, New MexicoDepartment of Economic DevelopmentDepartment of Taxation and RevenueAlbuquerque, New MexicoDepartment of LaborRichmond, VirginiaEconomic Development Partnership, Department of Business AssistanceAnnapolis, MarylandFederal Response and Technology Commercialization
Universities Bureau of Business and Economic Research, University of New Mexico, Albuquerque, New MexicoDepartment of Economics, University of Maryland, College Park, Maryland
Defense Contractors Honeywell Defense Avionics, Albuquerque, New MexicoLaguna Industries, Laguna, New MexicoMcDonnell Douglas, Long Beach, CaliforniaAeroparts Manufacturing and Repair, Rio Rancho, New MexicoSBS Technologies, Albuquerque, New MexicoPhysics, Mathematics, and Computers, Socorro, New MexicoKit Pack Company, Las Cruces, New MexicoEG&G Management Systems, Albuquerque, New MexicoLockheed Martin, Bethesda, MarylandDynCorp, Reston, Virginia
Others Professional Aerospace Contractors Association of New Mexico, Albuquerque, New MexicoIntel Corporation, Albuquerque, New MexicoAmerican Electronics Association, Santa Clara, CaliforniaLogistics Management Institute, McClean, VirginiaAcademy for State and Local Governments, Washington, D.C.National Council of State Governments, Washington, D.C.National Legislative Council, Washington, D.C.National Governors Association,Washington, D.C.RAND, Washington, D.C.
GAO/NSIAD-98-57 Defense Spending and EmploymentPage 31
Appendix II
Direct Federal Expenditures andEmployment in New Mexico
This appendix presents 1988-96 (1) trends in total direct federalexpenditures and employment in New Mexico and within specificspending categories, (2) defense-related and nondefense-relatedexpenditures and employment, and (3) the Department of Energy’s (DOE)and the Department of Defense’s (DOD) share of the defense-relatedexpenditures and employment.
We used existing databases and a survey on how much money is directlyspent and how many people are directly employed to determineexpenditures and employment. We did not assess the indirect or inducedeffects of federal expenditures and employment. All expenditure datawere adjusted for inflation and are presented in constant 1996 dollars.Data for all years were not always available.
Federal Expendituresin New Mexico
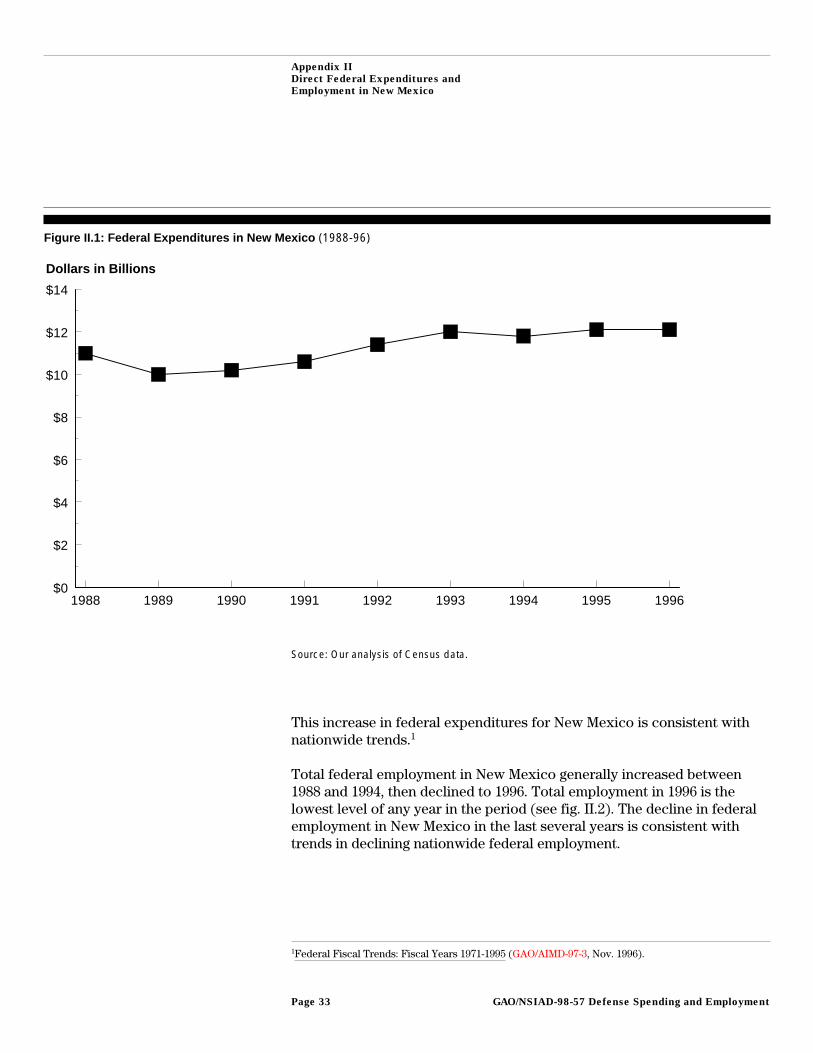
Federal expenditures in New Mexico fluctuated between about $10 billionand $12 billion, 1988 through 1996. The highest level of spending occurredin 1996 (see fig. II.1).
GAO/NSIAD-98-57 Defense Spending and EmploymentPage 32
Appendix II
Direct Federal Expenditures and
Employment in New Mexico
Figure II.1: Federal Expenditures in New Mexico (1988-96)
1988 1989 1990 1991 1992 1993 1994 1995 1996$0
$2
$4
$6
$8
$10
$12
$14
Dollars in Billions
Source: Our analysis of Census data.
This increase in federal expenditures for New Mexico is consistent withnationwide trends.1
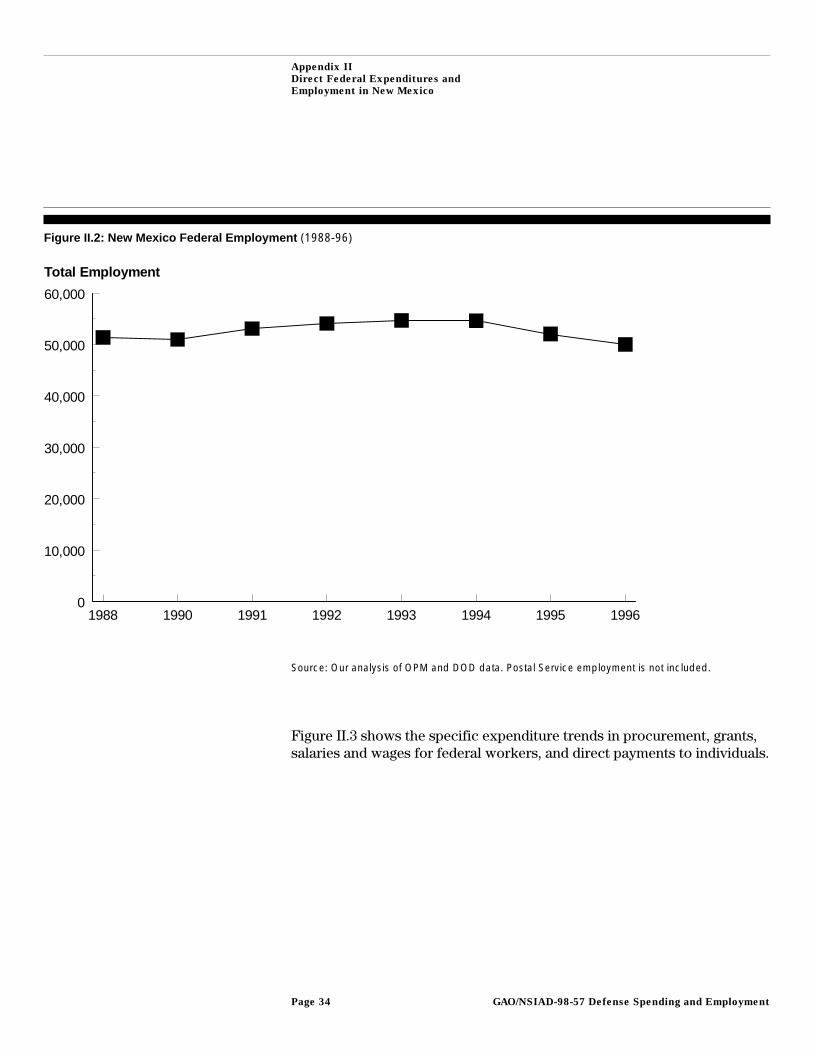
Total federal employment in New Mexico generally increased between1988 and 1994, then declined to 1996. Total employment in 1996 is thelowest level of any year in the period (see fig. II.2). The decline in federalemployment in New Mexico in the last several years is consistent withtrends in declining nationwide federal employment.
1Federal Fiscal Trends: Fiscal Years 1971-1995 (GAO/AIMD-97-3, Nov. 1996).
GAO/NSIAD-98-57 Defense Spending and EmploymentPage 33
Appendix II
Direct Federal Expenditures and
Employment in New Mexico
Figure II.2: New Mexico Federal Employment (1988-96)
1988 1990 1991 1992 1993 1994 1995 19960
10,000
20,000
30,000
40,000
50,000
60,000
Total Employment
Source: Our analysis of OPM and DOD data. Postal Service employment is not included.
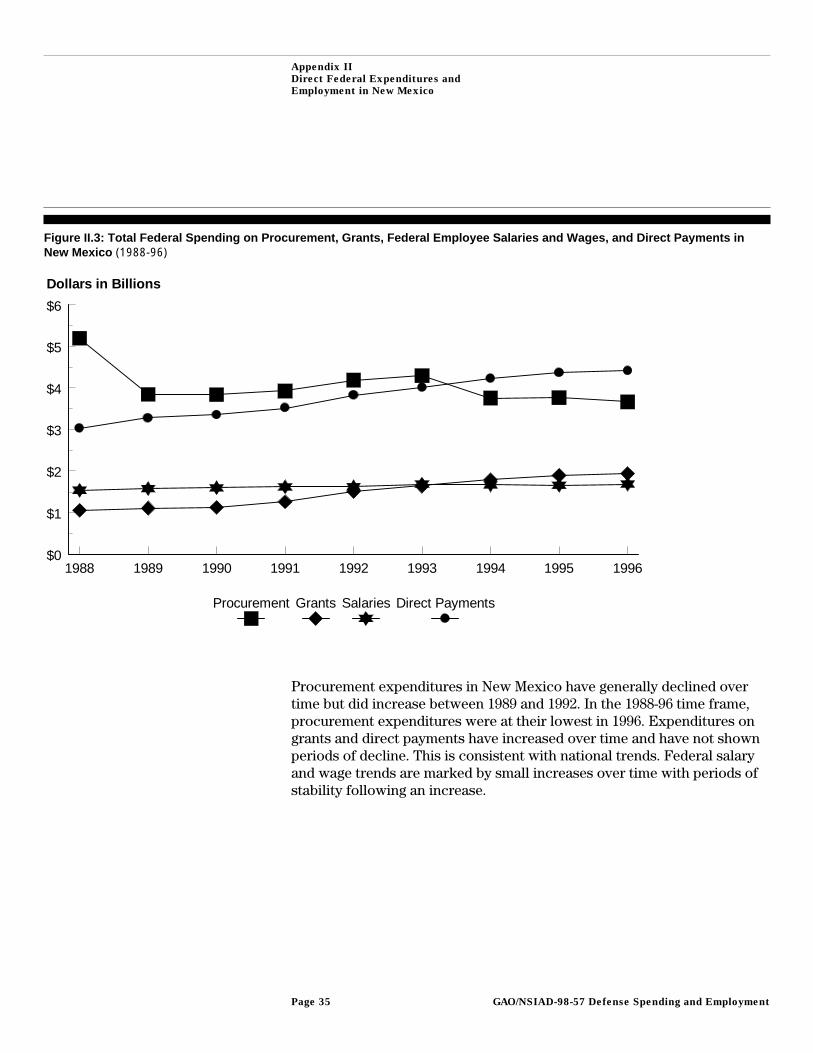
Figure II.3 shows the specific expenditure trends in procurement, grants,salaries and wages for federal workers, and direct payments to individuals.
GAO/NSIAD-98-57 Defense Spending and EmploymentPage 34
Appendix II
Direct Federal Expenditures and
Employment in New Mexico
Figure II.3: Total Federal Spending on Procurement, Grants, Federal Employee Salaries and Wages, and Direct Payments inNew Mexico (1988-96)
1988 1989 1990 1991 1992 1993 1994 1995 1996$0
$1
$2
$3
$4
$5
$6
Dollars in Billions
Procurement Grants Salaries Direct Payments
Procurement expenditures in New Mexico have generally declined overtime but did increase between 1989 and 1992. In the 1988-96 time frame,procurement expenditures were at their lowest in 1996. Expenditures ongrants and direct payments have increased over time and have not shownperiods of decline. This is consistent with national trends. Federal salaryand wage trends are marked by small increases over time with periods ofstability following an increase.
GAO/NSIAD-98-57 Defense Spending and EmploymentPage 35
Appendix II
Direct Federal Expenditures and
Employment in New Mexico
Defense-Related andNondefense-RelatedFederal Expendituresin New Mexico
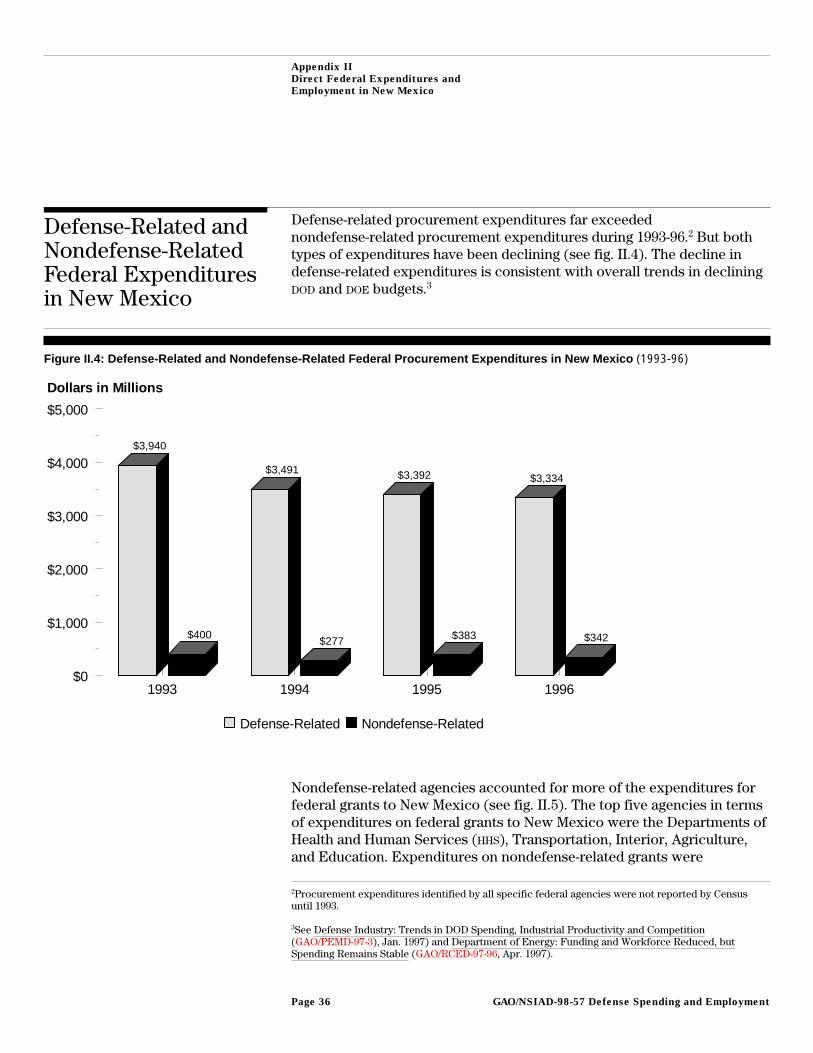
Defense-related procurement expenditures far exceedednondefense-related procurement expenditures during 1993-96.2 But bothtypes of expenditures have been declining (see fig. II.4). The decline indefense-related expenditures is consistent with overall trends in decliningDOD and DOE budgets.3
Figure II.4: Defense-Related and Nondefense-Related Federal Procurement Expenditures in New Mexico (1993-96)
1993 1994 1995 1996$0
$1,000
$2,000
$3,000
$4,000
$5,000
$3,940
$3,491 $3,392 $3,334
$400$277 $383 $342
Dollars in Millions
Defense-Related Nondefense-Related
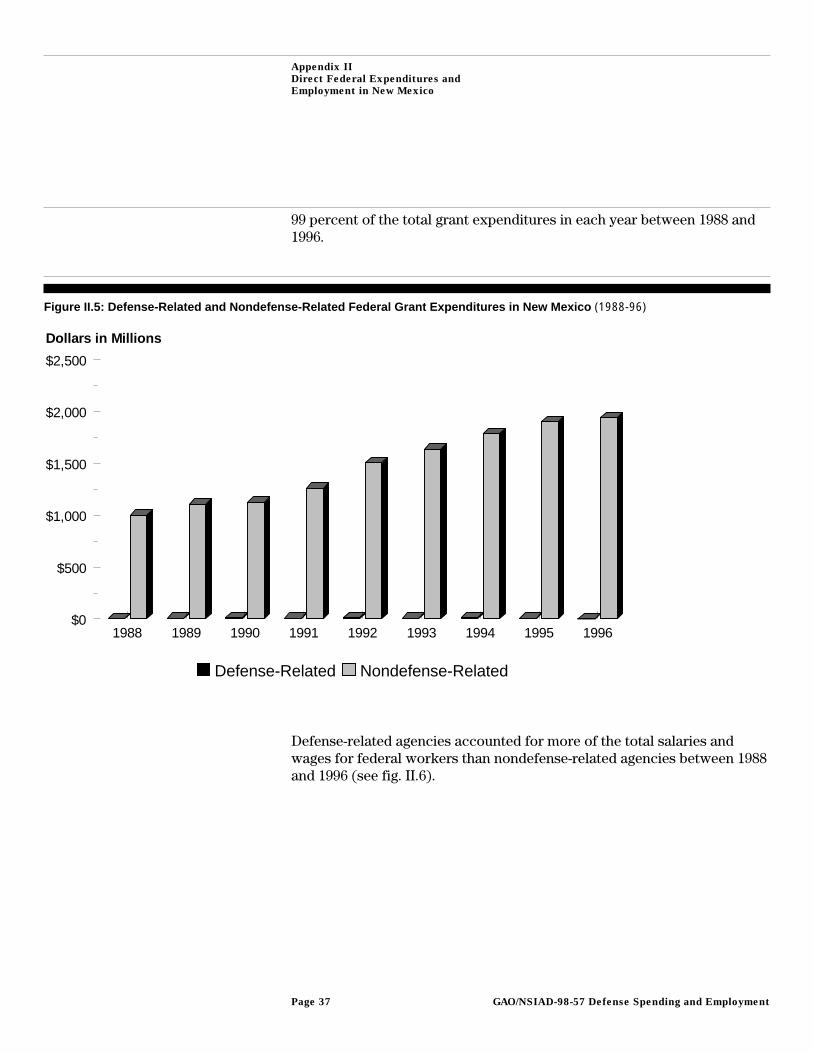
Nondefense-related agencies accounted for more of the expenditures forfederal grants to New Mexico (see fig. II.5). The top five agencies in termsof expenditures on federal grants to New Mexico were the Departments ofHealth and Human Services (HHS), Transportation, Interior, Agriculture,and Education. Expenditures on nondefense-related grants were
2Procurement expenditures identified by all specific federal agencies were not reported by Censusuntil 1993.
3See Defense Industry: Trends in DOD Spending, Industrial Productivity and Competition(GAO/PEMD-97-3), Jan. 1997) and Department of Energy: Funding and Workforce Reduced, butSpending Remains Stable (GAO/RCED-97-96, Apr. 1997).
GAO/NSIAD-98-57 Defense Spending and EmploymentPage 36
Appendix II
Direct Federal Expenditures and
Employment in New Mexico
99 percent of the total grant expenditures in each year between 1988 and1996.
Figure II.5: Defense-Related and Nondefense-Related Federal Grant Expenditures in New Mexico (1988-96)
1988 1989 1990 1991 1992 1993 1994 1995 1996$0
$500
$1,000
$1,500
$2,000
$2,500
Dollars in Millions
Defense-Related Nondefense-Related
Defense-related agencies accounted for more of the total salaries andwages for federal workers than nondefense-related agencies between 1988and 1996 (see fig. II.6).
GAO/NSIAD-98-57 Defense Spending and EmploymentPage 37
Appendix II
Direct Federal Expenditures and
Employment in New Mexico
Figure II.6: Salaries and Wages to Defense-Related and Nondefense-Related Federal Workers in New Mexico (1988-96)
1988 1990 1991 1992 1993 1994 1995 1996$0
$200
$400
$600
$800
$1,000
Dollars in Millions
Defense-Related Nondefense-Related
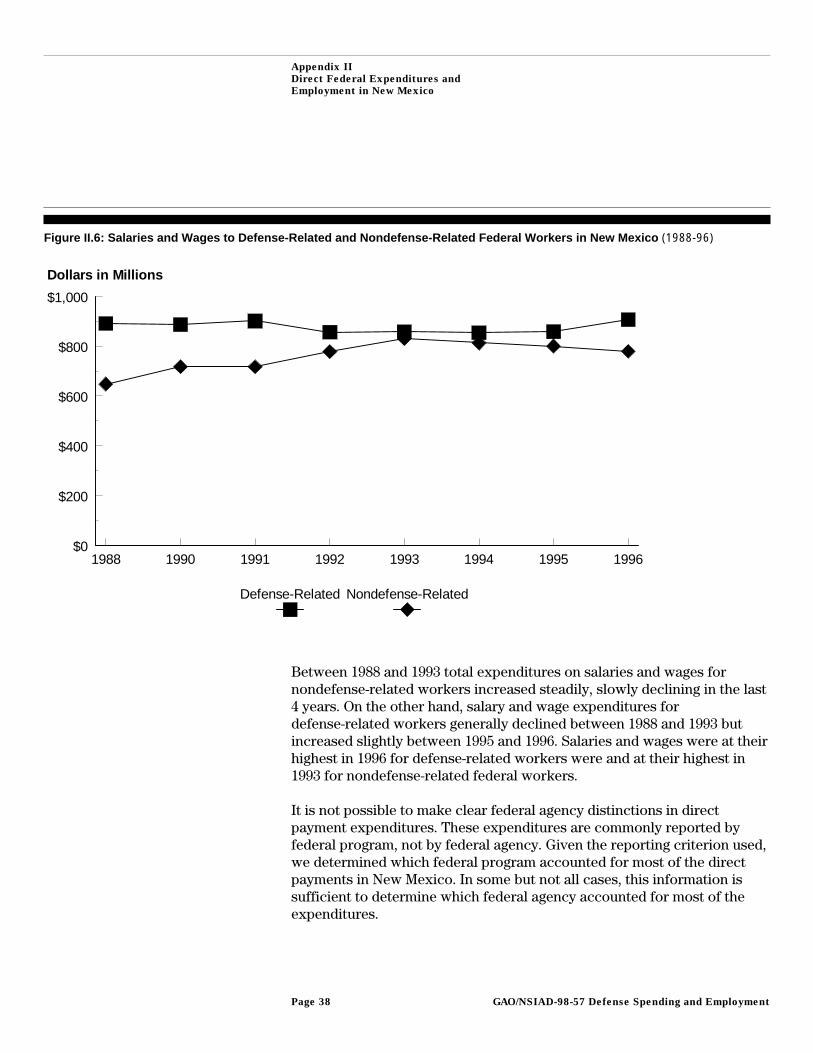
Between 1988 and 1993 total expenditures on salaries and wages fornondefense-related workers increased steadily, slowly declining in the last4 years. On the other hand, salary and wage expenditures fordefense-related workers generally declined between 1988 and 1993 butincreased slightly between 1995 and 1996. Salaries and wages were at theirhighest in 1996 for defense-related workers were and at their highest in1993 for nondefense-related federal workers.
It is not possible to make clear federal agency distinctions in directpayment expenditures. These expenditures are commonly reported byfederal program, not by federal agency. Given the reporting criterion used,we determined which federal program accounted for most of the directpayments in New Mexico. In some but not all cases, this information issufficient to determine which federal agency accounted for most of theexpenditures.
GAO/NSIAD-98-57 Defense Spending and EmploymentPage 38
Appendix II
Direct Federal Expenditures and
Employment in New Mexico
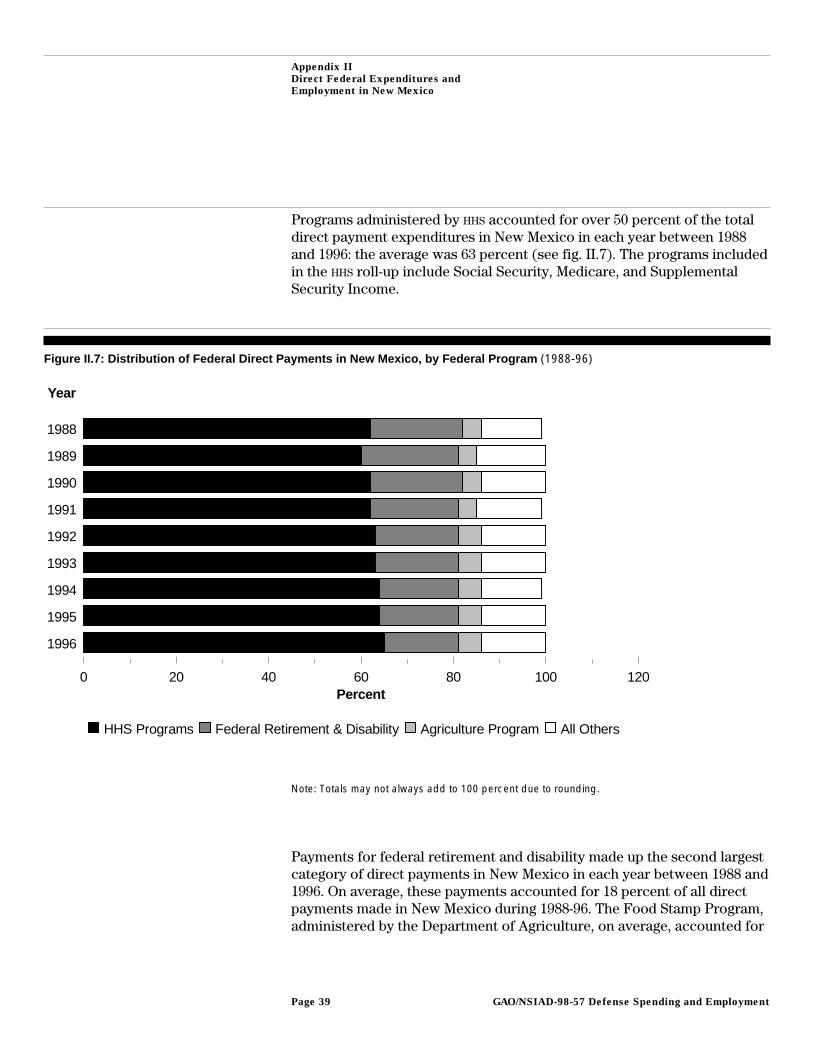
Programs administered by HHS accounted for over 50 percent of the totaldirect payment expenditures in New Mexico in each year between 1988and 1996: the average was 63 percent (see fig. II.7). The programs includedin the HHS roll-up include Social Security, Medicare, and SupplementalSecurity Income.
Figure II.7: Distribution of Federal Direct Payments in New Mexico, by Federal Program (1988-96)
1988
1989
1990
1991
1992
1993
1994
1995
1996
0 20 40 60 80 100 120
Year
Percent
HHS Programs Federal Retirement & Disability Agriculture Program All Others
Note: Totals may not always add to 100 percent due to rounding.
Payments for federal retirement and disability made up the second largestcategory of direct payments in New Mexico in each year between 1988 and1996. On average, these payments accounted for 18 percent of all directpayments made in New Mexico during 1988-96. The Food Stamp Program,administered by the Department of Agriculture, on average, accounted for
GAO/NSIAD-98-57 Defense Spending and EmploymentPage 39
Appendix II
Direct Federal Expenditures and
Employment in New Mexico
5 percent, and direct payments to individuals associated with all otherprograms, on average, accounted for 14 percent of the total directpayments over the same time period.4
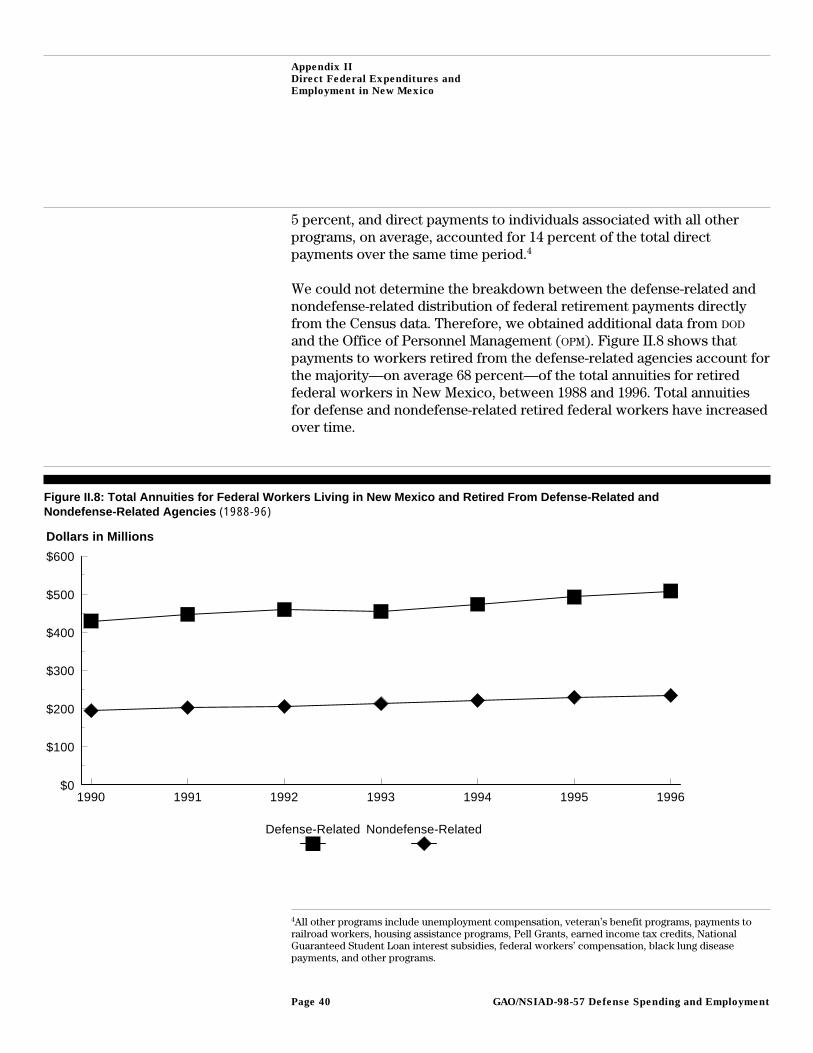
We could not determine the breakdown between the defense-related andnondefense-related distribution of federal retirement payments directlyfrom the Census data. Therefore, we obtained additional data from DOD
and the Office of Personnel Management (OPM). Figure II.8 shows thatpayments to workers retired from the defense-related agencies account forthe majority—on average 68 percent—of the total annuities for retiredfederal workers in New Mexico, between 1988 and 1996. Total annuitiesfor defense and nondefense-related retired federal workers have increasedover time.
Figure II.8: Total Annuities for Federal Workers Living in New Mexico and Retired From Defense-Related andNondefense-Related Agencies (1988-96)
1990 1991 1992 1993 1994 1995 1996$0
$100
$200
$300
$400
$500
$600
Dollars in Millions
Defense-Related Nondefense-Related
4All other programs include unemployment compensation, veteran’s benefit programs, payments torailroad workers, housing assistance programs, Pell Grants, earned income tax credits, NationalGuaranteed Student Loan interest subsidies, federal workers’ compensation, black lung diseasepayments, and other programs.
GAO/NSIAD-98-57 Defense Spending and EmploymentPage 40
Appendix II
Direct Federal Expenditures and
Employment in New Mexico
Defense-Related andNondefense-RelatedFederal Employmentin New Mexico
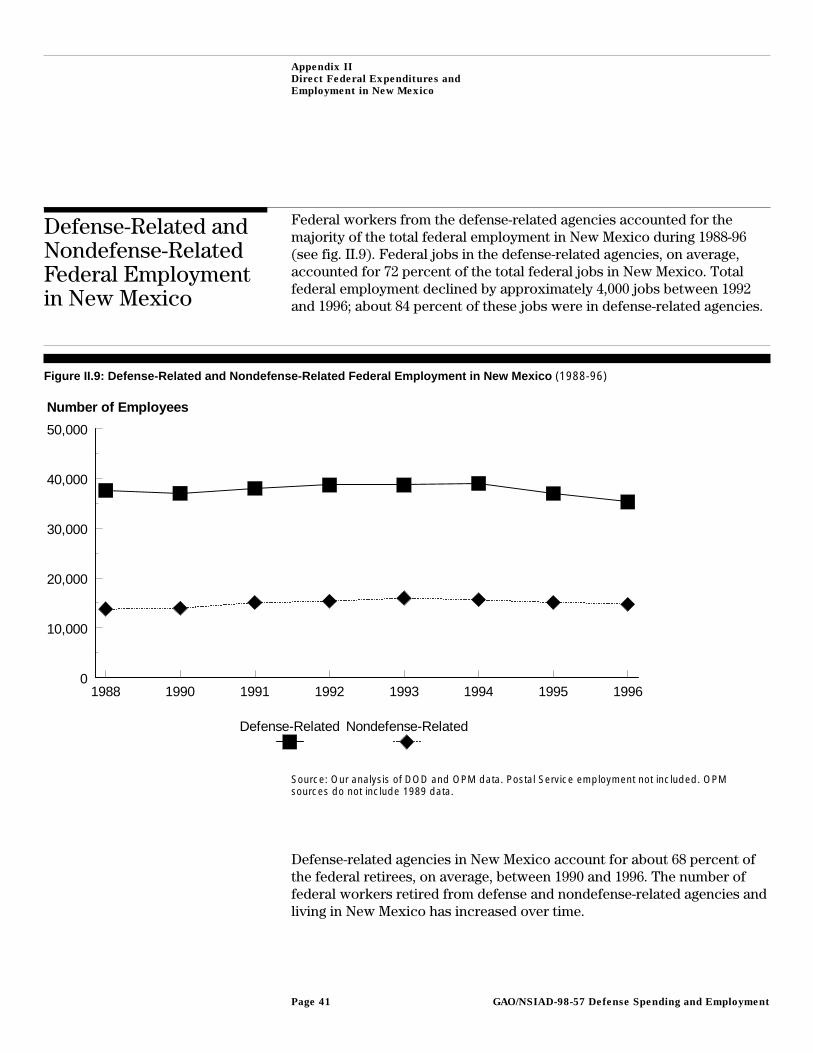
Federal workers from the defense-related agencies accounted for themajority of the total federal employment in New Mexico during 1988-96(see fig. II.9). Federal jobs in the defense-related agencies, on average,accounted for 72 percent of the total federal jobs in New Mexico. Totalfederal employment declined by approximately 4,000 jobs between 1992and 1996; about 84 percent of these jobs were in defense-related agencies.
Figure II.9: Defense-Related and Nondefense-Related Federal Employment in New Mexico (1988-96)
1988 1990 1991 1992 1993 1994 1995 19960
10,000
20,000
30,000
40,000
50,000
Number of Employees
Defense-Related Nondefense-Related
Source: Our analysis of DOD and OPM data. Postal Service employment not included. OPMsources do not include 1989 data.
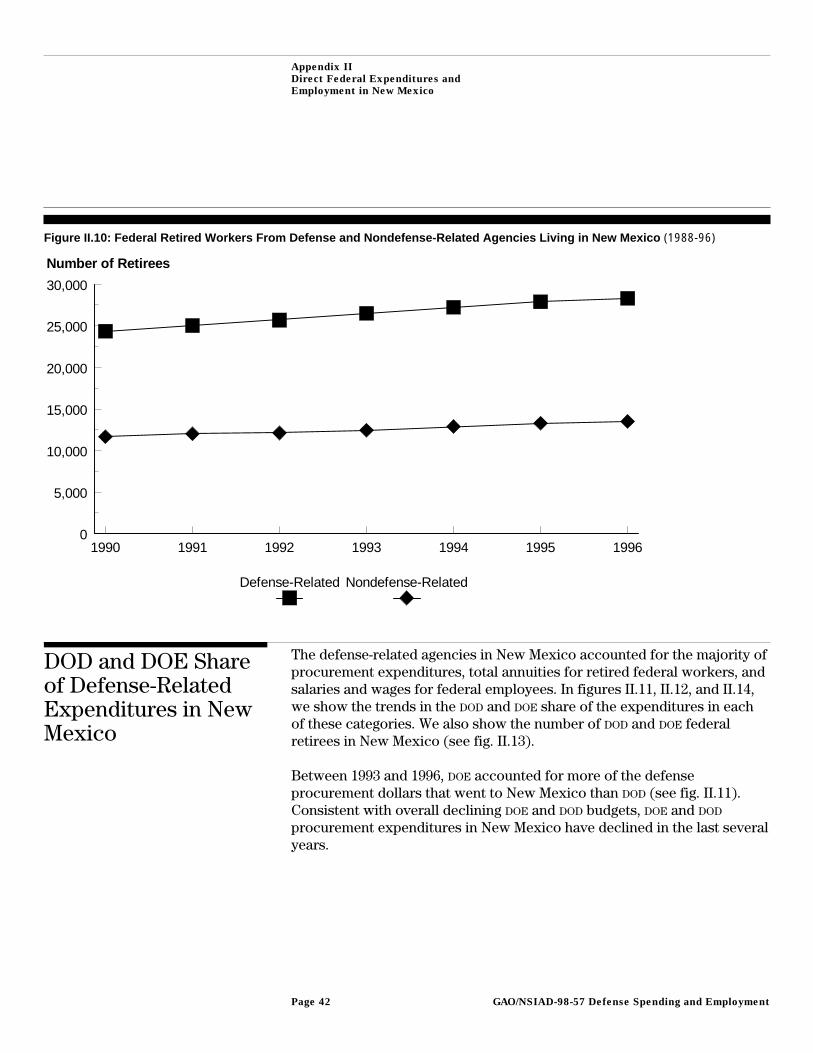
Defense-related agencies in New Mexico account for about 68 percent ofthe federal retirees, on average, between 1990 and 1996. The number offederal workers retired from defense and nondefense-related agencies andliving in New Mexico has increased over time.
GAO/NSIAD-98-57 Defense Spending and EmploymentPage 41
Appendix II
Direct Federal Expenditures and
Employment in New Mexico
Figure II.10: Federal Retired Workers From Defense and Nondefense-Related Agencies Living in New Mexico (1988-96)
1990 1991 1992 1993 1994 1995 19960
5,000
10,000
15,000
20,000
25,000
30,000
Number of Retirees
Defense-Related Nondefense-Related
DOD and DOE Shareof Defense-RelatedExpenditures in NewMexico
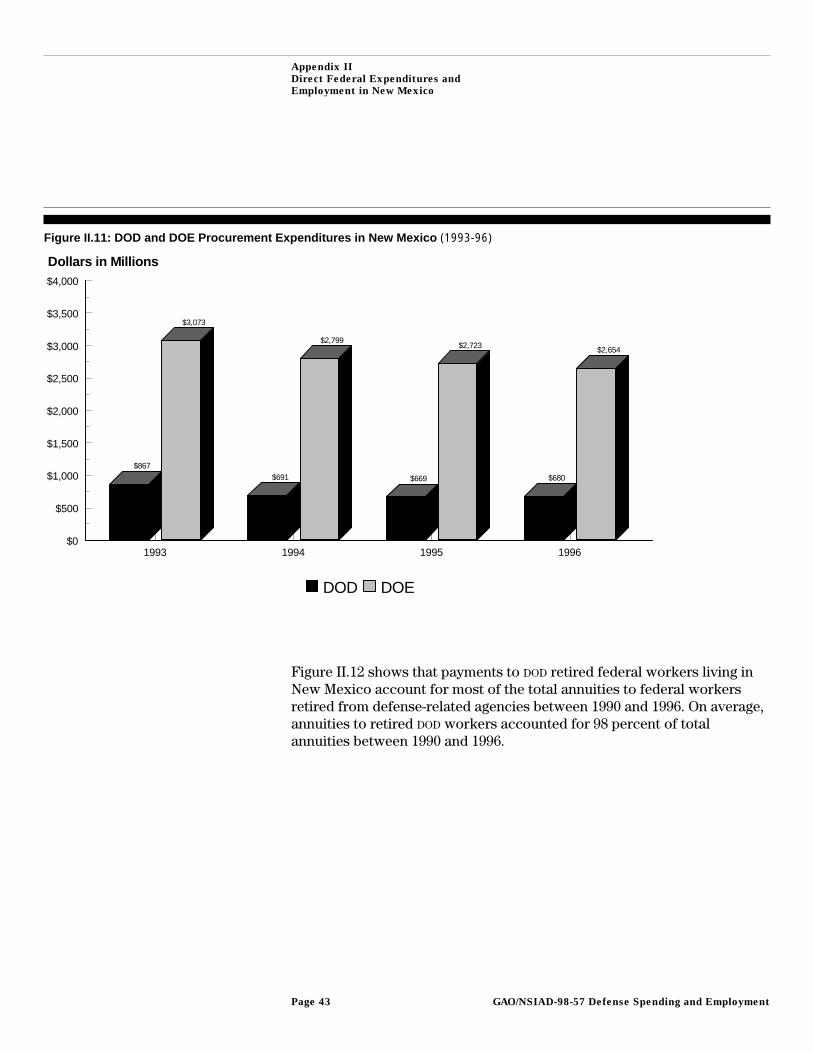
The defense-related agencies in New Mexico accounted for the majority ofprocurement expenditures, total annuities for retired federal workers, andsalaries and wages for federal employees. In figures II.11, II.12, and II.14,we show the trends in the DOD and DOE share of the expenditures in eachof these categories. We also show the number of DOD and DOE federalretirees in New Mexico (see fig. II.13).
Between 1993 and 1996, DOE accounted for more of the defenseprocurement dollars that went to New Mexico than DOD (see fig. II.11).Consistent with overall declining DOE and DOD budgets, DOE and DOD
procurement expenditures in New Mexico have declined in the last severalyears.
GAO/NSIAD-98-57 Defense Spending and EmploymentPage 42
Appendix II
Direct Federal Expenditures and
Employment in New Mexico
Figure II.11: DOD and DOE Procurement Expenditures in New Mexico (1993-96)
1993 1994 1995 1996$0
$500
$1,000
$1,500
$2,000
$2,500
$3,000
$3,500
$4,000
$867$691 $669 $680
$3,073
$2,799$2,723 $2,654
Dollars in Millions
DOD DOE
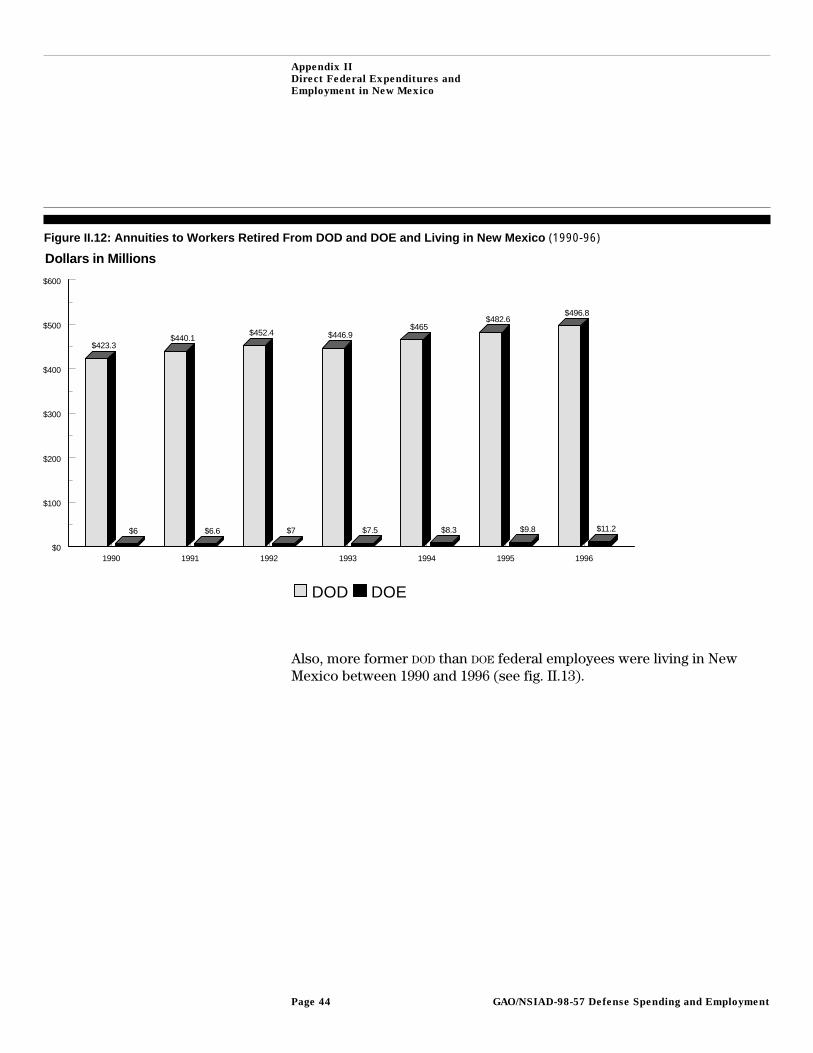
Figure II.12 shows that payments to DOD retired federal workers living inNew Mexico account for most of the total annuities to federal workersretired from defense-related agencies between 1990 and 1996. On average,annuities to retired DOD workers accounted for 98 percent of totalannuities between 1990 and 1996.
GAO/NSIAD-98-57 Defense Spending and EmploymentPage 43
Appendix II
Direct Federal Expenditures and
Employment in New Mexico
Figure II.12: Annuities to Workers Retired From DOD and DOE and Living in New Mexico (1990-96)
1990 1991 1992 1993 1994 1995 1996$0
$100
$200
$300
$400
$500
$600
$423.3$440.1
$452.4 $446.9$465
$482.6$496.8
$6 $6.6 $7 $7.5 $8.3 $9.8 $11.2
Dollars in Millions
DOD DOE
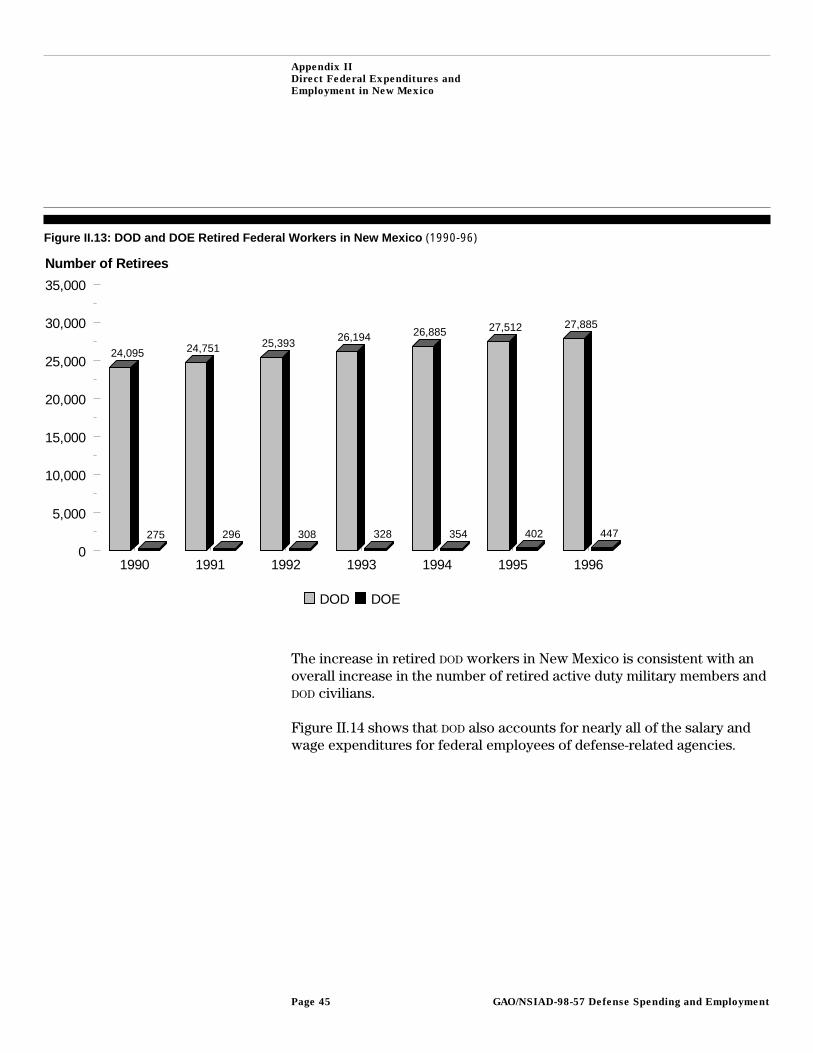
Also, more former DOD than DOE federal employees were living in NewMexico between 1990 and 1996 (see fig. II.13).
GAO/NSIAD-98-57 Defense Spending and EmploymentPage 44
Appendix II
Direct Federal Expenditures and
Employment in New Mexico
Figure II.13: DOD and DOE Retired Federal Workers in New Mexico (1990-96)
1990 1991 1992 1993 1994 1995 19960
5,000
10,000
15,000
20,000
25,000
30,000
35,000
24,095 24,751 25,393 26,194 26,885 27,512 27,885
275 296 308 328 354 402 447
Number of Retirees
DOD DOE
The increase in retired DOD workers in New Mexico is consistent with anoverall increase in the number of retired active duty military members andDOD civilians.
Figure II.14 shows that DOD also accounts for nearly all of the salary andwage expenditures for federal employees of defense-related agencies.
GAO/NSIAD-98-57 Defense Spending and EmploymentPage 45
Appendix II
Direct Federal Expenditures and
Employment in New Mexico
Figure II.14: DOD and DOE Federal Employee Salary and Wage Expenditures in New Mexico (1988-96)
1988 1990 1991 1992 1993 1994 1995 1996$0
$200
$400
$600
$800
$1,000
AAAAAAAAAAAAAAAAAAAAAAAAAAAAAAAAAAAAAAAAAAAAAAAAAAAAAAAAAAAAAAAAAAAAAAAAAAAAAAAAAAAAAAAAAAAAAAAAAAAAAAAAAAAAAAAAAAAAAAAAAAAAAAAAAAAAAAAAAAAAAAAAAAAAAAAAAAAAAAAAAAAAAAAAAAAAAAAAAAAAAAAA
AAAAAAAAAAAAAAAAAAAAAAAAAAAAAAAAAAAAAAAAAAAAAAAAAAAAAAAAAAAAAAAAAAAAAAAAAAAAAAAAAAAAAAAAAAAAAAAAAAAAAAAAAAAAAAAAAAAAAAAAAAAAAAAAAAAAAAAAAAAAAAAAAAAAAAAAAAAAAAAAAAAAAAAAAAAAAAAAAAAAAAAA
AAAAAAAAAAAAAAAAAAAAAAAAAAAAAAAAAAAAAAAAAAAAAA
AAAAAAAAAAAAAAAAAAAAAAAAAAAAAAAAAAAAAAAAAAAAAAAAAAAAAAAAAAAAAAAAAAAAAAAAAAAAAAAAAAAAAAAAAAAAAAAAAAAAAAAAAAAAAAAAAAAAAAAAAAAAAAAAAAAAAAAAAAAAAAAAAAAAAAAAAAAAAAAAAAAAAAAAAAAAAAAAAAAAAAAA
AAAAAAAAAAAAAAAAAAAAAAAAAAAAAAAAAAAAAAAAAAAAAA
AAAAAAAAAAAAAAAAAAAAAAAAAAAAAAAAAAAAAAAAAAAAAAAAAAAAAAAAAAAAAAAAAAAAAAAAAAAAAAAAAAAAAAAAAAAAAAAAAAAAAAAAAAAAAAAAAAAAAAAAAAAAAAAAAAAAAAAAAAAAAAAAAAAAAAAAAAAAAAAAAAAAAAAAAAAAAAAA
AAAAAAAAAAAAAAAAAAAAAAAAAAAAAAAAAAAAAAAAAAAA
AAAAAAAAAAAAAAAAAAAAAAAAAAAAAAAAAAAAAAAAAAAAAAAAAAAAAAAAAAAAAAAAAAAAAAAAAAAAAAAAAAAAAAAAAAAAAAAAAAAAAAAAAAAAAAAAAAAAAAAAAAAAAAAAAAAAAAAAAAAAAAAAAAAAAAAAAAAAAAAAAAAAAAAAAAAAAAAA
AAAAAAAAAAAAAAAAAAAAAAAAAAAAAAAAAAAAAAAAAAAA
AAAAAAAAAAAAAAAAAAAAAAAAAAAAAAAAAAAAAAAAAAAAAAAAAAAAAAAAAAAAAAAAAAAAAAAAAAAAAAAAAAAAAAAAAAAAAAAAAAAAAAAAAAAAAAAAAAAAAAAAAAAAAAAAAAAAAAAAAAAAAAAAAAAAAAAAAAAAAAAAAAAAAAAAAAAAAAAA
AAAAAAAAAAAAAAAAAAAAAAAAAAAAAAAAAAAAAAAAAAAA
AAAAAAAAAAAAAAAAAAAAAAAAAAAAAAAAAAAAAAAAAAAAAAAAAAAAAAAAAAAAAAAAAAAAAAAAAAAAAAAAAAAAAAAAAAAAAAAAAAAAAAAAAAAAAAAAAAAAAAAAAAAAAAAAAAAAAAAAAAAAAAAAAAAAAAAAAAAAAAAAAAAAAAAAAAAAAAAA
AAAAAAAAAAAAAAAAAAAAAAAAAAAAAAAAAAAAAAAAAAAA
AAAAAAAAAAAAAAAAAAAAAAAAAAAAAAAAAAAAAAAAAAAAAAAAAAAAAAAAAAAAAAAAAAAAAAAAAAAAAAAAAAAAAAAAAAAAAAAAAAAAAAAAAAAAAAAAAAAAAAAAAAAAAAAAAAAAAAAAAAAAAAAAAAAAAAAAAAAAAAAAAAAAAAAAAAAAAAAAAAAAAAAA
$845.5 $838.6 $848.3
$798.2 $797.9 $797.4 $798.2
$848.6
$45.8 $48.4 $52.9 $58.2 $60.2 $56.7 $60.3 $57.7
Dollars in Millions
AAAAAAAAA
DOD DOE
Source: Our analysis of Census and OPM data.
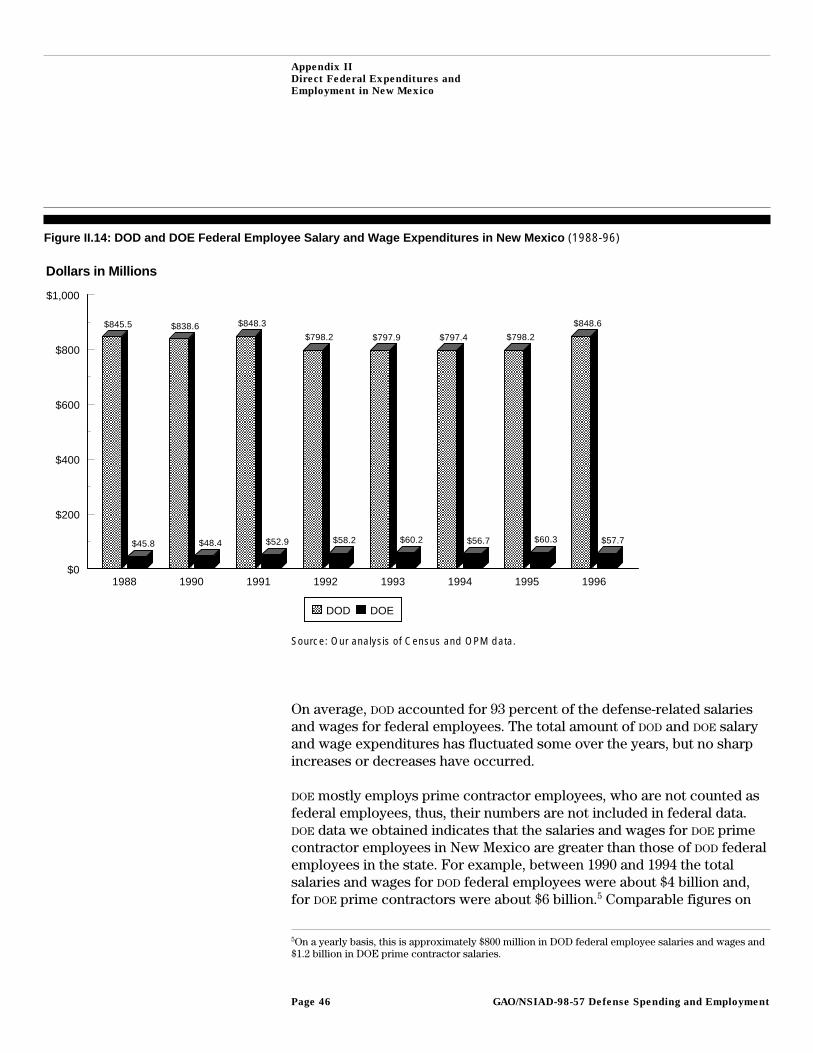
On average, DOD accounted for 93 percent of the defense-related salariesand wages for federal employees. The total amount of DOD and DOE salaryand wage expenditures has fluctuated some over the years, but no sharpincreases or decreases have occurred.
DOE mostly employs prime contractor employees, who are not counted asfederal employees, thus, their numbers are not included in federal data.DOE data we obtained indicates that the salaries and wages for DOE primecontractor employees in New Mexico are greater than those of DOD federalemployees in the state. For example, between 1990 and 1994 the totalsalaries and wages for DOD federal employees were about $4 billion and,for DOE prime contractors were about $6 billion.5 Comparable figures on
5On a yearly basis, this is approximately $800 million in DOD federal employee salaries and wages and$1.2 billion in DOE prime contractor salaries.
GAO/NSIAD-98-57 Defense Spending and EmploymentPage 46
Appendix II
Direct Federal Expenditures and
Employment in New Mexico
the total compensation to DOD prime contractor employees in New Mexicowere not available. However, the data we obtained from our survey of thetop New Mexico contractors shows that the total compensation to theiremployees was $332 million between 1990 and 1994, or about $6.6 millionper year.
DOD and DOE Shareof Defense-RelatedEmployment in NewMexico
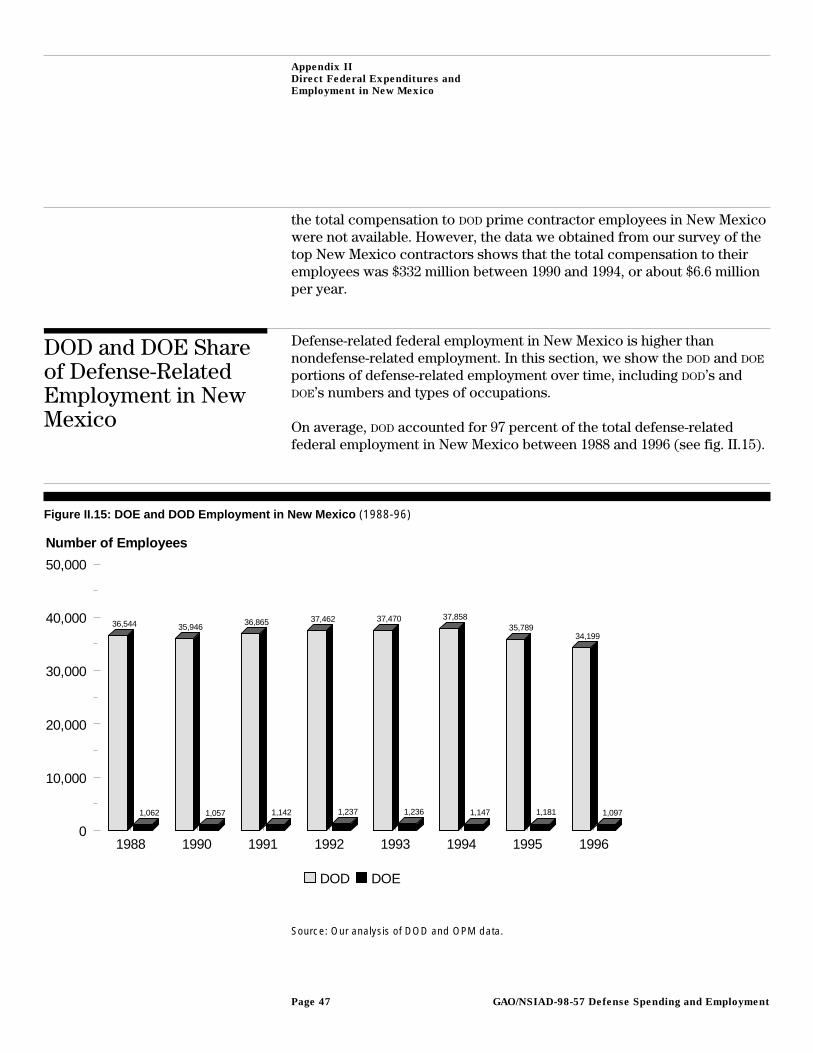
Defense-related federal employment in New Mexico is higher thannondefense-related employment. In this section, we show the DOD and DOE
portions of defense-related employment over time, including DOD’s andDOE’s numbers and types of occupations.
On average, DOD accounted for 97 percent of the total defense-relatedfederal employment in New Mexico between 1988 and 1996 (see fig. II.15).
Figure II.15: DOE and DOD Employment in New Mexico (1988-96)
1988 1990 1991 1992 1993 1994 1995 19960
10,000
20,000
30,000
40,000
50,000
36,544 35,946 36,865 37,462 37,470 37,85835,789
34,199
1,062 1,057 1,142 1,237 1,236 1,147 1,181 1,097
Number of Employees
DOD DOE
Source: Our analysis of DOD and OPM data.
GAO/NSIAD-98-57 Defense Spending and EmploymentPage 47

Appendix II
Direct Federal Expenditures and
Employment in New Mexico
In each year between 1988 and 1996, active duty military members werethe single largest group of DOD federal employees in New Mexico. Inactiveduty military and DOD civilian employees, respectively, accounted for thesecond and third largest component of DOD federal employment (see fig. II.16).
Figure II.16: DOD Active, Inactive, and Civilian Employment in New Mexico (1988-96)
1988 1989 1990 1991 1992 1993 1994 1995 19960
5,000
10,000
15,000
20,000
Number of Employees
Active Military Inactive Military Civilian
Active duty and inactive duty military members, and DOD civilians rankedfirst, third, and second, respectively, in accounting for the largest share ofsalary and wages for DOD federal employees in New Mexico from 1988 to1996 (see fig. II.17).
GAO/NSIAD-98-57 Defense Spending and EmploymentPage 48
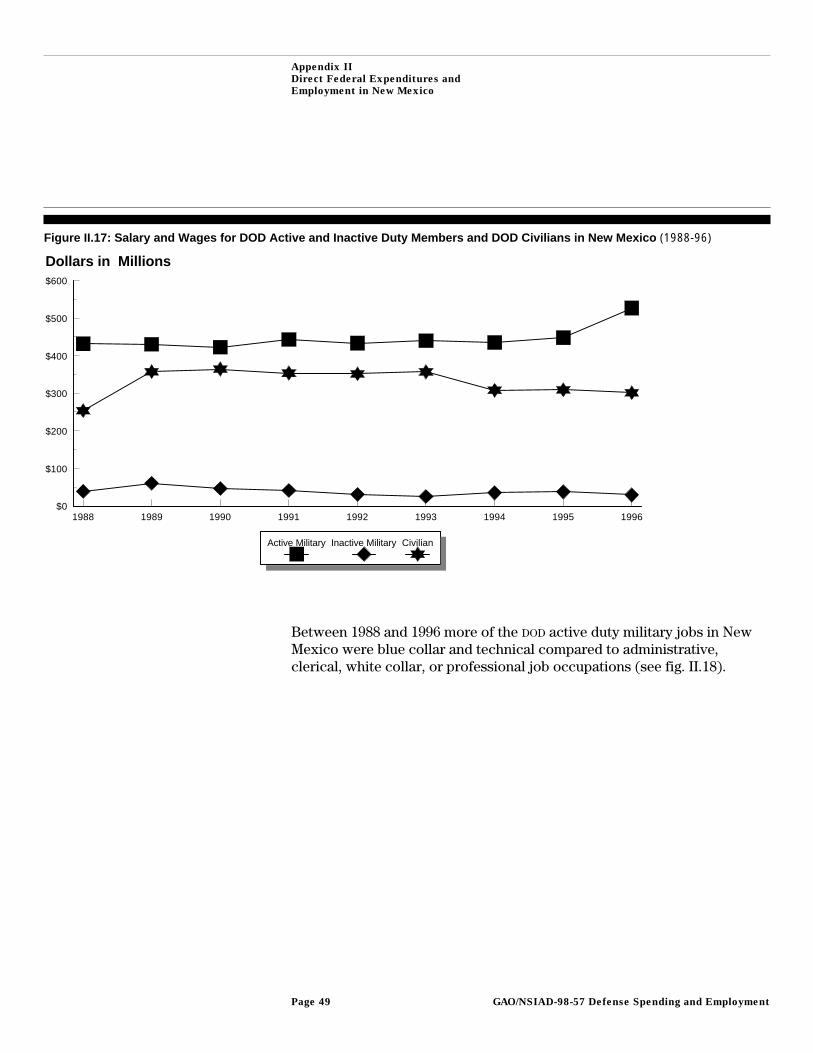
Appendix II
Direct Federal Expenditures and
Employment in New Mexico
Figure II.17: Salary and Wages for DOD Active and Inactive Duty Members and DOD Civilians in New Mexico (1988-96)
1988 1989 1990 1991 1992 1993 1994 1995 1996$0
$100
$200
$300
$400
$500
$600
Dollars in Millions
Active Military Inactive Military Civilian
Between 1988 and 1996 more of the DOD active duty military jobs in NewMexico were blue collar and technical compared to administrative,clerical, white collar, or professional job occupations (see fig. II.18).
GAO/NSIAD-98-57 Defense Spending and EmploymentPage 49

Appendix II
Direct Federal Expenditures and
Employment in New Mexico
Figure II.18: Job Occupations of DOD Active Duty Military in New Mexico (1988-96)
1988 1990 1992 1994 19960
1,000
2,000
3,000
4,000
5,000
6,000
Number of Jobs
Administrative Blue Collar Clerical Other White Collar Professional Technical
Note: Reserves and National Guard not included.
Source: Defense Manpower Data Center.
The job occupations of DOD civilians were more evenly dispersed acrosscategories than DOD military jobs. Professional job occupations accountedfor the most DOD civilian jobs in New Mexico between 1988 and 1996 (seefig. II.19).
GAO/NSIAD-98-57 Defense Spending and EmploymentPage 50
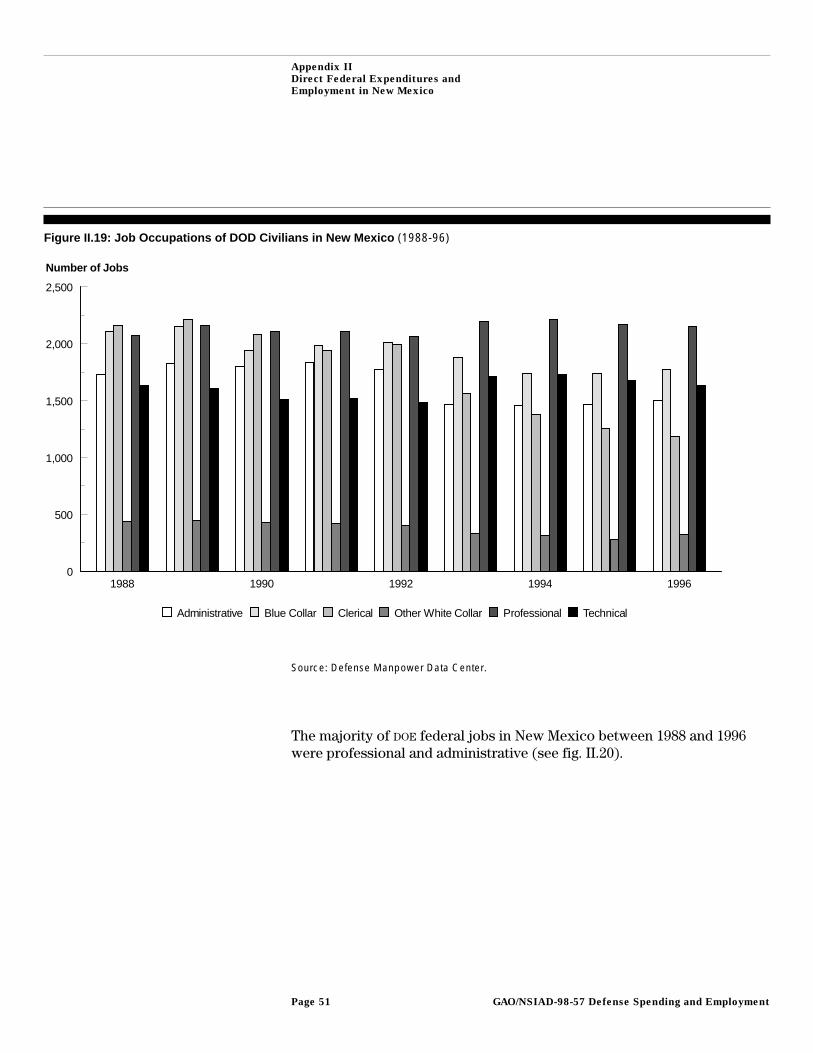
Appendix II
Direct Federal Expenditures and
Employment in New Mexico
Figure II.19: Job Occupations of DOD Civilians in New Mexico (1988-96)
1988 1990 1992 1994 19960
500
1,000
1,500
2,000
2,500
Number of Jobs
Administrative Blue Collar Clerical Other White Collar Professional Technical
Source: Defense Manpower Data Center.
The majority of DOE federal jobs in New Mexico between 1988 and 1996were professional and administrative (see fig. II.20).
GAO/NSIAD-98-57 Defense Spending and EmploymentPage 51
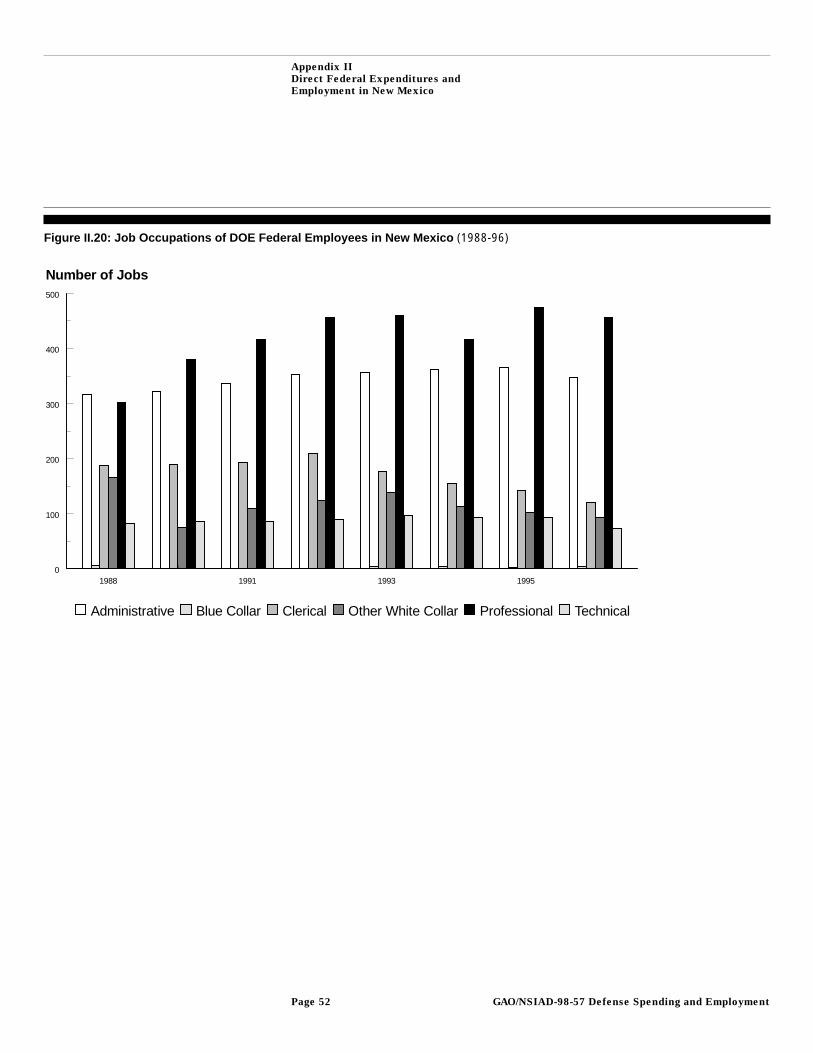
Appendix II
Direct Federal Expenditures and
Employment in New Mexico
Figure II.20: Job Occupations of DOE Federal Employees in New Mexico (1988-96)
1988 1991 1993 19950
100
200
300
400
500
Number of Jobs
Administrative Blue Collar Clerical Other White Collar Professional Technical
GAO/NSIAD-98-57 Defense Spending and EmploymentPage 52
Appendix III
Survey of Top Defense Contractors in NewMexico
The principal purpose of our survey was to determine and characterize theflow of defense dollars to contractors and to illuminate and quantify thelimitations of existing data sources that document defense spending instates.
Survey Methods For our survey sample, we selected contractors who were among the topfive in terms of the total dollar amount of DOD prime contracts awarded infiscal year 1996. Time and resource constraints prevented us fromsurveying every business that was awarded a defense contract andperformed work in New Mexico. For example, in 1996 alone, 471businesses were awarded DOD contracts exceeding $25,000 for workprincipally done in New Mexico.
We obtained DOD’s DD350 data to determine the total value of DOD primecontracts awarded to all businesses in 1996 with the principal place ofwork in New Mexico. From this population we selected five contractors:Honeywell, DynCorp, EG&G, Kit Pack Company, and Lockheed Martin. In1996, prime contracts to these businesses accounted for 26 percent of thetotal value of all DOD prime contracts awarded to businesses in NewMexico. In the period covered by our survey, that is, 1988-96, thepercentage of total DOD prime contract awards accounted for by the topfive New Mexico contractors ranged from 26 to 46 percent. Differentcompanies have been in the list of the top five over the years. However,over the survey period, Honeywell and DynCorp were consistently amongthe top five.
Contractors were asked to complete several questions about DOD contractsthey were awarded as a prime and subcontractor between 1988-96. Weasked them to indicate the total value of all DOD contracts received, thedollar amount of contract work that was subcontracted or wasinterdivisional work, the amounts subcontracted in-state and out-of-state,the amount of salary and wages for all contracts completed by thecontractor and by subcontractors, and the number of full-time equivalent(FTE) positions for work completed by the contractor and forsubcontractors.
ContractorBackground
As a group Honeywell, Lockheed Martin, DynCorp, and EG&G are large,diversified corporations with business establishments physically located inNew Mexico but actual corporate headquarters located elsewhere in the
GAO/NSIAD-98-57 Defense Spending and EmploymentPage 53
Appendix III
Survey of Top Defense Contractors in New
Mexico
country. Kit Pack is a relatively smaller company, with its businessheadquarters and all operations located in New Mexico.
During the period of time covered by our survey, Honeywell’s principalDOD work in New Mexico was research, development, and testing andevaluation services for military aircraft and the manufacturing of aircraftavionics components. In 1996, DOD awarded prime contracts to Honeywellto provide automatic pilot mechanisms; flight instruments; and research,development, and testing and evaluation services related to aircraft enginemanufacturing, among other things. Its survey data was completed by staffat Honeywell’s business establishment in Albuquerque.
DynCorp is a large professional and technical services firm. DynCorp’sprincipal work in New Mexico is providing business services, whichinclude aircraft maintenance and repair at military bases, and operationsservices provided at government-owned facilities. In 1996, DOD awardedprime contracts to DynCorp to provide maintenance and repair services toequipment and laboratory instruments, telecommunications services, andother services associated with operating a government-owned facility atWhite Sands Missile Range, among other things. DynCorp’s survey datawas completed by staff at the corporate headquarters in Reston, Virginia.DynCorp’s responses were based on financial data for DynCorp and itssubsidiaries that also operate in New Mexico (e.g., Aerotherm).
EG&G’s principal DOD work in New Mexico is providing communicationsequipment; operating radar and navigation facilities at Holloman Air ForceBase; and doing advanced research, development, testing and evaluationwork. In 1996, DOD awarded prime contracts to EG&G to provide advanceddevelopment and exploratory research and development (includingmedical) services at Kirtland Air Force Base and to operate radar andnavigation facilities at Holloman Air Force Base, among other things.EG&G’s survey data was completed by staff at the Albuquerque office andincludes data only for EG&G Management Systems.
Kit Pack Company is located in Las Cruces, south of Holloman Air ForceBase near White Sands Missile Range. Kit Pack’s principal DOD work inNew Mexico is providing aircraft spare parts and modification kits. In1996, DOD awarded prime contracts to Kit Pack to provide aircrafthydraulics, vacuum and deicing system components, airframe structuralcomponents, and torque converters and speed changers, among otherthings. After it completed and returned the survey to us, Kit Pack officialsinformed us that it was currently operating under Chapter 11 bankruptcy
GAO/NSIAD-98-57 Defense Spending and EmploymentPage 54

Appendix III
Survey of Top Defense Contractors in New
Mexico
due to the termination for default of an Army contract. Kit Pack had filedan appeal of the termination, which was pending when we completed ourwork. The company indicated that it has seen a severe reduction in thenumber of DOD contracts awarded since it filed for bankruptcy. Kit Packstaff in Las Cruces completed our survey.
We were unable to obtain survey information from Lockheed Martin.Company officials indicated that they did not have the type of informationwe requested broken out by states or geographical locations. In afollow-up meeting, company officials provided us with information ontheir total expenditures to New Mexico suppliers, annual payroll for theiremployees in New Mexico and the number of employees in the statebetween 1992 and 1996. The information was developed by staff inLockheed Martin’s Washington operations office.
We could not use Lockheed Martin’s information because it was notbroken out by specific federal agencies, nor could we determine whetherthe total expenditures, payroll, or employment were associated withgovernment-funded work or whether they were part of the company’scommercial business. Over the course of several meetings andconversations with Lockheed Martin officials, we obtained detailedsupplier expenditure information from the Lockheed Martin ConsolidatedProcurement Program which was broken out by specific Lockheed Martinbusiness units. Company officials said that this would provide anindication of the type of business activity (e.g., DOD, DOE, NASA, andcommercial) that the expenditures were made for. In addition, we weregiven information on corporate sales and payroll by staff in LockheedMartin’s tax department.
We discovered several discrepancies in the company’s financialinformation. When we discussed these with company officials, theyindicated that the data provided by the Washington operations office were“less reliable” than other data. Company officials also indicated that theirrecord-keeping had been challenged by the recent merger/acquisitionactivities (i.e., Lockheed and Martin Marietta in 1995 and the Loralacquisition in 1997). Lockheed Martin officials said that differentcompanies had different information systems and that some informationmay have been lost during the recent merger.
Key Limitations Our survey was not designed to specify or measure the exact amount of allDOD contract dollars that flow into New Mexico. Rather, its purpose was to
GAO/NSIAD-98-57 Defense Spending and EmploymentPage 55
Appendix III
Survey of Top Defense Contractors in New
Mexico
reflect the nature of the flow of DOD prime and subcontract dollars to asample of top New Mexico contractors and to compare these results toexisting DOD data.
Among the four contractors that completed the survey, none indicated thatthey could not provide reliable responses to the survey items. The mostcommon limitation was the lack of information on FTEs and wages forsubcontracted work. Specifically, contractors indicated the followinglimitations in their responses to us.
• Honeywell provided information on the dollar amount of the orders itreceived during the calendar year and estimates of subcontracted workand employees and wages associated with subcontracted work.
• Kit Pack did not have FTE or wage information on its subcontractors andindicated that it no longer had payroll records for its own staff for 1988,1989, or 1991.
• EG&G did not have records for FTEs and wages associated withsubcontracted work.
• DynCorp did not have information on its subcontractors prior to 1993. Toreport fiscal year information, DynCorp had to convert some companyfinancial data that was not identified by fiscal years.
Survey Findings We treated all survey data received from contractors as proprietary.Therefore, in discussing survey findings, contractor names are not usedand data is aggregated to protect business-sensitive information. Alldollars were adjusted for inflation and are constant 1996 dollars. All of thecontractors surveyed were DOD prime contractors. Two of the fourcontractors we surveyed indicated that they were also DOD subcontractors.
The total amount of DOD prime and contract subcontract awards hasdeclined over the 9-year period.6 The totals reported for 1996 were thelowest of all the years. For the 9-year period of our survey, expendituresfor DOD prime contracts ($1.5 billion) were roughly the same as forsubcontracts ($1.4 billion). However, in 5 of the 9 years, the contractorsreceived more subcontract than prime contract dollars (see fig. III.1).
6This is consistent with the general decline in total DOD procurement budgets. See Defense Industry:Trends in DOD Spending, Industrial Productivity and Competition (GAO/PEMD-97-3, Jan. 1997).
GAO/NSIAD-98-57 Defense Spending and EmploymentPage 56
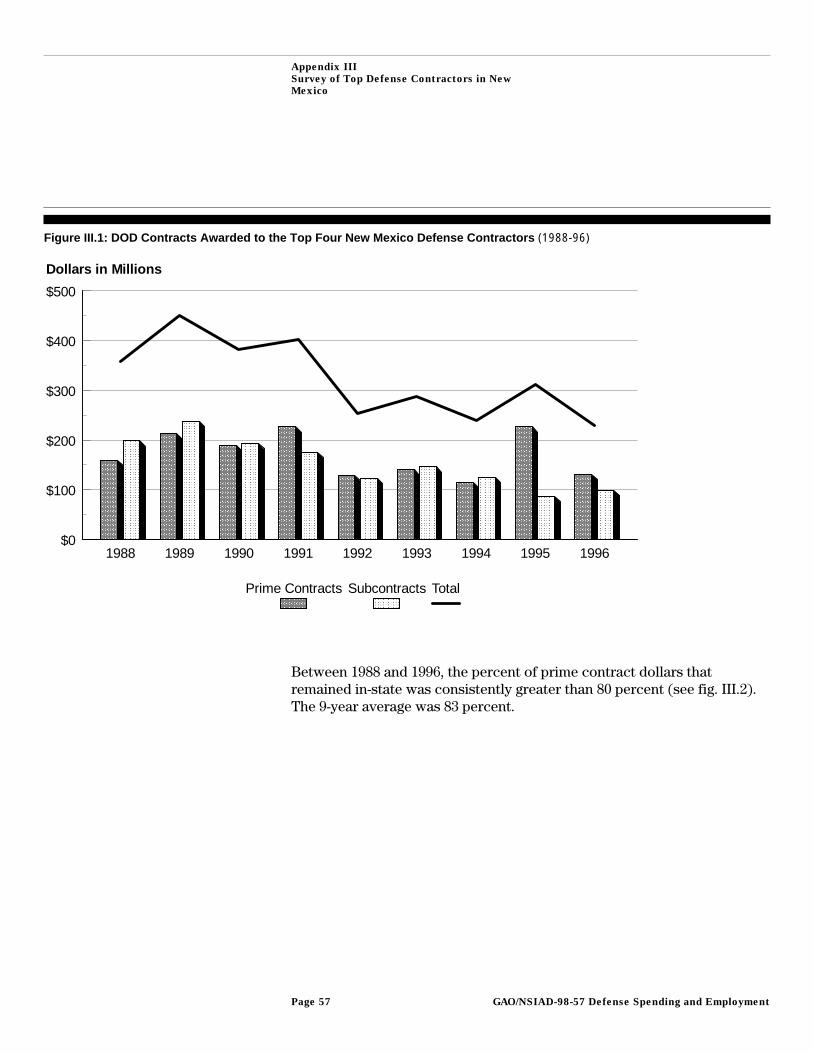
Appendix III
Survey of Top Defense Contractors in New
Mexico
Figure III.1: DOD Contracts Awarded to the Top Four New Mexico Defense Contractors (1988-96)
1988 1989 1990 1991 1992 1993 1994 1995 1996$0
$100
$200
$300
$400
$500
AAAAAAAAAAAAAAAAAAAAAAAAAAAAAAAAAAAAAAAAAAAAAAAAAAAAAAAAAAAAAAAA
AAAAAAAAAAAAAAAAAAAAAAAAAAAAAAAAAAAAAAAAAAAAAAAAAAAAAAAAAAAAAAAAAAAAAAAAAAAAAAAAAAAA
AAAAAAAAAAAAAAAAAAAAA
AAAAAAAAAAAAAAAAAAAAAAAAAAAAAAAAAAAAAAAAAAAAAAAAAAAAAAAAAAAAAAAAAAAAAAAAAAAA
AAAAAAAAAAAAAAAAAAAAAAAAAAAAAAAAAAAAAAAAAAAAAAAAAAAAAAAAAAAAAAAAAAAAAAAAAAAAAAAAAAAAAAAAAAAA
AAAAAAAAAAAAAAAAAAAAAAAAAAAAAAAAAAAAAAAAAAAAAAAAAAAA
AAAAAAAAAAAAA
AAAAAAAAAAAAAAAAAAAAAAAAAAAAAAAAAAAAAAAAAAAAAAAAAAAAAAAA
AAAAAAAAAAAAAAAAAAAAAAAAAAAAAAAAAAAAAAAAAAAAAAAA
AAAAAAAAAAAA
AAAAAAAAAAAAAAAAAAAAAAAAAAAAAAAAAAAAAAAAAAAAAAAAAAAAAAAAAAAAAAAAAAAAAAAAAAAAAAAAAAAAAAAAAAAA
AAAAAAAAAAAAAAAAAAAAAAAAAAAAAAAAAAAAAAAAAAAAAAAAAAAA
AAAAAAAAAAAAAAAAAAAAAAAAAAAAAAAAAAAAAAAAAAAAAAAAAAAAAAAAAAAAAAAAAAAAAAAAAAAAAAAA
AAAAAAAAAAAAAAAAAAAA
AAAAAAAAAAAAAAAAAAAAAAAAAAAAAAAAAAAAAAAAAAAAAAAAAAAAAAAAAAAAAAAAAAAAAAAAAAAAAAAAAAAAAAAAAAAAAAAA
AAAAAAAAAAAAAAAAAAAAAAAAAAAAAAAAAAAAAAAAAAAAAAAAAAAAAAAAAAAAAAAAAAAAAAAAAAAA
AAAAAAAAAAAAAAAAAAA
AAAAAAAAAAAAAAAAAAAAAAAAAAAAAAAAAAAAAAAAAAAAAAAAAAAAAAAAAAAAAAAAAAAAAAAA
AAAAAAAAAAAAAAAAAAAAAAAAAAAAAAAAAAAAAAAAAAAAAAAAAAAA
AAAAAAAAAAAAAAAAAAAAAAAAAAAAAAAAAAAAAAAAAAAAAAAAAAAAAAAAAAAA
AAAAAAAAAAAAAAA
AAAAAAAAAAAAAAAAAAAAAAAAAAAAAAAAAAAAAAAAAAAAAAAAAAAA
AAAAAAAAAAAAAAAAAAAAAAAAAAAAAAAAAAAA
AAAAAAAAA
AAAAAAAAAAAAAAAAAAAAAAAAAAAAAAAAAAAAAAAA
Dollars in Millions
AAAAAAAAAAAA
AAAAAA
AAAAAAAAAAAA
AAAAAA
Prime Contracts Subcontracts Total
Between 1988 and 1996, the percent of prime contract dollars thatremained in-state was consistently greater than 80 percent (see fig. III.2).The 9-year average was 83 percent.
GAO/NSIAD-98-57 Defense Spending and EmploymentPage 57
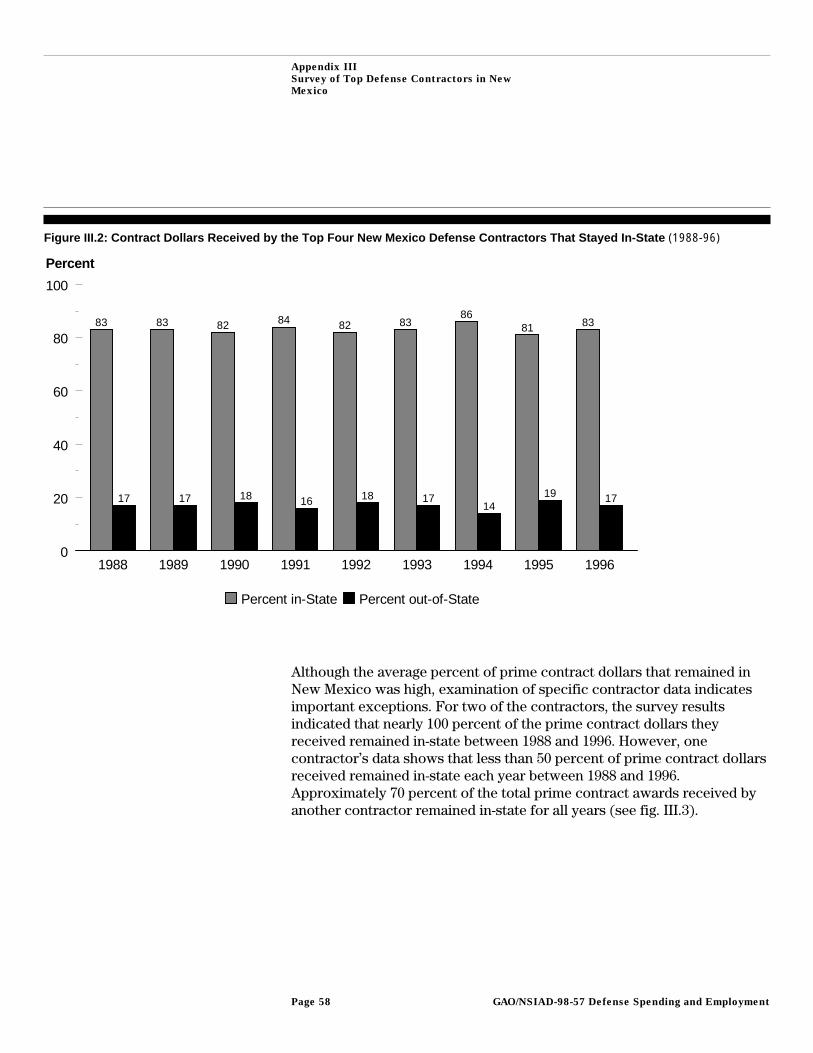
Appendix III
Survey of Top Defense Contractors in New
Mexico
Figure III.2: Contract Dollars Received by the Top Four New Mexico Defense Contractors That Stayed In-State (1988-96)
1988 1989 1990 1991 1992 1993 1994 1995 19960
20
40
60
80
100
83 83 82 84 82 8386
81 83
17 17 18 16 18 1714
19 17
Percent
Percent in-State Percent out-of-State
Although the average percent of prime contract dollars that remained inNew Mexico was high, examination of specific contractor data indicatesimportant exceptions. For two of the contractors, the survey resultsindicated that nearly 100 percent of the prime contract dollars theyreceived remained in-state between 1988 and 1996. However, onecontractor’s data shows that less than 50 percent of prime contract dollarsreceived remained in-state each year between 1988 and 1996.Approximately 70 percent of the total prime contract awards received byanother contractor remained in-state for all years (see fig. III.3).
GAO/NSIAD-98-57 Defense Spending and EmploymentPage 58

Appendix III
Survey of Top Defense Contractors in New
Mexico
Figure III.3: Differences in Percent of Prime Contract Dollars That Remained In-State (1988-96)
1988 1989 1990 1991 1992 1993 1994 1995 19960
10
20
30
40
50
60
70
80
90
100
110
Percent
Contractor 1 Contractor 2 Contractor 3 Contractor 4
For the two contractors that were also DOD subcontractors, a slightlysmaller percentage of their subcontract dollars remained in-statecompared to the percentage of their prime contract dollars (see fig. III.4).On average, 75 percent of subcontract dollars remained in-state between1988 and 1996.
GAO/NSIAD-98-57 Defense Spending and EmploymentPage 59
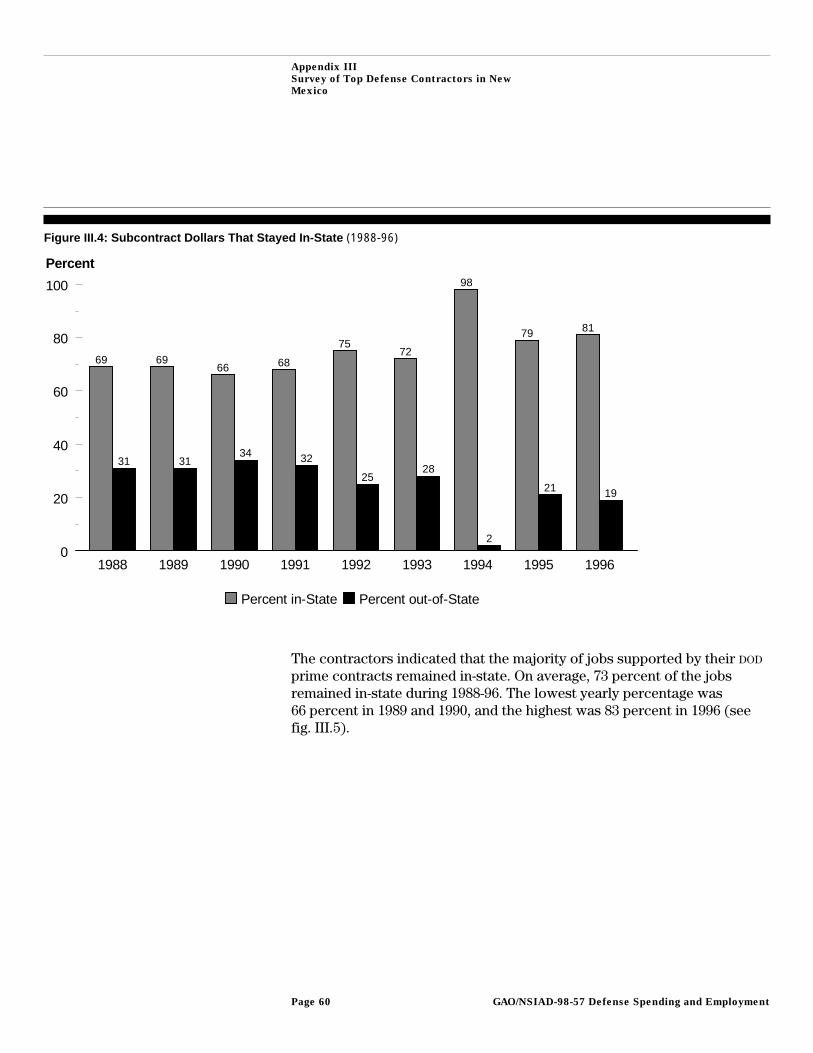
Appendix III
Survey of Top Defense Contractors in New
Mexico
Figure III.4: Subcontract Dollars That Stayed In-State (1988-96)
1988 1989 1990 1991 1992 1993 1994 1995 19960
20
40
60
80
100
69 6966 68
7572
98
79 81
31 3134 32
2528
2
21 19
Percent
Percent in-State Percent out-of-State
The contractors indicated that the majority of jobs supported by their DOD
prime contracts remained in-state. On average, 73 percent of the jobsremained in-state during 1988-96. The lowest yearly percentage was66 percent in 1989 and 1990, and the highest was 83 percent in 1996 (seefig. III.5).
GAO/NSIAD-98-57 Defense Spending and EmploymentPage 60
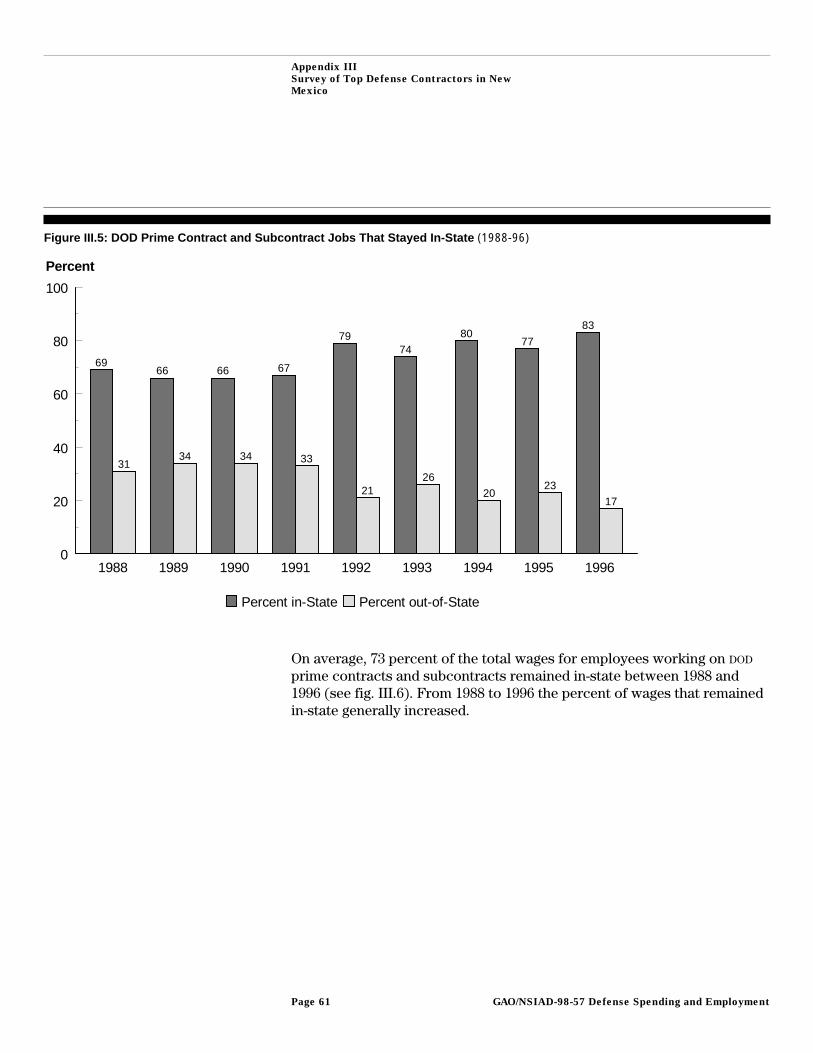
Appendix III
Survey of Top Defense Contractors in New
Mexico
Figure III.5: DOD Prime Contract and Subcontract Jobs That Stayed In-State (1988-96)
1988 1989 1990 1991 1992 1993 1994 1995 19960
20
40
60
80
100
6966 66 67
7974
8077
83
3134 34 33
2126
2023
17
Percent
Percent in-State Percent out-of-State
On average, 73 percent of the total wages for employees working on DOD
prime contracts and subcontracts remained in-state between 1988 and1996 (see fig. III.6). From 1988 to 1996 the percent of wages that remainedin-state generally increased.
GAO/NSIAD-98-57 Defense Spending and EmploymentPage 61
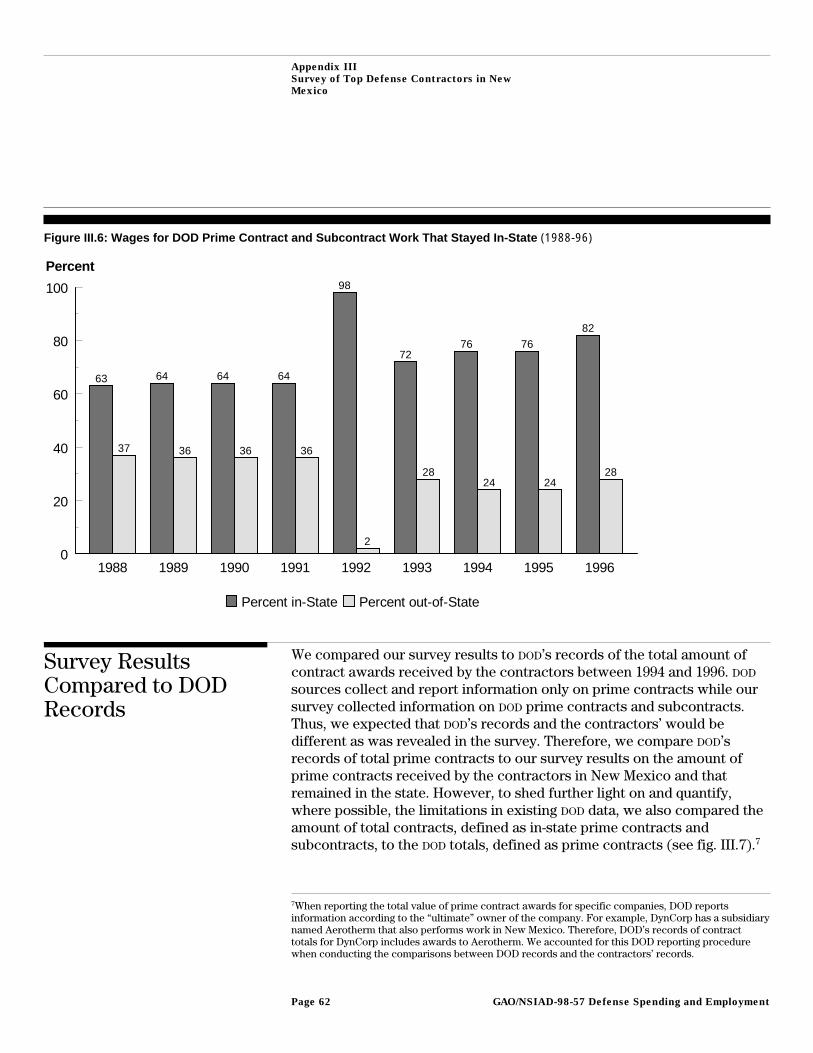
Appendix III
Survey of Top Defense Contractors in New
Mexico
Figure III.6: Wages for DOD Prime Contract and Subcontract Work That Stayed In-State (1988-96)
1988 1989 1990 1991 1992 1993 1994 1995 19960
20
40
60
80
100
63 64 64 64
98
7276 76
82
37 36 36 36
2
2824 24
28
Percent
Percent in-State Percent out-of-State
Survey ResultsCompared to DODRecords
We compared our survey results to DOD’s records of the total amount ofcontract awards received by the contractors between 1994 and 1996. DOD
sources collect and report information only on prime contracts while oursurvey collected information on DOD prime contracts and subcontracts.Thus, we expected that DOD’s records and the contractors’ would bedifferent as was revealed in the survey. Therefore, we compare DOD’srecords of total prime contracts to our survey results on the amount ofprime contracts received by the contractors in New Mexico and thatremained in the state. However, to shed further light on and quantify,where possible, the limitations in existing DOD data, we also compared theamount of total contracts, defined as in-state prime contracts andsubcontracts, to the DOD totals, defined as prime contracts (see fig. III.7).7
7When reporting the total value of prime contract awards for specific companies, DOD reportsinformation according to the “ultimate” owner of the company. For example, DynCorp has a subsidiarynamed Aerotherm that also performs work in New Mexico. Therefore, DOD’s records of contracttotals for DynCorp includes awards to Aerotherm. We accounted for this DOD reporting procedurewhen conducting the comparisons between DOD records and the contractors’ records.
GAO/NSIAD-98-57 Defense Spending and EmploymentPage 62
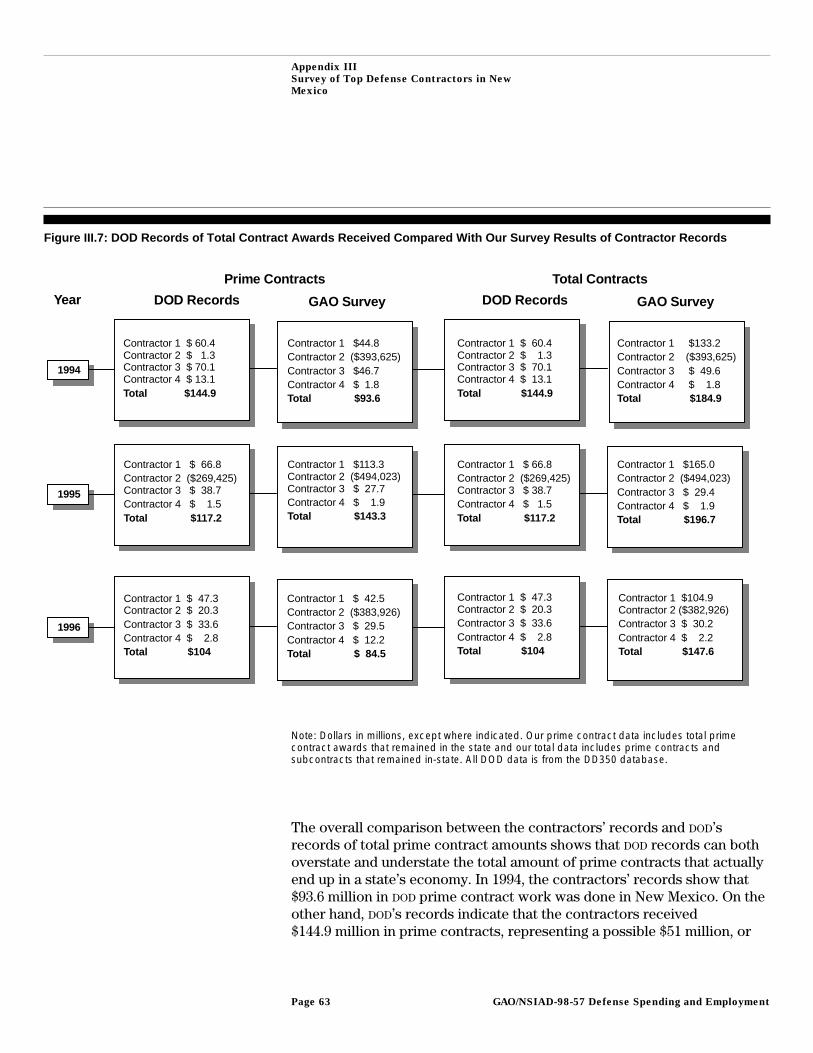
Appendix III
Survey of Top Defense Contractors in New
Mexico
Figure III.7: DOD Records of Total Contract Awards Received Compared With Our Survey Results of Contractor Records
1994
DOD Records GAO Survey
Contractor 1 $ 60.4 Contractor 2 $ 1.3 Contractor 3 $ 70.1 Contractor 4 $ 13.1Total $144.9
Prime Contracts
DOD Records GAO Survey
Total Contracts
1995
1996
Year
Contractor 1 $44.8Contractor 2 ($393,625)Contractor 3 $46.7Contractor 4 $ 1.8Total $93.6
Contractor 1 $133.2Contractor 2 ($393,625)Contractor 3 $ 49.6Contractor 4 $ 1.8 Total $184.9
Contractor 1 $ 66.8Contractor 2 ($269,425) Contractor 3 $ 38.7Contractor 4 $ 1.5Total $117.2
Contractor 1 $ 47.3 Contractor 2 $ 20.3Contractor 3 $ 33.6Contractor 4 $ 2.8Total $104
Contractor 1 $113.3 Contractor 2 ($494,023) Contractor 3 $ 27.7Contractor 4 $ 1.9Total $143.3
Contractor 1 $ 42.5Contractor 2 ($383,926)Contractor 3 $ 29.5Contractor 4 $ 12.2Total $ 84.5
Contractor 1 $165.0Contractor 2 ($494,023)Contractor 3 $ 29.4Contractor 4 $ 1.9Total $196.7
Contractor 1 $104.9 Contractor 2 ($382,926)Contractor 3 $ 30.2Contractor 4 $ 2.2Total $147.6
Contractor 1 $ 60.4 Contractor 2 $ 1.3 Contractor 3 $ 70.1 Contractor 4 $ 13.1Total $144.9
Contractor 1 $ 66.8Contractor 2 ($269,425) Contractor 3 $ 38.7Contractor 4 $ 1.5Total $117.2
Contractor 1 $ 47.3 Contractor 2 $ 20.3Contractor 3 $ 33.6Contractor 4 $ 2.8Total $104
Note: Dollars in millions, except where indicated. Our prime contract data includes total primecontract awards that remained in the state and our total data includes prime contracts andsubcontracts that remained in-state. All DOD data is from the DD350 database.
The overall comparison between the contractors’ records and DOD’srecords of total prime contract amounts shows that DOD records can bothoverstate and understate the total amount of prime contracts that actuallyend up in a state’s economy. In 1994, the contractors’ records show that$93.6 million in DOD prime contract work was done in New Mexico. On theother hand, DOD’s records indicate that the contractors received$144.9 million in prime contracts, representing a possible $51 million, or
GAO/NSIAD-98-57 Defense Spending and EmploymentPage 63
Appendix III
Survey of Top Defense Contractors in New
Mexico
about a 54-percent overstatement. However, in 1995, the contractors’records showed that $143.3 million in DOD prime contract work was donein the state, whereas DOD’s records show that the businesses received$117.2 million, representing a possible $26-million, or about an 18 percentunderstatement.
As expected, a comparison of the contractors’ records of the totalcontracts (in-state prime contracts and in-state subcontracts) to theexisting DOD records of total prime contracts shows that the totalsreported by the contractors were consistently greater than the totalsreported in DOD’s records.
Summary Between 1988 and 1996, more than 70 percent of the DOD prime contractand subcontract dollars and associated jobs and wages for the top fourcontractors in New Mexico remained in the state. However, a notableexception in one contractor’s data, combined with the fact that theprincipal type of contract awarded to firms in New Mexico generally is forservices, suggests that the survey findings may be explained, in part, bythe nature of the contracts that are awarded to the top New Mexicodefense contractors.
The responses of one contractor showed that about one third of the DOD
prime contract dollars received remained in state between 1988 and 1996.This pattern is an outlier relative to the data for the other threecontractors. Further, the DOD prime contracts this company receivedbetween 1994 and 1996 were exclusively for hardware and equipment. Onthe other hand, nearly 100 percent of two contractors’ prime contractdollars remained in the state and all of the contracts were for services(e.g., operation of military facilities, technical services). Data for the singleremaining contractor indicate that 70 to 80 percent of its DOD primecontract work remained in the state between 1988 and 1996. Thiscontractor received DOD contracts for services and for some hardwareprocurement between 1994 to 1996.
The presence of four military installations in New Mexico (Cannon,Holloman, and Kirtland Air Force Bases and White Sands Missile Range)drives the need for services to support the operation and maintenance ofthe installations. DOD’s data show that in each year during 1988-96, thelargest dollar amount of DOD prime contracts awarded to all businesses inNew Mexico was for services. Further, DOD’s data shows that between1994 and 1996 the four military installations consistently received the
GAO/NSIAD-98-57 Defense Spending and EmploymentPage 64
Appendix III
Survey of Top Defense Contractors in New
Mexico
largest dollar amount of DOD prime contracts compared to all other citiesor locations in the state. Given that these installations generate servicecontracts, it is reasonable to expect that the dollars received by these topfour contractors for performing the service contracts would remain in thestate. However, the survey data indicate it would be inappropriate togeneralize that expectation to all types of DOD contracts (e.g., majorhardware, equipment, and supplies).
DOD’s official data on prime contracts for the top four contractorsoverstated as well understated amounts reported by the contractors. Ourresearch suggests at least three reasons for this. First, DOD’s data does notaccount for leakages of DOD prime contract dollars from the state’seconomy that may occur through the subcontracting process. All of thecontractors we surveyed indicated that they subcontracted out of state atone time or another or did it consistently. Second, DOD is required to reportonly on prime contracts greater than $25,000. This reporting threshold maybe very inclusive for certain types of DOD purchases (e.g., major weaponsystems). However, for other types of DOD purchases (e.g., service contracts), this reporting threshold may mask a largeproportion of actual DOD expenditures. And third, the existing DOD datasources do not account for injections into a state’s economy fromsubcontracts that companies receive from other DOD contractors.
(713003) GAO/NSIAD-98-57 Defense Spending and EmploymentPage 65
Ordering Information
The first copy of each GAO report and testimony is free.
Additional copies are $2 each. Orders should be sent to the
following address, accompanied by a check or money order
made out to the Superintendent of Documents, when
necessary. VISA and MasterCard credit cards are accepted, also.
Orders for 100 or more copies to be mailed to a single address
are discounted 25 percent.
Orders by mail:
U.S. General Accounting Office
P.O. Box 37050
Washington, DC 20013
or visit:
Room 1100
700 4th St. NW (corner of 4th and G Sts. NW)
U.S. General Accounting Office
Washington, DC
Orders may also be placed by calling (202) 512-6000
or by using fax number (202) 512-6061, or TDD (202) 512-2537.
Each day, GAO issues a list of newly available reports and
testimony. To receive facsimile copies of the daily list or any
list from the past 30 days, please call (202) 512-6000 using a
touchtone phone. A recorded menu will provide information on
how to obtain these lists.
For information on how to access GAO reports on the INTERNET,
send an e-mail message with "info" in the body to:
or visit GAO’s World Wide Web Home Page at:
http://www.gao.gov
PRINTED ON RECYCLED PAPER

United StatesGeneral Accounting OfficeWashington, D.C. 20548-0001
Official BusinessPenalty for Private Use $300
Address Correction Requested
Bulk RatePostage & Fees Paid
GAOPermit No. G100


![[XLS] · Web view118 118 45 45 88 118 118 128 128 128 128 98 98 12 12 12 98 98 98 88 98 58 128 128 98 98 98 98 98 98 98 98 12 12 98 98 98 98 12 98 98 98 58 12 98 98 98 98 98 98 98](https://static.fdocuments.us/doc/165x107/5b1aab787f8b9a1e258df5af/xls-web-view118-118-45-45-88-118-118-128-128-128-128-98-98-12-12-12-98-98.jpg)


