NREL/SR-500-36973 Pass Wind Resource Area · Lim, Julia Camp, Jessie Quinn, Natasha Tuatoo-Bartley,...
411
A national laboratory of the U.S. Department of Energy Office of Energy Efficiency & Renewable Energy National Renewable Energy Laboratory Innovation for Our Energy Future Subcontract Report Bird Mortality at the Altamont NREL/SR-500-36973 Pass Wind Resource Area August 2005 March 1998 — September 2001 K.S. Smallwood and C.G. Thelander BioResource Consultants Ojai, California NREL is operated by Midwest Research Institute ● Battelle Contract No. DE-AC36-99-GO10337
Transcript of NREL/SR-500-36973 Pass Wind Resource Area · Lim, Julia Camp, Jessie Quinn, Natasha Tuatoo-Bartley,...

A national laboratory of the U.S. Department of Energy Office of Energy Efficiency & Renewable Energy
National Renewable Energy Laboratory Innovation for Our Energy Future
Subcontract Report Bird Mortality at the Altamont NREL/SR-500-36973
Pass Wind Resource Area August 2005
March 1998 — September 2001 K.S. Smallwood and C.G. Thelander BioResource Consultants Ojai, California
NREL is operated by Midwest Research Institute ● Battelle Contract No. DE-AC36-99-GO10337

Bird Mortality at the Altamont Pass Wind Resource Area March 1998 — September 2001 K.S. Smallwood and C.G. Thelander BioResource Consultants Ojai, California
NREL Technical Monitor: K. Sinclair Prepared under Subcontract No. LAT-1-30222-01
Subcontract Report NREL/SR-500-36973 August 2005
National Renewable Energy Laboratory 1617 Cole Boulevard, Golden, Colorado 80401-3393 303-275-3000 • www.nrel.gov
Operated for the U.S. Department of Energy Office of Energy Efficiency and Renewable Energy by Midwest Research Institute • Battelle
Contract No. DE-AC36-99-GO10337

NOTICE
This report was prepared as an account of work sponsored by an agency of the United States government. Neither the United States government nor any agency thereof, nor any of their employees, makes any warranty, express or implied, or assumes any legal liability or responsibility for the accuracy, completeness, or usefulness of any information, apparatus, product, or process disclosed, or represents that its use would not infringe privately owned rights. Reference herein to any specific commercial product, process, or service by trade name, trademark, manufacturer, or otherwise does not necessarily constitute or imply its endorsement, recommendation, or favoring by the United States government or any agency thereof. The views and opinions of authors expressed herein do not necessarily state or reflect those of the United States government or any agency thereof.
Available electronically at http://www.osti.gov/bridge
Available for a processing fee to U.S. Department of Energy and its contractors, in paper, from:
U.S. Department of Energy Office of Scientific and Technical Information P.O. Box 62 Oak Ridge, TN 37831-0062 phone: 865.576.8401 fax: 865.576.5728 email: mailto:[email protected]
Available for sale to the public, in paper, from: U.S. Department of Commerce National Technical Information Service 5285 Port Royal Road Springfield, VA 22161 phone: 800.553.6847 fax: 703.605.6900 email: [email protected] online ordering: http://www.ntis.gov/ordering.htm
This publication received minimal editorial review at NREL
Printed on paper containing at least 50% wastepaper, including 20% postconsumer waste

i
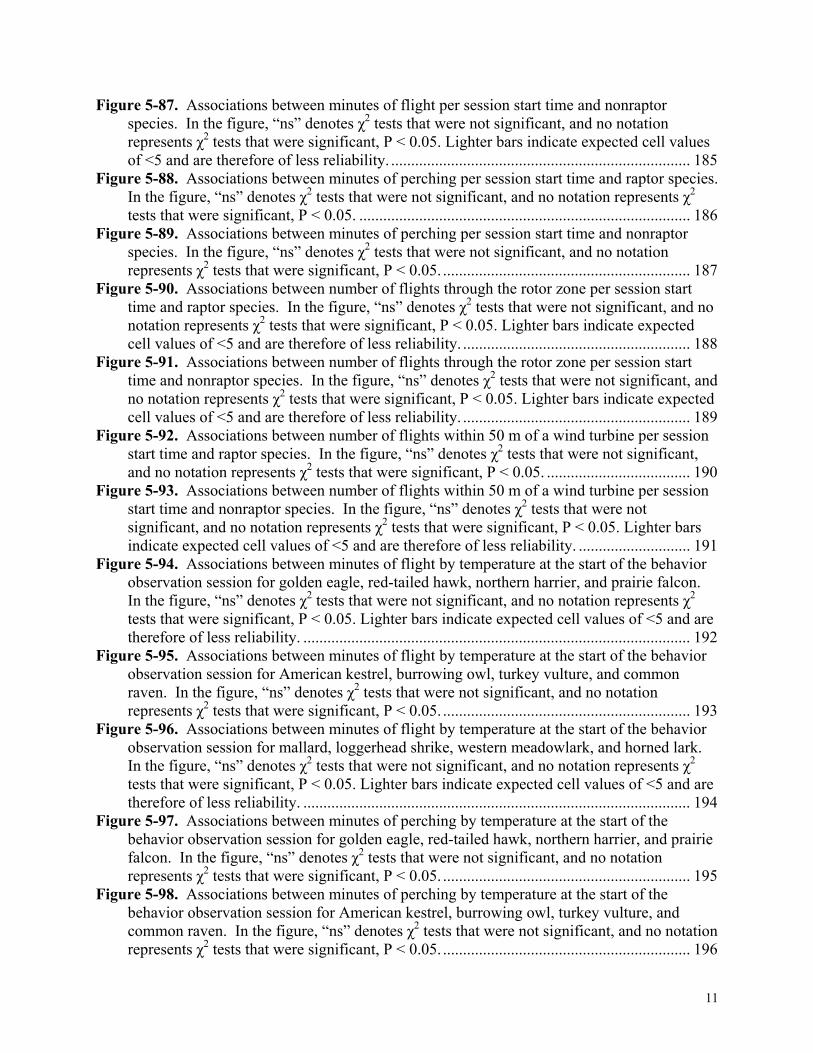
EXECUTIVE SUMMARY Over the past 15 years, research has shown that wind turbines in the Altamont Pass Wind Resource Area (APWRA) kill many birds, including raptors, which are protected by the Migratory Bird Treaty Act (MBTA), the Bald and Golden Eagle Protection Act, and/or state and federal Endangered Species Acts. Early research in the APWRA on avian mortality mainly attempted to identify the extent of the problem. In 1998, however, the National Renewable Energy Laboratory (NREL) initiated research to address the causal relationships between wind turbines and bird mortality. NREL funded a project by BioResource Consultants to perform this research directed at identifying and addressing the causes of mortality of various bird species from wind turbines in the APWRA. With 580 megawatts (MW) of installed wind turbine generating capacity in the APWRA, wind turbines there provide up to 1 billion kilowatt-hours (kWh) of emissions-free electricity annually. By identifying and implementing new methods and technologies to reduce or resolve bird mortality in the APWRA, power producers may be able to increase wind turbine electricity production at the site and apply similar mortality-reduction methods at other sites around the state and country. Objectives This 3 ½-year research effort involving 1,536 wind turbines was aimed at better understanding bird mortality at the world’s largest wind farm—the Altamont Pass Wind Resource Area (APWRA) in central California. We studied bird behaviors, raptor prey availability, wind turbine/tower design, inter-turbine distribution, landscape attributes, and range management practices in our effort to explain the variation in bird mortality in the APWRA. Our primary research objectives were to: (1) quantify bird use, including characterizing and quantifying perching and flying behaviors exhibited by individual birds around wind turbines; (2) evaluate flying behaviors and the environmental and topographic conditions associated with flight behaviors; and (3) identify possible relationships between bird behaviors and bird mortality, wind tower design and operations, landscape attributes, and prey availability. Approach Other studies have evaluated bird mortality in the APWRA. Our study differed from past studies in several significant ways, including:
• Adoption of an ecological indicators framework for addressing and interpreting factors related to avian mortality in the APWRA, in which solutions to the problem are based on consideration of the susceptibility of each species to impacts due to their natural behaviors, vulnerability of each species due to the installation of the wind turbines, and impacts that are measured by various mortality metrics
• Fatality searches performed at 1,536 wind turbines, composing the largest sample size of wind turbines searched for fatalities at any wind farm until the time of our study
• Adjustments to the mortality estimates to account for errors in detection rates and the rates of removal of carcasses by scavengers
• Ranges of mortality estimates, in which the lower end of the range was the mortality adjusted for fatalities that were likely missed beyond the 50-meter (m) search radius and the upper end was the mortality adjusted for fatalities missed due to undetected carcass removal by scavengers

ii
• Extensive behavior observations of birds flying and perching within 300 m of 1,165 wind turbines over a 2-year period.
Outcomes We obtained a sample of 688 fatalities, most of which were caused by wind turbine collisions, and most but not all of which were found within our 50-m search radius around wind turbines. Carcasses were found significantly farther away from wind turbines on taller towers compared to those on shorter towers, and from turbines at the ends of rows compared to those in the interior. Based on our sample of a limited area of the APWRA, we estimated that between 570 and 835 raptors are killed there annually. For all birds combined, that number was estimated at between 1,870 and 4,310. At least 31 bird species were represented in the fatalities, as well as one bat species. We estimated that the APWRA wind turbines annually kill 28 to 34 golden eagles, 196 to 237 red-tailed hawks, 54 to 136 American kestrels, and 181 to 457 burrowing owls. However, we note that these numbers changed with the completion of the expanded fatality searches funded by the California Energy Commission (CEC) and reported in Smallwood and Thelander (2004). Pocket gopher burrow systems were more clustered around wind turbines in areas where rodent control was applied in the APWRA, and more uniformly distributed around wind turbines in areas of no rodent control. Ground squirrel burrow systems were not clustered around wind turbines, but desert cottontail burrows were clustered around wind turbines, mostly under the tower pads. We observed at least 36 bird species during the 1,958 behavioral observation sessions, which totaled 979 hours. We recorded 48,396 bird sightings, with sightings averaging 3.2 birds per observation session. We observed no birds in 184 of the observation sessions. We recorded 31,317 minutes of bird activity, including 13,725 minutes spent flying (44%) and 17,592 minutes spent perching (56%). Factoring the number of birds composing each sighting, we recorded 454,801 minutes of bird activity, including 364,042 minutes of flying (80%) and 23,227 minutes of perching (20%). Typically, birds perched on wind turbines when there was no wind and turbines were not operating. Most of the dangerous flights of birds through the rotor zone were made during no winds. Evidence indicated that birds are aware of operating wind turbines and take measures to avoid moving wind turbine blades, but we also found that raptor species flew within the areas 50 m from wind turbines several times more often than expected by chance. The number of fatalities per species correlated positively with the number of flights the species made through the rotor zone, and with the number of flights made within 50 m of broken or non-operational wind turbines. Raptor fatalities were disproportionately greater at wind turbines with larger rotor diameters, slowest to intermediate blade tip speeds, mounted on tubular towers, and on taller towers (within the height domain of the towers in our study). Raptor fatalities were disproportionately greater at wind turbines on ridge saddles, plateaus, and in ravines and canyons, on south- and northwest-facing slopes, at lower elevations, and on steeper slopes. There were also disproportionately more fatalities where rock piles were numerous nearby. Raptor fatalities occurred more often than expected by chance at turbines at the ends of rows and at the edges of gaps, as well as at the edges of local clusters of wind turbines, at more isolated wind turbines,

iii
where rodent control was applied intermittently, where ground squirrel densities were high, and where the degree of clustering of all fossorial mammal burrow systems was greatest. Conclusions and Recommendations We identified the strongest candidate mitigation measures for reducing and compensating biological impacts caused by the APWRA, and we recommend the following measures be implemented as soon as possible:
• Cease the rodent control program that was applied by the County of Alameda and the wind turbine owners in 1997
• Alter habitat within 50 m of wind turbines in order to reduce prey vulnerability to raptor predation near wind turbines, thereby reducing raptor use of these areas
• Move rock piles farther away from the wind turbines • Relocate wind turbines out of large drainages, and move the more isolated wind turbines
closer to clusters of other wind turbines • Shut down wind turbines during the winter • Fix, replace, or remove broken or non-operational wind turbines, along with their towers • Apply the Hodos et al. blade painting scheme to the wind turbines identified as the most
dangerous to raptors • Retrofit electrical distribution poles so that they comply with APLIC standards • Exclude cattle from the areas nearby tower pads of wind turbines • Purchase conservation easements to protect raptor habitat outside the APWRA as a means of
offsetting the impacts that cannot be eliminated • Fund nonprofit conservation organizations with programs that benefit raptors and other bird
species adversely affected by the APWRA, such as research programs or rehabilitation facilities.

iv
ACKNOWLEDGEMENTS This project was funded by the National Renewable Energy Laboratory (NREL). We thank Karin Sinclair, NREL's Senior Project Leader, for her guidance and support. BRC field biologists who have participated on the project include: Lourdes Rugge (Field Team Leader), Stacia Hoover, James Cain, Cherilyn Burton, Elizabeth van Mantgen, Danika Tsao, Larry Lacunza, Tammy Lim, Julia Camp, Jessie Quinn, Natasha Tuatoo-Bartley, Adam Ballard, Laura Burkholder, Jennifer Phan, Caroline Szafranski, Erin Harrington, Marchel Munnecke, Angie Harbin, and Jeanette Weisman. Their dedication, positive attitudes, and willingness to work hard under demanding conditions have been an inspiration. W. Grainger Hunt, Ph.D. (University of California, Santa Cruz, Predatory Bird Research Group/The Peregrine Fund) graciously provided his GIS database of turbine locations throughout the APWRA, and his insights about the ecology of golden eagles and their prey in the region. Michael L. Morrison, Ph.D., provided valuable insights and direction throughout the project. We thank Seth Sutherland for his GIS and GPS knowledge and support, without which we could not have tested a number of important hypotheses. We also thank Brian Karas for use of his photos of the APWRA while working for BRC under funding from the California Energy Commission. We especially thank the management and field personnel of ENRON, FORAS, EnXco, SeaWest, Green Ridge Services, and Altamont Wind Power for providing logistical support and permission to access wind energy generating facilities that they own, lease, manage, and/or maintain.

1
Table of Contents
EXECUTIVE SUMMARY ............................................................................................................. i LIST OF FIGURES ........................................................................................................................ 4 LIST OF TABLES........................................................................................................................ 24 CHAPTER 1: UNDERSTANDING THE PROJECT ................................................................. 26 1-1 INTRODUCTION................................................................................................................. 26
Natural Behaviors and Ecological Relationships: Susceptibility............................................. 27 Exposure to Wind Farm Operations: Vulnerability ................................................................. 28 Measuring Effects on Birds: Impacts........................................................................................ 28 Relating Impacts to Causal Variables: Predictions and Solutions ........................................... 30
1-2 OBJECTIVES........................................................................................................................ 30 1-3 STUDY AREA...................................................................................................................... 31 CHAPTER 2: BIRD MORTALITY ............................................................................................ 37 2-1 INTRODUCTION................................................................................................................. 37 2-2 METHODS............................................................................................................................ 38 2-3 RESULTS.............................................................................................................................. 43 2-4 DISCUSSION........................................................................................................................ 51 CHAPTER 3: FATALITY LOCATIONS AND PROXIMITY TO TURBINE TOWERS........ 53 3-1 INTRODUCTION................................................................................................................. 53 3-2 METHODS............................................................................................................................ 53
Scavenging Effects.................................................................................................................... 53 3-3 RESULTS.............................................................................................................................. 54
Overview of Avian Fatalities in the APWRA........................................................................... 54 Distances of Bird Carcasses from Wind Turbines.................................................................... 62 Scavenging Effects.................................................................................................................... 64
3-4 DISCUSSION........................................................................................................................ 68 CHAPTER 4: DISTRIBUTION AND ABUNDANCE OF FOSSORIAL.................................. 71 ANIMAL BURROWS.................................................................................................................. 71 4-1 INTRODUCTION................................................................................................................. 71 4-2 METHODS............................................................................................................................ 73 4-3 RESULTS.............................................................................................................................. 75
Seasonal and Interannual Variation in Distribution and Abundance........................................ 77 Associations with Wind Turbine String Attributes and Range Management........................... 79
4-4 DISCUSSION........................................................................................................................ 83 CHAPTER 5: BIRD BEHAVIORS............................................................................................. 88 5-1 INTRODUCTION................................................................................................................. 88 5-2 METHODS............................................................................................................................ 88
Plot Level of Analysis............................................................................................................... 92 String Level of Analysis ........................................................................................................... 93 Turbine Level of Analysis ........................................................................................................ 94 Statistical Tests ......................................................................................................................... 95
5-3 RESULTS.............................................................................................................................. 96 Characteristics of the Observation Sessions ............................................................................. 96 Overall Bird Use ..................................................................................................................... 104 Association Analysis............................................................................................................... 121
Seasons................................................................................................................................ 121

2
Wind Speed......................................................................................................................... 144 Wind Direction (origin) ...................................................................................................... 159 Squirrel Activity.................................................................................................................. 175 Squirrel Numbers ................................................................................................................ 179 Session Start Time .............................................................................................................. 183 Temperature ........................................................................................................................ 191 Proximity Zone ................................................................................................................... 202
String Level of Analysis ......................................................................................................... 204 Rodent Control.................................................................................................................... 204 Physical Relief .................................................................................................................... 210 Whether in Canyon ............................................................................................................. 217
Turbine Level of Analysis ...................................................................................................... 222 Turbine Type....................................................................................................................... 222 Turbine Orientation to Wind............................................................................................... 226 Operating Status of Nearest Turbine................................................................................... 228 Tower Type......................................................................................................................... 235 Tower Height ...................................................................................................................... 240 Position in Turbine String................................................................................................... 245 Whether Part of Wind Wall ................................................................................................ 248 Turbine Congestion............................................................................................................. 250 Location in Wind Farm....................................................................................................... 253 Elevation ............................................................................................................................. 255 Slope Grade......................................................................................................................... 260 Slope Aspect ....................................................................................................................... 263 Physical Relief .................................................................................................................... 266 Whether in Canyon ............................................................................................................. 271 Edge Index .......................................................................................................................... 273 Rock Piles ........................................................................................................................... 276
Relating Bird Use to Fatalities................................................................................................ 278 Interspecific Level of Analysis ........................................................................................... 278 Turbine Row Level of Analysis.......................................................................................... 281
5-4 DISCUSSION...................................................................................................................... 288 Bird Behaviors and Fatalities.................................................................................................. 288 Avian Perceptions of Wind Turbines...................................................................................... 293 Ground Squirrel Distribution and Control Programs.............................................................. 294 Behavioral Characterization of Select Species ....................................................................... 294 The Analytical Challenge of Differential Sampling Effort..................................................... 295 Conclusions............................................................................................................................. 296
CHAPTER 6: FATALITY ASSOCIATIONS AND VULNERABILITY................................ 297 6-1 INTRODUCTION............................................................................................................... 297 6-2 METHODS.......................................................................................................................... 299
Variables ............................................................................................................................. 300 Analysis............................................................................................................................... 301
6-3 RESULTS ............................................................................................................................ 305 Sample Characteristics............................................................................................................ 305 Fatality Associations............................................................................................................... 317
Season ................................................................................................................................. 320

3
Wind Turbine Model........................................................................................................... 320 Wind Turbine Size .............................................................................................................. 321 Rated Speed ........................................................................................................................ 321 Rotor Diameter.................................................................................................................... 321 Tip Speed ............................................................................................................................ 321 Window of Time to Fly Through Rotor Plane.................................................................... 321 Rotor Area Swept per Second............................................................................................. 322 Rotor Orientation to Wind .................................................................................................. 322 Tower Type......................................................................................................................... 322 Tower Height ...................................................................................................................... 322 Physical Relief .................................................................................................................... 322 Canyons............................................................................................................................... 322 Slope Aspect ....................................................................................................................... 323 Elevation ............................................................................................................................. 323 Slope Grade......................................................................................................................... 323 Rock Piles ........................................................................................................................... 323 Position in String ................................................................................................................ 323 Wind Wall........................................................................................................................... 324 Position in Wind Farm........................................................................................................ 324 Wind Turbine Congestion................................................................................................... 324 Wind Company ................................................................................................................... 324 Rodent Control.................................................................................................................... 324 Edge Index .......................................................................................................................... 324 Burrow Distribution ............................................................................................................ 325
6-4 DISCUSSION...................................................................................................................... 383 Wind Turbine/Tower Attributes ............................................................................................. 383 Physiography........................................................................................................................... 383 Wind Farm Configuration....................................................................................................... 384 Rodent Control and Burrowing Animals ................................................................................ 384
CHAPTER 7: CONCLUSIONS AND RECOMMENDATIONS............................................. 388 7-1 RODENT CONTROL ................................................................................................. 388 7-2 HABITAT ALTERATION ......................................................................................... 388 7-3 PERCH GUARDS....................................................................................................... 388 7-4 SEASONAL SHUTDOWN OF WIND TURBINES.................................................. 392 7-5 MOVING ROCK PILES............................................................................................. 392 7-6 BARRICADING THE ROTOR PLANE .................................................................... 393 7-7 PROVIDING ALTERNATIVE PERCHES................................................................ 393 7-8 RELOCATING SELECTED WIND TURBINES ...................................................... 393 7-9 BROKEN AND NONOPERATIONAL WIND TURBINES..................................... 394 7-10 PAINTING TURBINE BLADES ............................................................................. 394 7-11 RETROFITTING POWER POLES .......................................................................... 394 7-12 EXCLUDING CATTLE FROM TOWER PADS..................................................... 394 7-13 OFF-SITE MITIGATION ......................................................................................... 395
REFERENCES ........................................................................................................................... 397

4
LIST OF FIGURES
Figure 1-1. Approximate boundary (outlined polygon) of the APWRA, located in Alameda and Contra Costa counties. .......................................................................................................... 36
Figure 2-1. Frequency distribution of span of years spent searching for carcasses in the APWRA, May 1998 to September 2001............................................................................... 40
Figure 2-2. Frequency distribution of number of searches for carcasses in the APWRA, May 1998 to September 2001. ...................................................................................................... 40
Figure 2-3. Mean comparisons of the number of fatality searches performed per season of the year in the APWRA, May 1998 to September 2001............................................................. 41
Figure 2-4. Frequency distribution of the number of searches per year made for estimating avian mortality in the APWRA, May 1998 to September 2001..................................................... 41
Figure 2-5. Relationships between the number of searches and the number of years spanning the searches (A), and between the searches per year and the number of years spanning the searches (B)........................................................................................................................... 42
Figure 2-6. Illustration of typical carcass search patterns around wind turbine strings.............. 43 Figure 2-7. Frequency distributions of avian mortality for selected species in the APWRA, May
1998 to September 2001. ...................................................................................................... 47 Figure 2-8. Mean comparisons of red-tailed hawk mortality across seasons in the APWRA, May
1998 to September 2001. ...................................................................................................... 48 Figure 2-9. Chi-square test results of mortality associated with season of the year in the
APWRA, May 1998 to September 2001............................................................................... 49 Figure 2-10. Red-tailed hawk mortality was greatest at turbines where rodent control was
applied................................................................................................................................... 50 Figure 2-11. Golden eagle mortality was greatest at turbines where rodent control was applied.
............................................................................................................................................... 51 Figure 2-12. All hawk mortality was greatest at turbines where rodent control was applied..... 51 Figure 3-1. Frequency distribution of typical body size of bird species whose carcasses were
found at the APWRA, 1998-2001......................................................................................... 54 Figure 3-2. Distribution of causes attributed to fatalities found at the APWRA, 1998-2001..... 55 Figure 3-3. Frequency of injuries noted for carcasses found at the APWRA, 1998-2001. ........ 57 Figure 3-4. Distribution of age at time of death noted for carcasses found at the APWRA, 1998-
2001....................................................................................................................................... 59 Figure 3-5. Seasonal distribution of carcasses found at the APWRA, 1998-2001 (Note: these
numbers are not adjusted by search effort). .......................................................................... 59 Figure 3-6. Distribution of carcasses found associated with the types of wind turbines operated
at the APWRA, 1998-2001 (Note: these are not adjusted by search effort)......................... 60 Figure 3-7. Frequency distribution of estimated days since death of carcasses found at the
APWRA, 1998-2001............................................................................................................. 61 Figure 3-8. Distribution of carcasses by elevation at the APWRA, 1998-2001 (Note: these
frequencies are not adjusted by search effort). ..................................................................... 62 Figure 3-9. Frequency distribution of distance (meters) between carcasses and wind towers of
large-bodied bird species (A) and small-bodied species (B). ............................................... 64 Figure 3-10. Frequency distribution of bearing (degrees, magnetic north) from wind towers to
carcasses of large-bodied bird species (A) and small-bodied species (B). ........................... 65 Figure 3-11. Relationship between distance of carcass from wind towers and tower height for
large-bodied bird species (A) and small-bodied species (B). ............................................... 66

5
Figure 3-12. Relationship between distance of carcass from wind towers and tower height for large-bodied bird species (A) and small-bodied species (B). ............................................... 67
Figure 3-13. Relationship between distance of carcass from wind towers and tower height coupled with topographic conditions relevant to degrees of declivity winds for large-bodied bird species (A) and small-bodied species (B). .................................................................... 68
Figure 4-1. Frequency distributions of the degree of clustering of pocket gopher burrow systems at wind turbines represented by (A) the slope of log density regressed on log search area, and (B) the observed ÷ expected number of burrow systems within 15 m of the wind turbines.................................................................................................................................. 76
Figure 4-2. The degree of clustering of pocket gopher burrow systems within 90 m of wind turbines related to the level of rodent control applied in the area. The degree of clustering in this case was represented by the steepness of negative slopes of log density regressed on log search area............................................................................................................................. 77
Figure 4-3. Relationship between two methods of characterizing the degree of clustering of burrow systems at wind turbines........................................................................................... 77
Figure 4-4. Seasonal pattern of the degree of clustering of burrow systems at wind turbines for (A) pocket gopher and (B) ground squirrel........................................................................... 78
Figure 4-5. Trends through the study in density of burrow systems out to 90 m from wind turbines for (A) pocket gophers and (B) ground squirrels.................................................... 79
Figure 4-6. Responses of the degree of clustering at wind turbines (A) and the density within 90 m of wind turbines (B) of pocket gopher and ground squirrel burrow systems to levels of rodent control. ....................................................................................................................... 81
Figure 4-7. Responses of desert cottontail burrow system density out to 15 m (A) and 90 m (B) from wind turbines due to levels of rodent control............................................................... 82
Figure 4-8. Response of the degree of clustering of desert cottontail burrow system at wind turbines due to levels of rodent control................................................................................. 83
Figure 5-1. The rotor plane of a Bonus turbine and the upper and lower reaches of the rotor zone of a string of four turbines............................................................................................ 91
Figure 5-2. Examples of buffers created in GIS and corrected to fit the three-dimensional landscape to test for behavior patterns in relation to proximity to wind turbines................. 93
Figure 5-3. Frequency distribution of start times for the 1,958 behavioral observation sessions................................................................................................................................................ 97
Figure 5-4. The frequency distribution of behavioral observation sessions performed among study plots. ............................................................................................................................ 97
Figure 5-5. Frequency distribution of behavioral observation sessions among months of the year........................................................................................................................................ 98
Figure 5-6. Frequency distribution of temperature at the start of 1,958 behavioral observation sessions. ................................................................................................................................ 98
Figure 5-7. Frequency distribution of wind directions (origin) during behavioral observation sessions. ................................................................................................................................ 99
Figure 5-8. Frequency distribution of wind speeds among behavioral observation sessions, where wind force measured on the Beaufort scale was the following: 0 was <0.3 m/s, 1 was 0.3 to 1.5 m/s, 2 was 1.6 to 3.3 m/s, 3 was 3.4 to 5.4 m/s, 4 was 5.5 to 7.9 m/s, 5 was 8 to 10.7 m/s, 6 was 10.8 to 13.8 m/s, and 7 was > 13.8 m/s....................................................... 99
Figure 5-9. Wind speed during behavioral observation sessions as functions of direction of origin (A) and month of the year (B). ................................................................................. 100

6
Figure 5-10. The proportion of turbines operating in the plot during behavioral observation sessions was a function of wind speed (A) and month of the year (B)............................... 101
Figure 5-11. The frequency distributions of wind turbines and sampling effort applied by model of manufacture. ................................................................................................................... 102
Figure 5-12. The frequency distributions of wind turbines and sampling effort applied by orientation of the rotor to the wind. .................................................................................... 102
Figure 5-13. The frequency distributions of wind turbines (A) and sampling effort (B) by elevation of the tower among wind turbines included in the behavior study. .................... 103
Figure 5-14. The average number of California ground squirrels seen per month on the study plot at the start of the behavioral observation session. ....................................................... 104
Figure 5-15. Frequency distribution of the distance to the nearest turbine recorded for bird sightings during the behavioral observation sessions. ........................................................ 105
Figure 5-16. The number of passes of birds through the rotor zone correlated strongly with the number of flights within 50 m of wind turbines. ................................................................ 105
Figure 5-17. The average times birds spent flying (A) and perching (B) were greater during slower winds. ...................................................................................................................... 106
Figure 5-18. The average times birds spent flying (A) and perching (B) were greater during the fall and winter months. ....................................................................................................... 107
Figure 5-19. The average number of passes of birds through the rotor zone related to wind direction (A) and wind speed (B) during the behavior observation session. ...................... 108
Figure 5-20. The average number of passes of birds through the rotor zone related to month of the year................................................................................................................................ 109
Figure 5-21. The average distance of birds to the nearest wind turbine related to wind direction during the behavior observation session. ............................................................................ 109
Figure 5-22. The average distance of birds to the nearest wind turbine related to wind speed (A) and month of the year (B) when the behavior observation session was performed. .......... 110
Figure 5-23. The average number of flights of birds within 50 m of wind turbines related to wind direction (A) and wind speed (B) during the behavior observation session. ............. 111
Figure 5-24. The average number of flights of birds within 50 m of wind turbines related to month of the year when the behavior observation session took place. ............................... 112
Figure 5-25. Associations between number of minutes of flight by month for golden eagle and red-tailed hawk. For both species, χ2 tests were significant, P < 0.05. .............................. 122
Figure 5-26. Associations between number of minutes of flight by month for northern harrier and prairie falcon. For both species, χ2 tests were significant, P < 0.05............................ 123
Figure 5-27. Associations between number of minutes of flight by month for American kestrel and burrowing owl. For both species, χ2 tests were significant, P < 0.05. ........................ 124
Figure 5-28. Associations between number of minutes of flight by month for turkey vulture and common raven. For both species, χ2 tests were significant, P < 0.05. ............................... 125
Figure 5-29. Associations between number of minutes of flight by month for mallard and loggerhead shrike. For both species, χ2 tests were significant, P < 0.05. .......................... 126
Figure 5-30. Associations between number of minutes of flight by month for western meadowlark and California horned lark. For both species, χ2 tests were significant, P < 0.05...................................................................................................................................... 127
Figure 5-31. Associations between number of minutes of perching by month for golden eagle and red-tailed hawk. For both species, χ2 tests were significant, P < 0.05. ....................... 128
7
Figure 5-32. Associations between number of minutes of perching by month for northern harrier and prairie falcon, where lighter bars indicate expected cell values of <5 and are therefore of less reliability. For both species, χ2 tests were significant, P < 0.05.............. 129
Figure 5-33. Associations between number of minutes of perching by month for American kestrel and burrowing owl. For both species, χ2 tests were significant, P < 0.05.............. 130
Figure 5-34. Associations between number of minutes of perching by month for turkey vulture and common raven. For both species, χ2 tests were significant, P < 0.05. ........................ 131
Figure 5-35. Associations between number of minutes of perching by month for loggerhead shrike. For both species, χ2 tests were significant, P < 0.05. ............................................. 132
Figure 5-36. Associations between number of minutes of perching by month for western meadowlark and California horned lark. For both species, χ2 tests were significant, P < 0.05...................................................................................................................................... 133
Figure 5-37. Associations between number of flights through the rotor zone by month for golden eagle and red-tailed hawk, where lighter bars indicate expected cell values of <5 and therefore are therefore of less reliability. For both species, χ2 tests were significant, P < 0.05...................................................................................................................................... 134
Figure 5-38. Associations between number of flights through the rotor zone by month for northern harrier and American kestrel, where lighter bars indicate expected cell values of <5 and are therefore of less reliability. For both species, χ2 tests were significant, P < 0.05. 135
Figure 5-39. Associations between number of flights through the rotor zone by month for turkey vulture and common raven, where lighter bars indicate expected cell values of <5 and are therefore of less reliability. For both species, χ2 tests were significant, P < 0.05.............. 136
Figure 5-40. Associations between number of flights through the rotor zone by month for loggerhead shrike and western meadowlark, where lighter bars indicate expected cell values of <5 and are therefore of less reliability. In the figure, “ns” denotes nonsignificant χ2 test, where P > 0.10. ................................................................................................................... 137
Figure 5-41. Associations between number of flights within 50 m of a wind turbine by month for golden eagle and red-tailed hawk. For both species, χ2 tests were significant, P < 0.05.............................................................................................................................................. 138
Figure 5-42. Associations between number of flights within 50 m of a wind turbine by month for northern harrier and prairie falcon, where lighter bars indicate expected cell values of <5 and are therefore of less reliability. For both species, χ2 tests were significant, P < 0.05. . 139
Figure 5-43. Associations between number of flights within 50 m of a wind turbine by month for American kestrel and burrowing owl, where lighter bars indicate expected cell values of <5 and are therefore of less reliability. For both species, χ2 tests were significant, P < 0.05.............................................................................................................................................. 140
Figure 5-44. Associations between number of flights within 50 m of a wind turbine by month for turkey vulture and common raven. For both species, χ2 tests were significant, P < 0.05.............................................................................................................................................. 141
Figure 5-45. Associations between number of flights within 50 m of a wind turbine by month for mallard and loggerhead shrike, where lighter bars indicate expected cell values of <5 and are therefore of less reliability. For both species, χ2 tests were significant, P < 0.05. . 142
Figure 5-46. Associations between number of flights within 50 m of a wind turbine by month for western meadowlark and California horned lark, where lighter bars indicate expected cell values of <5 and are therefore of less reliability. For both species, χ2 tests were significant, P < 0.05. ........................................................................................................... 143

8
Figure 5-47. The average minutes of flight of all birds (A) and red-tailed hawks (B) at blade height and within 50 m of operating wind turbines during each month. ............................ 144
Figure 5-48. Associations between minutes of flight by Beaufort wind force level for golden eagle, red-tailed hawk, and northern harrier. For each species, χ2 tests were significant, P < 0.05...................................................................................................................................... 145
Figure 5-49. Associations between minutes of flight by Beaufort wind force level for prairie falcon (not significant), American kestrel, and burrowing owl (for the latter two species, χ2 tests were significant, P < 0.05), and where lighter bars indicate expected cell values of <5 and are therefore of less reliability...................................................................................... 146
Figure 5-50. Associations between minutes of flight by Beaufort wind force level for turkey vulture, common raven, and mallard, where lighter bars indicate expected cell values of <5 and are therefore of less reliability. For each species, χ2 tests were significant, P < 0.05.. 147
Figure 5-51. Associations between minutes of flight by Beaufort wind force level for loggerhead shrike, western meadowlark, and California horned lark, where lighter bars indicate expected cell values of <5 and are therefore of less reliability. For each species, χ2 tests were significant, P < 0.05. .......................................................................................... 148
Figure 5-52. Associations between minutes of perching by Beaufort wind force level for golden eagle, red-tailed hawk, and northern harrier. For each species, χ2 tests were significant, P < 0.05...................................................................................................................................... 149
Figure 5-53. Associations between minutes of perching by Beaufort wind force level for prairie falcon, American kestrel, and burrowing owl. For each species, χ2 tests were significant, P < 0.05...................................................................................................................................... 150
Figure 5-54. Associations between minutes of perching by Beaufort wind force level for turkey vulture and common raven. For both species, χ2 tests were significant, P < 0.05. ............. 151
Figure 5-55. Associations between minutes of perching by Beaufort wind force level for loggerhead shrike, western meadowlark, and California horned lark. For each species, χ2 tests were significant, P < 0.05. .......................................................................................... 152
Figure 5-56. Associations between number of flights through the rotor zone by Beaufort wind force level for golden eagle (not significant), red-tailed hawk, and northern harrier (signficant χ2 tests, P < 0.05), and where lighter bars indicate expected cell values of <5 and are therefore of less reliability. ........................................................................................... 153
Figure 5-57. Associations between number of flights through the rotor zone by Beaufort wind force level for American kestrel, turkey vulture, and common raven, where lighter bars indicate expected cell values of <5 and are therefore of less reliability. For each species, χ2 tests were significant, P < 0.05. .......................................................................................... 154
Figure 5-58. Associations between number of flights through the rotor zone by Beaufort wind force level for loggerhead shrike, and western meadowlark (not significant), and where lighter bars indicate expected cell values of <5 and are therefore of less reliability. ......... 155
Figure 5-59. Associations between number of flights within 50 m of a wind turbine by Beaufort wind force level for golden eagle, red-tailed hawk, and northern harrier, where lighter bars indicate expected cell values of <5 and are therefore of less reliability. For each species, χ2 tests were significant, P < 0.05. .......................................................................................... 156
Figure 5-60. Associations between number of flights within 50 m of a wind turbine by Beaufort wind force level for prairie falcon, American kestrel, and burrowing owl (χ2 tests for latter two species were significant, P < 0.05). Lighter bars indicate expected cell values of <5 and are therefore of less reliability. ........................................................................................... 157

9
Figure 5-61. Associations between number of flights within 50 m of a wind turbine by Beaufort wind force level for turkey vulture, common raven (χ2 tests were significant, P < 0.05), and mallard (not significant). Lighter bars indicate expected cell values of <5 and are therefore of less reliability.................................................................................................................. 158
Figure 5-62. Associations between number of flights within 50 m of a wind turbine by Beaufort wind force level for loggerhead shrike, western meadowlark, and California horned lark. For each species, χ2 tests were significant, P < 0.05. Lighter bars indicate expected cell values of <5 and are therefore of less reliability................................................................. 159
Figure 5-63. Associations between minutes of flight by wind direction for golden eagle, red-tailed hawk, and northern harrier. For each species, χ2 tests were significant, P < 0.05. ... 161
Figure 5-64. Associations between minutes of flight by wind direction for prairie falcon, American kestrel, and burrowing owl. For each species, χ2 tests were significant, P < 0.05. Lighter bars indicate expected cell values of <5 and are therefore of less reliability......... 162
Figure 5-65. Associations between minutes of flight by wind direction for turkey vulture, common raven, and mallard. For each species, χ2 tests were significant, P < 0.05. Lighter bars indicate expected cell values of <5 and are therefore of less reliability. .................... 163
Figure 5-66. Associations between minutes of flight by wind direction for loggerhead shrike (not significant), western meadowlark, and California horned lark (χ2 tests were significant, P < 0.05). Lighter bars indicate expected cell values of <5 and are therefore of less reliability. ............................................................................................................................ 164
Figure 5-67. Associations between minutes of perching by wind direction for golden eagle, red-tailed hawk, and northern harrier. For each species, χ2 tests were significant, P < 0.05. Lighter bars indicate expected cell values of <5 and are therefore of less reliability......... 165
Figure 5-68. Associations between minutes of perching by wind direction for prairie falcon, American kestrel, and burrowing owl. For each species, χ2 tests were significant, P < 0.05. Lighter bars indicate expected cell values of <5 and are therefore of less reliability......... 166
Figure 5-69. Associations between minutes of perching by wind direction for turkey vulture, and common raven. For both species, χ2 tests were significant, P < 0.05. Lighter bars indicate expected cell values of <5 and are therefore of less reliability. ............................ 167
Figure 5-70. Associations between minutes of perching by wind direction for loggerhead shrike, western meadowlark, and California horned lark. For each species, χ2 tests were significant, P < 0.05. .............................................................................................................................. 168
Figure 5-71. Associations between number of flights through the rotor zone by wind direction for golden eagle (not significant), red-tailed hawk, and northern harrier (χ2 tests were significant, P < 0.05). Lighter bars indicate expected cell values of <5 and are therefore of less reliability. ..................................................................................................................... 169
Figure 5-72. Associations between number of flights through the rotor zone by Beaufort wind force level for American kestrel (χ2 test was significant, P < 0.05), turkey vulture (not significant), and common raven (χ2 test was significant, P < 0.05). Lighter bars indicate expected cell values of <5 and are therefore of less reliability........................................... 170
Figure 5-73. Associations between number of flights through the rotor zone by wind direction for loggerhead shrike (not significant) and western meadowlark (χ2 tests was significant, P < 0.05). Lighter bars indicate expected cell values of <5 and are therefore of less reliability.............................................................................................................................................. 171
Figure 5-74. Associations between number of flights within 50 m of a wind turbine by wind direction for golden eagle, red-tailed hawk, and northern harrier. For each species, χ2 tests

10
were significant, P < 0.05. Lighter bars indicate expected cell values of <5 and are therefore of less reliability.................................................................................................................. 172
Figure 5-75. Associations between number of flights within 50 m of a wind turbine by wind direction for prairie falcon, American kestrel, and burrowing owl. For each species, χ2 tests were significant, P < 0.05. Lighter bars indicate expected cell values of <5 and are therefore of less reliability.................................................................................................................. 173
Figure 5-76. Associations between number of flights within 50 m of a wind turbine by wind direction for turkey vulture, common raven (χ2 tests were significant, P < 0.05), and mallard (not significant). Lighter bars indicate expected cell values of <5 and are therefore of less reliability. ............................................................................................................................ 174
Figure 5-77. Associations between number of flights within 50 m of a wind turbine by wind direction for loggerhead shrike, western meadowlark, and California horned lark. For each species, χ2 tests were significant, P < 0.05. Lighter bars indicate expected cell values of <5 and are therefore of less reliability...................................................................................... 175
Figure 5-78. Associations between minutes of flight per ground squirrel activity level during behavioral observation sessions. For each species except prairie falcon, χ2 tests were significant, P < 0.05. Lighter bars indicate expected cell values of <5 and are therefore of less reliability. ..................................................................................................................... 176
Figure 5-79. Associations between minutes of perching per ground squirrel activity level during behavioral observation sessions. For each species except western meadowlark, χ2 tests were significant, P < 0.05. ........................................................................................................... 177
Figure 5-80. Associations between number of flights through the rotor zone per ground squirrel activity level during behavioral observation sessions. In the figure, “ns” denotes χ2 tests that were not significant, and no notation represents χ2 tests that were significant, P < 0.05. Lighter bars indicate expected cell values of <5 and are therefore of less reliability......... 178
Figure 5-81. Associations between number of flights within 50 m of a turbine per ground squirrel activity level during behavioral observation sessions. In the figure, “ns” denotes χ2 tests that were not significant, and no notation represents χ2 tests that were significant, P < 0.05...................................................................................................................................... 179
Figure 5-82. Associations between minutes of flight per ground squirrel abundance level during behavioral observation sessions. In the figure, “ns” denotes χ2 tests that were not significant, and no notation represents χ2 tests that were significant, P < 0.05. ................. 180
Figure 5-83. Associations between minutes of perching per ground squirrel abundance level during behavioral observation sessions. In the figure, “ns” denotes χ2 tests that were not significant, and no notation represents χ2 tests that were significant, P < 0.05. ................. 181
Figure 5-84. Associations between number of flights through the rotor zone per ground squirrel abundance level during behavioral observation sessions. In the figure, “ns” denotes χ2 tests that were not significant, and no notation represents χ2 tests that were significant, P < 0.05. Lighter bars indicate expected cell values of <5 and are therefore of less reliability......... 182
Figure 5-85. Associations between number of flights within 50 m of a turbine per ground squirrel abundance level during behavioral observation sessions. In the figure, “ns” denotes χ2 tests that were not significant, and no notation represents χ2 tests that were significant, P < 0.05. Lighter bars indicate expected cell values of <5 and are therefore of less reliability.............................................................................................................................................. 183
Figure 5-86. Associations between minutes of flight per session start time and raptor species. In the figure, “ns” denotes χ2 tests that were not significant, and no notation represents χ2 tests that were significant, P < 0.05. ........................................................................................... 184
11
Figure 5-87. Associations between minutes of flight per session start time and nonraptor species. In the figure, “ns” denotes χ2 tests that were not significant, and no notation represents χ2 tests that were significant, P < 0.05. Lighter bars indicate expected cell values of <5 and are therefore of less reliability. ........................................................................... 185
Figure 5-88. Associations between minutes of perching per session start time and raptor species. In the figure, “ns” denotes χ2 tests that were not significant, and no notation represents χ2 tests that were significant, P < 0.05. ................................................................................... 186
Figure 5-89. Associations between minutes of perching per session start time and nonraptor species. In the figure, “ns” denotes χ2 tests that were not significant, and no notation represents χ2 tests that were significant, P < 0.05. .............................................................. 187
Figure 5-90. Associations between number of flights through the rotor zone per session start time and raptor species. In the figure, “ns” denotes χ2 tests that were not significant, and no notation represents χ2 tests that were significant, P < 0.05. Lighter bars indicate expected cell values of <5 and are therefore of less reliability. ......................................................... 188
Figure 5-91. Associations between number of flights through the rotor zone per session start time and nonraptor species. In the figure, “ns” denotes χ2 tests that were not significant, and no notation represents χ2 tests that were significant, P < 0.05. Lighter bars indicate expected cell values of <5 and are therefore of less reliability. ......................................................... 189
Figure 5-92. Associations between number of flights within 50 m of a wind turbine per session start time and raptor species. In the figure, “ns” denotes χ2 tests that were not significant, and no notation represents χ2 tests that were significant, P < 0.05. .................................... 190
Figure 5-93. Associations between number of flights within 50 m of a wind turbine per session start time and nonraptor species. In the figure, “ns” denotes χ2 tests that were not significant, and no notation represents χ2 tests that were significant, P < 0.05. Lighter bars indicate expected cell values of <5 and are therefore of less reliability. ............................ 191
Figure 5-94. Associations between minutes of flight by temperature at the start of the behavior observation session for golden eagle, red-tailed hawk, northern harrier, and prairie falcon. In the figure, “ns” denotes χ2 tests that were not significant, and no notation represents χ2 tests that were significant, P < 0.05. Lighter bars indicate expected cell values of <5 and are therefore of less reliability. ................................................................................................. 192
Figure 5-95. Associations between minutes of flight by temperature at the start of the behavior observation session for American kestrel, burrowing owl, turkey vulture, and common raven. In the figure, “ns” denotes χ2 tests that were not significant, and no notation represents χ2 tests that were significant, P < 0.05. .............................................................. 193
Figure 5-96. Associations between minutes of flight by temperature at the start of the behavior observation session for mallard, loggerhead shrike, western meadowlark, and horned lark. In the figure, “ns” denotes χ2 tests that were not significant, and no notation represents χ2 tests that were significant, P < 0.05. Lighter bars indicate expected cell values of <5 and are therefore of less reliability. ................................................................................................. 194
Figure 5-97. Associations between minutes of perching by temperature at the start of the behavior observation session for golden eagle, red-tailed hawk, northern harrier, and prairie falcon. In the figure, “ns” denotes χ2 tests that were not significant, and no notation represents χ2 tests that were significant, P < 0.05. .............................................................. 195
Figure 5-98. Associations between minutes of perching by temperature at the start of the behavior observation session for American kestrel, burrowing owl, turkey vulture, and common raven. In the figure, “ns” denotes χ2 tests that were not significant, and no notation represents χ2 tests that were significant, P < 0.05. .............................................................. 196

12
Figure 5-99. Associations between minutes of perching by temperature at the start of the behavior observation session for loggerhead shrike, western meadowlark, and horned lark. In the figure, “ns” denotes χ2 tests that were not significant, and no notation represents χ2 tests that were significant, P < 0.05. ................................................................................... 197
Figure 5-100. Associations between number of flights through the rotor zone by temperature at the start of the behavior observation session for golden eagle, red-tailed hawk, northern harrier, and American kestrel. In the figure, “ns” denotes χ2 tests that were not significant, and no notation represents χ2 tests that were significant, P < 0.05. Lighter bars indicate expected cell values of <5 and are therefore of less reliability........................................... 198
Figure 5-101. Associations between number of flights through the rotor zone by temperature at the start of the behavior observation session for turkey vulture, common raven, loggerhead shrike, and western meadowlark. In the figure, “ns” denotes χ2 tests that were not significant, and no notation represents χ2 tests that were significant, P < 0.05. Lighter bars indicate expected cell values of <5 and are therefore of less reliability. ............................ 199
Figure 5-102. Associations between number of flights within 50 m of a wind turbine by temperature at the start of the behavior observation session for golden eagle, red-tailed hawk, northern harrier, and prairie falcon. In the figure, “ns” denotes χ2 tests that were not significant, and no notation represents χ2 tests that were significant, P < 0.05. Lighter bars indicate expected cell values of <5 and are therefore of less reliability. ............................ 200
Figure 5-103. Associations between number of flights within 50 m of a wind turbine by temperature at the start of the behavior observation session for American kestrel, burrowing owl, turkey vulture, and common raven. In the figure, “ns” denotes χ2 tests that were not significant, and no notation represents χ2 tests that were significant, P < 0.05. ................. 201
Figure 5-104. Associations between number of flights within 50 m of a wind turbine by temperature at the start of the behavior observation session for mallard, loggerhead shrike, western meadowlark, and horned lark. In the figure, “ns” denotes χ2 tests that were not significant, and no notation represents χ2 tests that were significant, P < 0.05. Lighter bars indicate expected cell values of <5 and are therefore of less reliability. ............................ 202
Figure 5-105. Associations between minutes of flight by proximity zone during behavioral observation sessions. In the figure, “ns” denotes χ2 tests that were not significant, and no notation represents χ2 tests that were significant, P < 0.05................................................. 203
Figure 5-106. Associations between minutes of perching by proximity zone during behavioral observation sessions. In the figure, “ns” denotes χ2 tests that were not significant, and no notation represents χ2 tests that were significant, P < 0.05................................................. 204
Figure 5-107. Associations between minutes of flight by intensity level of rodent control. In the figure, “ns” denotes χ2 tests that were not significant, and no notation represents χ2 tests that were significant, P < 0.05. .................................................................................................. 206
Figure 5-108. Associations between minutes of perching by intensity level of rodent control. In the figure, “ns” denotes χ2 tests that were not significant, and no notation represents χ2 tests that were significant, P < 0.05. ........................................................................................... 207
Figure 5-109. Associations between number of flights through the rotor zone and by intensity level of rodent control. In the figure, “ns” denotes χ2 tests that were not significant, and no notation represents χ2 tests that were significant, P < 0.05. Lighter bars indicate expected cell values of <5 and are therefore of less reliability. ......................................................... 208
Figure 5-110. Associations between number of flights within 50 m of a turbine and by intensity level of rodent control. In the figure, “ns” denotes χ2 tests that were not significant, and no

13
notation represents χ2 tests that were significant, P < 0.05. Lighter bars indicate expected cell values of <5 and are therefore of less reliability. ......................................................... 209
Figure 5-111. Associations between behaviors and level of rodent control at the interspecific level of analysis. In the figure, “ns” denotes χ2 tests that were not significant, and no notation represents χ2 tests that were significant, P < 0.05................................................. 210
Figure 5-112. Associations between minutes of flight and topography among raptor species. In the figure, “ns” denotes χ2 tests that were not significant, and no notation represents χ2 tests that were significant, P < 0.05. Lighter bars indicate expected cell values of <5 and are therefore of less reliability. ................................................................................................. 211
Figure 5-113. Associations between minutes of flight and topography among nonraptor species. In the figure, “ns” denotes χ2 tests that were not significant, and no notation represents χ2 tests that were significant, P < 0.05. Lighter bars indicate expected cell values of <5 and are therefore of less reliability. ................................................................................................. 212
Figure 5-114. Associations between minutes of perching and topography among raptor species. In the figure, “ns” denotes χ2 tests that were not significant, and no notation represents χ2 tests that were significant, P < 0.05. Lighter bars indicate expected cell values of <5 and are therefore of less reliability. ................................................................................................. 213
Figure 5-115. Associations between minutes of perching and topography among nonraptor species. In the figure, “ns” denotes χ2 tests that were not significant, and no notation represents χ2 tests that were significant, P < 0.05. .............................................................. 214
Figure 5-116. Associations between number of flights within 50 m of a wind turbine and topography among raptor species. In the figure, “ns” denotes χ2 tests that were not significant, and no notation represents χ2 tests that were significant, P < 0.05. Lighter bars indicate expected cell values of <5 and are therefore of less reliability. ............................ 215
Figure 5-117. Associations between number of flights within 50 m of a wind turbine and topography among nonraptor species. In the figure, “ns” denotes χ2 tests that were not significant, and no notation represents χ2 tests that were significant, P < 0.05. Lighter bars indicate expected cell values of <5 and are therefore of less reliability. ............................ 216
Figure 5-118. Associations between behaviors and level of topography at the interspecific level of analysis. In the figure, “ns” denotes χ2 tests that were not significant, and no notation represents χ2 tests that were significant, P < 0.05. .............................................................. 217
Figure 5-119. Associations between minutes of flight and whether the wind turbine was in a canyon. In the figure, “ns” denotes χ2 tests that were not significant, and no notation represents χ2 tests that were significant, P < 0.05. .............................................................. 218
Figure 5-120. Associations between minutes of perching and whether the wind turbine was in a canyon. In the figure, “ns” denotes χ2 tests that were not significant, and no notation represents χ2 tests that were significant, P < 0.05. .............................................................. 219
Figure 5-121. Associations between number of flights through the rotor zone and whether the wind turbine was in a canyon. In the figure, “ns” denotes χ2 tests that were not significant, and no notation represents χ2 tests that were significant, P < 0.05. Lighter bars indicate expected cell values of <5 and are therefore of less reliability........................................... 220
Figure 5-122. Associations between number of flights within 50 m of a wind turbine and whether the wind turbine was in a canyon. In the figure, “ns” denotes χ2 tests that were not significant, and no notation represents χ2 tests that were significant, P < 0.05. Lighter bars indicate expected cell values of <5 and are therefore of less reliability. ............................ 221

14
Figure 5-123. Associations between behaviors and level of whether the wind turbine was in a canyon at the interspecific level of analysis. In the figure, “ns” denotes χ2 tests that were not significant, and no notation represents χ2 tests that were significant, P < 0.05. ........... 222
Figure 5-124. Associations between minutes of close-by flights to wind turbines and type of wind turbine among raptor species. In the figure, “ns” denotes χ2 tests that were not significant, and no notation represents χ2 tests that were significant, P < 0.05. Lighter bars indicate expected cell values of <5 and are therefore of less reliability. ............................ 223
Figure 5-125. Associations between minutes of close-by flights to wind turbines and type of wind turbine among nonraptor species. In the figure, “ns” denotes χ2 tests that were not significant, and no notation represents χ2 tests that were significant, P < 0.05. Lighter bars indicate expected cell values of <5 and are therefore of less reliability. ............................ 224
Figure 5-126. Associations between minutes perching on wind turbines and type of wind turbine among raptor species. In the figure, “ns” denotes χ2 tests that were not significant, and no notation represents χ2 tests that were significant, P < 0.05. Lighter bars indicate expected cell values of <5 and are therefore of less reliability........................................... 225
Figure 5-127. Associations between minutes perching on wind turbines and type of wind turbine among nonraptor species. In the figure, “ns” denotes χ2 tests that were not significant, and no notation represents χ2 tests that were significant, P < 0.05. ................. 226
Figure 5-128. Associations between minutes of close-by flights to wind turbines and wind turbine’s rotor orientation to wind. In the figure, “ns” denotes χ2 tests that were not significant, and no notation represents χ2 tests that were significant, P < 0.05. ................. 227
Figure 5-129. Associations between minutes perching on wind turbines and wind turbine’s rotor orientation to wind. In the figure, “ns” denotes χ2 tests that were not significant, and no notation represents χ2 tests that were significant, P < 0.05. Lighter bars indicate expected cell values of <5 and are therefore of less reliability. ......................................................... 228
Figure 5-130. Associations between minutes of flight at blade height and the operational status of the nearest wind turbine. In the figure, “ns” denotes χ2 tests that were not significant, and no notation represents χ2 tests that were significant, P < 0.05............................................ 230
Figure 5-131. Associations between minutes of perching on a wind turbine and the operational status of that wind turbine. In the figure, “ns” denotes χ2 tests that were not significant, and no notation represents χ2 tests that were significant, P < 0.05............................................ 231
Figure 5-132. Associations between the number of flights through the rotor zone at blade height and the operational status of the nearest wind turbine. In the figure, “ns” denotes χ2 tests that were not significant, and no notation represents χ2 tests that were significant, P < 0.05.............................................................................................................................................. 232
Figure 5-133. Associations between the number of flights within 50 m of a turbine at blade height and the operational status of that wind turbine. In the figure, “ns” denotes χ2 tests that were not significant, and no notation represents χ2 tests that were significant, P < 0.05.............................................................................................................................................. 233
Figure 5-134. Associations between flights at blade height or perching on turbines and the operational status of the nearest wind turbine for house finch, European starling, and rock dove. In the figure, “ns” denotes χ2 tests that were not significant, and no notation represents χ2 tests that were significant, P < 0.05. .............................................................. 234
Figure 5-135. Associations between flights at blade height or perching on turbines and the operational status of the nearest wind turbine for interspecific groups. In the figure, “ns” denotes χ2 tests that were not significant, and no notation represents χ2 tests that were significant, P < 0.05. ........................................................................................................... 235

15
Figure 5-136. Associations between minutes of flight and tower type. In the figure, “ns” denotes χ2 tests that were not significant, and no notation represents χ2 tests that were significant, P < 0.05. ........................................................................................................... 236
Figure 5-137. Associations between minutes of perching and tower type. In the figure, “ns” denotes χ2 tests that were not significant, and no notation represents χ2 tests that were significant, P < 0.05. ........................................................................................................... 237
Figure 5-138. Associations between number of flights through the rotor zone and tower type. In the figure, “ns” denotes χ2 tests that were not significant, and no notation represents χ2 tests that were significant, P < 0.05. Lighter bars indicate expected cell values of <5 and are therefore of less reliability. ................................................................................................. 238
Figure 5-139. Associations between number of flights within 50 m of a wind turbine and tower type. In the figure, “ns” denotes χ2 tests that were not significant, and no notation represents χ2 tests that were significant, P < 0.05. Lighter bars indicate expected cell values of <5 and are therefore of less reliability. ........................................................................... 239
Figure 5-140. Associations between behaviors and tower type for interspecific groups. In the figure, “ns” denotes χ2 tests that were not significant, and no notation represents χ2 tests that were significant, P < 0.05. .................................................................................................. 240
Figure 5-141. Associations between minutes of close-by flights to wind turbines and tower height for golden eagle, red-tailed hawk, northern harrier, and prairie falcon. In the figure, “ns” denotes χ2 tests that were not significant, and no notation represents χ2 tests that were significant, P < 0.05. ........................................................................................................... 241
Figure 5-142. Associations between minutes of close-by flights to wind turbines and tower height for American kestrel, burrowing owl, turkey vulture, and common raven. In the figure, “ns” denotes χ2 tests that were not significant, and no notation represents χ2 tests that were significant, P < 0.05. .................................................................................................. 242
Figure 5-143. Associations between minutes of close-by flights to wind turbines and tower height for mallard, loggerhead shrike, western meadowlark, and horned lark. In the figure, “ns” denotes χ2 tests that were not significant, and no notation represents χ2 tests that were significant, P < 0.05. Lighter bars indicate expected cell values of <5 and are therefore of less reliability. ..................................................................................................................... 243
Figure 5-144. Associations between minutes of perching on a wind turbine and tower’s height for golden eagle, red-tailed hawk, prairie falcon, American kestrel, and burrowing owl. In the figure, “ns” denotes χ2 tests that were not significant, and no notation represents χ2 tests that were significant, P < 0.05. Lighter bars indicate expected cell values of <5 and are therefore of less reliability. ................................................................................................. 244
Figure 5-145. Associations between minutes of perching on a wind turbine and tower’s height for common raven, loggerhead shrike, and western meadowlark. In the figure, “ns” denotes χ2 tests that were not significant, and no notation represents χ2 tests that were significant, P < 0.05. Lighter bars indicate expected cell values of <5 and are therefore of less reliability.............................................................................................................................................. 245
Figure 5-146. Associations between minutes of close-by flights to wind turbines and the wind turbine’s position in the string for raptor species. In the figure, “ns” denotes χ2 tests that were not significant, and no notation represents χ2 tests that were significant, P < 0.05. Lighter bars indicate expected cell values of <5 and are therefore of less reliability......... 246
Figure 5-147. Associations between minutes of close-by flights to wind turbines and the wind turbine’s position in the string for nonraptor species. In the figure, “ns” denotes χ2 tests that

16
were not significant, and no notation represents χ2 tests that were significant, P < 0.05. Lighter bars indicate expected cell values of <5 and are therefore of less reliability......... 247
Figure 5-148. Associations between minutes of perching on wind turbines and the wind turbine’s position in the string. In the figure, “ns” denotes χ2 tests that were not significant, and no notation represents χ2 tests that were significant, P < 0.05. Lighter bars indicate expected cell values of <5 and are therefore of less reliability........................................... 248
Figure 5-149. Associations between minutes of close-by flights to wind turbines and whether the wind turbine was part of a wind wall. In the figure, “ns” denotes χ2 tests that were not significant, and no notation represents χ2 tests that were significant, P < 0.05. ................. 249
Figure 5-150. Associations between minutes of perching on wind turbines and whether the wind turbine was part of a wind wall. In the figure, “ns” denotes χ2 tests that were not significant, and no notation represents χ2 tests that were significant, P < 0.05. .................................... 250
Figure 5-151. Associations between minutes of close-by flights to wind turbines and the number of other wind turbines within 300 m for raptor species. In the figure, “ns” denotes χ2 tests that were not significant, and no notation represents χ2 tests that were significant, P < 0.05. ................................................................................................................................. 251
Figure 5-152. Associations between minutes of close-by flights to wind turbines and the number of other wind turbines within 300 m for nonraptor species. In the figure, “ns” denotes χ2 tests that were not significant, and no notation represents χ2 tests that were significant, P < 0.05. Lighter bars indicate expected cell values of <5 and are therefore of less reliability. ..................................................................................................................... 252
Figure 5-153. Associations between minutes of perching on wind turbines and the number of other wind turbines within 300 m. In the figure, “ns” denotes χ2 tests that were not significant, and no notation represents χ2 tests that were significant, P < 0.05. Lighter bars indicate expected cell values of <5 and are therefore of less reliability. ............................ 253
Figure 5-154. Associations between minutes of close-by flights to wind turbines and the wind turbine’s location in the wind farm. In the figure, “ns” denotes χ2 tests that were not significant, and no notation represents χ2 tests that were significant, P < 0.05. Lighter bars indicate expected cell values of <5 and are therefore of less reliability. ............................ 254
Figure 5-155. Associations between minutes of perching on wind turbines and the wind turbine’s location in the wind farm. In the figure, “ns” denotes χ2 tests that were not significant, and no notation represents χ2 tests that were significant, P < 0.05. Lighter bars indicate expected cell values of <5 and are therefore of less reliability. ............................ 255
Figure 5-156. Associations between minutes of close-by flights to wind turbines and elevation for golden eagle, red-tailed hawk, northern harrier, and prairie falcon. In the figure, “ns” denotes χ2 tests that were not significant, and no notation represents χ2 tests that were significant, P < 0.05. Lighter bars indicate expected cell values of <5 and are therefore of less reliability. ..................................................................................................................... 256
Figure 5-157. Associations between minutes of close-by flights to wind turbines and elevation for American kestrel, burrowing owl, turkey vulture, and common raven. In the figure, “ns” denotes χ2 tests that were not significant, and no notation represents χ2 tests that were significant, P < 0.05. ........................................................................................................... 257
Figure 5-158. Associations between minutes of close-by flights to wind turbines and elevation for mallard, loggerhead shrike, western meadowlark, and horned lark. In the figure, “ns” denotes χ2 tests that were not significant, and no notation represents χ2 tests that were significant, P < 0.05. Lighter bars indicate expected cell values of <5 and are therefore of less reliability. ..................................................................................................................... 258

17
Figure 5-159. Associations between minutes of perching on a wind turbine and its elevation for golden eagle, red-tailed hawk, prairie falcon, American kestrel, and burrowing owl. In the figure, “ns” denotes χ2 tests that were not significant, and no notation represents χ2 tests that were significant, P < 0.05. Lighter bars indicate expected cell values of <5 and are therefore of less reliability.................................................................................................................. 259
Figure 5-160. Associations between minutes of perching on a wind turbine and its elevation for common raven, loggerhead shrike, and western meadowlark. In the figure, “ns” denotes χ2 tests that were not significant, and no notation represents χ2 tests that were significant, P < 0.05...................................................................................................................................... 260
Figure 5-161. Associations between minutes of close-by flights to wind turbines and slope grade for raptor species. In the figure, “ns” denotes χ2 tests that were not significant, and no notation represents χ2 tests that were significant, P < 0.05................................................. 261
Figure 5-162. Associations between minutes of close-by flights to wind turbines and slope grade for nonraptor species. In the figure, “ns” denotes χ2 tests that were not significant, and no notation represents χ2 tests that were significant, P < 0.05. Lighter bars indicate expected cell values of <5 and are therefore of less reliability........................................... 262
Figure 5-163. Associations between minutes of perching on wind turbines and slope grade. In the figure, “ns” denotes χ2 tests that were not significant, and no notation represents χ2 tests that were significant, P < 0.05. Lighter bars indicate expected cell values of <5 and are therefore of less reliability. ................................................................................................. 263
Figure 5-164. Associations between minutes of close-by flights to wind turbines and slope aspect for raptor species. In the figure, “ns” denotes χ2 tests that were not significant, and no notation represents χ2 tests that were significant, P < 0.05. Lighter bars indicate expected cell values of <5 and are therefore of less reliability. ......................................................... 264
Figure 5-165. Associations between minutes of close-by flights to wind turbines and slope aspect for nonraptor species. In the figure, “ns” denotes χ2 tests that were not significant, and no notation represents χ2 tests that were significant, P < 0.05. .................................... 265
Figure 5-166. Associations between minutes of perching on wind turbines and slope aspect. In the figure, “ns” denotes χ2 tests that were not significant, and no notation represents χ2 tests that were significant, P < 0.05. Lighter bars indicate expected cell values of <5 and are therefore of less reliability. ................................................................................................. 266
Figure 5-167. Associations between minutes of close-by flights to wind turbines and topography for golden eagle, red-tailed hawk, northern harrier, and prairie falcon. In the figure, “ns” denotes χ2 tests that were not significant, and no notation represents χ2 tests that were significant, P < 0.05. Lighter bars indicate expected cell values of <5 and are therefore of less reliability.................................................................................................................. 267
Figure 5-168. Associations between minutes of close-by flights to wind turbines and topography for American kestrel, burrowing owl, turkey vulture, and common raven. In the figure, “ns” denotes χ2 tests that were not significant, and no notation represents χ2 tests that were significant, P < 0.05. .................................................................................................. 268
Figure 5-169. Associations between minutes of close-by flights to wind turbines and topography for mallard, loggerhead shrike, western meadowlark, and horned lark. In the figure, “ns” denotes χ2 tests that were not significant, and no notation represents χ2 tests that were significant, P < 0.05. Lighter bars indicate expected cell values of <5 and are therefore of less reliability.................................................................................................................. 269
Figure 5-170. Associations between minutes of perching on a wind turbine and its topography for golden eagle, red-tailed hawk, prairie falcon, American kestrel, and burrowing owl. In

18
the figure, “ns” denotes χ2 tests that were not significant, and no notation represents χ2 tests that were significant, P < 0.05. Lighter bars indicate expected cell values of <5 and are therefore of less reliability. ................................................................................................. 270
Figure 5-171. Associations between minutes of perching on a wind turbine and its topography for common raven, loggerhead shrike, and western meadowlark. In the figure, “ns” denotes χ2 tests that were not significant, and no notation represents χ2 tests that were significant, P < 0.05. Lighter bars indicate expected cell values of <5 and are therefore of less reliability.............................................................................................................................................. 271
Figure 5-172. Associations between minutes of close-by flights to wind turbines and whether the wind turbine is located in a canyon. In the figure, “ns” denotes χ2 tests that were not significant, and no notation represents χ2 tests that were significant, P < 0.05. ................. 272
Figure 5-173. Associations between minutes of perching on wind turbines and whether the wind turbine is located in a canyon. In the figure, “ns” denotes χ2 tests that were not significant, and no notation represents χ2 tests that were significant, P < 0.05. .................................... 273
Figure 5-174. Associations between minutes of close-by flights to wind turbines and the edge index of the tower laydown area, for raptor species. In the figure, “ns” denotes χ2 tests that were not significant, and no notation represents χ2 tests that were significant, P < 0.05. Lighter bars indicate expected cell values of <5 and are therefore of less reliability......... 274
Figure 5-175. Associations between minutes of close-by flights to wind turbines and the edge index of the tower laydown area, for nonraptor species. In the figure, “ns” denotes χ2 tests that were not significant, and no notation represents χ2 tests that were significant, P < 0.05. Lighter bars indicate expected cell values of <5 and are therefore of less reliability......... 275
Figure 5-176. Associations between minutes of perching on wind turbines and the edge index of the tower laydown area. In the figure, “ns” denotes χ2 tests that were not significant, and no notation represents χ2 tests that were significant, P < 0.05. Lighter bars indicate expected cell values of <5 and are therefore of less reliability. ......................................................... 276
Figure 5-177. Associations between minutes of close-by flights to wind turbines and the abundance of rock piles nearby. In the figure, “ns” denotes χ2 tests that were not significant, and no notation represents χ2 tests that were significant, P < 0.05. Lighter bars indicate expected cell values of <5 and are therefore of less reliability. ............................ 277
Figure 5-178. Associations between minutes of perching on wind turbines and the abundance of rock piles nearby. In the figure, “ns” denotes χ2 tests that were not significant, and no notation represents χ2 tests that were significant, P < 0.05. Lighter bars indicate expected cell values of <5 and are therefore of less reliability. ......................................................... 278
Figure 5-179. Number of fatalities per species regressed on number of flights at blade height by broken wind turbines........................................................................................................... 280
Figure 5-180. Interspecific relationships between the number of fatalities found at a wind turbine and the percentage of minutes in flight at the height domain of the blades of the nearest wind turbines (A), as well as with the percentage of flights within 50 m of wind turbines and within the height domain of the turbine blades (B)........................................ 281
Figure 5-181. Difference in American kestrel mortality regressed on rate of flight observed near all turbine strings (dotted line) and only those where fatalities were recorded (solid line).284
Figure 5-182. Mortality of red-tailed hawk regressed on search effort among wind turbine strings (A) and the minutes of flight per behavior session regressed on observation effort among turbine strings (B). .................................................................................................. 285
Figure 5-183. The rate of red-tailed hawk perching (A) and the rate of flights through the rotor zone (B) regressed on observation effort. ........................................................................... 286

19
Figure 5-184. Observed – expected number of red-tailed hawk fatalities regressed on observed – expected index value of nearness to wind turbines.......................................................... 287
Figure 6-1. The number of red-tailed hawk (A) and all bird (B) carcasses as positive linear functions of search effort per turbine string........................................................................ 304
Figure 6-2. Red-tailed hawk mortality is an inverse power function of search effort per turbine string. .................................................................................................................................. 305
Figure 6-3. Wind turbine models represented in the fatality searches by frequency of occurrence in the sampling area and by search effort. .......................................................................... 306
Figure 6-4. Wind tower designs represented in the fatality searches by frequency of occurrence in the sampling area and by search effort. .......................................................................... 307
Figure 6-5. Spatial areas in the rotor plane of wind turbines represented in the fatality searches by frequency of occurrence in the sampling area and by search effort. ............................. 307
Figure 6-6. Spatial areas in the rotor plane of wind turbines as functions of tip speed of the blades (A) and rotor diameter (B). ...................................................................................... 308
Figure 6-7. The time interval in seconds between sweeps of the blade at the edge of the rotor plane as functions of tip speed of the blades (A) and rotor diameter (B). .......................... 309
Figure 6-8. Tower heights of wind turbines represented in the fatality searches by frequency of occurrence in the sampling area and by search effort......................................................... 310
Figure 6-9. The wind turbine’s rotor orientation represented in the fatality searches by frequency of occurrence in the sampling area and by search effort. .................................. 310
Figure 6-10. The wind turbine’s position in the string as represented in the fatality searches by frequency of occurrence in the sampling area. ................................................................... 311
Figure 6-11. The wind turbine’s location in the wind farm as represented in the fatality searches by frequency of occurrence in the sampling area and by search effort. ............................. 311
Figure 6-12. The wind turbine’s underlying topography as represented in the fatality searches by frequency of occurrence in the sampling area and by search effort. ............................. 312
Figure 6-13. Wind turbines located in or out of canyons as represented in the fatality searches by frequency of occurrence in the sampling area and by search effort. ............................. 312
Figure 6-14. The frequency distribution of the aspect of the slopes upon which wind turbines were situated. ...................................................................................................................... 313
Figure 6-15. The frequency distributions of the elevation (A) and slope grade (B) at the bases of the wind turbines included in our fatality searches............................................................. 314
Figure 6-16. The frequency distributions of the numbers of wind turbines within 300 m (A) and 800 m (B) of each wind turbine included in our fatality searches. ..................................... 315
Figure 6-17. Wind turbine ownership by frequency of occurrence in the sampling area and by search effort. ....................................................................................................................... 316
Figure 6-18. The wind turbines in areas of three levels of rodent control as represented in the fatality searches by frequency of occurrence in the sampling area and by search effort.... 316
Figure 6-19. Species-specific associations between fatalities and wind turbine model, where n represents the number of fatalities observed and P is the probability of committing a Type I error in a χ2 test. “ns” represents not significant. ............................................................... 327
Figure 6-20. Multispecies associations between fatalities and wind turbine model, where n represents the number of fatalities observed and P is the probability of committing a Type I error in a χ2 test. .................................................................................................................. 328
Figure 6-21. Species-specific associations between fatalities and rotor diameter, where n represents the number of fatalities observed and P is the probability of committing a Type I error in a χ2 test. “ns” represents not significant. ................................................................ 329

20
Figure 6-22. Multispecies associations between fatalities and rotor diameter, where n represents the number of fatalities observed and P is the probability of committing a Type I error in a χ2 test................................................................................................................................... 330
Figure 6-23. Species-specific associations between fatalities and blade tip speed, where n represents the number of fatalities observed and P is the probability of committing a Type I error in a χ2 test. “ns” represents not significant. ................................................................ 331
Figure 6-24. Multispecies associations between fatalities and blade tip speed, where n represents the number of fatalities observed and P is the probability of committing a Type I error in a χ2 test. .................................................................................................................. 332
Figure 6-25. Species-specific associations between fatalities and number of seconds between rotor sweeps at the edge of the rotor plane, where n represents the number of fatalities observed and P is the probability of committing a Type I error in a χ2 test. “ns” represents not significant...................................................................................................................... 333
Figure 6-26. Multispecies associations between fatalities and number of seconds between rotor sweeps at the edge of the rotor plane, where n represents the number of fatalities observed and P is the probability of committing a Type I error in a χ2 test....................................... 334
Figure 6-27. Species-specific associations between fatalities and the area in the rotor plane that is swept per second, where n represents the number of fatalities observed and P is the probability of committing a Type I error in a χ2 test. “ns” represents not significant. ....... 335
Figure 6-28. Multispecies associations between fatalities and the area in the rotor plane that is swept per second, where n represents the number of fatalities observed and P is the probability of committing a Type I error in a χ2 test........................................................... 336
Figure 6-29. Species-specific associations between fatalities and orientation of rotor blades, where n represents the number of fatalities observed and P is the probability of committing a Type I error in a χ2 test. “ns” represents not significant................................................... 337
Figure 6-30. Multispecies associations between fatalities and orientation of rotor blades, where n represents the number of fatalities observed and P is the probability of committing a Type I error in a χ2 test. ................................................................................................................ 338
Figure 6-31. Species-specific associations between fatalities and tower type, where n represents the number of fatalities observed and P is the probability of committing a Type I error in a χ2 test. “ns” represents not significant................................................................................. 339
Figure 6-32. Multispecies associations between fatalities and tower type, where n represents the number of fatalities observed and P is the probability of committing a Type I error in a χ2 test. ...................................................................................................................................... 340
Figure 6-33. Species-specific associations between fatalities and tower height, where n represents the number of fatalities observed and P is the probability of committing a Type I error in a χ2 test. “ns” represents not significant. ................................................................ 341
Figure 6-34. Multispecies associations between fatalities and tower height, where n represents the number of fatalities observed and P is the probability of committing a Type I error in a χ2 test................................................................................................................................... 342
Figure 6-35. Species-specific associations between fatalities and physical relief at the wind turbine, where n represents the number of fatalities observed and P is the probability of committing a Type I error in a χ2 test. “ns” represents not significant. .............................. 343
Figure 6-36. Multispecies associations between fatalities and physical relief at the wind turbine, where n represents the number of fatalities observed and P is the probability of committing a Type I error in a χ2 test. “ns” represents not significant................................................... 344

21
Figure 6-37. Species-specific associations between fatalities and whether the wind turbine was in a canyon, where n represents the number of fatalities observed and P is the probability of committing a Type I error in a χ2 test. “ns” represents not significant. .............................. 345
Figure 6-38. Multispecies associations between fatalities and whether the wind turbine was in a canyon, where n represents the number of fatalities observed and P is the probability of committing a Type I error in a χ2 test. ................................................................................ 346
Figure 6-39. Associations between golden eagle, red-tailed hawk, American kestrel, and burrowing owl fatalities and elevation, where lighter bars indicate expected cell values of <5 and are therefore of less reliability. “ns” denotes χ2 tests that were not significant, and no notation represents χ2 tests that were significant, P < 0.05................................................. 347
Figure 6-40. Associations between barn owl, great horned owl, mallard, and California horned lark fatalities and elevation, where lighter bars indicate expected cell values of <5 and are therefore of less reliability. “ns” denotes χ2 tests that were not significant, and no notation represents χ2 tests that were significant, P < 0.05. .............................................................. 348
Figure 6-41. Associations between western meadowlark, house finch, European starling, and rock dove fatalities and elevation, where lighter bars indicate expected cell values of <5 and are therefore of less reliability. “ns” denotes χ2 tests that were not significant, and no notation represents χ2 tests that were significant, P < 0.05................................................. 349
Figure 6-42. Associations between all hawks, all raptors, and all bird fatalities and elevation, where lighter bars indicate expected cell values of <5 and are therefore of less reliability. “ns” denotes χ2 tests that were not significant, and no notation represents χ2 tests that were significant, P < 0.05. ........................................................................................................... 350
Figure 6-43. Associations between raptor fatalities and slope grade, where lighter bars indicate expected cell values of <5 and are therefore of less reliability. “ns” denotes χ2 tests that were not significant, and no notation represents χ2 tests that were significant, P < 0.05. .. 351
Figure 6-44. Associations between nonraptor fatalities and slope grade, where lighter bars indicate expected cell values of <5 and are therefore of less reliability. “ns” denotes χ2 tests that were not significant, and no notation represents χ2 tests that were significant, P < 0.05.............................................................................................................................................. 352
Figure 6-45. Associations between all hawks, all raptors, and all bird fatalities and slope grade, where lighter bars indicate expected cell values of <5 and are therefore of less reliability. “ns” denotes χ2 tests that were not significant, and no notation represents χ2 tests that were significant, P < 0.05. ........................................................................................................... 353
Figure 6-46. Species-specific associations between fatalities and number of rock piles nearby, where n represents the number of fatalities observed and P is the probability of committing a Type I error in a χ2 test. “ns” represents not significant................................................... 354
Figure 6-47. Multispecies associations between fatalities and number of rock piles nearby, where n represents the number of fatalities observed and P is the probability of committing a Type I error in a χ2 test. .................................................................................................... 355
Figure 6-48. Species-specific associations between fatalities and the wind turbine’s position in the string, where n represents the number of fatalities observed and P is the probability of committing a Type I error in a χ2 test. “ns” represents not significant. .............................. 356
Figure 6-49. Multispecies associations between fatalities and the wind turbine’s position in the string, where n represents the number of fatalities observed and P is the probability of committing a Type I error in a χ2 test. ................................................................................ 357

22
Figure 6-50. Species-specific associations between fatalities and the wind turbine’s position in the wind farm, where n represents the number of fatalities observed and P is the probability of committing a Type I error in a χ2 test. “ns” represents not significant........................... 358
Figure 6-51. Multispecies associations between fatalities and the wind turbine’s position in the wind farm, where n represents the number of fatalities observed and P is the probability of committing a Type I error in a χ2 test. ................................................................................ 359
Figure 6-52. Associations between raptor fatalities and the number of wind turbines within 300 m of another wind turbine, where lighter bars indicate expected cell values of <5 and are therefore of less reliability. In the figure, “ns” denotes χ2 tests that were not significant, and no notation represents χ2 tests that were significant, P < 0.05............................................ 360
Figure 6-53. Associations between nonraptor fatalities and the number of wind turbines within 300 m of another wind turbine, where lighter bars indicate expected cell values of <5 and are therefore of less reliability. In the figure, “ns” denotes χ2 tests that were not significant, and no notation represents χ2 tests that were significant, P < 0.05. .................................... 361
Figure 6-54. Multispecies associations between fatalities and the number of wind turbines within 300 m of another wind turbine. “ns” denotes χ2 tests that were not significant, and no notation represents χ2 tests that were significant, P < 0.05............................................ 362
Figure 6-55. Species-specific associations between fatalities and owners of the wind turbines, where n represents the number of fatalities observed and P is the probability of committing a Type I error in a χ2 test. “ns” represents not significant................................................... 363
Figure 6-56. Multispecies associations between fatalities and owners of the wind turbines, where n represents the number of fatalities observed and P is the probability of committing a Type I error in a χ2 test. .................................................................................................... 364
Figure 6-57. Species-specific associations between fatalities and level of rodent control in the area of the wind turbine, where n represents the number of fatalities observed and P is the probability of committing a Type I error in a χ2 test. “ns” represents not significant. ....... 365
Figure 6-58. Multispecies associations between fatalities and level of rodent control in the area of the wind turbine, where n represents the number of fatalities observed and P is the probability of committing a Type I error in a χ2 test........................................................... 366
Figure 6-59. Species-specific associations between fatalities and number of California ground squirrel burrow systems per ha within 90 m of the wind turbine, where n represents the number of fatalities observed and P is the probability of committing a Type I error in a χ2 test. “ns” represents not significant..................................................................................... 367
Figure 6-60. Multispecies associations between fatalities and number of California ground squirrel burrow systems per ha within 90 m of the wind turbine, where n represents the number of fatalities observed and P is the probability of committing a Type I error in a χ2 test. ...................................................................................................................................... 368
Figure 6-61. Species-specific associations between fatalities and number of pocket gopher burrow systems per ha within 90 m of the wind turbine, where n represents the number of fatalities observed and P is the probability of committing a Type I error in a χ2 test. “ns” represents not significant. ................................................................................................... 369
Figure 6-62. Multispecies associations between fatalities and number of pocket gopher burrow systems per ha within 90 m of the wind turbine, where n represents the number of fatalities observed and P is the probability of committing a Type I error in a χ2 test. ...................... 370
Figure 6-63. Species-specific associations between fatalities and number of all mammal burrow systems per ha within 90 m of the wind turbine, where n represents the number of fatalities

23
observed and P is the probability of committing a Type I error in a χ2 test. “ns” represents not significant...................................................................................................................... 371
Figure 6-64. Multispecies associations between fatalities and number of all mammal burrow systems per ha within 90 m of the wind turbine, where n represents the number of fatalities observed and P is the probability of committing a Type I error in a χ2 test. ...................... 372
Figure 6-65. Species-specific associations between fatalities and degree of clustering of California ground squirrel burrow systems around the wind turbine, where n represents the number of fatalities observed and P is the probability of committing a Type I error in a χ2 test. “ns” represents not significant..................................................................................... 373
Figure 6-66. Multispecies associations between fatalities and degree of clustering of California ground squirrel burrow systems around the wind turbine, where n represents the number of fatalities observed and P is the probability of committing a Type I error in a χ2 test. “ns” represents not significant. ................................................................................................... 374
Figure 6-67. Species-specific associations between fatalities and degree of clustering of pocket gopher burrow systems around the wind turbine, where n represents the number of fatalities observed and P is the probability of committing a Type I error in a χ2 test. “ns” represents not significant...................................................................................................................... 375
Figure 6-68. Multispecies associations between fatalities and degree of clustering of pocket gopher burrow systems around the wind turbine, where n represents the number of fatalities observed and P is the probability of committing a Type I error in a χ2 test. ...................... 376
Figure 6-69. Species-specific associations between fatalities and the interaction between whether the wind turbine was within a canyon and the degree of clustering of California ground squirrel burrow systems around it, where n represents the number of fatalities observed and P is the probability of committing a Type I error in a χ2 test. “ns” represents not significant...................................................................................................................... 377
Figure 6-70. Multispecies associations between fatalities and the interaction between whether the wind turbine was within a canyon and the degree of clustering of California ground squirrel burrow systems around it, where n represents the number of fatalities observed and P is the probability of committing a Type I error in a χ2 test.............................................. 378
Figure 6-71. Species-specific associations between fatalities and the interaction between whether the wind turbine was within a canyon and the degree of clustering of pocket gopher burrow systems around it, where n represents the number of fatalities observed and P is the probability of committing a Type I error in a χ2 test. “ns” represents not significant. ....... 379
Figure 6-72. Multispecies associations between fatalities and the interaction between whether the wind turbine was within a canyon and the degree of clustering of pocket gopher burrow systems around it, where n represents the number of fatalities observed and P is the probability of committing a Type I error in a χ2 test........................................................... 380
Figure 6-73. Species-specific associations between fatalities and the interaction between whether the wind turbine was within a canyon and the degree of clustering of all mammal burrow systems around it, where n represents the number of fatalities observed and P is the probability of committing a Type I error in a χ2 test. “ns” represents not significant. ....... 381
Figure 6-74. Multispecies associations between fatalities and the interaction between whether the wind turbine was within a canyon and the degree of clustering of all mammal burrow systems around it, where n represents the number of fatalities observed and P is the probability of committing a Type I error in a χ2 test........................................................... 382
Figure 6-75. Examples of pocket gopher and ground squirrel distributions around wind turbines where rodent control was and was not applied. .................................................................. 387

24
LIST OF TABLES
Table 2-1. Status of species found killed by 1,526 wind turbines in the APWRA from May 1998 to September 2001. ............................................................................................................... 44
Table 2-2. Summary of mortality estimates and projected mortality across the APWRA based on data collected by BioResource Consultants from May 1998 to September 2001............ 45
Table 2-3. Bird mortality estimates for the 1,536 wind turbines searched, and mortality extrapolated across the APWRA. We regard the mortality estimates in the left and right columns of each pair as the low and high values of the uncertainty range for each species or group. .................................................................................................................................... 46
Table 2-4. Summary of mortality estimates by rodent control intensity in the APWRA from May 1998 to September 2001. d.f. = 2, 191. ....................................................................... 50
Table 3-1. Summary of 688 fatalities in our study area (predation as cause excluded) from May 1998 to September 2001. Table includes four bat fatalities................................................. 56
Table 3-2. Summary of results related to distances of carcasses of large-bodied bird species from wind turbines................................................................................................................ 70
Table 3-3. Summary of results related to distances of carcasses of small-bodied bird species from wind turbines................................................................................................................ 70
Table 4-1. Mean comparison (ANOVA) of observed ÷ expected number of gopher burrow systems in areas treated with rodenticide.............................................................................. 83
Table 4-2. Summary of significant relationships between factors measured in our study and ground squirrel and pocket gopher distribution and abundance. .......................................... 87
Table 5-1. Plot number, plot size, tower type, and output for 1,165 turbines included in behavioral observation sessions............................................................................................ 89
Table 5-2. Flight behavior categories used to record observations during 30-minute observation sessions in the study plots. .................................................................................................... 90
Table 5-3. Possible perching structures used during the thirty-minute observation sessions. .... 92 Table 5-4. Summary of behavioral activities by species........................................................... 114 Table 5-5. Flight behaviors recorded per bird observation during 1,958 sessions, where AMKE
= American kestrel, BUOW = burrowing owl, GOEA = golden eagle, NOHA = northern harrier, PRFA = prairie falcon, and RTHA = red-tailed hawk. .......................................... 116
Table 5-6. Flight behaviors recorded per bird observation during 1,958 sessions, where CORA = Common raven, HOLA = horned lark, LOSH = loggerhead shrike, MALL = mallard, RODO = rock dove, WEME = western meadowlark, and TUVU = turkey vulture........... 116
Table 5-7. Total minutes of flight behaviors recorded during 1,958 observation sessions, where AMKE = American kestrel, BUOW = burrowing owl, GOEA = golden eagle, NOHA = northern harrier, PRFA = prairie falcon, and RTHA = red-tailed hawk............................. 117
Table 5-8. Total minutes of flight behaviors recorded during 1,958 observation sessions, where CORA = Common raven, HOLA = horned lark, LOSH = loggerhead shrike, MALL = mallard, RODO = rock dove, WEME = western meadowlark, and TUVU = turkey vulture.............................................................................................................................................. 118
Table 5-9. Total minutes of flight behaviors recorded at blade height within 50 m of turbine, where AMKE = American kestrel, BUOW = burrowing owl, GOEA = golden eagle, NOHA = northern harrier, PRFA = prairie falcon, and RTHA = red-tailed hawk. ........................ 118
Table 5-10. Total minutes of flight behaviors recorded at blade height within 50 m of turbine, where CORA = Common raven, HOLA = horned lark, LOSH = loggerhead shrike, MALL

25
= mallard, RODO = rock dove, WEME = western meadowlark, and TUVU = turkey vulture. ................................................................................................................................ 119
Table 5-11. Total minutes of flight behaviors recorded at blade height within 50 m of operating turbine, where AMKE = American kestrel, BUOW = burrowing owl, GOEA = golden eagle, NOHA = northern harrier, PRFA = prairie falcon, and RTHA = red-tailed hawk. . 119
Table 5-12. Total minutes of flight behaviors recorded at blade height within 50 m of operating turbine, where CORA = Common raven, HOLA = horned lark, LOSH = loggerhead shrike, MALL = mallard, RODO = rock dove, WEME = western meadowlark, and TUVU = turkey vulture. ................................................................................................................................ 120
Table 5-13. The distribution of perch time among select species observed in the APWRA. ... 120 Table 5-14. The distribution of perch time among select species observed in the APWRA. The
discrepancies in total values between this and the previous table are due to missing values.............................................................................................................................................. 121
Table 5-15. The number of species and taxonomic groups (e.g., unidentified gull species) in comparisons were 44. * is P < 0.05, ** is P < 0.001. ........................................................ 279
Table 5-16. Pearson’s 2-tailed correlation coefficients between mortality estimates and estimates of behavioral activity rates of select bird species observed at 132 turbine strings in the APWRA, where t represents 0.10 > P > 0.05, * represents P < 0.05, and ** represents P < 0.001. Mortality was calculated as the number of fatalities per m2 windswept area per year, and behavior rates were either minutes or occasions per m2 windswept area per behavioral observation session. .......................................................................................... 282
Table 5-17. Selecting only strings with fatalities recorded, Pearson’s 2-tailed correlation coefficients between mortality estimates and estimates of behavioral activity rates of select bird species observed at turbine strings in the APWRA, where t represents 0.10 > P > 0.05, * represents P < 0.05, and ** represents P < 0.001. Mortality was calculated as the number of fatalities per m2 windswept area per year, and behavior rates were either minutes or occasions per m2 windswept area per behavioral observation session. .............................. 283
Table 5-18. Pearson’s 2-tailed correlation coefficients between observed – expected fatalities and observed – expected minutes or occurrences of behavioral activities of select bird species observed at turbine strings in the APWRA, where t represents 0.10 > P > 0.05, * represents P < 0.05, and ** represents P < 0.001. .............................................................. 287
Table 5-19. Summary of golden eagle behaviors recorded in the APWRA for longer periods or more frequently than expected by chance........................................................................... 289
Table 5-20. Summary of red-tailed hawk behaviors recorded in the APWRA for longer periods or more frequently than expected by chance. ..................................................................... 290
Table 5-21. Summary of American kestrel behaviors recorded for longer periods or more frequently than expected by chance.................................................................................... 291
Table 5-22. Summary of burrowing owl behaviors recorded in the APWRA for longer periods or more frequently than expected by chance. ..................................................................... 292
Table 6-1. Chi-square values of association between the number of fatalities of avian species and attributes of the wind turbines, turbine strings, and physiographic conditions. t denotes 0.10 > P > 0.05, * denotes P < 0.05, and ** denotes P < 0.005.......................................... 318
Table 6-2. Chi-square values of association between the number of fatalities of avian species and attributes of the wind turbines, turbine strings, and physiographic conditions. t denotes 0.10 > P > 0.05, * denotes P < 0.05, and ** denotes P < 0.005.......................................... 320
26
CHAPTER 1: UNDERSTANDING THE PROJECT 1-1 INTRODUCTION
Since 1989, researchers consistently documented that wind turbines in the Altamont Pass Wind Resource Area (APWRA) kill large numbers of birds, especially raptors (Orloff and Flannery 1992; 1996; Howell 1997; Howell and DiDonato 1991). At that time, wind generation was just emerging as a renewable technology, and industry and regulators knew little about its potential environmental effects on birds. The early researchers succeeded by locating numerous bird fatalities and quantifying bird mortality, thus bringing attention to the problem. They hypothesized various causes and mechanisms associated with wind-turbine-caused bird fatalities, but these early efforts lacked the funding and duration needed to provide confident answers to the many questions they raised. In March 1998, the National Renewable Energy Laboratory (NREL) initiated research to address some complex questions that affect both wind energy development and wildlife conservation. What is the full extent of bird mortality in the APWRA? What are the underlying causes of these fatalities? Are fatalities predictable at wind turbines with certain suites of characteristics? If they can be predicted, then what management options might be implemented to reduce the number of fatalities? In an effort to simplify these questions, we present the following framework for addressing and interpreting factors related to avian mortality in the APWRA.
In the above framework, it is the integration of Steps 1 through 3 that leads to Step 4 and its solutions. An empirical model developed in Step 4 can be broadly applied to predict impacts using quantitative measurements of factors that relate to susceptibility and vulnerability, terms which are drawn from the ecological indicators framework (Rapport et al. 1985, Cairns and McCormick 1992, O’Neill et al. 1994, Rotmans et al. 1994, Schulze et al. 1994, USDA 1994, Battaglin and Goolsby 1995, Wilcox et al. 2002; for an example, see Zhang et al. 1998, 2002) and defined below. To estimate impact, we also would like to estimate levels of risk for each bird species in the APWRA. However, we cannot estimate population-level risk because it is too costly and impractical to enumerate
Step 1
Step 2
Step 3 Step 4
Natural behaviors, geographic distributions, and ecological relationships that predispose wildlife to harm due to wind turbines
Placement and operation of wind farm structures and related management activities that pose threats to wildlife
Mortality due to wind farm operations
Reliably predicting impacts from indicators of susceptibility and vulnerability
Susceptibility
Vulnerability
Impacts
Solution

27
each species at and around the APWRA. Estimating risk to the population requires that the researcher put the estimate of mortality into context with population size. To do so requires setting a geographic boundary as to what constitutes a population for any given species. This is problematic since for some species, like golden eagles (Aquila chysaetos), individuals using the APWRA may breed in the immediate area or hundreds of miles away, and they may commingle during their non-breeding months. Despite the risk per species being our preferred measure of risk, solutions to bird mortality in the APWRA can be efficiently derived from the above framework. Natural Behaviors and Ecological Relationships: Susceptibility Birds are killed in several ways in the APWRA, such as attempting to pass through the rotor plane of a turbine, flying into guy wires, or perching atop unsafe electrical distribution poles that service the wind farm. Attemping to fly through the rotor plane of a wind turbine ultimately expresses natural behaviors, but in an artificial context since the rotor plane has been introduced along with all of the other land uses and structures that are characteristic of wind farms. Natural behaviors and ecological relationships of birds contribute to their inherent susceptibility to wind turbines. Since each bird species exhibits unique suites of behaviors, geographic distributions, and ecological relationships, each also possesses unique susceptibilities to wind farms. For example, if golden eagles spend most of their foraging time in canyons, then they may be more susceptible to the placement of wind turbines in canyons. Red-tailed hawks (Buteo jamaicensis) may be less susceptible to wind turbine placement in canyons, but perhaps more susceptible to wind turbines placed on ridgelines, if ridgelines happen to be where they fly most often. Burrowing owls (Athene cunicularia) might be most susceptible to wind turbines placed where the owls conduct most of their courtship displays or where their dispersal flights take them into the altitudes of the moving turbine blades. Thus, we estimate susceptibility by measuring and comparing behaviors that could cause individual species to collide with wind turbines, should these behaviors continue unaltered after wind turbines are placed into operation. Orloff and Flannery (1996) suggested that some birds try to pass through the rotor plane because they simply cannot see moving wind turbine blades, or in the case of raptors, because they are fixated on a perch or prey item situated beyond the blades. Raptors may identify a perch or prey item and continuously observe it until they capture or land on it. If the raptor’s target is located behind the moving blades of a wind turbine, then the raptor may not see the blades until it is too late to avoid them. The relative effects of motion smear (Hodos et al. 2001) versus fixed focus on prey items remains unknown, as well as does the degree to which these two factors might interact. But the frequent fatalities of nonraptorial birds summarized in this report indicates that fixed focus on prey items is not the only reason birds attempt to pass through the rotor plane. Certain flight behaviors might influence a species' susceptibility to wind turbines, such as its long-distance flight behaviors during migration and its use of declivity winds, which are strong winds passing over ridge crests, as winds are forced upslope. Patterns of perching might connote various levels of susceptibility, if, for example, certain birds are prone to perching on wind towers because these towers provide perch opportunities similar to trees with which the species are familiar. Certain mating behaviors might distract individuals regardless of whether wind turbines are operating in the vicinity. Due to differences in sensory perception relied upon by animals during the night versus the day, nocturnal predators may or may not be more susceptible than diurnal predators. Lastly, some bird species occurring in relatively large numbers in the study area may only fly at heights well above the rotor planes, thus reducing their susceptibility to the existing wind farm. (New, larger wind turbines might alter the susceptibility of these bird species.) For these and other potential interspecific differences in susceptibility associated with flight behaviors, future changes in wind turbine design, operation and placement might yield different mortality rates among bird species in the APWRA.

28
The best approach available to researchers for estimating susceptibility is to implement a before-after control impact (BACI) design with replication of impact and control treatments (Anderson et al. 1999). However, our study could not implement such a design because the wind turbines available to us were put into operation prior to the initiation of our study. In the absence of the ideal study design, in which we would characterize bird behaviors in the APWRA prior to wind turbine operations, we made what inferences we could about susceptibility of bird species to placement and operation of wind turbines (see Chapter 5). Exposure to Wind Farm Operations: Vulnerability The placement and operation of wind turbines can make birds vulnerable to wind turbine collisions when and where these birds are already susceptible to wind turbines due to relative abundance, behaviors, and ecological relationships (e.g., predator-prey interactions). Vulnerability is a relative term that requires the measurement of susceptibility and impact across ranges of environmental conditions within the study area. Quantifying vulnerability requires comparing near-turbine bird activity levels and bird deaths to the availability of wind turbines within the environmental elements of interest, such as types of physical relief, seasons, and proximity to particular prey species. Measures of vulnerability can be based on relative abundance near wind turbines and/or on the relative mortality of avian species at wind turbines with particular attributes. In both cases, use-and-availability analysis using chi-square test statistics is an effective means of testing whether particular levels of vulnerability are significant. As an example of applying use-and-availability analysis, relative abundance can be measured as the proportion of the sampling periods that each bird species is observed flying over landscape element i, and this proportion of flight time is related to the proportion of landscape element i occurring within the study area. Bird mortality can be measured as the proportion of the sample of individuals killed at wind turbines of a particular type or environmental setting relative to the proportion of those types or settings in which all of the wind turbines in the study area occur. Vulnerability due to placement of wind turbines on certain landscape elements (as an example of any environmental element that one wishes to measure) can be expressed by the following model:
where, in the case of measuring use of the areas near wind turbines, n = flight time of a particular species nearby wind turbines on landscape element i, N = total flight time of the species on the sampled landscape; and where, in the case of measuring mortality, ni = number of individuals of the species killed at wind turbines on landscape element i, N = total number of the species killed within the landscape area being sampled and pi = proportion of the sampled landscape composed of landscape element i. In summary, part of our study attempts to identify the vulnerability of bird species to strikes with wind turbines based on our weighted measurements of susceptibility and impacts. Measuring Effects on Birds: Impacts Avian mortality studies conducted at wind resource areas have produced various mortality estimates. Howell and DiDonato (1991) sampled the APWRA's wind turbines in 1988-1989 and reported 0.05 deaths per wind turbine per year (n = 17 fatalities). Orloff and Flannery (1996) conservatively estimated that 39 golden eagles were killed during a 1-year period in the APWRA, and they estimated raptor mortality to range from 0.02 -
χ 2 Observed
χ 2 Expected
ni
N · pi
= χ 2 Observed
χ 2 Expected
ni
N · pi
=

29
0.05 deaths/turbine/year. Howell (1997) confirmed 72 wind-turbine-caused fatalities during an 18-month period at two wind farms, the Altamont WRA and Montezuma Hills WRA. Bird fatalities consisted of 44 raptors and 28 nonraptor with a mean raptor mortality of 0.03 deaths/turbine/year. The effects of wind turbine operations on birds can be interpreted from two perspectives: legal and biological. From a legal perspective, individual fatalities can be considered significant effects and subject to civil or criminal penalties. Federal laws protecting raptors specifically include the Migratory Bird Treaty Act (MBTA), the Bald Eagle and Golden Eagle Protection Act, and the Endangered Species Act. Raptors are also protected under California Fish and Game Code 3503.5, which makes it illegal to take, possess, or destroy any bird in the Order Falconiformes or Strigiformes. The MBTA prohibits killing any bird species designated as fully protected. The U.S. Fish and Wildlife Service considers ‘take’ to be any injury or fatality of any raptor from a collision with a wind turbine, or ancillary facilities, in the APWRA, and therefore, a violation of the MBTA (S. Pearson, USFWS, pers. comm. 2000). Bird fatalities attributable to wind turbines are significant effects, from a legal perspective, because they violate the MBTA, which constitutes a decision that any additional human-caused losses of individuals of raptor species covered by the MBTA are biologically significant. Comparing the wind-turbine-caused mortality to both the natural mortality and the recruitment rate of each affected species would effectively measure the biological importance of wind-turbine-caused fatalities. Doing so would yield estimates of the degree to which wind turbines adversely affect a species' population size, stability, and distribution. However, to do so would require extensive information about the distribution and demographic structure of populations occurring in and around the APWRA. Simply counting living birds in the APWRA usually would be inadequate for this purpose because the numbers would change dramatically throughout the year due to migrations. The numerical estimates made in the APWRA would be, in many cases, contaminated by individuals that live most or part of their lives elsewhere. The APWRA may directly affect any number of bird species that occur over a broad geographic area. Thus, the geographic scale required for estimating impacts to avian species would be much larger than the APWRA itself. The scope of our study did not allow inferences of population-level or regional impact assessments to be made, but it is important to consider that these impacts are possible and should be estimated by additional research. Among the species of raptors killed in the APWRA, golden eagle and burrowing owl are probably the species of greatest concern because they are California Species of Special Concern. No detailed studies are underway to address impacts to burrowing owls, but a recent study of golden eagle mortality factors and population regulation over a broad geographic region specifically included the APWRA within its overall study area (Hunt 1994, 2002, Hunt and Culp 1997). In recent years, golden eagle deaths in the area have been attributed to wind turbines. Hunt (1994) and Hunt and Culp (1997) concluded that the additional effect of wind-turbine-caused mortality might be contributing to a long-term decline in the local golden eagle population, but Hunt (2002) later concluded the local population might be stable. However, Hunt’s study was too brief for reliably estimating multigenerational trends in golden eagle numerical abundance and demography (see Smallwood and Schonewald 1998). In addition, a high mortality of golden eagles might not change the number of individuals in the population so long as recruitment keeps pace with fatalities, but a high rate of ill-fated recruitment might very well deplete golden eagle numbers in source areas (Smallwood 2002). Until more rigorous research efforts are conducted in the APWRA for each bird species, the full environmental impact of the APWRA will remain unknown. We will not know how the killing of individual birds affects their populations. In lieu of more rigorous research on population-level impacts, it would be prudent to implement effective management practices that will demonstrably reduce the vulnerability of bird species to the APWRA. In addition, demonstrating a reduction in bird mortality within the APWRA might enable Alameda County (1998) to permit an increase in generating capacity that is available to the wind industry.

30
Relating Impacts to Causal Variables: Predictions and Solutions Aside from the effects of season, weather, and wind turbine design and operation, if individuals of any bird species were randomly killed at wind turbines among measured environmental elements on the APWRA, then the probability of an individual being killed by a wind turbine occurring on a particular environmental element would equal the proportion of the wind turbines associated with that environmental element multiplied by the total number of that species killed in the study area. For example, if 20% of the wind turbines in a study area occurred on southeast-facing slopes, then a random distribution of 100 red-tailed hawk fatalities at wind turbines should have included about 20 birds killed by wind turbines on southeast-facing slopes. This product of total number killed (N) and the incidence of wind turbines on the ith landscape element is an expected kill rate at the ith landscape element. The number of fatalities at the ith landscape element can then be compared to the expected number of fatalities. For example, had 40 red-tailed hawks been killed by wind turbines on southeast-facing slopes, this observed frequency was twice the frequency expected of a random or uniform distribution of fatalities. When the observed and expected frequencies of fatalities are equal, then the observed frequency cannot be attributed statistically to anything other than wind turbine numbers. However, when the converse is true, a relationship exists between that environmental element and mortality. If the relationship is less than one, then there may be an avoidance of one environmental element and the possible selection of another. By identifying environmental elements where mortality exceeded expectations due to wind turbine numbers alone, we are able to identify which environmental factors might have a causal relationship. It is by this approach that we can assess vulnerability. At selected wind turbines within the APWRA, we compiled separate data files for bird behaviors, wind turbine and tower characteristics, fatality searches, fatality search results, maps of rodent burrow systems, and various other physical and biological factors. This final report summarizes the results of our integration of these data. This data integration brings us another step closer to developing a predictive model for bird mortality at wind turbines based on wind turbine location on the landscape, wind turbine location relative to other wind turbines, wind turbine design and operation, the distribution of raptor prey species near wind turbines, and other potential predictor variables. We believe that in the future such an approach will lead to a model that will reliably predict how many birds per species are likely to be killed at individual wind turbines or at strings of wind turbines per year. Most importantly, such a model can be used as a tool to identify zones of vulnerability when siting new wind turbines in the APWRA. 1-2 OBJECTIVES The primary objectives of this research were (1) to quantify bird use, including characterizing and quantifying perching and flying behaviors exhibited by individual birds around wind turbines; (2) to evaluate the flying behaviors and the environmental and topographic conditions associated with flight behaviors; and (3) to identify possible relationships between bird mortality and bird behaviors, wind tower design and operations, landscape attributes, and prey availability. A fourth objective, pursued through a research contract with the California Energy Commission, was to develop a predictive, empirical model that identifies areas or conditions that are associated with high vulnerability. Such a model could be used in the APWRA to identify locations and conditions of high versus low vulnerability, or to reliably identify those wind turbines that have demonstrated their ongoing threat to birds.

31
We began the project by quantifying bird use and bird fatalities associated with that use. Due to limited access, only about 28% of the APWRA's total wind turbine population was included in the project. We quantified bird flight and perching behaviors at the various wind turbine types, and examined whether the frequencies of these behaviors at wind turbines were related to environmental factors, including weather, topography, habitat features, and prey availability. As our study progressed, unexpected patterns prompted us to add certain focused subtasks and activities to complement the basic goals of the project. Such patterns included ground squirrel (Spermophilus beecheyi) distribution and abundance not relating to raptor mortality; pocket gophers (Thomomys bottae) clustering near wind towers on steep ridgelines; and raptors generally avoiding perching upon wind towers while turbines operated. We added research on rodent distribution in relation to tower locations, bird use, and fatality locations. We also examined topographic and landscape features and related these to bird use and bird fatalities. In general, the topics we examined fell into three broad categories: (1) bird flight behaviors; (2) wind turbine/tower design, placement, and operations; and (3) raptor prey availability and distribution in relation to individual wind turbines and turbine strings. Wherever applicable, the methods used in our project adhered to guidelines developed and recommended for such studies by the Avian Subcommittee of the National Wind Coordinating Committee (Anderson et al. 1999). 1-3 STUDY AREA APWRA is located 90 kilometers (km) east of San Francisco, within eastern Alameda and southeastern Contra Costa counties in central California (Figure 1-1). Within the APWRA, which is the largest wind energy facility in the world, some 8,200 wind turbines were originally approved and 5,400 are installed (Alameda County 1998). The output capacity of the installed wind turbines is about 580 megawatts. They are distributed over approximately 150 km2 (50,000 acres). Photos 1-1 through 1-7 depict aspects of the wind farm and various types of wind turbines.
Photo 1-1. Bonus 150-kW wind turbines on tubular towers and Flowind 150-kW vertical-axis wind turbines on the right, view east.
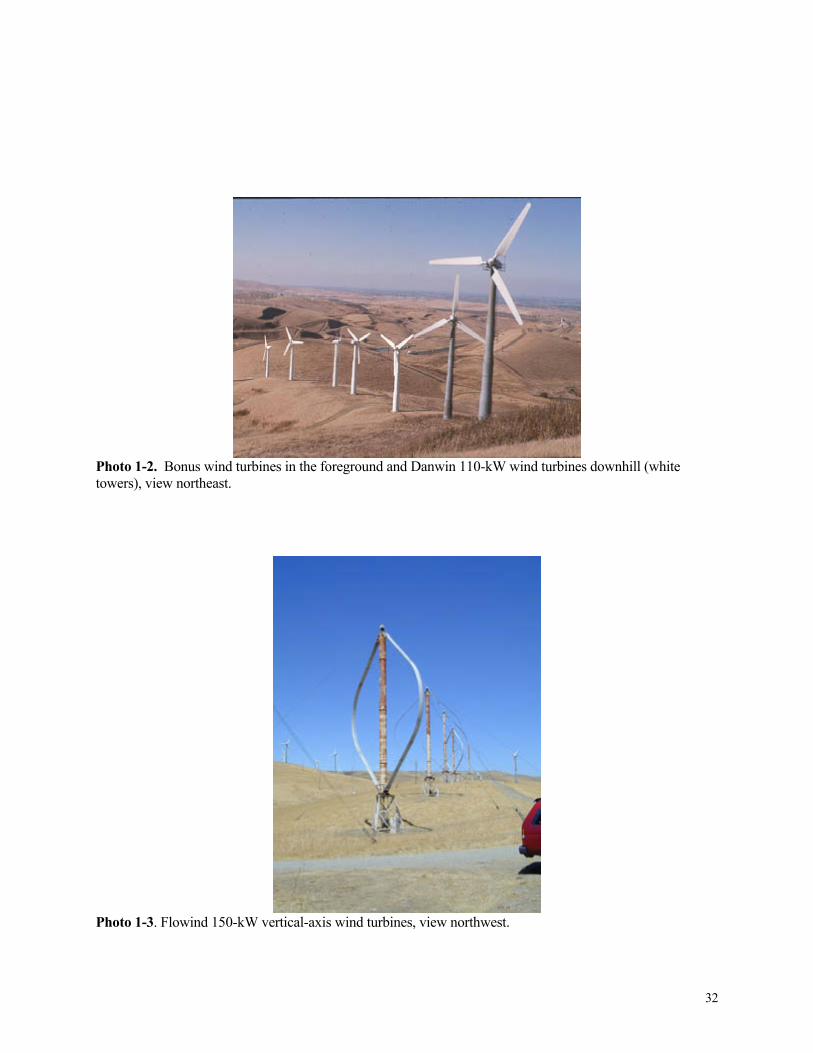
32
Photo 1-2. Bonus wind turbines in the foreground and Danwin 110-kW wind turbines downhill (white towers), view northeast.
Photo 1-3. Flowind 150-kW vertical-axis wind turbines, view northwest.

33
Photo 1-4. Micon 65-kW wind turbines near Mountain House, view southwest.
Photo 1-5. KVS-33 turbines on lattice and tubular towers in the foreground, and KCS-56 100-kW turbines in the background, view northeast.

34
Photo 1-6. Enertech 40-kW wind turbine with two turkey vultures flying nearby.
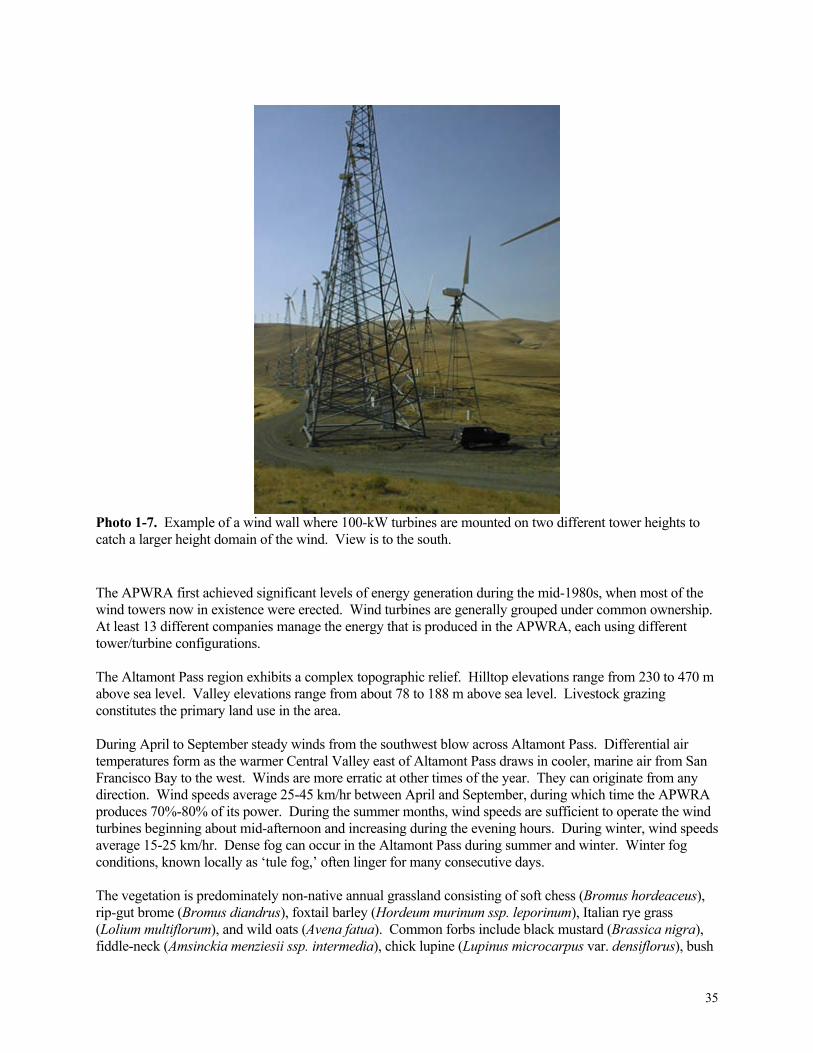
35
Photo 1-7. Example of a wind wall where 100-kW turbines are mounted on two different tower heights to catch a larger height domain of the wind. View is to the south. The APWRA first achieved significant levels of energy generation during the mid-1980s, when most of the wind towers now in existence were erected. Wind turbines are generally grouped under common ownership. At least 13 different companies manage the energy that is produced in the APWRA, each using different tower/turbine configurations. The Altamont Pass region exhibits a complex topographic relief. Hilltop elevations range from 230 to 470 m above sea level. Valley elevations range from about 78 to 188 m above sea level. Livestock grazing constitutes the primary land use in the area. During April to September steady winds from the southwest blow across Altamont Pass. Differential air temperatures form as the warmer Central Valley east of Altamont Pass draws in cooler, marine air from San Francisco Bay to the west. Winds are more erratic at other times of the year. They can originate from any direction. Wind speeds average 25-45 km/hr between April and September, during which time the APWRA produces 70%-80% of its power. During the summer months, wind speeds are sufficient to operate the wind turbines beginning about mid-afternoon and increasing during the evening hours. During winter, wind speeds average 15-25 km/hr. Dense fog can occur in the Altamont Pass during summer and winter. Winter fog conditions, known locally as ‘tule fog,’ often linger for many consecutive days. The vegetation is predominately non-native annual grassland consisting of soft chess (Bromus hordeaceus), rip-gut brome (Bromus diandrus), foxtail barley (Hordeum murinum ssp. leporinum), Italian rye grass (Lolium multiflorum), and wild oats (Avena fatua). Common forbs include black mustard (Brassica nigra), fiddle-neck (Amsinckia menziesii ssp. intermedia), chick lupine (Lupinus microcarpus var. densiflorus), bush

36
lupine (Lupinus albifrons), and wally baskets (Triteleia laxa). Grasses and forbs grow during the rainy months of January, February, and March, then die or go dormant by the beginning of June. The APWRA includes the following physiographic elements that harbor characteristic groups of species: annual grassland, alkali meadow, emergent marsh, riparian woodland and scrub, creeks and drainages, stock ponds, cultivated land, and rock outcrops. At least 18 special-status wildlife species occur in the area, including San Joaquin kit fox (Vulpes macrotis mutica), California red-legged frog (Rana aurora draytonii), San Joaquin pocket mouse (Perognathus inornatus inornatus), American badger (Taxidea taxus), Swainson's hawk (Buteo swainsoni), peregrine falcon (Falco peregrinus), California tiger salamander (Ambystoma californiense), two species of fairy shrimp, and others. In addition, the area supports as many as 15 special-status plant species (Alameda County 1998).
Figure 1-1. Approximate boundary (outlined polygon) of the APWRA, located in Alameda and Contra Costa counties.

37
CHAPTER 2: BIRD MORTALITY 2-1 INTRODUCTION Whereas the 5,400 wind turbines operating in the APWRA generate up to 580 MW of electricity, they also kill birds that fly into the moving blades. It is important for regulatory and biological reasons to estimate the environmental impact that the APWRA has on birds. Impact estimates are needed to decide the extent, magnitude, and types of mitigation that should be implemented in the APWRA. As mentioned in Chapter 1, in this study we made impact estimates based on fatalities because we lacked information on the ratio of fatalities to the number of birds residing in, or passing through, the APWRA. There are two means to measure impacts to birds. The simplest is to express impacts as the number of fatalities relative to the number of turbines and the time span over which the fatalities occurred. Another means is to compare the turbine-caused fatality rate to both the natural mortality and the recruitment rate of each species, thus estimating the degree to which the wind turbines adversely affect the numerical or demographic condition of each species. This latter means of expressing impacts enables risk assessments to be made, and it is the preferred means of expressing impacts. However, this approach requires information of the numerical distribution and demographic constitution of populations occurring at and around the APWRA. Also, the geographic scale of consideration would need to be much larger than the APWRA because the APWRA may serve as an ecological sink for animal species affected by the wind turbines. That is, individuals from surrounding populations disperse into the Altamont area and are killed, thus possibly affecting the overall numerical and demographic composition of the species over a relatively large region. Because it was impractical to estimate population size and to characterize the demography of species in and around the APWRA, we employed the simpler means of estimating impact as the number of fatalities per turbine per year. To our knowledge, the simpler method of estimating impact has been the only method used so far at this and other wind farms. Howell and DiDonato (1991) reported 17 raptor fatalities for a rate of 0.05 deaths per turbine per year in the APWRA during 1988-1989. Orloff and Flannery (1996) conservatively estimated that 39 golden eagles were killed during a 1-year period in the APWRA with raptor fatality rates varying from 0.02 to 0.05 deaths per turbine per year. Howell (1997) identified 72 confirmed collision fatalities during an 18-month period at two wind resource areas, Altamont Pass and Montezuma Hills. Bird fatalities consisted of 44 raptors and 28 nonraptor with a mean raptor mortality of 0.029 birds per turbine per year. Outside the APWRA, raptor mortality estimates have ranged from 0-0.48 birds per turbine per year and mortality estimates of all birds have ranged from zero to 4.45 birds per turbine per year (Erickson et al. 2001). Erickson et al. (2001) elected not to report the estimates of mortality of all birds in the APWRA because no scavenging or searcher efficiency studies were performed there. However, the error due to these factors would have rendered the estimates conservative, so not including them in Erickson et al.’s review only served to truncate the upper range of mortality estimates and lessen the resulting overall impact assessment of wind turbine operations. Among the species of raptors killed in the APWRA, the golden eagle has been the species of greatest concern and the species whose local population is most likely to be adversely affected (Hunt 1994, 2002). In addition to its low abundance relative to other raptors, the breeding and recruitment rates of golden eagle are naturally low. It is a species of special concern in California (California Fish and Game Department 1992) and receives special protection under the federal Bald Eagle Protection Act as amended in 1963. Wind-turbine-caused mortality of golden eagle in the APWRA is therefore of particular concern.

38
It was our intent to estimate mortality of each species so that comparisons could be made to other sites or to future monitored results from the APWRA. Another objective was to compare mortality by wind turbine type, rodent control level, ownership of the wind turbines, and season of the year. Finally, we extrapolated our mortality estimates to the unsampled portion of the APWRA in order to characterize the range of probable project impacts per species and among larger taxonomic groups. 2-2 METHODS We sampled 1,526 individual wind turbine and tower configurations from March 1998 through September 2001. During the course of the project, we periodically added groups of turbines as they became available to us. Gauthreaux (1996) suggested that searches for bird fatalities should be circular around each wind turbine, the minimum radius to be determined by the height of the wind turbine. Because all wind turbines in our study area were arranged in strings, we searched them efficiently by walking strip transects along both sides and around the ends. Thus, we chose the string of turbines as one of our study units because search rotations were efficiently performed on them. All wind turbines composing a turbine string shared common search dates, frequency of searching, and time span including the searches. For reasons beyond our control, we were unable to search all turbine strings throughout the study or equally in frequency, so our fatality searches among turbine strings varied by time spans (Figures 2-1 and 2-2) and seasonal representation (Figure 2-3). Most turbine strings were given roughly similar search efforts over the time spans they were searched (Figures 2-4 and 2-5). Two people explored the ground around each string of wind towers, using one of two searching methods, one for level terrain and the second for hillsides (Figure 2-6). In either case, each person walked in line with the string, 50 m away from the first tower, and 50 m in the opposite direction away from the string centerline. Previous studies reported that about 77% of all carcasses were found within a 30-40 m radius from the wind towers, mostly in the area behind the rotor (Orloff and Flannery 1992, Munsters et al. 1996, Howell 1997). Both searchers walked towards and outwards from the string line in a zigzag pattern from wind tower to wind tower until they reached the last one. On hillsides or steep terrain, the searchers walked parallel to the string of wind turbines, whereas on level terrain they walked perpendicular to it. The distance between each zigzag characterizes a different approach to this technique as compared with previous fatality search studies (i.e., Orloff and Flannery 1992). In this study, we kept a tight, closed, zigzag pattern, approximately 4 m between each turn. The expected advantage of this ground surveying technique was to increase the probability of detection of all bird remains, including small passerines. The ground around each wind tower was searched in 8-10 minutes. Five hours per day was devoted to fatality searches, and two-person crews managed to search 30 to 40 wind turbines per day. With two to three people searching 120-150 wind turbines per week, 685 turbines could be sampled once every five to six weeks, thus completing approximately eight fatality search cycles in 12 months during 1998 through 1999 when we were limited to 685 turbines. Not all turbine strings were searched every month due to changes in field strategies or for reasons out of our control, such as fire hazards and flooded roads. As we were allowed to search around additional wind turbines, our search rotations took longer and our frequency of searches per year declined. All carcasses or body parts, such as groups of flight feathers, head, wings, tarsi, and tail feathers, found during each search within a 50-m radius of the wind turbine were documented and flagged as fatalities. We carefully examined these to determine species, age, sex, and probable cause of death. The time since death

39
was estimated by carefully analyzing the carcass condition (e.g., fresh, weathered, dry, bleached bones) and decomposition level (e.g., flesh color, presence of maggots, odor), using methods and standards described in the following paragraphs. To determine the cause of death, we evaluated the general condition of intact carcasses. For dismembered or mutilated remains, we evaluated carcass position, the distance and compass reading to the nearest wind turbine or electrical distribution pole or wire, and the type(s) of injury. Each fatality was classified as a 'fresh kill' or as 'old remains' depending on the estimated time since death. Fatalities were considered fresh when carcasses and small remains were estimated less than 60 days since death. Old remains included highly decomposed and dismembered carcasses with weathered and discolored feathers, missing flesh, and bleached, exposed bones. These carcass characteristics led observers to believe that the time since death was before the initiation of search rotations at the particular wind turbines. The above data, as well as the distance and angle to the wind turbine closest to the carcass, were recorded on a standard data sheet. Observers photographed each fatality at the time of discovery. We expressed mortality as the number of fatalities per wind turbine per year in most circumstances, so the number of fatalities recorded for a turbine string was divided by the number of wind turbines composing the string and by the years or fractions of a year during which the searches were conducted. We assumed that the same number of fatalities would have been found during a given year regardless of whether 12 searches were performed or eight searches, but it is likely that reduced search frequency resulted in lower carcass detection rates. Our mortality metric was changed to number of fatalities per turbine per search when we compared mortality by season of the year. In both measures of mortality, old remains were not included in the calculations. Searcher bias and detection rates were not studied because it had already been established that mortality in the APWRA is much greater than experienced at other wind farms. We were unconcerned with underestimating mortality, and we acknowledge that we did so. We were more concerned with learning the factors related to fatalities so that we can recommend solutions to the wind-turbine-caused avian mortality problem. Therefore, we applied our resources to finding bird carcasses rather than into estimating how many birds we were missing due to variation in physiographic conditions, scavenging, searcher biases, or other reasons. Because we did not perform trials to estimate searcher detection and scavenger removal rates, we relied on published estimates from other studies. Orloff and Flannery (1992) estimated searcher detection of 85% of raptor carcasses in the APWRA, so we used this value for raptors. For nonraptors, we used the mean between the Johnson et al. (2002) estimate of 38.7% and the Erickson et al. (2003) estimate of 43%, which was 40.85% and rounded to 41%. We divided raptor mortality by 0.85 and nonraptor mortality by 0.41. To these we added the species/group-specific fraction of carcasses located more than 50 m from wind turbines, assuming we missed detecting just as many outside our search radius. Adjustments for searcher detection rates were made prior to factoring in scavenger removal rates. Erickson et al. (2003) estimated that after 40 days, 58.6% of carcasses of large-bodied species were removed on average, and that 80.2% of carcasses of small-bodied species were removed. Our average search interval was 53 ± 11.6 days. Therefore, we adopted the carcass removal rates of Erickson et al. (2003), assuming scavenger removal rates were similar between 40 days in their study and 53 days in ours. To adjust our mortality estimates so that they included the carcasses removed by scavengers and those that we did not detect, we divided the raw mortality estimates by the proportion of carcasses detected by Erickson et al. because the carcasses had not been removed yet by scavengers. We divided mortality by 0.198 and 0.414 for small-bodied and large-bodied species, respectively. Based on our experience with raptor carcasses in the APWRA, we did not believe that these scavenger removal rates were accurate for raptors, and we halved the removal rate estimates reported by Erickson et al.

40
(2003). Mortality of small raptor species was divided by 0.396, and mortality of large raptor species was divided by 0.828. After adjusting for searcher detection bias and the rates of carcass removal by scavengers, some error remains due to the WRRS (Wildlife Reporting and Response System) and other human actions. We found one raptor carcass buried under rocks and another stuffed in a ground squirrel burrow. One operator did not inform us when a golden eagle was removed as a part of the WRRS. Based on these experiences, it is possible that we missed other carcasses that were removed. For these reasons, our mortality estimates might be conservative.
Figure 2-1. Frequency distribution of span of years spent searching for carcasses in the APWRA, May 1998 to September 2001.
Figure 2-2. Frequency distribution of number of searches for carcasses in the APWRA, May 1998 to September 2001.
30.027.525.022.520.017.515.012.510.07.55.02.5
50
40
30
20
10
0
Freq
uenc
y
Number of searches made for carcasses30.027.525.022.520.017.515.012.510.07.55.02.5
50
40
30
20
10
0
Freq
uenc
y
Number of searches made for carcasses
3.53.02.52.01.51.00.5
50
40
30
20
10
0
Freq
uenc
y
Number of years spanning search for carcasses
3.53.02.52.01.51.00.5
50
40
30
20
10
0
Freq
uenc
y
Number of years spanning search for carcasses

41
Figure 2-3. Mean comparisons of the number of fatality searches performed per season of the year in the APWRA, May 1998 to September 2001.
Figure 2-4. Frequency distribution of the number of searches per year made for estimating avian mortality in the APWRA, May 1998 to September 2001.
7
6
5
4
3
2
1
0
Meannumber
ofsearches& 95% CI
FallSummerSpringWinter
N = 192 strings of turbines7
6
5
4
3
2
1
0
Meannumber
ofsearches& 95% CI
FallSummerSpringWinter
N = 192 strings of turbines
171615141312111098765432
60
50
40
30
20
10
0
Freq
uenc
y
Number of searches per year made for carcasses171615141312111098765432
60
50
40
30
20
10
0
Freq
uenc
y
Number of searches per year made for carcasses

42
Figure 2-5. Relationships between the number of searches and the number of years spanning the searches (A), and between the searches per year and the number of years spanning the searches (B).
3.53.02.52.01.51.00.5
30
20
10
0
Numberof
searches
3.53.02.52.01.51.00.5
18
16
14
12
10
8
6
4
2
0
Searchesperyear
Number of years spanning searches
A
B
3.53.02.52.01.51.00.5
30
20
10
0
Numberof
searches
3.53.02.52.01.51.00.5
30
20
10
0
Numberof
searches
3.53.02.52.01.51.00.5
18
16
14
12
10
8
6
4
2
0
Searchesperyear
Number of years spanning searches
A
B

43
Figure 2-6. Illustration of typical carcass search patterns around wind turbine strings. 2-3 RESULTS We found 652 fatalities that we attributed to operating wind turbines (Table 2-1). Of these, we estimated that 79 carcasses were more than 90 days old. They were excluded, therefore, from estimations of mortality (Tables 2-2 and 2-3). These older carcasses were used for association analyses that were intended to identify factors related to turbine-caused mortality (see Chapter 6.) At the string level of analysis, the frequency distributions of mortality were right-skewed (Figure 2-7). Red-tailed hawk mortality was greatest during the fall (Figure 2-8), even though our search effort was least during this time of year (Figure 2-3). Relating mortality to search effort per season, we found significant associations for burrowing owl, house finch, horned lark, rock dove, red-tailed hawk, western meadowlark, plus all raptors combined, all nonraptor combined, and all avian species combined (Figure 2-9). Mortality typically associated most positively with fall, and least with spring. However, house finch mortality was greatest during winter and horned lark mortality was greatest during summer. Mortality varied by groups of wind turbines according to the intensity of rodent control applied to the area around the wind turbines (Table 2-4). Red-tailed hawk mortality was greater where rodent control was used (Figure 2-10), and so was golden eagle mortality (Figure 2-11) and all raptors combined (Figure 2-12).
50 meters
50 meters
One observer per side of turbine string
One observer per side of turbine string
Level terrain
Steep terrain
wind turbine
50 meters
50 meters
One observer per side of turbine string
One observer per side of turbine string
Level terrain
Steep terrain
wind turbine

44
Table 2-1. Status of species found killed by 1,526 wind turbines in the APWRA from May 1998 to September 2001. Common name Species name Status a Golden eagle Aquila chrysaetos CSC, CFP Turkey vulture Cathartes aura Red-tailed hawk Buteo jamaicensis Northern harrier Circus cyaeneus CSC White-tailed kite Elanus leucurus CFP Prairie falcon Falco mexicanus CSC American kestrel Falco sparverius Burrowing owl Athene cunicularia hypugea CSC Great horned owl Bubo virginianus Barn owl Tyto alba California gull Larus californicus CSC Ring-billed gull Larus delawarensis Black-crowned night heron Nycticorax nycticorax CSA Mallard Anas platyrhynchos Wild turkey Melleagris gallopavo Rock dove Columba livia Mourning dove Zenaida macroura Northern flicker Colaptes auratus Common raven Corvus corax Brown-headed cowbird Molothrus ater Brewer’s blackbird Euphagus cyanocephalus Red-winged blackbird Agelaius phoeniceus Tricolored blackbird Agelaius tricolor FSC, CSC European starling Sturnus vulgaris Horned lark Eremophila alpestris actia CSC Western meadowlark Sturnella neglecta Loggerhead shrike Lanius ludovicianus FSC, CSC Pacific-slope flycatcher Empidonax difficilis Mountain bluebird Sialia currucoides Violet-green swallow Tachycineta thalassina Cliff swallow Hirundo pyrrhonota House finch Carpodacus mexicanus Hoary bat Lasiurus cinereus

45
Table 2-2. Summary of mortality estimates and projected mortality across the APWRA based on data collected by BioResource Consultants from May 1998 to September 2001.
Fatalities Mortality (deaths/turbine/year)
Species/Taxonomic group Total found
Used to estimate mortality
Mean per string
Standard deviation per string
Proportion of recent carcasses
found >50 m from turbines
Golden eagle 18 12 0.0037 0.0182 0.1818 Turkey vulture 3 3 0.0017 0.0142 0.0000 Red-tailed hawk 129 104 0.0275 0.0576 0.1212 Buteo 18 0 --- --- 0.0000 Northern harrier 2 2 0.0004 0.0038 0.0000 White-tailed kite 1 0 --- --- 0.0000 Prairie falcon 2 2 0.0005 0.0058 0.5000 American kestrel 30 30 0.0079 0.0289 0.0714 Burrowing owl 62 62 0.0250 0.0616 0.1400 Great horned owl 12 9 0.0035 0.0217 0.0000 Barn owl 33 31 0.0087 0.0371 0.2500 California gull 5 5 0.0015 0.0120 0.2500 Ring-billed gull 5 4 0.0025 0.0215 0.2500 Black-crowned night heron 2 2 0.0003 0.0031 0.5000 Mallard 28 23 0.0097 0.0588 0.2000 Wild turkey 1 1 0.0004 0.0051 0.0000 Rock dove 113 108 0.0299 0.0746 0.0481 Mourning dove 5 5 0.0025 0.0209 0.0000 Northern flicker 2 2 0.0010 0.0114 0.0000 Common raven 9 7 0.0029 0.0274 0.0000 Brown-headed cowbird 1 1 0.0006 0.0084 1.0000 Blackbird 1 1 0.0009 0.0124 0.0000 Brewer’s blackbird 4 4 0.0018 0.0165 0.0000 Red-winged blackbird 5 5 0.0032 0.0244 0.0000 Tricolored blackbird 1 1 0.0004 0.0054 0.0000 European starling 30 30 0.0137 0.0570 0.0345 Horned lark 12 12 0.0035 0.0155 0.0000 Western meadowlark 71 71 0.0278 0.0693 0.0175 Loggerhead shrike 4 4 0.0027 0.0238 0.0000 Pacific-slope flycatcher 1 1 0.0006 0.0088 0.0000 Mountain bluebird 2 2 0.0009 0.0111 0.0000 Violet-green swallow 1 1 0.0002 0.0028 0.0000 Cliff swallow 3 3 0.0014 0.0130 0.0000 Passerine 8 7 0.0037 0.0242 0.0000 House finch 14 13 0.0076 0.0408 0.0000 Unknown 10 5 --- --- 0.2000 Hoary bat 4 4 0.0012 0.0101 0.0000 Hawk 150 106 0.0282 0.0580 0.0889 Raptor 314 255 0.0792 0.1062 0.1336 TOTAL 652 573 0.2001 0.2077 0.0906

46
Table 2-3. Bird mortality estimates for the 1,536 wind turbines searched, and mortality extrapolated across the APWRA. We regard the mortality estimates in the left and right columns as the low and high values of the uncertainty range for each species or taxonomic group, and the left and right columns of fatality estimates also represent low and high values of the corresponding uncertainty range.
Mortality (deaths/turbine/year) adjusted for:
Fatalities per year in the APWRA a
adjusted for: Species/Taxonomic group Search detection Search detection
and scavenging Search detection Search detection and scavenging
Golden eagle 0.0051 0.0062 28 34 Turkey vulture 0.0020 0.0024 11 13 Red-tailed hawk 0.0363 0.0438 196 237 Northern harrier 0.0005 0.0006 3 3 Prairie falcon 0.0009 0.0011 5 6 American kestrel 0.0100 0.0251 54 136 Burrowing owl 0.0335 0.0847 181 457 Great horned owl 0.0041 0.0050 22 27 Barn owl 0.0128 0.0155 69 83 California gull 0.0046 0.0110 25 60 Ring-billed gull 0.0076 0.0184 41 99 Black-crowned night heron 0.0011 0.0027 6 14 Mallard 0.0284 0.0686 153 370 Wild turkey 0.0010 0.0024 5 13 Rock dove 0.0764 0.1846 413 997 Mourning dove 0.0061 0.0147 33 80 Northern flicker 0.0024 0.0059 13 32 Common raven 0.0071 0.0171 38 92 Brown-headed cowbird 0.0029 0.0148 16 80 Blackbird 0.0022 0.0053 12 29 Brewer’s blackbird 0.0044 0.0106 24 57 Red-winged blackbird 0.0078 0.0189 42 102 Tricolored blackbird 0.0010 0.0024 5 13 European starling 0.0346 0.0835 187 451 Horned lark 0.0085 0.0206 46 111 Western meadowlark 0.0690 0.1667 373 900 Loggerhead shrike 0.0066 0.0159 36 86 Pacific-slope flycatcher 0.0015 0.0035 8 19 Mountain bluebird 0.0022 0.0053 12 29 Violet-green swallow 0.0005 0.0012 3 6 Cliff swallow 0.0034 0.0082 18 45 Passerine 0.0090 0.0218 49 118 House finch 0.0185 0.0448 100 242 Hoary bat 0.0029 0.0071 16 38 Hawk 0.0361 0.0436 195 236 Raptor 0.1056 0.1547 570 835 TOTAL 0.3464 0.7981 1870 4310
a Mean mortality among strings × 5,400 wind turbines, and assuming that our sample of wind turbines is
representative of the wind turbines across the entire APWRA.

47
Figure 2-7. Frequency distributions of avian mortality for selected species in the APWRA, May 1998 to September 2001.
1.061.00
0.940.88
0.810.75
0.690.63
0.560.50
0.440.38
0.310.25
0.190.13
0.060.00
60
50
40
30
20
10
0
0.450.40
0.350.30
0.250.20
0.150.10
0.050.00
100
80
60
40
20
0
0.350.30
0.250.20
0.150.10
0.050.00
140
120
100
80
60
40
20
0
0.1750.150
0.1250.100
0.0750.050
0.0250.000
180
160
140
120
100
80
60
40
20
0
0.300.250.200.150.100.050.00
150
120
90
60
30
0
All birds Raptors
Red-tailed hawkGolden eagle
Burrowing owlMortality
(Fatalities/turbine/year)
Freq
uenc
y
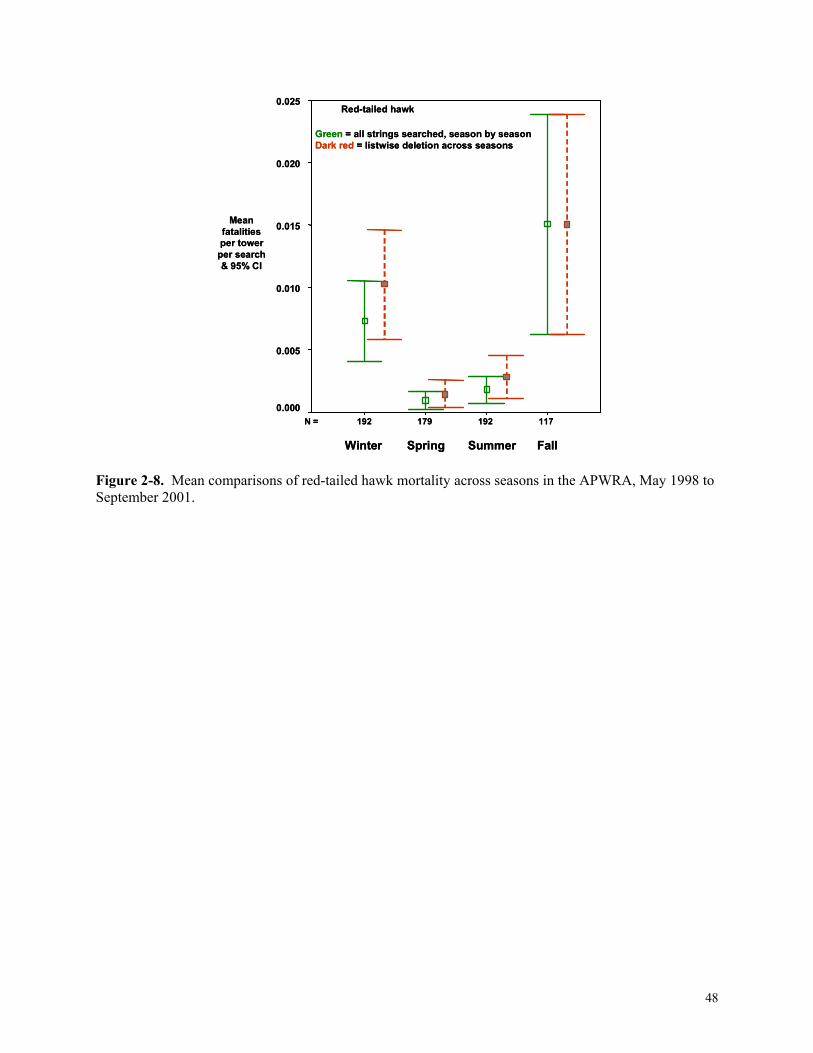
48
Figure 2-8. Mean comparisons of red-tailed hawk mortality across seasons in the APWRA, May 1998 to September 2001.
117192179192N =
0.025
0.020
0.015
0.010
0.005
0.000
FallSummerSpringWinter
Meanfatalitiesper tower
per search& 95% CI
Red-tailed hawk
Green = all strings searched, season by seasonDark red = listwise deletion across seasons
117192179192N =
0.025
0.020
0.015
0.010
0.005
0.000
FallSummerSpringWinter
Meanfatalitiesper tower
per search& 95% CI
Red-tailed hawk
Green = all strings searched, season by seasonDark red = listwise deletion across seasons

49
Figure 2-9. Chi-square test results of mortality associated with season of the year in the APWRA, May 1998 to September 2001.
American kestrel
Barn owl
Burrowing owl
European starling
Great horned owl
Golden eagle
House finch
Horned lark
Mallard
Rock dove
Red-tailed hawk
Western meadowlark
All hawks
All raptors
All nonraptor spp.
All avian species
3.53.02.52.01.51.00.50.0
Observed ÷ Expected Value
Winter
Spring
Summer
Fall
3.57
3.94
14.23**
1.33
5.77
3.66
26.80**
14.01**
2.71
25.89**
50.98**
28.87**
48.76**
46.62**
23.29**
51.42**
χ2
** P < 0.005df = 3
Line of uniform mortality across seasons
American kestrel
Barn owl
Burrowing owl
European starling
Great horned owl
Golden eagle
House finch
Horned lark
Mallard
Rock dove
Red-tailed hawk
Western meadowlark
All hawks
All raptors
All nonraptor spp.
All avian species
3.53.02.52.01.51.00.50.0
Observed ÷ Expected Value
Winter
Spring
Summer
Fall
Winter
Spring
Summer
Fall
3.57
3.94
14.23**
1.33
5.77
3.66
26.80**
14.01**
2.71
25.89**
50.98**
28.87**
48.76**
46.62**
23.29**
51.42**
χ2
** P < 0.005df = 3
Line of uniform mortality across seasons
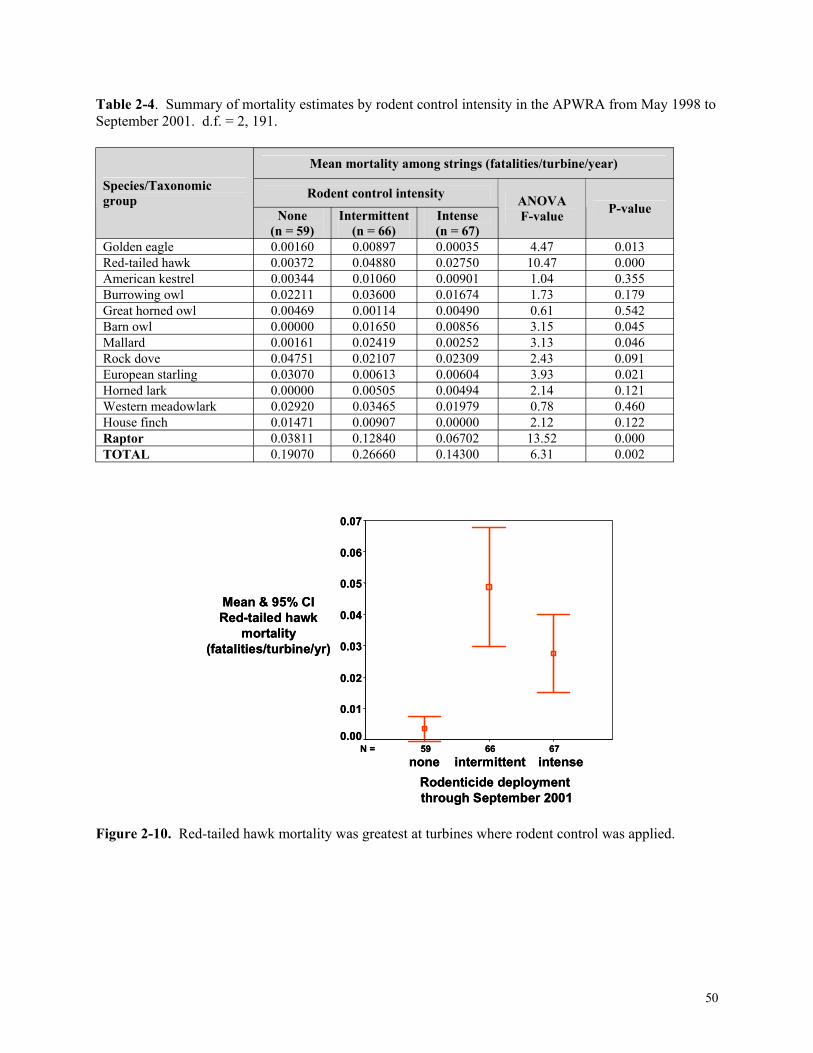
50
Table 2-4. Summary of mortality estimates by rodent control intensity in the APWRA from May 1998 to September 2001. d.f. = 2, 191.
Mean mortality among strings (fatalities/turbine/year)
Rodent control intensity Species/Taxonomic group
None (n = 59)
Intermittent (n = 66)
Intense (n = 67)
ANOVA F-value P-value
Golden eagle 0.00160 0.00897 0.00035 4.47 0.013 Red-tailed hawk 0.00372 0.04880 0.02750 10.47 0.000 American kestrel 0.00344 0.01060 0.00901 1.04 0.355 Burrowing owl 0.02211 0.03600 0.01674 1.73 0.179 Great horned owl 0.00469 0.00114 0.00490 0.61 0.542 Barn owl 0.00000 0.01650 0.00856 3.15 0.045 Mallard 0.00161 0.02419 0.00252 3.13 0.046 Rock dove 0.04751 0.02107 0.02309 2.43 0.091 European starling 0.03070 0.00613 0.00604 3.93 0.021 Horned lark 0.00000 0.00505 0.00494 2.14 0.121 Western meadowlark 0.02920 0.03465 0.01979 0.78 0.460 House finch 0.01471 0.00907 0.00000 2.12 0.122 Raptor 0.03811 0.12840 0.06702 13.52 0.000 TOTAL 0.19070 0.26660 0.14300 6.31 0.002
Figure 2-10. Red-tailed hawk mortality was greatest at turbines where rodent control was applied.
676659N =
Rodenticide deployment through September 2001
intenseintermittentnone
0.07
0.06
0.05
0.04
0.03
0.02
0.01
0.00
Mean & 95% CIRed-tailed hawk
mortality(fatalities/turbine/yr)
676659N =
Rodenticide deployment through September 2001
intenseintermittentnone
0.07
0.06
0.05
0.04
0.03
0.02
0.01
0.00
Mean & 95% CIRed-tailed hawk
mortality(fatalities/turbine/yr)

51
Figure 2-11. Golden eagle mortality was greatest at turbines where rodent control was applied.
Figure 2-12. All hawk mortality was greatest at turbines where rodent control was applied. 2-4 DISCUSSION Whereas we standardized our estimates of mortality by dividing the number of fatalities per turbine by the years spanning the search effort, our estimates of mortality were undoubtedly influenced by differential search efforts expressed as the number of years spanning the search period. For example, if few fatalities happened during a particular year, and we searched a group of wind turbines only during that year, then our mortality estimate from those wind turbines would be less than from other wind turbines and the comparison compromised. This shortfall in our study was beyond our control, since the owners of the wind turbines allowed us access to turbines at different times. However, this shortfall exists and it must be acknowledged. Assuming mortality levels in our study area are representative of the entire APWRA, we estimate that no less than 37,400 birds and as many as 86,200 birds have been killed by wind turbines in the APWRA
676659N =intenseintermittentnone
0.020
0.015
0.010
0.005
0.000
Rodenticide deployment through September 2001
Mean & 95% CIGolden eagle
mortality(fatalities/turbine/yr)
676659N =intenseintermittentnone
0.020
0.015
0.010
0.005
0.000
Rodenticide deployment through September 2001
Mean & 95% CIGolden eagle
mortality(fatalities/turbine/yr)
676659N =
none
0.16
0.12
0.08
0.04
0.00
Mean & 95% CIRaptor mortality
(fatalities/turbine/yr)
intenseintermittent
Rodenticide deployment through September 2001
676659N =
none
0.16
0.12
0.08
0.04
0.00
Mean & 95% CIRaptor mortality
(fatalities/turbine/yr)
intenseintermittent
Rodenticide deployment through September 2001

52
during the past 20 years of operations there. A minimum of 560 golden eagles, and perhaps as many as 680, have been killed during this time. A minimum of 3,920, and possibly as many as 4,740, red-tailed hawks have been killed there during the past 20 years. About 3,620 burrowing owls were probably killed in the APWRA during the past 20 years, and possibly as many as 9,140 were killed. We are unable to assess the risk that wind turbine operations in the APWRA may have had on populations of species. The regional biological significance of bird mortality caused by wind turbines remains unknown, with the possible exception of golden eagles nesting in the immediate vicinity of the APWRA. However, due to typically low recruitment rates, and the relative rarity of many raptor species, it would be prudent to regard the level of raptor mortality in the APWRA as significant.

53
CHAPTER 3: FATALITY LOCATIONS AND PROXIMITY TO TURBINE TOWERS 3-1 INTRODUCTION Our study of mortality and fatality associations at wind turbines relied on finding carcasses and interpreting the condition of each to ascertain the circumstances of the bird’s death as well as what happened to the carcass since death (e.g., whether it was moved by scavengers). We needed to assess the efficiency of our 50-m search radius around each wind turbine, including whether the efficiency varied due to the body size of the bird, wind turbine attributes, season, and physiographic conditions. Understanding search efficiency is important to interpreting our mortality estimates, as well as to designing future fatality monitoring programs at wind farms around the world. This aspect of our study was prompted by our finding carcasses beyond our search radius. Because we detected carcasses located beyond our search radius, we realized that some unknown proportion of the fatalities was not being detected because we were not systematically searching over a much larger area around each wind turbine. Also, we questioned the adequacy of this search radius as the repowering effort drew nearer in the APWRA, when much larger wind turbines on taller towers will be installed. We needed to know whether a greater search radius would be needed as part of the monitoring program post-repowering. 3-2 METHODS We identified each fatality by its associated carcass, or partial carcass, that was obviously independent of other evidence of fatalities in the area. We treated injured birds as fatalities since they were permanently removed from the wild population in nearly every instance. Bird species were represented by typical body length (cm) as reported in National Geographic Society (1987), and were categorized as small (<38 cm) or large (>38 cm), the cutoff based on a natural break in a histogram of body length (Figure 3-1). We intended to factor in the slope of the hills downhill from each of the wind turbines, but we lacked sufficient funding to perform this step. The statistical tests included mostly one-way analysis of variance (ANOVA) and least significant differences (LSD) between groups. All LSD tests reported below were associated with P-values < 0.05. We also estimated Pearson’s correlation coefficient for the distance of the carcasses and elevation of the tower. Scavenging Effects Orloff and Flannery (1992) reported little evidence of raptor carcass removal by scavengers during their research at Altamont. However, not documenting the full effect of scavenging may cause an underestimation of the number of dead birds found during our searches. We left each bird carcass we found in the field. Having recorded its exact location using GPS and flagging, we then visited each carcass location at least every three days, or until the proper authorities collected it. During the time the carcass was in the field, we recorded data on the condition of the carcass, amounts of decomposition over time, and any evidence of scavenging at an interval of once per week. Even though the U.S. Fish and Wildlife Service required immediate reporting of carcasses found, and endeavored to pick up all of these carcasses from the field soon after reporting, carcasses occasionally remained in the field for up to one month before authorized personnel retrieved them. Thus, we conducted a non-systematic scavenging rate evaluation by recording signs of scavenging activity at the time of the finding and occasionally throughout the times that carcasses remained in the field by the U.S. Fish and Wildlife Service.

54
Due to differences in county regulations, at our ENRON study site, carcasses and remains were reported to the supervisor on site, but never picked up from the field. This situation presented us with an opportunity to monitor the scavenging and decomposition rates of those carcasses for longer periods than at other sites. Information about change in carcass condition over time and the period carcasses remained in the field helped us assess the effectiveness of fatality searches in discovering fatalities and how long they remain to be discovered in our study area. We calibrated our estimates of time since death by comparing the decomposition level of a specific fatality since the known time of death (Figure 3-1).
Figure 3-1. Frequency distribution of typical body size of bird species whose carcasses were found at the APWRA, 1998-2001. 3-3 RESULTS Overview of Avian Fatalities in the APWRA We found a total of 688 bird carcasses. Of these, 670 fatalities were caused by collisions with wind turbines or their towers, by predation, or by unknown causes (Figure 3-2; Table 3-1). Another 18 fatalities were caused by electrocution on electrical power distribution poles (Photo 3-1) or collisions with power lines. Broken and severed wings were the most common injuries noted. Decapitations, head injuries, and severe injuries to the torso were common (Figure 3-3; see Photos 3-2 through 3-4). However, many of the carcasses showed signs of multiple injuries; these are not represented in Figure 3-3. Due to their decomposition, the age of the animal could not be estimated for most of the carcasses. Most of those that could be assigned an age category were adults, followed by immature birds (Figure 3-4). Spring was the only season in which the number of carcasses found differed from the other seasons (Figure 3-5). Most were found near Bonus tubular towers (Figure 3-6), and most were estimated to have been killed within 30 days of discovery (Figure 3-7). Most were found in two ranges of elevation: between 115 and 225 m, and between 280 and 350 m (Figure 3-8).
Count among carcasses
122.7118.1
113.5108.8
104.299.6
95.090.4
85.881.2
76.571.9
67.362.7
58.153.5
48.844.2
39.635.0
30.425.8
21.216.5
11.97.3
200
150
100
50
0
Typical adult body length (cm) of species
Count among carcasses
122.7118.1
113.5108.8
104.299.6
95.090.4
85.881.2
76.571.9
67.362.7
58.153.5
48.844.2
39.635.0
30.425.8
21.216.5
11.97.3
200
150
100
50
0
Typical adult body length (cm) of species
Count among carcasses
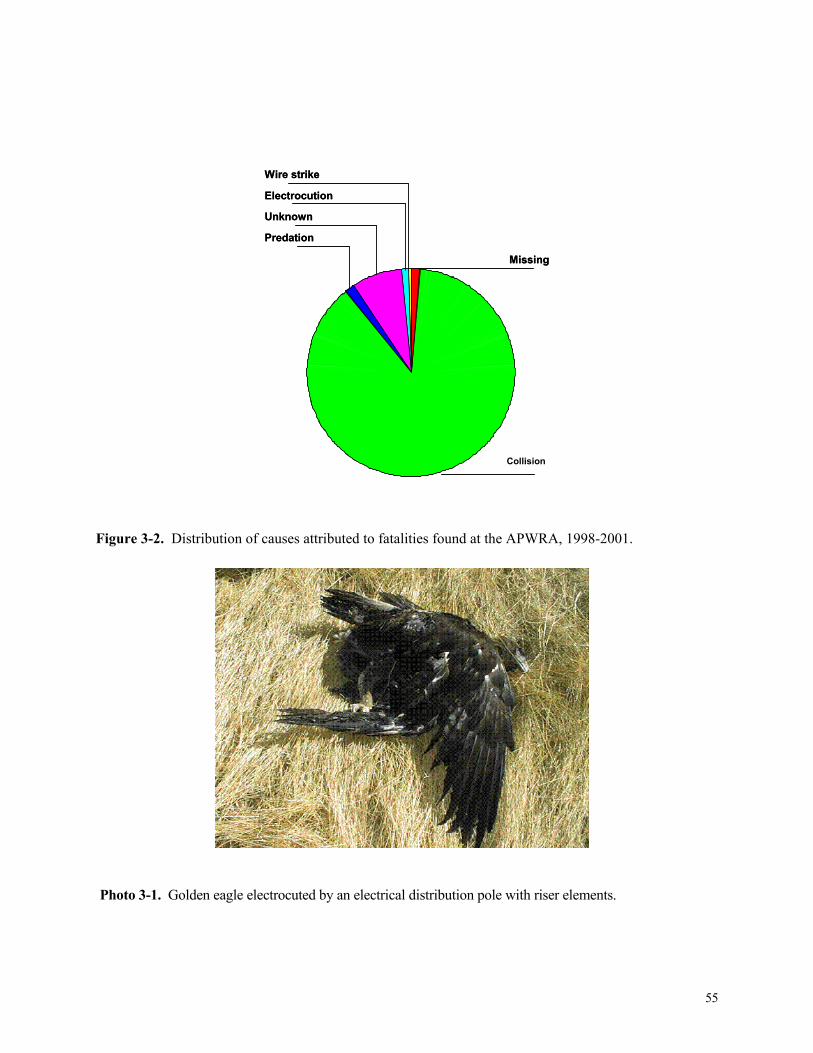
55
Figure 3-2. Distribution of causes attributed to fatalities found at the APWRA, 1998-2001.
Photo 3-1. Golden eagle electrocuted by an electrical distribution pole with riser elements.
Wire strike Electrocution
Unknown Predation
Collision
Missing
Wire strike Electrocution
Unknown Predation
Missing

56
Table 3-1. Summary of 688 fatalities in our study area (predation as cause excluded) from May 1998 to September 2001. Table includes four bat fatalities.
Species/Group Fatalities Wind turbine collision
Electrocution, wire strike Undetermined
Golden eagle 21 18 1 2 Turkey vulture 3 3 Red-tailed hawk 133 125 2 6 Buteo sp. 23 18 5 Northern harrier 2 2 White-tailed kite 1 1 Prairie falcon 2 2 American kestrel 30 28 2 Burrowing owl 64 50 1 9 Barn owl 36 30 2 4 Great Horned owl 12 12 Raptor 5 4 1 Mallard 29 25 3 Laridae sp. (gull) 1 1 California gull 6 5 1 Ring-billed gull 4 4 Black-crowned night heron 2 2 Northern flicker 2 2 Mourning dove 5 3 2 Rock dove 115 111 4 Wild turkey 1 0 1 Pacific slope flycatcher 1 1 Horned lark 12 12 Western meadowlark 73 58 12 Common raven 9 9 Tricolored blackbird 1 1 Brewer’s blackbird 4 3 1 Red-winged blackbird 5 3 2 Brown-headed cowbird 1 1 Blackbird (Icterinae sp.) 1 1 European starling 30 29 1 Loggerhead shrike 4 4 Cliff swallow 3 3 Mountain bluebird 2 1 1 Violet-green swallow 1 1 Townsend’s warbler 1 0 1 Black-throated gray warbler 1 0 1 House finch 15 10 2 Passerine 9 6 3 Unknown 13 12 1 Hoary bat 4 3 1
Total 688 605 9 63

57
Figure 3-3. Frequency of injuries noted for carcasses found at the APWRA, 1998-2001.
Photo 3-2. Decapitated American kestrel under a wind turbine.
no injury apparent
head
neck
decapitated
torso cut or twisted
broken wing
severed wing
torso cut in half
dismembered
tail cut off
leg(s ) cut off
leg broken
75 604530150
Number of cases
Type of injury
no injury apparent
head
neck
decapitated
torso cut or twisted
broken wing
severed wing
torso cut in half
dismembered
tail cut off
leg(s ) cut off
leg broken
75 604530150
Number of cases
Type of injury

58
Photo 3-3. Golden eagle wing under a wind turbine.
Photo 3-4. Red-tailed hawk with wing and leg sheared off, lying near a wind turbine.

59
Figure 3-4. Distribution of age at time of death noted for carcasses found at the APWRA, 1998-2001.
Figure 3-5. Seasonal distribution of carcasses found at the APWRA, 1998-2001 (Note: these numbers are not adjusted by search effort).
WinterFallSummerSpring
220
200
180
160
140
120
100
80
60
Number ofcarcasses
WinterFallSummerSpring
220
200
180
160
140
120
100
80
60
Number ofcarcasses
Subadult
Unknown
Immature
Adult
Missing Subadult
Unknown
Immature
Adult
Missing
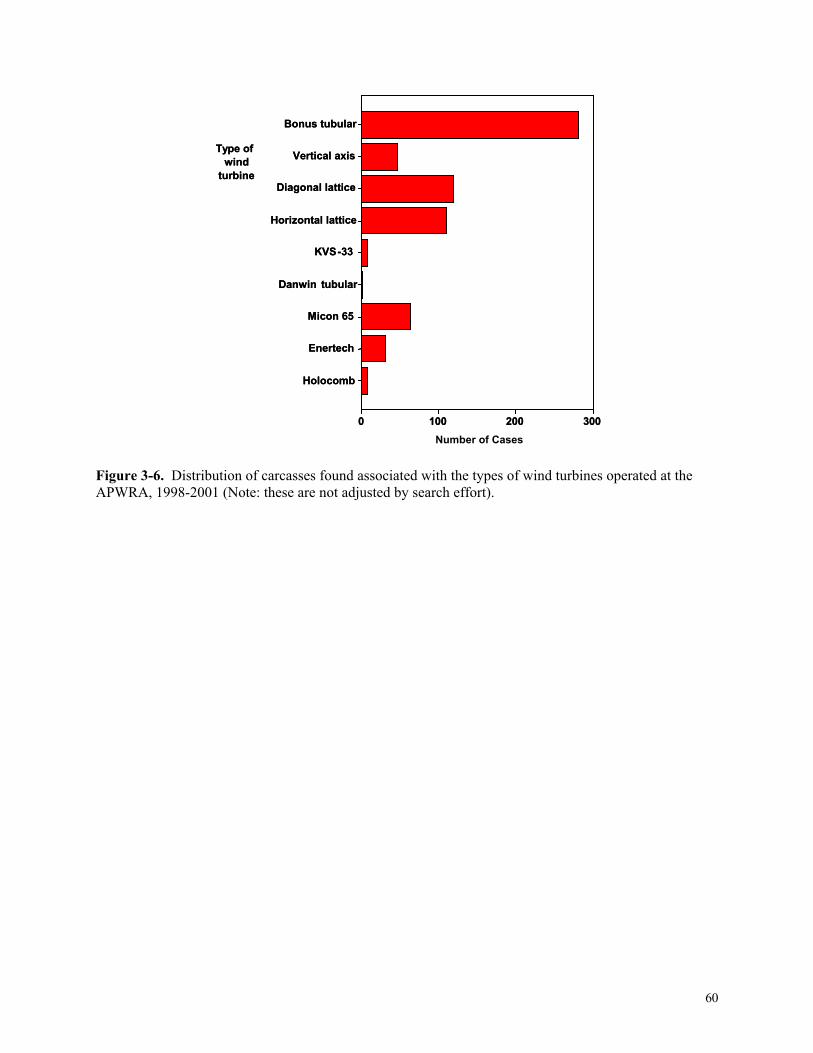
60
Figure 3-6. Distribution of carcasses found associated with the types of wind turbines operated at the APWRA, 1998-2001 (Note: these are not adjusted by search effort).
Bonus tubular
Vertical axis
Diagonal lattice
Horizontal lattice
KVS-33
Danwin tubular
Micon 65
Enertech
Holocomb
300 2001000Number of Cases
Type of wind
turbine
Bonus tubular
Vertical axis
Diagonal lattice
Horizontal lattice
KVS-33
Danwin tubular
Micon 65
Enertech
Holocomb
300 2001000
Type of wind
turbine

61
Figure 3-7. Frequency distribution of estimated days since death of carcasses found at the APWRA, 1998-2001.
0 - 3030 - 6060 - 91
91 - 121121 - 151151 - 181181 - 211211 - 242242 - 272272 - 302302 - 332332 - 363363 - 393393 - 423423 - 453453 - 483483 - 514514 - 544544 - 574574 - 604604 - 634634 - 665665 - 695695 - 725
5004003002001000
Estimated number of days since death
Number of cases
0 - 3030 - 6060 - 91
91 - 121121 - 151151 - 181181 - 211211 - 242242 - 272272 - 302302 - 332332 - 363363 - 393393 - 423423 - 453453 - 483483 - 514514 - 544544 - 574574 - 604604 - 634634 - 665665 - 695695 - 725
5004003002001000
Estimated number of days since death
Number of cases

62
Figure 3-8. Distribution of carcasses by elevation at the APWRA, 1998-2001 (Note: these frequencies are not adjusted by search effort). Distances of Bird Carcasses from Wind Turbines Large-Bodied Birds Our search radius included 84.1% of the carcasses of large-bodied bird species determined to be killed by wind turbines or unknown causes (Figure 3-9A), and of these, 75% were located within 44 m of the tower. The mean and standard deviation of these 270 distances was 32.4 ± 31 m. Most carcasses were found northeast of the tower, and a considerable number were located southwest of the tower (Figure 3-10A). Considering large-bodied bird species, the distance of carcass locations from the wind turbines tended to vary by tower height (ANOVA F = 2.22, d.f. = 3, 243, P = 0.087; fatality at 43-m tower excluded due to n = 1), and post-hoc LSD tests revealed that fatalities were located farther from 30-m towers (mean = 54 m) than from 19-m (mean = 26 m) and 24-m towers (mean = 33 m). A linear regression slope was not significantly different from 0 (Figure 3-11A) and was therefore not useful for predictive purposes. There was no significant difference by tower type, either (ANOVA F = 1.56, d.f. = 7, 268, P = 0.148; fatality at Danwin tower excluded due to n = 1), although LSD tests revealed that fatalities were located farther from vertical-axis towers (mean = 54 m) than diagonal lattice (mean = 26 m), horizontal lattice (mean = 26 m) and Micon-65 towers (mean = 28 m) (also see Figure 3-12A). We found no difference based on rotor speed (ANOVA F = 1.40, d.f. = 6, 259, P = 0.216), although LSD tests revealed that fatalities were located farther from wind turbines that can run at 61 km/hr (mean = 54 m) than at 48 km/hr (mean = 29 m). The distance of the carcass location did not differ significantly by whether the rotor faces upwind or downwind (ANOVA F = 1.80, d.f. = 1, 259, P = 0.182).
50046042038034030026022018014010060
120
100
80
60
40
20
0
Elevation (m above sea level)
Count

63
The distance of carcass locations from the wind turbines differed according to whether the wind turbine was located at the end, at a gap, or in the interior of a string of towers (ANOVA F = 6.30, d.f. = 2, 242, P = 0.002), and post-hoc LSD tests found distances to be 16 m greater on average at end turbines compared to interior turbines. It did not differ by season of the year (ANOVA F = 1.07, d.f. = 3, 269, P = 0. 362). The distance of carcass locations from the wind turbines did not differ according to whether the wind turbine was located in a canyon (ANOVA F = 0.00, d.f. = 1, 269, P = 0.980). It did not differ significantly by the degree to which the location was influenced by declivity winds (ANOVA F = 1.20, d.f. = 15, 265, P = 0.276), although LSD tests found distances from 30-m-tall towers on ridge tops to be 40 to 58 m greater than from most of the other tower heights on the various topographic conditions (Figure 13A). It did not differ by slope grade (ANOVA F = 0.41, d.f. = 3, 184, P = 0.743), and it did not correlate significantly with elevation (rp = -0.03, n = 270, P = 0.611). Small-Bodied Birds Our search radius included 92.5% of the carcasses of small-bodied bird species (Figure 3-9B), of which 75% were located within 32 m of the tower. The mean and standard deviation of these 371 distances was 22.7 ± 18.4 m. Most carcasses were found northeast of the tower, and a considerable number were located southwest (Figure 3-10B), just as the large-bodied bird carcasses had been distributed. Considering small-bodied bird species, the distance of carcass locations from the wind turbines varied significantly by tower height (ANOVA F = 2.97, d.f. = 3, 300, P = 0.032), and the one fatality at the tallest tower was excluded from the analysis but was located farther away (57 m) from the towers than the means of the other tower heights. Post-hoc LSD tests indicated that carcasses were more distant from 30-m-tall towers than from towers that were 24-m tall (mean difference = 8.7 m), 19-m tall (mean difference = 9.6 m), and 14-m tall (mean difference = 14.4 m). A linear regression slope was significant (Figure 3-11B), and indicated that for every meter increase in tower height, average distance of the carcass from the tower increased by nearly a meter. Distance between carcass and tower tended to be significant based on tower type (ANOVA F = 1.99, d.f. = 7, 369, P = 0.055), and post-hoc LSD tests revealed that the mean distance from vertical-axis turbines was significantly different from that of all other wind turbine types except Micon-65 and Holocomb (also see Figure 3-12B). Distance between carcass and tower tended to be significant based on rotor speed of the wind turbine (ANOVA F = 2.089, d.f. = 6, 362, P = 0.054), and post-hoc LSD tests revealed that the mean distance from wind turbines that operate at 61 km/hr was significantly different from those that operate at km/hr of 48 (mean difference = 12.5 m), 50 (mean difference = 10.8 m), 53 (mean difference = 9.6 m), and 64 (mean difference = 7 m). The distance was not related to whether the rotor faces upwind or downwind (ANOVA F = 0.64, d.f. = 1, 334, P = 0.424). Distance between carcass and tower tended to be significant based on whether the wind turbine was located at the end, at a gap, or in the interior of a string of towers (ANOVA F = 2.62, d.f. = 2, 298, P = 0.074), and post-hoc LSD tests revealed that the mean distance from end turbines was 4.7 m greater than from interior turbines. It differed by season of the year (ANOVA F = 5.20, d.f. = 3, 370, P = 0.002); fall was associated with greater distances from the wind turbines compared to spring (mean difference = 11.2 m), summer (mean difference = 6.7 m), and winter (mean difference = 7.5 m). The distance of carcass locations from the wind turbines did not differ according to whether the wind turbine was located in a canyon (ANOVA F = 2.02, d.f. = 1, 369, P = 0.156). It differed significantly by the degree to which the location was influenced by declivity winds (ANOVA F = 1.77, d.f. = 18, 363, P = 0.028), and post-hoc LSD tests found that carcasses averaged 15 to 32 m farther away from 24-m towers on ridgelines than from most other tower heights on various topographic conditions (Figure 3-13B). The distance between carcass and wind turbine tended towards significant differences by slope grade (ANOVA F = 2.20, d.f. = 3, 243, P = 0.089), and post-hoc LSD tests found the average distance to be 10.3 m shorter on 0%-9% slopes

64
than on 10%-19% slopes. It correlated significantly and inversely with elevation, although the correlation coefficient was not large (rp = -0.13, n = 370, P = 0.015). Scavenging Effects Data from the fatality searches indicate that scavenging has little effect on the results, especially for medium- to large-sized birds. For example, three dead barn owls monitored for their duration of detectability remained visible in the field for 90, 120, and 150 days. For 17 freshly killed red-tailed hawks monitored for detectability, each remained visible for at least 180 days, with five visible for at least 360 days. The effects of scavenging on small birds were not determined.
Figure 3-9. Frequency distribution of distance (meters) between carcasses and wind towers of large-bodied bird species (A) and small-bodied species (B).
Distance (m) from the tower
220200180160140120100806040200
70
60
50
40
30
20
10
0
Large-bodied bird carcasses
Search radius
Normal curve
A
B
140120100806040200
90
80
70
60
50
40
30
20
100
Small-bodied bird carcasses
Count
Count
Distance (m) from the tower
220200180160140120100806040200
70
60
50
40
30
20
10
0
Large-bodied bird carcasses
Search radius
Normal curve
A
B
140120100806040200
90
80
70
60
50
40
30
20
100
Small-bodied bird carcasses
Count
Count

65
Figure 3-10. Frequency distribution of bearing (degrees, magnetic north) from wind towers to carcasses of large-bodied bird species (A) and small-bodied species (B).
360340
320300
280260
240220
200180
160140
120100
8060
4020
0
45
40
35
30
25
20
15
10
5
0
360340
320300
280260
240220
200180
160140
120100
8060
4020
0
45
40
35
30
25
20
15
10
5
0
Bearing (Magnetic North)
Large-bodied bird carcasses
Small-bodied bird carcasses
A
B
Count
Count
360340
320300
280260
240220
200180
160140
120100
8060
4020
0
45
40
35
30
25
20
15
10
5
0
360340
320300
280260
240220
200180
160140
120100
8060
4020
0
45
40
35
30
25
20
15
10
5
0
Bearing (Magnetic North)
Large-bodied bird carcasses
Small-bodied bird carcasses
A
B
Count
Count

66
Figure 3-11. Relationship between distance of carcass from wind towers and tower height for large-bodied bird species (A) and small-bodied species (B).
45 4035302520151050
150
125
100
75
50
25
0
Small-bodied birds
Y = 2.41 + 0.87 Xr2 = 0.03RMSE = 18.3P = 0.003
Distance (m) from the tower
Tower height (m)
50 40302010
240
180
120
60
0
Large-bodied birds
Y = 7.17 + 1.10 Xr2 = 0.01RMSE = 32.1P = 0.102
Distance (m) from the tower
A
B
45 4035302520151050
150
125
100
75
50
25
0
Small-bodied birds
Y = 2.41 + 0.87 Xr2 = 0.03RMSE = 18.3P = 0.003
Distance (m) from the tower
Tower height (m)
50 40302010
240
180
120
60
0
Large-bodied birds
Y = 7.17 + 1.10 Xr2 = 0.01RMSE = 32.1P = 0.102
Distance (m) from the tower
A
B

67
Figure 3-12. Relationship between distance of carcass from wind towers and tower height for large-bodied bird species (A) and small-bodied species (B).
Holocom
Enertech
Micon 65
KVS-33
Horizontal lattice
Diagonal lattice
Vertical axis
Bonus tubular
40
30
20
10
0
Small-bodied bird species
Holocom
Enertech
Micon 65
KVS-33
Horizontal lattice
Diagonal lattice
Vertical axis
Bonus tubular
60
50
40
30
20
10
0
Mean distance (m) from carcass
to turbine
Large-bodied bird speciesA
B
Mean distance (m) from carcass
to turbine
Boundary of search radius
Holocom
Enertech
Micon 65
KVS-33
Horizontal lattice
Diagonal lattice
Vertical axis
Bonus tubular
40
30
20
10
0
Small-bodied bird species
Holocom
Enertech
Micon 65
KVS-33
Horizontal lattice
Diagonal lattice
Vertical axis
Bonus tubular
60
50
40
30
20
10
0
Mean distance (m) from carcass
to turbine
Large-bodied bird speciesA
B
Mean distance (m) from carcass
to turbine
Boundary of search radius

68
Figure 3-13. Relationship between distance of carcass from wind towers and tower height coupled with topographic conditions relevant to degrees of declivity winds for large-bodied bird species (A) and small-bodied species (B). 3-4 DISCUSSION Tables 3-2 and 3-3 summarize the results of our analysis. We found birds beyond the 50-m search radius because the field biologists could sometimes see carcasses at these greater distances when they approached the 50-m termini of their transect segments. It appears that either larger-bodied bird carcasses were more readily seen at distances beyond the search radius or the majority of small-bodied birds truly fell within the
30 m, ridge
30 m, slope
24 m, peak
24 m, ridge crest
24 m, swale
24 m, ridgeline
24 m, slope
24 m, plateau
21 m, slope
19 m, ridge crest
19 m, swale
19 m, ridgeline
19 m, ravine
19 m, slope
19 m, plateau
14 m, slope
80
70
60
50
40
30
20
10
0
30 m, ridge c
30 m, swale
30 m, ridgeline
30 m, slope
24 m, ridge crest
24 m, swale
24 m, ridgeline
24 m, slope
24 m, plateau
21 m, ravine
21 m, slope
21 m, plateau
19 m, ridge crest
19 m, ridgeline
19 m, ravine
19 m, slope
19 m, plateau
14 m, ridge crest
14 m, slope
50
40
30
20
10
0
Meandistance (m)of carcassfrom tower
Meandistance (m)of carcassfrom tower
A
BSmall-bodied bird species
Large-bodied bird species
Boundary of search radius

69
50-m search radius. Tower height appears not to have played a role in how far the carcasses traveled prior to our discovery of them on the ground. However, we did not yet factor in the slope of the hills downhill from where the towers are located. Although the position of the wind turbine in the string influenced the distance of carcass from the tower, the effect should be expected simply because there is greater opportunity for carcasses to occur farther from the end tower. That is, if an interior turbine kills a bird, it is likely to fall to either side and to be associated with the neighbor tower, whereas the end tower only has one neighbor for such a mistaken association to be made. Still, the percentage of carcasses of large-bodied bird species found within 50 m of end turbines was 77, which was 7% fewer than all the towers considered together and 13% fewer than the interior turbines alone. The mean and standard deviation of these 89 distances was 41 ± 40 m, which was 8 m greater than the mean including all the wind turbines and 15 m greater than the mean distance from interior turbines. A greater search effort is needed for large-bodied bird species at end turbines; 100 m would include 93% of the carcasses we found. Vertical-axis towers and wind turbines with faster rotations knocked small-bodied bird species farther away from the towers, as did taller towers. Furthermore, taller towers on certain topographic features tended to knock birds farther away, such as 30-m-tall towers on ridge crests and 24-m-tall towers on ridgelines. The declivity winds may have facilitated these greater distances in these situations. This latter result, and that of end towers, suggests that another variable should be quantified for use in this analysis. The slope of the hills to each side of the wind turbines should be characterized, and linked to the locations of the fatalities so that measured distances from wind turbines can also be transformed into horizontal, planar distances by accounting for the degree of slope between the carcass and the tower. Many of the wind turbines at the ends of strings are located on precipices of very steep hills descending into ravines and canyons; they occur at the break of convex slopes. Birds can fall down these steep slopes resulting in greater measured distances from the wind turbine. This potential effect needs to be considered in the future.

70
Table 3-2. Summary of results related to distances of carcasses of large-bodied bird species from wind turbines.
Variable P-value Explanation or post-hoc LSD test results
Tower height 0.087 21 m farther from 30-m towers than 24-m towers
Tower type 0.148 26 m farther from vertical-axis than from other towers
Rotor speed 0.216 25 m farther from 61 rpm than from 48 rpm
Facing direction 0.182 None
Position in string 0.002 16 m farther from end towers than from interior
Season 0.362 None
Located in canyon 0.980 None
Declivity winds 0.276 40 m farther from 30-m towers than from 24-m towers on ridge crests; 58 m farther than from 30-m towers on slopes
Slope grade 0.743 None
Elevation 0.611 None
Table 3-3. Summary of results related to distances of carcasses of small-bodied bird species from wind turbines.
Variable P-value Explanation or post-hoc LSD test results
Tower height 0.032 14 m farther from 30-m towers than from 14-m towers
Tower type 0.055 7 m farther from vertical-axis than from other towers
Rotor speed 0.054 12.5 m farther from 61 rpm than from 48 km/hr
Facing direction 0.424 None
Position in string 0.074 4.7 m farther from end towers than from interior
Season 0.002 11.2 m farther during fall than during spring
Located in canyon 0.156 None
Declivity winds 0.028 21 m farther from 30-m towers on swales than from 24-m towers; 15 m farther from 24-m towers on ridgelines than from ridge crests
Slope grade 0.089 10.3 m closer on 0%-9% slopes
Elevation 0.015 Distance decreased with greater elevation

71
CHAPTER 4: DISTRIBUTION AND ABUNDANCE OF FOSSORIAL ANIMAL BURROWS
4-1 INTRODUCTION Many have considered ground squirrels to be the principal prey species of raptors in the APWRA, and the principal attraction of raptors to the vicinity of wind turbines (Hunt and Culp 1997, Alameda County 1998, Curry and Kerlinger 2000, Hunt 2002). However, given the numbers of raptors killed south of Altamont Pass Road, where intense rodent control had nearly completely eradicated ground squirrels by 1999, we suspected that ground squirrels might not be the species of principal interest to raptors. Also, previous experience led us to believe that pocket gophers are important prey of raptors, and that gopher burrow systems serve as habitat for various other prey species of raptors. Pocket gophers appeared abundant in the APWRA on both sides of Altamont Pass Road, whereas ground squirrels appeared abundant only on the north side and where rodent control had not been applied on the south side. Furthermore, pocket gopher burrow systems typically occurred near the wind turbines (Photo 4-1), whereas ground squirrel burrow systems were often located farther away (Photos 4-2 and 4-3). Therefore, it occurred to us that raptors coming in close to operating wind turbines might not be approaching to hunt ground squirrels, but rather pocket gophers and other species that associate with pocket gopher burrow systems.
Photo 4-1. Pocket gopher burrow systems (see the light-colored mounds) typically occurred near wind turbines, such as along the cuts made into hillsides for turbine laydown areas and access roads.

72
Photo 4-2. Ground squirrel burrow systems typically occurred on slopes below wind turbines located on ridge crests, such as seen in this photo.
Photo 4-3. Ground squirrel burrow systems typically occurred on slopes below wind turbines located on ridge crests, such as to the lower left-center area in this photo.

73
Raptors spend a disproportionately large fraction of their flight time directly over pocket gopher burrow systems, where K. S. Smallwood (unpubl. data) has observed raptors capturing pocket gophers, voles, snakes, and black-tailed jackrabbits. Therefore, we decided to map the locations of pocket gopher and ground squirrel burrows in and around selected strings of wind turbines. Our objectives for this activity were to (1) relate ground squirrel and pocket gopher distribution and abundance to the levels of rodent control intensity applied in the APWRA; (2) relate the distribution and abundance of these species to physiographic conditions, relevant turbine attributes, and season; and (3) compare the activities and mortality of raptorial birds to the densities and degree of contagion of burrow systems actively used by potential prey species around individual turbines and around turbine strings. The rodent control applied in the APWRA has consisted of dispensing onto the ground rolled oats treated with 0.01% chlorophacinone, an anticoagulant. A truck was driven back and forth across treatment areas, and a dispenser would broadcast the bait onto the ground. Two teenage boys would walk over treated areas two weeks later to pick up dead animals lying on the ground. According to J. Smith of Alameda County and J. Stewart of Green Ridge Services, a consultant to Green Ridge Services reportedly maintained a database on the number of ground squirrels picked up. We were unable to obtain these data despite several requests. 4-2 METHODS We mapped rodent burrows near 571 wind turbines composing 70 strings of wind turbines in the APWRA. Most wind turbine strings were selected arbitrarily to represent a wide range of raptor mortality recorded by our fatality searches, as well as to represent a variety of physiographic conditions. Our sampling scheme was intended to establish on a trial basis whether the distribution of rodent burrow systems around wind turbines might relate to intensity of use, behaviors, and mortality of raptors. We mapped the approximate centers of pocket gopher, ground squirrel, and desert cottontail (Sylvilagus auduboni) burrow systems using a Trimble Pathfinder Pro-XR GPS with an error rate of less than 0.5 m. We located burrow systems based on freshly excavated soil or scats at the burrow entrance, which indicated the burrows were occupied. Although we easily recognized the boundaries of most individual pocket gopher and ground squirrel burrow systems, a pacing method (Smallwood and Erickson 1995) was used to separate burrows when continuity of sign rendered interburrow system distinctions difficult. We mapped burrows used by desert cottontails, kangaroo rats (Dipodomys spp.), burrowing owls, and mammalian carnivores as we encountered them. The presence of scat at each burrow entrance helped identify the species that made or occupied the burrow. Our search for burrows began in the string of wind turbines. A 15-m-wide strip transect was walked from 15 m beyond the wind turbine at one end of the string to 15 m beyond the wind turbine at the other end. Then, perimeter transects were walked at 15, 30, 45, 60, 75, and 90 m away from the turbine string, thus covering increasingly larger areas around the turbine strings. These 15-m intervals correspond with the distance across the largest burrow systems of male pocket gophers (Smallwood and Erickson 1995). A laser rangefinder was used to maintain the intended distances away from the turbines while searching along perimeter transects. The degree of clustering at wind turbines was estimated in two ways. In one, we estimated densities of gopher and ground squirrel burrow systems within each of the corresponding areas searched. Using least squares linear regression, densities of burrow systems were then regressed on the corresponding search areas and the steepness of the regression slope was used as an indicator of contagion relative to the location of each string of wind turbines. Steeper inverse slopes indicated greater degrees of clustering at the wind turbines. The other indicator of clustering near wind turbines was the observed divided by expected number of burrow systems within the 15-m zone of wind turbines, where the expected value was

74
N burrows within 90 m multiplied by the ratio of the area in the 15-m zone to the area in the entire 90-m zone. Larger ratios of observed-to-expected number of burrow systems indicated greater degrees of clustering within 15 m of the wind turbine. Also, we estimated the density of burrow systems within 90 m of each string of wind turbines and compared these data to physiographic conditions, rodent control intensity, and other factors. Rodent control intensity was rated ‘0’ for ownerships where no rodent control was performed, including the areas where Seawest operated its wind turbines. It was rated ‘1’ for intermittent control on the Elworthy Ranch because the Alameda County Agricultural agent who dispensed rodenticide was not allowed to operate there and considered Elworthy’s efforts as less effective than on the properties where the County agent was allowed to operate. Ownerships were rated ‘2’ where the County agent was allowed to dispense chlorophacinone-treated oats, as well as on the Mulqueeney Ranch, where the County agent was not allowed to dispense bait but where he thought the effectiveness of the rodent control was very high. An edge index was measured from the string transect while viewing the 40-m radius from the turbine:
0 = no vertical or lateral edge within 40 m of the wind turbine 1 = some lateral edge such as the presence of a dirt road other than just the service road found at all of the wind turbines (Photo 4-4), or cleared area adjacent to vegetated area, or area tilled for pipeline, etc. 2 = lots of lateral edge 3 = some vertical edge such as road cut, road embankment, or cut into the hillside for creating a flat laydown area for the tower pad 4 = lots of vertical edge, covering half or more of the area within 40 m of the wind turbine. This index was related to burrow distributions to test whether burrowing animal species associate with vertical and lateral edge, as has often been suggested in the literature.

75
Photo 4-4. All wind turbines included access roads, but those in the foreground also were near a fire break. 4-3 RESULTS Pocket gopher density consistently decreased as larger areas were searched around each string of wind turbines (Figure 4-1A). Nearly all turbine strings demonstrated a relationship between gopher burrow density and study area size that was similar to the pattern reported by Smallwood and Morrison (1999). Similarly, most of the observed divided by expected number of gopher burrow systems within 15 m of the wind turbines was greater than 1 (Figure 4-1B), meaning gophers were almost always clustered to some degree around the wind turbines. The slope of log pocket gopher density regressed on log hectares, as an index of clustering near wind turbines, differed significantly based on whether rodent control was applied in the area (ANOVA F = 4.92, d.f. = 2, 65, P = 0.010) (Figure 4-2). Based on post-hoc LSD tests, it was significantly less on areas without rodent control (mean slope, b = -0.219) relative to rodent control that was intermittent (mean slope, b = -0.509) or intense (mean slope, b = -0.472). Because this index of clustering related precisely to the observed divided by expected number of burrow systems within 15 m of the wind turbines (Figure 4-3), and because the latter index enabled the inclusion of wind turbine strings with no pocket gophers within 90 m of the wind turbines, we opted to use the latter index throughout the remainder of this analysis.

76
Figure 4-1. Frequency distributions of the degree of clustering of pocket gopher burrow systems at wind turbines represented by (A) the slope of log density regressed on log search area, and (B) the observed ÷ expected number of burrow systems within 15 m of the wind turbines.
0.190.06-0.06-0.19-0.31-0.44-0.56-0.69-0.81-0.94
10
8
6
4
2
0
Slope of log gopher burrow system densityregressed on log hectares used to estimate density
Frequencyof cases
Mean = -0.47N = 6680% < -0.256% > 0
Observed ÷ Expected number of gopher burrow systems within 15 m of wind turbines
17161514131211109876543210
16
14
12
10
8
6
4
2
0
Frequencyof cases
Mean = 2.81N = 6954% > 226% < 1
A
B

77
Figure 4-2. The degree of clustering of pocket gopher burrow systems within 90 m of wind turbines related to the level of rodent control applied in the area. The degree of clustering in this case was represented by the steepness of negative slopes of log density regressed on log search area.
Figure 4-3. Relationship between two methods of characterizing the degree of clustering of burrow systems at wind turbines. Seasonal and Interannual Variation in Distribution and Abundance Eleven strings of wind turbines were selected for seasonal monitoring purposes, 10 of which were located where rodenticide was applied intermittently and one of which was located where rodenticide was applied intensively.
213213N =
0
- 0.1
- 0.2
- 0.3
- 0.4
- 0.5
- 0.6
- 0.7
Rodenticide Deployment through September 2001
IntenseIntermittentNone
Slope of log gopher
burrow density regressed on log hectares
213213N =
0
- 0.1
- 0.2
- 0.3
- 0.4
- 0.5
- 0.6
- 0.7
Rodenticide
IntenseIntermittentNone
Slope of log gopher
burrow density regressed on log hectares
Observed÷
Expectednumber of
gopher burrowswithin 15 m
of wind turbines
0.40.20-0.2-0.4-0.6-0.8-1.0
10
9
8
7
6
5
4
3
2
10
Slope of log density regressed on log ha
Observed÷
Expectednumber of
gopher burrowswithin 15 m
of wind turbines
0.40.20-0.2-0.4-0.6-0.8-1.0
10
9
8
7
6
5
4
3
2
10
Slope of log density regressed on log ha

78
The observed-to-expected ratio of pocket gopher burrow systems within 15 m of wind turbines differed significantly by season (ANOVA F = 6.83, d.f. = 3, 42, P < 0.001), and according to post-hoc LSD tests this ratio was significantly less during winter when it averaged slightly greater than zero (Figure 4-4A). Pocket gopher clustering at wind turbines did not differ significantly between spring, summer and fall. The observed-to-expected ratio of ground squirrel burrow systems within 15 m of wind turbines also differed significantly by season (ANOVA F = 4.57, d.f. = 3, 42, P < 0.010), and according to post-hoc LSD tests this ratio was significantly greater during summer when it averaged 0.90 (Figure 4-4B). Ground squirrel avoidance of wind turbines did not differ significantly between winter, spring, and fall. Ground squirrels appeared to avoid locating burrow systems within 15 m of turbines during all seasons. The density of pocket gopher burrow systems out to 90 m from wind turbines did not differ significantly among dates between summer 1999 and fall 2001 (ANOVA F = 2.00, d.f. = 4, 41, P = 0.114). However, during this time period the density of ground squirrel burrow systems out to 90 m from wind turbines increased by 0.687 burrow systems per ha per season (linear regression, ANOVA F = 6.74, d.f. = 1, 41, P < 0.050). Figure 4-5 illustrates the difference in trends between pocket gopher and ground squirrel burrow system density out to 90 m from wind turbines.
Figure 4-4. Seasonal pattern of the degree of clustering of burrow systems at wind turbines for (A) pocket gopher and (B) ground squirrel.
11111110N =Winter2002
Fall2001
Summer2001
Spring2001
6
5
4
3
2
1
0
11111110N =
6
5
4
3
2
1
0
Winter2002
Fall2001
Summer2001
Spring2001
Pocket gopher
Ground squirrel
Mean & 95% CIObserved
÷Expected
number of burrow
systemswithin 15 m
of windturbines
Mean & 95% CIObserved
÷Expected
number of burrow
systemswithin 15 m
of windturbines
B
Line ofuniformity
Line ofuniformity
A

79
Figure 4-5. Trends through the study in density of burrow systems out to 90 m from wind turbines for (A) pocket gophers and (B) ground squirrels. Associations with Wind Turbine String Attributes and Range Management Ground squirrels did not cluster around the wind turbines (Figure 4-6A), which means they did not cluster around the access roads and cuts into the hillsides made for wind turbine laydown areas. Also, where rodent control was practiced, squirrels tended to avoid the area within 15 m of wind turbines (ANOVA F = 2.42, d.f. = 2, 68, P = 0.097). The degree of ground squirrel clustering at wind turbines correlated inversely with increasing elevation (rp = -0.32, n = 69, P < 0.001), which also corresponds with the areas experiencing rodent control. It also correlated positively with the mean number of cattle pats per wind turbine along the string of wind turbines (rp = 0.34, n = 69, P < 0.001). Pocket gophers, on the other hand, usually clustered at wind turbines (Figure 4-6A), and the degree of clustering was significantly greater where rodent control was practiced (ANOVA F = 7.21, d.f. = 2, 68, P
11111082N =
10
8
6
4
2
0
11111082N =Fall2001
Summer2001
Spring2001
Summer2000
Fall1999
6
5
4
3
2
1
0
Fall2001
Summer2001
Spring2001
Summer2000
Fall1999
Mean & 95% CIDensity of
burrow systemsout to 90 m from
wind turbines
Mean & 95% CIDensity of
burrow systemsout to 90 m from
wind turbines
Pocket gopher
Ground squirrel
A
B
80
= 0.001). Gophers did not cluster at wind turbines where rodent control was not practiced, but occurred within 15 m of wind turbines nearly 4 times the expected number where intermittent control was applied, and nearly 3 times the expected number where intense control was used (LSD tests were significant). The density of ground squirrel burrow systems within 90 m of wind turbines differed significantly among areas with no rodent control, intermittent control, and intense control (ANOVA F = 15.11, d.f. = 2, 68, P < 0.001). Pairwise LSD post-hoc tests indicated ground squirrel burrow system density out to 90 m was greatest where rodentecide was not deployed, and least where rodenticide was most intensely deployed (Figure 4-6B). Ground squirrel burrow system density in the intense rodent control areas averaged only 13% of the average density where no rodent control was applied. Ground squirrel burrow system density adjusted by the mean per rodent control intensity did not relate significantly to any other variables we measured on physiographic conditions or turbine types. The density of pocket gopher burrow systems within 90 m of wind turbines differed significantly among areas of different intensities of rodent control (ANOVA F = 5.36, d.f. = 2, 68, P < 0.01). Pairwise LSD post-hoc tests indicated pocket gopher density out to 90 m was significantly greater in the areas of intermittent rodent control than in the areas of no control (Figure 4-6B). Pocket gopher density in the intermittently controlled area was nearly twice that found on the areas with no rodent control. Gopher burrow system density adjusted by the mean per rodent control intensity did not relate significantly to any other variables we measured on physiographic conditions or types of wind turbine. The density of desert cottontail burrows within 90 m of wind turbines (Figure 4-7A) was much less than within 15 m of wind turbines (Figure 4-7B), and differed by rodent control intensity. Cottontail burrow density within 15 m was greatest where rodent control was most intensively applied (ANOVA F = 8.92, d.f. = 2, 68, P < 0.001), and within 90 m the difference tended towards significance (ANOVA F = 3.03, d.f. = 2, 68, P = 0.055). The degree of clustering of cottontail burrow systems at wind turbines was significantly greater in the areas of no rodent control and in those of intense rodent control (ANOVA F = 5.08, d.f. = 2, 68, P < 0.01) (Figure 4-8). In the rodent control areas, pocket gopher clustering at wind turbines varied significantly by slope aspect (ANOVA F = 5.64, d.f. = 5, 53, P < 0.001), with the greatest degrees of clustering on west and southwest-facing slopes, followed by northwest-facing slopes (Table 4-1). Pocket gopher clustering at wind turbines did not vary significantly by slope aspect in the areas where rodents were not controlled (ANOVA F = 0.62, d.f. = 3, 14, P = 0.620). The degree of pocket gopher clustering at wind turbines did not vary significantly with physical relief, where relief was categorized as plateaus, slopes, and ridges (ANOVA F = 0.74, d.f. = 2, 68, P = 0.479). It also did not vary significantly with relief within the areas of rodent control (ANOVA F = 0.07, d.f. = 2, 53, P = 0. 929). The degree of pocket gopher clustering at wind turbines correlated positively with the average change in elevation per wind turbine in the string of wind turbines (rp = 0.27, n = 69, P < 0.05), and with the percentage of the string in a canyon (rp = 0.36, n = 69, P < 0.001). It did not correlate significantly with the average edge index in the string. It correlated positively with the average number of cattle pats per wind turbine along the turbine string (rp = 0.51, n = 69, P < 0.001) and 20-40 m away (rp = 0.49, n = 69, P < 0.001), but negatively with the index of the abundance of cottontail fecal pellets along the turbine string (rp = -0.32, n = 69, P < 0.001) and 20-40 m away (rp = -0.32, n = 69, P < 0.001).

81
Figure 4-6. Responses of the degree of clustering at wind turbines (A) and the density within 90 m of wind turbines (B) of pocket gopher and ground squirrel burrow systems to levels of rodent control.
213315N =
Rodenticide Deployment through September 2001
IntenseIntermittentNone
Mean & 95% CIObserved
÷ Expected number of burrows
within 15 m of wind turbines
Pocket gopher
Line ofuniform distribution
5
4
3
2
1
0
Ground squirrel
A
213315N =IntenseIntermittentNone
14
12
10
8
6
4
2
0
Rodenticide Deployment through September 2001
Pocket gopherGround squirrel
Density (burrows/ha) within 90 m
of wind turbines
B
213315N =IntenseIntermittentNone
Mean & 95% CIObserved
÷ Expected number of burrows
within 15 m of wind turbines
Pocket gopher
Line ofuniform distribution
5
4
3
2
1
0
Ground squirrel
A
213315N =IntenseIntermittentNone
14
12
10
8
6
4
2
0
Pocket gopherGround squirrel
Density (burrows/ha) within 90 m
of wind turbines
B

82
Figure 4-7. Responses of desert cottontail burrow system density out to 15 m (A) and 90 m (B) from wind turbines due to levels of rodent control.
213315N =IntenseIntermittentNone
5
4
3
2
1
0
213315N =IntenseIntermittentNone
1.11.0
0.90.80.70.6
0.50.40.30.2
0.10.0
Mean & 95% CI Density of
desert cottontail burrow systems out to 15 m from
wind turbines
Mean & 95% CI Density of
desert cottontail burrow systems out to 90 m from
wind turbines
Rodenticide Deployment through September 2001
A
B
213315N =IntenseIntermittentNone
5
4
3
2
1
0
213315N =IntenseIntermittentNone
1.11.0
0.90.80.70.6
0.50.40.30.2
0.10.0
Mean & 95% CI Density of
desert cottontail burrow systems out to 15 m from
wind turbines
Mean & 95% CI Density of
desert cottontail burrow systems out to 90 m from
wind turbines
A
B

83
Figure 4-8. Response of the degree of clustering of desert cottontail burrow system at wind turbines due to levels of rodent control. Table 4-1. Mean comparison (ANOVA) of observed ÷ expected number of gopher burrow systems in areas treated with rodenticide.
Aspect N Mean SD LSD test, P < 0.05
Flat 10 2.48 2.04
Over hill or ridge 10 3.44 1.88
East, Northeast 12 1.60 1.40
Southeast, South 6 3.82 2.10
Southwest, West 2 10.27 9.87 > all other aspects
Northwest, North 14 4.27 1.97 >East Northeast
4-4 DISCUSSION Our study refutes several hypotheses and conclusions about the relationships between wind turbines, range management practices, and rodent distribution and abundance. For example, ground squirrel distribution appears to have not been extended by the wind turbine access roads or disturbed soils related to the wind farm at the Altamont Pass, as had been suggested by Colson (1995) and Morrison (1996). In fact, ground squirrels appear to avoid the 15-m zone around the wind turbines, which is where the access roads and soil disturbances principally exist. Pocket gophers, however, were attracted to this zone where soils were disturbed, and this species typically existed there 2 to 4 times more often than expected by a uniform distribution of gopher burrow systems within the entire search area.
213315N =IntenseIntermittentNone
7
6
5
4
3
2
1
0
Rodenticide Deployment through September 2001
Mean & 95% CI Observed
÷ Expected
number of desert cottontail burrow systems
within 15 m of wind turbines
213315N =IntenseIntermittentNone
7
6
5
4
3
2
1
0
Rodenticide
Mean & 95% CI Observed
÷ Expected
number of desert cottontail burrow systems
within 15 m of wind turbines

84
Hunt’s (2002) conclusion that ground squirrel control has reduced the abundance of ground squirrels where control was applied appears to be true, but with an interesting twist. On the Mulqueeney Ranch and where the County Agriculture Department has been funded by the wind industry to control ground squirrels, almost no ground squirrel burrow systems remain, so Hunt was correct in his conclusion on these properties versus properties where no or intermittent control was applied. However, on the Elworthy Ranch, ground squirrel abundance increased from 1999 through 2001 despite relatively intense applications of chlorophacinone by the rancher. Each year we witnessed the applications of the poison bait on this ranch, and we observed high mortality of ground squirrels and desert cottontails, whose carcasses lay upon the ground or in rock piles and were scavenged by raptors. We smelled decaying flesh everywhere we went on this ranch during the two weeks following the poison bait applications, and much of the smell emanated from the burrows in which most of the ground squirrels died. However, despite our observations of widespread mortality of squirrels due to control applied on this ranch, ground squirrel burrow system density increased from 1999 through 2001. It is likely that subadult ground squirrels quickly immigrated from surrounding areas or from unaffected colonies on the Elworthy Ranch, and occupied abandoned burrow systems. During an interview on October 14, 2002 with Jim Smith, who dispenses the rodenticide for the Alameda County Agriculture Department, we were informed that he avoids the areas immediately around the wind turbines because he feels that the near vicinity to the wind turbines is not within his jurisdiction. Smith’s statement contradicted the fact that the wind industry funded his control efforts, but it was further contradicted by the avoidance of this zone by ground squirrels in locating their burrow systems. Had Smith avoided this zone as he claimed, we would have expected more ground squirrel burrow systems to exist there, but we found the opposite to be true. On the other hand, it is possible that the more intense human activity nearby the wind turbines discouraged ground squirrels from being there. Rodent control, as practiced on Elworthy Ranch, associated with an increased density of pocket gopher burrow systems out to 90 m and increased degrees of clustering of gopher burrow systems around the wind turbines. Pocket gopher density and distribution responded to rodent control almost opposite the density and distribution of ground squirrels. The response of pocket gophers may be an unintended consequence of the rodent control program in the APWRA, and this consequence may exacerbate the avian mortality problem. The significant correlation between pocket gopher burrow systems clustering at wind turbines and cattle pat abundance may indicate a complex ecological relationship in which cattle more intensively use some wind turbines for shade and where they more intensively graze down the grass and defecate. The increased abundance of cattle pats near these wind turbines may fertilize plants to the advantage of forbs, including leguminous plants, which appear to flourish near wind turbines. Pocket gophers may be attracted to the near-zone of wind turbines partly due to the food plants available there. Table 4-2 summarizes the significant relationships we found because of this study. The distribution and abundance of small mammal species in the APWRA is obviously more complicated than the wind turbine owners have considered. Our study certainly did not fully characterize the factors affecting small mammal distribution and abundance. While in the field we observed many tantalizing anecdotes suggesting larger patterns that warrant investigation, but for which we lacked time and funds to pursue. For example, we observed desert cottontails burrowing under wind turbine pads (Photo 4-5), but we did not have the opportunity to identify the conditions associated with this burrowing activity. The wind turbine owners were overly simplistic in their logic that rodent control would serve to reduce raptor visitation to the APWRA, and hence reduce raptor mortality. The spatial distribution of an animal species is influenced by multiple factors, including the strong effects of social organization, which are rather rigid and unresponsive to local changes in the distribution and abundance of prey items

85
(Smallwood 2002). Smallwood (2002) summarized cases where animal species were shown to rely more on gestalt and sociality in spacing themselves out upon their environments, and to not rely upon prey enumeration. Additionally, rodent control threatens two special-status species we commonly observed in the APWRA: the California red-legged frog (Photo 4-6) and the California tiger salamander (Photo 4-7), which are listed as threatened under the federal Endangered Species Act. These species are losing fossorial mammal burrows as refuge sites while the rodent control proceeds to reduce the abundance and distribution of small mammals. Rodent control also threatens the existence of the endangered San Joaquin kit fox, which was documented in the APWRA during the early 1990s (Photo 4-8). San Joaquin kit fox are sensitive to anticoagulant poisons such as the chlorophacinone being used in the APWRA. We recommend that the wind turbine owners cease rodent control and explore alternatives means of managing the spatial distribution of small mammals in the APWRA. Chapter 7 includes suggested alternatives, and other ideas might be found in Van Vuren and Smallwood (1996).
Photo 4-5. Desert cottontails burrowed under some wind turbine pads.

86
Photo 4-6. California red-legged frog in the APWRA (photo by Brian Karas).
Photo 4-7. California tiger salamander in the APWRA (photo by Brian Karas).

87
Photo 4-8. The broadcasting of rolled oats soaked with chlorophacinone poses a hazard to San Joaquin kit fox, which were documented to use the area of the APWRA, and for which the installation of the wind turbines originally required mitigation measures for kit fox conservation. Table 4-2. Summary of significant relationships between factors measured in our study and ground squirrel and pocket gopher distribution and abundance.
Predictor Variables Significant Effects on Dependent Variables1 Magnitude
Rodent control Decreased ground squirrel density 13% of no control Rodent control Decreased ground squirrel clustering 86-41% of no control Elevation Decreased ground squirrel clustering r = -0.32 Mean number cattle pats along turbine string Increased ground squirrel clustering r = 0.34 Rodent control Increased pocket gopher density 2 times greater Rodent control Increased pocket gopher clustering 3-4 times greater Steepness of density:area regression slope Increased pocket gopher clustering r = 0.27 Percent of wind turbine string in canyon Increased pocket gopher clustering r = 0.36 Mean no. cattle pats along turbine string Increased pocket gopher clustering r = 0.51 Mean no. cattle pats 20-40 m from turbines Increased pocket gopher clustering r = 0.49 Mean no. of cottontail fecal pellets Decreased pocket gopher clustering r = -0.32
1 Density and clustering based on burrow systems ≤90 m from wind turbines.

88
CHAPTER 5: BIRD BEHAVIORS 5-1 INTRODUCTION During the past 15 years, it has been argued that specific behaviors predispose certain species to more likely collide with operating wind turbines (Estep 1989, Howell and DiDonato 1991, Howell and Noone 1992, Orloff and Flannery 1992, Colson 1995, Tucker 1996a, Erickson et al. 1999, Hoover 2001, Strickland et al. 2001a). Thelander et al. (2003) termed this predisposition “susceptibility,” and proposed that it varies and that it might be measured on a project site prior to the construction of a wind farm. In this case, however, the APWRA had already been constructed and most turbines had been operating for approximately 15-20 years before we initiated our study to assess susceptibility. The intensity of use of a wind farm also has been proposed as a contributing factor to the susceptibility of avian species to collide with wind turbines (Cade 1995, Morrison 1998, Anderson et al. 2001, Strickland et al. 2001b, Hunt 2002). Orloff and Flannery (1996) rejected the hypothesis that intensity of use relates to mortality, but others involved with research on the turbine-caused avian mortality issue persisted with their assertions that intensity of use of a wind farm relates to mortality. Thelander et al. (2003) reported that our measure of characterization of susceptibility of some species was confounded by evidence that the existence and operation of wind turbines already changed avian behaviors and perhaps intensity of use. For example, we found that red-tailed hawks flew within 50 m of turbines more often and for longer periods than expected by a uniform distribution of time in flight across our study area. It is possible that prior to the development of the APWRA, red-tailed hawks already spent more time flying where the turbines were placed, perhaps because the declivity winds were favored by the hawks as well as by the wind turbine owners, or perhaps because the prey species of red-tailed hawk just happen to prefer ridge crests and ridgelines where many of the turbines were placed. There is no way to know with certainty why red-tailed hawks favor flying near to wind turbines. However, in this study we analyzed the behavior patterns in the APWRA more closely than we did in Thelander et al. (2003). Our goal was to understand more fully how avian behaviors and intensity of use related to variables we measured in the APWRA, as well as to avian fatalities. 5-2 METHODS Two biologists collected bird behavior data within 28 study plots during March 26, 1998 through April 18, 2000. The study plot boundaries encompassed wind turbines easily visible to the observers from a fixed observation point, resulting in a mosaic of irregular shaped, non-overlapping plots, each about 3 km2 (Table 5-1). The plots contained 1,165 turbines, with 10-67 turbines per plot, representing the majority of the turbines accessible to us at that time. Each observer carried maps of the plots in order to identify each turbine by its number designation and to link it to recorded bird activities. A single observer performed circular visual scans (360o), also called variable distance circular point observations (Reynolds et al. 1980), using 8×40 binoculars out to 300 m. At the close of the 30-minute observation session, the observer moved to the next sampling plot in order to begin another 30-minute observation session.

89
Table 5-1. Plot number, plot size, tower type, and output for 1,165 turbines included in behavioral observation sessions during March 26, 1998 – April 18, 2000.
TURBINE FREQUENCY Tubular Vertical-axis Lattice (KCS-56) KVS-33
Plot ~Km2 Strings in plot 110 kW 120 kW 150 kW 150 kW 250 kW 100 kW 400 kW
Total
1 3.5 14 0 33 0 25 0 0 0 58 2 2.2 5 0 27 0 5 0 0 0 32 3 3.8 7 0 0 27 9 0 0 0 36 4 3.2 9 0 24 0 11 0 0 0 35 5 1.9 3 0 6 4 0 0 0 0 10 6 3.3 2 0 0 27 0 0 0 0 27 7 3.6 5 0 23 18 0 0 0 0 41 8 2.2 5 0 25 0 0 0 0 0 25 9 3.8 9 0 29 12 0 0 0 0 41 10 3.5 3 0 4 11 0 0 0 0 15 11 3.0 6 0 5 0 0 21 0 0 26 12 4.3 9 7 16 0 23 0 0 0 46 13 4.0 5 0 0 0 45 0 0 0 45 14 2.5 6 8 9 0 0 0 0 0 17 15 2.3 2 0 14 0 0 0 0 0 14 16 3.0 7 10 6 0 0 0 45 0 61 17 2.0 4 0 0 0 0 0 57 0 57 18 2.2 3 0 0 0 0 0 40 0 40 19 2.6 2 0 0 0 0 0 27 0 27 20 2.6 3 0 0 0 0 0 31 0 31 21 2.5 5 0 0 0 0 0 49 0 49 22 6 4 0 0 0 0 0 62 0 62 23 5.5 6 0 0 0 0 0 67 0 67 24 5 6 0 0 0 0 0 63 0 63 25 5 3 0 0 0 0 0 23 16 39 26 3.5 5 0 0 0 0 0 52 0 52 27 2.8 4 0 0 0 0 0 45 0 45 28 5 5 0 0 0 0 0 52 0 52
Total 94.8 147 25 221 99 118 21 613 16 1165
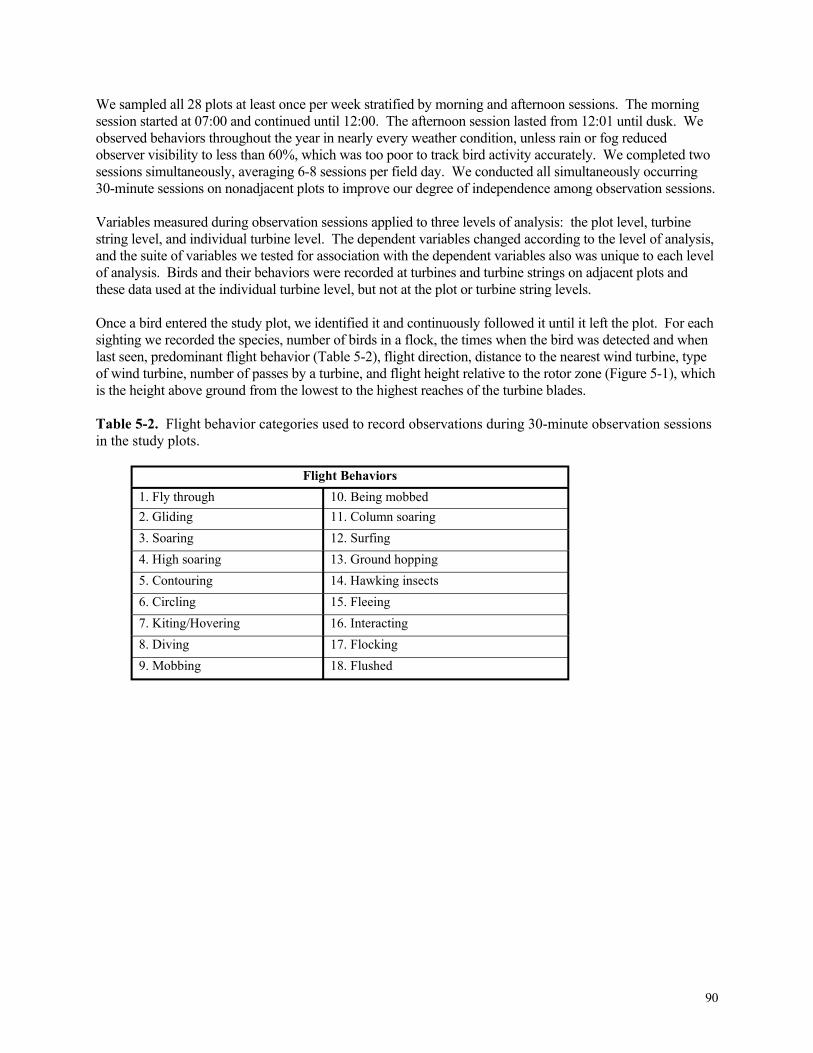
90
We sampled all 28 plots at least once per week stratified by morning and afternoon sessions. The morning session started at 07:00 and continued until 12:00. The afternoon session lasted from 12:01 until dusk. We observed behaviors throughout the year in nearly every weather condition, unless rain or fog reduced observer visibility to less than 60%, which was too poor to track bird activity accurately. We completed two sessions simultaneously, averaging 6-8 sessions per field day. We conducted all simultaneously occurring 30-minute sessions on nonadjacent plots to improve our degree of independence among observation sessions. Variables measured during observation sessions applied to three levels of analysis: the plot level, turbine string level, and individual turbine level. The dependent variables changed according to the level of analysis, and the suite of variables we tested for association with the dependent variables also was unique to each level of analysis. Birds and their behaviors were recorded at turbines and turbine strings on adjacent plots and these data used at the individual turbine level, but not at the plot or turbine string levels. Once a bird entered the study plot, we identified it and continuously followed it until it left the plot. For each sighting we recorded the species, number of birds in a flock, the times when the bird was detected and when last seen, predominant flight behavior (Table 5-2), flight direction, distance to the nearest wind turbine, type of wind turbine, number of passes by a turbine, and flight height relative to the rotor zone (Figure 5-1), which is the height above ground from the lowest to the highest reaches of the turbine blades. Table 5-2. Flight behavior categories used to record observations during 30-minute observation sessions in the study plots.
Flight Behaviors 1. Fly through 10. Being mobbed 2. Gliding 11. Column soaring 3. Soaring 12. Surfing 4. High soaring 13. Ground hopping 5. Contouring 14. Hawking insects 6. Circling 15. Fleeing 7. Kiting/Hovering 16. Interacting 8. Diving 17. Flocking 9. Mobbing 18. Flushed

91
Figure 5-1. The rotor plane of a Bonus turbine and the upper and lower reaches of the rotor zone of a string of four turbines. We considered two major bird activities: flying and perching, but classified 18 different flying behaviors (Table 5-2) and 21 different structures within our study site (Table 5-3). Our focus was to determine how close to a wind turbine each bird species flew, and what types of behaviors it exhibited near the rotor zone, which is where we considered the birds most vulnerable to wind turbine strikes. The rotor zone in this study represents the reach of the rotating turbine blades or rotor swept area within 50 m of the blades, which is a 50-m extension of the rotor plane (Figure 5-1). To improve accuracy and consistency in recording the closest pass to the zone of vulnerability, both field assistants practiced calibrations on height and depth measurements of known objects every six months. Most flying birds could be clearly identified to species out to 300 m, their behavior followed, and their distance estimated, so only birds observed within 300 m were recorded during the behavioral observations. To reduce the effects of observer bias in estimating and reporting distances and bird behaviors, paired observations were made for one month at the beginning of the study. At this time, we calibrated differences between observers in terms of distances, turbine and tower sizes, and depth perception. We also recorded bird behavior to become familiar with the data sheet and to standardize the names for all bird activities, behavior categories, and perching devices. Once the observers were achieving similar records and behavior interpretations, observers began conducting separate 30-minute observation sessions. We completed the first calibration period in 18 observation sessions. We repeated these calibration sessions every six months in four observation sessions for a period of one to two days. The observers recorded the behavioral information simultaneously but independently on separate data sheets. At the end of each calibration session, we compared and discussed the information to help ensure consistency of the behavioral interpretations.
Rotorplane
Rotorzone
Rotorplane
Rotorzone

92
Table 5-3. Possible perching structures used during the 30-minute observation sessions.
PERCHING STRUCTURES 1. Tree 11. Vertical-axis tower -- inner framework 2. Fence post 12. Vertical-axis tower -- guy wire 3. Ground 13. Turbine motor -- top 4. Rock/vegetation 14. Turbine motor -- inside 5. Electrical distribution pole -- top 15. Turbine blade tip/side 6. Electrical distribution pole -- wire 16. Turbine propeller cone 7. Electrical distribution pole -- crossarm 17. Catwalk of wind tower 8. Anemometer tower 18. Side ladder of wind tower 9. Electrical tower 19. Diagonal lattice tower -- top 10. Vertical-axis tower -- top 20. Diagonal lattice tower -- mid-framework 21. Diagonal lattice lower -- lower framework
Plot Level of Analysis At the plot level of analysis, we calculated the sum minutes of flying and perching behaviors among the 30-minute observation sessions for each bird species. Minutes of flying and perching were tested for relationships with session start time, temperature during the session, months and seasons of the year, wind speed, wind direction, California ground squirrel activity levels, and proximity of the bird(s) to wind turbines. Specific bird behaviors were recorded with alphanumeric codes onto a standardized data sheet, along with temperature, wind speed, the number of turbines operating, and cloud cover at the beginning of each 30-minute observation session. We measured temperature at the start of each session with a hand-held thermometer and, for analysis purposes, we lumped these temperatures into categories, most of which spanned 10˚ intervals. We recorded wind force measured on the Beaufort scale, where 0 was <0.3 m/s, 1 was 0.3 to 1.5 m/s, 2 was 1.6 to 3.3 m/s, 3 was 3.4 to 5.4 m/s, 4 was 5.5 to 7.9 m/s, 5 was 8 to 10.7 m/s, 6 was 10.8 to 13.8 m/s, and 7 was > 13.8 m/s. When the wind speed reached > 15 m/s (near gale winds), the wind farm managers advised us to leave the premises for safety reasons. We recorded wind direction (its origin) during the sessions, and the time the session started. For the purpose of this analysis, we lumped actual start times into representative times of the day, so 08:00 represented 07:00 to 08:30 hours, 10:00 was for 09:00 to 10:30 hours, 12:00 for 11:00 to 12:30 hours, 14:00 for 13:00 to 14:30 hours, 16:00 for 15:00 to 16:30 hours, and 18:00 for 17:00 to 20:30 hours. We noted whether ground squirrels were active and how many we could see on the plot at the start of the session. For analysis, we classified the reported number of ground squirrels per session into 0, > 0 and < 2, and ≥ 2 squirrels in order to characterize abundance but also to reduce the effect of error in recording squirrel numbers. A proximity value was assigned to each behavior in terms of how close that behavior was performed in relation to the turbine blades (Figure 5-2), and according to the length of time birds spent doing that behavior near the blades. Proximity Level 1 involved behaviors performed within 1-50 m of the turbines. Proximity Level 2 involved behaviors seen within 51-100 m. Proximity Level 3 behaviors were performed farther from the turbine at 101-300 m. The geographic areas composing these proximity levels were estimated using ArcView GIS and publicly available aerial imagery. Ground surface modeling was

93
performed using 30-m DEM data that were compiled into a GRID mosaic. This single GRID was then converted into a triangulated irregular network (TIN), and the resulting TIN was used in data creation efforts that included contouring, profiling, and hillshade mapping. Buffers at 50, 100 and 300 m were generated around the turbine strings and then intersected with the TIN in order to modify the existing TIN-based surface. The output TIN represented 3D geometry by draping the buffer polygons and creating only that intersected subset of the TIN for Surface Modeling. The buffer TIN surfaces were exported to GRIDs, which were then converted to 3D Arc-Info GIS shapefiles from which geographic areas that are resolved to the 3D landscape could be calculated.
Figure 5-2. Examples of buffers created in GIS and corrected to fit the three-dimensional landscape to test for behavior patterns in relation to proximity to wind turbines. String Level of Analysis Wind turbines in the APWRA are arranged in rows, which we termed strings. We classified each string of turbines by slope aspect, average grade and average elevation. Slope aspect was classified as facing north, northeast, east, southeast, south, southwest, west, northwest, or located in a valley. For analysis we lumped slope aspect into five categories: northeast and east, southeast and south, southwest and west, northwest and
#########
#####
##
######
#
###
# # ###
# ## # # #
#####
##
#####
####
####
#
################ ####################
####
#####
## ################
############################
####
###
####
######
########
####
####
####
#############
################
#############
########
########
##
#
### #
###
######## #
## ## # # ####
#
####
####
###
#################
#################
#############
############
##########
############
########
######
# #####
###
#
###
#####
####
#
#
##
#
N
#
50 m dissolved buffer – Proximity level 1100 m dissolved buffer – Proximity level 2300 m dissolved buffer – Proximity level 3Wind turbine
#########
#####
##
######
#
###
# # ###
# ## # # #
#####
##
#####
####
####
#
################ ####################
####
#####
## ################
############################
####
###
####
######
########
####
####
####
#############
################
#############
########
########
##
#
### #
###
######## #
## ## # # ####
#
####
####
###
#################
#################
#############
############
##########
############
########
######
# #####
###
#
###
#####
####
#
#
##
#
N
#
50 m dissolved buffer – Proximity level 1100 m dissolved buffer – Proximity level 2300 m dissolved buffer – Proximity level 3Wind turbine#
50 m dissolved buffer – Proximity level 1100 m dissolved buffer – Proximity level 2300 m dissolved buffer – Proximity level 3Wind turbine

94
north, and no aspect (flat terrain). Slope grade was measured as the average change in elevation from one turbine to the other within the turbine strings, and elevation was measured using a Trimble Pathfinder Pro-XR GPS at the base of each turbine tower. For analysis, slope grade and elevation were lumped into ranges of values with generally even distributions of turbine frequencies. We also recorded the physical relief on which turbine strings were situated, such as on ridge crests, ridgelines, slopes, saddles, peaks, or plateaus. Turbines were classified by whether they were in or out of three major canyons in the APWRA. Due to the complex topography of the APWRA, turbines could be classified as on a ridge crest while also being inside a canyon because peaks and ridge crests exist within the influence of canyons but of course at lower elevations than the canyon borders. While collecting behavior data we noticed individuals were broadcasting poisoned grain in our study area for rodent control. We later learned that the wind industry paid Alameda County to perform the control operation, but not all land owners participated with it. Therefore, our study area included three levels of control intensity, which were attributed to our plots and the wind turbines in the plots after we interviewed County staff (Jim Smith), for information on where and how chlorophacinone-treated oats were deployed across the APWRA. The levels of rodent control were none, intermittent, and intense. The intermittent control was applied to the land leased by EnXco, and consisted of the rancher applying poison bait on and around ground squirrel colonies on a less systematic and less frequent basis than applied elsewhere by Alameda County and some other ranchers. Turbine Level of Analysis We recorded the wind turbine designation number nearest the observed bird and its behavior wherever possible. Thus, we were able to relate behaviors to attributes of the turbines and their local environments, which we characterized in another data set. We related behavioral observations to turbine type as well as to the turbine’s orientation to the oncoming wind, where blades positioned between the rotor and the wind are ‘toward’ the wind, and blades positioned behind the rotor relative to the wind are ‘away’ from the wind. We recorded the operational status of the turbine during the observation session(s), the tower type, tower height, and its position in the turbine string, such as at the end of the string, second to the end, interior to the string, or separated from other turbines by a gap created by a gully or the removal of one or two turbines and their towers. Turbines recorded as not operating or broken typically were missing blades, the motor, or both, but at least the tower remained, and we noted whether operating turbines were adjacent to nonoperating turbines. We also recorded whether the turbine was part of a wind wall, which is composed of turbines at different heights situated next to each other so that winds at a greater height and lateral domain are captured for energy generation. We used ArcView GIS to count the number of other turbines occurring within a 300-m radius. Also, we recorded the turbine’s location in the APWRA, its elevation, steepness of the slope on which it occurred, slope aspect, physical relief, whether it was in a canyon, the edge index of its laydown area, and whether rocks were piled nearby as San Joaquin kit fox mitigation. The edge index was measured from the string transect while viewing the 40-m radius from the turbine: 0 = no vertical or lateral edge within 40 m of turbine; 1 = some lateral edge such as the presence of a dirt road other than just the service road found at all of the turbines, or cleared area adjacent to vegetated area, or area tilled for pipeline, etc.; 2 = lots of lateral edge; 3 = some vertical edge such as road cut, road embankment, or cut into the hillside for creating a flat laydown area; and 4 = lots of vertical edge, covering half or more of the area within 40 m of the turbine. The dependent variables we compared in the turbine level of analysis were restricted to time birds perched on wind turbines/towers and the time span of flights that approached to within 50 m of wind turbines.
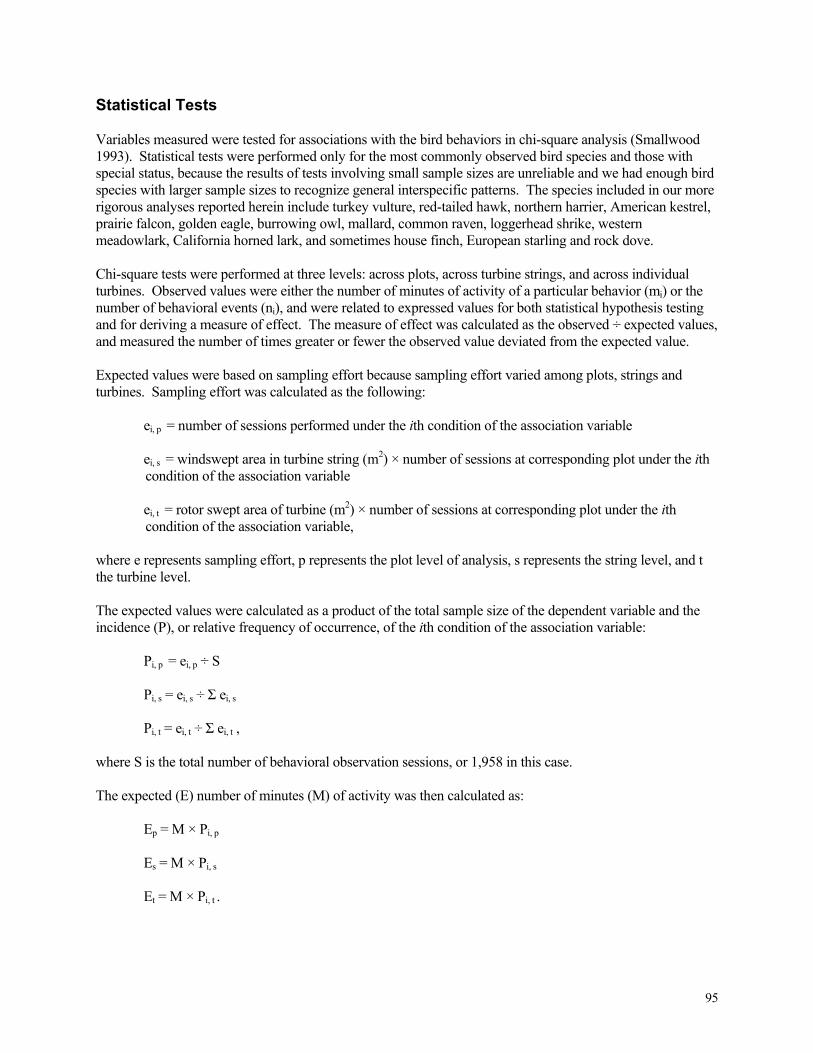
95
Statistical Tests Variables measured were tested for associations with the bird behaviors in chi-square analysis (Smallwood 1993). Statistical tests were performed only for the most commonly observed bird species and those with special status, because the results of tests involving small sample sizes are unreliable and we had enough bird species with larger sample sizes to recognize general interspecific patterns. The species included in our more rigorous analyses reported herein include turkey vulture, red-tailed hawk, northern harrier, American kestrel, prairie falcon, golden eagle, burrowing owl, mallard, common raven, loggerhead shrike, western meadowlark, California horned lark, and sometimes house finch, European starling and rock dove. Chi-square tests were performed at three levels: across plots, across turbine strings, and across individual turbines. Observed values were either the number of minutes of activity of a particular behavior (mi) or the number of behavioral events (ni), and were related to expressed values for both statistical hypothesis testing and for deriving a measure of effect. The measure of effect was calculated as the observed ÷ expected values, and measured the number of times greater or fewer the observed value deviated from the expected value. Expected values were based on sampling effort because sampling effort varied among plots, strings and turbines. Sampling effort was calculated as the following:
ei, p = number of sessions performed under the ith condition of the association variable
ei, s = windswept area in turbine string (m2) × number of sessions at corresponding plot under the ith condition of the association variable
ei, t = rotor swept area of turbine (m2) × number of sessions at corresponding plot under the ith condition of the association variable,
where e represents sampling effort, p represents the plot level of analysis, s represents the string level, and t the turbine level. The expected values were calculated as a product of the total sample size of the dependent variable and the incidence (P), or relative frequency of occurrence, of the ith condition of the association variable:
Pi, p = ei, p ÷ S
Pi, s = ei, s ÷ Σ ei, s
Pi, t = ei, t ÷ Σ ei, t , where S is the total number of behavioral observation sessions, or 1,958 in this case. The expected (E) number of minutes (M) of activity was then calculated as:
Ep = M × Pi, p
Es = M × Pi, s
Et = M × Pi, t .

96
In addition, the expected number of events (N) of a specific type of behavior was calculated as:
Ep = N × Pi, p
Es = N × Pi, s
Et = N × Pi, t . In many of our results, we will state that a species “prefers” or “favors” a particular condition. We use this term in the statistical sense only, because we cannot know what an animal really prefers unless it communicates that sentiment to us directly. What we mean by preference is that a species occurred or performed some behavior more often or for longer than expected, which we measured as the observed divided by expected values. 5-3 RESULTS Characteristics of the Observation Sessions Most of the sessions started between 09:00 hours and 17:00 hours, and the most common start time was midmorning (Figure 5-3). Twenty plots were visited more than 60 times each since the start of the study, and another eight plots were added later and visited more than 20 times each (Figure 5-4). These sessions were distributed relatively evenly among months of the year, except for January and May, which were visited relatively infrequently (Figure 5-5). Most occurred during moderate temperatures, from 50-80 ˚F (Figure 5-6). The most frequent wind direction during the sessions was from the southwest, and northeast, west, and northwest winds were generally common (Figure 5-7). Most of the sessions were completed during modest wind speeds, mostly ranging from ‘1’ to ‘4’ on the Beaufort scale (Figure 5-8). The average wind speed during these sessions was greatest when the winds blew from the southwest, followed by the west and northwest (Figure 5-9A). It peaked during the summer months (Figure 5-9B). The proportion of wind turbines in operation during the behavior session was a function of wind speed (Figure 5-10A), so we used the latter as a surrogate variable representing turbine activity. The proportion of wind turbines in operation also peaked during the summer months (Figure 5-10B). Most of the turbines in our study were KCS-56 turbines, but the most heavily sampled were Bonus turbines (Figure 5-11). Turbines facing the oncoming wind were sampled most intensively (Figure 5-12). Elevations of turbine pads ranged from 87 to 534 m above mean sea level, with three distinct peaks in frequency at 120-220, 280-440, and 520 m (Figure 5-13A). Search effort was greatest for turbines at 130-380 m and least for the lowest and highest elevations (Figure 5-13B). Ground squirrel activity appeared to correspond to an annual cycle with its peak in the late spring and summer and its low in the winter (Figure 5-14). We observed at least 36 bird species during the 1,958 behavioral observation sessions (a total of 979 hours). We recorded 48,396 bird sightings, with sightings averaging 3.23 birds per observation session. We observed no birds in 184 of the observation sessions.

97
Figure 5-3. Frequency distribution of start times for the 1,958 behavioral observation sessions.
Figure 5-4. The frequency distribution of behavioral observation sessions performed among study plots.
Start Time (Hours) of Behavioral Observation
20:00 19:00
18:0017:00
16:0015:00
14:0013:00
12:0011:00
10:0009:00
08:00 07:00
Count
200
100
0
Plot Number
28 27
26 25
2423
2221
2019
1817
1615
1413
1211
109
87
65
4 3
2 1
Count
120
100
80
60
40
20
0

98
Figure 5-5. Frequency distribution of behavioral observation sessions among months of the year.
Figure 5-6. Frequency distribution of temperature at the start of 1,958 behavioral observation sessions.
Month
DecNovOctSepAugJulJunMayAprMarFebJan
Count
220
200
180
160
140
120
100
Temperature (°F)
110105
10095
9085
8075
7065
6055
5045
4035
3025
300
200
100
0
Count

99
Figure 5-7. Frequency distribution of wind directions (origin) during behavioral observation sessions.
Figure 5-8. Frequency distribution of wind speeds among behavioral observation sessions, where wind force measured on the Beaufort scale was the following: 0 was <0.3 m/s, 1 was 0.3 to 1.5 m/s, 2 was 1.6 to 3.3 m/s, 3 was 3.4 to 5.4 m/s, 4 was 5.5 to 7.9 m/s, 5 was 8 to 10.7 m/s, 6 was 10.8 to 13.8 m/s, and 7 was > 13.8 m/s.
No wind
North
Northeast
East
Southeast
South
Southwest
West
Northwest
Count
9008007006005004003002001000
Wind direction (origin)
Wind Speed on Beaufort Scale
76543210
Count
500
400
300
200
100
0

100
Figure 5-9. Wind speed during behavioral observation sessions as functions of direction of origin (A) and month of the year (B).
252 25780633646234010437N =
Wind Direction (origin)NW WSWSSEENENNo
wind
4
3
2
1
0
181 141161158167197183127166180185111N =
5
4
3
2
1 Dec Nov OctSepAugJulJunMayAprMarFebJan
Month
Wind speed measured on
Beaufort Scale, mean & 95% CI
per session
Wind speed measured on
Beaufort Scale, mean & 95% CI
per session
A
B

101
Figure 5-10. The proportion of turbines operating in the plot during behavioral observation sessions was a function of wind speed (A) and month of the year (B).
47 11217830536235532134N =
7 6543210
1.0
0.8
0.6
0.4
0.2
0.0
Wind Speed on Beaufort Scale
Proportion of turbinesoperating during behavior
observation session
171 136 144138128153151104147163174105N =
1.0
0.8
0.6
0.4
0.2
0.0 Dec Nov OctSepAugJulJunMayAprMarFebJan
Month
Proportion of turbines operating
during behavior observation session
A
B
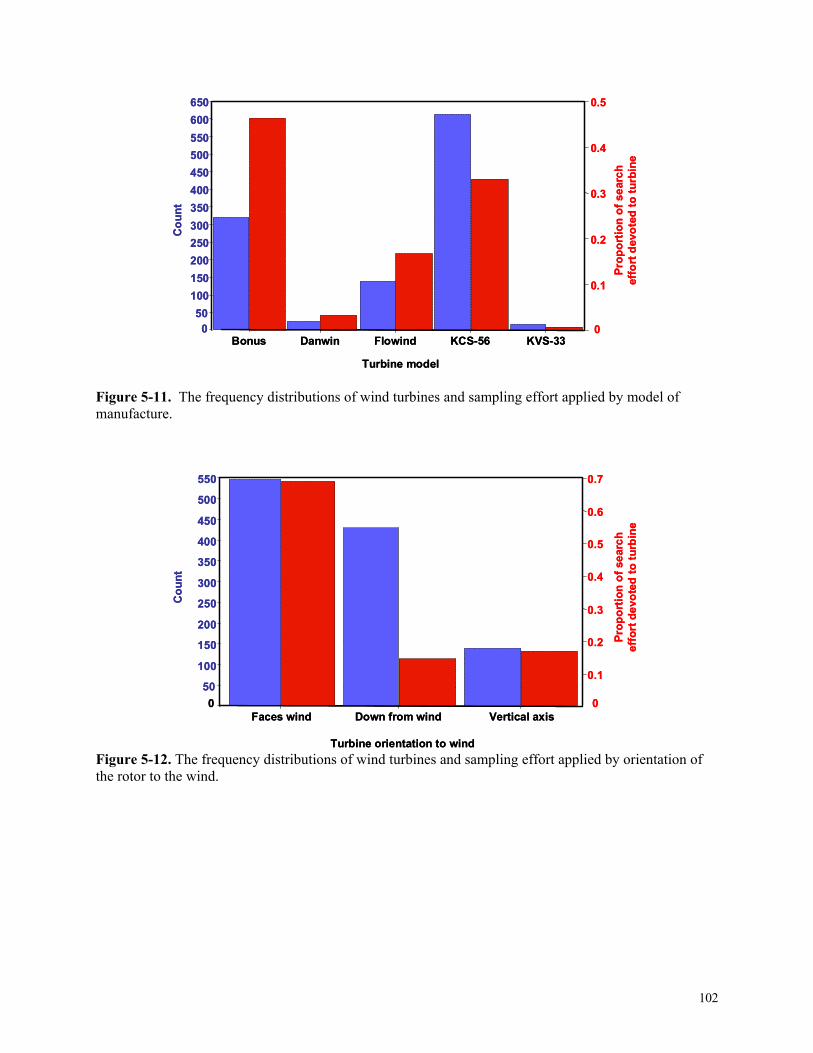
102
Figure 5-11. The frequency distributions of wind turbines and sampling effort applied by model of manufacture.
Figure 5-12. The frequency distributions of wind turbines and sampling effort applied by orientation of the rotor to the wind.
Turbine model
KVS-33KCS-56FlowindDanwinBonus
Cou
nt
650600550500450400350300250200150100500
0.5
0.4
0.3
0.2
0.1
0
Prop
ortio
n of
sea
rch
effo
rt d
evot
ed to
turb
ine
Turbine model
KVS-33KCS-56FlowindDanwinBonus
Cou
nt
650600550500450400350300250200150100500
0.5
0.4
0.3
0.2
0.1
0
Prop
ortio
n of
sea
rch
effo
rt d
evot
ed to
turb
ine
0.7
0.6
0.5
0.4
0.3
0.2
0.1
0
Turbine orientation to wind
Vertical axisDown from windFaces wind
550
500
450
400
350
300
250
200
150
100
500
Cou
nt
Prop
ortio
n of
sea
rch
effo
rt d
evot
ed to
turb
ine
0.7
0.6
0.5
0.4
0.3
0.2
0.1
0
Turbine orientation to wind
Vertical axisDown from windFaces wind
550
500
450
400
350
300
250
200
150
100
500
Cou
nt
Prop
ortio
n of
sea
rch
effo
rt d
evot
ed to
turb
ine

103
Figure 5-13. The frequency distributions of wind turbines (A) and sampling effort (B) by elevation of the tower among wind turbines included in the behavior study.
0.0002
0.0004
0.0006
0.0008
0.0010
0.0012
0.0014
0.0016
0.0018
Elevation (m)
52048044040036032028024020016012080
100
90
80
70
60
50
40
30
20
100
Count
53048043038033028023018013080
Elevation (m)
Prop
ortio
n of
sea
rch
effo
rt d
evot
ed to
turb
ine
A
B

104
Figure 5-14. The average number of California ground squirrels seen per month on the study plot at the start of the behavioral observation session. Overall Bird Use We recorded 31,317 minutes of bird activity, including 13,725 minutes spent flying (44%) and 17,592 minutes spent perching (56%). Factoring the number of birds composing each sighting, we recorded 454,801 minutes of bird activity, including 364,042 minutes of flying (80%) and 23,227 minutes of perching (20%). The majority of the birds observed came to within 100 m of the wind turbines, and many of them came to within 40 m of a turbine (Figure 5-15). We recorded 8,663 flights that passed within 50 m of a turbine, and 824 flights through the rotor zone. These two behaviors were also closely related (Figure 5-16). The average time birds were observed flying was greatest during slower winds (Figure 5-17A), and the same was true for perching (Figure 5-17B). The average time birds were seen either flying or perching was greatest during the fall and winter months (Figs. 5-18A and 5-18B). The number of passes birds made through the rotor zone averaged the least during periods of no wind or when the winds blew from the southwest, west or northwest (Figure 5-19A). It averaged relatively fewer during no winds but greatest during winds of 1-5 km/hr and increasingly fewer with greater wind speeds until 29-34 km/hr at which point the number of passes through the rotor zone actually increased with increasingly greater winds (Figure 5-19B). Passes through the rotor zone averaged most frequent during November and December, and secondarily during January through March (Figure 5-20). The birds’ minimum distance to the nearest turbine averaged farthest when the winds blew from the southwest, west or northwest (Figure 5-21). It averaged least during no winds and increased with wind speed until 39-49 km/hr, above which it decreased again (Figure 5-22A). The minimum distance to the nearest turbine averaged closest during the fall and winter and the farthest at the peak of summer (Figure 5-22B). The number of flights within 50 m of a turbine averaged fewest during no winds or when the winds blew from the southwest or west, and they were similar across all other wind directions (Figure 5-23A). They averaged fewer when winds blew at 29-49 km/hr, and most when they blew 1-28 km/hr (Figure 5-23B). They averaged the most during fall and winter and least at the peak of summer (Figure 5-24).
177140159154159186168112143172181109N =
3.0
2.5
2.0
1.5
1.0
0.5
0
DecNovOctSepAugJulJunMayAprMarFebJan
Month
Number of squirrelsseen during session,
mean & 95% CIper session

105
Figure 5-15. Frequency distribution of the distance to the nearest turbine recorded for bird sightings during the behavioral observation sessions.
Figure 5-16. The number of passes of birds through the rotor zone correlated strongly with the number of flights within 50 m of wind turbines.
500 450 400350300250200150100500
2500
2000
1500
1000
500
0
Count
Distance (m) to Nearest Turbine
2400 180012006000
300
240
180
120
60
0
Y = -1.36 0.0958Xr2 = 0.93RMSE = 13.03P < 0.0001
Interspecies level of analysis
Number of passes through the rotor zone (includes inter - turbine spaces along string)
Number of Flights Within 50 m of Turbines

106
Figure 5-17. The average times birds spent flying (A) and perching (B) were greater during slower winds.
63 14422235840339134035N =
70 60 50 40 30 20 10 0
63 14422235840339134035N =
1200
1000
800
600
400
200
0
Wind Speed on Beaufort Scale7 6543210
Wind Speed on Beaufort Scale7 6543210
Total minutes birds seen flying, mean & 95% CI
per session
Total minutes birds seen perching,
mean & 95% CI per session
A
B

107
Figure 5-18. The average times birds spent flying (A) and perching (B) were greater during the fall and winter months.
181141161158167197183127165180185111N =
2000
1500
1000
500
0
181141161158167197183127165180185111N =
150
100
50
0
Total minutesbirds seen flying,mean & 95% CI
per session
Total minutesbirds seen perching,
mean & 95% CIper session
DecNovOctSepAugJulJunMayAprMarFebJan
Month
DecNovOctSepAugJulJunMayAprMarFebJan
Month
A
B

108
Figure 5-19. The average number of passes of birds through the rotor zone related to wind direction (A) and wind speed (B) during the behavior observation session.
233 2147093062593239736N =
Wind Direction (origin)
NW WSWSSEENEN0
Number of passes through rotor zone,
mean & 95% CI per session
1.6 1.4 1.2 1.0 0.8 0.6 0.4 0.2
0
48 11718231636936832934N =
1.0
0.8
0.6
0.4
0.2
0
Number of passes through rotor zone,
mean & 95% CI per session
Wind Speed on Beaufort Scale7 6543210
A
B

109
Figure 5-20. The average number of passes of birds through the rotor zone related to month of the year.
Figure 5-21. The average distance of birds to the nearest wind turbine related to wind direction during the behavior observation session.
Number of passesthrough rotor zone,
mean & 95% CIper session
174141149142130159157112148170174107N =
1.4
1.2
1.0
0.8
0.6
0.4
0.2
0
DecNovOctSepAugJulJunMayAprMarFebJan
Month
80
70
60
50
40
30
20 233 2147093062593239736N =
Wind Direction (origin)
NW WSWSSEENEN0
Distance (m) to nearest turbine, mean & 95% CI
per session

110
Figure 5-22. The average distance of birds to the nearest wind turbine related to wind speed (A) and month of the year (B) when the behavior observation session was performed.
49 11818531837236833134N =
7 6543210
90
80
70
60
50
40
30 20
Distance (m) to nearest turbine, mean & 95% CI
per session
Wind Speed on Beaufort Scale
Distance (m) to nearest turbine, mean & 95% CI
per session
174 141149144131159157113151171178107N =
100
90
80
70
60
50
40 30
Dec Nov OctSepAugJulJunMayAprMarFebJanMonth
A
B

111
Figure 5-23. The average number of flights of birds within 50 m of wind turbines related to wind direction (A) and wind speed (B) during the behavior observation session.
233 2157133062593239836N =
9 8 7 6 5 4 3 2 1
48 11818331837036833034N =
Wind Speed on Beaufort Scale7 6543210
7
6
5
4
3
2
1
Wind Direction (origin)
NW WSWSSEENEN0
Number of passes <50 m from turbine,
mean & 95% CI per session
Number of passes <50 m from turbine,
mean & 95% CI per session
A
B

112
Figure 5-24. The average number of flights of birds within 50 m of wind turbines related to month of the year when the behavior observation session took place. The red-tailed hawk was one of the species most often observed in the APWRA and the species most often performing what we assumed to be more dangerous behaviors (Table 5-4). By far, gulls were the most commonly reported birds in the APWRA and we recorded nearly 300,000 minutes of observations of these (the minutes per flock were multiplied by the number of birds in the flock). Most of the gulls were not identified to species, and those that were included were mostly ring-billed gull and infrequently California gull. Blackbirds were also commonly seen and composed more than 70,000 total minutes of observation. Like gulls, most of these were not identified to species, but those that were identified mostly included red-winged blackbird. House finches were common, and so were unidentified passerine species. Other commonly observed raptors besides red-tailed hawks included turkey vulture, golden eagle, American kestrel, and burrowing owl. We assumed that dangerous behaviors included flights through the turbine strings within the height domain of the blades, and we referred to these flights as through the rotor zone (rather than the rotor plane, which is specifically through the area swept by the blades). We also considered greater proximity to the turbines to be more dangerous, as well as the number of flights made within 50 m of the turbines. The species performing more of these dangerous behaviors included red-tailed hawk, common raven, American kestrel, turkey vulture, blackbird spp., and golden eagle (Table 5-4). Species performing these behaviors at intermediate frequencies included gull spp., northern harrier, rock dove, and loggerhead shrike. Species that appeared to avoid the turbines based on these behaviors included rough-legged hawk, burrowing owl, swallows, and tricolored blackbird, among others. Specific flight behaviors observed were mostly those of birds flying through the plot, soaring, and gliding, followed by ground-hopping, flocking and circling/searching (Table 5-5 and 5-6). Contouring, diving, fleeing while being mobbed, and being flushed were the rarest behaviors. Factoring the total flight time per observation, the most practiced behaviors were flying through, column soaring, flocking, and ground hopping, and the rarest behaviors were diving, fleeing while being mobbed, and being flushed (Tables 5-7 and 5-8). Flight time at blade height and within 50 m of turbines was greatest for flying through the plot and ground-hopping, followed by kiting/hovering, soaring, gliding, and circling/searching (Tables 5-9 and 5-10).
174141149143131159157112149171176107N =
9
8
7
6
5
4
3
2
1
0DecNovOctSepAugJulJunMayAprMarFebJan
Month
Number of passes<50 m from turbine,
mean & 95% CIper session

113
The most dangerous behaviors we observed were those of flights at blade height and within 50 m of operating turbines. Based on total minutes of flight time, these were again dominated by flying through, followed by kiting/hovering, soaring, gliding and ground-hopping (Tables 5-11 and 5-12). We never observed flocking under this set of conditions, and surfing, fly-catching (also referred to as ‘hawking’ insects), mobbing, being mobbed, being flushed and diving were rare. Burrowing owl, horned lark, western meadowlark and mallard were never seen flying under these conditions, yet were relatively frequent fatalities in the APWRA. Therefore, our behavior sampling was obviously inadequate for some or even most species. In examining a select group of species that either were observed frequently in the APWRA or often died at turbines, we found that wind turbines and their towers were commonly perched upon and for lengthy durations (Table 5-13). However, these species appeared to apply caution and perch on turbines when it was safe – when the turbines were not operating or when they were broken (Table 5-14).

114
Table 5-4. Summary of behavioral activities by species.
Sum of minutes Number of flights Species Scientific name Number of
birds seen Observed Flying Perching
Mean distance (m) to closest
turbine Through
rotor zone < 50 m to turbine
Turkey vulture Cathartes aura 980 2425 2446 96 72 51 1047 Golden eagle Aquila chrysaetos 465 2272 1366 1008 82 32 450 Red-tailed hawk Buteo jamaicensis 2005 15486 6742 8938 65 270 2682 Rough-legged hawk Buteo lagopus 6 24 27 0 125 0 5 Ferruginous hawk Buteo regalis 12 59 44 30 53 0 38 Buteo spp. 1 2 2 0 20 0 2 Northern harrier Circus cyaneus 126 386 294 95 76 21 162 White-tailed kite Elanus leucurus 1 2 2 0 100 0 0 Cooper’s hawk Accipiter cooperii 2 2 3 0 35 0 6 American kestrel Falco sparverius 462 2926 753 2280 48 102 583 Prairie falcon Falco mexicanus 66 197 116 83 62 4 84 Burrowing owl Athene cunicularia 100 1622 193 1438 117 0 31 Raptor spp. 1 4 0 4 100 0 0 Great blue heron Ardea herodias 3 3 3 0 60 2 5 Long-billed curlew Numenius americanus 7 19 10 9 58 0 1 Killdeer Charadrius vociferus 2 2 2 0 20 0 1 California gull Larus califfornicus 36 36 36 0 50 0 5 Ring-billed gull Larus delawerensis 503 9823 9823 0 39 0 12 Gull spp. 28750 293957 299517 0 67 14 552 Mallard Anas platyrhynchos 79 83 83 0 85 0 16 Common goldeneye Bucephala clangula 1 1 1 0 10 0 2 Common raven Corvus corax 1313 4124 2343 1937 42 176 1787 American crow Corvus brachyrhynchos 25 145 33 112 6 8 31 Loggerhead shrike Lanius ludovicianus 139 845 139 707 49 11 98 Mourning dove Zenaida macroura 7 88 7 81 45 0 5 Rock dove Columba livia 526 828 706 128 57 10 160 Band-tailed pigeon Columba fasciata 30 30 30 0 5 1 1 Mountain bluebird Sialia currucoides 118 291 229 62 52 0 6

115
Say’s phoebe Sayornis saya 2 6 3 3 50 0 1 Cliff swallow Petrochelidon pyrrhonota 23 52 52 0 22 0 14 Brewer’s blackbird Euphagus cyanocephalus 337 1732 693 1051 35 7 41 Red-winged blackbird Agelaius phoeniceus 470 6557 785 5784 25 8 34 Brown-headed cowbird Molothrus ater 2 2 2 0 70 0 2 Tricolored blackbird Agelaius tricolor 78 281 298 0 88 0 0 Blackbird spp. 7924 67199 26296 41129 38 45 329 Western meadowlark Sturnella neglecta 207 720 266 455 31 16 72 Horned lark Eremophila alpestris 213 676 267 409 36 3 45 House finch Carpodacus mexicanus 1024 15920 2095 13525 25 6 61 European starling Sturnus vulgaris 259 2373 233 2140 16 10 106 Passerine spp. 1974 23076 7525 15551 38 25 141

116
Table 5-5. Flight behaviors recorded per bird observation during 1,958 sessions, where AMKE = American kestrel, BUOW = burrowing owl, GOEA = golden eagle, NOHA = northern harrier, PRFA = prairie falcon, and RTHA = red-tailed hawk.
Number of Bird Observations Flight behaviors observed within the 28 plots in the
APWRA All birds GOEA RTHA NOHA PRFA AMKE BUOW
Soaring 1839 160 462 30 6 9 1 Column soaring 5450 1 1 0 1 0 0 Flying through 28456 53 298 43 27 142 15 Gliding 1101 103 241 15 10 16 1 Surfing 813 9 11 1 1 5 0 Contouring 58 28 7 21 0 0 0 Circling/searching 1262 42 213 10 8 23 0 Kiting/hovering 415 6 307 4 3 64 0 Fly-catching 82 0 0 0 0 8 0 Diving 58 4 14 0 4 21 1 Ground hopping 3111 1 10 0 1 3 7 Short flights 738 0 24 0 0 34 12 Display (interacting) 464 2 21 0 1 6 0 Flocking 2619 0 0 0 0 0 0 Mobbing 48 2 10 0 1 22 0 Mobbed/fleeing 27 4 13 0 1 2 0 Flushed 27 11 10 0 0 3 0
Table 5-6. Flight behaviors recorded per bird observation during 1,958 sessions, where CORA = Common raven, HOLA = horned lark, LOSH = loggerhead shrike, MALL = mallard, RODO = rock dove, WEME = western meadowlark, and TUVU = turkey vulture.
Number of Bird Observations Flight behaviors within 50 m of turbines and at
blade height TUVU CORA MALL LOSH WEME HOLA RODO
Soaring 267 88 0 0 0 0 1 Column soaring 0 0 0 0 0 0 0 Flying through 225 741 77 43 131 146 491 Gliding 335 129 0 1 6 0 0 Surfing 3 34 0 2 0 23 0 Contouring 1 1 0 0 0 0 0 Circling/searching 136 120 0 0 0 0 10 Kiting/hovering 0 9 0 4 0 0 0 Fly-catching 0 1 0 1 0 0 0 Diving 1 2 0 8 0 0 0 Ground hopping 2 21 0 7 31 16 1 Short flights 1 60 1 9 10 10 11 Display (interacting) 0 15 0 3 0 10 0 Flocking 0 0 0 0 0 0 0 Mobbing 0 12 0 0 0 0 0 Mobbed/fleeing 0 6 0 1 0 0 0 Flushed 0 1 1 1 0 0 0

117
Table 5-7. Total minutes of flight behaviors recorded during 1,958 observation sessions, where AMKE = American kestrel, BUOW = burrowing owl, GOEA = golden eagle, NOHA = northern harrier, PRFA = prairie falcon, and RTHA = red-tailed hawk.
Minutes of flight activity Flight behaviors observed within the
28 plots in the APWRA All birds GOEA RTHA NOHA PRFA AMKE BUOW
Soaring 6139 613 1546 95 13 18 3 Column soaring 32173 3 1 0 2 0 0 Flying through 279449 87 525 59 45 205 17 Gliding 3172 318 726 21 20 62 2 Surfing 1618 34 29 1 3 5 0 Contouring 233 123 26 82 0 0 0 Circling/searching 4335 124 873 26 14 82 0 Kiting/hovering 2802 18 2481 9 5 211 0 Fly-catching 551 0 0 0 0 36 0 Diving 125 10 50 0 7 34 1 Ground hopping 12677 1 246 0 2 4 8 Short flights 1500 0 50 0 0 38 152 Display (interacting) 2517 8 55 0 1 7 0 Flocking 15634 0 0 0 0 0 0 Mobbing 142 6 43 0 2 35 0 Mobbed/fleeing 90 9 63 0 2 5 0 Flushed 29 12 10 0 0 4 0

118
Table 5-8. Total minutes of flight behaviors recorded during 1,958 observation sessions, where CORA = Common raven, HOLA = horned lark, LOSH = loggerhead shrike, MALL = mallard, RODO = rock dove, WEME = western meadowlark, and TUVU = turkey vulture.
Minutes of flight activity Flight behaviors observed within the 28 plots in the
APWRA TUVU CORA MALL LOSH WEME HOLA RODO Soaring 739 192 0 0 0 0 2 Column soaring 0 0 0 0 0 0 0 Flying through 320 1182 81 64 146 146 513 Gliding 706 326 0 1 6 0 0 Surfing 9 54 0 6 0 46 0 Contouring 1 1 0 0 0 0 0 Circling/searching 640 302 0 0 0 0 19 Kiting/hovering 0 16 0 6 0 0 0 Fly-catching 0 1 0 2 0 0 0 Diving 1 4 0 10 0 0 0 Ground hopping 2 34 0 31 96 50 1 Short flights 2 114 1 11 10 10 159 Display (interacting) 0 26 0 4 0 10 0 Flocking 0 0 0 0 0 0 0 Mobbing 0 55 0 0 0 0 0 Mobbed/fleeing 0 10 0 1 0 0 0 Flushed 0 1 1 1 0 0 0
Table 5-9. Total minutes of flight behaviors recorded at blade height within 50 m of turbine, where AMKE = American kestrel, BUOW = burrowing owl, GOEA = golden eagle, NOHA = northern harrier, PRFA = prairie falcon, and RTHA = red-tailed hawk.
Minutes of flight activity Flight behaviors within 50 m of turbines and at blade
height All birds GOEA RTHA NOHA PRFA AMKE BUOW Soaring 515 38 335 15 4 9 0 Column soaring 240 0 0 0 0 0 0 Flying through 5518 13 156 14 12 75 0 Gliding 444 25 203 2 2 1 0 Surfing 31 10 5 0 0 2 0 Contouring 22 18 3 0 0 0 0 Circling/searching 408 6 185 4 3 49 0 Kiting/hovering 700 4 594 0 3 92 0 Fly-catching 3 0 0 0 0 2 0 Diving 25 0 12 0 0 11 0 Ground hopping 1528 0 195 0 2 0 0 Short flights 359 0 9 0 0 17 147 Display (interacting) 29 0 8 0 0 5 0 Flocking 230 0 0 0 0 0 0 Mobbing 17 0 5 0 0 11 0 Mobbed/fleeing 14 2 9 0 2 0 0 Flushed 4 2 2 0 0 0 0

119
Table 5-10. Total minutes of flight behaviors recorded at blade height within 50 m of turbine, where CORA = Common raven, HOLA = horned lark, LOSH = loggerhead shrike, MALL = mallard, RODO = rock dove, WEME = western meadowlark, and TUVU = turkey vulture.
Minutes of flight activity Flight behaviors within 50 m of turbines and at blade height TUVU CORA MALL LOSH WEME HOLA RODO
Soaring 83 29 0 0 0 0 0 Column soaring 0 0 0 0 0 0 0 Flying through 23 245 2 2 20 24 64 Gliding 81 125 0 0 0 0 0 Surfing 0 8 0 0 0 0 0 Contouring 0 1 0 0 0 0 0 Circling/searching 62 69 0 0 0 0 5 Kiting/hovering 0 4 0 2 0 0 0 Fly-catching 0 1 0 0 0 0 0 Diving 0 0 0 2 0 0 0 Ground hopping 0 14 0 1 0 0 0 Short flights 0 47 0 5 0 0 8 Display (interacting) 0 10 0 0 0 0 0 Flocking 0 0 0 0 0 0 0 Mobbing 0 0 0 0 0 0 0 Mobbed/fleeing 0 1 0 0 0 0 0 Flushed 0 0 0 0 0 0 0
Table 5-11. Total minutes of flight behaviors recorded at blade height within 50 m of operating turbine, where AMKE = American kestrel, BUOW = burrowing owl, GOEA = golden eagle, NOHA = northern harrier, PRFA = prairie falcon, and RTHA = red-tailed hawk.
Minutes of flight activity Flight behaviors within 50 m and at blade height of operating
turbine All birds GOEA RTHA NOHA PRFA AMKE BUOW Soaring 216 18 0 15 4 0 0 Column soaring 240 0 0 0 0 0 0 Flying through 706 4 40 1 0 10 0 Gliding 243 11 105 0 2 0 0 Surfing 1 0 0 0 0 0 0 Contouring 18 18 132 0 0 0 0 Circling/searching 77 0 23 2 3 3 0 Kiting/hovering 456 0 408 0 2 42 0 Fly-catching 2 0 0 0 0 2 0 Diving 14 0 11 0 0 3 0 Ground hopping 195 0 194 0 0 0 0 Short flights 13 0 3 0 0 2 0 Display (interacting) 27 0 11 0 0 3 0 Flocking 0 0 0 0 0 0 0 Mobbing 5 0 3 0 0 1 0 Mobbed/fleeing 3 2 0 0 0 0 0 Flushed 3 2 1 0 0 0 0

120
Table 5-12. Total minutes of flight behaviors recorded at blade height within 50 m of operating turbine, where CORA = Common raven, HOLA = horned lark, LOSH = loggerhead shrike, MALL = mallard, RODO = rock dove, WEME = western meadowlark, and TUVU = turkey vulture.
Minutes of flight activity Flight behaviors within 50 m and at blade height of
operating turbine TUVU CORA MALL LOSH WEME HOLA RODO Soaring 34 11 0 0 0 0 0 Column soaring 0 0 0 0 0 0 0 Flying through 10 65 0 0 12 0 38 Gliding 55 68 0 0 0 0 0 Surfing 0 0 0 0 0 0 0 Contouring 0 0 0 0 0 0 0 Circling/searching 39 4 0 0 0 0 3 Kiting/hovering 0 4 0 0 0 0 0 Fly-catching 0 0 0 0 0 0 0 Diving 0 0 0 0 0 0 0 Ground hopping 0 0 0 0 0 0 0 Short flights 0 8 0 0 0 0 0 Display (interacting) 0 13 0 0 0 0 3 Flocking 0 0 0 0 0 0 0 Mobbing 0 0 0 0 0 0 0 Mobbed/fleeing 0 1 0 0 0 0 0 Flushed 0 0 0 0 0 0 0
Table 5-13. The distribution of perch time among select species observed in the APWRA.
Number of minutes observed perching on:
Species Wind turbine
Power pole
Land-scape
element
Trans-mission tower
Electric distribution
line
Ancillary equipment Total
Golden eagle 31 264 408 227 42 36 1008 Turkey vulture 0 0 85 0 11 0 96 Red-tailed hawk 4329 1361 1565 341 1050 250 8896 Northern harrier 1 0 85 0 0 0 86 Prairie falcon 14 10 23 11 25 0 83 American kestrel 1039 121 131 17 869 99 2276 Burrowing owl 56 24 1241 117 0 0 1438 Common raven 1093 175 374 20 227 46 1935 European starling 1877 0 0 0 196 67 2140 House finch 7295 2 0 0 6150 78 13525 Loggerhead shrike 194 55 65 0 350 43 707 Rock dove 109 1 0 0 1 17 128 Western meadowlark 236 5 69 0 125 20 455 Horned lark 0 0 409 0 0 0 409 Total 22918 2049 42111 656 12193 15663 95590

121
Table 5-14. The distribution of perch time among select species observed in the APWRA. The discrepancies in total values between this and Table 5-13 are due to missing values.
Number of minutes observed perching on wind turbine/tower that is: Species
Operating Not operating Broken Total Turkey vulture 0 0 0 0 Golden eagle 0 26 0 26 Red-tailed hawk 105 4065 62 4232 Northern harrier 0 1 0 1 Prairie falcon 0 14 0 14 American kestrel 55 940 7 1002 Burrowing owl 0 56 0 56 Common raven 63 990 9 1062 European starling 240 1196 441 1877 House finch 0 7295 0 7295 Loggerhead shrike 4 181 0 185 Rock dove 26 57 26 109 Western meadowlark 7 224 0 231 Horned lark 0 0 0 0 Total 500 19571 623 20694
Association Analysis Seasons Select bird species demonstrated strong seasonal patterns in time spent flying. Golden eagles flew more often than expected by chance during the warmer months when red-tailed hawks flew less often, and red-tailed hawks flew more often during the fall and winter when golden eagles flew less (Figure 5-25). Northern harriers favored fall and winter as well, but prairie falcons and American kestrels flew more often than expected during the summer months (Figures 5-26 and 5-27). Burrowing owls strongly favored March to fly (Figure 5-27). Turkey vulture flight time peaked in January and September, and common ravens favored early spring and late fall for flight (Figure 5-28). Mallard flight time occurred disproportionately during late spring (Figure 5-29). Western meadowlark and California horned lark flight time favored late fall into early spring (Figure 5-30). Golden eagles spent a disproportionate amount of time perching during September and November, whereas red-tailed hawks favored perching in fall and winter (Figure 5-31). Northern harriers were seen perching disproportionately more often during March and fall/early winter, which was similar to that seen for prairie falcons (Figure 5-32) and American kestrels (Figure 5-33). Burrowing owls were seen perched more often than expected during spring (Figure 5-33). Turkey vultures perched more often during May and late summer, and common ravens perched disproportionately longer during winter and spring (Figure 5-34). Loggerhead shrikes perched for disproportionately longer periods during winter and spring (Figure 5-35). California horned larks perched for disproportionately longer periods during winter, and western meadowlarks extended that period into spring (Figure 5-36). Flights through the rotor zone were taken more often than expected by chance during winter and summer by golden eagles, and during fall by red-tailed hawks (Figure 5-37), northern harriers, and American kestrels (Figure 5-38). They were taken more often during summer by turkey vulture and during fall and winter by

122
common raven (Figure 5-39). Patterns observed for loggerhead shrike and western meadowlark were unreliable due to inadequate sample sizes (Figure 5-40). Golden eagles flew within 50 m of turbines more often than expected by chance during summer, and red-tailed hawks did so during fall and winter (Figure 5-41). These close flights were disproportionately more common during fall, winter and early spring by northern harrier, and during summer by prairie falcon (Figure 5-42). They were made more often than expected during fall and winter by American kestrel, and almost all such flights were made by burrowing owls during February (Figure 5-43). Common ravens flew within 50 m of turbines disproportionately more often during winter and early spring (Figure 5-44), whereas mallards did so in May and September and loggerhead shrikes did so during winter and early spring (Figure 5-45). Western meadowlark favored flights near turbines during February and March, and California horned larks did so during January and November (Figure 5-46). The amount of time most species spent flying at blade height and within 50 m of operating turbines was too small at the species level for detailed analysis, so we limited our examination of it to all species combined and red-tailed hawk. All species combined spent more time performing these dangerous flights during the winter months (Figure 5-47A), and red-tailed hawk did so during December (Figure 5-47B).
Figure 5-25. Associations between number of minutes of flight by month for golden eagle and red-tailed hawk. For both species, χ2 tests were significant, P < 0.05.
3 210
Golden eagle
Red - tailed hawk
Jan Feb Mar Apr May Jun Jul Aug Sep Oct Nov Dec Jan Feb Mar Apr May Jun Jul Aug Sep Oct Nov Dec
Value expectedby chance
Observed ÷ Expected Minutes in Flight
Month

123
Figure 5-26. Associations between number of minutes of flight by month for northern harrier and prairie falcon. For both species, χ2 tests were significant, P < 0.05.
3 210
Northern harrier
Prairie falcon
Jan Feb Mar Apr May Jun Jul Aug Sep Oct Nov Dec Jan Feb Mar Apr May Jun Jul Aug Sep Oct Nov Dec
Value expectedby chance
Observed ÷ Expected Minutes in Flight
Month

124
Figure 5-27. Associations between number of minutes of flight by month for American kestrel and burrowing owl. For both species, χ2 tests were significant, P < 0.05.
3 210
American kestrel
Burrowing owl
9.2
Jan Feb Mar Apr May Jun Jul Aug Sep Oct Nov Dec Jan Feb Mar Apr May Jun Jul Aug Sep Oct Nov Dec
Value expectedby chance
Observed ÷ Expected Minutes in Flight
Month

125
Figure 5-28. Associations between number of minutes of flight by month for turkey vulture and common raven. For both species, χ2 tests were significant, P < 0.05.
3 210
Turkey vulture
Common raven
Jan Feb Mar Apr May Jun Jul Aug Sep Oct Nov Dec Jan Feb Mar Apr May Jun Jul Aug Sep Oct Nov Dec
Value expectedby chance
Observed ÷ Expected Minutes in Flight
Month

126
Figure 5-29. Associations between number of minutes of flight by month for mallard and loggerhead shrike. For both species, χ2 tests were significant, P < 0.05.
3 210
3.2 Mallard
Loggerhead shrike
Jan Feb Mar Apr May Jun Jul Aug Sep Oct Nov Dec Jan Feb Mar Apr May Jun Jul Aug Sep Oct Nov Dec
Value expectedby chance
Observed ÷ Expected Minutes in Flight
Month

127
Figure 5-30. Associations between number of minutes of flight by month for western meadowlark and California horned lark. For both species, χ2 tests were significant, P < 0.05.
Jan Feb Mar Apr May Jun Jul Aug Sep Oct Nov Dec Jan Feb Mar Apr May Jun Jul Aug Sep Oct Nov Dec
5 43210
5.3
Western meadowlark
California horned lark
Value expectedby chance
Observed ÷ Expected Minutes in Flight
Month

128
Figure 5-31. Associations between number of minutes of perching by month for golden eagle and red-tailed hawk. For both species, χ2 tests were significant, P < 0.05.
3210
Goldeneagle
Red-tailedhawk
JanFeb
MarAprMayJunJul
AugSepOctNovDecJan
FebMar
AprMayJunJulAugSepOctNov
Dec
Value expectedby chance
Observed ÷ Expected Minutes Perching
Month

129
Figure 5-32. Associations between number of minutes of perching by month for northern harrier and prairie falcon, where lighter bars indicate expected cell values of <5 and are therefore of less reliability. For both species, χ2 tests were significant, P < 0.05.
43210
Northernharrier
Prairiefalcon
JanFeb
MarAprMayJunJul
AugSepOctNovDecJan
FebMar
AprMayJunJulAugSepOctNov
Dec
Value expectedby chance
Observed ÷ Expected Minutes Perching
Month

130
Figure 5-33. Associations between number of minutes of perching by month for American kestrel and burrowing owl. For both species, χ2 tests were significant, P < 0.05.
43210
Americankestrel
Burrowingowl
JanFeb
MarAprMayJunJul
AugSepOctNovDecJan
FebMar
AprMayJunJulAugSepOctNov
Dec
Value expectedby chance
Observed ÷ Expected Minutes Perching
Month

131
Figure 5-34. Associations between number of minutes of perching by month for turkey vulture and common raven. For both species, χ2 tests were significant, P < 0.05.
3210
Turkeyvulture
Commonraven
JanFeb
MarAprMayJunJul
AugSepOctNovDecJan
FebMar
AprMayJunJulAugSepOctNov
Dec
Value expectedby chance
Observed ÷ Expected Minutes Perching
Month
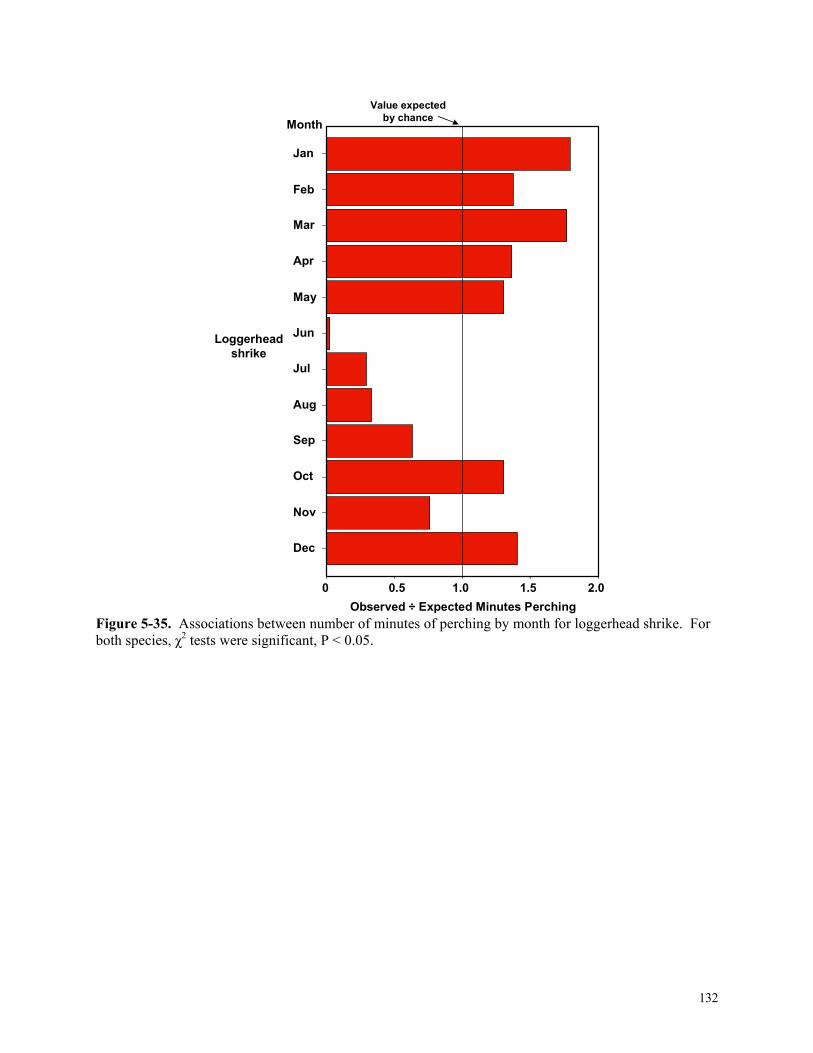
132
Figure 5-35. Associations between number of minutes of perching by month for loggerhead shrike. For both species, χ2 tests were significant, P < 0.05.
Jan
Feb
Mar
Apr
May
Jun
Jul
Aug
Sep
Oct
Nov
Dec
2.01.51.00.50
Loggerheadshrike
Value expectedby chance
Observed ÷ Expected Minutes Perching
Month

133
Figure 5-36. Associations between number of minutes of perching by month for western meadowlark and California horned lark. For both species, χ2 tests were significant, P < 0.05.
43210
11.6
JanFeb
MarAprMayJunJul
AugSepOctNovDecJan
FebMar
AprMayJunJulAugSepOctNov
Dec
Westernmeadowlark
Californiahorned lark
Value expectedby chance
Observed ÷ Expected Minutes Perching
Month

134
Figure 5-37. Associations between number of flights through the rotor zone by month for golden eagle and red-tailed hawk, where lighter bars indicate expected cell values of <5 and therefore are therefore of less reliability. For both species, χ2 tests were significant, P < 0.05.
43210
Goldeneagle
Red-tailedhawk
JanFeb
MarAprMayJunJul
AugSepOctNovDecJan
FebMar
AprMayJunJulAugSepOctNov
Dec
Value expectedby chance
Observed ÷ Expected Number of Flights through Rotor Zone
Month

135
Figure 5-38. Associations between number of flights through the rotor zone by month for northern harrier and American kestrel, where lighter bars indicate expected cell values of <5 and are therefore of less reliability. For both species, χ2 tests were significant, P < 0.05.
543210
Americankestrel
Northernharrier
JanFebMarAprMayJunJul
AugSepOctNovDec
Jan
FebMar
AprMayJunJulAugSepOctNov
Dec
Value expectedby chance
Observed ÷ Expected Number of Flights through Rotor Zone
Month

136
Figure 5-39. Associations between number of flights through the rotor zone by month for turkey vulture and common raven, where lighter bars indicate expected cell values of <5 and are therefore of less reliability. For both species, χ2 tests were significant, P < 0.05.
3210
Turkeyvulture
Commonraven
JanFeb
MarAprMayJunJul
AugSepOctNovDecJan
FebMar
AprMayJunJulAugSepOctNov
Dec
Value expectedby chance
Observed ÷ Expected Number of Flights through Rotor Zone
Month

137
Figure 5-40. Associations between number of flights through the rotor zone by month for loggerhead shrike and western meadowlark, where lighter bars indicate expected cell values of <5 and are therefore of less reliability. In the figure, “ns” denotes nonsignificant χ2 test, where P > 0.10.
43210
Loggerheadshrike
Westernmeadowlark
JanFebMarAprMayJunJul
AugSepOctNovDec
Jan
FebMar
AprMayJunJulAugSepOctNov
Dec
Value expectedby chance
Observed ÷ Expected Number of Flights through Rotor Zone
Monthns
0.10 > P > 0.05
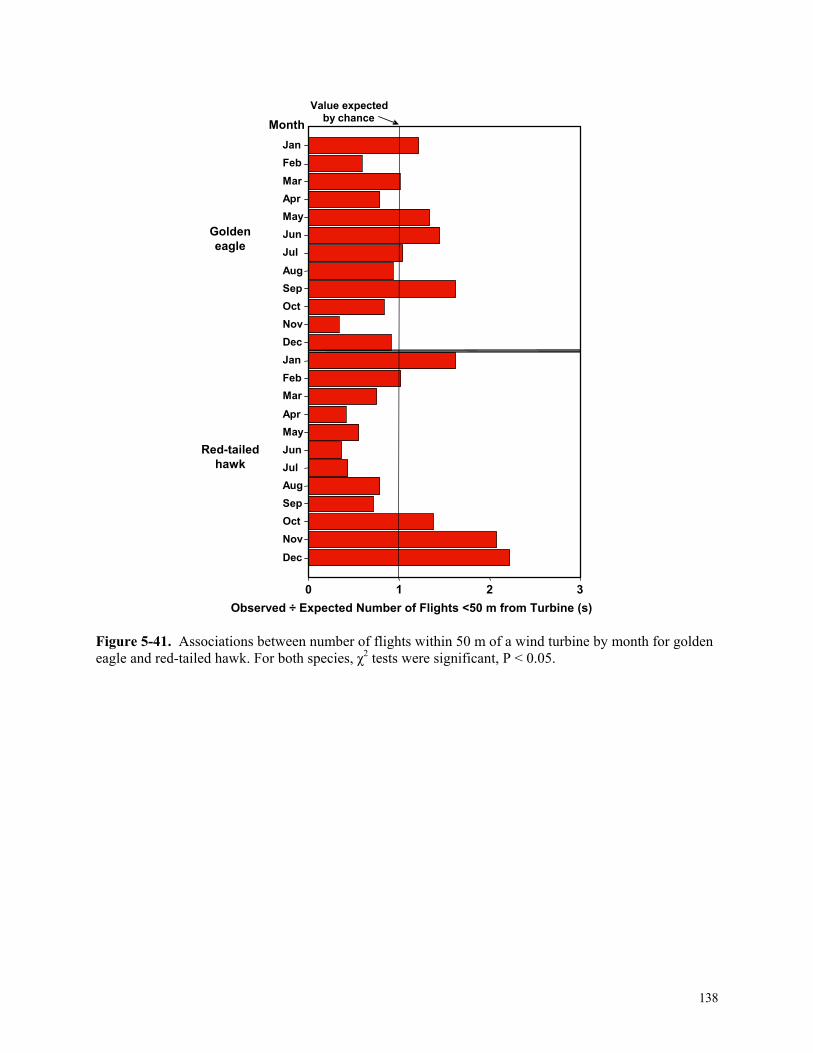
138
Figure 5-41. Associations between number of flights within 50 m of a wind turbine by month for golden eagle and red-tailed hawk. For both species, χ2 tests were significant, P < 0.05.
3 210
Golden eagle
Red - tailed hawk
Jan Feb Mar Apr May Jun Jul Aug Sep Oct Nov Dec Jan Feb Mar Apr May Jun Jul Aug Sep Oct Nov Dec
Value expectedby chance
Observed ÷ Expected Number of Flights <50 m from Turbine (s)
Month

139
Figure 5-42. Associations between number of flights within 50 m of a wind turbine by month for northern harrier and prairie falcon, where lighter bars indicate expected cell values of <5 and are therefore of less reliability. For both species, χ2 tests were significant, P < 0.05.
3.0 2.52.01.51.00.50
Northern harrier
Prairie falcon
Jan Feb Mar Apr May Jun Jul Aug Sep Oct Nov Dec Jan Feb Mar Apr May Jun Jul Aug Sep Oct Nov Dec
Value expectedby chance
Observed ÷ Expected Number of Flights <50 m from Turbine (s)
Month

140
Figure 5-43. Associations between number of flights within 50 m of a wind turbine by month for American kestrel and burrowing owl, where lighter bars indicate expected cell values of <5 and are therefore of less reliability. For both species, χ2 tests were significant, P < 0.05.
9.6
3 210
American kestrel
Burrowing owl
Jan Feb Mar Apr May Jun Jul Aug Sep Oct Nov Dec Jan Feb Mar Apr May Jun Jul Aug Sep Oct Nov Dec
Value expectedby chance
Observed ÷ Expected Number of Flights <50 m from Turbine (s)
Month

141
Figure 5-44. Associations between number of flights within 50 m of a wind turbine by month for turkey vulture and common raven. For both species, χ2 tests were significant, P < 0.05.
3.0 2.52.01.51.00.50
Turkey vulture
Common raven
Jan Feb Mar Apr May Jun Jul Aug Sep Oct Nov Dec Jan Feb Mar Apr May Jun Jul Aug Sep Oct Nov Dec
Value expectedby chance
Observed ÷ Expected Number of Flights <50 m from Turbine (s)
Month

142
Figure 5-45. Associations between number of flights within 50 m of a wind turbine by month for mallard and loggerhead shrike, where lighter bars indicate expected cell values of <5 and are therefore of less reliability. For both species, χ2 tests were significant, P < 0.05.
6 543210
Mallard
Loggerhead shrike
Jan Feb Mar Apr May Jun Jul Aug Sep Oct Nov Dec Jan Feb Mar Apr May Jun Jul Aug Sep Oct Nov Dec
Value expectedby chance
Observed ÷ Expected Number of Flights <50 m from Turbine (s)
Month

143
Figure 5-46. Associations between number of flights within 50 m of a wind turbine by month for western meadowlark and California horned lark, where lighter bars indicate expected cell values of <5 and are therefore of less reliability. For both species, χ2 tests were significant, P < 0.05.
4 3210
Jan Feb Mar Apr May Jun Jul Aug Sep Oct Nov Dec Jan Feb Mar Apr May Jun Jul Aug Sep Oct Nov Dec
Western meadowlark
California horned lark
Observed ÷ Expected Number of Flights <50 m from Turbine (s)
Value expectedby chanceMonth

144
Figure 5-47. The average minutes of flight of all birds (A) and red-tailed hawks (B) at blade height and within 50 m of operating wind turbines during each month. Wind Speed Golden eagles spent more time flying than expected by chance during the higher end of intermediate wind speeds, whereas red-tailed hawks and northern harriers flew more often during intermediate to the lower end of intermediate wind speeds (Figure 5-48). Prairie falcons preferred to fly during high winds, but American kestrels and burrowing owls preferred slow winds (Figure 5-49). Turkey vulture and common raven both preferred to fly during the slower end of intermediate wind speeds, but mallard preferred to fly during high winds (Figure 5-50). Intermediate winds were the preferred winds for flight by loggerhead shrike, western meadowlark, and California horned lark (Figure 5-51). Golden eagle, red-tailed hawk, and northern harrier spent more time perching than expected by chance during slow winds (Figure 5-52). The same was true for American kestrel, but prairie falcon perched more often during intermediate winds and burrowing owl during high winds (Figure 5-53). Turkey vulture also preferred
DecNovOctSepAugJulJunMayAprMarFebJan
Month
163192021949691216N =
45
40
35
30
25
20
15
10
5
0
Mean minutes of flight of
red-tailed hawk at blade height and within 50 m
of operating turbine
20433444124282828393924N =
35
30
25
20
15
10
5
0
DecNovOctSepAugJulJunMayAprMarFebJan
Month
Mean minutes of flight of
all bird species at blade height and within 50 m
of operating turbine
B
A

145
to perch during high winds, but common raven favored slow winds or no wind for perching (Figure 5-54). Loggerhead shrike, western meadowlark and California horned lark were all seen perching during slow winds over longer periods than expected by chance (Figure 5-55). Flights through the rotor zone were made more often than expected by chance during high winds by golden eagle, and slow winds by red-tailed hawk and northern harrier (Figure 5-56). Slow winds were favored for this behavior by American kestrel and common raven, but intermediate to high winds were favored by turkey vulture (Figure 5-57). Loggerhead shrike and western meadowlark made more of the flights than expected during slow winds, but these results were unreliable due to inadequate sample sizes (Figure 5-58). The number of flights within 50 m of turbines exceeded the number expected by chance during high winds for golden eagle, and during slow winds for red-tailed hawk and northern harrier (Figure 5-59). These flights were made disproportionately more often during slow winds by prairie falcon, American kestrel and burrowing owl (Figure 5-60), and during intermediate winds by turkey vulture, common raven and mallard (Figure 5-61). Slow to intermediate wind speeds were favored for this behavior by loggerhead shrike, western meadowlark and California horned lark (Figure 5-62).
Figure 5-48. Associations between minutes of flight by Beaufort wind force level for golden eagle, red-tailed hawk, and northern harrier. For each species, χ2 tests were significant, P < 0.05.
012345670123456701234567
3.02.52.01.51.00.50
Value expectedby chance
Observed ÷ Expected Minutes of Flight
Goldeneagle
Red-tailedhawk
Northernharrier
Wind speed,Beaufort
scale

146
Figure 5-49. Associations between minutes of flight by Beaufort wind force level for prairie falcon (not significant), American kestrel, and burrowing owl (for the latter two species, χ2 tests were significant, P < 0.05), and where lighter bars indicate expected cell values of <5 and are therefore of less reliability.
0123456701234567
43210
Value expectedby chance
Observed ÷ Expected Minutes of Flight
Prairiefalcon
Americankestrel
Burrowingowl
Wind speed,Beaufort
scale01234567
ns

147
Figure 5-50. Associations between minutes of flight by Beaufort wind force level for turkey vulture, common raven, and mallard, where lighter bars indicate expected cell values of <5 and are therefore of less reliability. For each species, χ2 tests were significant, P < 0.05.
012345670123456701234567
3.02.52.01.51.00.50Observed ÷ Expected Minutes of Flight
Turkeyvulture
Commonraven
Mallard
Value expectedby chance
Wind speed,Beaufort
scale

148
Figure 5-51. Associations between minutes of flight by Beaufort wind force level for loggerhead shrike, western meadowlark, and California horned lark, where lighter bars indicate expected cell values of <5 and are therefore of less reliability. For each species, χ2 tests were significant, P < 0.05.
012345670123456701234567
3.02.52.01.51.00.50Observed ÷ Expected Minutes of Flight
Loggerheadshrike
Westernmeadowlark
Californiahorned lark
Value expectedby chance
Wind speed,Beaufort
scale

149
Figure 5-52. Associations between minutes of perching by Beaufort wind force level for golden eagle, red-tailed hawk, and northern harrier. For each species, χ2 tests were significant, P < 0.05.
012345670123456701234567
543210Observed ÷ Expected Minutes of Perching
Goldeneagle
Red-tailedhawk
Northernharrier
Value expectedby chance
Wind speed,Beaufort
scale

150
Figure 5-53. Associations between minutes of perching by Beaufort wind force level for prairie falcon, American kestrel, and burrowing owl. For each species, χ2 tests were significant, P < 0.05.
01234567
0123456701234567
43210Observed ÷ Expected Minutes of Perching
Prairiefalcon
Americankestrel
Burrowingowl
Value expectedby chance
Wind speed,Beaufort
scale

151
Figure 5-54. Associations between minutes of perching by Beaufort wind force level for turkey vulture and common raven. For both species, χ2 tests were significant, P < 0.05.
0
1
2
3
4
5
6
7
0
1
2
3
4
5
6
7
43210Observed ÷ Expected Minutes of Perching
Turkeyvulture
Commonraven
Value expectedby chance
Wind speed,Beaufort
scale

152
Figure 5-55. Associations between minutes of perching by Beaufort wind force level for loggerhead shrike, western meadowlark, and California horned lark. For each species, χ2 tests were significant, P < 0.05.
5.9
Observed ÷ Expected Minutes of Perching
012345670123456701234567
43210
Loggerheadshrike
Westernmeadowlark
Californiahorned lark
Value expectedby chance
Wind speed,Beaufort
scale

153
Figure 5-56. Associations between number of flights through the rotor zone by Beaufort wind force level for golden eagle (not significant), red-tailed hawk, and northern harrier (signficant χ2 tests, P < 0.05), and where lighter bars indicate expected cell values of <5 and are therefore of less reliability.
0 1 2 3 4 5 6 7 0 1 2 3 4 5 6 7 0 1 2 3 4 5 6 7
4 3210
Golden eagle
Red - tailed hawk
Northern harrier
Observed ÷ Expected Number of Flights through Rotor Zone
Value expectedby chance
Wind speed, Beaufort
scale ns

154
Figure 5-57. Associations between number of flights through the rotor zone by Beaufort wind force level for American kestrel, turkey vulture, and common raven, where lighter bars indicate expected cell values of <5 and are therefore of less reliability. For each species, χ2 tests were significant, P < 0.05.
0 1 2 3 4 5 6 7 0 1 2 3 4 5 6 7 0 1 2 3 4 5 6 7
4 3210
Turkey vulture
Common raven
American kestrel
Observed ÷ Expected Number of Flights through Rotor Zone
Value expectedby chance
Wind speed, Beaufort
scale

155
Figure 5-58. Associations between number of flights through the rotor zone by Beaufort wind force level for loggerhead shrike, and western meadowlark (not significant), and where lighter bars indicate expected cell values of <5 and are therefore of less reliability.
0
1
2
3
4
5
6
7
0
1
2
3
4
5
6
7
4 3210
Loggerhead shrike
Western meadowlark
Observed ÷ Expected Number of Flights through Rotor Zone
Value expectedby chance
Wind speed,Beaufort
scale
ns
0.10 > P > 0.05

156
Figure 5-59. Associations between number of flights within 50 m of a wind turbine by Beaufort wind force level for golden eagle, red-tailed hawk, and northern harrier, where lighter bars indicate expected cell values of <5 and are therefore of less reliability. For each species, χ2 tests were significant, P < 0.05.
0 1 2 3 4 5 6 7 0 1 2 3 4 5 6 7 0 1 2 3 4 5 6 7
2.5 2.01.51.00.50 Observed ÷ Expected Number of Flights <50 m from Turbines
Golden eagle
Red - tailed hawk
Northern harrier
Value expectedby chance
Wind speed, Beaufort
scale

157
Figure 5-60. Associations between number of flights within 50 m of a wind turbine by Beaufort wind force level for prairie falcon, American kestrel, and burrowing owl (χ2 tests for latter two species were significant, P < 0.05). Lighter bars indicate expected cell values of <5 and are therefore of less reliability.
4.4
0 1 2 3 4 5 6 7 0 1 2 3 4 5 6 7 0 1 2 3 4 5 6 7
2.5 2.01.51.00.50 Observed ÷ Expected Number of Flights <50 m from Turbines
Prairie falcon
American kestrel
Burrowing owl
Value expectedby chance
Wind speed, Beaufort
scale 0.10 > P > 0.05

158
Figure 5-61. Associations between number of flights within 50 m of a wind turbine by Beaufort wind force level for turkey vulture, common raven (χ2 tests were significant, P < 0.05), and mallard (not significant). Lighter bars indicate expected cell values of <5 and are therefore of less reliability.
0 1 2 3 4 5 6 7 0 1 2 3 4 5 6 7 0 1 2 3 4 5 6 7
2.5 2.01.51.00.50 Observed ÷ Expected Number of Flights <50 m from Turbine (s)
Turkey vulture
Common raven
Mallard
Value expectedby chance
Wind speed, Beaufort
scale
ns
159
Figure 5-62. Associations between number of flights within 50 m of a wind turbine by Beaufort wind force level for loggerhead shrike, western meadowlark, and California horned lark. For each species, χ2 tests were significant, P < 0.05. Lighter bars indicate expected cell values of <5 and are therefore of less reliability. Wind Direction (origin) Golden eagles spent disproportionately more time flying during east and southwest winds, red-tailed hawks during northwest winds, and northern harriers during north, northeast, east, southeast, and south winds (Figure 5-63). Prairie falcons favored north winds in which to fly, American kestrels favored north and east winds, and burrowing owls favored southwest winds (Figure 5-64). Turkey vultures favored northeast winds; common ravens flew more often in north, northeast east and southeast winds, and mallard in northeast and southwest winds (Figure 5-65). East and southeast winds were favorite winds to fly in by loggerhead shrikes and western meadowlarks and California horned larks favored southwest and west winds (Figure 5-66). Perching by golden eagles exceeded the time expected by chance during no winds or when winds originated from the east, southeast and south (Figure 5-67). Red-tailed hawks preferred to perch during north, northeast and east winds, and northern harriers preferred to perch during east winds (Figure 5-68). Prairie falcons
0 1 2 3 4 5 6 7 0 1 2 3 4 5 6 7 0 1 2 3 4 5 6 7
2.5 2.01.51.00.50 Observed ÷ Expected Number of Flights <50 m from Turbine(s)
Value expectedby chance
Loggerhead shrike
Western meadowlark
California horned lark
Wind speed, Beaufort
scale

160
preferred to perch during northeast winds, American kestrels during north, northeast, east, southeast and south winds, and burrowing owls during east winds (Figure 5-68). Turkey vultures preferred northeast winds for perching, and common ravens preferred no winds or southeast and south winds (Figure 5-69). Loggerhead shrikes spent a disproportionate amount of time perching during east winds, western meadowlarks during no winds or east, southeast and south winds, and California horned larks during west and northwest winds (Figure 5-70). Flights through the rotor zone were made more often than expected by chance in north, northeast, and east winds by red-tailed hawk and northern harrier (Figure 5-71), as well as by American kestrel and common raven (Figure 5-72). Western meadowlark flew through the rotor zone more often than expected in no winds and in northeast, southeast and south winds (Figure 5-73). Flights within 50 m of turbines were disproportionately more common in northeast and southwest winds by golden eagle, north and northeast winds by red-tailed hawk, and north, east and southeast winds by northern harrier (Figure 5-74). They were more common in north and northwest winds by prairie falcon, north and east winds by American kestrel, and east winds by burrowing owl (Figure 5-75). Turkey vultures preferred to make such flights in north winds, and common ravens in north, southeast and south winds (Figure 5-76). Loggerhead shrikes made more of these flights than expected in west winds, western meadowlarks in northeast and southeast winds, and California horned larks in northeast and northwest winds (Figure 5-77).

161
Figure 5-63. Associations between minutes of flight by wind direction for golden eagle, red-tailed hawk, and northern harrier. For each species, χ2 tests were significant, P < 0.05.
0N
NEE
SES
SWWNW0N
NEE
SES
SWW
NW0N
NEE
SES
SWW
NW
3.53.02.52.01.51.00.50Observed ÷ Expected Minutes of Flight
Value expectedby chanceWind direction
(Origin)
Goldeneagle
Red-tailedhawk
Northernharrier

162
Figure 5-64. Associations between minutes of flight by wind direction for prairie falcon, American kestrel, and burrowing owl. For each species, χ2 tests were significant, P < 0.05. Lighter bars indicate expected cell values of <5 and are therefore of less reliability.
3.53.02.52.01.51.00.50
4.2
Observed ÷ Expected Minutes of Flight
Value expectedby chanceWind direction
(Origin)
Prairiefalcon
Americankestrel
Burrowingowl
0N
NEE
SES
SWWNW0N
NEE
SES
SWW
NW0N
NEE
SES
SWW
NW

163
Figure 5-65. Associations between minutes of flight by wind direction for turkey vulture, common raven, and mallard. For each species, χ2 tests were significant, P < 0.05. Lighter bars indicate expected cell values of <5 and are therefore of less reliability.
3.53.02.52.01.51.00.50Observed ÷ Expected Minutes of Flight
Value expectedby chanceWind direction
(Origin)
Turkeyvulture
Commonraven
Mallard
0N
NEE
SES
SWWNW0N
NEE
SES
SWW
NW0N
NEE
SES
SWW
NW

164
Figure 5-66. Associations between minutes of flight by wind direction for loggerhead shrike (not significant), western meadowlark, and California horned lark (χ2 tests were significant, P < 0.05). Lighter bars indicate expected cell values of <5 and are therefore of less reliability.
3.53.02.52.01.51.00.50Observed ÷ Expected Minutes of Flight
Loggerheadshrike
Westernmeadowlark
Californiahorned lark
Value expectedby chanceWind direction
(Origin)0N
NEE
SES
SWWNW0N
NEE
SES
SWW
NW0N
NEE
SES
SWW
NW
ns

165
Figure 5-67. Associations between minutes of perching by wind direction for golden eagle, red-tailed hawk, and northern harrier. For each species, χ2 tests were significant, P < 0.05. Lighter bars indicate expected cell values of <5 and are therefore of less reliability.
9.0
543210Observed ÷ Expected Minutes of Perching
Value expectedby chanceWind direction
(Origin)
Goldeneagle
Red-tailedhawk
Northernharrier
0N
NEE
SES
SWWNW0N
NEE
SES
SWW
NW0N
NEE
SES
SWW
NW

166
Figure 5-68. Associations between minutes of perching by wind direction for prairie falcon, American kestrel, and burrowing owl. For each species, χ2 tests were significant, P < 0.05. Lighter bars indicate expected cell values of <5 and are therefore of less reliability.
543210Observed ÷ Expected Minutes of Perching
Value expectedby chanceWind direction
(Origin)
Prairiefalcon
Americankestrel
Burrowingowl
0N
NEE
SES
SWWNW0N
NEE
SES
SWW
NW0N
NEE
SES
SWW
NW

167
Figure 5-69. Associations between minutes of perching by wind direction for turkey vulture, and common raven. For both species, χ2 tests were significant, P < 0.05. Lighter bars indicate expected cell values of <5 and are therefore of less reliability.
543210Observed ÷ Expected Minutes of Perching
Turkeyvulture
Commonraven
Value expectedby chanceWind direction
(Origin)0
N
NE
E
SE
S
SW
W
NW
0
N
NE
E
SE
S
SW
W
NW

168
Figure 5-70. Associations between minutes of perching by wind direction for loggerhead shrike, western meadowlark, and California horned lark. For each species, χ2 tests were significant, P < 0.05.
5.6
543210Observed ÷ Expected Minutes of Perching
Loggerheadshrike
Westernmeadowlark
Californiahorned lark
Value expectedby chanceWind direction
(Origin)0N
NEE
SES
SWWNW0N
NEE
SES
SWW
NW0N
NEE
SES
SWW
NW

169
Figure 5-71. Associations between number of flights through the rotor zone by wind direction for golden eagle (not significant), red-tailed hawk, and northern harrier (χ2 tests were significant, P < 0.05). Lighter bars indicate expected cell values of <5 and are therefore of less reliability.
13.5
4 3210
Golden eagle
Red - tailed hawk
Northern harrier
Observed ÷ Expected Number of Flights through Rotor Zone
Value expectedby chanceWind direction
(Origin) 0 N
NE E
SE S
SW W NW 0 N
NE E
SE S
SW W
NW 0 N
NE E
SE S
SW W
NW
ns

170
Figure 5-72. Associations between number of flights through the rotor zone by Beaufort wind force level for American kestrel (χ2 test was significant, P < 0.05), turkey vulture (not significant), and common raven (χ2 test was significant, P < 0.05). Lighter bars indicate expected cell values of <5 and are therefore of less reliability.
4 3210 Observed ÷ Expected Number of Flights through Rotor Zone
Value expectedby chanceWind direction
(Origin)
Turkey vulture
Common raven
American kestrel
0 N
NE E
SE S
SW W NW 0 N
NE E
SE S
SW W
NW 0 N
NE E
SE S
SW W
NW
ns

171
Figure 5-73. Associations between number of flights through the rotor zone by wind direction for loggerhead shrike (not significant) and western meadowlark (χ2 tests was significant, P < 0.05). Lighter bars indicate expected cell values of <5 and are therefore of less reliability.
7.4
4 3210 Observed ÷ Expected Number of Flights through Rotor Zone
Value expectedby chanceWind direction
(Origin)
Loggerhead shrike
Western meadowlark
0 N
NE E
SE S
SW W NW 0 N
NE E
SE S
SW W
NW
ns

172
Figure 5-74. Associations between number of flights within 50 m of a wind turbine by wind direction for golden eagle, red-tailed hawk, and northern harrier. For each species, χ2 tests were significant, P < 0.05. Lighter bars indicate expected cell values of <5 and are therefore of less reliability.
5 43210
Golden eagle
Red - tailed hawk
Northern harrier
Value expectedby chanceWind direction
(Origin)
Observed ÷ Expected Number of Flights <50 m from Turbine (s)
0 N
NE E
SE S
SW W NW 0 N
NE E
SE S
SW W
NW 0 N
NE E
SE S
SW W
NW

173
Figure 5-75. Associations between number of flights within 50 m of a wind turbine by wind direction for prairie falcon, American kestrel, and burrowing owl. For each species, χ2 tests were significant, P < 0.05. Lighter bars indicate expected cell values of <5 and are therefore of less reliability.
28.5
5 43210
Value expectedby chanceWind direction
(Origin)
Observed ÷ Expected Number of Flights <50 m from Turbine (s)
Prairie falcon
American kestrel
Burrowing owl
0 N
NE E
SE S
SW W NW 0 N
NE E
SE S
SW W
NW 0 N
NE E
SE S
SW W
NW

174
Figure 5-76. Associations between number of flights within 50 m of a wind turbine by wind direction for turkey vulture, common raven (χ2 tests were significant, P < 0.05), and mallard (not significant). Lighter bars indicate expected cell values of <5 and are therefore of less reliability.
5 43210
Value expectedby chanceWind direction
(Origin)
Observed ÷ Expected Number of Flights <50 m from Turbine (s)
Turkey vulture
Common raven
Mallard
0 N
NE E
SE S
SW W NW 0 N
NE E
SE S
SW W
NW 0 N
NE E
SE S
SW W
NW
ns

175
Figure 5-77. Associations between number of flights within 50 m of a wind turbine by wind direction for loggerhead shrike, western meadowlark, and California horned lark. For each species, χ2 tests were significant, P < 0.05. Lighter bars indicate expected cell values of <5 and are therefore of less reliability. Squirrel Activity While ground squirrels were active, flight activity extended longer than expected by chance for golden eagle, northern harrier, burrowing owl, loggerhead shrike, and western meadowlark (Figure 5-78). Flight time was disproportionately longer during periods of no squirrel activity for red-tailed hawk, American kestrel, turkey vulture, common raven, and California horned lark (Figure 5-78). Perching and flying related similarly to squirrel activity, although turkey vultures and common ravens perched longer than expected while squirrels were active, and prairie falcons perched longer while squirrels were inactive (Figure 5-79). While ground squirrels were active, flights through the rotor zone were more common than expected by chance for golden eagle, and while squirrels were inactive, these flights were more common for red-tailed hawk and American kestrel (Figure 5-80).
5 43210
Value expectedby chanceWind direction
(Origin)
Observed ÷ Expected Number of Flights <50 m from Turbine (s)
Loggerhead shrike
Western meadowlark
California horned lark
0 N
NE E
SE S
SW W NW 0 N
NE E
SE S
SW W
NW 0 N
NE E
SE S
SW W
NW

176
While ground squirrels were active, flights within 50 m of turbines were more common than expected for golden eagle, northern harrier, prairie falcon, burrowing owl, and loggerhead shrike, and they were less common for red-tailed hawk, American kestrel, turkey vulture, common raven, and California horned lark (Figure 5-81).
Figure 5-78. Associations between minutes of flight per ground squirrel activity level during behavioral observation sessions. For each species except prairie falcon, χ2 tests were significant, P < 0.05. Lighter bars indicate expected cell values of <5 and are therefore of less reliability.
yesnoyesnoyesnoyesnoyesnoyesnoyesnoyesnoyesnoyesnoyesnoyesno
3.53.02.52.01.51.00.50Observed ÷ Expected Minutes of Flight
Squirrelactivity?
Goldeneagle
Red-tailedhawk
Northernharrier
Prairiefalcon
Americankestrel
Turkeyvulture
Commonraven
Loggerheadshrike
Burrowingowl
Westernmeadowlark
Mallard
Hornedlark
Value expectedby chance
ns

177
Figure 5-79. Associations between minutes of perching per ground squirrel activity level during behavioral observation sessions. For each species except western meadowlark, χ2 tests were significant, P < 0.05.
yesnoyesnoyesnoyesnoyesnoyesnoyesnoyesnoyesnoyesnoyesno
3.53.02.52.01.51.00.50Observed ÷ Expected Minutes of Perching
Squirrelactivity?
Goldeneagle
Red-tailedhawk
Northernharrier
Prairiefalcon
Americankestrel
Turkeyvulture
Commonraven
Loggerheadshrike
Burrowingowl
Westernmeadowlark
Hornedlark
Value expectedby chance
ns

178
Figure 5-80. Associations between number of flights through the rotor zone per ground squirrel activity level during behavioral observation sessions. In the figure, “ns” denotes χ2 tests that were not significant, and no notation represents χ2 tests that were significant, P < 0.05. Lighter bars indicate expected cell values of <5 and are therefore of less reliability.
yes
no
yes
no
yes
no
yes
no
yes
no
yes
no
yes
no
yes
no
2.0 1.51.00.50 Observed ÷ Expected Number of Flights through Rotor Zone
Squirrel activity?
Golden eagle
Red- tailed hawk
Northern harrier
American kestrel
Turkey vulture
Common raven
Loggerhead shrike
Western meadowlark
Value expectedby chance
ns
ns
ns
ns
ns

179
Figure 5-81. Associations between number of flights within 50 m of a turbine per ground squirrel activity level during behavioral observation sessions. In the figure, “ns” denotes χ2 tests that were not significant, and no notation represents χ2 tests that were significant, P < 0.05. Squirrel Numbers As more squirrels were active, there was a disproportionate increase in flight time recorded for golden eagle, burrowing owl and loggerhead shrike, and a proportionate decrease in flight time for red-tailed hawk, turkey vulture, and California horned lark (Figure 5-82). As more squirrels were active, there was a proportionate increase in perch time recorded for burrowing owl and common raven, and a proportionate decrease for red-tailed hawk, American kestrel, and horned lark. When squirrels were active but numbered fewer than two per session, more than the expected time was devoted to perching by golden eagles, turkey vultures and loggerhead shrikes (Figure 5-83). Golden eagle flights through the rotor zone were reported more often than expected by chance when squirrels were more numerous, but red-tailed hawks flew through the rotor zone less often than expected while more squirrels were seen (Figure 5-84).
3.5 3.02.52.01.51.00.50 Observed ÷ Expected Number of Flights <50 m from Turbine(s)
Squirrel activity?
yes no
yes no
yes no
yes no
yes no
yes no
yes no
yes no
yes no
yes no
yes no
yes no
Golden eagle
Red - tailed hawk
Northern harrier Prairie falcon
American kestrel
Turkey vulture
Common raven
Loggerhead shrike
Burrowing owl
Western meadowlark
Mallard
Horned lark
Value expectedby chance
ns
ns

180
Golden eagle flights within 50 m of turbines disproportionately increased with greater numbers of squirrels seen, as did the flights of northern harrier and loggerhead shrike (Figure 5-85). The reverse was true for red-tailed hawk and California horned lark. The appearance of fewer than two squirrels per session associated with more flights within 50 m made by prairie falcon and burrowing owl (Figure 5-85).
Figure 5-82. Associations between minutes of flight per ground squirrel abundance level during behavioral observation sessions. In the figure, “ns” denotes χ2 tests that were not significant, and no notation represents χ2 tests that were significant, P < 0.05.

181
Figure 5-83. Associations between minutes of perching per ground squirrel abundance level during behavioral observation sessions. All tests were significant, P < 0.05.

182
Figure 5-84. Associations between number of flights through the rotor zone per ground squirrel abundance level during behavioral observation sessions. In the figure, “ns” denotes χ2 tests that were not significant, and no notation represents χ2 tests that were significant, P < 0.05. Lighter bars indicate expected cell values of <5 and are therefore of less reliability.

183
Figure 5-85. Associations between number of flights within 50 m of a turbine per ground squirrel abundance level during behavioral observation sessions. In the figure, “ns” denotes χ2 tests that were not significant, and no notation represents χ2 tests that were significant, P < 0.05. Lighter bars indicate expected cell values of <5 and are therefore of less reliability. Session Start Time Flight time was reported more often than expected by chance around 08:00 hours for common raven, mallard and California horned lark, 10:00 hours for burrowing owl, loggerhead shrike and western meadowlark, noon for golden eagle, turkey vulture and common raven, 14:00 hours for red-tailed hawk, northern harrier, American kestrel and western meadowlark, and 18:00 hours for prairie falcon (Figures 5-86 and 5-87). Perch time exceeded chance at 08:00 hours for golden eagle, common raven and horned lark, 10:00 hours for common raven and western meadowlark, 12:00 hours for prairie falcon, turkey vulture, and horned lark, 14:00 hours for northern harrier, prairie falcon, American kestrel, burrowing owl and western meadowlark, 16:00 hours for turkey vulture, and 18:00 hours for loggerhead shrike (Figures 5-88 and 5-89). Flights through the rotor zone exceeded chance around 08:00 hours for American kestrel and common raven, 10:00 through 12:00 hours for turkey vulture and western meadowlark, 12:00 through 14:00 hours for red-tailed hawk, and 14:00 hours for northern harrier (Figures 5-90 and 5-91). Flights within 50 m of turbines

184
occurred more often than expected by chance at 08:00 hours for mallard, 10:00 hours for western meadowlark, 12:00 hours for golden eagle turkey vulture common raven and loggerhead shrike, 14:00 hours for red-tailed hawk, 16:00 hours for burrowing owl, and 18:00 hours for prairie falcon and mallard (Figures 5-92 and 5-93).
Figure 5-86. Associations between minutes of flight per session start time and raptor species. All tests were significant, P < 0.05.
43210
08:0010:0012:0014:0016:0018:0008:0010:0012:0014:0016:0018:0008:0010:0012:0014:0016:0018:0008:0010:0012:0014:0016:0018:0008:0010:0012:0014:0016:0018:0008:0010:0012:0014:0016:0018:00
Goldeneagle
Red-tailedhawk
Northernharrier
Prairiefalcon
Americankestrel
Burrowingowl
~Session starttime (hour)
Value expectedby chance
Observed ÷ Expected Minutes of Flight

185
Figure 5-87. Associations between minutes of flight per session start time and nonraptor species. All tests were significant, P < 0.05. Lighter bars indicate expected cell values of <5 and are therefore of less reliability.
6.0
43210
Turkeyvulture
Commonraven
Loggerheadshrike
Westernmeadowlark
Mallard
Hornedlark
~Session starttime (hour)
Value expectedby chance
Observed ÷ Expected Minutes of Flight
08:0010:0012:0014:0016:0018:0008:0010:0012:0014:0016:0018:0008:0010:0012:0014:0016:0018:0008:0010:0012:0014:0016:0018:0008:0010:0012:0014:0016:0018:0008:0010:0012:0014:0016:0018:00

186
Figure 5-88. Associations between minutes of perching per session start time and raptor species. All tests were significant, P < 0.05.
43210
Goldeneagle
Red-tailedhawk
Northernharrier
Prairiefalcon
Americankestrel
Burrowingowl
~Session starttime (hour)
Value expectedby chance
Observed ÷ Expected Minutes of Perching
08:0010:0012:0014:0016:0018:0008:0010:0012:0014:0016:0018:0008:0010:0012:0014:0016:0018:0008:0010:0012:0014:0016:0018:0008:0010:0012:0014:0016:0018:0008:0010:0012:0014:0016:0018:00

187
Figure 5-89. Associations between minutes of perching per session start time and nonraptor species. All tests were significant, P < 0.05.
43210
Turkeyvulture
Commonraven
Loggerheadshrike
Westernmeadowlark
Hornedlark
~Session starttime (hour)
Value expectedby chance
Observed ÷ Expected Minutes of Perching
08:0010:0012:0014:0016:0018:0008:0010:0012:0014:0016:0018:0008:0010:0012:0014:0016:0018:0008:0010:0012:0014:0016:0018:0008:0010:0012:0014:0016:0018:00

188
Figure 5-90. Associations between number of flights through the rotor zone per session start time and raptor species. In the figure, “ns” denotes χ2 tests that were not significant, and no notation represents χ2 tests that were significant, P < 0.05. Lighter bars indicate expected cell values of <5 and are therefore of less reliability.
3.0 2.52.01.51.00.50
Golden eagle
Red - tailed hawk
Northern harrier
American kestrel
~ Session start time (hour)
Value expectedby chance
Observed ÷ Expected Number of Flights through Rotor Zone
08:00 10:00 12:00 14:00 16:00 18:00 08:00 10:00 12:00 14:00 16:00 18:00 08:00 10:00 12:00 14:00 16:00 18:00 08:00 10:00 12:00 14:00 16:00 18:00
ns

189
Figure 5-91. Associations between number of flights through the rotor zone per session start time and nonraptor species. In the figure, “ns” denotes χ2 tests that were not significant, and no notation represents χ2 tests that were significant, P < 0.05. Lighter bars indicate expected cell values of <5 and are therefore of less reliability.
08:00 10:00 12:00 14:00 16:00 18:00 08:00 10:00 12:00 14:00 16:00 18:00 08:00 10:00 12:00 14:00 16:00 18:00 08:00 10:00 12:00 14:00 16:00 18:00
3.0 2.52.01.51.00.50
Turkey vulture
Common raven
Loggerhead shrike
Western meadowlark
~ Session start time (hour)
Value expectedby chance
Observed ÷ Expected Number of Flights through Rotor Zone
ns
0.10 > P > 0.05
0.10 > P > 0.05
0.10 > P > 0.05

190
Figure 5-92. Associations between number of flights within 50 m of a wind turbine per session start time and raptor species. All tests were significant, P < 0.05.
5.0
3.0 2.52.01.51.00.50
Golden eagle
Red - tailed hawk
Northern harrier
Prairie falcon
American kestrel
Burrowing owl
~ Session start time (hour)
Value expectedby chance
Observed ÷ Expected Number of Flights <50 m from Turbine(s)
08:00 10:00 12:00 14:00 16:00 18:00 08:00 10:00 12:00 14:00 16:00 18:00 08:00 10:00 12:00 14:00 16:00 18:00 08:00 10:00 12:00 14:00 16:00 18:00 08:00 10:00 12:00 14:00 16:00 18:00 08:00 10:00 12:00 14:00 16:00 18:00

191
Figure 5-93. Associations between number of flights within 50 m of a wind turbine per session start time and nonraptor species. In the figure, “ns” denotes χ2 tests that were not significant, and no notation represents χ2 tests that were significant, P < 0.05. Lighter bars indicate expected cell values of <5 and are therefore of less reliability. Temperature Flight time was disproportionately greater at 45˚ F for common raven, mallard and horned lark, 55˚ F for red-tailed hawk, 55˚-65˚ F for western meadowlark, 65˚ for northern harrier and burrowing owl, 75˚-95˚ F for golden eagle, 85˚ F for Loggerhead shrike, 85˚-95˚ F for prairie falcon, 95˚ F for American kestrel, and 85˚ F and greater for turkey vulture (Figures 5-94 through 5-96). Perching was reported more often than expected at 45˚-55˚ F for red-tailed hawk, American kestrel, common raven and loggerhead shrike, at 55˚-65˚ F for golden eagle, northern harrier, western meadowlark and horned lark, at 65˚-75˚ F for prairie falcon and burrowing owl, at 75˚-85˚ F for turkey vulture, and at 95˚-105˚ F for golden eagle, northern harrier and prairie falcon (Figures 5-97 through 5-99). More flights than expected went through the rotor zone at 45˚ F for loggerhead shrike and western meadowlark, at 55˚ F for red-tailed hawk and common raven, 65˚ F for northern harrier, and at 75˚ F for turkey vulture (Figures 5-100 and 5-
3.0 2.52.01.51.00.50
Turkey vulture
Common raven
Loggerhead shrike
Western meadowlark
Mallard
Horned lark
~ Session start time (hour)
Value expectedby chance
Observed ÷ Expected Number of Flights <50 m from Turbine(s)
08:00 10:00 12:00 14:00 16:00 18:00 08:00 10:00 12:00 14:00 16:00 18:00 08:00 10:00 12:00 14:00 16:00 18:00 08:00 10:00 12:00 14:00 16:00 18:00 08:00 10:00 12:00 14:00 16:00 18:00 08:00 10:00 12:00 14:00 16:00 18:00
ns
0.10 > P > 0.05
192
101). More flights than expected were within 50 m at 45˚ F for northern harrier, American kestrel, loggerhead shrike, and horned lark, at 55˚ F for red-tailed hawk and common raven, at 65˚ F for burrowing owl, and at 75˚ F for turkey vulture (Figures 5-102 through 5-104).
Figure 5-94. Associations between minutes of flight by temperature at the start of the behavior observation session for golden eagle, red-tailed hawk, northern harrier, and prairie falcon. All tests were significant, P < 0.05. Lighter bars indicate expected cell values of <5 and are therefore of less reliability.
455565758595
105455565758595
105455565758595
105455565758595
105
3.02.52.01.51.00.50
Temperature (°F)at session start
Value expectedby chance
Observed ÷ Expected Minutes of Flight
Goldeneagle
Red-tailedhawk
Northernharrier
Prairiefalcon

193
Figure 5-95. Associations between minutes of flight by temperature at the start of the behavior observation session for American kestrel, burrowing owl, turkey vulture, and common raven. All tests were significant, P < 0.05.
3.4
455565758595
105455565758595
105455565758595
105455565758595
105
3.02.52.01.51.00.50
Temperature (°F)at session start
Value expectedby chance
Observed ÷ Expected Minutes of Flight
Turkeyvulture
Commonraven
Americankestrel
Burrowingowl

194
Figure 5-96. Associations between minutes of flight by temperature at the start of the behavior observation session for mallard, loggerhead shrike, western meadowlark, and horned lark. All tests were significant, P < 0.05. Lighter bars indicate expected cell values of <5 and are therefore of less reliability.
455565758595
105455565758595
105455565758595
105455565758595
105
3.02.52.01.51.00.50
Temperature (°F)at session start
Value expectedby chance
Observed ÷ Expected Minutes of Flight
Loggerheadshrike
Westernmeadowlark
Mallard
Hornedlark

195
Figure 5-97. Associations between minutes of perching by temperature at the start of the behavior observation session for golden eagle, red-tailed hawk, northern harrier, and prairie falcon. All tests were significant, P < 0.05.
455565758595
105455565758595
105455565758595
105455565758595
105
2.52.01.51.00.50Observed ÷ Expected Minutes of Perching
Goldeneagle
Red-tailedhawk
Northernharrier
Prairiefalcon
Temperature (°F)at session start
Value expectedby chance

196
Figure 5-98. Associations between minutes of perching by temperature at the start of the behavior observation session for American kestrel, burrowing owl, turkey vulture, and common raven. All tests were significant, P < 0.05.
455565758595
105455565758595
105455565758595
105455565758595
105
2.52.01.51.00.50Observed ÷ Expected Minutes of Perching
Turkeyvulture
Commonraven
Americankestrel
Burrowingowl
Temperature (°F)at session start
Value expectedby chance

197
Figure 5-99. Associations between minutes of perching by temperature at the start of the behavior observation session for loggerhead shrike, western meadowlark, and horned lark. All tests were significant, P < 0.05.
45
55
65
75
85
95
105
45
55
65
75
85
95
105
45
55
65
75
85
95
105
2.52.01.51.00.50Observed ÷ Expected Minutes of Perching
Loggerheadshrike
Westernmeadowlark
Hornedlark
Temperature (°F)at session start
Value expectedby chance

198
Figure 5-100. Associations between number of flights through the rotor zone by temperature at the start of the behavior observation session for golden eagle, red-tailed hawk, northern harrier, and American kestrel. In the figure, “ns” denotes χ2 tests that were not significant, and no notation represents χ2 tests that were significant, P < 0.05. Lighter bars indicate expected cell values of <5 and are therefore of less reliability.
45 55 65 75 85 95
105 45 55 65 75 85 95
105 45 55 65 75 85 95
105 45 55 65 75 85 95
105 4 3210
American kestrel
Golden eagle
Red - tailed hawk
Northern harrier
Observed ÷ Expected Number of Flights through Rotor Zone
Temperature ( ° F) at s ession start
Value expectedby chance
ns
ns

199
Figure 5-101. Associations between number of flights through the rotor zone by temperature at the start of the behavior observation session for turkey vulture, common raven, loggerhead shrike, and western meadowlark. All tests were significant, P < 0.05. Lighter bars indicate expected cell values of <5 and are therefore of less reliability.
45 55 65 75 85 95
105 45 55 65 75 85 95
105 45 55 65 75 85 95
105 45 55 65 75 85 95
105 4 3210
Turkey vulture
Common raven
Loggerhead shrike
Western meadowlark
Observed ÷ Expected Number of Flights through Rotor Zone
Temperature ( ° F)at s ession start
Value expectedby chance
0.10 > P > 0.05
0.10 > P > 0.05

200
Figure 5-102. Associations between number of flights within 50 m of a wind turbine by temperature at the start of the behavior observation session for golden eagle, red-tailed hawk, northern harrier, and prairie falcon. All tests were significant, P < 0.05. Lighter bars indicate expected cell values of <5 and are therefore of less reliability.
45 55 65 75 85 95
105 45 55 65 75 85 95
105 45 55 65 75 85 95
105 45 55 65 75 85 95
105 4 3210
Observed ÷ Expected Number of Flights <50 m from Turbine(s)
Golden eagle
Red - tailed hawk
Northern harrier
Prairie falcon
Temperature ( ° F) at s ession start
Value expectedby chance
0.10 > P > 0.05
201
Figure 5-103. Associations between number of flights within 50 m of a wind turbine by temperature at the start of the behavior observation session for American kestrel, burrowing owl, turkey vulture, and common raven. All tests were significant, P < 0.05.
45 55 65 75 85 95
105 45 55 65 75 85 95
105 45 55 65 75 85 95
105 45 55 65 75 85 95
105 4 3210
Observed ÷ Expected Number of Flights <50 m from Turbine(s)
Turkey vulture
Common raven
American kestrel
Burrowing owl
Temperature ( ° F) at s ession start
Value expectedby chance
202
Figure 5-104. Associations between number of flights within 50 m of a wind turbine by temperature at the start of the behavior observation session for mallard, loggerhead shrike, western meadowlark, and horned lark. In the figure, “ns” denotes χ2 tests that were not significant, and no notation represents χ2 tests that were significant, P < 0.05. Lighter bars indicate expected cell values of <5 and are therefore of less reliability. Proximity Zone All of the species we selected for detailed analysis were recorded flying within 50 m of the turbines for longer periods than expected by chance, most of them 8 to 12 times longer than expected (Figure 5-105). These results might be biased by the way the data were recorded. The distance to the nearest turbine was the variable used to place the animals observed within 50 m, 51 to 100 m, and 101 to 300 m from the turbines. However, a bird recorded as 45 m away might have been seen flying for 4 minutes, but only within 45 m for one minute and 51 to 100 m away for 3 minutes. Even if this error was common and we were to account for it, the apparent preference for the closest proximity zone would remain while the magnitude of the clustering would lessen probably by about half.
45 55 65 75 85 95
105 45 55 65 75 85 95
105 45 55 65 75 85 95
105 45 55 65 75 85 95
105 4 3210
Observed ÷ Expected Number of Flights <50 m from Turbine(s)
Loggerhead shrike
Western meadowlark
Mallard
Horned lark
Temperature ( ° F) at s ession start
Value expectedby chance
ns

203
Perching also occurred over disproportionately longer periods within 50 m of turbines for nearly all species we selected for analysis (Figure 5-106). The exception was burrowing owl, which perched more often than expected by chance at 51-100 m away from the turbines.
Figure 5-105. Associations between minutes of flight by proximity zone during behavioral observation sessions. All tests were significant, P < 0.05.
Value expectedby chance
Observed ÷ Expected Minutes of Flight
Goldeneagle
Red-tailedhawk
Northernharrier
Prairiefalcon
Americankestrel
Turkeyvulture
Commonraven
Loggerheadshrike
Burrowingowl
Westernmeadowlark
Mallard
Hornedlark
0-5051-100101-300
0-5051-100101-300
0-5051-100101-300
0-5051-100101-300
0-5051-100101-300
0-5051-100101-300
0-5051-100101-300
0-5051-100101-300
0-5051-100101-300
0-5051-100101-300
0-5051-100101-300
0-5051-100101-300
131211109876543210
Proximity Zone based on
distance to nearestturbine (m)

204
Figure 5-106. Associations between minutes of perching by proximity zone during behavioral observation sessions. All tests were significant, P < 0.05. String Level of Analysis Rodent Control The intermittent and intense levels of rodent control began in 1997, and our behavior observations spanned 1998 to 2000. Thus, our behavior work should have revealed behavioral responses to rodent control, if there were to be any responses. The industry certainly expected that raptors would spend less time at the turbines within areas of rodent control, which is the reason it funded the rodent control program. Had the rodent control program been effective, which it was (see Chapter 4), we should have observed raptors flying in the rodent control areas for significantly less time than elsewhere. We also were interested in whether raptors would have performed fewer of the behaviors we considered more dangerous, such as flying through the rotor zone or within 50 m of turbines.
1211109876543210
Proximity Zone based on
distance to nearestturbine (m)
Value expectedby chance
Observed ÷ Expected Minutes of Perching
Goldeneagle
Red-tailedhawk
Northernharrier
Prairiefalcon
Americankestrel
Turkeyvulture
Commonraven
Loggerheadshrike
Burrowingowl
Westernmeadowlark
Hornedlark
0-5051-100
101-3000-50
51-100101-300
0-5051-100
101-3000-50
51-100101-300
0-5051-100
101-3000-50
51-100101-300
0-5051-100
101-3000-50
51-100101-300
0-5051-100
101-3000-50
51-100101-300
0-5051-100
101-300

205
However, in the plots subjected to the intermittent level of rodent control, significantly more time than expected by chance was spent flying by golden eagle, red-tailed hawk, northern harrier, and burrowing owl (Figure 5-107). The plots subjected to intense control were favored for flying by common raven and western meadowlark. Golden eagle, northern harrier and burrowing owl also perched more often than expected in plots subjected to intermittent levels of rodent control (Figure 5-108). Western meadowlarks and horned larks spent more time perched in plots without rodent control, and common raven and loggerhead shrike spent more time than expected perching in areas of intense rodent control. There were more than the expected flights made through the rotor zone by red-tailed hawk and horned lark in areas of no rodent control, by golden eagle and northern harrier in the areas of intermittent control, and by American kestrel and common raven in the areas of intense control (Figure 5-109). More than the expected flights were within 50 m by red-tailed hawk, American kestrel, loggerhead shrike and horned lark in areas of no rodent control, and by golden eagle, northern harrier, and burrowing owl in areas of intermittent control (Figure 5-110). At the interspecific level of analysis (Figure 5-111), it did not appear that rodent control caused birds to shift their areas of flight to locations lacking rodent control, although we have no observations of avian behavior before rodent control to use in the comparison. Hawks did not vary significantly in perch time by rodent control level, raptors perched less often than expected in areas of no control, and all birds spent a disproportionately greater amount of time perching in areas of intense control (Figure 5-111). Hawks, raptors, and all birds flew through the rotor zone disproportionately more often in areas of no rodent control, and they flew within 50 m of turbines disproportionately more often in areas of no rodent control (Figure 5-111).

206
Figure 5-107. Associations between minutes of flight by intensity level of rodent control. In the figure, “ns” denotes χ2 tests that were not significant, and no notation represents χ2 tests that were significant, P < 0.05.
NoneModerate
IntenseNone
ModerateIntense
NoneModerate
IntenseNone
ModerateIntense
NoneModerate
IntenseNone
ModerateIntense
NoneModerate
IntenseNone
ModerateIntense
NoneModerate
IntenseNone
ModerateIntense
NoneModerate
IntenseNone
ModerateIntense
43210
Rodentcontrol
Value expectedby chance
Observed ÷ Expected Minutes of Flight
Goldeneagle
Red-tailedhawk
Northernharrier
Prairiefalcon
Americankestrel
Turkeyvulture
Commonraven
Loggerheadshrike
Burrowingowl
Westernmeadowlark
Mallard
Hornedlark
0.10 > P > 0.05
ns
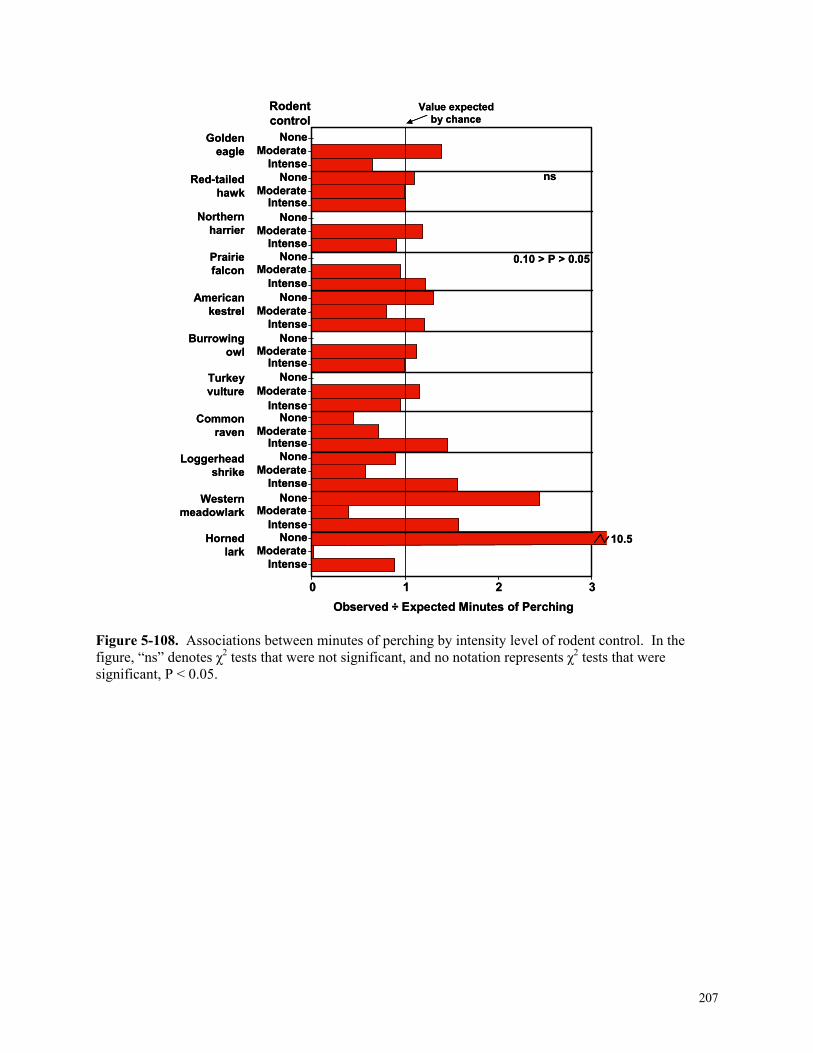
207
Figure 5-108. Associations between minutes of perching by intensity level of rodent control. In the figure, “ns” denotes χ2 tests that were not significant, and no notation represents χ2 tests that were significant, P < 0.05.
10.5
3210Observed ÷ Expected Minutes of Perching
Rodentcontrol
NoneModerate
IntenseNone
ModerateIntense
NoneModerate
IntenseNone
ModerateIntense
NoneModerate
IntenseNone
ModerateIntense
NoneModerate
IntenseNone
ModerateIntense
NoneModerate
IntenseNone
ModerateIntense
NoneModerate
Intense
Goldeneagle
Red-tailedhawk
Northernharrier
Prairiefalcon
Americankestrel
Turkeyvulture
Commonraven
Loggerheadshrike
Burrowingowl
Westernmeadowlark
Hornedlark
Value expectedby chance
0.10 > P > 0.05
ns

208
Figure 5-109. Associations between number of flights through the rotor zone and by intensity level of rodent control. In the figure, “ns” denotes χ2 tests that were not significant, and no notation represents χ2 tests that were significant, P < 0.05. Lighter bars indicate expected cell values of <5 and are therefore of less reliability.
5.6
3 210 Observed ÷ Expected Number of Flights through Rotor Zone
Rodent control
None Moderate
Intense None
Moderate Intense
None Moderate
Intense None
Moderate Intense
None Moderate
Intense None
Moderate Intense
None Moderate
Intense None
Moderate Intense
None Moderate
Intense None
Moderate Intense
None Moderate
Intense None
Moderate Intense
Golden eagle
Red - tailed hawk
Northern harrier Prairie falcon
American kestrel
Turkey vulture
Common raven
Loggerhead shrike
Burrowing owl
Western meadowlark
Mallard
Horned lark
Value expectedby chance
ns
ns
0.10 > P > 0.05
ns
ns
ns
0.10 > P > 0.05
ns

209
Figure 5-110. Associations between number of flights within 50 m of a turbine and by intensity level of rodent control. In the figure, “ns” denotes χ2 tests that were not significant, and no notation represents χ2 tests that were significant, P < 0.05. Lighter bars indicate expected cell values of <5 and are therefore of less reliability.
3.5 3.0 2.52.01.51.00.50 Observed ÷ Expected Number of Flights <50 m from Turbine(s)
Rodent control
None Moderate
Intense None
Moderate Intense
None Moderate
Intense None
Moderate Intense
None Moderate
Intense None
Moderate Intense
None Moderate
Intense None
Moderate Intense
None Moderate
Intense None
Moderate Intense
None Moderate
Intense None
Moderate Intense
Golden eagle
Red - tailed hawk
Northern harrier Prairie falcon
American kestrel
Turkey vulture
Common raven
Loggerhead shrike
Burrowing owl
Western meadowlark
Mallard
Horned lark
Value expectedby chance
0.10 > P > 0.05
ns

210
Figure 5-111. Associations between behaviors and level of rodent control at the interspecific level of analysis. In the figure, “ns” denotes χ2 tests that were not significant, and no notation represents χ2 tests that were significant, P < 0.05. Physical Relief Flight time was disproportionately longer on plateaus by northern harrier, prairie falcon, American kestrel, turkey vulture, common raven, mallard, loggerhead shrike, western meadowlark and horned lark, on ridge crests by golden eagle, red-tailed hawk, northern harrier and burrowing owl, and on slopes by western meadowlark (Figures 5-112 and 5-113). Perch time was disproportionately longer on plateaus by red-tailed hawk, northern harrier, prairie falcon, American kestrel, common raven, loggerhead shrike, and western meadowlark, on ridge crests by golden eagle and burrowing owl, on ridgelines by horned lark, and on slopes by turkey vulture (Figures 5-114 and 5-115). Disproportionately more flights within 50 m of turbines were made on plateaus by red-tailed hawk, northern harrier, prairie falcon, American kestrel, turkey vulture,
NoneModerate
IntenseNone
ModerateIntense
NoneModerate
IntenseNone
ModerateIntense
NoneModerate
IntenseNone
ModerateIntense
NoneModerate
IntenseNone
ModerateIntense
NoneModerate
IntenseNone
ModerateIntense
NoneModerate
IntenseNone
ModerateIntense
2.52.01.51.00.50
Hawks
Raptors
All birds
Hawks
Raptors
All birds
Hawks
Raptors
All birds
Hawks
Raptors
All birds
Rodentcontrol
Observed ÷ Expected Value
FlyingPerchingFlights through rotor zoneFlights < 50 m of turbineValue expected
by chance
ns

211
common raven and loggerhead shrike, and on ridge crests by golden eagle and burrowing owl (Figures 5-116 and 5-117). At the interspecific level of analysis, hawks and raptors spent more than the expected time flying over ridge crests and all birds spent more time flying over plateaus (Figure 5-118). Hawks, raptors and all birds combined spent more than the expected time perching on plateaus, and flew within 50 m of turbines more often than expected on plateaus (Figure 5-118).
Figure 5-112. Associations between minutes of flight and topography among raptor species. All tests were significant, P < 0.05. Lighter bars indicate expected cell values of <5 and are therefore of less reliability.
Observed ÷ Expected Minutes of Flight
PlateauRidge crest
RidgelineSlope
PlateauRidge crest
RidgelineSlope
PlateauRidge crest
RidgelineSlope
PlateauRidge crest
RidgelineSlope
PlateauRidge crest
RidgelineSlope
PlateauRidge crest
RidgelineSlope
543210
Physicalrelief
Goldeneagle
Red-tailedhawk
Northernharrier
Prairiefalcon
Americankestrel
Burrowingowl
Value expectedby chance

212
Figure 5-113. Associations between minutes of flight and topography among nonraptor species. All tests were significant, P < 0.05. Lighter bars indicate expected cell values of <5 and are therefore of less reliability.
Observed ÷ Expected Minutes of Flight543210
Physicalrelief
PlateauRidge crest
RidgelineSlope
PlateauRidge crest
RidgelineSlope
PlateauRidge crest
RidgelineSlope
PlateauRidge crest
RidgelineSlope
PlateauRidge crest
RidgelineSlope
PlateauRidge crest
RidgelineSlope
Turkeyvulture
Commonraven
Mallard
Loggerheadshrike
Westernmeadowlark
Hornedlark
Value expectedby chance

213
Figure 5-114. Associations between minutes of perching and topography among raptor species. All tests were significant, P < 0.05. Lighter bars indicate expected cell values of <5 and are therefore of less reliability.
7.8
76543210Observed ÷ Expected Minutes of Perching
Physicalrelief
PlateauRidge crest
RidgelineSlope
PlateauRidge crest
RidgelineSlope
PlateauRidge crest
RidgelineSlope
PlateauRidge crest
RidgelineSlope
PlateauRidge crest
RidgelineSlope
PlateauRidge crest
RidgelineSlope
Goldeneagle
Red-tailedhawk
Northernharrier
Prairiefalcon
Americankestrel
Burrowingowl
Value expectedby chance

214
Figure 5-115. Associations between minutes of perching and topography among nonraptor species. All tests were significant, P < 0.05.
76543210Observed ÷ Expected Minutes of Perching
Physicalrelief
Plateau
Ridge crest
Ridgeline
Slope
Plateau
Ridge crest
Ridgeline
Slope
Plateau
Ridge crest
Ridgeline
Slope
Plateau
Ridge crest
Ridgeline
Slope
Plateau
Ridge crest
Ridgeline
Slope
Turkeyvulture
Commonraven
Loggerheadshrike
Westernmeadowlark
Hornedlark
Value expectedby chance

215
Figure 5-116. Associations between number of flights within 50 m of a wind turbine and topography among raptor species. All tests were significant, P < 0.05. Lighter bars indicate expected cell values of <5 and are therefore of less reliability.
6 543210Observed ÷ Expected Number of Flights <50 m from Turbine(s)
Physical relief
Golden eagle
Red - tailedhawk
Northern harrier
Prairie falcon
American kestrel
Burrowingowl
Plateau Ridge crest
Ridgeline Slope
Plateau Ridge crest
Ridgeline Slope
Plateau Ridge crest
Ridgeline Slope
Plateau Ridge crest
Ridgeline Slope
Plateau Ridge crest
Ridgeline Slope
Plateau Ridge crest
Ridgeline Slope
Value expectedby chance

216
Figure 5-117. Associations between number of flights within 50 m of a wind turbine and topography among nonraptor species. In the figure, “ns” denotes χ2 tests that were not significant, and no notation represents χ2 tests that were significant, P < 0.05. Lighter bars indicate expected cell values of <5 and are therefore of less reliability.
6 543210Observed Expected Number of Flights <50 m from Turbine(s)
Physical relief
Turkey vulture
Common raven
Mallard
Loggerhead shrike
Western meadowlark
Horned lark
Plateau Ridge crest
Ridgeline Slope
Plateau Ridge crest
Ridgeline Slope
Plateau Ridge crest
Ridgeline Slope
Plateau Ridge crest
Ridgeline Slope
Plateau Ridge crest
Ridgeline Slope
Plateau Ridge crest
Ridgeline Slope
Value expectedby chance
ns
ns
ns
6 543210÷
Physical relief
Turkey vulture
Common raven
Mallard
Loggerhead shrike
Western meadowlark
Horned lark
Plateau Ridge crest
Ridgeline Slope
Plateau Ridge crest
Ridgeline Slope
Plateau Ridge crest
Ridgeline Slope
Plateau Ridge crest
Ridgeline Slope
Plateau Ridge crest
Ridgeline Slope
Plateau Ridge crest
Ridgeline Slope
Value expectedby chance
ns
ns
ns

217
Figure 5-118. Associations between behaviors and level of topography at the interspecific level of analysis. All tests were significant, P < 0.05. Whether in Canyon More flight time than expected by chance was spent in canyons by golden eagle, red-tailed hawk, and northern harrier, and out of canyons by all the rest of the birds we analyzed except prairie falcon and loggerhead shrike (Figure 5-119). Perching lasted longer than expected by chance in canyons by northern harrier, burrowing owl and turkey vulture, and less often in canyons by red-tailed hawk, American kestrel, common raven, loggerhead shrike, western meadowlark, horned lark (Figure 5-120). Golden eagle and northern harrier flew through the rotor zone disproportionately more often in canyons by (Figure 5-121), and golden eagle, northern harrier and burrowing owl flew within 50 m of turbines disproportionately more often in canyons (Figure 5-122).
PlateauRidge crest
RidgelineSlope
PlateauRidge crest
RidgelineSlope
PlateauRidge crest
RidgelineSlope
PlateauRidge crest
RidgelineSlope
PlateauRidge crest
RidgelineSlope
PlateauRidge crest
RidgelineSlope
PlateauRidge crest
RidgelineSlope
PlateauRidge crest
RidgelineSlope
PlateauRidge crest
RidgelineSlope
43210
6.6
Physicalrelief
Hawks
Raptors
All birds
Hawks
Raptors
All birds
Hawks
Raptors
All birds
FlyingPerchingFlights < 50 m of turbine
Observed ÷ Expected Value
Value expectedby chance

218
At the interspecific level of analysis, hawks and raptors flew longer than expected in canyons whereas all birds combined flew longer out of canyons (Figure 5-123). Perching lasted longer than expected in canyons for hawks, raptors and all birds (Figure 5-123).
Figure 5-119. Associations between minutes of flight and whether the wind turbine was in a canyon. In the figure, “ns” denotes χ2 tests that were not significant, and no notation represents χ2 tests that were significant, P < 0.05.
Whether in Canyon
NoYesNo
YesNo
YesNo
YesNo
YesNo
YesNo
YesNo
YesNo
YesNo
YesNo
YesNo
Yes
2.01.51.00.50Observed ÷ Expected Minutes of Flight
Goldeneagle
Red-tailedhawk
Northernharrier
Prairiefalcon
Americankestrel
Turkeyvulture
Commonraven
Loggerheadshrike
Burrowingowl
Westernmeadowlark
Mallard
Hornedlark
Value expectedby chance
ns
ns
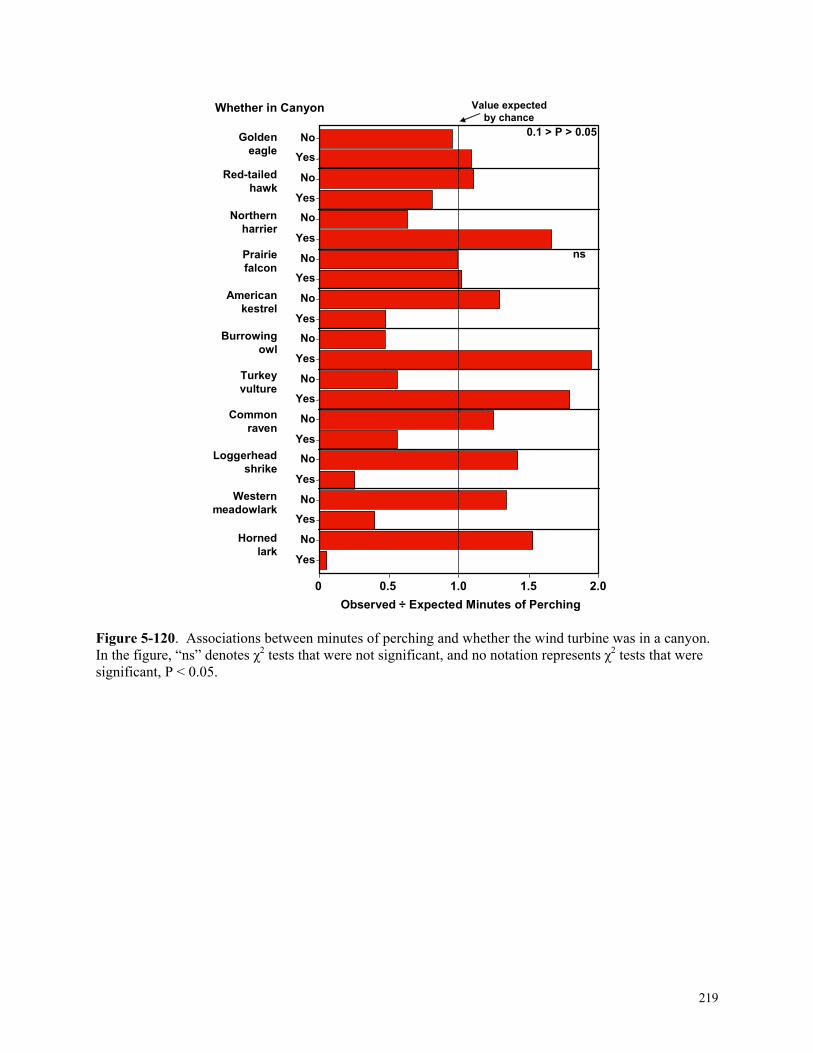
219
Figure 5-120. Associations between minutes of perching and whether the wind turbine was in a canyon. In the figure, “ns” denotes χ2 tests that were not significant, and no notation represents χ2 tests that were significant, P < 0.05.
No
Yes
No
Yes
No
Yes
No
Yes
No
Yes
No
Yes
No
Yes
No
Yes
No
Yes
No
Yes
No
Yes
2.01.51.00.50Observed ÷ Expected Minutes of Perching
Whether in Canyon
Goldeneagle
Red-tailedhawk
Northernharrier
Prairiefalcon
Americankestrel
Turkeyvulture
Commonraven
Loggerheadshrike
Burrowingowl
Westernmeadowlark
Hornedlark
Value expectedby chance
ns
0.1 > P > 0.05

220
Figure 5-121. Associations between number of flights through the rotor zone and whether the wind turbine was in a canyon. In the figure, “ns” denotes χ2 tests that were not significant, and no notation represents χ2 tests that were significant, P < 0.05. Lighter bars indicate expected cell values of <5 and are therefore of less reliability.
2.0 1.51.00.50 Observed ÷ Expected Number of Flights through Rotor Zone
Whether in Canyon
No Yes No
Yes No
Yes No
Yes No
Yes No
Yes No
Yes No
Yes No
Yes No
Yes No
Yes No
Yes
Golden eagle
Red - tailed hawk
Northern harrier Prairie falcon
American kestrel
Turkey vulture
Common raven
Loggerhead shrike
Burrowing owl
Western meadowlark
Mallard
Horned lark
Value expectedby chance
ns
ns
ns
ns
0.1 > P > 0.05
ns
ns
ns

221
Figure 5-122. Associations between number of flights within 50 m of a wind turbine and whether the wind turbine was in a canyon. In the figure, “ns” denotes χ2 tests that were not significant, and no notation represents χ2 tests that were significant, P < 0.05. Lighter bars indicate expected cell values of <5 and are therefore of less reliability.
3.0 2.52.01.51.00.50 Observed ÷ Expected Number of Flights <50 m from Turbine(s)
Whether in Canyon
No Yes No
Yes No
Yes No
Yes No
Yes No
Yes No
Yes No
Yes No
Yes No
Yes No
Yes No
Yes
Golden eagle
Red - tailed hawk
Northern harrier Prairie falcon
American kestrel
Turkey vulture
Common raven
Loggerhead shrike
Burrowing owl
Western meadowlark
Mallard
Horned lark
Value expectedby chance
ns
ns

222
Figure 5-123. Associations between behaviors and level of whether the wind turbine was in a canyon at the interspecific level of analysis. In the figure, “ns” denotes χ2 tests that were not significant, and no notation represents χ2 tests that were significant, P < 0.05. Turbine Level of Analysis Turbine Type Close-by flight time was disproportionately longer for golden eagles at Flowind turbines, than was the case for prairie falcon, American kestrel, loggerhead shrike, western meadowlark and horned lark (Figures 5-124 and 5-125). It was disproportionately longer for red-tailed hawk, golden eagle, northern harrier, burrowing owl, turkey vulture, and mallard at Bonus turbines, and was longer at KCS-56 turbines for common raven. Golden eagles rarely perched on turbines. When they did, they spent more time than expected by chance on Flowind turbines, as did western meadowlark (Figure 5-126). Danwin and Bonus turbines were perched
NoYesNo
YesNo
YesNo
YesNo
YesNo
YesNo
YesNo
YesNo
YesNo
YesNo
YesNo
Yes
1.51.00.50
Whether incanyon
Hawks
Raptors
All birds
Hawks
Raptors
All birds
Hawks
Raptors
All birds
Hawks
Raptors
All birds
Observed ÷ Expected Value
FlyingPerchingFlights through rotor zoneFlights < 50 m of turbine
ns
0.1 > P > 0.05

223
upon for disproportionately longer periods by red-tailed hawk and burrowing owl, and KCS-56 turbines were selected for perching more often by common raven, loggerhead shrike and western meadowlark (Figures 5-126 and 5-127).
Figure 5-124. Associations between minutes of close-by flights to wind turbines and type of wind turbine among raptor species. All tests were significant, P < 0.05. Lighter bars indicate expected cell values of <5 and are therefore of less reliability.
Bonus Danwin Flowind KCS - 56 KVS - 33 Bonus
Danwin Flowind KCS - 56 KVS - 33 Bonus
Danwin Flowind KCS - 56 KVS - 33 Bonus
Danwin Flowind KCS - 56 KVS - 33 Bonus
Danwin Flowind KCS - 56 KVS - 33 Bonus
Danwin Flowind KCS - 56 KVS - 33
3.0 2.52.01.51.00.50Observed ÷ Expected Minutes of Flight
That Came to Within 50 m of Turbine
Turbine type
Golden eagle
Red - tailed hawk
Northern harrier
Prairie falcon
American kestrel
Burrowing owl
Value expectedby chance

224
Figure 5-125. Associations between minutes of close-by flights to wind turbines and type of wind turbine among nonraptor species. All tests were significant, P < 0.05. Lighter bars indicate expected cell values of <5 and are therefore of less reliability.
3.0 2.52.01.51.00.50Observed ÷ Expected Minutes of Flight
That Came to Within 50 m of Turbine
Turbine type Value expectedby chance
Turkey vulture
Common raven
Mallard
Loggerhead shrike
Western meadowlark
Horned lark
Bonus Danwin Flowind KCS - 56 KVS - 33 Bonus
Danwin Flowind KCS - 56 KVS - 33 Bonus
Danwin Flowind KCS - 56 KVS - 33 Bonus
Danwin Flowind KCS - 56 KVS - 33 Bonus
Danwin Flowind KCS - 56 KVS - 33 Bonus
Danwin Flowind KCS - 56 KVS - 33

225
Figure 5-126. Associations between minutes perching on wind turbines and type of wind turbine among raptor species. In the figure, “ns” denotes χ2 tests that were not significant, and no notation represents χ2 tests that were significant, P < 0.05. Lighter bars indicate expected cell values of <5 and are therefore of less reliability.
Bonus Danwin Flowind KCS - 56 KVS - 33 Bonus
Danwin Flowind KCS - 56 KVS - 33 Bonus
Danwin Flowind KCS - 56 KVS - 33 Bonus
Danwin Flowind KCS - 56 KVS - 33 Bonus
Danwin Flowind KCS - 56 KVS - 33
6 543210
Golden eagle
Red - tailed hawk
Prairie falcon
American kestrel
Burrowing owl
Observed ÷ Expected Minutes of Perching on Turbine
Turbine type Value expectedby chance
ns

226
Figure 5-127. Associations between minutes perching on wind turbines and type of wind turbine among nonraptor species. All tests were significant, P < 0.05. Turbine Orientation to Wind Close-by flight time was disproportionately longer at vertical-axis turbines for golden eagle, prairie falcon, loggerhead shrike and western meadowlark (Figure 5-128). It was longer than expected at turbines oriented away from the wind for American kestrel, loggerhead shrike and horned lark, and toward the wind for burrowing owl and turkey vulture. Perch time was disproportionately longer on vertical-axis turbines for golden eagle, and on turbines oriented away from the wind for red-tailed hawk, American kestrel, common raven, loggerhead shrike and western meadowlark (Figure 5-129).
Bonus
Danwin
Flowind
KCS - 56
KVS - 33
Bonus
Danwin
Flowind
KCS - 56
KVS - 33
Bonus
Danwin
Flowind
KCS - 56
KVS - 33
2.5 2.01.51.00.50
Common raven
Loggerhead shrike
Western meadowlark
Observed ÷ Expected Minutes of Perching on Turbine
Turbine type Value expectedby chance

227
Figure 5-128. Associations between minutes of close-by flights to wind turbines and wind turbine’s rotor orientation to wind. In the figure, “ns” denotes χ2 tests that were not significant, and no notation represents χ2 tests that were significant, P < 0.05.
TowardAway
Vertical Axis Toward
Away Vertical Axis
TowardAway
Vertical Axis Toward
Away Vertical Axis
TowardAway
Vertical Axis Toward
Away Vertical Axis
TowardAway
Vertical Axis Toward
Away Vertical Axis
TowardAway
Vertical Axis Toward
Away Vertical Axis
TowardAway
Vertical Axis Toward
Away Vertical Axis
Turbineorientation
to wind
Observed ÷ Expected Minutes of Flight That Came to Within 50 m of Turbine
Golden eagle
Red - tailed hawk
Northern harrier Prairie falcon
American kestrel
Turkey vulture
Common raven
Loggerhead shrike
Burrowing owl
Western meadowlark
Mallard
Horned lark
Value expectedby chance
3.0 2.5 2.01.51.00.50
ns

228
Figure 5-129. Associations between minutes perching on wind turbines and wind turbine’s rotor orientation to wind. In the figure, “ns” denotes χ2 tests that were not significant, and no notation represents χ2 tests that were significant, P < 0.05. Lighter bars indicate expected cell values of <5 and are therefore of less reliability. Operating Status of Nearest Turbine Flights at blade height and within 50 m of turbines were performed by golden eagle, red-tailed hawk, and turkey vulture for disproportionately longer periods near operating turbines, and by American kestrel, burrowing owl, common raven, loggerhead shrike and horned lark near turbines turned off, whereas birds appeared to avoid flying near broken turbines relative to the occurrence frequency of these turbines (Figure 5-130). As summarized in Table 5-14, birds perched on turbines for longer periods when the turbines were not operating. In fact, all bird species that perched on turbines did so for disproportionately more time while the turbines were off (Figure 5-131), and they avoided perching on operating turbines or broken turbines. Similarly, red-tailed hawk, northern harrier, American kestrel and common raven made more flights through the rotor zone at blade height than expected by chance while the nearest turbine was not operating, and these
Toward Away
Vertical Axis Toward
Away Vertical Axis
Toward Away
Vertical Axis Toward
Away Vertical Axis
Toward Away
Vertical Axis Toward
Away Vertical Axis
Toward Away
Vertical Axis Toward
Away Vertical Axis
5 43210Observed ÷ Expected Minutes of Perching
on Turbine
Golden eagle
Red - tailed hawk
Prairie falcon
American kestrel
Burrowing owl
Common raven
Loggerhead shrike
Western meadowlark
Turbineorientation
to windValue expected
by chance
ns

229
species avoided operating turbines and broken turbines (Figure 5-132). The patterns were similar for the number of flights made within 50 m of turbines at blade height, although golden eagle made these flights disproportionately more often near operating turbines (Figure 5-133). Because these flights are so likely to relate to collision rates, we also compared them for house finch, European starling and rock dove, all of which were relatively frequently killed in the APWRA. House finch flew for longer, perched for longer and made more of its dangerous flights than expected by chance near turbines while the turbines were off (Figure 5-134). European starling and rock dove, however, spent more time flying at blade height and within 50 m of turbines, perching on turbines, and performing more of their dangerous flights near turbines that were broken. At the interspecific level of analysis, hawks and raptors spent more time flying within 50 m and at blade height of operating turbines, whereas all birds combined did so near turbines while they were off (Figure 5-135). Hawks, raptors and all birds perched more often on turbines while they were off, and they also made more of their dangerous flights near turbines that were off.

230
Figure 5-130. Associations between minutes of flight at blade height and the operational status of the nearest wind turbine. In the figure, “ns” denotes χ2 tests that were not significant, and no notation represents χ2 tests that were significant, P < 0.05.
OnOff
BrokenOnOff
BrokenOnOff
BrokenOnOff
BrokenOnOff
BrokenOnOff
BrokenOnOff
BrokenOnOff
BrokenOnOff
BrokenOnOff
BrokenOnOff
Broken
2.01.51.00.50
Goldeneagle
Red-tailedhawk
Northernharrier
Prairiefalcon
Americankestrel
Turkeyvulture
Commonraven
Loggerheadshrike
Burrowingowl
Westernmeadowlark
Hornedlark
Status of nearestturbine to bird(s)
Value expectedby chance
Observed ÷ Expected Minutes of Flightat Blade Height
ns
ns
ns

231
Figure 5-131. Associations between minutes of perching on a wind turbine and the operational status of that wind turbine. In the figure, “ns” denotes χ2 tests that were not significant, and no notation represents χ2 tests that were significant, P < 0.05.
2.01.51.00.50
Goldeneagle
Red-tailedhawk
Northernharrier
Prairiefalcon
Americankestrel
Turkeyvulture
Commonraven
Loggerheadshrike
Burrowingowl
Westernmeadowlark
Hornedlark
Value expectedby chance
OnOff
BrokenOnOff
BrokenOnOff
BrokenOnOff
BrokenOnOff
BrokenOnOff
BrokenOnOff
BrokenOnOff
BrokenOnOff
BrokenOnOff
BrokenOnOff
Broken
Status of nearestturbine to bird(s)
Observed ÷ Expected Minutes of Perching
ns
no test
no test
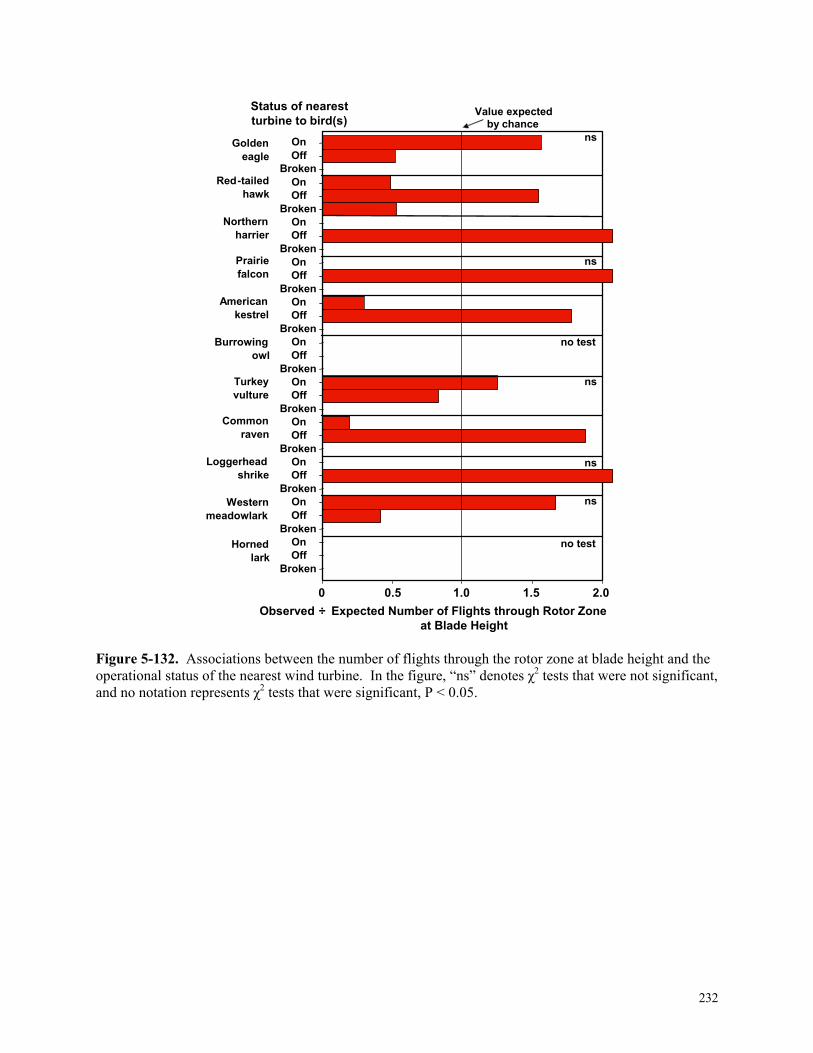
232
Figure 5-132. Associations between the number of flights through the rotor zone at blade height and the operational status of the nearest wind turbine. In the figure, “ns” denotes χ2 tests that were not significant, and no notation represents χ2 tests that were significant, P < 0.05.
2.0 1.51.00.50
Golden eagle
Red - tailed hawk
Northern harrier Prairie falcon
American kestrel
Turkey vulture
Common raven
Loggerhead shrike
Burrowing owl
Western meadowlark
Horned lark
Value expectedby chance
On Off
Broken On Off
Broken On Off
Broken On Off
Broken On Off
Broken On Off
Broken On Off
Broken On Off
Broken On Off
Broken On Off
Broken On Off
Broken
Status of nearestturbine to bird(s)
Observed ÷ Expected Number of Flights through Rotor Zoneat Blade Height
no test
no test
ns
ns
ns
ns
ns

233
Figure 5-133. Associations between the number of flights within 50 m of a turbine at blade height and the operational status of that wind turbine. In the figure, “ns” denotes χ2 tests that were not significant, and no notation represents χ2 tests that were significant, P < 0.05.
2.0 1.51.00.50
Golden eagle
Red - tailed hawk
Northern harrier Prairie falcon
American kestrel
Turkey vulture
Common raven
Loggerhead shrike
Burrowing owl
Western meadowlark
Horned lark
Value expectedby chance
On Off
Broken On Off
Broken On Off
Broken On Off
Broken On Off
Broken On Off
Broken On Off
Broken On Off
Broken On Off
Broken On Off
Broken On Off
Broken
Status of nearestturbine to bird(s)
Observed ÷ Expected Number of Flights <50 m from Turbine(s) and at Blade Height
ns
ns
ns
ns

234
Figure 5-134. Associations between flights at blade height or perching on turbines and the operational status of the nearest wind turbine for house finch, European starling, and rock dove. In the figure, “ns” denotes χ2 tests that were not significant, and no notation represents χ2 tests that were significant, P < 0.05.
6543210
House finch
Europeanstarling
Rock dove
Observed ÷ Expected Value
House finch
Europeanstarling
Rock dove
House finch
Europeanstarling
Rock dove
House finch
Europeanstarling
Rock dove
Status of nearestturbine to bird(s)
OnOff
BrokenOnOff
BrokenOnOff
BrokenOnOff
BrokenOnOff
BrokenOnOff
BrokenOnOff
BrokenOnOff
BrokenOnOff
BrokenOnOff
BrokenOnOff
BrokenOnOff
Broken
Value expectedby chance
0.10 > P > 0.05
ns
ns
FlyingPerchingFlights through rotor zoneFlights < 50 m of turbine
Flight behaviors at blade height

235
Figure 5-135. Associations between flights at blade height or perching on turbines and the operational status of the nearest wind turbine for interspecific groups. All tests were significant, P < 0.05. Tower Type Turbine towers may be perceived by avian species as more or less of an obstacle to flight, or the operational status of the turbines may be recognized more or less readily based on whether the tower is tubular, lattice or constructed as a vertical-axis. Therefore, we tested whether behaviors varied by tower type. Flight time was disproportionately less near lattice towers for golden eagle, red-tailed hawk, northern harrier, prairie falcon, burrowing owl, turkey vulture, mallard, loggerhead shrike and western meadowlark (Figure 5-136). It was disproportionately less near tubular towers for American kestrel, western meadowlark and horned lark. Golden eagle, red-tailed hawk and American kestrel perched for longer periods than expected by chance on tubular and vertical-axis towers, and burrowing owl and turkey vulture perched longer than expected on tubular towers (Figure 5-137). Only common raven and horned lark perched disproportionately
OnOff
BrokenOnOff
BrokenOnOff
BrokenOnOff
BrokenOnOff
BrokenOnOff
BrokenOnOff
BrokenOnOff
BrokenOnOff
BrokenOnOff
BrokenOnOff
BrokenOnOff
Broken
Hawks
Raptors
All birds
Observed ÷ Expected Value
Hawks
Raptors
All birds
Hawks
Raptors
All birds
Hawks
Raptors
All birds
2.01.51.00.50
Status of nearestturbine to bird(s)
FlyingPerchingFlights through rotor zoneFlights < 50 m of turbineValue expected
by chance
Flight behaviors at blade height

236
longer on lattice towers. Flights through the rotor zone of tubular towers were made more often than expected by chance by golden eagle and northern harrier, and through that of lattice towers by red-tailed hawk, American kestrel, common raven and horned lark (Figure 5-138). Flights within 50 m of turbines were disproportionately more common near vertical-axis turbines for golden eagle, prairie falcon, turkey vulture, loggerhead shrike and western meadowlark, near tubular towers for burrowing owl and mallard, and near lattice towers for common raven and horned lark (Figure 5-139). At the interspecific level of analysis, hawks flew longer than expected near tubular towers, and raptors and all birds combined flew longer near vertical-axis towers (Figure 5-140). Hawks and raptors appeared to avoid perching on lattice towers, whereas all birds combined avoided tubular towers and favored vertical-axis towers (Figure 5-140). Hawks flew through the rotor zones of lattice and tubular towers more often than expected by chance, but such flights of raptors and all birds combined did not associate significantly with tower type (Figure 5-140). Hawks flew within 50 m of turbines more often when the turbines were lattice design, and all birds did so when the turbines were either lattice or vertical-axis design (Figure 5-140).
Figure 5-136. Associations between minutes of flight and tower type. All tests were significant, P < 0.05.
LatticeTubular
Vertical axisLattice
TubularVertical axis
LatticeTubular
Vertical axisLattice
TubularVertical axis
LatticeTubular
Vertical axisLattice
TubularVertical axis
LatticeTubular
Vertical axisLattice
TubularVertical axis
LatticeTubular
Vertical axisLattice
TubularVertical axis
LatticeTubular
Vertical axisLattice
TubularVertical axis
43210Observed ÷ Expected Minutes of Flight
Towertype
Goldeneagle
Red-tailedhawk
Northernharrier
Prairiefalcon
Americankestrel
Turkeyvulture
Commonraven
Loggerheadshrike
Burrowingowl
Westernmeadowlark
Mallard
Hornedlark
Value expectedby chance

237
Figure 5-137. Associations between minutes of perching and tower type. All tests were significant, P < 0.05.
3210Observed ÷ Expected Minutes of Perching
Towertype
LatticeTubular
Vertical axisLattice
TubularVertical axis
LatticeTubular
Vertical axisLattice
TubularVertical axis
LatticeTubular
Vertical axisLattice
TubularVertical axis
LatticeTubular
Vertical axisLattice
TubularVertical axis
LatticeTubular
Vertical axisLattice
TubularVertical axis
LatticeTubular
Vertical axis
Goldeneagle
Red-tailedhawk
Northernharrier
Prairiefalcon
Americankestrel
Turkeyvulture
Commonraven
Loggerheadshrike
Burrowingowl
Westernmeadowlark
Hornedlark
Value expectedby chance
0.1 > P > 0.05

238
Figure 5-138. Associations between number of flights through the rotor zone and tower type. In the figure, “ns” denotes χ2 tests that were not significant, and no notation represents χ2 tests that were significant, P < 0.05. Lighter bars indicate expected cell values of <5 and are therefore of less reliability.
3 210Observed ÷ Expected Number of Flights through Rotor Zone
Towertype
Lattice Tubular
Vertical axis Lattice
Tubular Vertical axis
Lattice Tubular
Vertical axis Lattice
Tubular Vertical axis
Lattice Tubular
Vertical axis Lattice
Tubular Vertical axis
Lattice Tubular
Vertical axis Lattice
Tubular Vertical axis
Lattice Tubular
Vertical axis Lattice
Tubular Vertical axis
Lattice Tubular
Vertical axis Lattice
Tubular Vertical axis
Golden eagle
Red - tailed hawk
Northern harrier Prairie falcon
American kestrel
Turkey vulture
Common raven
Loggerhead shrike
Burrowing owl
Western meadowlark
Mallard
Horned lark
Value expectedby chance
0.1 > P > 0.05
0.1 > P > 0.05
ns
0.1 > P > 0.05
0.1 > P > 0.05
ns
ns
ns
ns
ns

239
Figure 5-139. Associations between number of flights within 50 m of a wind turbine and tower type. All tests were significant, P < 0.05. Lighter bars indicate expected cell values of <5 and are therefore of less reliability.
3 210Observed ÷ Expected Number of Flights <50 m from Turbine(s)
Tower type
Lattice Tubular
Vertical axis Lattice
Tubular Vertical axis
Lattice Tubular
Vertical axis Lattice
Tubular Vertical axis
Lattice Tubular
Vertical axis Lattice
Tubular Vertical axis
Lattice Tubular
Vertical axis Lattice
Tubular Vertical axis
Lattice Tubular
Vertical axis Lattice
Tubular Vertical axis
Lattice Tubular
Vertical axis Lattice
Tubular Vertical axis
Golden eagle
Red - tailed hawk
Northern harrier Prairie falcon
American kestrel
Turkey vulture
Common raven
Loggerhead shrike
Burrowing owl
Western meadowlark
Mallard
Horned lark
Value expectedby chance
0.1 > P > 0.05

240
Figure 5-140. Associations between behaviors and tower type for interspecific groups. In the figure, “ns” denotes χ2 tests that were not significant, and no notation represents χ2 tests that were significant, P < 0.05. Tower Height Close-by flight time was disproportionately longer at taller towers for golden eagle and prairie falcon, at towers of intermediate height for red-tailed hawk, American kestrel, burrowing owl, mallard, loggerhead shrike and horned lark (Figures 5-141through 5-143). Shorter towers were flown close by for longer periods than expected for turkey vulture and common raven. Tall towers were favored for perching by golden eagle, red-tailed hawk, and western meadowlark, but red-tailed hawk and western meadowlark also favored 19-m-tall towers along with American kestrel, common raven, and loggerhead shrike (Figures 5-144 and 5-145).
LatticeTubular
Vertical axisLattice
TubularVertical axis
LatticeTubular
Vertical axisLattice
TubularVertical axis
LatticeTubular
Vertical axisLattice
TubularVertical axis
LatticeTubular
Vertical axisLattice
TubularVertical axis
LatticeTubular
Vertical axisLattice
TubularVertical axis
LatticeTubular
Vertical axisLattice
TubularVertical axis
2.52.01.51.00.50
Tower typeHawks
Raptors
All birds
Hawks
Raptors
All birds
Hawks
Raptors
All birds
Hawks
Raptors
All birds
FlyingPerchingFlights through rotor zoneFlights < 50 m of turbine
Observed ÷ Expected Value
Value expectedby chance
ns
ns
ns

241
Figure 5-141. Associations between minutes of close-by flights to wind turbines and tower height for golden eagle, red-tailed hawk, northern harrier, and prairie falcon. In the figure, “ns” denotes χ2 tests that were not significant, and no notation represents χ2 tests that were significant, P < 0.05.
14 19 25 31 43 14 19 25 31 43 14 19 25 31 43 14 19 25 31 43
Observed ÷ Expected Minutes of FlightThat Came to Within 50 m of Turbine
Tower height (m)
Golden eagle
Red - tailed hawk
Northern harrier
Prairie falcon
Value expectedby chance
3.0 2.52.01.51.00.50
ns

242
Figure 5-142. Associations between minutes of close-by flights to wind turbines and tower height for American kestrel, burrowing owl, turkey vulture, and common raven. All tests were significant, P < 0.05.
14 19 25 31 43 14 19 25 31 43 14 19 25 31 43 14 19 25 31 43
Observed ÷ Expected Minutes of FlightThat Came to Within 50 m of Turbine
Tower height (m)
Turkey vulture
Common raven
American kestrel
Burrowing owl
Value expectedby chance
3.0 2.52.01.51.00.50

243
Figure 5-143. Associations between minutes of close-by flights to wind turbines and tower height for mallard, loggerhead shrike, western meadowlark, and horned lark. All tests were significant, P < 0.05. Lighter bars indicate expected cell values of <5 and are therefore of less reliability.
14 19 25 31 43 14 19 25 31 43 14 19 25 31 43 14 19 25 31 43
Observed ÷ Expected Minutes of FlightThat Came to Within 50 m of Turbine
Tower height (m)
Loggerhead shrike
Western meadowlark
Mallard
Horned lark
Value expectedby chance
3.0 2.52.01.51.00.50

244
Figure 5-144. Associations between minutes of perching on a wind turbine and tower’s height for golden eagle, red-tailed hawk, prairie falcon, American kestrel, and burrowing owl. In the figure, “ns” denotes χ2 tests that were not significant, and no notation represents χ2 tests that were significant, P < 0.05. Lighter bars indicate expected cell values of <5 and are therefore of less reliability.
14 19 25 31 43 14 19 25 31 43 14 19 25 31 43 14 19 25 31 43 14 19 25 31 43
5 43210 Observed ÷ Expected Minutes of Perching
on Turbine
Tower height (m)
Golden eagle
Red - tailed hawk
Prairie falcon
American kestrel
Burrowing owl
Value expectedby chance
ns
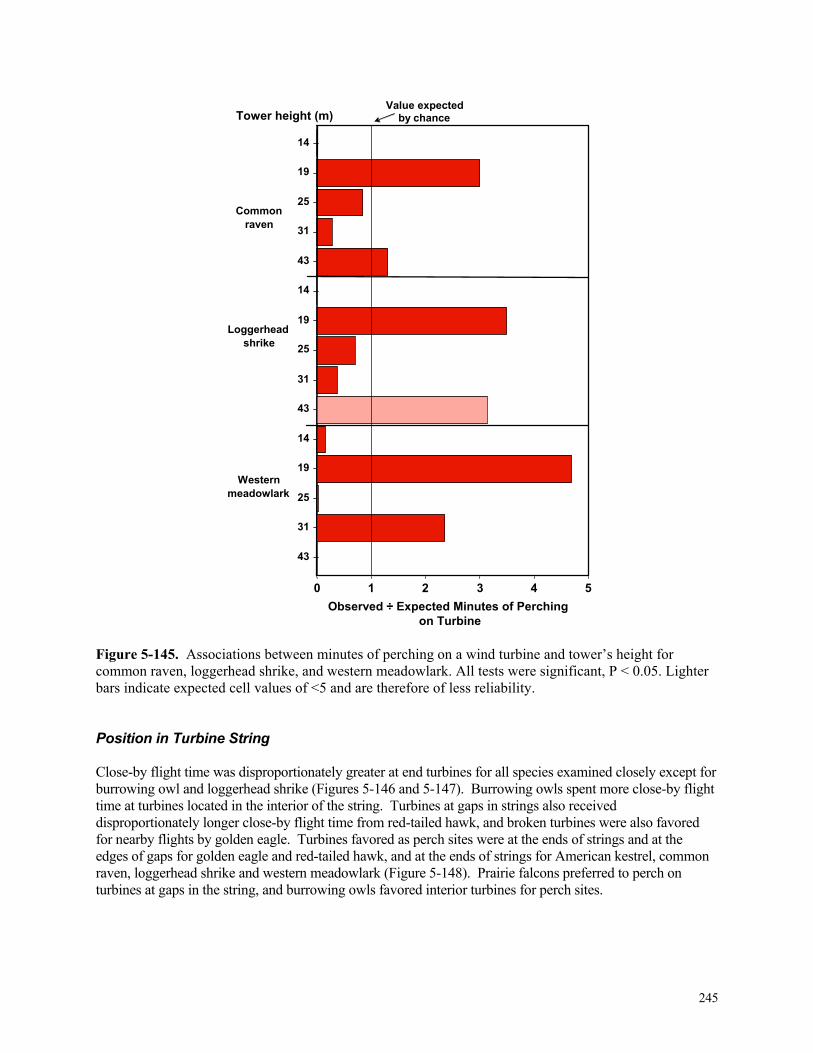
245
Figure 5-145. Associations between minutes of perching on a wind turbine and tower’s height for common raven, loggerhead shrike, and western meadowlark. All tests were significant, P < 0.05. Lighter bars indicate expected cell values of <5 and are therefore of less reliability. Position in Turbine String Close-by flight time was disproportionately greater at end turbines for all species examined closely except for burrowing owl and loggerhead shrike (Figures 5-146 and 5-147). Burrowing owls spent more close-by flight time at turbines located in the interior of the string. Turbines at gaps in strings also received disproportionately longer close-by flight time from red-tailed hawk, and broken turbines were also favored for nearby flights by golden eagle. Turbines favored as perch sites were at the ends of strings and at the edges of gaps for golden eagle and red-tailed hawk, and at the ends of strings for American kestrel, common raven, loggerhead shrike and western meadowlark (Figure 5-148). Prairie falcons preferred to perch on turbines at gaps in the string, and burrowing owls favored interior turbines for perch sites.
14
19
25
31
43
14
19
25
31
43
14
19
25
31
43
5 43210 Observed ÷ Expected Minutes of Perching
on Turbine
Tower height (m)
Common raven
Loggerhead shrike
Western meadowlark
Value expectedby chance

246
Figure 5-146. Associations between minutes of close-by flights to wind turbines and the wind turbine’s position in the string for raptor species. All tests were significant, P < 0.05. Lighter bars indicate expected cell values of <5 and are therefore of less reliability.
End Interior
Gap Non - op
End Interior
Gap Non - op
End Interior
Gap Non - op
End Interior
Gap Non - op
End Interior
Gap Non - op
End Interior
Gap Non - op
2.5 2.01.51.00.50 Observed ÷ Expected Minutes of Flight
That Came to Within 50 m of Turbine
Turbine’s positionin string
Golden eagle
Red - tailed hawk
Northern harrier
Prairie falcon
American kestrel
Burrowing owl
Value expectedby chance

247
Figure 5-147. Associations between minutes of close-by flights to wind turbines and the wind turbine’s position in the string for nonraptor species. In the figure, “ns” denotes χ2 tests that were not significant, and no notation represents χ2 tests that were significant, P < 0.05. Lighter bars indicate expected cell values of <5 and are therefore of less reliability.
End Interior
Gap Non - op
End Interior
Gap Non - op
End Interior
Gap Non - op
End Interior
Gap Non - op
End Interior
Gap Non - op
End Interior
Gap Non - op
2.5 2.01.51.00.50 Observed ÷ Expected Minutes of Flight
That Came to Within 50 m of Turbine
Turbine’s positionin string
Turkey vulture
Common raven
Mallard
Loggerhead shrike
Western meadowlark
Horned lark
Value expectedby chance
0.10 > P > 0.05
ns
248
Figure 5-148. Associations between minutes of perching on wind turbines and the wind turbine’s position in the string. All tests were significant, P < 0.05. Lighter bars indicate expected cell values of <5 and are therefore of less reliability. Whether Part of Wind Wall For every species closely examined except common raven and horned lark, close-by flight time was disproportionately greater at turbines that were not members of wind walls (Figure 5-149). None of the species examined favored turbines in wind walls for perching (Figure 5-150). Based on their availability and level of behavioral sampling in the APWRA, wind walls appeared to be avoided for the most part.
End Interior
Gap Non - op
End Interior
Gap Non - op
End Interior
Gap Non - op
End Interior
Gap Non - op
End Interior
Gap Non - op
End Interior
Gap Non - op
End Interior
Gap Non - op
End Interior
Gap Non - op
4 3210Observed ÷ Expected Minutes of Perching
on Turbine
Turbine’s positionin string
Golden eagle
Red - tailed hawk
Prairie falcon
American kestrel
Burrowing owl
Common raven
Loggerhead shrike
Western meadowlark
Value expectedby chance
End Interior
Gap Non - op
End Interior
Gap Non - op
End Interior
Gap Non - op
End Interior
Gap Non - op
End Interior
Gap Non - op
End Interior
Gap Non - op
End Interior
Gap Non - op
End Interior
Gap Non - op
4 3210Observed ÷ Expected Minutes of Perching
Turbine’s positionin string
Golden eagle
Red - tailed hawk
Prairie falcon
American kestrel
Burrowing owl
Common raven
Loggerhead shrike
Western meadowlark
Value expectedby chance

249
Figure 5-149. Associations between minutes of close-by flights to wind turbines and whether the wind turbine was part of a wind wall. In the figure, “ns” denotes χ2 tests that were not significant, and no notation represents χ2 tests that were significant, P < 0.05.
Observed ÷ Expected Minutes of FlightThat Came to Within 50 m of Turbine
Whether part of
windwall Golden
eagle Red - tailed
hawk Northern
harrier Prairie falcon
American kestrel
Turkey vulture
Common raven
Loggerhead shrike
Burrowing owl
Western meadowlark
Mallard
Horned lark
Yes No
Yes No
Yes No
Yes No
Yes No
Yes No
Yes No
Yes No
Yes No
Yes No
Yes No
Yes No
2.0 1.51.00.50
Value expectedby chance
0.10 > P > 0.05
0.10 > P > 0.05
ns

250
Figure 5-150. Associations between minutes of perching on wind turbines and whether the wind turbine was part of a wind wall. In the figure, “ns” denotes χ2 tests that were not significant, and no notation represents χ2 tests that were significant, P < 0.05. Turbine Congestion For raptor species and several others, close-by flights composed disproportionately more time at turbines with the fewest or fewer other turbines located within 300 m, and these species strongly avoided flying near turbines in dense turbine clusters (Figures 5-151 and 5-152). On the other hand, western meadowlark and horned lark favored close-by flights in dense turbine clusters. Red-tailed hawk, prairie falcon, American kestrel and burrowing owl perched on turbines more often than expected by chance when the turbines were more isolated from other turbines (Figure 5-153).
Whether part of
windwall
Observed ÷ Expected Minutes of Perching on Turbine
Yes
No
Yes
No
Yes
No
Yes
No
Yes
No
Yes
No
Yes
No
Yes
No
2.0 1.51.00.50
Golden eagle
Red - tailed hawk
Prairie falcon
American kestrel
Burrowing owl
Common raven
Loggerhead shrike
Western meadowlark
Value expectedby chance
ns
ns
ns
Whether part of
windwall
Observed ÷ Expected Minutes of Perching
Yes
No
Yes
No
Yes
No
Yes
No
Yes
No
Yes
No
Yes
No
Yes
No
2.0 1.51.00.50
Golden eagle
Red - tailed hawk
Prairie falcon
American kestrel
Burrowing owl
Common raven
Loggerhead shrike
Western meadowlark
Value expectedby chance
ns
ns
ns

251
Figure 5-151. Associations between minutes of close-by flights to wind turbines and the number of other wind turbines within 300 m for raptor species. All tests were significant, P < 0.05.
5.9
0 - 12 13 - 24 25 - 36 37 - 71
0 - 12 13 - 24 25 - 36 37 - 71
0 - 12 13 - 24 25 - 36 37 - 71
0 - 12 13 - 24 25 - 36 37 - 71
0 - 12 13 - 24 25 - 36 37 - 71
0 - 12 13 - 24 25 - 36 37 - 71
3.0 2.52.01.51.00.50
No. turbines = 300 m
Observed ÷ Expected Minutes of FlightThat Came to Within 50 m of Turbine
Golden eagle
Red - tailed hawk
Northern harrier
Prairie falcon
Americankestrel
Burrowing owl
Value expectedby chance
5.9
0 - 12 13 - 24 25 - 36 37 - 71
0 - 12 13 - 24 25 - 36 37 - 71
0 - 12 13 - 24 25 - 36 37 - 71
0 - 12 13 - 24 25 - 36 37 - 71
0 - 12 13 - 24 25 - 36 37 - 71
0 - 12 13 - 24 25 - 36 37 - 71
3.0 2.52.01.51.00.50
No. turbines = 300 m
Observed ÷ Expected Minutes of Flight
Golden eagle
Red - tailed hawk
Northern harrier
Prairie falcon
Americankestrel
Burrowing owl
Value expectedby chance

252
Figure 5-152. Associations between minutes of close-by flights to wind turbines and the number of other wind turbines within 300 m for nonraptor species. All tests were significant, P < 0.05. Lighter bars indicate expected cell values of <5 and are therefore of less reliability.
3.0 2.52.01.51.00.50
No. turbines= 300 m
Observed ÷ Expected Minutes of FlightThat Came to Within 50 m of Turbine
0 - 12 13 - 24 25 - 36 37 - 71
0 - 12 13 - 24 25 - 36 37 - 71
0 - 12 13 - 24 25 - 36 37 - 71
0 - 12 13 - 24 25 - 36 37 - 71
0 - 12 13 - 24 25 - 36 37 - 71
0 - 12 13 - 24 25 - 36 37 - 71
Turkey vulture
Common raven
Mallard
Loggerhead shrike
Western meadowlark
Horned lark
Value expectedby chance
3.0 2.52.01.51.00.50
No. turbines= 300 m
Observed ÷ Expected Minutes of Flight
0 - 12 13 - 24 25 - 36 37 - 71
0 - 12 13 - 24 25 - 36 37 - 71
0 - 12 13 - 24 25 - 36 37 - 71
0 - 12 13 - 24 25 - 36 37 - 71
0 - 12 13 - 24 25 - 36 37 - 71
0 - 12 13 - 24 25 - 36 37 - 71
Turkey vulture
Common raven
Mallard
Loggerhead shrike
Western meadowlark
Horned lark
Value expectedby chance

253
Figure 5-153. Associations between minutes of perching on wind turbines and the number of other wind turbines within 300 m. In the figure, “ns” denotes χ2 tests that were not significant, and no notation represents χ2 tests that were significant, P < 0.05. Lighter bars indicate expected cell values of <5 and are therefore of less reliability. Location in Wind Farm Close-by flights composed disproportionately more time at turbines at the edge of the wind farm for northern harrier and American kestrel, at the edges of local clusters of turbines for golden eagle, red-tailed hawk and turkey vulture, and in the interior of the wind farm for prairie falcon, burrowing owl, common raven and horned lark (Figure 5-154). Perching upon turbines was favored at the farm edge by red-tailed hawk, American kestrel, common raven, and western meadowlark (Figure 5-155).
0 - 12 13 - 24 25 - 36 37 - 71
0 - 12 13 - 24 25 - 36 37 - 71
0 - 12 13 - 24 25 - 36 37 - 71
0 - 12 13 - 24 25 - 36 37 - 71
0 - 12 13 - 24 25 - 36 37 - 71
0 - 12 13 - 24 25 - 36 37 - 71
0 - 12 13 - 24 25 - 36 37 - 71
0 - 12 13 - 24 25 - 36 37 - 71
6 543210
No. turbines= 300 m
Observed ÷ Expected Minutes of Perching on Turbine
Golden eagle
Red -tailed hawk
Prairie falcon
American kestrel
Burrowing owl
Common raven
Loggerhead shrike
Western meadowlark
Value expectedby chance
ns 0 - 12 13 - 24 25 - 36 37 - 71
0 - 12 13 - 24 25 - 36 37 - 71
0 - 12 13 - 24 25 - 36 37 - 71
0 - 12 13 - 24 25 - 36 37 - 71
0 - 12 13 - 24 25 - 36 37 - 71
0 - 12 13 - 24 25 - 36 37 - 71
0 - 12 13 - 24 25 - 36 37 - 71
0 - 12 13 - 24 25 - 36 37 - 71
6 543210
No. turbines= 300 m
Observed ÷ Expected Minutes of Perching
Golden eagle
Red -tailed hawk
Prairie falcon
American kestrel
Burrowing owl
Common raven
Loggerhead shrike
Western meadowlark
Value expectedby chance
ns

254
Figure 5-154. Associations between minutes of close-by flights to wind turbines and the wind turbine’s location in the wind farm. In the figure, “ns” denotes χ2 tests that were not significant, and no notation represents χ2 tests that were significant, P < 0.05. Lighter bars indicate expected cell values of <5 and are therefore of less reliability.
Farm edge Local edge
InteriorFarm edge Local edge
InteriorFarm edge Local edge
InteriorFarm edge Local edge
InteriorFarm edge Local edge
InteriorFarm edge Local edge
InteriorFarm edge Local edge
InteriorFarm edge Local edge
InteriorFarm edge Local edge
InteriorFarm edge Local edge
InteriorFarm edge Local edge
InteriorFarm edge Local edge
Interior
Location inwind farm
Observed ÷ Expected Minutes of Flight That Came to Within 50 m of Turbine
Golden eagle
Red - tailed hawk
Northern harrier Prairie falcon
American kestrel
Turkey vulture
Common raven
Loggerhead shrike
Burrowing owl
Western meadowlark
Mallard
Horned lark
Value expectedby chance
3.0 2.5 2.01.51.00.50
0.10 > P > 0.05
ns
ns
ns
Farm edge Local edge
InteriorFarm edge Local edge
InteriorFarm edge Local edge
InteriorFarm edge Local edge
InteriorFarm edge Local edge
InteriorFarm edge Local edge
InteriorFarm edge Local edge
InteriorFarm edge Local edge
InteriorFarm edge Local edge
InteriorFarm edge Local edge
InteriorFarm edge Local edge
InteriorFarm edge Local edge
Interior
Location inwind farm
Observed ÷ Expected Minutes of Flight
Golden eagle
Red - tailed hawk
Northern harrier Prairie falcon
American kestrel
Turkey vulture
Common raven
Loggerhead shrike
Burrowing owl
Western meadowlark
Mallard
Horned lark
Value expectedby chance
3.0 2.5 2.01.51.00.50
0.10 > P > 0.05
ns
ns
ns

255
Figure 5-155. Associations between minutes of perching on wind turbines and the wind turbine’s location in the wind farm. In the figure, “ns” denotes χ2 tests that were not significant, and no notation represents χ2 tests that were significant, P < 0.05. Lighter bars indicate expected cell values of <5 and are therefore of less reliability. Elevation Close-by flight time was disproportionately longer at mid-low elevation (185 to 235 m) for golden eagle, red-tailed hawk, northern harrier, turkey vulture, common raven and western meadowlark, whereas low elevations were favored by burrowing owl and mallard, and high elevations were favored by American kestrel, common raven, loggerhead shrike and horned lark (Figures 5-156 through 5-158). When turbines were chosen as perches, red-tailed hawk showed no particular pattern, but prairie falcon, American kestrel, common raven and western meadowlark perched longer than expected on turbines at the highest elevations and loggerhead shrike perched on turbines longer than expected at the lowest elevations (Figures 5-159 and 5-160).
Farm edge Local edge
Interior Farm edge Local edge
Interior Farm edge Local edge
Interior Farm edge Local edge
Interior Farm edge Local edge
Interior Farm edge Local edge
Interior Farm edge Local edge
Interior Farm edge Local edge
Interior
10
Location in wind farm
Observed ÷ Expected Minutes of Perching on Turbine
Golden eagle
Red - tailed hawk
Prairie falcon
American kestrel
Burrowing owl
Common raven
Loggerhead shrike
Western meadowlark
Value expectedby chance
3.0 2.52.01.51.00.50
ns
ns
ns
Farm edge Local edge
Interior Farm edge Local edge
Interior Farm edge Local edge
Interior Farm edge Local edge
Interior Farm edge Local edge
Interior Farm edge Local edge
Interior Farm edge Local edge
Interior Farm edge Local edge
Interior
10
Location in wind farm
Observed ÷ Expected Minutes of Perching
Golden eagle
Red - tailed hawk
Prairie falcon
American kestrel
Burrowing owl
Common raven
Loggerhead shrike
Western meadowlark
Value expectedby chance
3.0 2.52.01.51.00.50
ns
ns
ns
256
Figure 5-156. Associations between minutes of close-by flights to wind turbines and elevation for golden eagle, red-tailed hawk, northern harrier, and prairie falcon. In the figure, “ns” denotes χ2 tests that were not significant, and no notation represents χ2 tests that were significant, P < 0.05. Lighter bars indicate expected cell values of <5 and are therefore of less reliability.
110 160 210 260 310 360 460 110 160 210 260 310 360 460 110 160 210 260 310 360 460 110 160 210 260 310 360 460
4 3210 Observed ÷ Expected Minutes of Flight
That Came to Within 50 m of Turbine
Elevation (m),mid - value of50 - m range
Red - tailed hawk
Golden eagle
Northern harrier
Prairie falcon
Value expectedby chance
ns
110 160 210 260 310 360 460 110 160 210 260 310 360 460 110 160 210 260 310 360 460 110 160 210 260 310 360 460
4 3210 Observed ÷ Expected Minutes of Flight
Elevation (m),mid - value of50 - m range
Red - tailed hawk
Golden eagle
Northern harrier
Prairie falcon
Value expectedby chance
ns

257
Figure 5-157. Associations between minutes of close-by flights to wind turbines and elevation for American kestrel, burrowing owl, turkey vulture, and common raven. All tests were significant, P < 0.05.
6.7
43210
110 160 210 260 310 360 460 110 160 210 260 310 360 460 110 160 210 260 310 360 460 110 160 210 260 310 360 460
Observed ÷ Expected Minutes of FlightThat Came to Within 50 m of Turbine
Elevation (m), mid - value of 50 - m range
Turkey vulture
Common raven
American kestrel
Burrowing owl
Value expectedby chance
6.7
43210
110 160 210 260 310 360 460 110 160 210 260 310 360 460 110 160 210 260 310 360 460 110 160 210 260 310 360 460
Observed ÷ Expected Minutes of Flight
Elevation (m), mid - value of 50 - m range
Turkey vulture
Common raven
American kestrel
Burrowing owl
Value expectedby chance

258
Figure 5-158. Associations between minutes of close-by flights to wind turbines and elevation for mallard, loggerhead shrike, western meadowlark, and horned lark. All tests were significant, P < 0.05. Lighter bars indicate expected cell values of <5 and are therefore of less reliability.
6.2
43210
110 160 210 260 310 360 460 110 160 210 260 310 360 460 110 160 210 260 310 360 460 110 160 210 260 310 360 460
Observed ÷ Expected Minutes of FlightThat Came to Within 50 m of Turbine
Elevation (m), mid - value of 50 - m range
Loggerhead shrike
Western meadowlark
Mallard
Horned lark
Value expectedby chance
6.2
43210
110 160 210 260 310 360 460 110 160 210 260 310 360 460 110 160 210 260 310 360 460 110 160 210 260 310 360 460
Observed ÷ Expected Minutes of Flight
Elevation (m), mid - value of 50 - m range
Loggerhead shrike
Western meadowlark
Mallard
Horned lark
Value expectedby chance

259
Figure 5-159. Associations between minutes of perching on a wind turbine and its elevation for golden eagle, red-tailed hawk, prairie falcon, American kestrel, and burrowing owl. In the figure, “ns” denotes χ2 tests that were not significant, and no notation represents χ2 tests that were significant, P < 0.05. Lighter bars indicate expected cell values of <5 and are therefore of less reliability.
5 43210
110 160 210 260 310 360 460 110 160 210 260 310 360 460 110 160 210 260 310 360 460 110 160 210 260 310 360 460
Observed ÷ Expected Minutes of Perchingon Turbine
Elevation (m),mid - value of50 - m range
Golden eagle
Red - tailed hawk
Prairie falcon
American kestrel
Value expectedby chance
ns
5 43210
110 160 210 260 310 360 460 110 160 210 260 310 360 460 110 160 210 260 310 360 460 110 160 210 260 310 360 460
Observed ÷ Expected Minutes of Perching
Elevation (m),mid - value of50 - m range
Golden eagle
Red - tailed hawk
Prairie falcon
American kestrel
Value expectedby chance
ns

260
Figure 5-160. Associations between minutes of perching on a wind turbine and its elevation for common raven, loggerhead shrike, and western meadowlark. All tests were significant, P < 0.05. Slope Grade Close-by flights composed disproportionately more time at turbines on the steepest slopes for golden eagle, red-tailed hawk, northern harrier, prairie falcon, turkey vulture and western meadowlark, and shallow slopes for American kestrel and burrowing owl (Figures 5-161 and 5-162). Those species closely examined spent more than the expected amount of time perching on turbines when they were on gentle slopes (Figure 5-163).
6.3
110 160 210 260 310 360 460 110 160 210 260 310 360 460 110 160 210 260 310 360 460
543210 Observed ÷ Expected Minutes of Perching
on Turbine
Elevation (m), mid - value of 50 - m range
Common raven
Loggerhead shrike
Western meadowlark
Value expectedby chance
6.3
110 160 210 260 310 360 460 110 160 210 260 310 360 460 110 160 210 260 310 360 460
543210 Observed ÷ Expected Minutes of Perching
Elevation (m), mid - value of 50 - m range
Common raven
Loggerhead shrike
Western meadowlark
Value expectedby chance

261
Figure 5-161. Associations between minutes of close-by flights to wind turbines and slope grade for raptor species. In the figure, “ns” denotes χ2 tests that were not significant, and no notation represents χ2 tests that were significant, P < 0.05.
5.1
0 - 1 1 - 2 2 - 4 > 4
0 - 1 1 - 2 2 - 4 > 4
0 - 1 1 - 2 2 - 4 > 4
0 - 1 1 - 2 2 - 4 > 4
0 - 1 1 - 2 2 - 4 > 4
0 - 1 1 - 2 2 - 4 > 4
3.0 2.52.01.51.00.50
Change in elevation (m)per turbine in string
Observed ÷ Expected Minutes of FlightThat Came to Within 50 m of Turbine
Golden eagle
Red - tailed hawk
Northern harrier
Prairie falcon
American kestrel
Burrowing owl
Value expectedby chance
ns
5.1
0 - 1 1 - 2 2 - 4 > 4
0 - 1 1 - 2 2 - 4 > 4
0 - 1 1 - 2 2 - 4 > 4
0 - 1 1 - 2 2 - 4 > 4
0 - 1 1 - 2 2 - 4 > 4
0 - 1 1 - 2 2 - 4 > 4
3.0 2.52.01.51.00.50
Change in elevation (m)per turbine in string
Observed ÷ Expected Minutes of Flight
Golden eagle
Red - tailed hawk
Northern harrier
Prairie falcon
American kestrel
Burrowing owl
Value expectedby chance
ns

262
Figure 5-162. Associations between minutes of close-by flights to wind turbines and slope grade for nonraptor species. All tests were significant, P < 0.05. Lighter bars indicate expected cell values of <5 and are therefore of less reliability.
3.0 2.52.01.51.00.50
Change in elevation (m)per turbine in string
Observed ÷ Expected Minutes of FlightThat Came to Within 50 m of Turbine
0 - 1 1 - 2 2 - 4 > 4
0 - 1 1 - 2 2 - 4 > 4
0 - 1 1 - 2 2 - 4 > 4
0 - 1 1 - 2 2 - 4 > 4
0 - 1 1 - 2 2 - 4 > 4
0 - 1 1 - 2 2 - 4 > 4
Turkey vulture
Common raven
Mallard
Loggerhead shrike
Western meadowlark
Horned lark
Value expectedby chance
3.0 2.52.01.51.00.50
Change in elevation (m)per turbine in string
Observed ÷ Expected Minutes of Flight
0 - 1 1 - 2 2 - 4 > 4
0 - 1 1 - 2 2 - 4 > 4
0 - 1 1 - 2 2 - 4 > 4
0 - 1 1 - 2 2 - 4 > 4
0 - 1 1 - 2 2 - 4 > 4
0 - 1 1 - 2 2 - 4 > 4
Turkey vulture
Common raven
Mallard
Loggerhead shrike
Western meadowlark
Horned lark
Value expectedby chance

263
Figure 5-163. Associations between minutes of perching on wind turbines and slope grade. In the figure, “ns” denotes χ2 tests that were not significant, and no notation represents χ2 tests that were significant, P < 0.05. Lighter bars indicate expected cell values of <5 and are therefore of less reliability. Slope Aspect When flying close by turbines, golden eagle flew longer than expected by chance on south- and southeast-facing slopes, red-tailed hawk flew longer on southwest- and west-facing slopes, and prairie falcon on northwest slopes (Figure 5-164). Close-by flights lasted longer by turbines on relatively flat terrain with no slope aspect for American kestrel, burrowing owl, loggerhead shrike and horned lark (Figures 5-164 and 5-165). When turbines were perched upon, those favored were on flat terrain for red-tailed hawk (which also favored northeast- and east-facing slopes), prairie falcon, American kestrel, burrowing owl and western meadowlark (Figure 5-166).
0 - 1 1 - 2 2 - 4 > 4
0 - 1 1 - 2 2 - 4 > 4
0 - 1 1 - 2 2 - 4 > 4
0 - 1 1 - 2 2 - 4 > 4
0 - 1 1 - 2 2 - 4 > 4
0 - 1 1 - 2 2 - 4 > 4
0 - 1 1 - 2 2 - 4 > 4
0 - 1 1 - 2 2 - 4 > 4
5 43210 Observed ÷ Expected Minutes of Perching
on Turbine
Change in elevation (m)per turbine in string
Golden eagle
Red - tailed hawk
Prairie falcon
American kestrel
Burrowing owl
Common raven
Loggerhead shrike
Western meadowlark
Value expectedby chance
ns
ns
ns
0 - 1 1 - 2 2 - 4 > 4
0 - 1 1 - 2 2 - 4 > 4
0 - 1 1 - 2 2 - 4 > 4
0 - 1 1 - 2 2 - 4 > 4
0 - 1 1 - 2 2 - 4 > 4
0 - 1 1 - 2 2 - 4 > 4
0 - 1 1 - 2 2 - 4 > 4
0 - 1 1 - 2 2 - 4 > 4
5 43210 Observed ÷ Expected Minutes of Perching
Change in elevation (m)per turbine in string
Golden eagle
Red - tailed hawk
Prairie falcon
American kestrel
Burrowing owl
Common raven
Loggerhead shrike
Western meadowlark
Value expectedby chance
ns
ns
ns

264
Figure 5-164. Associations between minutes of close-by flights to wind turbines and slope aspect for raptor species. In the figure, “ns” denotes χ2 tests that were not significant, and no notation represents χ2 tests that were significant, P < 0.05. Lighter bars indicate expected cell values of <5 and are therefore of less reliability.
None NE, E SE, S
SW, W NW, N None NE, E SE, S
SW, W NW, N None NE, E SE, S
SW, W NW, N None NE, E SE, S
SW, W NW, N None NE, E SE, S
SW, W NW, N None NE, E SE, S
SW, W NW, N
4.5 4.0 3.53.02.52.01.51.00.50 Observed ÷ Expected Minutes of Flight
That Came to Within 50 m of Turbine
Slope aspectat turbine
Golden eagle
Red - tailed hawk
Northern harrier
Prairie falcon
American kestrel
Burrowing owl
Value expectedby chance
ns
None NE, E SE, S
SW, W NW, N None NE, E SE, S
SW, W NW, N None NE, E SE, S
SW, W NW, N None NE, E SE, S
SW, W NW, N None NE, E SE, S
SW, W NW, N None NE, E SE, S
SW, W NW, N
4.5 4.0 3.53.02.52.01.51.00.50 Observed ÷ Expected Minutes of Flight
Slope aspectat turbine
Golden eagle
Red - tailed hawk
Northern harrier
Prairie falcon
American kestrel
Burrowing owl
Value expectedby chance
ns
265
Figure 5-165. Associations between minutes of close-by flights to wind turbines and slope aspect for nonraptor species. All tests were significant, P < 0.05.
None NE, E SE, S
SW, W NW, N None NE, E SE, S
SW, W NW, N None NE, E SE, S
SW, W NW, N None NE, E SE, S
SW, W NW, N None NE, E SE, S
SW, W NW, N None NE, E SE, S
SW, W NW, N
4.5 4.0 3.53.02.52.01.51.00.50Observed ÷ Expected Minutes of Flight
That Came to Within 50 m of Turbine
Slope aspectat turbine
Turkey vulture
Common raven
Mallard
Loggerhead shrike
Western meadowlark
Horned lark
Value expectedby chance
None NE, E SE, S
SW, W NW, N None NE, E SE, S
SW, W NW, N None NE, E SE, S
SW, W NW, N None NE, E SE, S
SW, W NW, N None NE, E SE, S
SW, W NW, N None NE, E SE, S
SW, W NW, N
4.5 4.0 3.53.02.52.01.51.00.50Observed ÷ Expected Minutes of Flight
Slope aspectat turbine
Turkey vulture
Common raven
Mallard
Loggerhead shrike
Western meadowlark
Horned lark
Value expectedby chance

266
Figure 5-166. Associations between minutes of perching on wind turbines and slope aspect. In the figure, “ns” denotes χ2 tests that were not significant, and no notation represents χ2 tests that were significant, P < 0.05. Lighter bars indicate expected cell values of <5 and are therefore of less reliability. Physical Relief Close-by flights to turbines lasted disproportionately longer on peaks for golden eagle, red-tailed hawk, and northern harrier, on plateaus for American kestrel and common raven, on ridge crests for red-tailed hawk, burrowing owl, loggerhead shrike and horned lark, ridgelines for prairie falcon, American kestrel and western meadowlark, and on slopes for turkey vulture and mallard (Figures 5-167 through 5-169). Turbines selected as perches were used disproportionately longer when on plateaus for red-tailed hawk (which also favored turbines on saddles and in ravines), American kestrel, common raven and loggerhead shrike, on ridge crests for burrowing owl, and on ridgelines for common raven, loggerhead shrike and western meadowlark (Figures 5-170 and 5-171).
None NE, E SE, S
SW, W NW, N None NE, E SE, S
SW, W NW, N None NE, E SE, S
SW, W NW, N None NE, E SE, S
SW, W NW, N None NE, E SE, S
SW, W NW, N None NE, E SE, S
SW, W NW, N None NE, E SE, S
SW, W NW, N None NE, E SE, S
SW, W NW, N
5 43210Observed ÷ Expected Minutes of Perching
on Turbine
Slope aspectat turbine
Golden eagle
Red - tailed hawk
Prairie falcon
American kestrel
Burrowing owl
Common raven
Loggerhead shrike
Western meadowlark
Value expectedby chance
ns None NE, E SE, S
SW, W NW, N None NE, E SE, S
SW, W NW, N None NE, E SE, S
SW, W NW, N None NE, E SE, S
SW, W NW, N None NE, E SE, S
SW, W NW, N None NE, E SE, S
SW, W NW, N None NE, E SE, S
SW, W NW, N None NE, E SE, S
SW, W NW, N
5 43210Observed ÷ Expected Minutes of Perching
Slope aspectat turbine
Golden eagle
Red - tailed hawk
Prairie falcon
American kestrel
Burrowing owl
Common raven
Loggerhead shrike
Western meadowlark
Value expectedby chance
ns

267
Figure 5-167. Associations between minutes of close-by flights to wind turbines and topography for golden eagle, red-tailed hawk, northern harrier, and prairie falcon. All tests were significant, P < 0.05. Lighter bars indicate expected cell values of <5 and are therefore of less reliability.
Red - tailed hawk
Peak Plateau
Ridge crest Ridgeline
Slope Saddle Ravine
Peak Plateau
Ridge crest Ridgeline
Slope Saddle Ravine
Peak Plateau
Ridge crest Ridgeline
Slope Saddle Ravine
Peak Plateau
Ridge crest Ridgeline
Slope Saddle Ravine
4 3210Observed ÷ Expected Minutes of Flight
That Came to Within 50 m of Turbine
Physical reliefat turbine
Golden eagle
Northern harrier
Prairie falcon
Value expectedby chance
Red - tailed hawk
Peak Plateau
Ridge crest Ridgeline
Slope Saddle Ravine
Peak Plateau
Ridge crest Ridgeline
Slope Saddle Ravine
Peak Plateau
Ridge crest Ridgeline
Slope Saddle Ravine
Peak Plateau
Ridge crest Ridgeline
Slope Saddle Ravine
4 3210Observed ÷ Expected Minutes of Flight
Physical reliefat turbine
Golden eagle
Northern harrier
Prairie falcon
Value expectedby chance

268
Figure 5-168. Associations between minutes of close-by flights to wind turbines and topography for American kestrel, burrowing owl, turkey vulture, and common raven. All tests were significant, P < 0.05.
4 3210
6.4
Observed ÷ Expected Minutes of FlightThat Came to Within 50 m of Turbine
Physical relief at turbine
Turkey vulture
Common raven
American kestrel
Burrowing owl
Value expectedby chance
Peak Plateau
Ridge crest Ridgeline
Slope Saddle Ravine
Peak Plateau
Ridge crest Ridgeline
Slope Saddle Ravine
Peak Plateau
Ridge crest Ridgeline
Slope Saddle Ravine
Peak Plateau
Ridge crest Ridgeline
Slope Saddle Ravine
4 3210
6.4
Observed ÷ Expected Minutes of Flight
Physical relief at turbine
Turkey vulture
Common raven
American kestrel
Burrowing owl
Value expectedby chance
Peak Plateau
Ridge crest Ridgeline
Slope Saddle Ravine
Peak Plateau
Ridge crest Ridgeline
Slope Saddle Ravine
Peak Plateau
Ridge crest Ridgeline
Slope Saddle Ravine
Peak Plateau
Ridge crest Ridgeline
Slope Saddle Ravine

269
Figure 5-169. Associations between minutes of close-by flights to wind turbines and topography for mallard, loggerhead shrike, western meadowlark, and horned lark. In the figure, “ns” denotes χ2 tests that were not significant, and no notation represents χ2 tests that were significant, P < 0.05. Lighter bars indicate expected cell values of <5 and are therefore of less reliability.
4 3210
5.9
14.9
Observed ÷ Expected Minutes of FlightThat Came to Within 50 m of Turbine
Physical relief at turbine
Loggerhead shrike
Western meadowlark
Mallard
Horned lark
Value expectedby chance
nsPeak Plateau
Ridge crest Ridgeline
Slope Saddle Ravine
Peak Plateau
Ridge crest Ridgeline
Slope Saddle Ravine
Peak Plateau
Ridge crest Ridgeline
Slope Saddle Ravine
Peak Plateau
Ridge crest Ridgeline
Slope Saddle Ravine
4 3210
5.9
14.9
Observed ÷ Expected Minutes of Flight
Physical relief at turbine
Loggerhead shrike
Western meadowlark
Mallard
Horned lark
Value expectedby chance
nsPeak Plateau
Ridge crest Ridgeline
Slope Saddle Ravine
Peak Plateau
Ridge crest Ridgeline
Slope Saddle Ravine
Peak Plateau
Ridge crest Ridgeline
Slope Saddle Ravine
Peak Plateau
Ridge crest Ridgeline
Slope Saddle Ravine

270
Figure 5-170. Associations between minutes of perching on a wind turbine and its topography for golden eagle, red-tailed hawk, prairie falcon, American kestrel, and burrowing owl. In the figure, “ns” denotes χ2 tests that were not significant, and no notation represents χ2 tests that were significant, P < 0.05. Lighter bars indicate expected cell values of <5 and are therefore of less reliability.
Peak Plateau
Ridge crest Ridgeline
Slope Saddle Ravine
Peak Plateau
Ridge crest Ridgeline
Slope Saddle Ravine
Peak Plateau
Ridge crest Ridgeline
Slope Saddle Ravine
Peak Plateau
Ridge crest Ridgeline
Slope Saddle Ravine
Peak Plateau
Ridge crest Ridgeline
Slope Saddle Ravine
4 3210Observed ÷ Expected Minutes of Perching
on Turbine
Physical reliefat turbine
Golden eagle
Red - tailed hawk
Prairie falcon
American kestrel
Burrowing owl
Value expectedby chance
ns
ns
Peak Plateau
Ridge crest Ridgeline
Slope Saddle Ravine
Peak Plateau
Ridge crest Ridgeline
Slope Saddle Ravine
Peak Plateau
Ridge crest Ridgeline
Slope Saddle Ravine
Peak Plateau
Ridge crest Ridgeline
Slope Saddle Ravine
Peak Plateau
Ridge crest Ridgeline
Slope Saddle Ravine
4 3210Observed ÷ Expected Minutes of Perching
Physical reliefat turbine
Golden eagle
Red - tailed hawk
Prairie falcon
American kestrel
Burrowing owl
Value expectedby chance
ns
ns

271
Figure 5-171. Associations between minutes of perching on a wind turbine and its topography for common raven, loggerhead shrike, and western meadowlark. All tests were significant, P < 0.05. Lighter bars indicate expected cell values of <5 and are therefore of less reliability. Whether in Canyon Close-by flight time was favored for turbines in canyons by golden eagle, red-tailed hawk, northern harrier, and turkey vulture, and out of canyons by American kestrel, burrowing owl, loggerhead shrike, western meadowlark and horned lark (Figure 5-172). When turbines were perched on, no species we examined more carefully favored turbines in canyons (Figure 5-173).
Peak Plateau
Ridge crest Ridgeline
Slope Saddle Ravine
Peak Plateau
Ridge crest Ridgeline
Slope Saddle Ravine
Peak Plateau
Ridge crest Ridgeline
Slope Saddle Ravine
13.4
Observed ÷ Expected Minutes of Perchingon Turbine
Physical relief at turbine
Common raven
Loggerhead shrike
Western meadowlark
Value expectedby chance
6 543210
Peak Plateau
Ridge crest Ridgeline
Slope Saddle Ravine
Peak Plateau
Ridge crest Ridgeline
Slope Saddle Ravine
Peak Plateau
Ridge crest Ridgeline
Slope Saddle Ravine
13.4
Observed ÷ Expected Minutes of Perching
Physical relief at turbine
Common raven
Loggerhead shrike
Western meadowlark
Value expectedby chance
6 543210

272
Figure 5-172. Associations between minutes of close-by flights to wind turbines and whether the wind turbine is located in a canyon. In the figure, “ns” denotes χ2 tests that were not significant, and no notation represents χ2 tests that were significant, P < 0.05.
No Yes No
Yes No
Yes No
Yes No
Yes No
Yes No
Yes No
Yes No
Yes No
Yes No
Yes No
Yes 2.0 1.51.00.50
Whether in canyon
Observed ÷ Expected Minutes of FlightThat Came to Within 50 m of Turbine
Golden eagle
Red - tailed hawk
Northern harrier Prairie falcon
American kestrel
Turkey vulture
Common raven
Loggerhead shrike
Burrowing owl
Western meadowlark
Mallard
Horned lark
Value expectedby chance
ns
ns
ns
0.10 > P > 0.05
No Yes No
Yes No
Yes No
Yes No
Yes No
Yes No
Yes No
Yes No
Yes No
Yes No
Yes No
Yes 2.0 1.51.00.50
Whether in canyon
Observed ÷ Expected Minutes of Flight
Golden eagle
Red - tailed hawk
Northern harrier Prairie falcon
American kestrel
Turkey vulture
Common raven
Loggerhead shrike
Burrowing owl
Western meadowlark
Mallard
Horned lark
Value expectedby chance
ns
ns
ns
0.10 > P > 0.05

273
Figure 5-173. Associations between minutes of perching on wind turbines and whether the wind turbine is located in a canyon. In the figure, “ns” denotes χ2 tests that were not significant, and no notation represents χ2 tests that were significant, P < 0.05.
Edge Index Flight time near turbines was disproportionately longer with lots of adjacent vertical edge for golden eagle, red-tailed hawk, northern harrier, prairie falcon and mallard, and with no edge for American kestrel, burrowing owl and turkey vulture (Figures 5-174 and 5-175). Golden eagle, red-tailed hawk and prairie falcon perched on turbines disproportionately longer with lots of adjacent, vertical edge, whereas American kestrel, burrowing owl, loggerhead shrike and western meadowlark favored turbines for perching when no lateral or vertical edge was present (Figure 5-176).
No
Yes
No
Yes
No
Yes
No
Yes
No
Yes
No
Yes
No
Yes
No
Yes
2.0 1.51.00.50 Observed ÷ Expected Minutes of Perching
on Turbine
Whether in canyon
Golden eagle
Red - tailed hawk
Prairie falcon
American kestrel
Burrowing owl
Common raven
Loggerhead shrike
Western meadowlark
Value expectedby chance
0.10 > P > 0.05
ns No
Yes
No
Yes
No
Yes
No
Yes
No
Yes
No
Yes
No
Yes
No
Yes
2.0 1.51.00.50 Observed ÷ Expected Minutes of Perching
Whether in canyon
Golden eagle
Red - tailed hawk
Prairie falcon
American kestrel
Burrowing owl
Common raven
Loggerhead shrike
Western meadowlark
Value expectedby chance
0.10 > P > 0.05
ns

274
Figure 5-174. Associations between minutes of close-by flights to wind turbines and the edge index of the tower laydown area, for raptor species. All tests were significant, P < 0.05. Lighter bars indicate expected cell values of <5 and are therefore of less reliability.
None Some lateral
Lots lateral Some vertical
Lots vertical None
Some lateral Lots lateral
Some vertical Lots vertical
None Some lateral
Lots lateral Some vertical
Lots vertical None
Some lateral Lots lateral
Some vertical Lots vertical
None Some lateral
Lots lateral Some vertical
Lots vertical None
Some lateral Lots lateral
Some vertical Lots vertical
5 43210
34.9
Edge index at turbine
Observed ÷ Expected Minutes of FlightThat Came to Within 50 m of Turbine
Golden eagle
Red - tailed hawk
Northern harrier
Prairie falcon
American kestrel
Burrowing owl
Value expectedby chance
None Some lateral
Lots lateral Some vertical
Lots vertical None
Some lateral Lots lateral
Some vertical Lots vertical
None Some lateral
Lots lateral Some vertical
Lots vertical None
Some lateral Lots lateral
Some vertical Lots vertical
None Some lateral
Lots lateral Some vertical
Lots vertical None
Some lateral Lots lateral
Some vertical Lots vertical
5 43210
34.9
Edge index at turbine
Observed ÷ Expected Minutes of Flight
Golden eagle
Red - tailed hawk
Northern harrier
Prairie falcon
American kestrel
Burrowing owl
Value expectedby chance

275
Figure 5-175. Associations between minutes of close-by flights to wind turbines and the edge index of the tower laydown area, for nonraptor species. All tests were significant, P < 0.05. Lighter bars indicate expected cell values of <5 and are therefore of less reliability.
5 43210
Edge indexat turbine
Observed ÷ Expected Minutes of Flight That Came to Within 50 m of Turbine
Turkey vulture
Common raven
Mallard
Loggerhead shrike
Western meadowlark
Horned lark
Value expectedby chance
NoneSome lateral
Lots lateralSome vertical
Lots verticalNone
Some lateralLots lateral
Some verticalLots vertical
NoneSome lateral
Lots lateralSome vertical
Lots verticalNone
Some lateralLots lateral
Some verticalLots vertical
NoneSome lateral
Lots lateralSome vertical
Lots verticalNone
Some lateralLots lateral
Some verticalLots vertical
5 43210
Edge indexat turbine
Observed ÷ Expected Minutes of Flight
Turkey vulture
Common raven
Mallard
Loggerhead shrike
Western meadowlark
Horned lark
Value expectedby chance
NoneSome lateral
Lots lateralSome vertical
Lots verticalNone
Some lateralLots lateral
Some verticalLots vertical
NoneSome lateral
Lots lateralSome vertical
Lots verticalNone
Some lateralLots lateral
Some verticalLots vertical
NoneSome lateral
Lots lateralSome vertical
Lots verticalNone
Some lateralLots lateral
Some verticalLots vertical

276
Figure 5-176. Associations between minutes of perching on wind turbines and the edge index of the tower laydown area. In the figure, “ns” denotes χ2 tests that were not significant, and no notation represents χ2 tests that were significant, P < 0.05. Lighter bars indicate expected cell values of <5 and are therefore of less reliability. Rock Piles Close-by flights composed disproportionately more time at turbines without rock piles for golden eagle, turkey vulture, mallard and loggerhead shrike, and at turbines with the most rock piles for red-tailed hawk, northern harrier, American kestrel, and western meadowlark (Figure 5-177). However, golden eagles favored turbines as perch sites when they had the most nearby rock piles (Figure 5-178).
None Some lateral
Lots lateral Some vertical
Lots vertical None
Some lateral Lots lateral
Some vertical Lots vertical
None Some lateral
Lots lateral Some vertical
Lots vertical None
Some lateral Lots lateral
Some vertical Lots vertical
None Some lateral
Lots lateral Some vertical
Lots vertical None
Some lateral Lots lateral
Some vertical Lots vertical
None Some lateral
Lots lateral Some vertical
Lots vertical None
Some lateral Lots lateral
Some vertical Lots vertical
6 543210
35.6
Edge index at turbine
Observed ÷ Expected Minutes of Perching on Turbine
Golden eagle
Red - tailed hawk
Prairie falcon
American kestrel
Burrowing owl
Common raven
Loggerhead shrike
Western meadowlark
Value expectedby chance
ns None Some lateral
Lots lateral Some vertical
Lots vertical None
Some lateral Lots lateral
Some vertical Lots vertical
None Some lateral
Lots lateral Some vertical
Lots vertical None
Some lateral Lots lateral
Some vertical Lots vertical
None Some lateral
Lots lateral Some vertical
Lots vertical None
Some lateral Lots lateral
Some vertical Lots vertical
None Some lateral
Lots lateral Some vertical
Lots vertical None
Some lateral Lots lateral
Some vertical Lots vertical
6 543210
35.6
Edge index at turbine
Observed ÷ Expected Minutes of Perching
Golden eagle
Red - tailed hawk
Prairie falcon
American kestrel
Burrowing owl
Common raven
Loggerhead shrike
Western meadowlark
Value expectedby chance
ns
277
Figure 5-177. Associations between minutes of close-by flights to wind turbines and the abundance of rock piles nearby. In the figure, “ns” denotes χ2 tests that were not significant, and no notation represents χ2 tests that were significant, P < 0.05. Lighter bars indicate expected cell values of <5 and are therefore of less reliability.
None < 0.25 > 0.25 None
< 0.25 > 0.25 None
< 0.25 > 0.25 None
< 0.25 > 0.25 None
< 0.25 > 0.25 None
< 0.25 > 0.25 None
< 0.25 > 0.25 None
< 0.25 > 0.25 None
< 0.25 > 0.25 None
< 0.25 > 0.25 None
< 0.25 > 0.25 None
< 0.25 > 0.25
6.4
Rock piles/turbine in string
Observed ÷ Expected Minutes of FlightThat Came to Within 50 m of Turbine
Golden eagle
Red - tailed hawk
Northern harrier Prairie falcon
American kestrel
Turkey vulture
Common raven
Loggerhead shrike
Burrowing owl
Western meadowlark
Mallard
Horned lark
Value expectedby chance
3.0 2.52.01.51.00.50
0.10 > P > 0.05
ns
None < 0.25 > 0.25 None
< 0.25 > 0.25 None
< 0.25 > 0.25 None
< 0.25 > 0.25 None
< 0.25 > 0.25 None
< 0.25 > 0.25 None
< 0.25 > 0.25 None
< 0.25 > 0.25 None
< 0.25 > 0.25 None
< 0.25 > 0.25 None
< 0.25 > 0.25 None
< 0.25 > 0.25
6.4
Rock piles/turbine in string
Observed ÷ Expected Minutes of Flight
Golden eagle
Red - tailed hawk
Northern harrier Prairie falcon
American kestrel
Turkey vulture
Common raven
Loggerhead shrike
Burrowing owl
Western meadowlark
Mallard
Horned lark
Value expectedby chance
3.0 2.52.01.51.00.50
0.10 > P > 0.05
ns

278
Figure 5-178. Associations between minutes of perching on wind turbines and the abundance of rock piles nearby. In the figure, “ns” denotes χ2 tests that were not significant, and no notation represents χ2 tests that were significant, P < 0.05. Lighter bars indicate expected cell values of <5 and are therefore of less reliability. Relating Bird Use to Fatalities Interspecific Level of Analysis At the species level of analysis, the number of fatalities tallied from all fatality searches within the areas included in the behavior study did not correlate with the total number of minutes the species were observed flying or perching (Table 5-15), or present (rp = -0.05, n = 43), nor did the number of fatalities correlate with the number of birds seen (rp = -0.03, n = 44) or the average distance to the nearest turbine (rp = 0.14, n = 44). However, the number of fatalities did correlate with the number of flights through the rotor zone and the number of flights within 50 m of the turbines (Table 5-15). These results suggest that species that more
Rock piles/turbinein string
None < 0.25 > 0.25 None
< 0.25 > 0.25 None
< 0.25 > 0.25 None
< 0.25 > 0.25 None
< 0.25 > 0.25 None
< 0.25 > 0.25 None
< 0.25 > 0.25 None
< 0.25 > 0.25
7 6543210 Observed ÷ Expected Minutes of Perching
on Turbine
Golden eagle
Red - tailed hawk
Prairie falcon
American kestrel
Burrowing owl
Common raven
Loggerhead shrike
Western meadowlark
Value expectedby chance
ns
Rock piles/turbinein string
None < 0.25 > 0.25 None
< 0.25 > 0.25 None
< 0.25 > 0.25 None
< 0.25 > 0.25 None
< 0.25 > 0.25 None
< 0.25 > 0.25 None
< 0.25 > 0.25 None
< 0.25 > 0.25
7 6543210 Observed ÷ Expected Minutes of Perching
Golden eagle
Red - tailed hawk
Prairie falcon
American kestrel
Burrowing owl
Common raven
Loggerhead shrike
Western meadowlark
Value expectedby chance
ns

279
frequently fly by the turbines or through the row of turbines also more often are killed by the turbines, but these results are crude. We also selected behavioral records in which birds were recorded flying at blade height, and we performed correlation tests between the number of fatalities and predictor variables at the interspecific level. In these cases, the number of fatalities correlated significantly with the total number of minutes flying, the number of flights within 50 m of turbines, the number of flights through the rotor zone (Table 5-15), and the degree of nearness to the turbines (index of nearness, rp = 0.59, n = 44, P < 0.001). Our exclusion of the flights too low to the ground or too high above the turbines to be dangerous to the birds also revealed stronger relationships between the number of fatalities we observed per species and the levels at which specific behaviors were performed (Table 5-15). Bird species flying for longer periods at blade height but by broken turbines included red-tailed hawk, American kestrel, rock dove and European starling, and these species were killed by operating turbines more often as well (Figure 5-179). Table 5-15 also shows that the number of fatalities of a species correlated significantly and most strongly with the amount of time birds flew at blade height and within 50 m of broken turbines. The number of fatalities correlated with perching time insignificantly, and only when the turbines were operating or not, but not when the turbines were broken (Table 5-15). The percentage of the flight minutes, perching minutes, flights within 50 m of turbines, and flights through the rotor zone did not correlate significantly with the number of fatalities per species. However, scatter-plots of these variables revealed outliers, including western meadowlark, burrowing owl, rock dove, and red-tailed hawk (Figures 5-180A and 5-180B). These species were killed by turbines more often than expected based on the percentage of their flights taken within the height domain of the rotor swept area; they were more susceptible to being killed by the turbines than the other species in the APWRA. Table 5-15. The number of species and taxonomic groups (e.g., unidentified gull species) in comparisons were 44. * is P < 0.05, ** is P < 0.001.
Pearson Correlation Coefficient Correlate with number of fatalities
across species Flight minutes
Perch minutes
Flights through rotor
zone
Flights within 50 m of turbine
All behaviors included -0.06 0.07 0.58** 0.54** Only flights at blade height (or perching)
0.33* --- 0.60** 0.61**
and nearest turbine operating 0.64** 0.38* 0.66** 0.64** and nearest turbine not operating 0.13 0.30* 0.55** 0.58** and nearest turbine broken 0.59** 0.17 0.68** 0.68**

280
Figure 5-179. Number of fatalities per species regressed on number of flights at blade height by broken wind turbines.
1816 14 121086420
120
100
80
60
40
20
0
RTHA
RODO
AMKEEUST
WEMEBUOW
Number of Flights at Blade Height Within 50 m of Broken Turbine
Number of fatalities within behavior plots, 1998 through 2001
1816 14 121086420
120
100
80
60
40
20
0
RTHA
RODO
AMKEEUST
WEMEBUOW

281
Figure 5-180. Interspecific relationships between the number of fatalities found at a wind turbine and the percentage of minutes in flight at the height domain of the blades of the nearest wind turbines (A), as well as with the percentage of flights within 50 m of wind turbines and within the height domain of the turbine blades (B). Turbine Row Level of Analysis Table 5-16 summarizes the results of tests for correlation between mortality and behaviors. American kestrel appeared to be susceptible to turbine collision with greater levels of flying, perching, flying through the rotor zone, and being near the turbines. The mortality of burrowing owls increased with greater rates of flying,
100806040200
1201101009080706050403020100
100806040200
1201101009080706050403020100
Number of fatalitiesfound at turbines
in behaviorplots only
Number of fatalitiesfound at turbines
in behaviorplots only
Percentage of flight minutes within theheight domain of the rotor swept area
Percentage of flights within 50 m of turbines and that were within the height domain of the
rotor swept area
Western meadowlark
Rock dove
Red-tailed hawk
Burrowingowl
Burrowing owlWestern meadowlark
Rock dove
Red-tailed hawk
A
B
100806040200
1201101009080706050403020100
100806040200
1201101009080706050403020100
Number of fatalitiesfound at turbines
in behaviorplots only
Number of fatalitiesfound at turbines
in behaviorplots only
Percentage of flight minutes within theheight domain of the rotor swept area
Percentage of flights within 50 m of turbines and that were within the height domain of the
rotor swept area
Western meadowlark
Rock dove
Red-tailed hawk
Burrowingowl
Burrowing owlWestern meadowlark
Rock dove
Red-tailed hawk
A
B

282
perching, and being near the turbines. Red-tailed hawk mortality increased with greater rates of perching and being near turbines. Similar trends were found for the other species we examined. Table 5-17 also summarizes the results of tests for correlation between mortality and behaviors, but only for those turbine strings where at least one fatality of the species was found. In this case, the correlation coefficients increased for most tests, and the significance of some tests changed. However, all of the correlation coefficients remained positive, and, in general, mortality increased with greater rates of flying, perching, flying within 50 m of the turbines, and being nearer the turbines. Figure 5-181 exemplifies the difference in relationships between including all data when generating a correlation coefficient and only using the non-0 values. Table 5-16. Pearson’s 2-tailed correlation coefficients between mortality estimates and estimates of behavioral activity rates of select bird species observed at 132 turbine strings in the APWRA, where t represents 0.10 > P > 0.05, * represents P < 0.05, and ** represents P < 0.001. Mortality was calculated as the number of fatalities per m2 windswept area per year, and behavior rates were either minutes or occasions per m2 windswept area per behavioral observation session.
Rate of behavior at turbine string: Mortality at turbine
string: Flight minutes
Perching minutes
No. flights < 50 m to turbines
No. flights through rotor
zone
Indexa of nearness to turbine
American kestrel 0.417** 0.286** 0.403** 0.388** 0.254* Burrowing owl 0.214* 0.38** 0.011 --- 0.294** Golden eagle 0.121 0 -0.012 -0.047 -0.015 Red-tailed hawk -0.042 0.166 t -0.007 -0.013 0.197* European starling 0.024 0.179* 0.051 0.029 0.031 House finch -0.026 -0.026 -0.021 -0.019 -0.034 Rock dove 0.199* 0.129 0.349** -0.014 0.147 t Mallard 0.362** --- 0.065 --- 0.251* Western meadowlark 0.499** 0.1 0.279** -0.07 0.019 Horned lark 0.023 -0.029 0.008 -0.038 0.015 Hawk spp. -0.061 0.16 t -0.015 -0.021 0.189* Raptor spp. 0.11 0.2* 0.092 -0.1 0.188*
a Calculated as 1 ÷ ((dnt + 1) × no. birds in group), where dnt is distance (m) to nearest turbine. This index expresses the degree of nearness of the observations of the species to the turbines, where 0 is far away and 1 is on the turbine for a single bird during a particular session, and values >1 indicated multiple birds were close to the turbines.

283
Table 5-17. Selecting only strings with fatalities recorded, Pearson’s 2-tailed correlation coefficients between mortality estimates and estimates of behavioral activity rates of select bird species observed at turbine strings in the APWRA, where t represents 0.10 > P > 0.05, * represents P < 0.05, and ** represents P < 0.001. Mortality was calculated as the number of fatalities per m2 windswept area per year, and behavior rates were either minutes or occasions per m2 windswept area per behavioral observation session.
Rate of behavior at turbine string with fatalities: Mortality at turbine
string: Flight minutes
Perching minutes
No. flights < 50 m to turbines
No. flights through rotor
zone
Indexa of nearness to
turbine
No. of strings
American kestrel 0.72** 0.41 0.754** 0.673** 0.676* 21 Burrowing owl 0.08 0.336 t -0.162 --- 0.153 34 Golden eagle 0.239 -0.265 -0.378 -0.472 -0.005 9 Red-tailed hawk 0.083 0.417 0.184 0.018 0.369 50 European starling -0.142 0.18 -0.007 -0.158 -0.043 17 House finch -0.342 --- -0.342 --- -0.342 6 Rock dove 0.085 0.082 0.315 t -0.094 0.223 37 Mallard 0.7 --- -0.254 --- 0.163 12 Western meadowlark 0.513 0.561 0.542 -0.189 0.113 34 Horned lark -0.256 --- -0.072 --- -0.012 11 Hawk spp. 0.06 0.417 0.169 -0.001 0.372 51 Raptor spp. 0.234 0.291 0.182 t -0.081 0.253 84
a Calculated as 1 ÷ ((dnt + 1) × no. birds in group), where dnt is distance (m) to nearest turbine. This index expresses the degree of nearness of the observations of the species to the turbines, where 0 is far away and 1 is on the turbine for a single bird during a particular session, and values >1 indicated multiple birds were close to the turbines. Figure 5-182A illustrates two fundamental problems with comparing fatality rates among turbine strings to avian behaviors and intensity of use. The mortality data exhibit two basic functions of search effort: the strings with no fatalities detected did not relate at all to search effort, whereas strings where fatalities were detected declined nearly as an inverse power function of search effort. This dichotomy in functions likely confounded our hypothesis tests of avian mortality compared to levels of certain behaviors. It appears that, as search effort is increased, more turbine strings are eliminated from the zero mortality class and enter into the mortality class but at a necessarily small level. This is because many searches were needed before a fatality was detected, thus forcing the estimate of mortality to be small. These patterns suggest that it is important to account for sampling effort when comparing fatalities to avian behaviors, but a simple conversion of fatalities to mortality does not accomplish this. Figure 5-182B illustrates that the intensity of a common behavior, such as red-tailed hawk flight time, is independent of sampling effort. However, a less commonly observed behavior such as perching time (Figure 5-183A) converges on the pattern observed for mortality, and a rare behavior such as flying through the rotor zone (Figure 5-183B) emerges as another inverse power function, just like that of mortality. The influence of sampling effort on an estimated rate depends on the sample size of the events serving as the numerator of the rate, so relatively rare events like fatalities at turbines or flights through the rotor zone are not robustly represented by rate estimates. To some extent, the more common events, like red-tailed flight time, must also be confounded by sampling effort and the confounding hidden by the larger sample size.

284
Because our differential fatality search and behavioral observation efforts influenced rate estimates that are central to our study, we performed a second set of hypothesis tests in which we factored in differential efforts. These tests compared the observed-to-expected values, where the expected values were the product of sampling effort and the total number of events composing the sample set. By subtracting the expected from the observed values, the number of fatalities, for example, could be -2, or two fewer than observed considering the sampling effort that was applied toward that particular turbine string. In this way, the two classes of values observed in Figures 5-182A and 5-183B are transformed into one class of values each and measured on a continuous scale (e.g., Figure 5-184). Table 5-18 summarizes the results of tests for correlation between mortality and behaviors, but this time the variables are the differences between chi-square observed and expected values. Table 5-18 reveals a generally poor correspondence between recorded behaviors and mortality, which is exemplified by Figure 5-184. The most significant correlations – and these were relatively small – were between mortality and the dangerous behaviors; i.e., the number of flights within 50 m of turbines and the nearness of birds to the turbines.
Figure 5-181. Difference in American kestrel mortality regressed on rate of flight observed near all turbine strings (dotted line) and only those where fatalities were recorded (solid line).
0.00060.0005
0.00040.0003
0.00020.0001
0.0000
.00040
.00030
.00020
.00010
0.0000
No. of minutes of flight per m2
windswept area per behavior session
American kestrelfatalities per m2
windswept area per year
0.00060.0005
0.00040.0003
0.00020.0001
0.0000
.00040
.00030
.00020
.00010
0.0000
No. of minutes of flight per m2
windswept area per behavior session
American kestrelfatalities per m2
windswept area per year

285
Figure 5-182. Mortality of red-tailed hawk regressed on search effort among wind turbine strings (A) and the minutes of flight per behavior session regressed on observation effort among turbine strings (B).
7 65432
0.0005
0.0004
0.0003
0.0002
0.0001
0
-0.0001
log 10 Mortality of red - tailed hawk at turbine string
((fatalities + 1) per m - 2 windswept area
per yearspan )
log10 Search Effort(m2 windswept area × yearspan of searches )
1000000 800000
600000400000
2000000
0.6
0.4
0.2
0
Observation Effort(m2 windswept area ×no. sessions )
Minutes of flight per behavior session
recorded for red - tailed hawk at each turbine
string
A
B
7 65432
0.0005
0.0004
0.0003
0.0002
0.0001
0
-0.0001
log 10 Mortality of red - tailed hawk at turbine string
((fatalities + 1) per m - 2 windswept area
per yearspan )
log10(m2 windswept area × yearspan of searches )
1000000 800000
600000400000
2000000
0.6
0.4
0.2
0
(m2 windswept area ×no. sessions )
Minutes of flight per behavior session
recorded for red - tailed hawk at each turbine
string
A
B

286
Figure 5-183. The rate of red-tailed hawk perching (A) and the rate of flights through the rotor zone (B) regressed on observation effort.
6.05.55.04.54.0
0.024
0.020
0.016
0.012
0.008
0.004
0
1000000800000
600000400000
2000000
1.6
1.2
0.8
0.4
0
log10 No. of flightsper behavior sessionthrough rotor zoneby red-tailed hawk
log10 Observation effort(m2 windswept area × no. sessions)
Observation effort(m2 windswept area × no. sessions
No. of minutesperching per
behavior sessionby red-tailed hawk
A
B

287
Figure 5-184. Observed – expected number of red-tailed hawk fatalities regressed on observed – expected index value of nearness to wind turbines. Table 5-18. Pearson’s 2-tailed correlation coefficients between observed – expected fatalities and observed – expected minutes or occurrences of behavioral activities of select bird species observed at turbine strings in the APWRA, where t represents 0.10 > P > 0.05, * represents P < 0.05, and ** represents P < 0.001.
Observed ÷ Expected value at turbine string: Observed ÷ Expected fatalities at turbine
string: Flight
minutes Perching minutes
No. flights < 50 m to turbines
No. flights through rotor
zone
Indexa of nearness to turbine
American kestrel 0.003 0.009 0.11 0.152 t 0.04 Burrowing owl 0.067 0.106 0.05 --- 0.089 Golden eagle 0.177* 0.095 0.152 t 0.064 0.071 Red-tailed hawk 0.144 -0.057 0 0.038 -0.124 European starling 0.147 t 0.212* 0.192* 0.11 0.132 House finch -0.255* -0.215* -0.191* --- -0.211* Rock dove 0.164 t 0.424* 0.342* --- 0.302* Mallard 0.121 --- 0.323* --- 0.139 Western meadowlark 0.089 -0.11 0.038 0.159 t -0.259* Horned lark 0.145 -0.135 -0.019 --- 0.01 Hawk spp. 0.108 -0.071 -0.015 0.021 -0.144 Raptor spp. 0.035 -0.102 -0.038 -0.014 -0.184*
a Calculated as 1 ÷ ((dnt + 1) × no. birds in group), where dnt is distance (m) to nearest turbine. This index expresses the degree of nearness of the observations of the species to the turbines, where 0 is far away and 1 is on the turbine for a single bird during a particular session, and values >1 indicated multiple birds were close to the turbines.
151050-5
10
5
0
-5
-10
-15
Observed ÷ Expected index valueof nearness to turbines
Observed ÷ Expectedno. of red-tailed hawk
fatalities at turbine string
151050-5
10
5
0
-5
-10
-15
Observed ÷ Expected index valueof nearness to turbines
Observed ÷ Expectedno. of red-tailed hawk
fatalities at turbine string

288
5-4 DISCUSSION Bird Behaviors and Fatalities As expected, each species using the APWRA exhibits a unique suite of behaviors. It is these species-specific behaviors that appear to relate to mortality. Interspecific patterns between mortality and the frequencies of behaviors were unlikely to be strong due to the large differences in species-specific relationships. However, some interspecific patterns did emerge as significant, and these were insightful and useful for drawing generalizations about the roles of behavior and intensity of use of areas around wind turbines. The strongest interspecific relationships were of birds flying more often at the height of the turbine blades, especially for flights through the rotor zone and flights within 50 m of turbines. Red-tailed hawk, western meadowlark, and burrowing owl were particularly vulnerable to collisions when performing these behaviors, but, in general, the more time an avian species performed these flights the more likely it was to collide with a turbine. Species varied spatially in their behaviors and mortality, which provided us with better means of relating behaviors to mortality. Mortality appeared to increase where American kestrels, burrowing owls, rock doves, mallards, and western meadowlarks were seen to spend more time flying. Also, American kestrel, burrowing owl, red-tailed hawk, mallard, and all hawks and all raptors experienced greater mortality where these species were more frequently closer to turbines. However, comparisons in which differential sampling efforts were factored in revealed few spatially derived relationships, and the suite of species with significant relationships changed. Accounting for differential sampling efforts, golden eagles collided more often than expected the more time they were seen flying near the turbine string. Mallards were killed more often than expected the more they flew within 50 m of turbines. Otherwise, avian species appeared to collide with turbines in the APWRA at random with respect to the behaviors we measured. Based on our results, the mortality rate of birds in the APWRA, with the exception of the golden eagle and mallard, depends on the degree to which they perform these flight behaviors. The more a bird performs these flight behaviors in the APWRA, the more often they will collide with wind turbines. Red-tailed hawk, western meadowlark, burrowing owl, and rock dove are particularly susceptible to this outcome. Behavioral and fatality associations often corresponded, such as golden eagle fatality and behavioral associations with ground squirrel abundance, time of year, whether in canyons, and tower type. Golden eagles performed their dangerous behaviors in canyons, which is also where they were killed disproportionately more often by wind turbines. The same was true during summer when ground squirrels were most abundant, on Bonus turbines mounted on tubular towers and apart from wind walls, and at turbines at the ends of strings (Table 5-19). Red-tailed hawks performed their dangerous behaviors and died more frequently in canyons and on ridge crests during fall and winter, but also outside wind walls at local edges of the wind farm and with more rock piles nearby (Table 5-20). American kestrels performed their dangerous behaviors and also died more frequently during winter at lattice towers outside of wind walls (Table 5-21). Burrowing owls performed their dangerous behaviors and died more frequently at Bonus turbines on tubular towers in areas of intermittent rodent control and away from wind walls in the interior of the wind farm at low elevations (Table 5-22).

289
Table 5-19. Summary of golden eagle behaviors recorded in the APWRA for longer periods or more frequently than expected by chance.
Association variable Flying time Perching time Flights through rotor zone
Flights within 50 m of turbines
Strongest fatality associations
Months of the year summer Sep & Nov winter, summer summer fall & summer Wind speed high-intermediate slow high high Wind direction (origin) E and SW no wind; E, SE, S E & SW NE & SW Squirrel activity active active active active Squirrel abundance more numerous present but few more numerous more numerous most numerous Session start time 12:00 08:00 12:00 12:00 Temperature during session 75-95˚ 55-65˚ 55˚ 45 & 75-85˚ Proximity level 0-50 m 0-50 m --- --- Rodent control intermittent intermittent intermittent intermittent intermittent Physical relief ridge crest ridge crest ridge crest --- slope Whether in canyon yes yes yes yes yes Tower type VA & tubular VA & tubular tubular & VA VA & tubular tubular Status of nearest turbine Operating a Off --- Operating a Perch time on
turbine Flying time of flights to ≤50 m of turbine
Turbine model Flowind Flowind, Bonus, Danwin Bonus Rotor orientation to wind VA VA toward Tower height 31 m 31 & 43 m 25 m Whether part of wind wall no no no Position in turbine string end & gap end & non-op end & gap Location in wind farm no effect local edge no effect Turbine congestion no effect lowest no effect Elevation no effect 210 m highest Slope grade no effect steepest no effect Slope aspect no effect SE & S N & NW Physical relief no effect peak & ridge crest no effect Whether in canyon no effect yes yes Edge index no effect some lateral & lots vertical no effect Rock piles located nearby most none most
a Only flights at blade height and within 50 m of turbine.

290
Table 5-20. Summary of red-tailed hawk behaviors recorded in the APWRA for longer periods or more frequently than expected by chance.
Association variable Flying time Perching time Flights through rotor zone
Flights within 50 m of turbines
Strongest fatality associations
Months of the year fall & winter fall & winter fall & winter fall & winter fall & winter Wind speed slow slow slow to moderate slow to moderate Wind direction (origin) N & E N, NE, E N, NE, E N, NE, E Squirrel activity inactive inactive inactive inactive Squirrel abundance none present but few none none no effect Session start time 14:00 14:00 10:00-14:00 12:00-14:00 Temperature during session 55˚ 45-65˚ 45-55˚ 45-55˚ Proximity level 0-50 m 0-50 m --- --- Rodent control intermittent none none none intermittent Physical relief ridge crest plateau --- plateau, ridge crest saddle, ridge crest Whether in canyon yes no ns no yes Tower type tubular VA Lattice & tubular lattice tubular Status of nearest turbine Operating a Off Off Off Perch time on
turbine Flying time of flights to ≤50 m of turbine
Turbine model Danwin & Bonus Bonus no effect Rotor orientation to wind away toward toward Tower height 43 & 19 m 19 & 25 m 25 m Whether part of wind wall no no no Position in turbine string end & gap end & gap no effect Location in wind farm farm edge local edge local edge Turbine congestion lowest lowest no effect Elevation low, medium, high mid to low no effect Slope grade flat to gentle steep no effect Slope aspect NE & E; none SW & W S Physical relief plateau & saddle peak & ridge crest no effect Whether in canyon no yes yes Edge index some lateral lots of vertical no effect Rock piles located nearby some most some & most
a Only flights at blade height and within 50 m of turbine.

291
Table 5-21. Summary of American kestrel behaviors recorded for longer periods or more frequently than expected by chance.
Association variable Flying time Perching time Flights through rotor zone
Flights within 50 m of turbines
Strongest fatality associations
Months of the year fall & Feb fall & winter fall fall & winter winter Wind speed slow-intermediate slow-intermediate slow slow Wind direction (origin) N & E N, NE, E, SE, S N & E N & E Squirrel activity inactive inactive inactive inactive Squirrel abundance none none none none no effect Session start time 14:00 08:00, 14:00-16:00 08:00, 14:00-16:00 18:00 & 14:00 Temperature during session 65˚ & 95˚ 45-55˚ 45˚ & 95˚ 45˚ & 95˚ Proximity level 0-50 m 0-50 m --- --- Rodent control none & intense none & intense none & intense none & intense no effect Physical relief plateau, ridge crest plateau --- plateau, ridge crest saddle, ridge crest Whether in canyon no no no no no effect Tower type VA & lattice tubular &VA lattice lattice &VA lattice Status of nearest turbine Off a Off Off a Off a Perch time on
turbine Flying time of flights to ≤50 m of turbine
Turbine model KCS-56 Flowind & KCS-56 KVS-33 Rotor orientation to wind away away & VA no effect Tower height 19 m 19 & 31 m no effect Whether part of wind wall no effect no no Position in turbine string end end no effect Location in wind farm farm & local edge farm edge no effect Turbine congestion medium-low medium-low no effect Elevation highest highest low Slope grade flat-gentle gentle no effect Slope aspect none none; NW & N S Physical relief plateau plateau & ridgeline saddle, ridge crest Whether in canyon no no no effect Edge index none none no effect Rock piles located nearby some most some
a Only flights at blade height and within 50 m of turbine.

292
Table 5-22. Summary of burrowing owl behaviors recorded in the APWRA for longer periods or more frequently than expected by chance.
Association variable Flying time Perching time Flights through rotor zone
Flights within 50 m of turbines
Strongest fatality associations
Months of the year March spring --- Feb fall & winter Wind speed slow high & slow --- slow-intermediate Wind direction (origin) SW E & W --- E Squirrel activity active active --- active Squirrel abundance more numerous present but few --- present but few most numerous Session start time 10:00 10:00 & 14:00 --- 16:00 Temperature during session 65˚ 65-85˚ --- 65˚ Proximity level 0-50 m 51-100 m --- --- Rodent control intermittent intermittent --- intermittent intermittent Physical relief ridge crest ridge crest, slope --- ridge crest slope, plateau Whether in canyon no yes --- yes no effect Tower type tubular tubular --- tubular VA & tubular Status of nearest turbine Off a Off --- --- Perch time on
turbine Flying time of flights to ≤50 m of turbine
Turbine model Bonus Bonus Bonus & Flowind Rotor orientation to wind toward toward toward Tower height 25 m 25 m 25 m Whether part of wind wall no no no Position in turbine string interior interior end & gap Location in wind farm interior interior interior Turbine congestion lowest lowest no effect Elevation --- low low Slope grade gentle gentle steepest Slope aspect none none S Physical relief ridge crest ridge crest slope Whether in canyon no no no effect Edge index none none no effect Rock piles located nearby some some most
a Only flights at blade height and within 50 m of turbine.

293
Behavioral and fatality associations also contradicted each other. Golden eagles performed their dangerous behaviors disproportionately more often at 31- and 43-m-tall towers but died more often at 25-m-tall towers. They flew near the rotor zone longer at low elevations, but were killed disproportionately more often by turbines at both the lowest and highest elevations. They flew dangerously more often on southeast- and south-facing slopes but were killed by turbines disproportionately more often on north- and northwest-facing slopes. Red-tailed hawks flew dangerously for disproportionately longer periods where rodent control was not performed (where ground squirrels and pocket gophers were more uniformly distributed about turbines), but they died disproportionately more often at turbines in areas of intermittent rodent control (where ground squirrels were distant from turbines and pocket gophers more clustered at turbines). They flew dangerously more often around lattice towers, but died disproportionately more often at tubular towers. American kestrels flew dangerously most often during fall, but died more frequently in winter. They flew dangerously more often near KCS-56 turbines but died disproportionately more often at KVS-33 turbines. They flew dangerously more often at the highest elevations and on north- and northwest-facing slopes but died disproportionately more often at low elevations and on south-facing slopes. Burrowing owls flew disproportionately more often during February, but were killed by turbines disproportionately more often during fall and early winter. The dangerous flights were weighted toward ridge crests, but they were killed by wind turbines more often than expected on slopes and plateaus. They perched on and flew close to the rotor zone of turbines in the interior of the string over disproportionately longer periods, but were killed by turbines at the end of the string and at gaps more often than expected by chance. They also perched on and flew close to the rotor zone of turbines on gentle slopes but were killed by turbines on the steepest slopes out of proportion to the number of turbines on these slopes. These contradictions highlight the need to cautiously interpret the results of preproject bird behavior studies that are attempting to estimate the likely impact of a new wind farm project. Avian Perceptions of Wind Turbines Perching did not relate significantly to bird mortality across species, or across turbine strings. Birds spent a lot of time perching on wind turbines, but most species appeared to be careful to perch on turbines or their towers while the turbine was not operating. We are confident that, based on the frequency differences in Table 5-14, birds can determine when turbines are not operating. It may be possible to find significant relationships between perching and mortality by examining our data for interaction effects, such as between perch time on turbines during different wind speeds. However, our sample sizes are small and would likely be inadequate. Overall, perching and flying of all species but burrowing owl were performed disproportionately more frequently and for longer periods within 50 m of turbines as compared to 51 to 100 m or 101 to 300 m away. For some reasons, avian species appeared to be attracted to the vicinity of wind turbines. This may have been due to recording bias by our behavior crews, who might have been more vigilant for avian species nearer the wind turbines. Another cause might be the concentration of avian resources at wind turbines, including perch sites, declivity winds, cattle pats and the collection of species exploiting these pats, and rodents and lagomorphs. Because the ratios of observed-to-expected frequencies of birds occurring close to turbines were so large, we conclude that, although observer bias might have contributed to our measurement of selection preference of most avian species for the areas within 50 m of turbines, much of these patterns are real and biologically based. Avian species might perceive the area within 50 m of turbines as preferable to other areas in the APWRA, as suggested by the strong patterns we measured.

294
Despite earlier expectations that lattice towers were preferred perch sites because they offer more perch opportunities, we found that more species perched for disproportionately longer periods on tubular and vertical-axis towers, and avoided lattice towers. Ironically, the common raven preferred to perch on lattice towers but rarely was killed by wind turbines in the APWRA. Most birds also flew less often than expected near lattice towers, and most flew through the rotor zones of turbines on tubular and vertical-axis towers disproportionately more often. However, flights within 50 m of lattice towers were more common than expected by chance among all hawks, all raptors, and all birds. These latter patterns were influenced mostly by red-tailed hawk and house finch, which made many of their close flights by lattice towers. Ground Squirrel Distribution and Control Programs Periods of ground squirrel activity associated with golden eagle flying and perching, as well as with the dangerous behaviors of flying through the rotor zone or within 50 m of turbines. However, the periods when ground squirrels were not active associated with these behaviors of red-tailed hawk. Ground squirrel numbers also associated with golden eagle and red-tailed hawk behaviors, but in opposite ways, just as was observed for squirrel activity. It appears that behaviors that render golden eagles more susceptible to turbine collisions are linked to squirrel activity and abundance, whereas the same behaviors that render red-tailed hawks especially susceptible are linked to squirrel inactivity and lesser abundance. Based on the associations we observed between golden eagle and red-tailed hawk behaviors and ground squirrel abundance, the rodent control program in the APWRA can be expected to increase red-tailed hawk mortality because of attempting to reduce golden eagle mortality. This is because fewer ground squirrels correlates with more than the expected frequencies of dangerous behaviors performed by red-tailed hawks. And, unfortunately, the level of rodent control in the APWRA did not appear to associate with golden eagle behaviors in the manners anticipated by the wind turbine owners. Golden eagles flew and perched for disproportionately longer periods on the EnXco portion of the wind farm, where the rancher who owns the land liberally dispensed rodent poison but not systematically as did the Alameda County agricultural agent on other portions of the APWRA. Our data on gopher burrows indicate that pocket gophers more frequently exist near turbine strings than they do away from turbine strings. Furthermore, the distribution and occurrence of gopher burrows is related to raptor fatalities at turbine strings. From these findings, we conclude that lack of prey availability on the slopes away from turbines encourages red-tailed hawks to hunt near the turbines, thereby increasing the vulnerability of this species to operating turbines. The rodent control program applied to reduce golden eagle mortality at wind turbines might be increasing red-tailed hawk mortality caused by wind turbines. Behavioral Characterization of Select Species Tables 5-19 to 5-22 summarize the associations between behaviors and independent variables we measured. Golden eagles spend a disproportionate amount of their time flying during noontime warm temperatures in summer and during intermediate to high winds originating from the east and southwest (Table 5-19). They do this while ground squirrels are most numerous and active, and more often within 50 m of vertical-axis turbines and turbines on tubular towers located on ridge crests within canyons where rodent control has been applied rigorously but less systematically than in other parts of the APWRA. Their more dangerous flights are performed disproportionately under these same conditions, although when it is cooler and including during winter. They switch to perching over disproportionately longer

295
periods earlier during the day and when it is cooler during fall when winds are slow and originating from the east, southeast, or south. Squirrels are still active but only few are seen. This suite of behavioral associations with preferred conditions includes some dangerous elements, including flights close to turbines during high winds, which is why golden eagles fly at blade height near turbines more often than expected by chance. Red-tailed hawks flew disproportionately for longer periods during the early afternoons of fall and winter, when it was relatively cool, winds blew slowly out of the north and east, and ground squirrels were inactive. They flew more over ridge crests within canyons where rodent control has been applied rigorously but less systematically than some other parts of the APWRA, and within 50 m of tubular towers. They perched preferentially under similar circumstances but in different locations, instead near vertical-axis turbines on plateaus outside of canyons and where no rodent control was applied. The dangerous behaviors were performed under similar conditions as overall flight time, but disproportionately more often during cooler temperatures yet, earlier in the day, and around lattice towers in addition to tubular towers. The fact that slow wind speeds associate strongly with these behaviors suggests that the favorite red-tailed hawk behaviors might not be those performed when they are killed by wind turbines. Moreover, we discovered during this study that red-tailed hawks are more susceptible than other species to getting killed than the percentage of its flights at blade height would suggest. It appears that rare behaviors might contribute most to red-tailed hawk mortality caused by wind turbines. American kestrels flew disproportionately for longer periods during early afternoons in the fall and early spring when slow to intermediate winds blew from the north and east and ground squirrels were inactive. They flew more on plateaus and ridge crests within 50 m of vertical-axis turbines and turbines on lattice towers, and where rodent control was applied either not at all or intensely. They disproportionately perched and performed dangerous flight behaviors under very similar circumstances as overall flight time. These results suggest to us that American kestrels might select portions of the APWRA based on factors such as the potential for prey availability, the realized prey availability, and perching opportunities, and independent of rodent control intensity. The species’ disproportionate performance of dangerous behaviors while turbines are turned off suggests that it is the rare behaviors that associate with fatalities. Burrowing owls flew disproportionately for longer periods during the moderate to cool temperatures of mid-morning in March while winds blew slowly from the southwest and ground squirrels were active and numerous. They flew more on ridge crests outside of canyons within 50 m of tubular towers and where rodent control has been applied rigorously but less systematically than at other parts of the APWRA. They switched to perching disproportionately during spring when either high or slow winds blew from the east or west and ground squirrels were only slightly active. They were seen perching more when farther from the turbines and within canyons. Their dangerous flight behavior associated with late afternoons in February while flying on ridge crests within canyons. It appears that burrowing owls might migrate through the canyons in February to nesting locations outside the canyons which are occupied during the spring months. Dangerous behaviors were observed only while the nearest turbines were off. The Analytical Challenge of Differential Sampling Effort A major challenge of the study was the analysis of both behavioral and fatality data based on differential sampling efforts. Individual turbines and turbine strings varied in the number of times and time spans over which fatality searches were performed, and they also varied in the number of times they were included in behavior observation sessions. These differential search efforts resulted in rates of behavior and mortality that were functions of sampling effort used to estimate these rates. That these rates were functions of their founding sampling efforts indicates that the sample sizes obtained inadequately

296
represented the ranges of variation that would accurately characterize behaviors and mortality among turbines and turbine strings. We attempted to obtain adequate sample sizes within the project’s time and funding constraints. We were granted access to only 600 turbines at the beginning of the study, and more turbines were made available to us at various times while the study progressed. In addition, our funding was interrupted during the study, forcing hiatuses in fatality searches for several months at a time. Inclement weather also interrupted our search schedule. In the end, differential sampling efforts resulted in qualitative as well as quantitative differences in rates among turbines and strings, with under-sampled turbines and turbine strings yielding many of the zero values as well as the highest rates, the latter of which declined as a function of increasing sampling effort. We accounted for differential sampling efforts by using chi-square statistics because the sample size of the dependent variables is factored against the proportional representation of each condition considered for the association variable. Doing so generated very different results than we obtained by using parametric statistics on rates that were not qualified by sampling effort. Studies of this nature should in the future consider whether calculated rates are functions of their founding sampling efforts because, if they are, then the error about the mean will be large relative to the magnitude of the mean, and much of the disparity will be due to sampling design and search effort rather than to meaningful relationships in mortality and rates of bird behaviors. Conclusions Behavioral observation studies and studies of avian activity levels should precede the installation of wind turbines at new wind farms, not only to predict and avoid impacts, but also to enable the measuring of impacts after the wind farm is installed and operating. Our study revealed that avian behaviors were likely changed by the ongoing activities of the wind farm, as exemplified by the apparent strong attraction of most avian species to the vicinity of wind turbines. However, the only way to be certain whether birds are truly attracted to the vicinity of wind turbines is to perform behavior studies with a before-after control impact (BACI) design. Patterns of behavior do not always correspond with fatality patterns, and often these patterns are contradictory. For example, we would have predicted that a disproportionate number of burrowing owls are killed by wind turbines during February because burrowing owls fly within 50 m of the rotor zone during February 9.2 times more often than expected by a uniform distribution of such flights throughout the year. In fact, burrowing owls die disproportionately more often during the fall and early winter months. In another example, we would not have predicted that burrowing owls are relatively susceptible to turbine strikes because, unlike red-tailed hawks and other species, we never saw burrowing owls flying at blade height while within 50 m of operating turbines. Yet, burrowing owls proved highly susceptible to turbine strikes, so they must have flown at blade height and through the rotor plane of operating turbines when unobserved during the dispersal season, and/or perhaps at night. These dangerous behaviors must be common from a biological point of view even though they appear to be rare from a statistical point of view. Like many scientific investigations, ours left us with many new questions and unsatisfactory answers, as well as much new information. To answer many of the remaining questions satisfactorily, future behavioral studies at wind farms will require much greater sampling effort, as well as a BACI design.

297
CHAPTER 6: FATALITY ASSOCIATIONS AND VULNERABILITY 6-1 INTRODUCTION The key to reducing or minimizing avian fatalities at wind farms is to identify and understand the causal factors of the fatalities, then act on those causes. Because collisions at wind turbines have been observed only rarely, we must draw inferences from patterns of carcass locations found on wind farms. Other investigators have studied such patterns, but these were based on small sample sizes. Our study in the APWRA includes a much larger sample size of fatalities and thus exhibits more robust patterns. A robust empirical foundation is needed for factors attributed to the avian fatality problem at wind farms. Published and unpublished reports of the problem are replete with conclusions of the causal factors, only a few of which are based on reliable scientific sampling, adequate sample sizes, and hypothesis testing. Many of these conclusions are contradictory and some are used inappropriately to support management actions and optimistic impact estimates of proposed wind farms or changes in existing wind farms. The more commonly cited causal factors are cited below. Researchers have argued that particular species or functional groups of species are inherently susceptible to collision with wind turbine blades due to typical behaviors such as migration through the area, or particular foraging or breeding strategies (Rogers et al. 1976 Estep 1989, Howell and DiDonato 1991, Howell and Noone 1992, Orloff & Flannery 1992, 1996, Colson 1995, Erickson et al. 1999, Hoover 2001, Strickland et al. 2001b, Rugge 2001, Strickland et al. 2001a, Thelander & Rugge 2001, Hunt 2002, Johnson et al. 2002), or even body size (Tucker 1996a,b). They have also argued that susceptibility is linked to intensity of the use of the site or numerical abundance (Howell and Noone 1992, Cade 1995, Colson 1995, Morrison 1998, Erickson et al. 1999, Anderson et al. 2001, Kerlinger and Curry 2000, Thelander and Rugge 2000b, Ugoretz et al. 2000, Rugge 2001, Strickland et al. 2001b), while others have argued that it is not (Orloff and Flannery 1992, 1996, Hunt 2002). Some have argued that all types of wind turbine and tower combinations kill birds, or that the type of tower or wind turbine does not relate to avian mortality (Anderson et al. 2001, Johnson et al. 2002). Others have concluded that horizontal lattice towers (especially KCS 56-100s) are responsible for a disproportionate number of fatalities (Orloff and Flannery 1996, Curry and Kerlinger 2000, Rugge 2001, Hunt 2002). This conclusion has been related to the increased perching opportunities on horizontal lattice towers, which are thought to increase the number of fatalities (Howell and DiDonato 1991, Orloff and Flannery 1992, Cade 1995, Colson 1995, Curry and Kerlinger 2000, Kerlinger and Curry 2000, Strickland et al. 2001b, Hunt 2002). However, Rugge (2001) found that birds more frequently perch on wind turbines on tubular towers, and Thelander and Rugge (2001) found that mortality was no less common on tubular towers. Rogers et al. (1976) concluded that taller towers are more dangerous to birds, whereas Hunt (2002) concluded that taller towers are safer for golden eagles. Orloff and Flannery (1996) found that tower height did not relate to avian mortality, and Strickland et al. (2000b) safely concluded that the most dangerous wind turbines are those whose rotor-swept height band corresponds with the frequency of bird flights in it. Tucker (1996b) predicts that larger-diameter rotors will be safer, which is a conclusion adopted by Kerlinger and Curry (2001). However, Orloff and Flannery (1996) found that wind turbines with larger rotor-swept areas killed more birds, and Howell (1997) concluded that the size of the rotor-swept area does not matter. Because larger-diameter rotors have been associated with slower blade motion, conclusions regarding blade tip speed correspond with those of rotor diameters. Tucker (1996b) predicted that wind turbines with slower

298
blade tips are safer, which was also the opinion of Kerlinger and Curry (2001). However, Orloff and Flannery (1996) found that blade tip speed does not matter. Rogers et al. (1976) predicted that wind turbines with increased rotor solidity pose greater threats to birds, where rotor solidity is the degree to which the length, depth and speed of the blades pose an obstacle to birds flying through the rotor plane. However, Orloff and Flannery (1996) found that rotor solidity did not relate to avian mortality. Considerable attention has been focused on the visibility of the moving turbine blades, and their lack of contrast with the background sky (Howell and DiDonato 1991, Cade 1995, Tucker 1996b, Curry and Kerlinger 2000, McIsaac 2001). Wind turbine blades in the APWRA were painted in various patterns as a remedy and were said to be safer (Howell et al. 1991), but Orloff and Flannery (1992) found no effect. Hodos et al. (2001) reported that raptors experience motion smear, which is the inability to see the moving blades because their images moving across the birds’ retinas are too large and fast to be processed by the brain. Researchers concluded that wind turbines pose an obstacle to avian flights, so the more wind turbines, the greater the threat of the wind farm to birds (Winkelman 1992, Colson 1995, Howell 1997, Hunt et al. 1998, Kerlinger and Curry 2000). Wind turbine congestion also might relate to avian mortality (Orloff and Flannery 1992), or other tall structures in the wind farm might divert flying birds into the rotor planes of operating wind turbines (Kerlinger and Curry 2001). However, Orloff and Flannery (1992) found no relationship between avian fatalities and wind turbine congestion, interturbine spacing, or the density of all structures around each wind turbine. Orloff and Flannery (1992) also found no significant relationship between avian mortality and the length of the turbine row, its orientation, or whether it was part of a wind wall. Orloff and Flannery (1992) found that wind turbines in rows forming local edges were no less dangerous than other wind turbines. Investigators have differed on whether fatalities are proportionately more common at mid-row wind turbines (Howell et al. 1991, Howell and Noone 1992, Anderson et al. 2001) or end-row wind turbines (Winkelman 1992, Orloff and Flannery 1992, 1996, Curry and Kerlinger 2000). Gaps in wind turbine rows have also been identified as more dangerous to birds (Curry and Kerlinger 2000, Thelander and Rugge 2001). On the other hand, Smallwood et al. (2001) found that neither ends of rows nor gaps killed more birds, and Thelander and Rugge (2000a,b, 2001) concluded no more birds die at end-of-row turbines than at others. Rogers et al. (1976) suggested that wind turbines are more dangerous on ridge crests or hill peaks, and Colson (1995) also suggested that wind turbines on ridge crests are more dangerous. Wind turbines have been considered more dangerous when located on ridge saddles or shoulders of hills (Howell and DiDonato 1991, Howell et al. 1991, Colson 1995, Curry and Kerlinger 2000), on the edges of rims (Strickland et al. 2000a), or in canyons (Orloff and Flannery 1992, 1996, Colson 1995, Kerlinger and Curry 1999). Orloff and Flannery (1992) and Rugge (2001) concluded that wind turbines at higher elevations killed more birds. Orloff and Flannery (1992) also concluded that more raptors than nonraptors were killed at wind turbines on steep slopes, and wind turbines with two steep slopes within 154 m also killed more raptors. Curry and Kerlinger (2000) concurred that steeper slopes are more dangerous to birds, and Rugge (2001) concurred that greater topographic complexity was more dangerous. However, Orloff and Flannery (1992) concluded that slope aspect was insignificant, but Rugge (2001) concluded it was significant when examined at a species-specific level.

299
Some researchers feel that the development of wind farms also attracts small mammals, which then draw predatory birds to the wind farm (Hunt and Culp 1997, Hoover, 2001, Curry and Kerlinger 2000, Kerlinger and Curry 2001, Hunt 2002). Roads built to access the wind turbines are thought to extend the range of distribution of ground squirrels (Colson 1995, Morrison 1996) and pocket gophers (Smallwood et al. 2001). Hunt (2002) claimed that ground squirrels are more abundant where the wind turbines are located, and Smallwood et al. (2001) reported golden eagle fatalities to be more common at wind turbines with at least three ground squirrel burrows within 55 m. Researchers have argued that raptors become preoccupied with hunting prey animals when they inadvertently run into moving wind turbine blades (Smallwood et al. 2001, Hunt 2002). However, Hoover (2001) and Hoover et al. (2001) reported that red-tailed hawks are not attracted to ground squirrel colonies, and Orloff and Flannery (1992) reported that raptor mortality was unrelated to ground squirrel abundance. Hunt (2002) claimed that golden eagle locations from his radio-tagged population were more common on land parcels where rodenticides were not deployed, but his map of radio locations did not make his case as he claimed. Determining whether rodent control effectively mitigates the raptor fatality problem in the APWRA emerged as a primary objective of this study when we learned of the wind industry’s initiation and funding of the control program during our study. Cattle grazing was also thought to lower the average vegetation height to the favor of ground squirrels (Morrison 1996), and cattle carcasses were identified as a possible attraction to golden eagles (Hoover 2001). Janss and Clave (2000) suggested carrion could attract raptors to a wind farm, and carrion is abundant in the APWRA due to the frequent deaths of cattle, which are left to decompose in situ. Also, carrion is abundant in the fall following the most intense ground squirrel control efforts, because poisoned squirrels litter the hillsides, and dead squirrels and desert cottontails are clustered in and around the rock piles constructed near some turbine strings. However, Kerlinger and Curry (2000) claimed that land used for cattle grazing does not attract raptors, so it is safe for wind turbines, although they provided no explanation of how they arrived at this conclusion. Other factors associated with avian fatalities at wind farms include inclement weather (Coslon 1995, Johnson et al. 2002), particular seasons (Rugge 2001, Hunt 2002), and the rotor wake pushing birds into the ground (Winkelman 1995). Most of these suggested causal factors were addressed in our study. We represented the factors with measured variables and related them to the distribution of avian fatalities in the APWRA as described in the following section. Our objective was to systematically test hypotheses stemming from the conclusions summarized in the preceding paragraphs, using the largest data set yet assembled on avian fatalities at a wind farm. 6-2 METHODS Fatality search methods were described in Section 2-2, Methods in Chapter 2. Data collected on each fatality included season, tower type, turbine type, tower location within the string, the aspect of the slope on which the string of turbines was situated, and attributes of the physical relief of the study plot. Except for season and weather, these same variables were recorded for all wind towers, including those where birds were not killed. We used a GPS device to record this data.

300
Variables ‘Wind turbine model’ was the manufacturer of the wind turbine, and related closely to a suite of wind turbine attributes quantified in this study. We also represented the size of the wind turbine, so we examined two turbine sizes manufactured by Flowind and two by Bonus. ‘Rotor diameter’ was the distance through the center and to the extremes of the rotor plane. ‘Tip speed’ was the speed of movement of the rotor at the outer tip of the blade. We tracked this variable in km/hr but converted it to m/s for deriving the variables below. We calculated the window during which birds could fly through the rotor plane at the tips of the blades while the rotor operated at normal speed. This window was calculated as follows:
Window = C ÷ T·B where C is the circumference of the rotor plane, or 2πr, r is the radius of the rotor plane, or one-half the rotor diameter, T is the tip speed in m/s, and B is the number of blades on the rotor. This variable measured the number of seconds intervening blade sweeps at a particular location at the edge of the rotor plane, and the values for the wind turbines in the APWRA ranged 0.273 to 0.695 seconds. Thus, any bird taking 0.7 seconds or longer to clear the rotor plane of a normally operating wind turbine would be injured or killed. We also calculated the area of the rotor plane swept per second by the wind turbine’s blades:
Swept rate = TrB ÷ 2 , which, after cancellations of terms, was derived from the function
Swept rate = (T/C) ·AB , where A is the area of the rotor plane in m2. This variable characterizes the magnitude to which the sky is disrupted by the operation of the wind turbine, or the degree to which the rotor plane represents an obstacle to flying birds. It is measured in m2/s. ‘Tower height’ was measured in meters from the ground to the rotor. For comparison purposes, we also excluded vertical-axis turbines from our test of the effect of tower height on avian mortality. In one set of tests, we included vertical-axis turbines, and in one set we excluded them because the movement of the blades was fundamentally different from that of the horizontal-axis turbines. ‘Tower type’ was characterized also, but we related avian mortality to whether the tower was the vertical-axis of the wind turbine or either the tubular or lattice foundation for horizontal-axis turbines. This simplified comparison (relative to the progress report) was performed to test whether perching relates to avian mortality. Perching was assumed to be less likely on vertical-axis and tubular towers than on lattice towers, although perching can still occur on all towers. ‘Company’ referred to the company that owned the wind turbines operating in the APWRA for the majority of the time during our study. (Wind turbine ownership changed several times.) We mapped the perimeters of artificially made rock piles, and related avian mortality to the incidence of these rock piles. These rock piles were constructed to provide cover habitat for prey species of San

301
Joaquin kit fox. The rocks were removed from wind turbine laydown areas and piled near the wind turbines. During the course of our study, we noticed that ground squirrels and desert cottontails made intensive use of these rock piles, so it occurred to us that raptors might be drawn to them due to the concentration of prey species in and around them. The incidence of rock piles at each turbine string was characterized as none, ≤0.25 piles per turbine, and >0.25 piles per turbine. An edge index for the wind turbine/tower laydown area was measured from the string transect while viewing the 40 m radius from the wind turbine:
0 = no vertical or lateral edge within 40 m of wind turbine 1 = some lateral edge such as the presence of a dirt road other than just the service road found at
all of the wind turbines, or cleared area adjacent to vegetated area, or area tilled for pipeline, etc.
2 = lots of lateral edge 3 = some vertical edge such as road cut, road embankment, or cut into the hillside for creating a
flat laydown area 4 = lots of vertical edge, covering half or more of the area within 40 m of the wind turbine.
This index was measured to test whether raptors might be drawn to wind turbines with greater lateral and vertical edge for improved foraging opportunities, and subsequently killed by operating wind turbines. The position of the turbines in the wind farm was classified as edge for all those wind turbines facing a landscape devoid of wind turbines beyond the wind farm, local edge for all those adjacent to large spaces within the wind farm where no wind turbines occur, and interior for all those not at the wind farm edge or local edge. We discovered post hoc that the wind industry had been paying Alameda County to implement rodent control in the APWRA. However, not all land owners participated in the program, so three levels of control intensity were applied. We interviewed the County staff person (Jim Smith) performing the rodent control and obtained from him information on where and how chlorophacinone-treated oats were deployed across the APWRA. Thus, we linked specific wind turbines to the level of rodent control deployed in the area. These levels were none, intermittent, and intense. The intermittent control was applied to the land leased by EnXco and consisted of the rancher applying poison bait on and around ground squirrel colonies on a less systematic and less frequent basis than applied elsewhere by Alameda County and some other ranchers.
Analysis We analyzed mortality at two levels of resolution. The finest resolution of analysis was at the turbine level, in which we examined the number of fatalities of each species associated with each wind tower. At the turbine level of analysis, we relied on chi-square analysis derived from the model described above. We analyzed wind-turbine-caused mortality among bird species with which we had gathered at least 20 records, except for golden eagles, which had only 18 records but was a principal species of concern in the study due to its rarity, low productivity, and special-status under environmental laws (Hunt 2002).

302
The coarsest resolution of analysis was at the string level. In this case, we examined the number of fatalities of each species associated with entire strings of wind towers. At the string level of analysis, we relied on Pearson correlation coefficients (rp) and linear, least-square regression analyses. These analyses always started with examination of scatter plots of mortality on the Y-axis and predictor variables on the X-axis in order to identify patterns in the data, and progressed to a systems analysis approach to explaining the variation in fatality rates (Watt 1966, 1992). This systems analysis approach relies on saving unstandardized residuals from linear regression analysis, then systematically plotting these residuals against each of the other predictor variables. Residuals are the vertical, Y-axis distances measured between each data point and the estimated line representing the regression slope. Residuals represent the variation in the dependent variable that is not explained by the predictor variable. The new plots of residuals from one predictor variable plotted against another predictor variable can reveal meaningful patterns in the residual variation of the dependent variable, which can then be explained by both predictor variables in multiple regression analysis (Watt 1966). The statistics we present in this report were chosen to satisfy our objectives as well as the assumptions of the corresponding hypothesis tests. For example, correlation analyses are summarized by the coefficient of determination, r2, when prediction is the ultimate objective. They are summarized by Pearson’s correlation coefficient, rp, when the objective is simply to summarize the degree of correlation. We will report weak and non-significant correlations when doing so meets our objectives, or when the measures of effect are interesting despite the non-significance of the test. Because r2 is based on two independent factors – the steepness of the regression slope and the precision of the data relative to the regression line – we often also include the root mean square error (RMSE), which measures the latter. r2 alone is an inefficient summary statistic for some of our hypothesis tests. Although we used ANOVA to test some hypotheses in this study, key assumptions of ANOVA cannot be met due to the lack of any sort of block design or related controls on treatment replication or interspersion. Even though we are studying an anthropogenic system, ours is a nonmanipulative study. Our “replicates” and our degrees of interspersion of “treatments” were established by the placement of wind towers by the industry prior to our study. As a mensurative study, the chi-square family of statistical tests is most efficient for testing many of our hypotheses (Smallwood 1993, 2002). For all hypotheses tested, we relied on a α-level of significance of 0.05. However, we also took note of P-values less than 0.1 as indicative of trends worthy of further research or consideration. The observed divided by expected values derived from χ2 tests are used as measures of effect, and need to be interpreted based on the P-value of the test, whether the expected number of observations was larger than five (smaller than 5 is generally regarded as unreliable), and the magnitude of the ratio. These latter considerations for assessing the significance of particular observed/expected values are left to the reader’s determination. For association analyses, expected values were calculated by multiplying the total number of fatalities by the incidence of the environmental element being compared in the measured set. The incidence was the proportion of the total search effort, or the sum of the time spans over which each wind turbine-composing element i was searched divided by the sum of the time spans over which all of the wind turbines were searched. Search effort at the turbine level of analysis was calculated as:
Turbine Search Effort = Yt ÷ ΣY and

303
Incidence, Pi = Σ (Turbine Search Effort of all wind turbines composing element i)
and then Expected = N × Pi ,where Yt is the number of years during which fatality searches were performed for a given wind turbine, ΣY is the number of years of fatality searches across all wind turbines, and N represents the total number of fatalities compared within the measured set of environmental elements. Tests for relationships between avian fatalities and rodent burrow distributions were performed at the turbine string level of analysis because we felt that our representations of burrow distributions were more robust at this level. Performing the analysis at this level introduced an additional complication of search effort because turbine strings varied in length (i.e., number of wind turbines) and cumulative rotor swept area (we term this ‘windswept area’), as well as the number of years devoted to searching the wind turbines. Figure 6-1 illustrates the strong relationship between fatalities and search effort at the string level of analysis, requiring that fatality rates be adjusted by search effort. Therefore, the relative search effort devoted to each turbine string was calculated as
String Search Effort (m2 · years) = Nt × R × Y where Nt is the number of wind turbines in the string, R is the mean rotor swept area in m2, and Y is the number of years the string was searched. Figure 6-2 illustrates the inverse power relationship between a fatality rate and search effort, which casts doubt on the reliability of a simple conversion of fatalities to fatality rates (mortality) for interstring (or intersite) comparisons and hypothesis testing. This relationship resembles the patterns in estimates of animal density related to the sizes of the area used to make the estimates (Blackburn and Gaston 1996, Smallwood and Schonewald 1996), rendering their comparisons inappropriate among study sites of varying sizes. A more appropriate approach to factoring in differential search effort when comparing fatality frequencies is to estimate the number of fatalities expected of a uniform or random distribution of fatalities among levels or conditions of an environmental variable measured in the wind farm (Smallwood 1993, 2002). The incidence of the compared element in the string within the measured set of searches across all the strings was calculated as
Effort i ÷ Σ Effort and was the basis upon which expected χ2 values were estimated at the string level of analysis.

304
Figure 6-1. The number of red-tailed hawk (A) and all bird (B) carcasses as positive linear functions of search effort per turbine string.
800,000 600,000400,000200,0000
11109876543210
800,000 600,000400,000200,0000
55
50
45
40
35
30
25
20
15
10
50
Number of red - tailed hawk carcasses found
at turbine strings where animal burrows
were mapped
Number of bird carcasses found at turbine strings
where animal burrows were mapped
Search Effort(Rotor-swept area in m2 x number of turbines in string x number of years string was searched)
A
B 800,000 600,000400,000200,0000
11109876543210
800,000 600,000400,000200,0000
55
50
45
40
35
30
25
20
15
10
50
Number of red - tailed hawk carcasses found
at turbine strings where animal burrows
were mapped
Number of bird carcasses found at turbine strings
where animal burrows were mapped
A
B

305
Figure 6-2. Red-tailed hawk mortality is an inverse power function of search effort per turbine string. 6-3 RESULTS Sample Characteristics Our sample of wind turbines and our sampling effort included mostly KCS-56 and Bonus turbines (Figure 6-3), and our sample and sampling effort of towers included mostly lattice and tubular towers (Figure 6-4). Our sample included a wide range of rotor plane areas swept per second during ordinary wind turbine operations (416 to 1246 m2/s), although many of the wind turbines sampled swept a larger area per second (Figure 6-5). The area in the rotor plane swept per second, as well as the window of time birds could fly through the rotor plane at the blade tips, was much more a function of rotor diameter than tip speed (Figures 6-6 and 6-7). Similarly, our sample included a wide range of tower heights, ranging from 14 to 43.1 m (Figure 6-8). Our sample, however, was influenced largely by 18.5- and 24.6-m towers, which supported KCS-56 and Bonus turbines, respectively. Most of the wind turbines in our sample of turbines were designed to face the wind, although a considerable number also faced away from the wind (Figure 6-9). The majority of the wind turbines in our sample were situated in the interior of turbine strings (Figure 6-10), and the majority were situated in the interior of the wind farm (Figure 6-11). Most were on hill slopes and ridge crests (Figure 6-12), and only a relatively few wind turbines were within canyons (Figure 6-13). Nearly a third of the wind turbines in our sample were situated on peaks, ridge crests, and plateaus, to which no slope aspect applied, and relatively few wind turbines were on southwest- and west-facing slopes (Figure 6-14). The wind turbines ranged in elevation from 61 to 532 m above sea level, and most were situated within two subranges of elevation, from 120 to 220 m and from 280 to 450 m (Figure 6-15A). The wind turbines in our sample averaged 2.57 m elevation difference from the next turbine in the same string, indicating an average slope grade of 6.4% (Figure 6-15B).
800,000 600,000400,000200,0000
0.0004
0.0003
0.0002
0.0001
0
Number of red - tailed hawk carcasses per m 2of rotor - swept area peryear at turbine stringswhere animal burrows
were mapped
Search Effort
800,000 600,000400,000200,0000
0.0004
0.0003
0.0002
0.0001
0
Number of red - tailed hawk carcasses per m 2of rotor - swept area peryear at turbine stringswhere animal burrows
were mapped
(Rotor-swept area in m2 x number of turbines in string x number of years string was searched)
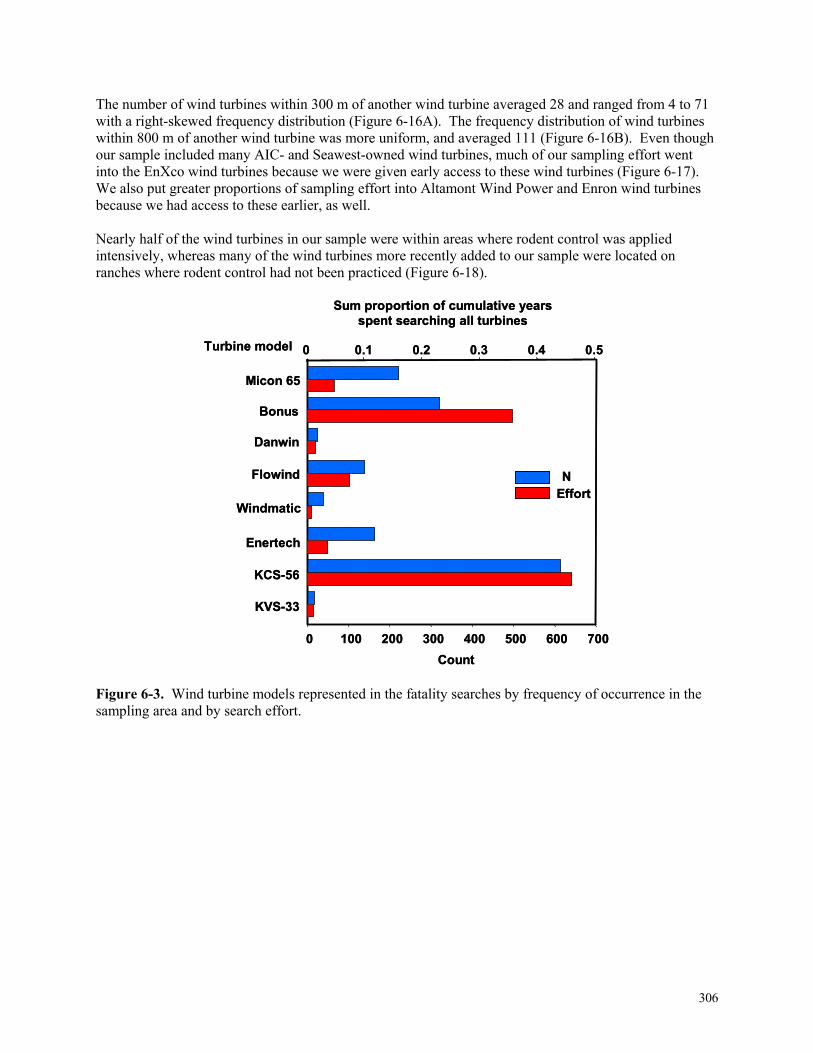
306
The number of wind turbines within 300 m of another wind turbine averaged 28 and ranged from 4 to 71 with a right-skewed frequency distribution (Figure 6-16A). The frequency distribution of wind turbines within 800 m of another wind turbine was more uniform, and averaged 111 (Figure 6-16B). Even though our sample included many AIC- and Seawest-owned wind turbines, much of our sampling effort went into the EnXco wind turbines because we were given early access to these wind turbines (Figure 6-17). We also put greater proportions of sampling effort into Altamont Wind Power and Enron wind turbines because we had access to these earlier, as well. Nearly half of the wind turbines in our sample were within areas where rodent control was applied intensively, whereas many of the wind turbines more recently added to our sample were located on ranches where rodent control had not been practiced (Figure 6-18).
Figure 6-3. Wind turbine models represented in the fatality searches by frequency of occurrence in the sampling area and by search effort.
Turbine model
Micon 65
Bonus
Danwin
Flowind
Windmatic
KCS-56
KVS-33
Count7006005004003002001000
Enertech
Sum proportion of cumulative yearsspent searching all turbines
0.50.40.30.20.10
NEffort
Turbine model
Micon 65
Bonus
Danwin
Flowind
Windmatic
KCS-56
KVS-33
Count7006005004003002001000
Enertech
Sum proportion of cumulative yearsspent searching all turbines
0.50.40.30.20.10
NEffort
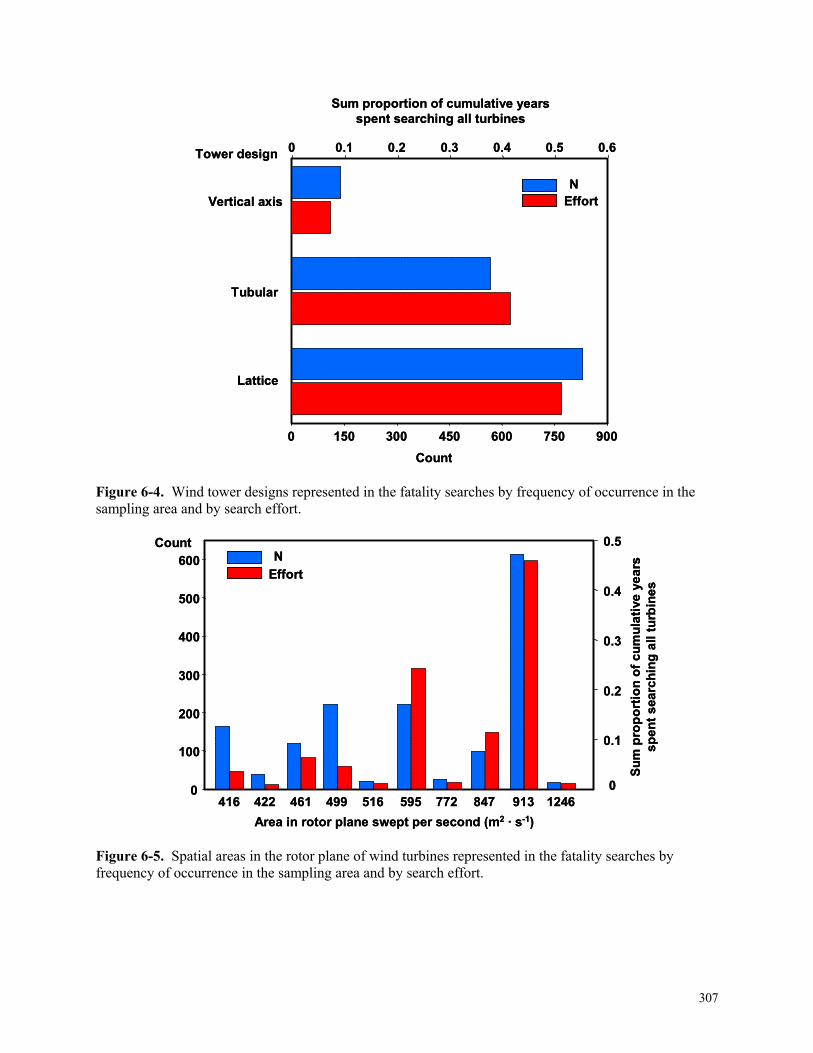
307
Figure 6-4. Wind tower designs represented in the fatality searches by frequency of occurrence in the sampling area and by search effort.
Figure 6-5. Spatial areas in the rotor plane of wind turbines represented in the fatality searches by frequency of occurrence in the sampling area and by search effort.
Tower design
Vertical axis
Tubular
Lattice
Count9007506004503001500
Sum proportion of cumulative yearsspent searching all turbines
0.60.50.40.30.20.10
NEffort
Tower design
Vertical axis
Tubular
Lattice
Count9007506004503001500
Sum proportion of cumulative yearsspent searching all turbines
0.60.50.40.30.20.10
NEffort
Sum
pro
port
ion
of c
umul
ativ
e ye
ars
spen
t sea
rchi
ng a
ll tu
rbin
es
0.5
0.4
0.3
0.2
0.1
01246913847772595516499461422416
600
500
400
300
200
100
0
Count
Area in rotor plane swept per second (m2 · s-1)
NEffort
Sum
pro
port
ion
of c
umul
ativ
e ye
ars
spen
t sea
rchi
ng a
ll tu
rbin
es
0.5
0.4
0.3
0.2
0.1
01246913847772595516499461422416
600
500
400
300
200
100
0
Count
Area in rotor plane swept per second (m2 · s-1)
NEffort

308
Figure 6-6. Spatial areas in the rotor plane of wind turbines as functions of tip speed of the blades (A) and rotor diameter (B).
Y = -15.7 + 3.9X r2 = 0.22RMSE = 253.4P > 0.05
40 302010
1400
1200
1000
800
600
400
Tip Speed (kph)260 240220200180160140120
1400
1200
1000
800
600
400
Y = -155.0 + 42.5X r2 = 0.77RMSE = 137.9P < 0.001
Rotor Diameter (m)
Area in rotor plane swept per second
(m 2 · s - 1 )
Area in rotor plane swept per second
(m 2 · s - 1 )
A
B
Y = -15.7 + 3.9X r2 = 0.22RMSE = 253.4P > 0.05
40 302010
1400
1200
1000
800
600
400
kph)260 240220200180160140120
1400
1200
1000
800
600
400
Y = -155.0 + 42.5X r2 = 0.77RMSE = 137.9P < 0.001
Area in rotor plane swept per second
(m 2 · s - 1 )
Area in rotor plane swept per second
(m 2 · s - 1 )
A
B

309
Figure 6-7. The time interval in seconds between sweeps of the blade at the edge of the rotor plane as functions of tip speed of the blades (A) and rotor diameter (B).
40 302010
0.8
0.6
0.4
0.2
260 240220200180160140120
0.8
0.6
0.4
0.2
Y = 0.558 – 0.00058X r2 = 0.03RMSE = 0.1267P > 0.05
Y = 0.13 + 0.0168X r2 = 0.61RMSE = 0.0804P < 0.01
Tip Speed (kph)
Rotor Diameter (m)
Interval (seconds) between rotor
sweeps at blade tip
Interval (seconds) between rotor
sweeps at blade tip
A
B
40 302010
0.8
0.6
0.4
0.2
260 240220200180160140120
0.8
0.6
0.4
0.2
Y = 0.558 – 0.00058X r2 = 0.03RMSE = 0.1267P > 0.05
Y = 0.13 + 0.0168X r2 = 0.61RMSE = 0.0804P < 0.01
kph)
Interval (seconds) between rotor
sweeps at blade tip
Interval (seconds) between rotor
sweeps at blade tip
A
B

310
Figure 6-8. Tower heights of wind turbines represented in the fatality searches by frequency of occurrence in the sampling area and by search effort.
Figure 6-9. The wind turbine’s rotor orientation represented in the fatality searches by frequency of occurrence in the sampling area and by search effort.
Sum
pro
port
ion
of c
umul
ativ
e ye
ars
spen
t sea
rchi
ng a
ll tu
rbin
es
0.5
0.4
0.3
0.2
0.1
0
Tower height in meters
43.132.329.525.224.624.018.514.0
Count700
600
500
400
300
200
100
0
NEffort
Sum
pro
port
ion
of c
umul
ativ
e ye
ars
spen
t sea
rchi
ng a
ll tu
rbin
es
0.5
0.4
0.3
0.2
0.1
0
Tower height in meters
43.132.329.525.224.624.018.514.0
Count700
600
500
400
300
200
100
0
NEffort
Turbine orientation to wind
Vertical axisDown from windFaces wind
Count900
750
600
450
300
150
0
Sum
pro
port
ion
of c
umul
ativ
e ye
ars
spen
t sea
rchi
ng a
ll tu
rbin
es
0.7
0.6
0.5
0.4
0.3
0.2
0.1
0N Effort N Effort N Effort
NEffort
Turbine orientation to wind
Vertical axisDown from windFaces wind
Count900
750
600
450
300
150
0
Sum
pro
port
ion
of c
umul
ativ
e ye
ars
spen
t sea
rchi
ng a
ll tu
rbin
es
0.7
0.6
0.5
0.4
0.3
0.2
0.1
0N Effort N Effort N Effort
NEffort

311
Figure 6-10. The wind turbine’s position in the string as represented in the fatality searches by frequency of occurrence in the sampling area.
Figure 6-11. The wind turbine’s location in the wind farm as represented in the fatality searches by frequency of occurrence in the sampling area and by search effort.
Position in turbine string
Non-operational
GapInteriorEnd
Count
1000
800
600
400
200
0
Position in turbine string
Non-operational
GapInteriorEnd
Count
1000
800
600
400
200
0
Location in wind farm
InteriorLocal edgeEdge
Count1200
1000
800
600
400
200
0
Sum
pro
port
ion
of c
umul
ativ
e ye
ars
spen
t sea
rchi
ng a
ll tu
rbin
es
0.8
0.6
0.4
0.2
0
NEffort
Location in wind farm
InteriorLocal edgeEdge
Count1200
1000
800
600
400
200
0
Sum
pro
port
ion
of c
umul
ativ
e ye
ars
spen
t sea
rchi
ng a
ll tu
rbin
es
0.8
0.6
0.4
0.2
0
NEffort
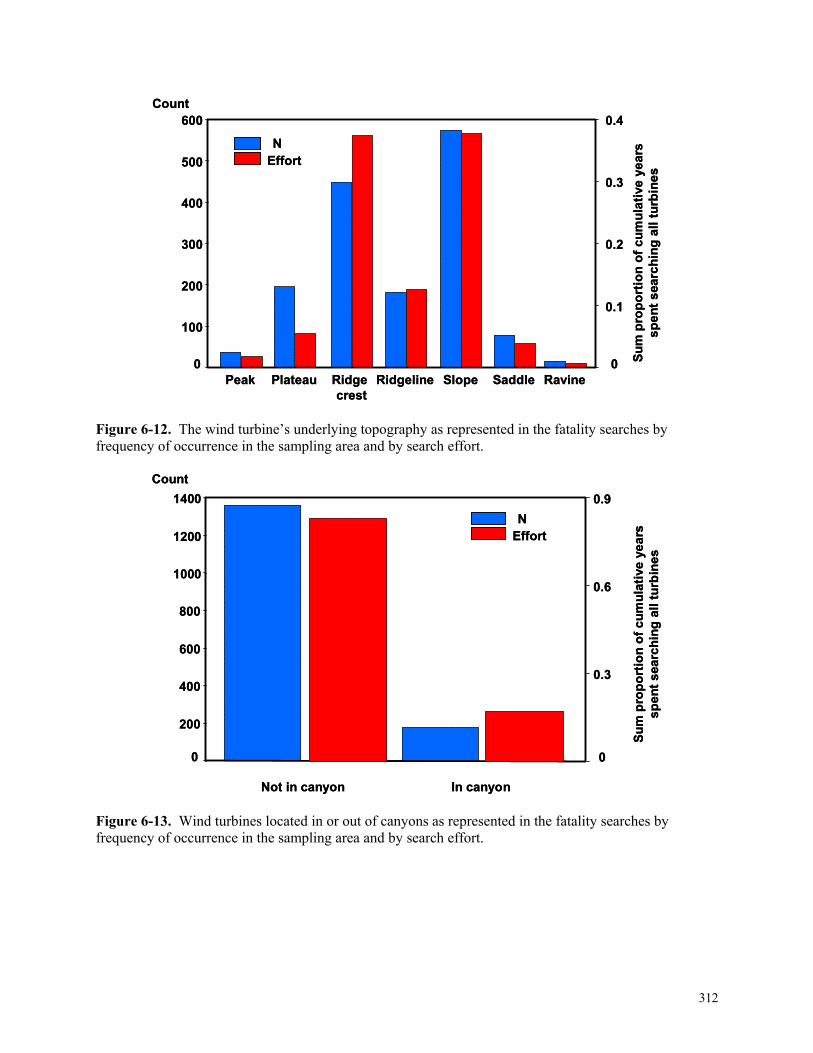
312
Figure 6-12. The wind turbine’s underlying topography as represented in the fatality searches by frequency of occurrence in the sampling area and by search effort.
Figure 6-13. Wind turbines located in or out of canyons as represented in the fatality searches by frequency of occurrence in the sampling area and by search effort.
Sum
pro
port
ion
of c
umul
ativ
e ye
ars
spen
t sea
rchi
ng a
ll tu
rbin
es
0.4
0.3
0.2
0.1
0RavineSaddleSlopeRidgelineRidge
crestPlateauPeak
Count600
500
400
300
200
100
0
NEffort
Sum
pro
port
ion
of c
umul
ativ
e ye
ars
spen
t sea
rchi
ng a
ll tu
rbin
es
0.4
0.3
0.2
0.1
0RavineSaddleSlopeRidgelineRidge
crestPlateauPeak
Count600
500
400
300
200
100
0
NEffort
In canyonNot in canyon
Count1400
1200
1000
800
600
400
200
0
Sum
pro
port
ion
of c
umul
ativ
e ye
ars
spen
t sea
rchi
ng a
ll tu
rbin
es
0.9
0.6
0.3
0
NEffort
In canyonNot in canyon
Count1400
1200
1000
800
600
400
200
0
Sum
pro
port
ion
of c
umul
ativ
e ye
ars
spen
t sea
rchi
ng a
ll tu
rbin
es
0.9
0.6
0.3
0
NEffort

313
Figure 6-14. The frequency distribution of the aspect of the slopes upon which wind turbines were situated.
Slope aspect
NorthwestWest
SouthwestSouth
SoutheastEast
NortheastNorth
None
Count500
400
300
200
100
0
Peaks, plateaus, and some ridge crests
Slope aspect
NorthwestWest
SouthwestSouth
SoutheastEast
NortheastNorth
None
Count500
400
300
200
100
0
Peaks, plateaus, and some ridge crests
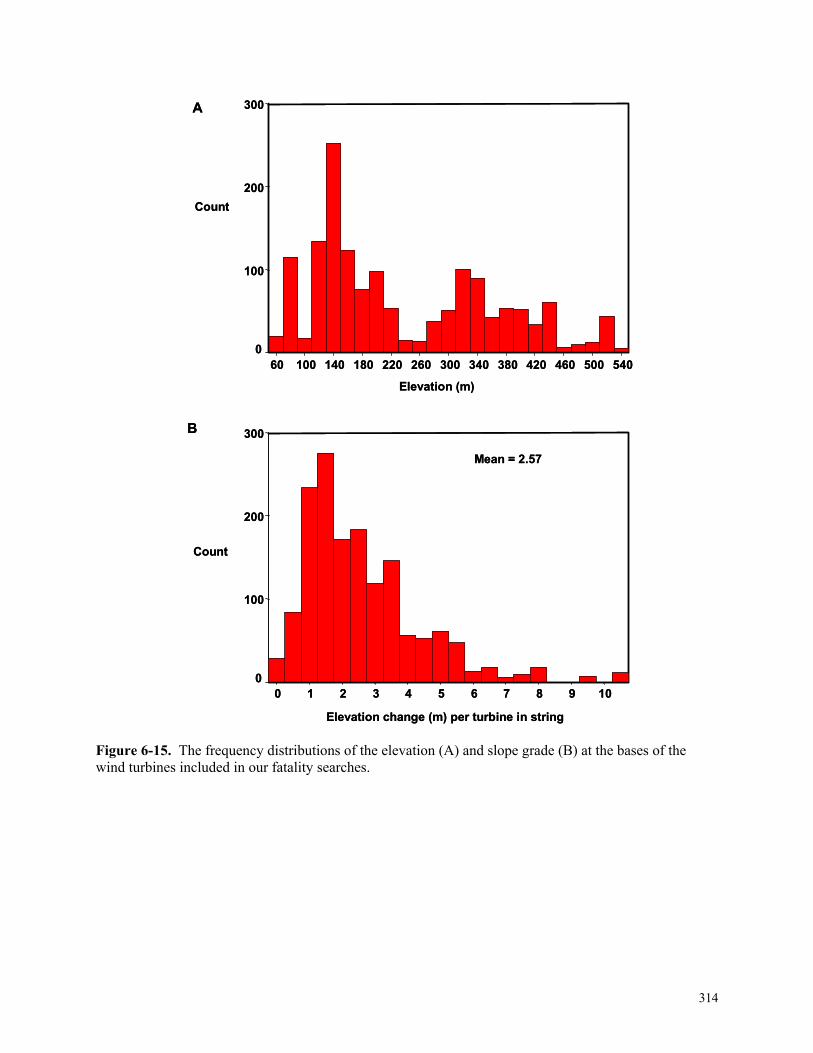
314
Figure 6-15. The frequency distributions of the elevation (A) and slope grade (B) at the bases of the wind turbines included in our fatality searches.
Elevation (m)
54050046042038034030026022018014010060
300
200
100
0
Elevation change (m) per turbine in string
109876543210
300
200
100
0
Mean = 2.57
A
B
Count
Count
Elevation (m)
54050046042038034030026022018014010060
300
200
100
0
Elevation change (m) per turbine in string
109876543210
300
200
100
0
Mean = 2.57
A
B
Count
Count

315
Figure 6-16. The frequency distributions of the numbers of wind turbines within 300 m (A) and 800 m (B) of each wind turbine included in our fatality searches.
22020018016014012010080604020
160
120
80
40
0
Number of turbines within 300 m706560555045403530252015105
300
200
100
0
Frequencyof turbines
Frequencyof turbines
Number of turbines within 800 m
A
B
22020018016014012010080604020
160
120
80
40
0
Number of turbines within 300 m706560555045403530252015105
300
200
100
0
Frequencyof turbines
Frequencyof turbines
Number of turbines within 800 m
A
B
316
Figure 6-17. Wind turbine ownership by frequency of occurrence in the sampling area and by search effort.
Figure 6-18. The wind turbines in areas of three levels of rodent control as represented in the fatality searches by frequency of occurrence in the sampling area and by search effort.
0.4
0.3
0.2
0.1
0
Companies that owned the turbines
SeawestAICEnronEnXcoAWP
Count450
400
350
300
250
200
150
100
Sum
pro
port
ion
of c
umul
ativ
e ye
ars
spen
t sea
rchi
ng a
ll tu
rbin
es
NEffort
0.4
0.3
0.2
0.1
0
Companies that owned the turbines
SeawestAICEnronEnXcoAWP
Count450
400
350
300
250
200
150
100
Sum
pro
port
ion
of c
umul
ativ
e ye
ars
spen
t sea
rchi
ng a
ll tu
rbin
es
NEffort
0.5
0.4
0.3
0.2
0.1
0
Rodent control applied through September 2001
IntenseIntermittentNone
Count700
600
500
400
300
200
Sum
pro
port
ion
of c
umul
ativ
e ye
ars
spen
t sea
rchi
ng a
ll tu
rbin
es
NEffort
0.5
0.4
0.3
0.2
0.1
0
Rodent control applied through September 2001
IntenseIntermittentNone
Count700
600
500
400
300
200
Sum
pro
port
ion
of c
umul
ativ
e ye
ars
spen
t sea
rchi
ng a
ll tu
rbin
es
NEffort

317
Fatality Associations Table 6-1 summarizes the χ2 tests between the distribution of avian fatalities and factors measured in the APWRA for particular species, and Table 6-2 summarizes the tests for groups of species, including all hawks, all raptors, and all avian species combined. In considering these test values, we also considered the percentage of expected values less than 5; the greater the percentage, the less reliable the test result. The test values were similar across wind turbine attributes, including wind turbine model, its rated speed, typical tip speed, rotor diameter, the window of time between blade sweeps of the same location at the blade tips, and the area in the rotor plane that is swept per second. Therefore, we only looked at three of these attributes in depth, recognizing that the results related to these attributes were not independent. The indepth examination of test results in the following figures was based on a measure of effect: the observed divided by expected values, which measures the number of fatalities at that element of the measured set as a multiple of what would be expected from a uniform or random distribution of fatalities throughout the measured set. In examining these observed divided by expected values, we attributed greater reliability to values associated with a greater number of observed fatalities, so the fatalities of Species A occurring at a wind turbine attribute twice as often as expected by chance would be considered more insightful when the observed fatalities numbered 10 compared to 1, for example.

318
Table 6-1. Chi-square values of association between the number of fatalities of avian species and attributes of the wind turbines, turbine strings, and physiographic conditions. t denotes 0.10 > P > 0.05, * denotes P < 0.05, and ** denotes P < 0.005.
Predictor Variable d.f. GOEA RTHA AMKE BUOW BAOW GHOW MALL RODO EUST WEME HOLA HOFI
Turbine model 7 17.62* 11.60 46.12** 32.59** 7.76 10.19 16.61* 40.18** 38.51** 23.10** 8.85 51.59**
Turbine size 7 13.52 t 7.11 45.64** 35.23** 8.48 9.27 20.98** 32.97** 31.47** 25.44** 24.55*
* 45.78**
Turbine rate/speed 6 15.98* 11.59 46.12** 28.05** 7.76 10.19 16.61* 36.85** 37.47** 21.36** 8.85 38.55**
Rotor diameter 9 17.81* 25.70** 46.20** 35.79** 8.51 10.30 26.58** 41.02** 39.25** 25.68** 24.55*
* 54.09**
Tip speed 8 17.81* 25.54** 46.11** 32.92** 7.76 10.30 26.19** 40.92** 38.42** 23.80** 24.55** 51.13**
Window 9 17.81* 25.70** 46.20** 35.79** 8.51 10.30 26.58** 41.02** 39.25** 25.68** 24.55** 54.09**
Rotorswept area/sec 9 17.81* 25.70** 46.20** 35.79** 8.51 10.30 26.58** 41.02** 39.25** 25.68** 24.55*
* 54.09**
Tower type 2 11.20** 8.73* 1.28 18.44** 1.84 3.00 10.90** 5.79 t 1.85 16.10** 6.06* 8.24*
Tower height 7 6.82 27.20** 3.05 11.45 6.94 5.78 18.13* 24.76** 3.75 14.67* 13.94 t 13.46 t
Tower height, no
VA 5 13.22* 69.61** 5.59 9.97 t 15.51* 3.39 40.87** 35.07** 1.98 36.11** 9.28 t 1.42
Orientation to wind 1 3.56 t 23.89** 0.24 3.94* 6.19* .28 7.80* 22.58** .65 14.12** 5.01* .66
Part of wind wall? 1 3.32 t 0.38 0.62 10.84** .00 .97 4.90* 19.56** .57 4.95* 2.10 2.62
Position in string 2 5.31 t 4.32 0.60 22.13** 1.58 .09 16.71** 7.21* 0.18 7.66* 8.45* 2.95
Position in farm 2 3.60 5.30 t 0.25 6.03* 8.01* 0.50 1.99 37.10** 0.30 4.33 2.26 2.94
Turbine congestion 3 5.67 12.15* 0.80 5.06 2.44 4.59 4.00 29.27** 7.16 t 2.66 3.44 10.88*
Elevation 6 17.18* 9.95 10.89 t 54.55** 13.26* 10.02 29.32** 34.20** 19.60** 30.90** 6.50 29.47**

319
Slope grade 3 6.14 2.06 4.87 7.51 t 7.05 t 7.19 t 2.21 25.55** 2.68 10.31* 2.27 11.98*
Physical relief 6 8.52 6.01 6.86 6.21 1.85 31.34** 12.37 t 22.85 8.87 15.09* 1.66 6.65
Whether in canyon 1 22.37** 11.56** 0.30 2.22 18.79** .65 17.05** .42 .83 24.22** .65 .09
Slope aspect 8 10.95 12.61 7.22 8.49 21.68* 7.44 11.33 14.74 t 5.29 8.42 8.66 15.64*
Edge index 4 5.19 6.56 1.26 5.69 2.67 7.03 1.20 1.60 6.54 3.65 2.58 2.45
Rock piles 2 4.87 t 13.70** 8.80* 12.14** 17.42** 2.85 4.69 t 75.43** 5.47 6.43* 10.84** .51
Rodent control 2 14.77** 5.84 t 0.35 18.18** 8.91* 8.56* 15.29** 7.15* 12.50** 11.10** 3.96 14.24**
Company 4 14.66* 9.15 t 4.67 33.76** 6.80 8.02 t 15.21** 64.50** 22.55** 28.68** 6.01 23.67** Gopher
clustering 3 10.29* 5.78 2.90 13.33** 9.10* 5.91 16.66** 7.37 t 20.27** 12.63* 6.28 t 1.63
Canyon and gopher
cluster interaction
5 65.51** 17.09** 2.10 24.04** 0.71 24.08** 188.58** 32.02** 118.01** 21.01** 6.47 30.67**
Squirrel clustering 2 2.40 0.62 1.26 1.96 0.17 1.34 3.91 15.54** 6.52* 3.99 3.92 3.58
Canyon and squirrel
cluster interaction
5 36.03** 50.55** 3.20 5.62 5.12 2.92 24.90** 26.55** 7.11 16.99** 12.12* 3.90
Gophers/ha to 90 m 2 11.05** 2.57 4.55 9.66* 0.65 0.74 3.36 19.73** 5.94 t 9.09* 5.41 t 5.80 t
Squirrels/ha to 90 m 2 9.13* 1.37 1.10 12.66** 0.63 2.37 4.23 0.92 12.86** 5.33 t 5.73 t 0.98
All burrows
clustering 2 0.36 45.19** 11.13** 1.04 0.78 1.92 11.64** 19.29** 3.24 5.23 t 3.02 2.24
All burrows density
2 11.05** 13.59** 1.67 18.97** 0.39 3.36 2.73 15.68** 8.82* 8.58* 8.25* 1.52

320
Table 6-2. Chi-square values of association between the number of fatalities of avian species and attributes of the wind turbines, turbine strings, and physiographic conditions. t denotes 0.10 > P > 0.05, * denotes P < 0.05, and ** denotes P < 0.005.
Predictor Variable d.f. Hawks Raptors All birds
Turbine model 7 14.46* 27.93** 72.95** Turbine size 6 7.80 24.99** 67.19** Turbine rate/speed 6 14.45* 26.27** 63.52** Rotor diameter 9 24.95** 31.20** 74.29** Tip speed 8 24.90** 29.71** 69.40** Window 9 24.95** 31.20** 74.29** Rotor-swept area/sec 9 24.95** 31.20** 74.29** Tower type 2 11.46** 16.82** 30.48** Tower height 7 28.27** 25.48** 35.11** Tower height, no VA 5 74.45** 99.56** 147.36** Orientation to wind 1 31.29** 39.82** 79.18** Part of wind wall? 1 0.05 1.52 2.41 Position in string 2 6.73* 25.76** 27.03** Position in farm 2 21.54** 26.38** 56.73** Turbine congestion 3 11.75* 6.25 0.78 Elevation 6 14.10* 25.36** 94.51** Slope grade 3 2.52 9.13* 18.88** Physical relief 6 6.60 8.81 42.83** Whether in canyon 1 10.57** 29.15** 39.62** Slope aspect 8 10.02 17.23* 11.58 Edge index 4 7.31 7.13 3.63 Rock piles 2 11.54** 24.82** 60.90** Rodent control 2 6.01* 24.01** 39.54** Company 4 10.07* 27.36** 88.27** Gopher clustering 3 11.58* 25.57** 64.90** Canyon and gopher cluster interaction 5 19.38** 54.42** 217.51** Squirrel clustering 2 1.06 0.70 1.92 Canyon and squirrel cluster interaction 5 53.38** 72.38** 96.00** Gophers/ha to 90 m 2 4.65 t 10.95** 9.80* Squirrels/ha to 90 m 2 2.87 12.14** 32.92** All burrows clustering 2 61.06** 62.13** 60.59** All burrows density 2 18.55** 35.74** 62.49**
Season
For most species, fall is the worst season for wind-turbine-caused mortality (see Figure 2-8). For horned larks, summer was by far the worst season. Wind Turbine Model Bonus turbines were associated with a greater-than-expected number of golden eagle fatalities, as well as those of burrowing owl, barn owl, mallard, and western meadowlark (Figure 6-19). KVS-33 turbines killed more than the expected number of American kestrels, and KCS-56 turbines killed more than the expected number of great horned owls. Enertech and Flowind turbines also killed more than the expected number of

321
burrowing owls, and Windmatic turbines took a disproportionate toll on mallards. Micon 65 turbines killed more than the expected number of European starlings and rock doves. At the multispecies level of analysis, Bonus turbines were the most substantially disproportionate killers of hawks, raptors and all birds considered together (Figure 6-20). KCS-56 turbines killed fewer than the expected number of hawks, and Micon 65 turbines were the second most substantial contributor to hawk, raptor and all bird mortality. KVS-33 emerged as important to raptor mortality, and Enertech turbines were important because they killed disproportionately more birds than expected by chance. Wind Turbine Size Figures were not produced for this attribute because it is strongly correlated with other wind turbine attributes measured and reported herein. Rated Speed Figures were not produced for this attribute because it is strongly correlated with other wind turbine attributes measured and reported herein. Rotor Diameter Considering both the ratio of observed-to-expected values and the number of observed fatalities, larger rotor diameters associated with disproportionately more golden eagles, red-tailed hawks, American kestrels, and burrowing owls, as well as mallards, horned larks, and western meadowlarks (Figure 6-21). Shorter-diameter wind turbines killed substantially more than the expected number of rock doves and European starlings. At the multispecies level of analysis, larger rotor diameters associated with disproportionately greater numbers of hawk, raptor and all bird species together (Figure 6-22). Tip Speed Wind turbines with slower-moving blades associated with a significantly larger proportion of fatalities of golden eagle, burrowing owl, horned lark, western meadowlark, house finch, European starling, and rock dove (Figure 6-23). Wind turbines with intermediate tip speeds associated with a significantly larger proportion of fatalities of red-tailed hawks and American kestrels, and the wind turbines with the fastest tip speed associated with a substantial but nonsignificant proportion of the great horned owl fatalities. At the multispecies level of analysis, wind turbines with the slowest to intermediate tip speeds associated significantly with the largest proportions of hawk, raptor, and all bird fatalities (Figure 6-24). Window of Time to Fly Through Rotor Plane Wind turbines with intermediate to larger windows of opportunity to fly through the rotor plane (i.e., 0.5-0.7 s) associated with a significantly larger proportion of fatalities of golden eagle, red-tailed hawk, American kestrel, burrowing owl, mallard, horned lark, and western meadowlark (Figure 6-25). Wind turbines with brief windows of opportunity to fly through the rotor plane (i.e., 0.27-0.41 s) associated with a significantly larger proportion of fatalities of house finch, European starling and rock dove, and also took a toll on golden eagle, burrowing owl, and great horned owl. At the multispecies level of analysis, wind turbines with intermediate to larger windows of opportunity to fly through the rotor plane (i.e., 0.5-0.7 s) associated with a significantly larger proportion of fatalities of hawks and raptors, but no clear pattern was evident for all birds combined, even though the test result was significant (Figure 6-26).

322
Rotor Area Swept per Second Larger rotor areas swept per second associated with disproportionately larger numbers of fatalities of golden eagle, red-tailed hawk, American kestrel, and mallard, whereas the significant associations for other species were intermediate and small rotor swept areas per second (Figure 6-27). At the multispecies level of analysis, large sample sizes contributed to significant test results, but no clear pattern emerged: small, intermediate, and large rotor areas swept per second associated strongly with hawk, raptor and all bird mortality (Figure 6-28). Rotor Orientation to Wind Rotors facing the wind killed disproportionately more of all the species and interspecific groups for which the test result was significant (Figures 6-29 and 6-30). Tower Type Tubular towers killed disproportionately more golden eagles, red-tailed hawks, burrowing owls, mallards, horned larks, and western meadowlarks than expected by chance (Figure 6-31). Lattice towers killed disproportionately more American kestrels than expected by chance, and killed a substantial number of great horned owls. They also killed disproportionately more rock doves than expected by chance. Vertical-axis turbines killed more burrowing owls, western meadowlarks, and house finches than expected. At the multispecies level of analysis, tubular towers were associated with more than the expected number of hawk, raptor, and all avian fatalities (Figure 6-32). Tower Height Taller towers were associated with disproportionately more fatalities of golden eagle, red-tailed hawk, American kestrel, burrowing owl, barn owl, mallard, and western meadowlark, whereas shorter or intermediate towers associated with more fatalities of horned lark, house finch and rock dove (Figure 6-33). At the multispecies level of analysis, taller towers associated with disproportionately more fatalities of hawks, raptors and all avian species combined (Figure 6-34). Physical Relief The χ2 tests for association were not significant for all species but great horned owl, mallards, and western meadowlarks, all of which were killed more often than expected by chance on plateaus (Figure 6-35). However, the measure of effect is still useful for identifying problem areas among species for which the tests were not significant. The ratio of observed-to-expected numbers of fatalities was notably large for golden eagles on slopes, and for red-tailed hawks, American kestrels, European starlings and rock doves on saddles of ridges. This ratio was usually relatively small for hill peaks, ridgelines, and ridge crests, although the latter associated with a considerable number of red-tailed hawk and American kestrel fatalities. At the multispecies level of analysis, the ratio of observed-to-expected numbers of fatalities was notably large for hawks and raptors on saddles of ridges, and wind turbines on plateaus, ridge saddles, and in ravines associated with significantly greater number of fatalities of all birds combined (Figure 6-36). Canyons Wind turbines in canyons killed more than 3 times the expected number of golden eagles, 1.5 times the number of red-tailed hawks, 2.5 times the number of barn owls, and more than 2.5 times the numbers of mallard and western meadowlark (Figure 6-37). Wind turbines in canyons killed 1.5 times the expected number of hawks, raptors and all birds combined (Figure 6-38).
323
Slope Aspect The only species for which fatalities related significantly to slope aspect were barn owl and house finch, and rock dove tended towards significance (Table 6-1). The largest observed/expected ratios of fatalities occurred for wind turbines on slopes facing northwest for barn owl (2.65), mallard (1.67), and western meadowlark (1.70), slopes facing south for American kestrel (2.38), burrowing owl (1.92), and red-tailed hawk (1.63), west for rock dove (2.72), and north and northwest for golden eagle (2.12 and 1.53, respectively). At the multispecies level of analysis, the ratio of observed-to-expected numbers of fatalities was larger on south- and northwest-facing slopes for hawks, raptors, and all species combined. Elevation Golden eagle fatalities associated significantly with elevation at the wind turbine base, but the sample size per range of elevations was small, and fatalities occurred disproportionately at both the lowest and highest elevation ranges (Figure 6-39). Fatalities of red-tailed hawk and American kestrel occurred disproportionately more often at wind turbines at lower elevations. Fatalities of burrowing owl, barn owl, mallard, house finch, rock dove, and western meadowlark were disproportionately more numerous at lower elevations (Figures 6-40 and 6-41). At the multispecies level of analysis, fatalities of hawks, raptors, and all avian species combined were disproportionately more numerous at the lowest elevations (Figure 6-42). Slope Grade Fatalities of most species did not associate significantly with slope grade (Figures 6-43 and 6-44). Burrowing owl, great horned owl, and western meadowlark tended to die more often than expected by chance at wind turbines on steeper slopes, whereas barn owls tended to do so more often on the shallow slopes. At the multispecies level of analysis, hawk fatalities did not associate significantly with slope grade, raptor fatalities were more common than expected by chance on steeper slopes, and all birds combined showed no biologically significant pattern in association with slope grade (Figure 6-45). Rock Piles The presence of rock piles assembled near wind turbine strings associated with significantly more than the expected number of fatalities of golden eagle, red-tailed hawk, American kestrel, burrowing owl, barn owl, horned lark, western meadowlark and rock dove (Figure 6-46). This association held for all hawks combined, all raptors, and all avian species (Figure 6-47). Position in String Wind turbines at the ends of rows killed more than the expected number of golden eagles, burrowing owls, and western meadowlarks, whereas wind turbines at the edges of gaps in the row killed more than the expected number of mallards and horned larks and interior wind turbines killed more than the expected number of rock doves (Figure 6-48). Overall, wind turbines at the ends of rows and at gaps killed disproportionately more hawks, raptors, and all avian species combined than did interior turbines (Figure 6-49).

324
Wind Wall Wind-turbine-caused fatalities of most species did not relate significantly to whether the wind turbine was part of a wind wall (Table 6-1). One exception was burrowing owl, none of which were killed by wind turbines in wind walls. Position in Wind Farm Golden eagle fatalities did not associate significantly with the wind turbine’s position in the wind farm, but wind turbines at the edges of local clusters of wind turbines killed disproportionately more red-tailed hawks, barn owls, and rock doves. Interior turbines were associated with significantly more burrowing owls (Figure 6-50). At the multispecies level of analysis, wind turbines at the edges of local clusters of wind turbines killed significantly more than the expected number of hawks, raptors, and all avian species combined (Figure 6-51). Wind Turbine Congestion At the 300-m scale of analysis, the fatalities of most species did not associate significantly with the number of surrounding wind turbines (Figures 6-52 and 6-53). House finch and rock dove were killed disproportionately more often by more isolated wind turbines and European starlings were killed more often at wind turbines most crowded by other wind turbines. At the multispecies level of analysis, hawks were killed disproportionately more often at more isolated wind turbines (Figure 6-54). Wind Company EnXco’s wind turbines killed significantly more than the expected number of golden eagles, red-tailed hawks, burrowing owls, mallards, western meadowlarks, and house finches (Figure 6-55). Enron’s wind turbines killed significantly more than the expected number of red-tailed hawks and rock doves, and substantially more American kestrels. AIC turbines killed significantly more than the expected number of great horned owls and substantially more American kestrels. Seawest’s wind turbines killed disproportionately more golden eagles, burrowing owls, western meadowlarks, house finches, European starlings, and rock doves. At the multispecies level of analysis, the wind turbines owned by EnXco and Enron killed significantly more than the expected number of hawks, and those owned by EnXco and Seawest killed significantly more than the expected number of raptors and all avian species combined (Figure 6-56). Rodent Control The intermittent level of rodent control associated with significantly more than the expected number of fatalities of golden eagle, red-tailed hawk, burrowing owl, mallard, western meadowlark, and house finch (Figure 6-57). No rodent control associated with significantly more than the expected number of fatalities of great horned owl, house finch, European starling, and rock dove. At the multispecies level of analysis, intermittent levels of rodent control were linked to more than the expected number of fatalities of hawks, raptors, and all avian species combined, and no rodent control was linked to more than the expected number of all avian species combined (Figure 6-58). Edge Index The edge index did not relate significantly to the number of fatalities of any species analyzed in this study.

325
Burrow Distribution Turbine strings with high densities of ground squirrel burrow systems killed more than 3 times the number of golden eagles expected by chance, and this relationship was similar for burrowing owl, western meadowlark, and European starling fatalities (Figure 6-59). The density of ground squirrel burrow systems did not relate significantly to the distribution of fatalities of red-tailed hawk or barn owl, nor with hawks at the interspecific level of analysis (Figure 6-60). Raptors and all birds combined died 1.6 and 1.8 times more often than expected by chance at turbine strings with high densities of ground squirrel burrow systems. Turbine strings with high densities of pocket gopher burrow systems killed 2.5 times the number of golden eagles expected by chance, and more than the expected number of horned larks (Figure 6-61). Burrowing owls, western meadowlarks, and European starlings died more often than expected by chance at turbine strings with modest densities of gopher burrow systems, and rock doves died disproportionately more often where pocket gophers occurred only in low density. Red-tailed hawk and barn owl fatalities did not relate to pocket gopher burrow system density. At the interspecific level of analysis, disproportionately more hawks were killed at turbine strings with moderate densities of pocket gophers, raptors were killed more often at moderate and high gopher densities, and all birds died disproportionately more often at moderate gopher densities (Figure 6-62). Turbine strings with high densities of burrow systems of all fossorial animal species killed 3 times the number of golden eagles expected by chance, and more than the expected number of red-tailed hawks, burrowing owls, horned larks, western meadowlarks, and European starlings (Figure 6-63). As with ground squirrel burrow systems, red-tailed hawks also died more often than expected by chance at turbine strings with low densities of burrow systems of all species. Rock doves died significantly more often than expected by chance at turbine strings with low densities of burrow systems. At the interspecific level of analysis, disproportionately more hawks, raptors, and all birds combined were killed at turbine strings with high densities of burrow systems of all fossorial animal species (Figure 6-64). The degree of clustering of ground squirrel burrow systems did not relate significantly to avian fatalities for all species but European starling and rock dove (Figures 6-65 and 6-66). European starlings and rock doves died disproportionately more often at turbine strings where squirrels clustered at wind turbines. However, factoring in the interaction of squirrel clustering with canyons changed the test results. Disproportionately more fatalities were of golden eagles and western meadowlarks at wind turbines with no squirrels or uniformly distributed squirrels in canyons, red-tailed hawks in canyons with either no squirrels or squirrels clustered around the wind turbines, and rock doves out of canyons where squirrels clustered near wind turbines (Figure 6-67). At the interspecific level of analysis, hawks, raptors, and all birds died disproportionately more often at turbine strings in canyons where squirrels either did not occur or clustered at the wind turbines (Figure 6-68). This seemingly conflicting pattern will be discussed in the Discussion section. Although some of the χ2 tests between avian fatalities and gopher burrow clustering at wind turbines were significant, none were interesting biologically (Figures 6-69 and 6-70). However, factoring in canyons revealed that golden eagles, red-tailed hawks, burrowing owls, and western meadowlarks were killed disproportionately more often in canyons with high degrees of gopher clustering at wind turbines (Figure 6-71). European starlings died more often than expected by chance where gophers did not cluster at wind turbines, both inside and outside canyons, and rock dove fatalities were disproportionately less frequent where gophers clustered at wind turbines in canyons. At the interspecific level of analysis, hawks, raptors and all birds combined died disproportionately more often at turbine strings in canyons with high degrees of gopher clustering, and raptors and all birds also died disproportionately more often at turbine strings without gopher clustering and both inside and outside of canyons (Figure 6-72).

326
The degree of clustering of burrow systems of all fossorial animal species did not relate significantly to the distribution of fatalities of golden eagles, burrow owls, barn owls, horned larks, or European starlings, but the greatest level of clustering associated with disproportionately more fatalities of red-tailed hawk, American kestrel, western meadowlark, and rock dove (Figure 6-73). At the interspecific level of analysis, hawks, raptors, and all birds combined died disproportionately more often at turbine strings with greatest clustering of burrow systems of all fossorial animal species combined (Figure 6-74).

327
Figure 6-19. Species-specific associations between fatalities and wind turbine model, where n represents the number of fatalities observed and P is the probability of committing a Type I error in a χ2 test. “ns” represents not significant.
=12.7
= 9.5
3.53.02.52.01.51.00.50 6543210
Turbine modelMicon 65
BonusDanwinFlowind
WindmaticEnertech
KCS-56KVS-33
Micon 65Bonus
DanwinFlowind
WindmaticEnertech
KCS-56KVS-33
Micon 65Bonus
DanwinFlowind
WindmaticEnertech
KCS-56KVS-33
Micon 65Bonus
DanwinFlowind
WindmaticEnertech
KCS-56KVS-33
Micon 65Bonus
DanwinFlowind
WindmaticEnertech
KCS-56KVS-33
Micon 65Bonus
DanwinFlowind
WindmaticEnertech
KCS-56KVS-33
Goldeneagle
Red-tailedhawk
Americankestrel
Burrowingowl
Barnowl
Greathorned
owl
n n
Mallard
Hornedlark
Westernmeadowlark
Housefinch
Europeanstarling
Rockdove
Valueexpected
by chance
Valueexpectedby chance
29
1
144
7601323
532
114
22
333
10
610
17
3
121
21
9
85
4
211
14
4
51
1730
2
759
317
25
1
637
19
4141
9
1
2
P < 0.05
P < 0.005
ns
P < 0.005
ns
ns
P < 0.005
P < 0.005
P < 0.005
P < 0.005
P < 0.05
ns
Observed ÷ Expected Number of Fatalities

328
Figure 6-20. Multispecies associations between fatalities and wind turbine model, where n represents the number of fatalities observed and P is the probability of committing a Type I error in a χ2 test.
2.52.01.51.00.50
Turbine model
Micon 65
Bonus
Danwin
Flowind
Windmatic
Enertech
KCS-56
KVS-33
Micon 65
Bonus
Danwin
Flowind
Windmatic
Enertech
KCS-56
KVS-33
Micon 65
Bonus
Danwin
Flowind
Windmatic
Enertech
KCS-56
KVS-33
Valueexpected
by chance
Observed ÷ Expected Number of Fatalities
Hawks
Raptors
Allbirds
nP < 0.05
P < 0.005
P < 0.005
10
74
1
4
2
3
65
2
19
153
1
21
3
11
114
7
64
281
1
46
6
31
230
8

329
Figure 6-21. Species-specific associations between fatalities and rotor diameter, where n represents the number of fatalities observed and P is the probability of committing a Type I error in a χ2 test. “ns” represents not significant.
13.514.816.017.217.819.119.219.523.433.2
13.514.816.017.217.819.119.219.523.433.2
13.514.816.017.217.819.119.219.523.433.2
13.514.816.017.217.819.119.219.523.033.2
13.514.816.017.217.819.119.219.523.433.2
13.514.816.017.217.819.119.219.523.433.2
43210 876543210
Rotor diameter(m)
Goldeneagle
Red-tailedhawk
Americankestrel
Burrowingowl
Barnowl
Greathorned
owl
n n
Observed ÷ Expected Number of Fatalities
Mallard
Hornedlark
Westernmeadowlark
Housefinch
Europeanstarling
Rockdove
Valueexpected
by chance
Valueexpectedby chance
P < 0.005
P < 0.005P < 0.05
P < 0.005
ns
ns P < 0.005
P < 0.005
P < 0.005
P < 0.005
P < 0.005P < 0.005
21
14
634
6
38
102
267
2
1
2
95
3272
5311
29312
312
1161
2
9
1
2
83
111
32
5
141
31
7
172
59
237
1325
710
4167
142
22151
21
9
=12.7
= 9.5
13.514.816.017.217.819.119.219.523.433.2
13.514.816.017.217.819.119.219.523.433.2
13.514.816.017.217.819.119.219.523.433.2
13.514.816.017.217.819.119.219.523.033.2
13.514.816.017.217.819.119.219.523.433.2
13.514.816.017.217.819.119.219.523.433.2
43210 876543210
Rotor diameter(m)
Goldeneagle
Red-tailedhawk
Americankestrel
Burrowingowl
Barnowl
Greathorned
owl
n n
Observed ÷ Expected Number of Fatalities
Mallard
Hornedlark
Westernmeadowlark
Housefinch
Europeanstarling
Rockdove
Valueexpected
by chance
Valueexpectedby chance
P < 0.005
P < 0.005P < 0.05
P < 0.005
ns
ns P < 0.005
P < 0.005
P < 0.005
P < 0.005
P < 0.005P < 0.005
21
14
634
6
38
102
267
2
1
2
95
3272
5311
29312
312
1161
2
9
1
2
83
111
32
5
141
31
7
172
59
237
1325
710
4167
142
22151
21
9
=12.7
= 9.5
330
Figure 6-22. Multispecies associations between fatalities and rotor diameter, where n represents the number of fatalities observed and P is the probability of committing a Type I error in a χ2 test.
13.514.816.017.217.819.119.219.523.433.2
2.52.01.51.00.50
13.514.816.017.217.819.119.219.523.433.2
13.514.816.017.217.819.119.219.523.433.2
Rotor diameter(m)
Valueexpectedby chance
Observed ÷ Expected Number of Fatalities
Hawks
Raptors
Allbirds
nP < 0.005
P < 0.005
P < 0.005
32
103
6511
39352
113
1918
11431
95
587
316
6439
23071
183988
13.514.816.017.217.819.119.219.523.433.2
2.52.01.51.00.50
13.514.816.017.217.819.119.219.523.433.2
13.514.816.017.217.819.119.219.523.433.2
Rotor diameter(m)
Valueexpectedby chance
Observed ÷ Expected Number of Fatalities
Hawks
Raptors
Allbirds
nP < 0.005
P < 0.005
P < 0.005
32
103
6511
39352
113
1918
11431
95
587
316
6439
23071
183988

331
Figure 6-23. Species-specific associations between fatalities and blade tip speed, where n represents the number of fatalities observed and P is the probability of committing a Type I error in a χ2 test. “ns” represents not significant.
136.77146.42148.03149.64173.77180.21193.08194.69246.18
43210
136.77146.42148.03149.64173.77180.21193.08194.69246.18
136.77146.42148.03149.64173.77180.21193.08194.69246.18
136.77146.42148.03149.64173.77180.21193.08194.69246.18
136.77146.42148.03149.64173.77180.21193.08194.69246.18
136.77146.42148.03149.64173.77180.21193.08194.69246.18
876543210
=12.7
= 9.5
Goldeneagle
Red-tailedhawk
Americankestrel
Burrowingowl
Barnowl
Greathorned
owl
n n
Mallard
Hornedlark
Westernmeadowlark
Housefinch
Europeanstarling
Rockdove
Valueexpectedby chance
Tip speed(m/s)
P < 0.05P < 0.005
Observed ÷ Expected Number of Fatalities
Valueexpected
by chance
6
2341
14
22937
31231
53
26637
82
10
12246
15172
14
3571
4
1
12
9215
2
17
310
2
5
11
613
12
3282
31
11
1
2
9
237
177
2
59
9P < 0.005
P < 0.005
P < 0.005
P < 0.005
P < 0.005
P < 0.005
P < 0.005
P < 0.005
ns
ns136.77146.42148.03149.64173.77180.21193.08194.69246.18
43210
136.77146.42148.03149.64173.77180.21193.08194.69246.18
136.77146.42148.03149.64173.77180.21193.08194.69246.18
136.77146.42148.03149.64173.77180.21193.08194.69246.18
136.77146.42148.03149.64173.77180.21193.08194.69246.18
136.77146.42148.03149.64173.77180.21193.08194.69246.18
876543210
=12.7
= 9.5
Goldeneagle
Red-tailedhawk
Americankestrel
Burrowingowl
Barnowl
Greathorned
owl
n n
Mallard
Hornedlark
Westernmeadowlark
Housefinch
Europeanstarling
Rockdove
Valueexpectedby chance
Tip speed(m/s)
P < 0.05P < 0.005
Observed ÷ Expected Number of Fatalities
Valueexpected
by chance
6
2341
14
22937
31231
53
26637
82
10
12246
15172
14
3571
4
1
12
9215
2
17
310
2
5
11
613
12
3282
31
11
1
2
9
237
177
2
59
9P < 0.005
P < 0.005
P < 0.005
P < 0.005
P < 0.005
P < 0.005
P < 0.005
P < 0.005
ns
ns

332
Figure 6-24. Multispecies associations between fatalities and blade tip speed, where n represents the number of fatalities observed and P is the probability of committing a Type I error in a χ2 test.
136.77146.42148.03149.64173.77180.21193.08194.69246.18
2.52.01.51.00.50
136.77146.42148.03149.64173.77180.21193.08194.69246.18
136.77146.42148.03149.64173.77180.21193.08194.69246.18
Valueexpected
by chance
Observed ÷ Expected Number of Fatalities
Hawks
Raptors
Allbirds
nP < 0.005
P < 0.005
P < 0.005
Tip speed(m/s)
2
39
3
10
35
2
41
65
3
95
11
19
58
7
193
114
6
183
31
64
98
8
407
230
136.77146.42148.03149.64173.77180.21193.08194.69246.18
2.52.01.51.00.50
136.77146.42148.03149.64173.77180.21193.08194.69246.18
136.77146.42148.03149.64173.77180.21193.08194.69246.18
Valueexpected
by chance
Observed ÷ Expected Number of Fatalities
Hawks
Raptors
Allbirds
nP < 0.005
P < 0.005
P < 0.005
Tip speed(m/s)
2
39
3
10
35
2
41
65
3
95
11
19
58
7
193
114
6
183
31
64
98
8
407
230

333
Figure 6-25. Species-specific associations between fatalities and number of seconds between rotor sweeps at the edge of the rotor plane, where n represents the number of fatalities observed and P is the probability of committing a Type I error in a χ2 test. “ns” represents not significant.
0.2730.3440.3750.4030.4080.5020.5040.5080.5550.695
43210
0.2730.3440.3750.4030.4080.5020.5040.5080.5550.695
0.2730.3440.3750.4030.4080.5020.5040.5080.5550.695
0.2730.3440.3750.4030.4080.5020.5040.5080.5550.695
0.2730.3440.3750.4030.4080.5020.5040.5080.5550.695
0.2730.3440.3750.4030.4080.5020.5040.5080.5550.695
876543210
Seconds per rotorsweep at blade tip
Goldeneagle
Red-tailedhawk
Americankestrel
Burrowingowl
Barnowl
Greathorned
owl
n n
Mallard
Hornedlark
Westernmeadowlark
Housefinch
Europeanstarling
Rockdove
Valueexpected
by chance
Valueexpectedby chance
P < 0.05 P < 0.005
Observed ÷ Expected Number of Fatalities
P < 0.005 P < 0.005
P < 0.005P < 0.005 533172
292
3112
2
9
1
22
1
9
5
5
3172
10
14
2
613
4
144
61
227
1521
106
3
26872
15
1
341
12
2
1136
1
112
8
3321
92
2
1
597
17
2327
P < 0.005
ns
ns
P < 0.005
P < 0.005
P < 0.0050.2730.3440.3750.4030.4080.5020.5040.5080.5550.695
43210
0.2730.3440.3750.4030.4080.5020.5040.5080.5550.695
0.2730.3440.3750.4030.4080.5020.5040.5080.5550.695
0.2730.3440.3750.4030.4080.5020.5040.5080.5550.695
0.2730.3440.3750.4030.4080.5020.5040.5080.5550.695
0.2730.3440.3750.4030.4080.5020.5040.5080.5550.695
876543210
Seconds per rotorsweep at blade tip
Goldeneagle
Red-tailedhawk
Americankestrel
Burrowingowl
Barnowl
Greathorned
owl
n n
Mallard
Hornedlark
Westernmeadowlark
Housefinch
Europeanstarling
Rockdove
Valueexpected
by chance
Valueexpectedby chance
P < 0.05 P < 0.005
Observed ÷ Expected Number of Fatalities
P < 0.005 P < 0.005
P < 0.005P < 0.005 533172
292
3112
2
9
1
22
1
9
5
5
3172
10
14
2
613
4
144
61
227
1521
106
3
26872
15
1
341
12
2
1136
1
112
8
3321
92
2
1
597
17
2327
P < 0.005
ns
ns
P < 0.005
P < 0.005
P < 0.005

334
Figure 6-26. Multispecies associations between fatalities and number of seconds between rotor sweeps at the edge of the rotor plane, where n represents the number of fatalities observed and P is the probability of committing a Type I error in a χ2 test.
2.52.01.51.00.50
Seconds per rotorsweep at blade tip
0.2730.3440.3750.4030.4080.5020.5040.5080.5550.695
0.2730.3440.3750.4030.4080.5020.5040.5080.5550.695
0.2730.3440.3750.4030.4080.5020.5040.5080.5550.695
Valueexpectedby chance
Observed ÷ Expected Number of Fatalities
Hawks
Raptors
Allbirds
nP < 0.005
P < 0.005
P < 0.005
3
110
2393
3512
11411
193
951858
37
230311
646
183399878
65

335
Figure 6-27. Species-specific associations between fatalities and the area in the rotor plane that is swept per second, where n represents the number of fatalities observed and P is the probability of committing a Type I error in a χ2 test. “ns” represents not significant.
416422461499516595772847913
1246
416422461499516595772847913
1246
416422461499516595772847913
1246
416422461499516595772847913
1246
416422461499516595772847913
1246
416422461499516595772847913
1246
3210
=12.7
876543210
= 9.5
Goldeneagle
Red-tailedhawk
Americankestrel
Burrowingowl
Barnowl
Greathorned
owl
n n
Mallard
Hornedlark
Westernmeadowlark
Housefinch
Europeanstarling
Rockdove
Valueexpectedby chance
Valueexpectedby chance
Area in rotor planeswept per second
(m2 · s-1)
12
6
3144
6
832
26
710
2
1
5
92
32271
291
31532
3
11
6121
2
1
9
2
3813
211
5
41
3
11
7
217
23
759
123
7
109
41762
22
15141
19
2
P < 0.05
P < 0.005
P < 0.005
P < 0.005
ns
ns
P < 0.005
P < 0.005
P < 0.005
P < 0.005
P < 0.005
P < 0.005
Observed ÷ Expected Number of Fatalities
416422461499516595772847913
1246
416422461499516595772847913
1246
416422461499516595772847913
1246
416422461499516595772847913
1246
416422461499516595772847913
1246
416422461499516595772847913
1246
3210
=12.7
876543210
= 9.5
Goldeneagle
Red-tailedhawk
Americankestrel
Burrowingowl
Barnowl
Greathorned
owl
n n
Mallard
Hornedlark
Westernmeadowlark
Housefinch
Europeanstarling
Rockdove
Valueexpectedby chance
Valueexpectedby chance
Area in rotor planeswept per second
(m2 · s-1)
12
6
3144
6
832
26
710
2
1
5
92
32271
291
31532
3
11
6121
2
1
9
2
3813
211
5
41
3
11
7
217
23
759
123
7
109
41762
22
15141
19
2
P < 0.05
P < 0.005
P < 0.005
P < 0.005
ns
ns
P < 0.005
P < 0.005
P < 0.005
P < 0.005
P < 0.005
P < 0.005
Observed ÷ Expected Number of Fatalities

336
Figure 6-28. Multispecies associations between fatalities and the area in the rotor plane that is swept per second, where n represents the number of fatalities observed and P is the probability of committing a Type I error in a χ2 test.
416422461499516595772847913
1246
2.52.01.51.00.50
416422461499516595772847913
1246
416422461499516595772847913
1246
P < 0.005
Valueexpectedby chance
Observed ÷ Expected Number of Fatalities
Hawks
Raptors
Allbirds
P < 0.005
P < 0.005
nArea in rotor planeswept per second
(m2 · s-1) 3
23
101
391
35652
113
18193
951
58114
7
316
39647
1831
98230
8
416422461499516595772847913
1246
2.52.01.51.00.50
416422461499516595772847913
1246
416422461499516595772847913
1246
P < 0.005
Valueexpectedby chance
Observed ÷ Expected Number of Fatalities
Hawks
Raptors
Allbirds
P < 0.005
P < 0.005
nArea in rotor planeswept per second
(m2 · s-1) 3
23
101
391
35652
113
18193
951
58114
7
316
39647
1831
98230
8

337
Figure 6-29. Species-specific associations between fatalities and orientation of rotor blades, where n represents the number of fatalities observed and P is the probability of committing a Type I error in a χ2 test. “ns” represents not significant.
1.51.00.50 1.51.00.50
Orientation ofrotor blades
Toward wind
Away from wind
Toward wind
Away from wind
Toward wind
Away from wind
Toward wind
Away from wind
Toward wind
Away from wind
Toward wind
Away from wind
Goldeneagle
Red-tailedhawk
Americankestrel
Burrowingowl
Barnowl
Greathorned
owl
n n
Mallard
Hornedlark
Westernmeadowlark
Housefinch
Europeanstarling
Rockdove
Valueexpected
by chance
Valueexpected
by chance0.10 > P > 0.05
P < 0.005
P < 0.05
ns
P < 0.05
ns
ns
P < 0.005
P < 0.005
ns
P < 0.05
P < 0.05
15
4
101
27
18
11
37
15
24
6
6
6
22
4
10
1
51
12
5
6
17
9
90
23
Observed ÷ Expected Number of Fatalities1.51.00.50 1.51.00.50
Orientation ofrotor blades
Toward wind
Away from wind
Toward wind
Away from wind
Toward wind
Away from wind
Toward wind
Away from wind
Toward wind
Away from wind
Toward wind
Away from wind
Goldeneagle
Red-tailedhawk
Americankestrel
Burrowingowl
Barnowl
Greathorned
owl
n n
Mallard
Hornedlark
Westernmeadowlark
Housefinch
Europeanstarling
Rockdove
Valueexpected
by chance
Valueexpected
by chance0.10 > P > 0.05
P < 0.005
P < 0.05
ns
P < 0.05
ns
ns
P < 0.005
P < 0.005
ns
P < 0.05
P < 0.05
15
4
101
27
18
11
37
15
24
6
6
6
22
4
10
1
51
12
5
6
17
9
90
23
Observed ÷ Expected Number of Fatalities

338
Figure 6-30. Multispecies associations between fatalities and orientation of rotor blades, where n represents the number of fatalities observed and P is the probability of committing a Type I error in a χ2 test.
1.51.00.50
Orientation ofrotor blades
Toward wind
Away from wind
Toward wind
Away from wind
Toward wind
Away from wind
Valueexpected
by chance
Observed ÷ Expected Number of Fatalities
Hawks
Raptors
Allbirds
nP < 0.05
P < 0.005
P < 0.005
125
32
232
76
467
154
1.51.00.50
Orientation ofrotor blades
Toward wind
Away from wind
Toward wind
Away from wind
Toward wind
Away from wind
Valueexpected
by chance
Observed ÷ Expected Number of Fatalities
Hawks
Raptors
Allbirds
nP < 0.05
P < 0.005
P < 0.005
125
32
232
76
467
154

339
Figure 6-31. Species-specific associations between fatalities and tower type, where n represents the number of fatalities observed and P is the probability of committing a Type I error in a χ2 test. “ns” represents not significant.
2.52.01.51.00.50 3.53.02.52.01.51.00.50
Tower typeVertical
axis
Tubular
Lattice
Verticalaxis
Tubular
Lattice
Verticalaxis
Tubular
Lattice
Verticalaxis
Tubular
Lattice
Verticalaxis
Tubular
Lattice
Verticalaxis
Tubular
Lattice
Goldeneagle
Red-tailedhawk
Americankestrel
Burrowingowl
Barnowl
Greathorned
owl
n n
Mallard
Hornedlark
Westernmeadowlark
Housefinch
Europeanstarling
Rockdove
Valueexpected
by chance
Valueexpectedby chance
1
11
18
10
36
16
15
4
3
68
60
3
17
13
3
9
4
13
13
4
5
6
2
47
66
2
20
6
9
43
20
1
9
2
P < 0.005
P < 0.05
P < 0.005
ns
ns
ns
ns
0.10 > P > 0.05
P < 0.005
P < 0.05
P < 0.05
P < 0.005
Observed ÷ Expected Number of Fatalities

340
Figure 6-32. Multispecies associations between fatalities and tower type, where n represents the number of fatalities observed and P is the probability of committing a Type I error in a χ2 test.
1.51.00.50
Verticalaxis
Tubular
Lattice
Verticalaxis
Tubular
Lattice
Verticalaxis
Tubular
Lattice
Valueexpected
by chance
Observed ÷ Expected Number of Fatalities
Hawks
Raptors
Allbirds
nTower type
4
85
72
21
173
135
46
346
275
P < 0.005
P < 0.005
P < 0.005
1.51.00.50
Verticalaxis
Tubular
Lattice
Verticalaxis
Tubular
Lattice
Verticalaxis
Tubular
Lattice
Valueexpected
by chance
Observed ÷ Expected Number of Fatalities
Hawks
Raptors
Allbirds
nTower type
4
85
72
21
173
135
46
346
275
P < 0.005
P < 0.005
P < 0.005

341
Figure 6-33. Species-specific associations between fatalities and tower height, where n represents the number of fatalities observed and P is the probability of committing a Type I error in a χ2 test. “ns” represents not significant.
14.018.524.024.625.243.1
14.018.524.024.625.243.1
14.018.524.024.625.243.1
14.018.524.024.625.243.1
14.018.524.024.625.243.1
14.018.524.024.625.243.1
43210 543210
Goldeneagle
Red-tailedhawk
Americankestrel
Burrowingowl
Barnowl
Greathorned
owl
n n
Mallard
Hornedlark
Westernmeadowlark
Housefinch
Europeanstarling
Rockdove
Valueexpected
by chance
Valueexpected
by chance
Tower height (m) ofhorizontal axis
turbines
17
18
3
15
30
7
4
10
5
3
261
6631
1
5
19
6
16
5
1
9
142
6
4
1
7
22
76
71
5
11
10
2
12
34
15
1
10
Observed ÷ Expected Number of Fatalities
P < 0.05
P < 0.005
P < 0.005
P < 0.005
P < 0.005
0.10 > P > 0.05
0.10 > P > 0.05
ns
ns
ns
P < 0.05
ns
14.018.524.024.625.243.1
14.018.524.024.625.243.1
14.018.524.024.625.243.1
14.018.524.024.625.243.1
14.018.524.024.625.243.1
14.018.524.024.625.243.1
43210 543210
Goldeneagle
Red-tailedhawk
Americankestrel
Burrowingowl
Barnowl
Greathorned
owl
n n
Mallard
Hornedlark
Westernmeadowlark
Housefinch
Europeanstarling
Rockdove
Valueexpected
by chance
Valueexpected
by chance
Tower height (m) ofhorizontal axis
turbines
17
18
3
15
30
7
4
10
5
3
261
6631
1
5
19
6
16
5
1
9
142
6
4
1
7
22
76
71
5
11
10
2
12
34
15
1
10
Observed ÷ Expected Number of Fatalities
P < 0.05
P < 0.005
P < 0.005
P < 0.005
P < 0.005
0.10 > P > 0.05
0.10 > P > 0.05
ns
ns
ns
P < 0.05
ns

342
Figure 6-34. Multispecies associations between fatalities and tower height, where n represents the number of fatalities observed and P is the probability of committing a Type I error in a χ2 test.
14.0
18.5
24.0
24.6
25.2
43.1
3.53.02.52.01.51.00.50
14.0
18.5
24.0
24.6
25.2
43.1
14.0
18.5
24.0
24.6
25.2
43.1
P < 0.005
Valueexpected
by chance
Observed ÷ Expected Number of Fatalities
Hawks
Raptors
Allbirds
P < 0.005
P < 0.005
n
4
31
1
85
35
1
6
69
1
171
58
3
16
149
1
354
98
3
Tower height (m) of horizontal axis turbines
14.0
18.5
24.0
24.6
25.2
43.1
3.53.02.52.01.51.00.50
14.0
18.5
24.0
24.6
25.2
43.1
14.0
18.5
24.0
24.6
25.2
43.1
P < 0.005
Valueexpected
by chance
Observed ÷ Expected Number of Fatalities
Hawks
Raptors
Allbirds
P < 0.005
P < 0.005
n
4
31
1
85
35
1
6
69
1
171
58
3
16
149
1
354
98
3
Tower height (m) of horizontal axis turbines

343
Figure 6-35. Species-specific associations between fatalities and physical relief at the wind turbine, where n represents the number of fatalities observed and P is the probability of committing a Type I error in a χ2 test. “ns” represents not significant.
43210 543210
PeakPlateau
Ridge crestRidgeline
SlopeSaddleRavine
= 7.7
PeakPlateau
Ridge crestRidgeline
SlopeSaddleRavine
PeakPlateau
Ridge crestRidgeline
SlopeSaddleRavine
PeakPlateau
Ridge crestRidgeline
SlopeSaddleRavine
PeakPlateau
Ridge crestRidgeline
SlopeSaddleRavine
PeakPlateau
Ridge crestRidgeline
SlopeSaddleRavine
Goldeneagle
Red-tailedhawk
Americankestrel
Burrowingowl
Barnowl
Greathorned
owl
n n
Mallard
Hornedlark
Westernmeadowlark
Housefinch
Europeanstarling
Rockdove
Valueexpected
by chancePhysical
relief0.10 > P > 0.05
Observed ÷ Expected Number of Fatalities
Valueexpectedby chance
P < 0.005
ns
P < 0.05ns
ns
ns
ns
ns
ns
ns ns
115
12
510
121
25
50
49
525
215283
29
248
27
2
4205
3011
14
10
2116
131
210
153
5214
113341044112
14
101

344
Figure 6-36. Multispecies associations between fatalities and physical relief at the wind turbine, where n represents the number of fatalities observed and P is the probability of committing a Type I error in a χ2 test. “ns” represents not significant.
2.01.51.00.50
Physicalrelief
Valueexpected
by chance
Observed ÷ Expected Number of Fatalities
Hawks
Raptors
Allbirds
nns
P < 0.005
ns
Peak
Plateau
Ridge crest
Ridgeline
Slope
Saddle
Ravine
Peak
Plateau
Ridge crest
Ridgeline
Slope
Saddle
Ravine
Peak
Plateau
Ridge crest
Ridgeline
Slope
Saddle
Ravine
2
7
61
17
61
12
1
3
21
119
32
131
20
2
6
64
226
55
273
35
7

345
Figure 6-37. Species-specific associations between fatalities and whether the wind turbine was in a canyon, where n represents the number of fatalities observed and P is the probability of committing a Type I error in a χ2 test. “ns” represents not significant.
3.53.02.52.01.51.00.50 3.02.52.01.51.00.50
Out ofcanyon
In canyon
Out ofcanyon
In canyon
Out ofcanyon
In canyon
Out ofcanyon
In canyon
Out ofcanyon
In canyon
Out ofcanyon
In canyon
Whether incanyon
Goldeneagle
Red-tailedhawk
Americankestrel
Burrowingowl
Barnowl
Greathorned
owl
n n
Mallard
Hornedlark
Westernmeadowlark
Housefinch
Europeanstarling
Rockdove
Valueexpected
by chance
Valueexpectedby chance
P < 0.005
P < 0.005
P < 0.005
ns
ns
ns ns
ns
ns
ns
P < 0.005
P < 0.005
26
4
47
15
8
11
94
37
18
15
11
1
23
7
12
3
98
17
15
13
44
28
11
1
Observed ÷ Expected Number of Fatalities

346
Figure 6-38. Multispecies associations between fatalities and whether the wind turbine was in a canyon, where n represents the number of fatalities observed and P is the probability of committing a Type I error in a χ2 test.
2.0 1.51.00.50
Out of canyon
In canyon
Whether incanyon
Out of canyon
In canyon
Out of canyon
In canyon
Valueexpectedby chance
Observed ÷ Expected Number of Fatalities
Hawks
Raptors
All birds
n P < 0.005
P < 0.005
P < 0.005
118
43
236
93
492
175
1.51.00.50
Out of canyon
In canyon
Whether incanyon
Out of canyon
In canyon
Out of canyon
In canyon
Valueexpectedby chance
÷
Hawks
Raptors
All birds
n P < 0.005
P < 0.005
P < 0.005
118
43
236
93
492
175

347
Figure 6-39. Associations between golden eagle, red-tailed hawk, American kestrel, and burrowing owl fatalities and elevation, where lighter bars indicate expected cell values of <5 and are therefore of less reliability. “ns” denotes χ2 tests that were not significant, and no notation represents χ2 tests that were significant, P < 0.05.
3.5 3.0 2.5 2.0 1.5 1.0 0.5 0
85 - 135 m 136 - 185 m 186 - 235 m 236 - 285 m 286 - 335 m 336 - 385 m 386 - 535 m 85 - 135 m
136 - 185 m 186 - 235 m 236 - 285 m 286 - 335 m 336 - 385 m 386 - 535 m 85 - 135 m
136 -
3.5 3.0 2.5 2.0 1.5 1.0 0.5 0
85 - 135 m 136 - 185 m 186 - 235 m 236 - 285 m 286 - 335 m 336 - 385 m 386 - 535 m 85 - 135 m
136 - 185 m 186 - 235 m 236 - 285 m 286 - 335 m 336 - 385 m 386 - 535 m 85 - 135 m
136 - 185 m 186 - 235 m 236 - 285 m 286 - 335 m 336 - 385 m 386 - 535 m 85 - 135 m
136 - 185 m 186 - 235 m 236 - 285 m 286 - 335 m 336 - 385 m 386 - 535 m
Observed ÷ Expected Number of Fatalities
Golden eagle
Red - tailed hawk
American kestrel
Burrowing owl
Elevation Value by chance
ns
0.10 > P > 0.05

348
Figure 6-40. Associations between barn owl, great horned owl, mallard, and California horned lark fatalities and elevation, where lighter bars indicate expected cell values of <5 and are therefore of less reliability. “ns” denotes χ2 tests that were not significant, and no notation represents χ2 tests that were significant, P < 0.05.
3.53.02.52.01.51.00.50
85-135 m136-185 m186-235 m236-285 m286-335 m336-385 m386-535 m85-135 m
136-185 m186-235 m236-285 m286-335 m336-385 m386-535 m85-135 m
136-185 m186-235 m236-285 m286-335 m336-385 m386-535 m85-135 m
136-185 m186-235 m236-285 m286-335 m336-385 m386-535 m
Observed ÷ Expected Number of Fatalities
Barnowl
Greathorned
owl
Mallard
Hornedlark
Elevation Value expectedby chance
ns
ns
349
Figure 6-41. Associations between western meadowlark, house finch, European starling, and rock dove fatalities and elevation, where lighter bars indicate expected cell values of <5 and are therefore of less reliability. All tests were significant, P < 0.05.
85-135 m136-185 m186-235 m236-285 m286-335 m336-385 m386-535 m85-135 m
136-185 m186-235 m236-285 m286-335 m336-385 m386-535 m85-135 m
136-185 m186-235 m236-285 m286-335 m336-385 m386-535 m85-135 m
136-185 m186-235 m236-285 m286-335 m336-385 m386-535 m
3.53.02.52.01.51.00.50Observed ÷ Expected Number of Fatalities
Westernmeadowlark
Housefinch
Europeanstarling
Rockdove
Elevation Value expectedby chance

350
Figure 6-42. Associations between all hawks, all raptors, and all bird fatalities and elevation, where lighter bars indicate expected cell values of <5 and are therefore of less reliability. All tests were significant, P < 0.05.
85-135 m
136-185 m
186-235 m
236-285 m
286-335 m
336-385 m
386-535 m
85-135 m
136-185 m
186-235 m
236-285 m
286-335 m
336-385 m
386-535 m
85-135 m
136-185 m
186-235 m
236-285 m
286-335 m
336-385 m
386-535 m
1.51.00.50Observed ÷ Expected Number of Fatalities
Hawks
Raptors
Allbirds
Elevation Value expectedby chance
85-135 m
136-185 m
186-235 m
236-285 m
286-335 m
336-385 m
386-535 m
85-135 m
136-185 m
186-235 m
236-285 m
286-335 m
336-385 m
386-535 m
85-135 m
136-185 m
186-235 m
236-285 m
286-335 m
336-385 m
386-535 m
1.51.00.50Observed ÷ Expected Number of Fatalities
Hawks
Raptors
Allbirds
Elevation Value expectedby chance

351
Figure 6-43. Associations between raptor fatalities and slope grade, where lighter bars indicate expected cell values of <5 and are therefore of less reliability. “ns” denotes χ2 tests that were not significant, and no notation represents χ2 tests that were significant, P < 0.05.
0-11-22-4>40-11-22-4>40-11-22-4>40-11-22-4>40-11-22-4>40-11-22-4>4
2.52.01.51.00.50
Slope grade(m/turbine)
Goldeneagle
Red-tailedhawk
Americankestrel
Burrowingowl
Barnowl
Greathorned
owl
Value expectedby chance
0.10 > P > 0.05
0.10 > P > 0.05
0.10 > P > 0.05
ns
ns
ns
0-11-22-4>40-11-22-4>40-11-22-4>40-11-22-4>40-11-22-4>40-11-22-4>4
2.52.01.51.00.50
Slope grade(m/turbine)
Goldeneagle
Red-tailedhawk
Americankestrel
Burrowingowl
Barnowl
Greathorned
owl
Value expectedby chance
0.10 > P > 0.05
0.10 > P > 0.05
0.10 > P > 0.05
ns
ns
ns
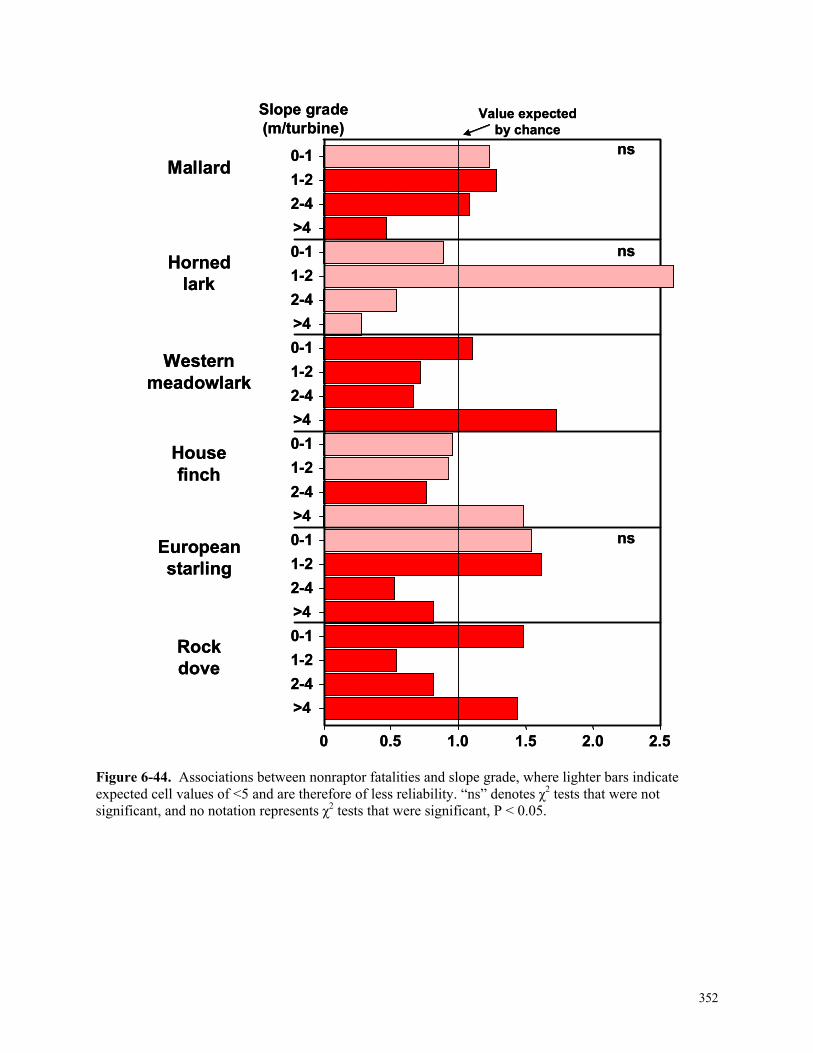
352
Figure 6-44. Associations between nonraptor fatalities and slope grade, where lighter bars indicate expected cell values of <5 and are therefore of less reliability. “ns” denotes χ2 tests that were not significant, and no notation represents χ2 tests that were significant, P < 0.05.
2.52.01.51.00.50
Slope grade(m/turbine)
0-11-22-4>40-11-22-4>40-11-22-4>40-11-22-4>40-11-22-4>40-11-22-4>4
Mallard
Hornedlark
Westernmeadowlark
Housefinch
Europeanstarling
Rockdove
Value expectedby chance
ns
ns
ns
2.52.01.51.00.50
Slope grade(m/turbine)
0-11-22-4>40-11-22-4>40-11-22-4>40-11-22-4>40-11-22-4>40-11-22-4>4
Mallard
Hornedlark
Westernmeadowlark
Housefinch
Europeanstarling
Rockdove
Value expectedby chance
ns
ns
ns

353
Figure 6-45. Associations between all hawks, all raptors, and all bird fatalities and slope grade, where lighter bars indicate expected cell values of <5 and are therefore of less reliability. “ns” denotes χ2 tests that were not significant, and no notation represents χ2 tests that were significant, P < 0.05.
0-1
1-2
2-4
>4
0-1
1-2
2-4
>4
0-1
1-2
2-4
>4
1.51.00.50
Slope grade(m/turbine)
Hawks
Raptors
Allbirds
Value expectedby chance
ns0-1
1-2
2-4
>4
0-1
1-2
2-4
>4
0-1
1-2
2-4
>4
1.51.00.50
Slope grade(m/turbine)
Hawks
Raptors
Allbirds
Value expectedby chance
ns

354
Figure 6-46. Species-specific associations between fatalities and number of rock piles nearby, where n represents the number of fatalities observed and P is the probability of committing a Type I error in a χ2 test. “ns” represents not significant.

355
Figure 6-47. Multispecies associations between fatalities and number of rock piles nearby, where n represents the number of fatalities observed and P is the probability of committing a Type I error in a χ2 test.

356
Figure 6-48. Species-specific associations between fatalities and the wind turbine’s position in the string, where n represents the number of fatalities observed and P is the probability of committing a Type I error in a χ2 test. “ns” represents not significant.
2.01.51.00.50 3.02.52.01.51.00.50
End
Position instring
Interior
Gap
End
Interior
Gap
End
Interior
Gap
End
Interior
Gap
End
Interior
Gap
End
Interior
Gap
Goldeneagle
Red-tailedhawk
Americankestrel
Burrowingowl
Barnowl
Greathorned
owl
n n
Mallard
Hornedlark
Westernmeadowlark
Housefinch
Europeanstarling
Rockdove
Valueexpectedby chance
Valueexpected
by chance
8
18
4
29
25
7
8
8
3
38
76
17
10
18
4
3
8
1
6
21
3
6
7
2
17
90
8
8
10
9
25
36
9
4
4
4
0.10 > P > 0.05
ns
ns
P < 0.005
ns
ns P < 0.05
ns
ns
P < 0.05
P < 0.005
P < 0.05
Observed ÷ Expected Number of Fatalities

357
Figure 6-49. Multispecies associations between fatalities and the wind turbine’s position in the string, where n represents the number of fatalities observed and P is the probability of committing a Type I error in a χ2 test.
1.51.00.50
End
Interior
Gap
End
Interior
Gap
End
Interior
Gap
Valueexpected
by chance
Observed ÷ Expected Number of Fatalities
Hawks
Raptors
Allbirds
nP < 0.05
P < 0.005
P < 0.005
49
92
20
110
176
41
203
380
79
Position instring
1.51.00.50
End
Interior
Gap
End
Interior
Gap
End
Interior
Gap
Valueexpected
by chance
Observed ÷ Expected Number of Fatalities
Hawks
Raptors
Allbirds
nP < 0.05
P < 0.005
P < 0.005
49
92
20
110
176
41
203
380
79
Position instring

358
Figure 6-50. Species-specific associations between fatalities and the wind turbine’s position in the wind farm, where n represents the number of fatalities observed and P is the probability of committing a Type I error in a χ2 test. “ns” represents not significant.
32102.52.01.51.00.50
Farm edge
Local edge
Interior
Position inwind farm
Farm edge
Local edge
Interior
Farm edge
Local edge
Interior
Farm edge
Local edge
Interior
Farm edge
Local edge
Interior
Farm edge
Local edge
Interior
Goldeneagle
Red-tailedhawk
Americankestrel
Burrowingowl
Barnowl
Greathorned
owl
n n
Mallard
Hornedlark
Westernmeadowlark
Housefinch
Europeanstarling
Rockdove
Valueexpected
by chance
Valueexpectedby chance
P < 0.05
0.10 > P > 0.05
P < 0.05
P < 0.005ns
ns
ns
nsns
ns ns
ns
5
3
22
3
4
55
12
14
93
1
14
2
17
3
4
21
1
11
1
6
26
4
3
23
5
7
60
1
1
10
10
26
79
Observed ÷ Expected Number of Fatalities32102.52.01.51.00.50
Farm edge
Local edge
Interior
Position inwind farm
Farm edge
Local edge
Interior
Farm edge
Local edge
Interior
Farm edge
Local edge
Interior
Farm edge
Local edge
Interior
Farm edge
Local edge
Interior
Goldeneagle
Red-tailedhawk
Americankestrel
Burrowingowl
Barnowl
Greathorned
owl
n n
Mallard
Hornedlark
Westernmeadowlark
Housefinch
Europeanstarling
Rockdove
Valueexpected
by chance
Valueexpectedby chance
P < 0.05
0.10 > P > 0.05
P < 0.05
P < 0.005ns
ns
ns
nsns
ns ns
ns
5
3
22
3
4
55
12
14
93
1
14
2
17
3
4
21
1
11
1
6
26
4
3
23
5
7
60
1
1
10
10
26
79
Observed ÷ Expected Number of Fatalities

359
Figure 6-51. Multispecies associations between fatalities and the wind turbine’s position in the wind farm, where n represents the number of fatalities observed and P is the probability of committing a Type I error in a χ2 test.
2.52.01.51.00.50
Position inwind farm
Farm edge
Local edge
Interior
Farm edge
Local edge
Interior
Farm edge
Local edge
Interior
Valueexpectedby chance
Observed ÷ Expected Number of Fatalities
Hawks
Raptors
Allbirds
nP < 0.005
P < 0.005
P < 0.005
15
27
117
26
44
257
55
93
517
2.52.01.51.00.50
Position inwind farm
Farm edge
Local edge
Interior
Farm edge
Local edge
Interior
Farm edge
Local edge
Interior
Valueexpectedby chance
Observed ÷ Expected Number of Fatalities
Hawks
Raptors
Allbirds
nP < 0.005
P < 0.005
P < 0.005
15
27
117
26
44
257
55
93
517
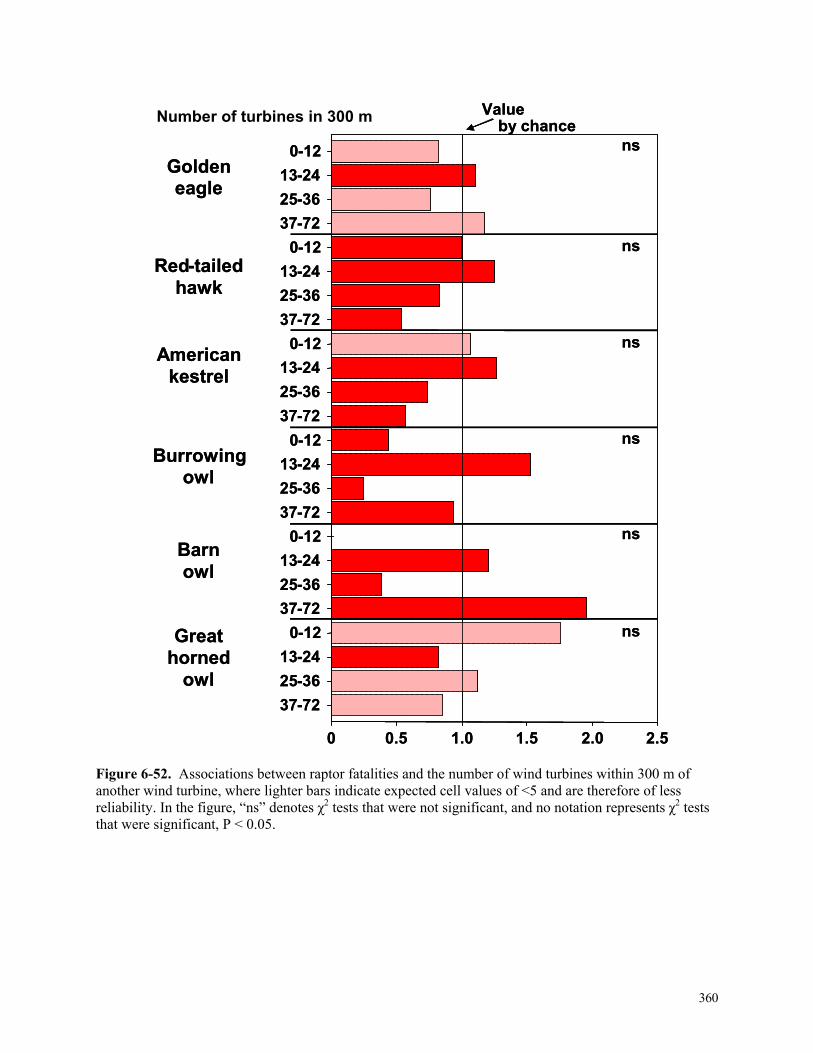
360
Figure 6-52. Associations between raptor fatalities and the number of wind turbines within 300 m of another wind turbine, where lighter bars indicate expected cell values of <5 and are therefore of less reliability. In the figure, “ns” denotes χ2 tests that were not significant, and no notation represents χ2 tests that were significant, P < 0.05.
0 - 12 13 - 24 25 - 36 37 - 72
0 - 12 13 - 24 25 - 36 37 - 72
0 - 12 13 - 24 25 - 36 37 - 72
0 - 12 13 - 24 25 - 36 37 - 72
0 - 12 13 - 24 25 - 36 37 - 72
0 - 12 13 - 24 25 - 36 37 - 72
2.52.0 1.5 1.0 0.5 0
Number of turbines in 300 m
Golden eagle
Red - tailed hawk
American kestrel
Burrowing owl
Barn owl
Great horned
owl
Value by chance
ns
ns
ns
ns
ns
ns
0 - 12 13 - 24 25 - 36 37 - 72
0 - 12 13 - 24 25 - 36 37 - 72
0 - 12 13 - 24 25 - 36 37 - 72
0 - 12 13 - 24 25 - 36 37 - 72
0 - 12 13 - 24 25 - 36 37 - 72
0 - 12 13 - 24 25 - 36 37 - 72
2.52.0 1.5 1.0 0.5 0
Golden eagle
Red - tailed hawk
American kestrel
Burrowing owl
Barn owl
Great horned
owl
Value by chance
ns
ns
ns
ns
ns
ns

361
Figure 6-53. Associations between nonraptor fatalities and the number of wind turbines within 300 m of another wind turbine, where lighter bars indicate expected cell values of <5 and are therefore of less reliability. In the figure, “ns” denotes χ2 tests that were not significant, and no notation represents χ2 tests that were significant, P < 0.05.
2.52.0 1.5 1.0 0.5 0
Number of turbines in 300 m
0 - 12 13 - 24 25 - 36 37 - 72
0 - 12 13 - 24 25 - 36 37 - 72
0 - 12 13 - 24 25 - 36 37 - 72
0 - 12 13 - 24 25 - 36 37 - 72
0 - 12 13 - 24 25 - 36 37 - 72
0 - 12 13 - 24 25 - 36 37 - 72
Mallard
Horned lark
Western meadowlark
House finch
European starling
Rock dove
Value by chance
ns
ns
ns
0.10 > P > 0.05
2.52.0 1.5 1.0 0.5 0
0 - 12 13 - 24 25 - 36 37 - 72
0 - 12 13 - 24 25 - 36 37 - 72
0 - 12 13 - 24 25 - 36 37 - 72
0 - 12 13 - 24 25 - 36 37 - 72
0 - 12 13 - 24 25 - 36 37 - 72
0 - 12 13 - 24 25 - 36 37 - 72
Mallard
Horned lark
Western meadowlark
House finch
European starling
Rock dove
Value by chance
ns
ns
ns
0.10 > P > 0.05

362
Figure 6-54. Multispecies associations between fatalities and the number of wind turbines within 300 m of another wind turbine. “ns” denotes χ2 tests that were not significant, and no notation represents χ2 tests that were significant, P < 0.05.
0 - 12
13 - 24
25 - 36
37 - 72
0 - 12
13 - 24
25 - 36
37 - 72
0 - 12
13 - 24
25 - 36
37 - 72
2.01.5 1.0 0.5 0
Number of turbines in 300 m
Hawks
Raptors
All birds
Value by chance
ns
ns
0 - 12
13 - 24
25 - 36
37 - 72
0 - 12
13 - 24
25 - 36
37 - 72
0 - 12
13 - 24
25 - 36
37 - 72
2.01.5 1.0 0.5 0
Hawks
Raptors
All birds
Value by chance
ns
ns

363
Figure 6-55. Species-specific associations between fatalities and owners of the wind turbines, where n represents the number of fatalities observed and P is the probability of committing a Type I error in a χ2 test. “ns” represents not significant.
AWP
EnXco
Enron
AICSeawest
210
14Goldeneagle
Red-tailedhawk
Americankestrel
2
3
10
59
26
24
12
1
9
7
11
2
Burrowingowl
Barnowl
Greathorned
owl
1
42
1
9
9
6
6
18
3
2
6
3
1
AWP
EnXco
Enron
AIC
Seawest
AWP
EnXco
Enron
AIC
Seawest
AWP
EnXco
Enron
AIC
Seawest
AWP
EnXco
Enron
AIC
Seawest
AWPEnXco
Enron
AIC
Seawest
nP < 0.005
ns
0.05 < P < 0.10
0.05 < P < 0.10
P < 0.005
ns
43210
Mallard
Hornedlark
Westernmeadowlark
Housefinch
Europeanstarling
Rockdove
19
1
4
4
2
8
1
1
3
45
5
8
11
8
1
6
3
7
3
7
10
4
31
40
16
24
P < 0.005
P < 0.005
P < 0.005
P < 0.005
P < 0.005
ns
n
Valueexpected
by chance
Valueexpectedby chanceCompany
Observed ÷ Expected Number of Fatalities
AWP
EnXco
Enron
AICSeawest
210
14Goldeneagle
Red-tailedhawk
Americankestrel
2
3
10
59
26
24
12
1
9
7
11
2
Burrowingowl
Barnowl
Greathorned
owl
1
42
1
9
9
6
6
18
3
2
6
3
1
AWP
EnXco
Enron
AIC
Seawest
AWP
EnXco
Enron
AIC
Seawest
AWP
EnXco
Enron
AIC
Seawest
AWP
EnXco
Enron
AIC
Seawest
AWPEnXco
Enron
AIC
Seawest
nP < 0.005
ns
0.05 < P < 0.10
0.05 < P < 0.10
P < 0.005
ns
43210
Mallard
Hornedlark
Westernmeadowlark
Housefinch
Europeanstarling
Rockdove
19
1
4
4
2
8
1
1
3
45
5
8
11
8
1
6
3
7
3
7
10
4
31
40
16
24
P < 0.005
P < 0.005
P < 0.005
P < 0.005
P < 0.005
ns
n
Valueexpected
by chance
Valueexpectedby chanceCompany
Observed ÷ Expected Number of Fatalities
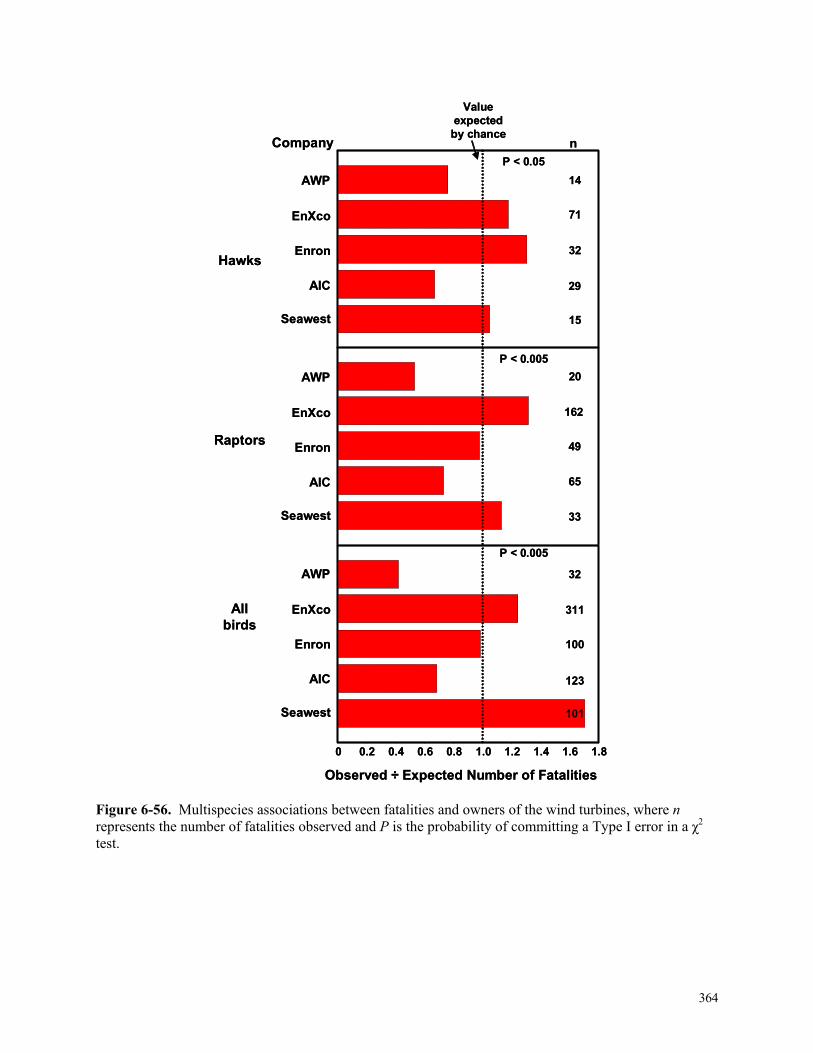
364
Figure 6-56. Multispecies associations between fatalities and owners of the wind turbines, where n represents the number of fatalities observed and P is the probability of committing a Type I error in a χ2 test.
1.81.61.41.21.00.80.60.40.20
AWP
EnXco
Enron
AIC
Seawest
AWP
EnXco
Enron
AIC
Seawest
AWP
EnXco
Enron
AIC
Seawest
Valueexpected
by chance
Observed ÷ Expected Number of Fatalities
Hawks
Raptors
Allbirds
14
71
32
29
15
20
162
49
65
33
32
311
100
123
101
P < 0.005
P < 0.005
P < 0.05nCompany
1.81.61.41.21.00.80.60.40.20
AWP
EnXco
Enron
AIC
Seawest
AWP
EnXco
Enron
AIC
Seawest
AWP
EnXco
Enron
AIC
Seawest
Valueexpected
by chance
Observed ÷ Expected Number of Fatalities
Hawks
Raptors
Allbirds
14
71
32
29
15
20
162
49
65
33
32
311
100
123
101
P < 0.005
P < 0.005
P < 0.05nCompany

365
Figure 6-57. Species-specific associations between fatalities and level of rodent control in the area of the wind turbine, where n represents the number of fatalities observed and P is the probability of committing a Type I error in a χ2 test. “ns” represents not significant.
2.52.01.51.00.50
Goldeneagle
Red-tailedhawk
Americankestrel
Burrowingowl
Barnowl
Greathorned
owl
None
Intermittent
Intense
None
Intermittent
Intense
None
Intermittent
Intense
None
Intermittent
Intense
None
Intermittent
Intense
None
Intermittent
Intense
4
9
17
10
36
16
3
14
2
17
58
56
18
15
5
1
6
Rodent control usedsince 1997 P < 0.005
P < 0.005
0.10 > P > 0.05
0.10 > P > 0.05
ns
ns
n
2.52.01.51.00.50
n
Mallard
Hornedlark
Westernmeadowlark
Housefinch
Europeanstarling
Rockdove
ns
P < 0.005
P < 0.005
P < 0.005
P < 0.005
P < 0.05
11
6
13
6
8
1
25
29
61
4
19
5
13
36
23
7
5
Valueexpected
by chance
Valueexpectedby chance
Observed ÷ Expected Number of Fatalities
2.52.01.51.00.50
Goldeneagle
Red-tailedhawk
Americankestrel
Burrowingowl
Barnowl
Greathorned
owl
None
Intermittent
Intense
None
Intermittent
Intense
None
Intermittent
Intense
None
Intermittent
Intense
None
Intermittent
Intense
None
Intermittent
Intense
4
9
17
10
36
16
3
14
2
17
58
56
18
15
5
1
6
Rodent control usedsince 1997 P < 0.005
P < 0.005
0.10 > P > 0.05
0.10 > P > 0.05
ns
ns
n
2.52.01.51.00.50
n
Mallard
Hornedlark
Westernmeadowlark
Housefinch
Europeanstarling
Rockdove
ns
P < 0.005
P < 0.005
P < 0.005
P < 0.005
P < 0.05
11
6
13
6
8
1
25
29
61
4
19
5
13
36
23
7
5
Valueexpected
by chance
Valueexpectedby chance
Observed ÷ Expected Number of Fatalities

366
Figure 6-58. Multispecies associations between fatalities and level of rodent control in the area of the wind turbine, where n represents the number of fatalities observed and P is the probability of committing a Type I error in a χ2 test.
1.51.00.50
None
Intermittent
Intense
Rodent control used since 1997P < 0.05
n
Valueexpected
by chance
Observed ÷ Expected Number of Fatalities
Hawks
Raptors
Allbirds
None
Intermittent
Intense
None
Intermittent
Intense
P < 0.005
P < 0.005
20
70
71
45
154
130
119
287
261
n
1.51.00.50
None
Intermittent
Intense
Rodent control used since 1997P < 0.05
n
Valueexpected
by chance
Observed ÷ Expected Number of Fatalities
Hawks
Raptors
Allbirds
None
Intermittent
Intense
None
Intermittent
Intense
P < 0.005
P < 0.005
20
70
71
45
154
130
119
287
261
n
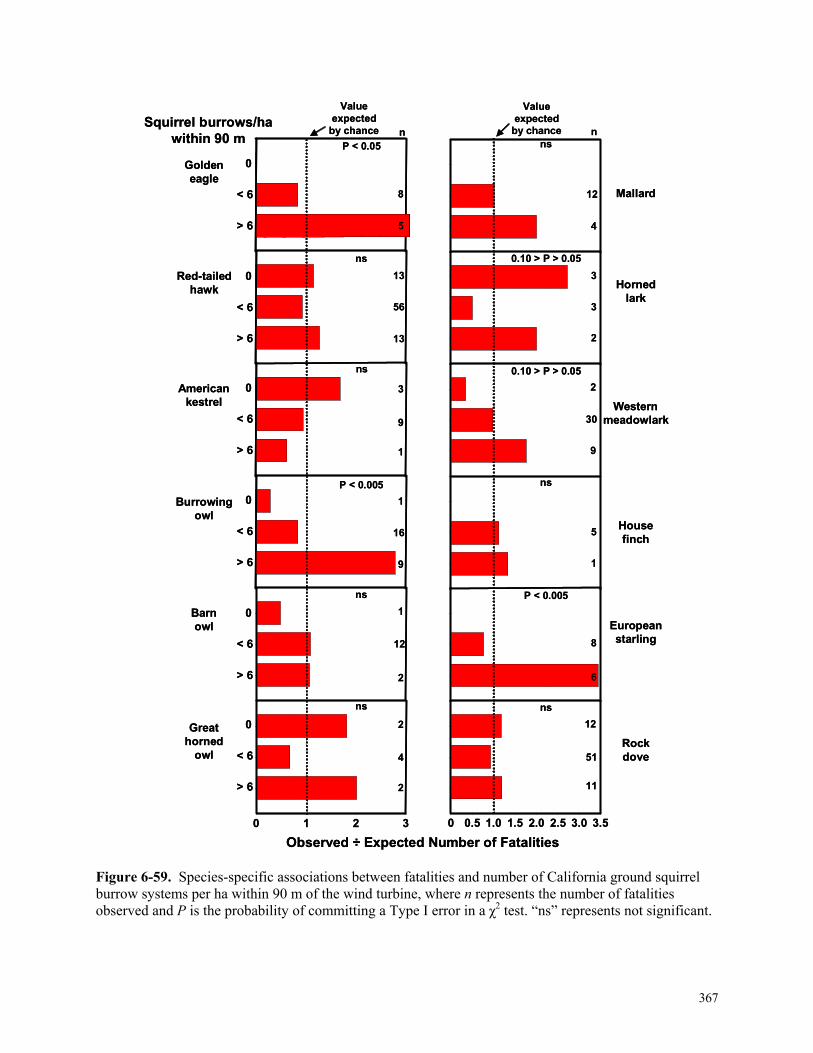
367
Figure 6-59. Species-specific associations between fatalities and number of California ground squirrel burrow systems per ha within 90 m of the wind turbine, where n represents the number of fatalities observed and P is the probability of committing a Type I error in a χ2 test. “ns” represents not significant.
3210 3.53.02.52.01.51.00.50
Squirrel burrows/hawithin 90 m
0
< 6
> 6
0
< 6
> 6
0
< 6
> 6
0
< 6
> 6
0
< 6
> 6
0
< 6
> 6
Goldeneagle
Red-tailedhawk
Americankestrel
Burrowingowl
Barnowl
Greathorned
owl
n n
Mallard
Hornedlark
Westernmeadowlark
Housefinch
Europeanstarling
Rockdove
Valueexpected
by chance
Valueexpected
by chance
Observed ÷ Expected Number of Fatalities
P < 0.05
P < 0.005
ns
P < 0.005
0.10 > P > 0.05
0.10 > P > 0.05
ns
ns
ns
ns ns
ns
3
1
1
16
9
5
13
56
13
1
12
2
2
4
2
8
6
5
12
51
11
4
2
30
9
3
3
2
8 12
1
9
368
Figure 6-60. Multispecies associations between fatalities and number of California ground squirrel burrow systems per ha within 90 m of the wind turbine, where n represents the number of fatalities observed and P is the probability of committing a Type I error in a χ2 test. “ns” represents not significant.
2.01.51.00.50
Squirrel burrows/hawithin 90 m
0
< 6
> 6
0
< 6
> 6
0
< 6
> 6
Valueexpectedby chance
Observed ÷ Expected Number of Fatalities
Hawks
Raptors
Allbirds
nns
P < 0.005
P < 0.005
16
63
16
24
115
37
42
244
82
2.01.51.00.50
Squirrel burrows/hawithin 90 m
0
< 6
> 6
0
< 6
> 6
0
< 6
> 6
Valueexpectedby chance
Observed ÷ Expected Number of Fatalities
Hawks
Raptors
Allbirds
nns
P < 0.005
P < 0.005
16
63
16
24
115
37
42
244
82

369
Figure 6-61. Species-specific associations between fatalities and number of pocket gopher burrow systems per ha within 90 m of the wind turbine, where n represents the number of fatalities observed and P is the probability of committing a Type I error in a χ2 test. “ns” represents not significant.
2.52.01.51.00.50 3210
Gopher burrows/hawithin 90 m
0 – 1.4
1.4 - 3.5
>3.5
0 – 1.4
1.4 - 3.5
>3.5
0 – 1.4
1.4 - 3.5
>3.5
0 – 1.4
1.4 - 3.5
>3.5
0 – 1.4
1.4 - 3.5
>3.5
0 – 1.4
1.4 - 3.5
>3.5
Goldeneagle
Red-tailedhawk
Americankestrel
Burrowingowl
Barnowl
Greathorned
owl
n n
Mallard
Hornedlark
Westernmeadowlark
Housefinch
Europeanstarling
Rockdove
Valueexpected
by chance
Valueexpectedby chance
Observed ÷ Expected Number of Fatalities
P < 0.005
P < 0.05
ns
ns
ns
ns
P < 0.05
ns
P < 0.005
0.10 > P > 0.05
0.10 > P > 0.05
0.10 > P > 0.05
9
4
5
12
9
2
9
33
26
23
6
5
4
3
3
2
7
1
1
4
54
8
12
4
7
12
18
11
1
2
5
2 5
6
1

370
Figure 6-62. Multispecies associations between fatalities and number of pocket gopher burrow systems per ha within 90 m of the wind turbine, where n represents the number of fatalities observed and P is the probability of committing a Type I error in a χ2 test.
1.51.00.50
Gopher burrows/hawithin 90 m
0 – 1.4
1.4 - 3.5
>3.5
0 – 1.4
1.4 - 3.5
>3.5
0 – 1.4
1.4 - 3.5
>3.5
Valueexpected
by chance
Observed ÷ Expected Number of Fatalities
Hawks
Raptors
Allbirds
n0.10 > P > 0.05
P < 0.05
P < 0.005
37
32
26
62
57
57
151
115
102
1.51.00.50
Gopher burrows/hawithin 90 m
0 – 1.4
1.4 - 3.5
>3.5
0 – 1.4
1.4 - 3.5
>3.5
0 – 1.4
1.4 - 3.5
>3.5
Valueexpected
by chance
Observed ÷ Expected Number of Fatalities
Hawks
Raptors
Allbirds
n0.10 > P > 0.05
P < 0.05
P < 0.005
37
32
26
62
57
57
151
115
102
371
Figure 6-63. Species-specific associations between fatalities and number of all mammal burrow systems per ha within 90 m of the wind turbine, where n represents the number of fatalities observed and P is the probability of committing a Type I error in a χ2 test. “ns” represents not significant.
3.02.52.01.51.00.50 3.53.02.52.01.51.00.50
< 5
5 - 9
> 9
Goldeneagle
Red-tailedhawk
Americankestrel
Burrowingowl
Barnowl
Greathorned
owl
n n
Mallard
Hornedlark
Westernmeadowlark
Housefinch
Europeanstarling
Rockdove
Valueexpectedby chance
Valueexpected
by chance
Observed ÷ Expected Number of Fatalities
P < 0.005 ns
7
2
7
7
12
6
38
23
21
6
6
3
3
2
2
3
6
2
43
19
12
4
11
17
13
3
1
4
6 9
2
4
< 5
5 - 9
> 9
< 5
5 - 9
> 9
< 5
5 - 9
> 9
< 5
5 - 9
> 9
< 5
5 - 9
> 9
All burrows/hawithin 90 m
1
5
2
3
P < 0.005
P < 0.005
ns
ns
ns
ns
P < 0.005
P < 0.05
P < 0.05
P < 0.05

372
Figure 6-64. Multispecies associations between fatalities and number of all mammal burrow systems per ha within 90 m of the wind turbine, where n represents the number of fatalities observed and P is the probability of committing a Type I error in a χ2 test.
2.01.51.00.50
< 5
5 - 9
> 9
Valueexpectedby chance
Observed ÷ Expected Number of Fatalities
Hawks
Raptors
Allbirds
nP < 0.005
P < 0.005
P < 0.005
45
25
25
70
53
53
143
118
107
< 5
5 - 9
> 9
< 5
5 - 9
> 9
All burrows/hawithin 90 m
2.01.51.00.50
< 5
5 - 9
> 9
Valueexpectedby chance
Observed ÷ Expected Number of Fatalities
Hawks
Raptors
Allbirds
nP < 0.005
P < 0.005
P < 0.005
45
25
25
70
53
53
143
118
107
< 5
5 - 9
> 9
< 5
5 - 9
> 9
All burrows/hawithin 90 m

373
Figure 6-65. Species-specific associations between fatalities and degree of clustering of California ground squirrel burrow systems around the wind turbine, where n represents the number of fatalities observed and P is the probability of committing a Type I error in a χ2 test. “ns” represents not significant.
2.01.51.00.50 2.01.51.00.50
0
< 1.15
> 1.15
0
< 1.15
> 1.15
0
< 1.15
> 1.15
0
< 1.15
> 1.15
0
< 1.15
> 1.15
0
< 1.15
> 1.15
Ground squirrel clustering at turbines(Observed ÷ Expected number of
burrow systems within 15 m)
Goldeneagle
Red-tailedhawk
Americankestrel
Burrowingowl
Barnowl
Greathorned
owl
n n
Mallard
Hornedlark
Westernmeadowlark
Housefinch
Europeanstarling
Rockdove
Valueexpectedby chance
Valueexpectedby chance
Observed ÷ Expected Number of Fatalities
P < 0.05
P < 0.005
ns
ns
ns
ns
ns ns
ns ns
ns ns
4
3
6
5
12
9
4
2
28
30
24
4
6
5
4
2
2
8
6
2
4
19
15
40
5
2
7
19
15
5
1
2
7 9

374
Figure 6-66. Multispecies associations between fatalities and degree of clustering of California ground squirrel burrow systems around the wind turbine, where n represents the number of fatalities observed and P is the probability of committing a Type I error in a χ2 test. “ns” represents not significant.
1.51.00.50
0
< 1.15
> 1.15
Ground squirrel clustering at turbines(Observed ÷ Expected number of
burrow systems within 15 m)
0
< 1.15
> 1.15
0
< 1.15
> 1.15
Valueexpected
by chance
Observed ÷ Expected Number of Fatalities
Hawks
Raptors
Allbirds
nns
ns
ns
33
35
27
57
66
53
102
138
128
1.51.00.50
0
< 1.15
> 1.15
Ground squirrel clustering at turbines(Observed ÷ Expected number of
burrow systems within 15 m)
0
< 1.15
> 1.15
0
< 1.15
> 1.15
Valueexpected
by chance
Observed ÷ Expected Number of Fatalities
Hawks
Raptors
Allbirds
nns
ns
ns
33
35
27
57
66
53
102
138
128
375
Figure 6-67. Species-specific associations between fatalities and degree of clustering of pocket gopher burrow systems around the wind turbine, where n represents the number of fatalities observed and P is the probability of committing a Type I error in a χ2 test. “ns” represents not significant.
543210 543210
0< 1.15> 1.15
0< 1.15> 1.15
Notin
canyon
Incanyon
Notin
canyon
Incanyon
Notin
canyon
Incanyon
Notin
canyon
Incanyon
Notin
canyon
Incanyon
Notin
canyon
Incanyon
Goldeneagle
Red-tailedhawk
Americankestrel
Burrowingowl
Barnowl
Greathorned
owl
n n
Mallard
Hornedlark
Westernmeadowlark
Housefinch
Europeanstarling
Rockdove
Valueexpectedby chance
Valueexpected
by chance
Observed ÷ Expected Number of Fatalities
P < 0.005
0< 1.15> 1.15
0< 1.15> 1.15
0< 1.15> 1.15
0< 1.15> 1.15
0< 1.15> 1.15
0< 1.15> 1.15
0< 1.15> 1.15
0< 1.15> 1.15
0< 1.15> 1.15
0< 1.15> 1.15
P < 0.005 P < 0.005
P < 0.005
P < 0.005
P < 0.05
ns
ns
ns ns
ns
ns
41
2
1
3
1
9
1
4
7
16
916
21
8
1
25
31
1
5
4
7
2
1
2
5
2
1
2
6
2
3
149
5
61
1
4
7
2
3
16
1
1
2
6
1
39
2
14
3
212
2
= 7.9 = 6.4
= 6.4
Interaction between canyon andground squirrel clustering at turbines
(Observed ÷ Expected number of burrow systems within 15 m)

376
Figure 6-68. Multispecies associations between fatalities and degree of clustering of pocket gopher burrow systems around the wind turbine, where n represents the number of fatalities observed and P is the probability of committing a Type I error in a χ2 test.
543210
Notin
canyon
Incanyon
Valueexpectedby chance
Observed ÷ Expected Number of Fatalities
Hawks
Raptors
Allbirds
nP < 0.005
P < 0.005
P < 0.005
Notin
canyon
Incanyon
Notin
canyon
Incanyon
0
< 1.15
> 1.15
0
< 1.15
> 1.15
0
< 1.15
> 1.15
0
< 1.15
> 1.15
0
< 1.15
> 1.15
0
< 1.15
> 1.15
21
10
17
12
25
10
35
16
38
22
50
15
59
43
108
43
95
20
Interaction between canyon andground squirrel clustering at turbines
(Observed ÷ Expected number of burrow systems within 15 m)
377
Figure 6-69. Species-specific associations between fatalities and the interaction between whether the wind turbine was within a canyon and the degree of clustering of California ground squirrel burrow systems around it, where n represents the number of fatalities observed and P is the probability of committing a Type I error in a χ2 test. “ns” represents not significant.
6543210 6543210
Pocket gopher clustering at turbines(Observed ÷ Expected number of
burrow systems within 15 m)
0
< 1.5
1.5 – 3.0
> 3.0
0
< 1.5
1.5 – 3.0
> 3.0
0
< 1.5
1.5 – 3.0
> 3.0
0
< 1.5
1.5 – 3.0
> 3.0
0
< 1.5
1.5 – 3.0
> 3.0
0
< 1.5
1.5 – 3.0
> 3.0
Goldeneagle
Red-tailedhawk
Americankestrel
Burrowingowl
Barnowl
Greathorned
owl
n n
Mallard
Hornedlark
Westernmeadowlark
Housefinch
Europeanstarling
Rockdove
Valueexpected
by chance
Valueexpectedby chance
Observed ÷ Expected Number of Fatalities
2
2
5
4
3
6
4
1
6
6
3
4
8
37
33
2
9
4
1
2
3
2
5
2
5
7
2
4
16
17
1
2
3
1
2
4
1
2
5
2
2
14
39
19
4
P < 0.05
ns
ns
ns
P < 0.05
P < 0.005
P < 0.005
P < 0.005
P < 0.05
ns
0.10 > P > 0.05
0.10 > P > 0.05

378
Figure 6-70. Multispecies associations between fatalities and the interaction between whether the wind turbine was within a canyon and the degree of clustering of California ground squirrel burrow systems around it, where n represents the number of fatalities observed and P is the probability of committing a Type I error in a χ2 test.
3.53.02.52.01.51.00.50
Pocket gopher clustering at turbines(Observed ÷ Expected number of
burrow systems within 15 m)
0
< 1.5
1.5 – 3.0
> 3.0
0
< 1.5
1.5 – 3.0
> 3.0
0
< 1.5
1.5 – 3.0
> 3.0
Valueexpected
by chance
Observed ÷ Expected Number of Fatalities
Hawks
Raptors
Allbirds
nP < 0.05
P < 0.005
P < 0.005
6
9
41
39
12
22
73
69
28
58
162
120

379
Figure 6-71. Species-specific associations between fatalities and the interaction between whether the wind turbine was within a canyon and the degree of clustering of pocket gopher burrow systems around it, where n represents the number of fatalities observed and P is the probability of committing a Type I error in a χ2 test. “ns” represents not significant.
43210 43210
< 1.51.5 – 3.5
> 3.5< 1.5
1.5 – 3.5> 3.5
Notin
canyon
Incanyon
Interaction between canyon andpocket gopher clustering at turbines
(Observed ÷ Expected number of burrow systems within 15 m)
< 1.51.5 – 3.5
> 3.5< 1.5
1.5 – 3.5> 3.5
Notin
canyon
Incanyon
< 1.51.5 – 3.5
> 3.5< 1.5
1.5 – 3.5> 3.5
Notin
canyon
Incanyon
< 1.51.5 – 3.5
> 3.5< 1.5
1.5 – 3.5> 3.5
Notin
canyon
Incanyon
< 1.51.5 – 3.5
> 3.5< 1.5
1.5 – 3.5> 3.5
Notin
canyon
Incanyon
< 1.51.5 – 3.5
> 3.5< 1.5
1.5 – 3.5> 3.5
Notin
canyon
Incanyon
Goldeneagle
Red-tailedhawk
Americankestrel
Burrowingowl
Barnowl
Greathorned
owl
n n
Mallard
Hornedlark
Westernmeadowlark
Housefinch
Europeanstarling
Rockdove
Valueexpectedby chance
Valueexpected
by chance
Observed ÷ Expected Number of Fatalities
P < 0.005 P < 0.005
P < 0.005
ns
ns
P < 0.005
P < 0.005 P < 0.005
P < 0.005
P < 0.005
P < 0.005
ns
34
2
1
4
1
2
2
2
5
12
1713
20
20
5
42
23
1
4
3
32
1
1
1
13
35
3
45
3
4
7
8
7
9
13
3
1
3
6
4
9
4
2
2
1
1
1
1
1
2
14
2
4
3
1
= 7.6 = 30.6
= 28.3 = 45.9
= 39.4
= 23 = 7.4
380
Figure 6-72. Multispecies associations between fatalities and the interaction between whether the wind turbine was within a canyon and the degree of clustering of pocket gopher burrow systems around it, where n represents the number of fatalities observed and P is the probability of committing a Type I error in a χ2 test.
543210
< 1.5
1.5 – 3.5
> 3.5
< 1.5
1.5 – 3.5
> 3.5
Notin
canyon
Incanyon
Interaction between canyon andpocket gopher clustering at turbines
(Observed ÷ Expected number of burrow systems within 15 m)
Valueexpectedby chance
Observed ÷ Expected Number of Fatalities
Hawks
Raptors
Allbirds
nP < 0.005
P < 0.005
P < 0.005< 1.5
1.5 – 3.5
> 3.5
< 1.5
1.5 – 3.5
> 3.5
Notin
canyon
Incanyon
< 1.5
1.5 – 3.5
> 3.5
< 1.5
1.5 – 3.5
> 3.5
Notin
canyon
Incanyon
14
19
16
1
22
23
29
37
26
5
36
43
65
96
53
21
66
67
= 10.5

381
Figure 6-73. Species-specific associations between fatalities and the interaction between whether the wind turbine was within a canyon and the degree of clustering of all mammal burrow systems around it, where n represents the number of fatalities observed and P is the probability of committing a Type I error in a χ2 test. “ns” represents not significant.
43210 2.52.01.51.00.50
< 1.2
1.2 - 3
> 3
Goldeneagle
Red-tailedhawk
Americankestrel
Burrowingowl
Barnowl
Greathorned
owl
n n
Mallard
Hornedlark
Westernmeadowlark
Housefinch
Europeanstarling
Rockdove
Valueexpectedby chance
Valueexpectedby chance
Observed ÷ Expected Number of Fatalities
P < 0.005 ns
0.10 > P > 0.05
2
5
1
16
9
2
15
40
27
5
8
2
2
4
2
8
6
3
13
42
19
5
6
27
8
3
3
2
8
10
3
6
< 1.2
1.2 - 3
> 3
< 1.2
1.2 - 3
> 3
< 1.2
1.2 - 3
> 3
< 1.2
1.2 - 3
> 3
< 1.2
1.2 - 3
> 3
All burrows clustering at turbines(Observed ÷ Expected number of
burrow systems within 15 m)
3
1
P < 0.005
ns
ns
ns
ns
P < 0.005
P < 0.005
ns
ns
382
Figure 6-74. Multispecies associations between fatalities and the interaction between whether the wind turbine was within a canyon and the degree of clustering of all mammal burrow systems around it, where n represents the number of fatalities observed and P is the probability of committing a Type I error in a χ2 test.
3.53.02.52.01.51.00.50
< 1.2
1.2 - 3
> 3
Valueexpected
by chance
Observed ÷ Expected Number of Fatalities
Hawks
Raptors
Allbirds
nP < 0.005
P < 0.005
P < 0.005
17
45
33
34
92
50
89
195
84
< 1.2
1.2 - 3
> 3
< 1.2
1.2 - 3
> 3
All burrows clustering at turbines(Observed ÷ Expected number of
burrow systems within 15 m)

383
6-4 DISCUSSION Wind Turbine/Tower Attributes Bonus, Micon, and KVS-33 turbines were the most dangerous wind turbines to birds within our study area in the APWRA. Generally, the taller towers up to 25 m and supporting wind turbines with a larger rotor diameter and slower to intermediate blade tip speeds were the most dangerous wind turbines to birds. Also, tubular towers associated with more avian fatalities than did lattice or vertical-axis towers. The test for association between fatalities and tower type indicated that perching on towers might be more of an issue for American kestrels and great horned owls, but not for any of the other species of priority concern in the APWRA. Perching is not the causal factor some previous investigators have suggested it to be, and taller towers are more dangerous to a larger suite of bird species than previously claimed. Our results contradict the claims made in the repowering DEIR (Alameda County 1998) that slower-moving blades on taller, tubular towers will be safer for birds in the APWRA. We found that, within the ranges of turbine and tower attributes in our study, taller towers, the slower-moving blades, and the longer time spans with which birds have to fly through the rotor plane increase the vulnerability of birds in the APWRA. We found that tubular towers did not reduce mortality over lattice towers, but rather appeared to increase mortality, likely because tubular towers were common to one or more other factors of the wind turbines and locations associated with these towers. Of course, our results are interpreted only within the context of the APWRA and the range of conditions represented by our sample of wind turbines and fatalities. The strong associations between burrowing owl mortality and Flowind and Enertech wind turbines were most likely spurious – the result of higher densities of burrowing owl occurring where these wind turbine models operated. Similarly, it was likely spurious that Windmatic turbines disproportionately killed mallards – the result of Windmatic turbines being located in a major water bird flyway. Despite these likely spurious relationships of location, burrowing owls and mallards were also killed more often than expected by chance by Bonus turbines on tubular towers. Rotors facing the wind associated with a significantly greater mortality of birds, either because this rotor orientation is also associated with other wind turbine attributes that cause more fatalities, or because there is a mechanism specific to the rotor orientation that causes more fatalities to occur. We cannot determine which of these scenarios is more likely. Physiography Generally, wind turbines at the lowest elevations and on canyon slopes were more dangerous to birds in our study area. The location of wind turbines in canyons was one of the most significant factors tested in our study. Also, birds were more vulnerable to wind turbines located on saddles of ridges, in ravines, and on plateaus. Another factor that related strongly to avian fatalities was the presence of rock piles created by the wind industry when it cleared rocks from wind turbine laydown areas. Wind turbines with these rock piles nearby killed more raptors and disproportionately more western meadowlarks and horned larks. Raptors are likely attracted to rock piles because these rock piles harbor ground squirrels and cottontails, the latter of which use these rock piles as principal den sites. Horned larks and western meadowlarks likely

384
approach and use the rock piles for their elevated displays and calls, which are typical of these species on grasslands. Rock dove fatalities also associated with the presence of rock piles, but this relationship is likely spurious and we cannot explain it. Wind Farm Configuration The most dangerous wind turbines in our study were those located at the ends of rows, next to gaps in rows, and at the edge of a local cluster of wind turbines within the wind farm. Overall, wind walls are safer for birds, as are the wind turbines situated in the interiors of clusters of wind turbines. These results suggest that birds recognize wind turbines and towers as obstacles and attempt to avoid them while flying, which is consistent with our behavioral observations, however, fatalities occur where birds are surprised by wind turbines situated at the edges of local wind turbine clusters. Rodent Control and Burrowing Animals Contrary to the expectation of the turbine operators in the APWRA, rodent control did not associate with reduced avian mortality. In fact, the opposite association was evident. Rodent control associated with greater degrees of clustering of burrow systems of fossorial animal species around wind turbines, and this clustering in turn associated with disproportionate numbers of avian fatalities. However, the greater densities of fossorial animal burrows within 90 m of wind turbines also associated with larger numbers of avian fatalities, including those of golden eagle, and these conditions were more common where rodent control has not been applied during the past five years. The wind companies in the APWRA and some researchers believed that reducing golden eagle prey populations in the APWRA through intensive control of ground squirrel populations might discourage eagles from visiting the APWRA, thus reducing the number of eagle fatalities caused by wind turbines (Kerlinger and Curry 1999, Hunt 2002). The ground squirrel has been the principal prey species of interest to researchers because of its status as a major prey item of golden eagles in central California (Hunt et al. 1998). However, pocket gophers (Thomomys bottae) are abundant throughout the APWRA, whereas ground squirrels have an uneven, patchy distribution, as we demonstrated with data in this report. Red-tailed hawks and great horned owls rely heavily on pocket gophers (Fitch et al. 1946, Craighead and Craighead 1956, Orians and Kuhlman 1956), whereas golden eagles rely more heavily on larger prey items such as ground squirrels and lagomorphs (Carnie 1954, Olendorff 1976). California vole (Microtus californicus) populations likely also influence the distributions of raptor species, as do small reptiles, amphibians, and arthropods, which are fed upon by burrowing owls and American kestrels. Each raptor species foraging in the APWRA responds uniquely to prey species availability and thus required independent analysis. Our analyses of raptor fatalities revealed relatively weak associations between the distribution of fatalities of each raptor species and the distribution of rodent prey species in most cases, and we suspect several reasons for these weak associations, explained in the following text. The wind companies in the APWRA decided to control ground squirrels during or prior to 1997. In published reports, and at public meetings, consultants G. Hunt, P. Kerlinger, and R. Curry have recommended rodent control programs as a management tool to reduce raptor use, especially by golden eagles (e.g., National Avian-Wind Power Planning Meeting IV, Carmel, California, May, 2000). Green Ridge Services (GRS) proceeded with a program, and their consultant reportedly maintained a database on where and how much effort was put into rodent control by the Alameda County agent, who was funded by APWRA wind companies. GRS monitored the effort and recorded the number of squirrel

385
carcasses collected by two field workers following the applications of the poisoned bait. (Note: BRC requested these data for this report but did not receive them). The response of golden eagles to the rodent control was also monitored in part by tracking the locations of radio-collared golden eagles in and around the APWRA (Hunt 2002). Hunt and Culp (1997) found more golden eagle radio locations in five plots with high ground squirrel density compared to their five plots with low ground squirrel density, and Hunt (2002:37-38) reported seven times more radio locations per unit area in areas of high squirrel density than in areas of low density. However, Figure 20 in Hunt (2002) depicts a strong spatial gradient in reported squirrel density, and this gradient is prone to pseudoreplication and is an unreliable comparison to eagle radio locations. Furthermore, Hunt’s (2002) classification of high, medium, and low squirrel densities based on road surveys was inadequate in spatial scale, in its inclusion of ranches on the APWRA, and in methodology. Drive-by surveys are less reliable than burrow counts or other accepted methods for ground squirrel enumeration or numerical indexing, because drive-by surveys can do little more than index relative abundance. Also, ranches with reportedly high squirrel densities and no or little control implementation were excluded from the comparisons of eagle radio locations. These excluded areas were labeled as having poor visibility or access, but we found no problem with visibility in any of these areas. The scale resolution of the squirrel surveys was too gross for reliable comparison to eagle use and fatalities. Our evidence indicates that golden eagles are killed at turbine strings where ground squirrels are present, but the degree of clustering of ground squirrels near wind turbines does not significantly associate with the distribution of golden eagle fatalities. The same was almost true of burrowing owl fatalities, but other raptor species died at relatively equal rates among turbine strings without ground squirrels, and with moderate or high densities of squirrels. The split in red-tailed hawk fatalities in canyons between turbine strings with squirrels clustered at wind turbines and with those lacking squirrels might reflect a stable foraging pattern in the face of intensive rodent control. The intensive rodent control applied since 1997 likely removed ground squirrels and pocket gophers from canyons where red-tailed hawks and other raptors expect their prey species to be (see Chapter 4). The wind turbine owners’ rodent control program likely interfered with our results of association tests between the distributions of avian fatalities and rodent prey species. Figure 6-75 depicts how pocket gopher and ground squirrel distributions related to raptor mortality caused by the wind turbines where rodent control was applied in a canyon and where it was not applied outside of canyons. These patterns were typical and demonstrate the likelihood that multiple factors interacted in their relationship to raptor fatalities. Factoring in these multiple variables reduced the average χ2 expected cell values to intolerably low levels for reliable test results, due to our relatively small sample sizes. With additional monitoring, we might achieve a sample size of fatalities that is conducive to multivariate testing. In Figure 6-75, the degree of clustering of gopher burrow systems was greatest at string 79, where rodent control was applied during the preceding five years. At string 192, there was no rodent control during the past five years, and at the time the map was made there were many gopher and ground squirrel burrow systems, but they were not clustered near the wind turbines. The rates of fatality of red-tailed hawks and all raptors were relatively high at turbine string 79, but no raptors were found dead at string 192 during our study. The distribution of raptor fatalities appears to relate to whether the wind turbine is in or out of canyons, the distributions of gophers and ground squirrels around the wind turbine, and whether rodent control was applied in the area. Figure 6-75 also illustrates the greater efficiency of the observed/expected χ2 value as a measure of clustering within 15 m of the wind turbines compared to using the slope of log density regressed on log hectares within each of the sequentially increasing 15-m buffer intervals from the wind turbines. Both

386
measures characterized the overall pattern of distribution out to 90 m, but the observed/expected value was easier to calculate, had a wider possible value range, and treated 0 burrow systems more accurately (in the regression analyses, the log 0 is an error thereby excluding 0 values). Given that rodent control has been differentially applied to the ranches in the APWRA, and given that the rodent species likely responded in different ways to the control efforts, the comparison of the distribution of avian fatalities to that of the burrows constructed by all fossorial animal species seemed appropriate. We assumed that foraging raptors or commensal grassland passerines might respond to areas with more or less sign of collective activity of burrowing animals, perhaps as these species compensate for the effects of rodent control on particular species. Indeed, at this level of analysis, the ratios of observed-to-expected numbers of fatalities were larger for greater degrees of clustering of burrowing activity near the wind turbines than for higher densities of burrows within 90 m of the wind turbines. At this level of analysis, it appears that the spatial distribution of mammal burrows around wind turbines is more important than the abundance of mammal burrows.

387
Figure 6-75. Examples of pocket gopher and ground squirrel distributions around wind turbines where rodent control was and was not applied.
#
#
#
#
#
#
#
#
#
#
### #
#
#
##
#
##
## # #
#
# #
#
###
#### #
#
#
#
#
N
#
#
# ##
##
#
#
###
## #
# ###
##
#### #
##
##
# ###
# # ##
##### # #
##
#### # # #
##
# ####
# #
#### ####
# ####
#
##
###
#
# #
#
## # #
90-meterBuffer(i.e., 90 mfrom turbines)
String 79: Rodents controlled, in canyon
String 192: Rodents not controlled, out of canyon
Pocket gopherburrow systems
Ground squirrelburrow systems
1.00.80.60.40.20-0.2
1.1
1.0
0.9
0.8
0.7
0.6
0.5
b = -0.54
Clusterednear turbines
log10 Hectares1.00.80.60.40.20-0.2
0.3
0.2
0.1
0
-0.1
-0.2
b = 0.08
Not clusterednear turbines
log10 Hectares
0.80.60.40.20-0.2-0.4-0.6
0.6
0.5
0.4
0.3
0.2
0.1
0.0
-0.1-0.2
b = -0.18
Not clusterednear turbines
log10 Hectares
log10 Density(burrow / ha)
log10 Density(burrow / ha)
1.38
1.36
1.34
1.32
1.30
1.28
b = 0.02
Not clusterednear turbines
log10 Hectares0.80.60.40.20-0.2-0.4-0.6
###
# Wind turbine
Pocket gopherGround squirrelDesert cottontail
Burrow system centroid Mortality (fatalities
per turbine per year)
0.21 Red-tailedhawks
0.30 Raptors
0 Red-tailedhawks
0 Raptors
#
#
#
#
#
#
#
#
#
#
### #
#
#
##
#
##
## # #
#
# #
#
###
#### #
#
#
#
#
#
#
#
#
#
#
#
#
#
#
### #
#
#
##
#
##
## # #
#
# #
#
###
#### #
#
#
#
#
NN
#
#
# ##
##
#
#
###
## #
# ###
##
#### #
##
##
# ###
# # ##
##### # #
##
#### # # #
##
# ####
# #
#### ####
# ####
#
##
###
#
# #
#
## # #
#
#
# ##
##
#
#
###
## #
# ###
##
#### #
##
##
# ###
# # ##
##### # #
##
#### # # #
##
# ####
# #
#### ####
# ####
#
##
###
#
# #
#
## # #
90-meterBuffer(i.e., 90 mfrom turbines)
String 79: Rodents controlled, in canyon
String 192: Rodents not controlled, out of canyon
Pocket gopherburrow systems
Ground squirrelburrow systems
1.00.80.60.40.20-0.2
1.1
1.0
0.9
0.8
0.7
0.6
0.5
b = -0.54
Clusterednear turbines
log10 Hectares1.00.80.60.40.20-0.2
0.3
0.2
0.1
0
-0.1
-0.2
b = 0.08
Not clusterednear turbines
log10 Hectares
0.80.60.40.20-0.2-0.4-0.6
0.6
0.5
0.4
0.3
0.2
0.1
0.0
-0.1-0.2
b = -0.18
Not clusterednear turbines
log10 Hectares
log10 Density(burrow / ha)
log10 Density(burrow / ha)
1.38
1.36
1.34
1.32
1.30
1.28
b = 0.02
Not clusterednear turbines
log10 Hectares0.80.60.40.20-0.2-0.4-0.6
###
# Wind turbine
Pocket gopherGround squirrelDesert cottontail
Burrow system centroid###
# Wind turbine
Pocket gopherGround squirrelDesert cottontail
Burrow system centroid Mortality (fatalities
per turbine per year)
0.21 Red-tailedhawks
0.30 Raptors
0 Red-tailedhawks
0 Raptors

388
CHAPTER 7: CONCLUSIONS AND RECOMMENDATIONS Many questions remain about the factors associated with fatalities at wind turbines, and about the biological impacts of the mortality we estimated. Results that are more reliable could be obtained through additional research, and we encourage the wind turbine owners and the various state and federal resource agencies to fund this needed research. Regardless, the wind turbine owners should not delay mitigating the impacts caused by wind turbines. As a result of our research, we can now identify the strongest candidate measures for reducing and compensating biological impacts. 7-1 RODENT CONTROL Our data indicate that rodent control has not changed avian behaviors in the manner hoped for by the wind turbine owners. Raptors have not abandoned the areas subjected to rodent control, and substantial numbers of them continue to be killed by wind turbines. Due to the ineffectiveness of the program, and for other reasons, we recommend that the wind turbine owners cease rodent control. Even if the wind turbine owners managed to eradicate rodents, raptors would likely continue to visit the APWRA because it is a migratory route and because birds are known to recognize prey-bearing habitat by gestalt rather than by enumeration and inventory methods. Moreover, even if the wind turbine owners managed to displace raptors after eradicating rodents (assuming again that they could eradicate rodents), this displacement necessarily would result in a net loss of raptors from the remaining habitat. The turbine owners would have reduced populations through displacement because these species cannot be crowded into smaller spaces. The social behaviors of these species are rather inflexible regarding home range size and plural occupancy of territories. Regardless of how one looks at the rodent control program and what might result from it, this program is bound to alarm many segments of the public, once it is fully disclosed. The public could challenge the issuance of existing conditional use permits or renewals, because the rodent control program was not reviewed publicly pursuant to the California Environmental Quality Act (CEQA). The public might eventually come to view wind energy as environmentally harmful, particularly in the Altamont Pass area. 7-2 HABITAT ALTERATION It may be possible to alter habitat within 50 m of wind turbines in order to reduce prey vulnerability to raptor predation near wind turbines, thereby reducing raptor use of these areas as well as fatalities. Habitat alterations, other than the use of rodenticides, remain untested. However, the U.S. Fish and Wildlife Service expressed some skepticism that such localized habitat alterations would shift raptor foraging from the near vicinity of wind turbines to farther away, and that agency might be correct. Still, it might be worth studying cattle exclusion around some select wind turbines, allowing the grass to grow tall and encouraging fossorial animals at locations well away from the wind turbines. 7-3 PERCH GUARDS The results of our behavior study suggest that perching on wind turbines and their towers is likely not the problem that it was portrayed to be in the past. Birds are disproportionately killed by wind turbines mounted on tubular towers, which provide fewer perch sites than do lattice towers. In addition, we found that birds carefully perched on turbines/towers while wind turbines were not operating (Photos 7-1 to 7-5)

389
or broken (Photo 7-3). For these reasons, we do not believe perch guards will substantially reduce mortality. The experimental perch guards implemented thus far in the APWRA are unlikely to thwart perching by raptors on the wind turbines. Hardware cloth (‘chicken wire’) was erected atop horizontal supports of some lattice towers, but this wire loses its integrity relatively quickly and falls apart (Photo 7-6). Also, raptors are perching on the rotors, work platforms and engine housing of wind turbines on both lattice and tubular towers (e.g., Photos 7-2 to 7-5), and the chicken wire cannot prevent perching on these elements.
Photo 7-1. A hawk perched on a lattice tower while the wind turbines of the entire string are not operating.

390
Photo 7-2. A hawk perched on the work platform of a wind turbine while it is not operating.
Photo 7-3. A hawk perched on the work platform of a tower that is missing its wind turbine, and while the adjacent wind turbines are not operating.

391
Photo 7-4. A red-tailed hawk perched atop a wind turbine blade.
Photo 7-5. Red-tailed hawk perched atop the tip of a wind turbine blade.

392
Photo 7-6. Mesh hardware cloth (“chicken wire”) used as perch guard on a lattice tower. 7-4 SEASONAL SHUTDOWN OF WIND TURBINES Researchers and others familiar with the turbine-caused mortality problem have frequently suggested shutting down wind turbines during the most dangerous times of the year. We found, however, that periods of the year when avian species are most susceptible vary substantially among species. Shutting down wind turbines during summer to protect golden eagles will do less to curb the mortality of red-tailed hawks, burrowing owls, and other species. Nevertheless, CEC staff recently concluded that proportionately more individuals of multiple raptor species would be saved than the energy lost by implementing a winter-time shutdown (S. Smallwood and L. Spiegel, unpublished data). A winter-time shutdown would substantially reduce avian mortality while reducing annual energy generation by about 16%. 7-5 MOVING ROCK PILES Rocks were piled near wind turbines as a mitigation measure for the wind farm (Photo 7-7). These rocks were removed from the laydown areas and piled nearby as prey-bearing cover for San Joaquin kit fox. Relocating rock piles further away from the wind turbines might reduce the mortality of some species, but most likely not substantially. However, we recommend pursuing this, as it is a low-cost solution.

393
Photo 7-7. Rocks gathered from wind turbine laydown areas during construction and piled nearby. 7-6 BARRICADING THE ROTOR PLANE Many who first learn of the wind-turbine-caused avian mortality problem ask why barriers cannot be erected to keep birds from flying into moving blades. Simply put, this measure would be overwhelmingly costly and impractical, and it would likely reduce the wind power that could be generated because any such structure would impede wind flow. 7-7 PROVIDING ALTERNATIVE PERCHES The APWRA now offers birds many perches that were not present prior to the wind farm. These perches are on thousands of wind turbines and their towers, and on many ancillary structures. We do not believe alternative perches, as recommended by Alameda County (1998), would substantially attract perching birds away from the thousands of perches available already. 7-8 RELOCATING SELECTED WIND TURBINES Wind turbines should be moved out of canyons, and more isolated wind turbines should be moved closer to clusters of other wind turbines. These relocations would reduce mortality, based on the strength of the associations in our study. If relocations are pursued, we recommend prioritizing wind turbines that are more isolated and in canyons, especially those at lower elevations.

394
7-9 BROKEN AND NONOPERATIONAL WIND TURBINES We found evidence that suggests raptors are killed disproportionately more often by wind turbines adjacent to broken wind turbines. Possibly, birds often fly wide of broken wind turbines because another raptor is perched on the broken wind turbine (i.e., recall that data revealed that perching on wind turbines was mostly on wind turbines that were either turned off or broken). A raptor flying through the rotor zone in which another raptor is perched atop the tower of a broken or missing wind turbine might not notice or see the moving blades of an adjacent wind turbine, and subsequently get struck. Broken or nonoperational wind turbines should be fixed, replaced, or removed along with their towers. The relationship between broken wind turbines and raptor mortality, as well as our results on perching behaviors, also suggest that turbine strings are most dangerous when some wind turbines are turned on while others are turned off. Coordinating the operations of the wind turbines in a string, so they are either all on or all off might reduce avian mortality. At the APWRA, this practice is likely made difficult by the site variation in wind speeds due to a complex topography. 7-10 PAINTING TURBINE BLADES Smallwood and Thelander (2004) found that the previously implemented blade painting schemes did not reduce avian mortality. The painting scheme recommended by Hodos et (2003), in which a single, solid black blade is paired with two white blades, or possibly a single, thin-striped blade is paired with two white blades, would probably be the most visible visual deterrent scheme to apply. We cannot know the extent to which the resulting reduction in motion smear would prevent fatalities, but we recommend that this painting scheme be implemented, beginning with the wind turbines identified as the most dangerous to raptors based on their location and design attributes. 7-11 RETROFITTING POWER POLES Birds continue to be electrocuted in the APWRA, so all APLIC non-compliant poles (APLIC 1996) should be retrofitted as soon as possible. 7-12 EXCLUDING CATTLE FROM TOWER PADS Cattle congregate around wind turbines due to the shade afforded by the towers or perhaps for other reasons (Photos 7-8 and 7-9). This concentration of cattle activity also concentrates the distribution of cattle pats, which are fed upon by hundreds of grasshoppers per pat and serve as a principal base of a food web attracting birds to the near vicinity of wind turbines. It might be possible to encourage this food web to proliferate more distant from the wind turbines by fencing off the area immediately surrounding the wind turbines and excluding cattle from that area. A 50-m exclusion area might suffice. Again, to record any meaningful effect of this measure, it would need to be applied to wind turbines with the demonstrated worst records of causing fatalities.

395
Photo 7-8. Cattle routinely congregate in the shade of wind towers, especially on hot days.
Photo 7-9. Cattle congregate around wind turbine for shade and foraging. By doing so, they reduce grass height and expose small mammals more readily to foraging raptors. 7-13 OFF-SITE MITIGATION Acquiring Conservation Easements Because the avian mortality caused by wind turbines in the APWRA cannot be reduced to zero, the wind industry should provide compensatory mitigation. The purchase of conservation easements on lands
396
surrounding the APWRA may be helpful. These easements should include conditions, such as not allowing rodent control. The appropriate area to be put in conservation easements could be arrived at by estimating the species-specific mortalities that will remain after other mitigation measures are implemented, and the spatial areas typically used by the numbers of birds killed could be tallied and multiplied by a factor that would be appropriate to the continuing loss of that number of birds per year. That is, a mitigation ratio could be arrived at that accounts for the APWRA’s performance as an ecological sink. Another alternative would be to have the wind industry and regulatory agencies identify lands for sale that, if purchased, would enhance raptor populations in California. The purchase of these lands could result in the establishment of a conservation-banking program. In these instances, developers needing to provide mitigation for particular developments can purchase credits. The eventual purchase of the credits secures the long-term protection of an area that otherwise would be destroyed in terms of its wildlife habitat values. An example might be the purchase of a portion of the central Coast Ranges known to support a dense population of golden eagles and establishing a mitigation bank, whereby future wind developers could purchase mitigation credits. Support for Raptor Research and Rehabilitation Facilities Mitigation can take the form of providing direct funding to nonprofit organizations with programs that relate to the benefit of resources impacted by a project. The wind industry could allocate a stream of income based on energy revenues, or provide a negotiated lump sum payment to organizations working with raptors. This might include groups like the Predatory Bird Research Group at the University of California at Santa Cruz, The Peregrine Fund in Boise, Idaho, and many others.

397
REFERENCES Alameda County. 1998. Repowering a portion of the Altamont wind resource area. Final Environmental
Impact Report. Community Development Agency. State Clearinghouse No. 98022024, Sacramento, CA.
Anderson, R., M., Morrison, K. Sinclair, D. Strickland. 1999. Studying wind energy and bird
interactions: a guidance document. National Wind Coordinating Committee. Wash., DC. 87 pp. Anderson, R., W. Erickson, D. Strickland, M. Bourassa, J. Tom, and N. Neumann. 2001. Avian
monitoring and risk assessment at Tehachapi Pass and San Gorgonio Pass Wind Resource Areas, California. Pages 31-46 in Proceedings of National Avian-Wind Power Planning Meeting III, San Diego, California, May 1998. Prepared for the Avian Subcommittee of the National Wind Coordinating Committee by LGL Ltd., King City, Ont., 202 pp.
Avian Power Line Interaction Committee (APLIC). 1996. Suggested practices for raptor protection on power lines: the state of the art in 1996. Edison Electric Institute and the Raptor Research Foundation. Washington, D.C.
Battaglin, W.A., and D.A. Goolsby. 1995. Spatial data in Geographic Information System format on
agricultural chemical use, land use, and cropping practices in the United States. U.S. Geological Survey, Water Resources Investigations Report 94-4176, Denver. 87 pp.
Blackburn T. M., and K. J. Gaston. 1996. Abundance-body size relationships: the area you census tells
you more. Oikos 75:303-309. Cade, T. 1995. Industry research: Kenetech Windpower. Pages 36-39 in LGL Ltd., environmental
research associates, Ed., Proceedings of National Avian-Wind Power Planning Meeting, Lakewood, Colorado. National Renewable Energy Laboratory, Golden, Colorado. 145 pp.
Cairns J., Jr. and P.V. McCormick. 1992. Developing an ecosystem-based capability for ecological risk
assessments. The Environmental Professional 14:186-196. California Fish and Game Department. 1992. Special animals list. Natural Diversity Data Base,
Sacramento, California. Carnie, S. K. 1954. Food habits of nesting golden eagles in the coast ranges of California. Condor 56:3-
12.
Colson and Associates. 1995. Avian interactions with wind energy facilities: A summary. Prepared by Colson & Associates for AWEA, Washington, D.C.
Craighead, J. J., and F. C. Craighead, Jr. 1956. Hawks, owls and wildlife. Stackpole Books, Harrisburg,
PA. 443 pp. Curry, R. C., and P. Kerlinger. 2000. Avian mitigation plan: Kenetech model wind turbines, Altamont
Pass WRA, California. Pages 18-27 in Proceedings of National Avian-Wind Power Planning Meeting III, San Diego, California, May 1998. Prepared for the Avian Subcommittee of the National Wind Coordinating Committee by LGL Ltd., King City, Ont., 202 pp.

398
Erickson, W. P., G. D. Johnson, M. D. Strickland, K. Kronner, P. S. Becker, and S. Orloff. 1999. Baseline avian use and behavior at the CARES Wind Plant Site, Klitchitat County, Washington. Final Report (NREL/SR-500-26902). National Renewable Energy Laboratory, Golden, Colorado. 67 pp.
Erickson, W. P., G. D. Johnson, M. D. Strickland, D. P. Young, Jr., K. J. Sernka, and R. E. Good. 2001.
Avian collisions with wind turbines: A summary of existing studies and comparisons to other sources of avian collision mortality in the United States. National Wind Coordinating Committee, c/o RESOLVE, Washington, D.C. 62 pp.
Erickson, W. P., J. Jeffrey, K. Kronner, and K. Bay. 2003. Stateline wind project wildlife monitoring
annual report, results for the period July 2001–December 2002. Technical Report submitted to FPL Energy, the Oregon Office of Energy and the Stateline Technical Advisory Committee.
ESA. 2002. Solano County High Winds Power Project Environmental Impact Report. Prepared for
Solano County Department of Environmental Management, Fairfield, California. Estep, J. 1989. Avian mortality at large wind energy facilities in California: identification of a problem.
Staff report no. P700-89-001. California Energy Commission, Sacramento. Fitch, H. S., R. Swenson, and D. F. Tillotson. 1946. Behavior and food habits of the red-tailed hawk.
Condor 48:205-237. Gauthreaux, S. A. 1996. Suggested practices for monitoring bird populations, movements and mortality
in wind resource areas. In: Proceedings of National Avian-Wind Power Planning Meeting II. Palm Springs, California, 20-22 Sept. 1995. Prepared for the Avian Subcommittee of the National Wind Coordination Committee by RESOLVE Inc., Washington, DC, and LGL Ltd., King City, Ont. 152 pp.
Hodos, W., A. Potocki, T. Storm, and M. Gaffney. 2001. Reduction of motion smear to reduce avian
collisions with wind turbines. Pages 88-105 in S. S. Schwartz, ed., Proceedings of National Avian-Wind Power Planning Meeting IV, Carmel, California. Avian Subcommittee of the National Wind Coordinating Committee, Washington, D.C.
Hoover, S. L. 2001. The response of raptors and other prey to topographical features at the Altamont
Wind Resource Area. M.S. Thesis, California State University, Sacramento. 83 pp. Hoover, S. L., M. L. Morrison, C. Thelander, and L. Rugge 2001. Response of raptors and other prey to
topographical features at the Altamont Wind Resource Area. Pages 16-21 in S. S. Schwartz, ed., Proceedings of National Avian-Wind Power Planning Meeting IV, Carmel, California. Avian Subcommittee of the National Wind Coordinating Committee, Washington, D.C.
Howell, J. A. 1997. Avian mortality at rotor swept area equivalents, Altamont Pass and Montezuma
Hills, California. Transactions of the Western Section of the Wildlife Society 33:24-29. Howell, J.A. and J.E. Didonato. 1991. Assessment of avian use and mortality related to wind turbine
operations, Altamont Pass, Alameda and Contra Costa Counties, California, September 1998 through August 1989. Final report submitted to U.S. Windpower, Inc., Livermore, California. 168 pp.

399
Howell, J.A. and J. Noone. 1992. Examination of avian use and mortality at a U.S. Windpower wind energy development site, Montezuma Hills, Solano County, California. Final report. Prepared for Solano County Department of Environmental Management, Fairfield, California.
Howell, J.A., J. Noone, and C. Wardner. 1991. Visual experiment to reduce avian mortality related to wind
turbine operations, Altamont Pass, Alameda and Contra Costa counties, California, April 1990 through March 1991. Final report. Prepared for U.S. Windpower, Inc., Livermore, California.
Hunt, G. 1994. A pilot golden eagle population project in the Altamont Pass Wind Resource Area,
California. Prepared by the Predatory Bird Research Group, University of California, Santa Cruz, for the National Renewable Energy Laboratory, Golden Colorado. 212 pp.
Hunt, W. G. 2002. Golden eagles in a perilous landscape: Predicting the effects of mitigation for wind
turbine blade-strike mortality. Consultant Report to California Energy Commission, Sacramento, California.
Hunt, G., and L. Culp. 1997. The influence of high ground squirrel densities on the occurrence of golden
eagles on Altamont Ownership Consortium property. Unpublished report to Altamont Ownership Consortium. 16 pp.
Hunt, W. G., R. E. Jackman, T. L. Hunt, D. E. Driscoll, and L. Culp. 1998. A population study of golden
eagles in the Altamont Pass Wind Resource Area: population trend analysis 1997. Report to National Renewable Energy Laboratory, Subcontract XAT-6-16459-01. National Technical Information Service, U. S. Department of Commerce, Springfield, Virginia.
Janss, G. and A. T. Clave. 2000. Bird behavior in and near a wind farm at Tarifa, Spain: management
considerations. Pages 110-114 Proceedings of National Avian-Wind Power Planning Meeting III, San Diego, California, May 1998. Prepared for the Avian Subcommittee of the National Wind Coordinating Committee by LGL Ltd., King City, Ontario. 202 pp.
Johnson, G. J., W. P. Erickson, M. D. Strickland, M. F. Shepherd, D. A. Shepherd, and S. A. Sarappo.
2002. Collision mortality of local and migrant birds at a large-scale wind-power development on Buffalo Ridge, Minnesota. Wildlife Society Bulletin 30:879-887.
Kerlinger, P., and R. Curry. 1999. Analysis of flight patterns and pathways of golden eagles and red-
tailed hawks in relation to wind turbines and topography in the Altamont Wind Resource Area (AWRA) of California. Unpublished report to Altamont Infrastructure Company, Livermore, California. 11 pp + 11 figures.
Kerlinger, P., and R. Curry. 2000. Impacts of a small wind power facility in Weld County, Colorado, on
breeding, migrating, and wintering birds: preliminary results and conclusions. Pages 64-69 in Proceedings of National Avian-Wind Power Planning Meeting III, San Diego, California, May 1998. Prepared for the Avian Subcommittee of the National Wind Coordinating Committee by LGL Ltd., King City, Ontario. 202 pp.
Kerlinger, P., and R. Curry. 2001. Analysis of avian fatalities at Kenetech KVS-33 turbines in Alameda
and Contra Costa Counties, California. Unpublished report to Green Ridge Power, L.L.C. 8 pp. McIsaac, H. P. 2001. Raptor acuity and wind turbine blade conspicuity. Pages 59-87 in S. S. Schwartz,
ed., Proceedings of National Avian-Wind Power Planning Meeting IV, Carmel, California. Avian Subcommittee of the National Wind Coordinating Committee, Washington, D.C.

400
Morrison, M. L. 1996. Protocols for evaluation of existing wind developments and determination of bird
mortality. In Resolve, Inc. and LGL Ltd., editors, Proceedings of National Avian-Wind Power Planning Meeting II, Palm Springs, California. Avian Subcommittee of the National Wind Coordinating Committee, Washington, D.C.
Morrison, M. L. 1998. Avian risk and fatality protocol. National Renewable Energy Laboratory,
NREL/SR-500-24997, Golden Colorado. 7 pp. Munsters, C. J. M., M. A. W. Noordervliet and W. J. Ter Keurs. 1996. Bird casualties caused by a wind
energy project in an estuary. Bird Study 43:124-126. National Geographic Society. 1987. Field guide to the birds of North America, 2nd ed. Washington, D.C. Nelson, M.W. 1982. Human impacts on golden eagles: a positive outlook for the 1980s and 1990s.
Raptor Research 16:97-103. Olendorff, R. R. 1976. The food habits of North American golden eagles. Amer. Midland Naturalist.
95:231-3-236. O'Neill R.V., K. B. Jones, K. H. Ritters, J. D. Wickham, and I. A. Goodman. 1994. Landscape
monitoring and assessment research plan. U.S. EPA 620/R-94/009, Environmental Protection Agency: 53 pp.
Orians, G. H., and F. Kuhlman. 1956. Red-tailed hawk and horned owl populations in Wisconsin.
Condor 58:371-385. Orloff, S., and A. Flannery. 1992. Wind turbine effects on avian activity, habitat use, and mortality in
Altamont Pass and Solano County Wind Resource Areas: 1989-1991. Report to California Energy Commission, Sacramento, California.
Orloff, S., and A. Flannery. 1996. A continued examination of avian mortality in the Altamont Pass
Wind Resource Area. Report to California Energy Commission, Sacramento, California. Pearson, Scott. Personal communication. 2000. U.S. Fish and Wildlife Service, Senior Resident Agent,
Sacramento, California. Rapport D. J., H. A. Reiger, and T. C. Hutchinson. 1985. Ecosystem behavior under stress. American
Naturalist 125:617-640. Reynolds, R. T., J. M. Scott, and R. A. Nussbaum. 1980. A variable circular-plot method for estimating
bird numbers. Condor 82:309-313. Rogers, S.E., B.W. Cornaby, C.W. Rodman, P.R. Sticksel, and D.A. Tolle. 1976. Evaluation of the
potential environmental effects of wind energy system development. Battelle Columbus Laboratories, Columbus, Ohio. 71 pp.
Rotmans, J., M.B.A. van Asselt, A.J. de Bruin, M.G.J. den Elzen, J. de Greef, H. Hiderink, A.Y.
Hoekstra, M.A. Janssen, H. W. Koster, W.J.M. Martens, L.W. Niessen, and H.J.M. de Vries. 1994.

401
Global change and sustainable development. Global Dynamics & Sustainable Development Programme, GLOBO Report Series no. 4. RIVM, Bilthoven, The Netherlands.
Rugge, L. M. 2001. An avian risk behavior and mortality assessment at the Altamont Pass Wind
Resource Area in Livermore, California. M.S. Thesis, California State University, Sacramento. 156 pp.
Schulze I., M. Colby, M. Conomos, W. Garetz, H. Lacayo, T. Stuart, P. Wilkinson, and C.
Solloway. 1994. A conceptual framework to support the development and use of environmental information. Environmental Indicators Team, United States EPA, Office of Policy, Planning, and Evaluation. Washington, D.C.
Smallwood, K.S. 1993. Understanding ecological pattern and process by association and order. Acta
Oecologica 14(3):443-462. Smallwood, K.S. 2002. Habitat models based on numerical comparisons. Pages 83-95 in predicting
species occurrences: Issues of scale and accuracy, J. M. Scott, P. J. Heglund, M. Morrison, M. Raphael, J. Haufler, and B. Wall, editors. Island Press, Covello, California.
Smallwood, K.S. and W.A. Erickson. 1995. Estimating gopher populations and their abatement in forest
plantations. Forest Science 41:284-296. Smallwood, K. S. and M. L. Morrison. 1999. Spatial scaling of pocket gopher (Geomyidae) density.
Southwestern Naturalist 44:73–82. Smallwood, K. S. and C. Schonewald. 1996. Scaling population density and spatial pattern for terrestrial,
mammalian carnivores. Oecologia 105:329-335. Smallwood, K. S, and C. M. Schonewald. 1998. Study design and interpretation for mammalian
carnivore density estimates. Oecologia 113:474-491. Smallwood, K. S. and C. Thelander. 2004. Developing methods to reduce bird mortality in the Altamont
Pass Wind Resource Area. Final Report to the California Energy Commission, Public Interest Energy Research – Environmental Area, Contract No. 500-01-019. Sacramento, California. 531 pp.
Smallwood, K. S., L. Rugge, S. Hoover, M. L. Morrison, C. G. Thelander. 2001. Intra- and
interturbine string comparison of fatalities to animal burrow densities at Altamont Pass. Pages 23-37 in S. S. Schwartz, ed., Proceedings of the National Avian-Wind Power Planning Meeting IV. RESOLVE, Inc., Washington, D.C.
Strickland, M. D., G. Johnson, W. P. Erickson, and K. Kronner. 2001a. Avian studies at wind plants located at Buffalo Ridge, Minnesota and Vansycle Ridge, Oregon. Pages 38-52 in S. S. Schwartz, ed., Proceedings of the National Avian-Wind Power Planning Meeting IV. RESOLVE, Inc., Washington, D.C.
Strickland, M. D., W. P. Erickson, G. Johnson, D. Young, and R. Good. 2001b. Risk reduction avian
studies at the Foote Creek Rim Wind Plant in Wyoming. Pages 107-114 in S. S. Schwartz, ed., Proceedings of the National Avian-Wind Power Planning Meeting IV. Avian Subcommittee of the National Wind Coordinating Committee, Washington, D.C., 179 pp.

402
Strickland, M. D., D. P. Young, Jr., G. D. Johnson, C. E. Derby, W. P. Erickson, and J. W. Kern. 2000a. Wildlife monitoring studies for the SeaWest Wind Power development, Carbon County, Wyoming. Pages 55-63 in Proceedings of National Avian-Wind Power Planning Meeting III, San Diego, California, May 1998. Prepared for the Avian Subcommittee of the National Wind Coordinating Committee by LGL Ltd., King City, Ontario. 202 pp.
Strickland, M. D., G. D. Johnson, W. P. Erickson, S. A. Sarappo, and R. M. Halet. 2000b. Avian use, flight behavior, and mortality on the Buffalo Ridge, Minnesota, Wind Resource Area. Pages 70-79 in Proceedings of National Avian-Wind Power Planning Meeting III, San Diego, California, May 1998. Prepared for the Avian Subcommittee of the National Wind Coordinating Committee by LGL Ltd., King City, Ontario. 202 pp.
Thelander, C.G. and L. Rugge. 2000a. Bird risk behaviors and fatalities at the Altamont Wind Resource Area. Pg. 5-14, in Proceedings of the National Avian-Wind Power Planning Meeting III. National Wind Coordinating Committee/RESOLVE. Washington, D.C.
Thelander, C. G., and L. Rugge. 2000b. Avian risk behavior and fatalities at the Altamont Wind Resource Area: March 1998 to February 1999. Report to National Renewable Energy Laboratory, Subcontract TAT-8-18209-01. National Technical Information Service, U. S. Department of Commerce, Springfield, VA..
Thelander, C. G. and L. Rugge. 2001. Examining relationships between bird risk behaviors and fatalities
at the Altamont Wind Resource Area: a second year’s progress report Pages 5-14 in S. S. Schwartz, ed., Proceedings of the National Avian-Wind Power Planning Meeting IV. Avian Subcommittee of the National Wind Coordinating Committee, Washington, D.C., 179 pp.
Thelander, C.G., K.S. Smallwood, and L. Rugge. 2003. Bird risk behaviors and fatalities at the Altamont
Wind Resource Area. National Renewable Energy Laboratory: NREL/SR-500-33829. Tucker, V.A, 1996a. A mathematical model of bird collisions with wind turbine rotors. J. Solar Energy &
Engineer. 118: 253-262.
Tucker, V.A, 1996b. Using a collision model to design safer turbine rotors for birds. J. Solar Energy &
Engineer. 118: 263-269.
Ugoretz, S., R. Atwater, W. Fannucchi, and G. Bartelt. 2000. Wind/bird interaction studies in Wisconsin. Pages 88-89 in Proceedings of the National Avian-Wind Power Planning Meeting III. National Wind Coordinating Committee/RESOLVE. Washington, D.C.
USDA. 1994. Agricultural resources and environmental indicators. U.S. Department of Agriculture,
Economic Research Service, Natural Resources and Environment Division. Agricultural Handbook No. 705, Wash., D.C.
Van Vuren, D. and K.S. Smallwood. 1996. Ecological management of vertebrate pests in agricultural
systems. Biological Agriculture and Horticulture 13:41-64.

403
Watt, K. E. F. 1966. Systems ecology. Systems analysis in ecology. Academic Press, New York. Watt, K. E. F. 1992. Taming the future. The Contextured Web Press, Davis, California. Wilcox, B. A., K. S. Smallwood, and J. A. Kahn. 2002. Toward a forest Capital Index. Pages 285-298
in D.J. Rapport, W.L. Lasley, D.E. Rolston, N.O. Nielsen, C.O. Qualset, and A.B. Damania (eds.), Managing for Healthy Ecosystems, Lewis Publishers, Boca Raton, Florida USA.
Winkelman, J. E. 1992. The impact of the Sep wind park near Oosterbierum (Fr.), The Netherlands, on
birds, 1: collision victims. RIN Report 92/2. DLO-Institut voor Bosen Natuuronderzoek, Arnhem, The Netherlands. 71 pp. + Appendices. (c.f., in English summary reported on pages 127-128 in S. S. Schwartz, ed., Proceedings of the National Avian-Wind Power Planning Meeting IV. Avian Subcommittee of the National Wind Coordinating Committee, Washington, D.C., 179 pp.)
Winkelman, J. E. 1995. Bird/wind turbine investigations in Europe. Pages 43-47 and 110-120 in LGL
Ltd., environmental research associates, Ed. Proceedings of National Avian-Wind Power Planning Meeting, Lakewood, Colorado. National Renewable Energy Laboratory, Golden, Colorado. 145 pp.
Zhang, M., S. Geng, and K. S. Smallwood. 1998. Nitrate contamination in groundwater of Tulare
County, California. Ambio 27(3): 170-174. Zhang, M., K. S. Smallwood, and E. Anderson. 2002. Relating indicators of ecological health and
integrity to assess risks to sustainable agriculture and native biota. Pages 757-768 in D.J. Rapport, W.L. Lasley, D.E. Rolston, N.O. Nielsen, C.O. Qualset, and A.B. Damania (eds.), Managing for Healthy Ecosystems, Lewis Publishers, Boca Raton, Florida USA.

F1146-E(12/2004)
REPORT DOCUMENTATION PAGE Form Approved OMB No. 0704-0188
The public reporting burden for this collection of information is estimated to average 1 hour per response, including the time for reviewing instructions, searching existing data sources, gathering and maintaining the data needed, and completing and reviewing the collection of information. Send comments regarding this burden estimate or any other aspect of this collection of information, including suggestions for reducing the burden, to Department of Defense, Executive Services and Communications Directorate (0704-0188). Respondents should be aware that notwithstanding any other provision of law, no person shall be subject to any penalty for failing to comply with a collection of information if it does not display a currently valid OMB control number. PLEASE DO NOT RETURN YOUR FORM TO THE ABOVE ORGANIZATION. 1. REPORT DATE (DD-MM-YYYY)
August 2005 2. REPORT TYPE
Subcontractor Report 3. DATES COVERED (From - To)
March 1998 - September 2001 5a. CONTRACT NUMBER
DE-AC36-99-GO10337
5b. GRANT NUMBER
4. TITLE AND SUBTITLE Bird Mortality at the Altamont Pass Wind Resource Area: March 1998—September 2001
5c. PROGRAM ELEMENT NUMBER
5d. PROJECT NUMBER NREL/SR-500-36973
5e. TASK NUMBER WER5 7401
6. AUTHOR(S) K.S. Smallwood and C.G. Thelander
5f. WORK UNIT NUMBER
7. PERFORMING ORGANIZATION NAME(S) AND ADDRESS(ES) BioResource Consultants PO Box 1539 Ojai, California 93024-1539
8. PERFORMING ORGANIZATION REPORT NUMBER LAT-1-30222-01
10. SPONSOR/MONITOR'S ACRONYM(S) NREL
9. SPONSORING/MONITORING AGENCY NAME(S) AND ADDRESS(ES) National Renewable Energy Laboratory 1617 Cole Blvd. Golden, CO 80401-3393 11. SPONSORING/MONITORING
AGENCY REPORT NUMBER NREL/SR-500-36973
12. DISTRIBUTION AVAILABILITY STATEMENT National Technical Information Service U.S. Department of Commerce 5285 Port Royal Road Springfield, VA 22161
13. SUPPLEMENTARY NOTES NREL Technical Monitor: K. Sinclair
14. ABSTRACT (Maximum 200 Words) Over the past 15 years, research has shown that wind turbines in the Altamont Pass Wind Resource Area (APWRA) kill many birds, including raptors, which are protected by the Migratory Bird Treaty Act (MBTA), the Bald and Golden Eagle Protection Act, and/or state and federal Endangered Species Acts. Early research in the APWRA on avian mortality mainly attempted to identify the extent of the problem. In 1998, however, the National Renewable Energy Laboratory (NREL) initiated research to address the causal relationships between wind turbines and bird mortality. NREL funded a project by BioResource Consultants to perform this research directed at identifying and addressing the causes of mortality of various bird species from wind turbines in the APWRA.With 580 megawatts (MW) of installed wind turbine generating capacity in the APWRA, wind turbines there provide up to 1 billion kilowatt-hours (kWh) of emissions-free electricity annually. By identifying and implementing new methods and technologies to reduce or resolve bird mortality in the APWRA, power producers may be able to increase wind turbine electricity production at the site and apply similar mortality-reduction methods at other sites around the state and country.
15. SUBJECT TERMS wind energy; wind turbine; avian issues; bird mortality; Altamont Pass; California; raptors
16. SECURITY CLASSIFICATION OF: 19a. NAME OF RESPONSIBLE PERSON a. REPORT
Unclassified b. ABSTRACT Unclassified
c. THIS PAGE Unclassified
17. LIMITATION OF ABSTRACT
UL
18. NUMBER OF PAGES
19b. TELEPHONE NUMBER (Include area code)
Standard Form 298 (Rev. 8/98) Prescribed by ANSI Std. Z39.18