
NRDC: Pollution Unchecked in Greene County, Pennsylvania · PDF fileA Case Study of Greene...
74
POLLUTION UNCHECKED A Case Study of Greene County, Pennsylvania Authors Erik D. Olson, Natural Resources Defense Council Mayra Quirindongo, Natural Resources Defense Council Natural Resources Defense Council Pennsylvania Environmental Council Monongahela Riverkeeper December 2004
Transcript of NRDC: Pollution Unchecked in Greene County, Pennsylvania · PDF fileA Case Study of Greene...

POLLUTION UNCHECKED
A Case Study of Greene County, Pennsylvania
AuthorsErik D. Olson, Natural Resources Defense CouncilMayra Quirindongo, Natural Resources Defense Council
Natural Resources Defense CouncilPennsylvania Environmental CouncilMonongahela RiverkeeperDecember 2004

ABOUT NRDCThe Natural Resources Defense Council is a national nonprofit environmental organi-zation with more than 1 million members and online activists. Since 1970, our lawyers,scientists, and other environmental specialists have worked to protect the world’snatural resources, public health, and the environment. NRDC has offices in New YorkCity, Washington, D.C., Los Angeles, and San Francisco. Visit us at www.nrdc.org.
ABOUT MONONGAHELA RIVERKEEPERMonongahela Riverkeeper is sponsored by the Monongahela River Society, a small non-profit organization focused on issues related to the quality of public drinking sourcewater and the impact of pollution on public health. For additional information, pleasecontact the Monongahela River Society at 28 Church Street, Waynesburg, PA 15370.
ABOUT PECThe Pennsylvania Environmental Council improves quality of life for all Pennsylvaniansby enhancing the Commonwealth’s natural and built environments by integratingadvocacy, education, and implementation of community and regional action projects.The Council values reasoned and long-term approaches that include the interests ofall stakeholders to accomplish its goals. Visit us on the web at www.pecpa.org orcontact us at 22 Terminal Way, Pittsburgh, PA 15219; 412-481-9400.
ACKNOWLEDGMENTSThe Natural Resources Defense Council gratefully acknowledges The Heinz Endow-ments and The New York Community Trust for their generous support. The authorswould also like to thank the following individuals for their helpful comments andguidance: Farley Toothman of Monongahela Riverkeeper, John Walliser and DavittWoodwell of Pennsylvania Environmental Council (PEC), Lisa Evans of Clean Air TaskForce (CATF), Cyril A. Fox (consultant to PEC), Bill Hopwood of Hopwood, Inc., DavidMcIntosh of NRDC, Charles H. Norris of Geo-Hydro, Inc., and Jeffrey Stant (consultantto CATF). Thanks to Lucas Miller and Dade Thorton for helping with the research,and to Carrie Forrester for her early documentation of Greene County problems.
NRDC Reports Manager: Alexandra KennaughEditor: Shanti MenonProduction: Bonnie GreenfieldCover Design: Jenkins & PageNRDC President: John AdamsNRDC Executive Director: Frances BeineckeNRDC Director of Communications: Alan Metrick
Copyright 2004 by the Natural Resources Defense Council.
For additional copies of this report, send $7.50 plus $3.95 shipping and handling to NRDC Reports Department, 40West 20th Street, New York, NY 10011. California residents must add 7.5% sales tax. Please make checks payable toNRDC in U.S. dollars.
This report is printed on paper that is 80 percent recycled, 60 percent post-consumer waste, and processed chlorine free.
ii
Harboring Pollution
POLLUTION UNCHECKEDA Case Study of Greene County, Pennsylvania
December 2004

Executive Summary iv
Recommendations viii
Chapter 1: Overview of Greene County 1Environmental Factors Affecting Greene County 2How NRDC Conducted This Study 3
Chapter 2: Sources of Water Pollution 5Monongahela Water Quality 5Coal Mining and Contaminated Mine Drainage 7Water Pollution from Power Plants 13Pollution from Sewage 27Industrial, Waste Disposal, and Hazardous Waste Sites 27Polluted Runoff 28
Chapter 3: Drinking Water Quality Problems 30Southwestern Pennsylvania Water Authority 31Brave Water Authority 34Carmichaels Municipal Water Authority 35Dunkard Valley Joint Municipal Water Authority 37East Dunkard Water Association 41Mt. Morris Water & Sewage Authority 48
Chapter 4: Sources of Air Pollution 49Hatfield’s Ferry Power Station 52Fort Martin Power Station 57
Chapter 5: Conclusion 60
Appendix 1: Databases Consulted 62
Appendix 2: Additional Air Pollution Data 64
Endnotes 65
iii
CONTENTS
POLLUTION UNCHECKEDA Case Study of Greene County, Pennsylvania
December 2004
Greene County, a predominantly low-income Appalachian community in thesouthwestern corner of Pennsylvania, suffers from serious air and water
pollution. A variety of sources, including abandoned mining sites and two majorAllegheny Energy power plants, release large quantities of pollutants into theenvironment. The U.S. Environmental Protection Agency (EPA) has alreadydesignated Greene County as an unhealthy air area (non-attainment area) dueto ozone pollution and has also proposed designating Greene County as a non-attainment area for particulate matter pollution. Cancer rates in Greene County aresubstantially higher than state and national averages. Despite the obvious healthrisks county residents face, state and federal officials have repeatedly allowedinadequate monitoring of air and water pollution and have made no significanteffort to collect data on possible health effects linked to pollution in Greene County.The problems NRDC uncovered in Greene County, while perhaps extreme, are notunique; residents in other parts of Pennsylvania and the Appalachian region facesimilar issues. The county’s problems illustrate substantial shortcomings in state andfederal regulatory programs and enforcement, some of which may plague manyother communities in the nation.
Working in cooperation with, and at the request of, the Pennsylvania EnvironmentalCouncil (PEC) and local citizens, NRDC launched an investigation to determine theextent of pollution problems in Greene County. This report details the results of NRDC’sextensive examination of government documents and computer databases.
HEALTH EFFECTS OF POLLUTIONMany of the air and water contaminants to which Greene County residents areexposed pose known health threats. For example:
� Arsenic, found in much county tap water, causes bladder, lung, and other cancers.1
� Ozone in the county’s air makes it hard for some people to breathe. Children, theelderly, people with asthma or other lung ailments, and those who work or exerciseregularly outdoors are most susceptible to ozone. It can permanently harm thelungs,2 and recently has been linked to certain birth defects.3
� Particulate matter (PM) in polluted county air can aggravate asthma, increaserespiratory symptoms like coughing and painful breathing, cause chronic bronchitisand decreased lung function, and can trigger premature death.4
� Sulfur dioxide (SO2), one of the principal pollutants released by power plants, isassociated with low birth weight and the onset of asthma attacks.5
� Bacteria and parasites in drinking water or recreational water can cause gastro-intestinal disease, vomiting, diarrhea, and in vulnerable people, serious infectionsand even death.6
� Manganese, found in much county tap water, has been linked with neurologicaland cognitive impairments.7
iv
EXECUTIVE SUMMARY
POLLUTION UNCHECKEDA Case Study of Greene County, Pennsylvania
December 2004
� Beryllium, pumped into the county air in large quantities by local power plants, cancause lung damage and is a “probable human carcinogen,” according to the EPA.
Based upon the limited available data, it has been projected that nearly all40,000 county residents face a pollution-related cancer risk greater than 100 timesthe goal set by federal policy (one in 1 million lifetime cancer risk).8 In fact, GreeneCounty was ranked as one of the “dirtiest/worst counties in the United States”(worst 10 percent) based on total environmental releases, cancer risk, and non-cancerrisk.9 The extent of the pollution also raises concerns about children’s health anddevelopment in the county and surrounding areas. As noted above, prenatalexposures to pollutants such as ozone are suspected of causing birth defects, whileothers, such as manganese, are associated with delayed psychomotor developmentin children.10
AIR POLLUTIONHatfield’s Ferry and Fort Martin power plants are the most significant local sourcesof air pollution in Greene County—Hatfield’s Ferry is the second largest air polluterin Pennsylvania.11 Both plants have a history of regulatory compliance problemsstretching back over 30 years.
Annually, the two plants release approximately 99 million pounds of nitrogenoxides and 511 million pounds of sulfur oxides into the air. In 2001, Hatfield’s Ferrywas the largest source of SO2 in the United States.12
In addition, both plants emit millions of pounds of heavy metals and other toxinsinto the air. In 2002, Hatfield’s Ferry was responsible for more than half of the entirestate’s air emissions of the dangerous metal beryllium. The plant pumped morethan 3,900 pounds of arsenic into the air in 2002—21 percent of the state’s airemissions of arsenic. The Fort Martin plant self-reported 210 pounds of arsenicemissions to the air in 2002.13
Other significant toxic releases included barium, chromium, cobalt, copper,dioxin, hydrochloric acid, hydrogen fluoride, lead, manganese, mercury, nickel,selenium, sulfuric acid, vanadium, and zinc. However, the county’s only ambientair quality monitoring station does not test for any of these hazardous air pollutants,so actual exposure data for residents are nonexistent. NRDC discovered that bothpower plants also have violated opacity standards on numerous occasions—anindication of PM pollution.
DRINKING WATER RISKS AND WATER POLLUTIONSpotty compliance records and detections of contaminants in public drinking watersupplies also pose health concerns.14 Two local water supplies have been found tocontain arsenic, a potent cancer-causing agent, at levels up to three times higherthan the EPA’s new 10 parts per billion (ppb) standard (which becomes enforceablein 2006).15 The risk of dying from cancer from drinking water containing this level
v
Pollution Unchecked
Greene County
was ranked as one
of the “dirtiest/
worst counties in
the United States.”
of arsenic for a lifetime, according to National Academy of Sciences estimates, isabout 1 in 100.16 Some local water systems also have failed bacteria, filtration, orother drinking water requirements. In one instance, water authority employeesfound rat remains clogging a customer’s water meter and tap.
It is not possible to pinpoint with certainty the source of the arsenic in localwater supplies, but it is a concern that in 2002 the Hatfield’s Ferry power plantreleased or transferred 15,000 pounds of arsenic to land.17 It also is a concern thathigh levels of arsenic and certain other heavy metals and other inorganic con-stituents that are fingerprints for coal waste or coal ash have been found in ground-water and surface water at or near the two big power plants, and that dischargesfrom the two plants sometimes contain metals at elevated levels. Furthermore,certain abandoned mine discharges in Greene and neighboring Fayette countieshave been found to contain elevated arsenic concentrations. Again, there are majorgaps in the discharge monitoring, groundwater monitoring, and monitoring of theMonongahela and its tributaries in the Greene County area. Even so, NRDC hasuncovered numerous violations of water permits from power plants and otherpollution sources.
Other environmental pollution sources in Greene County include:
� contamination from abandoned and active coal mines;
� “wildcat sewers” that discharge untreated sewage into the Monongahela and itstributaries immediately upstream of Greene County water supply intakes;
� hazardous waste disposal areas;
� other upstream or upwind pollution sources.
INADEQUATE MONITORING AND ENFORCEMENTOur detailed review has shown that despite the potential health risks due to pollu-tion, state and federal officials have repeatedly allowed monitoring waivers orinsufficient testing for air and water pollution in Greene County. County air pollutionis monitored at only one site and only for three pollutants, and monitoring for manyair and water pollutants at the big power plants is infrequent or nonexistent. More-over, water quality testing of the Monongahela River, its tributaries, and recharginggroundwater is rare and generally ignores key contaminants. In addition, Penn-sylvania Department of Environmental Protection (PA DEP) officials have waivedmany drinking water safety monitoring requirements for Greene County waterutilities, such as tests for arsenic, pesticides, and many industrial chemicals, in amanner that NRDC believes is unlawful—using a statewide blanket waiver thatallows most utilities to test for many contaminants only once every nine years. Thisvirtually guarantees that the extent of local tap water contamination is poorly under-stood, and that local citizens are not informed of potentially risky contaminants intheir water. And despite the numerous violations NRDC uncovered in state records,enforcement has been weak to nonexistent.
vi
Natural Resources Defense Council
Despite the numerous
violations NRDC
uncovered in state
records, enforcement
has been weak to
nonexistent.

In addition, NRDC found no substantial effort by government officials to collectdirect data on possible health effects linked to pollution in the county. The overallcancer rate, and the rate of certain cancers such as lung cancer, are higher in GreeneCounty than statewide or nationally, though making any link to environmentalcauses would require further study. Better data will be crucial in order to identifypossible disease clusters and to track the progress of environmental and healthprotection efforts.
vii
Pollution Unchecked

viii
Natural Resources Defense Council
Monitoring and Health Tracking� State DEP officials and local water utilities should assure thatthere is routine monitoring of microbial contaminants, arsenic,and other heavy metals indicative of mine discharge or powerplant waste in ambient water in the Monongahela and at drinkingwater intakes.� Monitoring for arsenic and other toxic metals is needed in thetributaries and groundwater that drain coal ash dumps, coal ashminefills, and mine drainage areas.� The PA DEP should revoke the nine-year monitoring waivers forGreene County and other water systems, particularly for contami-nants often found in mine discharges, as well as discharges andrunoff from coal ash ponds, landfills, and minefills.� The Pennsylvania and West Virginia DEPs should strengthen theNational Pollution Discharge Elimination System (NPDES) permitsand the ash disposal landfill permits for power plants by requiringcomprehensive, at least monthly monitoring of arsenic, heavymetals, and other hazardous constituents of coal ash at all outfallsand in nearby streams and groundwater.� The existing ambient air quality monitoring station in Holbrookshould be improved to test for a wider array of air pollutants,including PM and high-volume power plant pollutants like arsenic. � At least one additional ambient air quality monitoring stationshould be established near the Hatfield plant in the prevailingdownwind direction. It should monitor for all criteria pollutants andfor key hazardous pollutants emitted by the power plant.� The EPA should review the adequacy and legality of statemonitoring and permit requirements, such as Pennsylvania’swidespread use of nine-year monitoring wavers and extremelylimited NPDES and air monitoring.� A citizen monitoring campaign for the Monongahela should bedeveloped. NRDC is prepared to work with PEC and others topinpoint monitoring locations and parameters.� Local and state officials should develop a significantly improvedpublic health tracking system (including asthma, birth defects, andother health data) to evaluate the health status of Greene Countyand other state residents who may be affected by pollution andother health threats.
Stronger Permits� The Pennsylvania and West Virginia DEPs should establish strictpermit limits for arsenic and heavy metal air emissions and waterdischarges at the Hatfield and Fort Martin plants.� The PA DEP should impose strict, enforceable limits on ground-water contamination and surface water runoff from the residualwaste landfill at Hatfield for heavy metals, including arsenic and otherhazardous contaminants like boron, manganese, and molybdenum.� A comprehensive state review of the adequacy of the ash dis-posal permits is needed at both the Fort Martin and Hatfield’s
RecommendationsThe problems identified in this report are not exclusive to Greene County. Contaminated mine drainage from both activeand abandoned coal mines, air emissions from highly polluting power plants, hazardous waste sites, wildcat sewers, andother pollution sources found in Greene County are also present in many other areas of Pennsylvania and the region. Soare many of the deficiencies in state activities identified in this report: inadequate monitoring of air and water quality, poorenforcement of clean air and clean water laws, and insufficient collection of data on the health effects of environmentalcontamination. Therefore, the recommendations outlined here are applicable to other areas of the state.
Ferry plants to ensure that groundwater and surface water con-tamination with heavy metals and other contaminants, as well asfugitive emissions, is fully controlled.� The PA DEP should conduct a system-wide review of the residualwaste permits at coal-fired power plants to ensure that similardeficiencies are not threatening other drinking water sources withcontamination from coal ash.� The EPA should review the adequacy of state NPDES permits andresidual waste handling requirements.
Enforcement� Pennsylvania officials should follow through on the threatenedair pollution lawsuits against the Fort Martin and Hatfield’s Ferrypower plants.� Pennsylvania and West Virginia DEP officials should swiftlypunish all permit and clean air and water rule violations byAllegheny Energy power plants.� Pennsylvania and West Virginia officials should conduct acomprehensive compliance audit of the two big Allegheny Energypower plants, release the results, and bring enforcement action toaddress additional discovered violations.� The EPA should implement a vigorous New Source Review ruleand enforcement program to address power plant pollution.
Citizen Involvement� Citizen groups at the local, state, and national level shouldcooperatively set up an extensive citizen monitoring effort for theMonongahela and key tributaries in Greene County.� Citizen groups, such as the Monongahela Riverkeeper, PEC, andother local organizations, should be supported in efforts toaggressively oversee government and polluter monitoring of localair and water pollution, discover (and if necessary enforce against)violations, and conduct citizen monitoring.� Citizen groups also should receive support to educate local andregional media, local, state, and federal officials, and GreeneCounty and other citizens about the extent of the environmentalhealth threats in the county, and what can be done about them.� Local, statewide, and national citizen groups should develop anaggressive public education and advocacy campaign to assure thatenvironmental rules are met and polluters clean up.� Citizen groups should consider petitioning the DEP for strongerpermit requirements for Fort Martin and Hatfield, including morecomprehensive monitoring and strict discharge limits, and for anexamination of other coal-fired power plants to uncover similarpermitting problems.� Citizen groups should consider initiating citizen suits against theFort Martin and Hatfield’s Ferry plants for air, water, and solidwaste rule and permit violations if the states fail to do so or do notaggressively prosecute enforcement cases.

OVERVIEW OFGREENE COUNTY
Nestled in the heart of Appalachia, in the southwestern corner of Pennsylvaniabordering West Virginia, Greene County is a predominantly low-income
rural county with about 40,000 residents and 16,600 housing units. According tothe 2000 Census, the per capita income in the county, $14,959, is far below the stateaverage of $21,000; the poverty rate (16 percent) is substantially higher than the stateaverage (11 percent); and the median county home is worth $59,600, about half thestate median.18
Greene County stands out among other counties in the United States for theamount of toxic pollution threatening the health of county residents. Greene Countyfigured in the top 2 percent of counties in the United States for total air emissionsof toxic contaminants in 2002, with 7.2 million pounds, ranking 38th among the2,260 counties where air emissions were reported.19 As one of the country’s topcoal producers, Greene County also suffers from water quality problems causedby over a century of surface and deep coal mining, with contaminated drainagefrom active and abandoned mines causing widespread pollution of groundwaterand surface water. In addition, millions of tons of coal ash from two powerplants (Hatfield’s Ferry in Greene County and Fort Martin in Maidsville, WestVirginia) have been dumped in landfills and surface mines in Greene Countyand its vicinity over nearly four decades, becoming a major source of contaminationwith heavy metals and other toxic substances. Much of this pollution eventuallyenters the Monongahela River, which supplies most of the drinking water forcounty residents.
Cancer statistics show a marked difference between Greene County and the restof the country. Cancer incidence and mortality rates are 8.8 and 8.1 percent higher,respectively, than U.S. rates. Although differences in cancer rates between GreeneCounty and the state of Pennsylvania are not as striking, they still compare unfavor-ably to state rates. Cancer incidence in the county is 2.7 percent higher, and cancermortality is 4.3 percent higher than in the state at large.20 So far, there has been nosignificant effort by health authorities to determine how environmental factors maybe influencing cancer rates, or to track the incidence of other diseases that may becaused or aggravated by exposure to environmental pollutants. The current shortageof primary care physicians in Greene County also raises concerns that residents maynot be able to obtain good quality health care in a timely manner.21
1
CHAPTER 1
POLLUTION UNCHECKEDA Case Study of Greene County, Pennsylvania
December 2004

ENVIRONMENTAL FACTORS AFFECTING GREENE COUNTYGreene County residents are exposed to air and water pollutants that have beenscientifically linked to known health threats, including cancer, asthma and otherrespiratory diseases, heart attacks, and a variety of other health consequences. Thearsenic found in much county tap water, for example, is known to cause bladderand lung cancer,22 and ozone causes respiratory problems, especially in children,the elderly, people with asthma or other lung ailments, and people who spend alot of time outdoors.23 Particulate matter aggravates asthma, causes coughing andbreathing difficulty, chronic bronchitis, and can cause premature death.24 Parasitesin tap water or recreational water can cause vomiting, diarrhea, and in people withcompromised immune systems, serious infections and even death.25
NRDC has been unable to discover any serious effort by local, state, or federalgovernment officials to collect data on the possible health effects linked to pollutionin the county. However, there are reasons for concern. For example, according toNational Cancer Institute data, the annual cancer death rate in Greene County from1998 to 2001 was 216 deaths per 100,000 people and has been rising in recent years.26
Greene County’s cancer death rate is higher than the state average (207.1), and sig-nificantly above the national average (199.9), placing it in the worst 10 of Pennsylvania’s67 counties. Similarly, the cancer incidence rate in Greene County in the period from1998 to 2000 was 505.1 cases per 100,000 people, also significantly higher than theU.S. rate of 464.2 and the state rate of 491.7. Additional study would be needed toestablish whether environmental factors are contributing to this higher cancer rate.
Greene County has a lung cancer incidence and death rate that is much higherthan average Pennsylvania or U.S. rates (Table 1). In fact, Greene County ranks thirdamong Pennsylvania’s 67 counties for lung cancer incidence, and fourth for lung
2
Natural Resources Defense Council
TABLE 1Comparison of Cancer Rates
Cancer site Greene County Pennsylvania United States Greene County Pennsylvania United States
Bladder 23.1 24.8 21.5 3 or fewer 4.7 4.4
Breast 118.3 132.4 128.9 26.0 28.8 27.0
Cervix 5 or fewer 9.3 9.2 3 or fewer 2.9 2.9
Colon and rectum 69.1 62.4 54.6 20.0 23.4 20.8
Kidney and renal pelvis Not available 13.3 12.0 3 or fewer 4.3 4.2
Lung and bronchus 86.0* 69.2 67.4 66.2** 56.2 55.7
Non-Hodgkin’s lymphoma Not available 19.9 18.1 6.4 8.9 8.4
Prostate 216.4 166.8 160.4 19.4 31.8 31.5
Stomach 5 or fewer 7.9 7.3 3 or fewer 4.6 4.7
All cancers 505.1 491.7 464.2 216.0 207.1 199.8
Source: National Cancer Institute, State Cancer Profiles
Bold indicates rates higher than state and national averages.
**The lung cancer incidence rate places Greene County in 3rd place among the 67 PA counties.**The lung cancer death rate places Greene County in 4th place among the 67 PA counties.
D E AT H S ( P E R 1 0 0 , 0 0 0 P E O P L E ) 1 9 9 7 – 2 0 0 1I N C I D E N C E ( P E R 1 0 0 , 0 0 0 P E O P L E ) 1 9 9 8 – 2 0 0 0

cancer deaths. Again, additional study is needed to determine what, if any,environmental contribution there is to the county’s lung cancer rate. Other potentialconfounders, such as smoking rates, must be assessed, but the PennsylvaniaDepartment of Health has reported that the percentage of smokers in this area is notsignificantly different from the rest of the state.27
Greene County also has a much higher rate of prostate cancer than the UnitedStates or the state of Pennsylvania, although the death rate from this type of canceris lower. The incidence of cancer of the colon and rectum is also higher in GreeneCounty. Lung, prostate, and colorectal cancer appear to be the main contributors tothe higher overall cancer rate. Although the county tends to have lower rates ofseveral other types of cancer than the rest of the state or the United States as a whole,it is still falling far short of the goal of the U.S. Department of Health’s Healthy People2010 program to reduce the overall cancer death rate to 159.9 by the year 2010.28
Greene County residents are exposed to a wide variety of air and water pollutants,and the overall county cancer rate is substantially higher than state and national aver-ages. Therefore, there is a need for serious study and tracking of the possible adversehealth problems that may be associated with the county’s environmental pollution.
While Pennsylvania tracks cancer information well, receiving an “A” from theTrust for America’s Health (a national public health group) for its cancer trackingsystem, the state does not track disease rates for many other illnesses that havebeen linked to environmental causes or are suspected of having environmentalcomponents, including asthma, cerebral palsy, autism, mental retardation, and auto-immune disease. 29 The state also recently received a “D” grade for its health trackingof birth defects from the Trust for America’s Health.30 In addition, Pennsylvania hasjust 37 health workers per 100,000 residents, which is the lowest number of healthworkers per capita of any state in the country—less than one-fourth the nationalaverage of 158 per 100,000.31
Greene County residents face elevated environmental health risks, yet havemore limited health care options than Pennsylvania residents in general. There isno county health department, and although the percentage of adults lacking healthinsurance in Greene County is not significantly different from the state average(12.2 percent versus 11.9 percent, respectively), most of the county is considered aHealth Professional Shortage Area—an area with a critical shortage of primary carephysicians.32 With a higher poverty rate and lower per capita income than the restof the state, people living in these underserved areas may find it difficult to obtainproper health care. Meanwhile, the Greene-Fayette-Washington County area hasa significantly higher percentage of the population reporting fair or poor health(17.5 percent) than the state average (14.0 percent).33
HOW NRDC CONDUCTED THIS STUDYThe PEC and others raised substantial questions about the possible adverse healthimpacts of major pollution sources in the area, including the two large coal-firedpower plants.34 At the request of the PEC and local citizens, NRDC launched an
3
Pollution Unchecked
Most of the county
is considered a
Health Professional
Shortage Area—an
area with a critical
shortage of primary
care physicians.
investigation to determine the extent of pollution problems in the county. With helpand advice from the PEC and local experts, NRDC conducted an extensiveinvestigation of paper files and computer databases. NRDC submitted open recordsand freedom of information requests for data to Pennsylvania and West Virginiaofficials, and reviewed tens of thousands of pages of files in DEP offices in Pittsburghand California, Pennsylvania and Charleston, West Virginia.
NRDC evaluated information contained in permit files, records of violations,correspondence, notices, inspection reports, citizen complaints, and other informationavailable in state files. We also reviewed data available in electronic databases housedat EPA, including the Toxics Release Inventory (TRI), Envirofacts, Superfund/hazardouswaste (e.g., CERCLIS), drinking water (SDWIS), surface water discharge, permitcompliance (PCS), groundwater/surface water storage and retrieval (STORET),Enviromapper; Environmental Compliance History Online (ECHO) and otherdatabases; U.S. Geological Survey databases (e.g., NWIS and NAWQA); the U.S.Department of Interior database on abandoned mines (AMLIS); and PennsylvaniaDEP databases (e.g., EFACTS, eMap PA, and DWRS).
4
Natural Resources Defense Council
SOURCES OFWATER POLLUTION
The Monongahela River, which separates Greene and Fayette counties, flows northfrom West Virginia into Pennsylvania and is the main drinking water source for
Greene County residents. The Upper and Lower Monongahela River watersheds,which drain into the segment of the river running through Greene and Fayettecounties, cover a total area of 1,913 square miles in the states of Pennsylvania andWest Virginia.35 Extensive coal mining in the area has long been a major source ofwater pollutants, which are discharged from active and abandoned mines. Disposalof coal ash from the Hatfield’s Ferry and Fort Martin power stations is anothersignificant source of contaminants. Other factors that degrade water quality in theMonongahela include untreated sewage, industrial discharges, agricultural runoff,oil and gas wells, toxic waste sites, and urban stormwater runoff.
MONONGAHELA WATER QUALITYThe most recent PA DEP stream assessment report classified the Monongahela Riverwatershed as highly degraded by point and nonpoint pollutants ranging from acidmine drainage to sewage. Water quality problems in the watershed include elevatedtemperatures, reduced dissolved oxygen, increased iron and sulfate levels, and highturbidity and suspended solids. Forty-seven water bodies in the Upper and LowerMonongahela River watersheds have been classified as “impaired” for their desig-nated uses by the states of Pennsylvania and West Virginia. Causes of impairmentinclude metals, PCBs, inorganic chemicals, suspended solids, pH, salinity, and silta-tion. Only two impairments are listed for the Monongahela River itself: the pesticidechlordane and PCBs. This is not necessarily indicative of water quality in the riverbecause of the low monitoring frequency and the small number of locations sampled.
According to a Source Water Assessment prepared for Southwestern PennsylvaniaWater Authority, the largest of the public water systems serving Greene County, thereare 1,078 potential sources of water contamination that may affect the system’s intakewater, including point sources such as industrial wastewater discharges, and non-point sources such as contaminated mine drainage, barge traffic, and toxic wastesites. When these were ranked according to their potential threat, with “A” repre-senting the greatest threat and “F” the lowest, over 90 percent of those potentialsources were ranked as “A” or “B.”
5
CHAPTER 2
POLLUTION UNCHECKEDA Case Study of Greene County, Pennsylvania
December 2004

6
Natural Resources Defense Council
TABLE 2Source Water Analysis (Monongahela River), Average Concentrations
Maximum 1998 1999 2000 2001Contaminant Level Concentration Concentration Concentration Concentration
Chemical (ppm) (ppm) (ppm) (ppm) (ppm)
Aluminum 0.2 0.21 0.035 0.101 0.829
Arsenic 0.050 0.0015 Not detected Not detected Not detected
Barium 2 0.043 0.043 0.043 0.049
Cadmium 0.005 Not detected Not detected Not detected Not detected
Copper 1.3 0.012 0.058 0.068 0.063
Fluoride 4.0 Not detected 0.115 Not detected 0.08
Iron 0.3 0.39 0.23 0.250 1.505
Lead 0.015 Not detected Not detected Not detected 0.0023
Manganese 0.05 0.141 0.091 0.061 0.099
Selenium 0.05 Not detected Not detected Not detected Not detected
Sodium — 21.2 32.5 21.6 14.87
Sulfate 250 101 Not detected 110.6 78.4
Total Phosphorus — 0.015 Not detected Not detected Not detected
Zinc 5 0.017 0.009 0.051 0.020
Source: Morgantown Utility Board, as reported in Annual Drinking Water Quality Reports of Brave Water Authority and Mt. Morris Water and Sewage Authority.
Concentrations exceeding drinking water quality standards (Maximum Contaminant Levels, or MCLs) are shown in bold. MCLs for aluminum, fluoride, iron,manganese, sulfate, and zinc are non-enforceable secondary standards.
TABLE 3Monongahela River Water Quality in Greene/Fayette County Area, PA, 1995–2004
Monongahela River Average Range MCL or SMCL Number ofParameter Sampling Location (ppm) (ppm) (ppm) Samples
Aluminum, Total At Lock & Dam #8-Point Marion 0.951 0.135–4.1400.5
46Point Marion 0.491 0.200–2.100 31
Copper, Total At Lock & Dam #8-Point Marion 0.00126 Not detected–0.0161.3
46Point Marion 0.01039 0.0100–0.016 31
Iron, Total At Lock & Dam #8-Point Marion 1.5169 0.0810–7.6000.3
46Point Marion 0.8422 0.1440–2.525 31
Lead, Total At Lock & Dam #8-Point Marion 0.0008 Not detected–0.00510.015
46Point Marion 0.0015 0.0010–0.0079 31
Manganese, Total At Lock & Dam #8-Point Marion 0.1846 0.0530–0.38900.05
46Point Marion 0.1444 0.0710–0.2220 31
Nickel, Total At Lock & Dam #8-Point Marion Not detected Not detected—
36Point Marion 0.0500 0.0500–0.0500 31
Sulfate, Total At Lock & Dam #8-Point Marion 104.57 Not detected–258.0250.0
46Point Marion 97.64 32.0–242.0 33
Zinc, Total At Lock & Dam #8-Point Marion 0.0416 Not detected–0.16701.3
46Point Marion 0.0332 0.0100–0.1640 31
Source: EPA Storage and Retrieval (STORET) database; data collected by Pennsylvania Department of Environmental Protection.
*Bolded results exceeded the Maximum Contaminant Level (MCL) or Secondary MCL (SMCL).
Source water analyses of the Monongahela River completed occasionally for theMorgantown Water Utility Board (which supplies water to Brave Water Authorityand Mt. Morris Water and Sewage Authority) show that aluminum, iron, and manga-nese exceeded non-enforceable secondary drinking water standards (Table 2). Whilethese inorganics have no enforceable health standards, they often are an indicationthat mine drainage, coal mining, and coal ash have polluted the water. Often, thesepollution sources also are associated with other heavy metals of substantial healthconcern, such as arsenic, cadmium, and mercury. No information was provided asto how many samples or sampling locations were included in the analysis.
PA DEP water quality monitoring of the Monongahela River also has shown highlevels of aluminum, iron, and manganese at the two sampling stations in Point Marion(Table 3). The stations are located downstream of Fort Martin, but upstream of theHatfield’s Ferry power plant. These metals can leach out of coal ash, but they arealso found in mine drainage, which is a significant source of water pollution for theMonongahela. Aluminum concentrations averaged 0.951 and 0.491 parts per million(ppm) at these locations, which is significantly above the secondary drinking waterquality standard of 0.2 ppm. The average iron concentrations (1.5169 and 0.8422 ppm)also exceeded the corresponding secondary standard of 0.3 ppm. Manganese aver-aged 0.1846 and 0.1444 ppm, also above its secondary standard of 0.05 ppm.
COAL MINING AND CONTAMINATED MINE DRAINAGEAccording to the PA DEP, mining accounts for more than 70 percent of the water-shed’s degradation.36 Approximately 75 percent of the point sources in the watershed
7
Pollution Unchecked
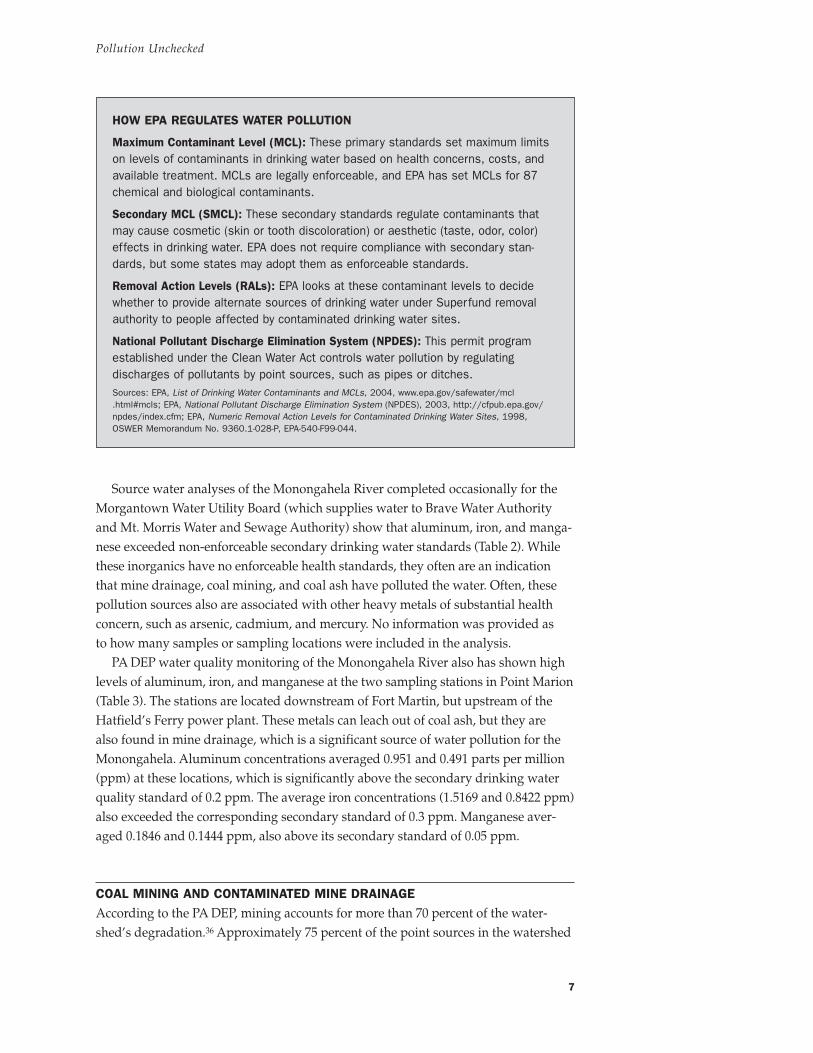
HOW EPA REGULATES WATER POLLUTION
Maximum Contaminant Level (MCL): These primary standards set maximum limitson levels of contaminants in drinking water based on health concerns, costs, andavailable treatment. MCLs are legally enforceable, and EPA has set MCLs for 87chemical and biological contaminants.
Secondary MCL (SMCL): These secondary standards regulate contaminants thatmay cause cosmetic (skin or tooth discoloration) or aesthetic (taste, odor, color)effects in drinking water. EPA does not require compliance with secondary stan-dards, but some states may adopt them as enforceable standards.
Removal Action Levels (RALs): EPA looks at these contaminant levels to decidewhether to provide alternate sources of drinking water under Superfund removalauthority to people affected by contaminated drinking water sites.
National Pollutant Discharge Elimination System (NPDES): This permit programestablished under the Clean Water Act controls water pollution by regulatingdischarges of pollutants by point sources, such as pipes or ditches.Sources: EPA, List of Drinking Water Contaminants and MCLs, 2004, www.epa.gov/safewater/mcl.html#mcls; EPA, National Pollutant Discharge Elimination System (NPDES), 2003, http://cfpub.epa.gov/npdes/index.cfm; EPA, Numeric Removal Action Levels for Contaminated Drinking Water Sites, 1998,OSWER Memorandum No. 9360.1-028-P, EPA-540-F99-044.
are related to surface and deep coal mining activities.37 The Monongahela River,Whiteley Creek, and Little Whiteley Creek all receive contaminated mine drainage(CMD). Figure 1 shows active and abandoned mining sites in areas of Greene andFayette counties that drain into the stretch of the Monongahela River separating thetwo counties.
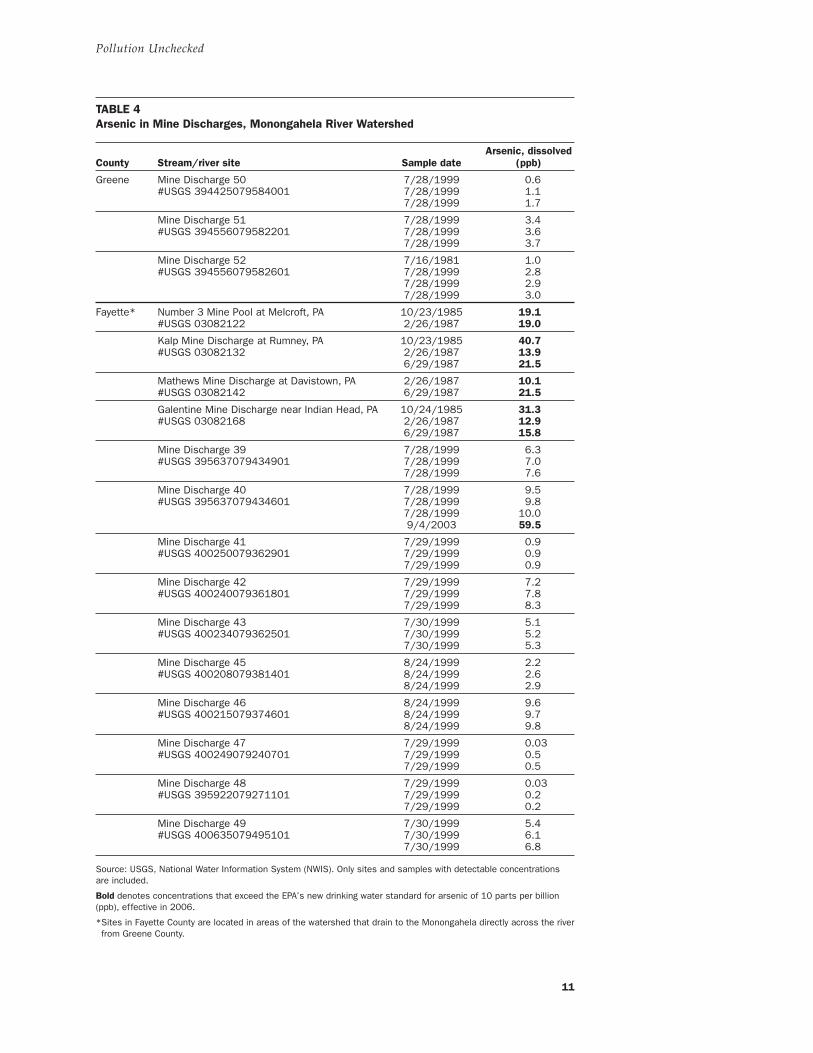
United States Geological Survey (USGS) and other monitoring along severalstretches of the Monongahela in coal country has found elevated levels of manyheavy metals, including arsenic, resulting from coal mining activity and acid minedrainage.38 In addition to runoff or groundwater discharge from the ash disposal atpower plants, coal mines are likely sources of the arsenic found in some of GreeneCounty’s drinking water supplies (see Figures 2 and 3). Testing of mine discharges inGreene and Fayette counties has found arsenic concentrations up to 59.5 ppb (nearlysix times the EPA’s new drinking water standard of 10 ppb), demonstrating that thesesites are a source of toxic discharges (see Table 4, page 11).
8
Natural Resources Defense Council
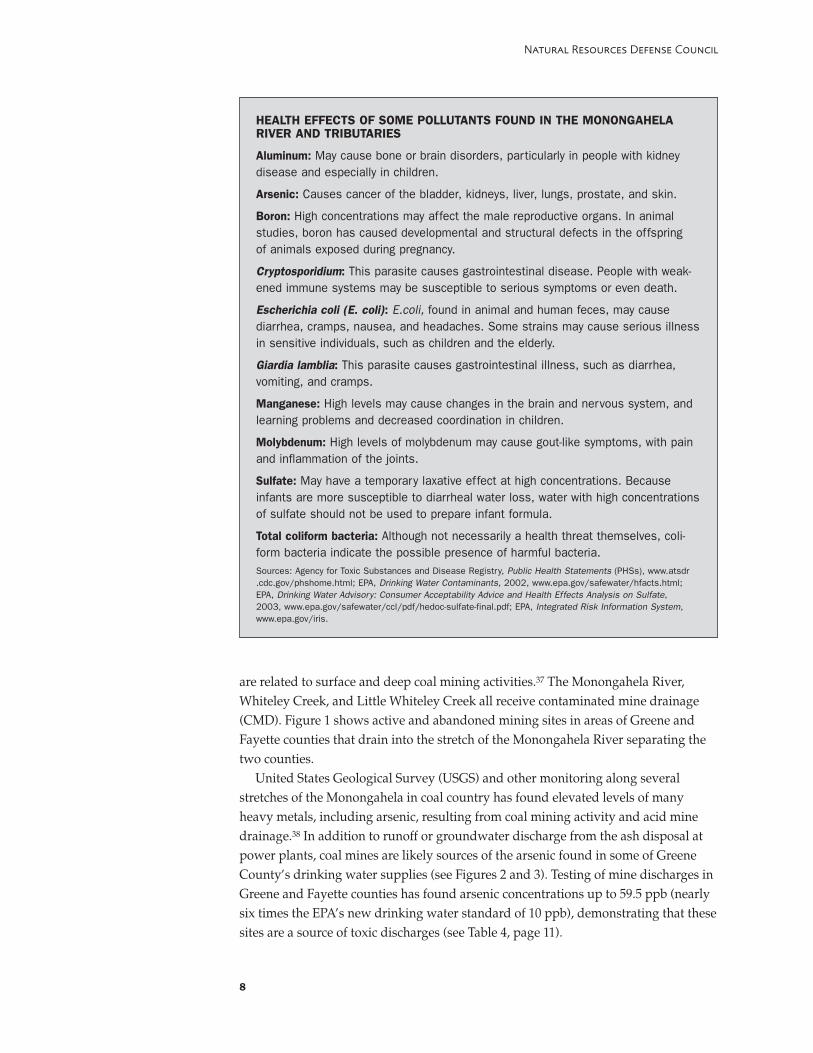
HEALTH EFFECTS OF SOME POLLUTANTS FOUND IN THE MONONGAHELARIVER AND TRIBUTARIES
Aluminum: May cause bone or brain disorders, particularly in people with kidneydisease and especially in children.
Arsenic: Causes cancer of the bladder, kidneys, liver, lungs, prostate, and skin.
Boron: High concentrations may affect the male reproductive organs. In animalstudies, boron has caused developmental and structural defects in the offspringof animals exposed during pregnancy.
Cryptosporidium: This parasite causes gastrointestinal disease. People with weak-ened immune systems may be susceptible to serious symptoms or even death.
Escherichia coli (E. coli): E.coli, found in animal and human feces, may causediarrhea, cramps, nausea, and headaches. Some strains may cause serious illnessin sensitive individuals, such as children and the elderly.
Giardia lamblia: This parasite causes gastrointestinal illness, such as diarrhea,vomiting, and cramps.
Manganese: High levels may cause changes in the brain and nervous system, andlearning problems and decreased coordination in children.
Molybdenum: High levels of molybdenum may cause gout-like symptoms, with painand inflammation of the joints.
Sulfate: May have a temporary laxative effect at high concentrations. Becauseinfants are more susceptible to diarrheal water loss, water with high concentrationsof sulfate should not be used to prepare infant formula.
Total coliform bacteria: Although not necessarily a health threat themselves, coli-form bacteria indicate the possible presence of harmful bacteria.Sources: Agency for Toxic Substances and Disease Registry, Public Health Statements (PHSs), www.atsdr.cdc.gov/phshome.html; EPA, Drinking Water Contaminants, 2002, www.epa.gov/safewater/hfacts.html;EPA, Drinking Water Advisory: Consumer Acceptability Advice and Health Effects Analysis on Sulfate,2003, www.epa.gov/safewater/ccl/pdf/hedoc-sulfate-final.pdf; EPA, Integrated Risk Information System,www.epa.gov/iris.

Active Coal MinesPA DEP data identify the locations of nine active surface coal mines and one activeunderground mine within the drainage area of the segment of the MonongahelaRiver that separates Greene and Fayette counties.39 Many of these mines pollutesurface and groundwater with CMD. One of the main processes that producesCMD is the oxidation of iron disulfide (pyrite), which produces sulfuric acid thatlowers the pH of water in the mined areas. This acidic water then dissolves metalssuch as iron, aluminum, and manganese, as well as more toxic elements such asarsenic and chromium. The result is the degradation of aquatic habitats and drinkingwater supplies.
The EPA’s Toxics Release Inventory for 2002 (the most recent year for whichdata are available) lists reported chemical releases for only two mining operationsin Greene County. None are listed for Fayette County. The two Greene County minesreported the release of hydrochloric acid, lead and mercury compounds, sulfuricacid, and chlorine, in the total amount of 53,507 pounds. Ninety-five percent ofthe reported amount was released into the air, 3.2 percent was released directly intosurface waters, and 1.3 percent went to land disposal. However, these amounts arejust estimates of reportable chemicals released during mining operations and in no
9
Pollution Unchecked
FIGURE 1Mining Sites Near the Monongahela River, Greene and Fayette Counties, PA
Waynesburg
WashingtonCounty
Luzerne
Luzerne
Crucible
Carmichaels
Greene County
Fayette County
Point MarionPENNSYLVANIAWEST VIRGINIA
Mon
on g
ahe
l aR
ive
rMasontown
Coal mining operationMine drainage treatmentIndustrial mineral miningLongwall miningAbandoned Mine Lands Inventory
Pennsylvania DEP

10
Natural Resources Defense Council
PENNSYLVAN IA
WEST V IRG IN IA
FIGURE 2Abandoned Mine Sites in the Upper Monongahela Watershed, WV
Source: DOI Office of Surface Mining Abandoned Mine Land Inventory System (AMLIS).
PENNSYLVAN IA
WEST V IRG IN IA
FIGURE 3Abandoned Mine Sites in the Lower Monongahela Watershed, PA
Source: DOI Office of Surface Mining Abandoned Mine Land Inventory System (AMLIS).
11
Pollution Unchecked
TABLE 4Arsenic in Mine Discharges, Monongahela River Watershed
Arsenic, dissolvedCounty Stream/river site Sample date (ppb)
Greene Mine Discharge 50 7/28/1999 0.6#USGS 394425079584001 7/28/1999 1.1
7/28/1999 1.7
Mine Discharge 51 7/28/1999 3.4#USGS 394556079582201 7/28/1999 3.6
7/28/1999 3.7
Mine Discharge 52 7/16/1981 1.0#USGS 394556079582601 7/28/1999 2.8
7/28/1999 2.97/28/1999 3.0
Fayette* Number 3 Mine Pool at Melcroft, PA 10/23/1985 19.1#USGS 03082122 2/26/1987 19.0
Kalp Mine Discharge at Rumney, PA 10/23/1985 40.7#USGS 03082132 2/26/1987 13.9
6/29/1987 21.5
Mathews Mine Discharge at Davistown, PA 2/26/1987 10.1#USGS 03082142 6/29/1987 21.5
Galentine Mine Discharge near Indian Head, PA 10/24/1985 31.3#USGS 03082168 2/26/1987 12.9
6/29/1987 15.8
Mine Discharge 39 7/28/1999 6.3#USGS 395637079434901 7/28/1999 7.0
7/28/1999 7.6
Mine Discharge 40 7/28/1999 9.5#USGS 395637079434601 7/28/1999 9.8
7/28/1999 10.09/4/2003 59.5
Mine Discharge 41 7/29/1999 0.9#USGS 400250079362901 7/29/1999 0.9
7/29/1999 0.9
Mine Discharge 42 7/29/1999 7.2#USGS 400240079361801 7/29/1999 7.8
7/29/1999 8.3
Mine Discharge 43 7/30/1999 5.1#USGS 400234079362501 7/30/1999 5.2
7/30/1999 5.3
Mine Discharge 45 8/24/1999 2.2#USGS 400208079381401 8/24/1999 2.6
8/24/1999 2.9
Mine Discharge 46 8/24/1999 9.6#USGS 400215079374601 8/24/1999 9.7
8/24/1999 9.8
Mine Discharge 47 7/29/1999 0.03#USGS 400249079240701 7/29/1999 0.5
7/29/1999 0.5
Mine Discharge 48 7/29/1999 0.03#USGS 395922079271101 7/29/1999 0.2
7/29/1999 0.2
Mine Discharge 49 7/30/1999 5.4#USGS 400635079495101 7/30/1999 6.1
7/30/1999 6.8
Source: USGS, National Water Information System (NWIS). Only sites and samples with detectable concentrationsare included.
Bold denotes concentrations that exceed the EPA’s new drinking water standard for arsenic of 10 parts per billion(ppb), effective in 2006.
*Sites in Fayette County are located in areas of the watershed that drain to the Monongahela directly across the riverfrom Greene County.
way represent the actual amounts of chemicals released by mine drainage, runofffrom mine spoils, and chemicals contained in coal mining waste, which include iron,aluminum, manganese, sulfate, and heavy metals. In fact, lack of regular monitoringfor most contaminants makes it impossible to estimate the amounts of contaminantsreleased into the water from these mines. The scarcity of data concerning pollutantreleases caused by mining will be an obstacle in the design of any future waterpollution prevention activities by the PA DEP not only in Greene County, but in theentire state of Pennsylvania.
Abandoned and Inactive MinesMost of the coal mines along the river are abandoned, and CMD from these abandonedmines represents a significant source of contamination with manganese, aluminum,zinc, arsenic, barium, cadmium, cobalt, copper, silver, sulfate, iron, and other tracemetals and inorganic constituents.40
The U.S. Department of Interior Office of Surface Mining lists 148 abandoned minesites within Greene and Fayette counties, and the state of West Virginia has identified200 abandoned mine sites in the Upper Monongahela watershed, upstream of GreeneCounty (see Figures 2 and 3, page 10).41 The number could actually be higher, since theseinventories consist mostly of sites that are eligible for reclamation funding. Many ofthese sites have the potential to release CMD into surface water or groundwater.
Like active mine sites, inactive and abandoned mines receive little monitoring fortoxic releases despite being important sources of water contamination. PA DEP data-bases contain location data for 49 of these inactive and abandoned mines within thearea that drains into the stretch of the Monongahela separating Greene and Fayettecounties. Like most of the active mines, these sites are usually located close to surfacestreams, particularly the main stem of the Monongahela River. Not surprisingly, whatlittle monitoring data have been collected show high levels of aluminum, iron, andmanganese, all of which are indicators of CMD pollution.
Abandoned mines are sometimes selected for remining, the process of extractingleftover coal and coal-containing mine spoils, followed by reclamation of the minedlands. Although improvements in water quality have been observed in some areas,remining projects in the coal seams in Greene County tend to increase water pollutionwith iron and manganese. This means that additional abatement measures, such ascontrolling water flow and adding limestone to increase alkalinity, become necessaryto control water quality problems.42
Mine BackfillingAnother important threat to water quality in Greene County is the use of both activeand abandoned mines as dump sites for coal ash. The rationale for filling mines withcoal ash is that not only do they provide a disposal site for large amounts of waste,but that alkaline ash will make mine drainage less acidic and prevent the releaseof iron, manganese, and other contaminants associated with CMD. However, toxicmetals found in coal ash are frequently released when the ash comes into contactwith mine drainage.43
12
Natural Resources Defense Council
The scarcity of data
concerning pollutant
releases caused by
mining will be an
obstacle in the design
of any future water
pollution prevention
activities by the
PA DEP not only in
Greene County, but
in the entire state
of Pennsylvania.

Four minefill sites currently exist in Greene County. Despite the likelihood that thesesites will worsen the already poor water quality, the PA DEP’s approach has been toallow backfilling projects to proceed relying on the results of short-term monitoring,which cannot detect contamination problems that take more time to fully develop.Also, experience at other sites in Pennsylvania has shown that the agency’s decisionsto approve projects based on chemical analyses of the ash, without considering site-specific hydrological conditions, have allowed further degradation of water quality.44
Approximately 80 additional backfilling sites in Monongalia, Marion, and Prestoncounties in West Virginia, outside of the PA DEP’s jurisdiction, are also adding to thepollutant load carried by tributaries of the Monongahela River. More research isneeded to measure this impact, but water quality data from West Virginia minefillsindicates that levels of arsenic, selenium, thallium, antimony, lead, and nickelroutinely exceed safe drinking water standards in the surface water and groundwaterthat drains these minefills and eventually flows into the Monongahela. These levelsof metals are occurring in concentrations not measured in baseline acid mine drain-age at the sites. Two active sites in particular, the Albright Minefill and the StacksRun Refuse Site, both in Preston County, are significant sources of these contami-nants.45 For example, arsenic was measured at 907 ppb in downgradient groundwaterat the Stacks Run Refuse Site, more than 90 times the new arsenic drinking waterstandard.46 Arsenic in surface water downstream of the Stacks Run Refuse Site wasmeasured at 76 ppb, over 7 times the new federal standard. At the Albright Minefill,arsenic was measured at 504 ppb in groundwater downgradient of the minefill.47
WATER POLLUTION FROM POWER PLANTSBoth the Hatfield’s Ferry and Fort Martin power plants are also significant sources ofwater pollutants to the Monongahela River by direct release of wastewater into theriver and through the leaching of chemicals from their ash landfills. These landfillsare a source of contamination for both surface and groundwater. While the plantsreported releasing 1,435 pounds of pollutants to water in 2002, this amount does notinclude chemicals not captured by wastewater treatment or stormwater/leachatecollection systems. While there is no scientific assessment of the total amounts ofchemicals leaching out of the ash disposal areas, our extensive review of PA DEP filesand other available information suggests that there is great potential for watercontamination. This is cause for concern, since both power stations are locatedupstream of the water intakes of several water systems that provide drinking waterto Greene County residents.
Reported Toxics Releases from Hatfield’s FerryHatfield’s Ferry reported the release of 203 pounds of chemicals into the MonongahelaRiver in 2002, according to the EPA Toxics Release Inventory (TRI) (Table 5, page 14).The releases included arsenic, barium, chromium, and cobalt. This amount may notinclude waterborne chemicals in flow not captured by wastewater treatment orstormwater/leachate collection systems (including some surface runoff and ground-
13
Pollution Unchecked
Both the Hatfield’s
Ferry and Fort Martin
power plants are also
significant sources
of water pollutants.

water discharge) and chemicals entering the river through atmospheric deposition.No manganese was reported, although this is one of the chemicals monitored (anddetected) in wastewater effluent. Because many of the chemicals are not required tobe regularly monitored, NRDC considers TRI-reported discharge levels unreliable,and likely often underestimated.
National Pollution Discharge Elimination System (NPDES) Monitoring andViolations: Hatfield’s FerryThe station is required to monitor effluent from its pipe outfall for aluminum, chlorine,chromium, copper, iron, manganese, oil and grease, pH, suspended solids, temperature,thallium, and zinc by its NPDES permit. Not all outfalls are monitored for the sameparameters. No monitoring is required for parameters such as arsenic, boron, andmolybdenum, which are some of the contaminants that leach from coal ash.
Data concerning pollutant releases do not give a complete picture of the amountof chemicals released. The outfalls carrying stormwater runoff are required to bemonitored by taking a sample only once per month, and outfall 007, which carriestreated landfill leachate and runoff, is sampled only once per week. Also, as notedabove, many key parameters are not monitored at all.
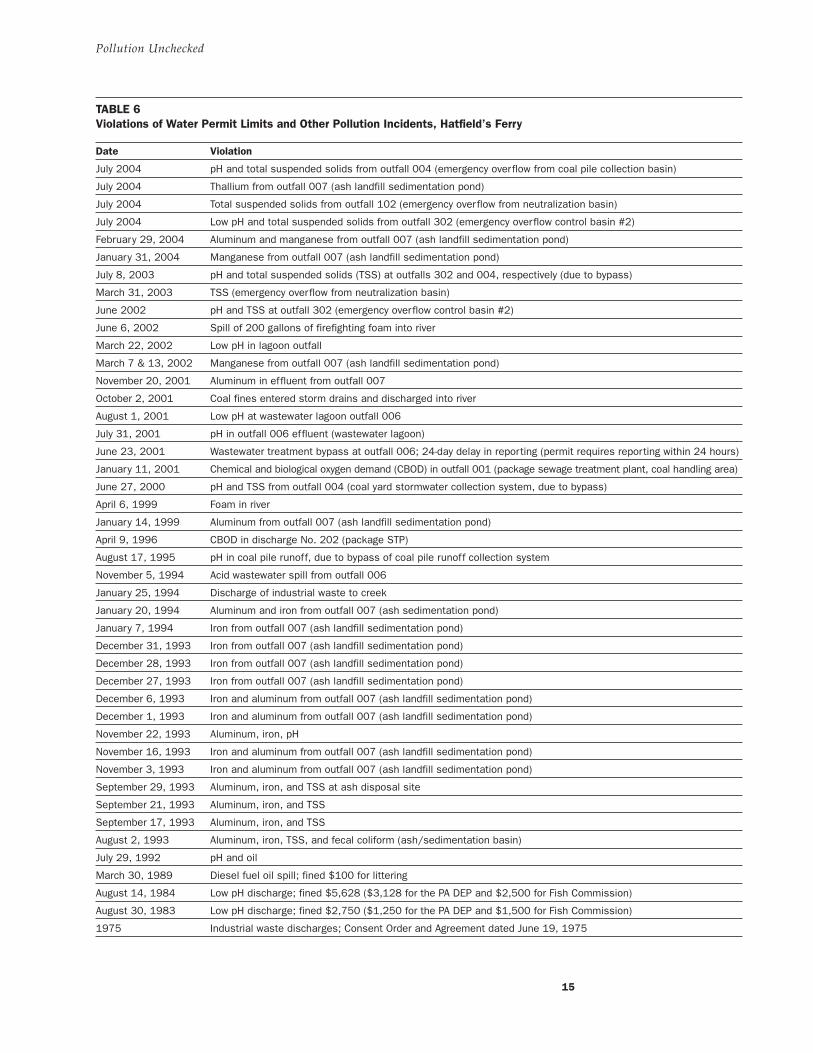
PA DEP inspection reports and incident reports made by the company show therehave been at least 32 violations of NPDES parameters since 1983, in addition to otherpermit violations (Table 6).48 Fourteen of them occurred from January 1999 to 2004. Theparameters most commonly violated since 1983 have been aluminum, iron, manganese,
14
Natural Resources Defense Council
TABLE 5Discharges to Surface Water from Pipe Outfall Reported by Hatfield’s Ferry (in pounds)
Chemical 2000 2001 2002
Arsenic* 0 0 56
Barium* 0 120 110
Beryllium* 0 0 —
Chromium 0 10 13
Cobalt* 0 43 —
Copper 0 37 24
Dioxin* 0 0 —
Lead* 0 0 —
Manganese 0 0 —
Mercury* 0 0 —
Nickel* 0 18 —
Selenium* 15 9 —
Sulfuric acid* — — —
Vanadium* 0 0 —
Zinc 0 130 —
Total 15 367 203
Source: EPA Toxics Release Inventory (TRI).
*Not required to be routinely monitored in discharges. NRDC considers TRI-reported discharge levels to be unreliable.
15
Pollution Unchecked
TABLE 6Violations of Water Permit Limits and Other Pollution Incidents, Hatfield’s Ferry
Date Violation
July 2004 pH and total suspended solids from outfall 004 (emergency overflow from coal pile collection basin)
July 2004 Thallium from outfall 007 (ash landfill sedimentation pond)
July 2004 Total suspended solids from outfall 102 (emergency overflow from neutralization basin)
July 2004 Low pH and total suspended solids from outfall 302 (emergency overflow control basin #2)
February 29, 2004 Aluminum and manganese from outfall 007 (ash landfill sedimentation pond)
January 31, 2004 Manganese from outfall 007 (ash landfill sedimentation pond)
July 8, 2003 pH and total suspended solids (TSS) at outfalls 302 and 004, respectively (due to bypass)
March 31, 2003 TSS (emergency overflow from neutralization basin)
June 2002 pH and TSS at outfall 302 (emergency overflow control basin #2)
June 6, 2002 Spill of 200 gallons of firefighting foam into river
March 22, 2002 Low pH in lagoon outfall
March 7 & 13, 2002 Manganese from outfall 007 (ash landfill sedimentation pond)
November 20, 2001 Aluminum in effluent from outfall 007
October 2, 2001 Coal fines entered storm drains and discharged into river
August 1, 2001 Low pH at wastewater lagoon outfall 006
July 31, 2001 pH in outfall 006 effluent (wastewater lagoon)
June 23, 2001 Wastewater treatment bypass at outfall 006; 24-day delay in reporting (permit requires reporting within 24 hours)
January 11, 2001 Chemical and biological oxygen demand (CBOD) in outfall 001 (package sewage treatment plant, coal handling area)
June 27, 2000 pH and TSS from outfall 004 (coal yard stormwater collection system, due to bypass)
April 6, 1999 Foam in river
January 14, 1999 Aluminum from outfall 007 (ash landfill sedimentation pond)
April 9, 1996 CBOD in discharge No. 202 (package STP)
August 17, 1995 pH in coal pile runoff, due to bypass of coal pile runoff collection system
November 5, 1994 Acid wastewater spill from outfall 006
January 25, 1994 Discharge of industrial waste to creek
January 20, 1994 Aluminum and iron from outfall 007 (ash sedimentation pond)
January 7, 1994 Iron from outfall 007 (ash landfill sedimentation pond)
December 31, 1993 Iron from outfall 007 (ash landfill sedimentation pond)
December 28, 1993 Iron from outfall 007 (ash landfill sedimentation pond)
December 27, 1993 Iron from outfall 007 (ash landfill sedimentation pond)
December 6, 1993 Iron and aluminum from outfall 007 (ash landfill sedimentation pond)
December 1, 1993 Iron and aluminum from outfall 007 (ash landfill sedimentation pond)
November 22, 1993 Aluminum, iron, pH
November 16, 1993 Iron and aluminum from outfall 007 (ash landfill sedimentation pond)
November 3, 1993 Iron and aluminum from outfall 007 (ash landfill sedimentation pond)
September 29, 1993 Aluminum, iron, and TSS at ash disposal site
September 21, 1993 Aluminum, iron, and TSS
September 17, 1993 Aluminum, iron, and TSS
August 2, 1993 Aluminum, iron, TSS, and fecal coliform (ash/sedimentation basin)
July 29, 1992 pH and oil
March 30, 1989 Diesel fuel oil spill; fined $100 for littering
August 14, 1984 Low pH discharge; fined $5,628 ($3,128 for the PA DEP and $2,500 for Fish Commission)
August 30, 1983 Low pH discharge; fined $2,750 ($1,250 for the PA DEP and $1,500 for Fish Commission)
1975 Industrial waste discharges; Consent Order and Agreement dated June 19, 1975

and pH. Two violations of the manganese limit and aluminum limits have been recordedthis year as of May 31, 2004. A wetland treatment system began operating in 2001 tocontrol iron and manganese at outfall 007, which carries effluent from a sedimentationpond that receives landfill leachate. The two manganese violations recorded in early2004 occurred at this outfall, which discharges into an unnamed tributary of LittleWhiteley Creek, a tributary of the Monongahela River. The list of violations showsthat the landfill is a persistent source of water contamination. In fact, the actual extentof the pollution problem is worse than the list of violations indicates, since parameterssuch as arsenic, barium, boron, molybdenum, and nickel, among others, are notrequired to be monitored and are not subject to NPDES limits in Hatfield’s permit.
In addition to these multiple violations of NPDES permit limitations, Hatfield hasalso reported eight bypasses of the wastewater treatment system since 1992, resultingin the direct release of untreated or partially treated wastewater into the MonongahelaRiver. Six of the bypasses have occurred since June 2001. The June 2001 incident resultedin the release of 72,000 gallons of polluted water carrying oil and solvents. The companydid not report the bypass to the PA DEP for 24 days, not within 24 hours as requiredby the station’s permit. By that time, the Greene County Conservation District hadalready received an anonymous report of the discharge. This incident prompted awritten complaint to the PA DEP from the president of the Utility Workers Union ofAmerica Local 102, who wrote to urge the agency to hold Allegheny Energy account-able for the spill. The complaint letter says the station was operating with inadequatepersonnel because 30 maintenance workers who had left had not been replaced. In2002, EPA imposed a $55,000 penalty on Allegheny Energy for this incident.
Other problems with unauthorized pollutant discharges have included five minoroil discharges since 1998 and six other releases since 1994 involving coal fines, fire-fighting foam, coal pile runoff, and acid wastewater.
Hatfield’s repeated violations of its discharge permit led the PA DEP to assess a$14,190 civil penalty against Allegheny Energy in 2002 for those incidents that occurredbetween January 1999 and October 2001.
When the PA DEP renewed the facility’s NPDES permit in 2003, it did not considerit necessary to revise permit limits for outfall 007, except for thallium.49 In its State-ment of Basis for the permit, the PA DEP says no NPDES violations were found inthe Permit Compliance System for the period January 2000 to January 2003. However,our review of PA DEP files showed seven violations at the plant’s outfalls during thatperiod, two of them at outfall 007. At least two more violations have occurred at thatoutfall since the new permit went into effect in January 2004.
Other Sources of Surface Water Contamination at HatfieldSurface runoff and windblown fly ash from the landfill area may be a source of con-tamination for the Monongahela River. The landfill was designed with some erosioncontrol features to reduce this type of contamination, which included surface collec-tion and drainage systems, and revegetation of completed disposal areas. Runoff col-lected from the landfill is treated in a sedimentation pond before being discharged intoan unnamed tributary of Little Whiteley Creek, which in turn enters the Monongahela
16
Natural Resources Defense Council
Hatfield has also
reported eight bypasses
of the wastewater
treatment system
since 1992, resulting
in the direct release of
untreated or partially
treated wastewater
into the Monongahela.

River. During our review of PA DEP records, we did not find information on theextent to which surface runoff not captured by the collection system or windblownash may be carrying pollutants into the river.
Surface water monitoring data for this area of the Monongahela are scarce. A briefmetals survey of the river in 2001 showed exceedances of drinking water standards onlyfor aluminum, iron, and manganese.50 These elements are found in ash leachate as wellas in contaminated mine drainage, which is an important source of pollution in thewatershed. Little Whiteley Creek also had exceedances for iron and manganese. Arsenicwas not detected in any of the samples in the survey. This survey involved only onesample from each location on the same date. It is at best a very modest snapshot that can-not be considered a representative sample of the Monongahela’s water quality over time.
Hatfield’s own water monitoring has detected elevated concentrations of arsenic,boron, and manganese in Little Whiteley Creek and the unnamed tributary to the creekthat receives treated landfill leachate. The arsenic level in the tributary exceeded theEPA’s new drinking water standard of 10 ppb on at least one occasion (see Figure 4).Manganese levels in the tributary and in Little Whiteley Creek downstream of the outfallhave been consistently above the 0.05 ppm secondary standard (see Figure 5). Boron, oneof the characteristic elements of coal ash, has also been found at very high levels in boththe tributary and the downstream portion of the creek, usually at levels above the EPA’sRemoval Action Level, or RAL (see Figure 6). RALs are contaminant levels that are con-sidered by the EPA to decide whether to provide alternate sources of drinking waterunder Superfund removal authority to people affected by contaminated drinking watersites.51 Although Little Whiteley Creek is not used as a source of drinking water, thesehigh concentrations are indicative of serious water quality problems caused by the dis-charge of treated leachate from Hatfield’s landfill. They are also evidence that the ashsedimentation pond used to treat the leachate is insufficient to remove pollutants. Forexample, data collected from 1998 to 2000 show that boron concentrations were reduced
17
Pollution Unchecked
0.0
2.0
4.0
6.0
8.0
10.0
12.0
14.0
Q3 2000Q2 2000Q1 2000Q4 1999Q3 1999Q2 1999Q1 1999
AR
SEN
IC, TO
TAL
(PP
B)
MCL: 10 ppb
QUARTER, YEAR
FIGURE 4Arsenic in Little Whiteley Creek and Tributary, Up- and Downstream of Hatfield’s Ferry Landfill Outfall
Source: Allegheny Energy Supply, Form 14R, Residual Waste Landfills and Disposal Impoundments Quarterly and Annual Water Quality Analyses, 1999 and 2000.
■ Little Whiteley Creek, upstream■ Little Whiteley Creek, downstream■ Unnamed tributary to Little Whiteley Creek, downstream
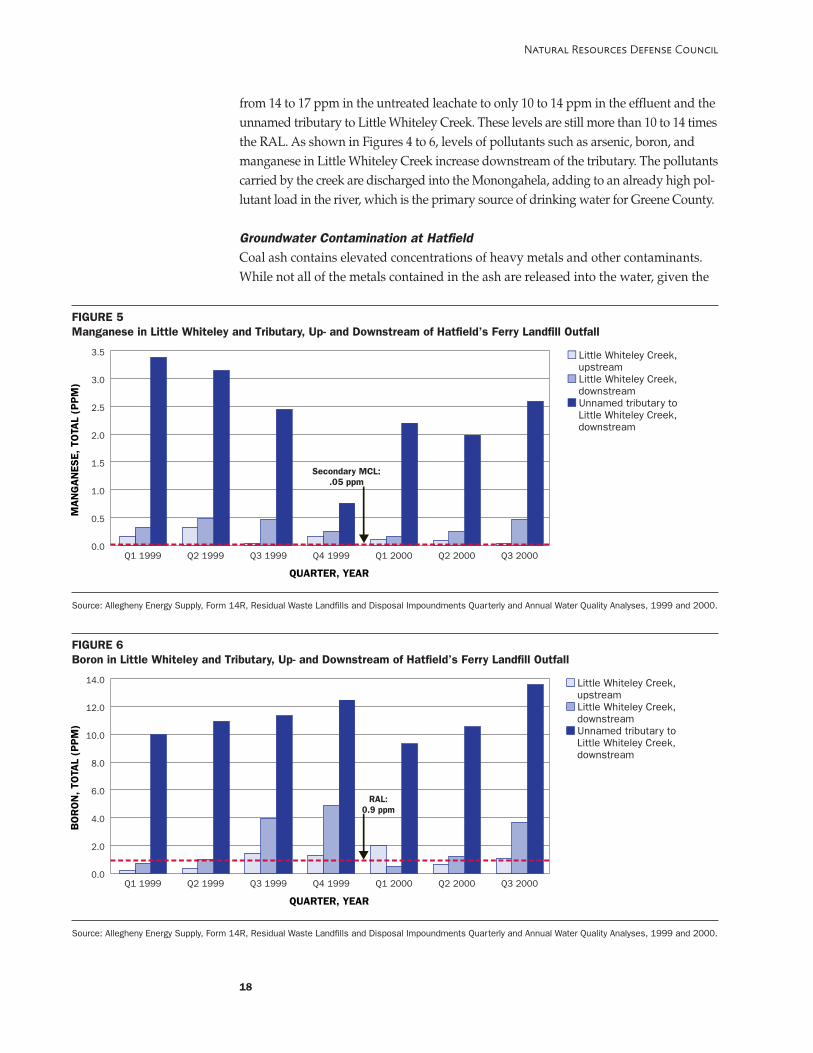
from 14 to 17 ppm in the untreated leachate to only 10 to 14 ppm in the effluent and theunnamed tributary to Little Whiteley Creek. These levels are still more than 10 to 14 timesthe RAL. As shown in Figures 4 to 6, levels of pollutants such as arsenic, boron, andmanganese in Little Whiteley Creek increase downstream of the tributary. The pollutantscarried by the creek are discharged into the Monongahela, adding to an already high pol-lutant load in the river, which is the primary source of drinking water for Greene County.
Groundwater Contamination at HatfieldCoal ash contains elevated concentrations of heavy metals and other contaminants.While not all of the metals contained in the ash are released into the water, given the
18
Natural Resources Defense Council
0.0
0.5
1.0
1.5
2.0
2.5
3.0
3.5
Q3 2000Q2 2000Q1 2000Q4 1999Q3 1999Q2 1999Q1 1999
MA
NG
AN
ESE,
TO
TAL
(PP
M)
Secondary MCL:.05 ppm
QUARTER, YEAR
FIGURE 5Manganese in Little Whiteley and Tributary, Up- and Downstream of Hatfield’s Ferry Landfill Outfall
Source: Allegheny Energy Supply, Form 14R, Residual Waste Landfills and Disposal Impoundments Quarterly and Annual Water Quality Analyses, 1999 and 2000.
■ Little Whiteley Creek, upstream■ Little Whiteley Creek, downstream■ Unnamed tributary to Little Whiteley Creek, downstream
0.0
2.0
4.0
6.0
8.0
10.0
12.0
14.0
Q3 2000Q2 2000Q1 2000Q4 1999Q3 1999Q2 1999Q1 1999
BO
RO
N, TO
TAL
(PP
M)
RAL:0.9 ppm
QUARTER, YEAR
FIGURE 6Boron in Little Whiteley and Tributary, Up- and Downstream of Hatfield’s Ferry Landfill Outfall
Source: Allegheny Energy Supply, Form 14R, Residual Waste Landfills and Disposal Impoundments Quarterly and Annual Water Quality Analyses, 1999 and 2000.
■ Little Whiteley Creek, upstream■ Little Whiteley Creek, downstream■ Unnamed tributary to Little Whiteley Creek, downstream

amounts of toxic chemicals and the volume of ash that has been disposed in andaround Hatfield’s Ferry, this is a significant source of water contamination. Thereare two primary ash disposal areas that are contributing to groundwater contami-nation: a surface mining pit on Hatfield’s property that was used for ash disposaluntil 1984, and the current landfill. Hatfield’s Ferry originally disposed of its coalcombustion ash in the surface mine, which until the early 1980s produced coal foruse at the power plant. The ash was co-disposed with mine spoils here as a minereclamation measure until 1984, when the current landfill was permitted. The lowerportion of the mine spoil is in contact with groundwater, some of which is dis-charged through springs, causing the release of metals and other pollutants. Theshallowest of the three aquifers underlying the Hatfield’s Ferry site consists of theco-disposed mine spoil and ash, and is located upgradient or upslope of the currentash landfill. A 1996 report submitted by the company to the PA DEP says the co-disposal of fly ash with mine spoil in this surface mine was responsible for the factthat high levels of boron are found in groundwater upgradient of the current landfill,not just downgradient as might be expected if the landfill were the only source ofgroundwater contamination.
The currently operating ash landfill began operations in 1984 and accepts approxi-mately 350,000 tons of fly ash annually. It is a Class II (single-liner) landfill with ablanket of permeable material to collect and drain groundwater. It is located in twosmall valleys that converge to an unnamed tributary of Little Whiteley Creek. Col-lected landfill leachate is treated in a sedimentation pond before being dischargedinto this tributary. The Uniontown aquifer, which underlies the landfill, shows clearsigns of increasing contamination from coal ash, as indicated by high levels of boron.Groundwater in this aquifer is discharged into the drainage area of Little WhiteleyCreek, and from there into the Monongahela River.
Hatfield’s Ferry reported the land disposal of nearly 2.3 million pounds of metalsand other toxic chemicals from 2000 to 2002 (see Table 7, page 20). These toxics arecontained in the coal combustion ash disposed in the landfill.
The ash has been tested in the laboratory to determine the concentrations ofmetals in ash leachate, which is at best an imperfect indicator of the mobility of thesepollutants into water. Table 8 shows the concentrations of some of the pollutantsreleased by fly and bottom ash when tested in a laboratory setting according toEPA procedures. It must be noted that the Toxicity Characteristic Leaching Procedure(TCLP) used in the laboratory analysis may underestimate the concentrations ofcontaminants released under real-world conditions for many pollutants.52 Evenso, levels of arsenic, cadmium, and chromium in fly ash leachate exceeded theirrespective federal primary drinking water standards, or Maximum ContaminantLevels (MCLs), indicating that landfill leachate is likely to degrade groundwaterquality, even though the concentrations obtained in the test are within levels allowedby the PA DEP.
The Hatfield’s Ferry station is required to monitor groundwater through a seriesof wells around the landfill to detect any deterioration of groundwater that may bedue to the leaching of chemicals from the ash. Although none of the three aquifers
19
Pollution Unchecked
Hatfield’s Ferry
reported the land
disposal of nearly
2.3 million pounds
of metals and other
toxic chemicals from
2000 to 2002.

potentially impacted by the landfill are used for drinking water, pollutedgroundwater may enter the Monongahela River.
Groundwater monitoring data show levels of sulfate, iron, manganese, fluoride, andpH that repeatedly exceed the applicable primary or secondary drinking water stan-dards in some monitoring wells. Also, there are 18 parameters that show upward trendsover time in upgradient wells53 and 16 parameters with upward trends in downgradientwells.54 Twelve of the 16 trends also occur at the upgradient wells. The occurrenceof rising trends in chemical concentrations both up- and downgradient of the landfill
20
Natural Resources Defense Council
TABLE 7Land Releases of Chemicals (in pounds), Hatfield’s Ferry
Chemical 2000 2001 2002
Arsenic 76,000 46,000 15,000
Barium 440,000 300,000 110,000
Beryllium 9,300 6,200 2,600
Chromium 71,000 48,000 22,000
Cobalt 19,000 13,000 5,700
Copper 99,000 67,000 23,000
Dioxin — — —
Ethylene glycol — 1,600 —
Hydrochloric acid — — —
Hydrogen fluoride — — —
Lead 28,000 18,000 6,718
Manganese 110,000 77,000 36,000
Mercury 170 100 19.4
Nickel 60,000 42,000 21,000
Selenium 6,700 4,200 1,200
Sulfuric acid — — —
Vanadium 170,000 120,000 36,000
Zinc 100,000 67,000 20,000
Total 1,189,170 810,100 299,237
Source: EPA Toxics Release Inventory
TABLE 8Ash Analysis by Toxicity Characteristic Leaching Procedure (TCLP)
Parameter MCL (ppm) Bottom ash Fly ash
Arsenic 0.010 <0.002 0.2241
Barium 2 0.4245 0.3710
Cadmium 0.005 0.0003 0.0111
Chromium 0.1 0.0199 0.1170
Lead 0.015 0.0087 0.0011
Mercury 0.002 <0.0002 0.0002
Test date: December 2001. Levels that exceed the primary drinking water standard, or MCL, are noted in bold.
C O N C E N T R A T I O N ( P P M )
was cited by Allegheny Energy in its 2001 Annual Evaluation Report for the landfillas evidence that much of the groundwater contamination is produced by naturalgeochemical conditions.55 As mentioned previously, fly ash and mine spoil that weredisposed in a surface mining pit is impacting groundwater quality in the upgradientwells. Therefore, these wells are not representative of background or natural condi-tions, and certainly do not support the theory that the landfill is not responsible foran increase in groundwater contamination. Higher chemical concentrations in down-gradient wells relative to upgradient wells indicate that contaminants in the coal ashare reaching the groundwater. Increasing contamination by boron and other metalscharacteristic of coal ash in the Uniontown Sandstone aquifer underlying the landfillare also strong evidence that the landfill is affecting groundwater quality.
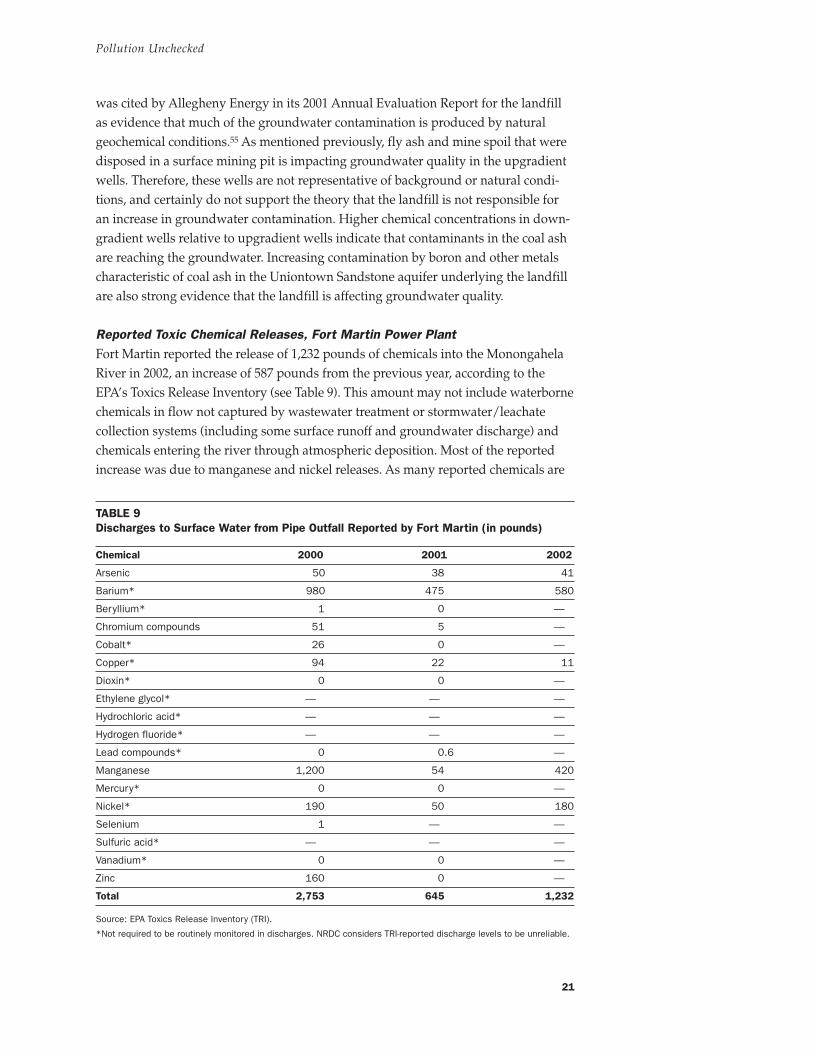
Reported Toxic Chemical Releases, Fort Martin Power PlantFort Martin reported the release of 1,232 pounds of chemicals into the MonongahelaRiver in 2002, an increase of 587 pounds from the previous year, according to theEPA’s Toxics Release Inventory (see Table 9). This amount may not include waterbornechemicals in flow not captured by wastewater treatment or stormwater/leachatecollection systems (including some surface runoff and groundwater discharge) andchemicals entering the river through atmospheric deposition. Most of the reportedincrease was due to manganese and nickel releases. As many reported chemicals are
21
Pollution Unchecked
TABLE 9Discharges to Surface Water from Pipe Outfall Reported by Fort Martin (in pounds)
Chemical 2000 2001 2002
Arsenic 50 38 41
Barium* 980 475 580
Beryllium* 1 0 —
Chromium compounds 51 5 —
Cobalt* 26 0 —
Copper* 94 22 11
Dioxin* 0 0 —
Ethylene glycol* — — —
Hydrochloric acid* — — —
Hydrogen fluoride* — — —
Lead compounds* 0 0.6 —
Manganese 1,200 54 420
Mercury* 0 0 —
Nickel* 190 50 180
Selenium 1 — —
Sulfuric acid* — — —
Vanadium* 0 0 —
Zinc 160 0 —
Total 2,753 645 1,232
Source: EPA Toxics Release Inventory (TRI).
*Not required to be routinely monitored in discharges. NRDC considers TRI-reported discharge levels to be unreliable.
not required to be routinely monitored in discharges, NRDC considers TRI-reporteddischarge levels to be unreliable.
Originally, Fort Martin relied on settling ponds that were alleged to be sufficient tocontrol pollutants in the wastewater. This proved inadequate, and the first treatmentsystem was built in 1972. The DEP required the plant to improve its system again in1990 to reduce pollutant discharges. For many years, Fort Martin discharged itseffluent into an unnamed tributary of Crooked Run but redirected its outfall to theriver in 1994, as required by a WV DEP order issued in 1988.
NPDES Monitoring and Violations, Fort MartinThe station monitors its main outfall (007) effluent for arsenic, boron, hexavalentchromium, iron, manganese, molybdenum, pH, selenium, sulfate, total dissolvedsolids, and total suspended solids, as required by its NPDES permit. The facility isrequired to test only one sample per month. Permit limits are in effect for arsenic,hexavalent chromium, iron, manganese, pH, selenium, and total suspended solids,but not for boron, sulfate, and total dissolved solids. The requirements of a 2001WV DEP order to control hexavalent chromium and selenium from outfall 007 wereincorporated into the current permit, which was issued in 2002.
The station’s stormwater outfalls (010 and 020) are also monitored for aluminum,but not for sulfate or suspended solids. The stormwater effluent is tested only onceevery six months. There are no limits for chemical parameters for these outfalls; thefacility is only required to report the data.
The station’s combined NPDES/Solid Waste permit also sets requirements forgroundwater monitoring around the landfill (discussed in “Groundwater” sectionbelow).
A review of WV DEP files dating back to 1979 showed that there have been at least13 overflows and bypasses of the wastewater treatment systems. Four of those incidentshave occurred since 2001 (three of them in 2003, all allegedly due to electrical problems).
NRDC found records of 11 violations of NPDES permit limits for chemicals ineffluent. Five incidents have occurred since 1999. In 2001, the WV DEP determinedthat the facility was in violation of the Clean Water Act due to hexavalent chromiumand selenium discharges. Because monitoring is infrequent (once per month) it is notpossible to say whether existing records of violations give the full picture of theplant’s environmental performance.
Nine accidental spills (all occurring from 1979 to 1991) were reported. These includedspills of fuel oil, sulfuric acid, algaecide, mineral oil, acidic water, and fly ash.
The plant is inspected for NPDES compliance roughly once per month; not allinspections cover the entire facility. The most recent problem, in 2001, involved therelease of dark effluent, apparently caused by changes in ash characteristics after thecompany installed new burners. Previous inspection reports record 25 inspections inwhich deficiencies were found, occurring from 1980 to 1988.
The WV DEP issued 20-Day Notices (notices of violation) to Fort Martin for itsNPDES violations and deficiencies in its wastewater treatment system, but NRDCdid not find any evidence that the company had ever been required to pay fines.
22
Natural Resources Defense Council
NRDC found records
of 11 violations of
NPDES permit limits
for chemicals in efflu-
ent. Five incidents
have occurred since
1999.

Other Sources of Surface Water Contamination, Fort MartinSurface runoff and windblown fly ash from the landfill area may be a source ofcontamination for the Monongahela River, but there is no data on how much thesesources may be contributing to pollution in the river.
The USGS sampled one location in the Monongahela River downstream of Fort Martinfor chemical parameters in 2002. Aluminum, iron, and manganese exceeded the second-ary drinking water standard (see Table 10). These metal levels may be indicative of pol-lution from both mine drainage and Fort Martin’s discharges. Only two or three sampleswere taken for each parameter, and no other locations appear to have been sampledfor chemical concentrations by USGS in this area of the river during the last 10 years.
23
Pollution Unchecked
TABLE 10Monongahela at Lock & Dam 8, Point Marion: Exceedances of Secondary Drinking WaterStandards (SMCLs)
Parameter SMCL (ppm) Sampling Date Result (ppm)
Aluminum, recoverable 0.05–0.2 4/15/2002 0.4006/17/2002 0.700
Iron, recoverable 0.3 4/15/2002 0.6906/17/2002 101.0
Manganese, recoverable 0.05 4/15/2002 0.2006/17/2002 0.0908/8/2002 0.070
Source: USGS National Water Information System.
TABLE 11Land Releases of Chemicals (in pounds), Fort Martin
Chemical 2000 2001 2002
Arsenic 7,800 110 210
Barium 76,000 19,000 23,000
Beryllium 1,400 300 420
Chromium 12,000 2,700 3,900
Cobalt 3,200 760 1,100
Copper 15,000 3,200 4,100
Dioxin 0.001139 0.001006 0.001143
Ethylene glycol — 3,400 —
Hydrochloric acid 0 0 0
Hydrogen fluoride 0 0 0
Lead 3,600 460 650
Manganese 20,000 5,400 8,000
Mercury 22 2.2 2.8
Nickel 12,000 2,800 4,100
Selenium 680 — —
Sulfuric acid 0 0 0
Vanadium 27,000 6,300 6,900
Zinc 14,000 2,600 3,100
Total 192,702 47,032 55,483
Source: EPA Toxics Release Inventory.

Groundwater Contamination, Fort MartinThe ash landfill appears to be the most significant potential source of groundwatercontamination. It is an unlined Class F industrial landfill and is regulated by thestation’s combined NPDES/Solid Waste permit. The landfill has been operating since1982 (two years before the Hatfield’s Ferry landfill) and has expanded to its maximumpermitted area of 67.3 acres. Both bottom and fly ash are disposed in the landfill.
In 2002, the facility disposed of waste (mostly ash) containing approximately 55,483pounds of toxic chemicals reportable to the EPA’s Toxics Release Inventory (see Table 11,page 23). While not all of the chemicals contained in the ash are released into the water,given the volume of ash in the landfill and the lack of an impermeable liner to prevent therelease of toxic chemicals, this is likely to be a significant source of water contamination.
There are four sedimentation ponds (Ponds 3, 4, 5, and 6) that capture surfacerunoff and leachate from the landfill’s underdrain system. The site surface drains toCrooked Run, an unnamed tributary to Crooked Run, and the Monongahela River.There are two wells and one spring in the area that are used as private water supplies.
Groundwater has been monitored quarterly since the landfill began operating. Thelandfill sits over an area of weathered and fractured bedrock containing an unconfinedaquifer. There are 11 monitoring wells around the landfill and the sedimentation ponds.Existing wells were installed from 1993 to 1995 to replace an old well network installedin the 1980s. The existing well network has been monitored quarterly since 1994.
Groundwater Monitoring, Fort MartinThe parameters monitored in groundwater around Fort Martin’s landfill includealuminum, antimony, arsenic, beryllium, boron, cadmium, chromium, iron, manga-nese, molybdenum, and selenium, among others. Groundwater monitoring up- anddowngradient of Fort Martin’s landfill has detected five parameters with increasing
24
Natural Resources Defense Council
0.0
0.2
0.4
0.6
0.8
1.0
1.2
Q12001
Q32000
Q12000
Q31999
Q11999
Q31998
Q11998
Q31997
Q11997
Q31996
Q11996
Q31995
Q11995
Q31994
Q11994
DIS
SOLV
ED B
OR
ON
(P
PM
)
RAL: 0.9 ppm
QUARTER, YEAR
MW-107 MW-109(monitoring wells with increasing trends)
FIGURE 7Dissolved Boron in Groundwater, Fort Martin
Source: Hydrosystems Management, Inc., Assessment of Ground-Water Monitoring Well System, Fort Martin PowerStation CCB Landfill, Monongalia County, West Virginia (Monroeville, PA: Allegheny Energy Supply), April 1, 2002.

trends over time: boron, sulfate, hardness, manganese, and total dissolved solids(TDS). Of the chemical parameters, boron increased in downgradient well MW-107and cross-gradient well MW-109, sulfate increased in downgradient well MW-103,while manganese increased in background well MW-110 (see Figures 7–9).
Three parameters have decreased over time: molybdenum in downgradient wellsMW-103, MW-104, and MW-105; iron in downgradient well MW-105 (see Figures 10and 11); and manganese in downgradient well MW-107, crossgradient well MW-109,and background well MW-111 (Figure 9).
25
Pollution Unchecked
0
50
100
150
200
250
300
350
400
Q12001
Q32000
Q12000
Q31999
Q11999
Q31998
Q11998
Q31997
Q11997
Q31996
Q11996
Q31995
Q11995
Q31994
Q11994
SULF
ATE
(PP
M) Secondary MCL: 250 ppm
QUARTER, YEAR
MW-103 MW-107 MW-109(monitoring wells with increasing trends)
FIGURE 8Sulfate in Groundwater, Fort Martin
Source: Hydrosystems Management, Inc., Assessment of Ground-Water Monitoring Well System, Fort Martin PowerStation CCB Landfill, Monongalia County, West Virginia (Monroeville, PA: Allegheny Energy Supply), April 1, 2002.
0.0
0.2
0.4
0.6
0.8
1.0
1.2
1.4
Q12001
Q32000
Q12000
Q31999
Q11999
Q31998
Q11998
Q31997
Q11997
Q31996
Q11996
Q31995
Q11995
Q31994
Q11994
MA
NG
AN
ESE,
DIS
SOLV
ED (
PP
M)
Secondary MCL: .05 ppm
QUARTER, YEAR
MW-107 (downgradient) MW-109 (cross-gradient)MW-110 (background) MW-111 (background)
FIGURE 9Dissolved Manganese in Groundwater, Fort Martin
Source: Hydrosystems Management, Inc., Assessment of Ground-Water Monitoring Well System, Fort Martin PowerStation CCB Landfill, Monongalia County, West Virginia (Monroeville, PA: Allegheny Energy Supply), April 1, 2002.

Overall, concentrations of iron and manganese showed the greatest tendency toexceed secondary drinking water standards in the monitoring wells, while most otherparameters remained below SMCL levels. As shown in Figures 9 and 11, both metalsgenerally remained above their respective SMCLs even in wells with decreasing trends.There are no drinking water standards for boron or molybdenum, both of which aretoxic metals of concern, but both metals sometimes reached concentrations above theEPA’s Removal Action Levels (RALs). RALs are contaminant levels considered by the
26
Natural Resources Defense Council
0.0
2.0
4.0
6.0
8.0
10.0
12.0
14.0
16.0
Q12001
Q32000
Q12000
Q31999
Q11999
Q31998
Q11998
Q31997
Q11997
Q31996
Q11996
Q31995
Q11995
Q31994
Q11994
MO
LYB
DEN
UM
, D
ISSO
LVED
(P
PB
)
RAL: 10 ppb
QUARTER, YEAR
MW-103 MW-104 MW-105(monitoring wells with decreasing trends)
FIGURE 10Dissolved Molybdenum in Groundwater, Fort Martin
Source: Hydrosystems Management, Inc., Assessment of Ground-Water Monitoring Well System, Fort Martin PowerStation CCB Landfill, Monongalia County, West Virginia (Monroeville, PA: Allegheny Energy Supply), April 1, 2002.
0.0
0.5
1.0
1.5
2.0
2.5
3.0
Q12001
Q32000
Q12000
Q31999
Q11999
Q31998
Q11998
Q31997
Q11997
Q31996
Q11996
Q31995
Q11995
Q31994
Q11994
IRO
N, D
ISSO
LVED
(P
PM
)
Secondary MCL: 0.3 ppm
QUARTER, YEAR
MW-105(monitoring well with decreasing trend)
FIGURE 11Dissolved Iron in Groundwater, Fort Martin
Source: Hydrosystems Management, Inc., Assessment of Ground-Water Monitoring Well System, Fort Martin PowerStation CCB Landfill, Monongalia County, West Virginia (Monroeville, PA: Allegheny Energy Supply), April 1, 2002.

EPA in deciding whether to provide alternate sources of drinking water under Super-fund removal authority to people affected by contaminated drinking water sites.56
Although SMCLs and RALs do not apply for regulatory purposes to these wells,they are used here for reference. These monitoring results, illustrated in Figures 7through 11, show that groundwater quality is being adversely affected by coal ash.
POLLUTION FROM SEWAGEApproximately 90 percent of the Monongahela riverfront in Fayette and Greenecounties was not covered by municipal treatment service as of 1997.57 Many commu-nities within the study corridor rely on on-lot septic systems and discharge untreatedsewage through so-called “wildcat sewers”—that is, pipes that simply take rawhuman sewage and dump it into a stream or river. Soils in the watershed have lowpermeability and the water table tends to be high. As a result, 90 percent of the soilsare rated as moderate to severe for sanitary facilities such as septic systems, meaningthat without special designs and extra maintenance, on-lot sanitary facilities cansignificantly pollute surface waters.58
Bacterial contamination, often from untreated sewage, is an important measureof drinking water quality. Test results from water samples taken by the GreeneCounty Conservation District in April 2001 show the presence of coliform bacteria,including E. coli, in Whiteley Creek and Little Whiteley Creek, which are tributariesof the Monongahela River. The presence of these bacteria is an indicator of con-tamination with fecal matter. E. coli were found in nine sampling locations inthese creeks.59 Virtually no data is available on bacterial levels in the MonongahelaRiver in the study area.
INDUSTRIAL, WASTE DISPOSAL, AND HAZARDOUS WASTE SITESThe PA DEP’s eMap database identifies the locations of 951 known and potential non-mining pollution sources in areas of Greene and Fayette counties that drain into thestretch of the Monongahela River separating the two counties. These include bothpoint and nonpoint sources in categories such as air pollution sources (included inthis section because they may contribute to surface water pollution), beneficial usesites where biosolids or septage are applied for soil treatment or as fertilizer, munici-pal waste sites, industrial and nonindustrial water pollution discharges, and facilitiesthat generate hazardous waste, among others (see Table 12, page 28). Possible sourcesof water pollution in this area also include at least 830 active and abandoned oil andgas wells. Abandoned wells that have not been plugged may contribute to waterpollution through oil and gas leaks that contaminate groundwater, and by allowingcontaminated drainage from nearby mines or brine from deep geologic formations toreach the surface and run off into streams.60 Unplugged wells can also create hydraulicconnection between two aquifers, allowing contaminated water from one aquifer toinfiltrate another aquifer. Those pollution sources closest to the Monongahela Riverare shown in Figure 12, page 29.
27
Pollution Unchecked
Many communities
within the study
corridor rely on on-lot
septic systems and
discharge untreated
sewage through so-
called “wildcat
sewers”—that is,
pipes that simply take
raw human sewage
and dump it into a
stream or river.
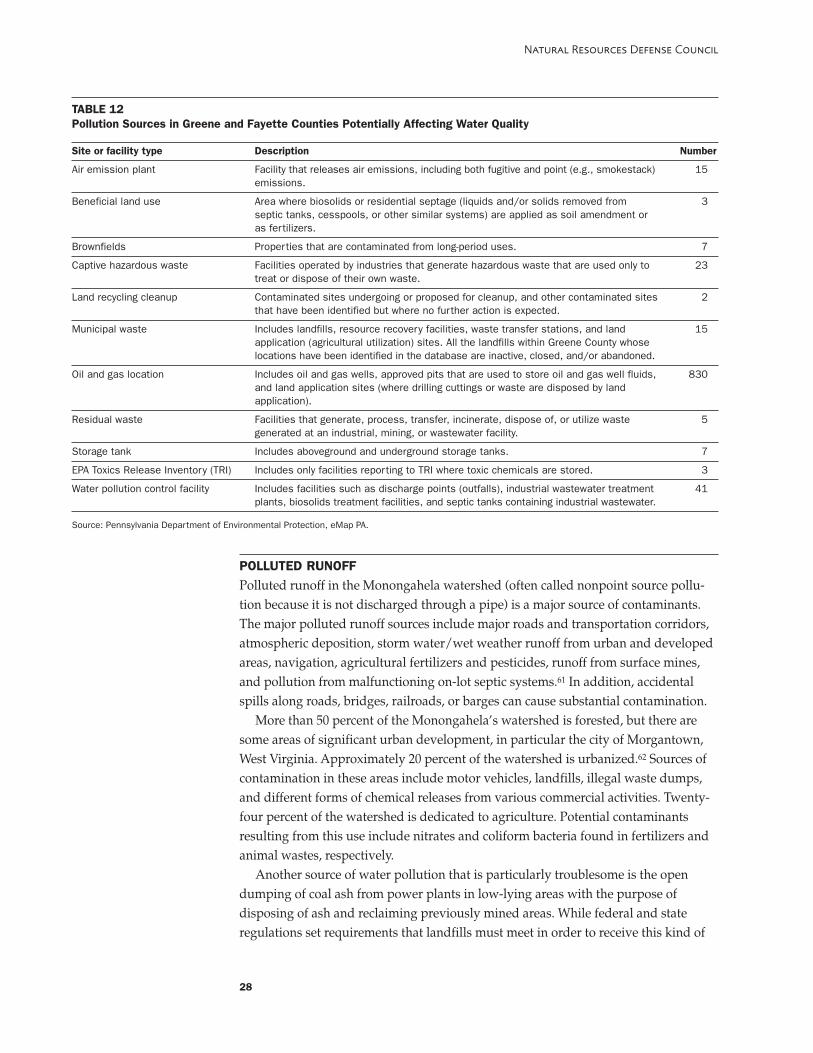
POLLUTED RUNOFFPolluted runoff in the Monongahela watershed (often called nonpoint source pollu-tion because it is not discharged through a pipe) is a major source of contaminants.The major polluted runoff sources include major roads and transportation corridors,atmospheric deposition, storm water/wet weather runoff from urban and developedareas, navigation, agricultural fertilizers and pesticides, runoff from surface mines,and pollution from malfunctioning on-lot septic systems.61 In addition, accidentalspills along roads, bridges, railroads, or barges can cause substantial contamination.
More than 50 percent of the Monongahela’s watershed is forested, but there aresome areas of significant urban development, in particular the city of Morgantown,West Virginia. Approximately 20 percent of the watershed is urbanized.62 Sources ofcontamination in these areas include motor vehicles, landfills, illegal waste dumps,and different forms of chemical releases from various commercial activities. Twenty-four percent of the watershed is dedicated to agriculture. Potential contaminantsresulting from this use include nitrates and coliform bacteria found in fertilizers andanimal wastes, respectively.
Another source of water pollution that is particularly troublesome is the opendumping of coal ash from power plants in low-lying areas with the purpose ofdisposing of ash and reclaiming previously mined areas. While federal and stateregulations set requirements that landfills must meet in order to receive this kind of
28
Natural Resources Defense Council
TABLE 12Pollution Sources in Greene and Fayette Counties Potentially Affecting Water Quality
Site or facility type Description Number
Air emission plant Facility that releases air emissions, including both fugitive and point (e.g., smokestack) 15emissions.
Beneficial land use Area where biosolids or residential septage (liquids and/or solids removed from 3septic tanks, cesspools, or other similar systems) are applied as soil amendment or as fertilizers.
Brownfields Properties that are contaminated from long-period uses. 7
Captive hazardous waste Facilities operated by industries that generate hazardous waste that are used only to 23treat or dispose of their own waste.
Land recycling cleanup Contaminated sites undergoing or proposed for cleanup, and other contaminated sites 2that have been identified but where no further action is expected.
Municipal waste Includes landfills, resource recovery facilities, waste transfer stations, and land 15application (agricultural utilization) sites. All the landfills within Greene County whose locations have been identified in the database are inactive, closed, and/or abandoned.
Oil and gas location Includes oil and gas wells, approved pits that are used to store oil and gas well fluids, 830and land application sites (where drilling cuttings or waste are disposed by land application).
Residual waste Facilities that generate, process, transfer, incinerate, dispose of, or utilize waste 5generated at an industrial, mining, or wastewater facility.
Storage tank Includes aboveground and underground storage tanks. 7
EPA Toxics Release Inventory (TRI) Includes only facilities reporting to TRI where toxic chemicals are stored. 3
Water pollution control facility Includes facilities such as discharge points (outfalls), industrial wastewater treatment 41plants, biosolids treatment facilities, and septic tanks containing industrial wastewater.
Source: Pennsylvania Department of Environmental Protection, eMap PA.

waste, the PA DEP allows companies to dispose of this ash in valleys instead of land-fills without applying the same pollution-prevention measures (other than a layer ofsoil cover and some vegetation). Boron and other contaminants in the ash make itdifficult for vegetation to become established, which leaves these sites more vulner-able to erosion and allows the formation of polluted runoff that contaminates streams.The lack of any significant barriers against pollution also means that groundwaterbecomes polluted as well. Without requirements to monitor groundwater after thedumping of the coal ash, the magnitude of the groundwater pollution often remainsundetected. Groundwater and surface water monitoring at coal ash mine dump sitesin West Virginia reveal significant contamination flowing from the coal ash.
29
Pollution Unchecked
FIGURE 12Non-Mining Pollution Sources Near the Monongahela River, Greene and Fayette Counties, PA
PENNSYLVANIAWEST VIRGINIA
Waynesburg
Greene County Carmichaels
Mon
on
ga
hel
aR
ive
r
Fayette County
Masontown
Point Marion
Washington County
Luzerne
Crucible
Air emission plantBeneficial land useBrownfieldCaptive hazardous wasteLand recycling and cleanupMunicipal wasteOil/gas locationResidual wasteStorage tankToxics Release InventoryWater pollution control: discharge pointWater pollution control: industrial wastewater production, storage, or treatmentWater pollution control: septage hauler
Source: Pennsylvania DEP

DRINKING WATERQUALITY PROBLEMS
There are six principal public water systems serving Greene County that haveintakes in the Monongahela River or purchase their water from other suppliers
who obtain their water from the Monongahela (see Table 13). The largest of thesesystems is Southwestern Pennsylvania Water Authority, which serves a populationof approximately 34,000.
The following sections show the results of the most recent monitoring at thesedrinking water utilities. As noted below, many contaminants are monitored infre-quently (such as once every nine years), so these results may be highly unreliable. Forexample, several water systems in the county detected elevated levels of arsenic andother contaminants in their water several years ago, but a single subsequent moni-toring event years later may not have detected the contaminant.
EPA regulations allow waivers of inorganic chemical monitoring, based uponseveral rounds of early monitoring showing levels of the contaminants belowstandards, and a case-by-case review of the water system’s source water, pumpingpatterns, variability in concentration of the contaminant, changes in stream flow, andother factors.63 The case-by-case waiver, and determination of monitoring frequency,“shall be made in writing and [the state] shall set forth the basis for the determina-tion.”64 However, the PA DEP issued a blanket rule that allows waivers of monitoringfor nine years for systems that have levels of a contaminant below the MCL, with no
30
CHAPTER 3
TABLE 13Public Water Suppliers in Greene County with Intakes in the Monongahela River
Facility Population Withdrawal Intake locationserved (gal/day) (river mile)
Brave Water Authoritya 200 36,000
Carmichaels Municipal Water Authorityb 3,900 300,000 75.2
Dunkard Valley Joint Municipal Water Authorityc 1,400 100,000 83
East Dunkard Water Associationc 3,400 400,000 88.1
Mt. Morris Water & Sewage Authoritya 1,500 100,000
Southwestern PA Water Authorityb 34,000 4,000,000 71.2
Total 44,400 4,936,000
a Purchases water from another supplier, which has its intake on the Monongahela River.b Intake downstream of both Fort Martin and Hatfield’s Ferry power stations.c Intake downstream of Fort Martin Power Station.
POLLUTION UNCHECKEDA Case Study of Greene County, Pennsylvania
December 2004

case-by-case review and no written determination justifying the waiver.65 This is aclear violation of the federal rules.
NRDC does not consider a single or a few monitoring events, spread out overseveral years, to be adequate to determine the extent of any drinking water problem.This is particularly true for surface water supplies like those in Greene County usingthe Monongahela, whose source water quality can literally change by the minute.What does emerge from these data and the discussions below is a picture of severalrelatively small water systems struggling to maintain compliance while dealing withthe sometimes challenging water quality from the Monongahela.
SOUTHWESTERN PENNSYLVANIA WATER AUTHORITY (SPWA)This system serves areas of Greene, Fayette, and Washington counties. The SPWAobtains raw water from the Monongahela River at milepoint 71.2. Agriculturalactivity, roads, sewage treatment plants, and other possible sources of contaminationupstream of the intake may affect raw water quality. Muddy Run’s confluence withthe Monongahela is about 1.7 miles upstream and on the same side as the waterintake, which may also impact water quality due to turbidity and sewage.66
The SPWA’s water treatment plant in Cumberland was built in 1995 with a designcapacity of 9.2 million gallons per day (MGD), but currently produces about 4.33 MGD.The plant is permitted to withdraw 7.0 MGD from the river. A Filter Plant PerformanceEvaluation gave it an “Acceptable” performance rating. The evaluation lookedspecifically at turbidity in the finished water, removal of Giardia- and Cryptosporidium-sized particles, and general operation of the plant, including chemical treatment andfilter backwashing. No problems were found in any of these areas, except for somechemical treatment procedures. The PA DEP recommended changing the time andorder in which some treatment chemicals were added to ensure maximum effective-ness. The plant could have problems complying with an upcoming EPA rule ondisinfection by-products (trihalomethanes and haloacetic acids) in drinking water.The average trihalomethane concentration measured in the third quarter of 2003was 0.078 ppm, very close to the drinking water standard of 0.080 ppm (based onan annual average).67 An upcoming EPA rule is expected to tighten this standard.Excessive ingestion of trihalomethanes may cause liver, kidney or central nervoussystem problems and increase the risk of cancer. In addition, recent evidence linkselevated levels of these chemicals to reproductive problems, including birth defects,miscarriages, and low birth weight.
Drinking Water MonitoringAccording to the SPWA’s 2002 Annual Drinking Water Quality Report (also known asConsumer Confidence or Right-to-Know Report), the authority’s drinking water metall federal and state requirements. The parameters reported were: turbidity, barium,copper, fluoride, lead, nitrate, total trihalomethanes (TTHMs), and haloacetic acids(HAA-5). The PA DEP instructed the SPWA to include in its 2003 report one violation(late reporting of turbidity data). No violations were reported in the 1998, 1999, 2000,
31
Pollution Unchecked
NRDC does not con-
sider a single or a few
monitoring events,
spread out over several
years, to be adequate
to determine the
extent of any drink-
ing water problem.
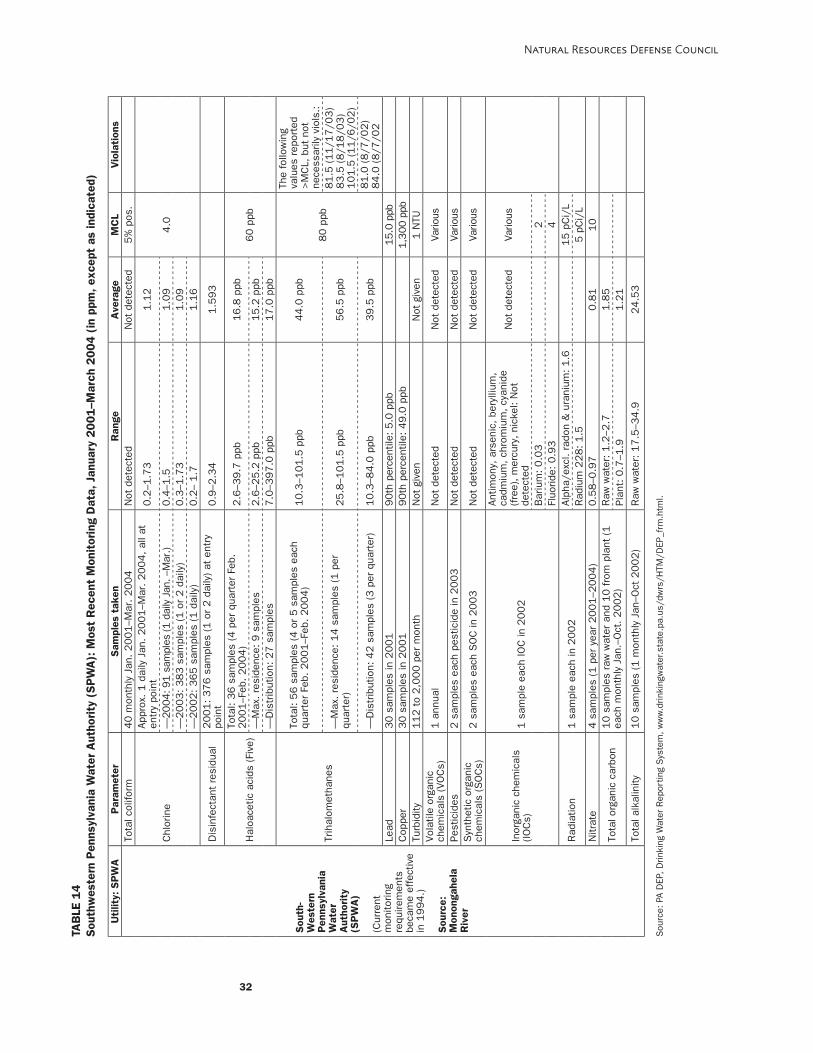
32
Natural Resources Defense Council
Uti
lity:
SP
WA
Par
amet
erS
ampl
es t
aken
Ran
geA
vera
geM
CL
Vio
lati
ons
Tota
l col
iform
40
mon
thly
Jan
. 2
00
1–M
ar.
20
04
Not
det
ecte
dN
ot d
etec
ted
5%
pos
.Ap
prox
. 1
dai
ly J
an.
20
01
–Mar
. 2
00
4,
all a
ten
try
poin
t0
.2–1
.73
1.1
2
—20
04: 9
1 s
ampl
es (1
dai
ly J
an. –
Mar
.)0
.4–1
.51
.09
—2
00
3:
38
3 s
ampl
es (
1 o
r 2
dai
ly)
0.3
–1.7
31
.09
Chl
orin
e
—2
00
2:
36
5 s
ampl
es (
1 d
aily
)0
.2–
1.7
1.1
6
4.0
Dis
infe
ctan
t re
sidu
al2
00
1:
37
6 s
ampl
es (
1 o
r 2
dai
ly)
at e
ntry
poin
t0
.9–2
.34
1.5
93
Tota
l: 3
6 s
ampl
es (
4 p
er q
uart
er F
eb.
20
01
–Feb
. 2
00
4)
2.6
–39
.7 p
pb1
6.8
ppb
—M
ax.
resi
denc
e: 9
sam
ples
2.6
–25
.2 p
pb1
5.2
ppb
Hal
oace
tic a
cids
(Fi
ve)
—D
istr
ibut
ion:
27
sam
ples
7.0
–39
7.0
ppb
17
.0 p
pb
60
ppb
Tota
l: 5
6 s
ampl
es (
4 o
r 5
sam
ples
eac
hqu
arte
r Fe
b. 2
00
1–F
eb.
20
04
)1
0.3
–10
1.5
ppb
44
.0 p
pb
The
follo
win
gva
lues
rep
orte
d>
MC
L, b
ut n
otne
cess
arily
vio
ls.:
—M
ax.
resi
denc
e: 1
4 s
ampl
es (
1 p
erqu
arte
r)2
5.8
–10
1.5
ppb
56
.5 p
pb8
1.5
(1
1/1
7/0
3)
83
.5 (
8/1
8/0
3)
10
1.5
(1
1/6
/02
)
Trih
alom
etha
nes
—D
istr
ibut
ion:
42
sam
ples
(3
per
qua
rter
)1
0.3
–84
.0 p
pb3
9.5
ppb
80
ppb
81
.0 (
8/7
/02
)8
4.0
(8
/7/0
2Le
ad3
0 s
ampl
es in
20
01
90
th p
erce
ntile
: 5
.0 p
pb15
.0 p
p bC
oppe
r3
0 s
ampl
es in
20
01
90
th p
erce
ntile
: 4
9.0
ppb
1,3
00 p
p bTu
rbid
ity1
12
to
2,0
00
per
mon
thN
ot g
iven
Not
giv
en1
NTU
Vola
tile
orga
nic
chem
ical
s (V
OC
s)1
ann
ual
Not
det
ecte
dN
ot d
etec
ted
Vario
u s
Pest
icid
es2
sam
ples
eac
h pe
stic
ide
in 2
00
3N
ot d
etec
ted
Not
det
ecte
dVa
rious
Syn
thet
ic o
rgan
icch
emic
als
(SO
Cs)
2 s
ampl
es e
ach
SO
C in
20
03
Not
det
ecte
dN
ot d
etec
ted
Vario
u s
Antim
ony,
ars
enic
, be
rylli
um,
cadm
ium
, ch
rom
ium
, cy
anid
e(f
ree)
, m
ercu
ry,
nick
el:
Not
dete
cted
Not
det
ecte
dVa
riou s
Bar
ium
: 0
.03
2
Inor
gani
c ch
emic
als
(IOC
s)1
sam
ple
each
IOC
in 2
00
2
Fluo
ride:
0.9
34
Alph
a/ex
cl.
rado
n &
ura
nium
: 1
.61
5 p
Ci/
LR
adia
tion
1 s
ampl
e ea
ch in
20
02
Rad
ium
22
8:
1.5
5 p
Ci/
LN
itrat
e4
sam
ples
(1
per
yea
r 2
00
1–2
00
4)
0.5
8–0
.97
0.8
11
0R
aw w
ater
: 1
.2–2
.71
.85
Tota
l org
anic
car
bon
10
sam
ples
raw
wat
er a
nd 1
0 f
rom
pla
nt (
1ea
ch m
onth
ly J
an.–
Oct
. 2
00
2)
Plan
t: 0
.7–1
.91
.21
Sou
th-
Wes
tern
Pen
nsyl
vani
aW
ater
Aut
hori
ty(S
PW
A)
(Cur
rent
mon
itorin
gre
quire
men
tsbe
cam
e ef
fect
ive
in 1
99
4.)
Sou
rce:
Mon
onga
hela
Riv
er
Tota
l alk
alin
ity1
0 s
ampl
es (
1 m
onth
ly J
an–O
ct 2
00
2)
Raw
wat
er:
17
.5–3
4.9
24
.53
TAB
LE 1
4Sou
thw
este
rn P
enns
ylva
nia
Wat
er A
utho
rity
(SP
WA
): M
ost
Rec
ent
Mon
itor
ing
Dat
a, J
anua
ry 2
001–M
arch
2004 (
in p
pm, ex
cept
as
indi
cate
d)
Sou
rce:
PA
DEP
, D
rinki
ng W
ater
Rep
ortin
g S
yste
m, w
ww.d
rinki
ngw
ater
.sta
te.p
a.us
/dw
rs/H
TM/D
EP_f
rm.h
tml.

or 2001 reports. The system had not reported any violations of drinking waterquality standards in 2004 as of the first week of June. Recent water monitoringresults reported to the PA DEP by the SPWA are shown in Table 14.
PA DEP monitoring found a few instances in 1996 in which non-enforceablesecondary drinking water standards were exceeded. Samples taken from the resi-dences of four SPWA customers in 1996 showed one concentration of 0.609 ppm ofiron, above the secondary standard of 0.3 ppm, and an aluminum concentration of0.0778 ppm, above the secondary standard of 0.05 ppm.
It is not possible to determine whether the lack of violations is truly representativeof the quality of the drinking water supplied by the SPWA. Monitoring for inorganiccontaminants, such as arsenic, barium, beryllium, cadmium, chromium, nickel, andselenium, is required only once per nine-year period (see Table 15), despite the factthat there are known sources of many of these contaminants in the watershed; mostnotably, the Hatfield’s Ferry and Fort Martin power plants and mine or ash piledrainage areas.
A PA DEP memorandum indicates that the SPWA’s Crucible plant should havemonitored for inorganic chemicals (IOCs) for three consecutive years when it beganoperations in 1996. Instead, the SPWA assumed the plant was under the same reducedmonitoring waiver that applied to its older treatment plant. Monitoring began insteadin the period 1999–2002. Since three years of consecutive monitoring did not detectIOCs in excess of drinking water standards, the plant is now allowed to test everynine years. Only low concentrations of barium and fluoride were detected. Apparently,the PA DEP did not take any enforcement action for the lack of initial monitoring. The
33
Pollution Unchecked
TABLE 15Drinking Water Monitoring Requirements: SPWA
Parameter Monitoring requirements
Total coliform 40 monthly samples
Disinfectant residual Sampled daily, reported monthly
Haloacetic acids (five) 1 quarterly sample
Trihalomethanes 1 quarterly sample
Lead 30 samples every three years. Due by 9/30/2004,9/30/2007, and 9/30/2010.
Copper 30 samples every three years. Due by 9/30/2004,9/30/2007, and 9/30/2010.
Turbidity Sampled daily, reported monthly
Volatile organic compounds (VOCs) 1 annual sample by 12/31
Synthetic organic compounds (SOCs) 2 samples every three years. Due by 9/30/2003,9/30/2006, and 9/30/2009.
Inorganic chemicals (IOCs) 1 sample every nine years. Due between 1/1/2002 and12/31/2004.
Radiation 1 sample every four years. Due between 6/25/00 and6/24/04.
Nitrate 1 annual sample due by 12/31
Source: PA DEP, Drinking Water Reporting System, www.drinkingwater.state.pa.us/dwrs/HTM/DEP_frm.html.

lack of detection of arsenic and some other IOCs is not reliable, since the three-yearmonitoring was apparently based on a single annual sample.
Public ComplaintsThere have been three complaints concerning the SPWA documented during the last10 years in PA DEP files. The most recent complaint found by NRDC occurred inApril 2004 and concerned high levels of lead found in a drinking water fountain inthe Clarksville Post Office. Lead levels were 169 ppb. The EPA has set an action levelfor lead of 15 ppb (this is the level at which public water systems are required to takeaction to control the corrosivity of their water to minimize the leaching of lead fromwater pipes). A sample taken later by the PA DEP on a faucet that had been flushedthe previous night showed only 2.4 ppb, but it is unclear whether the sample wastaken in accordance with the EPA’s protocol, which requires first draw water to betaken after the faucet has sat unused overnight. The PA DEP apparently took nofurther action.
The PA DEP received another complaint from an SPWA customer in 2000 regard-ing dirty water. The customer complained her daughter had become ill after drinkingthe water. The SPWA attributed the problem to the recent use of fire hydrants, whichreleased sediments in the water lines. Another complaint was made in 1999 andconcerned a chemical spill that had allegedly occurred in July 1997. The anonymouscaller said the SPWA had not neutralized the spill and allowed the chemical to entera lagoon that discharged into the river. This supposedly caused rise in the pH of theeffluent that lasted three days and was not reported in the water treatment plant’sDischarge Monitoring Report (DMR). Written communications between PA DEP staffdiscuss the possibility of an investigation, but we were not able to locate anydocuments indicating whether there was any further action.
BRAVE WATER AUTHORITYBrave Water Authority purchases its water from the Morgantown Utility Board. Thesources of this water are the Monongahela River and the Cobun Creek Reservoir.There is little information specific to this system in PA DEP files, perhaps becauseBrave is apparently only responsible for chlorination, and most water qualitymonitoring and treatment are carried out by the water supplier, not Brave.
Drinking Water MonitoringAs shown in Table 16, monitoring requirements for Brave Water are even lessstringent than those for the SPWA because Brave is a smaller system serving onlyabout 200 customers.
The system’s Annual Drinking Water Quality Report for 2002 does not show anyviolations of drinking water quality standards for turbidity, fluoride, nitrate, totaltrihalomethanes, or haloacetic acids, the only chemicals reported. Brave is requiredto test for lead and copper, total coliform, cadmium, turbidity, and chlorine residual.Drinking Water Quality Reports for 1998 and 1999 showed no violations of drinking
34
Natural Resources Defense Council
A complaint in
April 2004 concerned
high levels of lead
found in a drinking
water fountain
in the Clarksville
Post Office.

water standards for those chemicals. PA DEP files show a violation for total coliformbacteria in three samples taken in 2001, which tested positive.
The most recent water quality monitoring for IOCs by the Morgantown UtilityBoard reported in the 1998 and 1999 Annual Water Quality Reports detected nitrate,barium, chromium, and fluoride, all below drinking water standards. Water moni-toring results reported to the PA DEP by Brave Water are shown in Table 17.
CARMICHAELS MUNICIPAL WATER AUTHORITYThe Carmichaels water treatment plant was originally built in 1949 and refurbishedin 1993. The plant withdraws water from the Monongahela River at milepost 75.2.The plant has a permitted water allocation of 500,000 gallons per day and servesapproximately 3,900 consumers.
A Filter Plant Performance Evaluation in 2000 gave the Carmichaels water treat-ment plant an “acceptable” rating. No Giardia or Cryptosporidium were found in thefinished water. The plant was not expected to have problems complying with theupcoming EPA rule on disinfection by-products (trihalomethanes and haloaceticacids) in drinking water because concentrations of total organic carbon (TOC) in boththe raw and finished water were low.
The 2002 Source Water Assessment Report for Carmichaels mentions heavy metaldischarge from local power plants, cumulative release of petroleum products frommarinas along the river, and storm water runoff from developed areas as potentialsources of contamination. The report also mentions potential contamination fromwildcat sewers along the river. One of these appears to be about two miles upstream
35
Pollution Unchecked
TABLE 16Drinking Water Monitoring Requirements: Brave Water Authority
Parameter Monitoring requirements
Total coliform 1 monthly sample
Disinfectant residual 1 monthly sample
Haloacetic acids (five) 1 annual sample by 9/30
Trihalomethanes 1 annual sample by 9/30
Lead 5 samples every three years. Due by 9/30/2004,9/30/2007, and 9/30/2010.
Copper 5 samples every three years. Due by 9/30/2004,9/30/2007, and 9/30/2010.
Turbidity Sampled daily, reported monthly
Volatile organic compounds (VOCs) 1 annual sample (monitored by Morgantown Utility Board)
Synthetic organic compounds (SOCs) 1 sample every three years (monitored by Morgantown UtilityBoard)
Inorganic chemicals (IOCs) Monitored by Morgantown Utility Board. Frequency notdescribed in PA DEP files
Nitrate Monitored by Morgantown Utility Board. Frequency notdescribed in PA DEP files
Source: PA DEP, Drinking Water Reporting System, www.drinkingwater.state.pa.us/dwrs/HTM/DEP_frm.html.
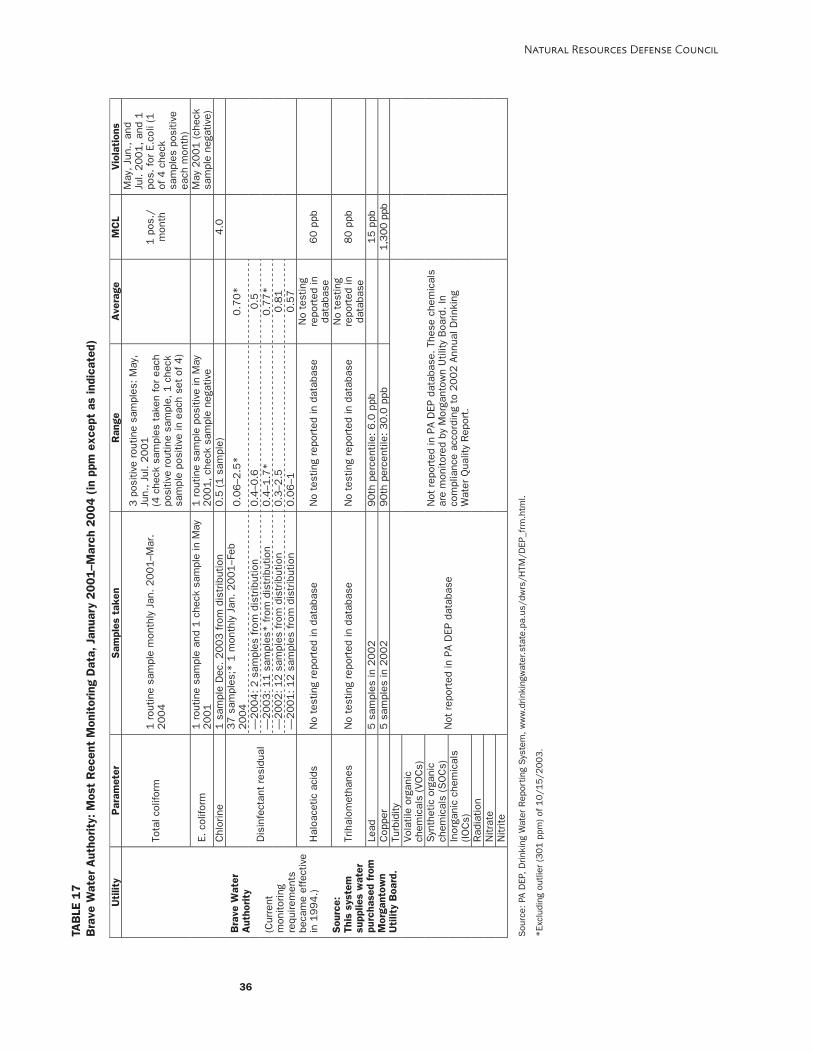
36
Natural Resources Defense Council
Uti
lity
Par
amet
erSam
ples
tak
enR
ange
Ave
rage
MC
LVio
lati
ons
Tota
l col
iform
1 r
outin
e sa
mpl
e m
onth
ly J
an. 2001–M
ar.
2004
3 p
ositi
ve r
outin
e sa
mpl
es: M
ay,
Jun.
, Ju
l. 2001
(4 c
heck
sam
ples
tak
en for
eac
hpo
sitiv
e ro
utin
e sa
mpl
e, 1
che
cksa
mpl
e po
sitiv
e in
eac
h se
t of
4)
1 p
os./
mon
th
May
, Ju
n., an
dJu
l. 2001, an
d 1
pos.
for
E.c
oli (
1of
4 c
heck
sam
ples
pos
itive
each
mon
th)
E. c
olifo
rm1 r
outin
e sa
mpl
e an
d 1 c
heck
sam
ple
in M
ay2001
1 r
outin
e sa
mpl
e po
sitiv
e in
May
2001, ch
eck
sam
ple
nega
tive
May
2001 (ch
eck
sam
ple
nega
tive)
Chl
orin
e1 s
ampl
e D
ec. 2003 fro
m d
istr
ibut
ion
0.5
(1 s
ampl
e)4.0
37 s
ampl
es;*
1 m
onth
ly J
an. 2001–F
eb2004
0.0
6–2
.5*
0.7
0*
—2004: 2 s
ampl
es fro
m d
istr
ibut
ion
0.4
–0.6
0.5
—2003: 11 s
ampl
es* fro
m d
istr
ibut
ion
0.4
–1.7
*0.7
7*
—2002: 12 s
ampl
es fro
m d
istr
ibut
ion
0.3
–2.5
0.8
1
Dis
infe
ctan
t re
sidu
al
—2001: 12 s
ampl
es fro
m d
istr
ibut
ion
0.0
6–1
0.5
7
Hal
oace
tic a
cids
No
test
ing
repo
rted
in d
atab
ase
No
test
ing
repo
rted
in d
atab
ase
No
test
ing
repo
rted
inda
taba
se60 p
pb
Trih
alom
etha
nes
No
test
ing
repo
rted
in d
atab
ase
No
test
ing
repo
rted
in d
atab
ase
No
test
ing
repo
rted
inda
taba
se80 p
pb
Lead
5 s
ampl
es in
2002
90th
per
cent
ile: 6.0
ppb
15 p
pbC
oppe
r5 s
ampl
es in
2002
90th
per
cent
ile: 30.0
ppb
1,3
00 p
p bTu
rbid
ityVo
latil
e or
gani
cch
emic
als
(VO
Cs)
Syn
thet
ic o
rgan
icch
emic
als
(SO
Cs)
Inor
gani
c ch
emic
als
(IOC
s)R
adia
tion
Nitr
ate
Bra
ve W
ater
Aut
hority
(Cur
rent
mon
itorin
gre
quire
men
tsbe
cam
e ef
fect
ive
in 1
994.)
Sou
rce:
This
sys
tem
supp
lies
wat
erpu
rcha
sed
from
Mor
gant
own
Uti
lity
Boa
rd.
Nitr
ite
Not
rep
orte
d in
PA
DEP
dat
abas
e
Not
rep
orte
d in
PA
DEP
dat
abas
e. T
hese
che
mic
als
are
mon
itore
d by
Mor
gant
own
Util
ity B
oard
. In
com
plia
nce
acco
rdin
g to
2002 A
nnua
l Drin
king
Wat
er Q
ualit
y R
epor
t.
TAB
LE 1
7B
rave
Wat
er A
utho
rity
: M
ost
Rec
ent
Mon
itor
ing
Dat
a, J
anua
ry 2
001–M
arch
2004 (
in p
pm e
xcep
t as
indi
cate
d)
Sou
rce:
PA
DEP
, D
rinki
ng W
ater
Rep
ortin
g S
yste
m, w
ww.d
rinki
ngw
ater
.sta
te.p
a.us
/dw
rs/H
TM/D
EP_f
rm.h
tml.
*Ex
clud
ing
outli
er (301 p
pm) of
10/1
5/2
003.
of the water treatment plant intake, according to the map accompanying the report.There are other wildcat lines farther upstream.
Drinking Water MonitoringThe 2002 Annual Drinking Water Quality Report shows no violations of drinking waterquality standards for turbidity, nitrate, barium, fluoride, lead, copper, synthetic organiccompounds (SOCs), coliform bacteria, haloacetic acids, or total trihalomethanes. However,two samples tested positive for coliform bacteria in 2002. In addition, a test for tri-halomethanes, chemicals that may cause cancer, certain birth defects, and miscarriages,detected a level of 93 ppb, which is higher than EPA’s new standard of 80 ppb. How-ever, it is unclear whether a violation took place, because violations are determinedbased on the results of a year of monitoring, which Carmichaels did not report.Subsequent monitoring reportedly found somewhat lower levels of trihalomethanes.
The PA DEP instructed the system to report one violation in its report for 2003,late reporting of coliform bacteria results in August, September, and October 2003.Reports for 1998, 1999, 2000, and 2001 show no violations of drinking water qualitystandards. Water monitoring results reported to the PA DEP by Carmichaels areshown in Table 18.
Tests for inorganic chemicals are required only once every nine years, under thesame unlawful waiver provision applied to the other public water systems in thestate. In 1998, tests found low concentrations of barium and fluoride. Of the regulatedVOCs, xylene and toluene have been found, both in 2002 at concentrations belowdrinking water quality standards.68 However, this detection means that the systemhas to monitor for VOCs annually by taking one sample during four consecutiveyears. If no additional detections are made, the system will be allowed to go back to areduced monitoring schedule. Monitoring requirements for Carmichaels MunicipalWater Authority are shown in Table 19.
Public Complaint: Rat?A public complaint concerning Carmichaels came from a customer who alleged thatshe detected a foul odor in her water and found animal remains in the screen on herfaucet. Carmichaels employees found the remains of a rodent in the water meterservicing the home, but did not take water samples to check for bacterial contami-nation. The customer arranged to have her water tested by another laboratory, andresults were positive for coliform bacteria. The water system apparently did nothelp the customer in cleaning out the water lines or with other measures necessaryto clean out the contamination. Carmichaels later reimbursed the customer’s costs,though it denied any responsibility for the problem.
DUNKARD VALLEY JOINT MUNICIPAL WATER AUTHORITYDunkard’s water treatment plant was built in 1945, and the first water supply permitfor the system was issued in 1950. The system serves a population of approximately1,400 in Greensboro and Monongahela. The water comes from the left bank of the
37
Pollution Unchecked
Carmichaels employees
found the remains of
a rodent in the water
meter servicing the
home, but did not
take water samples
to check for bacterial
contamination.
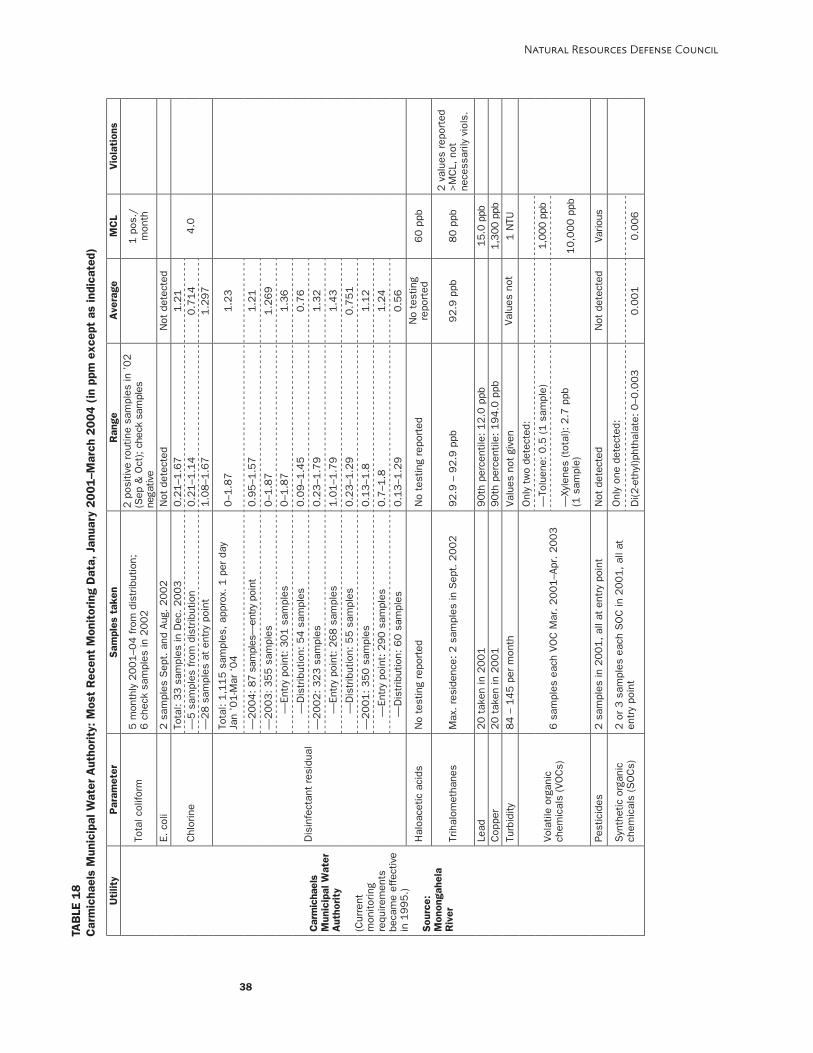
38
Natural Resources Defense Council
Uti
lity
Par
amet
erS
ampl
es t
aken
Ran
geA
vera
geM
CL
Vio
lati
ons
Tota
l col
iform
5 m
onth
ly 2
00
1–0
4 f
rom
dis
trib
utio
n;6
che
ck s
ampl
es in
20
02
2 p
ositi
ve r
outin
e sa
mpl
es in
’0
2(S
ep &
Oct
); c
heck
sam
ples
nega
tive
1 p
os./
mon
th
E. c
oli
2 s
ampl
es S
ept.
and
Aug
. 2
00
2N
ot d
etec
ted
Not
det
ecte
dTo
tal:
33
sam
ples
in D
ec.
20
03
0.2
1–1
.67
1.2
1—
5 s
ampl
es f
rom
dis
trib
utio
n0
.21
–1.1
40
.71
4C
hlor
ine
—2
8 s
ampl
es a
t en
try
poin
t1
.08
–1.6
71
.29
74
.0
Tota
l: 1
,11
5 s
ampl
es,
appr
ox.
1 p
er d
ayJa
n ’0
1-M
ar ‘
04
0–1
.87
1.2
3
—2
00
4:
87 s
ampl
es—
entry
poi
nt0
.95
–1.5
71
.21
—2
00
3:
35
5 s
ampl
es0–1
.87
1.2
69
—En
try
poin
t: 3
01
sam
ples
0–1
.87
1.3
6
—D
istr
ibut
ion:
54
sam
ples
0.0
9–1
.45
0.7
6
—2
00
2:
32
3 s
ampl
es0.2
3–1
.79
1.3
2
—En
try
poin
t: 2
68
sam
ples
1.0
1–1
.79
1.4
3
—D
istr
ibut
ion:
55
sam
ples
0.2
3–1
.29
0.7
51
—2
00
1:
35
0 s
ampl
es0.1
3–1
.81
.12
—En
try
poin
t: 2
90
sam
ples
0.7
–1.8
1.2
4
Dis
infe
ctan
t re
sidu
al
—D
istr
ibut
ion:
60
sam
ples
0.1
3–1
.29
0.5
6
Hal
oace
tic a
cids
No
test
ing
repo
rted
No
test
ing
repo
rted
No
test
ing
repo
rted
60
ppb
Trih
alom
etha
nes
Max
. re
side
nce:
2 s
ampl
es in
Sep
t. 2
00
29
2.9
– 9
2.9
ppb
92
.9 p
pb8
0 p
pb2
val
ues
repo
rted
>M
CL,
not
nece
ssar
ily v
iols
.
Lead
20
tak
en in
20
01
90
th p
erce
ntile
: 1
2.0
ppb
15.0
ppb
Cop
per
20
tak
en in
20
01
90
th p
erce
ntile
: 1
94
.0 p
pb1,
300
ppb
Turb
idity
84
– 1
45
per
mon
thVa
lues
not
giv
enVa
lues
not
1 N
TU
Onl
y tw
o de
tect
ed:
—To
luen
e: 0
.5 (
1 s
ampl
e)1,
000
ppb
Vola
tile
orga
nic
chem
ical
s (V
OC
s)6
sam
ples
eac
h VO
C M
ar.
20
01
–Apr
. 2
00
3—
Xyle
nes
(tot
al):
2.7
ppb
(1 s
ampl
e)1
0,0
00
ppb
Pest
icid
es2
sam
ples
in 2
00
1,
all a
t en
try
poin
tN
ot d
etec
ted
Not
det
ecte
dVa
rious
Onl
y on
e de
tect
ed:
Car
mic
hael
sM
unic
ipal
Wat
erA
utho
rity
(Cur
rent
mon
itorin
gre
quire
men
tsbe
cam
e ef
fect
ive
in 1
99
5.)
Sou
rce:
Mon
onga
hela
Riv
er
Syn
thet
ic o
rgan
icch
emic
als
(SO
Cs)
2 o
r 3
sam
ples
eac
h S
OC
in 2
00
1,
all a
ten
try
poin
tD
i(2-e
thyl
)pht
hala
te:
0–0
.00
30
.00
10
.00
6
TAB
LE 1
8C
arm
icha
els
Mun
icip
al W
ater
Aut
hority
: M
ost
Rec
ent
Mon
itor
ing
Dat
a, J
anua
ry 2
001–M
arch
2004 (
in p
pm e
xcep
t as
indi
cate
d)

39
Pollution Unchecked
Sou
rce:
PA
DEP
, D
rinki
ng W
ater
Rep
ortin
g S
yste
m, w
ww.d
rinki
ngw
ater
.sta
te.p
a.us
/dw
rs/H
TM/D
EP_f
rm.h
tml.
*30 p
pb a
s of
12/0
8/0
3.
Uti
lity
Par
amet
erS
ampl
es t
aken
Ran
geA
vera
geM
CL
Vio
lati
ons
Inor
gani
c ch
emic
als
(IOC
s)N
o te
stin
g re
port
edN
o te
stin
g re
port
edN
o te
stin
gre
port
edAl
pha/
excl
. ra
don
& u
rani
um:
0.2
15
pC
i/L
Com
bine
d ur
aniu
m:
1*
Rad
ium
22
6:
Not
det
ecte
dR
adia
tion
1 s
ampl
e fr
om e
ntry
poi
nt in
Jan
. 2
00
3
Rad
ium
22
8:
Not
det
ecte
d5
pC
i/L
(com
bine
d)
Nitr
ate
1 p
er y
ear
20
01
–20
04
0.2
–0.8
33
0.6
36
10
Raw
wat
er:
1.0
5–3
.06
1.6
96
7To
tal o
rgan
ic c
arbo
n1
2 s
ampl
es r
aw w
ater
and
12
fro
m p
lant
(1 e
ach
mon
thly
in 2
00
3)
Plan
t: 0
.69
–2.5
11
.27
9
Car
mic
hael
sM
unic
ipal
Wat
erA
utho
rity
(Cur
rent
mon
itorin
gre
quire
men
tsbe
cam
e ef
fect
ive
in 1
99
5.)
Sou
rce:
Mon
onga
hela
Riv
erTo
tal a
lkal
inity
10
sam
ples
raw
wat
er (
appr
ox.
1 m
onth
ly in
20
03
)1
6–5
12
9.3
TAB
LE 1
8 (
cont
inue
d)C
arm
icha
els
Mun
icip
al W
ater
Aut
hority
: M
ost
Rec
ent
Mon
itor
ing
Dat
a, J
anua
ry 2
001–M
arch
2004 (
in p
pm e
xcep
t as
indi
cate
d)
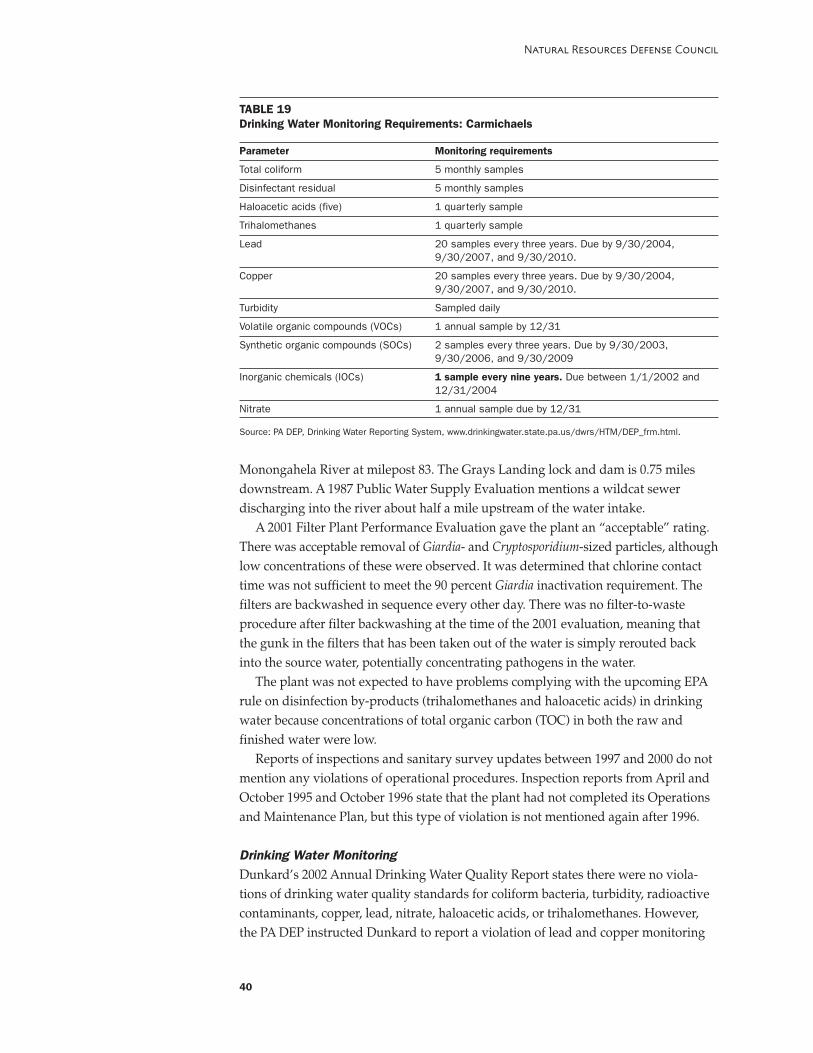
Monongahela River at milepost 83. The Grays Landing lock and dam is 0.75 milesdownstream. A 1987 Public Water Supply Evaluation mentions a wildcat sewerdischarging into the river about half a mile upstream of the water intake.
A 2001 Filter Plant Performance Evaluation gave the plant an “acceptable” rating.There was acceptable removal of Giardia- and Cryptosporidium-sized particles, althoughlow concentrations of these were observed. It was determined that chlorine contacttime was not sufficient to meet the 90 percent Giardia inactivation requirement. Thefilters are backwashed in sequence every other day. There was no filter-to-wasteprocedure after filter backwashing at the time of the 2001 evaluation, meaning thatthe gunk in the filters that has been taken out of the water is simply rerouted backinto the source water, potentially concentrating pathogens in the water.
The plant was not expected to have problems complying with the upcoming EPArule on disinfection by-products (trihalomethanes and haloacetic acids) in drinkingwater because concentrations of total organic carbon (TOC) in both the raw andfinished water were low.
Reports of inspections and sanitary survey updates between 1997 and 2000 do notmention any violations of operational procedures. Inspection reports from April andOctober 1995 and October 1996 state that the plant had not completed its Operationsand Maintenance Plan, but this type of violation is not mentioned again after 1996.
Drinking Water MonitoringDunkard’s 2002 Annual Drinking Water Quality Report states there were no viola-tions of drinking water quality standards for coliform bacteria, turbidity, radioactivecontaminants, copper, lead, nitrate, haloacetic acids, or trihalomethanes. However,the PA DEP instructed Dunkard to report a violation of lead and copper monitoring
40
Natural Resources Defense Council
TABLE 19Drinking Water Monitoring Requirements: Carmichaels
Parameter Monitoring requirements
Total coliform 5 monthly samples
Disinfectant residual 5 monthly samples
Haloacetic acids (five) 1 quarterly sample
Trihalomethanes 1 quarterly sample
Lead 20 samples every three years. Due by 9/30/2004,9/30/2007, and 9/30/2010.
Copper 20 samples every three years. Due by 9/30/2004,9/30/2007, and 9/30/2010.
Turbidity Sampled daily
Volatile organic compounds (VOCs) 1 annual sample by 12/31
Synthetic organic compounds (SOCs) 2 samples every three years. Due by 9/30/2003,9/30/2006, and 9/30/2009
Inorganic chemicals (IOCs) 1 sample every nine years. Due between 1/1/2002 and12/31/2004
Nitrate 1 annual sample due by 12/31
Source: PA DEP, Drinking Water Reporting System, www.drinkingwater.state.pa.us/dwrs/HTM/DEP_frm.html.
requirements because the system did not take the number of samples required. ThePA DEP Drinking Water Reporting System database, on the other hand, says no suchmonitoring is expected. PA DEP files did not clarify this inconsistency.
Dunkard was required to report another monitoring violation in its report for 2003 dueto late reporting of coliform bacteria results in August, September, and October 2003.The EPA also issued a Notice of Violation (NOV) to Dunkard in November 2002 for latesubmission of the 2002 report. Reports for 1998, 1999, 2000, and 2001 show no violationsof drinking water quality standards or monitoring requirements. Water monitoringresults reported to the PA DEP by Dunkard Valley are shown in Table 20, page 42.
PA DEP records show some additional monitoring violations for failure to reportturbidity data during seven months in 2002. Dunkard Valley is under a reduced moni-toring schedule for inorganic contaminants (IOCs), like the other public water systemsserving Greene County. This means that the system is required to test one sample everynine years. Monitoring requirements for Dunkard Valley are shown in Table 21, page 44.
Arsenic ContaminationThe 1998 Annual Drinking Water Quality Report and lab reports evaluated by NRDC inPA DEP files show that 30 ppb of arsenic were detected in 1996. This concentration isbelow the old drinking water quality standard of 50 ppb set in 1942, but is three timesthe level allowed under the new standard of 10 ppb, which becomes enforceable in 2006.According to a 2001 National Academy of Sciences report on arsenic in drinking water,a person who drinks water containing this level of arsenic, 30 ppb, faces a lifetime fatalcancer risk of about 1 in 100—in other words, one out of every hundred people drink-ing this water for a lifetime would be expected to die prematurely of cancer as a result.69
As noted in Table 20, no arsenic was detected in the most recent sample, but the datais inadequate to evaluate the true ongoing levels of arsenic in the water supply.
Despite the new EPA arsenic standard of 10 ppb and past detections well abovethat level, according to a recent conversation with a PA DEP water supply inspector,it is not clear whether the agency will take any action to modify the reduced moni-toring waivers that have been granted to the water systems.70
EAST DUNKARD WATER ASSOCIATIONThe system serves a population of approximately 3,400 in the townships of Dunkard,Monongahela, Greene, and Cumberland. Its water treatment plant was built in 1983,and its water intake is about one mile downstream of the Cheat River confluence.There are wildcat sewers in the watershed upstream of this intake. The water treat-ment plant produces an average of 0.335 MGD.
Serious Filtration ProblemsIn 2002 a Filter Plant Performance Evaluation gave the plant an “unacceptable” rating.The evaluation identified an unacceptable performance in its ability to remove Giardiacysts, an insufficient coagulant control strategy, inconsistent operation of the clarifica-tion unit, inadequate process control testing, and no monitoring of the filters. Chlorine
41
Pollution Unchecked
One out of every
hundred people
drinking this water
for a lifetime would
be expected to die
prematurely of cancer.
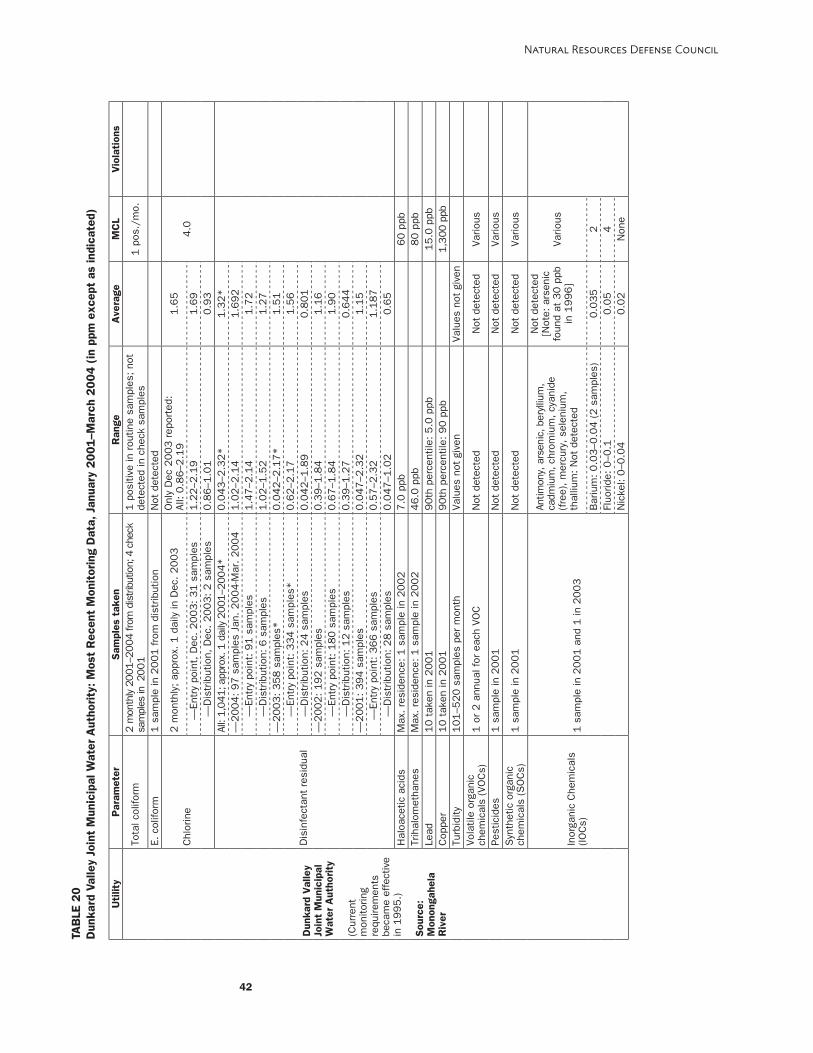
42
Natural Resources Defense Council
Uti
lity
Par
amet
erS
ampl
es t
aken
Ran
geA
vera
geM
CL
Vio
lati
ons
Tota
l col
iform
2 m
onth
ly 2
001–
2004
from
dis
tribu
tion;
4 c
heck
sam
ples
in 2
001
1 p
ositi
ve in
rou
tine
sam
ples
; no
tde
tect
ed in
che
ck s
ampl
es1
pos
./m
o.
E. c
olifo
rm1
sam
ple
in 2
00
1 f
rom
dis
trib
utio
nN
ot d
etec
ted
2 m
onth
ly;
appr
ox.
1 d
aily
in D
ec.
20
03
Onl
y D
ec 2
00
3 r
epor
ted:
All:
0.8
6–2
.19
1.6
5
—En
try
poin
t, D
ec.
20
03
: 3
1 s
ampl
es1
.22
–2.1
91
.69
Chl
orin
e
—D
istr
ibut
ion,
Dec
. 2
00
3:
2 s
ampl
es0
.86
–1.0
10
.93
4.0
All:
1,04
1; a
ppro
x. 1
dai
ly 2
001–
200
4*0
.04
3–2
.32
*1
.32
*—
20
04
: 9
7 s
ampl
es J
an.
20
04
-Mar
. 2
00
41
.02
–2.1
41
.69
2
—
Entr
y po
int:
91
sam
ples
1.4
7–2
.14
1.7
2
—
Dis
trib
utio
n: 6
sam
ples
1.0
2–1
.52
1.2
7—
20
03
: 3
58
sam
ples
*0
.04
2–2
.17
*1
.51
—En
try
poin
t: 3
34
sam
ples
*0
.62
–2.1
71
.56
—D
istr
ibut
ion:
24
sam
ples
0.0
42
–1.8
90
.80
1—
20
02
: 1
92
sam
ples
0.3
9–1
.84
1.1
6
—
Entr
y po
int:
18
0 s
ampl
es0
.67
–1.8
41
.90
—D
istr
ibut
ion:
12
sam
ples
0.3
9–1
.27
0.6
44
—2
00
1:
39
4 s
ampl
es0
.04
7–2
.32
1.1
5
—
Entr
y po
int:
36
6 s
ampl
es0
.57
–2.3
21
.18
7
Dis
infe
ctan
t re
sidu
al
—D
istr
ibut
ion:
28
sam
ples
0.0
47
–1.0
20
.65
Hal
oace
tic a
cids
Max
. re
side
nce:
1 s
ampl
e in
20
02
7.0
ppb
60
ppb
Trih
alom
etha
nes
Max
. re
side
nce:
1 s
ampl
e in
20
02
46
.0 p
pb8
0 p
pbLe
ad1
0 t
aken
in 2
00
19
0th
per
cent
ile:
5.0
ppb
15
.0 p
pbC
oppe
r1
0 t
aken
in 2
00
19
0th
per
cent
ile:
90
ppb
1,3
00 p
pbTu
rbid
ity1
01
–52
0 s
ampl
es p
er m
onth
Valu
es n
ot g
iven
Valu
es n
ot g
iven
Vola
tile
orga
nic
chem
ical
s (V
OC
s)1
or
2 a
nnua
l for
eac
h VO
CN
ot d
etec
ted
Not
det
ecte
dVa
rious
Pest
icid
es1
sam
ple
in 2
00
1N
ot d
etec
ted
Not
det
ecte
dVa
rious
Syn
thet
ic o
rgan
icch
emic
als
(SO
Cs)
1 s
ampl
e in
20
01
Not
det
ecte
dN
ot d
etec
ted
Vario
us
Antim
ony,
ars
enic
, ber
ylliu
m,
cadm
ium
, chr
omiu
m,
cyan
ide
(fre
e),
mer
cury
, se
leni
um,
thal
lium
: N
ot d
etec
ted
Not
det
ecte
d[N
ote:
ars
enic
foun
d at
30
ppb
in 1
99
6]
Vario
us
Bar
ium
: 0
.03
–0.0
4 (
2 s
ampl
es)
0.0
35
2Fl
uorid
e: 0
–0.1
0.0
54
Dun
kard
Val
ley
Join
t M
unic
ipal
Wat
er A
utho
rity
(Cur
rent
mon
itorin
gre
quire
men
tsbe
cam
e ef
fect
ive
in 1
99
5.)
Sou
rce:
Mon
onga
hela
Riv
er
Inor
gani
c C
hem
ical
s(IO
Cs)
1 s
ampl
e in
20
01
and
1 in
20
03
Nic
kel:
0–0
.04
0.0
2N
one
TAB
LE 2
0D
unka
rd V
alle
y Jo
int
Mun
icip
al W
ater
Aut
hority
: M
ost
Rec
ent
Mon
itor
ing
Dat
a, J
anua
ry 2
001–M
arch
2004 (
in p
pm e
xcep
t as
indi
cate
d)
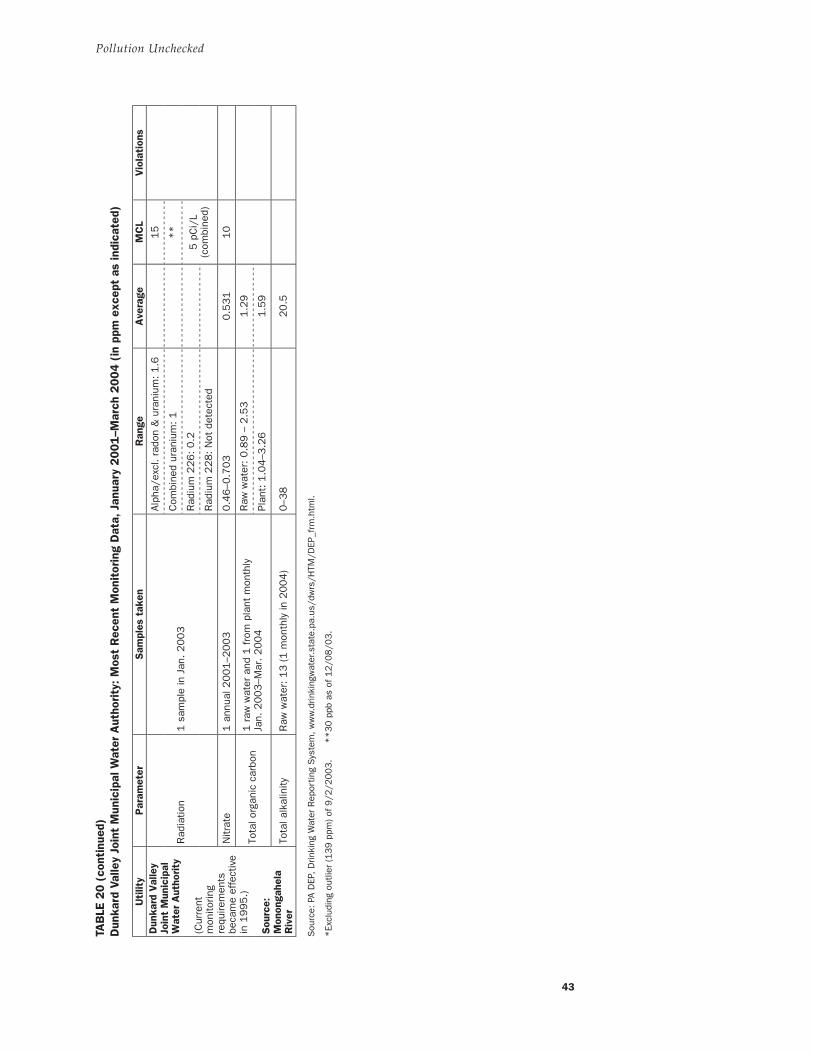
43
Pollution Unchecked
Sou
rce:
PA
DEP
, D
rinki
ng W
ater
Rep
ortin
g S
yste
m, w
ww.d
rinki
ngw
ater
.sta
te.p
a.us
/dw
rs/H
TM/D
EP_f
rm.h
tml.
*Ex
clud
ing
outli
er (139 p
pm) of
9/2
/2003.
**30 p
pb a
s of
12/0
8/0
3.
TAB
LE 2
0 (
cont
inue
d)D
unka
rd V
alle
y Jo
int
Mun
icip
al W
ater
Aut
hority
: M
ost
Rec
ent
Mon
itor
ing
Dat
a, J
anua
ry 2
001–M
arch
2004 (
in p
pm e
xcep
t as
indi
cate
d)
Uti
lity
Par
amet
erS
ampl
es t
aken
Ran
geA
vera
geM
CL
Vio
lati
ons
Alph
a/ex
cl.
rado
n &
ura
nium
: 1
.61
5
Com
bine
d ur
aniu
m:
1*
*
Rad
ium
22
6: 0
.2R
adia
tion
1 s
ampl
e in
Jan
. 2
00
3
Rad
ium
22
8: N
ot d
etec
ted
5 p
Ci/
L(c
ombi
ned)
Nitr
ate
1 a
nnua
l 20
01
–20
03
0.4
6–0
.70
30
.53
11
0
Raw
wat
er:
0.8
9 –
2.5
31
.29
Tota
l org
anic
car
bon
1 r
aw w
ater
and
1 f
rom
pla
nt m
onth
lyJa
n. 2
00
3–M
ar. 2
00
4Pl
ant:
1.0
4–3
.26
1.5
9
Dun
kard
Val
ley
Join
t M
unic
ipal
Wat
er A
utho
rity
(Cur
rent
mon
itorin
gre
quire
men
tsbe
cam
e ef
fect
ive
in 1
995.)
Sou
rce:
Mon
onga
hela
Riv
erTo
tal a
lkal
inity
Raw
wat
er:
13
(1
mon
thly
in 2
00
4)
0–3
82
0.5

contact time was deemed to be sufficient for inactivation (i.e., to kill bacteria andviruses), except perhaps under cold-water conditions. The pH in the finished waterwas 9.5, above the non-enforceable secondary drinking water standard of 6.5 to 8.5.
Drinking Water MonitoringAccording to East Dunkard’s 2002 Annual Drinking Water Quality Report, there wereno violations of drinking water quality standards for turbidity, copper, lead, or totaltrihalomethanes. East Dunkard had a monitoring requirement violation in 2002 forlate testing for volatile organic compounds (VOCs), which should have been sampledbetween January and March 2002. The 1998, 1999, 2000, and 2001 reports mention noviolations of water quality standards or monitoring requirements.
The PA DEP has instructed East Dunkard to report a violation in its upcomingDrinking Water Quality Report for 2003. The violation involved late reporting ofresults for total coliform bacteria for September and October 2003. PA DEP recordsalso show there was a violation for late reporting of turbidity results duringSeptember 2003. Water monitoring results reported to the PA DEP by East Dunkardare shown in Table 22.
Arsenic ContaminationLike Dunkard Valley, East Dunkard reported a detection of 30 ppb of arsenic inApril 1996. This concentration is below the current drinking water quality standard,
44
Natural Resources Defense Council
TABLE 21Drinking Water Monitoring Requirements: Dunkard Valley
Parameter Monitoring requirements
Total coliform 2 monthly samples
Disinfectant residual 2 monthly samples
Haloacetic acids (five) 1 quarterly sample
Trihalomethanes 1 quarterly sample
Lead and copper No monitoring of lead or copper is expected according tothe PA DEP Drinking Water Reporting System database.However, PA DEP files say the agency required the systemto report a violation of monitoring requirements for takingfewer samples than required.
Turbidity Sampled daily, reported monthly.
Volatile organic compounds (VOCs) 1 annual sample by 12/31 if previously detected
Synthetic organic compounds (SOCs) 1 sample every three years. Due by 9/30/2003,9/30/2006, and 9/30/2009
Inorganic chemicals (IOCs) 1 sample every nine years. Due between 1/1/2002 and12/31/2004.
Radiation 1 sample every four years between 6/25/00 and 6/24/04
Nitrate 1 annual sample due by 12/31
Total organic carbon 1 monthly sample
Total alkalinity 1 monthly sample
Source: PA DEP, Drinking Water Reporting System, www.drinkingwater.state.pa.us/dwrs/HTM/DEP_frm.html.
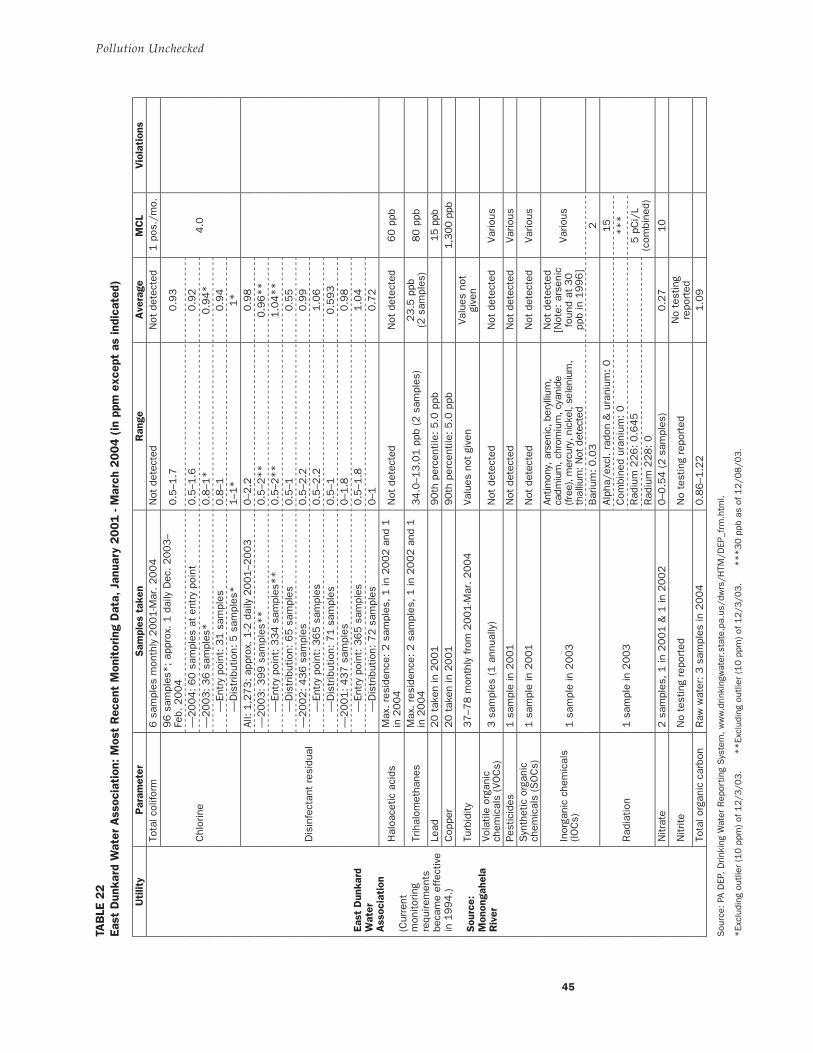
45
Pollution Unchecked
Sou
rce:
PA
DEP
, D
rinki
ng W
ater
Rep
ortin
g S
yste
m, w
ww.d
rinki
ngw
ater
.sta
te.p
a.us
/dw
rs/H
TM/D
EP_f
rm.h
tml.
*Ex
clud
ing
outli
er (10 p
pm) of
12/3
/03.
**Ex
clud
ing
outli
er (10 p
pm) of
12/3
/03.
***30 p
pb a
s of
12/0
8/0
3.
TAB
LE 2
2Ea
st D
unka
rd W
ater
Ass
ocia
tion
: M
ost
Rec
ent
Mon
itor
ing
Dat
a, J
anua
ry 2
001 -
Mar
ch 2
004 (
in p
pm e
xcep
t as
indi
cate
d)
Uti
lity
Par
amet
erSam
ples
tak
enR
ange
Ave
rage
MC
LVio
lati
ons
Tota
l col
iform
6 s
ampl
es m
onth
ly 2
001-M
ar. 2004
Not
det
ecte
dN
ot d
etec
ted
1 p
os./
mo.
96 s
ampl
es*; ap
prox
. 1 d
aily
Dec
. 2003–
Feb.
2004
0.5
–1.7
0.9
3
—2004: 60 s
ampl
es a
t en
try
poin
t0.5
–1.6
0.9
2—
2003: 36 s
ampl
es*
0.8
–1*
0.9
4*
—
Entr
y po
int:
31 s
ampl
es0.8
–10.9
4
Chl
orin
e
—
Dis
trib
utio
n: 5
sam
ples
*1–1
*1*
4.0
All:
1,2
73; ap
prox
. 1-2
dai
ly 2
001–2
003
0–2
.20.9
8—
2003: 399 s
ampl
es**
0.5
–2**
0.9
6**
—
Entr
y po
int:
334 s
ampl
es**
0.5
–2**
1.0
4**
—
Dis
trib
utio
n: 6
5 s
ampl
es0.5
–10.5
5—
2002: 436 s
ampl
es0.5
–2.2
0.9
9 —
Entr
y po
int:
365 s
ampl
es0.5
–2.2
1.0
6 —
Dis
trib
utio
n: 7
1 s
ampl
es0.5
–10.5
93
—2001: 437 s
ampl
es0–1
.80.9
8 —
Entr
y po
int:
365 s
ampl
es0.5
–1.8
1.0
4
Dis
infe
ctan
t re
sidu
al
—
Dis
trib
utio
n: 7
2 s
ampl
es0–1
0.7
2
Hal
oace
tic a
cids
Max
. re
side
nce:
2 s
ampl
es, 1 in
2002 a
nd 1
in 2
004
Not
det
ecte
dN
ot d
etec
ted
60 p
pb
Trih
alom
etha
nes
Max
. re
side
nce:
2 s
ampl
es, 1 in
2002 a
nd 1
in 2
004
34.0
–13.0
1 p
pb (2 s
ampl
es)
23.5
ppb
(2 s
ampl
es)
80 p
pb
Lead
20 t
aken
in 2
001
90th
per
cent
ile: 5.0
ppb
15 p
p bC
oppe
r20 t
aken
in 2
001
90th
per
cent
ile: 5.0
ppb
1,3
00 p
p b
Turb
idity
37–7
8 m
onth
ly fro
m 2
001-M
ar. 2004
Valu
es n
ot g
iven
Valu
es n
otgi
ven
Vola
tile
orga
nic
chem
ical
s (V
OC
s)3 s
ampl
es (1 a
nnua
lly)
Not
det
ecte
dN
ot d
etec
ted
Vario
us
Pest
icid
es1 s
ampl
e in
2001
Not
det
ecte
dN
ot d
etec
ted
Vario
usS
ynth
etic
org
anic
chem
ical
s (S
OC
s)1 s
ampl
e in
2001
Not
det
ecte
dN
ot d
etec
ted
Vario
us
Antim
ony,
ars
enic
, ber
ylliu
m,
cadm
ium
, chr
omiu
m, c
yani
de(fr
ee),
mer
cury
, nic
kel,
sele
nium
,th
alliu
m: N
ot d
etec
ted
Not
det
ecte
d[N
ote:
ars
enic
foun
d at
30
ppb
in 1
996]
Vario
usIn
orga
nic
chem
ical
s(IO
Cs)
1 s
ampl
e in
2003
Bar
ium
: 0.0
32
Alph
a/ex
cl. ra
don
& u
rani
um: 0
15
Com
bine
d ur
aniu
m: 0
***
Rad
ium
226: 0.6
45
Rad
iatio
n1 s
ampl
e in
2003
Rad
ium
228: 0
5 p
Ci/
L(c
ombi
ned)
Nitr
ate
2 s
ampl
es, 1 in
2001 &
1 in
2002
0–0
.54 (2 s
ampl
es)
0.2
710
Nitr
iteN
o te
stin
g re
port
edN
o te
stin
g re
port
edN
o te
stin
gre
port
ed
East
Dun
kard
Wat
erA
ssoc
iati
on
(Cur
rent
mon
itorin
gre
quire
men
tsbe
cam
e ef
fect
ive
in 1
994.)
Sou
rce:
Mon
onga
hela
Riv
er
Tota
l org
anic
car
bon
Raw
wat
er: 3 s
ampl
es in
2004
0.8
6–1
.22
1.0
9

46
Natural Resources Defense Council
TABLE 23Drinking Water Monitoring Requirements: East Dunkard
Parameter Monitoring requirements
Total coliform 4 monthly samples
Disinfectant residual Daily; reported monthly
Haloacetic acids (five) 1 quarterly sample
Trihalomethanes 1 quarterly sample
Lead 20 samples every three years. Due by 9/30/2004,9/30/2007, and 9/30/2010.
Copper 20 samples every three years by 9/30/2004, 9/30/2007,and 9/30/2010.
Turbidity Sampled daily, reported monthly
Volatile organic compounds (VOCs) 1 annual sample by 12/31
Synthetic organic compounds (SOCs) 1 sample every three years. Due by 9/30/2003,9/30/2006, and 9/30/2009.
Inorganic chemicals (IOCs) 1 sample every nine years. Due between 1/1/2002 and12/31/2004.
Radiation 1 sample every four years between 6/25/2000 and6/24/2004.
Nitrate 1 annual sample due by 12/31
Source: PA DEP, Drinking Water Reporting System, www.drinkingwater.state.pa.us/dwrs/HTM/DEP_frm.html.
TABLE 24Drinking Water Monitoring Requirements: Mt. Morris
Parameter Monitoring requirements
Total coliform 2 monthly samples
Disinfectant residual 2 monthly samples
Haloacetic acids (five) 1 quarterly sample
Trihalomethanes 1 quarterly sample
Lead 10 samples every three years. Due by 9/30/2004,9/30/2007, and 9/30/2010.
Copper 10 samples every three years by 9/30/2004, 9/30/2007,and 9/30/2010.
Turbidity Sampled daily, reported monthly
Volatile organic compounds (VOCs) Monitored by Morgantown Utility Board. Frequency notdescribed in PA DEP files.
Synthetic organic compounds (SOCs) Monitored by Morgantown Utility Board. Frequency notdescribed in PA DEP files.
Inorganic chemicals (IOCs) Monitored by Morgantown Utility Board. Frequency notdescribed in PA DEP files.
Radiation Monitored by Morgantown Utility Board. Frequency notdescribed in PA DEP files.
Nitrate Monitored by Morgantown Utility Board. Frequency notdescribed in PA DEP files.
Source: PA DEP, Drinking Water Reporting System, www.drinkingwater.state.pa.us/dwrs/HTM/DEP_frm.html.

47
Pollution Unchecked
Sou
rce:
PA
DEP
, D
rinki
ng W
ater
Rep
ortin
g S
yste
m, w
ww.d
rinki
ng w
ater
.sta
te.p
a.us
/dw
rs/H
TM/D
EP_f
rm.h
tml.
TAB
LE 2
5M
t. M
orris
Wat
er &
Sew
age
Aut
hority
: M
ost
Rec
ent
Mon
itor
ing
Dat
a, J
anua
ry 2
001–M
arch
2004 (
in p
pm e
xcep
t as
indi
cate
d)
Uti
lity
Par
amet
erSam
ples
tak
enR
ange
Ave
rage
MC
LVio
lati
ons
Tota
l col
iform
2 m
onth
ly J
an. 2001–M
ar. 2004
Not
det
ecte
d1 p
os./
mon
th
Chl
orin
e2 s
ampl
es in
Dec
‘03
1.2
8–1
.3 (2 s
ampl
es)
1.2
9(2
sam
ples
)4.0
70 s
ampl
es; 2
mon
thly
Jan
’01 —
Nov
’03
0.4
–1.4
0.8
8—
2003: 22 s
ampl
es fro
m d
istr
ibut
ion
0.6
–1.4
0.9
8—
2002: 24 s
ampl
es fro
m d
istr
ibut
ion
0.4
–1.4
0.8
9D
isin
fect
ant
resi
dual
—2001: 24 s
ampl
es fro
m d
istr
ibut
ion
0.4
–1.4
0.7
9
Hal
oace
tic a
cids
Max
. re
side
nce:
2 s
ampl
es; 1 in
2003 a
nd 1
in 2
004
25.2
–58.8
ppb
42.0
ppb
60 p
pb
Trih
alom
etha
nes
Max
. re
side
nce:
2 s
ampl
es; 1 in
2003 a
nd 1
in 2
004
25.3
–68.7
ppb
47.0
ppb
80 p
pb
Lead
10 in
2001
90th
per
cent
ile: 5.0
ppb
15.0
pp b
Cop
per
10 in
2001
90th
per
cent
ile: 15.0
ppb
1,3
00 p
p bTu
rbid
ityVo
latil
e or
gani
cch
emic
als
(VO
Cs)
Syn
thet
ic o
rgan
icch
emic
als
(SO
Cs)
Not
rep
orte
d in
PA
DEP
dat
abas
e
Not
rep
orte
d in
the
PA
DEP
dat
abas
e. T
hese
chem
ical
s ar
e m
onito
red
by M
orga
ntow
n U
tility
Boa
rd. In
com
plia
nce
acco
rdin
g to
2002 A
nnua
lD
rinki
ng W
ater
Qua
lity
Rep
ort.
Inor
gani
c ch
emic
als
(IOC
s)3 s
ampl
es; 1 a
nnua
l 2001–2
003
Cad
miu
m: 0.3
–0.5
ppb
(No
othe
r re
port
ed)
0.4
ppb
5.0
ppb
Rad
iatio
nN
itrat
eN
itrite
Tota
l org
anic
car
bon
Mt.
Mor
ris
Wat
er &
Sew
age
Aut
hority
(Cur
rent
mon
itorin
gre
quire
men
tsbe
cam
e ef
fect
ive
in 1
993.)
Sou
rce:
This
sys
tem
supp
lies
wat
erpu
rcha
sed
from
Mor
gant
own
Uti
lity
Boa
rd.
Tota
l alk
alin
ity
Not
rep
orte
d in
the
PA
DEP
dat
abas
e
Not
rep
orte
d in
the
PA
DEP
dat
abas
e. T
hese
chem
ical
s ar
e m
onito
red
by M
orga
ntow
n U
tility
Boa
rd. In
com
plia
nce
acco
rdin
g to
2002 A
nnua
lD
rinki
ng W
ater
Qua
lity
Rep
ort.

but three times the new EPA arsenic standard of 10 ppb that will become effectiveJanuary 23, 2006. East Dunkard is under a reduced monitoring schedule for inorganiccontaminants (IOCs), including arsenic, like the other public water systems servingGreene County. According to a 2001 National Academy of Sciences report on arsenicin drinking water, a person who drinks water containing this level of arsenic, 30 ppb,faces a high lifetime fatal cancer risk of about 1 in 10071—in other words, one out ofevery hundred people drinking this water for a lifetime would be expected to dieprematurely of cancer as a result. The potentially good news is that a single sampleIOC test in 2003 reportedly found no detectable arsenic. More frequent monitoring isabsolutely crucial for this water supply to determine how often arsenic is a problem,and at what levels. Current monitoring requirements for East Dunkard are shownin Table 23.
MT. MORRIS WATER & SEWAGE AUTHORITYThis system serves a population of approximately 1,500 people. Mt. Morris pur-chases its water from the Morgantown Utility Board. The sources of this water arethe Monongahela River and Cobun Creek Reservoir. There is little informationspecific to this system in PA DEP files, perhaps due to the fact that there is minimalwater treatment (other than chlorination) and most water quality monitoring iscarried out by its supplier.
Drinking Water MonitoringThe system’s Annual Drinking Water Quality Reports for 1998, 1999, 2000, 2001, and2002 do not show any violations of drinking water quality standards or monitoringrequirements. The system is required to test for lead, copper, total coliform, cadmium,and chlorine residual (see monitoring requirements in Table 24). PA DEP files showno violations for the last 10 years. Monitoring for inorganic chemicals (IOCs) andvolatile organic chemicals (VOCs) by the Morgantown Utility Board, which suppliesthe water served by Mt. Morris, found only low concentrations of barium, chromium,and fluoride below drinking water standards. Water monitoring results reported tothe PA DEP by Mt. Morris are shown in Table 25.
A PA DEP investigation in 2001 detected regulated and unregulated volatileorganic compounds (VOCs) in the drinking water. These included o-xylene (68.2 ppb),n-butylbenzene (0.299 ppb), acetone (4.59 ppb), methyl ethyl ketone (3.75 ppb), iso-propylbenzene (1.02 ppb), MIBK (4.49 ppb), m/p xylene (163 ppb), and chloroform(111 ppb). Of these, only chloroform and xylenes are regulated, and the concentra-tions detected were below drinking water standards. We did not find any agencyrecords indicating what prompted the investigation, or whether there was anyfurther PA DEP involvement. The occurrence of these toxic chemicals in the town’swater supply is a serious concern.
48
Natural Resources Defense Council
More frequent moni-
toring is absolutely
crucial for this water
supply to determine
how often arsenic
is a problem, and
at what levels.

SOURCES OFAIR POLLUTION
Even though Greene County is home to the Hatfield’s Ferry power plant, thesecond largest air polluter in Pennsylvania, ambient air quality monitoring in
the county is extremely limited. There are major gaps in our knowledge of the healththreats posed by air pollution in the county. According to the most recent publishedPennsylvania DEP report on air quality monitoring, there is only a single ambient airquality monitoring station in Greene County, situated in Holbrook (apparentlyupwind of the Hatfield plant under prevailing wind patterns).72 This station monitorsonly three “criteria” air pollutants: ozone, sulfur dioxide, and carbon monoxide—not nitrogen oxides, particulate matter, lead, or any air toxics. For example, beryllium,a highly toxic metal, is not monitored in Greene or in other nearby counties, eventhough Hatfield’s Ferry releases over half of the reported beryllium emissions in theentire state of Pennsylvania (see Table 26, page 50).
In spite of this exceedingly limited monitoring, Greene County has still beendesignated as a non-attainment area—that is, it does not meet the EPA’s health-based National Ambient Air Quality Standard for ozone.73 The county received thedesignation because of multiple violations of the 8-hour ozone standard; there were21 days of violation in 1999, 6 days in 2000, 12 days in 2001, 9 days in 2002, and 3 daysin 2003.74 The state has classified Greene as a transport county, meaning that theozone problem is in part from long-range transport of pollution from distant, often
49
CHAPTER 4
EPA AIR POLLUTANT DEFINITIONS
Criteria air pollutants: The EPA has set National Ambient Air Quality Standards toprotect human health and welfare from six criteria air pollutants: ozone (O3), carbonmonoxide (CO), total suspended particulates (also know as particulate matter, orPM), sulfur dioxide (SO2), lead (Pb), and nitrogen oxides (NOx). These pollutants arehazardous to human health.
Hazardous air pollutants: These pollutants are not regulated by ambient air qualitystandards but, as defined in the Clean Air Act, may present a threat of adversehuman health effects or adverse environmental effects. Such pollutants includeasbestos, beryllium, mercury, benzene, coke oven emissions, radionuclides, andvinyl chloride.Source: U.S. Environmental Protection Agency, Terms of the Environment, http://www.epa.gov/OCEPAterms/.
POLLUTION UNCHECKEDA Case Study of Greene County, Pennsylvania
December 2004

out-of-state sources.75 The county also is listed in the “basic” non-attainment cate-gory; that is, its ozone problems were serious but not as severe as a few highlyindustrialized areas, such as around Philadelphia. Greene County is required tocome into compliance with the ozone standard no later than June 2009.76
The state does not monitor particulate matter in Greene County at all—neitherPM2.5 (particulate matter with a size of less than 2.5 microns), which is especiallydangerous to health because it can penetrate deep into lungs, nor PM10 (soot under10 microns). Despite this lack of monitoring (or perhaps, because of it), the PA DEPconsiders the county to be in attainment for PM, as the agency stated in its recom-mendations to the EPA in February 2004.77 However, in June 2004, the EPA proposeddesignating Greene County as a non-attainment area for PM2.5 due to the proximityof particulate sources, a decision the state is expected to fight. A final decision isexpected in late 2004. In contrast, the PA DEP recommended Washington, Beaver,Allegheny, and Westmoreland, which surround Greene and Fayette counties to thenorth, as non-attainment areas based on monitoring data there showing PM prob-lems, and they have been so designated by the EPA.78
Greene County is currently designated as an attainment area for carbon monoxide,nitrogen dioxide, and sulfur dioxide. However, the county has among the highest
50
Natural Resources Defense Council
TABLE 26Atmospheric Emissions of Pollutants (in pounds), Hatfield’s Ferry Power Station
2000 2001 2002
Chemical
Arsenic 3,203 3,403 3,904 20.6
Barium 8,108 8,627 6,428 8.8
Beryllium 240 260 270 50.9
Chromium 1,658 1,805 1,705 1.5
Cobalt 420 452 420 6.1
Copper 1,143 1,303 1,111 0.9
Dioxin 0.00145 0.00165 0.001492 0.2
Ethylene glycol — 1 — —
Hydrochloric acid 7,107,100 6,806,800 5,405,400 10.6
Hydrogen fluoride 660,660 750,750 680,680 12.6
Lead 1,401 1,531 1,571 1.7
Manganese 2,312 2,506 2,302 2.7
Mercury 581 681 421 4.6
Nickel 1,475 1,505 1,506 0.5
Selenium 12,012 14,014 12,012 22.3
Sulfuric acid 1,001,000 1,101,000 960,960 9.3
Vanadium 3,203 3,403 2,503 10.2
Zinc 4,104 4,509 3,871 0.3
Total 8,808,620 8,702,550 7,085,064
Source: EPA Toxics Release Inventory
A S A P E R C E N TO F T O T A L A I R
R E L E A S E S I N P A
T O T A LR E L E A S E S
( L B S )

densities of sulfur dioxide emissions in the state, due to the Hatfield’s Ferry powerplant (see Figure 13).
Allegheny Energy’s Hatfield’s Ferry and Fort Martin power stations are the mostsignificant local sources of air pollution in Greene County—and the Hatfield plant isone of the largest in the state (see Figure 14). According to the EPA’s Toxics ReleaseInventory (TRI), these plants reported the release of a total of 13.1 million pounds oftoxic air pollutants in 2002, the most recent year for which data are available.79 Thisfigure does not include the approximately 99 million pounds of nitrogen oxides and511 million pounds of sulfur oxides released by the two stations annually. In addition,both Hatfield and Fort Martin are important sources of airborne particulate matter,which is released during the combustion of coal and during the handling anddisposal of fly ash remaining from the combustion process.
51
Pollution Unchecked
Wayne
Montour
Pike
SusquehannaBradfordTiogaPotterMcKean
Elk Cameron
ClintonLycoming
Sullivan
LuzerneMonroe
Wyoming Lackawanna
CarbonCentre
Franklin AdamsFultonBedford
Washington
Fayette Somerset
Westmoreland
Allegheny
Beaver
Lawrence
Mercer
Crawford
Butler
Venango
Warren
Erie
Forest
ClarionJefferson
Clearfield
Cambria Blair
NorthamptonSnyder
Union
Mifflin
Juniata
HuntingdonPerry Dauphin
Cumberland
Northumberland
Columbia
Schuykill
BerksLebanon
Lancaster Chester
Lehigh
BucksMontgomery
DelawarePhiladelphia
Greene
ArmstrongIndiana
York
FIGURE 13SO2 Emissions Density, 1999
Source: Pennsylvania DEP, 2002
SO2 (tons per year)/sq. mi.■■ 0.073–12.436■ 12.436–45.963■ 45.963–152.84■ 152.847–240.0■ 240.043–862.2
GE Co., Erie PlantInt'l Paper Co.
Erie Mill
Orion Power MidwestNew Castle Plant
Zinc Corp. America,Monaca Smelter
Allegheny Energy,Armstrong Power Plant
Reliant Energy, Shawville Station
Duquesne Light Co.Cheswick Station
Keystone Station, Cohemaugh Plant
Reliant Energy, Seward Power PlantEdison Mission Energy Homer City Station
Keystone Station, Keystone Power Plant
Allegheny Energy,Hatfield's Ferry Plant
Orion Power MidwestElrama Plant
Int'l Paper Co.Lock Haven Mill
PP&L Montour LLC, Montour SES
PP&L Inc. Sunbury, SES
PP&L Brunner IslandPower Plant
PH Glatfelter Co.,Spring Grove
Reliant Energy,Titus Station
Sunoco Inc., Marcus Hook Refinery
Exelon Generation Co.Eddystone Station
Sun Refining(formerlyChevron)
Reliant Energy,Portland Station
PP&L Martins CreekPower Plant
FIGURE 14Top 25 SO2-Emitting Facilities, 1999
Source: Pennsylvania DEP, 2002
SO2 emissions (tons per year)4,848–9,2499,250–19,53719,538–41,60341,604–71,18871,189–163,462
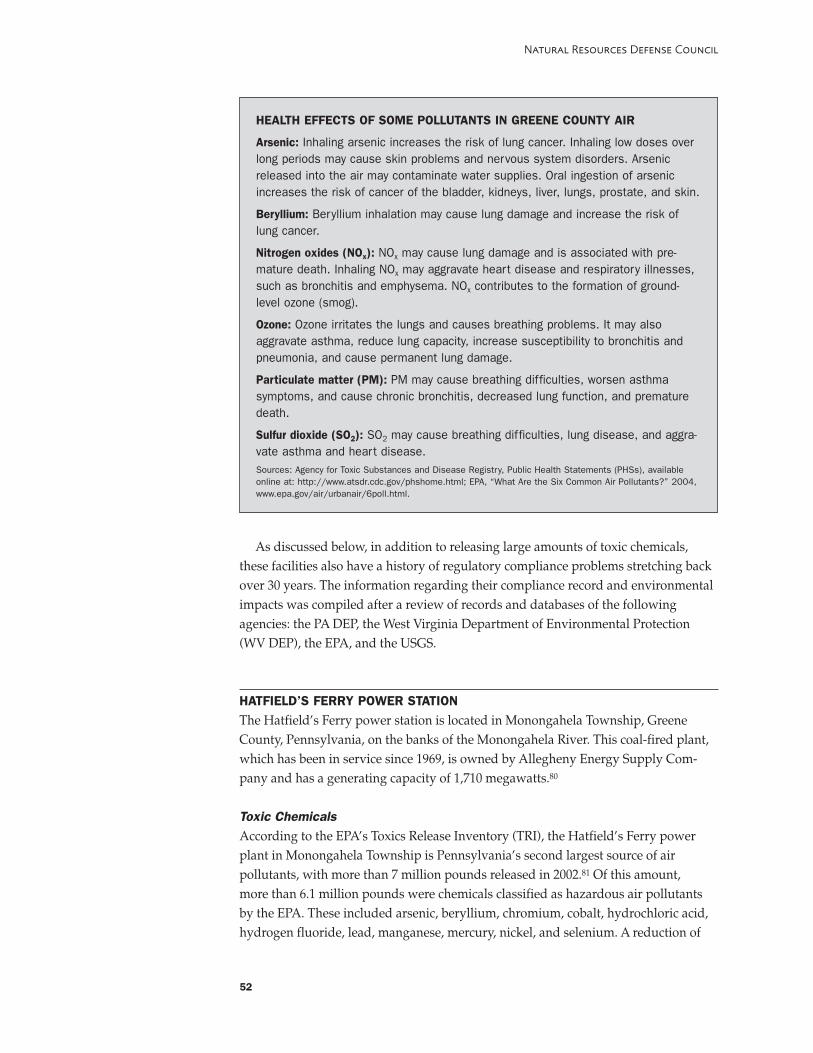
As discussed below, in addition to releasing large amounts of toxic chemicals,these facilities also have a history of regulatory compliance problems stretching backover 30 years. The information regarding their compliance record and environmentalimpacts was compiled after a review of records and databases of the followingagencies: the PA DEP, the West Virginia Department of Environmental Protection(WV DEP), the EPA, and the USGS.
HATFIELD’S FERRY POWER STATIONThe Hatfield’s Ferry power station is located in Monongahela Township, GreeneCounty, Pennsylvania, on the banks of the Monongahela River. This coal-fired plant,which has been in service since 1969, is owned by Allegheny Energy Supply Com-pany and has a generating capacity of 1,710 megawatts.80
Toxic ChemicalsAccording to the EPA’s Toxics Release Inventory (TRI), the Hatfield’s Ferry powerplant in Monongahela Township is Pennsylvania’s second largest source of airpollutants, with more than 7 million pounds released in 2002.81 Of this amount,more than 6.1 million pounds were chemicals classified as hazardous air pollutantsby the EPA. These included arsenic, beryllium, chromium, cobalt, hydrochloric acid,hydrogen fluoride, lead, manganese, mercury, nickel, and selenium. A reduction of
52
Natural Resources Defense Council
HEALTH EFFECTS OF SOME POLLUTANTS IN GREENE COUNTY AIR
Arsenic: Inhaling arsenic increases the risk of lung cancer. Inhaling low doses overlong periods may cause skin problems and nervous system disorders. Arsenicreleased into the air may contaminate water supplies. Oral ingestion of arsenicincreases the risk of cancer of the bladder, kidneys, liver, lungs, prostate, and skin.
Beryllium: Beryllium inhalation may cause lung damage and increase the risk oflung cancer.
Nitrogen oxides (NOx): NOx may cause lung damage and is associated with pre-mature death. Inhaling NOx may aggravate heart disease and respiratory illnesses,such as bronchitis and emphysema. NOx contributes to the formation of ground-level ozone (smog).
Ozone: Ozone irritates the lungs and causes breathing problems. It may alsoaggravate asthma, reduce lung capacity, increase susceptibility to bronchitis andpneumonia, and cause permanent lung damage.
Particulate matter (PM): PM may cause breathing difficulties, worsen asthmasymptoms, and cause chronic bronchitis, decreased lung function, and prematuredeath.
Sulfur dioxide (SO2): SO2 may cause breathing difficulties, lung disease, and aggra-vate asthma and heart disease.Sources: Agency for Toxic Substances and Disease Registry, Public Health Statements (PHSs), availableonline at: http://www.atsdr.cdc.gov/phshome.html; EPA, “What Are the Six Common Air Pollutants?” 2004,www.epa.gov/air/urbanair/6poll.html.
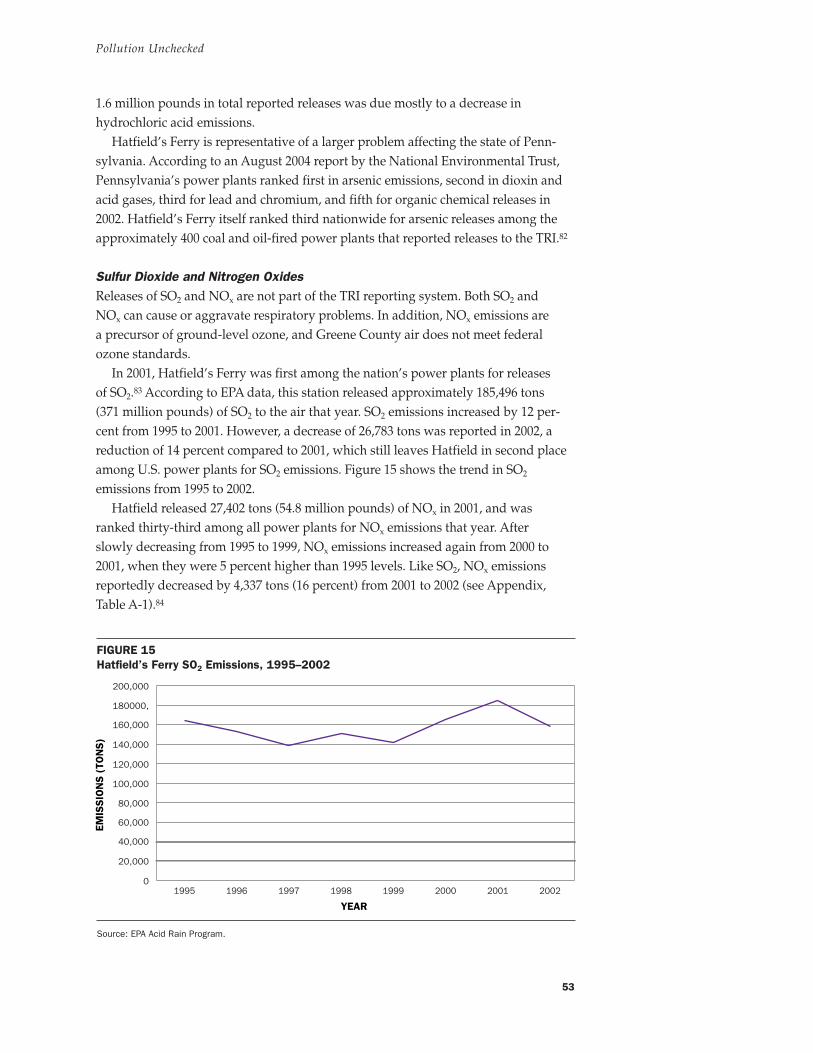
1.6 million pounds in total reported releases was due mostly to a decrease inhydrochloric acid emissions.
Hatfield’s Ferry is representative of a larger problem affecting the state of Penn-sylvania. According to an August 2004 report by the National Environmental Trust,Pennsylvania’s power plants ranked first in arsenic emissions, second in dioxin andacid gases, third for lead and chromium, and fifth for organic chemical releases in2002. Hatfield’s Ferry itself ranked third nationwide for arsenic releases among theapproximately 400 coal and oil-fired power plants that reported releases to the TRI.82
Sulfur Dioxide and Nitrogen OxidesReleases of SO2 and NOx are not part of the TRI reporting system. Both SO2 andNOx can cause or aggravate respiratory problems. In addition, NOx emissions area precursor of ground-level ozone, and Greene County air does not meet federalozone standards.
In 2001, Hatfield’s Ferry was first among the nation’s power plants for releasesof SO2.83 According to EPA data, this station released approximately 185,496 tons(371 million pounds) of SO2 to the air that year. SO2 emissions increased by 12 per-cent from 1995 to 2001. However, a decrease of 26,783 tons was reported in 2002, areduction of 14 percent compared to 2001, which still leaves Hatfield in second placeamong U.S. power plants for SO2 emissions. Figure 15 shows the trend in SO2
emissions from 1995 to 2002.Hatfield released 27,402 tons (54.8 million pounds) of NOx in 2001, and was
ranked thirty-third among all power plants for NOx emissions that year. Afterslowly decreasing from 1995 to 1999, NOx emissions increased again from 2000 to2001, when they were 5 percent higher than 1995 levels. Like SO2, NOx emissionsreportedly decreased by 4,337 tons (16 percent) from 2001 to 2002 (see Appendix,Table A-1).84
53
Pollution Unchecked
0
20,000
40,000
60,000
80,000
100,000
120,000
140,000
160,000
180000,
200,000
20022001200019991998199719961995
EMIS
SIO
NS
(TO
NS
)
YEAR
FIGURE 15Hatfield’s Ferry SO2 Emissions, 1995–2002
Source: EPA Acid Rain Program.

New Source Review (NSR) and Prevention of Significant Deterioration (PSD)Violations for SO2 and NOx
In 2000, the EPA required Allegheny Energy to provide information on operations andmaintenance of some of its power stations, including Hatfield’s Ferry, to determinecompliance with NSR and PSD regulations. The NSR rules require that if significantmodifications are made at an air pollution source that may increase air emissions,improved air pollution controls must be installed to reduce emissions. PSD rules pro-hibit pollution sources from modifications that could degrade air quality in attainmentareas (where certain EPA health standards are met). The company provided informationin 2000, 2001, and 2002. The information request was made pursuant to Section 114 ofthe Clean Air Act. EPA and company officials met in July 2003.85 However, as has beenwidely reported, under the Bush administration, the EPA essentially abandoned theenforcement of air pollution rules against power plants, leaving the problem in thelaps of the states. Several senior EPA enforcement officials resigned in protest.86
After the EPA dropped the ball, on April 23, 2004, the Commonwealth of Penn-sylvania notified Allegheny Energy that the state believed the Hatfield plant was inviolation of the NSR and PSD rules due to several modifications of the plant thatcaused increased SO2 and NOx emissions. In addition, Pennsylvania and three otherstate attorneys general issued a Notice of Intent to sue referencing the Hatfield planton May 20, 2004.87 That joint notice stated, in part:
Hatfield’s Ferry plant in Masontown, Pennsylvania: The companies under-took the following major modifications of the plant including, but notnecessarily limited to: (i) at Unit 1, replacement of the secondary super-heater outlet header in or around 1996 and replacement of lower slopepanels in or around 1997; (ii) at Unit 2, replacement of reheater pendantsand roof tubes in or around 1993; replacement of the secondary superheateroutlet header in or around 1996; and replacement of lower slope panels inor around 1999; and (iii) at Unit 3, replacement of the secondary super-heater outlet header and ash hopper tube panels in or around 1996. Theinformation available to us indicates that the companies should have pro-jected a net emissions increase in emissions of NOx and/or SO2 from thoseprojects, triggering the PSD and nonattainment NSR requirements.88
This letter placed Allegheny Energy on formal notice that Pennsylvania and theother states intended to bring an enforcement action against the company for vio-lations at five West Virginia plants, including Fort Martin. It noted Pennsylvania’sinvestigation and suggested the possible joint prosecution of a suit against thecompany’s Hatfield’s Ferry plant and two others in Pennsylvania.
Particulate MatterHatfield’s Ferry also releases large amounts of particulate matter in the form of largeparticles and also small particulates (PM10 and PM2.5, the two most relevant from ahealth standpoint). The smaller particles are regarded as the most serious healththreat because they can penetrate deep into the lungs.
54
Natural Resources Defense Council

The release of smaller particulate matter from this station has been a problemthroughout its operating history. PM2.5 and PM10 penetrate the respiratory tractand are associated with asthma attacks, impaired lung function, the aggravationof respiratory illnesses such as chronic bronchitis and emphysema, and prematuredeaths. To ensure that particulate emissions remain within acceptable limits, thecompany is required to monitor the opacity of its smokestack emissions, which isan indicator of particulate matter concentrations.89 However, records show that thestation has a history of exceeding opacity limits.
The first documented intervention by the PA DEP, based on a review of existingagency records, occurred in 1976 and involved the issuance of a Consent Order andAgreement requiring the company to reduce its particulate emissions. Problems havebeen documented on many other occasions since. For example, violations occurredduring at least 10 of the 32 quarterly reporting periods from 1988 to 1995. The plantalso violated the opacity standard during every quarter from the first quarter of 1999to the fourth quarter of 2003. Hatfield reported 1,635 days of violation for emissionsfrom its first stack during those five years, and 1,528 days of violation for its secondstack during the same period.90 The company was fined $150 in 2002 for violations ofthe opacity standard. Another fine of $6,750 was imposed in 2003 for other opacityviolations that occurred in 2002.
The most significant incident related to particulate emissions in recent years tookplace from February to April 2002. The incident came to the attention of the PA DEPabout a month after problems began when someone (apparently a station employee)complained to the agency that a tear in a precipitator gasket was causing a seriousemissions problem. The situation lasted approximately two months. Despite theseverity of the problem, a proposed $28,000 penalty was reduced to $10,000 afterthe company alleged the equipment failure was due to normal wear and tear, andelectricity demand prevented it from making repairs sooner.
Particulates are released not only when coal is burned, but also during ash handlingoperations. The company was issued two Notices of Violation (NOVs) in 2002 forviolating regulations concerning the handling of fly ash. One of these incidents wasdiscovered after a station employee complained to the PA DEP about fly ash fallinginto the river and was blamed by the agency on improper ash handling procedures.The company was required to pay a penalty of $800 and submit an abatement plan.Later that same year, an incident occurred that involved fugitive emissions from a flyash silo, which the company attributed to an equipment malfunction. The PA DEPtook no enforcement action after issuing the NOV, citing the lack of public healthcomplaints and the company’s “good compliance history.” However, citizens wouldnot necessarily associate their health symptoms with the plant’s operations, especiallyif they do not know that a violation is taking place. In an area where health effects dueto everyday particulate releases from Hatfield may already be common, residents’complaints should not determine whether to impose penalties when a violation occurs.
Quarterly dustfall monitoring reports for a period from the second quarter 2000to the third quarter of 2003 show that the area surrounding the plant has been con-sistently affected by a significant amount of large particulates exceeding the current
55
Pollution Unchecked
The release of smaller
particulate matter
from this station
has been a problem
throughout its oper-
ating history.
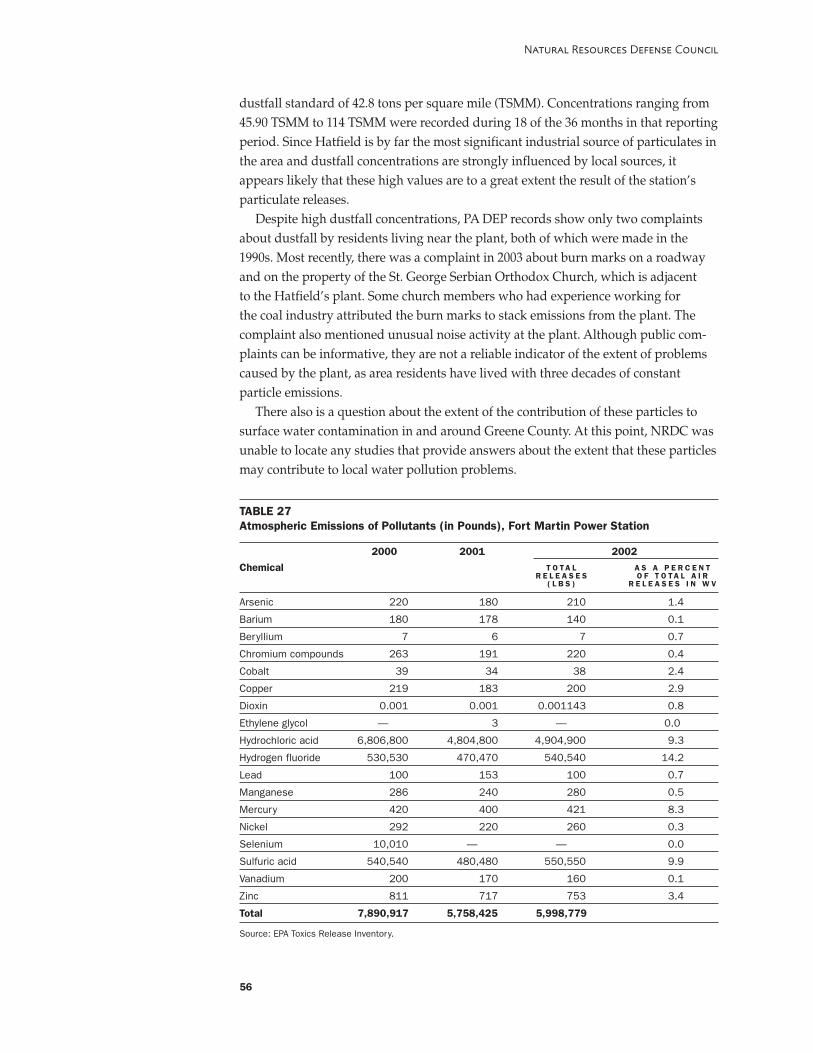
dustfall standard of 42.8 tons per square mile (TSMM). Concentrations ranging from45.90 TSMM to 114 TSMM were recorded during 18 of the 36 months in that reportingperiod. Since Hatfield is by far the most significant industrial source of particulates inthe area and dustfall concentrations are strongly influenced by local sources, itappears likely that these high values are to a great extent the result of the station’sparticulate releases.
Despite high dustfall concentrations, PA DEP records show only two complaintsabout dustfall by residents living near the plant, both of which were made in the1990s. Most recently, there was a complaint in 2003 about burn marks on a roadwayand on the property of the St. George Serbian Orthodox Church, which is adjacentto the Hatfield’s plant. Some church members who had experience working forthe coal industry attributed the burn marks to stack emissions from the plant. Thecomplaint also mentioned unusual noise activity at the plant. Although public com-plaints can be informative, they are not a reliable indicator of the extent of problemscaused by the plant, as area residents have lived with three decades of constantparticle emissions.
There also is a question about the extent of the contribution of these particles tosurface water contamination in and around Greene County. At this point, NRDC wasunable to locate any studies that provide answers about the extent that these particlesmay contribute to local water pollution problems.
56
Natural Resources Defense Council
TABLE 27Atmospheric Emissions of Pollutants (in Pounds), Fort Martin Power Station
2000 2001 2002
Chemical
Arsenic 220 180 210 1.4
Barium 180 178 140 0.1
Beryllium 7 6 7 0.7
Chromium compounds 263 191 220 0.4
Cobalt 39 34 38 2.4
Copper 219 183 200 2.9
Dioxin 0.001 0.001 0.001143 0.8
Ethylene glycol — 3 — 0.0
Hydrochloric acid 6,806,800 4,804,800 4,904,900 9.3
Hydrogen fluoride 530,530 470,470 540,540 14.2
Lead 100 153 100 0.7
Manganese 286 240 280 0.5
Mercury 420 400 421 8.3
Nickel 292 220 260 0.3
Selenium 10,010 — — 0.0
Sulfuric acid 540,540 480,480 550,550 9.9
Vanadium 200 170 160 0.1
Zinc 811 717 753 3.4
Total 7,890,917 5,758,425 5,998,779
Source: EPA Toxics Release Inventory.
A S A P E R C E N TO F T O T A L A I R
R E L E A S E S I N W V
T O T A LR E L E A S E S
( L B S )
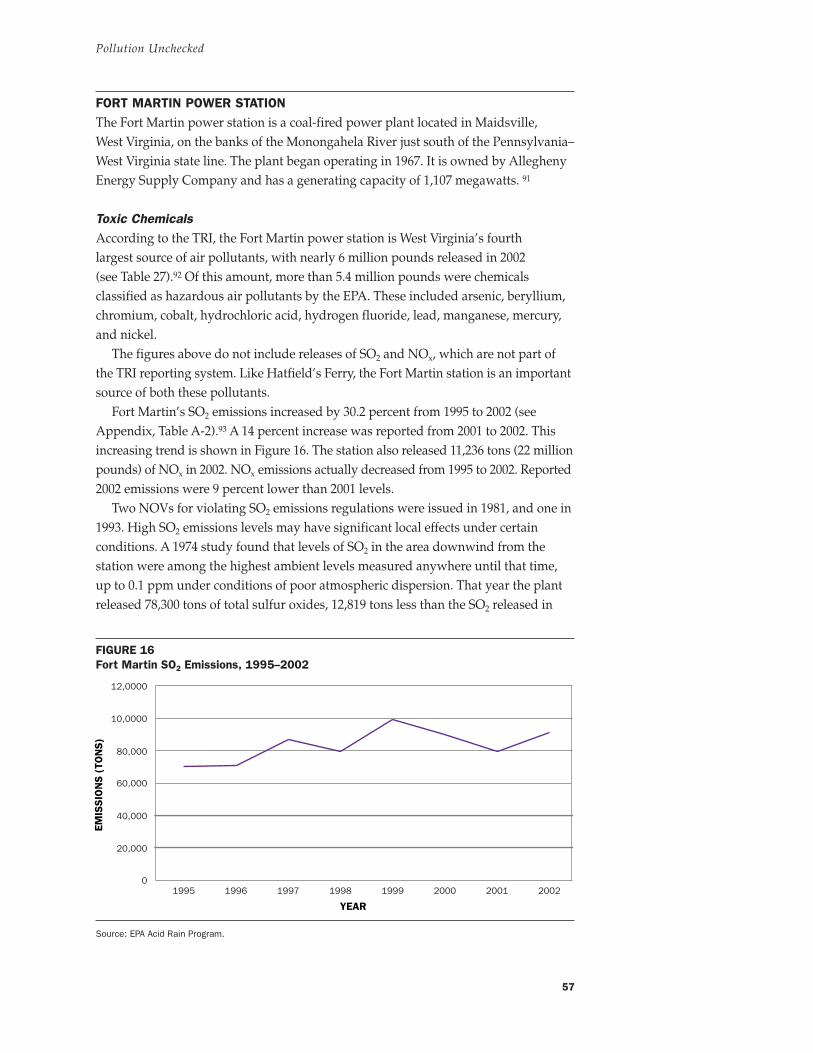
FORT MARTIN POWER STATIONThe Fort Martin power station is a coal-fired power plant located in Maidsville,West Virginia, on the banks of the Monongahela River just south of the Pennsylvania–West Virginia state line. The plant began operating in 1967. It is owned by AlleghenyEnergy Supply Company and has a generating capacity of 1,107 megawatts. 91
Toxic ChemicalsAccording to the TRI, the Fort Martin power station is West Virginia’s fourthlargest source of air pollutants, with nearly 6 million pounds released in 2002(see Table 27).92 Of this amount, more than 5.4 million pounds were chemicalsclassified as hazardous air pollutants by the EPA. These included arsenic, beryllium,chromium, cobalt, hydrochloric acid, hydrogen fluoride, lead, manganese, mercury,and nickel.
The figures above do not include releases of SO2 and NOx, which are not part ofthe TRI reporting system. Like Hatfield’s Ferry, the Fort Martin station is an importantsource of both these pollutants.
Fort Martin’s SO2 emissions increased by 30.2 percent from 1995 to 2002 (seeAppendix, Table A-2).93 A 14 percent increase was reported from 2001 to 2002. Thisincreasing trend is shown in Figure 16. The station also released 11,236 tons (22 millionpounds) of NOx in 2002. NOx emissions actually decreased from 1995 to 2002. Reported2002 emissions were 9 percent lower than 2001 levels.
Two NOVs for violating SO2 emissions regulations were issued in 1981, and one in1993. High SO2 emissions levels may have significant local effects under certainconditions. A 1974 study found that levels of SO2 in the area downwind from thestation were among the highest ambient levels measured anywhere until that time,up to 0.1 ppm under conditions of poor atmospheric dispersion. That year the plantreleased 78,300 tons of total sulfur oxides, 12,819 tons less than the SO2 released in
57
Pollution Unchecked
0
20,000
40,000
60,000
80,000
10,0000
12,0000
20022001200019991998199719961995
EMIS
SIO
NS
(TO
NS
)
YEAR
FIGURE 16Fort Martin SO2 Emissions, 1995–2002
Source: EPA Acid Rain Program.

2002. However, it is important to note this was a short-term study, and changes inother local sources of SO2 must have occurred since 1974. No NOVs or otherdocuments showing violations of NOx limits were found in WV DEP files.
NSR and PSD Violations for SO2 and NOx
As noted above with respect to the Hatfield’s Ferry plant, in 2000, the EPA initiated aprocess to evaluate whether Allegheny Energy power stations, including Fort Martin,were in compliance with NSR and PSD regulations. The NSR rules require emissionsreductions for plants that make changes projected to increase emissions, while the PSDrules prohibit pollution sources from degrading air quality in attainment areas. After theBush administration essentially abandoned this enforcement program against pollutingpower plants, on May 20, 2004, Pennsylvania and three other state attorneys generalissued a Notice of Intent to sue Allegheny Energy for NSR and PSD violations at theFort Martin plant and four others in West Virginia.94 That joint notice stated, in part:
The companies undertook major modifications of the Fort Martin plantincluding, but not necessarily limited to: (i) at Unit 1, replacement of thependant superheater assembly and the forced draft fan wheel in or around1996; and (ii) at Unit 2, replacement of the pulverizers in or around 1987,replacement of the superheater outlet header and reheater pendants in oraround 1996, and replacement of the superheater outlet bank, commencingin or around 2001. The information available to us indicates that thecompanies should have projected a net emissions increase (as defined inCSR §45-14-2) in emissions of NOx and SO2 from those projects, trigger-ing the PSD requirements.95
Particulate MatterLike the Hatfield’s Ferry station, Fort Martin is also an important source of particulatematter due to coal combustion and ash handling and disposal operations. But unlikeHatfield’s Ferry, Fort Martin is not required to monitor dustfall to track the deposi-tion of large particles.
Fort Martin does monitor the opacity of its smokestack emissions, which is anindicator of PM2.5 and PM10 emissions. The plant’s pollution control equipment(electrostatic precipitators) was tested in 2002 and found to be in compliance withpermit requirements. However, there were 19 incidents involving exceedances of theopacity standards from 2000 to September 2003.96 Six of those incidents reportedlywere related to unit start-ups, and were alleged to be exempt from the opacity limit.The other 13 incidents were supposedly due to causes such as weather damage toequipment, electrical problems, and excess ash accumulation in the ash hoppers.Most of these were alleged to be “malfunctions” and also supposedly were excludedfrom the permit limit. There were also at least 36 other incidents from 1996 to 1999.Exceedances also occurred during all four quarters of 1994.
Fort Martin’s history of particulate pollution problems dates back to the 1970s, whenrepeated inspections found violations of opacity standards.97 The WV DEP issued a
58
Natural Resources Defense Council

Cease and Desist Order against the plant in 1978 to control particulate pollution. AConsent Order in 1979 and a Consent Decree in 1980 reaffirmed the order to replacethe pollution control equipment. The new precipitators went online in 1982.
Despite many exceedances of opacity standards, NOVs were issued only in 1978(10 NOVs), 1979 (3 NOVs), 1989 (1 NOV), and 1994 (2 NOVs). Since most of the inci-dents were said to be due to malfunctions, the permit limit does not apply. WV DEPrecords revealed only one fine imposed against the company for violations at the FortMartin plant, a $4,000 penalty in the 1980 Consent Decree.
WV DEP files showed two complaints from area residents concerning particulatematter during the last 10 years. These were related to fly ash and occurred in July andAugust 2000. According to the agency, the plant addressed the cause of the complaints.Previous complaints reflected by the records occurred in 1975 (54 complaints), 1980,1983, and 1989. The small number of recent complaints is not an indication of a lackof public health effects or other consequences, since area residents have likely becomeaccustomed to elevated particulate matter levels in the more than 30 years the planthas been operating.
In 1997, the company informed the WV DEP of its intention to modify its flyash handling process at Fort Martin by loading a portion of the ash into pneumatictanker trucks for transport to the landfill, instead of loading it all into open dumptrucks. This was expected to reduce actual emissions of particulate matter by 62.8lbs/hr. In 2003, the company proposed to build a bottom ash screening facility atthe plant, which could add potential total emissions of 3.67 lbs/hr, and 16.08 tonsper year.98 It is unclear from our DEP file review whether these changes have beenundertaken or completed.
Burning of Hazardous WasteThe company is allowed by “small quantity” burner regulations to burn a total of40 gallons of used oil and hazardous waste every month, provided the waste meetsminimum BTU requirements, and levels of hazardous constituents remain withinregulatory limits. In 1997, the WV DEP issued an NOV to the facility for violating theminimum BTU requirement and burning waste in excess of the 40 gallon limit. Thecompany responded that it would review results of laboratory tests before burningwaste to ensure compliance with the BTU requirement. However, another NOV wasissued against the company in 1999 for violating the BTU requirement. The companyproposed similar corrective measures as it did in 1997. The WV DEP imposed nopenalties for either violation, but issued a Cease and Desist Order in 1999.
59
Pollution Unchecked
Despite many exceed-
ances of opacity stan-
dards, records revealed
only one fine imposed
against the company
for violations at the
Fort Martin plant.

CONCLUSION
Major pollution sources like the Allegheny Energy power plants and nearbyactive and abandoned mines discharge millions of pounds of toxic air and
water pollutants into Greene County’s environment every year. County air some-times violates the EPA’s health standards, but government officials have failed toensure that local air quality is adequately monitored to guarantee that particulatematter, heavy metals, and other risky contaminants are kept to safe levels. A singlemonitor in the county that tests for only three air pollutants is insufficient. Thestate plan, announced in May 2004, to sue Allegheny Energy for air pollution (SO2
and NOx) violations is welcome news and should be encouraged, but a compre-hensive state audit of the power plants’ air and water emissions and permit compli-ance is necessary.
Findings of arsenic, other heavy metals, and a suite of other contaminants in theMonongahela, and sometimes in county residents’ tap water, is a concern. Localdrinking water and recreational waters, including the Monongahela, should be testedfrequently and comprehensively to ensure safety; waivers allowing testing only onceevery nine years are unacceptable. The lack of resources and effort put into healthtracking and health protection is also unacceptable.
Available data indicate that there are some serious public health threats fromenvironmental contamination in Greene County, but the lack of high-quality dataon pollutant exposures and the incidence of most diseases associated with environ-mental contamination makes it impossible to determine the extent to which thesources of pollution identified in this report are affecting the health of countyresidents. However, the PA DEP, WV DEP, and the EPA should not wait untilmore studies are completed to enforce existing environmental laws, and to setmore stringent limits on pollutant emissions from power plants. The statesshould also act diligently to expedite the cleanup of contaminated drainage fromabandoned mines using available federal and state funds, and should allocateadditional money for this purpose. The PA DEP should also require that pro-tective measures are put in place at active mine sites to prevent additionalcontamination. In addition, aggressive action is needed to remedy the problemof wildcat sewers in order to reduce the threat of serious water pollution. More-over, the EPA should strengthen its New Source Review rules and enforcementto address power plant emissions, and should substantially strengthen rules forash disposal.
Citizen groups like PEC and Monongahela Riverkeeper and local citizen activistsshould be commended for blowing the whistle on many of the environmental
60
CHAPTER 5
POLLUTION UNCHECKEDA Case Study of Greene County, Pennsylvania
December 2004

problems facing Greene County. But much more needs to be done. A detailedcitizen monitoring, public education, health tracking, and citizen advocacy programcould help to encourage local, state, and federal officials as well as industry toaddress the environmental challenges of Greene County. NRDC looks forwardto working with local and state groups and concerned state and local officials todevelop such a strategy.
61
Pollution Unchecked

62
APPENDIX 1
DATABASESCONSULTED
� Pennsylvania Department of Environmental Protection, Environment, Facility,Application, Compliance Tracking System (E.F.A.C.T.S.), www.dep.state.pa.us/efacts
� Pennsylvania Department of Environmental Protection, Drinking Water ReportingSystem, www.drinkingwater.state.pa.us/dwrs/HTM/DEP_frm.html
� Pennsylvania Department of Environmental Protection, eMap PA, www.emappa.dep.state.pa.us/emappawebsite/HTMLDEMO
� U.S. Department of the Interior, Office of Surface Mining, Abandoned Mine LandInventory System (AMLIS), http://ismhdqa02.osmre.gov/OSM.HTM
� U.S. Environmental Protection Agency, Clean Air Markets, http://cfpub.epa.gov/gdm/index.cfm?fuseaction=iss.isshome
� U.S. Environmental Protection Agency, Superfund Information Systems, ArchivedSites, http://cfpub.epa.gov/supercpad/arcsites/srchsites.cfm
� U.S. Environmental Protection Agency, Superfund Information Systems, Compre-hensive Environmental Response, Compensation, and Liability Information System(CERCLIS), http://cfpub.epa.gov/supercpad/cursites/srchsites.cfm
� U.S. Environmental Protection Agency, Emissions Scorecard 2001, www.epa.gov/airmarkets/emissions/score01/index.html
� U.S. Environmental Protection Agency, Enforcement and Compliance History(ECHO), www.epa.gov/echo/
� U.S. Environmental Protection Agency, Envirofacts, www.epa.gov/enviro/index.html
� U.S. Environmental Protection Agency, Permit Compliance System (PCS),www.epa.gov/enviro/html/pcs/index.html
� U.S. Environmental Protection Agency, Safe Drinking Water Information System,(SDWIS), www.epa.gov/enviro/html/sdwis/sdwis_query.html
� U.S. Environmental Protection Agency, Storage and Retrieval (STORET),www.epa.gov/STORET/
POLLUTION UNCHECKEDA Case Study of Greene County, Pennsylvania
December 2004
� U.S. Environmental Protection Agency, Toxics Release inventory (TRI),www.epa.gov/tri
� U.S. Geological Survey, National Water Information System (NWISWeb),http://waterdata.usgs.gov/nwis
� U.S. Geological Survey, National Water Quality Assessment Program (NAWQA),http://water.usgs.gov/nawqa/
� West Virginia Department of Environmental Protection, Geographical Server,http://gis.wvdep.org/
63
Pollution Unchecked

ADDITIONAL AIRPOLLUTION DATA
64
APPENDIX 2
TABLE A-1SO2 and NOx emissions, Hatfield’s Ferry, 1995–2002
Year SO2 (tons) NOx (tons)
1995 164,841 26,050
1996 153,413 25,274
1997 138,630 24,717
1998 150,869 21,583
1999 141,872 20,067
2000 165,695 23,234
2001 185,496 27,402
2002 158,712 23,065
Source: EPA Acid Rain Program.
TABLE A-2SO2 and NOx emissions, Fort Martin, 1995–2002
Year SO2 (tons) NOx (tons)
1995 69,974 25,561
1996 71,152 22,710
1997 87,146 30,014
1998 79,304 24,649
1999 99,101 30,422
2000 90,055 26,330
2001 79,661 12,334
2002 91,119 11,236
Source: EPA Acid Rain Program.
POLLUTION UNCHECKEDA Case Study of Greene County, Pennsylvania
December 2004

65
ENDNOTES
1 National Academy of Sciences,Arsenic in Drinking Water: 2001 Up-date (Washington, D.C.: NationalAcademy Press, 2001), http://books.nap.edu/catalog/10194.html.
2 EPA, “Health and Environ-mental Impacts of Ground-LevelOzone,” www.epa.gov/air/urbanair/ozone/hlth.html.
3 B. Ritz, F. Yu, S. Fruin, G. Chapa,G.M. Shaw, and J.A. Harris, “Ambi-ent air pollution and risk of birthdefects in Southern California,”American Journal of Epidemiology,vol. 155(1) (2002): pp. 17–25.
4 EPA, “Health and EnvironmentalEffects of PM,” www.epa.gov/air/urbanair/pm/hlth1.html.
5 M. Maisonet, T.J. Bush, A.Correa, and J.J. Jaakkola, “Relationbetween ambient air pollution andlow birth weight in the North-eastern United States,” Environ-mental Health Perspectives, vol.109(Suppl 3) (2001): pp. 351–6.
6 EPA, “Drinking Water Contami-nants: Microbes,” www.epa.gov/safewater/hfacts.html.
7 EPA, Health Effects SupportDocument for Manganese, EPA No.822RO2029, April 2002.
8 Pennsylvania EnvironmentalCouncil, Greene County: PreliminaryAssessment (August 2002); Score-card, “2000 Rankings: MajorChemical Releases in GreeneCounty,” www.scorecard.org/env-releases/county.tcl?fips_county_code=42059#major_chemical_releases.
9 Scorecard, “2000 Rankings:Major Chemical Releases in GreeneCounty,” www.scorecard.org/env-releases/county.tcl?fips_county_code=42059#major_chemical_releases.
10 B. Ritz, F. Yu, S. Fruin, G. Chapa,G.M. Shaw, and J.A. Harris, “Am-bient air pollution and risk of birthdefects in Southern California,”American Journal of Epidemiology,vol. 155(1) (2002): pp. 17–25; andL. Takser, D. Mergler, G. Hellier,J. Sahuquillo, and G. Huel, “Man-ganese, monoamine metabolitelevels at birth, and child psycho-motor development,” Neurotoxi-cology vol. 24(4-5) (2003): pp.667–74.
11 EPA, Toxics Release Inventory,www.epa.gov/tri.
12 EPA, Clean Air Markets—Dataand Maps http://cfpub.epa.gov/gdm.
13 EPA, Toxics Release Inventory,www.epa.gov/tri.
14 Scorecard, “2000 Rankings:Major Chemical Releases in Greene
County,” www.scorecard.org/envreleases/county.tcl?fips_county_code=42059#major_chemical_releases; EPA, Safe Drinking WaterInformation System, www.epa.gov/safewater/dwinfo/pa.htm.
15 EPA, Safe Drinking WaterInformation System, www.epa.gov/safewater/dwinfo/pa.htm.
16 National Academy of Sciences,Arsenic in Drinking Water: 2001 Up-date (Washington, D.C.: NationalAcademy Press, 2001), http://books.nap.edu/catalog/10194.html; National Academy ofSciences, “New Evidence ConfirmsCancer Risk in Drinking Water,”September 11, 2001, www4.nationalacademies.org/news.nsf/isbn/0309076293?OpenDocument.
17 Right-to-Know Network, TRIDatabase, http://d1.rtknet.org/tri/fac.php?REPTYPE=f&FACILITY_ID=15461HTFLDRD1BO&REPORTING_YEAR=2000&EMAIL=&DETAIL=H&DATYPE=T&DBTYPE=C.
18 U.S. Census Bureau, “2000Census Quick Facts for GreeneCounty, PA,” http://quickfacts.census.gov/qfd/states/42/42059.html.
19 EPA, Toxics Release Inventory,2002, www.epa.gov/tri.
20 NCI, State Cancer Profiles,http://statecancerprofiles.cancer.gov/.
21 Pennsylvania Department ofHealth, Behavioral Risk Factors ofPennsylvania Adults: RegionalDifferences, 1996–2000, www.dsf.health.state.pa.us/health/lib/health/brfss/regional96-00/brfss_regional_report_1996_to_2000.pdf; Special Report On The Charac-teristics Of The Physician Populationin Pennsylvania, 2004, www.dsf.health.state.pa.us/health/lib/health/PHYSREPORT.pdf.
22 National Academy of Sciences,Arsenic in Drinking Water: 2001 Up-date (Washington, D.C.: NationalAcademy Press, 2001), http://books.nap.edu/catalog/10194.html.
23 EPA, “Health and Environ-mental Impacts of Ground-LevelOzone,” www.epa.gov/air/urbanair/ozone/hlth.html.
24 EPA, “Health and Environ-mental Effects of PM,” www.epa.gov/air/urbanair/pm/hlth1.html.
25 EPA, “Drinking Water Con-taminants: Microbes,” www.epa.gov/safewater/hfacts.html.
26 National Cancer Institute, “StateCancer Profiles: Pennsylvania,”http://statecancerprofiles.cancer.gov/cgi-bin/deathrates/
deathrates.pl?42&001&00&0&001&1&1&1.
27 Pennsylvania Department ofHealth, Behavioral Risk Factors ofPennsylvania Adults: Regional Differ-ences, 1996-2000, www.dsf.health.state.pa.us/health/lib/health/brfss/regional96-00/brfss_regional_report_1996_to_2000.pdf.
28 Pennsylvania Department ofHealth, Healthy People 2010, www.dsf.health.state.pa.us/health/lib/health/hp2010-all_counties.pdf.
29 Trust for America’s Health,“Pennsylvania: Health TrackingStatus,” 2004, http://healthyamericans.org/state/index.php?StateID=PA.
30 Ibid.
31 K. Gebbie, “Lack of HealthWorkers Puts All Pennsylvaniansat Risk,” Philadelphia Inquirer, 8January 2004.
32 Pennsylvania Department ofHealth, Behavioral Risk Factors ofPennsylvania Adults: RegionalDifferences, 1996-2000, www.dsf.health.state.pa.us/health/lib/health/brfss/regional96-00/brfss_regional_report_1996_to_2000.pdf; Special Report On TheCharacteristics of the PhysicianPopulation in Pennsylvania, 2004,www.dsf.health.state.pa.us/health/lib/health/PHYSREPORT.pdf.
33 Pennsylvania Department ofHealth, Behavioral Risk Factors ofPennsylvania Adults: RegionalDifferences, 1996-2000, www.dsf.health.state.pa.us/health/lib/health/brfss/regional96-00/brfss_regional_report_1996_to_2000.pdf.
34 Pennsylvania EnvironmentalCouncil, Greene County: PreliminaryAssessment (August 2002).
35 U.S. Geological Survey, Boun-dary Descriptions and Names ofRegions, Subregions, AccountingUnits and Cataloging Units, http://water.usgs.gov/GIS/huc_name.txt.
36 PA DEP, 1994 Water QualityAssessment Report.
37 Spotts, Stevens, and McCoy,Inc., Source Water AssessmentReport, PWSID #5300017-001:Southwestern Pennsylvania WaterAuthority Monongahela River(Harrisburg, PA: PennsylvaniaDEP, 2003).
38 R.M. Anderson, K.M. Beer,T.F. Buckwalter, M.E. Clark, S.D.McAuley, J.I. Sams III, and D.R.Williams, Water Quality in theAllegheny and Monongahela RiverBasins Pennsylvania, West Virginia,New York, and Maryland, 1996–98:U.S. Geological Survey Circular 1202,
2000, http://pubs.water.usgs.gov/circ1202/.
39 PA DEP, eMap PA, www.emappa.dep.state.pa.us/emappawebsite/HTMLDEMO/.
40 R.M. Anderson, K.M. Beer, T.F.Buckwalter, M.E. Clark, S.D.McAuley, J.I. Sams III, and D.R.Williams, Water Quality in theAllegheny and Monongahela RiverBasins Pennsylvania, West Virginia,New York, and Maryland, 1996–98:U.S. Geological Survey Circular 1202,2000, http://pubs.water.usgs.gov/circ1202/.
41 West Virginia DEP, Geograph-ical Server, http://gis.wvdep.org/
42 J. W. Hawkins, “ReminingCoal,” www.leo.lehigh.edu/envirosci/enviroissue/amd/links/remining.html.
43 C. H. Norris, EnvironmentalConcerns and Inputs of Power PlantWaste Placement in Mines, papersubmitted to Office of SurfaceMining Conference on StateRegulation of Coal CombustionBy-Products Placement at MineSites: A Technical InteractiveForum, May 4–6, 2004.
44 A.K. Mukherjee, “Coal Com-bustion Ash (CCA) Disposal in aPennsylvania Surface Mine Siteand Its Nonbeneficial Impacts onGroundwater Flow Regime: ADegradation Experience,” Pro-ceedings of Coal Combustion By-Products and Western Coal Mines:A Technical Interactive Forum,April 16–18, 2002, www.mcrcc.osmre.gov/Forum.htm.
45 West Virginia DEP.
46 West Virginia DEP, Division ofMining and Reclamation, publicfiles. Albright Minefill permit no.S-1013-89; and Stacks Run RefuseSite, permit no. R-1011-91.
47 West Virginia DEP, Division ofMining and Reclamation, publicfiles. Albright Minefill permit no.S-1013-89; and Stacks Run RefuseSite, permit no. R-1011-91.
48 PA DEP generally keeps facili-ties’ Discharge Monitoring Reportsfor eight years. Therefore, most ofthe earlier NPDES compliancehistory cannot be documented.
49 Thallium limits may beremoved after a year if data showit is not a pollutant of concern.
50 Results of a metals survey ofthe Monongahela River by the PADEP on August 28, 2001.
51 EPA, “Numeric RemovalAction Levels for ContaminatedDrinking Water Sites,” 10 Novem-ber 1998, OSWER MemorandumNo. 9360.1-028-P, EPA-540-F99-044.

66
Natural Resources Defense Council
52 L.G. Evans, “The Disposal ofPower Plant Waste in Mines: Pub-lic Health, Environmental, andRegulatory Concerns,” 2002, Pro-ceedings of Coal Combustion By-Products and Western Coal Mines:A Technical Interactive Forum, April16–18, 2002, www.mcrcc.osmre.gov/Forum.htm, citing J.R.Boulding, “Disposal of Coal Com-bustion Waste in Indiana: An Anal-ysis of Technical and RegulatoryIssues,” (Indianapolis, IN: HoosierEnvironmental Council, 1991).
53 Parameters with upward trendsin upgradient wells: alkalinity,ammonia-nitrogen, dissolvedbarium, bicarbonate, dissolvedboron, dissolved calcium, chemicaloxygen demand, dissolved mag-nesium, dissolved molybdenum,dissolved nickel, nitrate-nitrogen,pH (field), dissolved potassium,dissolved sodium, sulfate, andtotal dissolved solids.
54 Parameters with upward trendsin downgradient wells: alkalinity,dissolved barium, bicarbonate, dis-solved boron, dissolved calcium,chloride, dissolved copper, dis-solved iron, dissolved magnesium,dissolved manganese, dissolvednickel, nitrate-nitrogen, dissolvedpotassium, dissolved sodium,sulfate, and total dissolved solids.
55 Allegheny Energy, Annual Eval-uation Report—Hatfield’s Ferry PowerStation Ash Disposal Site, 2001.
56 EPA, “Numeric RemovalAction Levels for ContaminatedDrinking Water Sites,” 10 Novem-ber 1998, OSWER MemorandumNo. 9360.1-028-P, EPA-540-F99-044.
57 Mackin Engineering Company,Monongahela River ConservationPlan, Final Report, 1998. Preparedfor: Steel Industry HeritageCorporation.
58 Spotts, Stevens, and McCoy,Inc., Source Water AssessmentReport, PWSID #5300017-001:Southwestern Pennsylvania WaterAuthority Monongahela River(Harrisburg, PA: PennsylvaniaDEP, 2003).
59 Results of analysis of watersamples collected by the GreeneCounty Conservation District onApril 9, 2001, and analyzed byE-Watertest.
60 Pennsylvania DEP, “OrphanOil and Gas Wells and the OrphanWell Plugging Fund,” www.dep.state.pa.us/dep/deputate/minres/oilgas/fs1670.htm.
61 Spotts, Stevens, and McCoy, Inc.,Source Water Assessment Report,PWSID #5300017-001: SouthwesternPennsylvania Water Authority
Monongahela River (Harrisburg, PA:Pennsylvania DEP, 2003).
62 Ibid.
63 40 C.F.R. § 141.23(c)(inorganics);40 C.F.R. § 141.24(f)(8)(organics).
64 40 C.F.R. § 141.23(c)(6).
65 25 Penn. Code §109.301(7)(iii)(D).
66 PA DEP, Filter Plant PerformanceEvaluation, Southwestern Pennsyl-vania Water Authority, 2002.
67 The average for the year was0.047 ppm. The MCL is based onthe annual average.
68 Concentrations of xylene andtoluene of 0.0027 and 0.0005 ppm,respectively, which were below thecorresponding standards of 10 ppmand 1 ppm.
69 National Academy of Sciences,Arsenic in Drinking Water: 2001Update (Washington, D.C.:National Academy Press, 2001),http://books.nap.edu/catalog/10194.html; National Academy ofSciences, “New Evidence ConfirmsCancer Risk from Arsenic in Drink-ing Water,” 11 September 2001,http://www4.nationalacademies.org/news.nsf/isbn/0309076293|?OpenDocument.
70 K. Frederick, PA DEP Bureau ofWater Supply Management, per-sonal communication, 1 June 2004.
71 National Academy of Sciences,Arsenic in Drinking Water: 2001Update (National Academy Press,2001), http://books.nap.edu/catalog/10194.html; NationalAcademy of Sciences, “New Evi-dence Confirms Cancer Risk fromArsenic in Drinking Water,” 11September 2001, http://www4.nationalacademies.org/news.nsf/isbn/0309076293?OpenDocument.
72 PA DEP, Pennsylvania Air QualityMonitoring 2001 Annual Report, 2002,www.dep.state.pa.us/eps/docs/cab200149b1126000/fldr200149d1642109/fldr200149e48461e7/fldr20035ia1334003/doc20035qc423400e/2001%20Annual%20Report.pdf.
73 PA DEP, “Letter from EPAAdministrator Leavitt to Gov. EdRendell,” April 15, 2004, www.dep.state.pa.us/dep/deputate/airwaste/aq/plans/plans/designation/r3letter.pdf; Pennsyl-vania DEP, “Attainment Status byPrincipal Pollutants,” 2004, www.dep.state.pa.us/dep/deputate/airwaste/aq/attain/status.htm.
74 PA DEP, Ozone Summary Reports,www.dep.state.pa.us/aq_apps/ozone/summary.htm.
75 PA DEP, “Pennsylvania’s CleanAir Plans,” www.dep.state.pa.us/dep/deputate/airwaste/aq/
plans/designations; http://www.dep.state.pa.us/dep/deputate/airwaste/aq/plans/clean_air_plans.htm#designations.
76 PA DEP, “Letter from EPA Ad-ministrator Leavitt to Gov. EdRendell,” April 15, 2004, www.dep.state.pa.us/dep/deputate/airwaste/aq/plans/plans/designation/r3letter.pdf.
77 PA DEP, “Pennsylvania’s CleanAir Plans,” www.dep.state.pa.us/dep/deputate/airwaste/aq/plans/clean_air_plans.htm#designations.
78 Ibid.
79 Right-to-Know Network, TRIDatabase, http://d1.rtknet.org/tri/fac.php?REPTYPE=f&FACILITY_ID=15461HTFLDRD1BO&REPORTING_YEAR=2000&EMAIL=&DETAIL=H&DATYPE=T&DBTYPE=C; andwww.rtknet.org/tri/fac.php?REPTYPE=f&FACILITY_ID=26541FRTMRRTE53&REPORTING_YEAR=2001&EMAIL=&DETAIL=H&DATYPE=T&DBTYPE=C.
80 Allegheny Energy, Inc., TheAllegheny Energy Evolution, 2001,www.alleghenyenergy.com/Newsroom/History/companyhistory.com; Allegheny Energy Supply,“Generating Facilities,”www.alleghenyenergysupply.com/generating/default.asp.
81 EPA, Toxics Release Inventory,www.epa.gov/tri
82 Clean Air Council, “BeyondMercury: How the Fine Print of theBush Administration Plan MeansMore Arsenic, Dioxin, Lead andOther Toxic Air Pollution,” 2004,www.cleanair.org/toxicreport.pdf.
83 EPA, Clean Air Markets—Dataand Maps,http://cfpub.epa.gov/gdm/.
84 Ibid.
85 Allegheny Energy, Inc., 2002Annual Report (Hagerstown, MD:Allegheny Energy, 2002).
86 “EPA Officials Resign, StaffComplains of Political Pressure,”Energy User News, 23 January, 2004,http://www.energyusernews.com/CDA/ArticleInformation/features/BNP__Features__Item/0%2C2584%2C117450%2C00.html.
87 Office of New York State Attor-ney General Elliot Spitzer, “Letterfrom Attorneys General of NY, CT,NJ and PA to Allegheny Energyet al.,” May 20, 2004, http://www.oag.state.ny.us/press/2004/may/may20c_04_attach1.pdf.
88 Ibid.
89 25 Penn. Code § 123.41 states:“A person may not permit theemission into the outdoor atmo-sphere of visible air contaminantsin such a manner that the opacityof the emission is either of thefollowing: (1) Equal to or greaterthan 20% for a period or periodsaggregating more than 3 minutesin any 1 hour. (2) Equal to orgreater than 60% at any time.”
90 PennFuture, Notice Letter toHatfield's Ferry Power Plant Regard-ing Air Pollution, October 5, 2004,www.pennfuture.org/smokestack/hatfieldsferry/noticeletterhatfieldsferry1004.html.
91 Allegheny Energy, Inc., TheAllegheny Energy Evolution, 2001,www.alleghenyenergy.com/Newsroom/History/companyhistory.com; Allegheny Energy Supply,“Generating Facilities, www.alleghenyenergysupply.com/generating/default.asp.
92 EPA, Toxics Release Inventory,www.epa.gov/tri.
93 EPA, Clean Air Markets—Dataand Maps, http://cfpub.epa.gov/gdm/.
94 Office of New York State Attor-ney General Elliot Spitzer, “Letterfrom Attorneys General of NY, CT,NJ and PA to Allegheny Energy etal.,” May 20, 2004, www.oag.state.ny.us/press/2004/may/may20c_04_attach1.pdf.
95 Ibid.
96 The plant’s permit sets anopacity limit of 10 percent basedon a 6-minute block average (45C.S.R. § 2-3.1).
This excludes start-up and shut-down periods. This is lower thanthe EPA’s opacity standard of 20percent. Fort Martin is allowed torelease 249.2 lbs of particulate mat-ter per hour from Stacks 1 and 2.
97 For example, in 1976 the plantwas releasing 814 lbs of particulatematter per hour, when its permitonly allowed 256 lbs/hour. In1977, it was still releasing 400lbs/hr.
98 The WV DEP determined thatthe company would not need apermit to build the ash screeningfacility. Under a new rule effectiveJune 2003 a facility needs a permitif the potential total emissions aregreater than 6 lb/hr and 10 TPY.