NRCS EFH CHAPTER 2 - ESTIMATING RUNOFF EFH CHAPTER 2 - ESTIMATING RUNOFF Presented by: Angela D....
28
NRCS EFH CHAPTER 2 - ESTIMATING RUNOFF Presented by: Angela D. Greene, P.E.
Transcript of NRCS EFH CHAPTER 2 - ESTIMATING RUNOFF EFH CHAPTER 2 - ESTIMATING RUNOFF Presented by: Angela D....

NRCS EFH CHAPTER 2 -
ESTIMATING RUNOFFPresented by: Angela D. Greene, P.E.

Definitions
• Surface runoff – the volume of
excess water that runs off a
drainage area.
• Peak discharge is the peak rate of
runoff from a drainage area for a
given rainfall.
• EFH-2 Assumption: Rainfall is the
primary source of water that runs
off the surface of small rural
watersheds.

General
• The main factors affecting the
volume of rainfall that runs off the
surface are the kind of soil and the
type of vegetation in the
watershed.
• Factors affecting the rate at which
water runs off are the watershed
topography and shape along with
conservation practices on a
watershed.

Rainfall
• The peak discharge from a small rural
watershed is usually caused by
intense rainfall.
• To avoid the use of a different set of
rainfall intensities for each drainage
area, a set of synthetic rainfall
distributions was developed.
• This set maximizes the rainfall
intensities by including short duration
with those needed for longer
duration.

Rainfall (Continued)
• Based on the watershed size for which
NRCS typically provides assistance, a
storm duration of 24 hours was chosen
for the synthetic distribution.
• The 24-hour storm while longer than
needed to determine peak discharges, is
suitable for determining runoff volumes.
• A single storm duration and the
associated synthetic rainfall distribution
can be used to estimate peak discharges
for a wide range of watershed areas.
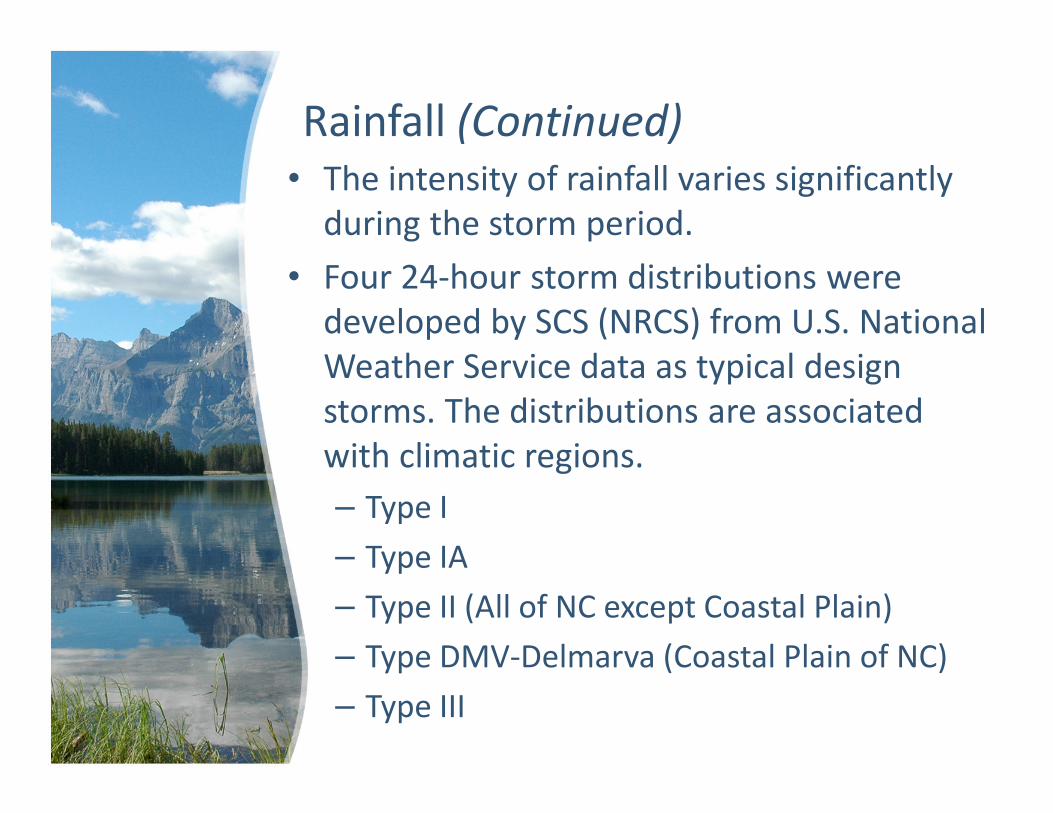
Rainfall (Continued)
• The intensity of rainfall varies significantly
during the storm period.
• Four 24-hour storm distributions were
developed by SCS (NRCS) from U.S. National
Weather Service data as typical design
storms. The distributions are associated
with climatic regions.
– Type I
– Type IA
– Type II (All of NC except Coastal Plain)
– Type DMV-Delmarva (Coastal Plain of NC)
– Type III

Hydrologic Soil Groups
• NRCS Soil Scientists have classified soils into four
hydrologic soil groups
– Group A – Low runoff potential and high infiltration
rates even when thoroughly wetted. Mostly sands and
gravels that are deep, well drained to excessively
drained with a high rate of water transmission (>0.30
in/hr).
– Group B – Moderate infiltration rates when thoroughly
wetted. Mostly moderately deep to deep soils that are
moderately well drained to well drained with
moderately fine to moderately coarse textures.
Moderate rate of water transmission (0.15 to 0.30 in/hr)

Hydrologic Soil Groups (Continued)
– Group C – Low infiltration rates when thoroughly
wetted. Chiefly consists of soils with a layer that
impedes downward movement of water with
moderately fine to fine texture. Slow rate of water
transmission (0.05 to 0.15 in/hr).
– Group D – High runoff potential with very low
infiltration rates when thoroughly wetted. Mostly clay
soils with high swell potential, soils with a permanent
high water table, soils with a claypan or clay layer at or
near the surface, and shallow soils over nearly
impervious material. Very low rate of water
transmission (0 to 0.05 in/hr).

Factors Affecting Runoff
• Cover type
• Conservation practices or treatment
– Reduce erosion
– Maintain an open structure at the soil surface
which reduces runoff. The effect diminishes
quickly with increases in storm magnitude.
• Hydrologic conditions
– Affects the volume of runoff more than any
other single factor
– Consider the effects of cover type and
treatment on infiltration and runoff
– Generally estimated from density of plant
cover and residue on the ground surface

Topography
• Slopes in a watershed have a major
effect on the peak discharge at
downstream points.
• As watershed slope increases, velocity
increases, Tc decreases, and peak
discharge increases.
• An average watershed is fan shaped. If
the shape is elongated or more
rectangular, the Tc increases and peak
discharge decreases.

Potholes and Marshland
• Potholes may trap rain and as a result reduce
the amount of runoff.
• If potholes and marshland areas make up 1/3
or less of the total watershed and do not
intercept the drainage from the remaining
2/3, they will not contribute much to the
peak discharge.
– These areas may be excluded from the
drainage area for estimating peak discharge.
– If potholes or marshland constitute more than
1/3 of the total drainage or they intercept the
drainage, use NEH-4 procedures to estimate
peak discharge.

Limitations of EFH-2 Procedures
• The watershed drainage area must be greater
than 1.0 acre and less than 2,000 acres.
• NOTE: If the drainage area is outside these
limits, another procedure such as TR-55 or TR-
20, Project Formulation - Hydrology, should be
used to estimate peak discharge.
• The watershed should have only one main
stream. If more than one exists, the branches
must have nearly equal Tc’s.

Limitations of EFH-2 Procedures (Continued)
• The watershed must be hydrologically similar
[i.e., able to be represented by a weighted
curve number (CN)]. Land use, soils, and cover
are distributed uniformly throughout the
watershed. The land use must be primarily
rural. If urban conditions are present and not
uniformly distributed throughout the
watershed, or if they represent more than 10
percent of the watershed, then TR-55 or other
procedures must be used.

Limitations of EFH-2 Procedures (Continued)
• If the computed Tc is < 0.1 hour, use 0.1 hour. If the
computed Tc is > 10 hours, peak discharge should
be estimated using the NEH-4 procedures which
are automated in the TR-20 computer program.
• When the flow length is < 200 feet or > 26,000
feet, use another procedure such as TR-55 to
estimate Tc and peak discharge.
• Runoff and peak discharge from snowmelt or rain
on frozen ground cannot be estimated using these
procedures. NEH-4 (TR-20) provides a procedure
for estimating peak discharge in these conditions.
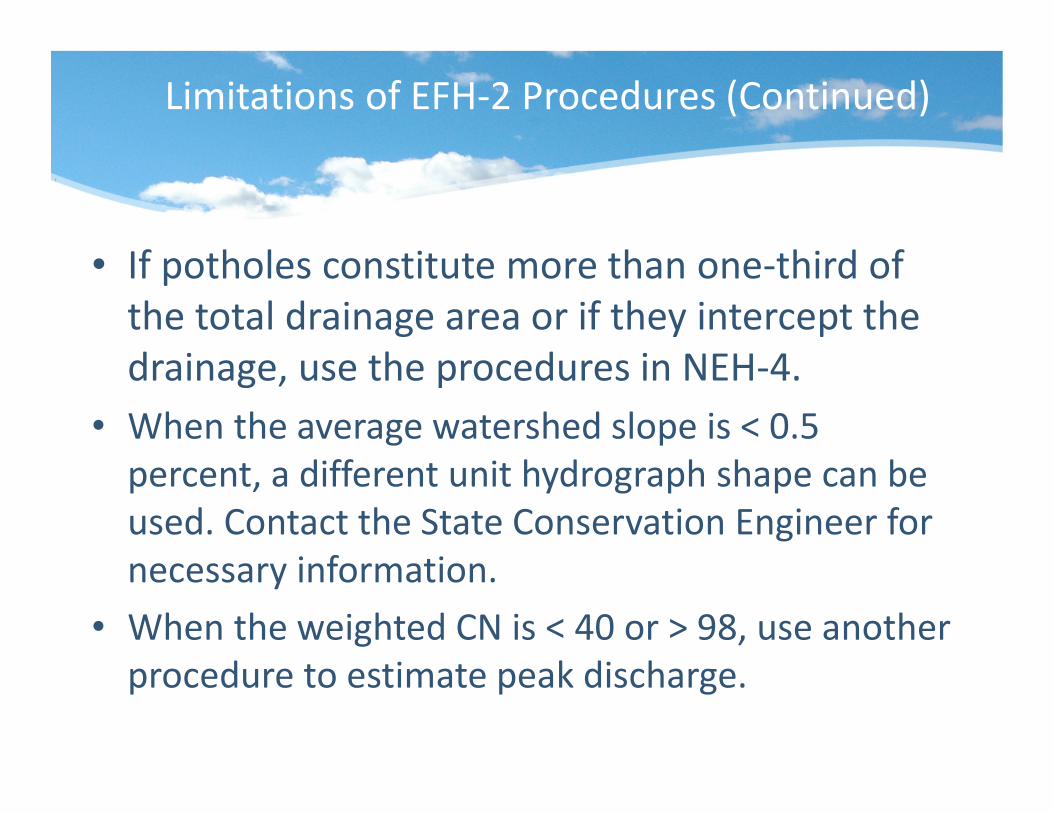
Limitations of EFH-2 Procedures (Continued)
• If potholes constitute more than one-third of
the total drainage area or if they intercept the
drainage, use the procedures in NEH-4.
• When the average watershed slope is < 0.5
percent, a different unit hydrograph shape can be
used. Contact the State Conservation Engineer for
necessary information.
• When the weighted CN is < 40 or > 98, use another
procedure to estimate peak discharge.
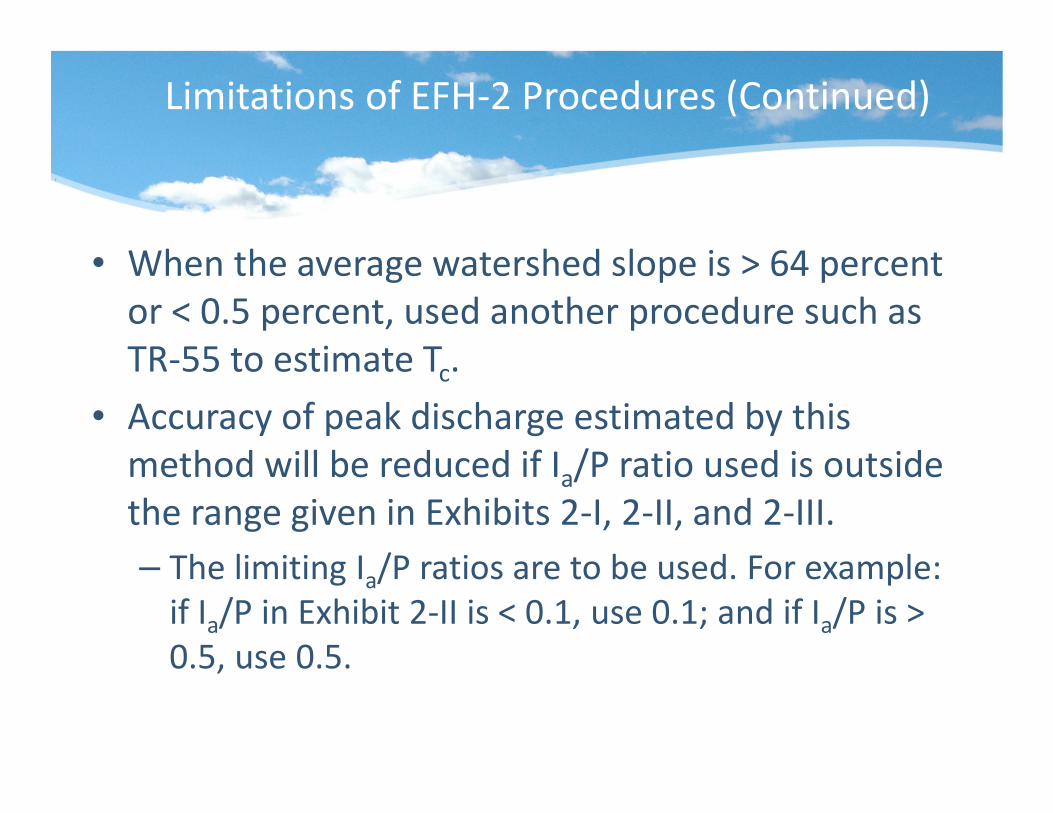
Limitations of EFH-2 Procedures (Continued)
• When the average watershed slope is > 64 percent
or < 0.5 percent, used another procedure such as
TR-55 to estimate Tc.
• Accuracy of peak discharge estimated by this
method will be reduced if Ia/P ratio used is outside
the range given in Exhibits 2-I, 2-II, and 2-III.
– The limiting Ia/P ratios are to be used. For example:
if Ia/P in Exhibit 2-II is < 0.1, use 0.1; and if Ia/P is >
0.5, use 0.5.

Estimating Runoff
• The runoff from a watershed may be
expressed as the average depth of
water that would cover the entire
watershed. The depth is usually
expressed in inches.
• The volume of runoff is computed by
converting depth over the drainage
area of the watershed to volume. The
volume is usually expressed in acre-
feet.

Runoff Curve Number (CN)
• The SCS runoff equation is:
(P-Ia)2
Q =(P-Ia) + S
Where Q = runoff (inches)
P = rainfall (inches)
Ia = initial abstraction (inches)
S = potential maximum retention
after runoff begins (inches)

Initial Abstraction (Ia)
• Includes all losses before runoff
begins.
– Water retained in surface depressions
– Water intercepted by vegetation
– Water lost to evaporation
– Infiltration
• Through studies of many small
agricultural watersheds, Ia was found
to be approximated by:
Ia = 0.2S

Runoff Curve Number (CN)
• Substituting Ia = 0.2S in the SCS runoff
equation:
Q = (P-0.2S)2
P + 0.8S
• Since potential maximum retention
can range from 0 on a smooth
impervious surface to infinity in deep
gravel, the S-values were converted to
CN’s:
CN = 1000
10 + S

Runoff Curve Number (CN)
• Using the previous equation,
when S is zero, the CN is 100.
• As S approaches infinity, the CN
approaches zero.
• Therefore, CN’s can range from
zero to 100
• But for practical applications,
CN values are limited to a range
of 40 to 98

Estimating Runoff (Q)
• When CN and rainfall (P) have been
determined for the watershed,
determine runoff (Q) by using Figure 2-
26 (Page 2-40) or Table 2-2 (Page 2-84).
• COMPLETE EXERCISE BY HAND
– Determine CN (runoff curve number)
using Worksheet 1 (Page 2-90)
– Determine P (rainfall)
– Determine Q (runoff)

Time of Concentration (Tc)
• Tc is the time it takes for runoff to
travel from the hydraulically most
distant point of the watershed to
the outlet.
• Tc influences the peak discharge.
– For the same size watershed, the
shorter the Tc, the larger the peak
discharge.

Time of Concentration (Tc)
• Tc can be estimated for small rural
watersheds using the following
empirical relationship:
• Tc = l0.8
[(1000/CN) – 9]0.7
1140 Y0.5
Where:
Tc = time of concentration (hours)
l = flow length (feet)
CN = runoff curve number
Y = average watershed slope in percent

Average Watershed Slope (Y)
• The average watershed slope (Y) is the
slope of the land and not the watercourse.
– Average watershed slope is an average of
individual land slope measurements.
• Y can be determined using the following
relationship:
Y = 100CI
A
Where Y = Avg WS Slope (percent)
C = total contour length (feet)
I = contour interval (feet)
A = drainage area in square feet

• Use topo map to determine l and Y.
• Use the nomograph in Figure 2-27 (Page
2-41) to determine Tc by completing the
top part of Worksheet 2 on Page 2-91.
Flow Length (l)Flow length is the longest flow path in the
watershed from the watershed divide to
the outlet. It is the total path water travels
overland and in small channels on the way
to the outlet.

EXERCISE:Estimating Peak Discharge (qp)
• Use Q, Ia/P, Tc and the nomograph on Page
2-14 to estimate Unit Peak Discharge (qu)
for 1-YR, 2-YR, & 25-YR 24-HR storms
using the Type II storm distribution.
• Calculate Peak Discharge
qp = qu x DA x Q
Where:
qu = unit peak discharge (cfs/ac/in)
DA = drainage area (acres)
Q = runoff (inch)
Complete Worksheet 2
Congratulations! Time to check your work.Check your hand calculations by entering
the data in the EFH-2 Software Program