NR Aug 2014 StRate M
7
This information may be accessed on the DES World Wide Web page, at http://www.ncesc.com N e w s R e l e a s e North Carolina Department of Commerce - Labor and Economic Analysis Division For More Information, Contact: For Immediate Release Larry Parker/919.707.1010 September 19, 2014 North Carolina’s August Employment Figures Released RALEIGH — The state’s seasonally adjusted August unemployment rate was 6.8 percent, increasing 0.3 of a percentage point from July’s revised rate of 6.5 percent. The national rate decreased 0.1 of a percentage point to 6.1 percent. North Carolina’s August 2014 unemployment rate was 1.2 percentage points lower than a year ago. The number of people employed decreased 28,666 over the month to 4,340,873, and increased 28,938 over the year. The number of people unemployed increased 10,404 over the month to 314,962, and declined 57,505 over the year. Seasonally adjusted Total Nonfarm industry employment, as gathered through the monthly establishment survey, increased 12,500 to 4,153,700 in August. The major industry with the largest over-the-month increase was Gov- ernment at 8,500, followed by Education & Health Services, 2,700; Professional & Business Services, 2,500; Manufacturing, 1,900; Financial Activities, 1,100; Information, 300; and Other Services, 100. Major industries experiencing decreases were Leisure & Hospitality Services, 3,300; and Construction, 1,300. Mining & Logging and Trade, Transportation & Utilities employment remained unchanged over the month. Since August 2013, Total Nonfarm jobs gained 98,800 with the Total Private sector growing by 94,300 and Gov- ernment increasing by 4,500. The largest over-the-year increase of major industries was Professional & Business Services at 38,600, followed by Trade, Transportation & Utilities, 18,000; Education & Health Services, 7,000; Leisure & Hospitality Services, 7,000; Construction, 6,700; Other Services, 5,000; Manufacturing, 4,600; Infor- mation, 4,500; Government, 4,500; Financial Activities, 2,700; and Mining & Logging, 200. The next unemployment update is scheduled for Wednesday, October 1, 2014 when the county unemployment rates for August 2014 will be released. — More — N.C. 7.7 U.S. Sept. 2013 7.2 7.5 Oct. 2013 7.2 7.2 Nov. 2013 7.0 6.9 Dec. 2013 6.7 6.7 Jan. 2014 6.6 6.4 Feb. 2014 6.7 6.2 Apr. 2014 6.3 6.4 May 2014 6.3 6.4 June 2014 6.1 6.5 July 2014 6.2 6.8 Aug. 2014 6.1 8.0 Aug. 2013 7.2 Seasonally Adjusted Unemployment Rates Since August 2013 *2013 Numbers Have Been Annually Revised* 6.3 Mar. 2014 6.7
-
Upload
carolinamercury -
Category
Documents
-
view
73 -
download
1
description
August unemployment rate up to 6.8 percent.
Transcript of NR Aug 2014 StRate M
This information may be accessed on the DES World Wide Web page, at http://www.ncesc.com
N e w s R e l e a s eNorth Carolina Department of Commerce - Labor and Economic Analysis Division
For More Information, Contact: For Immediate ReleaseLarry Parker/919.707.1010 September 19, 2014
North Carolina’s August Employment Figures Released
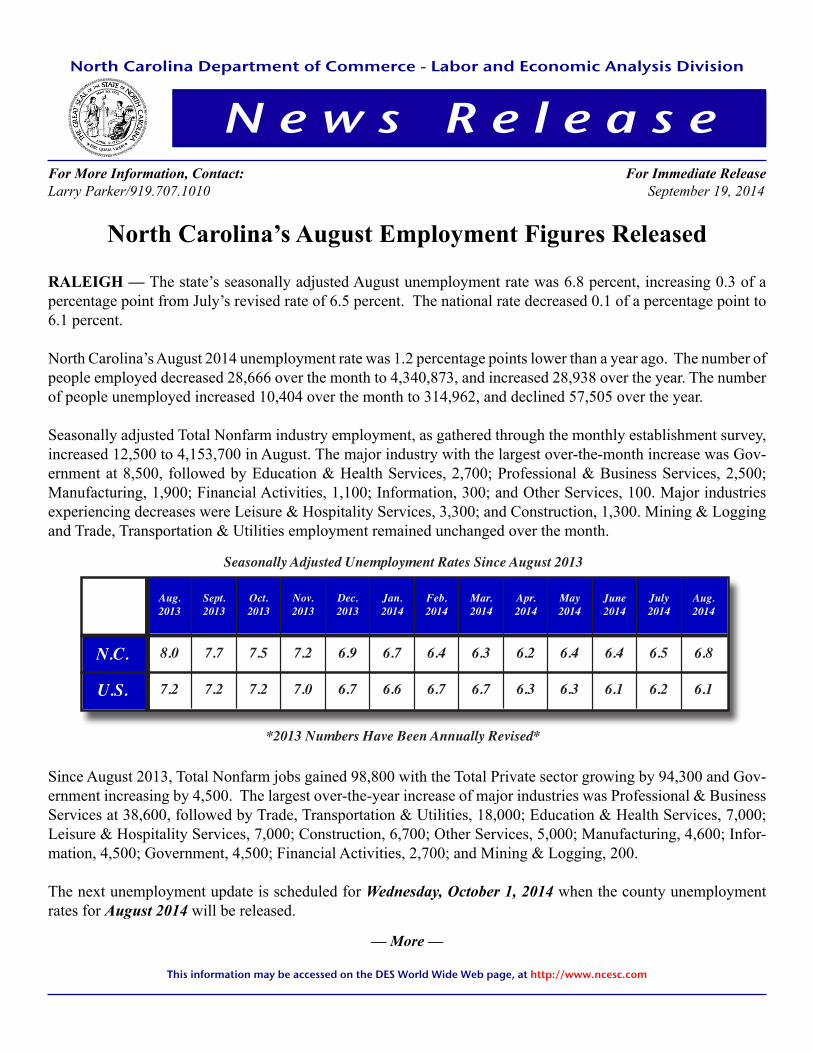
RALEIGH — The state’s seasonally adjusted August unemployment rate was 6.8 percent, increasing 0.3 of a percentage point from July’s revised rate of 6.5 percent. The national rate decreased 0.1 of a percentage point to 6.1 percent.
North Carolina’s August 2014 unemployment rate was 1.2 percentage points lower than a year ago. The number of people employed decreased 28,666 over the month to 4,340,873, and increased 28,938 over the year. The number of people unemployed increased 10,404 over the month to 314,962, and declined 57,505 over the year.
Seasonally adjusted Total Nonfarm industry employment, as gathered through the monthly establishment survey, increased 12,500 to 4,153,700 in August. The major industry with the largest over-the-month increase was Gov-ernment at 8,500, followed by Education & Health Services, 2,700; Professional & Business Services, 2,500; Manufacturing, 1,900; Financial Activities, 1,100; Information, 300; and Other Services, 100. Major industries experiencing decreases were Leisure & Hospitality Services, 3,300; and Construction, 1,300. Mining & Logging and Trade, Transportation & Utilities employment remained unchanged over the month.
Since August 2013, Total Nonfarm jobs gained 98,800 with the Total Private sector growing by 94,300 and Gov-ernment increasing by 4,500. The largest over-the-year increase of major industries was Professional & Business Services at 38,600, followed by Trade, Transportation & Utilities, 18,000; Education & Health Services, 7,000; Leisure & Hospitality Services, 7,000; Construction, 6,700; Other Services, 5,000; Manufacturing, 4,600; Infor-mation, 4,500; Government, 4,500; Financial Activities, 2,700; and Mining & Logging, 200.
The next unemployment update is scheduled for Wednesday, October 1, 2014 when the county unemployment rates for August 2014 will be released.
— More —
N.C. 7.7
U.S.
Sept.2013
7.2
7.5
Oct.2013
7.2
7.2
Nov.2013
7.0
6.9
Dec.2013
6.7
6.7
Jan.2014
6.6
6.4
Feb.2014
6.7
6.2
Apr.2014
6.3
6.4
May2014
6.3
6.4
June2014
6.1
6.5
July2014
6.2
6.8
Aug.2014
6.1
8.0
Aug.2013
7.2
Seasonally Adjusted Unemployment Rates Since August 2013
*2013 Numbers Have Been Annually Revised*
6.3
Mar.2014
6.7
August 2014 July 2014 August 2013NumericChange
PercentChange
NumericChange
PercentChange
(Local Area Unemployment Statistics)
Smoothed Seasonally Adjusted
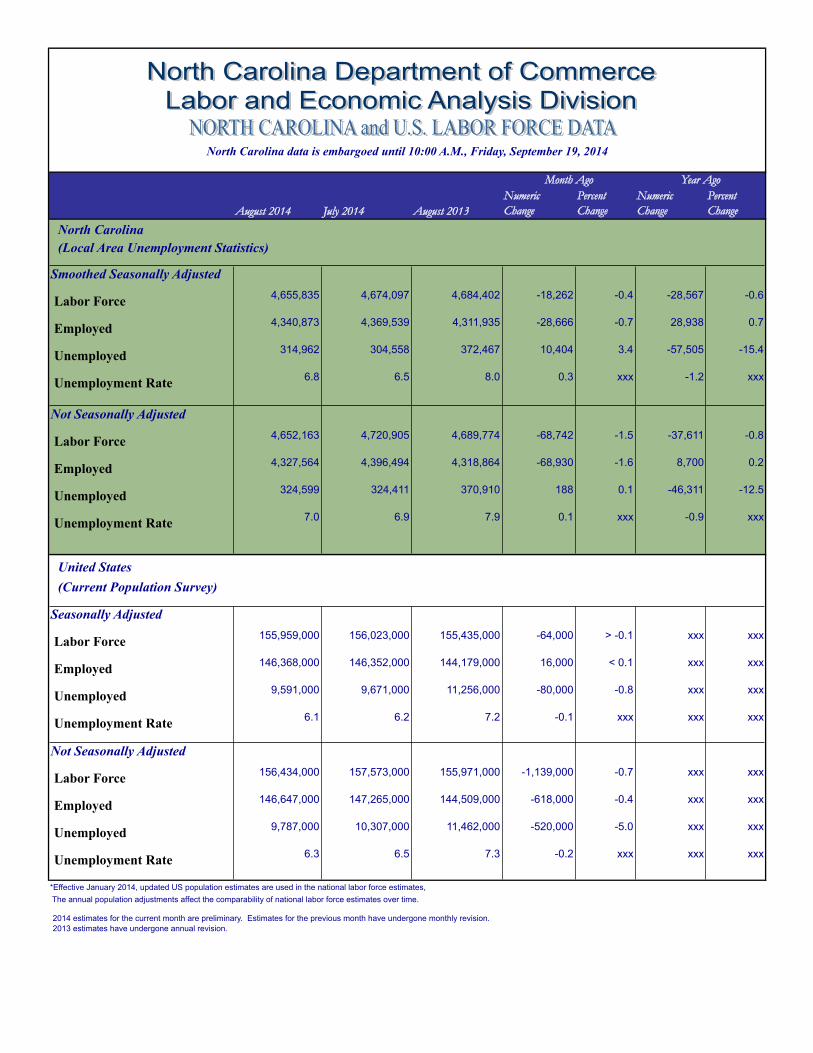
Labor Force 4,655,835 4,674,097 4,684,402 -18,262 -0.4 -28,567 -0.6
Employed 4,340,873 4,369,539 4,311,935 -28,666 -0.7 28,938 0.7
Unemployed 314,962 304,558 372,467 10,404 3.4 -57,505 -15.4
Unemployment Rate 6.8 6.5 8.0 0.3 xxx -1.2 xxx
Not Seasonally Adjusted
Labor Force 4,652,163 4,720,905 4,689,774 -68,742 -1.5 -37,611 -0.8
Employed 4,327,564 4,396,494 4,318,864 -68,930 -1.6 8,700 0.2
Unemployed 324,599 324,411 370,910 188 0.1 -46,311 -12.5
Unemployment Rate 7.0 6.9 7.9 0.1 xxx -0.9 xxx
(Current Population Survey)
Seasonally Adjusted
Labor Force 155,959,000 156,023,000 155,435,000 -64,000 > -0.1 xxx xxx
Employed 146,368,000 146,352,000 144,179,000 16,000 < 0.1 xxx xxx
Unemployed 9,591,000 9,671,000 11,256,000 -80,000 -0.8 xxx xxx
Unemployment Rate 6.1 6.2 7.2 -0.1 xxx xxx xxx
Not Seasonally Adjusted
Labor Force 156,434,000 157,573,000 155,971,000 -1,139,000 -0.7 xxx xxx
Employed 146,647,000 147,265,000 144,509,000 -618,000 -0.4 xxx xxx
Unemployed 9,787,000 10,307,000 11,462,000 -520,000 -5.0 xxx xxx
Unemployment Rate 6.3 6.5 7.3 -0.2 xxx xxx xxx
*Effective January 2014, updated US population estimates are used in the national labor force estimates, The annual population adjustments affect the comparability of national labor force estimates over time.
2014 estimates for the current month are preliminary. Estimates for the previous month have undergone monthly revision.2013 estimates have undergone annual revision.
United States
Month Ago Year Ago
North Carolina
North Carolina data is embargoed until 10:00 A.M., Friday, September 19, 2014
August 2014 July 2014 August 2013NumericChange
PercentChange
NumericChange
PercentChange
(Current Employment Statistics)
Seasonally Adjusted
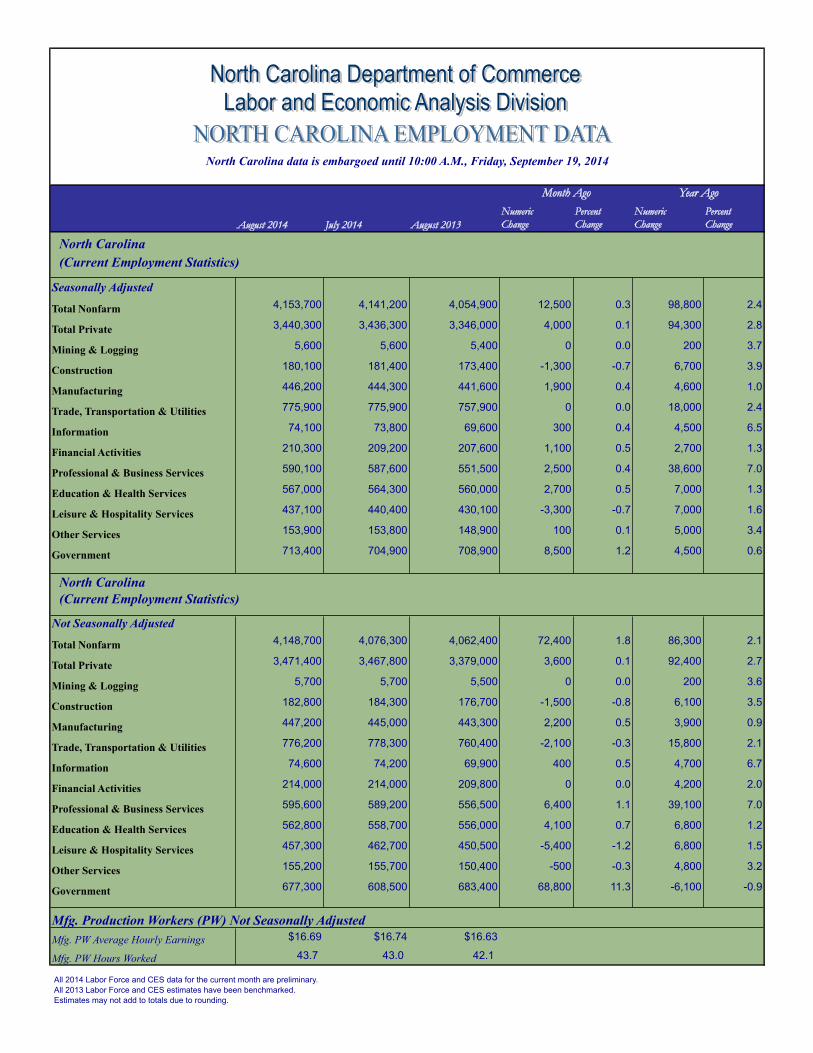
Total Nonfarm 4,153,700 4,141,200 4,054,900 12,500 0.3 98,800 2.4
Total Private 3,440,300 3,436,300 3,346,000 4,000 0.1 94,300 2.8
Mining & Logging 5,600 5,600 5,400 0 0.0 200 3.7
Construction 180,100 181,400 173,400 -1,300 -0.7 6,700 3.9
Manufacturing 446,200 444,300 441,600 1,900 0.4 4,600 1.0
Trade, Transportation & Utilities 775,900 775,900 757,900 0 0.0 18,000 2.4
Information 74,100 73,800 69,600 300 0.4 4,500 6.5
Financial Activities 210,300 209,200 207,600 1,100 0.5 2,700 1.3
Professional & Business Services 590,100 587,600 551,500 2,500 0.4 38,600 7.0
Education & Health Services 567,000 564,300 560,000 2,700 0.5 7,000 1.3
Leisure & Hospitality Services 437,100 440,400 430,100 -3,300 -0.7 7,000 1.6
Other Services 153,900 153,800 148,900 100 0.1 5,000 3.4
Government 713,400 704,900 708,900 8,500 1.2 4,500 0.6
(Current Employment Statistics)
Not Seasonally Adjusted
Total Nonfarm 4,148,700 4,076,300 4,062,400 72,400 1.8 86,300 2.1
Total Private 3,471,400 3,467,800 3,379,000 3,600 0.1 92,400 2.7
Mining & Logging 5,700 5,700 5,500 0 0.0 200 3.6
Construction 182,800 184,300 176,700 -1,500 -0.8 6,100 3.5
Manufacturing 447,200 445,000 443,300 2,200 0.5 3,900 0.9
Trade, Transportation & Utilities 776,200 778,300 760,400 -2,100 -0.3 15,800 2.1
Information 74,600 74,200 69,900 400 0.5 4,700 6.7
Financial Activities 214,000 214,000 209,800 0 0.0 4,200 2.0
Professional & Business Services 595,600 589,200 556,500 6,400 1.1 39,100 7.0
Education & Health Services 562,800 558,700 556,000 4,100 0.7 6,800 1.2
Leisure & Hospitality Services 457,300 462,700 450,500 -5,400 -1.2 6,800 1.5
Other Services 155,200 155,700 150,400 -500 -0.3 4,800 3.2
Government 677,300 608,500 683,400 68,800 11.3 -6,100 -0.9
Mfg. Production Workers (PW) Not Seasonally AdjustedMfg. PW Average Hourly Earnings $16.69 $16.74 $16.63
Mfg. PW Hours Worked 43.7 43.0 42.1
All 2014 Labor Force and CES data for the current month are preliminary.All 2013 Labor Force and CES estimates have been benchmarked.Estimates may not add to totals due to rounding.
North Carolina
North Carolina
Month Ago Year Ago
North Carolina data is embargoed until 10:00 A.M., Friday, September 19, 2014
L a b o r & E c o n o m i c A n a l y s i s D i v i s i o n | N o r t h C a r o l i n a D e p a r t m e n t o f C o m m e r c e | 1 o f 2
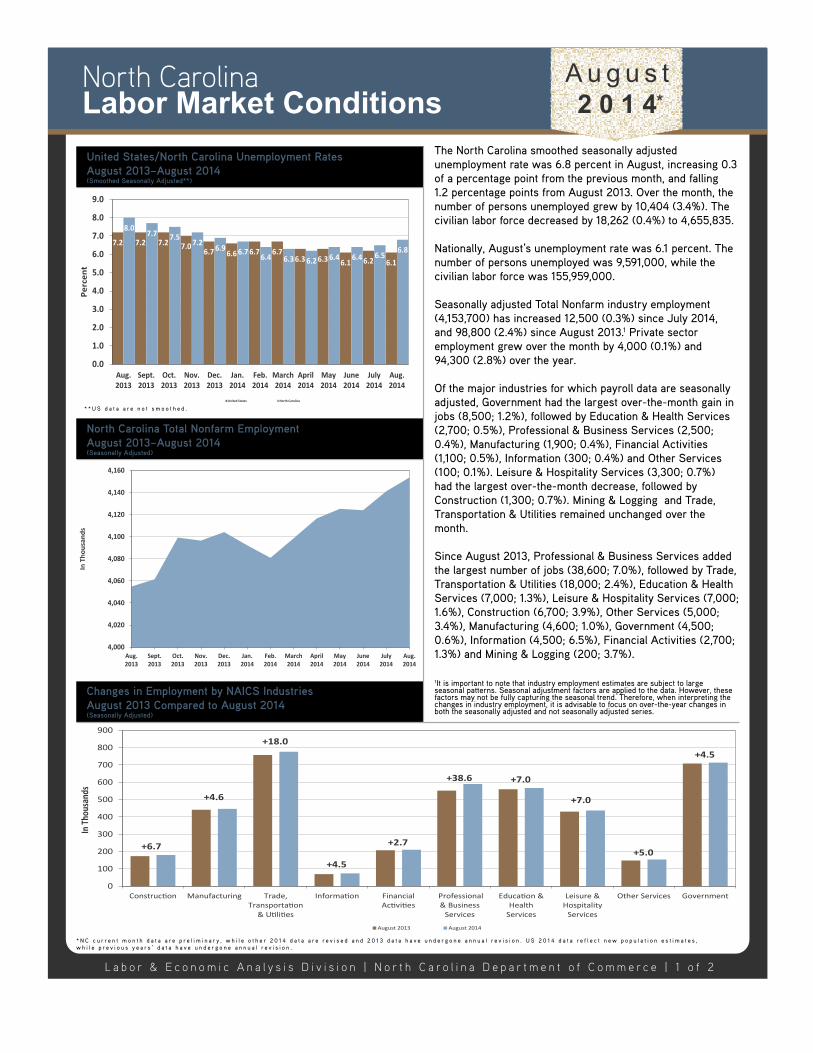
The North Carolina smoothed seasonally adjusted unemployment rate was 6.8 percent in August, increasing 0.3 of a percentage point from the previous month, and falling 1.2 percentage points from August 2013. Over the month, the number of persons unemployed grew by 10,404 (3.4%). The civilian labor force decreased by 18,262 (0.4%) to 4,655,835.
Nationally, August’s unemployment rate was 6.1 percent. The number of persons unemployed was 9,591,000, while the civilian labor force was 155,959,000.
Seasonally adjusted Total Nonfarm industry employment (4,153,700) has increased 12,500 (0.3%) since July 2014, and 98,800 (2.4%) since August 2013.1 Private sector employment grew over the month by 4,000 (0.1%) and 94,300 (2.8%) over the year.
Of the major industries for which payroll data are seasonally adjusted, Government had the largest over-the-month gain in jobs (8,500; 1.2%), followed by Education & Health Services (2,700; 0.5%), Professional & Business Services (2,500; 0.4%), Manufacturing (1,900; 0.4%), Financial Activities (1,100; 0.5%), Information (300; 0.4%) and Other Services (100; 0.1%). Leisure & Hospitality Services (3,300; 0.7%) had the largest over-the-month decrease, followed by Construction (1,300; 0.7%). Mining & Logging and Trade, Transportation & Utilities remained unchanged over the month.
Since August 2013, Professional & Business Services added the largest number of jobs (38,600; 7.0%), followed by Trade, Transportation & Utilities (18,000; 2.4%), Education & Health Services (7,000; 1.3%), Leisure & Hospitality Services (7,000; 1.6%), Construction (6,700; 3.9%), Other Services (5,000; 3.4%), Manufacturing (4,600; 1.0%), Government (4,500; 0.6%), Information (4,500; 6.5%), Financial Activities (2,700; 1.3%) and Mining & Logging (200; 3.7%).
1It is important to note that industry employment estimates are subject to large seasonal patterns. Seasonal adjustment factors are applied to the data. However, these factors may not be fully capturing the seasonal trend. Therefore, when interpreting the changes in industry employment, it is advisable to focus on over-the-year changes in both the seasonally adjusted and not seasonally adjusted series.
Changes in Employment by NAICS IndustriesAugust 2013 Compared to August 2014(Seasonally Adjusted)
United States/North Carolina Unemployment RatesAugust 2013–August 2014(Smoothed Seasonally Adjusted**)
North Carolina Total Nonfarm EmploymentAugust 2013–August 2014(Seasonally Adjusted)
7.2 7.2 7.27.0
6.7 6.6 6.7 6.7
6.3 6.36.1 6.2 6.1
8.07.7
7.57.2
6.96.7
6.4 6.3 6.26.4 6.4 6.5
6.8
0.0
1.0
2.0
3.0
4.0
5.0
6.0
7.0
8.0
9.0
Aug.
2013
Sept.
2013
Oct.
2013
Nov.
2013
Dec.
2013
Jan.
2014
Feb.
2014
March
2014
April
2014
May
2014
June
2014
July
2014
Aug.
2014
Percent
United States North Carolina
4,000
4,020
4,040
4,060
4,080
4,100
4,120
4,140
4,160
Aug.
2013
Sept.
2013
Oct.
2013
Nov.
2013
Dec.
2013
Jan.
2014
Feb.
2014
March
2014
April
2014
May
2014
June
2014
July
2014
Aug.
2014
In Thousands
+6.7
+4.6
+18.0
+4.5
+2.7
+38.6 +7.0
+7.0
+5.0
+4.5
0
100
200
300
400
500
600
700
800
900
Construc on Manufacturing Trade,Transporta on
& U li es
Informa on FinancialAc vi es
Professional& BusinessServices
Educa on &HealthServices
Leisure &HospitalityServices
Other Services Government
In Thousands
August 2013 August 2014
Labor Market ConditionsNorth Carolina Au g u s t
2 0 1 4
* N C c u r r e n t m o n t h d a t a a r e p r e l i m i n a r y , w h i l e o t h e r 2 0 1 4 d a t a a r e r e v i s e d a n d 2 0 1 3 d a t a h a v e u n d e r g o n e a n n u a l r e v i s i o n . U S 2 0 1 4 d a t a r e f l e c t n e w p o p u l a t i o n e s t i m a t e s , w h i l e p r e v i o u s y e a r s ’ d a t a h a v e u n d e r g o n e a n n u a l r e v i s i o n .
* * U S d a t a a r e n o t s m o o t h e d .
L a b o r & E c o n o m i c A n a l y s i s D i v i s i o n | N o r t h C a r o l i n a D e p a r t m e n t o f C o m m e r c e | 2 o f 2
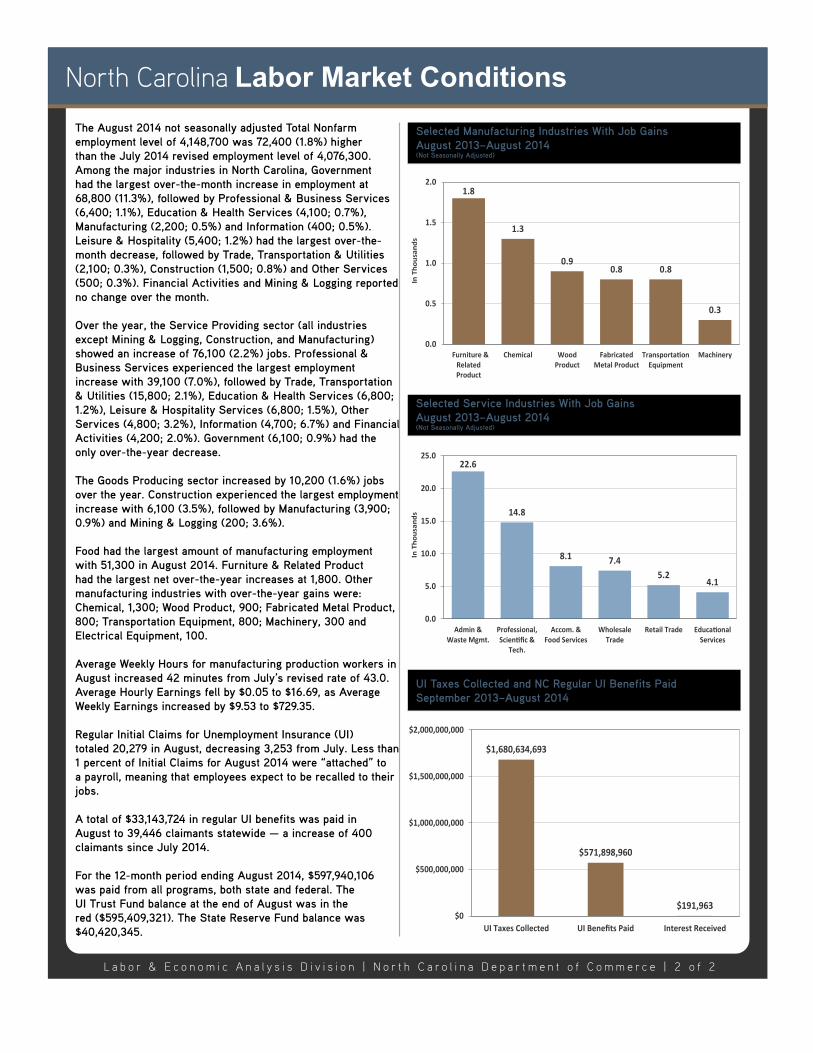
The August 2014 not seasonally adjusted Total Nonfarm employment level of 4,148,700 was 72,400 (1.8%) higher than the July 2014 revised employment level of 4,076,300. Among the major industries in North Carolina, Government had the largest over-the-month increase in employment at 68,800 (11.3%), followed by Professional & Business Services (6,400; 1.1%), Education & Health Services (4,100; 0.7%), Manufacturing (2,200; 0.5%) and Information (400; 0.5%). Leisure & Hospitality (5,400; 1.2%) had the largest over-the-month decrease, followed by Trade, Transportation & Utilities (2,100; 0.3%), Construction (1,500; 0.8%) and Other Services (500; 0.3%). Financial Activities and Mining & Logging reported no change over the month.
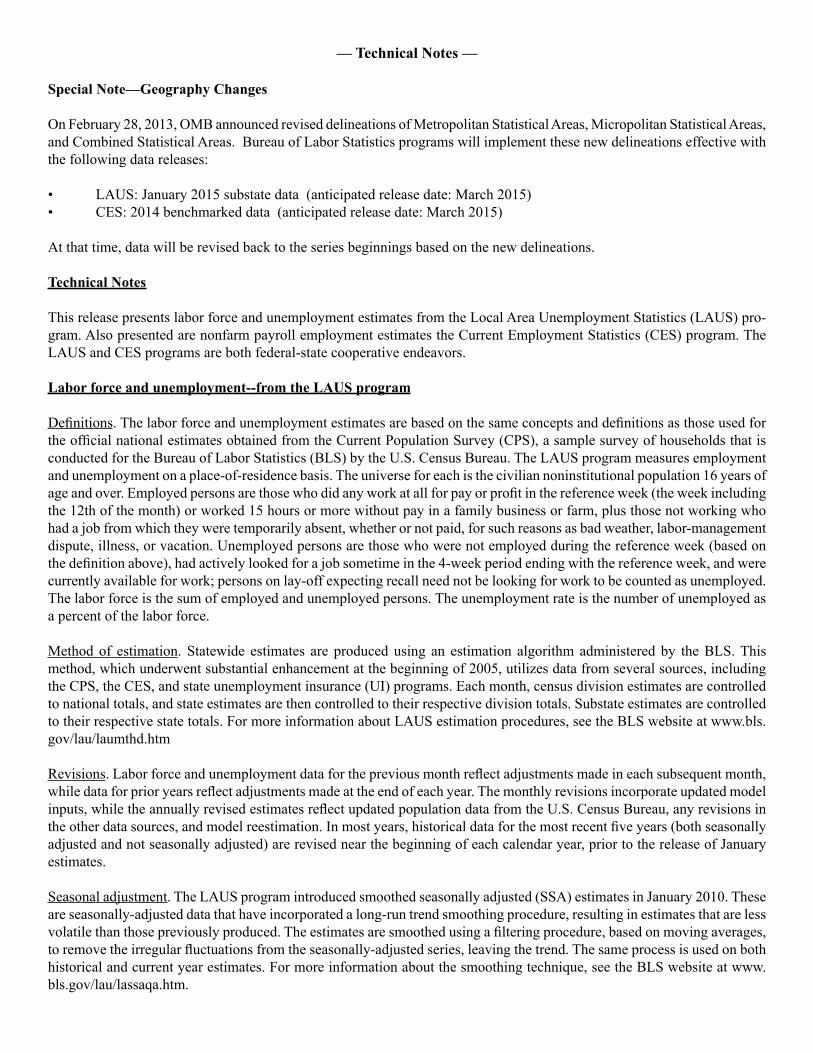
Over the year, the Service Providing sector (all industries except Mining & Logging, Construction, and Manufacturing) showed an increase of 76,100 (2.2%) jobs. Professional & Business Services experienced the largest employment increase with 39,100 (7.0%), followed by Trade, Transportation & Utilities (15,800; 2.1%), Education & Health Services (6,800; 1.2%), Leisure & Hospitality Services (6,800; 1.5%), Other Services (4,800; 3.2%), Information (4,700; 6.7%) and Financial Activities (4,200; 2.0%). Government (6,100; 0.9%) had the only over-the-year decrease.
The Goods Producing sector increased by 10,200 (1.6%) jobs over the year. Construction experienced the largest employment increase with 6,100 (3.5%), followed by Manufacturing (3,900; 0.9%) and Mining & Logging (200; 3.6%).
Food had the largest amount of manufacturing employment with 51,300 in August 2014. Furniture & Related Product had the largest net over-the-year increases at 1,800. Other manufacturing industries with over-the-year gains were: Chemical, 1,300; Wood Product, 900; Fabricated Metal Product, 800; Transportation Equipment, 800; Machinery, 300 and Electrical Equipment, 100.
Average Weekly Hours for manufacturing production workers in August increased 42 minutes from July’s revised rate of 43.0. Average Hourly Earnings fell by $0.05 to $16.69, as Average Weekly Earnings increased by $9.53 to $729.35.
Regular Initial Claims for Unemployment Insurance (UI) totaled 20,279 in August, decreasing 3,253 from July. Less than 1 percent of Initial Claims for August 2014 were “attached” to a payroll, meaning that employees expect to be recalled to their jobs.
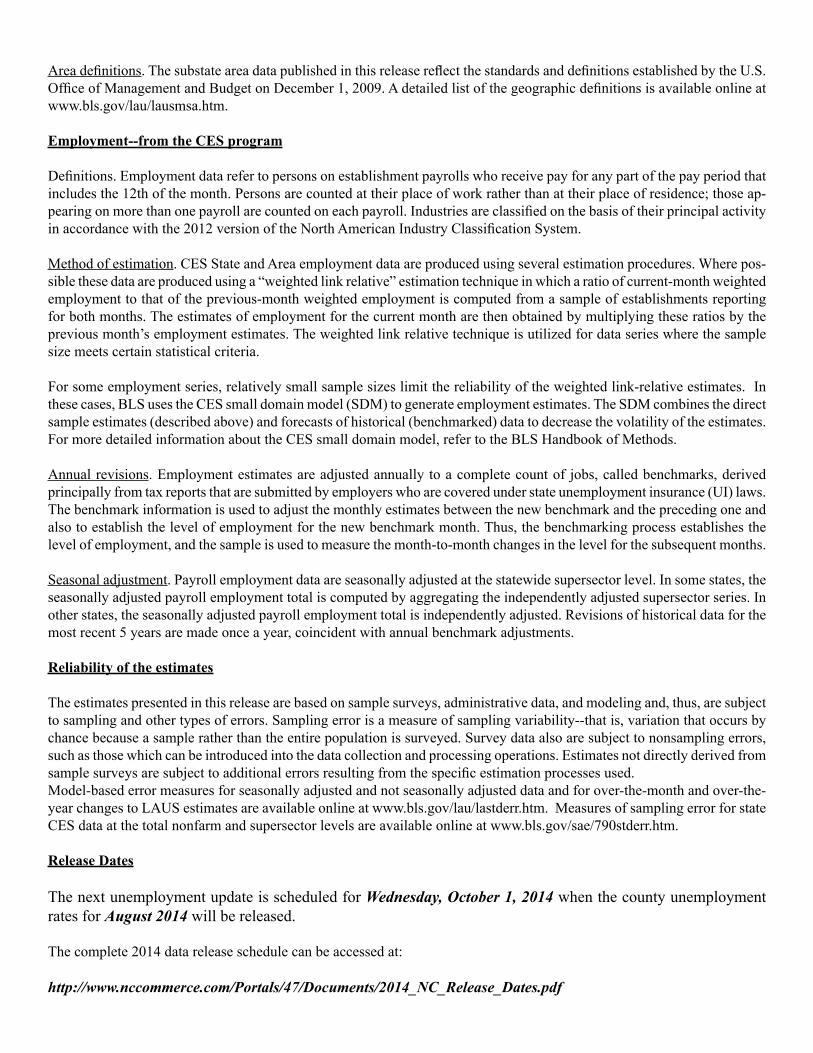
A total of $33,143,724 in regular UI benefits was paid in August to 39,446 claimants statewide — a increase of 400 claimants since July 2014.
For the 12-month period ending August 2014, $597,940,106 was paid from all programs, both state and federal. The UI Trust Fund balance at the end of August was in the red ($595,409,321). The State Reserve Fund balance was $40,420,345.
1.8
1.3
0.90.8 0.8
0.3
0.0
0.5
1.0
1.5
2.0
Furniture &
Related
Product
Chemical Wood
Product
Fabricated
Metal Product
Transporta on
Equipment
Machinery
In Thousands
22.6
14.8
8.17.4
5.24.1
0.0
5.0
10.0
15.0
20.0
25.0
Admin &
Waste Mgmt.
Professional,
Scien c &
Tech.
Accom. &
Food Services
Wholesale
Trade
Retail Trade Educa onal
Services
In Thousands
$1,680,634,693
$571,898,960
$191,963
$0
$500,000,000
$1,000,000,000
$1,500,000,000
$2,000,000,000
UI Taxes Collected UI Bene ts Paid Interest Received
Selected Manufacturing Industries With Job GainsAugust 2013–August 2014(Not Seasonally Adjusted)
Selected Service Industries With Job GainsAugust 2013–August 2014(Not Seasonally Adjusted)
UI Taxes Collected and NC Regular UI Benefits PaidSeptember 2013–August 2014
North Carolina Labor Market Conditions
— Technical Notes —
Special Note—Geography Changes
On February 28, 2013, OMB announced revised delineations of Metropolitan Statistical Areas, Micropolitan Statistical Areas, and Combined Statistical Areas. Bureau of Labor Statistics programs will implement these new delineations effective with the following data releases:
• LAUS:January2015substatedata(anticipatedreleasedate:March2015)• CES:2014benchmarkeddata(anticipatedreleasedate:March2015)
Atthattime,datawillberevisedbacktotheseriesbeginningsbasedonthenewdelineations.
Technical Notes
ThisreleasepresentslaborforceandunemploymentestimatesfromtheLocalAreaUnemploymentStatistics(LAUS)pro-gram.AlsopresentedarenonfarmpayrollemploymentestimatestheCurrentEmploymentStatistics(CES)program.TheLAUS and CES programs are both federal-state cooperative endeavors.
Labor force and unemployment--from the LAUS program
Definitions.ThelaborforceandunemploymentestimatesarebasedonthesameconceptsanddefinitionsasthoseusedfortheofficialnationalestimatesobtainedfromtheCurrentPopulationSurvey(CPS),asamplesurveyofhouseholdsthatisconductedfortheBureauofLaborStatistics(BLS)bytheU.S.CensusBureau.TheLAUSprogrammeasuresemploymentand unemployment on a place-of-residence basis. The universe for each is the civilian noninstitutional population 16 years of ageandover.Employedpersonsarethosewhodidanyworkatallforpayorprofitinthereferenceweek(theweekincludingthe12thofthemonth)orworked15hoursormorewithoutpayinafamilybusinessorfarm,plusthosenotworkingwhohad a job from which they were temporarily absent, whether or not paid, for such reasons as bad weather, labor-management dispute,illness,orvacation.Unemployedpersonsarethosewhowerenotemployedduringthereferenceweek(basedonthedefinitionabove),hadactivelylookedforajobsometimeinthe4-weekperiodendingwiththereferenceweek,andwerecurrentlyavailableforwork;personsonlay-offexpectingrecallneednotbelookingforworktobecountedasunemployed.The labor force is the sum of employed and unemployed persons. The unemployment rate is the number of unemployed as a percent of the labor force.
Method of estimation. Statewide estimates are produced using an estimation algorithm administered by the BLS. This method, which underwent substantial enhancement at the beginning of 2005, utilizes data from several sources, including theCPS,theCES,andstateunemploymentinsurance(UI)programs.Eachmonth,censusdivisionestimatesarecontrolledto national totals, and state estimates are then controlled to their respective division totals. Substate estimates are controlled to their respective state totals. For more information about LAUS estimation procedures, see the BLS website at www.bls.gov/lau/laumthd.htm
Revisions.Laborforceandunemploymentdataforthepreviousmonthreflectadjustmentsmadeineachsubsequentmonth,whiledataforprioryearsreflectadjustmentsmadeattheendofeachyear.Themonthlyrevisionsincorporateupdatedmodelinputs,whiletheannuallyrevisedestimatesreflectupdatedpopulationdatafromtheU.S.CensusBureau,anyrevisionsintheotherdatasources,andmodelreestimation.Inmostyears,historicaldataforthemostrecentfiveyears(bothseasonallyadjustedandnotseasonallyadjusted)arerevisednearthebeginningofeachcalendaryear,priortothereleaseofJanuaryestimates.
Seasonal adjustment.TheLAUSprogramintroducedsmoothedseasonallyadjusted(SSA)estimatesinJanuary2010.Theseare seasonally-adjusted data that have incorporated a long-run trend smoothing procedure, resulting in estimates that are less volatilethanthosepreviouslyproduced.Theestimatesaresmoothedusingafilteringprocedure,basedonmovingaverages,toremovetheirregularfluctuationsfromtheseasonally-adjustedseries,leavingthetrend.Thesameprocessisusedonbothhistoricalandcurrentyearestimates.Formoreinformationaboutthesmoothingtechnique,seetheBLSwebsiteatwww.bls.gov/lau/lassaqa.htm.
Areadefinitions.ThesubstateareadatapublishedinthisreleasereflectthestandardsanddefinitionsestablishedbytheU.S.OfficeofManagementandBudgetonDecember1,2009.Adetailedlistofthegeographicdefinitionsisavailableonlineatwww.bls.gov/lau/lausmsa.htm.
Employment--from the CES program
Definitions.Employmentdatarefertopersonsonestablishmentpayrollswhoreceivepayforanypartofthepayperiodthatincludesthe12thofthemonth.Personsarecountedattheirplaceofworkratherthanattheirplaceofresidence;thoseap-pearingonmorethanonepayrollarecountedoneachpayroll.Industriesareclassifiedonthebasisoftheirprincipalactivityinaccordancewiththe2012versionoftheNorthAmericanIndustryClassificationSystem.
Method of estimation. CES State and Area employment data are produced using several estimation procedures. Where pos-siblethesedataareproducedusinga“weightedlinkrelative”estimationtechniqueinwhicharatioofcurrent-monthweightedemployment to that of the previous-month weighted employment is computed from a sample of establishments reporting for both months. The estimates of employment for the current month are then obtained by multiplying these ratios by the previousmonth’semploymentestimates.Theweightedlinkrelativetechniqueisutilizedfordataserieswherethesamplesize meets certain statistical criteria.
Forsomeemploymentseries,relativelysmallsamplesizeslimitthereliabilityoftheweightedlink-relativeestimates.Inthesecases,BLSusestheCESsmalldomainmodel(SDM)togenerateemploymentestimates.TheSDMcombinesthedirectsampleestimates(describedabove)andforecastsofhistorical(benchmarked)datatodecreasethevolatilityoftheestimates.FormoredetailedinformationabouttheCESsmalldomainmodel,refertotheBLSHandbookofMethods.
Annual revisions.Employmentestimatesareadjustedannuallytoacompletecountofjobs,calledbenchmarks,derivedprincipallyfromtaxreportsthataresubmittedbyemployerswhoarecoveredunderstateunemploymentinsurance(UI)laws.Thebenchmarkinformationisusedtoadjustthemonthlyestimatesbetweenthenewbenchmarkandtheprecedingoneandalsotoestablishthelevelofemploymentforthenewbenchmarkmonth.Thus,thebenchmarkingprocessestablishesthelevelofemployment,andthesampleisusedtomeasurethemonth-to-monthchangesinthelevelforthesubsequentmonths.
Seasonal adjustment. Payroll employment data are seasonally adjusted at the statewide supersector level. In some states, the seasonally adjusted payroll employment total is computed by aggregating the independently adjusted supersector series. In other states, the seasonally adjusted payroll employment total is independently adjusted. Revisions of historical data for the mostrecent5yearsaremadeonceayear,coincidentwithannualbenchmarkadjustments.
Reliability of the estimates
The estimates presented in this release are based on sample surveys, administrative data, and modeling and, thus, are subject to sampling and other types of errors. Sampling error is a measure of sampling variability--that is, variation that occurs by chance because a sample rather than the entire population is surveyed. Survey data also are subject to nonsampling errors, such as those which can be introduced into the data collection and processing operations. Estimates not directly derived from samplesurveysaresubjecttoadditionalerrorsresultingfromthespecificestimationprocessesused.Model-based error measures for seasonally adjusted and not seasonally adjusted data and for over-the-month and over-the-year changes to LAUS estimates are available online at www.bls.gov/lau/lastderr.htm. Measures of sampling error for state CES data at the total nonfarm and supersector levels are available online at www.bls.gov/sae/790stderr.htm.
Release Dates
The next unemployment update is scheduled for Wednesday, October 1, 2014 when the county unemployment rates for August 2014 will be released.
The complete 2014 data release schedule can be accessed at:
http://www.nccommerce.com/Portals/47/Documents/2014_NC_Release_Dates.pdf