N:P:Si nutrient export ratios and ecological consequences in coastal ...
12
Click Here for Full Article N:P:Si nutrient export ratios and ecological consequences in coastal seas evaluated by the ICEP approach Josette Garnier, 1 Arthur Beusen, 2 Vincent Thieu, 1 Gilles Billen, 1 and Lex Bouwman 2,3 Received 22 May 2009; revised 3 October 2009; accepted 30 October 2009; published 23 April 2010. [1] The Indicator for Coastal Eutrophication Potential (ICEP) for river nutrient export of nitrogen, phosphorus, and silica at the global scale was first calculated from available measurement data. Positive values of ICEP indicate an excess of nitrogen and phosphorus over silica and generally coincide with eutrophication. The sign of ICEP based on measured nutrient fluxes was in good agreement with the corresponding one calculated from the Global‐NEWS models for more than 5000 watersheds in the world. Calculated ICEP for the year 2050 based on Global NEWS data for the four Millennium Ecosystem Assessment scenarios show increasing values particularly in developing countries. For further evaluation of the ICEP at the outlet of the rivers of the world based on measurements, there is a need for additional determination silica fluxes and concentrations, which are scarcely documented. Citation: Garnier, J., A. Beusen, V. Thieu, G. Billen, and L. Bouwman (2010), N:P:Si nutrient export ratios and ecological consequences in coastal seas evaluated by the ICEP approach, Global Biogeochem. Cycles, 24, GB0A05, doi:10.1029/2009GB003583. 1. Introduction [2] In the past few decades, increased nutrient loading of coastal marine ecosystems has resulted in severe local, re- gional and global eutrophication problems [ Billen and Garnier, 2007; Howarth, 2008; Glibert et al., 2008]. The manifestation of these problems may be quite diverse, de- pending on local physiographical and hydrological condi- tions of the coastal marine system: (1) blooms of potentially toxic algae in the Seine Bight and the Baltic Sea [Cugier et al., 2005; Vahtera et al., 2007; Elmgren, 1989; Granéli, 2004]; (2) massive development of mucilaginous, unpalat- able, algal species in the North Sea [Lancelot et al., 1987, 2005, 2007], the Black Sea [Cociasu et al., 1996], or the Adriatic Sea [Marchetti, 1991]; (3) increased deposition of organic material resulting in anoxic bottom waters as in the northern Adriatic and northern Gulf of Mexico [Justić, 1991; Justić et al., 1995a], the open waters around Denmark and in Danish estuaries [Conley et al., 2007], and in many places in the world [Diaz, 2001; Justić et al., 1995b; Diaz and Rosenberg, 2008]. Profound changes in the structure of food webs are often observed as a result of eutrophication in coastal marine ecosystems, with changes in the structure of the benthic communities [Lim et al., 2006] and a decline in zooplankton affecting commercial fish production [Rousseau et al., 2000]. [3] It is now recognized that these phenomena are not only caused by nutrient enrichment of the marine system per se, but rather by the changes in the nutrient stoichiometry. Coastal enrichment with nutrients, brought in proportion of the Redfield ratios [Redfield et al., 1963] and characterizing the requirement of diatom growth, would only rarely result in eutrophication problems. New planktonic primary pro- duction is mostly ensured by diatoms, while nonsiliceous algae are restricted to regenerated production. On the con- trary, when nitrogen (N) and phosphorus (P) are discharged in excess over silicon (Si) with respect to the requirements of diatoms, these will be limited, and nondiatoms, often undesirable algal species, will develop instead [Billen and Garnier, 1997, 2007; Conley et al., 1993; Conley, 1999; Cugier et al., 2005; Humborg et al., 2000, 2008; Justić et al., 1995a, 1995b; Officer and Ryther , 1980; Turner and Rabalais, 1994; Turner et al., 1998]. [4] According to this view, an Indicator of Coastal Eutrophication Potential (ICEP) was proposed [Billen and Garnier, 2007]. ICEP is calculated on the basis of riverine N, P and Si deliveries, allowing to determine the possible problems resulting from a new production of nonsiliceous algae sustained by external inputs of N and/or P brought in excess over silica, i.e., in limiting conditions for the diatom growth. Compared to N:P ratios which are often considered [e.g., Glibert et al., 2008], the ICEP adds information about the role of Si in determining potential eutrophication im- pacts of changing element stoichiometry. [5] The aim of this paper is to compare the ICEP values on the basis of the Global NEWS data [Seitzinger et al., 2010] 1 UMR 7619 Sisyphe, UPMC, CNRS, Paris, France. 2 Netherlands Environmental Assessment Agency, Bilthoven, Netherlands. 3 Earth System Science and Climate Change Group, Wageningen University Research Centre, Wageningen, Netherlands. Copyright 2010 by the American Geophysical Union. 0886‐6236/10/2009GB003583 GLOBAL BIOGEOCHEMICAL CYCLES, VOL. 24, GB0A05, doi:10.1029/2009GB003583, 2010 GB0A05 1 of 12
Transcript of N:P:Si nutrient export ratios and ecological consequences in coastal ...

ClickHere
for
FullArticle
N:P:Si nutrient export ratios and ecological consequencesin coastal seas evaluated by the ICEP approach
Josette Garnier,1 Arthur Beusen,2 Vincent Thieu,1 Gilles Billen,1 and Lex Bouwman2,3
Received 22 May 2009; revised 3 October 2009; accepted 30 October 2009; published 23 April 2010.
[1] The Indicator for Coastal Eutrophication Potential (ICEP) for river nutrient export ofnitrogen, phosphorus, and silica at the global scale was first calculated from availablemeasurement data. Positive values of ICEP indicate an excess of nitrogen and phosphorusover silica and generally coincide with eutrophication. The sign of ICEP based onmeasured nutrient fluxes was in good agreement with the corresponding one calculatedfrom the Global‐NEWS models for more than 5000 watersheds in the world. CalculatedICEP for the year 2050 based on Global NEWS data for the four Millennium EcosystemAssessment scenarios show increasing values particularly in developing countries. Forfurther evaluation of the ICEP at the outlet of the rivers of the world based onmeasurements, there is a need for additional determination silica fluxes and concentrations,which are scarcely documented.
Citation: Garnier, J., A. Beusen, V. Thieu, G. Billen, and L. Bouwman (2010), N:P:Si nutrient export ratios and ecologicalconsequences in coastal seas evaluated by the ICEP approach, Global Biogeochem. Cycles, 24, GB0A05,doi:10.1029/2009GB003583.
1. Introduction
[2] In the past few decades, increased nutrient loading ofcoastal marine ecosystems has resulted in severe local, re-gional and global eutrophication problems [Billen andGarnier, 2007; Howarth, 2008; Glibert et al., 2008]. Themanifestation of these problems may be quite diverse, de-pending on local physiographical and hydrological condi-tions of the coastal marine system: (1) blooms of potentiallytoxic algae in the Seine Bight and the Baltic Sea [Cugier etal., 2005; Vahtera et al., 2007; Elmgren, 1989; Granéli,2004]; (2) massive development of mucilaginous, unpalat-able, algal species in the North Sea [Lancelot et al., 1987,2005, 2007], the Black Sea [Cociasu et al., 1996], or theAdriatic Sea [Marchetti, 1991]; (3) increased deposition oforganic material resulting in anoxic bottom waters as in thenorthern Adriatic and northern Gulf of Mexico [Justić, 1991;Justić et al., 1995a], the open waters around Denmark and inDanish estuaries [Conley et al., 2007], and in many placesin the world [Diaz, 2001; Justić et al., 1995b; Diaz andRosenberg, 2008]. Profound changes in the structure offood webs are often observed as a result of eutrophication incoastal marine ecosystems, with changes in the structure ofthe benthic communities [Lim et al., 2006] and a decline in
zooplankton affecting commercial fish production [Rousseauet al., 2000].[3] It is now recognized that these phenomena are not
only caused by nutrient enrichment of the marine system perse, but rather by the changes in the nutrient stoichiometry.Coastal enrichment with nutrients, brought in proportion ofthe Redfield ratios [Redfield et al., 1963] and characterizingthe requirement of diatom growth, would only rarely resultin eutrophication problems. New planktonic primary pro-duction is mostly ensured by diatoms, while nonsiliceousalgae are restricted to regenerated production. On the con-trary, when nitrogen (N) and phosphorus (P) are dischargedin excess over silicon (Si) with respect to the requirementsof diatoms, these will be limited, and nondiatoms, oftenundesirable algal species, will develop instead [Billen andGarnier, 1997, 2007; Conley et al., 1993; Conley, 1999;Cugier et al., 2005; Humborg et al., 2000, 2008; Justić et al.,1995a, 1995b; Officer and Ryther, 1980; Turner andRabalais, 1994; Turner et al., 1998].[4] According to this view, an Indicator of Coastal
Eutrophication Potential (ICEP) was proposed [Billen andGarnier, 2007]. ICEP is calculated on the basis of riverineN, P and Si deliveries, allowing to determine the possibleproblems resulting from a new production of nonsiliceousalgae sustained by external inputs of N and/or P brought inexcess over silica, i.e., in limiting conditions for the diatomgrowth. Compared to N:P ratios which are often considered[e.g., Glibert et al., 2008], the ICEP adds information aboutthe role of Si in determining potential eutrophication im-pacts of changing element stoichiometry.[5] The aim of this paper is to compare the ICEP values on
the basis of the Global NEWS data [Seitzinger et al., 2010]
1UMR 7619 Sisyphe, UPMC, CNRS, Paris, France.2Netherlands Environmental Assessment Agency, Bilthoven,
Netherlands.3Earth System Science and Climate Change Group, Wageningen
University Research Centre, Wageningen, Netherlands.
Copyright 2010 by the American Geophysical Union.0886‐6236/10/2009GB003583
GLOBAL BIOGEOCHEMICAL CYCLES, VOL. 24, GB0A05, doi:10.1029/2009GB003583, 2010
GB0A05 1 of 12

and a data set of N, P, Si fluxes from the GEMS‐GLORIdatabase [Meybeck and Ragu, 1995, 1997] combined withother data from the literature. This data set is used to illustratethe ICEP values for the period from 1970–1990. Furthermore,the NEWS DSi model of global DSi export by world rivers[Beusen et al., 2009], together with the Global‐NEWSmodels of P and N [Seitzinger et al., 2010], allows com-puting the ICEP for most of the drainage basins of theplanet. Finally, we used the Global NEWS implementationof the Millennium Ecosystem Assessment scenarios [Alcamoet al., 2006] to assess potential changes in eutrophication incoastal marine ecosystems based on ICEP for the period2000 to 2050.
2. Observations of River Export of Nitrogen,Phosphorus, and Silica
[6] The documented DSi data were taken from theGEMS‐GLORI database and literature, together with dis-solved inorganic nitrogen (DIN) and total phosphorus (TP).DIN is calculated as the sum of dissolved nitrate andammonium (DIN). When nitrate only is available, the rela-tionship found between DIN and nitrate was used to cal-culate DIN (Figure 1a). Further, as the few total nitrogen(TN) data available (18) did not show any difference andtrend compared with DIN (not shown), DIN has been takenas a good estimate of TN for calculating the ICEP, as we didin the initial paper by Billen and Garnier [2007]. Indeed,both organic and inorganic N forms are biologically availableto marine plankton [Seitzinger and Sanders, 1999; Wiegnerand Seitzinger, 2001]. Some studies showed that DONmight represent over 20% of TN, but this occurs at low TNonly [De Wit et al., 2005; Ludwig et al., 2010; P. Johnes,personal communication, 2009], so that DIN largely dom-inates in most N contaminated waters.
[7] Dissolved inorganic phosphorus (PO4) is the P form forwhich data are mostly available. A relationship has beenestablished between total phosphorus (TP) andPO4 (Figure 1b),which was used when TP data were missing. We considerhere that total phosphorus may be rapidly available asreported in several studies showing that phosphorus adsorbedonto particles is exchangeable [Conley et al., 1995; Némeryet al., 2005; Némery and Garnier, 2007].[8] According to Billen and Garnier [2007], we consider
dissolved silica (DSi) fluxes only for the calculation of theICEP; we ignore particulate amorphous silica (ASi) as onlyfew data exist in the rivers of the world. Yet, ASi may beimportant in the total bioavailable silica delivery [Conley,2002; Humborg et al., 2000, 2002, 2006; Garnier et al.,2002a; Sferratore et al., 2006] with a share in total Siriver global loads generally of the order of 10%–20%[Conley, 2002; Laruelle et al., 2009]. Hence, we have toaccept such an underestimation of total silica loads, andperhaps a slight overestimation of ICEP, if not compensatedby a possible underestimation of the nitrogen load based onDIN only (see above).[9] Our data set contains 189 observed data with both
DIN and DSi, and 132 with TP and DSi. The GEMS‐GLORI database includes data from rivers “still in a pristinestate” and other “impacted by human activities” and a varietyof rivers “affected at various stages of impacts, such asnutrient pollution, damming, salt pollution, land manage-ment, etc.” [Meybeck and Ragu, 1995, pp. 105–245]. Theadditional literature data include rivers from Asia [Zhang,1996; Liu et al., 2005; Le et al., 2005], South America[Edmond et al., 1981], Mediterranean rivers [El Boukhary,2005; Gago et al., 2005], temperate Europe [Marchetti etal., 1989; Wafar et al., 1989; Jaworski et al., 1992; Billenand Garnier, 1999; Garnier et al., 2002b; El Boukhary,2005; Humborg et al., 2006; Thieu et al., 2009], NorthAmerica [Turner and Rabalais, 1994; Justić et al., 1995a,
Figure 1. Relationship between (a) DIN and N‐NO3 and (b) TP and P‐PO4 for the data available in theGEMS‐GLORI database.
GARNIER ET AL.: N:P:SI EXPORT RATIOS FROM WORLD RIVERS GB0A05GB0A05
2 of 12
1995b] and the Arctic [Telang et al., 1991; Humborg et al.,2004]. All these rivers are in different stages of humaninterference both in terms of hydrology and nutrient loading.
3. ICEP: An Indicator for Coastal EutrophicationPotential of Rivers
[10] The indicator for coastal eutrophication potential(ICEP) represents the new production of nonsiliceous algalbiomass potentially sustained in the receiving coastal waterbody by either nitrogen or phosphorus delivered in excessover silica [Billen and Garnier, 2007]. ICEP is based on theRedfield molar C:N:P:Si ratios 106:16:1:20 [Redfield et al.,1963; Conley et al., 1989]. For the purpose of river to rivercomparison, it is scaled to the river watershed area, thusexpressed in kg C km−2 d−1. According to the nutrientconsidered, either N‐ICEP or P‐ICEP can be defined,following relationships (1) or (2), respectively:
N� ICEP ¼ ½NFlx=ð14� 16Þ � SiFlx=ð28� 20Þ� � 106� 12
ð1Þ
P� ICEP ¼ ½PFlx=31� SiFlx=ð28� 20Þ� � 106� 12 ð2Þ
where PFlx, NFlx, and SiFlx are the mean specific fluxesof total nitrogen, total phosphorus, and dissolved silica,respectively, delivered at the outlet of the river basin, ex-pressed in kg P km−2 d−1, kg N km−2 d−1, and kg Si km−2 d−1.[11] A negative value of the ICEP indicates that silica is
present in excess over the other nutrient and would thuscharacterize the absence of eutrophication problems. Positivevalues indicate an excess of either N or P over the require-ments for diatom growth, thus a condition for potentially
harmful nonsiliceous algal development. The ICEP representsthe potential impact of the riverine delivery to the coastalzone, and does not take into account the particular morpho-logical, climatic and hydrological conditions that locallydetermine the response of the marine algae in the receivingcoastal zone [cf. Rabouille et al., 2008; Nixon, 2009].[12] Depending on the N:P ratio of nutrient loading, either
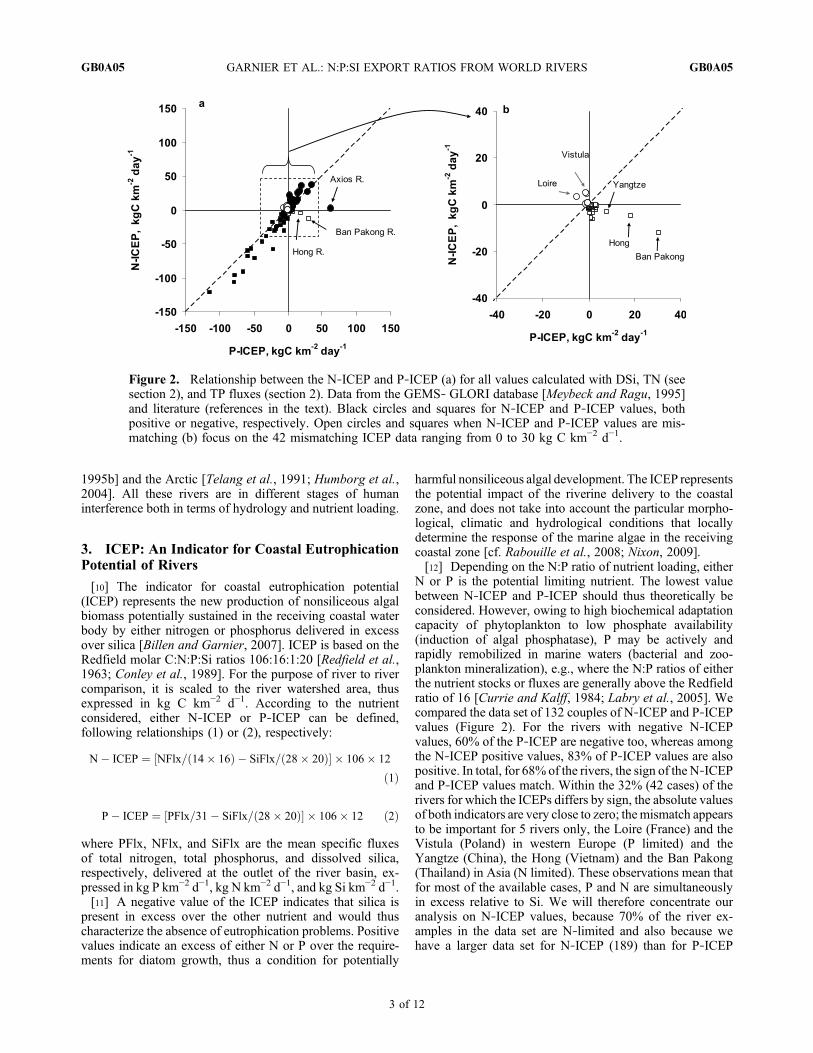
N or P is the potential limiting nutrient. The lowest valuebetween N‐ICEP and P‐ICEP should thus theoretically beconsidered. However, owing to high biochemical adaptationcapacity of phytoplankton to low phosphate availability(induction of algal phosphatase), P may be actively andrapidly remobilized in marine waters (bacterial and zoo-plankton mineralization), e.g., where the N:P ratios of eitherthe nutrient stocks or fluxes are generally above the Redfieldratio of 16 [Currie and Kalff, 1984; Labry et al., 2005]. Wecompared the data set of 132 couples of N‐ICEP and P‐ICEPvalues (Figure 2). For the rivers with negative N‐ICEPvalues, 60% of the P‐ICEP are negative too, whereas amongthe N‐ICEP positive values, 83% of P‐ICEP values are alsopositive. In total, for 68% of the rivers, the sign of the N‐ICEPand P‐ICEP values match. Within the 32% (42 cases) of therivers for which the ICEPs differs by sign, the absolute valuesof both indicators are very close to zero; themismatch appearsto be important for 5 rivers only, the Loire (France) and theVistula (Poland) in western Europe (P limited) and theYangtze (China), the Hong (Vietnam) and the Ban Pakong(Thailand) in Asia (N limited). These observations mean thatfor most of the available cases, P and N are simultaneouslyin excess relative to Si. We will therefore concentrate ouranalysis on N‐ICEP values, because 70% of the river ex-amples in the data set are N‐limited and also because wehave a larger data set for N‐ICEP (189) than for P‐ICEP
Figure 2. Relationship between the N‐ICEP and P‐ICEP (a) for all values calculated with DSi, TN (seesection 2), and TP fluxes (section 2). Data from the GEMS‐ GLORI database [Meybeck and Ragu, 1995]and literature (references in the text). Black circles and squares for N‐ICEP and P‐ICEP values, bothpositive or negative, respectively. Open circles and squares when N‐ICEP and P‐ICEP values are mis-matching (b) focus on the 42 mismatching ICEP data ranging from 0 to 30 kg C km−2 d−1.
GARNIER ET AL.: N:P:SI EXPORT RATIOS FROM WORLD RIVERS GB0A05GB0A05
3 of 12
(132). We recognize however, that both P‐ and N‐ICEPshould be considered to strengthen the ICEP approach, eventhough P may not systematically be limiting in marinewaters where the N:P ratios are lower than 16 due to its rapidrecycling.[13] On the basis of the measured data set, we see positive
N‐ICEP values for river basins draining to the Mediterra-
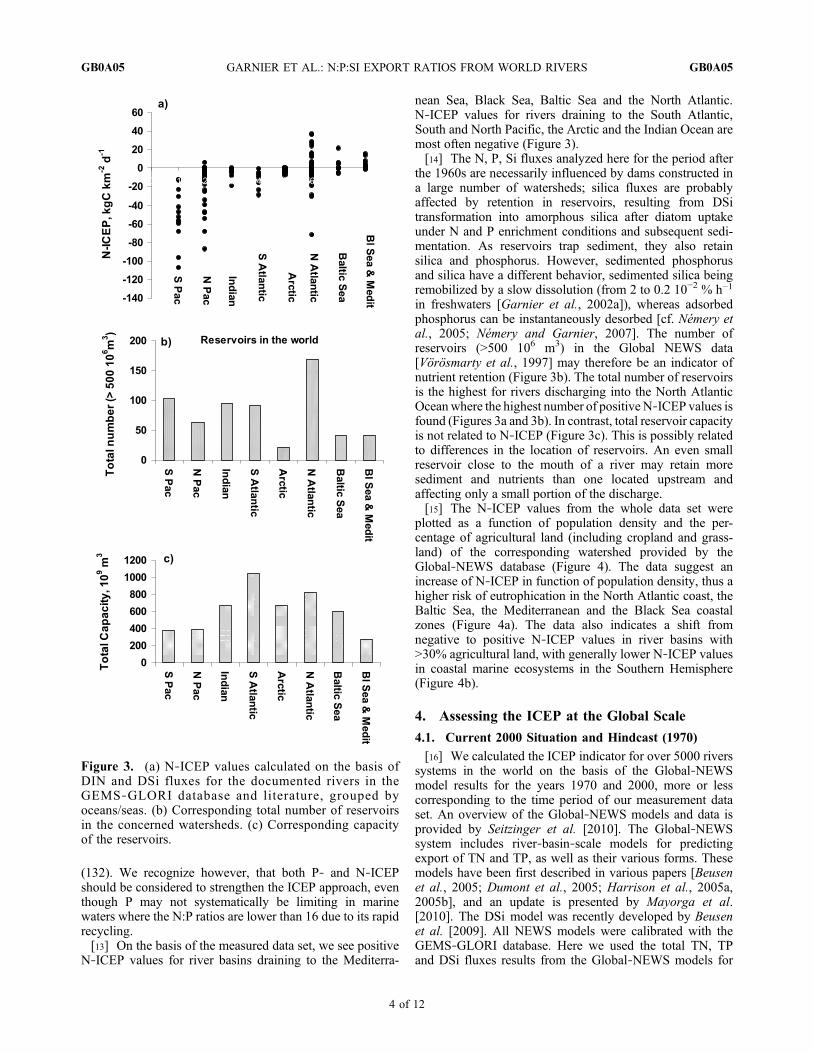
nean Sea, Black Sea, Baltic Sea and the North Atlantic.N‐ICEP values for rivers draining to the South Atlantic,South and North Pacific, the Arctic and the Indian Ocean aremost often negative (Figure 3).[14] The N, P, Si fluxes analyzed here for the period after
the 1960s are necessarily influenced by dams constructed ina large number of watersheds; silica fluxes are probablyaffected by retention in reservoirs, resulting from DSitransformation into amorphous silica after diatom uptakeunder N and P enrichment conditions and subsequent sedi-mentation. As reservoirs trap sediment, they also retainsilica and phosphorus. However, sedimented phosphorusand silica have a different behavior, sedimented silica beingremobilized by a slow dissolution (from 2 to 0.2 10−2 % h−1
in freshwaters [Garnier et al., 2002a]), whereas adsorbedphosphorus can be instantaneously desorbed [cf. Némery etal., 2005; Némery and Garnier, 2007]. The number ofreservoirs (>500 106 m3) in the Global NEWS data[Vörösmarty et al., 1997] may therefore be an indicator ofnutrient retention (Figure 3b). The total number of reservoirsis the highest for rivers discharging into the North AtlanticOceanwhere the highest number of positive N‐ICEP values isfound (Figures 3a and 3b). In contrast, total reservoir capacityis not related to N‐ICEP (Figure 3c). This is possibly relatedto differences in the location of reservoirs. An even smallreservoir close to the mouth of a river may retain moresediment and nutrients than one located upstream andaffecting only a small portion of the discharge.[15] The N‐ICEP values from the whole data set were
plotted as a function of population density and the per-centage of agricultural land (including cropland and grass-land) of the corresponding watershed provided by theGlobal‐NEWS database (Figure 4). The data suggest anincrease of N‐ICEP in function of population density, thus ahigher risk of eutrophication in the North Atlantic coast, theBaltic Sea, the Mediterranean and the Black Sea coastalzones (Figure 4a). The data also indicates a shift fromnegative to positive N‐ICEP values in river basins with>30% agricultural land, with generally lower N‐ICEP valuesin coastal marine ecosystems in the Southern Hemisphere(Figure 4b).
4. Assessing the ICEP at the Global Scale
4.1. Current 2000 Situation and Hindcast (1970)
[16] We calculated the ICEP indicator for over 5000 riverssystems in the world on the basis of the Global‐NEWSmodel results for the years 1970 and 2000, more or lesscorresponding to the time period of our measurement dataset. An overview of the Global‐NEWS models and data isprovided by Seitzinger et al. [2010]. The Global‐NEWSsystem includes river‐basin‐scale models for predictingexport of TN and TP, as well as their various forms. Thesemodels have been first described in various papers [Beusenet al., 2005; Dumont et al., 2005; Harrison et al., 2005a,2005b], and an update is presented by Mayorga et al.[2010]. The DSi model was recently developed by Beusenet al. [2009]. All NEWS models were calibrated with theGEMS‐GLORI database. Here we used the total TN, TPand DSi fluxes results from the Global‐NEWS models for
Figure 3. (a) N‐ICEP values calculated on the basis ofDIN and DSi fluxes for the documented rivers in theGEMS‐GLORI database and literature, grouped byoceans/seas. (b) Corresponding total number of reservoirsin the concerned watersheds. (c) Corresponding capacityof the reservoirs.
GARNIER ET AL.: N:P:SI EXPORT RATIOS FROM WORLD RIVERS GB0A05GB0A05
4 of 12

all individual watersheds of the world [Fekete et al., 2002]and calculated their N‐ICEP. The NEWS‐DSi model[Beusen et al., 2009] represents natural conditions for thepredam situation; DSi retention was calculated with thesediment trapping efficiency for all global rivers [Fekete etal., 2002, 2010] proposed by Vörösmarty et al. [2003]. Thisis based on the assumption that sedimentation rates of sus-pended solids and diatom frustules are similar.[17] The calculated N‐ICEP values from Global NEWS
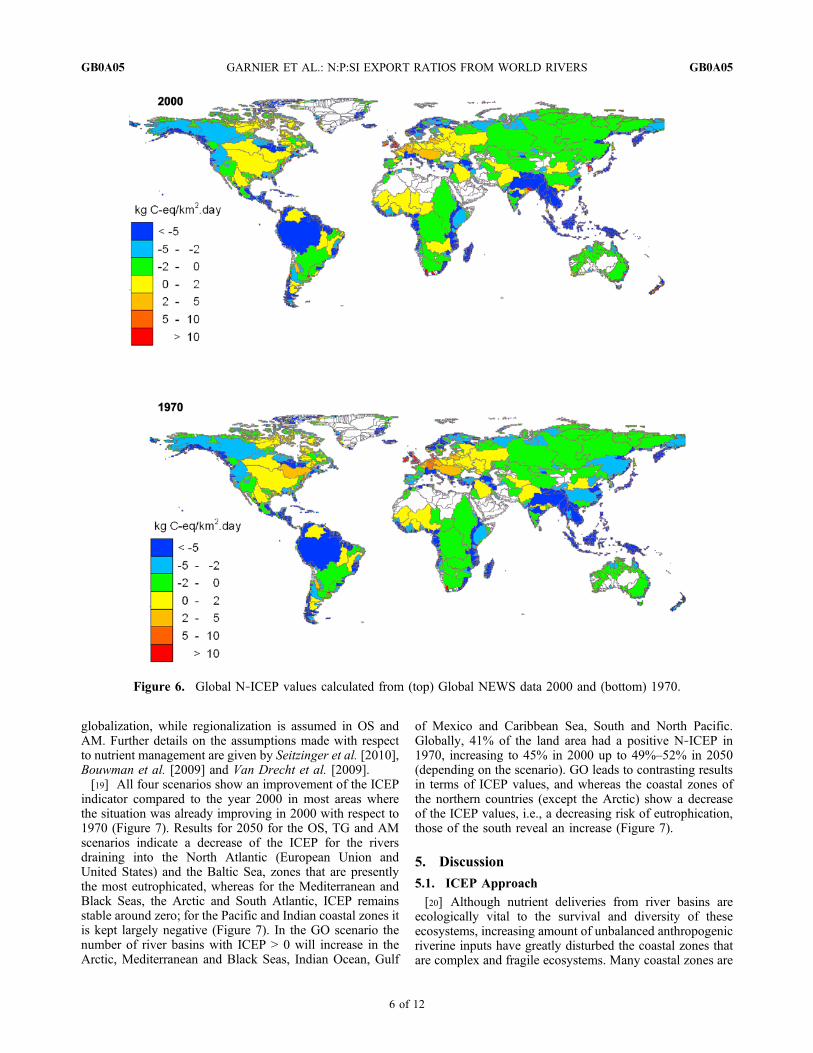
data vs. the ones obtained from the observations are sig-nificantly correlated (R2 = 0.4, n = 189), with a lower slope(0.34) compared to the 1:1 line (Figure 5). However, theglobal‐scale model matches the observations in terms ofsign in about 70% of the cases (i.e., calculated and observedN‐ICEP being both negative or both positive) (Figure 5).Most mismatching data correspond to a potential of eutro-phication due to silica limitation (positive calculatedN‐ICEP)when measured silica would not be limited (negativeobserved N‐ICEP). The calculated ICEP can be a warningindicator in these cases. The calculated N‐ICEP for 1970 and2000 shows the changes during the last 30 years (Figure 6). Inthe Northern Hemisphere, e.g., the North Atlantic and NorthSea, the Baltic Sea and the Black Sea in Central Europe, the
Hudson in Canada and the Gulf of Mexico in the UnitedStates, have high N‐ICEP values. Although the SouthernHemisphere generally appears to be less sensitive to eutro-phication, some hot spots can be identified for South Pacific,South Atlantic and Indian Oceans (Figure 6). The compar-ison shows that eutrophication risk has decreased in Europe,and eastern Canada, and increased in some other places inthe period 1970–2000 (e.g., Japanese and Chinese seas,Indian and South Africa coasts). This increase of N‐ICEPvalues is related to rapidly increasing agricultural productionand fast urbanization and development of sewerage systemswithout sufficient treatment of sewage water. In contrast, inindustrialized countries in Europe and the United States,N‐ICEP values are constant or show a decrease as a resultof major efforts to remove N and P in wastewater treatment,and increases in the efficiency of agricultural N and P use[Bouwman et al., 2009].
4.2. Millenium Ecosystems Assessment Scenarios
[18] Apart from the current and hindcast analysis of theICEP values, the Global‐NEWS implementation of theMillenium Ecosystem Assessment (MEA) scenarios hasbeen used to calculate the possible future nutrient dischargeof N, P and Si by world rivers to coastal marine ecosystems.Although the MEA scenario results are reported for 2030and 2050, we limit here our analysis to the data for 2050.The four MEA scenarios differ in terms of management ofthe environment and the degree and scale of connectednessamong and within institutions across country borders[Alcamo et al., 2006]. Technogarden (TG) and AdaptingMosaic (AM) were developed assuming proactive approachto environmental management, while Order from Strength(OS) and Global Orchestration (GO) assume reactive envi-ronmental management. GO and TG reflect trends toward
Figure 4. Relationships between the N‐ICEP values iden-tified by the adjacent oceans/seas and (a) the populationdensity (Pop. Density) and (b) the percentage of agriculturalarea in the corresponding watershed.
Figure 5. Relationship between observed and calculatedN‐ICEP for the year 2000. Black circles and squares for cal-culated and observed N‐ICEP values both positive or nega-tive, respectively. Open circles and squares when calculatedand observed N‐ICEP values are mismatching.
GARNIER ET AL.: N:P:SI EXPORT RATIOS FROM WORLD RIVERS GB0A05GB0A05
5 of 12
globalization, while regionalization is assumed in OS andAM. Further details on the assumptions made with respectto nutrient management are given by Seitzinger et al. [2010],Bouwman et al. [2009] and Van Drecht et al. [2009].[19] All four scenarios show an improvement of the ICEP
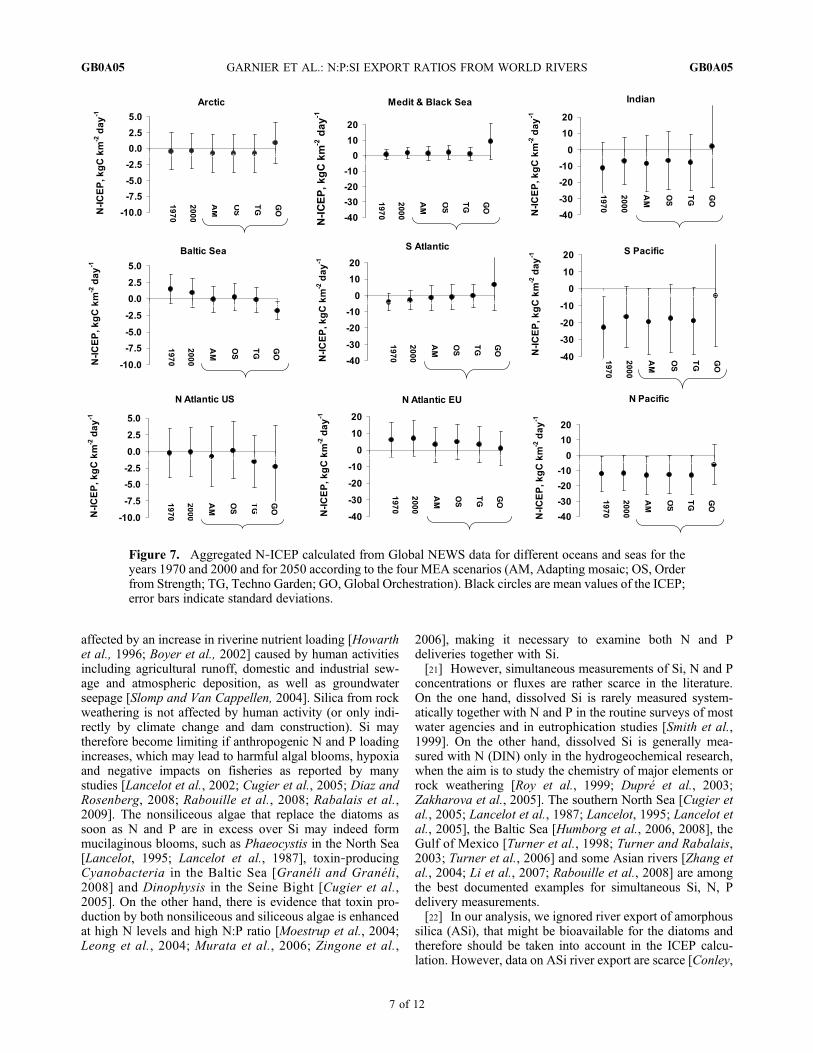
indicator compared to the year 2000 in most areas wherethe situation was already improving in 2000 with respect to1970 (Figure 7). Results for 2050 for the OS, TG and AMscenarios indicate a decrease of the ICEP for the riversdraining into the North Atlantic (European Union andUnited States) and the Baltic Sea, zones that are presentlythe most eutrophicated, whereas for the Mediterranean andBlack Seas, the Arctic and South Atlantic, ICEP remainsstable around zero; for the Pacific and Indian coastal zones itis kept largely negative (Figure 7). In the GO scenario thenumber of river basins with ICEP > 0 will increase in theArctic, Mediterranean and Black Seas, Indian Ocean, Gulf
of Mexico and Caribbean Sea, South and North Pacific.Globally, 41% of the land area had a positive N‐ICEP in1970, increasing to 45% in 2000 up to 49%–52% in 2050(depending on the scenario). GO leads to contrasting resultsin terms of ICEP values, and whereas the coastal zones ofthe northern countries (except the Arctic) show a decreaseof the ICEP values, i.e., a decreasing risk of eutrophication,those of the south reveal an increase (Figure 7).
5. Discussion
5.1. ICEP Approach
[20] Although nutrient deliveries from river basins areecologically vital to the survival and diversity of theseecosystems, increasing amount of unbalanced anthropogenicriverine inputs have greatly disturbed the coastal zones thatare complex and fragile ecosystems. Many coastal zones are
Figure 6. Global N‐ICEP values calculated from (top) Global NEWS data 2000 and (bottom) 1970.
GARNIER ET AL.: N:P:SI EXPORT RATIOS FROM WORLD RIVERS GB0A05GB0A05
6 of 12
affected by an increase in riverine nutrient loading [Howarthet al., 1996; Boyer et al., 2002] caused by human activitiesincluding agricultural runoff, domestic and industrial sew-age and atmospheric deposition, as well as groundwaterseepage [Slomp and Van Cappellen, 2004]. Silica from rockweathering is not affected by human activity (or only indi-rectly by climate change and dam construction). Si maytherefore become limiting if anthropogenic N and P loadingincreases, which may lead to harmful algal blooms, hypoxiaand negative impacts on fisheries as reported by manystudies [Lancelot et al., 2002; Cugier et al., 2005; Diaz andRosenberg, 2008; Rabouille et al., 2008; Rabalais et al.,2009]. The nonsiliceous algae that replace the diatoms assoon as N and P are in excess over Si may indeed formmucilaginous blooms, such as Phaeocystis in the North Sea[Lancelot, 1995; Lancelot et al., 1987], toxin‐producingCyanobacteria in the Baltic Sea [Granéli and Granéli,2008] and Dinophysis in the Seine Bight [Cugier et al.,2005]. On the other hand, there is evidence that toxin pro-duction by both nonsiliceous and siliceous algae is enhancedat high N levels and high N:P ratio [Moestrup et al., 2004;Leong et al., 2004; Murata et al., 2006; Zingone et al.,
2006], making it necessary to examine both N and Pdeliveries together with Si.[21] However, simultaneous measurements of Si, N and P
concentrations or fluxes are rather scarce in the literature.On the one hand, dissolved Si is rarely measured system-atically together with N and P in the routine surveys of mostwater agencies and in eutrophication studies [Smith et al.,1999]. On the other hand, dissolved Si is generally mea-sured with N (DIN) only in the hydrogeochemical research,when the aim is to study the chemistry of major elements orrock weathering [Roy et al., 1999; Dupré et al., 2003;Zakharova et al., 2005]. The southern North Sea [Cugier etal., 2005; Lancelot et al., 1987; Lancelot, 1995; Lancelot etal., 2005], the Baltic Sea [Humborg et al., 2006, 2008], theGulf of Mexico [Turner et al., 1998; Turner and Rabalais,2003; Turner et al., 2006] and some Asian rivers [Zhang etal., 2004; Li et al., 2007; Rabouille et al., 2008] are amongthe best documented examples for simultaneous Si, N, Pdelivery measurements.[22] In our analysis, we ignored river export of amorphous
silica (ASi), that might be bioavailable for the diatoms andtherefore should be taken into account in the ICEP calcu-lation. However, data on ASi river export are scarce [Conley,
Figure 7. Aggregated N‐ICEP calculated from Global NEWS data for different oceans and seas for theyears 1970 and 2000 and for 2050 according to the four MEA scenarios (AM, Adapting mosaic; OS, Orderfrom Strength; TG, Techno Garden; GO, Global Orchestration). Black circles are mean values of the ICEP;error bars indicate standard deviations.
GARNIER ET AL.: N:P:SI EXPORT RATIOS FROM WORLD RIVERS GB0A05GB0A05
7 of 12
2002;Humborg et al., 2006;Garnier et al., 2002a; Sferratoreet al., 2006]. This may cause an underestimation of the totalSi flux and thus an overestimation of ICEP. In particular,because ASi dissolution has been shown to increase when itpasses the salinity gradient of the estuarine zones, ASi canbe of major importance in coastal marine ecosystems[Ragueneau et al., 2002; Roubeix and Lancelot, 2008]. Thisindicates the need for data on ASi fluxes for a betterunderstanding and forecasting of eutrophication. Anotherdrawback of the ICEP approach is that it is based on theRedfield ratio concept to assess N or P limitation. This maybe a problem where, for example, phosphorus may be low,but made rapidly available for the algae by microbiologicalprocesses [Currie and Kalff, 1984; Labry et al., 2005].[23] As a whole, a strong advantage of the ICEP approach
is to provide a functional and warning indicator, as opposedto other indices of ecological status proposed based on theworks conducted in the scope of the European WaterFramework Directive [European Commission, 2000]. Inaddition, the ICEP can be calculated either from observations,at the scale of the year or the season, or from modeling.Furthermore, ICEP values calculated with a validated modelallow for reconstructing the ICEP trajectories for the past[Billen et al., 2007] or in projected futures based on sce-narios, like those of the MEA discussed in this paper. TheICEP concept should help the researchers and the managers,not to only consider P and N, with a propensity to reduce theP:N ratio in order to obviate eutrophication (see the debateinitiated by Conley et al. [2009]), but rather to consider theSi:P and Si:N ratios and imagine scenarios that tend toconverge toward the physiological requirement of algae interms of N:P:Si.
5.2. Features of ICEP for Documented Rivers
[24] The number of rivers where the ICEP could be cal-culated was limited, because in many cases N, P and Si are notmeasured simultaneously. In the data set compiled here, only189 can be used in this N‐ICEP framework (132 for P‐ICEP).It is interesting to mention that the deviations between the twovalues of the ICEP are larger around the ICEP thresholdsvalue of zero, e.g., when silica is close to a limitation withregard to N and P.[25] The N‐ICEP grouping by sea basin confirms some
well‐known coastal zone behavior with respect to eutrophi-cation, such as the North Atlantic Ocean, both on Europeanand American sides. Whereas the North Sea is well knownfor its Phaeocystis developments [Lancelot et al., 1987;Lancelot, 1995] and itsDinophysis blooms in the Seine Bight[Cugier et al., 2005], eutrophication of the Baltic has beenoften discussed for its Cyanobacteria blooms [Elmgren,1989; Vahtera et al., 2007; Granéli and Granéli, 2008].Most rivers connected to these coastal zones have positiveICEP values and thus eutrophication risk (Seine, Scheldt,Rhine for the North Sea; Oder, Elbe, Vistula, Daugava,Neva for the Baltic Sea). Eutrophication manifestations havealso been reported in the western Black Sea [Lancelot et al.,2002], and in some part of the Mediterranean, as theAdriatic [McQuatters‐Gollop et al., 2009] where the largelypositive ICEP suggests a high eutrophication risk (Figure 5).Within the data set of North Atlantic on the U.S. side, the
positive ICEP of the Mississippi is consistent with the severeeutrophication state, leading to trophic chain disturbance asa result of excess in N and P over silica fluxes delivered bythe Mississippi [Turner et al., 1998; Turner and Rabalais,2003; Turner et al., 2006].[26] Most rivers draining to the North Pacific have a
negative ICEP, such as the Huanghe (Yellow River), while anumber of smaller rivers such the Lunanhe and the FuchunJian rivers show positive ICEP values. Recently, however,the Huanghe, discharging into the Bohai Sea, has experi-enced a dramatic reduction of freshwater and sedimentdischarge and export of N, P and Si since the 1980s [Fanand Huang, 2008]. According to these authors, changes inriver water quality impacted negatively primary productivityso that the number of species, the values of density andbiomass of fish community dropped dramatically.[27] Hot spots of eutrophication may occur in areas with
high population density and large coverage of agriculturalarea. The tropics and subtropics seem to have a lower risk toeutrophication based on their negative ICEP values. Thedistinction between the tropics and subtropics and thenorthern oceans can be explained from the lithology, soils,hydrology and temperature, all factors enhancing rockweathering and leading to elevated silica concentrations andfluxes [Conley, 2002; Garnier et al., 2002a; Humborg et al.,2004, 2006; Garnier et al., 2006; Sferratore et al., 2006;Beusen et al., 2009].
5.3. Role of Reservoirs in Silica Trapping
[28] During the 20th century, according to the Interna-tional Rivers Network an estimated $2 trillion was spent fordams’ construction [International Rivers Network, 2003].Analysis of the Global‐NEWS database of the largereservoirs (>500 106 m3) [Vörösmarty et al., 1997] showsthat their construction increased significantly in the 1950s(a total capacity of 900 109 m3 impounded between 1940and 1960), accelerated between 1960 and 1980 with anadditional installed capacity of 2500 109 m3, then leveledoff during the 1990s (700 109 m3 new capacity impounded).[29] Dams are known to be a major factor of silica retention
through (1) sedimentation of suspended solids [Vörösmartyet al., 1997, 2003; Chen et al., 2001, 2008] including par-ticulate silica, amorphous and lithogenic [Chen et al., 2001;Li et al., 2007]; (2) uptake of DSi by diatoms when resi-dence time is compatible with their growth rates, and sub-sequent sedimentation of ASi incorporated in their frustules[Humborg et al., 1997]; and (3) reduction of DSi fluxeswhen rivers are regulated by the effect of hydrologicalalterations affecting ground‐surface water interactions[Humborg et al., 2002, 2006, 2008]. Increased loading ofN and P may also lead to increasing production, and thussedimentation, of diatoms in reservoirs [Conley, 2002].[30] A budget for small reservoirs with a residence time of
2–3 months revealed a DSi retention of 30% [Garnier et al.,1999], whereas at the scale of the Baltic, the DSi fluxeswould have decreased for 30%–40% [Humborg et al., 2008],and up to 22% in the Yangtze River [Li et al., 2007] since the1960s as a result of increased damming.[31] The direct influence of the reservoirs cannot be shown
with the data presented here. However, there is evidence of a
GARNIER ET AL.: N:P:SI EXPORT RATIOS FROM WORLD RIVERS GB0A05GB0A05
8 of 12
decrease of Si following damming, and associated eutrophi-cation problems [Cociasu et al., 1996; Humborg et al., 2008,and references therein]. Data on DSi concentration and dis-charge are scarce, both for water entering and leaving thereservoirs. Further research is needed for better evaluatingthe role of reservoirs in the global silica budget. Also, theimpact on Si river export and eutrophication should beconsidered when planning construction of water diversionfor agricultural, domestic and industrial use, as well as damconstruction for hydroelectric power development.
5.4. Global Modeling of Past, Current,and Future ICEP
[32] The N‐ICEP was selected for analyzing the modelresults on the 1970 and 2000 as well as the scenarios of theMillennium Ecosystem Assessment (MEA). The changes inICEP values for the scenarios depend on many differentchanges in society and in the environment. For example,DSi export may increase as a result of increasing precipi-tation, and decrease as a result of dam construction. The netresult may be no change. River export of N and P is influ-enced by the volume of agricultural production and the effi-ciency of nutrient use. River N and P export is alsodetermined by the increase in sewage effluent as a result ofincreasing numbers of people with a sewerage connection andthe degree of sewage water treatment. In general, in indus-trialized countries as well as in China and India, there is arapid increase in nutrient use efficiency in agriculture; thisincrease is rapid in Technogarden and Global Orchestration,and less so in Adapting Mosaic and Order from Strength.However, in some countries (e.g., China and India) theincreasing efficiency may not be sufficient to prevent anabsolute increase of nutrient transport to rivers, because theagricultural production volume increases more rapidly.Adapting Mosaic is a special case. In this scenario there isrecycling of human excreta and better integration of animalmanure in agricultural systems, leading to reduced fertilizeruse and high nutrient use efficiency. In most developingcountries, there is a rapid increase in fertilizer use. Thisdevelopment is most pronounced in Technogarden andGlobal Orchestration. Globally, the treatment of sewagewater is much more advanced in Technogarden and GlobalOrchestration than in Adapting Mosaic and Order fromStrength. The resulting transport of nutrients through riversystems to coastal seas may thus be a constant DSi anddecreasing N and P in most industrialized countries. Indeveloping countries the scenarios generally indicate a nearlyconstant DSi export, and increasing N and P from agricultureand sewerage systems. The magnitude of these changesdepends on the scenario. More details on the developmentsin agriculture can be found in the work of Bouwman et al.[2009] (agriculture) and Van Drecht et al. [2009] (urbanwastewater).[33] The N‐ICEP analyzed by oceans/sea shows a same
trend for observed and modeled values during the period1970–2000 (see Figures 3 and 7). The calculated ICEP fromthe Global‐NEWS models indicates an improvement in theBaltic, and no change in the North Pacific. The ICEPmarkedly increased in northern Europe, the MediterraneanSea and Black Sea. The 1970s is typically the critical period
for eutrophication, although particularly well documentedfor lakes (see the pioneer work by Vollenweider [1968]).Between 1970 and 2000, as shown by both observations andmodeled scenarios, emissions from point sources markedlydecreased in Europe as a result of advanced wastewatertreatment and the banning of P‐based detergents in laundrymachines [Billen et al., 1999; Garnier et al., 2005; VanDrecht et al., 2009]. However, the diffuse sources (espe-cially nitrate, but also phosphorus) markedly increased due tointensification and modernization of the agriculture in theindustrialized countries of North America and Europe, so thatthe excess of N (and P) over silica increased, especially whenrivers are controlled by dams with high residence time.[34] The demand for nutrients in agriculture will increase
in all scenarios, associated to the future population growth[Bouwman et al., 2005, 2009]. However, in the AM sce-nario, N and P use in agriculture is more efficient [Bouwmanet al., 2009] so that N leakage can be reduced. Turning tothe wastewater flows, we see increasing population, urban-ization, sewerage connection, per capita N and P emissionsin all scenarios. At the same time, wastewater treatment islagging, particularly in developing countries. Among thefour MEA scenarios, the AM is one where societies developa strong proactive approach to the management of ecosys-tems based on simple technologies: animal manure is betterintegrated in agricultural production systems, and human Nand P is recycled to substitute N and P fertilizers [Bouwmanet al., 2009]. As a result, river N and P export appears to beslightly reduced by the year 2050 compared to the year2000. In the GO scenario, TN export increases by 10% inthe period 2000–2050, while river P export shows only asmall change. Hence, river TN is 12% lower in AM than inGO, and TP export is very similar in GO and AM. The smalldifference for P is related to the wastewater P flows;wastewater treatment is less advanced in AM than in GO.The reduction of agricultural P flows is comparable to theincrease in P flows from households.
6. Concluding Remarks
[35] Humans have been occupying and using the largedrainage network and coasts for long and their impact hasbeen severe in some areas of the world and will increase inthe future in some other areas [Nixon, 1995]. Because of thenegative consequences of this impact, many coastal eco-systems have lost their functionality and their capacity todeliver ecosystem services. The services offered by coastalecosystems have been estimated to represent about 1/3 ofthe total economic value of all services offered by naturalsystems in the world [Costanza et al., 1997; Martínez et al.,2007].[36] The MEA scenario analysis shows that it will be
difficult to reduce the human impact, and consequently theriver export of N and P at the coastal marine systems. Inaddition, increasing the number of reservoirs in the world’sriver systems will decrease Si river export globally as aresult of retention and eutrophication. These simultaneouschanges of N:P:Si will results in an increasing ICEP value,indicating an increasing risk that severe problems associatedwith eutrophication will occur in many places. For the future
GARNIER ET AL.: N:P:SI EXPORT RATIOS FROM WORLD RIVERS GB0A05GB0A05
9 of 12

decades, the proactive scenarios which involves more sus-tainable agricultural practices (e.g., AM) is the one whichminimize globally the risks of eutrophication in the regionsof the southern continents not yet facing eutrophicationproblems, whereas GO scenarios lead to better improve thesituation in the industrialized countries of the north, probablybecause rehabilitation efforts have already been undertakenthere, successfully.
[37] Acknowledgments. This study is part of the Global NEWSproject, which has been cofunded by UNESCO‐IOC and is a project underLOICZ. We are particularly indebted to Sybil Seitzinger for starting andcoordinating the Global NEWS network. The IP‐Thresholds EU‐programmehas been a driver for producing threshold indicators, from which the ICEP,discussed here at a global scale, has emerged. The Nine scientific network(ESF), Timothy (BELSPO), andAware (EU) projects also offered a frameworkfor a deeper understanding of how the changes in the nitrogen cycle haveexacerbated a number of environmental issues, including eutrophication.
References
Alcamo, J., D. Van Vuuren, and W. Cramer (2006), Changes in ecosystemservices and their drivers across the scenarios, in Ecosystems and HumanWell‐Being: Scenarios, edited by S. R. Carpenter et al., pp. 279–354,Island Press, Washington, D. C.
Beusen, A. H. W., A. L. M. Dekkers, A. F. Bouwman, W. Ludwig,and J. Harrison (2005), Estimation of global river transport of sedi-ments and associated particulate C, N, and P, Global Biogeochem.Cycles, 19, GB4S05, doi:10.1029/2005GB002453.
Beusen, A. H. W., A. F. Bouwman, H. H. Dürr, A. L. M. Dekkers,and J. Hartmann (2009), Global patterns of dissolved silica export to thecoastal zone: Results from a spatially explicit global model, GlobalBiogeochem. Cycles, 23, GB0A02, doi:10.1029/2008GB003281.
Billen, G., and J. Garnier (1997), The Phison River Plume: coastal eutro-phication in response to changes in land use and water management inthe watershed, Aquat. Microb. Ecol., 13, 3–17, doi:10.3354/ame013003.
Billen, G., and J. Garnier (1999), Nitrogen transfers through the Seinedrainage network: A budget based on the application of the Riverstrahlermodel, Hydrobiologia, 410, 139–150, doi:10.1023/A:1003838116725.
Billen, G., and J. Garnier (2007), River basin nutrient delivery to the coastalsea: assessing its potential to sustain new production of non‐siliceousalgae, Mar. Chem., 106, 148–160, doi:10.1016/j.marchem.2006.12.017.
Billen, G., J. Garnier, C. Deligne, and C. Billen (1999), Estimates of early‐industrial inputs of nutrients to river systems: Implication for coastaleutrophication, Sci. Total Environ., 243/244, 43–52.
Billen, G., J. Garnier, J. Némery, M. Sebilo, A. Sferratore, S. Barles,P. Benoit, and M. Benoit (2007), Nutrient transfers through the Seine rivercontinuum: mechanisms and long term trends, Sci. Total Environ., 375,80–97, doi:10.1016/j.scitotenv.2006.12.005.
Bouwman, A. F., G. Van Drecht, J. M. Knoop, A. H. W. Beusen, andC. R. Meinardi (2005), Exploring changes in river nitrogen exportthe world’s oceans. Global Biogeochem. Cycles, 19, GB1002,doi:10.1029/2004GB002314.
Bouwman, A. F., A. H. W. Beusen, and G. Billen (2009), Human alter-ation of the global nitrogen and phosphorus soil balances for the period1970–2050, Global Biogeochem. Cycles, 23, GB0A04, doi:10.1029/2009GB003576.
Boyer, E. W., C. L. Goodale, N. A. Jaworski, and R. W. Howarth (2002),Anthropogenic nitrogen sources and relationships to riverine nitrogenexport in the northeastern USA, Biogeochemistry, 57–58, 137–169,doi:10.1023/A:1015709302073.
Chen, X., Y. Yan, R. Fu, R. Dou, and E. Zhang (2008), Sediment transportfrom the Yangtze River, China, into the sea over the post‐Three GorgeDam Period: A discussion, Quat. Int., 186, 55–64, doi:10.1016/j.quaint.2007.10.003.
Chen, Z., J. Li, H. Shen, and W. Zhanghua (2001), Yangtze River of China:Historical analysis of discharge variability and sediment flux, Geomor-phology, 41, 77–91, doi:10.1016/S0169-555X(01)00106-4.
Cociasu, A., L. Dorogan, C. Humborg, and L. Popa (1996), Long‐termecological changes in Romanian coastal waters of the Black Sea,Mar. Pollut. Bull., 32, 32–38, doi:10.1016/0025-326X(95)00106-W.
Conley, D. J. (1999), Biogeochemical nutrient cycles and nutrient manage-ment s t ra tegies , Hydrobiologia , 410 , 87–96, doi :10.1023/A:1003784504005.
Conley, D. J. (2002), Terrestrial ecosystems and the global biogeochemicalsilica cycle, Global Biogeochem. Cycles, 16(4), 1121, doi:10.1029/2002GB001894.
Conley, D. J., S. S. Kilham, and E. C. Theriot (1989), Differences in sil-ica content between marine and freshwater diatoms, Limnol. Oceanogr.,34, 205–213.
Conley, D. J., C. L. Schelske, and E. F. Stoermer (1993), Modification ofthe biogeochemical cycle of silica with eutrophication, Mar. Ecol. Prog.Ser., 101, 179–192, doi:10.3354/meps101179.
Conley, D. J., W. M. Smith, J. C. Corwell, and T. R. Fisher (1995), Transfor-mation of particle‐bound phosphorus at the land‐sea interfaces, EstuarineCoastal Shelf Sci., 40, 161–176, doi:10.1016/S0272-7714(05)80003-4.
Conley, D. J., J. Cartensen, G. Aertebjerg, P. B. Chritensen, T. Dalsgaard,J. L. S. Hansen, and A. B. Josefson (2007), Long‐term changes andimpacts of hypoxia in Danish coastal waters, Ecol. Appl., 17(5),S165–S184, doi:10.1890/05-0766.1.
Conley, D. J., H. W. Paerl, R. W. Howarth, D. F. Boesch, S. P. Seitzinger,K. E. Havens, C. Lancelot, and G. E. Likens (2009), Controlling eutro-phication: Nitrogen and phosphorus, Science, 323, 1014–1015,doi:10.1126/science.1167755.
Costanza, R., et al. (1997), The value of the world’s ecosystem services andnatural capital, Nature, 387, 253–260, doi:10.1038/387253a0.
Cugier, P., G. Billen, J. F. Guillaud, J. Garnier, and A. Ménesguen (2005),Modelling the eutrophication of the Seine Bight (France) under historical,present and future riverine nutrient loading, J. Hydrol., 304, 381–396,doi:10.1016/j.jhydrol.2004.07.049.
Currie, D. J., and J. Kalff (1984), The relative importance of bacterioplanktonand phytoplankton in phosphorus uptake in freshwater, Limnol. Ocea-nogr., 29, 311–321.
De Wit, R., et al. (2005), Relationship between land‐use in the agro‐forestrysystem of les Landes, nitrogen loading to and risk ofmacro‐algal bloomingin the Bassin d’Arcachon coastal lagoon (SW France), Estuarine CoastalShelf Sci., 62, 453–465, doi:10.1016/j.ecss.2004.09.007.
Diaz, R. J. (2001), Overview of hypoxia around the world, J. Environ.Qual., 30, 275–281.
Diaz, R. J., and R. Rosenberg (2008), Spreading dead zones and conse-quences for marine ecosystems, Science, 321(5891), 926–929,ISSN:0036‐8075, doi:10.1126/science.1156401.
Dumont, E., J. A. Harrison, C. Kroeze, E. J. Baker, and S. P. Seitzinger(2005), Global distribution and sources of dissolved inorganic nitrogenexport to the coastal zone: results from a spatially explicit, global model,Global Biogeochem. Cycles, 19, GB4S02, doi:10.1029/2005GB002488.
Dupré, B., C. Dessert, P. Oliva, Y. Goddéris, J. Viers, L. Francois, R. Millot,and J. Gaillardet (2003), Rivers, chemical weathering and Earth’s climate,C. R. Geosci., 335, 1141–1160, doi:10.1016/j.crte.2003.09.015.
Edmond, J. M., E. A. Boyle, B. Grant, and R. F. Stallard (1981), Chemicalmass balance in the Amazon plume: 1. The nutrients, Deep Sea Res., 28,1339–1374, doi:10.1016/0198-0149(81)90038-8.
El Boukhary, M. M. S. (2005), Impact des activités humaines sur les cyclesbiogéochimiques en mer Méditerranée, Ph.D. diss., 204 pp., Biogéochim.et Chim. Mar., Univ. Paris 6, Paris.
Elmgren, R. (1989), Man’s impact on the ecosystem of the Baltic Sea:Energy flows today and at the turn of the century, Ambio, 18, 326–332.
European Commission (2000), Water framework directive, Dir. 2000/60/EC, OJ L 327/1, 72 pp., Brussels, 22 Dec.
Fan, H., and H. Huang (2008), Response of coastal marine eco‐environ-ment to river fluxes into the sea: A case study of the Huanghe (Yellow)River mouth and adjacent waters, Mar. Environ. Res., 65, 378–387,doi:10.1016/j.marenvres.2008.01.003.
Fekete, B. M., C. J. Vörösmarty, and W. Grabs (2002), High‐resolutionfields of global runoff combining observed river discharge and simulatedwater balances, Global Biogeochem. Cycles, 16(3), 1042, doi:10.1029/1999GB001254.
Fekete, B. M., D. Wisser, C. Kroeze, E. Mayorga, L. Bouwman, andW. M. Wollheim (2010), Millennium ecosystem assessment scenariodrivers (1970–2050): Climate and hydrological alterations, Global Bio-geochem. Cycles, doi:10.1029/2009GB003593, in press.
Gago, J., X. A. Alvarez‐Salgado, M. Nieto‐Cid, S. Brea, and S. Piedracoba(2005), Continental inputs of C, N, P and Si species to the Rıa de Vigo(NW Spain), Estuarine Coastal Shelf Sci., 65, 74–82, doi:10.1016/j.ecss.2005.05.008.
Garnier, J., B. Leporcq, N. Sanchez, and X. Philippon (1999), Biogeochem-ical budgets in three large reservoirs of the Seine basin (Marne, Seine &Aube reservoirs), Biogeochemistry, 47, 119–146.
Garnier, J., A. d’Ayguesvives, G. Billen, D. Conley, and A. Sferratore(2002a), Silica dynamics in the hydrographic network of the Seine River,Oceanis, 28, 487–508.
GARNIER ET AL.: N:P:SI EXPORT RATIOS FROM WORLD RIVERS GB0A05GB0A05
10 of 12
Garnier, J., G. Billen, E. Hannon, S. Fonbonne, Y. Videnina, and M. Soulie(2002b), Modeling transfer and retention of nutrients in the drainage net-work of the Danube River, Estuarine Coastal Shelf Sci., 54, 285–308,doi:10.1006/ecss.2000.0648.
Garnier, J., J. Némery, G. Billen, and S. Théry (2005), Nutrient dynamicsand control of eutrophication in the Marne River system: Modelling therole of exchangeable phosphorus, J. Hydrol., 304, 397–412, doi:10.1016/j.jhydrol.2004.07.040.
Garnier, J., A. Sferratore, M. Meybeck, G. Billen, and H. Dürr (2006),Modelling silica transfer processes in river catchments, in The Silicon Cycle:Human Perturbations and Impacts on Aquatic Systems, Scope 66, edited byV. Ittekkot et al., 296 pp., Island Press, Washington, D. C., ISBN:1‐59726‐115‐7.
Glibert, P. M., E. Mayorga, and S. P. Seitzinger (2008), Prorocentrum min-imum tracks anthropogenic nitrogen and phosphorus inputs on a globalbasis: Application of spatially explicit nutrient export models, HarmfulAlgae, 8, 33–38, doi:10.1016/j.hal.2008.08.023.
Granéli, E. (2004), Eutrophication and harmful algal blooms, in DrainageBasin Nutrient Imputs and Eutrophication: An Integrated Approach,edited by P.Wassmann, and K. Olli, pp. 49–62, Univ. of Tromsø, Norway.
Granéli, E., and W. Granéli (2008), Nitrogen in the marine environment, inNitrogen in Inland Seas, chap. 13, pp. 683–704, Elsevier, New York,doi:10.1016/B978-0-12-372522-6.00015-3.
Harrison, J. A., S. P. Seitzinger, A. F. Bouwman, N. F. Caraco, A. H. W.Beusen, and C. J. Vörösmarty (2005a), Dissolved inorganic phosphorusexport to the coastal zone: Results from a spatially explicit, global model,Global Biogeochem. Cycles, 19, GB4S03, doi:10.1029/2004GB002357.
Harrison, J. A., N. Caraco, and S. P. Seitzinger (2005b), Global patternsand sources of dissolved organic matter export to the coastal zone: Resultsfrom a spatially explicit, global model, Global Biogeochem. Cycles, 19,GB4S04, doi:10.1029/2005GB002480.
Howarth, R. W. (2008), Coastal nitrogen pollution: A review of sourcesand trends globally and regionally, Harmful Algae, 8 , 14–20,doi:10.1016/j.hal.2008.08.015.
Howarth, R. W., et al. (1996), Regional nitrogen budgets and riverine N &P fluxes for the drainages to the North Atlantic Ocean: Natural and hu-man influences, Biogeochemistry , 35 , 75–139, doi:10.1007/BF02179825.
Humborg, C., V. Ittekkot, A. Cociasu, and B. von Bodungen (1997), Effectof Danube River dam on Black Sea biogeochemistry and ecosystemstructure, Nature, 386, 385–388, doi:10.1038/386385a0.
Humborg, C., D. J. Conley, L. Rahm, F. Wulff, A. Cociasu, and V. Ittekot(2000), Silicon retention in river basins: Far‐reaching effects on biogeo-chemistry and aquatic food webs in coastal marine environments, Ambio,29(1), 45–51.
Humborg, C., S. Blomqvist, E. Avsan, Y. Bergensund, E. Smedberg,J. Brink, and C.M.Morth (2002), Hydrological alterations with river dam-ming in northern Sweden: Implications for weathering and river biogeo-chemistry, Global Biogeochem. Cycles, 16(3), 1039, doi:10.1029/2000GB001369.
Humborg, C., E. Smedberg, S. Blomqvist, C. M. Morth, J. Brink, L. Rahm,A. Danielsson, and J. Sahlberg (2004), Nutrient variations in boreal andsubarctic Swedish rivers: Landscape control of land‐sea fluxes, Limnol.Oceanogr., 49(5), 1871–1883.
Humborg, C., M. Pastuszak, J. Aigars, H. Siegmund, C. M. Morth, andV. Ittekkot (2006) Decreased silica land‐sea fluxes through dammingin the Baltic Sea catchment: Significance of particle trapping and hy-drological alterations, Biogeochemistry, 77(2), 265–281, doi:10.1007/s10533-005-1533-3.
Humborg, C., E. Smedberg, M. Rodriguez Medina, and C.‐M. Mörth(2008), Changes in dissolved silicate loads to the Baltic Sea: The effectsof lakes and reservoirs, J. Mar. Syst., 73, 223–235, doi:10.1016/j.jmarsys.2007.10.014.
International Rivers Network (2003), Dammed rivers, damned lives. Thecase against large dams, report, Berkeley, Calif. (Available at http://www.irn.org)
Jaworski, N. A., P. M. Groffman, A. A. Keller, and J. C. Prager (1992), Awatershed nitrogen and phosphorus balance: The upper Potomac Riverbasin, Estuaries, 15, 83–95, doi:10.2307/1352713.
Justić, D. (1991), Hypoxic conditions in the northern Adriatic Sea: Histor-ical development and ecological significance, Geol. Soc. Spec. Publ.London, 58, 95–105.
Justić, D., N. N. Rabalais, R. E. Turner, and Q. Dortch (1995a), Changes innutrient structure of river‐dominated coastal waters: Stoichiometric nutri-ent balance and its consequences, Estuarine Coastal Shelf Sci., 40, 339–356, doi:10.1016/S0272-7714(05)80014-9.
Justić, D., N. N. Rabalais, and R. E. Turner (1995b), Stoichiometric nutri-ent balance and origin of coastal eutrophication, Mar. Pollut. Bull., 30,41–46, doi:10.1016/0025-326X(94)00105-I.
Labry, C., D. Delmas, and A. Herbland (2005), Phytoplankton and bacterialalkaline phosphatase activities in relation to phosphate and DOP avail-ability within the Gironde plume waters (Bay of Biscay), J. Exp. Mar.Biol. Ecol., 318, 213–225, doi:10.1016/j.jembe.2004.12.017.
Lancelot, C. (1995), The mucilage phenomenon in the continental coastalwaters of the North Sea, Sci . Total Environ. , 165 , 83–102,doi:10.1016/0048-9697(95)04545-C.
Lancelot, C., G. Billen, A. Sournia, T. Weisse, F. Colijn, M. Veldhuis,A. Davies, and P. Wassman (1987), Phaeocystis blooms and nutrientenrichment in the continental coastal zones of the North Sea, Ambio,16, 38–46.
Lancelot, C., J.‐M. Martin, N. Panin, and Y. Zaitsev (2002), The north‐western Black Sea: A pilot site to understand the complex interactionbetween human activities and the coastal environment, Estuarine CoastalShelf Sci., 54, 279–283, doi:10.1006/ecss.2000.0647.
Lancelot, C., Y. Spitz, N. Gypens, K. Ruddick, S. Becquevort, V. Rousseau,G. Lacroix, and G. Billen (2005), Modelling diatom and Phaeocystisblooms and nutrient cycles in the Southern Bight of the North Sea: TheMIRO model, Mar. Ecol. Prog. Ser., 289, 63–78, doi:10.3354/meps289063.
Lancelot, C., N. Gypens, G. Billen, J. Garnier, and V. Roubeix (2007),Linking marine eutrophication to land use: An integrated river‐oceanmathematical tool—The Southern Bight of the North Sea over the past50 years, J. Mar. Syst., 64, 216–228, doi:10.1016/j.jmarsys.2006.03.010.
Laruelle, G. G., et al. (2009), Anthropogenic perturbations of the siliconcycle at the global scale: Key role of the land‐ocean transition, GlobalBiogeochem. Cycles, 23, GB4031, doi:10.1029/2008GB003267.
Le, T. P. Q., G. Billen, J. Garnier, S. Théry, C. Fézard, and C. V. Minh(2005), Nutrient (N, P) budgets for the Red River basin (Vietnam andChina), Global Biogeochem. Cycles, 19, GB2022, doi:10.1029/2004GB002405.
Leong, S. C. Y., A. Murata, Y. Nagashima, and S. Taguchi (2004), Vari-ability in toxicity of the dinoflagellate Alexandrium tamarense in responseto different nitrogen sources and concentrations, Toxicon, 43, 407–415,doi:10.1016/j.toxicon.2004.01.015.
Li, M., K. Xu, M. Watanabe, and Z. Chen (2007), Long‐term variations indissolved silicate, nitrogen, and phosphorus flux from the Yangtze Riverinto the East China Sea and impacts on estuarine ecosystem, EstuarineCoastal Shelf Sci., 71, 3–12, doi:10.1016/j.ecss.2006.08.013.
Lim, H.‐S., R. J. Diaz, J.‐S. Hong, and L. C. Schaffner (2006), Hypoxiaand benthic community recovery in Korean coastal waters, Mar. Pollut.Bull., 52, 1517–1526, doi:10.1016/j.marpolbul.2006.05.013.
Liu, S. M., J. Zhang, H. T. Chen, and G. S. Zhang (2005), Factors influenc-ing nutrient dynamics in the eutrophic Jiaozhou Bay, north China, Prog.Oceanogr., 66, 66–85, doi:10.1016/j.pocean.2005.03.009.
Ludwig, W., E. Dumont, M. Meybeck, and S. Heussner (2010), River dis-charges of water and nutrients to the Mediterranean Sea: Major driversfor ecosystem changes during past and future decades, Prog. Oceanogr.,doi:10.1016/j.pocean.2009.02.001, in press.
Marchetti, R. (1991), Algal blooms and gel production in the Adriatic Sea,in Eutrophication‐Related Phenomena in the Adriatic Sea and in otherMediterraneanCoastal Zones,Water Pollut. Res. Rep. Ser., vol. 16, editedby H. Barth and L. Fegan, pp. 21–42, CEC DGXII, Brussels.
Marchetti, R., A. Provini, and G. Crosa (1989), Nutrient load carried by theRiver Po into the Adriatic Sea, 1968–87,Mar. Pollut. Bull., 20, 168–172,doi:10.1016/0025-326X(89)90487-6.
Martínez, M. L., A. Intralawan, G. Vázquez, O. Pérez‐Maqueo, P. Sutton,and R. Landgrave (2007), The coasts of our world: Ecological, economicand social importance, Ecol. Econ., 63, 254–272, doi:10.1016/j.ecole-con.2006.10.022.
Mayorga, E., S. P. Seitzinger, J. A. Harrison, E. Dumont, A. H. W. Beusen,A. F. Bouwman, B. M. Fekete, C. Kroeze, and G. Van Drecht (2010),Global Nutrient Export from WaterSheds 2 (NEWS 2): Model develop-ment and implementation, Environ. Modell. Softw., doi:10.1016/j.envsoft.2010.01.007, in press.
McQuatters‐Gollop, A., A. J. Gilbert, L. D. Mee, J. E. Vermaat Artioli, Y. C.Humborg, and F. Wulff (2009), How well do ecosystem indicators com-municate the effects of anthropogenic eutrophication?, Estuarine CoastalShelf Sci., 82, 583–596, doi:10.1016/j.ecss.2009.02.017.
Meybeck, M., and A. Ragu (1995), River discharges to the oceans: Anassessment of suspended solids, major ions and nutrients, report, U.N.Environ. Programme, Nairobi.
GARNIER ET AL.: N:P:SI EXPORT RATIOS FROM WORLD RIVERS GB0A05GB0A05
11 of 12
Meybeck, M., and A. Ragu (1997), Presenting the GEMS‐GLORI, a com-pendium for world river discharge to the oceans, Int. Assoc. Hydrol. Sci.Publ., 243, 3–14.
Moestrup, Ø., G. A. Codd, M. Elbrächter, M. A. Faust, S. Fraga, Y. Fukuyo,G. Cronberg, Y. Halim, F. J. R. Taylor, and A. Zingone (2004), IOCTaxonomic Reference List of Toxic Algae, Intergov. Oceanogr. Comm.of UNESCO, Paris.
Murata, A., S. C. Y. Leong, Y. Nagashima, and S. Taguchi (2006), Nitro-gen: Phosphorus supply ratio may control the protein and total toxin ofdinoflagellate Alexandrium tamarense, Toxicon, 48, 683–689,doi:10.1016/j.toxicon.2006.08.004.
Némery, J., and J. Garnier (2007), Origin and fate of phosphorus in theSeine watershed (France): Agricultural and hydrographic P budgets,J. Geophys. Res., 112, G03012, doi:10.1029/2006JG000331.
Némery, J., J. Garnier, and C. Morel (2005), Phosphorus budget in theMarne watershed (France): urban vs. diffuse sources, dissolved vs. particu-late forms, Biogeochemistry, 72, 35–66, doi:10.1007/s10533-004-0078-1.
Nixon, S. W. (1995), Coastal marine eutrophication: A definition, socialcauses, and future concerns, Ophelia, 41, 199–219.
Nixon, S. W. (2009), Eutrophication and the macroscope, Hydrobiologia,629, 5–19, doi:10.1007/s10750-009-9759-z.
Officer, C. B., and J. H. Ryther (1980), The possible importance of siliconin marine eutrophication, Mar. Ecol. Prog. Ser., 3, 83–91, doi:10.3354/meps003083.
Rabalais, N. N., R. E. Turner, R. J. Díaz, and D. Justić (2009), Globalchange and eutrophication of coastal waters, ICES J. Mar. Sci., 66,1–10, doi:10.1093/icesjms/fsp047.
Rabouille, C., et al. (2008), Comparison of hypoxia among four river‐dominated ocean margins: The Changjiang (Yangtze), Mississippi,Pearl , and Rhône rivers, Cont. Shelf Res. , 28 , 1527–1537,doi:10.1016/j.csr.2008.01.020.
Ragueneau, O., et al. (2002), Biogeochemical transformations of inorganicnutrients in the mixing zone between the Danube River and the north‐western Black Sea, Estuarine Coastal Shelf Sci., 54, 321–336,doi:10.1006/ecss.2000.0650.
Redfield, A. C., B. H. Ketchum, and F. A. Richards (1963), The influenceof organisms on the composition of sea‐water, in The Sea, edited by M. N.Hill, pp. 12–37, John Wiley, New York.
Roubeix, V., and C. Lancelot (2008), Effect of salinity on growth, cell sizeand silicification of an euryhaline freshwater diatom: Cyclotella mene-ghiniana Kütz, Transitional Waters Bull., 1, 31–38.
Rousseau, V., S. Becquevort, J.‐Y. Parent, S. Gasparini, M.‐H. Daro,M. Tackx, and C. Lancelot (2000), Trophic efficiency of the plank-tonic food web in a coastal ecosystem dominated by Phaeocystis col-onies, J. Sea Res., 43, 357–372, doi:10.1016/S1385-1101(00)00018-6.
Roy, S., J. Gaillardet, and C. J. Allègre (1999), Geochemistry of dissolvedand suspended loads of the Seine River, France: Anthropogenic impact,carbonate and silicate weathering, Geochim. Cosmochim. Acta, 63,1277–1292, doi:10.1016/S0016-7037(99)00099-X.
Seitzinger, S. P., and R. W. Sanders (1999), Atmospheric inputs of dis-solved organic nitrogen stimulate estuarine bacteria and phytoplankton,Limnol. Oceanogr., 44, 721–730.
Seitzinger, S. P., et al. (2010), Global river nutrient export: A scenario anal-ysis of past and future trends, Global Biogeochem. Cycles, doi:10.1029/2009GB003587, in press.
Sferratore, A., J. Garnier, G. Billen, D. Conley, and S. Pinault (2006), Silicadiffuse and point sources in the Seine watershed, Environ. Sci. Technol.,40, 6630–6635, doi:10.1021/es060710q.
Slomp, C. P., and P. Van Cappellen (2004), Nutrient inputs to the coastalocean through submarine groundwater discharge: controls and potentialimpact, J. Hydrol., 295, 64–86, doi:10.1016/j.jhydrol.2004.02.018.
Smith, V. H., G. D. Tilman, and J. C. Nekola (1999), Eutrophication: Impactsof excess nutrient inputs on freshwater, marine, and terrestrial ecosystems,Environ. Pollut., 100, 179–196, doi:10.1016/S0269-7491(99)00091-3.
Telang, S. A., R. Pockington, A. S. Naidu, E. A. Romankevitch, I. I. Gitelson,and M. I. Gladyshev (1991), Carbon and mineral transport in major NorthAmerican, Russian Arctic and Siberian Rivers: The St Lawrence, theMackenzie, the Yukon, the Arctic Basin rivers in the Soviet Union and
the Yenisei, in Biogeochemistry of Major World Rivers, SCOPE 42, editedby E. T. Degens, S. Kempe, and J. E. Richey, pp 75–104, John Wiley,Hoboken, N. J.
Thieu, V., G. Billen, and J. Garnier (2009), Nutrient transfer in three con-trasting NW European watersheds: The Seine, Somme, and Scheldt rivers.A comparative application of the Seneque/Riverstrahler model, WaterRes., 43, 1740–1754, doi:10.1016/j.watres.2009.01.014.
Turner, R. E., and N. N. Rabalais (1994), Evidence for coastal eutrophica-tion near the Mississippi River delta, Nature, 368, 619–621, doi:10.1038/368619a0.
Turner, R. E., and N. N. Rabalais (2003), Linking landscape and waterquality in the Mississippi River basin for 200 years, BioScience, 53,563–572, doi:10.1641/0006-3568(2003)053[0563:LLAWQI]2.0.CO;2.
Turner, R. E., N.A. Qureshi, N. N. Rabalais, Q. Dortch, D. Justić, R. Shaw,and J. Cope (1998), Fluctuating silicate:nitrate ratios and coastal planktonfood webs, Proc. Natl. Acad. Sci. USA, 95, 13,048–13,051.
Turner, R. E., N. N. Rabalais, and D. Justić (2006), Predicting summer hyp-oxia in the northern Gulf of Mexico: Riverine N, P, and Si loading, Mar.Pollut. Bull., 52, 139–148, doi:10.1016/j.marpolbul.2005.08.012.
Vahtera, E., et al. (2007), Internal ecosystem feedbacks enhance nitrogen‐fixing Cyanobacteria blooms and complicate management in theBaltic Sea, Ambio, 36, 186–194, doi:10.1579/0044-7447(2007)36[186:IEFENC]2.0.CO;2.
Van Drecht, G., F. A. Bouwman, J. Harrison, and J. M. Knoop (2009),Global nitrogen and phosphate in urban waste water for the period1970–2050, Global Biogeochem. Cycles, 23, GB0A03, doi:10.1029/2009GB003458.
Vollenweider, R. A. (1968), Water management research. Scientific funda-mentals of the eutrophication of lakes and flowing waters with particularreference to nitrogen and phosphorus as factors in eutrophication, OECD.Paris. Tech. Rep. DA 5/SCI/68.27, 250 pp.
Vörösmarty, C. J., M. Meybeck, B. Fekete, and K. Sharma (1997), Thepotential impact of neo‐Castorization on sediment transport by theglobal network of rivers, in Human Impact on Erosion and Sedimenta-tion. Proceedings of the Rabat Symposium, Int. Assoc. Hydrol. Sci.Publ. 245, pp. 261–273, Wallingford, U. K.
Vörösmarty, C. J., M. Meybeck, B. Fekete, K. Sharma, P. Green, andS. Syvitski (2003), Anthropogenic sediment retention: major global‐scaleimpact from the population of registered impoundments, Global Planet.Change, 39, 169–190, doi:10.1016/S0921-8181(03)00023-7.
Wafar, M. V. M., P. Le Corre, and J. L. Birrien (1989), Transport of carbon,nitrogen and phosphorus in a Brittany River, France, Estuarine CoastalShelf Sci., 29, 489–500, doi:10.1016/0272-7714(89)90082-6.
Wiegner, T. N., and S. P. Seitzinger (2001), Photochemical and microbialdegradation of external dissolved organic matter inputs to rivers, Aquat.Microb. Ecol., 24, 27–40, doi:10.3354/ame024027.
Zakharova, E. A., O. S. Pokrovsky, B. Dupré, and M. B. Zaslavskaya(2005), Chemical weathering of silicate rocks in Aldan Shield and BaikalUplift: Insights from long‐term seasonal measurements of solute fluxes inrivers, Chem. Geol., 214, 223–248, doi:10.1016/j.chemgeo.2004.10.003.
Zhang, J. (1996), Nutrient elements in large Chinese estuaries, Cont. ShelfRes., 16, 1023–1045, doi:10.1016/0278-4343(95)00055-0.
Zhang, J., Z. G. Yu, T. Raabe, S. M. Liu, A. Starke, L. Zou, H. W. Gao,and U. Brockmann (2004), Dynamics of inorganic nutrient species inthe Bohai seawaters, J. Mar. Syst., 44, 189–212, doi:10.1016/j.jmarsys.2003.09.010.
Zingone, A., R. Siano, D. D’Alelio, and D. Sarno (2006), Potentially toxicand harmful microalgae from coastal waters of the Campania region(Tyrrhenian Sea, Mediterranean Sea), Harmful Algae, 5, 321–337,doi:10.1016/j.hal.2005.09.002.
A. Beusen and L. Bouwman, PBL, PO Box 303, NL 3720 AH Bilthoven,Netherlands.G. Billen, J. Garnier, and V. Thieu, UMR 7619 Sisyphe, UPMC, CNRS,
Tour 56, Etage 4, Boite 123, 4, Place Jussieu, F‐75005, Paris, France.([email protected])
GARNIER ET AL.: N:P:SI EXPORT RATIOS FROM WORLD RIVERS GB0A05GB0A05
12 of 12