NPS-OR-93-016 NAVAL POSTGRADUATE SCHOOL · a mecton of inlormaton, r1dng suggestfos r reducing thi...
27
NPS-OR-93-016 NAVAL POSTGRADUATE SCHOOL Monterey, California AD-A273 272 I III!II il~lt1 lii tlBlltlll lll11qI MONITORING DECLINING QUALITY OF AMMUNITION STOCKPILE UNDER STEP-STRESS So Young Sohn September 1993 Approved for public release; distribution is unlimited. Prepared for: Naval Surface Warfare Center Crane, IN 47522 1"r 93-29350 93 1i1i11l
Transcript of NPS-OR-93-016 NAVAL POSTGRADUATE SCHOOL · a mecton of inlormaton, r1dng suggestfos r reducing thi...

NPS-OR-93-016
NAVAL POSTGRADUATE SCHOOLMonterey, California
AD-A273 272I III!II il~lt1 lii tlBlltlll lll11qI
MONITORING DECLINING QUALITY OFAMMUNITION STOCKPILE UNDER STEP-STRESS
So Young Sohn
September 1993
Approved for public release; distribution is unlimited.
Prepared for:Naval Surface Warfare CenterCrane, IN 47522 1"r 93-29350
93 1i1i11l
NAVAL POSTGRADUATE SCHOOLMONTEREY, CA 93943-5000
Rear Admiral T. A. Mercer Harrison ShullSuperintendent Provost
This report was prepared for and funded by Naval Surface Warfare Center.
Reproduction of all or part of this report is authorized.
This report was prepared by:
SO YOUNG SOHNProfessor of Operations Research
Reviewed by: Released by:
PETERPURDUE PAULTJ. MA*TOProfessor and Chairman Dean of ReslkrchDepartment of Operations Research
Acceslon ForNTIS CRA&IDTIC TABI3Uv-ianrou, oci Li}
J A. . ..........
By . .. ......... ............-- -- --
DiA t t'
Dilt
-maim-
Form ApprovedREPORT DOCUMENTATION PAGE OMB No. 0704-0188
Pui~c reprg burden f tohs lection of informaton is estirnated .o average 1 hour per res e, inuding te uine for reevewng r'sbuctins, aearodng exissno data sources.gatnng wnd mainlanirg the darn needed, and ornpletrg and rewi~gte olecion of nlormaton. Send cornments regarding hs burden esomame or any odier a=pea of ovsa mecton of inlormaton, r1dng suggestfos r reducing thi burden, te shington Headquarers Sermoes, Directorate for informabon Operazons and Reports. 121 JaferaorDavis Hi-hway, Suite 1204. M~Adrn, VA 22202-4302, and ID the Office of Management and Budget, Paperwork Reduction Projct (0704-0188), Washington, DC 20503.
1. AGENCY USE ONLY (Leave blank) Z. REPORT DATE 3. REPORT TYPE AND DATES COVERED
1 15 Sep 1993 Technical, Oct 92 to Sep 93
4. TITLE AND SUBTITLE 5. FUNDING NUMBERS
Monitoring Declining Quality of Ammunition Stockpile underStep-Stress RGGMB
6. AUTHOR(S)
So Young Sohn
7. PERFORMING ORGANIZATION NAME(S) AND ADDRESS(ES) 8. PERFORMING ORGANIZATIONREPORT NUMBER
Naval Postgraduate SchoolMonterey, CA 93943
9. SPONSORING / MONITORING AGENCY NAME(S) AND ADDRESS(ES) 10. SPONSORING / MONITORING
AGENCY REPORT NUMBER
Naval Surface Warfare CenterCrane, IN 47522
11. SUPPLEMENTARY NOTES
12a. DISTRIBUTION / AVAILABILITY STATEMENT 1 2b. DISTRIBUTION CODE
Approved for public release; distribution is unlimited.
13. ABSTRACT (Maximum ZOO words)
Most ammunition is produced long before its ultimate consumption and stored in a seriesof different depots for a considerably long period of time. During storage, the quality of theammunition stockpile deteriorates proportionally to the conditions of depots. We viewdifferent conditions associated with a series of depots as step-stress. A random effects logisticregression model is employed to predict the quality of ammunition stockpile in terms of therouting information such as a series of location and duration of storage of ammunition lots.The resultant prediction model can be used to determine the appropriate time for reorder orrenovation of ammunition before the quality reaches substandard. An example is given toillustrate the implementation procedure of the prediction model suggested in this paper.
14. SUBJECT TERMS 1S. NUMBER OF PAGES
Random Effects Model, Step-Stress, Deterioration Rate, A Two-Stage 26Estimation 16. PRICE CODE
17. SECURITY CLASSIFICATION 18. SECURITY CLASSIFICATION 19. SECURITY CLASSIFICATION 20. LIMITATION OF ABSTRACTOF REPORT OF THIS PAGE OF ABSTRACT
Unclassified Unclassified Unclassified ULNSN 7540-01-280-5500 Standard Form 298 (Rev. 2-89)
Prescribed by ANSI Std. 239-18

Monitoring Declining Quality of Ammunition Stockpile under
Step-Stress
So Young Sohn
Dept. of Operations Research
Naval Postgraduate School
Monterey, CA 93943
Abstract
Most ammunition is produced long before its ultimate consumption and
stored in a series of different depots for a considerably long period of time.
During storage, the quality of the ammunition stockpile deteriorates pro-
portionally to the conditions of depots. We view different conditions as-
sociated with a series of depots as step-stress. A random effects logistic
regression model is employed to predict the quality of ammunition stock-
pile in terms of the routing information such as a series of location and
duration of storage of ammunition lots. The resultant prediction model
can be used to determine the appropriate time for reorder or renovation of
ammunition before the quality reaches substandard. An example is given to
illustrate the implementation procedure of the prediction model suggested
in this paper.
Key Words: Random Effects Model, Step-Stress, Deterioration Rate,
A Two-Stage Estimation

1. INTRODUCTION
Designing the proper surveillance program for the material whose qual-
ity deteriorates during storage has been one of the important topics in the
area of material management (Valdez-Flores and Feldman [13], Whitehead
[14]). Especially, when the degradation of the quality would cause not on-
ly economic loss but also catastrophic disaster such as loss of human life,
importance of the appropriate quality control cannot be overemphasized.
A good example would be ammunition lots that are stored in depots for a
relatively long period of time before their ultimate usage. In order to keep
ammunition stockpile from reaching substandard faster than expected, well
planned surveillance programs are necessary.
In an attempt to provide inputs to such surveillance programs Solin
[10] formulated an ammunition stockpile deterioration model based on a
random effect logistic regression analysis. The suggested model enables
one to predict the deterioration rate of ammunition lots in terms of depot
condition along with other related characteristics such as vendor sources
and the manufacturing year. In order to model deteriorating patterns, one
of the assumptions employed in Sohn [10] was that once ammunition lots
are sent to a depot, they remain in the same depot during the experimental
period.
In practice, however, ammunition lots may be transferred to several
depots in sequence before ultimate usage. A typical logistics chain of am-
munition lots described in Brzuskiewicz and Morrison [1] begins with the
load plant. At the load plant, ammunition lots sometimes spend up to
one year in temporary storage before deployment to the permanent storage
area. The ammunition lots shipped to and stored in permanent depots are
2

then rotated from war reserve and tested on schedules which depend on the
availability of the item and the policy of the Defense Ammunition Director.
In sum, an ammunition lot would be exposed to a series of different
conditions of depots associated with different levels of average temperature
and humidity in various locations (underground depot, aboveground depot,
and warship)(see Eriksen and Stromsoe[2], Forsyth et al. [3]). A series of
different conditions can be viewed as step-stress consisting of several levels
of constant stress.
In this paper, we formulate the deteriorating pattern of the quality
of ammunition stockpile under step-stress in order to accommodate the
possible exposure of ammunition lots to several different depots. The main
goal is to provide tools to predict the quality of ammunition given the
expected duration and locations of storage of ammunition lots in sequence.
In section 2, the model formulation (a random effects logistic regression)
under constant stress and the necessary estimation methods introduced in
(Sohn [10]) is briefly reviewed. In section 3, by combining the segments of
individual models, a prediction model for ammunition deterioration under
step-stress is derived. In section 4, an example is given to illustrate the
implementation procedure. Finally, discussion is given in section 5.
2. CONSTANT STRESS MODEL
Consider the following experiment. N lots of homogeneous caliber am-
munition (say, fuze manufactured by the same vendor in the same year) are
purchased from a vendor. They are sent to m different depots: lot number
1,.., N1 to depot 1; lot number N1 +1,.., N1 +N 2 to depot 2;,..,; lot number
N",_ I + 1, .., Nn,_ I + N,,, = N to depot m.
It is assumed that once lots are stored in a depot, they remain in the
3
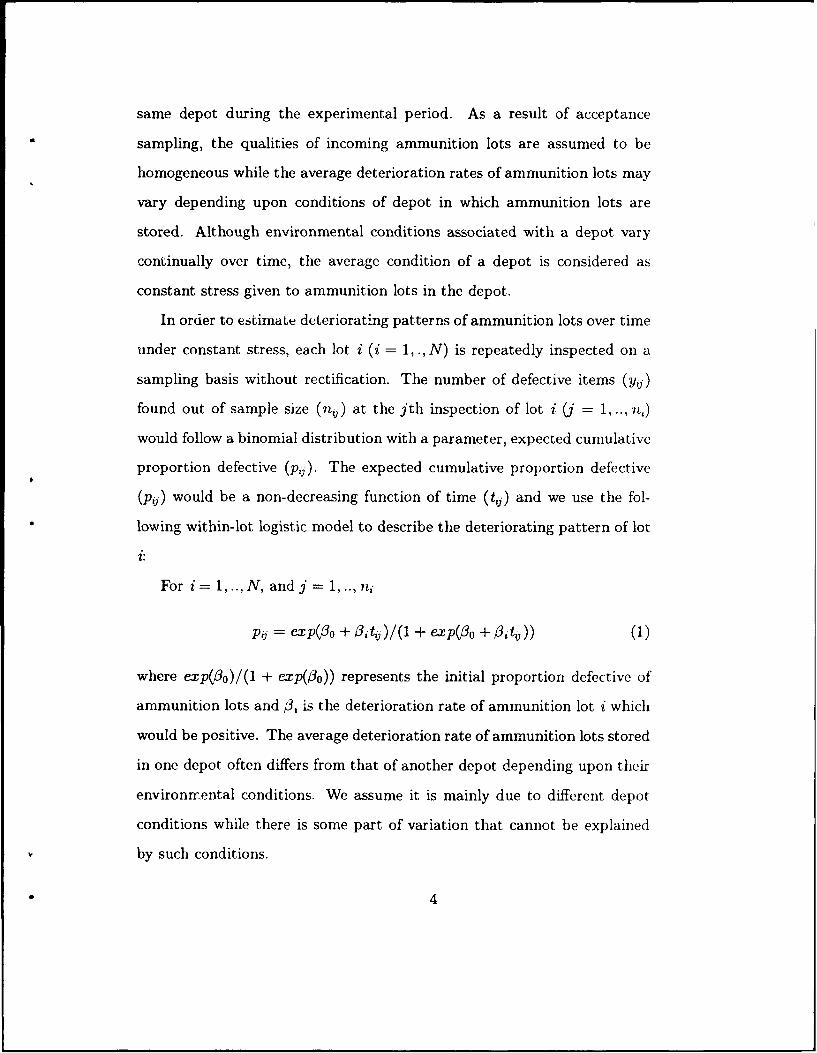
same depot during the experimental period. As a result of acceptance
sampling, the qualities of incoming ammunition lots are assumed to be
homogeneous while the average deterioration rates of ammunition lots may
vary depending upon conditions of depot in which ammunition lots are
stored. Although environmental conditions associated with a depot vary
continually over time, the average condition of a depot is considered as
constant stress given to ammunition lots in the depot.
In order to estimate deteriorating patterns of ammunition lots over time
under constant stress, each lot i (i = 1, ., N) is repeatedly inspected on a
sampling basis without rectification. The number of defective items (yij)
found out of sample size (nil) at the jth inspection of lot i (j = 1, .., n,)
would follow a binomial distribution with a parameter, expected cumulative
proportion defective (pij). The expected cumulative proportion defective
(pij) would be a non-decreasing function of time (tij) and we use the fol-
lowing within-lot logistic model to describe the deteriorating pattern of lot
For i = 1, .. , N, and j = 1, .., ni
pij = &tp(L3o+ +3tj)/(i + exp(Oo + Ojtý)) (1)
where exp(l3o)/(1 + exp(o3o)) represents the initial proportion defective of
ammunition lots and/3, is the deterioration rate of ammunition lot i which
would be positive. The average deterioration rate of ammunition lots stored
in one depot often differs from that of another depot depending upon their
environmental conditions. We assume it is mainly due to different depot
conditions while there is some part of variation that cannot be explained
by such conditions.
0 4

One of the possible models that accommodate these points would be
the following between-lot model for /3,:
O3, = exp(^ylzi +.. + ")MZim + E,) or
ln3, = z +.. + -)',Zim + E, (2)
where zk (k = 1,.., m) is a dummy variable (zik=1 if a lot i is stored
in depot k; otherwise 0) and E, follows independent N(0, or2). The corre-
sponding regression coefficient -yk. would imply the average log(deterioration
rates) of ammunition lots stored in depot k.
Once unknown regression fficients (fyl, .., -ym) in (2) are estimated,
they can be used as a basis to examine which depots are associated with
significantly higher average deterioration rates than the others as shown
in [9]. In addition, when 00 is available, one can predict the proportion
defective of an ammunition lot which would be stored in one of the depots
or similar depots used in the experiment.
In order to estimate unknown parameters such as 300 and ('h1 , Ym), we
use a two-stage method which separates the estimation of the within-lot
model (1) from that of the between-lot model (2) (Korn and Whittemore
[5], Sohn [10] and Stiratelli et al. [11]).
A Two-Stage Estimation
First, in order to estimate the within-individual model (1), the following
likelihood function of Yj conditional on 3o, /31,...,/3N is formulated:
N nj
L1 = HJHf p?(1 - pý)N -h (3)i=lj=l
where p,, is as in equation (1).
5"

In order to estimate 3o, 0I,'", 3 N that maximizes (3), we differentiate
In(L1) with respect to 30, /31,...,, 3 N. By solving a set of resulting normal
equations, we find the maximum likelihood (ML) estimates, (30, 13 1,...,!3 N).
A (N + 1) x 1 vector 3-= (030, 31,...,3N)' would follow asymptotically normal
distribution with mean 3 =(03o, 31,..,/3N)' and variance A where
"2 .2
2TN, ... ... 7"NN
The inverse of the negative information matrix evaluated at (00, 31,... ,3•'),
A can be used to estimate the variance matrix A.
Once the ML estimates /3's are obtained, they can replace the unobserv-
able 3i in the between-individual model (2). This replacement, however,
adds the estimation error 6, to the equation (2):
ln 30i = )lzil + ... + ImZz -+ E€i + 6 i (4)
for i= 1,..,N.
Using matrix notation model (4) can be written as follows:
ln3 = Z'I + E + 6 (5)
where ln3 is an N x 1 vector, (3, is an N x m matrix of
zk's; the -y is an m x 1 vector of -n's; E is an N x 1 vector of ci's; and 6 is
an N x 1 vector of 6i's.
66

6 is assumed to be statistically independent of f and would asyniptoti-
cally follow normal distribution with mean 0 and variance f2. where
Estimated £2, 2, can be obtained by replacing 2rk/33k with T., 3 3 k
for i, k = 1,.., N. In sum, lný - N(Z',, V) where V = b2 + a,2 .
Based on normal ln 3, the restricted maximum likelihood (REML) method
is used to estimate the between-individual model parameter a 2 which sat-
isfies the following:
- 0.5trR - o.510''RR 10 = 0 (6)
where R = V` - V- 1Z(Z'V-'Z)-'Z'V- 1 (Searle et. al [9]). Once &-2 is
obtained from (6), it replaces a2 in V and -y can be estimated as
ý = (z' fvz) -I(z' fV(1 0)) (7)
where WV= (b2+ -IN)-' and the estimated variance of ý is (Z' WVZ)-1.
Finally when the estimates "j's in (7) replace -n's in (4), 170, can be
predicted in terms of zj,..., zim:
ln(ji3) = "•yzjj + ... + Ymýzm (8)
or
O, = exp(•yzi + ... + ',,Zi.). (9)
7

Notice the difference between the estimated individual deterioration rate
* i and the average group deterioration rate f3i that takes into account the
random effects.
In order to predict the proportion defective of a randomly selected lot
iv that was not used in the experiment, one can use the following:
/1( t) = exp(Oo + 3 j, t)/(1 + exp(jo + It)) (10)
where 31e = exp(Qyz, .+, ..., +i'mZ,'r).
Subsequently, one can estimate the expected time t' when the quality
of ammunition lot ev reaches a predetermined level p:
4,(p) = [ln(p/(1 - p))- o]/3,,. (11)
3. STEP-STRESS MODEL
In order to formulate the deterioration model with step-stress, the fol-
lowing assumptions are made based on Nelson [7]: (1) The remaining life
of ammunition depends only on the current cumulative proportion defec-
tive and the current stress associated with the depot regardless how the
proportion is accumulated; (2) If held at the current stress, defective items
will occur according to the logistic function for that stress but starting at
the previously accumulated fraction failed; (3) The change in stress has no
effect on life - only the level of stress does.
Now, suppose that ammunition lot i would be stored in depot k, dur-
ing [0, ti], in depot k2 during [ti, t2] and finally transferred to depot k3 and
stored during [t2 , t3 ]. In this case, a routing sequence of locations of depots
becomes (kl. k2, k3) along with associated duration [0, ti], [ti, t2], [t2, t3], re-
spectively.
"8
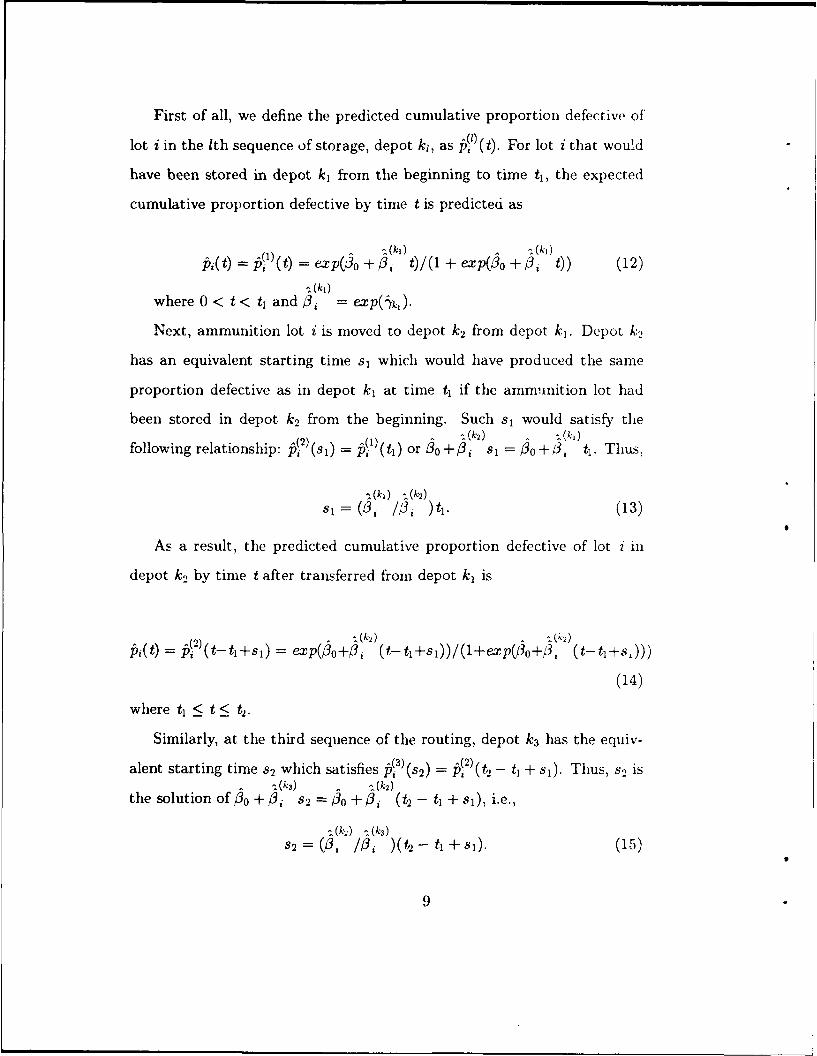
First of all, we define the predicted cumulative proportion defective of'
lot i in the 1th sequence of storage, depot ki, as ^(1)(t). For lot i that would
have been stored in depot k, from the beginning to time ti, the expected
cumulative proportion defective by time t is predicted as
•(k•) (k,)Pi(t) = Pi )(t) = exp(3 o +±3i t)/(1 + exp(3 o + Oi t)) (12)
where 0 < t < t1 and i = exp(yk,).
Next, ammunition lot i is moved to depot k2 from depot k1 . Depot k,2
has an equivalent starting time s, which would have produced the same
proportion defective as in depot k, at time tj if the ammunition lot had
been stored in depot k2 from the beginning. Such s, would satisfy the~(k2 ) (i
following relationship: p7) (s1 ) = P1')(ti) or 3 o0+ si s1 = o0+ 3 ti. Thus,
ý(k1 ) - (k2 )
s,= (P3 /i 3 )tA . (13)
As a result, the predicted cumulative proportion defective of lot i in
depot k., by time t after transferred from depot k, is
(k2)
Pi(t) = P 2)(t-tj+s 1 ) = expC(o+-3, (t-t1 +sj))/(+lexp(3o+O,3 (t-tl+s,)))
(14)
where t1 < t < t2.
Similarly, at the third sequence of the routing, depot k3 has the equiv-
alent starting time 82 which satisfies -(3)(s2) = P(2)(t, - t1 + si). Thus, s) is~(k3) (2
the solution of 00 + 8i S2 = 00 + O, (t 2 - ti + s), i.e.,
(Ck%.) ^( 3)S= (0, A )(t 2 - tI + Sl) (15)
9

The cumulative proportion defective of lot i in depot k3 by time t after
transferred from depot ki and depot k2 sequentially is predicted as
(k3) (k3)15,3() = 15s(t-t2 +s52 ) = eXP(0o+O, (t-t 2 +s2 ))/(l+eXp(3o+ý3, (t-t±+S.)))
(16)
for time period tk < t < t3.
In general, for lot i which is transferred from depot k1 _1 to depot k, at
time 4-1, depot k, has the equivalent starting time s1_1 which satisfies the
following relationship: ýO + ý,3 s-1 = /30 + 3 (4-1 - 4- 2 + sj- 2) where
I = 2,.., L, to = 0 and so 0 . Therefore
S-1 = (3, /03 )(4-1 - 4-2 + S-2). (17)
Consequently the cumulative proportion defective of lot i in depot k, by
time t, 4- 1 < t < 4 is estimated as follows:
A5,(t) - 15•(t- 4-1 + $-,)
= exp(3o +, 3 i (t- 4- 1 + st-i))/(1 + exp(/o + f3 (t- 4-1 + si- 1 ))) (18)
for time period 4-1 < t < 4.
Thus, the predicted cumulative proportion defective of ammunition lot
i, 15(t), for step-stress pattern (kj, k2, k3) along with associated duration
[0, ti], [ti, t2], [t2, t3] consists of segments of the ^(15() (2)(), and P513)().
4. ILLUSTRATION
In order to illustrate implementation procedures for the methods sug-
gested in this paper, a numerical example is generated based on the pa-
rameters used in the guideline of the U.S. Army Ammunition Surveillance
Procedure [12].
10

Suppose 20 ammunition lots were used for experiment to estimate 3 j's
where (i = 1,.., 20). The experimental lots are exposed to four different
levels of constant stress representing the conditions of depot 1 (lots 1,..,5),
depot 2 (lots 6,..,10), depot 3 (lots 11,..,15), and depot 4 (lots 16,..,20). All
the lots are inspected annually based on sample size of 20 (itij). Inspection
starts when the lot is 3 years old ant it is done thereafter every three years
until 15th year. Table 1 contains information regarding the series of the
number of defective items (yij) found in 20 ammunition lots (N).
This information is used to obtain ML estimates of parameters in the
within-lot model (1) (00, 1,..,-/2o and A). For this step, PROC LOGISTIC
of a statistical package SAS [8] is used. In Figure 1, sample patterns of the
actual deterioration (Actual:Xo/ Yý ) are overlaid to those of the estimated
deterioration (Fitted: (exp(!3o + itij)/(i + expoo + Qji•))) against time
to).
The between-lot model (2) is formed to relate deterioration rates to the
depot characteristics. 10, is used as dependent variable and the four dum-
my variables (zij ,..,z4) representing 4 different depots are used as covariates
without an intercept: zj = 1 for ammunition lots stored in depot 1, oth-
erwise zil = 0; z,2 = 1 for ammunition lots stored in depot 2, otherwise
z,2 = 0; z3 = 1 for ammunition lots stored in depot 3, otherwise z3 = 0;
and z,4 = 1 for ammunition lots stored in depot 4, otherwise zi4 = 0. Given
such (z,1, .., z4) as well as , and A), the IMSL subroutine ZSPOW [4], is
applied to (6,7) in order to obtain " 4, .. , -Y and (Z'WVZ)-'. These estimates
are summarized in Table 2.
Now we apply these results to predict the proportion defective of an
ammunition lot i which would be transferred from depot 1 to depot 4
11

following the route given in Table 3. The route given in Table 3 can be
related to the following: ammunition lot i would be stored in the temporary
depot 1 for 1 year and transferred to the permanent depot 2 where it would
be kept for the next 4 years. The lot i then would be sent to the depot 3 in
warship and storcd for 1 year and brought back to depot 4 where it would
remain until ultimate usage.
The expected proportion defective in depot 1 by time t4 0 < t < 1, can
be predicted as
Pt Ai1 (t) - eexp(-5.8551 + exp(-1.6058)t) (19)
(1 + exp(-5.8551 + exp(-1.6058)t)) (
The expected proportion defective of ammunition lot i stored in depot
2 during 1 < t < 5 after being transferred from depot 1 is predicted as
PiW-0 0 )p(-5.8551 + exp(-1.5432)(t- 0.0606))
,= - 0.0606) = (1 + exp(-5.8551 + exp(- 1.5432)(t - 0.0606)))
(20)
Next, the expected proportion defective of ammunition lot i stored in
depot 3 during 5 < t < 6 after depot 1 and depot 2 is predicted as
P) 3 9 exp(-5.8551 + e.xp(-1.3566)(t - 0.9016)),(t) = 3 )(t- 0.9016) = (1 + exp(-5.8551 + exp(-1.3566)(t- 0.9016)))
(21)
Similarly, the expected proportion defective of ammunition lot i stored
in depot 4 during t > 6 after storage in depot 1, 2 and 3 is predicted as
Pi-(t) --. 4)(t- 2.5887) -- exp(-5.8551 + exp(-0.9547)(t- 2.5887))
(1 + exp(-5.8551 + exp(-0.9547)(t - 2.5887)))
(22)
Figure 2 shows the segments of the estimated cumulative proportion
defectives obtained under the four different depot conditions. First, the
* 12

quality of the ammunition lot deteriorates according to the average condi-
tion of depot 1 up to time t1 . After it is transferred to depot 2, the stockpile
deteriorates following the pattern fitted for depot 2, starting at the accu-
mulated proportion defective due to the condition of depot 1. Similarly,
when the lot is shipped from depot 2 to depot 3, from depot 3 to depot 4,
deteriorating patterns follow the corresponding logistic models fitted under
each depot condition, respectively starting at the accumulated proportion
defective at the previous depots. Figure 3 gives their connection represent-
ing the predicted cumulative proportion defective of the ammunition lot
under the step-stress described in Table 3.
Under the route given in Table 3, the proportion defectives of amnmuni-
tion lot i in depot 4 by t = 10 is predicted as follows:
Pi(10) = -( 4)(7.4113) = 0.0473. (23)
Similar calculation provides f5,(12) = 0.0969, Ai(13) = 0.1365, and
Pj(14) = 0.1880.
When the substandard quality of the ammunition lot is set at p = 0.15,
this ammunition lot should be used or replaced, at the latest, by the end
of 13th year of storage in depot 4 provided it had followed the route given
in Table 3.
13

5. DISCUSSION
A two-stage random effect logistic regression analysis is applied to pre-
dict the declining quality of ammunition stockpile when a series of location
and the duration of storage associated with the ammunition lot is given.
First of all, average deterioration rates are estimated using constant stress
model. Next the prediction method for the cumulative proportion defective
of an ammunition lot is described using a step-stress model.
We use a logistic regression model to fit deteriorating patterns of ammu-
nition stockpile. The patterns of declining qualities are observed based on
sampling inspection. Other alternatives to the logistic model include com-
plementary log-log model and probit model (McCullagh [6]). For instance,
the complementary log-log and the probit within-lot models which corre-
spond to the logistic within-lot model (1) would be piy = 1- exp(-exp(3o +
Oi t•)), and pij = P(i3o +iti3t), respectively, where P(.) is the standard nor-
mal integral. Even in these model specifications, parameters 3i's represent
the deterioration rates as described in the logistic regression model (1). To
estimate ,3 's, the maximum likelihood estimation methods given in (3) can
be applied. The corresponding between-lot model analyses are essentially
the same as described in the two stage estimation. Choice of the specific
within-lot model among logistic, probit and complementary log-log models
depends on the pattern of data gathered from the experiment.
When the response is taken in terms of the change in a certain attribute
of an item such as water content in propellant, rather than counting the
number of defectives based on a certain sampling scheme, a nonlinear mod-
el can be used to formulate deteriorating patterns of ammunition lots. A
typical example is use of a negative exponential growth curve model. How-
"14

ever, the selection of appropriate nonlinear model again depends on the
observed declining characteristic of the quality of ammunition stockpile.
In this paper, different levels of depot conditions are viewed step-stress.
Degradation is assumed to be independent of the sequence of step-stress,
(i.e., sequence of depot routing). Sometimes abrupt changes between two
consecutive depots may cause faster deterioration of stockpile than expect-
ed in these two depots. Developing models that accommodate sequential
dependence is left as one of areas for further study.
15
REFERENCES
[1] Brzuskiewicz, J. E. and Morrison, C., Test Plan Development for
Plastic Ammunition Containers, Vol. I, AD-A207 038, U.S. Army Ar-
mament Research, Development and Engineering Center, Armament Engi-
neering Directorate, Picatinny Arsenal, Dover, NJ (1989).
[2] Eriksen, S. and Str0ms0e, E., An Examination of Deterioration
of Ammunition by Storage, AD-A055-897, Norwegian Defence Research
Establishment, Norway (1978).
[3] Forsyth A., Smith J, Dowins D. and Fair H. The Long Term Storage
on Special Purpose Lead Azide, AD-751-760, Picatinny Arsenal, Dover,
NJ (1972).
[4] IMSL (1984) International Mathematical and Statistical Library:
User's Manual Ed. 9.2, Houston TX.
[5] Korn, E. and Whittemore, A., "Methods for Analyzing Panel Studies
of Acute Health Effects". Biometrics, 35, 795-802 (1979).
[6] McCullagh, P. and Nelda, J. A., Generalized Linear Models, Chap-
man and Hall, London (1983).
[7] Nelson, W., Accelerated Testing, Statistical Models, Test Plans,
and Data Analysis, John Wiley & Sons, NY, (1990).
[8] SAS SAS/STAT User's Guide, Vol. 2, Version 6. Fourth Ed.
Cary, NC, (1990).
[9] Searle, S. R., Casella, G. and McCulloch, C. E., Variance Compo-
nents, John Wiley & Sons, Inc., New York (1992).
[10] Sohn, S. Y., "An Analysis of a Random Effect Logistic Regression
Model to Predict Ammunition Stockpile Deterioration," Technical Report,
NPS-OR-92-013, Naval Postgraduate School, CA (1992).
16

[11] Stiratelli, R., Laird, N. and Ware, J. H., "Random-Effects Models
for Serial Observations with Binary Response," Biometrics, 40, 961-971
(1984).
[12] Supply Bulletin SB 742-1, Inspection of Supplies and Equip-
ment: US Army Ammunition Surveillance Procedures, Headquarters,
Department of the Army, Washington DC (1988).
[13] Valdez-Flores, C. and Feldman, R., "A Survey of Preventive Mainte-
nance Models for Stochastically Deteriorating Single-Unit System," Naval
Research Logistics, 36, 419-446 (1989).
[14] Whitehead, J., "Sequential Methods for Monitoring Declining Qual-
ity, with Application to the Long-Term Storage of Seeds," Biometrics, 45,
13-22 (1989).
17

Table 1: Number of Defectives yij Observed in Sample Size of 20 at the jth
Inspection of Lot i
group 1 group 2
lot i
S1 2 3 4 5 6 7 8 9 10
3 0 0 0 0 0 0 0 0 0 0
6 0 0 0 0 0 0 0 0 0 0
9 0 0 0 0 0 0 0 0 0 0
12 0 1 1 0 0 1 0 1 1 1
15 1 1 1 1 1 1 1 1 1 1
I, 0.1494 0.1966 0.1966 0.1494 0.1494 0.1966 0.1494 0.1966 0.1966 0.1966
se(3,) 0.0813 0.0644 0.0644 0.0813 0.0813 0.0644 0.0813 0.0644 0.0644 0.0644
group 3 group 4
lot i
ttý 11 12 13 14 15 16 17 18 19 20
3 0 0 0 0 0 0 0 0 0 0
6 0 0 0 0 1 0 1 1 1 1
9 1 0 0 0 2 1 2 2 3 2
12 1 1 1 1 3 3 4 4 5 4
15 1 1 1 1 5 5 6 6 8 6
,3 0.2197 0.1966 0.1966 0.1966 0.2836 0.3827 0.3520 0.3520 0.3627 0.352o
se(f) 0.0583 0.0644 0.0644 0.0644 0.0471 0.0414 0.0421 0.0421 0.0414 0.0421
• 18

Table 2: Fitted Between-Lot Model
I ,• z'fvz
1 -1.6058 0.0631 0.0316 0.0257 0.0163
2 -1.5432 0.0316 0.0490 0.0236 0.0149
3 -1.3566 0.0257 0.0236 0.0297 0.0121
4 -0.9547 0.0163 0.0149 0.0121 0.0106
Table 3: Scenario for Location and Duration of Storage
Depot 1 2 3 4
Period [0,1] [1,5] [5,6] [6,-]
19 b

Figure 1: Deteriorating Patterns of Ammunition Quality
0.54i
0.45 Actual/
0 Lot 10.4 C
Lot 6/
0.35 A LotiS I> /
x Lot 16S0.3 /
/o ,0 Fitted*. 0.25 x/
o Lot I- /S0.2 ----- LotS 6
Lo I___/
75 0.15 Lot1xE
Lot 16U/
0.1
0.05 " -
0A -,- -
3 6 9 12 15
Year
20

Figure 2. ?egments of the Predicted Cumulative ProportionDefective of the Ammunition Lot under Constant Stress
0.03Depot 4
Depot 3 11
0.025
> 0.02 //Depot 2
C, / / /,
4-/
a,/ / /"
o Depot 1" / / /
o / , ,
S0.01o /"
"7/ '/Dpo
/ / / --
o .01s /.•,EU
0.005
0-
0 2 4 6 8 10
Year
21

Figure 3. Predicted Cumulative Proportion Defectiveof the Ammunition Lot under Step-Stress
0.9
0.8
0.7
US0.60
•0.500.0
0.4
"_ Depot 475 0.3E
0.2Depot 3
Depot 20.1 44
Depot 1
0o
0 5 10 15 20
Year
22

ACKNOWLEDGMENT
I would like to thank Mr. Larry Massa and John Bowden fromn Naval
Surface Warfare Center, Crane IN for discussions we had concerning the
ammunition deterioration under step-stress. I also thank Ms. Therese
Bilodeau for her editorial assistance. This research was partially sponsored
by U.S. Naval Surface Weapon Center, Crane IN. The opinions express,ýd
are solely those of the author.
INITIAL DISTRIBUTION LIST
1. Office of Research Administration (Code 08) ................................................... 1Naval Postgraduate SchoolMonterey, CA 93943-5000
2. Dudley Knox Library (Code 52) .................................................................... 2Naval Postgraduate SchoolMonterey, CA 93943-5002
3. Defense Technical Information Center .......................................................... 2Cameron StationAlexandria, VA 22304
4. Department of Operations Research (Code OR) .............................................. 1Naval Postgraduate SchoolMonterey, CA 93943-5000
5. Naval Surface Warfare Center ....................................................................... 1ATTN: Mr. Larry MassaCrane, IN 47522-5000
6. N aval Surface W arfare Center ............................................................................. 1ATIN: Mr. John BowdenCrane, IN 47522-5000
7. Department of Administrative Sciences (Code AS/Kk) ................................. 1Naval Postgraduate SchoolMonterey, CA 93943-5000
8. Prof. So Young Sohn (Code OR/Sh) ............................................................ 20Naval Postgraduate SchoolMonterey, CA 93943-5000
9. Prof. Lyn R. Whitaker (Code OR/Wh) .......................................................... 1Naval Postgraduate SchoolMonterey, CA 93943-5000
10. Prof. Michael Bailey (Code OR/Ba) ............................................................... 1Naval Postgraduate SchoolMonterey, CA 93943-5000