NPL, Debt Restructuring and Structured Finance · How This May Be Achieved? (1/2) • There are...
21
NPL, Debt Restructuring and Structured Finance 1 Confidential © Copyright Risk Control Limited 2015 Structured Finance Presentation by William Perraudin to the EBA Board of Supervisors Away Day July 10th 2015
Transcript of NPL, Debt Restructuring and Structured Finance · How This May Be Achieved? (1/2) • There are...

NPL, Debt Restructuring and Structured Finance
1Confidential © Copyright Risk Control Limited 2015
Structured Finance
Presentation by William Perraudin to the EBA Board of Supervisors Away DayJuly 10th 2015
Contents
1. The benefits of cleaning bank balance sheets following a crisis
2. How this may be achieved?
3. The current state of NPLs in Europe
4. Where does the NPL portfolio market in Europe stand?
5. How could securitisation facilitate disposal of NPL portfolios?
6. What are the impediments to sale of portfolios and securitisation?
2Confidential © Copyright Risk Control Limited 2015
a. Current state of provisioning
b. Accounting rules
c. Access to funding and capital rules for securitisations
d. Role of the rating agencies
7. Suggestions for policies to accelerate progress

Benefits of Cleaning Bank Balance Sheets Following a Crisis
• It was a common place among policymakers that the Swedish handling of their early 1990s banking crisis was exemplary in rapidly resolving impaired loans and recapitalising banks
• In contrast, Japan’s more passive handling of their early 1990s asset bubble collapse has been widely criticised because it left banks to reconstruct their own balance sheets gradually contributing to economic stagnation
• Direct comparison of the two episodes is facile but it is uncontroversial that leaving banks with a heavy burden of Non-Performing Loans (NPLs) on their
3Confidential © Copyright Risk Control Limited 2015
leaving banks with a heavy burden of Non-Performing Loans (NPLs) on their balance sheets and weak capital ratios impairs economic activity
• How?1. Cost – NPLs imply heavy cost of carry in that funding costs exceed interest, NPLs
absorb capital, NPLs impose high administrative and management costs2. Opaqueness – NPLs reduce transparency, discouraging investors and hence
boosting the cost of raising new capital• Banks are not constituted to act as distressed debt funds, the sooner they can
revert to their business model, the sooner flows of credit and investment can resume

How This May Be Achieved? (1/2)
• There are different organisational forms in some cases involving “bad bank” arrangements
Structured solution Banking entity
On-balance sheet:
On balance sheet guarantee:Bank protects part of its portfolio through external guarantees.
Can be implemented quickly, thus can be used as a first step to stabilizing a bank
Internal restructuring unit:Building up an internal bad bank or restructuring unit.
The separate unit ensures management focus, efficiency and clear incentives
Increases transparency of core bank’s performance with separate
4Confidential © Copyright Risk Control Limited 2015
as a first step to stabilizing a bank
No balance sheet de-consolidation and limited risk transfer
High structural complexity which limits the attractiveness to outside investors
Increases transparency of core bank’s performance with separate financial reports
No balance sheet de-consolidation and limited risk transfer
Off-balance sheet:
Off balance sheet SPE:Bank offloads part of its portfolio into a special purpose entity (SPE), which is usually government-sponsored.
Toxic assets are removed from balance sheet
High complexity due to asset heterogeneity, always placed upon conservative ratings
Bad bank spin-off:Dispose the asset into a legally separated entity (external bad bank).
Most efficient bad bank solution. Ensures maximum risk transfer
Cost of the transaction is high (typically from transfer of customers with performing loans)
High operational complexity considering legal, tax, accounting frameworks
Source: McKinsey

How This May Be Achieved? (2/2)
Work out on balance sheet
Hedging
Accelerated
Recovery
Restructuring
Extracting value from the assets:• Passive rundown. The
bank maintains positions on balance sheet managing delinquencies internally
• Transactions. Asset sales or securitisations.
• Work-out on balance sheet. The bank may
5Confidential © Copyright Risk Control Limited 2015
Portfolio reduction strategies
Workout
Transactions(portfolios or single
assets)
Securitisations
Carve-out/ outright sale/ structured sale
Passive Rundown
sheet. The bank may accelerate recovery by actively negotiating with borrowers offering restructuring, discounts etc. or following work-out process if already defaulted.

State of NPLs in Europe (1/3)
% 2010 2011 2012 2013 2014
Italy 10.0 11.7 13.7 16.5 17.3
Spain 4.7 6.0 7.5 9.4 8.5
Germany 3.2 3.0 2.9 2.7 2.6
France 3.8 4.3 4.3 4.5 5.2
United Kingdom 4.0 4.0 3.6 3.1 2.7
Ireland 13.0 16.1 25.0 25.7 18.7
Greece 9.1 14.4 23.3 31.9 34.3
Netherlands 2.8 2.7 3.1 3.2 3.1
Russia 8.2 6.6 6.0 6.0 6.7
Cyprus 5.8 10.0 18.4 38.6 45.4
• Levels are highly correlated with sovereign credit problems (one may show they are very closely and directly related to sovereign CDS spread levels)
• The more creditor friendly the insolvency regime, the more resolutely positive is the trend
NPL to Total Loan Ratio
6Confidential © Copyright Risk Control Limited 2015
Source: World Bank and author’s calculations
Cyprus 5.8 10.0 18.4 38.6 45.4
Portugal 5.2 7.5 9.8 10.6 11.2
Poland 4.9 4.7 5.2 5.0 4.9
Austria 2.8 2.7 2.8 2.9 3.9
Turkey 3.5 2.6 2.7 2.6 2.8
Denmark 4.1 3.7 6.0 4.6 4.5
Romania 11.9 14.3 18.2 21.9 15.3
Hungary 10.0 13.7 16.0 16.8 15.6
Ukraine 15.3 14.7 16.5 12.9 19.0
Czech Republic 5.4 5.2 5.2 5.2 5.6
Sweden 0.8 0.7 0.7 0.6 0.6
Norway 1.5 1.7 1.5 1.3 1.3
Slovakia 5.8 5.6 5.2 5.1 5.3
Finland 0.6 0.5 0.5 0.5 1.0
resolutely positive is the trend• Some countries on the mend –
especially Ireland• Others trending upwards – e.g., Italy
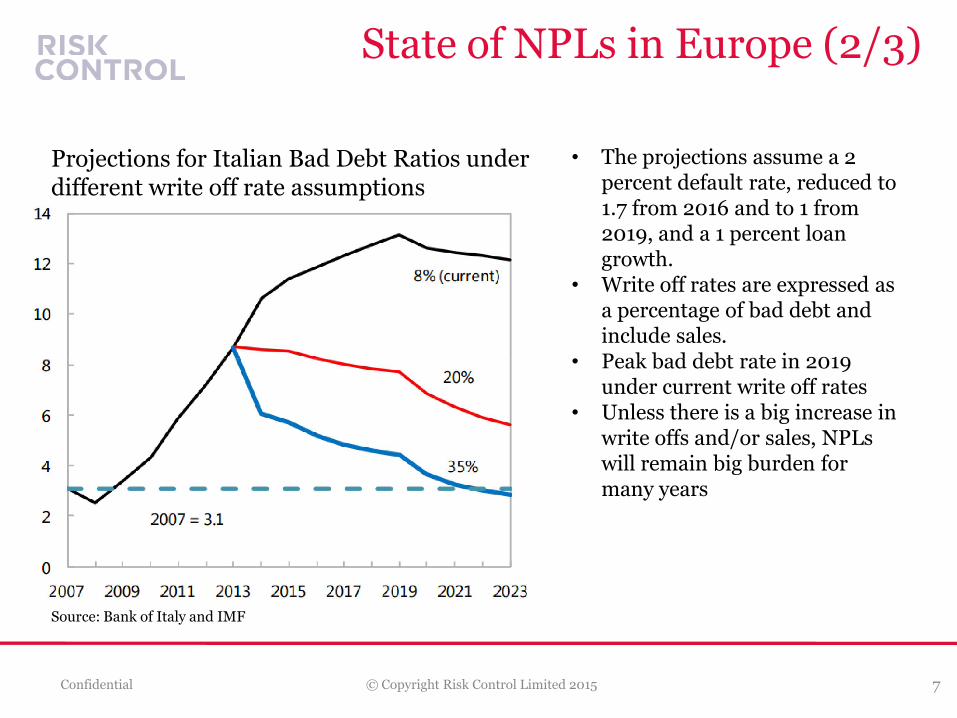
• The projections assume a 2 percent default rate, reduced to 1.7 from 2016 and to 1 from 2019, and a 1 percent loan growth.
• Write off rates are expressed as a percentage of bad debt and include sales.
• Peak bad debt rate in 2019
State of NPLs in Europe (2/3)
Projections for Italian Bad Debt Ratios under different write off rate assumptions
7Confidential © Copyright Risk Control Limited 2015
Source: Bank of Italy and IMF
• Peak bad debt rate in 2019 under current write off rates
• Unless there is a big increase in write offs and/or sales, NPLs will remain big burden for many years

% 2010 2011 2012 2013 2014
Italy 60.2 64.6 79.7 89.9 93.4
Spain 18.7 30.1 26.9 39.6 32.0
Germany 34.2 31.6 27.4 23.8 NA
France 17.2 20.8 19.3 19.8 NA
United Kingdom 16.9 16.1 13.9 9.5 NA
Ireland 80.8 63.6 81.8 78.1 NA
Greece 42.0 -484.1 218.8 138.9 120.5
Netherlands 47.3 44.2 46.7 50.4 42.2
Russia 9.6 9.5 9.5 10.1 12.8
Cyprus 38.0 NA 132.0 413.6 274.9
NPL Net of Provisions to Capital Ratio
State of NPLs in Europe (3/3)
• The scale of the problem faced by some banking systems is revealed by the ratios of NPLs net of provisions to capital
• These are significant for some countries that are not particularly associated with the recent crisis such as the Netherlands and Denmark
8Confidential © Copyright Risk Control Limited 2015
Source: International Monetary Fund
Portugal 20.6 NA 41.2 40.2 NA
Poland 11.5 11.6 12.9 12.1 NA
Austria 8.2 8.0 6.9 5.8 13.8
Turkey 2.4 2.5 3.0 3.1 3.5
Denmark 23.7 24.8 32.1 33.6 32.8
Romania 15.7 NA 15.7 12.1 NA
Hungary 49.7 NA 56.2 46.7 38.4
Ukraine 29.2 NA 25.1 30.7 61.1
Czech Republic 25.6 NA 22.4 21.2 23.0
Sweden 11.2 9.7 9.4 8.8 NA
Norway 10.6 12.2 9.9 8.0 NA
Slovakia 16.7 15.5 13.3 13.1 15.8
Finland 5.1 5.5 5.7 5.3 NA
as the Netherlands and Denmark

Spain, 21
Germany, 6
Belgium, 11.5
Italy, 5
Italy, 7.5
Netherland, 2
Other, 1
Other, 0.5
Other, 4.5
Estimated,41
50
60
70
80
90
100
Face Value (€bn)
€46bn
€64bn
€91bn
€100bn
European NPL portfolio market (1/2)
• Figures are based on the location of the head office of the bank selling the assets
• Clear upward trend in volumes
• Only recently have crisis country NPLs become the majority of
9Confidential © Copyright Risk Control Limited 2015
Source: PwC
U.K, 10
U.K, 23.5 U.K, 21.5Ireland, 3
Ireland, 2
Ireland, 30.5
Spain, 9
Spain, 9.5Germany,
10
Germany, 10
France, 9
Italy, 4
Other, 1
Completed,20
In progress,39
0
10
20
30
40
2012 2013 2014 2015
(€bn) become the majority of face value transacted
• Italy small contribution relative to problem
• Ireland on the increase
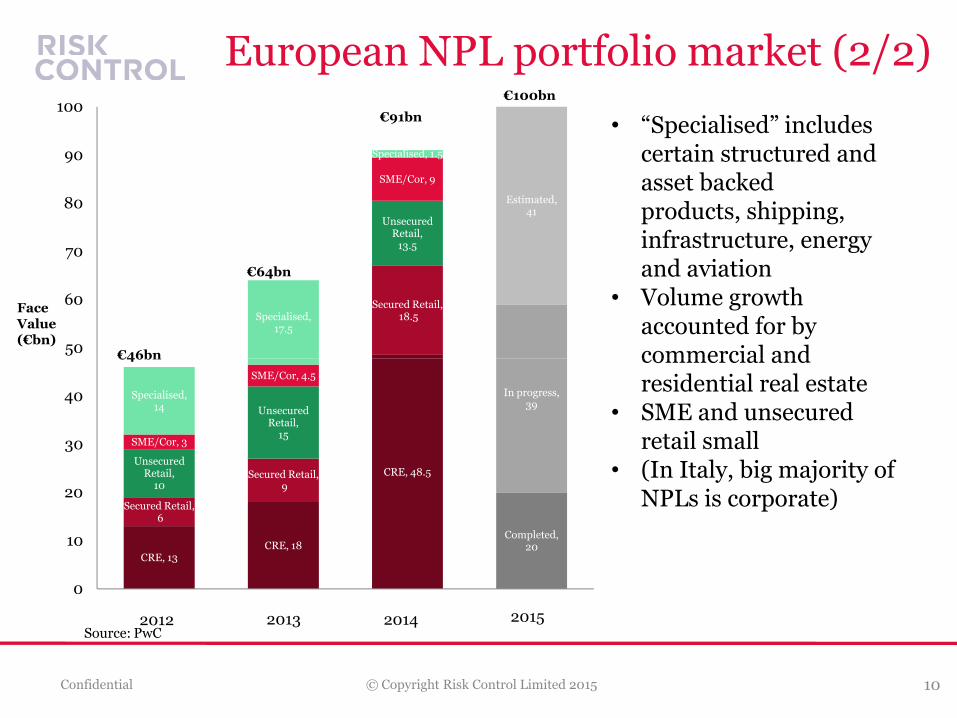
Secured Retail,18.5
Unsecured Retail,
13.5
SME/Cor, 9
Specialised,17.5
Specialised, 1.5
Estimated,41
50
60
70
80
90
100
Face Value (€bn)
€46bn
€64bn
€91bn
€100bn
• “Specialised” includes certain structured and asset backed products, shipping, infrastructure, energy and aviation
• Volume growth accounted for by commercial and
European NPL portfolio market (2/2)
10Confidential © Copyright Risk Control Limited 2015
CRE, 13CRE, 18
CRE, 48.5
Secured Retail,6
Secured Retail,9
Unsecured Retail,
10
Unsecured Retail,
15SME/Cor, 3
SME/Cor, 4.5
Specialised, 14
Completed,20
In progress,39
0
10
20
30
40
€46bn
2012 2013 2014 2015
commercial and residential real estate
• SME and unsecured retail small
• (In Italy, big majority of NPLs is corporate)
Source: PwC
• In Italy, there has been a long standing use of securitisation as a vehicle for NPL sales
• (The very first transactions after the Italian securitisation law was passed in 1999 was an NPL trade)
• The market was active from 2000-2005 and then, like the rest of the securitisation market, died (apart from retained deals) post crisis
• Recently, large US investors have been active in buying Italian securitisations and some trades have used the technology of
Securitisation and NPL disposal
11Confidential © Copyright Risk Control Limited 2015
securitisations and some trades have used the technology of securitisation
• Often the investor buys the equity tranche and the senior tranches provide financing
• Securitisation is a natural tool in this market because extreme expertise is involved in selecting and managing non-performing assets and those who have this expertise and risk appetite are not necessarily in a position to provide financing
Is the Technology of Securitisation Not Compromised?
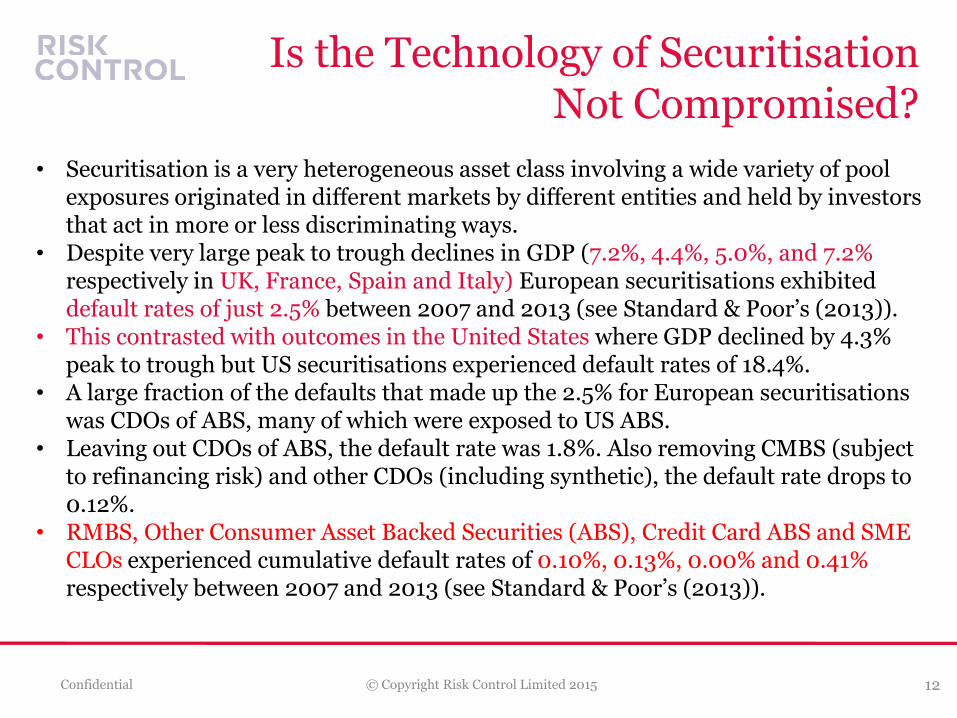
• Securitisation is a very heterogeneous asset class involving a wide variety of pool exposures originated in different markets by different entities and held by investors that act in more or less discriminating ways.
• Despite very large peak to trough declines in GDP (7.2%, 4.4%, 5.0%, and 7.2% respectively in UK, France, Spain and Italy) European securitisations exhibited default rates of just 2.5% between 2007 and 2013 (see Standard & Poor’s (2013)).
• This contrasted with outcomes in the United States where GDP declined by 4.3% peak to trough but US securitisations experienced default rates of 18.4%.
12Confidential © Copyright Risk Control Limited 2015
peak to trough but US securitisations experienced default rates of 18.4%.• A large fraction of the defaults that made up the 2.5% for European securitisations
was CDOs of ABS, many of which were exposed to US ABS. • Leaving out CDOs of ABS, the default rate was 1.8%. Also removing CMBS (subject
to refinancing risk) and other CDOs (including synthetic), the default rate drops to 0.12%.
• RMBS, Other Consumer Asset Backed Securities (ABS), Credit Card ABS and SME CLOs experienced cumulative default rates of 0.10%, 0.13%, 0.00% and 0.41%respectively between 2007 and 2013 (see Standard & Poor’s (2013)).

Impediments to NPL Sales and Securitisation
• The obstacles to (i) selling NPLs and (ii) using securitisation as a vehicle, are familiar but intractable problems that show no sign of diminishing soon.
• They area. Bank incentives to sell assets are diluted by
accounting rulesb. Finding investors willing to invest in securitisations is
13Confidential © Copyright Risk Control Limited 2015
b. Finding investors willing to invest in securitisations is hampered by the post crisis regulatory environment which is, in turn, exacerbated by the reliance on agency ratings in capital rules

Current State of Provisioning
• “The average provisioning coverage for Italian banks has declined from 48 percent in 2007 to a low of 37 percent in June 2012.
• As a result of the Bank of Italy’s special loan inspections and in
Italian Bank Nonperforming Loans and Coverage Ratio, June 2014
14Confidential © Copyright Risk Control Limited 2015
inspections and in preparation for the European AQR, provisioning coverage has subsequently increased to 42 percent in June 2014” IMF study
Source: Bank of Italy and ECB.

Accounting Rules (1/2)
• Provisions (when prudently calculated on a forward-looking basis) are worked out by
1. Forecasting cash-flows on NPLs 2. Calculating net present value3. Setting Provision = Book value - NPV
• Key issue is that the discount rate employed in the NPV calculation is the discount rate on the loan at origination
• If the credit quality of the loan has declined (which must be true for an
15Confidential © Copyright Risk Control Limited 2015
• If the credit quality of the loan has declined (which must be true for an NPL) , then the NPV will exceed the value that a market investor would assign
• (The investor will demand a rate that compensates them for expected losses and provides a risk premium)
• This creates a price gap between the bank’s internal accounting value and the market value
• The price gap has been in the range 15-20% which has served to discourage sale of NPL portfolios
Accounting Rules (2/2)
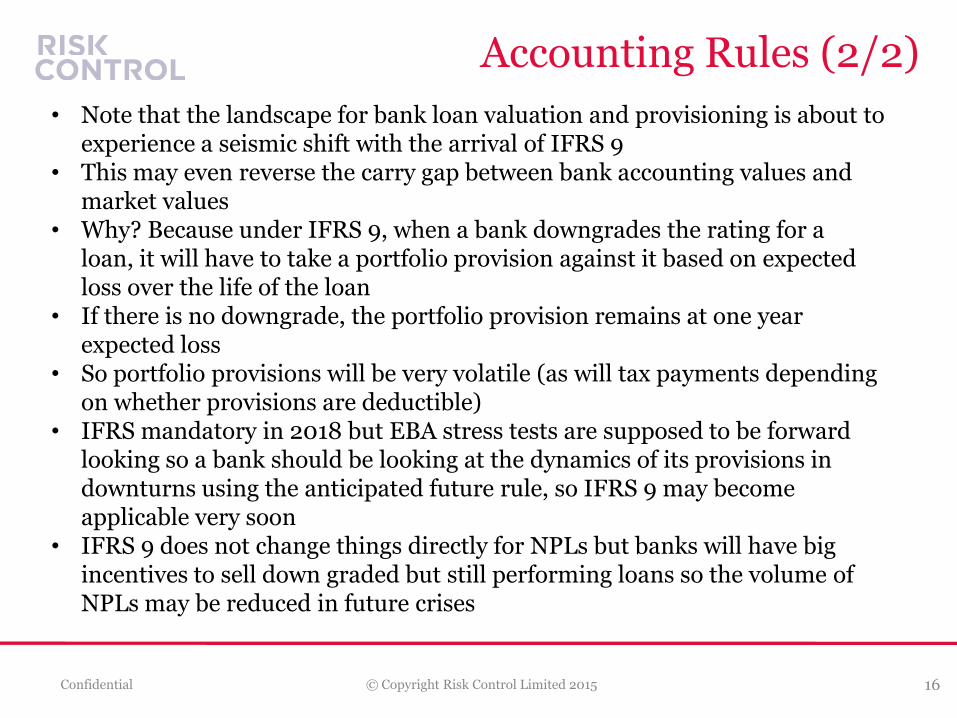
• Note that the landscape for bank loan valuation and provisioning is about to experience a seismic shift with the arrival of IFRS 9
• This may even reverse the carry gap between bank accounting values and market values
• Why? Because under IFRS 9, when a bank downgrades the rating for a loan, it will have to take a portfolio provision against it based on expected loss over the life of the loan
• If there is no downgrade, the portfolio provision remains at one year expected loss
16Confidential © Copyright Risk Control Limited 2015
• So portfolio provisions will be very volatile (as will tax payments depending on whether provisions are deductible)
• IFRS mandatory in 2018 but EBA stress tests are supposed to be forward looking so a bank should be looking at the dynamics of its provisions in downturns using the anticipated future rule, so IFRS 9 may become applicable very soon
• IFRS 9 does not change things directly for NPLs but banks will have big incentives to sell down graded but still performing loans so the volume of NPLs may be reduced in future crises

Capital Rules for Securitisations
• As already mentioned, it is natural to think of using securitisation structures in NPL deals because of the combination of risk bearing and managing expertise and financing that is required
• The availability of financing, however, is within Europe constrained by the capital rules as they apply to European institutions, specifically banks and insurers
• The existing Basel II capital rules and the new rules announced in BCBS 303 are profoundly conservative as far as European banks are concerned
• This is because:
17Confidential © Copyright Risk Control Limited 2015
1. European banks are not allowed to use proxies in calculating the pool capital inputs to the Basel formulae based approaches except when they are the originators
2. Hence they must employ agency ratings based approaches for calculating capital for the vast majority of their positions
3. Ratings agency criteria have shifted since the crisis so that the Basel II look-up table for capital is no longer appropriately calibrated
4. Also sovereign ratings floors play a crucial role in some markets5. In any case, the formulae suggested in BCBS 303 are themselves very
conservative (although not as conservative as the ratings based approach)

Role of the Rating Agencies
• The Toronto G20 adopted the objective of reducing reliance on agency ratings in financial regulation
• This was implemented by the US through Dodd-Frank• But the direction of regulatory change in Europe, despite general policy
statements to the contrary, has been to entrench and extent the role of ratings• Rules on securitisation capital are a good example• Unless regulatory practices on calculation of KIRB change, securitisation capital
for European banks will depend on ratings• The EBA has recently gone to great trouble to propose a definition of High
18Confidential © Copyright Risk Control Limited 2015
• The EBA has recently gone to great trouble to propose a definition of High Quality or SST securitisations and an appropriate capital treatment
But the reduction in capital will be little if the ratings based capital formula is employed

Formula Based Securitisation Capital
• To facilitate use of securitisation in NPL deals, as in other areas of securitisation, reducing the role of ratings agencies is an important step
• To do this requires making it possible for banks to use a formula based approach like the BCBS 303 SEC-IRBA or SEC-SA approaches
• This could be achieved by (i) changing the hierarchy, (ii) deeming that the ratings based approach is ineligible for the jurisdiction in question (as the US has done and which is, of course, consistent with Basel, or (iii) permitting the use of proxies in SEC-IRBA securitisation capital
19Confidential © Copyright Risk Control Limited 2015
permitting the use of proxies in SEC-IRBA securitisation capital calculations
• There are technical problems that need addressing:1. The input KIRB required in the formula based approaches is designed
for performing loans2. It could be adapted for non-performing loans but this requires some
thought and analysis

Suggestions for Policies to Accelerate Progress
• Some caution is required in assessing possible steps• Taking more actions to oblige banks to increase write-offs or disposals
when there is already great (pro-cyclical) pressure on them to raise capital and increasing TLAC may not boost economic activity at all
• IFRS 9 will have a big impact on banks’ provisioning for performing assets in countries where internal ratings have dropped, i.e., all the crisis countries
20Confidential © Copyright Risk Control Limited 2015
countries• Facilitating the financing of market based solutions to reducing NPLs
does not have “procyclical” drawbacks• Even if institutional approaches involving bad banks are rejected as an
approach, there may be some role for the use of state guarantees

Contact
Website: www.riskcontrollimited.com
Telephone: +44 20 3307 0730
Address: 13-14 Dean Street, London, W1D 3RS, U.K.
William Perraudin, Director
21Confidential © Copyright Risk Control Limited 2015
William Perraudin, Director
Telephone: +44 20 3307 0731 (o) +44 7968 328 459 (m)
Email: [email protected]