NPI industry survey report - epa.sa.gov.au · NPI industry survey report ... I have used my...
64
NPI industry survey report collation of responses 2006 E N V I R O N M E N T P R O T E C T I O N A U T H O R I T Y
Transcript of NPI industry survey report - epa.sa.gov.au · NPI industry survey report ... I have used my...

NPI industry survey report collation of responses 2006
E N V I R O N M E N T P R O T E C T I O N A U T H O R I T Y

NPI industry survey report
collation of responses
2006
NPI industry survey report
collation of responses 2006
Author: A Ellson
For further information please contact:
Information Officer
Environment Protection Authority
GPO Box 2607
Adelaide SA 5001
Telephone: (08) 8204 2004
Facsimile: (08) 8204 2020
Free call (country): 1800 623 445
Website: <www.epa.sa.gov.au>
E-mail: <[email protected]>
ISBN 1 921125 26 8
October 2006
© Environment Protection Authority
This document may be reproduced in whole or part for the purpose of study or training, subject to the inclusion of an
acknowledgment of the source and to its not being used for commercial purposes or sale. Reproduction for purposes other than those
given above requires the prior written permission of the Environment Protection Authority.
Printed on recycled paper

CONTENTS
SUMMARY.........................................................................................1
1 INTRODUCTION.............................................................................3
2 SURVEY BACKGROUND AND DEVELOPMENT ..........................................4
3 SURVEY RESPONSES .......................................................................5
3.1 Technical support ..................................................................5
3.2 Reporting........................................................................... 24
3.3 Use of consultants and data .................................................... 36
4 SUMMARY OF RECOMMENDATIONS ................................................... 40
5 CONCLUSION AND FUTURE DIRECTION .............................................. 43
REFERENCES ................................................................................... 44
APPENDIX A SURVEY DESIGN (FACSIMILE) ............................................ 45
APPENDIX B ALL RESPONSES ............................................................ 52

List of Figures
Figure 1: Number of industry NPI reporters in South Australia and Australia .................. 3
Figure 2: I have used the NPI website and I have found the website useful.................... 5
Figure 3: I have used the SA EPA website and I have found the website useful ............... 6
Figure 4: I have used my industry’s EET Manual and I found the manual to be useful........ 7
Figure 5: Usefulness of manuals as per ANZSIC code ............................................... 8
Figure 6: I have used emission factors and I found the factors to be representative ......... 9
Figure 7: Representativeness of emission factors as per ANZSIC Code ......................... 10
Figure 8: I have used the NPI Guide and I found the guide to be useful ....................... 11
Figure 9: Usefulness of the combustion in boilers tool............................................ 12
Figure 10: Usefulness of the FOLS tool .............................................................. 12
Figure 11: Usefulness of the LABS tool .............................................................. 13
Figure 12: Usefulness of the winery tool ............................................................ 13
Figure 13: Usefulness of the WATER9 tool .......................................................... 14
Figure 14: Usefulness of the piggery tool ........................................................... 14
Figure 15: I would attend the workshop and the workshop should include….................. 15
Figure 16: I have spoken to an NPI team member and I found the interaction useful ....... 17
Figure 17: I would like to receive NPI publications and receive information on…............ 18
Figure 18: I would like to receive a reminder and I would like to receive it via…............ 19
Figure 19: In future an important form of technical support will be… ......................... 21
Figure 20: Assistance with greenhouse gases required............................................ 22
Figure 21: Assistance with waste transfers required .............................................. 23
Figure 22: Understanding of NPI substances threshold............................................ 25
Figure 23: Understanding of TVOC threshold ....................................................... 25
Figure 24: Understanding of fuel usage thresholds ................................................ 26
Figure 25: Understanding of nitrogen and phosphorus thresholds............................... 26
Figure 26: Understanding of technique selection .................................................. 27
Figure 27: Understanding of mass balance EET .................................................... 28
Figure 28: Understanding of emission factors EET ................................................. 29
Figure 29: Understanding of engineering calculations EET ....................................... 29
Figure 30: Understanding of direct measurement EET ............................................ 30
Figure 31: Reporting method .......................................................................... 31
Figure 32: Usability of the NRT ....................................................................... 31
Figure 33: Usability of the paper reporting form .................................................. 31
Figure 34: Reasons for reporting via the paper reporting form.................................. 32
Figure 35: Usefulness of third-party validation .................................................... 34

Figure 36: Increased EPA feedback................................................................... 35
Figure 37: I would use an online reporting system ................................................ 35
Figure 38: I have used a consultant .................................................................. 37
Figure 39: I have used the data for non-NPI purposes and I found the data useful .......... 37
Figure 40: Public shown interest in NPI data ....................................................... 38

NPI industry survey report—collation of responses
SUMMARY
The South Australian Environment Protection Authority (SA EPA) conducted a survey of
industry National Pollutant Inventory (NPI) reporters to determine their current and
future needs in relation to the NPI. The survey was aimed at companies who are
currently submitting NPI reports for South Australian facilities.
This report explains the background and design of the survey, and addresses responses
to each survey question.
Based on the results of the survey, a number of recommendations have been made that
the SA EPA will consider for incorporation into an industry communication plan. This
plan will be designed to ensure the needs of industry NPI reporters in South Australia are
met.
1

2
1
NPI industry survey report—collation of responses
INTRODUCTION
The National Pollutant Inventory (NPI) is an internet database1 that provides information
to the community, industry and government on the type and amounts of pollutants (90
substances2) emitted to the environment (air, land and water) throughout Australia. The
NPI provides pollutant emission estimates for industrial and commercial sources, and for
diffuse emissions.
Industry is required to estimate the pollutants emitted from their facility on an annual
basis and report them to the relevant environmental authority in their state. To assist
industry with reporting, a number of tools have been developed, both on a state and
national basis, including:
National Pollutant Inventory Guide3 (to provide an overview of NPI reporting
requirements and general information)
industry specific manuals and handbooks (including calculation methods and
default emission factors)
calculation tools (designed to assist industry estimate their emissions from
various parts of their facility).
The guide, manuals and calculation tools are updated when required.
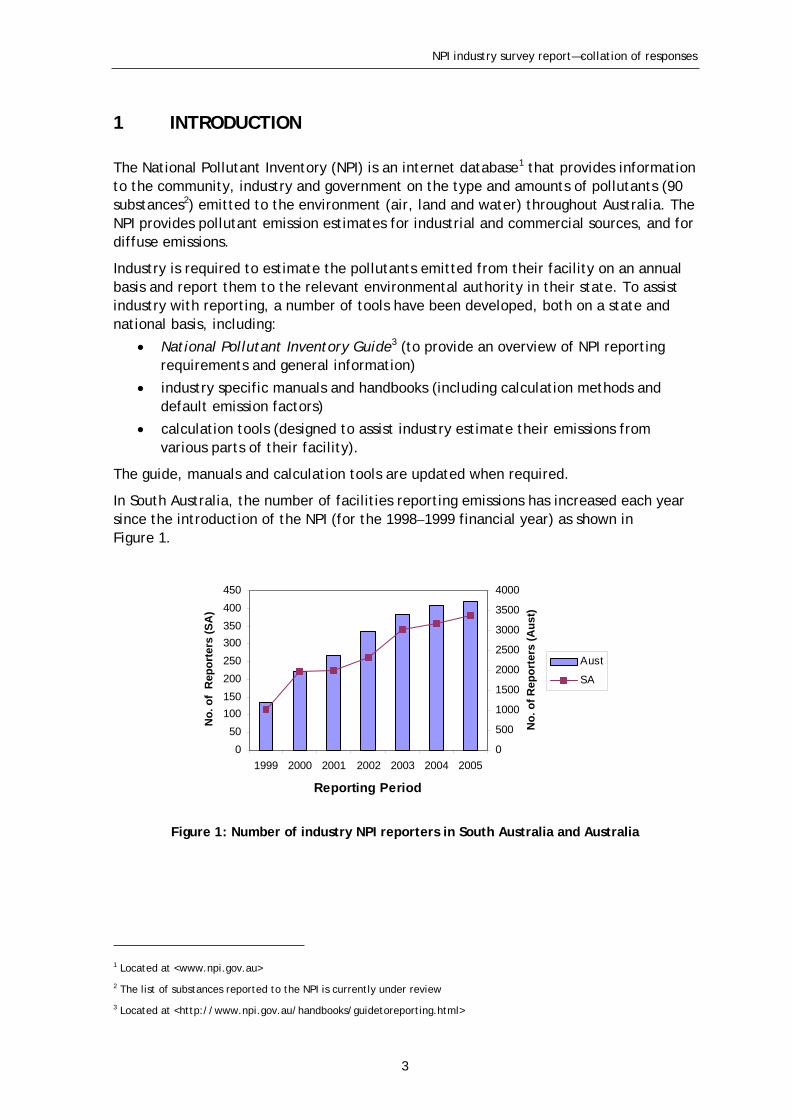
In South Australia, the number of facilities reporting emissions has increased each year
since the introduction of the NPI (for the 1998–1999 financial year) as shown in
Figure 1.
0
50
100
150
200
250
300
350
400
450
No
. o
f R
ep
ort
ers
(S
A)
0
500
1000
1500
2000
2500
3000
3500
4000
No
. o
f R
ep
ort
ers
(A
us
t)
SA
Aust
1999 2000 2001 2002 2003 2004 2005
Reporting Period
Figure 1: Number of industry NPI reporters in South Australia and Australia
1 Located at <www.npi.gov.au>
2 The list of substances reported to the NPI is currently under review
3 Located at <http://www.npi.gov.au/handbooks/guidetoreporting.html>
3

2
NPI industry survey report—collation of responses
SURVEY BACKGROUND AND DEVELOPMENT
Since the introduction of the NPI, the SA EPA has focused on:
contributing to the development and maintenance of manuals and handbooks
informing industry of the existence of the NPI
contacting potential industry NPI reporters
assisting facilities with their NPI reports
developing and implementing procedures for validation of industry NPI reports
contributing to the development and testing of the calculation tools.
While the manuals, reporting and validation process will require continual review and
maintenance, the SA EPA has recognised the need for targeting its efforts in relation to
industry reporting. It has become apparent that there is a need to increase industry’s
awareness of the NPI and assist facilities with the NPI reporting process.
In response to this, a survey was prepared based on a similar questionnaire conducted in
Queensland and Northern Territory (Appendix A). The layout, wording and some
questions were adopted to allow for possible interstate comparison later, if required.
The scope of the survey is to determine where improvements can be made to the NPI
reporting process so that the needs of industry are met. The 203 companies, reporting
on 381 facilities for the 2005 2006 reporting year, provided a reasonable number of
potential respondents for the survey.
Issues on a larger scale, such as overall benefits of the NPI program which industries
should report, and threshold levels, were not considered in this survey. These larger
issues were addressed via a survey and subsequent review of the NPI program and the
National Environment Protection Measure (NEPM) conducted by the Australian
government. This survey was completed in 2005 with the review currently underway.
4

NPI industry survey report—collation of responses
3 SURVEY RESPONSES
Surveys were distributed to 201 industry NPI reporters on 8 December 2005 with
reminders sent on 16 and 30 January 2006. Submissions officially closed on 31 January
2006. However, completed surveys were accepted and included in this report after that
date. Completion of the surveys was voluntary and the response rate was 59.1% (120 out
of 203 surveys).
3.1 Technical support
The first section of the survey focused on technical support that would assist industry,
and looked specifically at how industry rates current support and what future support
would be appropriate.
NPI website
Question 1: I have used the NPI website <www.npi.gov.au> [and if so] I have found
the website useful.
The NPI website is managed and maintained by the Australian government and the SA
EPA provides input to the website.
Of the 120 respondents to this questionnaire, 83% had used the website with 73% of
those finding it useful (Figure 2). It was of some concern that 17% of respondents had
never used the NPI website even though it contains valuable information on the
requirements for reporting to the NPI. Upon further consideration, it is thought that
there may be some valid reasons for this such as:
company has no access to the internet
relevant calculation methods and requirements have been determined by a
previous employee and are applied annually
all required information is supplied by the SA EPA upon contacting new reporters.
100%
90%
80%
70%
60%
50%
40%
30%
20%
10%
0%
100%
90%
80%
70%
60%
50%
40%
30%
20%
10%
0%
Yes No Strongly Agree Neutral Disagree Strongly
Agree Opinion Disagree
Figure 2: I have used the NPI website and I have found the website useful
5

NPI industry survey report—collation of responses
Only 8% of respondents who used the NPI website did not find the site useful. This
indicates that, for the majority of industry NPI reporters, the current information is
sufficient. Therefore, updating the website in relation to reporter information should
not be a high priority for SA EPA.
SA EPA website
Question 2: I have used the SA EPA website <www.epa.sa.gov.au> [and if so] I have
found the website useful.
A section of the SA EPA website has been dedicated to providing information on the NPI
<www.epa.sa.gov.au/npi.html> including general introductory information, quick links
to the NPI website for industry, and SA-specific summary data.
A total of 73% of respondents had used the SA EPA website (Figure 3). However, as the
question did not specify the NPI section of the website, it is impossible to determine
how many used that section. Of the SA EPA website users, 78% found the site useful, 16%
were of neutral opinion and only 6% did not find the site useful.
100% 100%
90% 90%
80% 80%
70% 70%
60% 60%
50% 50%
40%40%
30%30%
20%20%
10% 10%
0% 0%
Strongly Agree Neutral Disagree Strongly Yes No
Agree Opinion Disagree
Figure 3: I have used the SA EPA website and I have found the website useful
While this indicates that updating the NPI section of the SA EPA website is not
necessarily an urgent priority, the SA EPA has recognised the need for a review of the
entire website. A review and update of the NPI portion of the website will occur during
this review. In addition, all NPI web pages are reviewed every six months as part of an
ongoing process.
Emission Estimation Technique Manual(s)
Question 3: I have used the NPI Emission Estimation Technique Manual(s) for my
industry sector [and if so] I found the manual to be useful.
There are 93 Emission Estimation Technique (EET) Manuals available for download from
the NPI website. An industry sector may require one or more EET Manuals and nine of
the manuals are commonly used across multiple industry sectors.
A large majority, 77% of respondents, had used the EET Manual relevant to their
industry sector (Figure 4). While it is of concern that 23% have not used an EET Manual,
6

NPI industry survey report—collation of responses
this may be due to the development of calculation tools (which contain all the required
equations from the manual) specifically those for wineries and piggeries. The
calculation tools provide the equations and emission factors from the EET Manuals in an
Microsoft Excel spreadsheet. These tools, combined with the National Reporting Tool
(NRT) or paper reporting form, provide the means for NPI reporting required of wineries
and piggeries. It is possible that previous employees established the method for NPI
emission calculation themselves and their method has continued to be used since.
While these are valid reasons, it is of some concern that some companies do not use the
EET Manuals and therefore may not be aware of any updates to the manuals. Thus, the
SA EPA should provide regular updates to its reporters to ensure they are aware of
updates to any of the manuals. It is recommended that this be an ongoing process and
of medium priority.
100%
100% 90%
90% 80%
80% 70%
70%
60% 60%
50% 50%
40% 40%
30% 30%
20% 20%
10% 10%
0%0%
Yes No Strongly Agree Neutral Disagree Strongly
Agree Opinion Disagree
Figure 4: I have used my industry’s EET Manual and I found the manual to be useful
Of the EET Manual users, 18% found that their manual was not useful. These respondents
were from a range of industry sectors indicating that there may be an issue with the
layout and information contained in the manuals. The Australian government is
currently working on a shortened version of the manuals to simplify them to the
minimum information required for reporting. Explanation would still be available in the
extended version of the manuals if required. The cross-industry response to the
usefulness of manuals indicates that this project should be supported. However, as 59%
of reporters found the manuals useful, it should be of medium priority.
7

Table 1: Recommendations for Emission Estimation Technique Manuals
NPI industry survey report—collation of responses
100%
90%
80%
70%
60%
50%
40%
30%
20%
10%
0%
Cem
ent &
Lim
e M
fg
ongl y D i s agr
D i s agr ee
N l O io n
Ag
ongl y
S t r e e
e u t r a p in
r e e
S t r A g r e e
Min
ing
Mea
t Proce
ssin
g
Dai
ryPro
duct
Mfg
Win
e M
fg
Beer &
Malt M
fg
Timber
Res
awin
g& D
ress
ing
Wood
Produ
ct M
fg
Printin
g
Inor
gani
cChe
mistry
Mfg
Paint
Mfg
Rub
ber Tyr
eM
fg
Glass
Mfg
Met
al Coa
ting
&Fin
ishing
Autom
otive
Com
ponen
ts M
fg
Fabric
ated
Met
alM
fg
Batte
ry M
fg
Electric
ity S
upply
Petro
leum
Pro
duct W
holesa
ling
Figure 5: Usefulness of manuals as per ANZSIC code
For some industry sectors (based on the ANZSIC code) there were multiple respondents
who were not satisfied with their manual. Therefore, it was possible to identify those
manuals for which there are significant issues. It can be seen from Figure 5 that
respondents from Mining, Dairy Product Manufacturing, Timber Resawing and Dressing,
and Cement and Lime Manufacturing were not satisfied with their respective manuals
(Figure 5). Therefore, these related manuals should be targeted for review and take
priority over manuals with which the majority of respondents indicated their
satisfaction.
As the industry survey was designed to provide only a general overview, an in-depth look
at what was not useful about the EET manuals would be useful. This could be done by
carrying out a follow-up survey of industry sectors not satisfied with their manuals, or
by contacting respondents individually. As the Commonwealth is currently initiating a
review of all manuals, conducting additional surveys at this time would duplicate
workload. It would be more productive for the SA EPA to focus on supporting the
Commonwealth in its review process.
8

NPI industry survey report—collation of responses
Recommendations for SA EPA Priority
1 Send out information to industry NPI reporters on EET Manual updates Medium
2 Send new industry NPI reporters a ‘starter pack’ including hard copy and High
electronic resources of NPI information
3 Support and assist the Commonwealth with the provision of ‘short Medium
version manuals’
4 Support the Commonwealth during its review of manuals by providing Medium
information, and by contacting SA respondents if requested by the
Commonwealth
Emission factors
Question 4: I have used the emission factors for my industry sector [and if so] I
found the factors to be representative.
A number of methods for calculating emissions are outlined in the EET Manuals, one of
which is emission factors. This involves multiplying a measurable aspect of an industry
(e.g. amount of wood treated or kL of wine produced) by an emission factor to estimate
an emission for the facility.
Of the 120 respondents, 71% had used emission factors for their emission calculations
(Figure 6). The remaining 29% used other emission calculation techniques (mass balance,
direct monitoring or engineering calculations).
100%
90%
80%
70%
60%
50%
40%
30%
20%
10%
0%
100%
90%
80%
70%
60%
50%
40%
30%
20%
10%
0%
Yes No Strongly Agree Neutral Disagree Strongly
Agree Opinion Disagree
Figure 6: I have used emission factors and I found the factors to be representative
While 48% of emission factor users thought the relevant factors were accurate, 18% did
not and 34% were of neutral opinion. There was a range of industry sectors whose
respondents were not convinced of the representativeness of emission factors intended
for their industry. In addition, some industry sectors provided more than one negative
9
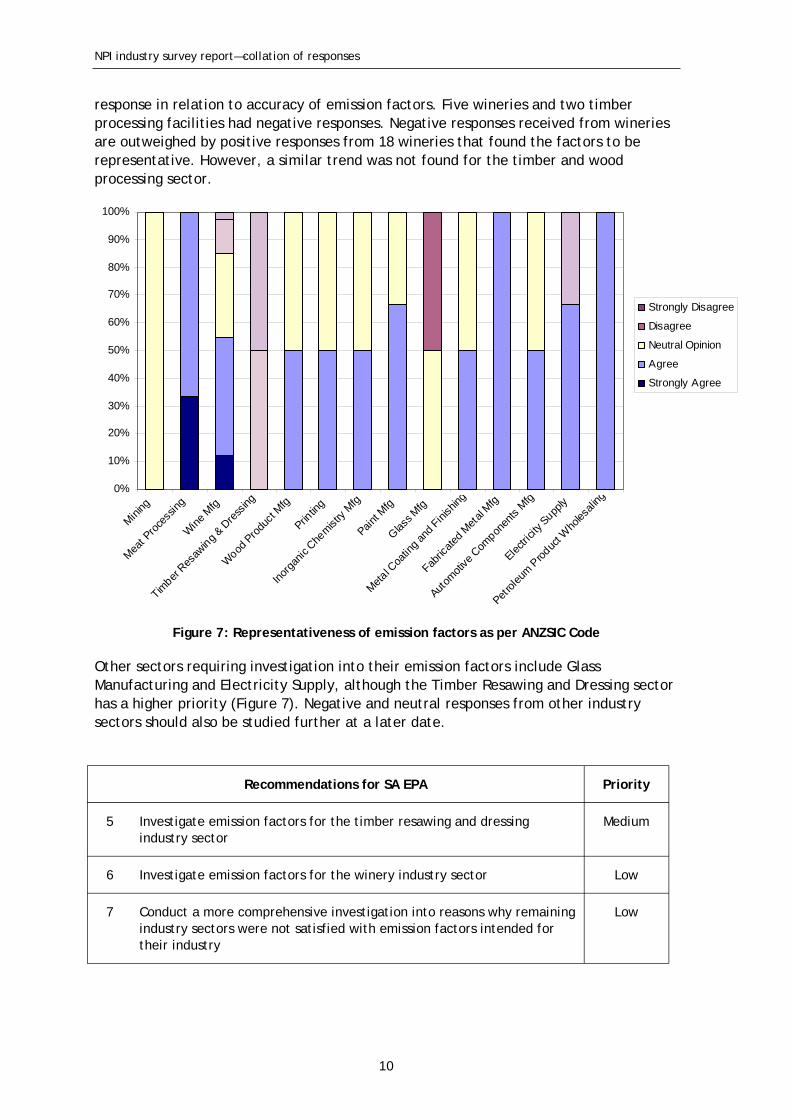
Table 2: Recommendations for emission factors
NPI industry survey report—collation of responses
response in relation to accuracy of emission factors. Five wineries and two timber
processing facilities had negative responses. Negative responses received from wineries
are outweighed by positive responses from 18 wineries that found the factors to be
representative. However, a similar trend was not found for the timber and wood
processing sector.
0%
10%
20%
30%
40%
50%
60%
70%
80%
90%
100%
Min
ing
Mea
t Pro
cess
ing
Win
e M
fg
Timber
Res
awin
g&
Dre
ssing
Wood
Pro
duct
Mfg
Printin
g
Inor
gani
c Che
mistry
Mfg
Paint
Mfg
Glass
Mfg
Met
al Coa
ting
and
Finishing
Fabric
ated
Met
al M
fg
Autom
otive
Com
ponen
ts M
fg
Electric
ity S
upply
Petro
leum
Pro
duct W
holesa
ling
S t r ongl y D i s agr ee
D i s agr ee
N e u t r a l O p in io n
Ag r e e
S t r ongl y A g r e e
Figure 7: Representativeness of emission factors as per ANZSIC Code
Other sectors requiring investigation into their emission factors include Glass
Manufacturing and Electricity Supply, although the Timber Resawing and Dressing sector
has a higher priority (Figure 7). Negative and neutral responses from other industry
sectors should also be studied further at a later date.
Recommendations for SA EPA Priority
5 Investigate emission factors for the timber resawing and dressing Medium
industry sector
6 Investigate emission factors for the winery industry sector Low
7 Conduct a more comprehensive investigation into reasons why remaining Low
industry sectors were not satisfied with emission factors intended for
their industry
10

NPI industry survey report—collation of responses
NPI Guide
Question 5: I have used the NPI Guide [and if so] I found the guide to be useful.
The NPI Guide is available on the NPI website and provides an overview of the NPI
including threshold calculations, general information on emission calculations, reporting
requirements and methods, the substances, useful equations and unit conversion
factors.
Three quarter (77%) of respondents had used the NPI Guide (Figure 8). The guide
provides much of the base information for reporting to the NPI. Thus, it was assumed
that the 23% who had not used the guide gained the required information from other
sources such as previous employees and SA EPA staff.
100% 100%
90% 90%
80% 80%
70% 70%
60% 60%
50% 50%
40% 40%
30% 30%
20%20%
10%10%
0% 0%
Yes No Strongly Agree Neutral Disagree Strongly
Agree Opinion Disagree
Figure 8: I have used the NPI Guide and I found the guide to be useful
The guide itself seems to be satisfactory in its current format with 74% of respondents
who had used the guide finding it to be useful. Thus no action on this is currently
required.
Calculation tools
Question 6: I am aware of the following calculation tools and have found them
useful:
combustion in boilers
FOLS (fuel and organic liquid storage)
LABS (emissions for landfills)
winery emissions
piggery emissions
WATER9 (emissions from wastewater treatment).
There are currently five calculation tools available on the NPI website: combustion in
boilers, FOLS, LABS, winery emissions and WATER9. In addition, the SA EPA has
developed a piggery emissions calculation tool available from the NPI team.
11

NPI industry survey report—collation of responses
Combustion in boilers
In addition to being available on the NPI website, the combustion in boilers tool is
incorporated into the NRT. Fifty-seven per cent of respondents reported using the tool
with 70% of those finding the tool useful (Figure 9). Due to the positive response in
relation to this tool, combined with the fact that this tool is maintained by the Victorian
EPA, no action on it is currently required.
0%
10%
20%
30%
40%
50%
60%
70%
80%
90%
100%
Strongly Agree Neutral Disagree Strongly
Agree Opinion Disagree
Figure 9: Usefulness of the combustion in boilers tool
Fuel and organic liquid storage
There are two tools available for the estimation of emissions for fuel and/or organic
liquid storage: TANKS, the more complicated of the two, and FOLS. This survey focuses
on FOLS. The FOLS tool was used by 31% of respondents, with 65% finding it useful
(Figure 10). Only 11% did not find it useful, thus no action is currently required for this
tool.
0%
10%
20%
30%
40%
50%
60%
70%
80%
90%
100%
Strongly Agree Neutral Disagree Strongly
Agree Opinion Disagree
Figure 10: Usefulness of the FOLS tool
12

NPI industry survey report—collation of responses
Emissions from landfills
Only 8% of respondents reported using the LABS calculation tool and the distribution of
positive and negative responses to this tool was similar (Figure 11). This is also an area
for which it is believed that additional facilities should be reporting. Therefore, this tool
requires further reviewing and updating.
0%
10%
20%
30%
40%
50%
60%
70%
80%
90%
100%
Strongly Agree Neutral Disagree Strongly
Agree Opinion Disagree
Figure 11: Usefulness of the LABS tool
Winery tool
Wineries make up one of the largest NPI reporting industry sectors in South Australia.
Some 37% of respondents used the winery calculation tool with 71% of them finding the
tool useful and only 10% reporting it was not useful (Figure 12). Thus, no immediate
action is required for this tool. However, it should be reviewed on a regular basis to
ensure its usability.
0%
10%
20%
30%
40%
50%
60%
70%
80%
90%
100%
Strongly Agree Neutral Disagree Strongly
Agree Opinion Disagree
Figure 12: Usefulness of the winery tool
13
NPI industry survey report—collation of responses
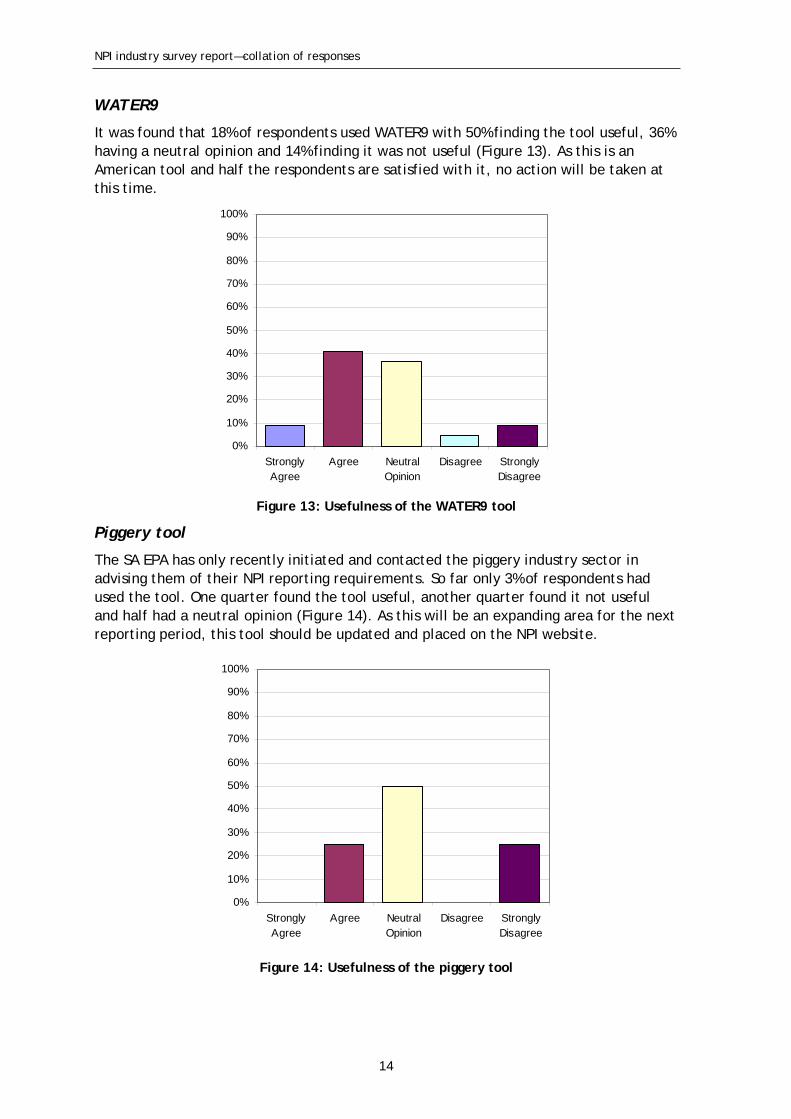
WATER9
It was found that 18% of respondents used WATER9 with 50% finding the tool useful, 36%
having a neutral opinion and 14% finding it was not useful (Figure 13). As this is an
American tool and half the respondents are satisfied with it, no action will be taken at
this time.
100%
90%
80%
70%
60%
50%
40%
30%
20%
10%
0%
Strongly Agree Neutral Disagree Strongly
Agree Opinion Disagree
Figure 13: Usefulness of the WATER9 tool
Piggery tool
The SA EPA has only recently initiated and contacted the piggery industry sector in
advising them of their NPI reporting requirements. So far only 3% of respondents had
used the tool. One quarter found the tool useful, another quarter found it not useful
and half had a neutral opinion (Figure 14). As this will be an expanding area for the next
reporting period, this tool should be updated and placed on the NPI website.
100%
90%
80%
70%
60%
50%
40%
30%
20%
10%
0%
Strongly Agree Neutral Disagree Strongly
Agree Opinion Disagree
Figure 14: Usefulness of the piggery tool
14

Table 3: Recommendations for calculation tools
NPI industry survey report—collation of responses
Recommendations for SA EPA Priority
8 Update the LABS calculation tool Medium
9 Maintain the winery calculation tool and update as necessary Low
10 Update the piggery calculation tool and place on the NPI website High
11 Include training on the use of tools as part of the NPI workshops Medium
NPI Workshop
Question 7: If an NPI workshop was available, I would attend [and if so] I would like
the workshop to include:
a) using the NRT
b) estimating emissions
c) summary of previous data
d) other.
Currently, the SA EPA does not conduct workshops on the NPI and instead runs one-on-
one sessions for interested companies to assist with their reporting. Some workshops are
conducted by interstate agencies with varying degrees of success.
Some 70% of respondents indicated that they would attend an NPI workshop if one was
offered (Figure 15). Topics respondents would like included are:
using the NRT (91%)
estimating emissions (87%)
summary of previous data (75%).
Thus, there seems to be merit in the SA EPA running workshops for NPI reporters.
100% 100%
90%90%
80% 80%
70% 70%
60% 60%
50% 50%
40% 40%
30% 30%
20% 20%
10% 10%
0%
i
Di
Strongly Dsagree
sagree
Neutral Opinion
Agree
Strongly Agree
0% Using the NRT Estimating Summary of Yes No Emissions Previous Data
Figure 15: I would attend the workshop and the workshop should include…
15

Table 4: Recommendations for NPI workshops
NPI industry survey report—collation of responses
Additional workshop information requests were for:
the combustion tool
estimation techniques (current and for industries that have no specified technique)
estimation tools/models
news about online reporting
validity and accuracy of tools and EETs
dioxin reporting
development of tool to allow for minimal input.
Some facilities indicated they had previously attended workshops in other states. The
additional comments support the need for including emissions estimation in a workshop
and include the combustion tool, estimation techniques and estimation tools as possible
discussion topics.
While the topics of the validity and accuracy of tools and EETs, dioxin reporting and
additional tool development are valid issues, a workshop may not be the most suitable
forum for dealing with these, as they will often be specific to the facility. However,
issues common to an industry sector could be incorporated into workshop discussion.
Site-specific issues should be taken up with the individual facility.
Recommendations for SA EPA Priority
12 Organise and run NPI workshops for industry Medium
13 Contact facilities that have site-specific concerns Medium
NPI team member
Questions 8a and 8b: I have spoken with an NPI team member (SA EPA) [and if so] I
have found the interaction useful. If the interaction was not useful please provide
details on why and how it can be improved.
Industry reporters are able to access assistance from the SA EPA via a dedicated NPI
phone line (08 8204 9095) and email <[email protected]>. Of the 77% of respondents
who had spoken with an NPI team member, 92% found the interaction to be useful
(Figure 16). Only 2% did not find the interaction useful and while this is a small
percentage, the SA EPA should aim for this to be rectified.
16

Table 5: Recommendations for NPI team members
NPI industry survey report—collation of responses
100%100%
90%90%
80%80%
70%70%
60% 60%
50% 50%
40% 40%
30% 30%
20% 20%
10% 10%
0% 0%
Strongly Agree Neutral Disagree Strongly Yes No Agree Opinion Disagree
Figure 16: I have spoken to an NPI team member and I found the interaction useful
Additional comments about interactions with NPI team members:
national NPI reporter is Melbourne-based, thus contacts Victorian EPA
difficult to contact the SA NPI staff
process frustrating
very little assistance for specific industry.
While the dedicated phone line is not manned constantly, there is an additional option
to leave a message or send an email. SA EPA attempts to respond to queries promptly.
The respondent who commented on a lack of assistance for the specific industry did so
as they have difficulty reporting each year as there are currently no emission factors for
this facility. This issue will be addressed through a review of the manuals currently
being conducted on a national level.
Recommendations for SA EPA Priority
14 Increase reporter assistance by responding to all queries within two High
working days
15 Form closer ties with industry groups, and supply information to them on Medium
NPI reporting and the assistance that is available
NPI publications
Question 9: I am interested in receiving NPI publications, [and if so] I would like to
receive information on:
a) summary data
b) changes to manual(s)/emission factors
c) how to use the data
d) other.
17
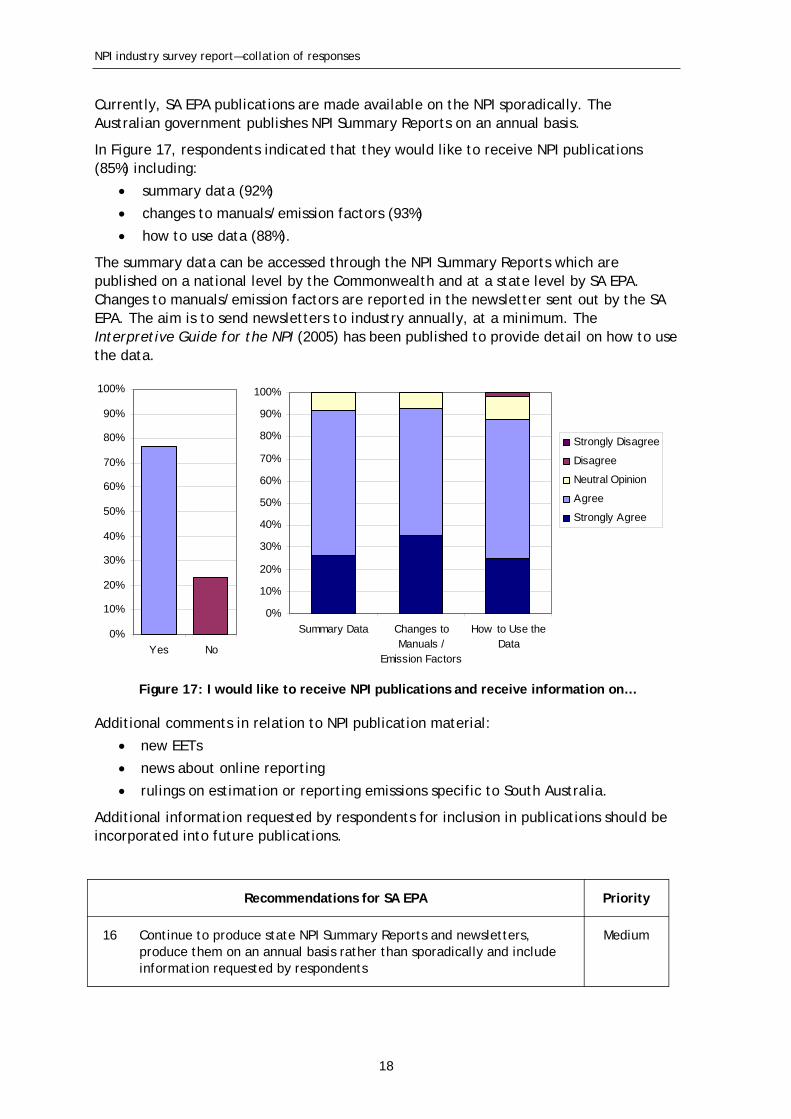
Table 6: Recommendations for NPI publications
NPI industry survey report—collation of responses
Currently, SA EPA publications are made available on the NPI sporadically. The
Australian government publishes NPI Summary Reports on an annual basis.
In Figure 17, respondents indicated that they would like to receive NPI publications
(85%) including:
summary data (92%)
changes to manuals/emission factors (93%)
how to use data (88%).
The summary data can be accessed through the NPI Summary Reports which are
published on a national level by the Commonwealth and at a state level by SA EPA.
Changes to manuals/emission factors are reported in the newsletter sent out by the SA
EPA. The aim is to send newsletters to industry annually, at a minimum. The
Interpretive Guide for the NPI (2005) has been published to provide detail on how to use
the data.
100% 100%
90% 90%
80%80%
70%70%
60% 60%
50% 50%
40% 40%
30% 30%
20%
20% 10%
10% 0%
Summary Data Changes to How to Use the
i
Di
Strongly Dsagree
sagree
Neutral Opinion
Agree
Strongly Agree
0%
Yes No Manuals / Data
Emission Factors
Figure 17: I would like to receive NPI publications and receive information on…
Additional comments in relation to NPI publication material:
new EETs
news about online reporting
rulings on estimation or reporting emissions specific to South Australia.
Additional information requested by respondents for inclusion in publications should be
incorporated into future publications.
Priority
16 Continue to produce state NPI Summary Reports and newsletters,
produce them on an annual basis rather than sporadically and include
information requested by respondents
Recommendations for SA EPA
Medium
18

NPI industry survey report—collation of responses
Recommendations for SA EPA Priority
17 Investigate the possibility of writing industry specific reports where Low
sufficient reporters exist within the industry sector
18 Advertise the release of the Interpretive Guide for the NPI to industry High
Reminder
Question 10: I would like to receive a reminder before the reporting due date [and
if so] I would like to receive it:
via e-mail
via letter.
Currently, the SA EPA sends out reminder emails to facilities prior to the submission
date. Companies registered for the NRT also receive an additional reminder in the form
of the NRT support file (attached to an email).
Figure 18 shows that 89% of respondents indicated that they would like to receive a
reminder, with 91% preferring email, 4% a letter and 6% both.
100%
90%
80%
70%
60%
50%
40%
30%
20%
10%
0%
100%
90%
80%
70%
60%
50%
40%
30%
20%
10%
0%
Yes No Via Email Via Letter Both
Figure 18: I would like to receive a reminder and I would like to receive it via…
As the majority of respondents would like a reminder, the SA EPA reminder email should
continue as a high priority. While the EPA would prefer to issue all reminders
electronically, previous attempts at this resulted in some companies not receiving them.
This was due to companies either not having email access or a change in staff resulted
in use of an outdated email address. Thus the letter reminder should commence as a
high priority.
19

NPI industry survey report—collation of responses
Recommendations for SA EPA Priority
19 Continue to send reminder emails High
20 Commence sending reminder letters High
Future technical support
Question 11: In future, an important form of technical support for me will be:
a) the website
b) NPI publications
c) workshops/seminar
d) the manuals
e) additional calculation tools
f) contact with NPI team member
g) a consultant
h) another form of technical support.
A large proportion of respondents supported all options for technical support for the
future, with the exception of use of a consultant (Figure 19). The degree to which
respondents indicated interest in future technical support is as follows:
the NPI website (92%)
additional calculation tools (85%)
the EET manuals (81%)
NPI publications (79%)
contact with a NPI team member (79%)
workshops/seminars (68%)
a consultant (30%).
20

Table 7: Recommendations for future technical support
NPI industry survey report—collation of responses
0%
10%
20%
30%
40%
50%
60%
70%
80%
90%
100%
Strongly Disagree
Disagree
Neutral Opinion
Agree
Strongly Agree
erns b
oolslsrs ntte aa ai o m
bs tnuti ina u
mm
et lc m on
em
ae nsib i ee
w l ta/s ou s aA
culp hh teop TT lcPIa PI
shN ch
Nrk alno
W ito wtiddi
act
A ntoC
Figure 19: In future an important form of technical support will be…
Progressing with the EET Manuals, NPI publications, contact with an NPI team member
and workshops/seminars have previously been addressed in this report. While earlier
comments indicate that the NPI website is useful, it is important that the SA EPA
continue to influence the Australian government in the updating of the NPI website. The
development of additional calculation tools should also be investigated.
Recommendation for SA EPA Priority
21 Investigate and develop additional calculation tools High
Greenhouse gases
Question 12: In future, if NPI reporting includes calculations of greenhouse gas
emissions, I will require specific technical support.
The current NEPM review is considering the inclusion of greenhouse gases in the NPI. A
total of 76% of respondents indicated that if this is implemented, they would need
assistance (Figure 20).
This is a low priority as greenhouse gases are not currently included in the NPI NPEM.
However, it would increase in priority if the outcomes of the NEPM review include the
incorporation of greenhouse gases in the NPI.
It is assumed that training material for this would be produced on a national level.
However, the actual training of industry NPI reporters would be conducted on a state
level.
21

Table 8: Recommendations for greenhouse gases
NPI industry survey report—collation of responses
100%
90%
80%
70%
60%
50%
40%
30%
20%
10%
0%
Strongly Agree Neutral Disagree Strongly
Agree Opinion Disagree
Figure 20: Assistance with greenhouse gases required
Priority
22
material, workshops/seminars and phone support
Low4
Recommendation for SA EPA
If greenhouse gases are incorporated into the NPI, distribute training
packages for NPI reporters. Training packages could include printed
Waste transfers
Question 13: In future, if NPI reporting includes calculations for waste transfers5, I
will require specific technical support.
The NEPM review is assessing the possibility of including waste transfers in the NPI
program. Seventy-one per cent of respondents indicated that if this occurs, they will
need assistance with including waste transfers in their report (Figure 21).
As is the case with greenhouse gases, the issue of technical support regarding waste
transfers will increase in priority if the NEPM review determines that they will be
included in the NPI.
4 Priority to change to ‘high’ if greenhouse gases are incorporated into the NPI
5 ‘Transfer’ is the transport or movement, on-site or off-site, of substances contained in waste for:
(a) containment
(b) destruction
(c) treatment which leads to:
(i) reuse, recycling or reprocessing
(ii) purification or partial purification
(iii) remediation
(iv) immobilisation.
(d) energy recovery.
22

Table 9: Recommendations for waste transfers
NPI industry survey report—collation of responses
100%
90%
80%
70%
60%
50%
40%
30%
20%
10%
0%
Strongly Agree Neutral Disagree Strongly
Agree Opinion Disagree
Figure 21: Assistance with waste transfers required
Priority
23 If waste transfers are incorporated into the NPI, distribute training Low6
Recommendation for SA EPA
packages for NPI reporters. Training packages could include printed
material, workshops/seminars and phone support
Additional comments
Question 14: Further comments on technical support.
Additional comments provided by the respondents ranged from general comments on
issues with the NPI to comments specific to South Australia. Comments in relation to the
process being difficult to understand and time consuming will hopefully be addressed
through the introduction of the online reporting system.
Additional comments in relation to technical support:
NPI reporting process is difficult to understand
process is time consuming
process requires more accuracy
technical support hotline during business hours required
technical information should be available on the internet
NPI contact person required
technical support should be as industry specific as possible
rulings specific to South Australia should be provided
if greenhouse gases are included, should be consistent with reporting requirements to Australian Greenhouse Office
need to look at waste transfers linkage with waste transport currently reported
to EPA
need to look at data provided to EPA under licence versus NPI.
6 Priority to change to high if waste transfers are incorporated into the NPI
23
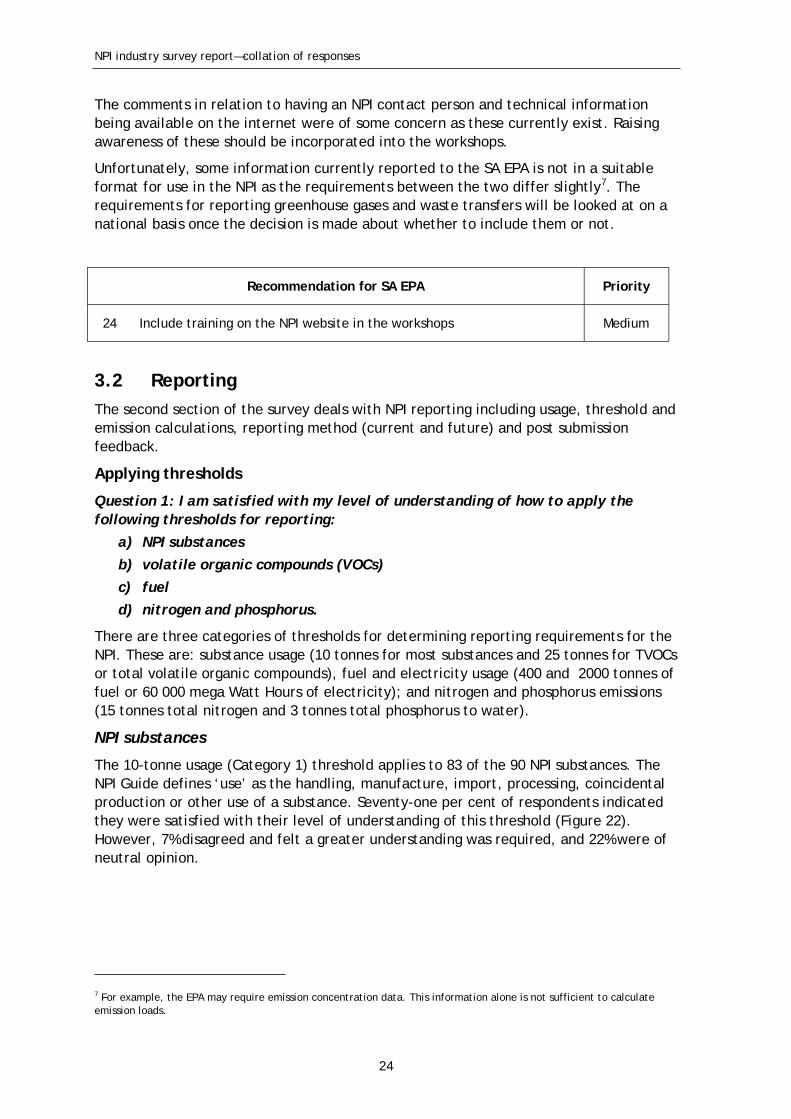
Table 10: Recommendations for further technical support
NPI industry survey report—collation of responses
The comments in relation to having an NPI contact person and technical information
being available on the internet were of some concern as these currently exist. Raising
awareness of these should be incorporated into the workshops.
Unfortunately, some information currently reported to the SA EPA is not in a suitable
format for use in the NPI as the requirements between the two differ slightly7. The
requirements for reporting greenhouse gases and waste transfers will be looked at on a
national basis once the decision is made about whether to include them or not.
Priority
24 Include training on the NPI website in the workshops Medium
Recommendation for SA EPA
3.2 Reporting
The second section of the survey deals with NPI reporting including usage, threshold and
emission calculations, reporting method (current and future) and post submission
feedback.
Applying thresholds
Question 1: I am satisfied with my level of understanding of how to apply the
following thresholds for reporting:
a) NPI substances
b) volatile organic compounds (VOCs)
c) fuel
d) nitrogen and phosphorus.
There are three categories of thresholds for determining reporting requirements for the
NPI. These are: substance usage (10 tonnes for most substances and 25 tonnes for TVOCs
or total volatile organic compounds), fuel and electricity usage (400 and 2000 tonnes of
fuel or 60 000 mega Watt Hours of electricity); and nitrogen and phosphorus emissions
(15 tonnes total nitrogen and 3 tonnes total phosphorus to water).
NPI substances
The 10-tonne usage (Category 1) threshold applies to 83 of the 90 NPI substances. The
NPI Guide defines ‘use’ as the handling, manufacture, import, processing, coincidental
production or other use of a substance. Seventy-one per cent of respondents indicated
they were satisfied with their level of understanding of this threshold (Figure 22).
However, 7% disagreed and felt a greater understanding was required, and 22% were of
neutral opinion.
7 For example, the EPA may require emission concentration data. This information alone is not sufficient to calculate
emission loads.
24

NPI industry survey report—collation of responses
0%
10%
20%
30%
40%
50%
60%
70%
80%
90%
100%
Strongly Agree Neutral Disagree Strongly
Agree Opinion Disagree
Figure 22: Understanding of NPI substances threshold
Volatile organic compounds
The Category 1a threshold only applies to volatile organic compounds. This threshold
relates to usage, as does Category 1, but has a limit of 25 tonnes. Most respondents
(62%) indicated that they were satisfied with their understanding of this threshold
(Figure 23). However, 26% were not sure and 12% were not satisfied with their level of
understanding.
0%
10%
20%
30%
40%
50%
60%
70%
80%
90%
100%
Strongly Agree Neutral Disagree Strongly
Agree Opinion Disagree
Figure 23: Understanding of TVOC threshold
Fuel
Fuel usage is important for both Category 2a and 2b thresholds. If a facility uses more
than 400 tonnes of fuel (e.g. wood, petrol, LPG) they are required to report on all
Category 2a substances8. If the fuel usage exceeds 2000 tonnes, reporting on all
Category 2b substances9 is required. The emissions of these substances from anywhere
in the facility must be reported (not just the portion that results from fuel burning).
8 Category 2a substances—carbon monoxide, fluoride compounds, hydrochloric acid, oxides of nitrogen, particulate
matter 10 µm and less, polycyclic aromatic hydrocarbons, sulfur dioxide, total volatile organic compounds
9 Category 2b substances—arsenic and compounds, beryllium and compounds, carbon monoxide, cadmium and
compounds, chromium (III) compounds, chromium (VI) compounds, copper and compounds, fluoride compounds,
hydrochloric acid, lead and compounds, magnesium oxide fume, mercury and compounds, nickel and compounds, nickel
carbonyl, nickel subsulfide, oxides of nitrogen, particulate matter 10 µm and less, polychlorinated dioxins and furans,
polycyclic aromatic hydrocarbons, sulfur dioxide, total volatile organic compounds
25

Table 11: Recommendations for applying thresholds
NPI industry survey report—collation of responses
While 9% of respondents were not satisfied with their level of understanding of this
threshold, 71% were, and only 20% had a neutral opinion (Figure 24).
0%
10%
20%
30%
40%
50%
60%
70%
80%
90%
100%
Strongly Agree Neutral Disagree Strongly
Agree Opinion Disagree
Figure 24: Understanding of fuel usage thresholds
Nitrogen and phosphorus
The Category 3 threshold is the only threshold related to the emission level. If more
than 15 tonnes of nitrogen or 3 tonnes of phosphorus are emitted to water, these
substances must be reported on. Only 44% of respondents indicated they understood
this, 14% felt they didn’t and 42% were of neutral opinion (Figure 25). While this
indicates a lower level of understanding for this threshold, in South Australia the
majority of facilities are not legally allowed to discharge to water, and therefore the
number of facilities for which this threshold is relevant is minimal.
0%
10%
20%
30%
40%
50%
60%
70%
80%
90%
100%
Strongly Agree Neutral Disagree Strongly
Agree Opinion Disagree
Figure 25: Understanding of nitrogen and phosphorus thresholds
Overall, the general understanding of the thresholds is good. However, there is an
indication that this could be improved. The NPI thresholds should be covered in the
workshops.
26
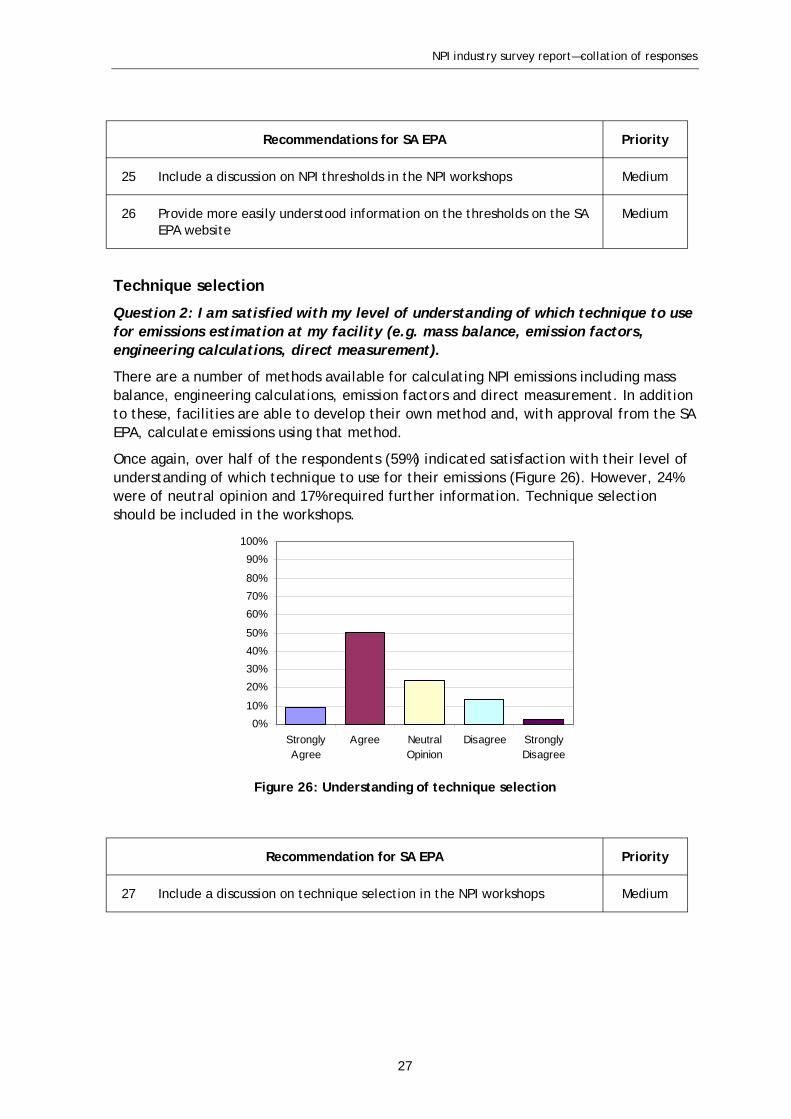
Table 12: Recommendations for technique selection
NPI industry survey report—collation of responses
Recommendations for SA EPA Priority
25 Include a discussion on NPI thresholds in the NPI workshops Medium
26 Provide more easily understood information on the thresholds on the SA Medium
EPA website
Technique selection
Question 2: I am satisfied with my level of understanding of which technique to use
for emissions estimation at my facility (e.g. mass balance, emission factors,
engineering calculations, direct measurement).
There are a number of methods available for calculating NPI emissions including mass
balance, engineering calculations, emission factors and direct measurement. In addition
to these, facilities are able to develop their own method and, with approval from the SA
EPA, calculate emissions using that method.
Once again, over half of the respondents (59%) indicated satisfaction with their level of
understanding of which technique to use for their emissions (Figure 26). However, 24%
were of neutral opinion and 17% required further information. Technique selection
should be included in the workshops.
100%
90%
80%
70%
60%
50%
40%
30%
20%
10%
0%
Strongly Agree Neutral Disagree Strongly
Agree Opinion Disagree
Figure 26: Understanding of technique selection
Priority
27
Recommendation for SA EPA
Include a discussion on technique selection in the NPI workshops Medium
27
NPI industry survey report—collation of responses
EET calculations
Question 3: I am satisfied that I can perform the calculations necessary for each of
the following emission estimation techniques:
a) mass balance
b) emission factors
c) engineering calculations
d) direct measurement.
Each calculation method (mass balance, engineering calculations, emission factors and
direct measurement) requires different equations, input values and calculations.
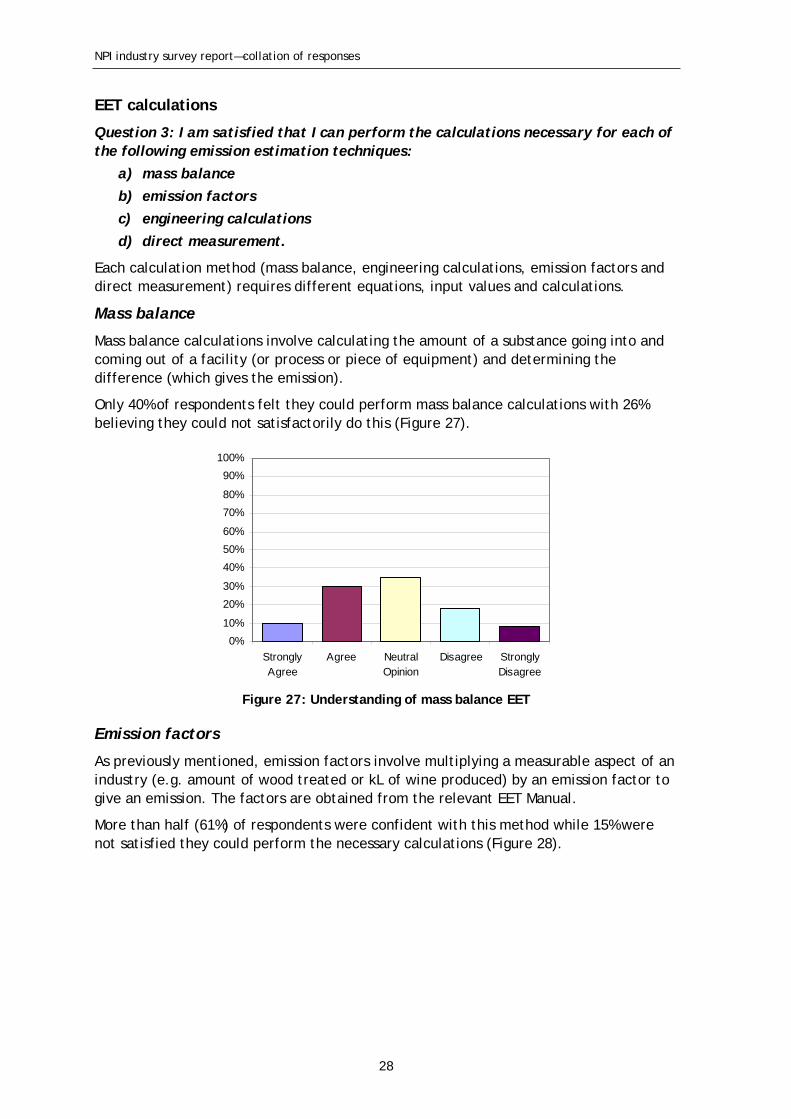
Mass balance
Mass balance calculations involve calculating the amount of a substance going into and
coming out of a facility (or process or piece of equipment) and determining the
difference (which gives the emission).
Only 40% of respondents felt they could perform mass balance calculations with 26%
believing they could not satisfactorily do this (Figure 27).
100%
90%
80%
70%
60%
50%
40%
30%
20%
10%
0%
Strongly Agree Neutral Disagree Strongly
Agree Opinion Disagree
Figure 27: Understanding of mass balance EET
Emission factors
As previously mentioned, emission factors involve multiplying a measurable aspect of an
industry (e.g. amount of wood treated or kL of wine produced) by an emission factor to
give an emission. The factors are obtained from the relevant EET Manual.
More than half (61%) of respondents were confident with this method while 15% were
not satisfied they could perform the necessary calculations (Figure 28).
28

NPI industry survey report—collation of responses
100%
90%
80%
70%
60%
50%
40%
30%
20%
10%
0%
Strongly Agree Neutral Disagree Strongly
Agree Opinion Disagree
Figure 28: Understanding of emission factors EET
Engineering calculations
This method uses the chemical and physical properties of substances to calculate
emissions (e.g. vapour pressure of a substance and surface area can be used to calculate
evaporation rates and thus emissions).
This method was the least understood by the respondents with only 37% indicating they
believed they could satisfactorily perform these calculations (Figure 29). However 28%
felt they could not use engineering calculations to determine their emissions.
0%
10%
20%
30%
40%
50%
60%
70%
80%
90%
100%
Strongly Agree Neutral Disagree Strongly
Agree Opinion Disagree
Figure 29: Understanding of engineering calculations EET
Direct measurement
The last method available for NPI emission calculations is direct measurement where a
facility monitors (periodically or continuously) the concentrations of a substance and
the volumes of the waste stream discharged to the environment. From this, an amount
of the substance discharged can be calculated. Over a quarter (27%) of respondents
were not satisfied they could perform direct monitoring emission calculations, while 44%
of respondents believed they could (Figure 30).
29
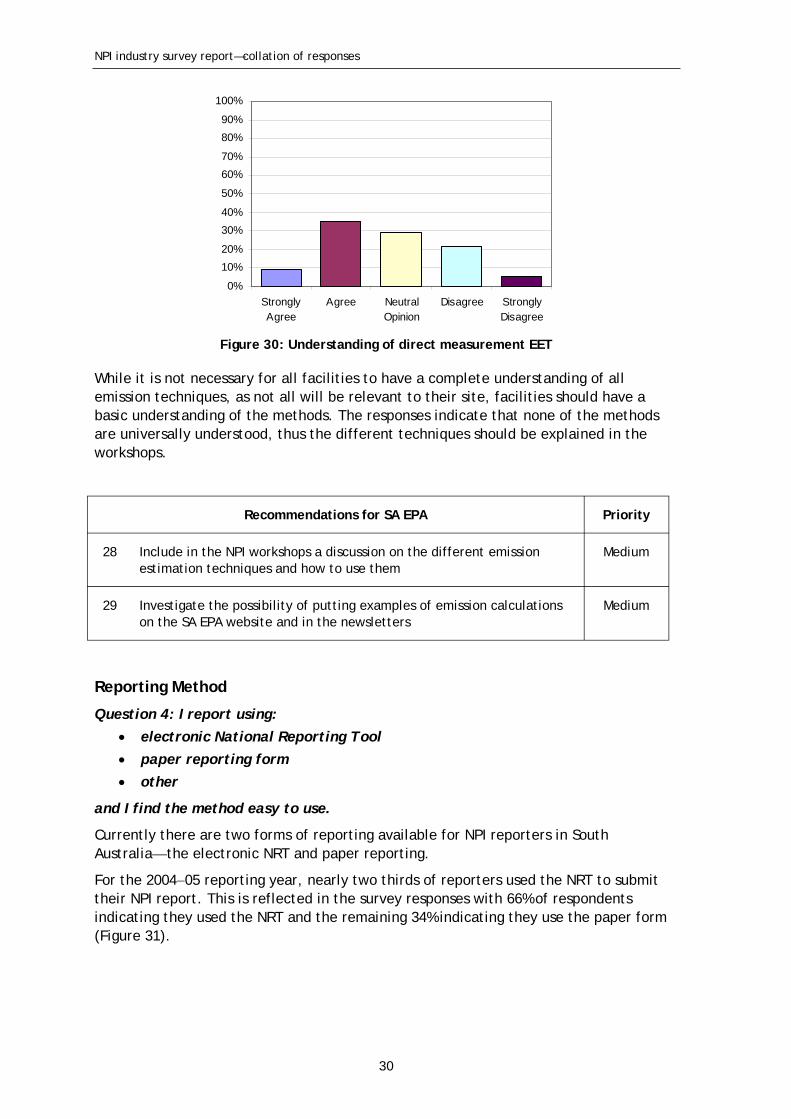
Table 13: Recommendations for EET calculations
NPI industry survey report—collation of responses
0%
10%
20%
30%
40%
50%
60%
70%
80%
90%
100%
Strongly Agree Neutral Disagree Strongly
Agree Opinion Disagree
Figure 30: Understanding of direct measurement EET
While it is not necessary for all facilities to have a complete understanding of all
emission techniques, as not all will be relevant to their site, facilities should have a
basic understanding of the methods. The responses indicate that none of the methods
are universally understood, thus the different techniques should be explained in the
workshops.
Recommendations for SA EPA Priority
28 Include in the NPI workshops a discussion on the different emission Medium
estimation techniques and how to use them
29 Investigate the possibility of putting examples of emission calculations Medium
on the SA EPA website and in the newsletters
Reporting Method
Question 4: I report using:
electronic National Reporting Tool
paper reporting form
other
and I find the method easy to use.
Currently there are two forms of reporting available for NPI reporters in South
Australia—the electronic NRT and paper reporting.
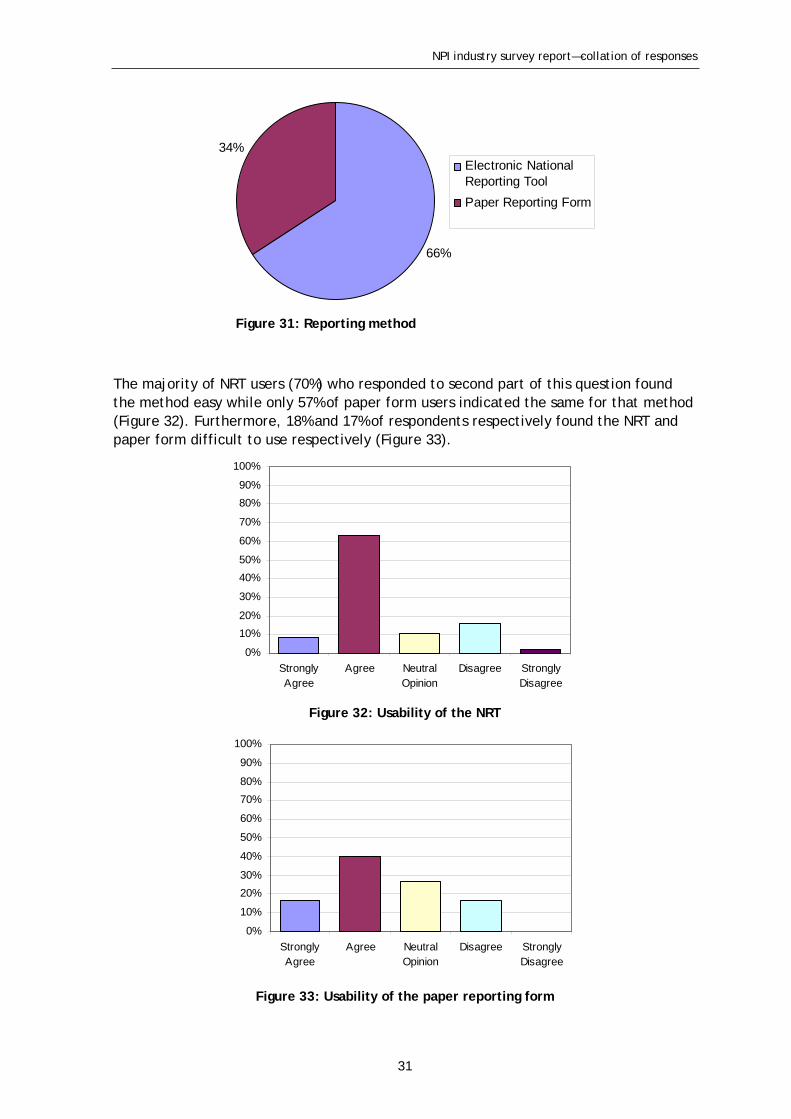
For the 2004 05 reporting year, nearly two thirds of reporters used the NRT to submit
their NPI report. This is reflected in the survey responses with 66% of respondents
indicating they used the NRT and the remaining 34% indicating they use the paper form
(Figure 31).
30
NPI industry survey report—collation of responses
El i i
i
i
66%
34%
ectron c Nat onal
Report ng Tool
Paper Report ng Form
Figure 31: Reporting method
The majority of NRT users (70%) who responded to second part of this question found
the method easy while only 57% of paper form users indicated the same for that method
(Figure 32). Furthermore, 18% and 17% of respondents respectively found the NRT and
paper form difficult to use respectively (Figure 33).
100%
90%
80%
70%
60%
50%
40%
30%
20%
10%
0%
Strongly Agree Neutral Disagree Strongly
Agree Opinion Disagree
Figure 32: Usability of the NRT
100%
90%
80%
70%
60%
50%
40%
30%
20%
10%
0%
Strongly Agree Neutral Disagree Strongly
Agree Opinion Disagree
Figure 33: Usability of the paper reporting form
31

Table 14: Recommendations for reporting method
NPI industry survey report—collation of responses
The SA EPA is aware of the issues that facilities have had with the NRT and is currently
providing comment to the Australian government on the development of an online
reporting system to replace the NRT. The issues with the NRT should be addressed
through this process.
Paper reporting will still be a valid method after the introduction of online reporting.
Therefore, the issues associated with this method should be determined and addressed.
Recommendations for SA EPA Priority
30 Assist the Australian government with developing an online reporting Medium
system that meets the needs of reporters
31 Contact those reporters who use the paper reporting form to determine Low
how the form can be improved and recommend to the Commonwealth to
make those improvements
Paper Reporting
Question 5: I report via paper because:
no internet/e-mail
prefer this method
had difficulty with the NRT
other.
The SA EPA encourages NPI reporters to use the NRT. However, many still prefer the
paper reporting form (37% in the 2004 2005 reporting year).
2%
20%
37%
41%
il
i
i i l i
NRT
No Internet/Ema
Prefer th s Method
Had d ff cu ty w th the
Other
Figure 34: Reasons for reporting via the paper reporting form
Forty-one per cent of paper reporting form users indicated they had difficulty using the
NRT. These reporters may be open to using the online reporting system in future as may
many of the remaining paper reporting form users. Their comments indicate that
suitable reminders on reporting, as well as the availability and requirements of the NRT,
would increase their usage of the system. Relevant information should be incorporated
into the reporter reminders and the workshops.
32
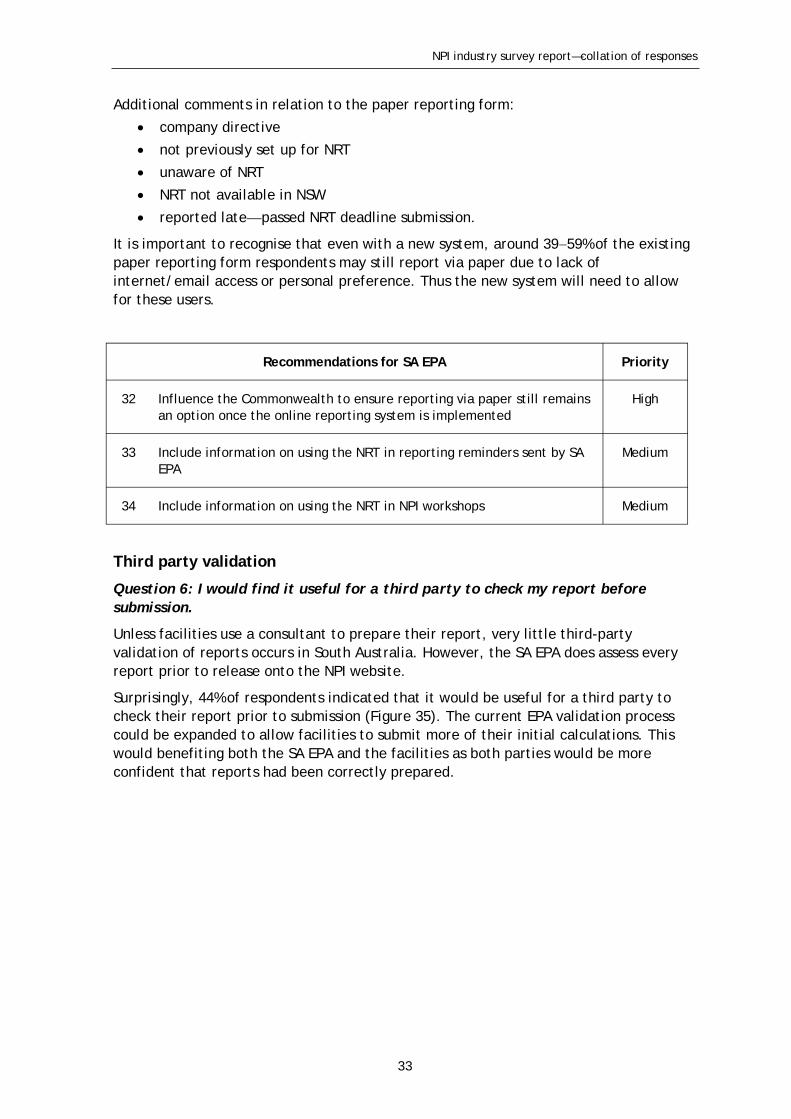
Table 15: Recommendations for paper reporting
NPI industry survey report—collation of responses
Additional comments in relation to the paper reporting form:
company directive
not previously set up for NRT
unaware of NRT
NRT not available in NSW
reported late—passed NRT deadline submission.
It is important to recognise that even with a new system, around 39 59% of the existing
paper reporting form respondents may still report via paper due to lack of
internet/email access or personal preference. Thus the new system will need to allow
for these users.
Recommendations for SA EPA Priority
32 Influence the Commonwealth to ensure reporting via paper still remains High
an option once the online reporting system is implemented
33 Include information on using the NRT in reporting reminders sent by SA Medium
EPA
34 Include information on using the NRT in NPI workshops Medium
Third party validation
Question 6: I would find it useful for a third party to check my report before
submission.
Unless facilities use a consultant to prepare their report, very little third-party
validation of reports occurs in South Australia. However, the SA EPA does assess every
report prior to release onto the NPI website.
Surprisingly, 44% of respondents indicated that it would be useful for a third party to
check their report prior to submission (Figure 35). The current EPA validation process
could be expanded to allow facilities to submit more of their initial calculations. This
would benefiting both the SA EPA and the facilities as both parties would be more
confident that reports had been correctly prepared.
33

Table 16: Recommendations for third party validation
NPI industry survey report—collation of responses
0%
10%
20%
30%
40%
50%
60%
70%
80%
90%
100%
Strongly Agree Neutral Disagree Strongly
Agree Opinion Disagree
Figure 35: Usefulness of third-party validation
Priority
35
Recommendation for SA EPA
Expand validation process and notify facilities that additional validation
of their calculations is available if they supply the data
Medium
EPA feedback
Question 7: I would like to receive more feedback from the EPA on our completed
report.
Over the last few years the SA EPA has implemented an NPI report validation system in
which reports are checked and industries contacted if any issues arise. In the 2004 05
reporting period, the SA EPA updated the process to include sending all companies a
copy of their final report prior to submission to the website.
About 44% of respondents indicated that they would like to receive additional feedback
on their report (Figure 36). This could be done in a general way through the NPI
Summary Report or the workshops, but more information from facilities is required on
what type of site-specific feedback they would be interested in receiving. Some of this
feedback may be addressed through the additional validation outlined in
Recommendation 35.
34
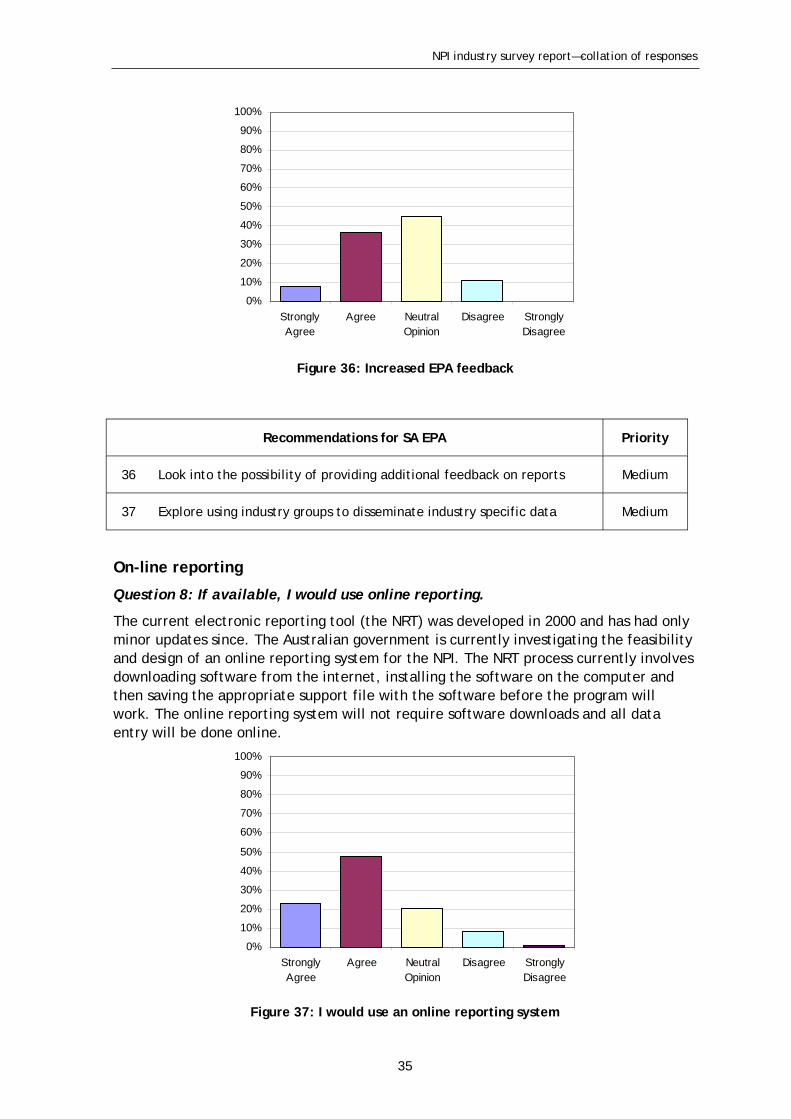
Table 17: Recommendations for EPA feedback
NPI industry survey report—collation of responses
0%
10%
20%
30%
40%
50%
60%
70%
80%
90%
100%
Strongly Agree Neutral Disagree Strongly
Agree Opinion Disagree
Figure 36: Increased EPA feedback
Priority
36 Medium
37
Recommendations for SA EPA
Look into the possibility of providing additional feedback on reports
Explore using industry groups to disseminate industry specific data Medium
On-line reporting
Question 8: If available, I would use online reporting.
The current electronic reporting tool (the NRT) was developed in 2000 and has had only
minor updates since. The Australian government is currently investigating the feasibility
and design of an online reporting system for the NPI. The NRT process currently involves
downloading software from the internet, installing the software on the computer and
then saving the appropriate support file with the software before the program will
work. The online reporting system will not require software downloads and all data
entry will be done online.
0%
10%
20%
30%
40%
50%
60%
70%
80%
90%
100%
Strongly Agree Neutral Disagree Strongly
Agree Opinion Disagree
Figure 37: I would use an online reporting system
35

3.3
NPI industry survey report—collation of responses
Seventy per cent of respondents indicated they would use an online reporting system,
with 20% having neutral opinion (Figure 37). Thus, progressing the development of an
online system is worthwhile (see also Recommendation 33). For the 10% who indicated
they would not use an online system, the paper reporting form will still be available.
NPI time requirements
Question 9: An approximate of ___ hours of effort was expended preparing our last
NPI report.
The amount of time required to prepare an NPI report varies between industries. The
average time respondents indicated it took to complete their NPI reporting
requirements was 21.75 hours with a minimum of 30 minutes and a maximum of 150
hours. It should be noted that the respondents who reported the most amount of time
generally submitted multiple reports for facilities across Australia.
Additional comments
Question 10: Further comments on reporting.
The additional comments for this section are not listed due to the length of some
responses. However, most were general comments relating to previous questions that
refer to reporting and are summarised below:
EPA assistance
calculation tools—training requirements (combustion in boilers)
interstate coordination of reports
support of the online reporting system
difficulty in reporting when industry staff changes with little or no handover
difficulty in accessing previous data from NPI website.
The majority of these comments have previously been addressed in relevant sections of
this report.
Use of consultants and data
The third and final section of the survey deals with the use of consultants in the
preparation of NPI reports and the use of data, compiled for NPI reporting, for uses
other than NPI reporting.
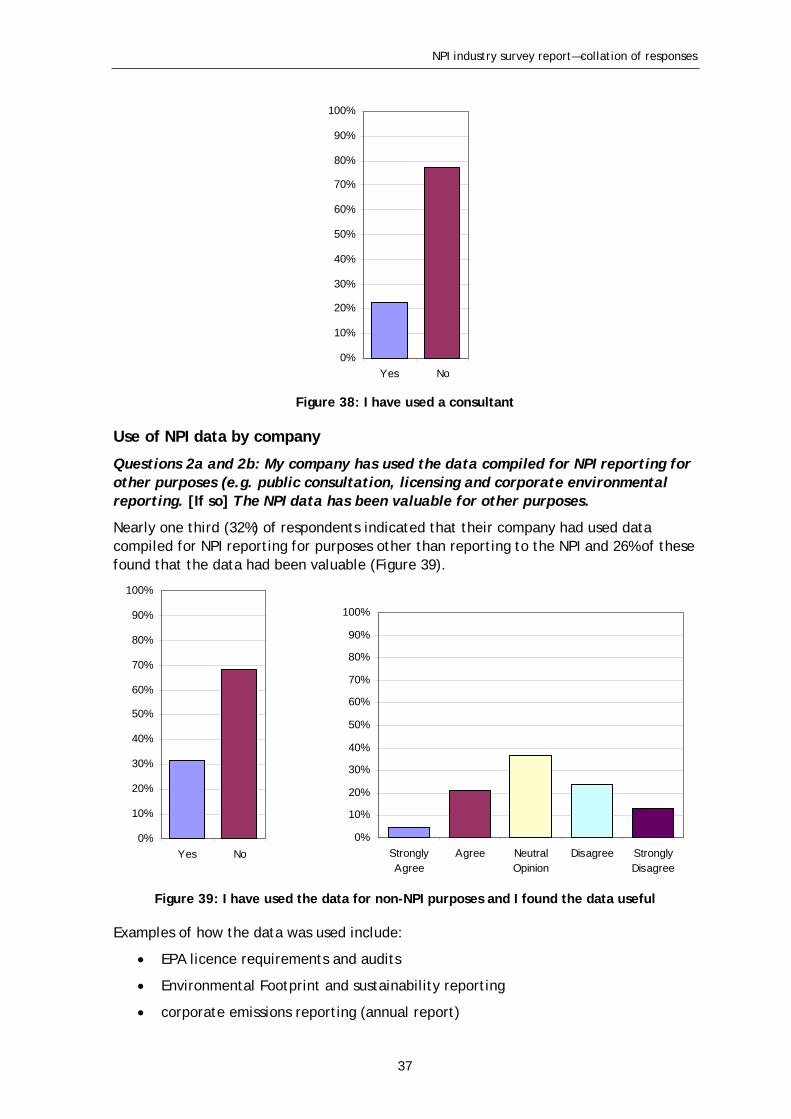
Consultant Use
Question 1: I have used a consultant to assist in NPI reporting.
Over 75% of respondents were able to meet their NPI reporting obligations without the
need for a consultant (Figure 38). With the development of the online reporting system,
the review of the manuals and the creation of additional reporting tools, this figure may
increase. It is preferable for NPI reporting to be as simple as possible. However, some
companies may always require a consultant to assist them.
36
NPI industry survey report—collation of responses
100%
90%
80%
70%
60%
50%
40%
30%
20%
10%
0%
Yes No
Figure 38: I have used a consultant
Use of NPI data by company
Questions 2a and 2b: My company has used the data compiled for NPI reporting for
other purposes (e.g. public consultation, licensing and corporate environmental
reporting. [If so] The NPI data has been valuable for other purposes.
Nearly one third (32%) of respondents indicated that their company had used data
compiled for NPI reporting for purposes other than reporting to the NPI and 26% of these
found that the data had been valuable (Figure 39).
100%
90%
80%
70%
60%
50%
40%
30%
20%
10%
0%
100%
90%
80%
70%
60%
50%
40%
30%
20%
10%
0%
Yes No Strongly Agree Neutral Disagree Strongly
Agree Opinion Disagree
Figure 39: I have used the data for non-NPI purposes and I found the data useful
Examples of how the data was used include:
EPA licence requirements and audits
Environmental Footprint and sustainability reporting
corporate emissions reporting (annual report)
37

Table 18: Recommendations for community interest
NPI industry survey report—collation of responses
cost reviews (material consumption and minimisation, process change to allow
for reclaiming of material, alternative chemical use, waste generation)
greenhouse gas reporting
PIRSA reporting
fuel and energy use data appropriate for other reporting requirements
hazardous substances management.
It is encouraging to see that some industry is finding the NPI data useful for other
purposes. The Interpretive Guide published by the SA EPA may assist industry with the
identification of other possible uses for NPI data.
Community interest
Question 3: The wider community has shown an interest in my facility’s NPI report,
[and if so] the interaction has been positive.
One of the purposes of the NPI is to fulfil the community’s right to know about
emissions. However, only 3% of respondents indicated that the wider community showed
any interest in their facility’s NPI report (Figure 40).
100%
90%
80%
70%
60%
50%
40%
30%
20%
10%
0%
Yes No
Figure 40: Public shown interest in NPI data
This may be influenced by the fact that the community can access the information
directly from the NPI website and do not necessarily contact individual companies. A
lack of knowledge about the NPI may also be a factor. This is supported by results of a
survey conducted by the Australian government. Thus, the SA EPA should attempt to
educate the general community on the availability of the NPI and how to use it.
Priority
38 Attempt to raise awareness of the NPI in the general community Low
Recommendation for SA EPA
38

NPI industry survey report—collation of responses
Raising awareness of the NPI in the general community is given a low priority for two
reasons. Firstly, this report focuses on the needs of industry rather than the general
community and raising community awareness is not a high priority for industry.
Secondly, the NPI is currently under review on a national basis and this review may
include a renaming of the program. Any community awareness raising of the NPI
program should therefore be delayed until completion of the review.
Additional comments
Question 4: Further comments on consultants and/or data use (e.g. has the NPI
been useful in engaging with your community, clients or stakeholders) and your
opinion of the NPI as a valuable tool for your industry.
The additional comments for this section are not listed due to the length of some
responses. The comments were generally explanations in relation to responses on the
use of consultants and the data, and are summarised below:
how and why consultants were used
additional information on data use or lack there of, and reasons for this
accuracy and understanding of emissions (misinterpretation of data) by public
requirement for additional feedback.
The majority of these comments have been addressed in the relevant section of this
report.
39
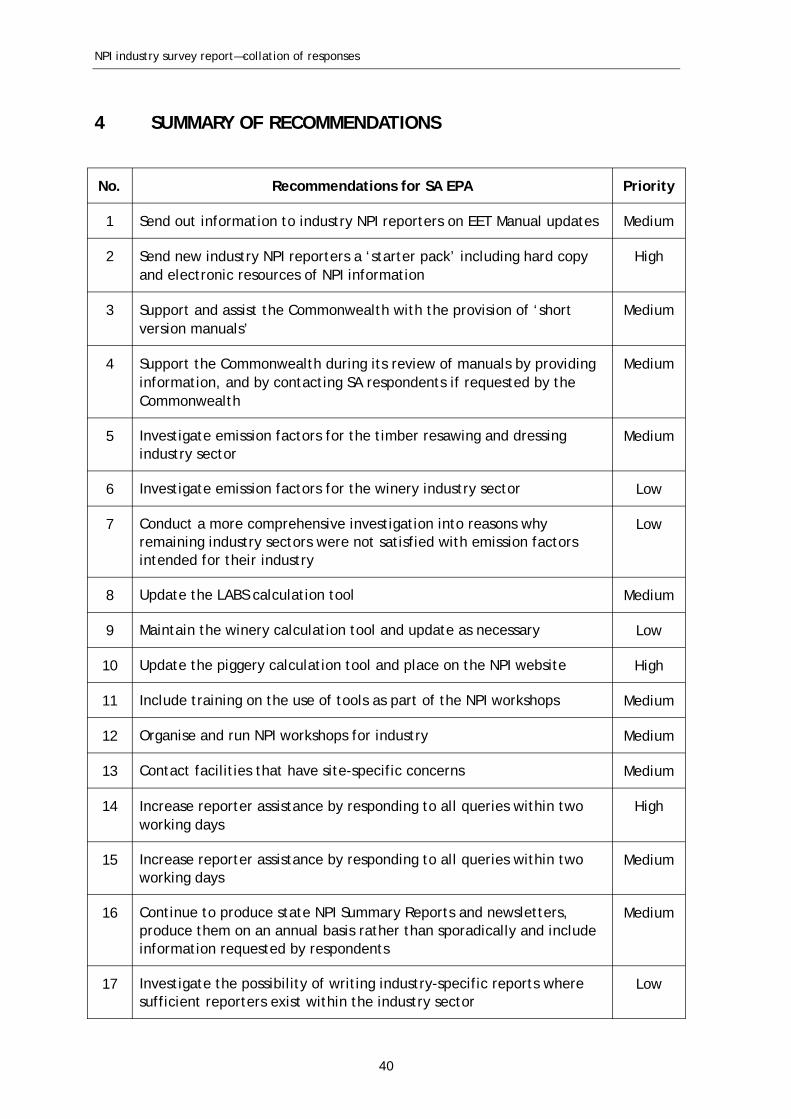
4
NPI industry survey report—collation of responses
SUMMARY OF RECOMMENDATIONS
No. Recommendations for SA EPA Priority
1 Send out information to industry NPI reporters on EET Manual updates Medium
2 Send new industry NPI reporters a ‘starter pack’ including hard copy
and electronic resources of NPI information
High
3 Support and assist the Commonwealth with the provision of ‘short
version manuals’
Medium
4 Support the Commonwealth during its review of manuals by providing
information, and by contacting SA respondents if requested by the
Commonwealth
Medium
5 Investigate emission factors for the timber resawing and dressing
industry sector
Medium
6 Investigate emission factors for the winery industry sector Low
7 Conduct a more comprehensive investigation into reasons why
remaining industry sectors were not satisfied with emission factors
intended for their industry
Low
8 Update the LABS calculation tool Medium
9 Maintain the winery calculation tool and update as necessary Low
10 Update the piggery calculation tool and place on the NPI website High
11 Include training on the use of tools as part of the NPI workshops Medium
12 Organise and run NPI workshops for industry Medium
13 Contact facilities that have site-specific concerns Medium
14 Increase reporter assistance by responding to all queries within two
working days
High
15 Increase reporter assistance by responding to all queries within two
working days
Medium
16 Continue to produce state NPI Summary Reports and newsletters,
produce them on an annual basis rather than sporadically and include
information requested by respondents
Medium
17 Investigate the possibility of writing industry-specific reports where
sufficient reporters exist within the industry sector
Low
40

NPI industry survey report—collation of responses
No. Recommendations for SA EPA Priority
18 Advertise the release of the Interpretive Guide for the NPI to industry High
19 Continue to send reminder emails High
20 Commence sending reminder letters High
21 Investigate and develop additional calculation tools High
22 If greenhouse gases are incorporated into the NPI, distribute training
packages for NPI reporters. Training packages could include printed
material, workshops/seminars and phone support
Low10
23 If waste transfers are incorporated into the NPI, distribute training
packages for NPI reporters. Training packages could include printed
material, workshops/seminars and phone support
Low11
24 Include training on the NPI website in the workshops Medium
25 Include a discussion on NPI thresholds in the NPI workshops Medium
26 Provide more easily understood information on the thresholds on the
SA EPA website
Medium
27 Include a discussion on technique selection in the NPI workshops Medium
28 Include in the NPI workshops a discussion on the different emission
estimation techniques and how to use them
Medium
29 Investigate the possibility of putting examples of emission calculations
on the SA EPA website and in the newsletters
Medium
30 Assist the Australian government with developing an online reporting
system that meets the needs of reporters
Medium
31 Contact those reporters who use the paper reporting form to
determine how the form can be improved and recommend to the
Commonwealth to make those improvements
Low
32 Influence the Commonwealth to ensure reporting via paper still
remains an option once the online reporting system is implemented
High
33 Include information on using the NRT in reporting reminders sent by
SA EPA
Medium
34 Include information on using the NRT in NPI workshops Medium
10 Priority to change to high if greenhouse gases are incorporated into the NPI
11 Priority to change to high if waste transfers are incorporated into the NPI
41

NPI industry survey report—collation of responses
No. Recommendations for SA EPA Priority
35 Expand validation process and notify facilities that additional
validation of their calculations is available if they supply the data
Medium
36 Look into the possibility of providing additional feedback on reports Medium
37 Explore using industry groups to disseminate industry specific data Medium
38 Attempt to raise awareness of the NPI in the general community Low
42
5
NPI industry survey report—collation of responses
CONCLUSION AND FUTURE DIRECTION
The survey of NPI industry reporters was analysed and resulted in 38 recommendations
to be considered by the SA EPA in the development of an industry communication plan.
The recommendations and priorities reflect the current and future requirements of
industry NPI reporters with the need for NPI workshops recognised as an important
means of communication.
In addition to the development of the communication plan, the SA EPA is considering
the need for ongoing industry surveys to:
provide an ongoing indication of how well the SA EPA is meeting the needs of
industry NPI reporters
provide more detailed information on certain industry sectors or particular issues
(through more targeted surveys).
With the review of the NPI NEPM and the development of the online reporting system,
communication to and training of industry NPI reporters will continue to be a focus of
the SA EPA.
43

NPI industry survey report—collation of responses
REFERENCES
Department of Environment and Heritage (Commonwealth) 2004, National Pollutant
Inventory guide, Commonwealth of Australia.
——2006, Emission Estimation Technique Manuals, Commonwealth of Australia, viewed
3 October 2006,<http://npi.gov.au/handbooks/approved_handbooks/index.html/>.
——2006, National Pollutant Inventory Database, Commonwealth of Australia, viewed
3 October 2006, <http://www.npi.gov.au>.
Queensland Environment Protection Agency 2005, National Pollutant Inventory—
Reporting Improvement Survey, Queensland Environment Protection Agency,
Brisbane.
——2005, Interpretive guide for the NPI: A guide to understanding South Australia’s NPI
database, Environment Protection Authority, Adelaide.
——2006, National Pollutant Inventory (NPI) South Australia summary Report
2004 2005, Environment Protection Authority, Adelaide.
44

NPI industry survey report—collation of responses
APPENDIX A SURVEY DESIGN (FACSIMILE)
45

NPI industry survey report—collation of responses
46

NPI industry survey report—collation of responses
47

NPI industry survey report—collation of responses
48

NPI industry survey report—collation of responses
49
NPI industry survey report—collation of responses
50

NPI industry survey report—collation of responses
51

NPI industry survey report—collation of responses
APPENDIX B ALL RESPONSES
Following is a summary of all survey responses received (120 out of 203 surveys sent
out).
A Technical Support
Str
on
gly
agre
e
Ag
ree
Neu
tral
op
inio
n
Dis
agre
e
Str
on
gly
dis
agre
e
1. I have used the NPI website (www.npi.gov.au).
21 No
99 Yes, and I have found the website useful. 1 71 18 6 2
2. I have used the SA EPA website (www.epa.sa.gov.au).
33 No
87 Yes, and I have found the website useful. 5 62 14 5 0
3. I have used the NPI Emission Estimation Technique Manual(s) for my industry sector.
28 No
92 Yes, and I found the manual to be useful. 15 40 20 14 3
4. I have used the emission factors for my industry sector.
35 No
85 Yes, and I found the factors to be 6 35 29 11 4representative.
5. I have used the NPI Guide.
28 No
92 Yes, and I found the guide to be useful. 11 48 25 9 0
6. I am aware of the following calculation tools and have found them useful.
68 Combustion in boilers 7 41 12 5 3
37 FOLS (fuel & organic liquid storage) 3 21 9 3 1
9 LABS (emissions for landfills) 1 3 3 1 1
44 Winery emissions 6 25 9 2 2
4 Piggery emissions 0 1 2 0 1
22 WATER9 (emissions from waste water 2 9 8 1 2treatment).
52
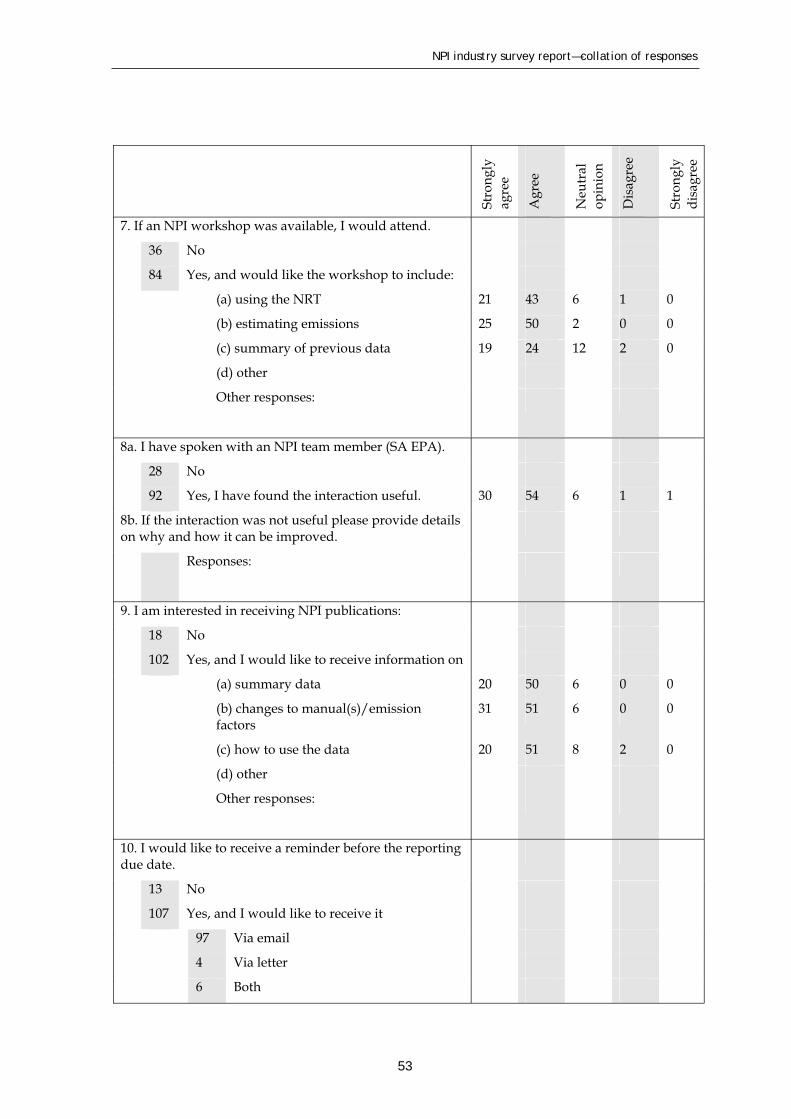
NPI industry survey report—collation of responses
Str
on
gly
agre
e
Ag
ree
Neu
tral
op
inio
n
Dis
agre
e
Str
on
gly
dis
agre
e
7. If an NPI workshop was available, I would attend.
36 No
84 Yes, and would like the workshop to include:
(a) using the NRT 21 43 6 1 0
(b) estimating emissions 25 50 2 0 0
(c) summary of previous data 19 24 12 2 0
(d) other
Other responses:
8a. I have spoken with an NPI team member (SA EPA).
28 No
92 Yes, I have found the interaction useful. 30 54 6 1 1
8b. If the interaction was not useful please provide details on why and how it can be improved.
Responses:
9. I am interested in receiving NPI publications:
18 No
102 Yes, and I would like to receive information on
(a) summary data 20 50 6 0 0
(b) changes to manual(s)/emission 31 51 6 0 0factors
(c) how to use the data 20 51 8 2 0
(d) other
Other responses:
10. I would like to receive a reminder before the reporting due date.
13 No
107 Yes, and I would like to receive it
97 Via email
4 Via letter
6 Both
53

NPI industry survey report—collation of responses
Str
on
gly
agre
e
Ag
ree
Neu
tral
op
inio
n
Dis
agre
e
Str
on
gly
dis
agre
e
11. In future, an important form of technical support for me will be:
(a) the website 34 55 7 1 0
(b) NPI publications 22 51 18 2 0
(c) workshops/seminars 15 44 21 5 1
(d) the manuals 25 52 12 4 2
(e) additional calculation tools 30 47 10 4 0
(f) contact with NPI team member 28 46 20 0 0
(g) a consultant 7 16 27 15 10
(h) another form of technical support
Other responses:
12. In future, if NPI reporting includes calculations of 45 45 23 5 2greenhouse gas emissions, I will require specific technical support.
13. In future, if NPI reporting includes calculations for waste transfers, I will require specific technical support.
38 47 31 4 0
14. Further comments on technical support:
B Reporting
Str
on
gly
agre
e
Ag
ree
Neu
tral
op
inio
n
Dis
agre
e
Str
on
gly
dis
agre
e
1. I am satisfied with my level of understanding of how to apply the following thresholds for reporting:
(a) NPI substances 18 66 26 6 2
(b) volatile organic compounds (VOCs) 15 56 30 9 4
(c) fuel 13 66 22 7 3
(d) nitrogen and phosphorus 9 35 42 10 4
2. I am satisfied with my level of understanding of which 11 59 28 16 3technique to use for emissions estimation at my facility (e.g. mass balance, emission factors, engineering calculations, direct measurement).
54

NPI industry survey report—collation of responses
Str
on
gly
agre
e
Ag
ree
Neu
tral
op
inio
n
Dis
agre
e
Str
on
gly
dis
agre
e
3. I am satisfied that I can perform the calculations necessary for each of the following emission estimation techniques:
(a) mass balance 10 30 35 18 8
(b) emission factors 15 55 27 14 3
(c) engineering calculations 10 28 36 22 6
(d) direct measurement 9 34 28 21 5
4. I report using: (and I find the method easy to use)
79 Electronic National Reporting Tool 5 36 6 9 1
41 Paper reporting tool 5 12 8 5 0
Other:
5. I report via paper because
1 No internet/e-mail
15 Prefer this method
17 Had difficulty with the NRT
8 Other:
6. I would find it useful for a third party to check my report before submission.
10 39 45 14 5
7. I would like more feedback from the EPA on our completed report.
9 42 52 13 0
8. If available, I would use online reporting. 27 56 24 10 1
9. Approximate number of hours of effort expended preparing last NPI report.
150 Maximum
0.5 Minimum
22 Average
10. Further comments on reporting:
55

C
NPI industry survey report—collation of responses
Use of consultants and data
Str
on
gly
agre
e
Ag
ree
Neu
tral
op
inio
n
Dis
agre
e
Str
on
gly
dis
agre
e
1. I have used a consultant to assist in NPI reporting
93 No
27 Yes
2a. My company has used the data compiled for NPI reporting for other purposes (e.g. public consultation, corporate environmental reporting).
79 No
37 Yes
2b. The NPI data has been valuable for other purposes. 4 18 31 20 11
Examples:
3. The wider community has shown an interest in my facility’s NPI report.
116 No
4 Yes, and the interaction has been positive
4. Further comments on consultants and/or data use and your opinion of the NPI as a valuable tool for your industry:
56