NOx Formation in Chemical Looping Combustion with Solid...
42
Department of Energy and Materials Chalmers University of Technology Göteborg, Sverige 2015 NOx Formation in Chemical Looping Combustion with Solid Fuel Master’s thesis in Material Chemistry and Nanotechnology Martin Östergren
Transcript of NOx Formation in Chemical Looping Combustion with Solid...

Department of Energy and Materials Chalmers University of Technology Göteborg, Sverige 2015
NOx Formation in Chemical Looping Combustion with Solid Fuel Master’s thesis in Material Chemistry and Nanotechnology Martin Östergren

Department of Energy and Materials Chalmers University of Technology
Gothenburg, Sweden 2015 II
Abstract This project studies the formation of NOx in a solid fuel Chemical-Looping Combustion system. The study was performed in a lab scale fluidized bed reactor, where oxidizing, inert and reducing conditions have been altered in cycles at 850, 900 and 950°C. Two types of oxygen carrier were used, a synthesized iron oxide and an ilmenite ore. Two settings for the volume fraction of steam in the fluidizing gas were used, 33% and 50% respectively. The CO, CO2, CH4 and NOx concentrations were analyzed continuously and NH3 concentration was measured separately, as the average of three cycles. Concentration profiles, instantaneous, cumulative and total conversion as well as rates of formation were measured and calculated. Lower conversion to NOx and CO2 are observed with ilmenite than with Fe2O3 for all temperatures and volume fractions of steam, while ilmenite shows a higher conversion to CO. Conversion to CO2 is increased with the volume fraction of steam for both oxygen carriers. For Fe2O3, the conversion to NOx also increases with the volume fraction of steam, while the opposite behavior is observed for the conversion to NOx when ilmenite is used. Higher rates of (CO+CO2+CH4) and NOx formation are observed at higher volume fractions of steam for both oxygen carriers. Rates of (CO+CO2+CH4) and NOx formation increase with temperature when ilmenite is used, for both volume fractions of steam. This is also true for Fe2O3 at lower temperatures. In general, there appear to be a larger difference between the two oxygen carriers than the differences in volume fraction of steam, concerning conversion to NOx.

Department of Energy and Materials Chalmers University of Technology
Gothenburg, Sweden 2015 III
Table of Contents
List of Figures .......................................................................................................................................................................... V
List of Tables .......................................................................................................................................................................... VI
1. Introduction ............................................................................................................................................... 1
2. Scope of the study .................................................................................................................................... 3
3. Background ................................................................................................................................................ 4
3.1 Carbon Capture Techniques ......................................................................................................................... 4
3.2 Chemical Looping Combustion ................................................................................................................... 5
3.3 Oxygen Carriers ................................................................................................................................................ 6
3.4 Fuel ........................................................................................................................................................................ 7
3.5 Gasification ......................................................................................................................................................... 7
3.6 NOx formation ................................................................................................................................................... 8
3.6.1 Thermal NO .................................................................................................................................................................... 8
3.6.2 Prompt NO ...................................................................................................................................................................... 8
3.6.3 Fuel NO ............................................................................................................................................................................. 9
3.7 Previous work ................................................................................................................................................... 9
4. Experimental .......................................................................................................................................... 10
4.1 Oxygen carriers ............................................................................................................................................... 10
4.2 Fuel ...................................................................................................................................................................... 10
4.3 Experimental setup and procedure ........................................................................................................ 11
4.3.1 Experimental setup .................................................................................................................................................. 11
4.3.2 Experimental procedure ........................................................................................................................................ 12
4.4 Analysis methods and data evaluation .................................................................................................. 14
4.4.1 Flow- and concentration measurements ........................................................................................................ 14
4.4.2 Ion Chromatography analysis .............................................................................................................................. 17
5. Results and Discussion ........................................................................................................................ 18
5.1 Concentration profiles ................................................................................................................................. 18
5.2 Instantaneous conversion .......................................................................................................................... 20
5.3 Cumulative conversion ................................................................................................................................ 22
5.4 Total conversion ............................................................................................................................................. 23
5.5 Rate of formation ........................................................................................................................................... 26
5.6 Average rate of formation ........................................................................................................................... 28
Department of Energy and Materials Chalmers University of Technology
Gothenburg, Sweden 2015 IV
6. Conclusions ............................................................................................................................................. 30
7. Future work ............................................................................................................................................ 31
8. Acknowledgements .............................................................................................................................. 32
9. References ............................................................................................................................................... 33
Department of Energy and Materials Chalmers University of Technology
Gothenburg, Sweden 2015 V
List of Figures Figure 1. Schematic illustration of the CLC process. ....................................................................................... 5
Figure 2. Routes of formation for NOx and other volatile species during the primary and
secondary devolatilization of the solid fuel. ...................................................................................................... 9
Figure 3. Reaction paths of volatile nitrogen species (Neumann, 2014). ............................................... 9
Figure 4. Schematic illustration of the test setup. ......................................................................................... 11
Figure 5A (ilmenite) and 5B (Fe2O3). Concentration profiles of dry gases out from the reactor, 1
cycle; 33% volume fraction of steam at 950°C. .............................................................................................. 18
Figure 6A (ilmenite) and 6B (Fe2O3). Instantaneous conversion during reducing phase
at 33% volume fraction of steam, for 850, 900 and 950°C. ....................................................................... 20
Figure 7A (ilmenite) and 7B (Fe2O3). Instantaneous conversion during reducing phase
at 50% volume fraction of steam, for 850, 900 and 950°C.. ...................................................................... 20
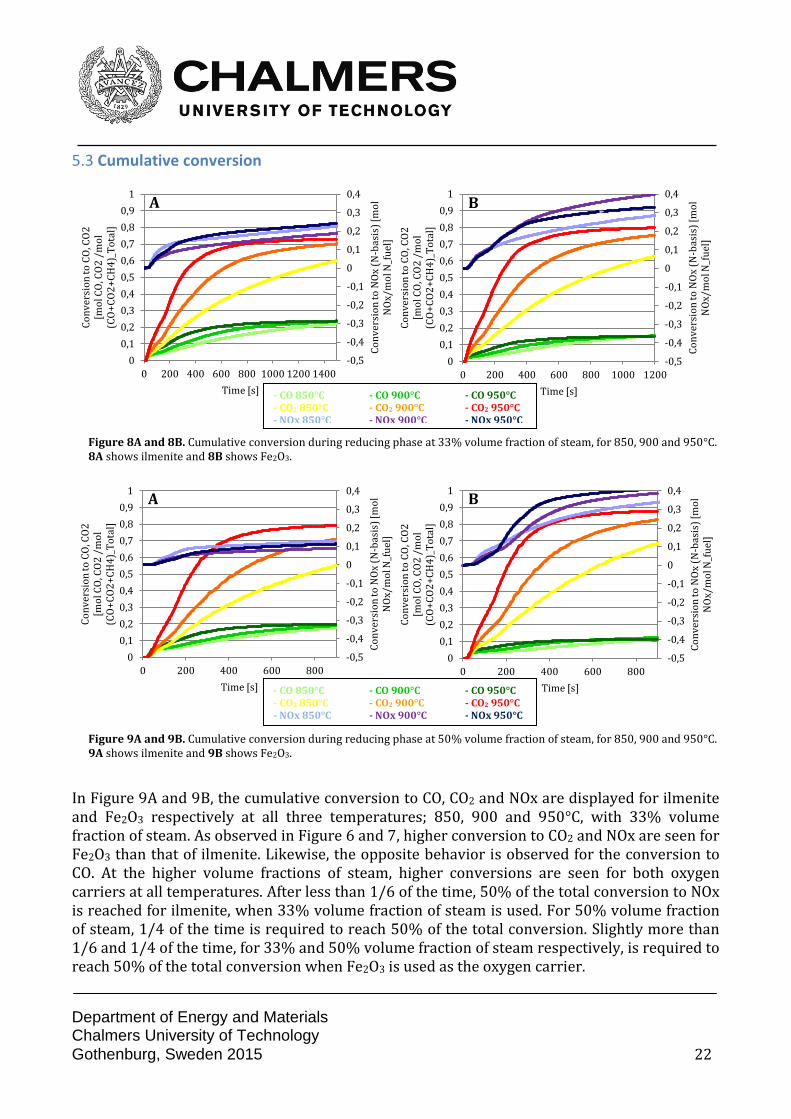
Figure 8A (ilmenite) and 8B (Fe2O3). Cumulative conversion during reducing phase
at 33% volume fraction of steam, for 850, 900 and 950°C.. ...................................................................... 22
Figure 9A (ilmenite) and 9B (Fe2O3). Cumulative conversion during reducing phase
at 50% volume fraction of steam, for 850, 900 and 950°C.. ...................................................................... 22
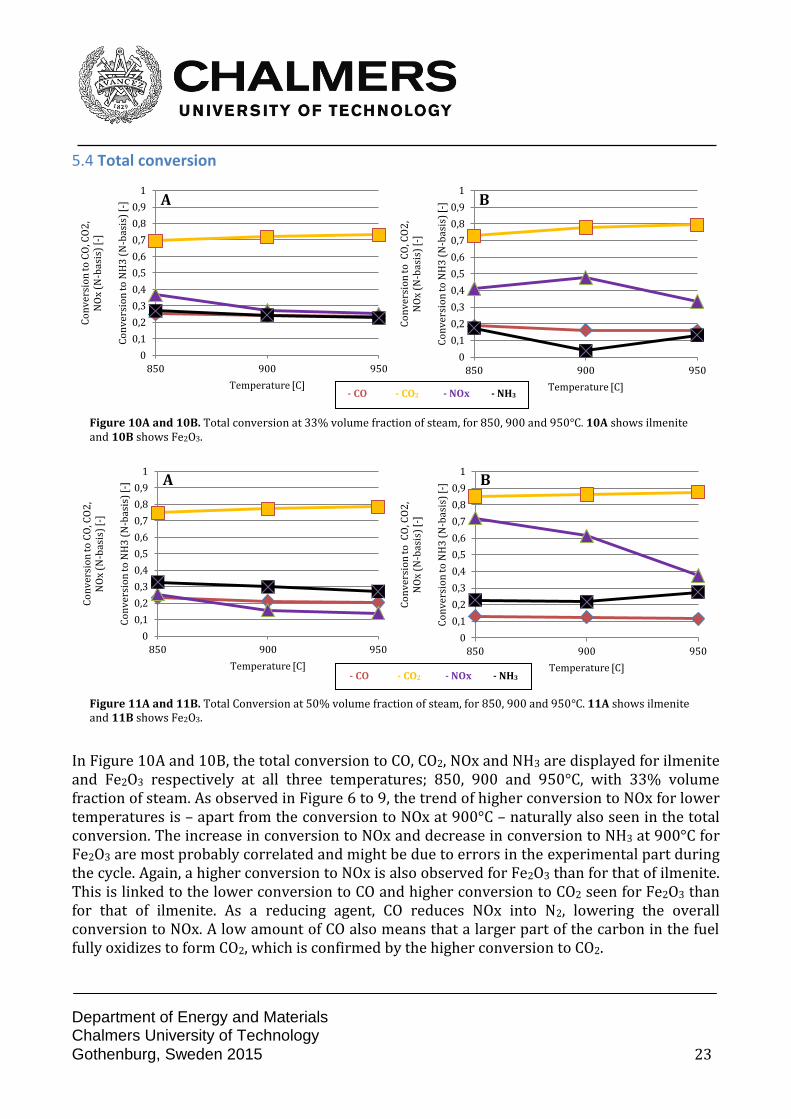
Figure 10A (ilmenite) and 10B (Fe2O3). Total conversion at 33% volume fraction of steam,
for 850, 900 and 950°C.. .......................................................................................................................................... 23
Figure 11A (ilmenite) and 11B (Fe2O3). Total Conversion at 50% volume fraction of steam,
for 850, 900 and 950°C.. .......................................................................................................................................... 23
Figure 12A (ilmenite) and 12B (Fe2O3). Total Conversion at 33% volume fraction of steam,
for 850, 900 and 950°C. ........................................................................................................................................... 25
Figure 13A (ilmenite) and 13B (Fe2O3). Total Conversion at 50% volume fraction of steam,
for 850, 900 and 950°C.. .......................................................................................................................................... 25
Figure 14A (ilmenite) and 14B (Fe2O3). Instantaneous rate of formation during
reducing phase, 1 cycle; 33% volume fraction of steam at 950°C.. ........................................................ 26
Figure 15A (ilmenite) and 15B (Fe2O3). Instantaneous rate of formation during
reducing phase, 1 cycle; 50% volume fraction of steam at 950°C. ......................................................... 26
Figure 16A (ilmenite) and 16B (Fe2O3). Average Instantaneous rate of formation for
30-70% carbon conversion, during reducing phase. 33% volume fraction of steam,
for 850, 900 and 950°C. ........................................................................................................................................... 28
Figure 17A (ilmenite) and 17B (Fe2O3). Average Instantaneous rate of formation for
30-70% carbon conversion, during reducing phase. 50% volume fraction of steam,
for 850, 900 and 950°C. ........................................................................................................................................... 28

Department of Energy and Materials Chalmers University of Technology
Gothenburg, Sweden 2015 VI
List of Tables Table 1. Volumetric and molar flow rates for Reducing and Inert/Oxidizing phases, 33% steam.
........................................................................................................................................................................................... 13
Table 2. Volumetric and molar flow rates for Reducing and Inert/Oxidizing phases, 50% steam.
........................................................................................................................................................................................... 13
Department of Energy and Materials Chalmers University of Technology
Gothenburg, Sweden 2015 1
1. Introduction
As the development of the global society proceeds, the effect of climate change from fossil fuel usage is becoming one of the most alarming problems to solve. When burning oil, gas, coke and other fossil hydrocarbons large amounts of green house gases (GHG) are produced, where carbon dioxide (CO2) contributes the most to the global warming (Olajire, 2010; Pires, Martins, Alvim-Ferraz, & Simões, 2011). Switching from combustion of fossil fuels to techniques based on renewable energy sources will prevent further CO2 emissions and therefore reduce the green house effect (Fu & Gundersen, 2012). Solar power, wind and hydropower as well as biofuels are commonly used renewable energy sources. Biofuels are refined, virgin or waste material used as fuel in combustion processes for heat and electricity production. The origin of the biofuel differs depending on the geographical location and may vary from methanol produced from bio crops, to waste material from the paper industry and sewage from agriculture and municipalities (Ragauskas et al., 2006; Rulkens, 2008). However contributing to increased CO2 emissions, it is likely that fossil fuels will be the dominant source of energy, until other energy sources are reliable, cheaper and have the capacity to fully meet the energy demand (Wall, 2007). To cope with the CO2 emissions, techniques are being developed to separate CO2 before or during the combustion of various fuels, transport and finally store the compressed gas. These techniques are called Carbon Capture and Storage (CCS) and have primarily been under development during the last decade (Gibbins & Chalmers, 2008; Wall, 2007). Chemical Looping Combustion (CLC) has emerged as one of the most promising methods for obtaining pure CO2 in the flue gas. While other techniques have to pay an energy penalty for gas separation in order to obtain pure CO2, CLC can maintain a high total efficiency as no extra separation is required (Lyngfelt, Leckner, & Mattisson, 2001). Another advantage with the CLC technique is that nitrogen from the air is not present during the fuel conversion. This means that when a nitrogen free fuel such as syngas (CO and H2) is used, no formation of nitrogen oxides (NOx) exists. However, when utilizing solid fuels containing nitrogen compounds, some NOx formation is inevitable (T. Song et al., 2012). Studies have been made measuring the type and amount of NOx species from testes simulating the nitrogen content of the fuel by addition of external nitrogen sources such as ammonia (Neumann, 2014). Still, there are very limited studies where commercial solid fuels containing nitrogen have been analyzed. To adapt the knowledge achieved in lab bench scales to information useful for the power industry, using a commercial type of fuel is a crucial step.
Department of Energy and Materials Chalmers University of Technology
Gothenburg, Sweden 2015 2
Coal is one of the most abundant and used fuels, with an estimated annual use of about 5000 billion metric tons corresponding to 25% of the global energy consumption (year 2000) (Chow, Kopp, & Portney, 2003). It is therefore clear that the CLC system must be adapted to this kind of fuel.
The nitrogen content in coal is generally between 0.4 and 1.6 wt% (Liu, Feng, Lu, & Zheng, 2005). To understand the fate of this nitrogen, studies analyzing flue gas products from the CLC system are required. Also, what type of compounds the nitrogen forms is important, to determine if they need to be separated and what techniques to utilize. With knowledge about the mechanisms behind the formation of nitrogen containing compounds it is possible to further investigate ways to reduce reactions with the nitrogen. These questions are necessary to answer, to take the CLC method the last step towards commercial use. By doing so, the technology has a great potential to contribute to decrease CO2 emissions and thereby stop the increase in temperature, which is of great concern to the global society.
Department of Energy and Materials Chalmers University of Technology
Gothenburg, Sweden 2015 3
2. Scope of the study
In this project, the NOx formation from fuel bound nitrogen is analyzed in a bench scale CLC system. Two different oxygen carriers (ilmenite and Fe2O3 on Mg-ZrO2) are tested with one solid fuel, at different volume fractions of steam and working temperatures. During the project, the kind of nitrogen species that are formed during the fuel conversion will be analyzed. Furthermore, the rate of NOx formation will be calculated. How the results differ between the two oxygen carrier materials, different temperatures and volume fractions of steam is also important to analyze and discuss.

Department of Energy and Materials Chalmers University of Technology
Gothenburg, Sweden 2015 4
3. Background
In this chapter, a background is presented. As a start, different techniques used to capture carbon in the form of CO2 are presented, ending of with the CLC concept. A more detailed section about the oxygen carrier follows, listing compounds used in CLC. Different fuels and the advantages and challenges they present with a focus on nitrogen content are discussed, as this is highly relevant for the study. The formation of NOx is also of great importance, what reaction steps and mechanisms that are possible and how much of the fuel bound nitrogen that theoretically might be converted to nitrogen gas and nitrogen containing compounds.
3.1 Carbon Capture Techniques There are several combustion techniques which either directly include separation and capture of CO2 or are compatible with external CCS systems. In Post-Combustion Capture (PCC), CO2 in the flue gas from the combustion chamber is absorbed by chemical agents in a solution, such as monoethanolamine (MEA) or methyldiethanolamine (MDEA). By heating up the solution, CO2 is regenerated and extracted. In addition to the energy penalty, large equipment and considerable volumes of required solvents, large water consumption and emissions from solvent recovery are disadvantages within PCC (Haszeldine, 2009; Wall, 2007). Pre-combustion capture or Integrated Gasification Combined Circle (IGCC) is a method where the fuel is converted into syngas before combustion. The carbon monoxide is then converted to CO2 in a water-gas shift process (Fu & Gundersen, 2012). The IGCC technique is proved to work at an annual megaton scale and is currently operating in several projects worldwide. Presenting a good compatibility with multiple fuels, major disadvantages with the technique is the high construction and operating cost and decreased short-term flexibility (Haszeldine, 2009).
To obtain a high concentration of CO2 in the flue gas and avoid formation of NOx from nitrogen in the air, OXY-Fuel combustion (OXYF) is a method currently used in pilot projects. As the name suggests, pure oxygen is used for the combustion rather than air (Olajire, 2010). However, to control the combustion temperature, a major part of the flue gas (containing CO2 and H2O) is recycled to the combustion chamber (Fu & Gundersen, 2012). Advantages are high CO2 concentrations in the flue gas and the lack of solvents usage. The main disadvantage are the large required amount of oxygen, which is expensive, energy consuming, as well as high risk concentrated oxygen pose when mixed with flammable substances (Olajire, 2010).
Department of Energy and Materials Chalmers University of Technology
Gothenburg, Sweden 2015 5
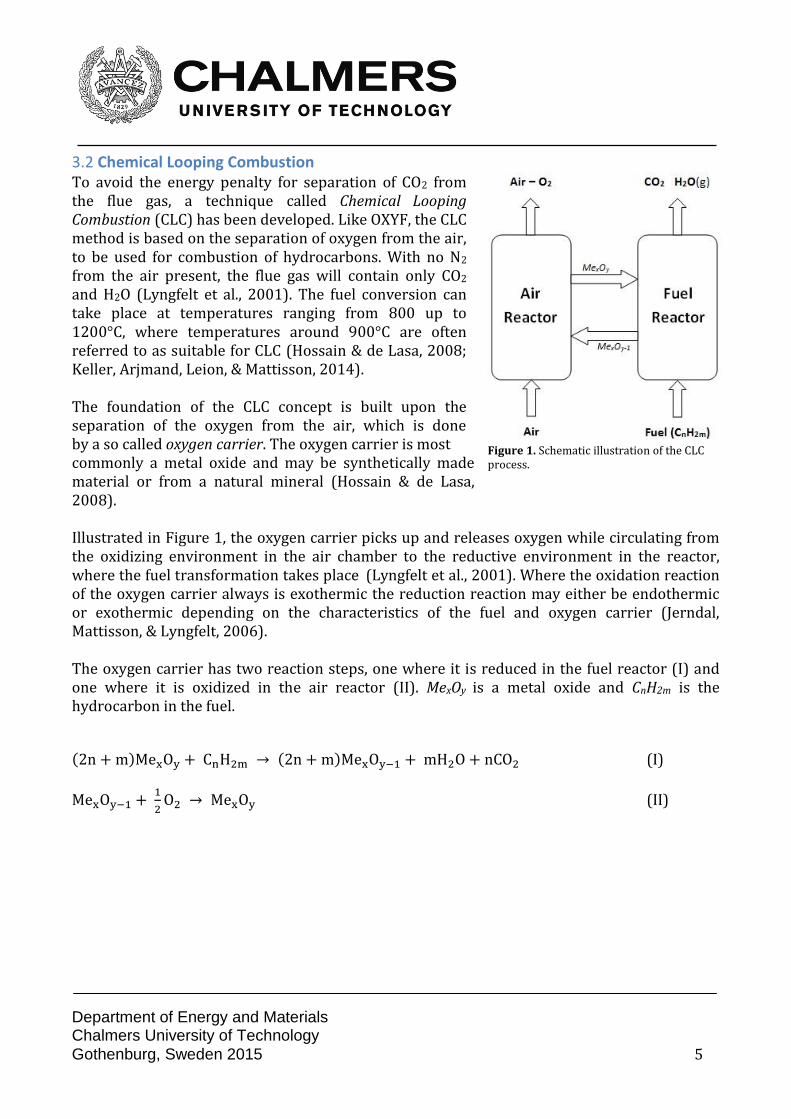
3.2 Chemical Looping Combustion To avoid the energy penalty for separation of CO2 from the flue gas, a technique called Chemical Looping Combustion (CLC) has been developed. Like OXYF, the CLC method is based on the separation of oxygen from the air, to be used for combustion of hydrocarbons. With no N2 from the air present, the flue gas will contain only CO2 and H2O (Lyngfelt et al., 2001). The fuel conversion can take place at temperatures ranging from 800 up to 1200°C, where temperatures around 900°C are often referred to as suitable for CLC (Hossain & de Lasa, 2008; Keller, Arjmand, Leion, & Mattisson, 2014). The foundation of the CLC concept is built upon the separation of the oxygen from the air, which is done by a so called oxygen carrier. The oxygen carrier is most commonly a metal oxide and may be synthetically made material or from a natural mineral (Hossain & de Lasa, 2008). Illustrated in Figure 1, the oxygen carrier picks up and releases oxygen while circulating from the oxidizing environment in the air chamber to the reductive environment in the reactor, where the fuel transformation takes place (Lyngfelt et al., 2001). Where the oxidation reaction of the oxygen carrier always is exothermic the reduction reaction may either be endothermic or exothermic depending on the characteristics of the fuel and oxygen carrier (Jerndal, Mattisson, & Lyngfelt, 2006). The oxygen carrier has two reaction steps, one where it is reduced in the fuel reactor (I) and one where it is oxidized in the air reactor (II). MexOy is a metal oxide and CnH2m is the hydrocarbon in the fuel.
(I)
(II)
Figure 1. Schematic illustration of the CLC process.
Department of Energy and Materials Chalmers University of Technology
Gothenburg, Sweden 2015 6
CLC is currently tested in several countries in pilot scale projects. Variations in equipment setup, type of fuel, oxygen carrier, temperature and flow rates are analyzed for facilities from 10 kW up to 1 MW (Berguerand & Lyngfelt, 2009; Pröll et al., 2009; Ströhle, Orth, & Epple, 2014). Other parameters that differ are how the equipment is run and for what purpose. If the purpose of the plant is to reform the fuel rather than burning it, methane and other larger hydrocarbons can catalytically be cracked in to smaller fractions such as CO and H2. This technique is called Chemical Looping Reforming (CLR) (Rydén, Lyngfelt, & Mattisson, 2008). When solid fuels are used in CLC, direct contact between the fuel and the oxygen carrier is not sufficient for effective fuel conversion. To increase the contact and thereby the reaction rate, gasification of the fuel is considered an alternative. This method is referred to as in-situ Gasification CLC (iG-CLC) and is utilized for CLC as well as CLR (Adanez, Abad, Garcia-Labiano, Gayan, & De Diego, 2012). Oxygen carrier materials may not only be used in a chemical looping combustion system but is also used for conventional Circulating Fluidized Bed (CFB) combustion. By even out oxygen concentration differences in the reactor, the added oxygen carrier increases the energy efficiency, as well as reduces temperature differences. The concept, called Oxygen Carrier Aided Combustion (OCAC) has recently been tested in a laboratory setup and shows a lot of potential to advance fluidized bed combustion (Zhao et al., 2014).
3.3 Oxygen Carriers The keystone in the CLC process is the oxygen carrier, a metal oxide that transports oxygen from aerobic, oxidizing conditions in the air reactor to the anaerobic, reducing environment in the fuel reactor. This circulation enables oxygen to be brought in contact with the fuel without any presence of nitrogen and thereby preventing formation of NOx during the fuel conversion (Berguerand & Lyngfelt, 2009). Though most oxygen carriers are based on a metal oxide, their chemical and physical properties varies as well as their origin. To ensure good oxygen carrier capacity, the material should have high reactivity and mechanical strength and a high oxygen transport capacity (Hossain & de Lasa, 2008; Pröll et al., 2009). Some possible materials suitable as oxygen carriers are F2O3, CuO, Mn3O4, CoO and NiO (Adánez et al., 2004; Pröll et al., 2009). Oxygen carriers might be found as natural minerals, rest products from the mining industry or as synthesized compounds (Leion, Jerndal, et al., 2009). Some oxygen carriers, such as ilmenite, are both synthesized and found as a mineral (Azis, Jerndal, Leion, Mattisson, & Lyngfelt, 2010). The oxygen carrier of choice depends to large extent on what fuel that will be used, as some fuels might agglomerate with a particular type of oxygen carrier (Keller et al., 2014). However, as for all industrial utilized methods, the economy is the defining factor. An inexpensive oxygen carrier with a short lifetime may still be more economical favorable than a more sustainable, expensive material (Azis et al., 2010).

Department of Energy and Materials Chalmers University of Technology
Gothenburg, Sweden 2015 7
To improve the physical and chemical properties and thereby extend the lifetime of the oxygen carrier, an inert so called support material may be used. Al2O3, SiO2, TiO2, and ZrO2 are materials that oxygen carriers may be combined with (Adánez et al., 2004). When designing the support material, a ceramic material is commonly used, where mechanical strength, high surface area, ion conductivity and compatibility with the oxygen carrier material are important properties (Adánez et al., 2004; Pröll et al., 2009). While the oxygen in ordinary oxygen carriers is bound to the metal oxide and therefore requires gasification of solid fuels to achieve sufficient contact for the reaction, some oxides such as CuO relies the oxygen as gaseous O2. This phenomenon is referred to as Chemical Looping with Oxygen Uncoupling (CLOU) and is a good alternative for solid fuels as the reaction rates are increased with up to a factor 3 compared to conventional oxygen carriers (Leion, Mattisson, & Lyngfelt, 2009).
3.4 Fuel Until recently, gaseous fuels have been the choice of fuel when analyzing the capacity and lifetime of oxygen carriers in conventional CLC (Leion, Jerndal, et al., 2009). However, as conventional combustion techniques utilizes solid fuels like coke, coal and biomaterials, analysis of these kinds of fuels in CLC setups are of great importance. Combustion of gaseous fuels with low nitrogen content, such as methane or syngas, limits the NOx formation in the air free environment (Hossain & de Lasa, 2008). Solid fuels on the other hand contain substances such as sulfur and nitrogen and is therefore a source of NOx formation (T. Song et al., 2012). Coal from different parts of the world has been the subject of many studies and the reactions between oxygen carriers and a range of components found in biofuels have been analyzed (Keller et al., 2014; Leion, Lyngfelt, & Mattisson, 2009; Leion, Jerndal, et al., 2009).
3.5 Gasification To create a gas-solid reaction between the solid fuel and oxygen carrier materials without CLOU properties, gasification of the fuel is required. This is done since solid-solid reactions in fluidized beds are very slow (Leion, 2008). The gasification is done by using a gasification agent, such as CO2 or steam (Leion, 2008). In Reaction (III) and (IV), the reactions between solid fuel and the gasification agents are shown (Leion, Mattisson, & Lyngfelt, 2008). Note that the fuel is simplified as carbon, C. (III) (IV)
Department of Energy and Materials Chalmers University of Technology
Gothenburg, Sweden 2015 8
By the CO-shift reaction, the oxygen can also be transferred within the gas phase (Reaction V): (V)
The gasification products react with the oxygen carrier, according to Reaction (VI) and (VII): (VI)
(VII)
3.6 NOx formation NOx is an umbrella term for nitrogen oxides, commonly nitric oxide (NO) and nitrogen dioxide (NO2). Nitrous oxide (N2O) is sometimes also included and is then denoted as NyOx. From an environmental perspective, NO and NO2 act as precursors to acidic rain whereas N2O is a greenhouse gas (Penthor, Mayer, Pro, & Hofbauer, 2014). Where the formation of N2O often can be neglected in many combustion systems, the main contributor to NOx formation is NO (Glarborg, Jensen, & Johnsson, 2003). Formation of NO in combustion can be derived into three categories: thermal, prompt and fuel NO. 3.6.1 Thermal NO Thermal NO is formed when atmospheric nitrogen is oxidized in fuel-lean environments and at high temperatures. The process, which is highly temperature dependent, is described in Reaction (VIII to X), by the three reactions in the extended Zeldovich mechanism. As the thermal NO formation is significantly reduced at temperatures below 1600 - 1800 K, the Zeldovich reactions do not contribute a lot to the total NO formation, at temperatures used in a CLC process (Hill & Smoot, 2000). (VIII)
(IX)
(X) 3.6.2 Prompt NO The formation of prompt NO occurs in fuel-rich conditions and is initiated by a radical attack of the CH on the N2 (Reaction XI and XII). The formed hydrogen cyanide (HCN) is the intermediate stage in the formation of NO (Y. H. Song, Blair, Siminski, & Bartok, 1981). As N2 is absent in the fuel reactor of the CLC system and substantial amounts of fuel-nitrogen is present when solid fuels are used, the prompt NO is a small part of the total NO formation (Hill & Smoot, 2000).
(XI)
(XII)
Department of Energy and Materials Chalmers University of Technology
Gothenburg, Sweden 2015 9
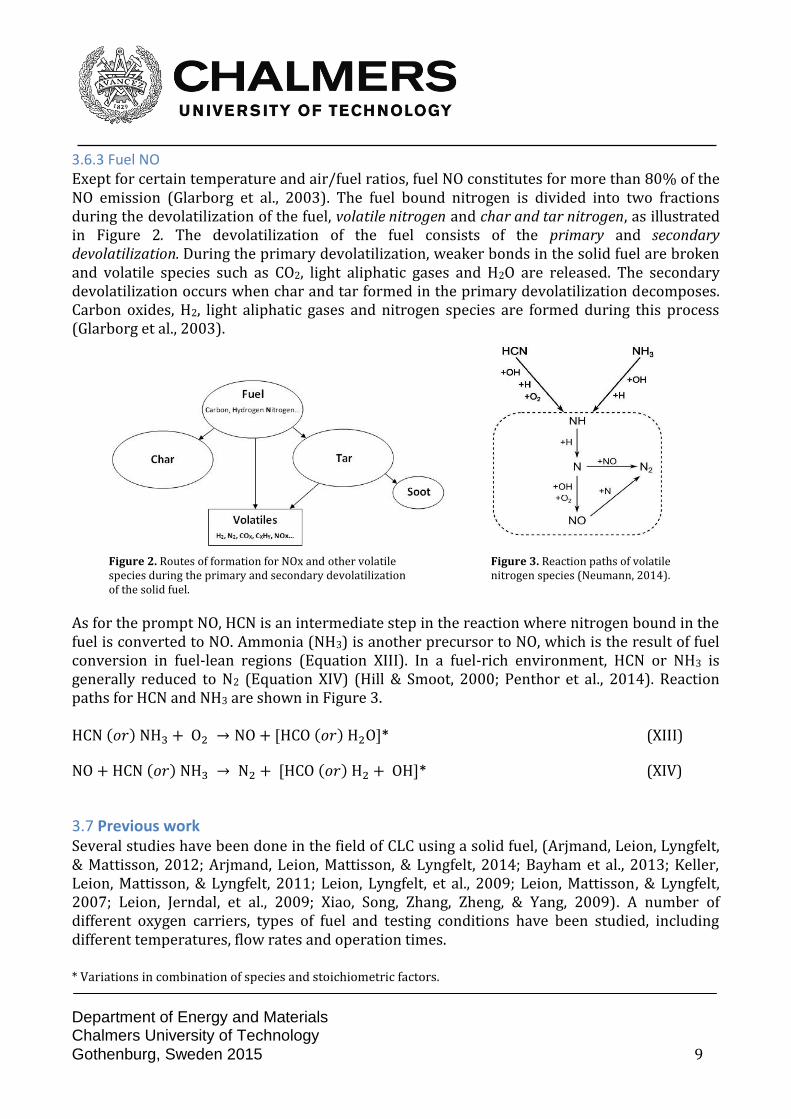
3.6.3 Fuel NO Exept for certain temperature and air/fuel ratios, fuel NO constitutes for more than 80% of the NO emission (Glarborg et al., 2003). The fuel bound nitrogen is divided into two fractions during the devolatilization of the fuel, volatile nitrogen and char and tar nitrogen, as illustrated in Figure 2. The devolatilization of the fuel consists of the primary and secondary devolatilization. During the primary devolatilization, weaker bonds in the solid fuel are broken and volatile species such as CO2, light aliphatic gases and H2O are released. The secondary devolatilization occurs when char and tar formed in the primary devolatilization decomposes. Carbon oxides, H2, light aliphatic gases and nitrogen species are formed during this process (Glarborg et al., 2003).
As for the prompt NO, HCN is an intermediate step in the reaction where nitrogen bound in the fuel is converted to NO. Ammonia (NH3) is another precursor to NO, which is the result of fuel conversion in fuel-lean regions (Equation XIII). In a fuel-rich environment, HCN or NH3 is generally reduced to N2 (Equation XIV) (Hill & Smoot, 2000; Penthor et al., 2014). Reaction paths for HCN and NH3 are shown in Figure 3. * (XIII)
* (XIV)
3.7 Previous work Several studies have been done in the field of CLC using a solid fuel, (Arjmand, Leion, Lyngfelt, & Mattisson, 2012; Arjmand, Leion, Mattisson, & Lyngfelt, 2014; Bayham et al., 2013; Keller, Leion, Mattisson, & Lyngfelt, 2011; Leion, Lyngfelt, et al., 2009; Leion, Mattisson, & Lyngfelt, 2007; Leion, Jerndal, et al., 2009; Xiao, Song, Zhang, Zheng, & Yang, 2009). A number of different oxygen carriers, types of fuel and testing conditions have been studied, including different temperatures, flow rates and operation times.
* Variations in combination of species and stoichiometric factors.
Figure 2. Routes of formation for NOx and other volatile species during the primary and secondary devolatilization of the solid fuel.
Figure 3. Reaction paths of volatile nitrogen species (Neumann, 2014).

Department of Energy and Materials Chalmers University of Technology
Gothenburg, Sweden 2015 10
4. Experimental
To answer the questions defined in the scope, a lab scale setup is used with alternating oxidizing and reducing environments, to mimic the conditions in a CLC unit. Two oxygen carrier materials are tested with a solid fuel, which is feed into the reactor during reducing phase. Between reducing and oxidizing phases inert gas is rinsed through the reactor. For tests with conventional oxygen carrier materials, steam is necessary for the fuel conversion.
4.1 Oxygen carriers Two oxygen carriers have been studied in this project, a synthesized iron oxide (Fe2O3 (60%) and Mg-ZrO2 (40%); VITO, Belgium) and an ilmenite ore (Cruzor, Australia). To achieve stabile operating performance of the ilmenite, the material is first heat treated, to remove any volatile material and to make sure the oxygen carrier is fully oxidize. The heat treatment – which also reduces the number of cycles required for the activation – is performed in an Entech box furnace at 950°C for 24 hours, in an atmospheric environment. After the heat treatment the agglomerated oxygen carrier is crushed and sieved to a size range of 125 to 180 µm. This is then followed by activation of the material in a fluidized-bed reactor of quartz, with the same dimensions as the reactor used in the test setup. The activation is done by running cycles of oxidizing, inert and reducing phases until the CO2 concentration out from the reactor during the reductive phase stabilizes. This proves that the oxygen carrier provides a constant amount of oxygen during each reductive phase, which in this study occurs after 32 cycles. The first three cycles are performed at a lower temperature (900°C) to avoid agglomeration of the particles. The oxidation phase, 10% O2 in N2 with a flow of 900 ml/min, is stopped when the oxygen concentration out from the reactor equals the concentration in to the reactor. As no more oxygen reacts with the oxygen carrier, the material is in its most oxidized state. The inert phase consists of N2 with a flow of 900 ml/min and lasts for 180 seconds. This is followed by 80 seconds of reducing phase, where syngas (50% H2 in CO) at a flow of 450 ml/min is used. The synthesized iron oxide has a stabile operating performance and needs therefore no additional heat treatment or activation (Rydén, Cleverstam, Johansson, Lyngfelt, & Mattisson, 2010). The particles are sieved to a size range of 125 to 180 µm before usage. The oxidized form of the iron oxide is Fe2O3 and the reduced form is Fe3O4. For ilmenite, the suggested oxidized form is [Fe2TiO5 + TiO2] and the reduced form is FeTiO3. The reaction steps are further described by Jerndal (2006) and Leion (2008).
4.2 Fuel The solid fuel used in this project is a Swedish wood char from Skogens Kol AB, which chemical composition has been analyzed by BELAB (www.belab.nu). Before usage of the fuel, the particles have been sieved to a size range of 250 to 355 µm in diameter.

Department of Energy and Materials Chalmers University of Technology
Gothenburg, Sweden 2015 11
4.3 Experimental setup and procedure
4.3.1 Experimental setup The test setup shown schematically in Figure 4 is based on the reactor, which is a 880 mm long fluidized-bed reactor of quartz. The reactor is heated with an Electro Heat (Sweden) oven, which temperature is measured and controlled by Type-K thermocouples. To analyze the fluidization of the bed, the differential pressure is measured over the reactor. Inside the reactor, a perforated plate is used as the bottom part of the fluidization zone, on which the oxygen carrier is placed. The plate is placed 400 mm from the bottom end of the reactor. The inner diameters are approximately 8 and 22 mm below and above the perforated plate respectively. The section of the reactor is where the fluidization takes place and has a length of 400 mm, where around 100 mm is actually used for the fluidization. To the gas inlet at the bottom of the reactor, pipelines supplying oxidizing, inert and reducing gas mixtures are connected. The steam generator, which connected to a flow of nitrogen supplies the reducing gas mixture, is made by running 13.3 ml/h liquid H2O in a steel pipe, approximately 1200 mm long with an outer diameter of 3.175 mm. The steel pipeline is heated by heating bands connected to a Eurotherm 24V, 4-20 mA regulator, to a temperature of approximately 120°C.
Figure 4. Schematic illustration of the test setup.
Department of Energy and Materials Chalmers University of Technology
Gothenburg, Sweden 2015 12
Next to the gas outlet at the top part of the reactor, an inlet vault for the solid fuel feed is connected. Coupled with the vault is a pipe mixing sweeping gas with the fuel feed, as further described below. The gas out from the reactor is directed via a cooler, which condenses the steam fraction in the gas, into a Rosemont NGA 2000 non-dispersive infrared diffraction (NDIR) analyzer, in which CO2, CO, CH4 and O2 concentrations are measured continuously. A fraction of the gas out from the reactor is split from the main stream before the cooler and lead to via an ammonia sampler to a second analyzer. In the Eco Physics CLD 700 EL ht chemiluminescence NO/NOx analyzer, NO, NO2 and NOx concentrations are measured. The samples collected in the ammonia sampler are analyzed with ion chromatography in a cation Dionex ICS-900 apparatus with a Dionex AS-DV automatic sample injector, from which analysis the NH3 concentration is calculated.
4.3.2 Experimental procedure To mimic the cycling environment in the CLC process, oxidizing and reducing conditions are altered. During reducing conditions, fluidizing gas consisting of 600 ml/min 50% respective 900 ml/min 33% steam in N2 is introduced at the bottom of the reactor, while 0.1 gram solid fuel is added manually from the top. To ensure that the fuel reaches the fluidized bed (see Section 4.2.1) without getting stuck in the feeding pipe, a flow of 250 ml/min N2 is used to sweep the fuel into the reactor (2 in Figure 4). The sweeping gas does not enter the fluidization zone and therefore takes no part in any reaction. For 50% steam, 300 ml/min N2 is added to the combustion gases before the inlet of the analyzer to ensure a measurable gas flow through the apparatus (6 in Figure 4). The reduction is allowed to proceed until the CO2 reach a constant concentration at the detection limit and is then followed by 180 seconds of an inert phase (900 ml/min N2) to rinse the system. After the inert phase, 900 ml/min synthetic air will be led through the reactor from below until the oxygen concentration is the same out from the reactor as in the inlet. This is done to ensure complete oxidation of the OC. To limit the temperature increase due to the exothermic oxidation reaction, 5% oxygen in nitrogen is used instead of pure synthetic air (20% O2 in N2) (Leion, Lyngfelt, et al., 2009). The outflow from the reactor is split, cooled and led to two analyzers which detect NO, NO2 and NOx respective CO2, CO, CH4 and O2. Before entering the NOx analyzer, the gas flow (4 in Figure 4, 369 ml/min) goes through an ammonia trap, consisting of a low molar sulfuric acid solution (15.49 g H2SO4 in 2L H2O) in a cooled on-line container. The amount of ammonium ions trapped in the solution is separately measured by Ion Chromatography (IC), where one mol of ammonium ions corresponds to one mol of ammonia. For every combination of oxygen carrier, temperature and volume fraction of steam, a sample of approximately 68 ml H2SO4 solution is collected, which then is analyzed per three full cycles.

Department of Energy and Materials Chalmers University of Technology
Gothenburg, Sweden 2015 13
In Table 1 and 2, the flow rates for every step in the system setup are listed. The flow rates are the same for oxidizing and inert phases, while reducing phase differs due to the volume fraction of steam. Types of oxygen carrier, temperature and steam concentration are three parameters that are altered throughout the study. For each combination, three cycles are tested. Table 1. Dry volumetric and molar flow rates for Reducing and Inert/Oxidizing phases, 33% steam.
Reducing Flow rates Inert and Oxidizing Flow rates
q[1] 600 [mL/min] 0,000409 [mol/s] q[1] 900 [mL/min] 0,000613 [mol/s]
q[2] 250 [mL/min] 0,00017 [mol/s] q[2] 250 [mL/min] 0,00017 [mol/s]
q[3] 850 [mL/min] 0,000579 [mol/s] q[3] 1150 [mL/min] 0,000783 [mol/s]
q[4] 369* [mL/min] 0,000251 [mol/s] q[4] 369* [mL/min] 0,000251 [mol/s]
q[5] 481 [mL/min] 0,000328 [mol/s] q[5] 781 [mL/min] 0,000532 [mol/s]
q[6] 0 [mL/min] 0 [mol/s] q[6] 0 [mL/min] 0 [mol/s]
q[7] 481 [mL/min] 0,000328 [mol/s] q[7] 781 [mL/min] 0,000532 [mol/s]
Table 2. Dry volumetric and molar flow rates for Reducing and Inert/Oxidizing phases, 50% steam.
Reducing Flow rates Inert and Oxidizing Flow rates
q[1] 300 [mL/min] 0,000204 [mol/s] q[1] 900 [mL/min] 0,000613 [mol/s]
q[2] 250 [mL/min] 0,00017 [mol/s] q[2] 250 [mL/min] 0,00017 [mol/s]
q[3] 550 [mL/min] 0,000375 [mol/s] q[3] 1150 [mL/min] 0,000783 [mol/s]
q[4] 369* [mL/min] 0,000251 [mol/s] q[4] 369* [mL/min] 0,000251 [mol/s]
q[5] 181 [mL/min] 0,000123 [mol/s] q[5] 781 [mL/min] 0,000532 [mol/s]
q[6] 300 [mL/min] 0,000204 [mol/s] q[6] 300 [mL/min] 0,000204 [mol/s]
q[7] 481 [mL/min] 0,000328 [mol/s] q[7] 1081 [mL/min] 0,000736 [mol/s]
* Set flow rate for the NOx analyzer.

Department of Energy and Materials Chalmers University of Technology
Gothenburg, Sweden 2015 14
4.4 Analysis methods and data evaluation
4.4.1 Flow- and concentration measurements The CO, CO2, CH4 and O2 concentrations of the dry gas out from the reactor are measured by the analyzer, shown in the schematically illustration of the test setup, 7 in Figure 4. Similarly, the NOx concentration is measured in the NOx analyzer 8 in Figure 4. To calculate the concentrations in the reactor (1 in Figure 4), mass balances are made over the system, for the Analyzer respective the NOx Analyzer. Equation 1 and 2 are used, for CO, CO2, CH4 and O2 respective NOx:
(1)
(2)
where C is the dry concentration [vol.% or ppm] and q is the volumetric flow [ml/min] at each point in Figure 4. Note that the calculated concentrations are dry concentrations; hence C4 and C8 are the same. From the volumetric flow converted into molar flow rates, combined with the concentrations, rates molar flow rates are calculated. Instantaneous, cumulative and total conversion (Equation 3 to 8) as well as rates of formation (Equation 9 to 11) are then calculated for CO, CO2, CH4 and NOx. Note that conversion to CO, CO2, CH4 and NOx is the conversion of carbon or nitrogen in the fuel, where CO, CO2, CH4 and NOx are formed respectively. The instantaneous conversion (Equation 3 and 4) is a measurement for how much of the total carbon or nitrogen content in the fuel that is converted into different carbon or nitrogen species at a certain time step during the reducing phase:
(3)
where X, instantaneousA,i is the instantaneous conversion of specie A at time step i [-]. nA,i is the amount of specie A at time step i [mol] and (nCO+nCO2+nCH4)total is the total amount of carbon in the converted fuel at the last time step [mol]. A is CO, CO2 or CH4. Each interval is 2 seconds.
(4)
where X, instantaneousNOx,i is the instantaneous conversion to NOx at time step i [-]. NNOx,i is the amount of NOx at time step i [mol] and (nN-Fuel)total is the total amount of nitrogen in the converted fuel at the last time step [mol]. Each interval is 2 seconds.
Department of Energy and Materials Chalmers University of Technology
Gothenburg, Sweden 2015 15
The cumulative conversion (Equation 5 and 6) is a measurement of the accumulated value of formed carbon or nitrogen species at time step i, divided by the total amount of carbon or nitrogen in the fuel:
(5)
where X, cumulativeA,i is the cumulative conversion of specie A at time step i [-]. nA,i is the amount of specie A at time step i [mol] and (nCO+nCO2+nCH4)total is the total amount of carbon in the converted fuel at the last time step [mol]. A is CO, CO2 or CH4. Each interval is 2 seconds.
(6)
where X, cumulativeNOx,i is the cumulative conversion to NOx at time step i [-]. NNOx,i is the amount of NOx at time step i [mol] and (nN-Fuel)total is the total amount of nitrogen in the converted fuel at the last time step[mol]. Each interval is 2 seconds. The total conversion (Equation 7 and 8) is the cumulative conversion at the last time step during the reductive phase, when i = i[total]. The total conversion is a measurement of accumulated total amount of formed carbon or nitrogen species divided by the total amount of carbon or nitrogen in the fuel:
(7)
where X, totalA is the total conversion of specie A [-]. nA,i is the amount of specie A at time step i [mol] and (nCO+nCO2+nCH4)total is the total amount of carbon in the converted fuel at the last time step [mol]. A is CO, CO2 or CH4. Each interval is 2 seconds.
(8)
where X, totalNOx is the total conversion to NOx [-]. nNOx,i is the amount of NOx at time step i [mol] and (nN-Fuel)total is the total amount of nitrogen in the converted fuel at the last time step [mol]. Each interval is 2 seconds.

Department of Energy and Materials Chalmers University of Technology
Gothenburg, Sweden 2015 16
The instantaneous rate of formation (Equation 9) is a measurement of at what rate carbon or nitrogen species are formed during the fuel conversion. The instantaneous rate of formation is calculated as the change in amount of formed carbon or nitrogen species over time, divided by the amount of carbon or nitrogen remaining in the fuel:
(9)
where r, instantaneousA,i is the instantaneous rate of formation of specie A at time step i [1/s], nA,remaining is the amount of specie A left in the fuel inside the reactor [mol], dnB is the difference in amount of mol specie B [mol] and dt is the time step (2 s). A is carbon or nitrogen, B is (CO+CO2+CH4) or NOx. The remaining amount of carbon or nitrogen (Equation 10) is the amount of carbon or nitrogen left in the fuel inside the reactor at a certain time step, corresponding to a certain conversion at that time step:
(10)
where nA,total is the amount of A at the last time step [mol] and nB,i is the amount of at time step i [mol]. A is carbon or nitrogen and B is (CO+CO2+CH4) or NOx. The average rate of formation as a function of carbon conversion is calculated for an interval of 30 and 70% conversion, which is done to focus on the conditions most similar to those in a full scale CLC system. The first 30% of the carbon conversion is due to volatile compounds in the fuel, which in a heated, continuous system would not reach the reactor bed. At 70% carbon conversion, the amount of fuel in the batch fed reactor used in this study is very low, which is why the rate of formation deviates exponentially. In a continuously fed reactor, the amount of fuel would be kept at a constant level when operating. The average rate of formation (Equation 11) is a calculation of the average rate of formation of carbon or nitrogen species, divided by the number of time steps between 30% and 70% carbon conversion:
(11)
where <r> is the average rate of formation, X is the carbon conversion [-], r,instantaneousA is the instantaneous rate of formation of specie A [1/s] and i0.3X-0.7X is the number of time steps between 30 and 70% carbon conversion [-]. A is (CO+CO2+CH4) or NOx. Note that the conversion and rates of formation are calculated for the reducing phase, on the assumption that the fraction of non-converted fuel during the reducing phase is the same as for the full cycle.

Department of Energy and Materials Chalmers University of Technology
Gothenburg, Sweden 2015 17
4.4.2 Ion Chromatography analysis For each combination of oxygen carrier, temperature and volume fraction of steam, one sample of ammonium ions trapped in sulfuric acid solution is collected. The concentrations of ammonium ions are measured in the Ion Chromatography (IC) apparatus using three blank samples (containing milli-Q water) and four standard solutions. The standard solutions contain 1, 5, 10 and 20 mg ammonium ions per liter. From the concentration and the volume of the sample, the amount of ammonium ions is calculated, equal to the amount of ammonia. Finally, the conversion of nitrogen (Equation 12) in the fuel to ammonia is calculated as at the total amount of formed ammonia, divided by the total amount of nitrogen in the fuel:
(12)
where XNH3 is the total conversion to ammonia [-], nNH3, total is the total amount of formed ammonia [mol] and nN-Fuel, total is the total amount of nitrogen in the fuel [mol].
Department of Energy and Materials Chalmers University of Technology
Gothenburg, Sweden 2015 18
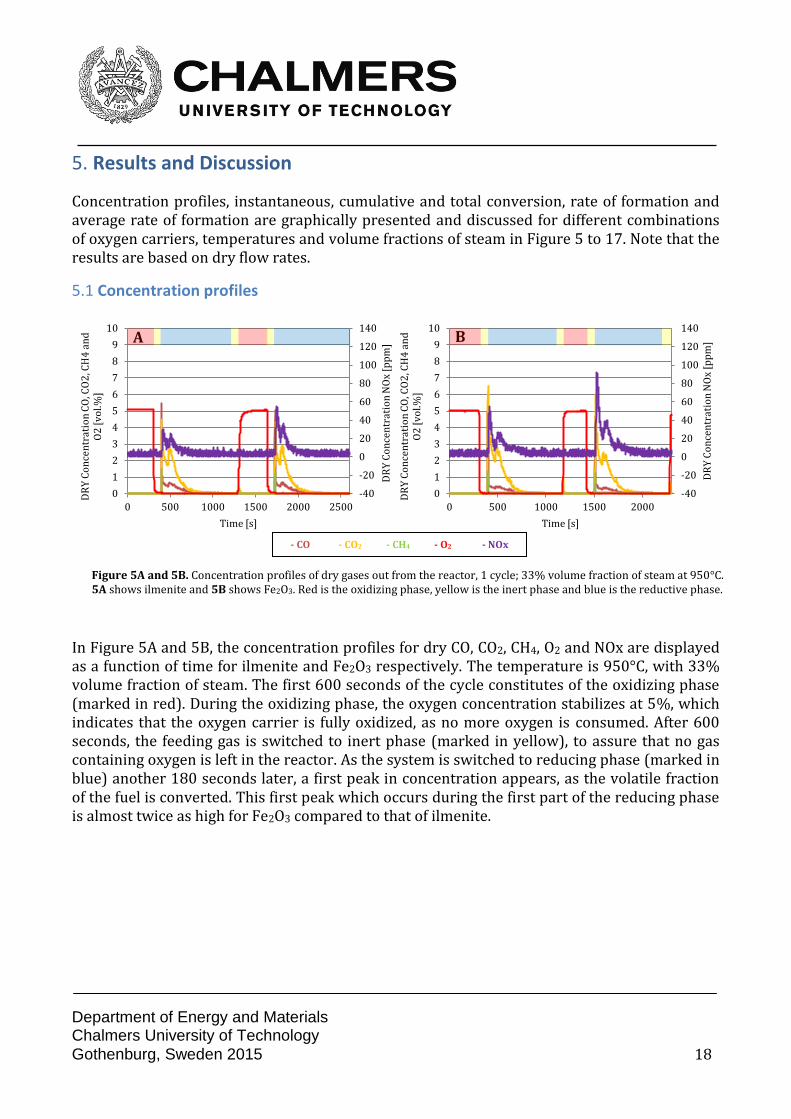
Figure 5A and 5B. Concentration profiles of dry gases out from the reactor, 1 cycle; 33% volume fraction of steam at 950°C. 5A shows ilmenite and 5B shows Fe2O3. Red is the oxidizing phase, yellow is the inert phase and blue is the reductive phase.
-40
-20
0
20
40
60
80
100
120
140
0
1
2
3
4
5
6
7
8
9
10
0 500 1000 1500 2000 2500
DR
Y C
on
cen
trat
ion
NO
x [p
pm
]
DR
Y C
on
cen
trat
ion
CO
, CO
2, C
H4
an
d
O2
[v
ol.%
]
Time [s]
-40
-20
0
20
40
60
80
100
120
140
0
1
2
3
4
5
6
7
8
9
10
0 500 1000 1500 2000
DR
Y C
on
cen
trat
ion
NO
x [p
pm
]
DR
Y C
on
cen
trat
ion
CO
, CO
2, C
H4
an
d
O2
[v
ol.%
]
Time [s]
5. Results and Discussion
Concentration profiles, instantaneous, cumulative and total conversion, rate of formation and average rate of formation are graphically presented and discussed for different combinations of oxygen carriers, temperatures and volume fractions of steam in Figure 5 to 17. Note that the results are based on dry flow rates.
5.1 Concentration profiles
In Figure 5A and 5B, the concentration profiles for dry CO, CO2, CH4, O2 and NOx are displayed as a function of time for ilmenite and Fe2O3 respectively. The temperature is 950°C, with 33% volume fraction of steam. The first 600 seconds of the cycle constitutes of the oxidizing phase (marked in red). During the oxidizing phase, the oxygen concentration stabilizes at 5%, which indicates that the oxygen carrier is fully oxidized, as no more oxygen is consumed. After 600 seconds, the feeding gas is switched to inert phase (marked in yellow), to assure that no gas containing oxygen is left in the reactor. As the system is switched to reducing phase (marked in blue) another 180 seconds later, a first peak in concentration appears, as the volatile fraction of the fuel is converted. This first peak which occurs during the first part of the reducing phase is almost twice as high for Fe2O3 compared to that of ilmenite.
A B
- CO - CO2 - CH4 - O2 - NOx

Department of Energy and Materials Chalmers University of Technology
Gothenburg, Sweden 2015 19
A second concentration peak corresponding to conversion of the non-volatile fraction of the fuel occurs roughly 100 seconds after the first peak, for ilmenite. For Fe2O3, the time until the second peak occurs is around 200 seconds. This second peak – which is more representative for a continuously fed reactor, as described in section 4.4.1 – is much closer in magnitude when comparing the two oxygen carriers, compared to the first peak. The concentration profiles of CO, CO2 and NOx all show comparable patterns with two peaks, while the increase in concentration of CH4 is limited to the conversion of volatile species in the fuel. In general, the NOx concentration is slightly higher for Fe2O3 than that of ilmenite. This is even more substantial for the volatile fraction of the fuel. As the trend is the same for both 33 and 50% volume fraction of steam, only the case for 33% steam is shown in the report.

Department of Energy and Materials Chalmers University of Technology
Gothenburg, Sweden 2015 20
Figure 6A and 6B. Instantaneous conversion during reducing phase at 33% volume fraction of steam, for 850, 900 and 950°C. 6A shows ilmenite and 6B shows Fe2O3.
Figure 7A and 7B. Instantaneous conversion during reducing phase at 50% volume fraction of steam, for 850, 900 and 950°C. 7A shows ilmenite and 7B shows Fe2O3.
-0,005
-0,004
-0,003
-0,002
-0,001
-1E-17
0,001
0,002
0,003
0
0,002
0,004
0,006
0,008
0,01
0 200 400 600 800 1000 1200 1400 C
on
ver
sio
n t
o N
Ox
(N-b
asis
) [m
ol
NO
x/m
ol N
_fu
el]
Co
nv
ersi
on
to
CO
, CO
2
[mo
l CO
, CO
2 /
mo
l (C
O+
CO
2+
CH
4)_
To
tal]
Time [s]
-0,005
-0,004
-0,003
-0,002
-0,001
-1E-17
0,001
0,002
0,003
0
0,002
0,004
0,006
0,008
0,01
0 200 400 600 800 1000 1200
Co
nv
ersi
on
to
NO
x (N
-bas
is)
[mo
l N
Ox/
mo
l N_f
uel
]
Co
nv
ersi
on
to
CO
, CO
2
[mo
l CO
, CO
2 /
mo
l (C
O+
CO
2+
CH
4)_
To
tal]
Time [s]
-0,005
-0,004
-0,003
-0,002
-0,001
-1E-17
0,001
0,002
0,003
0
0,002
0,004
0,006
0,008
0,01
0 200 400 600 800
Co
nv
ersi
on
to
NO
x (N
-bas
is)
[mo
l N
Ox/
mo
l N_f
uel
]
Co
nv
ersi
on
to
CO
, CO
2
[mo
l CO
, CO
2 /
mo
l (C
O+
CO
2+
CH
4)_
To
tal]
Time [s]
-0,005
-0,004
-0,003
-0,002
-0,001
-1E-17
0,001
0,002
0,003
0
0,002
0,004
0,006
0,008
0,01
0 200 400 600 800 C
on
ver
sio
n t
o N
Ox
(N-b
asis
) [m
ol
NO
x/m
ol N
_fu
el]
Co
nv
ersi
on
to
CO
, CO
2
[mo
l CO
, CO
2 /
mo
l (C
O+
CO
2+
CH
4)_
To
tal]
Time [s]
5.2 Instantaneous conversion
In Figure 6A and 6B, the instantaneous conversion during the reductive phase to CO, CO2, and NOx are displayed as a function of time, for ilmenite and Fe2O3 respectively. All three temperatures are shown; 850, 900 and 950°C, at 33% volume fraction of steam. When the reductive phase starts and the fuel is added to the reactor, conversion of volatile species in the fuel results in an instantaneous increase in the formation of CO, CO2 and NOx. Approximately 180 seconds later, the conversion of the non-volatile part of the fuel occurs, which gradually decreases until the conversion stops after 1000 to 1500 seconds.
A B
A B
- CO 850°C - CO 900°C - CO 950°C - CO2 850°C - CO2 900°C - CO2 950°C - NOx 850°C - NOx 900°C - NOx 950°C
- CO 850°C - CO 900°C - CO 950°C - CO2 850°C - CO2 900°C - CO2 950°C - NOx 850°C - NOx 900°C - NOx 950°C
Department of Energy and Materials Chalmers University of Technology
Gothenburg, Sweden 2015 21
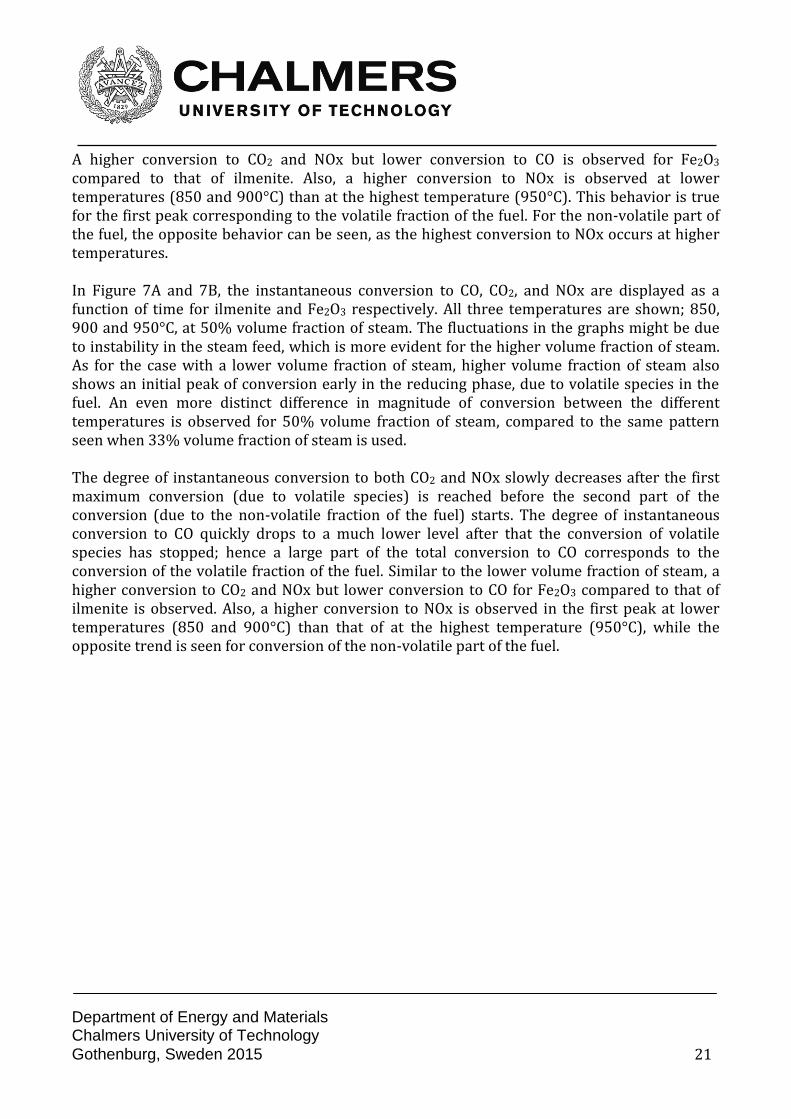
A higher conversion to CO2 and NOx but lower conversion to CO is observed for Fe2O3 compared to that of ilmenite. Also, a higher conversion to NOx is observed at lower temperatures (850 and 900°C) than at the highest temperature (950°C). This behavior is true for the first peak corresponding to the volatile fraction of the fuel. For the non-volatile part of the fuel, the opposite behavior can be seen, as the highest conversion to NOx occurs at higher temperatures. In Figure 7A and 7B, the instantaneous conversion to CO, CO2, and NOx are displayed as a function of time for ilmenite and Fe2O3 respectively. All three temperatures are shown; 850, 900 and 950°C, at 50% volume fraction of steam. The fluctuations in the graphs might be due to instability in the steam feed, which is more evident for the higher volume fraction of steam. As for the case with a lower volume fraction of steam, higher volume fraction of steam also shows an initial peak of conversion early in the reducing phase, due to volatile species in the fuel. An even more distinct difference in magnitude of conversion between the different temperatures is observed for 50% volume fraction of steam, compared to the same pattern seen when 33% volume fraction of steam is used. The degree of instantaneous conversion to both CO2 and NOx slowly decreases after the first maximum conversion (due to volatile species) is reached before the second part of the conversion (due to the non-volatile fraction of the fuel) starts. The degree of instantaneous conversion to CO quickly drops to a much lower level after that the conversion of volatile species has stopped; hence a large part of the total conversion to CO corresponds to the conversion of the volatile fraction of the fuel. Similar to the lower volume fraction of steam, a higher conversion to CO2 and NOx but lower conversion to CO for Fe2O3 compared to that of ilmenite is observed. Also, a higher conversion to NOx is observed in the first peak at lower temperatures (850 and 900°C) than that of at the highest temperature (950°C), while the opposite trend is seen for conversion of the non-volatile part of the fuel.
Department of Energy and Materials Chalmers University of Technology
Gothenburg, Sweden 2015 22
Figure 8A and 8B. Cumulative conversion during reducing phase at 33% volume fraction of steam, for 850, 900 and 950°C. 8A shows ilmenite and 8B shows Fe2O3.
Figure 9A and 9B. Cumulative conversion during reducing phase at 50% volume fraction of steam, for 850, 900 and 950°C. 9A shows ilmenite and 9B shows Fe2O3.
-0,5
-0,4
-0,3
-0,2
-0,1
0
0,1
0,2
0,3
0,4
0
0,1
0,2
0,3
0,4
0,5
0,6
0,7
0,8
0,9
1
0 200 400 600 800 1000 1200 1400 C
on
ver
sio
n t
o N
Ox
(N-b
asis
) [m
ol
NO
x/m
ol N
_fu
el]
Co
nv
ersi
on
to
CO
, CO
2
[mo
l CO
, CO
2 /
mo
l (C
O+
CO
2+
CH
4)_
To
tal]
Time [s]
-0,5
-0,4
-0,3
-0,2
-0,1
0
0,1
0,2
0,3
0,4
0
0,1
0,2
0,3
0,4
0,5
0,6
0,7
0,8
0,9
1
0 200 400 600 800 1000 1200
Co
nv
ersi
on
to
NO
x (N
-bas
is)
[mo
l N
Ox/
mo
l N_f
uel
]
Co
nv
ersi
on
to
CO
, CO
2
[mo
l CO
, CO
2 /
mo
l (C
O+
CO
2+
CH
4)_
To
tal]
Time [s]
-0,5
-0,4
-0,3
-0,2
-0,1
0
0,1
0,2
0,3
0,4
0
0,1
0,2
0,3
0,4
0,5
0,6
0,7
0,8
0,9
1
0 200 400 600 800
Co
nv
ersi
on
to
NO
x (N
-bas
is)
[mo
l N
Ox/
mo
l N_f
uel
]
Co
nv
ersi
on
to
CO
, CO
2
[mo
l CO
, CO
2 /
mo
l (C
O+
CO
2+
CH
4)_
To
tal]
Time [s]
-0,5
-0,4
-0,3
-0,2
-0,1
0
0,1
0,2
0,3
0,4
0
0,1
0,2
0,3
0,4
0,5
0,6
0,7
0,8
0,9
1
0 200 400 600 800
Co
nv
ersi
on
to
NO
x (N
-bas
is)
[mo
l N
Ox/
mo
l N_f
uel
]
Co
nv
ersi
on
to
CO
, CO
2
[mo
l CO
, CO
2 /
mo
l (C
O+
CO
2+
CH
4)_
To
tal]
Time [s]
5.3 Cumulative conversion
In Figure 9A and 9B, the cumulative conversion to CO, CO2 and NOx are displayed for ilmenite and Fe2O3 respectively at all three temperatures; 850, 900 and 950°C, with 33% volume fraction of steam. As observed in Figure 6 and 7, higher conversion to CO2 and NOx are seen for Fe2O3 than that of ilmenite. Likewise, the opposite behavior is observed for the conversion to CO. At the higher volume fractions of steam, higher conversions are seen for both oxygen carriers at all temperatures. After less than 1/6 of the time, 50% of the total conversion to NOx is reached for ilmenite, when 33% volume fraction of steam is used. For 50% volume fraction of steam, 1/4 of the time is required to reach 50% of the total conversion. Slightly more than 1/6 and 1/4 of the time, for 33% and 50% volume fraction of steam respectively, is required to reach 50% of the total conversion when Fe2O3 is used as the oxygen carrier.
A B
A B
- CO 850°C - CO 900°C - CO 950°C - CO2 850°C - CO2 900°C - CO2 950°C - NOx 850°C - NOx 900°C - NOx 950°C
- CO 850°C - CO 900°C - CO 950°C - CO2 850°C - CO2 900°C - CO2 950°C - NOx 850°C - NOx 900°C - NOx 950°C
Department of Energy and Materials Chalmers University of Technology
Gothenburg, Sweden 2015 23
Figure 10A and 10B. Total conversion at 33% volume fraction of steam, for 850, 900 and 950°C. 10A shows ilmenite and 10B shows Fe2O3.
Figure 11A and 11B. Total Conversion at 50% volume fraction of steam, for 850, 900 and 950°C. 11A shows ilmenite and 11B shows Fe2O3.
0
0,1
0,2
0,3
0,4
0,5
0,6
0,7
0,8
0,9
1
850 900 950
Co
nv
ersi
on
to
CO
, CO
2,
NO
x (N
-bas
is)
[-]
C
on
ver
sio
n t
o N
H3
(N
-bas
is)
[-]
Temperature [C]
0
0,1
0,2
0,3
0,4
0,5
0,6
0,7
0,8
0,9
1
850 900 950
Co
nv
ersi
on
to
CO
, CO
2,
NO
x (N
-bas
is)
[-]
C
on
ver
sio
n t
o N
H3
(N
-bas
is)
[-]
Temperature [C]
0
0,1
0,2
0,3
0,4
0,5
0,6
0,7
0,8
0,9
1
850 900 950
Co
nv
ersi
on
to
CO
, CO
2,
NO
x (N
-bas
is)
[-]
C
on
ver
sio
n t
o N
H3
(N
-bas
is)
[-]
Temperature [C]
0
0,1
0,2
0,3
0,4
0,5
0,6
0,7
0,8
0,9
1
850 900 950
Co
nv
ersi
on
to
CO
, CO
2,
NO
x (N
-bas
is)
[-]
C
on
ver
sio
n t
o N
H3
(N
-bas
is)
[-]
Temperature [C]
5.4 Total conversion
In Figure 10A and 10B, the total conversion to CO, CO2, NOx and NH3 are displayed for ilmenite and Fe2O3 respectively at all three temperatures; 850, 900 and 950°C, with 33% volume fraction of steam. As observed in Figure 6 to 9, the trend of higher conversion to NOx for lower temperatures is – apart from the conversion to NOx at 900°C – naturally also seen in the total conversion. The increase in conversion to NOx and decrease in conversion to NH3 at 900°C for Fe2O3 are most probably correlated and might be due to errors in the experimental part during the cycle. Again, a higher conversion to NOx is also observed for Fe2O3 than for that of ilmenite. This is linked to the lower conversion to CO and higher conversion to CO2 seen for Fe2O3 than for that of ilmenite. As a reducing agent, CO reduces NOx into N2, lowering the overall conversion to NOx. A low amount of CO also means that a larger part of the carbon in the fuel fully oxidizes to form CO2, which is confirmed by the higher conversion to CO2.
- CO - CO2 - NOx - NH3
- CO - CO2 - NOx - NH3
A
A
B
B
A B
Department of Energy and Materials Chalmers University of Technology
Gothenburg, Sweden 2015 24
In Figure 11A and 11B, the total conversion to CO, CO2, NOx and NH3 are displayed for ilmenite and Fe2O3 respectively at all three temperatures; 850, 900 and 950°C, with 50% volume fraction of steam. As for the lower volume fraction of steam, decreasing conversion to NOx at higher temperatures is observed for both oxygen carriers. Also, a higher conversion to NOx is seen for Fe2O3 than for that of ilmenite. Compared to the lower volume fraction of steam, the conversion to NOx for iron oxide is for the higher volume fraction of steam almost twice as high at lower temperatures. For ilmenite, the conversion to NOx is lower at 50% steam but has the same order of magnitude as for the lower volume fraction of steam. The conversion to CO2 is higher for both oxygen carriers at the higher volume fraction of steam, while the opposite trend is observed for the conversion to CO. Once again, a higher conversion to CO and lower conversion to CO2 is observed for ilmenite than that of Fe2O3. The conversion to NH3 shows a similar pattern to that of CO; lower for Fe2O3 than that of ilmenite, at both volume fractions of steam. The conversion to ammonia follows the magnitude of the conversion to CO, where higher conversion is observed at the higher volume fraction of steam. As for 33% volume fraction of steam, the conversion to CO, CO2 and NOx is calculated for the reducing phase only, while the conversion to NH3 is measured over the complete cycle.

Department of Energy and Materials Chalmers University of Technology
Gothenburg, Sweden 2015 25
Figure 12A and 12B. Total Conversion at 33% volume fraction of steam, for 850, 900 and 950°C. 12A shows ilmenite and 12B shows Fe2O3.
Figure 13A and 13B. Total Conversion at 50% volume fraction of steam, for 850, 900 and 950°C. 13A shows ilmenite and 13B shows Fe2O3.
0
0,1
0,2
0,3
0,4
0,5
0,6
0,7
0,8
0,9
1
850 900 950
Co
nv
ersi
on
to
N
Ox,
NH
3 (
N-b
asis
) [-
]
Temperature [C]
0
0,1
0,2
0,3
0,4
0,5
0,6
0,7
0,8
0,9
1
850 900 950
Co
nv
ersi
on
to
N
Ox,
NH
3 (
N-b
asis
) [-
]
Temperature [C]
0
0,1
0,2
0,3
0,4
0,5
0,6
0,7
0,8
0,9
1
850 900 950
Co
nv
ersi
on
to
N
Ox,
NH
3 (
N-b
asis
) [-
]
Temperature [C]
0
0,1
0,2
0,3
0,4
0,5
0,6
0,7
0,8
0,9
1
850 900 950
Co
nv
ersi
on
to
N
Ox,
NH
3 (
N-b
asis
) [-
]
Temperature [C]
In Figure 12A and 12B, the total conversion to NOx and NH3 are displayed for ilmenite and Fe2O3 respectively at all three temperatures; 850, 900 and 950°C, with 33% volume fraction of steam. The fuel nitrogen which is not converted into NOx or NH3 is calculated as if converted into N2, where the sum of all nitrogen species equals to 1. The formation of nitrogen increases with temperature for both oxygen carriers, with similar magnitudes of N2 formation. Higher conversion to NOx is observed for ilmenite than for Fe2O3, at all temperatures. However, higher conversion to NH3 is observed for Fe2O3 than for ilmenite, at all temperatures. In Figure 13A and 13B, the total conversion to NOx and NH3 are displayed for ilmenite and Fe2O3 respectively at all three temperatures; 850, 900 and 950°C, with 50% volume fraction of steam. As for 33% volume fraction of steam, the formation of nitrogen increases with temperature, for both oxygen carriers. On the contrary to 33% volume fraction of steam, lower conversion to NOx and higher conversion to NH3 are observed for ilmenite than for Fe2O3, at all temperatures.
⧠ N2 ⧠ NOx ⧠ NH3
⧠ N2 ⧠ NOx ⧠ NH3
A B
A B

Department of Energy and Materials Chalmers University of Technology
Gothenburg, Sweden 2015 26
Figure 14A and 14B. Instantaneous rate of formation during reducing phase, 1 cycle; 33% volume fraction of steam at 950°C. 14A shows ilmenite and 14B shows Fe2O3.
Figure 15A and 15B. Instantaneous rate of formation during reducing phase, 1 cycle; 50% volume fraction of steam at 950°C. 15A shows ilmenite and 15B shows Fe2O3.
0
0,005
0,01
0,015
0,02
0 0,2 0,4 0,6 0,8 1
Rat
e o
f (C
O+
CO
2+
CH
4)
form
atio
n (
Fu
el
bas
is)
[1/s
]
Rat
e o
f N
Ox
form
atio
n (
N-b
asis
) [1
/s]
Carbon Conversion [-]
0
0,005
0,01
0,015
0,02
0 0,2 0,4 0,6 0,8 1
Rat
e o
f (C
O+
CO
2+
CH
4)
form
atio
n (
Fu
el
bas
is)
[1/s
]
Rat
e o
f N
Ox
form
atio
n (
N-b
asis
) [1
/s]
Carbon Conversion [-]
0
0,005
0,01
0,015
0,02
0 0,2 0,4 0,6 0,8 1
Rat
e o
f (C
O+
CO
2+
CH
4)
form
atio
n (
Fu
el
bas
is)
[1/s
]
Rat
e o
f N
Ox
form
atio
n (
N-b
asis
) [1
/s]
Carbon Conversion [-]
0
0,005
0,01
0,015
0,02
0 0,2 0,4 0,6 0,8 1
Rat
e o
f (C
O+
CO
2+
CH
4)
form
atio
n (
Fu
el
bas
is)
[1/s
]
Rat
e o
f N
Ox
form
atio
n (
N-b
asis
) [1
/s]
Carbon Conversion [-]
5.5 Rate of formation
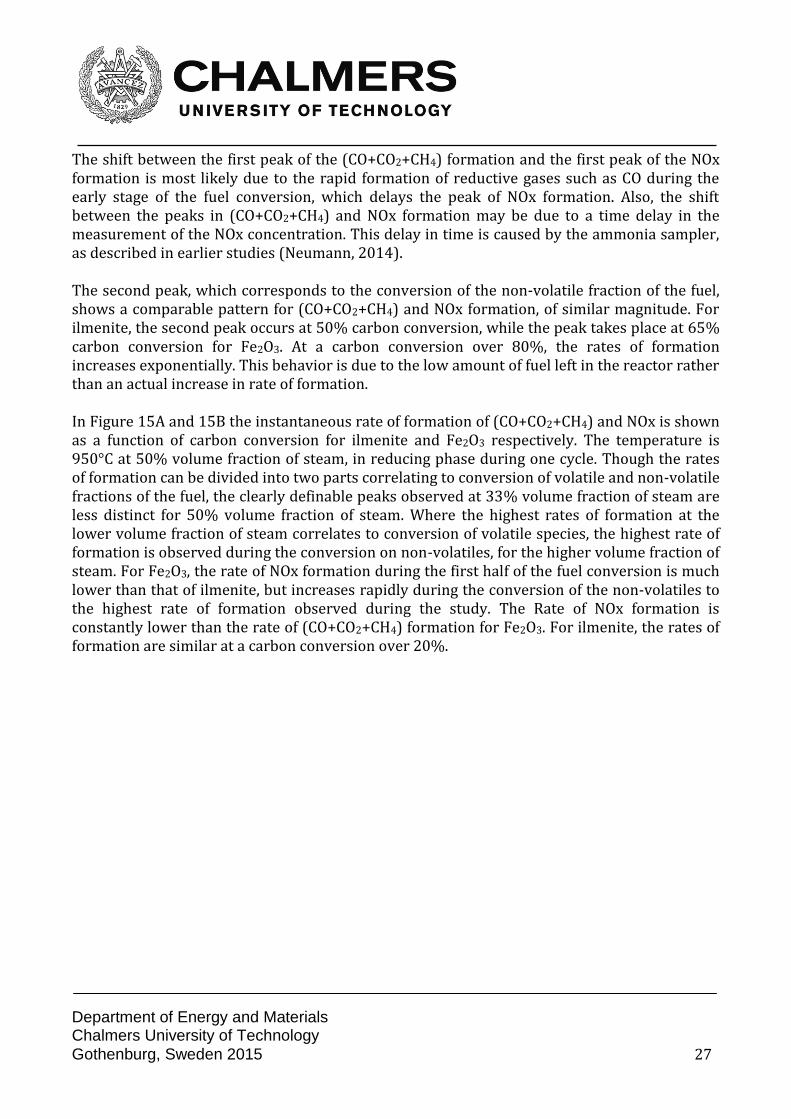
In Figure 14A and 14B the instantaneous rate of formation of (CO+CO2+CH4) and NOx is shown as a function of carbon conversion for ilmenite and Fe2O3 respectively. The temperature is 950°C at 33% volume fraction of steam, in reducing phase during one cycle. At 0 to 70% carbon conversion, two peaks are observed for the rate of (CO+CO2+CH4) and NOx formation. The first peak, which is higher and more distinct for (CO+CO2+CH4) than for NOx, is due to the release of volatile species in the fuel. These volatiles are almost instantly converted, which takes place during the first 30% of the carbon conversion. The rate of NOx formation in this first peak is slightly higher for Fe2O3 than for ilmenite.
A
B A
B
- (CO+CO2+CH4) - NOx
- (CO+CO2+CH4) - NOx
- (CO+CO2+CH4) - NOx
A B
Department of Energy and Materials Chalmers University of Technology
Gothenburg, Sweden 2015 27
The shift between the first peak of the (CO+CO2+CH4) formation and the first peak of the NOx formation is most likely due to the rapid formation of reductive gases such as CO during the early stage of the fuel conversion, which delays the peak of NOx formation. Also, the shift between the peaks in (CO+CO2+CH4) and NOx formation may be due to a time delay in the measurement of the NOx concentration. This delay in time is caused by the ammonia sampler, as described in earlier studies (Neumann, 2014). The second peak, which corresponds to the conversion of the non-volatile fraction of the fuel, shows a comparable pattern for (CO+CO2+CH4) and NOx formation, of similar magnitude. For ilmenite, the second peak occurs at 50% carbon conversion, while the peak takes place at 65% carbon conversion for Fe2O3. At a carbon conversion over 80%, the rates of formation increases exponentially. This behavior is due to the low amount of fuel left in the reactor rather than an actual increase in rate of formation. In Figure 15A and 15B the instantaneous rate of formation of (CO+CO2+CH4) and NOx is shown as a function of carbon conversion for ilmenite and Fe2O3 respectively. The temperature is 950°C at 50% volume fraction of steam, in reducing phase during one cycle. Though the rates of formation can be divided into two parts correlating to conversion of volatile and non-volatile fractions of the fuel, the clearly definable peaks observed at 33% volume fraction of steam are less distinct for 50% volume fraction of steam. Where the highest rates of formation at the lower volume fraction of steam correlates to conversion of volatile species, the highest rate of formation is observed during the conversion on non-volatiles, for the higher volume fraction of steam. For Fe2O3, the rate of NOx formation during the first half of the fuel conversion is much lower than that of ilmenite, but increases rapidly during the conversion of the non-volatiles to the highest rate of formation observed during the study. The Rate of NOx formation is constantly lower than the rate of (CO+CO2+CH4) formation for Fe2O3. For ilmenite, the rates of formation are similar at a carbon conversion over 20%.
Department of Energy and Materials Chalmers University of Technology
Gothenburg, Sweden 2015 28
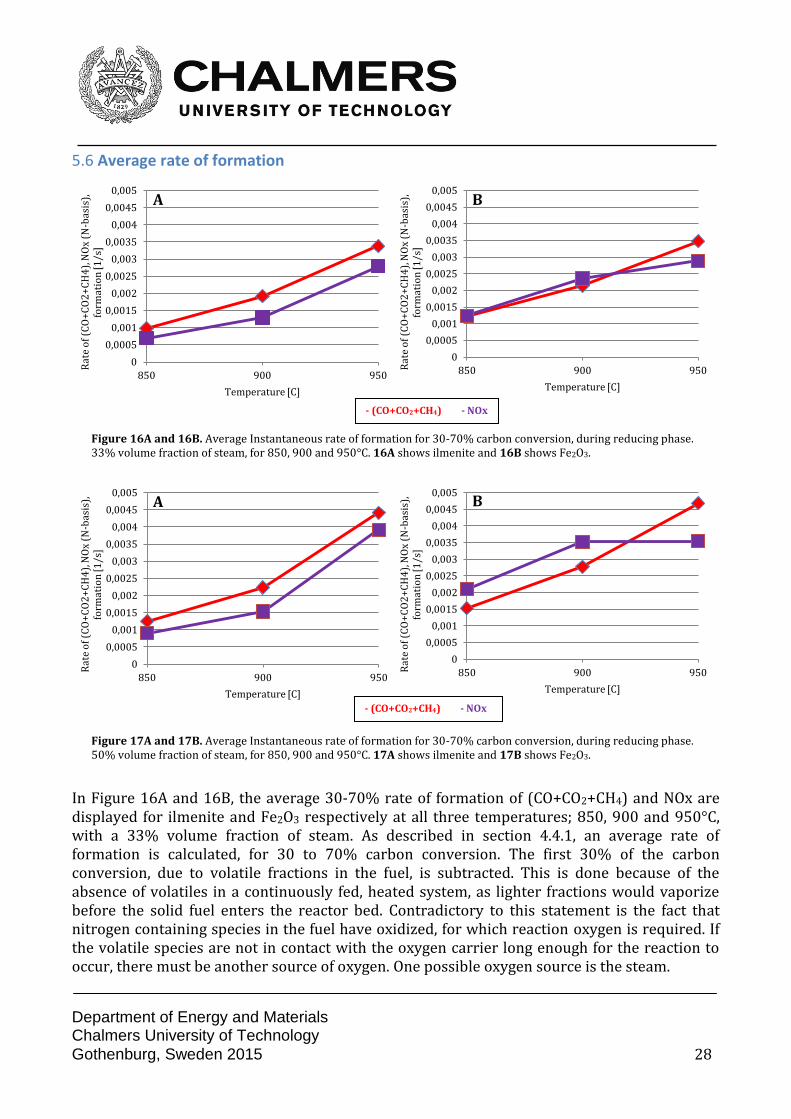
Figure 16A and 16B. Average Instantaneous rate of formation for 30-70% carbon conversion, during reducing phase. 33% volume fraction of steam, for 850, 900 and 950°C. 16A shows ilmenite and 16B shows Fe2O3.
Figure 17A and 17B. Average Instantaneous rate of formation for 30-70% carbon conversion, during reducing phase. 50% volume fraction of steam, for 850, 900 and 950°C. 17A shows ilmenite and 17B shows Fe2O3.
0
0,0005
0,001
0,0015
0,002
0,0025
0,003
0,0035
0,004
0,0045
0,005
850 900 950
Rat
e o
f (C
O+
CO
2+
CH
4),
NO
x (N
-bas
is),
fo
rmat
ion
[1/s
]
Temperature [C]
0
0,0005
0,001
0,0015
0,002
0,0025
0,003
0,0035
0,004
0,0045
0,005
850 900 950 Rat
e o
f (C
O+
CO
2+
CH
4),
NO
x (N
-bas
is),
fo
rmat
ion
[1/s
]
Temperature [C]
0
0,0005
0,001
0,0015
0,002
0,0025
0,003
0,0035
0,004
0,0045
0,005
850 900 950
Rat
e o
f (C
O+
CO
2+
CH
4),
NO
x (N
-bas
is),
fo
rmat
ion
[1/s
]
Temperature [C]
0
0,0005
0,001
0,0015
0,002
0,0025
0,003
0,0035
0,004
0,0045
0,005
850 900 950 Rat
e o
f (C
O+
CO
2+
CH
4),
NO
x (N
-bas
is),
fo
rmat
ion
[1/s
]
Temperature [C]
5.6 Average rate of formation
In Figure 16A and 16B, the average 30-70% rate of formation of (CO+CO2+CH4) and NOx are displayed for ilmenite and Fe2O3 respectively at all three temperatures; 850, 900 and 950°C, with a 33% volume fraction of steam. As described in section 4.4.1, an average rate of formation is calculated, for 30 to 70% carbon conversion. The first 30% of the carbon conversion, due to volatile fractions in the fuel, is subtracted. This is done because of the absence of volatiles in a continuously fed, heated system, as lighter fractions would vaporize before the solid fuel enters the reactor bed. Contradictory to this statement is the fact that nitrogen containing species in the fuel have oxidized, for which reaction oxygen is required. If the volatile species are not in contact with the oxygen carrier long enough for the reaction to occur, there must be another source of oxygen. One possible oxygen source is the steam.
A B
A B
- (CO+CO2+CH4) - NOx
- (CO+CO2+CH4) - NOx
Department of Energy and Materials Chalmers University of Technology
Gothenburg, Sweden 2015 29
Similarly, the last 30% of the carbon conversion is also excluded. The low amount of fuel left in the reactor at the end of the reductive phase is not representative for a continuously fed system, which is why the exponentially increasing rate of formation is subtracted. Even when disregarding the results correlating to very low and high carbon conversion, the trend of lower rate of NOx formation for ilmenite than that of Fe2O3 is observed, especially at lower temperatures. In Figure 17A and 17B, the average 30-70% rate of formation of (CO+CO2+CH4) and NOx are displayed for ilmenite and Fe2O3 respectively at all three temperatures; 850, 900 and 950°C, with a 50% volume fraction of steam. As for the 33% volume fraction of steam, higher rates of formation are observed at higher temperatures. The higher rate of (CO+CO2+CH4) formation for Fe2O3 compared to that of ilmenite is seen also at 50% volume fraction of steam. For ilmenite, the rates of formation show a much comparable pattern at all three temperatures, at low and high volume fraction of steam. For Fe2O3, the difference between the rates of (CO+CO2+CH4) and NOx formation is larger for Fe2O3 in 50% volume fraction of steam than when 33% volume fraction of steam is used. As for the lower volume fraction of steam, the rate of NOx formation follows the same pattern as the rate of (CO+CO2+CH4) formation at lower temperatures, where the rate of NOx formation is slightly higher than that of (CO+CO2+CH4). At 950°C, the NOx formation takes place at almost the same rate as for 900°C, which indicates that the increase in rate of NOx formation declines at temperatures over 900°C. This behavior is not observed for ilmenite, for which the highest rate of NOx formation occurs at the highest temperature, 950°C.
* * * From the concentration profiles, instantaneous and total conversion as well as rates of formation, a clear pattern is observed. When ilmenite is used as oxygen carrier material, the amount and rate of formed NOx is less than that of Fe2O3. Why this phenomenon occur might at first be difficult to understand, as the synthesized iron oxide both has a higher carbon conversion and rate of CO2 formation. As mentioned earlier, an explanation is that the higher conversion of carbon into CO2 results in a lower amount formed CO, which in turns means that less NOx is be reduced to N2. However, there might be more reasons why the use of ilmenite results in lesser NOx levels. One theory is based on the fact that ilmenite to roughly 50% consists of titanium, which has shown potential to catalyze the reduction of NOx (Nakajiama, 1991). While titanium in previous work only has been used as a component in the catalyst, the thought of titanium having catalyzing abilities is not that farfetched, as many other transition metals are known to have these properties (Augustine & Fu, 2006). Another observation made is that while carbon species are more rapidly formed during the conversion of volatile species, the rate of NOx formation at higher carbon conversion is closer in magnitude to the rate of (CO+CO2+CH4) formation.

Department of Energy and Materials Chalmers University of Technology
Gothenburg, Sweden 2015 30
6. Conclusions
While work remains to be done to fully understand the formation of NOx when solid fuel is used in a Chemical Looping Combustion system, some conclusions can still be made from the result of this study. Different behaviors are observed for different volume fractions of steam for the two used oxygen carriers. Below is an attempt to summarize the discussion into short statements and hypothesis.
Lower conversion to NOx and CO2 is observed for ilmenite than that of Fe2O3. On the contrary, Fe2O3 shows a higher conversion to CO than ilmenite. This is true for all temperatures and volume fractions of steam analyzed in this study.
Higher conversion to CO2 at higher volume fraction of steam is observed for both oxygen carriers at all temperatures than the conversion to CO2 seen at 33% volume fraction of steam.
Lower conversion to NOx is observed for ilmenite at higher volume fraction of steam,
compared to the conversion to NOx seen for at the lower volume fraction of steam.
Higher conversion to NOx is observed for Fe2O3 at higher volume fraction of steam, compared to the conversion to NOx seen at the lower volume fraction of steam.
50% of the total carbon conversion is reached faster for ilmenite than that of Fe2O3.
Higher rates of (CO+CO2+CH4) and NOx formation are observed at higher volume fractions of steam, for all temperatures analyzed in this study.
For ilmenite, the rates of (CO+CO2+CH4) and NOx formation are increasing with temperature at both 33% and 50% volume fraction of steam.
For Fe2O3, the increase in rate of NOx formation is lesser at temperatures over 900°C, at both 33% and 50% volume fraction of steam.
In general, there appear to be a larger difference between the two oxygen carriers than
the differences in volume fraction of steam, concerning conversion to NOx.
Department of Energy and Materials Chalmers University of Technology
Gothenburg, Sweden 2015 31
7. Future work
There is a need of continued studies within the field of NOx formation in a CLC system using solid fuel. With a limited time frame for the master thesis work, questions still remain concerning the ammonia formation and how the chemical composition and behavior of the oxygen carrier affects the conversion to NOx. Also, practical issues such as improving the stability of the steam feed into the reactor should be further developed. Summarized below are the next steps to take in continued studies of NOx formation:
Study the behavior of other synthesized oxygen carrier materials containing different
combinations of metal oxides and transition metal oxides that has been proved to work as suitable oxygen carriers, in turns of NOx formation.
Perform tests at lower and higher volume fractions of steam to further analyze how this affects the formation of NOx. To do this, a stabile feed of steam into the reactor is required, which is why the stability of the existing setup should be investigated.
Department of Energy and Materials Chalmers University of Technology
Gothenburg, Sweden 2015 32
8. Acknowledgements This study would not have been possible without the guidance and assistance from my supervisors Henrik Leion and Dongmei Zhao. Their extensive knowledge in the field and support throughout the project has proven to be invaluable and the author therefore acknowledges their contribution to this report. Gratitude is also shown to Fredrik Norman for proof reading the report and valuable inputs regarding the NOx formation. The author would like to show appreciation for the encouraging attitude by the members of the CLC group, which advices during the laboratory work, minimized and prevented many time consuming mistakes. Last, the author would like to thank Ida Holm for all the support and love a boyfriend could ever ask for.
Department of Energy and Materials Chalmers University of Technology
Gothenburg, Sweden 2015 33
9. References
Adanez, J., Abad, A., Garcia-Labiano, F., Gayan, P., & De Diego, L. F. (2012). Progress in chemical-looping combustion and reforming technologies. Progress in Energy and Combustion Science, 38(2), 215–282. doi:10.1016/j.pecs.2011.09.001
Adánez, J., De Diego, L. F., García-Labiano, F., Gayán, P., Abad, a., & Palacios, J. M. (2004). Selection of oxygen carriers for chemical-looping combustion. Energy and Fuels, 18(3), 371–377. doi:10.1021/ef0301452
Arjmand, M., Leion, H., Lyngfelt, A., & Mattisson, T. (2012). Use of manganese ore in chemical-looping combustion (CLC)-Effect on steam gasification. International Journal of Greenhouse Gas Control, 8, 56–60. doi:10.1016/j.ijggc.2012.02.001
Arjmand, M., Leion, H., Mattisson, T., & Lyngfelt, A. (2014). Investigation of different manganese ores as oxygen carriers in chemical-looping combustion (CLC) for solid fuels. Applied Energy, 113, 1883–1894. doi:10.1016/j.apenergy.2013.06.015
Augustine, S., & Fu, G. (2006). U.S. Patent No. 0084569 A1. Washington, DC: U.S. Patent and Trademark Office.
Azis, M. M., Jerndal, E., Leion, H., Mattisson, T., & Lyngfelt, A. (2010). On the evaluation of synthetic and natural ilmenite using syngas as fuel in chemical-looping combustion (CLC). Chemical Engineering Research and Design, 88(11), 1505–1514. doi:10.1016/j.cherd.2010.03.006
Bayham, S., Kim, H. R., Wang, D., Zeng, L., Tong, A., Chung, E., … Fan, L. (2013). Coal direct chemical looping combustion process : Design and operation of a 25-kW th sub-pilot unit. Fuel, 108, 370–384.
Berguerand, N., & Lyngfelt, A. (2009). Chemical-looping combustion of petroleum coke using ilmenite in a 10 kwth unit-high-temperature operation. Energy and Fuels, 23(6), 5257–5268. doi:10.1021/ef900464j
Chow, J., Kopp, R. J., & Portney, P. R. (2003). Energy resources and global development. Science (New York, N.Y.), 302(November), 1528–1531. doi:10.1126/science.1091939
Fu, C., & Gundersen, T. (2012). Carbon Capture and Storage in the Power Industry: Challenges and Opportunities. Energy Procedia, 16, 1806–1812. doi:10.1016/j.egypro.2012.01.278
Gibbins, J., & Chalmers, H. (2008). Carbon capture and storage. Energy Policy, 36(12), 4317–4322. doi:10.1016/j.enpol.2008.09.058

Department of Energy and Materials Chalmers University of Technology
Gothenburg, Sweden 2015 34
Glarborg, P., Jensen, a. D., & Johnsson, J. E. (2003). Fuel nitrogen conversion in solid fuel fired systems. Progress in Energy and Combustion Science, 29, 89–113. doi:10.1016/S0360-1285(02)00031-X
Haszeldine, R. S. (2009). Carbon capture and storage: how green can black be? Science (New York, N.Y.), 325(5948), 1647–52. doi:10.1126/science.1172246
Hill, S. C., & Smoot, L. D. (2000). Modeling of nitrogen oxides formation and destruction in combustion systems. Progress in Energy and Combustion Science, 26, 417–458. doi:10.1016/S0360-1285(00)00011-3
Hossain, M. M., & de Lasa, H. I. (2008). Chemical-looping combustion (CLC) for inherent separations—a review. Chemical Engineering Science, 63(18), 4433–4451. doi:10.1016/j.ces.2008.05.028
Jerndal, E., Mattisson, T., & Lyngfelt, A. (2006). Thermal analysis of chemical-looping combustion. Chemical Engineering Research and Design, 84(September), 795–806. doi:10.1205/cherd05020
Keller, M., Arjmand, M., Leion, H., & Mattisson, T. (2014). Interaction of mineral matter of coal with oxygen carriers in chemical-looping combustion (CLC). Chemical Engineering Research and Design, 92(9), 1753–1770. doi:10.1016/j.cherd.2013.12.006
Keller, M., Leion, H., Mattisson, T., & Lyngfelt, A. (2011). Gasification inhibition in chemical-looping combustion with solid fuels. Combustion and Flame, 158(3), 393–400. doi:10.1016/j.combustflame.2010.09.009
Leion, H. (2008). Capture of CO2 from solid fuels using Chemical-Looping Combustion and Chemical-Looping Oxygen Uncoupling. (Doctoral dissertation). Chalmers University of Technology.
Leion, H., Jerndal, E., Steenari, B.-M., Hermansson, S., Israelsson, M., Jansson, E., … Lyngfelt, A. (2009). Solid fuels in chemical-looping combustion using oxide scale and unprocessed iron ore as oxygen carriers. Fuel, 88(10), 1945–1954. doi:10.1016/j.fuel.2009.03.033
Leion, H., Lyngfelt, A., & Mattisson, T. (2009). Solid fuels in chemical-looping combustion using a NiO-based oxygen carrier. Chemical Engineering Research and Design, 87(October 2008), 1543–1550. doi:10.1016/j.cherd.2009.04.003
Leion, H., Mattisson, T., & Lyngfelt, A. (2007). The use of petroleum coke as fuel in chemical-looping combustion. Fuel, 86, 1947–1958. doi:10.1016/j.fuel.2006.11.037

Department of Energy and Materials Chalmers University of Technology
Gothenburg, Sweden 2015 35
Leion, H., Mattisson, T., & Lyngfelt, A. (2008). Solid fuels in chemical-looping combustion. International Journal of Greenhouse Gas Control, 2, 180–193. doi:10.1016/S1750-5836(07)00117-X
Leion, H., Mattisson, T., & Lyngfelt, A. (2009). Using chemical-looping with oxygen uncoupling (CLOU) for combustion of six different solid fuels. Energy Procedia, 1(1), 447–453. doi:10.1016/j.egypro.2009.01.060
Liu, H., Feng, B., Lu, J., & Zheng, C. (2005). Formation From Circulating Fluidized Bed Combustion of Coal. Chemical Engineering Communications, 192(January 2015), 1482–1489. doi:10.1080/009864490896043
Lyngfelt, A., Leckner, B., & Mattisson, T. (2001). A uidized-bed combustion process with inherent CO 2 separation ; application of chemical-looping combustion, 56, 3101–3113. Retrieved from http://www.sciencedirect.com/science/article/pii/S0009250901000070#
Nakajiama, F. (1991). Air Pollution Control with Catalysis -Past, Present and Future. Catalysis Today, 10, 1–20. Retrieved from http://www.sciencedirect.com/science/article/pii/092058619180070P#
Neumann, N. (2014). NOx Formation in Chemical-Looping Combustion, MS thesis, Tächnische Universität Darmstadt.
Olajire, A. a. (2010). CO2 capture and separation technologies for end-of-pipe applications – A review. Energy, 35(6), 2610–2628. doi:10.1016/j.energy.2010.02.030
Penthor, S., Mayer, K., Pro, T., & Hofbauer, H. (2014). Experimental Study of the Path of Nitrogen in Chemical Looping Combustion Using a Nickel-Based Oxygen Carrier, 2–7.
Pires, J. C. M., Martins, F. G., Alvim-Ferraz, M. C. M., & Simões, M. (2011). Recent developments on carbon capture and storage: An overview. Chemical Engineering Research and Design, 89(9), 1446–1460. doi:10.1016/j.cherd.2011.01.028
Pröll, T., Mayer, K., Bolhàr-Nordenkampf, J., Kolbitsch, P., Mattisson, T., Lyngfelt, A., & Hofbauer, H. (2009). Natural minerals as oxygen carriers for chemical looping combustion in a dual circulating fluidized bed system. Energy Procedia, 1(1), 27–34. doi:10.1016/j.egypro.2009.01.006
Ragauskas, A. J., Williams, C. K., Davison, B. H., Britovsek, G., Cairney, J., Eckert, C. a, … Tschaplinski, T. (2006). The path forward for biofuels and biomaterials. Science (New York, N.Y.), 311(January), 484–489. doi:10.1126/science.1114736

Department of Energy and Materials Chalmers University of Technology
Gothenburg, Sweden 2015 36
Rulkens, W. (2008). Sewage Sludge as a Biomass Resource for the Production of Energy : Overview and Assessment of the Various Options, 44(1), 9–15. doi:10.1021/ef700267m
Rydén, M., Cleverstam, E., Johansson, M., Lyngfelt, A., & Mattisson, T. (2010). Fe2O3 on Ce-, Ca-, or Mg-Stabilized ZrO2 as Oxygen Carrier for Chemical-Looping Combustion Using NiO as Additive. AIChE Journal, 56(8), 2211–2220. doi:10.1002/aic
Rydén, M., Lyngfelt, A., & Mattisson, T. (2008). Chemical-looping combustion and chemical-looping reforming in a circulating fluidized-bed reactor using Ni-based oxygen carriers. Energy and Fuels, 22, 2585–2597. doi:10.1021/ef800065m
Song, T., Shen, L., Xiao, J., Chen, D., Gu, H., & Zhang, S. (2012). Nitrogen transfer of fuel-N in chemical looping combustion. Combustion and Flame, 159(3), 1286–1295. doi:10.1016/j.combustflame.2011.10.024
Song, Y. H., Blair, D. W., Siminski, V. J., & Bartok, W. (1981). Conversion of fixed nitrogen to N2 in rich combustion. Symposium (International) on Combustion, 18(1), 53–63. doi:10.1016/S0082-0784(81)80010-0
Ströhle, J., Orth, M., & Epple, B. (2014). Design and operation of a 1MWth chemical looping plant. Applied Energy, 113, 1490–1495. doi:10.1016/j.apenergy.2013.09.008
Wall, T. F. (2007). Combustion processes for carbon capture. Proceedings of the Combustion Institute, 31(1), 31–47. doi:10.1016/j.proci.2006.08.123
Xiao, R., Song, Q., Zhang, S., Zheng, W., & Yang, Y. (2009). Pressurized chemical-looping combustion of chinese bituminous coal: Cyclic performance and characterization of iron ore-based oxygen carrier. Energy and Fuels, 24(2), 1449–1463. doi:10.1021/ef901070c
Zhao, D., Schwebel, G., Pour, N. M., Leion, H., Lind, F., & Thunman, H. (2014). Laboratory fluidized bed testing of Ilmenite as bed material for oxygen carrier aided combustion (OCAC). 11th International Conference on Fluidized Bed Technology, Beijing, China.