
NOx Budget Trading Program: 2005 Program …NOx xBudget Trading Program: 2005 Program Compliance and...
188
NO x Budget Trading Program m 2005 Program Compliance and d Environmental Results s
Transcript of NOx Budget Trading Program: 2005 Program …NOx xBudget Trading Program: 2005 Program Compliance and...
NNOOxx BBuuddggeett TTrraaddiinngg PPrrooggrraamm
22000055 PPrrooggrraamm CCoommpplliiaannccee aannddEEnnvviirroonnmmeennttaall RReessuullttss
United States Environmental Protection Agency Office of Air and Radiation
Office of Atmospheric Programs Clean Air Markets Division (6204J) 1200 Pennsylvania Ave., NW Washington, DC 20460 www.epa.gov/airmarkets
Office of Air Quality Planning and Standards Air Quality Assessment Division www.epa.gov/airtrends
EPA430-R-06-013 September 2006
ContentsExecutive Summary . . . . . . . . . . . . . . . . . . . . . . . . . . . . . . . . . . . . . . . . . . . . . . . . . . . . . . . . . . . . 1
Introduction . . . . . . . . . . . . . . . . . . . . . . . . . . . . . . . . . . . . . . . . . . . . . . . . . . . . . . . . . . . . . . . . . . . 3
Section 1 — Background: Ozone and Major Control Programs. . . . . . . . . . . . . . . . . . . . . 5
Ozone Formation and Health and Ecological Effects . . . . . . . . . . . . . . . . . . . . . . . . . . . . . . . . . . . . . . . . . . 5
Overview: Major Control Programs for NOx and VOCs . . . . . . . . . . . . . . . . . . . . . . . . . . . . . . . . . . . . . . . . 6
Overview: NOx Budget Trading Program, 2005 . . . . . . . . . . . . . . . . . . . . . . . . . . . . . . . . . . . . . . . . . . . . . . . 9
Section 2 — Changes in Emissions. . . . . . . . . . . . . . . . . . . . . . . . . . . . . . . . . . . . . . . . . . . . . . 11
Ozone Season NOx Reductions under the NOx Budget Trading Program . . . . . . . . . . . . . . . . . . . . . 11
Ozone Season Generation and Emission Reductions by Fuel Type . . . . . . . . . . . . . . . . . . . . . . . . . . . 13
State-by-State Reductions . . . . . . . . . . . . . . . . . . . . . . . . . . . . . . . . . . . . . . . . . . . . . . . . . . . . . . . . . . . . . . . . . . 13
Daily Emission Trends . . . . . . . . . . . . . . . . . . . . . . . . . . . . . . . . . . . . . . . . . . . . . . . . . . . . . . . . . . . . . . . . . . . . . . 16
Section 3 — Environmental Results. . . . . . . . . . . . . . . . . . . . . . . . . . . . . . . . . . . . . . . . . . . . . 17
Ozone Monitoring Networks . . . . . . . . . . . . . . . . . . . . . . . . . . . . . . . . . . . . . . . . . . . . . . . . . . . . . . . . . . . . . . . 17
General Trends: Changes in Eastern Ozone Concentrations since 1997 . . . . . . . . . . . . . . . . . . . . . . 18
Ozone Changes after Adjusting for Meteorology . . . . . . . . . . . . . . . . . . . . . . . . . . . . . . . . . . . . . . . . . . . 18
Ozone Changes: Focus on the NOx Budget Trading Program . . . . . . . . . . . . . . . . . . . . . . . . . . . . . . . . 20
Ozone Impacts on Forest Health . . . . . . . . . . . . . . . . . . . . . . . . . . . . . . . . . . . . . . . . . . . . . . . . . . . . . . . . . . . 25
Section 4 — Compliance and Market Activity . . . . . . . . . . . . . . . . . . . . . . . . . . . . . . . . . . . 27
2005 Compliance Results . . . . . . . . . . . . . . . . . . . . . . . . . . . . . . . . . . . . . . . . . . . . . . . . . . . . . . . . . . . . . . . . . . 27
Banking in 2005 and Flow Control in 2006 . . . . . . . . . . . . . . . . . . . . . . . . . . . . . . . . . . . . . . . . . . . . . . . . . . 28
NOx Allowance Trading in 2005 . . . . . . . . . . . . . . . . . . . . . . . . . . . . . . . . . . . . . . . . . . . . . . . . . . . . . . . . . . . . 29
Continuous Emission Monitoring System (CEMS) Results . . . . . . . . . . . . . . . . . . . . . . . . . . . . . . . . . . . 30
Compliance Options Used by NBP Sources in 2005 . . . . . . . . . . . . . . . . . . . . . . . . . . . . . . . . . . . . . . . . . 31
Section 5 — Future NOx Reductions and Ozone Improvements:
Transition to the Clean Air Interstate Rule. . . . . . . . . . . . . . . . . . . . . . . . . . . . . . . . . . . . . . . 35
Online Resources . . . . . . . . . . . . . . . . . . . . . . . . . . . . . . . . . . . . . . . . . . . . . . . . . . . . . . . . . . . . . 38

NOx Budget Trading Program: 2005 Program Compliance and Environmental ResultsNOx Budget Trading Program: 2005 Program Compliance and Environmental Results
Executive Summary
The NO Budget Trading Program (NBP) is ax
market-based cap and trade program creat
ed to reduce emissions of nitrogen oxides
(NOx) from power plants and other large combus
tion sources in the eastern United States. NO is ax
prime ingredient in the formation of ground-level
ozone (smog), a pervasive air pollution problem in
many areas of the eastern United States. The NBP
was designed to reduce NOx emissions during the
warm summer months, referred to as the ozone
season, when ground-level ozone concentrations
are highest. This report evaluates progress under
the NBP in 2005 by examining emission reduc
tions, comparing changes in emissions to changes
in ozone concentrations, and reviewing compli
ance results and market activity.
2005 Key Results • The NBP has successfully reduced ozone
season NO emissions throughout thexregion. In 2005, NBP ozone season NOxemissions were:
– 11 percent lower than in 2004 even as power generation increased by 7 percent (primarily due to moving up the seasonal compliance period for 11 Midwestern and Southern states to May 1);
– 57 percent lower than in 2000 (before implementation of the NBP); and
– 72 percent lower than in 1990 (before implementation of the Clean Air Act Amendments).
• Ground-level ozone has improved since the implementation of the NBP.
– Ozone formation depends greatly on weather conditions, which can vary significantly from year to year. To get a truer picture of how emission changes impact ozone formation, EPA adjusts ozone concentrations to account for the influences of weather.
– Average ozone levels in the NBP region have
decreased by about 8 percent since 2002. Ground level ozone has improved since the NBP began in 2003.
– There is a strong association between areas with the greatest reductions in NOx emissions and nearby downwind sites exhibiting the greatest improvements in ozone.
– In 2004, EPA officially designated 103 areas in the eastern United States as 8-hour ozone “nonattainment areas”. These areas were required to improve their ozone air quality with the goal of attaining and maintaining the national air quality standards for ground-level ozone. Based on 2003 to 2005 air monitoring data, ozone air quality improved in all of these areas. Nearly 70 percent of them (68 areas) now have air quality that is better than the level of the standard. The NBP is the major contributor to these improvements.
• Through a wide range of pollution control strategies and an active NOx allowance market in 2005, sources achieved over 99 percent compliance with the NBP.
– There were 2,570 units affected under the NBP in 2005. Only three NBP sources ( four units total) did not hold sufficient allowances.
– Overall, trading activity increased from 2004 to 2005 with an active market, and allowance prices were slightly lower and somewhat less volatile than in 2004.
– The flexibility of the NBP provides sources options to reduce NOx emissions, such as adding NOx emission control technologies, replacing existing controls with more advanced technologies, or optimizing existing controls.
• The Clean Air Interstate Rule (CAIR), issued in March 2005, will continue the progress demonstrated by the NBP. CAIR extends this successful cap and trade program to control both ozone and fine particles in 28 eastern states and the District of Columbia.
Executive Summary 1
NOx Budget Trading Program: 2005 Program Compliance and Environmental Results
Introduction
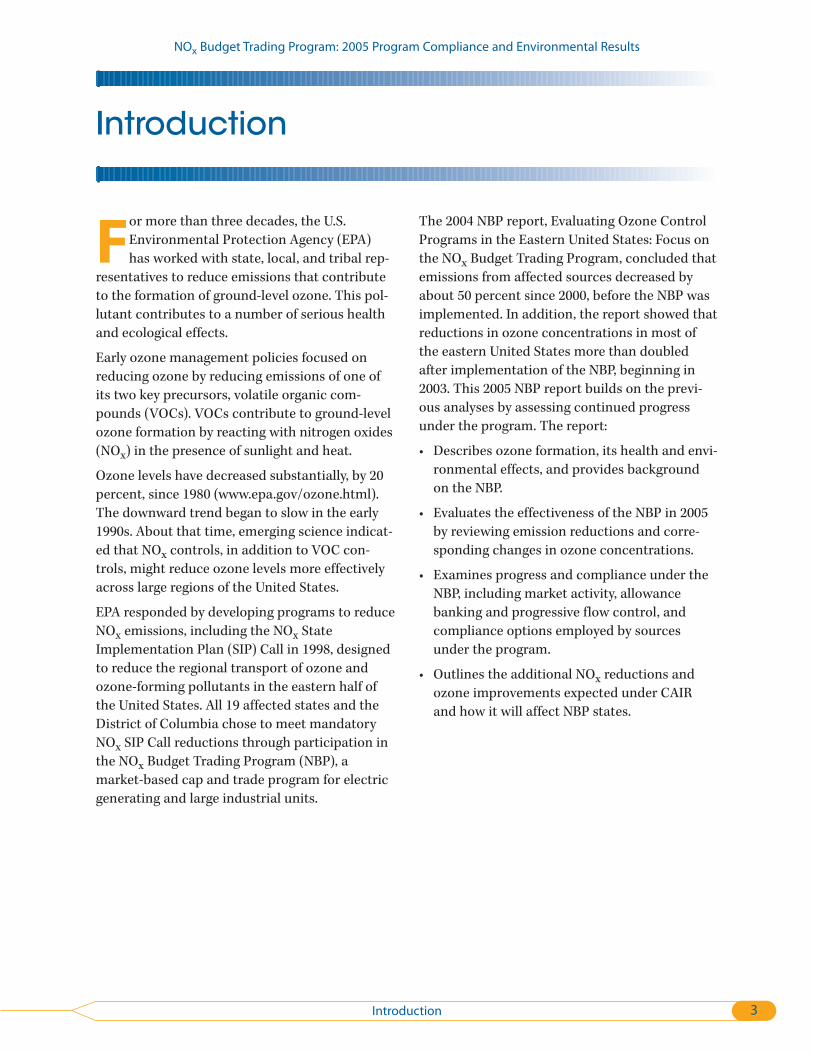
For more than three decades, the U.S.
Environmental Protection Agency (EPA)
has worked with state, local, and tribal rep
resentatives to reduce emissions that contribute
to the formation of ground-level ozone. This pol
lutant contributes to a number of serious health
and ecological effects.
Early ozone management policies focused on
reducing ozone by reducing emissions of one of
its two key precursors, volatile organic com
pounds (VOCs). VOCs contribute to ground-level
ozone formation by reacting with nitrogen oxides
(NOx) in the presence of sunlight and heat.
Ozone levels have decreased substantially, by 20
percent, since 1980 (www.epa.gov/ozone.html).
The downward trend began to slow in the early
1990s. About that time, emerging science indicat
ed that NOx controls, in addition to VOC con
trols, might reduce ozone levels more effectively
across large regions of the United States.
EPA responded by developing programs to reduce
NOx emissions, including the NOx State
Implementation Plan (SIP) Call in 1998, designed
to reduce the regional transport of ozone and
ozone-forming pollutants in the eastern half of
the United States. All 19 affected states and the
District of Columbia chose to meet mandatory
NO SIP Call reductions through participation in x
the NO Budget Trading Program (NBP), a x
market-based cap and trade program for electric
generating and large industrial units.
The 2004 NBP report, Evaluating Ozone Control
Programs in the Eastern United States: Focus on
the NOx Budget Trading Program, concluded that
emissions from affected sources decreased by
about 50 percent since 2000, before the NBP was
implemented. In addition, the report showed that
reductions in ozone concentrations in most of
the eastern United States more than doubled
after implementation of the NBP, beginning in
2003. This 2005 NBP report builds on the previ
ous analyses by assessing continued progress
under the program. The report:
• Describes ozone formation, its health and envi
ronmental effects, and provides background
on the NBP.
• Evaluates the effectiveness of the NBP in 2005
by reviewing emission reductions and corre
sponding changes in ozone concentrations.
• Examines progress and compliance under the
NBP, including market activity, allowance
banking and progressive flow control, and
compliance options employed by sources
under the program.
• Outlines the additional NO reductions and x
ozone improvements expected under CAIR
and how it will affect NBP states.
Introduction 3

NOx Budget Trading Program: 2005 Program Compliance and Environmental Results
Section 1 — Background: Ozone and Major Control Programs
Ozone Formation and Health and
Ecological Effects
Beneficial ozone occurs naturally in the Earth’s
upper atmosphere (the stratosphere), where it
shields the planet from the sun’s harmful ultravi
olet rays. At ground level, harmful ozone pollu
tion forms when emissions of nitrogen oxides
(NOx) and volatile organic compounds (VOCs)
react in sunlight and heat. Major sources of NOx
and VOC emissions include motor vehicles, gaso
line stations, drycleaners, industrial facilities, and
electric power plants (see Figure 1).
Meteorology plays a significant role in both the
formation and transport of ozone. The complex
photochemical reactions that transform emis
sions of NOx and VOCs into ozone require warm,
sunny conditions. Because ground-level ozone is
highest when sunlight is most intense, the warm
summer months (May 1 to September 30) are typ
ically referred to as the “ozone season.”
Ozone levels can be high where there are concen
trated local sources of NOx and VOCs, such as
urban and suburban areas. The location and con
centration of ozone pollution are also affected by
regional transport — the movement of ozone
and/or its precursors by the wind. Although, in
general, urban ozone concentrations are higher
than rural areas, ozone levels can be elevated in
some rural areas where there are few local emis
sion sources because of the transport of ozone.
Ozone Impacts on Human Health and
Ecosystems
Exposure to ozone has been linked to a number
of health effects. At levels found in many urban
areas, ozone can aggravate respiratory diseases,
such as asthma, emphysema, and bronchitis, and
can reduce the respiratory system’s ability to fight
off bacterial infections. Long-term, repeated
exposures to sufficient levels of ozone can cause
permanent damage to the lungs. Recent research
suggests that acute exposure to ozone likely con
tributes to premature death.
Ground-level ozone also damages vegetation and
ecosystems, leading to reduced agricultural crop
and commercial forest yields and increased plant
susceptibility to diseases, pests, and other stresses,
such as harsh weather. Ozone can damage the
foliage of trees and other plants, adversely affect-
Weather Plays a Significant Role in Determining Ozone Pollution in a Given Area
Ozone is rarely emitted directly into the air. Instead, ground-level ozone forms when NOx and VOCs react under the right atmospheric conditions. A dry, hot, sunny day is most favorable for ozone production. In general, ozone concentrations increase during the day, peak in the afternoon when the temperature and sunlight intensity are the highest, and drop back down again in the evening.
Wind transports ozone and/or its precursors. Therefore, depending on its direction, the wind can bring in more pollution to an area, sometimes from hundreds of miles away. Weather also determines how quickly ozone moves away or disperses from an area. Very light winds or no wind can allow ozone and the pollutants that create ozone to build up, providing a more favorable environment for the chemical reactions necessary to create ozone.
When looking at changes in ozone levels (see Section 3, Environmental Results), EPA uses a statistical model to account for the impact of weather on ozone concentrations. While no model can account for all complex meteorological factors that influence ozone, this adjustment provides a better estimate of the underlying ozone trend (i.e., the impact of emission changes).
5Section 1 — Background: Ozone and Major Control Programs
NOx Budget Trading Program: 2005 Program Compliance and Environmental Results
8-Hour Ozone Standard
To better protect public health, EPA revised its national air quality standards for ozone in 1997, establishing an 8-hour standard. The 8-hour standard is 0.08 parts per million (ppm). An area meets the standard if the 3-year average of the annual fourth highest daily maximum 8-hour average concentration is less than or equal to 0.08 ppm. For more information on the 8-hour ozone standard and ozone nonattainment areas in the United States, visit <www.epa.gov/air/ oaqps/greenbk/map8hrnm.html>.
ing the landscape of cities and national parks,
forests, and recreation areas. For example, the
United States Forest Service observed ozone-
induced injury to the leaves of certain ozone sensi
tive plants ( from 1997 to 2002) in many areas of
the country, with the highest occurrences in the
Northeast. Refer to Section 3, Environmental
Results, for more information.
For more information on ground-level ozone,
including health and ecological effects, visit
<www.epa.gov/epahome/ozone.htm>.
Overview: Major Control Programs
for NOx and VOCs
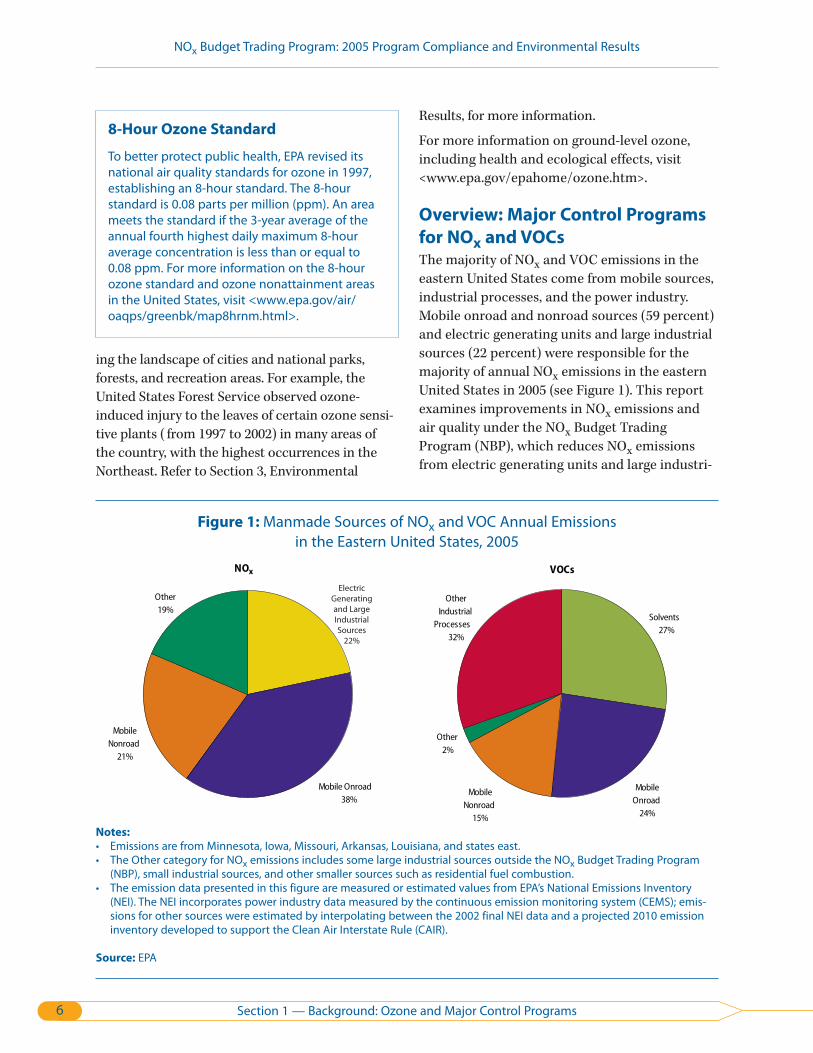
The majority of NO and VOC emissions in the x
eastern United States come from mobile sources,
industrial processes, and the power industry.
Mobile onroad and nonroad sources (59 percent)
and electric generating units and large industrial
sources (22 percent) were responsible for the
majority of annual NO emissions in the eastern x
United States in 2005 (see Figure 1). This report
examines improvements in NO emissions and x
air quality under the NO Budget Trading x
Program (NBP), which reduces NO emissions x
from electric generating units and large industri-
Figure 1: Manmade Sources of NOx and VOC Annual Emissions in the Eastern United States, 2005
NOx VOCs
Electric Other Generating Other 19% and Large Industrial
Industrial Processes Solvents
Sources 27% 32%22%
Mobile Other
Nonroad 2%
21%
Mobile Onroad Mobile Mobile 38% Onroad Nonroad
24%15%
Notes:
• Emissions are from Minnesota, Iowa, Missouri, Arkansas, Louisiana, and states east. • The Other category for NOx emissions includes some large industrial sources outside the NOx Budget Trading Program
(NBP), small industrial sources, and other smaller sources such as residential fuel combustion. • The emission data presented in this figure are measured or estimated values from EPA’s National Emissions Inventory
(NEI). The NEI incorporates power industry data measured by the continuous emission monitoring system (CEMS); emissions for other sources were estimated by interpolating between the 2002 final NEI data and a projected 2010 emission inventory developed to support the Clean Air Interstate Rule (CAIR).
Source: EPA
6 Section 1 — Background: Ozone and Major Control Programs
NOx Budget Trading Program: 2005 Program Compliance and Environmental Results
Figure 2: Manmade Annual NOx and VOC Emissions in the Eastern United States, 1990-1995, 1997–2005
1818
1616
0
2
4
6
8
10
12
14
1990 1991 1992 1993 1994 1995
Year
4
6
8
1997 1999 2001 2003 2005
Year
Emis
sion
s (M
illio
ns o
f Ton
s)
Emis
sion
s (M
illio
ns o
f Ton
s)
14
12
10
2
0
VOCs NOx
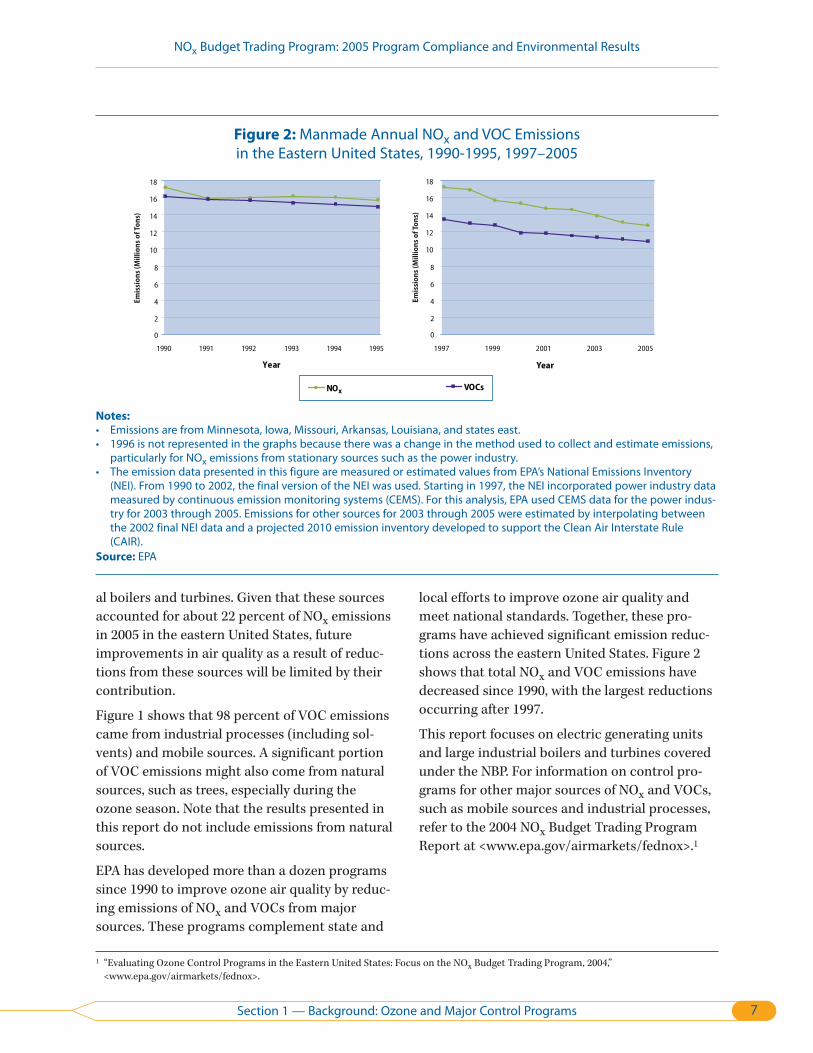
Notes:
• Emissions are from Minnesota, Iowa, Missouri, Arkansas, Louisiana, and states east. • 1996 is not represented in the graphs because there was a change in the method used to collect and estimate emissions,
particularly for NOx emissions from stationary sources such as the power industry. • The emission data presented in this figure are measured or estimated values from EPA’s National Emissions Inventory
(NEI). From 1990 to 2002, the final version of the NEI was used. Starting in 1997, the NEI incorporated power industry data measured by continuous emission monitoring systems (CEMS). For this analysis, EPA used CEMS data for the power industry for 2003 through 2005. Emissions for other sources for 2003 through 2005 were estimated by interpolating between the 2002 final NEI data and a projected 2010 emission inventory developed to support the Clean Air Interstate Rule (CAIR).
Source: EPA
al boilers and turbines. Given that these sources
accounted for about 22 percent of NO emissions x
in 2005 in the eastern United States, future
improvements in air quality as a result of reduc
tions from these sources will be limited by their
contribution.
Figure 1 shows that 98 percent of VOC emissions
came from industrial processes (including sol
vents) and mobile sources. A significant portion
of VOC emissions might also come from natural
sources, such as trees, especially during the
ozone season. Note that the results presented in
this report do not include emissions from natural
sources.
EPA has developed more than a dozen programs
since 1990 to improve ozone air quality by reduc
ing emissions of NOx and VOCs from major
sources. These programs complement state and
local efforts to improve ozone air quality and
meet national standards. Together, these pro
grams have achieved significant emission reduc
tions across the eastern United States. Figure 2
shows that total NO and VOC emissions have x
decreased since 1990, with the largest reductions
occurring after 1997.
This report focuses on electric generating units
and large industrial boilers and turbines covered
under the NBP. For information on control pro
grams for other major sources of NO and VOCs, x
such as mobile sources and industrial processes,
refer to the 2004 NOx Budget Trading Program
Report at <www.epa.gov/airmarkets/fednox>.1
1 “Evaluating Ozone Control Programs in the Eastern United States: Focus on the NOx Budget Trading Program, 2004,”
<www.epa.gov/airmarkets/fednox>.
Section 1 — Background: Ozone and Major Control Programs 7
NOx Budget Trading Program: 2005 Program Compliance and Environmental Results
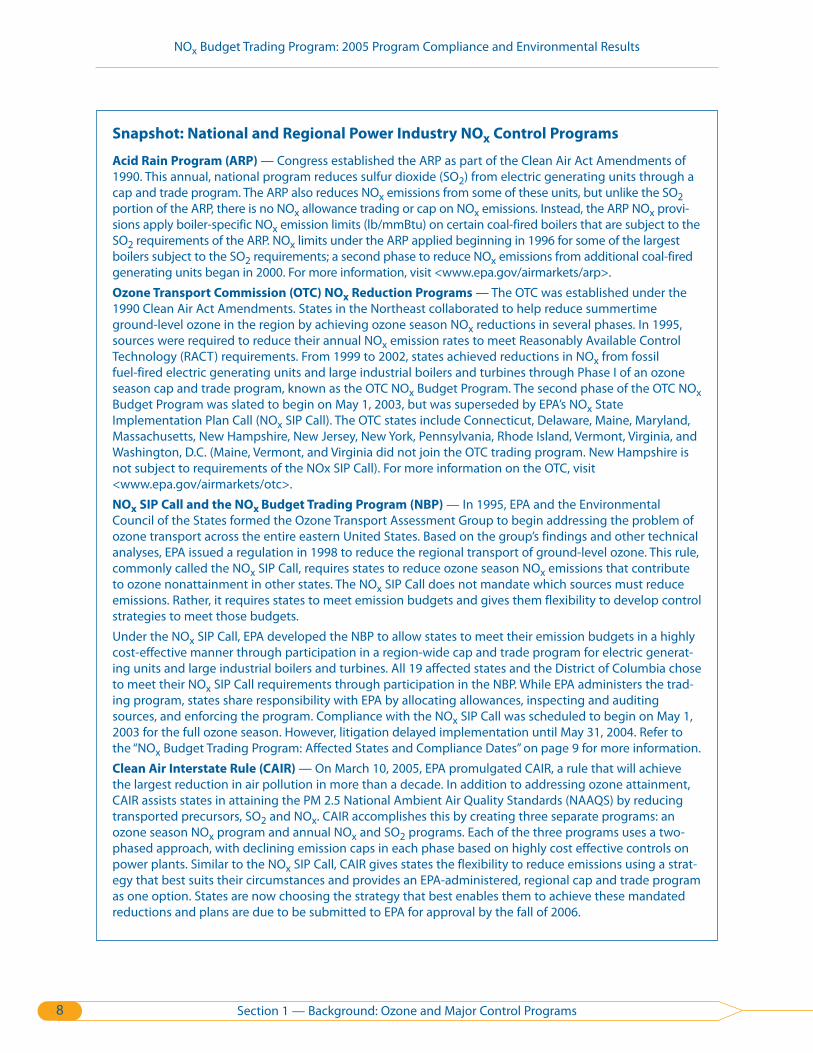
Snapshot: National and Regional Power Industry NOx Control Programs
Acid Rain Program (ARP) — Congress established the ARP as part of the Clean Air Act Amendments of 1990. This annual, national program reduces sulfur dioxide (SO2) from electric generating units through a cap and trade program. The ARP also reduces NOx emissions from some of these units, but unlike the SO2 portion of the ARP, there is no NOx allowance trading or cap on NOx emissions. Instead, the ARP NOx provisions apply boiler-specific NOx emission limits (lb/mmBtu) on certain coal-fired boilers that are subject to the SO2 requirements of the ARP. NOx limits under the ARP applied beginning in 1996 for some of the largest boilers subject to the SO2 requirements; a second phase to reduce NOx emissions from additional coal-fired generating units began in 2000. For more information, visit <www.epa.gov/airmarkets/arp>.
Ozone Transport Commission (OTC) NOx Reduction Programs — The OTC was established under the 1990 Clean Air Act Amendments. States in the Northeast collaborated to help reduce summertime ground-level ozone in the region by achieving ozone season NOx reductions in several phases. In 1995, sources were required to reduce their annual NOx emission rates to meet Reasonably Available Control Technology (RACT) requirements. From 1999 to 2002, states achieved reductions in NOx from fossil fuel-fired electric generating units and large industrial boilers and turbines through Phase I of an ozone season cap and trade program, known as the OTC NOx Budget Program. The second phase of the OTC NOx Budget Program was slated to begin on May 1, 2003, but was superseded by EPA’s NOx State Implementation Plan Call (NOx SIP Call). The OTC states include Connecticut, Delaware, Maine, Maryland, Massachusetts, New Hampshire, New Jersey, New York, Pennsylvania, Rhode Island, Vermont, Virginia, and Washington, D.C. (Maine, Vermont, and Virginia did not join the OTC trading program. New Hampshire is not subject to requirements of the NOx SIP Call). For more information on the OTC, visit <www.epa.gov/airmarkets/otc>.
NOx SIP Call and the NOx Budget Trading Program (NBP) — In 1995, EPA and the Environmental Council of the States formed the Ozone Transport Assessment Group to begin addressing the problem of ozone transport across the entire eastern United States. Based on the group’s findings and other technical analyses, EPA issued a regulation in 1998 to reduce the regional transport of ground-level ozone. This rule, commonly called the NOx SIP Call, requires states to reduce ozone season NOx emissions that contribute to ozone nonattainment in other states. The NOx SIP Call does not mandate which sources must reduce emissions. Rather, it requires states to meet emission budgets and gives them flexibility to develop control strategies to meet those budgets.
Under the NOx SIP Call, EPA developed the NBP to allow states to meet their emission budgets in a highly cost-effective manner through participation in a region-wide cap and trade program for electric generating units and large industrial boilers and turbines. All 19 affected states and the District of Columbia chose to meet their NOx SIP Call requirements through participation in the NBP. While EPA administers the trading program, states share responsibility with EPA by allocating allowances, inspecting and auditing sources, and enforcing the program. Compliance with the NOx SIP Call was scheduled to begin on May 1, 2003 for the full ozone season. However, litigation delayed implementation until May 31, 2004. Refer to the “NOx Budget Trading Program: Affected States and Compliance Dates” on page 9 for more information.
Clean Air Interstate Rule (CAIR) — On March 10, 2005, EPA promulgated CAIR, a rule that will achieve the largest reduction in air pollution in more than a decade. In addition to addressing ozone attainment, CAIR assists states in attaining the PM 2.5 National Ambient Air Quality Standards (NAAQS) by reducing transported precursors, SO2 and NOx. CAIR accomplishes this by creating three separate programs: an ozone season NOx program and annual NOx and SO2 programs. Each of the three programs uses a two-phased approach, with declining emission caps in each phase based on highly cost effective controls on power plants. Similar to the NOx SIP Call, CAIR gives states the flexibility to reduce emissions using a strategy that best suits their circumstances and provides an EPA-administered, regional cap and trade program as one option. States are now choosing the strategy that best enables them to achieve these mandated reductions and plans are due to be submitted to EPA for approval by the fall of 2006.
8 Section 1 — Background: Ozone and Major Control Programs

NOx Budget Trading Program: 2005 Program Compliance and Environmental Results
Overview: NOx Budget Trading
Program, 2005
Over the past 3 years, the NOx SIP Call has
achieved significant NOx reductions, contributing
to improvements in regional air quality across
the Northeast and mid-Atlantic regions. The pri
mary mechanism for achieving these reductions
is the NBP.
NOx Budget Trading Program: Affected
States and Compliance Dates
In 2005, all NBP affected sources were required to
comply for the full ozone season, May 1 through
September 30.
When reviewing results under the NBP, it is
important to understand program implementa
tion and compliance dates. Compliance with the
NO SIP Call was scheduled to begin on May 1, x
2003 for the full ozone season. However, litigation
delayed implementation until May 31, 2004. The
states previously in the OTC NOx Budget
Program adopted the original compliance date in
transitioning to the NOx SIP Call and therefore
began participating in the NBP on May 1, 2003
(see Figure 3). These states include Connecticut,
Delaware, Maryland, Massachusetts, New Jersey,
New York, Pennsylvania, Rhode Island, and the
District of Columbia. Due to the litigation, the
first compliance period did not begin until May
31, 2004, a month into the normal ozone season
for states not previously in the OTC NOx Budget
Program (see Figure 3). These states include
Alabama, Illinois, Indiana, Kentucky, Michigan,
North Carolina, Ohio, South Carolina, Tennessee,
Virginia, and West Virginia. The affected portions
of Missouri and Georgia are required to comply
with the NOx SIP call as of May 1, 2007. However,
EPA has stayed the NOx SIP Call requirements for
Georgia while it responds to a petition to recon
sider Georgia's inclusion in the NOx SIP Call.
Figure 3: NOx SIP Call Program Implementation
Source: EPA
Section 1 — Background: Ozone and Major Control Programs 9
NOx Budget Trading Program: 2005 Program Compliance and Environmental Results
Key Components of the NBP
The NBP is an ozone season (May 1 to September 30) cap and trade program for electric generating units and large industrial boilers and turbines. The program has several important features:
• Under the NBP, the region-wide cap is the sum of the state emission budgets EPA established under the NOx SIP Call to help states meet their air quality goals.
• Authorizations to emit, known as emission allowances, are then allocated to affected sources based on state trading budgets. The NOx allowance market enables sources to trade (buy and sell) allowances throughout the year.
• At the end of every ozone season, each source must surrender sufficient allowances to cover its ozone season NOx emissions (each allowance represents 1 ton of NOx emissions). This process is called annual reconciliation.
• If a source does not have enough allowances to cover its emissions, EPA will automatically deduct allowances from the following year’s allocation at a 3:1 ratio.
• If a source has excess allowances because it reduced emissions beyond required levels, it can sell the unused allowances or “bank” (i.e., save) them for use in a future ozone season. The NBP also has “progressive flow control” provisions, which were designed to discourage extensive use of banked allowances in a particular ozone season. When the bank in any given year exceeds 10 percent of the regional trading budget for the next year, flow control is triggered and determines the amount of NOx emissions a banked allowance can offset. More information on flow control is available in Section 4, Compliance and Market Activity.
• To accurately monitor and report emissions, sources use continuous emission monitoring systems (CEMS) or other approved monitoring methods under EPA’s stringent monitoring requirements (40 CFR Part 75).
For more information on the NBP, including state trading budgets, allowance allocations, and compliance supplement pool (CSP) allowances, refer to <www.epa.gov/airmarkets/fednox>.
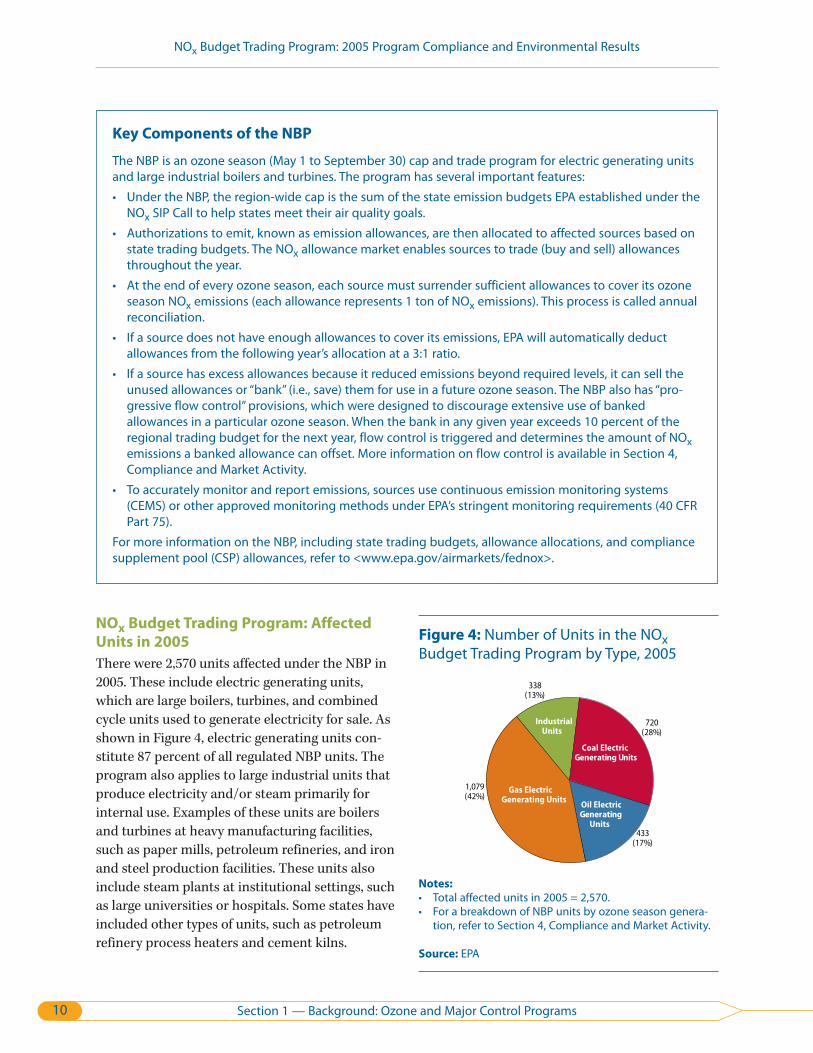
NOx Budget Trading Program: Affected
Units in 2005
There were 2,570 units affected under the NBP in
2005. These include electric generating units,
which are large boilers, turbines, and combined
cycle units used to generate electricity for sale. As
shown in Figure 4, electric generating units con
stitute 87 percent of all regulated NBP units. The
program also applies to large industrial units that
produce electricity and/or steam primarily for
internal use. Examples of these units are boilers
and turbines at heavy manufacturing facilities,
such as paper mills, petroleum refineries, and iron
and steel production facilities. These units also
include steam plants at institutional settings, such
as large universities or hospitals. Some states have
included other types of units, such as petroleum
refinery process heaters and cement kilns.
Figure 4: Number of Units in the NOxBudget Trading Program by Type, 2005
338 (13%)
720 (28%)
1,079(42%)
433 (17%)
Coal Electric Generating Units
Oil Electric Generating
Units
Industrial Units
Gas Electric Generating Units
Notes:
• Total affected units in 2005 = 2,570. • For a breakdown of NBP units by ozone season genera
tion, refer to Section 4, Compliance and Market Activity.
Source: EPA
10 Section 1 — Background: Ozone and Major Control Programs
NOx Budget Trading Program: 2005 Program Compliance and Environmental Results
Section 2 — Changes in Emissions
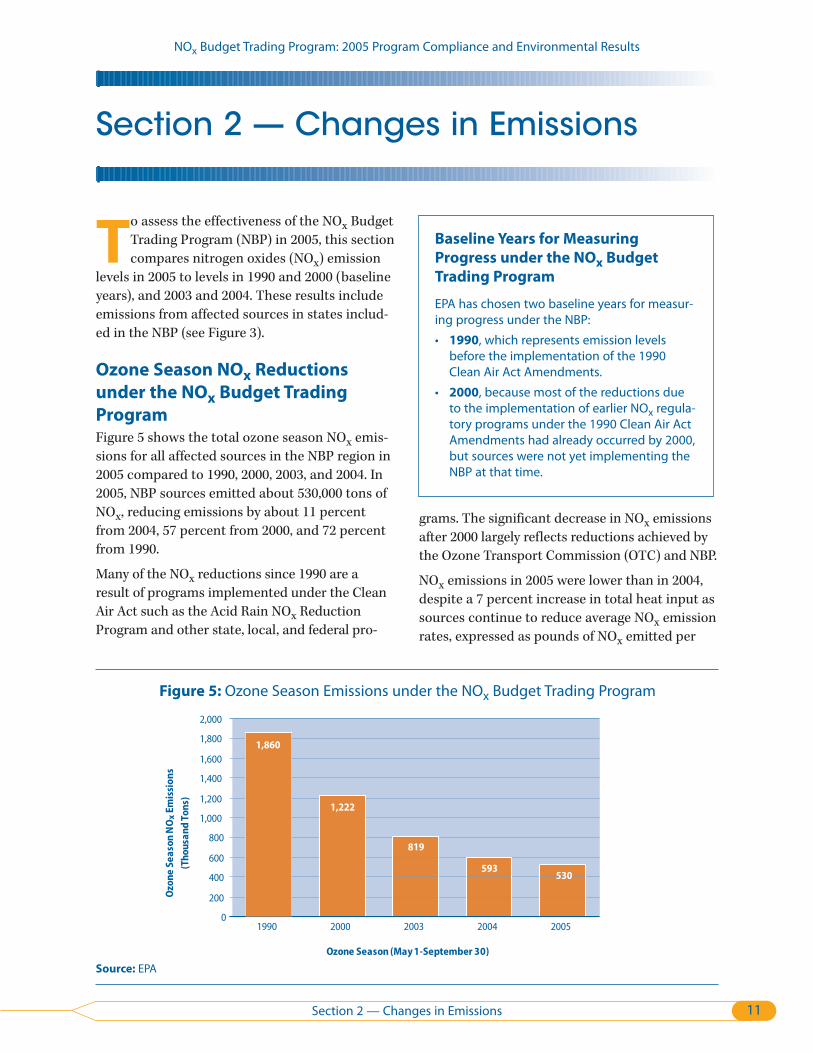
To assess the effectiveness of the NO Budget x
Trading Program (NBP) in 2005, this section
compares nitrogen oxides (NOx) emission
levels in 2005 to levels in 1990 and 2000 (baseline
years), and 2003 and 2004. These results include
emissions from affected sources in states includ
ed in the NBP (see Figure 3).
Ozone Season NOx Reductions
under the NOx Budget Trading
Program
Figure 5 shows the total ozone season NO emisx
sions for all affected sources in the NBP region in
2005 compared to 1990, 2000, 2003, and 2004. In
2005, NBP sources emitted about 530,000 tons of
NOx, reducing emissions by about 11 percent
from 2004, 57 percent from 2000, and 72 percent
from 1990.
Many of the NO reductions since 1990 are a x
result of programs implemented under the Clean
Air Act such as the Acid Rain NO Reductionx
Program and other state, local, and federal pro-
Baseline Years for Measuring
Progress under the NOx Budget
Trading Program
EPA has chosen two baseline years for measuring progress under the NBP:
• 1990, which represents emission levels before the implementation of the 1990 Clean Air Act Amendments.
• 2000, because most of the reductions due to the implementation of earlier NOx regulatory programs under the 1990 Clean Air Act Amendments had already occurred by 2000, but sources were not yet implementing the NBP at that time.
grams. The significant decrease in NO emissions x
after 2000 largely reflects reductions achieved by
the Ozone Transport Commission (OTC) and NBP.
NOx emissions in 2005 were lower than in 2004,
despite a 7 percent increase in total heat input as
sources continue to reduce average NO emission x
rates, expressed as pounds of NOx emitted per
Figure 5: Ozone Season Emissions under the NOx Budget Trading Program
2,000
1,800
1,600
1,400
1,200
1,000
800
600
400
200
0
1,860
1,222
819
593 530
1990 2000 2003 2004 2005
Ozone Season (May 1-September 30)
Ozo
ne S
easo
n N
Ox
Emis
sion
s(T
hous
and
Tons
)
Source: EPA
11Section 2 — Changes in Emissions
NOx Budget Trading Program: 2005 Program Compliance and Environmental Results
Ave
rage
Rat
e (lb
/mm
Btu)
What Is Heat Input?
Heat input is the heat derived from the combustion of fuel in a unit. It is a simple way to track ozone season power generation or utilization of affected units. The overall ozone season heat input to affected NBP sources increased by about 7 percent between 2004 and 2005, although there was no significant change in the number of NBP sources. However, despite the increase in ozone season power generation in 2005, NBP sources still achieved substantial NOx emission reductions (11 percent).
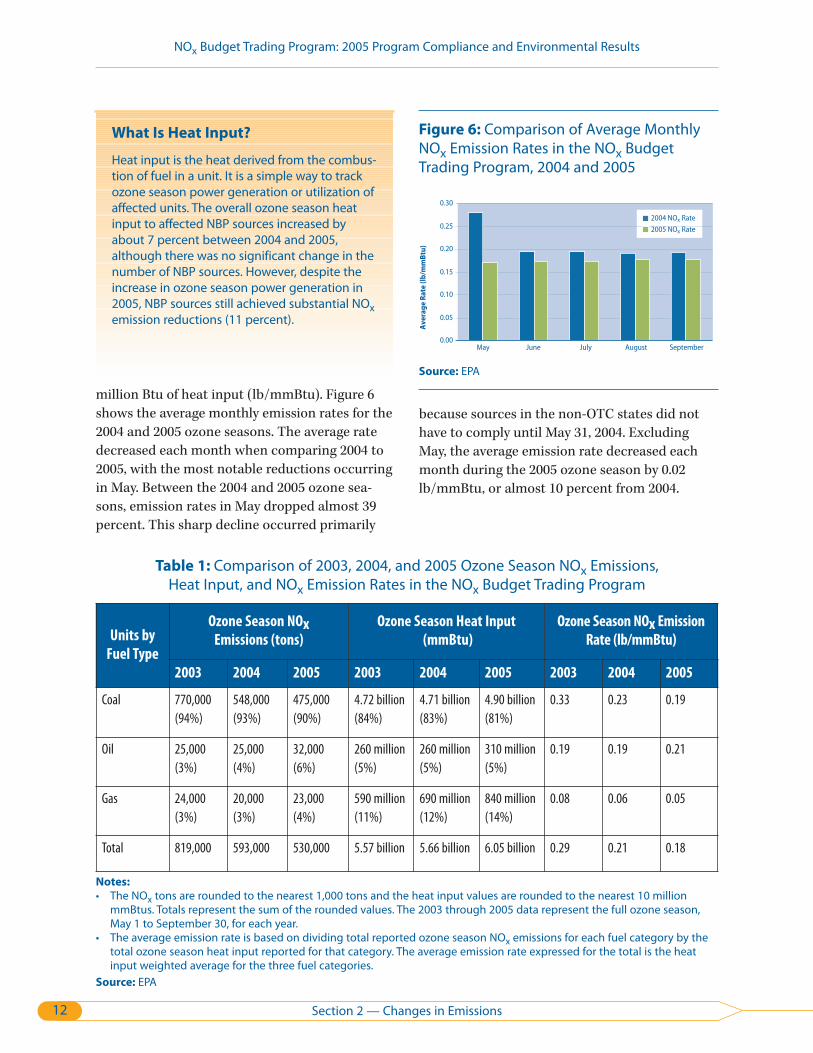
million Btu of heat input (lb/mmBtu). Figure 6
shows the average monthly emission rates for the
2004 and 2005 ozone seasons. The average rate
decreased each month when comparing 2004 to
2005, with the most notable reductions occurring
in May. Between the 2004 and 2005 ozone sea
sons, emission rates in May dropped almost 39
percent. This sharp decline occurred primarily
Figure 6: Comparison of Average Monthly NOx Emission Rates in the NOx Budget Trading Program, 2004 and 2005
0.30
2004 NOx Rate 0.25 2005 NOx Rate
0.20
0.15
0.10
0.05
0.00 May June July August September
Source: EPA
because sources in the non-OTC states did not
have to comply until May 31, 2004. Excluding
May, the average emission rate decreased each
month during the 2005 ozone season by 0.02
lb/mmBtu, or almost 10 percent from 2004.
Table 1: Comparison of 2003, 2004, and 2005 Ozone Season NOx Emissions, Heat Input, and NOx Emission Rates in the NOx Budget Trading Program
Units by
Fuel Type
Ozone Season NOx Emissions (tons)
Ozone Season Heat Input
(mmBtu)
Ozone Season NOx Emission
Rate (lb/mmBtu)
2003 2004 2005 2003 2004 2005 2003 2004 2005
Coal 770,000
(94%)
548,000
(93%)
475,000
(90%)
4.72 billion
(84%)
4.71 billion
(83%)
4.90 billion
(81%)
0.33 0.23 0.19
Oil 25,000
(3%)
25,000
(4%)
32,000
(6%)
260 million
(5%)
260 million
(5%)
310 million
(5%)
0.19 0.19 0.21
Gas 24,000
(3%)
20,000
(3%)
23,000
(4%)
590 million
(11%)
690 million
(12%)
840 million
(14%)
0.08 0.06 0.05
Total 819,000 593,000 530,000 5.57 billion 5.66 billion 6.05 billion 0.29 0.21 0.18
Notes:
• The NOx tons are rounded to the nearest 1,000 tons and the heat input values are rounded to the nearest 10 million mmBtus. Totals represent the sum of the rounded values. The 2003 through 2005 data represent the full ozone season, May 1 to September 30, for each year.
• The average emission rate is based on dividing total reported ozone season NOx emissions for each fuel category by the total ozone season heat input reported for that category. The average emission rate expressed for the total is the heat input weighted average for the three fuel categories.
Source: EPA
Section 2 — Changes in Emissions 12

NOx Budget Trading Program: 2005 Program Compliance and Environmental Results
Ozone Season Generation and
Emission Reductions by Fuel Type
Table 1 provides the total emissions and heat
input for NBP units by fuel type for the 2003, 2004,
and 2005 ozone seasons. Coal-fired units account
ed for all of the emission reductions from 2004 to
2005, decreasing emissions by about 73,000 tons.
The majority of these reductions (about 67,000
tons) came from coal-fired units that operated
add-on controls during the 2005 ozone season (see
Section 4, Compliance and Market Activity).
The most dramatic result is the continued
decrease in NO emission rates leading to these x
reductions for coal-fired units, despite an
increase in heat input from these units between
2004 and 2005. The largest increase in heat input
came from oil-fired and gas-fired units, which
increased emissions by about 10,000 tons
between 2004 and 2005 largely due to increased
utilization.
State-by-State Reductions
The NBP states have achieved significant reduc
tions in ozone season NO emissions since the x
baseline years 1990 and 2000 (as shown in Figure
7). All states have achieved reductions since 1990
as a result of programs implemented under the
Clean Air Act Amendments, with many states
reducing their emissions by more than half since
1990. The decrease in NO emissions after 2000 x
largely reflects reductions achieved by the OTC
and NBP.
While the NBP achieved an 11 percent decrease in
NOx emissions overall from 2004 to 2005, Figure 8
shows that the emission reductions from 2004 to
2005 varied somewhat from state to state. Given
that 2005 was the first full ozone season compli
ance period for states outside the OTC, those states
saw the most significant reductions from 2004.
Figure 7: NOx Budget Trading Program State-by-State Ozone Season NOx EmissionReductions from 1990 and 2000
250,000
200,000
150,000
100,000
50,000
0
IN
OH
MIIL
KY
ALNC
WV
TN
VASC
PA
NY
MD NJMA
DECT DCRI
Non-OTC StatesOTC States
Reductions between 1990 and 2000
Emissions in 2005
Reductions between 2000 and 2005
Notes:
• Because emissions in the District of Columbia and Delaware increased between 2000 and 2005 by approximately 146 and 1,282 tons, respectively, there is no green bar shown in the figure for those states.
• For each state, the total bar (i.e., the sum of the orange, green, and blue stacked bars) depicts emissions in 1990. The sum of the green and orange stacked bars depicts emissions in 2000, and the orange bar depicts emissions in 2005.
• Results in Alabama and Michigan represent ozone season emissions from only the affected portion of each state (see Figure 3).
Source: EPA
NO
x Em
issi
ons
(Ton
s)
Section 2 — Changes in Emissions 13

NOx Budget Trading Program: 2005 Program Compliance and Environmental Results
Figure 8: NOx Budget Trading Program Ozone Season NOx Emissions from 1990, 2000, 2004, and 2005, and 2005 State Trading Budgets
The non-OTC states are shaded in gray; OTC states are shown in yellow. Results in Alabama and Michigan represent ozone season emissions from only the affected portion of each state (see Figure 3).
1990 Emissions
2000 Emissions
2004 Emissions
2005 Emissions
2005 State Trading Budgets
120,000 Tons
Notes:
• •
Source: EPA
Eight states (Connecticut, Massachusetts, New
Jersey, New York, North Carolina, Rhode Island,
South Carolina, Tennessee) had ozone season
emissions below their trading budgets in 2005
(see Figure 8 and Table 2). Three of these states,
Connecticut, Massachusetts, and Rhode Island,
were below their trading budgets by at least 30
percent. Emissions in eight other states
(Alabama, Illinois, Indiana, Kentucky, Ohio,
Pennsylvania, Virginia, and West Virginia)
remained above their trading budgets. However,
all of these states reduced emissions from 2004
levels, and most were within 1 to 6 percent of
their respective budgets. In addition, Indiana,
Ohio, and West Virginia accounted for more than
50 percent of the total reductions from 2004 to
2005 (about 35,000 tons).
Cap and Trade: Guaranteed
Environmental Results
Cap and trade programs deliver results with a mandatory cap on emissions while providing sources flexibility in how they comply. Cap and trade programs have proven highly effective in reducing emissions from multiple sources on a regional or larger scale. The mandatory cap on emissions is critical to protect public health and the environment and to sustain that protection into the future. Under cap and trade programs, affected sources are allocated authorizations to emit in the form of emission allowances, but the total number of allowances cannot exceed the cap. The cap also serves to provide stability and predictability to the allowance trading market.
14 Section 2 — Changes in Emissions
NOx Budget Trading Program: 2005 Program Compliance and Environmental Results
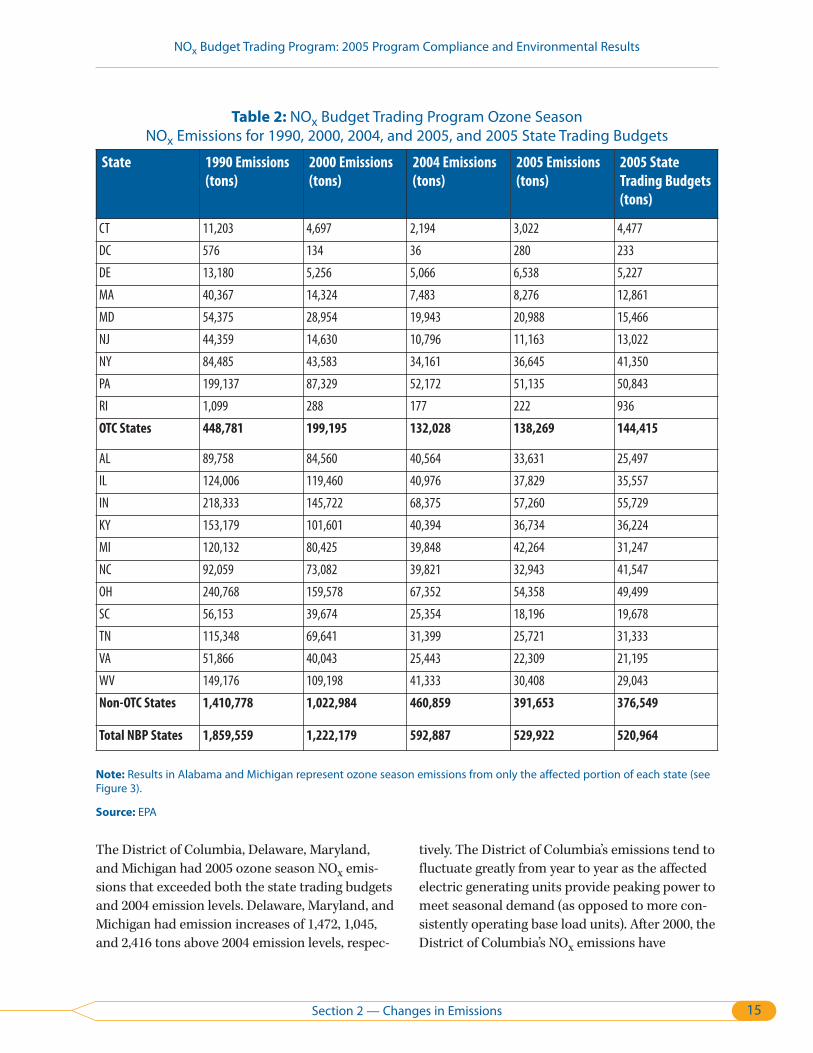
Table 2: NOx Budget Trading Program Ozone Season NOx Emissions for 1990, 2000, 2004, and 2005, and 2005 State Trading Budgets
State 1990 Emissions
(tons)
2000 Emissions
(tons)
2004 Emissions
(tons)
2005 Emissions
(tons)
2005 State
Trading Budgets
(tons)
CT 11,203 4,697 2,194 3,022 4,477
DC 576 134 36 280 233
DE 13,180 5,256 5,066 6,538 5,227
MA 40,367 14,324 7,483 8,276 12,861
MD 54,375 28,954 19,943 20,988 15,466
NJ 44,359 14,630 10,796 11,163 13,022
NY 84,485 43,583 34,161 36,645 41,350
PA 199,137 87,329 52,172 51,135 50,843
RI 1,099 288 177 222 936
OTC States 448,781 199,195 132,028 138,269 144,415
AL 89,758 84,560 40,564 33,631 25,497
IL 124,006 119,460 40,976 37,829 35,557
IN 218,333 145,722 68,375 57,260 55,729
KY 153,179 101,601 40,394 36,734 36,224
MI 120,132 80,425 39,848 42,264 31,247
NC 92,059 73,082 39,821 32,943 41,547
OH 240,768 159,578 67,352 54,358 49,499
SC 56,153 39,674 25,354 18,196 19,678
TN 115,348 69,641 31,399 25,721 31,333
VA 51,866 40,043 25,443 22,309 21,195
WV 149,176 109,198 41,333 30,408 29,043
Non-OTC States 1,410,778 1,022,984 460,859 391,653 376,549
Total NBP States 1,859,559 1,222,179 592,887 529,922 520,964
Note: Results in Alabama and Michigan represent ozone season emissions from only the affected portion of each state (see Figure 3).
Source: EPA
The District of Columbia, Delaware, Maryland, tively. The District of Columbia’s emissions tend to
and Michigan had 2005 ozone season NOx emis- fluctuate greatly from year to year as the affected
sions that exceeded both the state trading budgets electric generating units provide peaking power to
and 2004 emission levels. Delaware, Maryland, and meet seasonal demand (as opposed to more con-
Michigan had emission increases of 1,472, 1,045, sistently operating base load units). After 2000, the
and 2,416 tons above 2004 emission levels, respec- District of Columbia’s NOx emissions have
Section 2 — Changes in Emissions 15

NOx Budget Trading Program: 2005 Program Compliance and Environmental Results
remained low at less than 300 tons per ozone sea
son. State-specific factors have strongly affected
NO emissions in these states. For example, x
Delaware experienced a significant jump in both
heat input and emissions, primarily associated
with two plants. In Maryland, three plants were
responsible for over 65 percent of NOx emissions
in 2005, and emission controls are planned at
these plants in upcoming years as required by a
federal consent decree and recently passed state
legislation.2 In Michigan, while emissions
increased 6 percent from 2004, heat input
increased 9 percent during 2005 — the largest
increase within the non-OTC region.
Daily Emission Trends
Studies indicate that many of the health effects
associated with ozone are linked to daily expo
sure. EPA developed the 8-hour ozone standard
to protect against such exposure. Although the
NBP ensures significant regional NOx reductions
throughout the course of the ozone season, there
have been concerns that a seasonal cap would
not sufficiently reduce short-term, peak NOx
emissions that can occur on hot, high electricity
demand days.
In practice, the NBP has had a significant impact
on daily emissions since the program began in
2003. Figure 9 compares daily NOx emissions dur
ing 2003, 2004, and 2005 for the NBP region. In
2005, daily NOx emission levels for June through
September remained comparable to those in
2004. NOx emissions in May 2005 decreased near
ly 47 percent from May 2004, illustrating the sig
nificant reductions achieved by the non-OTC
states as they began participating in the program
on a full ozone season basis.
Dai
ly N
Ox
Emis
sion
s (t
ons)
Figure 9: Comparison of Daily NOx Emission Levels, 2003–2005
8,000
7,000
6,000
5,000
4,000
3,000
2,000
1,000
0 May Jun Jul Aug Sep Oct
2003
2004
2005
Source: EPA
2 By 2008, under a federal consent decree, one of the companies with affected units in Maryland will be required to cap emissions from three Maryland plants and one Virginia plant to 6,150 tons per ozone season. The emissions cap in this consent decree should reduce emissions from existing plants in Maryland well below budget levels. The emissions from these four plants totaled over 14,800 tons in the 2005 ozone season. In addition, Maryland recently passed legislation, the Healthy Air Act, which will further lower future NOx emissions.
Section 2 — Changes in Emissions 16
NOx Budget Trading Program: 2005 Program Compliance and Environmental Results
Section 3 — Environmental Results
To better understand how the NOx Budget
Trading Program (NBP) affects ozone, this
section examines ozone air quality across
the NBP states since 1997 and then looks at
changes in ozone concentrations before and after
implementation of the NBP. In addition, this sec
tion compares geographic patterns in ozone con
centrations to reductions in nitrogen oxides (NOx)
emissions under the NBP. These analyses consider
the impact of weather, because variations in weath
er conditions play an important role in determin
ing ozone levels.
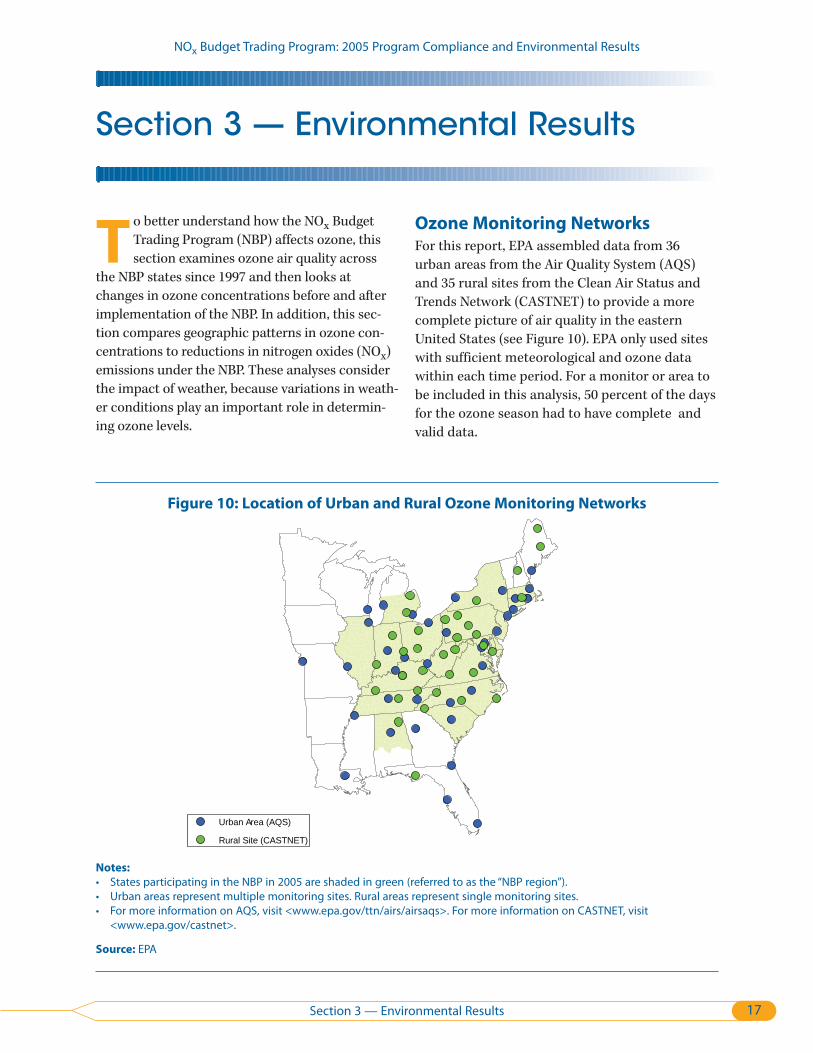
Ozone Monitoring Networks
For this report, EPA assembled data from 36
urban areas from the Air Quality System (AQS)
and 35 rural sites from the Clean Air Status and
Trends Network (CASTNET) to provide a more
complete picture of air quality in the eastern
United States (see Figure 10). EPA only used sites
with sufficient meteorological and ozone data
within each time period. For a monitor or area to
be included in this analysis, 50 percent of the days
for the ozone season had to have complete and
valid data.
Figure 10: Location of Urban and Rural Ozone Monitoring Networks
Urban Area (AQS)
Rural Site (CASTNET)
Notes:
• States participating in the NBP in 2005 are shaded in green (referred to as the “NBP region”). • Urban areas represent multiple monitoring sites. Rural areas represent single monitoring sites. • For more information on AQS, visit <www.epa.gov/ttn/airs/airsaqs>. For more information on CASTNET, visit
<www.epa.gov/castnet>.
Source: EPA
Section 3 — Environmental Results 17

NOx Budget Trading Program: 2005 Program Compliance and Environmental Results
Figure 11: Trends in Seasonal Average 8-Hour Ozone Concentrations in the NOx Budget Trading Program Region (Not Adjusted for Meteorology)
70
60
50
40 1997 1998 1999 2000 2001 2002 2003 2004 2005
Ozone Season AQS Urban Ozone Levels
CASTNET Rural Ozone Levels
NBP Region Ozone Levels
Note: Data presented in this figure are unweighted averages of 8-hour daily maximum ozone concentrations during the ozone season for sites within the NBP region, shaded in green in Figure 10.
Source: EPA
Ozo
ne
Con
cen
trat
ion
s (p
pb
)
General Trends: Changes in Eastern
Ozone Concentrations since 1997
Figure 11 shows trends in the “seasonal average”
8-hour ozone concentrations in the NBP region
from 1997 to 2005, showing the variability over
time in measured ozone concentrations at urban
and rural sites. The seasonal average ozone con
centration is the average of daily maximum 8
hour ozone concentrations from May 1 through
September 30. On average, 2005 ozone concentra
tions in the NBP region remain below 2002 levels,
but are higher than in 2004 (not adjusted for
meteorology). In general, weather conditions
were more conducive to ozone formation in 2005
than in 2004.
Figure 11 also shows that on average, ozone in
rural areas is lower than ozone in urban areas but
follows a similar trend. These results provide a
seasonal average for NBP states and do not show
variations in ozone concentrations for specific
urban or rural areas. Although urban and metro
politan areas typically experienced higher ozone
concentrations, non-urban areas can also experi
ence high ozone levels due to transport and local
emission sources (e.g., mobile sources).
For example, the National Park Service reported
that based on a 3-year average of the fourth highest
daily maximum 8-hour ozone concentration (in
parts per billion, or ppb) for the years 2002 to 2004,
three National Park Units in the eastern United
States (Acadia, Cape Cod, and Great Smoky
Mountains) experienced high ozone concentra
tions that exceeded 85 ppb.3
Ozone Changes after Adjusting for
Meteorology
Variations in weather conditions play an impor
tant role in determining ozone levels. EPA uses a
statistical model to account for the weather-
related variability of seasonal ozone concentra
tions to provide a more accurate assessment.4
3 National Park Service Air Resources Division. “Annual Data Summary, 2004 Gaseous Pollutant Monitoring, Program Ozone, Sulfur Dioxide, Meteorological Observations.” U.S. Department of the Interior. <www2.nature.nps.gov/air/pubs/pdf/ads/2004/GPMP-XX.pdf>.
4 Cox, William M. and Shao-Hang Chu. (1996). “Assessment of Interannual Ozone Variation in Urban Areas from a Climatological Perspective.” Atmospheric Environment, 30.14, 2615-2625.
Section 3 — Environmental Results 18

NOX Budget Trading Program: 2005 Program Compliance and Environmental Results
Meteorology Matters
The graphics below show how the summers of 1997, 2002, and 2005 deviate from normal summer conditions for temperature and precipitation (a surrogate for humidity). Normal conditions are determined by averaging 30 years of temperature and precipitation data (1971 to 2000) at each site for June through August. The information presented below is useful in evaluating the ozone forming potential for a particular ozone season.
Source: National Oceanic and Atmospheric Administration (NOAA), National Climatic Data Center <http://www.ncdc.noaa.gov/oa/climate/research/2002/CMB_prod_us_2002.html>
Section 3 — Environmental Results 19

NOx Budget Trading Program: 2005 Program Compliance and Environmental Results
Figure 12: Seasonal Average 8-Hour Ozone Concentrations in the NOx Budget Trading Program Region before and after Adjusting for Weather
70
60
50
40
Unadjusted for Meteorology Adjusted for Meteorology
1997 1998 1999 2000 2001 2002 2003 2004 2005
Ozone Season
Note: Data presented in this figure are unweighted averages of 8-hour daily maximum ozone concentrations during the ozone season for sites within the NBP region, shaded in green in Figure 10.
Source: EPA
Ozo
ne C
once
ntra
tion
s (p
pb)
This report uses an assessment approach that
accounts for the impacts of weather by normaliz
ing weather variations to provide a better esti
mate of the underlying ozone trend and the
impact of NOx emission reductions. The resulting
estimates represent ozone levels anticipated
under typical weather conditions. This methodol
ogy and the ozone estimates were provided by
EPA’s Office of Air Quality Planning and Standards
(OAQPS), Air Quality Assessment Division,
www.epa.gov/airtrends.
Figure 12 shows trends in the seasonal average 8
hour ozone concentrations before and after
adjusting for meteorology. The blue dotted line
shows the trend in unadjusted, observed values
at monitoring sites. The orange solid line illus
trates the underlying ozone after removing
effects of weather to provide a more accurate
ozone trend for assessing changes in emissions.
When comparing two years with significantly dif
ferent weather conditions and ozone forming
potential (e.g., 1997 vs. 2002), it is important to
account for the variation caused by meteorology.
For example, in general, lower temperatures
depressed ozone formation in 1997 while higher
temperatures increased ozone formation in 2002.
Removing the effects of weather using this type of
meteorological adjustment approach results in a
higher than observed ozone estimate for 1997 and
a lower than observed ozone estimate for 2002.
Ozone Changes: Focus on the NOx
Budget Trading Program
The 2004 NBP report, Evaluating Ozone Control
Programs in the Eastern United States: Focus on
the NOx Budget Trading Program, concluded that
the average reduction in ozone in the eastern
United States between 1997 and 2002 was about 4
percent (adjusted for meteorology), compared
with more than 10 percent between 2002 and
2004.5
Figures 13 and 14 illustrate changes in ozone con
centrations between 1997 and 2002 and 2002 and
2005, after adjusting for meteorology. The average
reduction in ozone in the NBP region between
5 “Evaluating Ozone Control Programs in the Eastern United States: Focus on the NOx Budget Trading Program, 2004,”
<www.epa.gov/airmarkets/fednox>.
Section 3 — Environmental Results 20

NOx Budget Trading Program: 2005 Program Compliance and Environmental Results
Figure 13: Percent Change in Seasonal Figure 14: Percent Change in Seasonal 8-Hour Ozone, 1997 vs. 2002 (Adjusted for 8-Hour Ozone, 2002 vs. 2005 (Adjusted for Meteorology) Meteorology)
Increase Between 25% and 34%
Increase Between 15% and 25%
Increase Between 5% and 15%
Increase Less Than 5%
Decrease Less Than 5%
Decrease Between 5% and 15%
Decrease Between 15% and 23%
Margin of error is +/- 5 percent.
Note: Shaded region shows areas affected under the NBP as of 2005.Source: EPA
2002 and 2005 was about 8 percent. While, on
average, there was no improvement in ozone in
the NBP region between 2004 and 2005 (about 0.5
percent increase as shown in Figure 12), these
results show that the majority of the ozone
progress made between 2002 and 2004 was
retained. In general, weather conditions in 2005
were similar to weather conditions in 2002 (i.e.,
both years had higher than average ozone forming
potential). Before adjusting for meteorology, the
average reduction in ozone between 2002 and 2005
was also about 8 percent.
Figure 15 shows the relationship between reduc
tions in power industry NOx emissions and reduc
tions in ozone after implementation of the NBP.
Between 2002 and 2005, there were decreases in
ozone across all NBP states, with the largest reduc
tions occurring in Connecticut, New York, North
Carolina, Pennsylvania, and West Virginia. There
were some increases in the southern United States,
Note: Shaded region shows areas affected under the NBP as of 2005. Source: EPA
specifically in Florida (which is not in the NBP).
Generally, there is a strong association between
areas with the greatest NOx emission reductions
and downwind sites exhibiting the greatest
improvement in ozone. This suggests that levels of
transported NOx emissions have been reduced in
the eastern United States. While this report does
not attribute all ozone reductions after 2002 to the
NBP, it does show that the NBP has played a key
role in reducing ozone concentrations.
Other recent studies support the key findings of
this report. Gégo et al. examined the effectiveness
of the NOx SIP Call by quantifying changes in daily
maximum 8-hour ozone concentrations at moni
toring sites in the eastern United States before
(1997 to 1998) and after (2003 to 2004) implemen
tation of the program.6 The researchers primarily
used CASTNET data for this analysis because these
measurements are taken in rural areas where
ozone production depends strongly on NOx con
6 Gégo, Edith P, et. al. “Observation-based assessment of the impact of nitrogen oxides emissions reductions on ozone air quality over the east
ern United States.” Journal of Applied Meteorology and Climatology, special issue on the NOAA-EPA Golden Jubilee Symposium (submitted).
Section 3 — Environmental Results 21

NOx Budget Trading Program: 2005 Program Compliance and Environmental Results
Figure 15: Reductions in Ozone Season Power Industry NOx Emissions and 8-Hour Ozone, 2002 vs. 2005
Power Industry NOx Emission 8-Hour Ozone, Adjusted forReductions Meteorology
Ozone Season NOX Emissions Ozone Season 8-Hour Ozone Tons Reduced Percent Reduced
Increase Between 15% and 22% Increase Less Than 1,000
Increase Between 5% and 15%
Decrease Less Than 25,000 Increase Less Than 5%
Decrease Between 25,000 and 50,000 Decrease Less Than 5%
Decrease Between 5% and 15%
Decrease Between 50,000 and 75,000 Decrease Between 15% and 23%
Decrease Between 75,000 and 105,000 Margin of error is +/- 5 percent.
Note: From 2002 to 2005, Delaware (943 tons), New Hampshire (216 tons), Connecticut (76 tons), and Vermont (44 tons) show small increases in ozone season NOx emissions.
Source: EPA
centrations and is nearly independent of VOCs.
After adjusting for meteorology, this study found
that ozone concentrations are on average 13 per
cent less (ranging from 4 to 27 percent across all
sites) than they were before the program. This
study also used a back trajectory analysis and
found that NO emission reductions in the Ohio x
River Valley resulted in substantial improvements
in ozone air quality in downwind regions, especial
ly east and northeast of the Ohio River Valley. This
study concluded that the NO SIP Call has been x
effective in reducing interstate ozone transport and
helping to improve ozone air quality in the eastern
United States.
22 Section 3 — Environmental Results
NOx Budget Trading Program: 2005 Program Compliance and Environmental Results
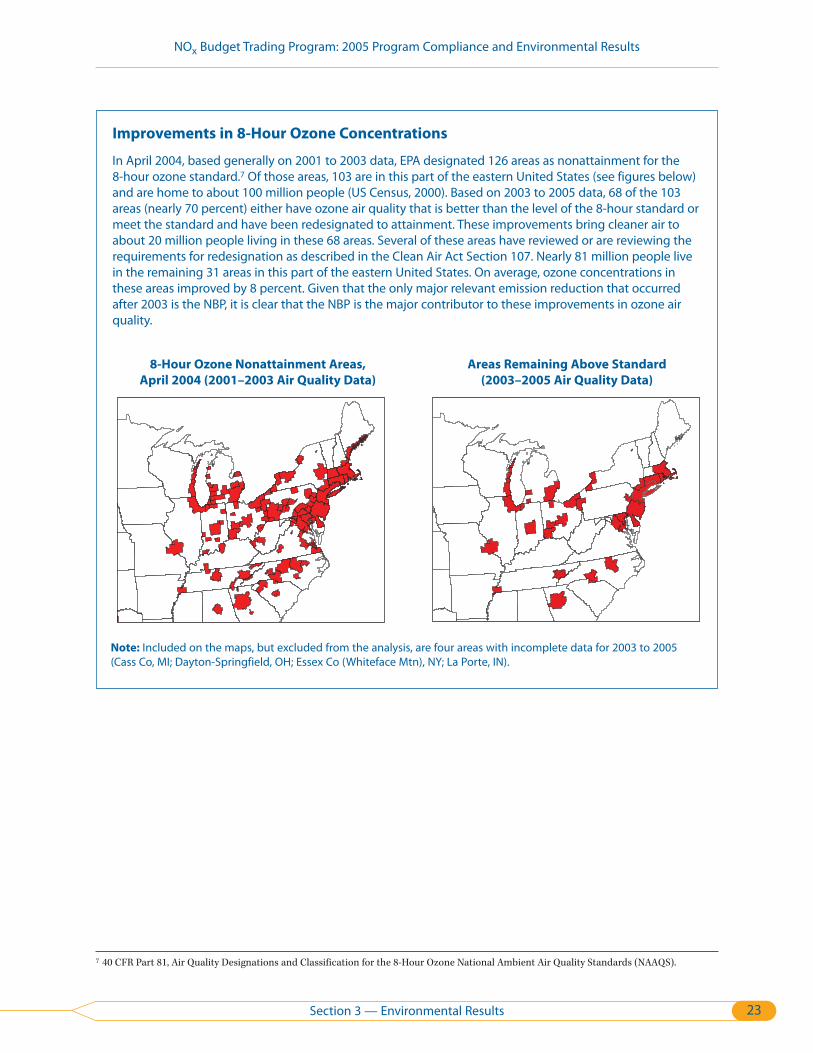
Improvements in 8-Hour Ozone Concentrations
In April 2004, based generally on 2001 to 2003 data, EPA designated 126 areas as nonattainment for the 8-hour ozone standard.7 Of those areas, 103 are in this part of the eastern United States (see figures below) and are home to about 100 million people (US Census, 2000). Based on 2003 to 2005 data, 68 of the 103 areas (nearly 70 percent) either have ozone air quality that is better than the level of the 8-hour standard or meet the standard and have been redesignated to attainment. These improvements bring cleaner air to about 20 million people living in these 68 areas. Several of these areas have reviewed or are reviewing the requirements for redesignation as described in the Clean Air Act Section 107. Nearly 81 million people live in the remaining 31 areas in this part of the eastern United States. On average, ozone concentrations in these areas improved by 8 percent. Given that the only major relevant emission reduction that occurred after 2003 is the NBP, it is clear that the NBP is the major contributor to these improvements in ozone air quality.
8-Hour Ozone Nonattainment Areas, Areas Remaining Above Standard
April 2004 (2001–2003 Air Quality Data) (2003–2005 Air Quality Data)
Note: Included on the maps, but excluded from the analysis, are four areas with incomplete data for 2003 to 2005 (Cass Co, MI; Dayton-Springfield, OH; Essex Co (Whiteface Mtn), NY; La Porte, IN).
7 40 CFR Part 81, Air Quality Designations and Classification for the 8-Hour Ozone National Ambient Air Quality Standards (NAAQS).
Section 3 — Environmental Results 23
NOx Budget Trading Program: 2005 Program Compliance and Environmental Results
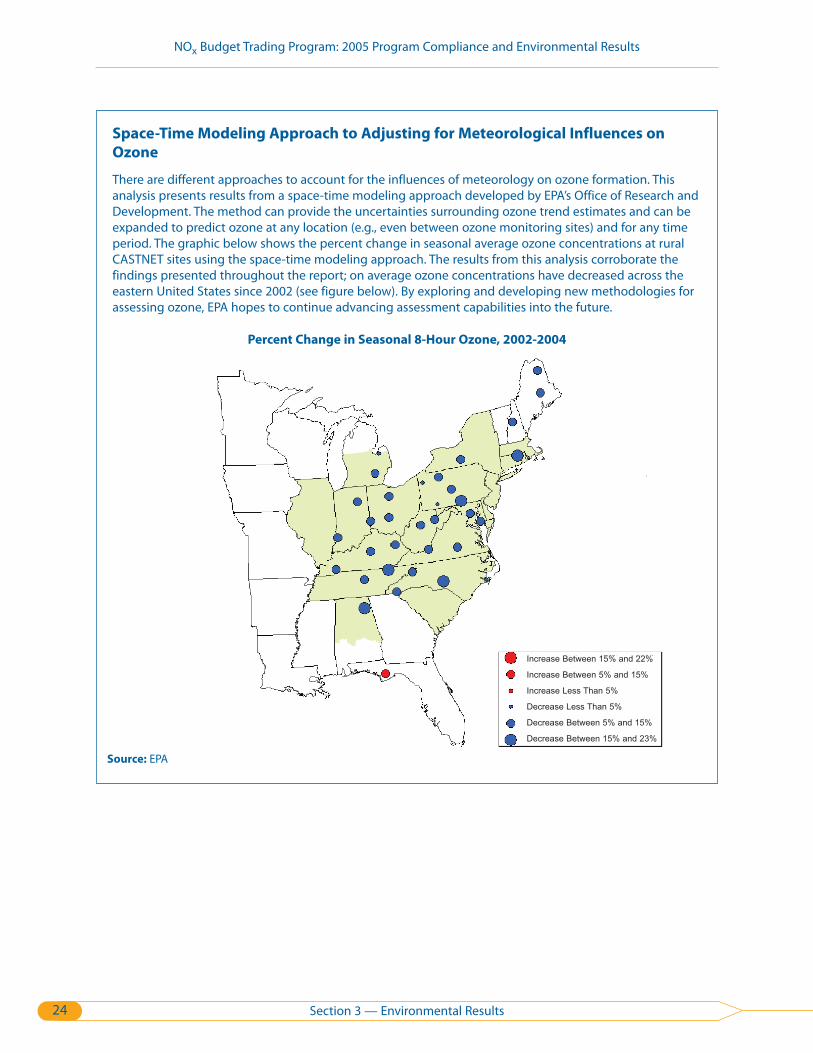
Space-Time Modeling Approach to Adjusting for Meteorological Influences on
Ozone
There are different approaches to account for the influences of meteorology on ozone formation. This analysis presents results from a space-time modeling approach developed by EPA’s Office of Research and Development. The method can provide the uncertainties surrounding ozone trend estimates and can be expanded to predict ozone at any location (e.g., even between ozone monitoring sites) and for any time period. The graphic below shows the percent change in seasonal average ozone concentrations at rural CASTNET sites using the space-time modeling approach. The results from this analysis corroborate the findings presented throughout the report; on average ozone concentrations have decreased across the eastern United States since 2002 (see figure below). By exploring and developing new methodologies for assessing ozone, EPA hopes to continue advancing assessment capabilities into the future.
Percent Change in Seasonal 8-Hour Ozone, 2002-2004
Increase Between 15% and 22%
Increase Between 5% and 15%
Increase Less Than 5%
Decrease Less Than 5%
Decrease Between 5% and 15%
Decrease Between 15% and 23%
Source: EPA
24 Section 3 — Environmental Results
NOx Budget Trading Program: 2005 Program Compliance and Environmental Results
Ozone Impacts on Forest Health
As with human health, EPA is concerned about
the impacts of air pollution on ecological sys
tems. Ground-level ozone-induced effects on
trees and forests include reduced growth and/or
reproduction and increased susceptibility to dis
ease, pests, and other environmental stresses
(e.g., harsh weather). Ground-level ozone can also
cause visible injury to leaves and foliage.
The United States Forest Service Forest Health
Monitoring Program (FHM) uses visible foliar
injury as an indicator that ground-level ozone is
impacting trees and forests. The Ozone Biosite
Index (see Table 3) was developed based on the
proportion of damaged leaves and the severity of
symptoms to the number of non-injured leaves
within a defined forested area.8 The Forest
Service uses the Ozone Biosite Index to survey
forested areas in the United States. The most
recent data are presented as an average value
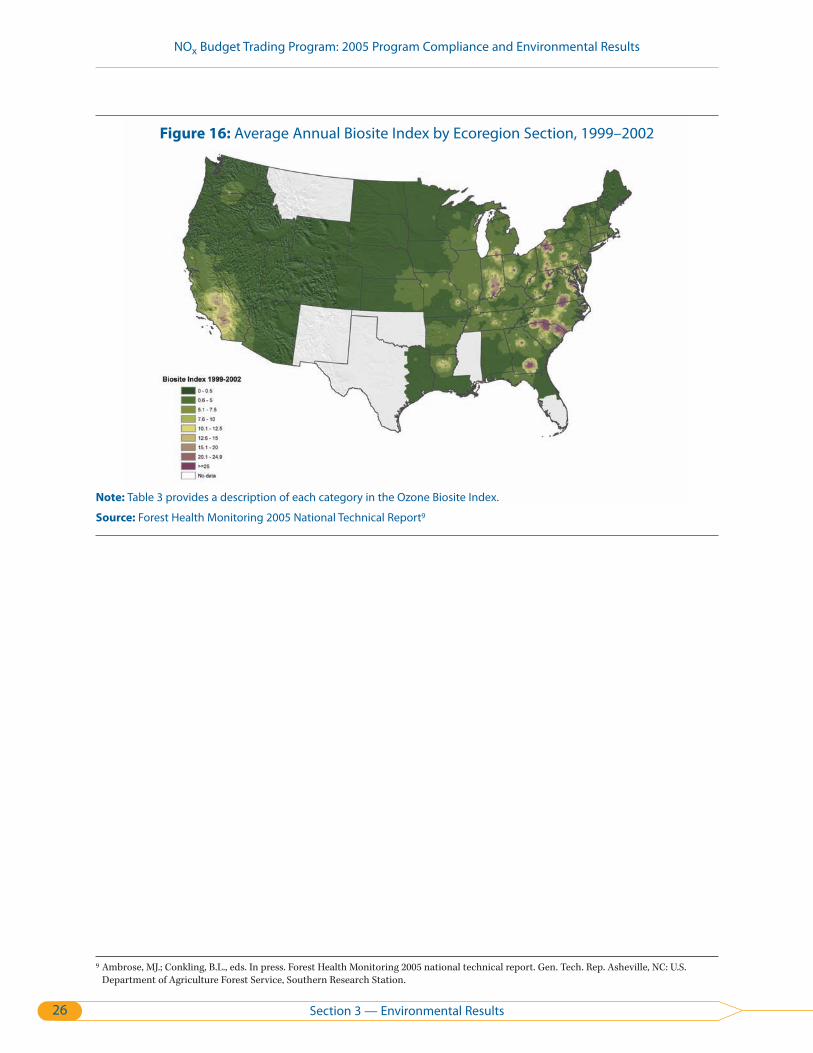
from 1999 to 2002 (see Figure 16). This analysis
shows that foliar injury occurred more extensive
ly in the eastern United States than the western
United States in this time period, especially in the
Mid-Atlantic and the Southeast. These data show
visible foliar injury before the NOx emission
reductions under the NBP took effect. Recent
improvements in ozone due to emission control
programs have occurred in many areas where for
est ecosystems had experienced the most visible
foliar injury from ozone exposure. While it will
take time for forest ecosystems to respond to
ozone improvements, as data become available
(i.e., 2002 to 2005 data), EPA will continue to
examine the impacts of ozone on forest
indicators.
Table 3: Ozone Biosite Index Categories, Risk Assumption, and Possible Impact
Biosite Index Bioindicator
Response
Assumption of Risk to
Forest Resource
Possible Impact
0 to < 5.0 Little or No Foliar Injury None Visible injury to isolated genotypes of sen
sitive species; e.g., common milkweed,
black cherry.
5.0 to < 15.0 Light to Moderate Foliar
Injury
Low Visible injury to highly sensitive species,
e.g., black cherry; effects noted primarily
at the tree level.
15.0 to < 25.0 Moderate to Severe
Foliar Injury
Moderate Visible injury to moderately sensitive
species, e.g., tulip poplar; effects noted
primarily at the tree level.
> 25 Severe Foliar Injury High Visible injury leading to changes in struc
ture and function of the ecosystem.
Source: Smith, G.C. FHM second ozone bioindicator workshop – summary of proceedings. Unpublished manuscript. 12 p. On file with: USDA Forest Service, Forest Health Monitoring Program, P.O. Box 12254, Research Triangle Park, NC 27709
8 Ambrose, MJ.; Conkling, B.L., eds. In press. Forest Health Monitoring 2005 national technical report. Gen. Tech. Rep. Asheville, NC: U.S. Department of Agriculture Forest Service, Southern Research Station.
Section 3 — Environmental Results 25
NOx Budget Trading Program: 2005 Program Compliance and Environmental Results
Figure 16: Average Annual Biosite Index by Ecoregion Section, 1999–2002
Note: Table 3 provides a description of each category in the Ozone Biosite Index.
Source: Forest Health Monitoring 2005 National Technical Report9
9 Ambrose, MJ.; Conkling, B.L., eds. In press. Forest Health Monitoring 2005 national technical report. Gen. Tech. Rep. Asheville, NC: U.S. Department of Agriculture Forest Service, Southern Research Station.
Section 3 — Environmental Results 26

NOx Budget Trading Program: 2005 Program Compliance and Environmental Results
Section 4 — Compliance and MarketActivity
Sources achieved over 99 percent compliance
with the NO Budget Trading Program (NBP) in x
2005. This section examines compliance under
the NBP in 2005 and reviews allowance trading
and pricing trends in this maturing market. In
addition, this section reviews the monitoring and
control methods employed by sources to meet
program requirements.
2005 Compliance Results
Under the NBP, sources must hold sufficient
allowances to cover their ozone season nitrogen
oxides (NOx) emissions each year. Sources can
maintain the allowances in compliance accounts
(established for each unit) or in an overdraft
account (established for each facility with more
than one unit). The sources have a 2-month peri
od following the end of the control period to buy
or sell allowances and/or move allowances
between accounts to ensure their emissions do
not exceed allowances held. After the 2-month
period, EPA reconciles emissions with allowance
holdings to determine program compliance.
Sources may not transfer allowances until annual
reconciliation is complete.
There were 2,570 units affected under the NBP in
2005. Only three NBP sources (4 units total) did
not hold sufficient allowances to cover their emis
sions. Table 4 summarizes the allowance reconcil
iation process for 2005.
Table 4: NOx Allowance Reconciliation the Summary for the NOx Budget Trading Program, 2005
Total Allowances Held for Reconciliation (2003 through 2005 Vintages) 729,326
Allowances Held in Compliance or Overdraft Accounts 700,782
Allowances Held in Other Accounts* 28,544
Allowances Deducted in 2005 534,005
Allowances Deducted for Actual Emissions 529,830
Additional Allowances Deducted under Progressive Flow Control (PFC) 4,168
Termination of 2004 Early Reduction Credits (or Compliance Supplement Pool) Allowances** 7
Banked Allowances (Carried into 2006 Ozone Season) 195,321
Allowances Held in Compliance or Overdraft Accounts 160,604
Allowances Held in Other Accounts*** 34,717
Penalty Allowances Deducted**** (from Future Year Allocations) 12
* Other Accounts refers to general accounts in the NOx Allowance Tracking System (NATS) that can be held by any source, individual, or other organization, as well as state accounts.
** Compliance supplement pool (CSP) allowances can only be used for 2 years. CSP allowances not used for reconciliation in 2005 have been retired permanently.
*** Total includes 6,173 new unit allowances returned to state holding accounts. **** These penalty deductions are made from future vintage year allowances, not 2005 allowances. An additional 264
penalty allowances are owed by one source and will be deducted in the future.
Section 4 — Compliance and Market Activity 27

NOx Budget Trading Program: 2005 Program Compliance and Environmental Results
Banking in 2005 and Flow Control
in 2006
Under cap and trade programs in general, and
the NBP specifically, banking allows companies
to decrease emissions below the amount of
allowances they hold and then save the unused
allowances for future use. Banking results in envi
ronmental and health benefits earlier than
required and provides an available pool of
allowances that could address unexpected
events, or smooth the transition into deeper
emission reductions.
Figure 17 shows the number of allowances allo
cated each year, the allowances banked from the
previous year, and the total ozone season emis
sions for NBP sources from 2003 to 2005. Sources
banked over 195,000 allowances in the 2005
ozone season (see Table 4), which will be avail
able for use in 2006 for program compliance. This
is about 6 percent lower than the nearly 208,000
allowances sources banked by the end of the 2004
ozone season, which were available for use in
2005 (as shown in Figure 17).
The NBP’s progressive flow control provisions
were designed to discourage extensive use of
banked allowances in a particular ozone season.
Flow control is triggered when the total number
of allowances banked for all sources exceeds 10
percent of the total regional budget for the next
year. When this occurs, EPA calculates the flow
control ratio by dividing 10 percent of the total
regional NOx trading budget by the number of
banked allowances (a larger bank will result in a
smaller flow control ratio). The resulting flow
control ratio establishes the percentage of
banked allowances that can be deducted from a
source’s account on a ratio of one allowance per
ton of emissions. The remaining banked
allowances, if used, must be deducted at a rate of
two allowances per one ton of emissions. In 2005,
the flow control ratio was 0.25, and 4,168 addi
tional allowances were deducted from the
allowance bank under the flow control provi
sions. Flow control will be triggered again in
2006, at a slightly higher ratio of 0.27 (see “Flow
Control Will Apply in 2006,” page 29, for details).
NO
x Em
issi
ons
(Tho
usan
d To
ns)
Figure 17: NOx Allowance Allocations and the Allowance Bank, 2003–2005
800
700
600
500
400
300
200
100
0 2003 2004 2005
Ozone Season
Banked Allowances from Previous Year
Allowances Allocated Control Period Emissions
Notes:
• The 2003 emissions and allocations totals includes only the OTC states. The 2004 emissions total includes the OTC states emissions (from May 1 to September 30) plus the non-OTC states emissions (from May 31 to September 30).
• Allowances allocated include base budget, compliance supplement pool (CSP), and opt-in allowances. CSP allowances may not be used beyond the 2005 ozone season. For more information on allowance allocations, visit www.epa.gov/airmarkets/fednox.
Source: EPA
28 Section 4 — Compliance and Market Activity

NOx Budget Trading Program: 2005 Program Compliance and Environmental Results
Flow Control Will Apply in 2006 — How Will It Affect Sources?
2006 Regional Budget: 520,957 Allowances
Banked Allowances after 2005: 195,321 Allowances
Flow Control Trigger: 195,321/520,957 = .375 (> than 10 percent), Triggering Flow Control for 2006
• The 2006 flow control ratio = 0.27 (determined by dividing 10 percent of the total regional trading budget by the total number of banked allowances, or 52,096/195,321).
• The flow control ratio applies to banked allowances in each source’s compliance and overdraft allowance accounts at the time of compliance reconciliation. For example:
– If a source holds 1,000 banked allowances at the end of 2006, it can use 270 of those allowances on a 1-for-1 basis and the remaining 730 allowances on a 2-for-1 basis.
– If the source used all 1,000 banked allowances for 2006 compliance, the banked allowances could cover only 635 tons of NOx emissions (i.e., 270 + 730/2).
NOx Allowance Trading in 2005
There are three main types of allowance
transactions:
• Transfers within a company or between related
entities (e.g., holding company transfers to a
small operating subsidiary), including transfers
between a unit compliance account and any
account held by a company with an ownership
interest in the unit.
• Transfers between separate economic entities.
This may include companies with contractual
relationships such as power purchase agree
ments, but excludes parent-subsidiary types of
relationships. These transfers are categorized
broadly as “economically significant trades.”
• Transfers from or to a state as allowance allo
cations or allowance surrenders.
In 2005, economically significant trades repre
sented about 30 percent of the total transfers
between entities other than a state. There were
approximately 228,000 allowances involved in
economically significant trades in 2005, an
increase of about 34,000 allowances from 2004
(see Figure 18). The economically significant
trades provide a strong indicator of true market
activity, because they represent an actual
exchange of assets between unaffiliated
participants.
Industrial sources accounted for over 6 percent
of the economically significant trade volume in
2005, which was down from 2004 levels. This level
of activity is proportional to the industrial units’
regional emissions contribution of slightly less
than 7 percent. The high level of 2004 trading
activity for industrial sources was the result of a
significant number of allowances purchased by
this group of sources. In 2005, that trend was
reversed as the industrial sources transferred far
more allowances to others than they received. In
most trades, industrial sources are trading with
electric generating companies, with only a few
trades involving industrial sources on both sides
of the transaction.
Section 4 — Compliance and Market Activity 29

NOx Budget Trading Program: 2005 Program Compliance and Environmental Results
NOx allowance prices in 2005 were slightly lower Figure 18: Estimated Volumes of and somewhat less volatile than during 2004 (see Economically Significant Trades under the Figure 19). Potential reasons for the price decline NOx Budget Trading Program, 2003–2005 may include sources’ need to use remaining com
pliance supplement pool (CSP) allowances before 250,000
Total Allowances Traded Allowances Traded by Industrial Sources
2003
2004
2005
Interstate Rule (CAIR) finalized in March 2005. In 150,000
addition, the general price differential between
100,000 vintage years 2004 and 2005 versus 2006 through
2008 reflects the discount applied to banked 50,000
allowances as a result of flow control.
0 NOx allowance prices can reflect market uncer
tainties as companies evaluate ongoing trends in
their 2005 expiration and increased confidence200,000 from understanding the impacts of the Clean Air
NO
x Al
low
ance
s
Note: As part of compiling this information for the 2005 report, EPA has reexamined all allowance transfer data from 2003 and 2004, and has revised the numbers for 2003 and 2004 presented in previous reports. Generally, EPA’s estimate of economically significant trade volume in those years has decreased based on further analysis of outside data sources (such as company Web sites and Securities and Exchange Commission filings) to identify corporate relationships and ownership interests in units. The 2003 data also have been adjusted to correct a computational error. Because trades are not reported by market participants with respect to whether they are economically significant, EPA presents these data as a general estimate only.
Source: EPA
Figure 19: Vintage Year NOx Allowance Prices by Month of Sale for the NOx Budget Trading Program
Vintage Year NOx Allowance Price 9,000
control installations, energy demand, and other
external factors that affect the overall costs of
control. Additional influences on allowance pric
ing include progressive flow control and integra
tion with other emission control programs, such
as CAIR.
Continuous Emission Monitoring
System (CEMS) Results
In order for NO allowances to be accurately x
tracked and traded, NBP sources must use con
sistent emissions monitoring procedures to
determine their emissions. Accurate and consis
tent monitoring ensures that all allowances in
the NBP have the same value (i.e., a ton of NOx
emissions from one NBP source is equal to a ton
of NOx emissions from any other source in the
program). Sources are required to conduct strin
gent quality assurance tests of their monitoring
4,000
0
5,000
6,000
7,000
8,000
Oct ’02 Feb ’03 Jun ’03 Oct ’03 Feb ’04 Jun ’04 Oct ’04 Feb ’05 Jun ’05 Oct ’05 Feb ’06
2003
2004
2005
2006
2007
2008
only verify that the monitoring systems are meas3,000
uring accurately, but also compare measured 2,000
data to a standard reference method. Analysis of 1,000
the quality-assured CEMS data reported by NBP
sources in 2005 convincingly demonstrates the
accuracy of the emission data.
systems, such as daily calibrations, quarterly lin-
Nom
inal
Dol
lars
per
Ton earity checks, and semi-annual or annual relative
accuracy test audits (RATAs). These tests not
Source: Evolution Markets, LLC and Cantor Environmental Brokerage In 2005, both the electric generating units and
industrial units passed at least 98 percent of the
quality assurance tests required of their monitoring
30 Section 4 — Compliance and Market Activity

NOx Budget Trading Program: 2005 Program Compliance and Environmental Results
systems. Industrial sources, many of which have
only been monitoring under EPA’s detailed moni
toring procedures (40 CFR Part 75) since 2003,
were able to perform at nearly the same level as
electric generating units, many of which have been
monitoring under Part 75 for more than a decade.
The NBP sources reported quality-assured
emission data for more than 99 percent of their
operating hours in 2005. Part 75 requires conserv
atively high substitute data values to be reported
for missing data periods, but substitute data were
used less than 1 percent of the time in 2005 and
therefore had little impact on the NOx emissions
reported by NBP sources.
Compliance Options Used by NOx
Budget Trading Program Sources in
2005
Sources may select from a variety of compliance
options to meet the emission reduction targets of
the NBP in ways that best fit their own circum
stances, such as:
• Decreasing or stopping generation from units
with high NOx emission rates, or shifting to
lower emitting units, during the ozone season.
• Using NOx combustion controls that modify or
optimize the basic combustion process to con
trol the formation of NO .x
• Using add-on emission controls, such as selec
tive catalytic reduction (SCR) or selective non-
catalytic reduction (SNCR).
• Purchasing additional allowances from other
market participants whose emissions were
lower than their allocations.
Before implementation of the NBP, a large num
ber of electric generating units and some indus
trial units added combustion controls to meet
applicable NOx emission limits of either the Acid
Rain Program (ARP) or state regulations. For
boilers, furnaces, and heaters, NOx combustion
controls include low NO burner and overfire air x
technologies, which modify the combustion
Monitoring Options Available to
Sources
EPA has developed detailed procedures (40 CFR Part 75) to ensure that sources monitor and report emissions with a high degree of precision, accuracy, reliability, and consistency. Coal-fired units are required to use CEMS for NOx and stack gas flow rate (and if needed, CO2 or O2 and moisture), to measure and record their NOx emissions. Oil- and gas-fired units may alternatively use a NOx CEMS in conjunction with a fuel flowmeter to determine NOx emissions. For oil- and gas-fired units that are either operated infrequently to provide power during periods of peak demand, or that have very low NOx emissions, Part 75 provides low-cost alternatives to CEMS for estimating NOx emissions.
process to reduce formation of NOx from nitro
gen found in the combustion air and fuel.
Add-on control technologies, such as SCR or
SNCR, have also been frequently installed for NOx
control. The majority of units that install add-on
controls use them in conjunction with their exist
ing combustion controls to achieve greater emis
sion reductions. SCR and SNCR are control
technologies that achieve NOx reductions by
injecting ammonia, urea, or another NOx -reduc
ing chemical into the flue gas downstream of the
combustion unit to react with NOx, forming ele
mental nitrogen (N2) and water. SCR, which adds
a catalyst to allow the reaction to occur in a
lower temperature range, can be applied to a
wider range of sources than SNCR and is capable
of greater NOx removal rates.
NOx Controls Used in 2005
Sources subject to the NBP are required to report
pollution control equipment information, includ
ing installation dates, in monitoring plans sub
mitted to EPA. For this report, EPA verified the
source-reported EPA emission control equipment
data with state agencies, with an emphasis on
coal-fired units, to confirm the findings.10
10 Two affected states are still gathering data; all others have provided updated control status information.
Section 4 — Compliance and Market Activity 31

NOx Budget Trading Program: 2005 Program Compliance and Environmental Results
Figure 20: Number of Affected Electric Generating Units (EGUs) and Percent of Total Ozone Season Electric Generation by Fuel and Control Type for 2004 and 2005
2004 EGU Population (Total, 2,232 Units) 2005 EGU Population (Total, 2,232 Units)
203 219
9% 10%
522 50823% 23%
38337517% 17%
126
6% 136
6%
988 1,004
45% 44%
2004 EGU Generation (Total, 547,659 GWh) 2005 EGU Generation (Total, 596,247 GWh)
64,371 86,383 25,408 12% 11,585
27,226 14%2%
219,97540%
5%
226,320 41%
5% 14,905
213,555 36% 254,178
43%
2%
Add-on Controlled Coal
Combustion Controlled Coal
Uncontrolled Coal
Controlled Oil and Gas
Uncontrolled Oil and Gas
Note: Add-on controls for coal units include SCR and SNCR. Combustion controls include various low NOx burner control technologies, over-fire air, water injection, and others.
Source: EPA
EPA used the input from the state agencies to
update data where needed. EPA continues efforts
to verify that control equipment data are accu
rate and complete.
Figure 20 shows the breakdown of how electric
generating units have employed emission con
trols as of the 2005 ozone season compared to
the 2004 ozone season. The charts include the
results broken down both by number of units and
by the percent of total ozone season generation.
In the 2005 ozone season, there were 2,232 elec
tric generating units affected under the NBP. The
results show that although the number of coal-
fired units with NOx emission controls (i.e., add-
on controls and/or combustion controls)
represents less than 30 percent of the total num
ber of electric generating units, this sector repre
sented almost 80 percent of total generation.
Uncontrolled units, either coal or gas and oil, rep
resent about one-third of all units, but less than
32 Section 4 — Compliance and Market Activity
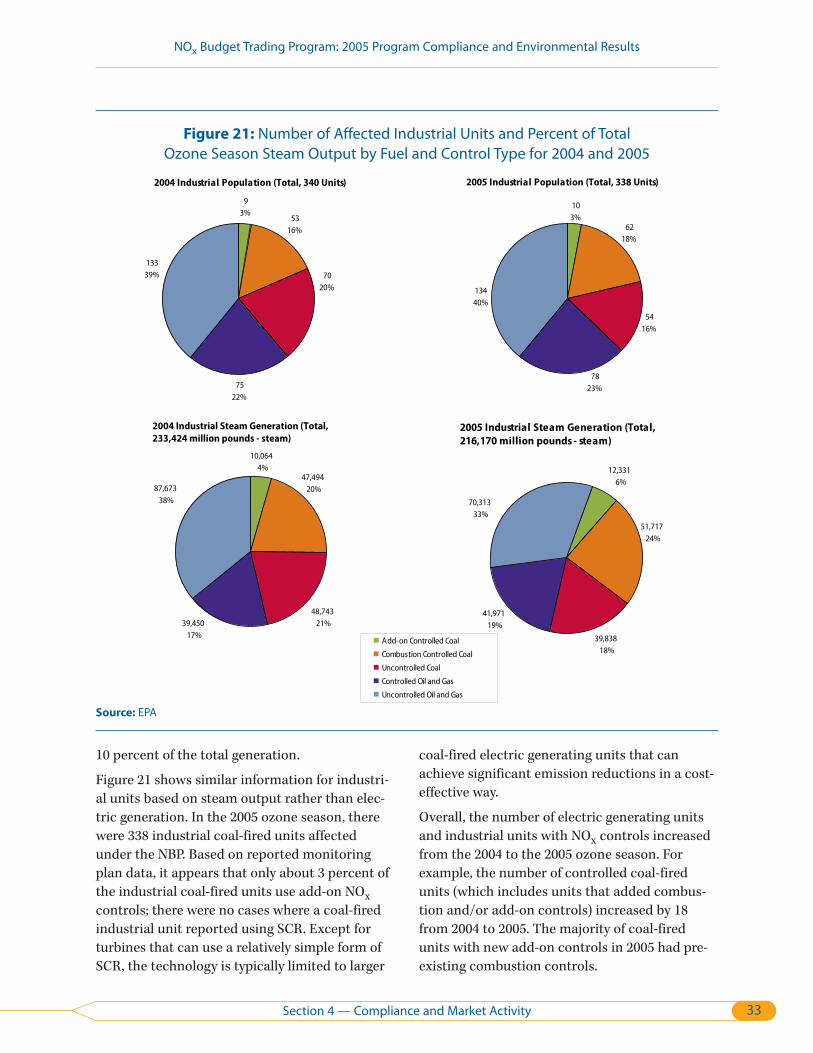
NOx Budget Trading Program: 2005 Program Compliance and Environmental Results
Figure 21: Number of Affected Industrial Units and Percent of Total Ozone Season Steam Output by Fuel and Control Type for 2004 and 2005
2004 Industrial Population (Total, 340 Units) 2005 Industrial Population (Total, 338 Units)
9 10 3%
53 3%
13339%
16%
75 22%
70 20% 134
40%
54
6218%
7823%
16%
2004 Industrial Steam Generation (Total, 2005 Industrial Steam Generation (Total, 233,424 million pounds - steam) 216,170 million pounds - steam)
10,064 4% 12,331
47,494
Add-on Controlled Coal
Combustion Controlled Coal
Uncontrolled Coal
Controlled Oil and Gas
Uncontrolled Oil and Gas
6% 87,673 20%
38% 70,313 33%
51,717 24%
48,743 41,971 39,450 21% 19%
17% 39,838 18%
Source: EPA
10 percent of the total generation.
Figure 21 shows similar information for industri
al units based on steam output rather than elec
tric generation. In the 2005 ozone season, there
were 338 industrial coal-fired units affected
under the NBP. Based on reported monitoring
plan data, it appears that only about 3 percent of
the industrial coal-fired units use add-on NOx
controls; there were no cases where a coal-fired
industrial unit reported using SCR. Except for
turbines that can use a relatively simple form of
SCR, the technology is typically limited to larger
coal-fired electric generating units that can
achieve significant emission reductions in a cost-
effective way.
Overall, the number of electric generating units
and industrial units with NO controls increased x
from the 2004 to the 2005 ozone season. For
example, the number of controlled coal-fired
units (which includes units that added combus
tion and/or add-on controls) increased by 18
from 2004 to 2005. The majority of coal-fired
units with new add-on controls in 2005 had pre
existing combustion controls.
Section 4 — Compliance and Market Activity 33
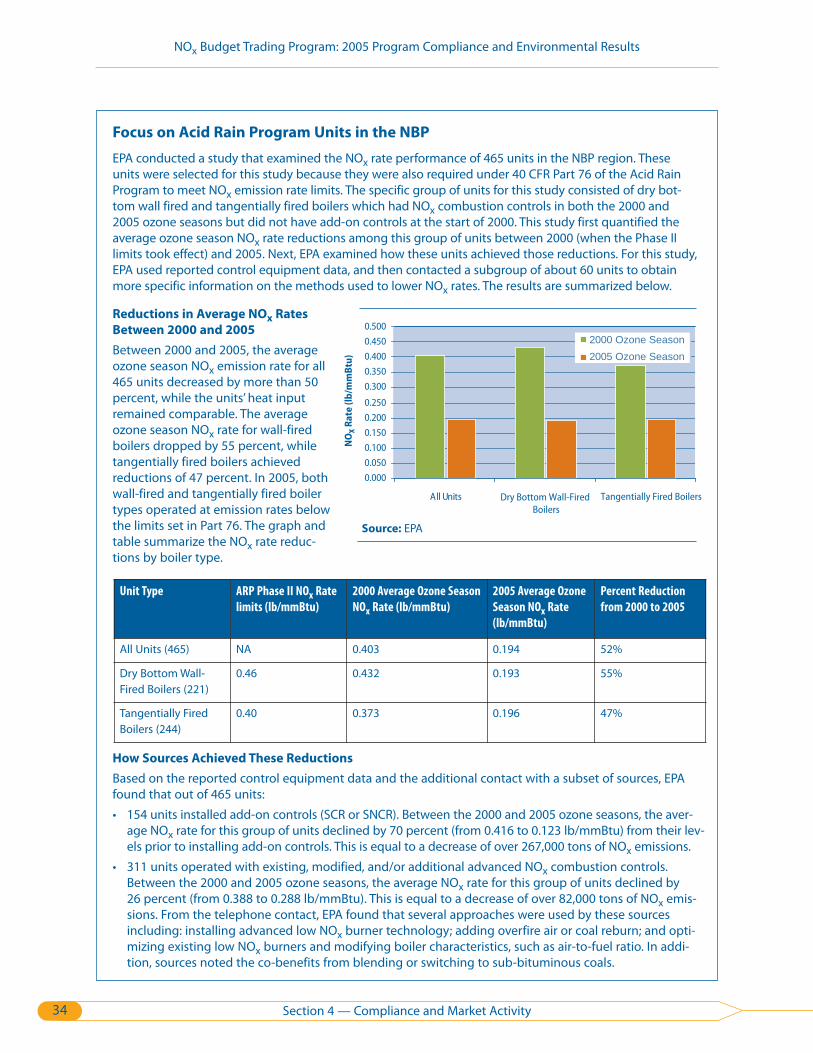
NOx Budget Trading Program: 2005 Program Compliance and Environmental Results
Focus on Acid Rain Program Units in the NBP
EPA conducted a study that examined the NOx rate performance of 465 units in the NBP region. These units were selected for this study because they were also required under 40 CFR Part 76 of the Acid Rain Program to meet NOx emission rate limits. The specific group of units for this study consisted of dry bottom wall fired and tangentially fired boilers which had NOx combustion controls in both the 2000 and 2005 ozone seasons but did not have add-on controls at the start of 2000. This study first quantified the average ozone season NOx rate reductions among this group of units between 2000 (when the Phase II limits took effect) and 2005. Next, EPA examined how these units achieved those reductions. For this study, EPA used reported control equipment data, and then contacted a subgroup of about 60 units to obtain more specific information on the methods used to lower NOx rates. The results are summarized below.
Reductions in Average NOx Rates
Between 2000 and 2005 0.500
0.450 Between 2000 and 2005, the averageozone season NOx emission rate for all 465 units decreased by more than 50percent, while the units’ heat inputremained comparable. The averageozone season NOx rate for wall-fired boilers dropped by 55 percent, while N
OX
Rate
(lb/
mm
Btu
) 0.400
0.350
0.300
0.250
0.200
0.150
0.100
2000 Ozone Season
2005 Ozone Season
tangentially fired boilers achieved 0.050
reductions of 47 percent. In 2005, both 0.000
wall-fired and tangentially fired boiler All Units Dry Bottom Wall-Fired Tangentially Fired Boilers types operated at emission rates below Boilers
the limits set in Part 76. The graph and Source: EPA table summarize the NOx rate reductions by boiler type.
Unit Type ARP Phase II NOx Rate
limits (lb/mmBtu)
2000 Average Ozone Season
NOx Rate (lb/mmBtu)
2005 Average Ozone
Season NOx Rate
(lb/mmBtu)
Percent Reduction
from 2000 to 2005
All Units (465) NA 0.403 0.194 52%
Dry Bottom Wall-Fired Boilers (221)
0.46 0.432 0.193 55%
Tangentially Fired Boilers (244)
0.40 0.373 0.196 47%
How Sources Achieved These Reductions
Based on the reported control equipment data and the additional contact with a subset of sources, EPA found that out of 465 units:
• 154 units installed add-on controls (SCR or SNCR). Between the 2000 and 2005 ozone seasons, the average NOx rate for this group of units declined by 70 percent (from 0.416 to 0.123 lb/mmBtu) from their levels prior to installing add-on controls. This is equal to a decrease of over 267,000 tons of NOx emissions.
• 311 units operated with existing, modified, and/or additional advanced NOx combustion controls. Between the 2000 and 2005 ozone seasons, the average NOx rate for this group of units declined by 26 percent (from 0.388 to 0.288 lb/mmBtu). This is equal to a decrease of over 82,000 tons of NOx emissions. From the telephone contact, EPA found that several approaches were used by these sources including: installing advanced low NOx burner technology; adding overfire air or coal reburn; and optimizing existing low NOx burners and modifying boiler characteristics, such as air-to-fuel ratio. In addition, sources noted the co-benefits from blending or switching to sub-bituminous coals.
34 Section 4 — Compliance and Market Activity

NOx Budget Trading Program: 2005 Program Compliance and Environmental Results
Section 5 — Future NOx Reductions and Ozone Improvements: Transition to the Clean Air Interstate Rule
Building upon the nitrogen oxides (NO )x
emission reductions of the NOx Budget
Trading Program (NBP) and the Acid Rain
Program, the Clean Air Interstate Rule (CAIR),
issued March 10, 2005, will permanently lower
power industry emissions of sulfur dioxide (SO2)
and NOx in the eastern United States, achieving
significant reductions of these pollutants. In addi
tion to addressing ozone attainment, CAIR assists
states in attaining the PM 2.5 National Ambient
Air Quality Standards (NAAQS) by reducing trans
ported precursors, SO2 and NOx. CAIR accom
plishes this by creating three separate programs:
an ozone season NOx program and annual NOx
and SO2 programs. Each of the three programs
uses a two-phased approach, with declining
emission caps in each phase based on highly cost-
effective controls on power plants. The first phase
will begin in 2009 for the NOx ozone season and
annual programs and 2010 for the SO2 annual
program. The second phase for all three programs
will begin in 2015. Similar to the NOx SIP Call,
CAIR gives states the flexibility to reduce
emissions using a strategy that best suits their
circumstances and provides an EPA-administered,
regional cap and trade program as one option.
States are now choosing the strategy that best
enables them to achieve these mandated reduc
tions and plans are due to be submitted to EPA for
approval by the fall of 2006.
Figure 22: Transition from the NOx Budget Trading Program to the Clean Air Interstate Rule
Note: The affected portions of Missouri and Georgia are required to comply with the NOx SIP Call as of May 1, 2007. However, EPA has stayed the NOx SIP Call requirements for Georgia while it responds to a petition to reconsider Georgia’s inclusion in the NOx SIP Call.
Source: EPA
Section 5 — Future NOx Reductions and Ozone Improvements: Transition to the Clean Air Interstate Rule 35
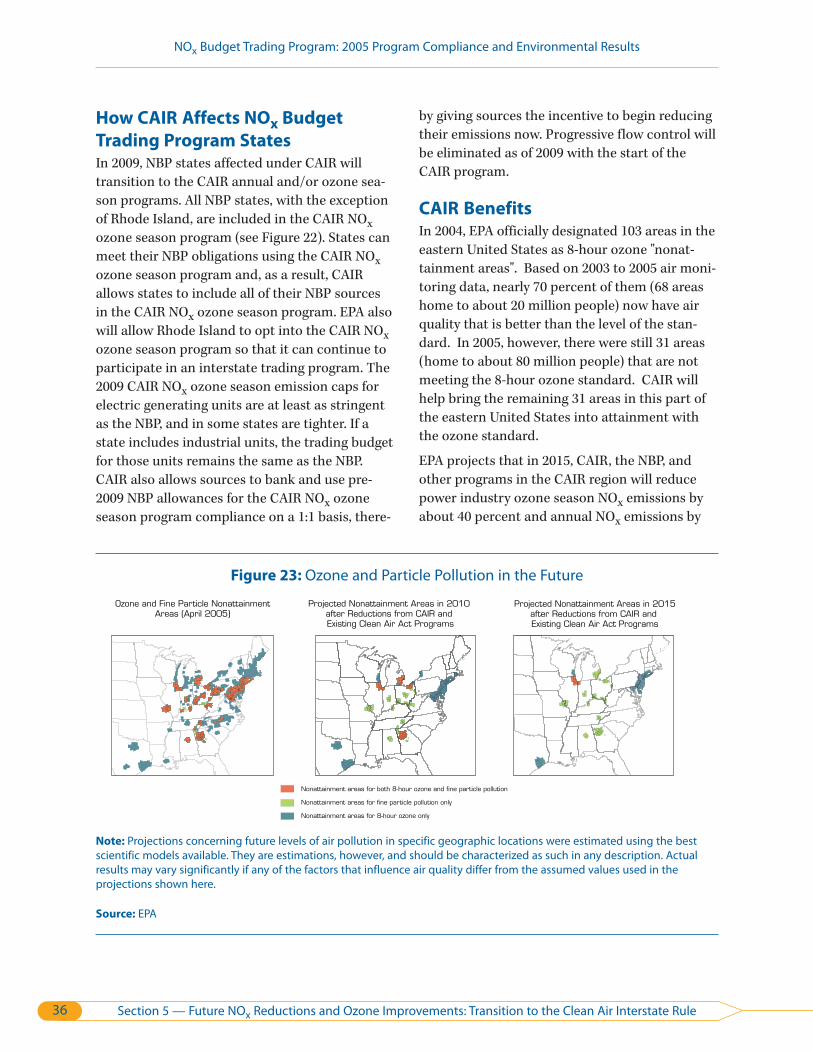
NOx Budget Trading Program: 2005 Program Compliance and Environmental Results
How CAIR Affects NOx Budget
Trading Program States
In 2009, NBP states affected under CAIR will
transition to the CAIR annual and/or ozone sea
son programs. All NBP states, with the exception
of Rhode Island, are included in the CAIR NOx
ozone season program (see Figure 22). States can
meet their NBP obligations using the CAIR NOx
ozone season program and, as a result, CAIR
allows states to include all of their NBP sources
in the CAIR NOx ozone season program. EPA also
will allow Rhode Island to opt into the CAIR NOx
ozone season program so that it can continue to
participate in an interstate trading program. The
2009 CAIR NO ozone season emission caps for x
electric generating units are at least as stringent
as the NBP, and in some states are tighter. If a
state includes industrial units, the trading budget
for those units remains the same as the NBP.
CAIR also allows sources to bank and use pre
2009 NBP allowances for the CAIR NO ozone x
season program compliance on a 1:1 basis, there
by giving sources the incentive to begin reducing
their emissions now. Progressive flow control will
be eliminated as of 2009 with the start of the
CAIR program.
CAIR Benefits
In 2004, EPA officially designated 103 areas in the
eastern United States as 8-hour ozone "nonat
tainment areas". Based on 2003 to 2005 air moni
toring data, nearly 70 percent of them (68 areas
home to about 20 million people) now have air
quality that is better than the level of the stan
dard. In 2005, however, there were still 31 areas
(home to about 80 million people) that are not
meeting the 8-hour ozone standard. CAIR will
help bring the remaining 31 areas in this part of
the eastern United States into attainment with
the ozone standard.
EPA projects that in 2015, CAIR, the NBP, and
other programs in the CAIR region will reduce
power industry ozone season NOx emissions by
about 40 percent and annual NOx emissions by
Figure 23: Ozone and Particle Pollution in the Future
Ozone and Fine Particle Nonattainment Projected Nonattainment Areas in 2010 Projected Nonattainment Areas in 2015 Areas (April 2005) after Reductions from CAIR and after Reductions from CAIR and
Existing Clean Air Act Programs Existing Clean Air Act Programs
Nonattainment areas for both 8-hour ozone and fine particle pollution
Nonattainment areas for fine particle pollution only
Nonattainment areas for 8-hour ozone only
Note: Projections concerning future levels of air pollution in specific geographic locations were estimated using the best scientific models available. They are estimations, however, and should be characterized as such in any description. Actual results may vary significantly if any of the factors that influence air quality differ from the assumed values used in the projections shown here.
Source: EPA
Section 5 — Future NOx Reductions and Ozone Improvements: Transition to the Clean Air Interstate Rule 36
NOx Budget Trading Program: 2005 Program Compliance and Environmental Results
about 55 percent from 2005 levels. EPA also proj
ects that CAIR and existing federal and state pro
grams will reduce the number of 8-hour ozone
nonattainment areas in the East to six by 2015
(see Figure 23). The phase in of clean diesel
engines and low sulfur fuel requirements will fur
ther reduce ozone and fine particle pollution
throughout the United States. Additionally, states
are working to identify and implement local con
trols to move these remaining six areas into
attainment.
By 2015, the air quality improvements under
CAIR are projected to result in:
• $85 to $100 billion in annual health benefits,
annually preventing 17,000 premature deaths,
millions of lost work and school days, and tens
of thousands of non-fatal heart attacks and
hospital admissions.
• Nearly $2 billion in annual visibility benefits in
southeastern national parks, such as Great
Smoky and Shenandoah.
• Significant regional reductions in sulfur and
nitrogen deposition, reducing the number of
acidic lakes and streams in the eastern United
States.
For more information, visit <www.epa.gov/CAIR>.
Section 5 — Future NOx Reductions and Ozone Improvements: Transition to the Clean Air Interstate Rule 37
NOX Budget Trading Program: 2005 Program Compliance and Environmental Results
Online Resources General Information:
• Office of Air and Radiation: www.epa.gov/oar
– Office of Atmospheric Programs: www.epa.gov/air/oap.html
– Office of Air Quality Planning and Standards: www.epa.gov/oar/oaqps
• Mobile Sources: www.epa.gov/otaq
• Cap and Trade and Related Programs: www.epa.gov/airmarkt
• Air Trends: www.epa.gov/airtrends
NOx Control Programs:
• Acid Rain Program: www.epa.gov/airmarkets/arp
• Ozone Transport Commission (OTC) NOx Budget Program: www.epa.gov/airmarkets/otc
• NOx Budget Trading Program (NBP): www.epa.gov/airmarkets/fednox
• Clean Air Interstate Rule (CAIR): www.epa.gov/cair
Ozone Information:
• General Information: http://www.epa.gov/air/urbanair/ozone
• USDA Forest Service, Forest Health Monitoring Program http://fhm.fs.fed.us/pubs
Emission Data and Monitoring Information:
• National Emissions Inventory (NEI): www.epa.gov/ttn/chief/net
• Clean Air Markets Data and Maps: http://cfpub.epa.gov/gdm
Ozone Monitoring Networks and Data:
• Clean Air Status and Trends Network (CASTNET): www.epa.gov/castnet
• Air Quality Systems (AQS): www.epa.gov/ttn/airs/airsaqs
Other Emission and Air Quality Resources:
• General Information on EPA Air Quality Monitoring Networks: www.epa.gov/ttn/amtic
• Clean Air Mapping and Analysis Program (CMAP): www.epa.gov/airmarkets/cmap
• The Emissions and Generation Resources Integrated Database (eGRID):
www.epa.gov/cleanenergy/egrid
• AIRNow: www.epa.gov/airnow
Online Resources 38
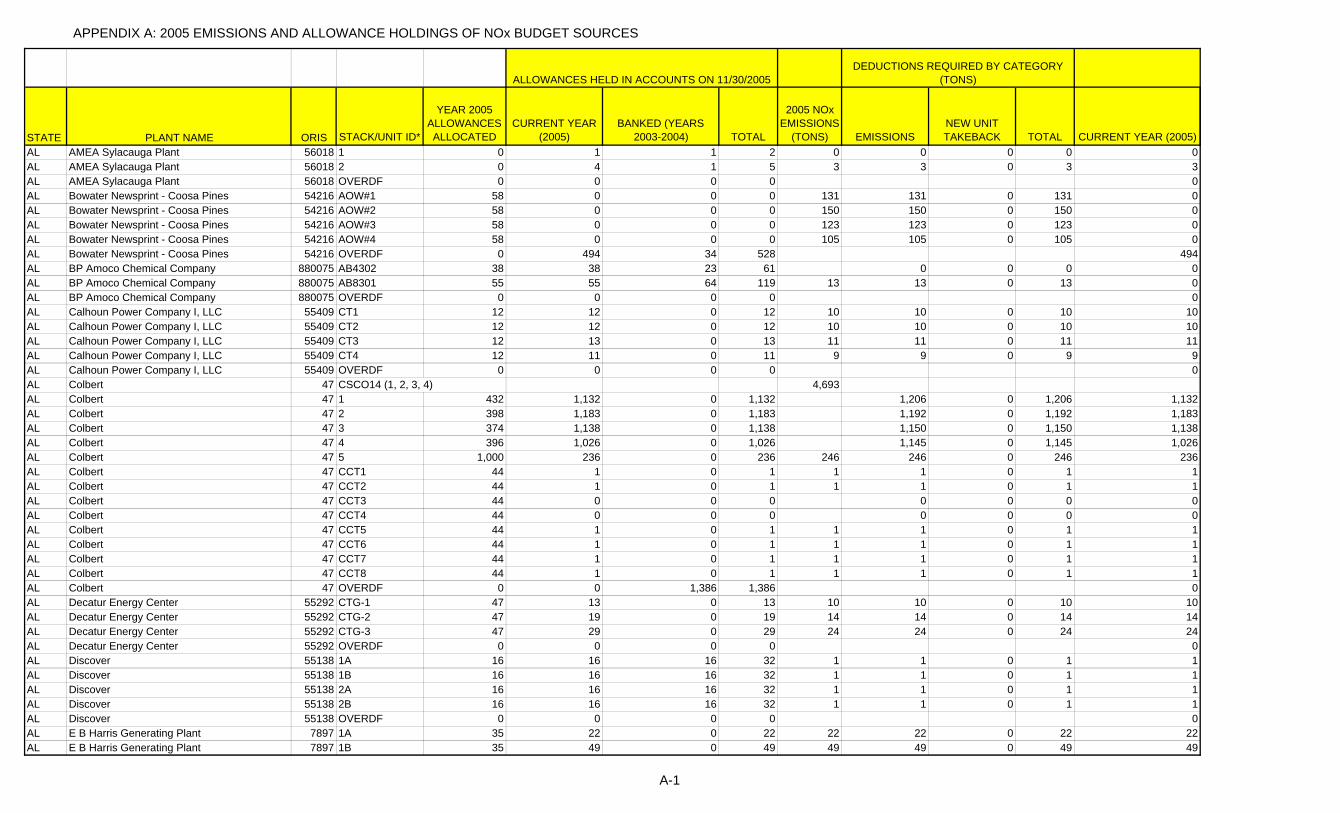
APPENDIX A: 2005 EMISSIONS AND ALLOWANCE HOLDINGS OF NOx BUDGET SOURCES
STATE PLANT NAME ORIS STACK/UNIT ID*
YEAR 2005 ALLOWANCES ALLOCATED
CURRENT YEAR (2005)
BANKED (YEARS 2003-2004) TOTAL
2005 NOx EMISSIONS
(TONS) EMISSIONSNEW UNIT TAKEBACK TOTAL CURRENT YEAR (2005)
AL AMEA Sylacauga Plant 56018 1 0 1 1 2 0 0 0 0 0AL AMEA Sylacauga Plant 56018 2 0 4 1 5 3 3 0 3 3AL AMEA Sylacauga Plant 56018 OVERDF 0 0 0 0 0AL Bowater Newsprint - Coosa Pines 54216 AOW#1 58 0 0 0 131 131 0 131 0AL Bowater Newsprint - Coosa Pines 54216 AOW#2 58 0 0 0 150 150 0 150 0AL Bowater Newsprint - Coosa Pines 54216 AOW#3 58 0 0 0 123 123 0 123 0AL Bowater Newsprint - Coosa Pines 54216 AOW#4 58 0 0 0 105 105 0 105 0AL Bowater Newsprint - Coosa Pines 54216 OVERDF 0 494 34 528 494AL BP Amoco Chemical Company 880075 AB4302 38 38 23 61 0 0 0 0AL BP Amoco Chemical Company 880075 AB8301 55 55 64 119 13 13 0 13 0AL BP Amoco Chemical Company 880075 OVERDF 0 0 0 0 0AL Calhoun Power Company I, LLC 55409 CT1 12 12 0 12 10 10 0 10 10AL Calhoun Power Company I, LLC 55409 CT2 12 12 0 12 10 10 0 10 10AL Calhoun Power Company I, LLC 55409 CT3 12 13 0 13 11 11 0 11 11AL Calhoun Power Company I, LLC 55409 CT4 12 11 0 11 9 9 0 9 9AL Calhoun Power Company I, LLC 55409 OVERDF 0 0 0 0 0AL Colbert 47 CSCO14 (1, 2, 3, 4) 4,693AL Colbert 47 1 432 1,132 0 1,132 1,206 0 1,206 1,132AL Colbert 47 2 398 1,183 0 1,183 1,192 0 1,192 1,183AL Colbert 47 3 374 1,138 0 1,138 1,150 0 1,150 1,138AL Colbert 47 4 396 1,026 0 1,026 1,145 0 1,145 1,026AL Colbert 47 5 1,000 236 0 236 246 246 0 246 236AL Colbert 47 CCT1 44 1 0 1 1 1 0 1 1AL Colbert 47 CCT2 44 1 0 1 1 1 0 1 1AL Colbert 47 CCT3 44 0 0 0 0 0 0 0AL Colbert 47 CCT4 44 0 0 0 0 0 0 0AL Colbert 47 CCT5 44 1 0 1 1 1 0 1 1AL Colbert 47 CCT6 44 1 0 1 1 1 0 1 1AL Colbert 47 CCT7 44 1 0 1 1 1 0 1 1AL Colbert 47 CCT8 44 1 0 1 1 1 0 1 1AL Colbert 47 OVERDF 0 0 1,386 1,386 0AL Decatur Energy Center 55292 CTG-1 47 13 0 13 10 10 0 10 10AL Decatur Energy Center 55292 CTG-2 47 19 0 19 14 14 0 14 14AL Decatur Energy Center 55292 CTG-3 47 29 0 29 24 24 0 24 24AL Decatur Energy Center 55292 OVERDF 0 0 0 0 0AL Discover 55138 1A 16 16 16 32 1 1 0 1 1AL Discover 55138 1B 16 16 16 32 1 1 0 1 1AL Discover 55138 2A 16 16 16 32 1 1 0 1 1AL Discover 55138 2B 16 16 16 32 1 1 0 1 1AL Discover 55138 OVERDF 0 0 0 0 0AL E B Harris Generating Plant 7897 1A 35 22 0 22 22 22 0 22 22AL E B Harris Generating Plant 7897 1B 35 49 0 49 49 49 0 49 49
ALLOWANCES HELD IN ACCOUNTS ON 11/30/2005DEDUCTIONS REQUIRED BY CATEGORY
(TONS)
A-1

APPENDIX A: 2005 EMISSIONS AND ALLOWANCE HOLDINGS OF NOx BUDGET SOURCES
STATE PLANT NAME ORIS STACK/UNIT ID*
YEAR 2005 ALLOWANCES ALLOCATED
CURRENT YEAR (2005)
BANKED (YEARS 2003-2004) TOTAL
2005 NOx EMISSIONS
(TONS) EMISSIONSNEW UNIT TAKEBACK TOTAL CURRENT YEAR (2005)
AL E B Harris Generating Plant 7897 2A 35 33 0 33 33 33 0 33 33AL E B Harris Generating Plant 7897 2B 35 23 0 23 23 23 0 23 23AL E B Harris Generating Plant 7897 OVERDF 0 13 10 23 0AL E C Gaston 26 CS0CAN (1, 2) 2,575AL E C Gaston 26 1 563 1,287 0 1,287 1,287 0 1,287 1,287AL E C Gaston 26 2 499 1,288 0 1,288 1,288 0 1,288 1,288AL E C Gaston 26 CS0CBN (3, 4) 3,161AL E C Gaston 26 3 635 1,333 4 1,337 1,334 0 1,334 1,333AL E C Gaston 26 4 588 1,827 0 1,827 1,827 0 1,827 1,827AL E C Gaston 26 5 1,951 5,104 0 5,104 5,104 5,104 0 5,104 5,104AL E C Gaston 26 OVERDF 0 20 1,300 1,320 0AL Gadsden 7 1 132 402 0 402 402 402 0 402 402AL Gadsden 7 2 122 351 0 351 351 351 0 351 351AL Gadsden 7 OVERDF 0 10 79 89 0AL Gorgas 8 CS0DAN (6, 7) 1,427AL Gorgas 8 6 281 732 0 732 732 0 732 732AL Gorgas 8 7 288 695 0 695 695 0 695 695AL Gorgas 8 8 422 882 0 882 882 882 0 882 882AL Gorgas 8 9 462 809 0 809 809 809 0 809 809AL Gorgas 8 10 1,563 853 0 853 853 853 0 853 853AL Gorgas 8 OVERDF 0 20 257 277 0AL Greene County 10 1 646 1,321 0 1,321 1,321 1,321 0 1,321 1,321AL Greene County 10 2 634 1,483 0 1,483 1,483 1,483 0 1,483 1,483AL Greene County 10 CT2 42 11 0 11 11 11 0 11 11AL Greene County 10 CT3 44 5 0 5 5 5 0 5 5AL Greene County 10 CT4 42 17 0 17 17 17 0 17 17AL Greene County 10 CT5 44 12 0 12 12 12 0 12 12AL Greene County 10 CT6 44 5 0 5 5 5 0 5 5AL Greene County 10 CT7 44 15 0 15 15 15 0 15 15AL Greene County 10 CT8 45 9 0 9 9 9 0 9 9AL Greene County 10 CT9 45 16 0 16 16 16 0 16 16AL Greene County 10 CT10 42 6 0 6 6 6 0 6 6AL Greene County 10 OVERDF 0 34 369 403 0AL International Paper-Courtland Mill 50245 GTX017 108 15 4 19 11 11 0 11 11AL International Paper-Courtland Mill 50245 PBX007 13 7 1 8 3 3 0 3 3AL International Paper-Courtland Mill 50245 OVERDF 0 0 0 0 0AL International Paper-Prattville Mill 52140 Z006 113 152 1 153 153 153 0 153 152AL International Paper-Prattville Mill 52140 Z008 148 416 5 421 420 420 0 420 416AL International Paper-Prattville Mill 52140 OVERDF 0 21 20 41 1AL International Paper-Riverdale Mill 54096 X026 90 86 3 89 74 74 0 74 74AL International Paper-Riverdale Mill 54096 Z007 42 10 3 13 6 6 0 6 6AL International Paper-Riverdale Mill 54096 OVERDF 0 0 0 0 0AL James H Miller Jr 6002 1 1,715 820 0 820 820 820 0 820 820AL James H Miller Jr 6002 2 1,860 849 0 849 849 849 0 849 849AL James H Miller Jr 6002 3 1,712 844 0 844 844 844 0 844 844
A-2

APPENDIX A: 2005 EMISSIONS AND ALLOWANCE HOLDINGS OF NOx BUDGET SOURCES
STATE PLANT NAME ORIS STACK/UNIT ID*
YEAR 2005 ALLOWANCES ALLOCATED
CURRENT YEAR (2005)
BANKED (YEARS 2003-2004) TOTAL
2005 NOx EMISSIONS
(TONS) EMISSIONSNEW UNIT TAKEBACK TOTAL CURRENT YEAR (2005)
AL James H Miller Jr 6002 4 1,888 798 0 798 798 798 0 798 798AL James H Miller Jr 6002 OVERDF 0 20 1,107 1,127 0AL MeadWestvaco Coated Board, Inc - Mahart 54802 X022 51 15 0 15 15 15 0 15 15AL MeadWestvaco Coated Board, Inc - Mahart 54802 Z008 50 64 0 64 63 63 0 63 63AL MeadWestvaco Coated Board, Inc - Mahart 54802 OVERDF 0 4 0 4 0AL Morgan Energy Center 55293 CT-1 47 20 0 20 16 16 0 16 16AL Morgan Energy Center 55293 CT-2 47 26 0 26 22 22 0 22 22AL Morgan Energy Center 55293 CT-3 47 25 0 25 20 20 0 20 20AL Morgan Energy Center 55293 OVERDF 0 0 0 0 0AL Plant H. Allen Franklin 7710 1A 33 33 2 35 24 24 0 24 24AL Plant H. Allen Franklin 7710 1B 33 33 3 36 26 26 0 26 26AL Plant H. Allen Franklin 7710 2A 33 33 3 36 27 27 0 27 27AL Plant H. Allen Franklin 7710 2B 33 33 3 36 34 34 0 34 33AL Plant H. Allen Franklin 7710 OVERDF 0 0 0 0 0AL Solutia (Decatur Plant) 880041 X015 132 0 0 0 226 226 0 226 0AL Solutia (Decatur Plant) 880041 X053 2 0 1 1 0 0 0 0AL Solutia (Decatur Plant) 880041 CS001 (Z004, Z005, Z006) 78AL Solutia (Decatur Plant) 880041 Z004 52 0 0 0 26 0 26 0AL Solutia (Decatur Plant) 880041 Z005 56 0 8 8 26 0 26 0AL Solutia (Decatur Plant) 880041 Z006 53 0 0 0 26 0 26 0AL Solutia (Decatur Plant) 880041 OVERDF 0 308 0 308 299AL Tenaska Central Alabama Gen Station 55440 CTGDB1 36 0 0 0 7 7 0 7 0AL Tenaska Central Alabama Gen Station 55440 CTGDB2 36 0 0 0 7 7 0 7 0AL Tenaska Central Alabama Gen Station 55440 CTGDB3 36 0 0 0 7 7 0 7 0AL Tenaska Central Alabama Gen Station 55440 OVERDF 0 0 84 84 0AL Tenaska Lindsay Hill 55271 CT1 40 0 0 0 9 9 0 9 0AL Tenaska Lindsay Hill 55271 CT2 40 0 0 0 11 11 0 11 0AL Tenaska Lindsay Hill 55271 CT3 40 0 0 0 11 11 0 11 0AL Tenaska Lindsay Hill 55271 OVERDF 0 9 88 97 9AL US Steel (Fairfield Works) 50730 206 6 0 1 1 0 0 0 0AL US Steel (Fairfield Works) 50730 208 30 2 1 3 2 2 0 2 2AL US Steel (Fairfield Works) 50730 209 162 63 8 71 63 63 0 63 63AL US Steel (Fairfield Works) 50730 210 161 16 5 21 15 15 0 15 15AL US Steel (Fairfield Works) 50730 OVERDF 0 1 5 6 0AL Widows Creek 50 CSWC16 (1, 2, 3, 4, 5, 6) 4,055AL Widows Creek 50 1 234 234 0 234 658 0 658 234AL Widows Creek 50 2 256 256 0 256 674 0 674 256AL Widows Creek 50 3 240 589 0 589 629 0 629 589AL Widows Creek 50 4 283 283 0 283 739 0 739 283AL Widows Creek 50 5 264 610 0 610 666 0 666 610AL Widows Creek 50 6 277 277 0 277 689 0 689 277AL Widows Creek 50 7 1,145 445 0 445 455 455 0 455 445AL Widows Creek 50 8 927 297 0 297 307 307 0 307 297AL Widows Creek 50 OVERDF 0 0 7,815 7,815 0CT AES Thames 10675 CS01 (UNITA, UNITB) 125
A-3

APPENDIX A: 2005 EMISSIONS AND ALLOWANCE HOLDINGS OF NOx BUDGET SOURCES
STATE PLANT NAME ORIS STACK/UNIT ID*
YEAR 2005 ALLOWANCES ALLOCATED
CURRENT YEAR (2005)
BANKED (YEARS 2003-2004) TOTAL
2005 NOx EMISSIONS
(TONS) EMISSIONSNEW UNIT TAKEBACK TOTAL CURRENT YEAR (2005)
CT AES Thames 10675 UNITA 98 75 18 93 75 0 75 68CT AES Thames 10675 UNITB 98 51 3 54 50 0 50 50CT AES Thames 10675 OVERDF 0 0 0 0 0CT Algonquin Power Windsor Locks, LLC 10567 GT1 118 118 11 129 107 107 0 107 107CT Branford 540 10 0 3 1 4 2 2 0 2 2CT Bridgeport Energy 55042 BE1 48 44 0 44 43 43 0 43 43CT Bridgeport Energy 55042 BE2 48 41 0 41 40 40 0 40 40CT Bridgeport Energy 55042 OVERDF 0 0 0 0 0CT Bridgeport Harbor Station 568 BHB1 0 0 0 0 0 0 0 0CT Bridgeport Harbor Station 568 BHB2 18 25 4 29 24 24 0 24 24CT Bridgeport Harbor Station 568 BHB3 2,568 869 0 869 863 863 0 863 863CT Bridgeport Harbor Station 568 BHB4 1 1 1 2 1 1 0 1 1CT Bridgeport Harbor Station 568 OVERDF 0 0 20 20 0CT Capitol District Energy Center 50498 GT 4 4 40 44 1 1 0 1 1CT Cos Cob 542 10 1 1 0 1 7 7 0 7 1CT Cos Cob 542 11 1 1 0 1 6 6 0 6 1CT Cos Cob 542 12 1 1 0 1 7 7 0 7 1CT Cos Cob 542 OVERDF 0 19 0 19 17CT Devon 544 CS0001 (7, 8) 0CT Devon 544 7 60 3 0 3 0 0 0 0CT Devon 544 8 28 1 0 1 0 0 0 0CT Devon 544 10 0 0 0 0 0 0 0 0CT Devon 544 11 2 0 0 0 1 1 0 1 0CT Devon 544 12 1 0 0 0 1 1 0 1 0CT Devon 544 13 2 0 0 0 1 1 0 1 0CT Devon 544 14 2 0 0 0 2 2 0 2 0CT Devon 544 OVERDF 0 7 17 24 5CT English Station 569 EB13 0 0 0 0 0 0 0 0CT English Station 569 EB14 0 0 0 0 0 0 0 0CT English Station 569 OVERDF 0 0 0 0 0CT Franklin Drive 561 10 1 2 0 2 1 1 0 1 1CT Lake Road Generating Company 55149 LRG1 12 0 0 0 1 1 0 1 0CT Lake Road Generating Company 55149 LRG2 11 0 0 0 18 18 0 18 0CT Lake Road Generating Company 55149 LRG3 12 0 0 0 16 16 0 16 0CT Lake Road Generating Company 55149 OVERDF 0 35 15 50 35CT Middletown 562 2 159 7 0 7 120 120 0 120 7CT Middletown 562 3 188 9 0 9 422 422 0 422 9CT Middletown 562 4 24 1 0 1 144 144 0 144 1CT Middletown 562 10 0 0 0 0 2 2 0 2 0CT Middletown 562 OVERDF 0 514 423 937 514CT Milford Power Company LLC 55126 CT01 21 21 0 21 20 20 0 20 20CT Milford Power Company LLC 55126 CT02 24 24 0 24 19 19 0 19 19CT Milford Power Company LLC 55126 OVERDF 0 23 0 23 0CT Montville 546 5 16 1 0 1 69 69 0 69 1CT Montville 546 6 86 4 0 4 228 228 0 228 4
A-4
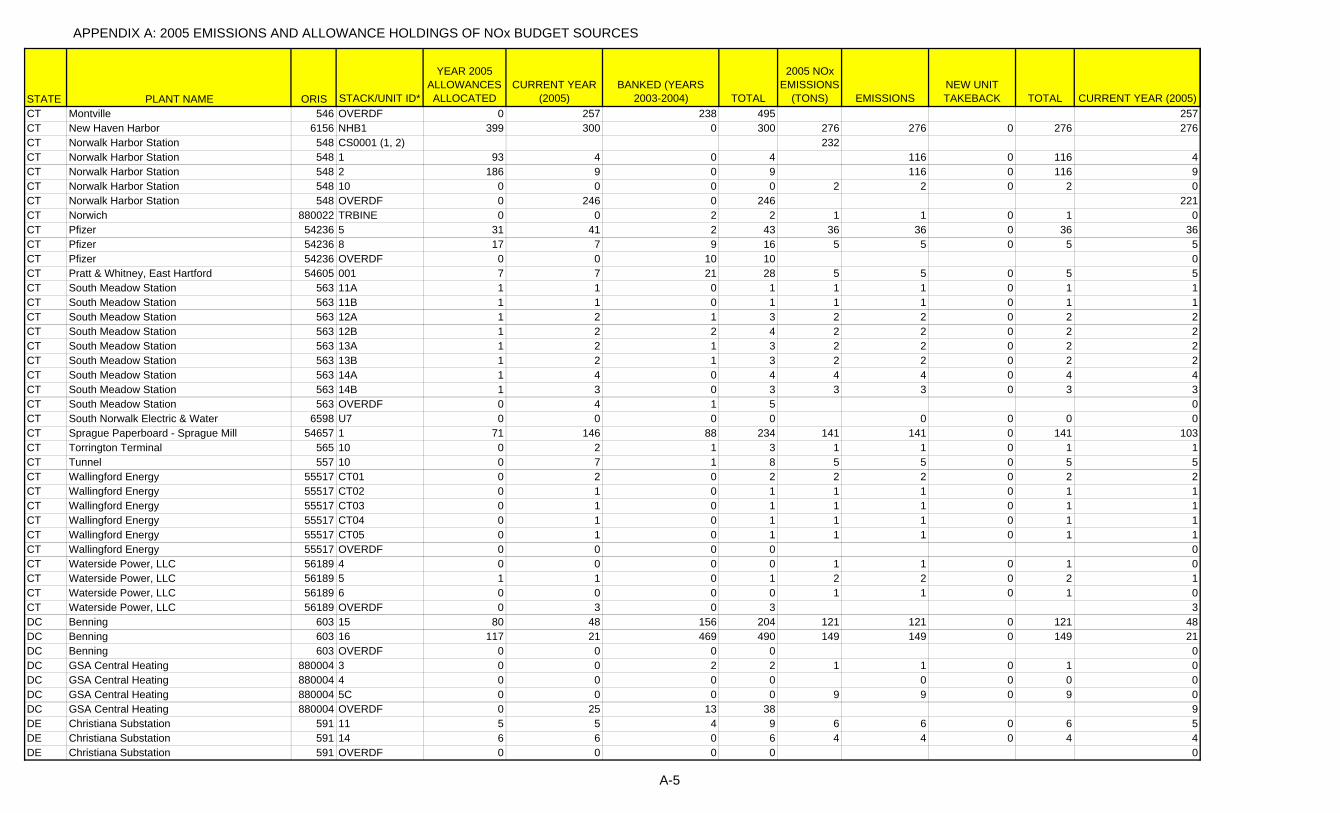
APPENDIX A: 2005 EMISSIONS AND ALLOWANCE HOLDINGS OF NOx BUDGET SOURCES
STATE PLANT NAME ORIS STACK/UNIT ID*
YEAR 2005 ALLOWANCES ALLOCATED
CURRENT YEAR (2005)
BANKED (YEARS 2003-2004) TOTAL
2005 NOx EMISSIONS
(TONS) EMISSIONSNEW UNIT TAKEBACK TOTAL CURRENT YEAR (2005)
CT Montville 546 OVERDF 0 257 238 495 257CT New Haven Harbor 6156 NHB1 399 300 0 300 276 276 0 276 276CT Norwalk Harbor Station 548 CS0001 (1, 2) 232CT Norwalk Harbor Station 548 1 93 4 0 4 116 0 116 4CT Norwalk Harbor Station 548 2 186 9 0 9 116 0 116 9CT Norwalk Harbor Station 548 10 0 0 0 0 2 2 0 2 0CT Norwalk Harbor Station 548 OVERDF 0 246 0 246 221CT Norwich 880022 TRBINE 0 0 2 2 1 1 0 1 0CT Pfizer 54236 5 31 41 2 43 36 36 0 36 36CT Pfizer 54236 8 17 7 9 16 5 5 0 5 5CT Pfizer 54236 OVERDF 0 0 10 10 0CT Pratt & Whitney, East Hartford 54605 001 7 7 21 28 5 5 0 5 5CT South Meadow Station 563 11A 1 1 0 1 1 1 0 1 1CT South Meadow Station 563 11B 1 1 0 1 1 1 0 1 1CT South Meadow Station 563 12A 1 2 1 3 2 2 0 2 2CT South Meadow Station 563 12B 1 2 2 4 2 2 0 2 2CT South Meadow Station 563 13A 1 2 1 3 2 2 0 2 2CT South Meadow Station 563 13B 1 2 1 3 2 2 0 2 2CT South Meadow Station 563 14A 1 4 0 4 4 4 0 4 4CT South Meadow Station 563 14B 1 3 0 3 3 3 0 3 3CT South Meadow Station 563 OVERDF 0 4 1 5 0CT South Norwalk Electric & Water 6598 U7 0 0 0 0 0 0 0 0CT Sprague Paperboard - Sprague Mill 54657 1 71 146 88 234 141 141 0 141 103CT Torrington Terminal 565 10 0 2 1 3 1 1 0 1 1CT Tunnel 557 10 0 7 1 8 5 5 0 5 5CT Wallingford Energy 55517 CT01 0 2 0 2 2 2 0 2 2CT Wallingford Energy 55517 CT02 0 1 0 1 1 1 0 1 1CT Wallingford Energy 55517 CT03 0 1 0 1 1 1 0 1 1CT Wallingford Energy 55517 CT04 0 1 0 1 1 1 0 1 1CT Wallingford Energy 55517 CT05 0 1 0 1 1 1 0 1 1CT Wallingford Energy 55517 OVERDF 0 0 0 0 0CT Waterside Power, LLC 56189 4 0 0 0 0 1 1 0 1 0CT Waterside Power, LLC 56189 5 1 1 0 1 2 2 0 2 1CT Waterside Power, LLC 56189 6 0 0 0 0 1 1 0 1 0CT Waterside Power, LLC 56189 OVERDF 0 3 0 3 3DC Benning 603 15 80 48 156 204 121 121 0 121 48DC Benning 603 16 117 21 469 490 149 149 0 149 21DC Benning 603 OVERDF 0 0 0 0 0DC GSA Central Heating 880004 3 0 0 2 2 1 1 0 1 0DC GSA Central Heating 880004 4 0 0 0 0 0 0 0 0DC GSA Central Heating 880004 5C 0 0 0 0 9 9 0 9 0DC GSA Central Heating 880004 OVERDF 0 25 13 38 9DE Christiana Substation 591 11 5 5 4 9 6 6 0 6 5DE Christiana Substation 591 14 6 6 0 6 4 4 0 4 4DE Christiana Substation 591 OVERDF 0 0 0 0 0
A-5
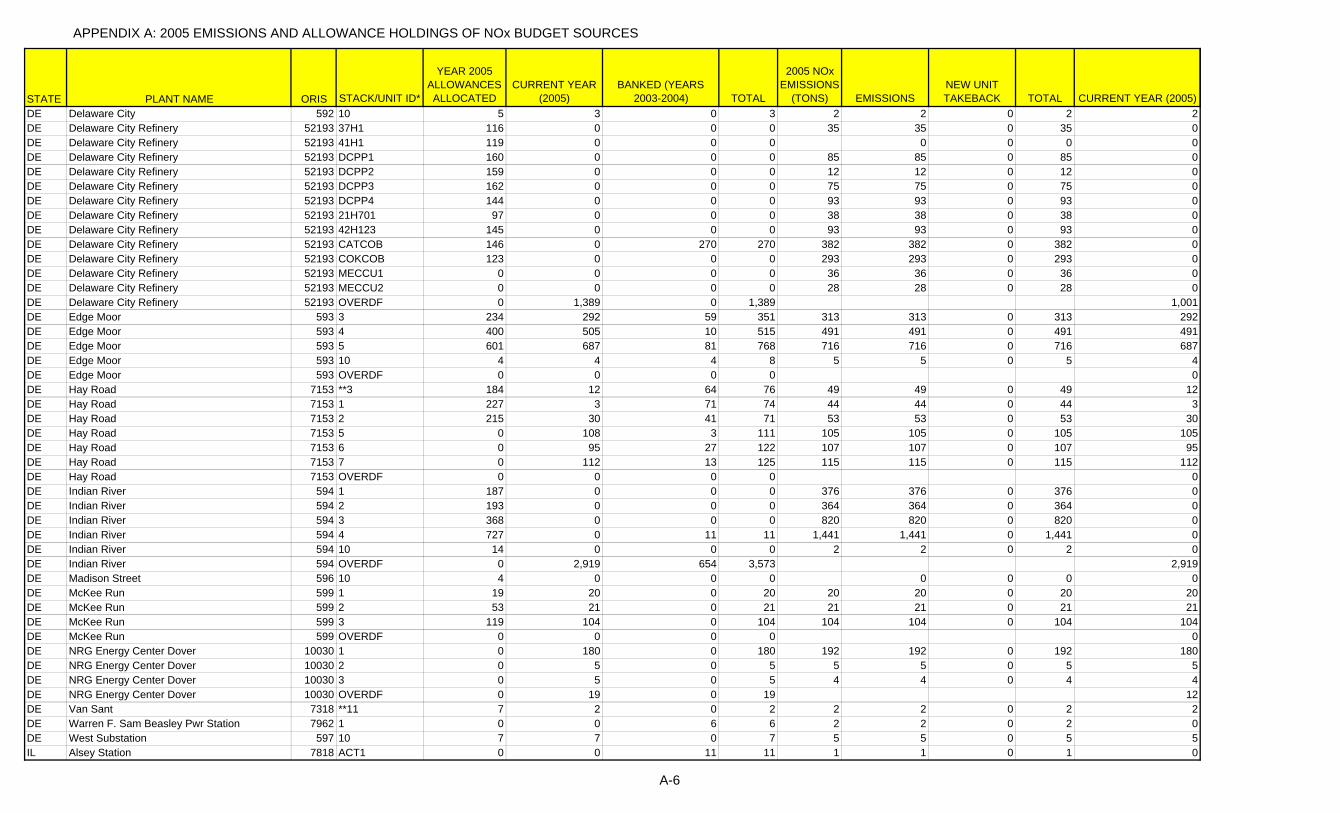
APPENDIX A: 2005 EMISSIONS AND ALLOWANCE HOLDINGS OF NOx BUDGET SOURCES
STATE PLANT NAME ORIS STACK/UNIT ID*
YEAR 2005 ALLOWANCES ALLOCATED
CURRENT YEAR (2005)
BANKED (YEARS 2003-2004) TOTAL
2005 NOx EMISSIONS
(TONS) EMISSIONSNEW UNIT TAKEBACK TOTAL CURRENT YEAR (2005)
DE Delaware City 592 10 5 3 0 3 2 2 0 2 2DE Delaware City Refinery 52193 37H1 116 0 0 0 35 35 0 35 0DE Delaware City Refinery 52193 41H1 119 0 0 0 0 0 0 0DE Delaware City Refinery 52193 DCPP1 160 0 0 0 85 85 0 85 0DE Delaware City Refinery 52193 DCPP2 159 0 0 0 12 12 0 12 0DE Delaware City Refinery 52193 DCPP3 162 0 0 0 75 75 0 75 0DE Delaware City Refinery 52193 DCPP4 144 0 0 0 93 93 0 93 0DE Delaware City Refinery 52193 21H701 97 0 0 0 38 38 0 38 0DE Delaware City Refinery 52193 42H123 145 0 0 0 93 93 0 93 0DE Delaware City Refinery 52193 CATCOB 146 0 270 270 382 382 0 382 0DE Delaware City Refinery 52193 COKCOB 123 0 0 0 293 293 0 293 0DE Delaware City Refinery 52193 MECCU1 0 0 0 0 36 36 0 36 0DE Delaware City Refinery 52193 MECCU2 0 0 0 0 28 28 0 28 0DE Delaware City Refinery 52193 OVERDF 0 1,389 0 1,389 1,001DE Edge Moor 593 3 234 292 59 351 313 313 0 313 292DE Edge Moor 593 4 400 505 10 515 491 491 0 491 491DE Edge Moor 593 5 601 687 81 768 716 716 0 716 687DE Edge Moor 593 10 4 4 4 8 5 5 0 5 4DE Edge Moor 593 OVERDF 0 0 0 0 0DE Hay Road 7153 **3 184 12 64 76 49 49 0 49 12DE Hay Road 7153 1 227 3 71 74 44 44 0 44 3DE Hay Road 7153 2 215 30 41 71 53 53 0 53 30DE Hay Road 7153 5 0 108 3 111 105 105 0 105 105DE Hay Road 7153 6 0 95 27 122 107 107 0 107 95DE Hay Road 7153 7 0 112 13 125 115 115 0 115 112DE Hay Road 7153 OVERDF 0 0 0 0 0DE Indian River 594 1 187 0 0 0 376 376 0 376 0DE Indian River 594 2 193 0 0 0 364 364 0 364 0DE Indian River 594 3 368 0 0 0 820 820 0 820 0DE Indian River 594 4 727 0 11 11 1,441 1,441 0 1,441 0DE Indian River 594 10 14 0 0 0 2 2 0 2 0DE Indian River 594 OVERDF 0 2,919 654 3,573 2,919DE Madison Street 596 10 4 0 0 0 0 0 0 0DE McKee Run 599 1 19 20 0 20 20 20 0 20 20DE McKee Run 599 2 53 21 0 21 21 21 0 21 21DE McKee Run 599 3 119 104 0 104 104 104 0 104 104DE McKee Run 599 OVERDF 0 0 0 0 0DE NRG Energy Center Dover 10030 1 0 180 0 180 192 192 0 192 180DE NRG Energy Center Dover 10030 2 0 5 0 5 5 5 0 5 5DE NRG Energy Center Dover 10030 3 0 5 0 5 4 4 0 4 4DE NRG Energy Center Dover 10030 OVERDF 0 19 0 19 12DE Van Sant 7318 **11 7 2 0 2 2 2 0 2 2DE Warren F. Sam Beasley Pwr Station 7962 1 0 0 6 6 2 2 0 2 0DE West Substation 597 10 7 7 0 7 5 5 0 5 5IL Alsey Station 7818 ACT1 0 0 11 11 1 1 0 1 0
A-6
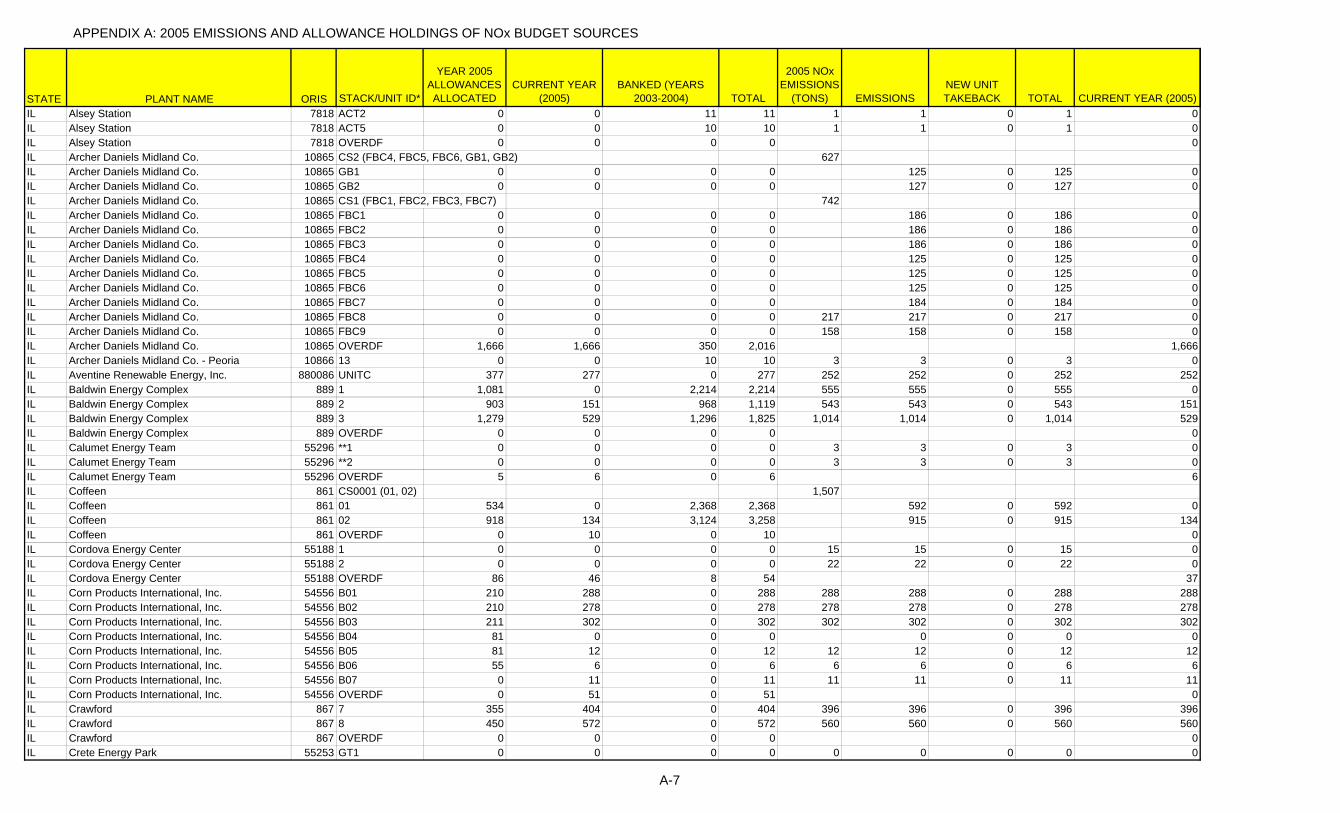
APPENDIX A: 2005 EMISSIONS AND ALLOWANCE HOLDINGS OF NOx BUDGET SOURCES
STATE PLANT NAME ORIS STACK/UNIT ID*
YEAR 2005 ALLOWANCES ALLOCATED
CURRENT YEAR (2005)
BANKED (YEARS 2003-2004) TOTAL
2005 NOx EMISSIONS
(TONS) EMISSIONSNEW UNIT TAKEBACK TOTAL CURRENT YEAR (2005)
IL Alsey Station 7818 ACT2 0 0 11 11 1 1 0 1 0IL Alsey Station 7818 ACT5 0 0 10 10 1 1 0 1 0IL Alsey Station 7818 OVERDF 0 0 0 0 0IL Archer Daniels Midland Co. 10865 CS2 (FBC4, FBC5, FBC6, GB1, GB2) 627IL Archer Daniels Midland Co. 10865 GB1 0 0 0 0 125 0 125 0IL Archer Daniels Midland Co. 10865 GB2 0 0 0 0 127 0 127 0IL Archer Daniels Midland Co. 10865 CS1 (FBC1, FBC2, FBC3, FBC7) 742IL Archer Daniels Midland Co. 10865 FBC1 0 0 0 0 186 0 186 0IL Archer Daniels Midland Co. 10865 FBC2 0 0 0 0 186 0 186 0IL Archer Daniels Midland Co. 10865 FBC3 0 0 0 0 186 0 186 0IL Archer Daniels Midland Co. 10865 FBC4 0 0 0 0 125 0 125 0IL Archer Daniels Midland Co. 10865 FBC5 0 0 0 0 125 0 125 0IL Archer Daniels Midland Co. 10865 FBC6 0 0 0 0 125 0 125 0IL Archer Daniels Midland Co. 10865 FBC7 0 0 0 0 184 0 184 0IL Archer Daniels Midland Co. 10865 FBC8 0 0 0 0 217 217 0 217 0IL Archer Daniels Midland Co. 10865 FBC9 0 0 0 0 158 158 0 158 0IL Archer Daniels Midland Co. 10865 OVERDF 1,666 1,666 350 2,016 1,666IL Archer Daniels Midland Co. - Peoria 10866 13 0 0 10 10 3 3 0 3 0IL Aventine Renewable Energy, Inc. 880086 UNITC 377 277 0 277 252 252 0 252 252IL Baldwin Energy Complex 889 1 1,081 0 2,214 2,214 555 555 0 555 0IL Baldwin Energy Complex 889 2 903 151 968 1,119 543 543 0 543 151IL Baldwin Energy Complex 889 3 1,279 529 1,296 1,825 1,014 1,014 0 1,014 529IL Baldwin Energy Complex 889 OVERDF 0 0 0 0 0IL Calumet Energy Team 55296 **1 0 0 0 0 3 3 0 3 0IL Calumet Energy Team 55296 **2 0 0 0 0 3 3 0 3 0IL Calumet Energy Team 55296 OVERDF 5 6 0 6 6IL Coffeen 861 CS0001 (01, 02) 1,507IL Coffeen 861 01 534 0 2,368 2,368 592 0 592 0IL Coffeen 861 02 918 134 3,124 3,258 915 0 915 134IL Coffeen 861 OVERDF 0 10 0 10 0IL Cordova Energy Center 55188 1 0 0 0 0 15 15 0 15 0IL Cordova Energy Center 55188 2 0 0 0 0 22 22 0 22 0IL Cordova Energy Center 55188 OVERDF 86 46 8 54 37IL Corn Products International, Inc. 54556 B01 210 288 0 288 288 288 0 288 288IL Corn Products International, Inc. 54556 B02 210 278 0 278 278 278 0 278 278IL Corn Products International, Inc. 54556 B03 211 302 0 302 302 302 0 302 302IL Corn Products International, Inc. 54556 B04 81 0 0 0 0 0 0 0IL Corn Products International, Inc. 54556 B05 81 12 0 12 12 12 0 12 12IL Corn Products International, Inc. 54556 B06 55 6 0 6 6 6 0 6 6IL Corn Products International, Inc. 54556 B07 0 11 0 11 11 11 0 11 11IL Corn Products International, Inc. 54556 OVERDF 0 51 0 51 0IL Crawford 867 7 355 404 0 404 396 396 0 396 396IL Crawford 867 8 450 572 0 572 560 560 0 560 560IL Crawford 867 OVERDF 0 0 0 0 0IL Crete Energy Park 55253 GT1 0 0 0 0 0 0 0 0 0
A-7

APPENDIX A: 2005 EMISSIONS AND ALLOWANCE HOLDINGS OF NOx BUDGET SOURCES
STATE PLANT NAME ORIS STACK/UNIT ID*
YEAR 2005 ALLOWANCES ALLOCATED
CURRENT YEAR (2005)
BANKED (YEARS 2003-2004) TOTAL
2005 NOx EMISSIONS
(TONS) EMISSIONSNEW UNIT TAKEBACK TOTAL CURRENT YEAR (2005)
IL Crete Energy Park 55253 GT2 0 0 0 0 0 0 0 0 0IL Crete Energy Park 55253 GT3 0 0 0 0 0 0 0 0 0IL Crete Energy Park 55253 GT4 0 0 0 0 0 0 0 0 0IL Crete Energy Park 55253 OVERDF 5 5 5 10 0IL Dallman 963 CS3132 (31, 32) 294IL Dallman 963 31 137 147 0 147 147 0 147 147IL Dallman 963 32 196 147 0 147 147 0 147 147IL Dallman 963 33 460 245 0 245 245 245 0 245 245IL Dallman 963 OVERDF 0 0 10 10 0IL Duck Creek 6016 1 887 389 21 410 388 388 0 388 383IL E D Edwards 856 CS0001 (1, 2) 1,593IL E D Edwards 856 1 244 554 0 554 554 0 554 554IL E D Edwards 856 2 358 1,028 44 1,072 1,039 0 1,039 1,028IL E D Edwards 856 3 636 335 0 335 335 335 0 335 335IL E D Edwards 856 OVERDF 0 0 44 44 0IL Elgin Energy Center 55438 CT01 0 3 0 3 3 3 0 3 3IL Elgin Energy Center 55438 CT02 0 2 0 2 2 2 0 2 2IL Elgin Energy Center 55438 CT03 0 3 0 3 3 3 0 3 3IL Elgin Energy Center 55438 CT04 0 2 0 2 2 2 0 2 2IL Elgin Energy Center 55438 OVERDF 13 2 0 2 0IL Elwood Energy Facility 55199 1 0 14 0 14 14 14 0 14 14IL Elwood Energy Facility 55199 2 0 23 0 23 25 25 0 25 23IL Elwood Energy Facility 55199 3 0 13 0 13 14 14 0 14 13IL Elwood Energy Facility 55199 4 0 16 0 16 30 30 0 30 16IL Elwood Energy Facility 55199 5 0 4 0 4 3 3 0 3 3IL Elwood Energy Facility 55199 6 0 4 0 4 3 3 0 3 3IL Elwood Energy Facility 55199 7 0 4 0 4 4 4 0 4 4IL Elwood Energy Facility 55199 8 0 4 0 4 4 4 0 4 4IL Elwood Energy Facility 55199 9 0 3 0 3 3 3 0 3 3IL Elwood Energy Facility 55199 OVERDF 111 26 0 26 17IL Exxonmobil Oil Corporation 50627 20B1 0 0 0 0 46 46 0 46 0IL Exxonmobil Oil Corporation 50627 55B100 0 0 0 0 29 29 0 29 0IL Exxonmobil Oil Corporation 50627 OVERDF 186 186 126 312 75IL Factory Gas Turbine 8016 2 88 1 2 3 0 0 0 0 0IL Fisk 886 19 508 577 0 577 566 566 0 566 566IL Fisk 886 311 9 0 8 8 2 2 0 2 0IL Fisk 886 312 9 0 8 8 2 2 0 2 0IL Fisk 886 321 9 0 20 20 5 5 0 5 0IL Fisk 886 322 9 0 8 8 2 2 0 2 0IL Fisk 886 331 8 0 4 4 1 1 0 1 0IL Fisk 886 332 8 0 4 4 1 1 0 1 0IL Fisk 886 341 8 0 0 0 0 0 0 0IL Fisk 886 342 8 0 4 4 0 0 0 0IL Fisk 886 OVERDF 0 0 0 0 0IL Flint Hills Resources, LP - Joliet Plant 880089 CB706 0 6 1 7 6 6 0 6 6
A-8
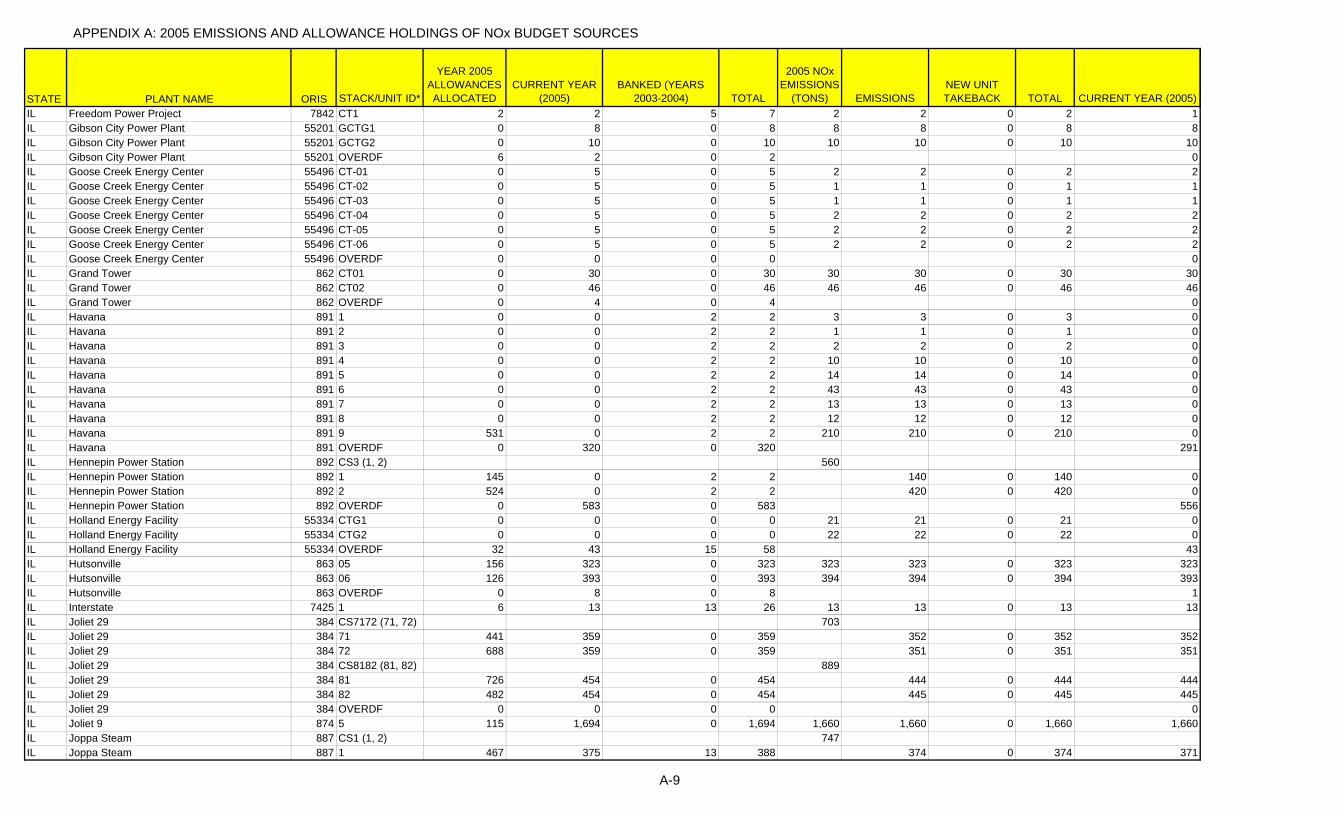
APPENDIX A: 2005 EMISSIONS AND ALLOWANCE HOLDINGS OF NOx BUDGET SOURCES
STATE PLANT NAME ORIS STACK/UNIT ID*
YEAR 2005 ALLOWANCES ALLOCATED
CURRENT YEAR (2005)
BANKED (YEARS 2003-2004) TOTAL
2005 NOx EMISSIONS
(TONS) EMISSIONSNEW UNIT TAKEBACK TOTAL CURRENT YEAR (2005)
IL Freedom Power Project 7842 CT1 2 2 5 7 2 2 0 2 1IL Gibson City Power Plant 55201 GCTG1 0 8 0 8 8 8 0 8 8IL Gibson City Power Plant 55201 GCTG2 0 10 0 10 10 10 0 10 10IL Gibson City Power Plant 55201 OVERDF 6 2 0 2 0IL Goose Creek Energy Center 55496 CT-01 0 5 0 5 2 2 0 2 2IL Goose Creek Energy Center 55496 CT-02 0 5 0 5 1 1 0 1 1IL Goose Creek Energy Center 55496 CT-03 0 5 0 5 1 1 0 1 1IL Goose Creek Energy Center 55496 CT-04 0 5 0 5 2 2 0 2 2IL Goose Creek Energy Center 55496 CT-05 0 5 0 5 2 2 0 2 2IL Goose Creek Energy Center 55496 CT-06 0 5 0 5 2 2 0 2 2IL Goose Creek Energy Center 55496 OVERDF 0 0 0 0 0IL Grand Tower 862 CT01 0 30 0 30 30 30 0 30 30IL Grand Tower 862 CT02 0 46 0 46 46 46 0 46 46IL Grand Tower 862 OVERDF 0 4 0 4 0IL Havana 891 1 0 0 2 2 3 3 0 3 0IL Havana 891 2 0 0 2 2 1 1 0 1 0IL Havana 891 3 0 0 2 2 2 2 0 2 0IL Havana 891 4 0 0 2 2 10 10 0 10 0IL Havana 891 5 0 0 2 2 14 14 0 14 0IL Havana 891 6 0 0 2 2 43 43 0 43 0IL Havana 891 7 0 0 2 2 13 13 0 13 0IL Havana 891 8 0 0 2 2 12 12 0 12 0IL Havana 891 9 531 0 2 2 210 210 0 210 0IL Havana 891 OVERDF 0 320 0 320 291IL Hennepin Power Station 892 CS3 (1, 2) 560IL Hennepin Power Station 892 1 145 0 2 2 140 0 140 0IL Hennepin Power Station 892 2 524 0 2 2 420 0 420 0IL Hennepin Power Station 892 OVERDF 0 583 0 583 556IL Holland Energy Facility 55334 CTG1 0 0 0 0 21 21 0 21 0IL Holland Energy Facility 55334 CTG2 0 0 0 0 22 22 0 22 0IL Holland Energy Facility 55334 OVERDF 32 43 15 58 43IL Hutsonville 863 05 156 323 0 323 323 323 0 323 323IL Hutsonville 863 06 126 393 0 393 394 394 0 394 393IL Hutsonville 863 OVERDF 0 8 0 8 1IL Interstate 7425 1 6 13 13 26 13 13 0 13 13IL Joliet 29 384 CS7172 (71, 72) 703IL Joliet 29 384 71 441 359 0 359 352 0 352 352IL Joliet 29 384 72 688 359 0 359 351 0 351 351IL Joliet 29 384 CS8182 (81, 82) 889IL Joliet 29 384 81 726 454 0 454 444 0 444 444IL Joliet 29 384 82 482 454 0 454 445 0 445 445IL Joliet 29 384 OVERDF 0 0 0 0 0IL Joliet 9 874 5 115 1,694 0 1,694 1,660 1,660 0 1,660 1,660IL Joppa Steam 887 CS1 (1, 2) 747IL Joppa Steam 887 1 467 375 13 388 374 0 374 371
A-9
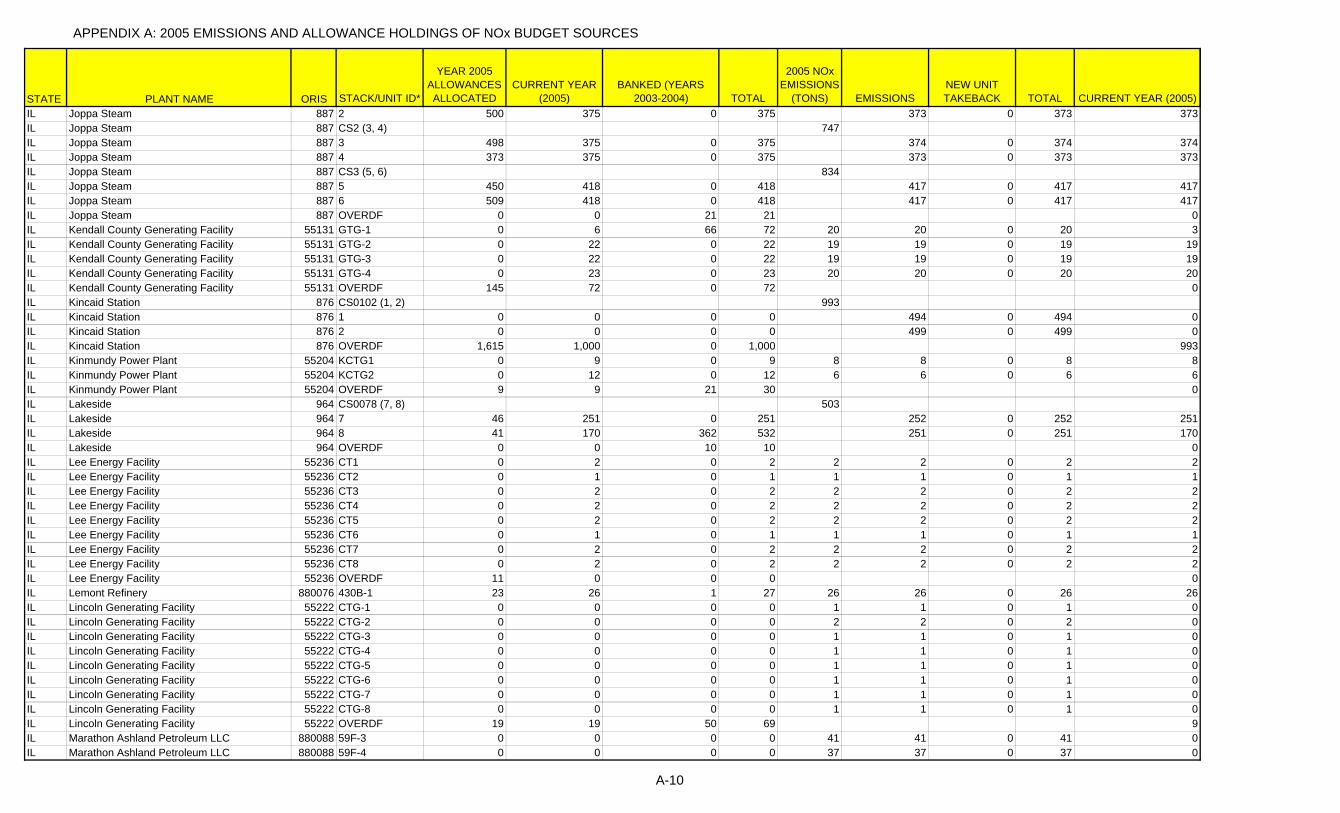
APPENDIX A: 2005 EMISSIONS AND ALLOWANCE HOLDINGS OF NOx BUDGET SOURCES
STATE PLANT NAME ORIS STACK/UNIT ID*
YEAR 2005 ALLOWANCES ALLOCATED
CURRENT YEAR (2005)
BANKED (YEARS 2003-2004) TOTAL
2005 NOx EMISSIONS
(TONS) EMISSIONSNEW UNIT TAKEBACK TOTAL CURRENT YEAR (2005)
IL Joppa Steam 887 2 500 375 0 375 373 0 373 373IL Joppa Steam 887 CS2 (3, 4) 747IL Joppa Steam 887 3 498 375 0 375 374 0 374 374IL Joppa Steam 887 4 373 375 0 375 373 0 373 373IL Joppa Steam 887 CS3 (5, 6) 834IL Joppa Steam 887 5 450 418 0 418 417 0 417 417IL Joppa Steam 887 6 509 418 0 418 417 0 417 417IL Joppa Steam 887 OVERDF 0 0 21 21 0IL Kendall County Generating Facility 55131 GTG-1 0 6 66 72 20 20 0 20 3IL Kendall County Generating Facility 55131 GTG-2 0 22 0 22 19 19 0 19 19IL Kendall County Generating Facility 55131 GTG-3 0 22 0 22 19 19 0 19 19IL Kendall County Generating Facility 55131 GTG-4 0 23 0 23 20 20 0 20 20IL Kendall County Generating Facility 55131 OVERDF 145 72 0 72 0IL Kincaid Station 876 CS0102 (1, 2) 993IL Kincaid Station 876 1 0 0 0 0 494 0 494 0IL Kincaid Station 876 2 0 0 0 0 499 0 499 0IL Kincaid Station 876 OVERDF 1,615 1,000 0 1,000 993IL Kinmundy Power Plant 55204 KCTG1 0 9 0 9 8 8 0 8 8IL Kinmundy Power Plant 55204 KCTG2 0 12 0 12 6 6 0 6 6IL Kinmundy Power Plant 55204 OVERDF 9 9 21 30 0IL Lakeside 964 CS0078 (7, 8) 503IL Lakeside 964 7 46 251 0 251 252 0 252 251IL Lakeside 964 8 41 170 362 532 251 0 251 170IL Lakeside 964 OVERDF 0 0 10 10 0IL Lee Energy Facility 55236 CT1 0 2 0 2 2 2 0 2 2IL Lee Energy Facility 55236 CT2 0 1 0 1 1 1 0 1 1IL Lee Energy Facility 55236 CT3 0 2 0 2 2 2 0 2 2IL Lee Energy Facility 55236 CT4 0 2 0 2 2 2 0 2 2IL Lee Energy Facility 55236 CT5 0 2 0 2 2 2 0 2 2IL Lee Energy Facility 55236 CT6 0 1 0 1 1 1 0 1 1IL Lee Energy Facility 55236 CT7 0 2 0 2 2 2 0 2 2IL Lee Energy Facility 55236 CT8 0 2 0 2 2 2 0 2 2IL Lee Energy Facility 55236 OVERDF 11 0 0 0 0IL Lemont Refinery 880076 430B-1 23 26 1 27 26 26 0 26 26IL Lincoln Generating Facility 55222 CTG-1 0 0 0 0 1 1 0 1 0IL Lincoln Generating Facility 55222 CTG-2 0 0 0 0 2 2 0 2 0IL Lincoln Generating Facility 55222 CTG-3 0 0 0 0 1 1 0 1 0IL Lincoln Generating Facility 55222 CTG-4 0 0 0 0 1 1 0 1 0IL Lincoln Generating Facility 55222 CTG-5 0 0 0 0 1 1 0 1 0IL Lincoln Generating Facility 55222 CTG-6 0 0 0 0 1 1 0 1 0IL Lincoln Generating Facility 55222 CTG-7 0 0 0 0 1 1 0 1 0IL Lincoln Generating Facility 55222 CTG-8 0 0 0 0 1 1 0 1 0IL Lincoln Generating Facility 55222 OVERDF 19 19 50 69 9IL Marathon Ashland Petroleum LLC 880088 59F-3 0 0 0 0 41 41 0 41 0IL Marathon Ashland Petroleum LLC 880088 59F-4 0 0 0 0 37 37 0 37 0
A-10
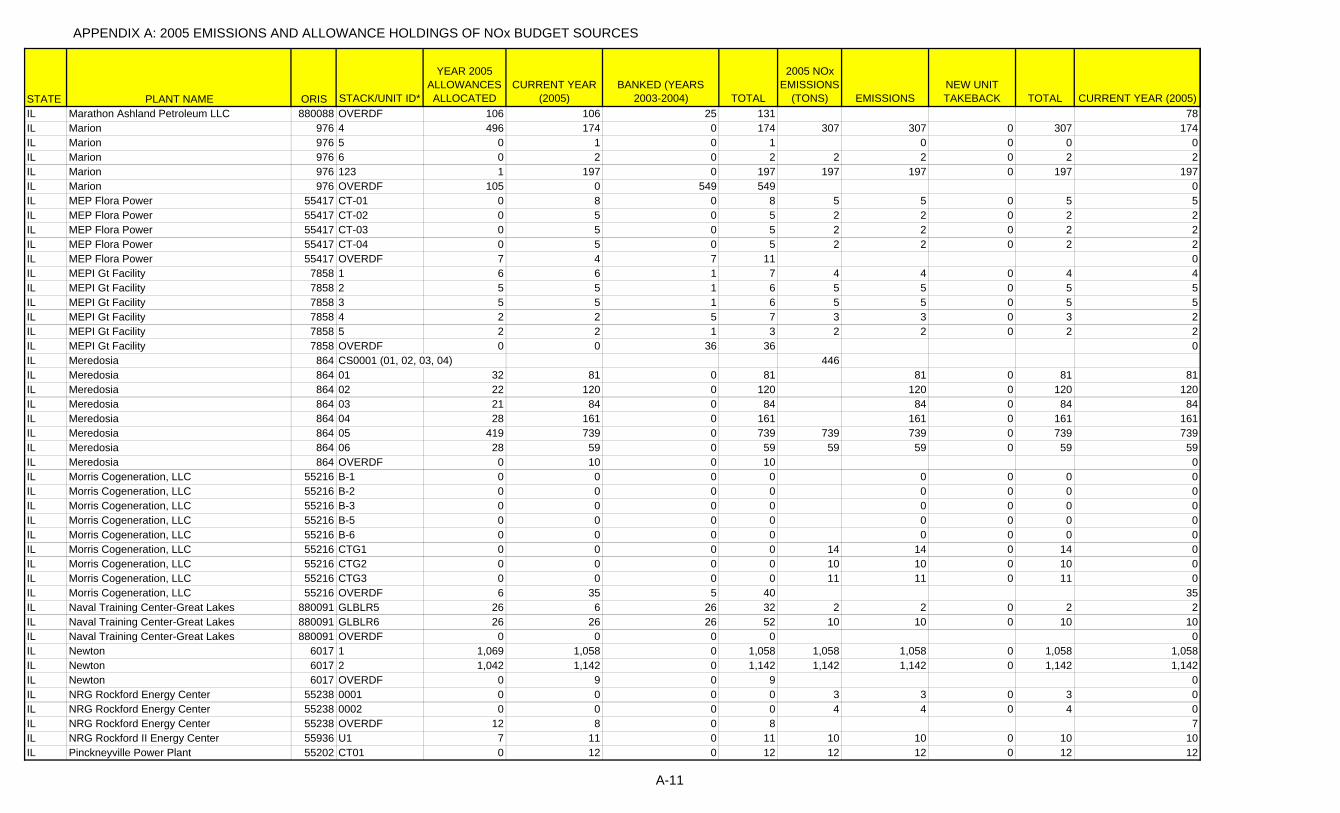
APPENDIX A: 2005 EMISSIONS AND ALLOWANCE HOLDINGS OF NOx BUDGET SOURCES
STATE PLANT NAME ORIS STACK/UNIT ID*
YEAR 2005 ALLOWANCES ALLOCATED
CURRENT YEAR (2005)
BANKED (YEARS 2003-2004) TOTAL
2005 NOx EMISSIONS
(TONS) EMISSIONSNEW UNIT TAKEBACK TOTAL CURRENT YEAR (2005)
IL Marathon Ashland Petroleum LLC 880088 OVERDF 106 106 25 131 78IL Marion 976 4 496 174 0 174 307 307 0 307 174IL Marion 976 5 0 1 0 1 0 0 0 0IL Marion 976 6 0 2 0 2 2 2 0 2 2IL Marion 976 123 1 197 0 197 197 197 0 197 197IL Marion 976 OVERDF 105 0 549 549 0IL MEP Flora Power 55417 CT-01 0 8 0 8 5 5 0 5 5IL MEP Flora Power 55417 CT-02 0 5 0 5 2 2 0 2 2IL MEP Flora Power 55417 CT-03 0 5 0 5 2 2 0 2 2IL MEP Flora Power 55417 CT-04 0 5 0 5 2 2 0 2 2IL MEP Flora Power 55417 OVERDF 7 4 7 11 0IL MEPI Gt Facility 7858 1 6 6 1 7 4 4 0 4 4IL MEPI Gt Facility 7858 2 5 5 1 6 5 5 0 5 5IL MEPI Gt Facility 7858 3 5 5 1 6 5 5 0 5 5IL MEPI Gt Facility 7858 4 2 2 5 7 3 3 0 3 2IL MEPI Gt Facility 7858 5 2 2 1 3 2 2 0 2 2IL MEPI Gt Facility 7858 OVERDF 0 0 36 36 0IL Meredosia 864 CS0001 (01, 02, 03, 04) 446IL Meredosia 864 01 32 81 0 81 81 0 81 81IL Meredosia 864 02 22 120 0 120 120 0 120 120IL Meredosia 864 03 21 84 0 84 84 0 84 84IL Meredosia 864 04 28 161 0 161 161 0 161 161IL Meredosia 864 05 419 739 0 739 739 739 0 739 739IL Meredosia 864 06 28 59 0 59 59 59 0 59 59IL Meredosia 864 OVERDF 0 10 0 10 0IL Morris Cogeneration, LLC 55216 B-1 0 0 0 0 0 0 0 0IL Morris Cogeneration, LLC 55216 B-2 0 0 0 0 0 0 0 0IL Morris Cogeneration, LLC 55216 B-3 0 0 0 0 0 0 0 0IL Morris Cogeneration, LLC 55216 B-5 0 0 0 0 0 0 0 0IL Morris Cogeneration, LLC 55216 B-6 0 0 0 0 0 0 0 0IL Morris Cogeneration, LLC 55216 CTG1 0 0 0 0 14 14 0 14 0IL Morris Cogeneration, LLC 55216 CTG2 0 0 0 0 10 10 0 10 0IL Morris Cogeneration, LLC 55216 CTG3 0 0 0 0 11 11 0 11 0IL Morris Cogeneration, LLC 55216 OVERDF 6 35 5 40 35IL Naval Training Center-Great Lakes 880091 GLBLR5 26 6 26 32 2 2 0 2 2IL Naval Training Center-Great Lakes 880091 GLBLR6 26 26 26 52 10 10 0 10 10IL Naval Training Center-Great Lakes 880091 OVERDF 0 0 0 0 0IL Newton 6017 1 1,069 1,058 0 1,058 1,058 1,058 0 1,058 1,058IL Newton 6017 2 1,042 1,142 0 1,142 1,142 1,142 0 1,142 1,142IL Newton 6017 OVERDF 0 9 0 9 0IL NRG Rockford Energy Center 55238 0001 0 0 0 0 3 3 0 3 0IL NRG Rockford Energy Center 55238 0002 0 0 0 0 4 4 0 4 0IL NRG Rockford Energy Center 55238 OVERDF 12 8 0 8 7IL NRG Rockford II Energy Center 55936 U1 7 11 0 11 10 10 0 10 10IL Pinckneyville Power Plant 55202 CT01 0 12 0 12 12 12 0 12 12
A-11
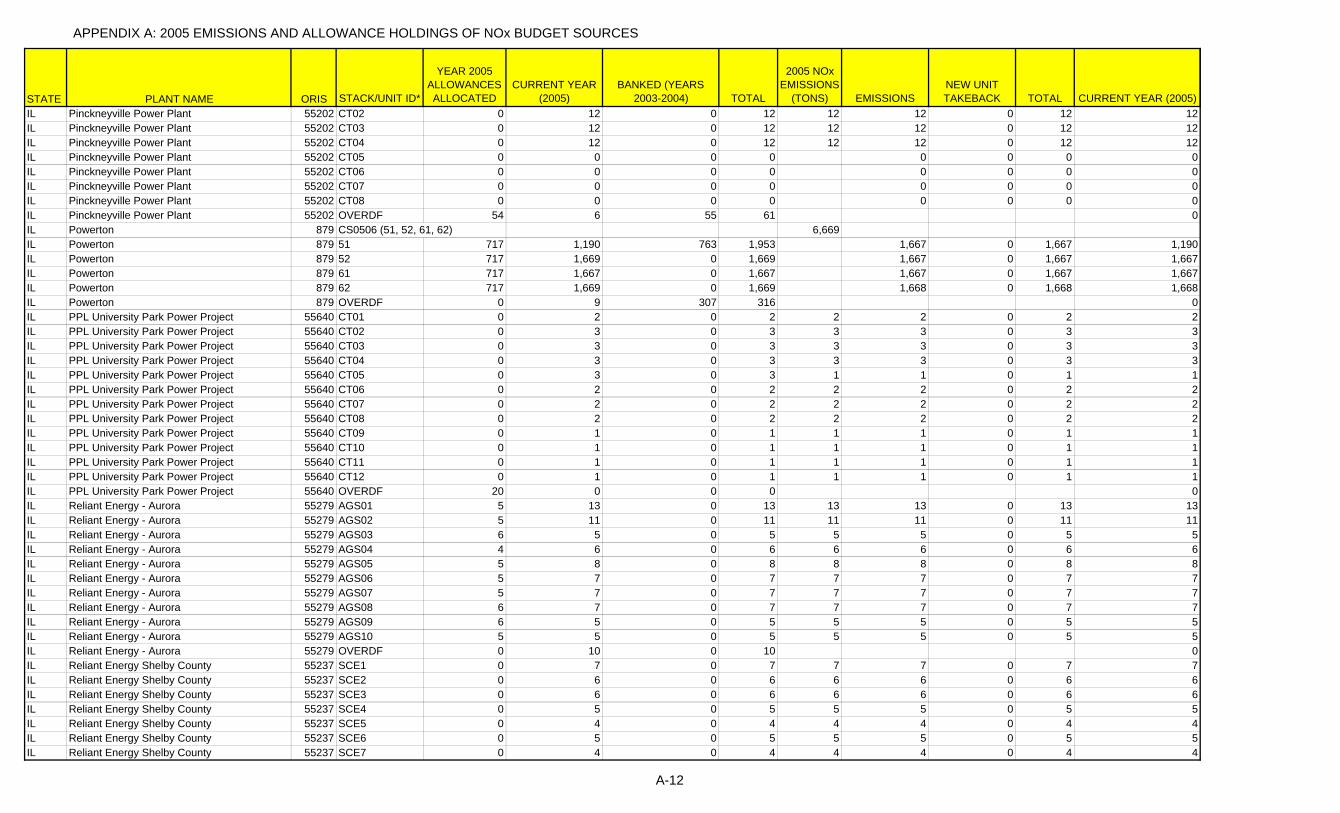
APPENDIX A: 2005 EMISSIONS AND ALLOWANCE HOLDINGS OF NOx BUDGET SOURCES
STATE PLANT NAME ORIS STACK/UNIT ID*
YEAR 2005 ALLOWANCES ALLOCATED
CURRENT YEAR (2005)
BANKED (YEARS 2003-2004) TOTAL
2005 NOx EMISSIONS
(TONS) EMISSIONSNEW UNIT TAKEBACK TOTAL CURRENT YEAR (2005)
IL Pinckneyville Power Plant 55202 CT02 0 12 0 12 12 12 0 12 12IL Pinckneyville Power Plant 55202 CT03 0 12 0 12 12 12 0 12 12IL Pinckneyville Power Plant 55202 CT04 0 12 0 12 12 12 0 12 12IL Pinckneyville Power Plant 55202 CT05 0 0 0 0 0 0 0 0IL Pinckneyville Power Plant 55202 CT06 0 0 0 0 0 0 0 0IL Pinckneyville Power Plant 55202 CT07 0 0 0 0 0 0 0 0IL Pinckneyville Power Plant 55202 CT08 0 0 0 0 0 0 0 0IL Pinckneyville Power Plant 55202 OVERDF 54 6 55 61 0IL Powerton 879 CS0506 (51, 52, 61, 62) 6,669IL Powerton 879 51 717 1,190 763 1,953 1,667 0 1,667 1,190IL Powerton 879 52 717 1,669 0 1,669 1,667 0 1,667 1,667IL Powerton 879 61 717 1,667 0 1,667 1,667 0 1,667 1,667IL Powerton 879 62 717 1,669 0 1,669 1,668 0 1,668 1,668IL Powerton 879 OVERDF 0 9 307 316 0IL PPL University Park Power Project 55640 CT01 0 2 0 2 2 2 0 2 2IL PPL University Park Power Project 55640 CT02 0 3 0 3 3 3 0 3 3IL PPL University Park Power Project 55640 CT03 0 3 0 3 3 3 0 3 3IL PPL University Park Power Project 55640 CT04 0 3 0 3 3 3 0 3 3IL PPL University Park Power Project 55640 CT05 0 3 0 3 1 1 0 1 1IL PPL University Park Power Project 55640 CT06 0 2 0 2 2 2 0 2 2IL PPL University Park Power Project 55640 CT07 0 2 0 2 2 2 0 2 2IL PPL University Park Power Project 55640 CT08 0 2 0 2 2 2 0 2 2IL PPL University Park Power Project 55640 CT09 0 1 0 1 1 1 0 1 1IL PPL University Park Power Project 55640 CT10 0 1 0 1 1 1 0 1 1IL PPL University Park Power Project 55640 CT11 0 1 0 1 1 1 0 1 1IL PPL University Park Power Project 55640 CT12 0 1 0 1 1 1 0 1 1IL PPL University Park Power Project 55640 OVERDF 20 0 0 0 0IL Reliant Energy - Aurora 55279 AGS01 5 13 0 13 13 13 0 13 13IL Reliant Energy - Aurora 55279 AGS02 5 11 0 11 11 11 0 11 11IL Reliant Energy - Aurora 55279 AGS03 6 5 0 5 5 5 0 5 5IL Reliant Energy - Aurora 55279 AGS04 4 6 0 6 6 6 0 6 6IL Reliant Energy - Aurora 55279 AGS05 5 8 0 8 8 8 0 8 8IL Reliant Energy - Aurora 55279 AGS06 5 7 0 7 7 7 0 7 7IL Reliant Energy - Aurora 55279 AGS07 5 7 0 7 7 7 0 7 7IL Reliant Energy - Aurora 55279 AGS08 6 7 0 7 7 7 0 7 7IL Reliant Energy - Aurora 55279 AGS09 6 5 0 5 5 5 0 5 5IL Reliant Energy - Aurora 55279 AGS10 5 5 0 5 5 5 0 5 5IL Reliant Energy - Aurora 55279 OVERDF 0 10 0 10 0IL Reliant Energy Shelby County 55237 SCE1 0 7 0 7 7 7 0 7 7IL Reliant Energy Shelby County 55237 SCE2 0 6 0 6 6 6 0 6 6IL Reliant Energy Shelby County 55237 SCE3 0 6 0 6 6 6 0 6 6IL Reliant Energy Shelby County 55237 SCE4 0 5 0 5 5 5 0 5 5IL Reliant Energy Shelby County 55237 SCE5 0 4 0 4 4 4 0 4 4IL Reliant Energy Shelby County 55237 SCE6 0 5 0 5 5 5 0 5 5IL Reliant Energy Shelby County 55237 SCE7 0 4 0 4 4 4 0 4 4
A-12
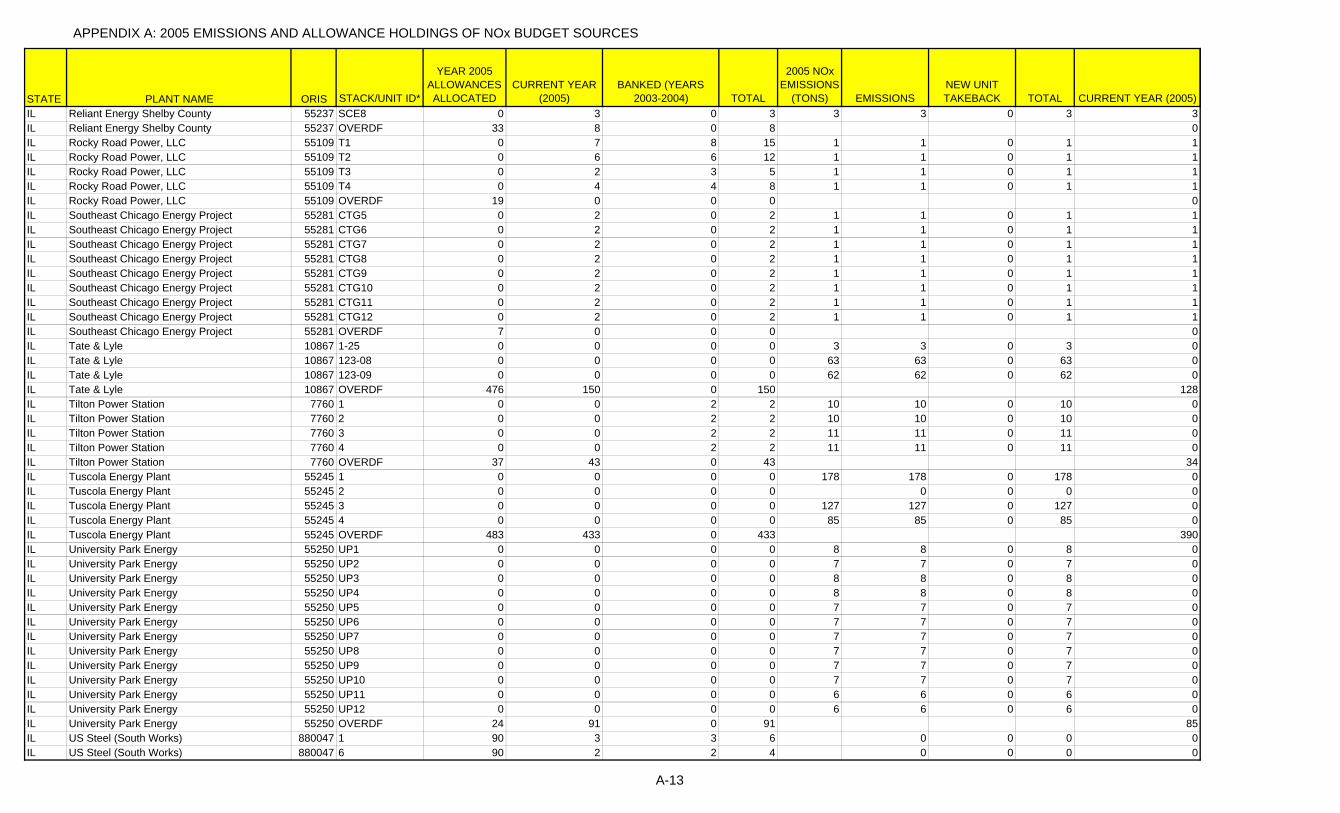
APPENDIX A: 2005 EMISSIONS AND ALLOWANCE HOLDINGS OF NOx BUDGET SOURCES
STATE PLANT NAME ORIS STACK/UNIT ID*
YEAR 2005 ALLOWANCES ALLOCATED
CURRENT YEAR (2005)
BANKED (YEARS 2003-2004) TOTAL
2005 NOx EMISSIONS
(TONS) EMISSIONSNEW UNIT TAKEBACK TOTAL CURRENT YEAR (2005)
IL Reliant Energy Shelby County 55237 SCE8 0 3 0 3 3 3 0 3 3IL Reliant Energy Shelby County 55237 OVERDF 33 8 0 8 0IL Rocky Road Power, LLC 55109 T1 0 7 8 15 1 1 0 1 1IL Rocky Road Power, LLC 55109 T2 0 6 6 12 1 1 0 1 1IL Rocky Road Power, LLC 55109 T3 0 2 3 5 1 1 0 1 1IL Rocky Road Power, LLC 55109 T4 0 4 4 8 1 1 0 1 1IL Rocky Road Power, LLC 55109 OVERDF 19 0 0 0 0IL Southeast Chicago Energy Project 55281 CTG5 0 2 0 2 1 1 0 1 1IL Southeast Chicago Energy Project 55281 CTG6 0 2 0 2 1 1 0 1 1IL Southeast Chicago Energy Project 55281 CTG7 0 2 0 2 1 1 0 1 1IL Southeast Chicago Energy Project 55281 CTG8 0 2 0 2 1 1 0 1 1IL Southeast Chicago Energy Project 55281 CTG9 0 2 0 2 1 1 0 1 1IL Southeast Chicago Energy Project 55281 CTG10 0 2 0 2 1 1 0 1 1IL Southeast Chicago Energy Project 55281 CTG11 0 2 0 2 1 1 0 1 1IL Southeast Chicago Energy Project 55281 CTG12 0 2 0 2 1 1 0 1 1IL Southeast Chicago Energy Project 55281 OVERDF 7 0 0 0 0IL Tate & Lyle 10867 1-25 0 0 0 0 3 3 0 3 0IL Tate & Lyle 10867 123-08 0 0 0 0 63 63 0 63 0IL Tate & Lyle 10867 123-09 0 0 0 0 62 62 0 62 0IL Tate & Lyle 10867 OVERDF 476 150 0 150 128IL Tilton Power Station 7760 1 0 0 2 2 10 10 0 10 0IL Tilton Power Station 7760 2 0 0 2 2 10 10 0 10 0IL Tilton Power Station 7760 3 0 0 2 2 11 11 0 11 0IL Tilton Power Station 7760 4 0 0 2 2 11 11 0 11 0IL Tilton Power Station 7760 OVERDF 37 43 0 43 34IL Tuscola Energy Plant 55245 1 0 0 0 0 178 178 0 178 0IL Tuscola Energy Plant 55245 2 0 0 0 0 0 0 0 0IL Tuscola Energy Plant 55245 3 0 0 0 0 127 127 0 127 0IL Tuscola Energy Plant 55245 4 0 0 0 0 85 85 0 85 0IL Tuscola Energy Plant 55245 OVERDF 483 433 0 433 390IL University Park Energy 55250 UP1 0 0 0 0 8 8 0 8 0IL University Park Energy 55250 UP2 0 0 0 0 7 7 0 7 0IL University Park Energy 55250 UP3 0 0 0 0 8 8 0 8 0IL University Park Energy 55250 UP4 0 0 0 0 8 8 0 8 0IL University Park Energy 55250 UP5 0 0 0 0 7 7 0 7 0IL University Park Energy 55250 UP6 0 0 0 0 7 7 0 7 0IL University Park Energy 55250 UP7 0 0 0 0 7 7 0 7 0IL University Park Energy 55250 UP8 0 0 0 0 7 7 0 7 0IL University Park Energy 55250 UP9 0 0 0 0 7 7 0 7 0IL University Park Energy 55250 UP10 0 0 0 0 7 7 0 7 0IL University Park Energy 55250 UP11 0 0 0 0 6 6 0 6 0IL University Park Energy 55250 UP12 0 0 0 0 6 6 0 6 0IL University Park Energy 55250 OVERDF 24 91 0 91 85IL US Steel (South Works) 880047 1 90 3 3 6 0 0 0 0IL US Steel (South Works) 880047 6 90 2 2 4 0 0 0 0
A-13

APPENDIX A: 2005 EMISSIONS AND ALLOWANCE HOLDINGS OF NOx BUDGET SOURCES
STATE PLANT NAME ORIS STACK/UNIT ID*
YEAR 2005 ALLOWANCES ALLOCATED
CURRENT YEAR (2005)
BANKED (YEARS 2003-2004) TOTAL
2005 NOx EMISSIONS
(TONS) EMISSIONSNEW UNIT TAKEBACK TOTAL CURRENT YEAR (2005)
IL US Steel (South Works) 880047 OVERDF 0 0 0 0 0IL Venice 913 CT1 4 4 0 4 0 0 0 0IL Venice 913 CT03 0 14 0 14 9 9 0 9 9IL Venice 913 CT04 0 15 0 15 3 3 0 3 3IL Venice 913 CT2A 0 6 8 14 4 4 0 4 2IL Venice 913 CT2B 0 7 11 18 4 4 0 4 2IL Venice 913 OVERDF 2 6 52 58 0IL Vermilion Power Station 897 CS3 (1, 2) 464IL Vermilion Power Station 897 1 16 0 2 2 186 0 186 0IL Vermilion Power Station 897 2 31 0 2 2 278 0 278 0IL Vermilion Power Station 897 OVERDF 0 483 0 483 460IL Waukegan 883 7 365 595 0 595 583 583 0 583 583IL Waukegan 883 8 648 656 0 656 643 643 0 643 643IL Waukegan 883 17 193 715 0 715 700 700 0 700 700IL Waukegan 883 311 4 0 12 12 3 3 0 3 0IL Waukegan 883 312 5 0 28 28 7 7 0 7 0IL Waukegan 883 321 5 0 20 20 5 5 0 5 0IL Waukegan 883 322 5 0 20 20 5 5 0 5 0IL Waukegan 883 OVERDF 0 0 0 0 0IL Will County 884 1 354 786 0 786 769 769 0 769 769IL Will County 884 2 343 610 0 610 597 597 0 597 597IL Will County 884 3 436 362 0 362 355 355 0 355 355IL Will County 884 4 744 787 0 787 771 771 0 771 771IL Will County 884 OVERDF 0 0 0 0 0IL Wood River Power Station 898 CS1 (1, 2, 3) 4IL Wood River Power Station 898 1 0 0 2 2 2 0 2 0IL Wood River Power Station 898 2 0 0 2 2 1 0 1 0IL Wood River Power Station 898 3 0 0 2 2 1 0 1 0IL Wood River Power Station 898 4 213 0 2 2 208 208 0 208 0IL Wood River Power Station 898 5 693 0 2 2 807 807 0 807 0IL Wood River Power Station 898 OVERDF 0 1,059 2 1,061 1,011IL Wood River Refinery 880067 BLR15 0 0 0 0 45 45 0 45 0IL Wood River Refinery 880067 BLR16 0 0 0 0 57 57 0 57 0IL Wood River Refinery 880067 BLR17 0 0 0 0 41 41 0 41 0IL Wood River Refinery 880067 OVERDF 160 160 33 193 143IL Zion Energy Center 55392 CT-1 25 3 0 3 3 3 0 3 3IL Zion Energy Center 55392 CT-2 16 2 0 2 2 2 0 2 2IL Zion Energy Center 55392 CT-3 10 6 0 6 2 2 0 2 2IL Zion Energy Center 55392 OVERDF 0 0 0 0 0IN A B Brown Generating Station 6137 1 534 328 0 328 320 320 0 320 320IN A B Brown Generating Station 6137 2 601 414 0 414 404 404 0 404 404IN A B Brown Generating Station 6137 3 18 10 5 15 11 11 0 11 10IN A B Brown Generating Station 6137 4 17 6 0 6 4 4 2 6 6IN A B Brown Generating Station 6137 OVERDF 0 0 0 0 0IN Anderson 7336 ACT1 10 10 10 20 0 0 0 0
A-14

APPENDIX A: 2005 EMISSIONS AND ALLOWANCE HOLDINGS OF NOx BUDGET SOURCES
STATE PLANT NAME ORIS STACK/UNIT ID*
YEAR 2005 ALLOWANCES ALLOCATED
CURRENT YEAR (2005)
BANKED (YEARS 2003-2004) TOTAL
2005 NOx EMISSIONS
(TONS) EMISSIONSNEW UNIT TAKEBACK TOTAL CURRENT YEAR (2005)
IN Anderson 7336 ACT2 9 9 9 18 1 1 0 1 1IN Anderson 7336 ACT3 51 51 0 51 0 51 51 51IN Anderson 7336 OVERDF 0 0 0 0 0IN Bailly Generating Station 995 XS12 (7, 8) 2,665IN Bailly Generating Station 995 7 414 764 0 764 1,332 0 1,332 764IN Bailly Generating Station 995 8 673 765 0 765 1,333 0 1,333 765IN Bailly Generating Station 995 10 6 2 0 2 2 2 0 2 2IN Bailly Generating Station 995 OVERDF 0 0 4,555 4,555 0IN BP Whiting Business Unit 52130 CS5-01 (1SPS13, 1SPS14) 79IN BP Whiting Business Unit 52130 1SPS13 22 22 0 22 40 0 40 22IN BP Whiting Business Unit 52130 1SPS14 22 22 0 22 39 0 39 22IN BP Whiting Business Unit 52130 CS5-02 (1SPS15, 1SPS16, 1SPS17) 87IN BP Whiting Business Unit 52130 1SPS15 22 22 0 22 29 0 29 22IN BP Whiting Business Unit 52130 1SPS16 22 22 0 22 29 0 29 22IN BP Whiting Business Unit 52130 1SPS17 23 23 0 23 29 0 29 23IN BP Whiting Business Unit 52130 3SPS31 271 91 0 91 57 57 0 57 57IN BP Whiting Business Unit 52130 3SPS32 271 51 0 51 23 23 0 23 23IN BP Whiting Business Unit 52130 3SPS33 271 91 0 91 64 64 0 64 64IN BP Whiting Business Unit 52130 3SPS34 271 71 0 71 33 33 0 33 33IN BP Whiting Business Unit 52130 3SPS36 271 66 0 66 38 38 0 38 38IN BP Whiting Business Unit 52130 OVERDF 0 100 0 100 55IN Broadway Avenue Generating Station 1011 1 16 7 14 21 13 13 0 13 5IN Broadway Avenue Generating Station 1011 2 28 9 27 36 17 17 0 17 5IN Broadway Avenue Generating Station 1011 OVERDF 0 0 0 0 0IN C. C. Perry K Steam Plant 992 CS003 (11, 12) 223IN C. C. Perry K Steam Plant 992 11 129 116 0 116 112 0 112 112IN C. C. Perry K Steam Plant 992 12 149 124 0 124 111 0 111 111IN C. C. Perry K Steam Plant 992 13 92 40 0 40 30 30 0 30 30IN C. C. Perry K Steam Plant 992 14 81 20 0 20 10 10 0 10 10IN C. C. Perry K Steam Plant 992 CS001 (15, 16) 149IN C. C. Perry K Steam Plant 992 15 59 86 0 86 80 0 80 80IN C. C. Perry K Steam Plant 992 16 74 74 0 74 69 0 69 69IN C. C. Perry K Steam Plant 992 OVERDF 0 0 0 0 0IN Cayuga 1001 1 1,128 1,882 480 2,362 1,998 1,998 0 1,998 1,878IN Cayuga 1001 2 1,044 2,585 660 3,245 2,746 2,746 0 2,746 2,581IN Cayuga 1001 4 37 9 0 9 7 7 0 7 7IN Cayuga 1001 OVERDF 0 0 0 0 0IN Clifty Creek 983 CS001 (1, 2, 3) 742IN Clifty Creek 983 1 528 167 626 793 245 0 245 165IN Clifty Creek 983 2 514 167 612 779 245 0 245 165IN Clifty Creek 983 3 533 174 625 799 252 0 252 174IN Clifty Creek 983 CS002 (4, 5, 6) 2,765IN Clifty Creek 983 4 497 921 297 1,218 912 0 912 912IN Clifty Creek 983 5 530 922 331 1,253 912 0 912 912IN Clifty Creek 983 6 481 922 264 1,186 941 0 941 922
A-15

APPENDIX A: 2005 EMISSIONS AND ALLOWANCE HOLDINGS OF NOx BUDGET SOURCES
STATE PLANT NAME ORIS STACK/UNIT ID*
YEAR 2005 ALLOWANCES ALLOCATED
CURRENT YEAR (2005)
BANKED (YEARS 2003-2004) TOTAL
2005 NOx EMISSIONS
(TONS) EMISSIONSNEW UNIT TAKEBACK TOTAL CURRENT YEAR (2005)
IN Clifty Creek 983 OVERDF 0 0 0 0 0IN Connersville Peaking Station 1002 1A 6 1 0 1 1 1 0 1 1IN Connersville Peaking Station 1002 1B 0 2 0 2 1 1 0 1 1IN Connersville Peaking Station 1002 2A 6 0 0 0 0 0 0 0IN Connersville Peaking Station 1002 2B 0 0 0 0 0 0 0 0IN Connersville Peaking Station 1002 OVERDF 0 8 0 8 0IN Dean H Mitchell Generating Station 996 CS45 (4, 5) 0IN Dean H Mitchell Generating Station 996 4 147 0 0 0 0 0 0 0IN Dean H Mitchell Generating Station 996 5 254 0 0 0 0 0 0 0IN Dean H Mitchell Generating Station 996 CS611 (6, 11) 0IN Dean H Mitchell Generating Station 996 6 236 0 0 0 0 0 0 0IN Dean H Mitchell Generating Station 996 11 217 0 0 0 0 0 0 0IN Dean H Mitchell Generating Station 996 OVERDF 0 0 0 0 0IN Edwardsport 1004 6-1 15 0 0 0 0 0 0 0IN Edwardsport 1004 7-1 99 275 72 347 289 289 0 289 271IN Edwardsport 1004 7-2 101 212 48 260 220 220 0 220 208IN Edwardsport 1004 8-1 85 217 56 273 227 227 0 227 213IN Edwardsport 1004 OVERDF 0 0 0 0 0IN F B Culley Generating Station 1012 1 66 297 271 568 442 442 0 442 297IN F B Culley Generating Station 1012 XS23 (2, 3) 1,060IN F B Culley Generating Station 1012 2 239 1,061 33 1,094 1,060 0 1,060 1,041IN F B Culley Generating Station 1012 3 768 0 0 0 0 0 0 0IN F B Culley Generating Station 1012 OVERDF 0 0 0 0 0IN Frank E Ratts 1043 1SG1 251 776 60 836 742 742 0 742 742IN Frank E Ratts 1043 2SG1 274 424 22 446 397 397 0 397 397IN Frank E Ratts 1043 OVERDF 0 0 0 0 0IN Georgetown Substation 7759 GT1 26 26 0 26 2 2 24 26 26IN Georgetown Substation 7759 GT2 26 26 0 26 3 3 23 26 26IN Georgetown Substation 7759 GT3 26 26 0 26 3 3 23 26 26IN Georgetown Substation 7759 GT4 26 26 0 26 4 4 22 26 26IN Georgetown Substation 7759 OVERDF 0 0 0 0 0IN Gibson 6113 CS0003 (1, 2) 1,584IN Gibson 6113 1 1,481 748 192 940 792 0 792 744IN Gibson 6113 2 1,343 748 192 940 792 0 792 744IN Gibson 6113 XS34 (3, 4) 1,467IN Gibson 6113 3 1,327 694 176 870 734 0 734 690IN Gibson 6113 4 1,432 693 180 873 733 0 733 688IN Gibson 6113 5 1,480 741 156 897 776 776 0 776 737IN Gibson 6113 OVERDF 0 0 0 0 0IN Harding Street Station (EW Stout) 990 9 6 2 0 2 0 0 0 0IN Harding Street Station (EW Stout) 990 10 5 2 0 2 1 1 0 1 1IN Harding Street Station (EW Stout) 990 50 231 363 0 363 362 362 0 362 362IN Harding Street Station (EW Stout) 990 60 215 345 0 345 344 344 0 344 344IN Harding Street Station (EW Stout) 990 70 807 666 0 666 664 664 0 664 664IN Harding Street Station (EW Stout) 990 GT4 29 12 0 12 11 11 0 11 11
A-16

APPENDIX A: 2005 EMISSIONS AND ALLOWANCE HOLDINGS OF NOx BUDGET SOURCES
STATE PLANT NAME ORIS STACK/UNIT ID*
YEAR 2005 ALLOWANCES ALLOCATED
CURRENT YEAR (2005)
BANKED (YEARS 2003-2004) TOTAL
2005 NOx EMISSIONS
(TONS) EMISSIONSNEW UNIT TAKEBACK TOTAL CURRENT YEAR (2005)
IN Harding Street Station (EW Stout) 990 GT5 27 12 0 12 10 10 0 10 10IN Harding Street Station (EW Stout) 990 GT6 40 40 0 40 5 5 35 40 40IN Harding Street Station (EW Stout) 990 OVERDF 0 0 0 0 0IN Henry County Generating Station 7763 1 21 21 0 21 10 10 11 21 21IN Henry County Generating Station 7763 2 21 21 0 21 10 10 11 21 21IN Henry County Generating Station 7763 3 21 21 0 21 11 11 10 21 21IN Henry County Generating Station 7763 OVERDF 0 6 0 6 0IN Hoosier Energy Lawrence Co Station 7948 1 25 25 0 25 5 5 20 25 25IN Hoosier Energy Lawrence Co Station 7948 2 25 25 0 25 7 7 18 25 25IN Hoosier Energy Lawrence Co Station 7948 3 25 25 0 25 7 7 18 25 25IN Hoosier Energy Lawrence Co Station 7948 4 25 25 0 25 5 5 20 25 25IN Hoosier Energy Lawrence Co Station 7948 5 25 25 0 25 4 4 21 25 25IN Hoosier Energy Lawrence Co Station 7948 6 25 25 0 25 6 6 19 25 25IN Hoosier Energy Lawrence Co Station 7948 OVERDF 0 0 0 0 0IN IPL Eagle Valley Generating Station 991 1 4 2 0 2 1 1 0 1 1IN IPL Eagle Valley Generating Station 991 2 4 3 0 3 2 2 0 2 2IN IPL Eagle Valley Generating Station 991 CS592 (3, 4) 572IN IPL Eagle Valley Generating Station 991 3 80 232 0 232 231 0 231 231IN IPL Eagle Valley Generating Station 991 4 104 343 0 343 341 0 341 341IN IPL Eagle Valley Generating Station 991 CS596 (5, 6) 538IN IPL Eagle Valley Generating Station 991 5 90 190 0 190 188 0 188 188IN IPL Eagle Valley Generating Station 991 6 198 351 0 351 350 0 350 350IN IPL Eagle Valley Generating Station 991 OVERDF 0 0 0 0 0IN Merom 6213 1SG1 1,304 854 702 1,556 809 809 0 809 809IN Merom 6213 2SG1 1,400 1,175 443 1,618 991 991 0 991 991IN Merom 6213 OVERDF 0 0 0 0 0IN Michigan City Generating Station 997 4 21 0 0 0 0 0 0 0IN Michigan City Generating Station 997 5 16 0 0 0 0 0 0 0IN Michigan City Generating Station 997 6 0 0 0 0 0 0 0 0IN Michigan City Generating Station 997 12 959 0 0 0 689 689 0 689 0IN Michigan City Generating Station 997 OVERDF 0 0 2,765 2,765 0IN Mirant Sugar Creek, LLC 55364 CT11 49 49 0 49 14 14 35 49 49IN Mirant Sugar Creek, LLC 55364 CT12 49 49 0 49 34 34 15 49 49IN Mirant Sugar Creek, LLC 55364 OVERDF 0 0 0 0 0IN Mittal Steel USA - Indiana Harbor East 10474 211 118 0 0 0 0 0 0 0IN Mittal Steel USA - Indiana Harbor East 10474 212 118 4 0 4 4 4 0 4 4IN Mittal Steel USA - Indiana Harbor East 10474 213 117 0 1 1 1 1 0 1 0IN Mittal Steel USA - Indiana Harbor East 10474 CS5 (501, 502, 503) 159IN Mittal Steel USA - Indiana Harbor East 10474 501 148 47 10 57 53 0 53 47IN Mittal Steel USA - Indiana Harbor East 10474 502 148 40 21 61 53 0 53 40IN Mittal Steel USA - Indiana Harbor East 10474 503 148 40 21 61 53 0 53 40IN Mittal Steel USA - Indiana Harbor East 10474 OVERDF 0 0 0 0 0IN Montpelier Electric Gen Station 55229 G1CT1 19 19 0 19 3 3 16 19 19IN Montpelier Electric Gen Station 55229 G1CT2 19 19 0 19 3 3 16 19 19IN Montpelier Electric Gen Station 55229 G2CT1 19 19 0 19 3 3 16 19 19
A-17

APPENDIX A: 2005 EMISSIONS AND ALLOWANCE HOLDINGS OF NOx BUDGET SOURCES
STATE PLANT NAME ORIS STACK/UNIT ID*
YEAR 2005 ALLOWANCES ALLOCATED
CURRENT YEAR (2005)
BANKED (YEARS 2003-2004) TOTAL
2005 NOx EMISSIONS
(TONS) EMISSIONSNEW UNIT TAKEBACK TOTAL CURRENT YEAR (2005)
IN Montpelier Electric Gen Station 55229 G2CT2 19 19 0 19 3 3 16 19 19IN Montpelier Electric Gen Station 55229 G3CT1 19 19 0 19 3 3 16 19 19IN Montpelier Electric Gen Station 55229 G3CT2 19 19 0 19 3 3 16 19 19IN Montpelier Electric Gen Station 55229 G4CT1 19 19 0 19 3 3 16 19 19IN Montpelier Electric Gen Station 55229 G4CT2 19 19 0 19 3 3 16 19 19IN Montpelier Electric Gen Station 55229 OVERDF 0 0 128 128 0IN New Energy Corp 880087 U-4000 256 316 50 366 345 345 0 345 316IN Noblesville 1007 CT3 30 30 0 30 4 4 26 30 30IN Noblesville 1007 CT4 30 30 0 30 6 6 24 30 30IN Noblesville 1007 CT5 30 30 0 30 6 6 24 30 30IN Noblesville 1007 OVERDF 0 6 0 6 0IN Petersburg 994 1 519 874 404 1,278 975 975 0 975 874IN Petersburg 994 2 1,086 361 0 361 360 360 0 360 360IN Petersburg 994 3 1,222 332 0 332 331 331 0 331 331IN Petersburg 994 4 1,177 2,220 0 2,220 2,219 2,219 0 2,219 2,219IN Petersburg 994 OVERDF 0 0 0 0 0IN Portside Energy 55096 CT 36 16 0 16 16 16 0 16 16IN Portside Energy 55096 BLR1 54 3 0 3 3 3 0 3 3IN Portside Energy 55096 BLR2 5 3 0 3 3 3 0 3 3IN Portside Energy 55096 OVERDF 0 11 1 12 0IN PSEG Lawrenceburg Energy Facility 55502 1 34 34 0 34 5 5 29 34 34IN PSEG Lawrenceburg Energy Facility 55502 2 34 34 1 35 4 4 30 34 34IN PSEG Lawrenceburg Energy Facility 55502 3 34 34 2 36 8 8 26 34 34IN PSEG Lawrenceburg Energy Facility 55502 4 34 34 2 36 7 7 27 34 34IN PSEG Lawrenceburg Energy Facility 55502 OVERDF 0 0 0 0 0IN Purdue University-Wade Utility 50240 1 97 97 40 137 133 133 0 133 97IN Purdue University-Wade Utility 50240 2 98 98 0 98 102 102 0 102 98IN Purdue University-Wade Utility 50240 3 9 9 1 10 0 0 0 0IN Purdue University-Wade Utility 50240 5 78 36 8 44 43 43 0 43 36IN Purdue University-Wade Utility 50240 OVERDF 0 42 0 42 17IN R Gallagher 1008 CS0001 (1, 2) 999IN R Gallagher 1008 1 274 480 96 576 500 0 500 476IN R Gallagher 1008 2 261 480 96 576 499 0 499 475IN R Gallagher 1008 CS0002 (3, 4) 866IN R Gallagher 1008 3 328 410 108 518 433 0 433 406IN R Gallagher 1008 4 312 410 108 518 433 0 433 406IN R Gallagher 1008 OVERDF 0 0 0 0 0IN R M Schahfer Generating Station 6085 14 994 0 0 0 988 988 0 988 0IN R M Schahfer Generating Station 6085 15 1,124 0 0 0 1,263 1,263 0 1,263 0IN R M Schahfer Generating Station 6085 17 754 0 0 0 1,230 1,230 0 1,230 0IN R M Schahfer Generating Station 6085 18 835 0 0 0 1,395 1,395 0 1,395 0IN R M Schahfer Generating Station 6085 16A 20 0 0 0 28 28 0 28 0IN R M Schahfer Generating Station 6085 16B 16 0 0 0 24 24 0 24 0IN R M Schahfer Generating Station 6085 OVERDF 0 0 19,720 19,720 0IN Richmond (IN) 7335 RCT1 9 9 9 18 1 1 0 1 1
A-18

APPENDIX A: 2005 EMISSIONS AND ALLOWANCE HOLDINGS OF NOx BUDGET SOURCES
STATE PLANT NAME ORIS STACK/UNIT ID*
YEAR 2005 ALLOWANCES ALLOCATED
CURRENT YEAR (2005)
BANKED (YEARS 2003-2004) TOTAL
2005 NOx EMISSIONS
(TONS) EMISSIONSNEW UNIT TAKEBACK TOTAL CURRENT YEAR (2005)
IN Richmond (IN) 7335 RCT2 9 9 9 18 1 1 0 1 1IN Richmond (IN) 7335 OVERDF 0 0 0 0 0IN Rockport 6166 AB1 2 3 0 3 2 2 0 2 2IN Rockport 6166 AB2 1 1 0 1 1 1 0 1 1IN Rockport 6166 CS012 (MB1, MB2) 7,955IN Rockport 6166 MB1 3,482 3,722 91 3,813 3,702 0 3,702 3,702IN Rockport 6166 MB2 3,426 4,276 93 4,369 4,253 0 4,253 4,253IN Rockport 6166 OVERDF 0 0 0 0 0IN State Line Generating Station (IN) 981 3 365 474 0 474 471 471 0 471 471IN State Line Generating Station (IN) 981 4 477 1,843 0 1,843 1,837 1,837 0 1,837 1,837IN State Line Generating Station (IN) 981 OVERDF 0 0 0 0 0IN Tanners Creek 988 CS013 (U1, U2, U3) 1,465IN Tanners Creek 988 U1 286 0 1,892 1,892 461 0 461 0IN Tanners Creek 988 U2 264 0 2,041 2,041 500 0 500 0IN Tanners Creek 988 U3 385 0 2,070 2,070 504 0 504 0IN Tanners Creek 988 U4 926 1,894 25 1,919 1,884 1,884 0 1,884 1,884IN Tanners Creek 988 OVERDF 0 0 0 0 0IN US Steel Cop. Gary Works 50733 701B1 84 21 0 21 21 21 0 21 21IN US Steel Cop. Gary Works 50733 701B2 84 41 0 41 41 41 0 41 41IN US Steel Cop. Gary Works 50733 701B3 84 80 0 80 80 80 0 80 80IN US Steel Cop. Gary Works 50733 701B5 93 37 0 37 37 37 0 37 37IN US Steel Cop. Gary Works 50733 701B6 156 31 0 31 31 31 0 31 31IN US Steel Cop. Gary Works 50733 720B1 115 15 0 15 14 14 0 14 14IN US Steel Cop. Gary Works 50733 720B2 115 13 1 14 12 12 0 12 12IN US Steel Cop. Gary Works 50733 720B3 115 15 0 15 14 14 0 14 14IN US Steel Cop. Gary Works 50733 OVERDF 0 2 3 5 0IN Vermillion Energy Facility 55111 1 32 32 0 32 2 2 30 32 32IN Vermillion Energy Facility 55111 2 32 32 0 32 2 2 30 32 32IN Vermillion Energy Facility 55111 3 32 32 0 32 2 2 30 32 32IN Vermillion Energy Facility 55111 4 32 32 0 32 2 2 30 32 32IN Vermillion Energy Facility 55111 5 32 32 0 32 2 2 30 32 32IN Vermillion Energy Facility 55111 6 32 32 0 32 2 2 30 32 32IN Vermillion Energy Facility 55111 7 32 32 0 32 1 1 31 32 32IN Vermillion Energy Facility 55111 8 32 32 0 32 2 2 30 32 32IN Vermillion Energy Facility 55111 OVERDF 0 0 0 0 0IN Wabash River 1010 1 278 117 24 141 119 119 0 119 113IN Wabash River 1010 CS0005 (2, 3, 4, 5, 6) 3,179IN Wabash River 1010 2 150 603 148 751 636 0 636 599IN Wabash River 1010 3 166 603 148 751 636 0 636 599IN Wabash River 1010 4 219 603 148 751 636 0 636 599IN Wabash River 1010 5 191 603 148 751 636 0 636 599IN Wabash River 1010 6 607 603 148 751 635 0 635 598IN Wabash River 1010 OVERDF 0 0 0 0 0IN Warrick 6705 XS123 (1, 2, 3) 2,687IN Warrick 6705 1 1,172 905 1 906 905 0 905 905
A-19

APPENDIX A: 2005 EMISSIONS AND ALLOWANCE HOLDINGS OF NOx BUDGET SOURCES
STATE PLANT NAME ORIS STACK/UNIT ID*
YEAR 2005 ALLOWANCES ALLOCATED
CURRENT YEAR (2005)
BANKED (YEARS 2003-2004) TOTAL
2005 NOx EMISSIONS
(TONS) EMISSIONSNEW UNIT TAKEBACK TOTAL CURRENT YEAR (2005)
IN Warrick 6705 2 1,138 865 0 865 865 0 865 865IN Warrick 6705 3 1,104 917 0 917 917 0 917 917IN Warrick 6705 4 785 508 25 533 532 532 0 532 508IN Warrick 6705 OVERDF 0 14 9 23 8IN Wheatland Generating Facility LLC 55224 EU-01 25 25 0 25 2 2 23 25 25IN Wheatland Generating Facility LLC 55224 EU-02 25 25 0 25 2 2 23 25 25IN Wheatland Generating Facility LLC 55224 EU-03 25 25 0 25 1 1 24 25 25IN Wheatland Generating Facility LLC 55224 EU-04 25 25 0 25 2 2 23 25 25IN Wheatland Generating Facility LLC 55224 OVERDF 0 8 0 8 0IN Whitewater Valley 1040 CS12 (1, 2) 437IN Whitewater Valley 1040 1 80 178 2 180 170 0 170 170IN Whitewater Valley 1040 2 179 279 5 284 267 0 267 267IN Whitewater Valley 1040 OVERDF 0 0 0 0 0IN Whiting Clean Energy, Inc. 55259 CT1 131 131 0 131 15 15 116 131 131IN Whiting Clean Energy, Inc. 55259 CT2 131 131 0 131 16 16 115 131 131IN Whiting Clean Energy, Inc. 55259 OVERDF 0 0 0 0 0IN Worthington Generation 55148 1 25 25 0 25 5 5 20 25 25IN Worthington Generation 55148 2 25 25 0 25 3 3 22 25 25IN Worthington Generation 55148 3 25 25 0 25 4 4 21 25 25IN Worthington Generation 55148 4 25 25 0 25 5 5 20 25 25IN Worthington Generation 55148 OVERDF 0 0 0 0 0KY Big Sandy 1353 AUX2 1 2 0 2 1 1 0 1 1KY Big Sandy 1353 CS012 (BSU1, BSU2) 1,441KY Big Sandy 1353 BSU1 593 0 1,843 1,843 336 0 336 0KY Big Sandy 1353 BSU2 1,736 1,117 0 1,117 1,105 0 1,105 1,105KY Big Sandy 1353 OVERDF 0 0 0 0 0KY Bluegrass Generating Company, LLC 55164 GTG1 0 4 0 4 3 3 0 3 3KY Bluegrass Generating Company, LLC 55164 GTG2 0 4 0 4 3 3 0 3 3KY Bluegrass Generating Company, LLC 55164 GTG3 0 6 0 6 5 5 0 5 5KY Bluegrass Generating Company, LLC 55164 OVERDF 0 0 0 0 0KY Calvert City Cogen 55308 A 20 10 2 12 9 9 0 9 9KY Calvert City Cogen 55308 B 18 12 2 14 11 11 0 11 11KY Calvert City Cogen 55308 C 68 30 2 32 29 29 0 29 29KY Calvert City Cogen 55308 OVERDF 0 0 0 0 0KY Cane Run 1363 4 389 739 659 1,398 862 862 0 862 710KY Cane Run 1363 5 360 1,060 20 1,080 997 997 0 997 997KY Cane Run 1363 6 420 1,019 735 1,754 1,145 1,145 0 1,145 998KY Cane Run 1363 OVERDF 0 0 0 0 0KY Catlettsburg Refining, LLC 880038 061 29 29 22 51 40 40 0 40 29KY Coleman 1381 C1 382 717 87 804 737 737 0 737 717KY Coleman 1381 C2 376 616 84 700 636 636 0 636 616KY Coleman 1381 C3 377 747 86 833 756 756 0 756 747KY Coleman 1381 OVERDF 0 0 30 30 0KY D B Wilson 6823 W1 1,242 412 79 491 424 424 0 424 412KY E W Brown 1355 1 235 685 472 1,157 646 646 0 646 646
A-20

APPENDIX A: 2005 EMISSIONS AND ALLOWANCE HOLDINGS OF NOx BUDGET SOURCES
STATE PLANT NAME ORIS STACK/UNIT ID*
YEAR 2005 ALLOWANCES ALLOCATED
CURRENT YEAR (2005)
BANKED (YEARS 2003-2004) TOTAL
2005 NOx EMISSIONS
(TONS) EMISSIONSNEW UNIT TAKEBACK TOTAL CURRENT YEAR (2005)
KY E W Brown 1355 CS003 (2, 3) 1,645KY E W Brown 1355 2 346 596 7 603 560 0 560 560KY E W Brown 1355 3 831 1,331 75 1,406 1,085 0 1,085 1,085KY E W Brown 1355 5 0 50 10 60 46 46 0 46 46KY E W Brown 1355 6 7 57 6 63 38 38 0 38 38KY E W Brown 1355 7 9 59 7 66 23 23 0 23 23KY E W Brown 1355 8 46 46 46 92 1 1 0 1 1KY E W Brown 1355 9 44 44 44 88 1 1 0 1 1KY E W Brown 1355 10 41 41 41 82 1 1 0 1 1KY E W Brown 1355 11 32 32 32 64 1 1 0 1 1KY E W Brown 1355 OVERDF 0 0 0 0 0KY East Bend 6018 2 1,570 484 720 1,204 660 660 0 660 480KY Elmer Smith 1374 1 375 432 0 432 432 432 0 432 432KY Elmer Smith 1374 2 746 754 15 769 769 769 0 769 754KY Elmer Smith 1374 OVERDF 0 0 45 45 0KY Ghent 1356 1 1,093 543 90 633 339 339 0 339 339KY Ghent 1356 2 1,090 1,640 668 2,308 1,620 1,620 0 1,620 1,620KY Ghent 1356 CS002 (3, 4) 378KY Ghent 1356 3 1,104 104 531 635 189 0 189 71KY Ghent 1356 4 1,113 563 36 599 189 0 189 189KY Ghent 1356 OVERDF 0 0 0 0 0KY Green River 1357 4 197 404 139 543 334 334 0 334 334KY Green River 1357 5 242 242 35 277 145 145 0 145 145KY Green River 1357 OVERDF 0 0 0 0 0KY H L Spurlock 6041 1 705 602 0 602 601 601 0 601 601KY H L Spurlock 6041 2 1,662 718 0 718 717 717 0 717 717KY H L Spurlock 6041 3 0 368 0 368 367 367 0 367 367KY H L Spurlock 6041 OVERDF 0 0 10 10 0KY Henderson I 1372 6 31 31 31 62 11 11 0 11 11KY HMP&L Station 2 1382 H1 384 214 0 214 213 213 0 213 213KY HMP&L Station 2 1382 H2 430 205 0 205 204 204 0 204 204KY HMP&L Station 2 1382 OVERDF 0 12 0 12 0KY John S. Cooper 1384 CS1 (1, 2) 2,090KY John S. Cooper 1384 1 191 1,045 0 1,045 1,045 0 1,045 1,045KY John S. Cooper 1384 2 403 847 4 851 1,045 0 1,045 847KY John S. Cooper 1384 OVERDF 0 0 725 725 0KY KGen Marshall LLC 55232 CT1 0 0 0 0 0 0 0 0KY KGen Marshall LLC 55232 CT2 0 0 0 0 0 0 0 0KY KGen Marshall LLC 55232 CT3 0 0 0 0 0 0 0 0KY KGen Marshall LLC 55232 CT4 0 0 0 0 0 0 0 0KY KGen Marshall LLC 55232 CT5 0 0 0 0 0 0 0 0KY KGen Marshall LLC 55232 CT6 0 0 0 0 0 0 0 0KY KGen Marshall LLC 55232 CT7 0 0 0 0 0 0 0 0KY KGen Marshall LLC 55232 CT8 0 0 0 0 0 0 0 0KY KGen Marshall LLC 55232 OVERDF 0 0 0 0 0
A-21
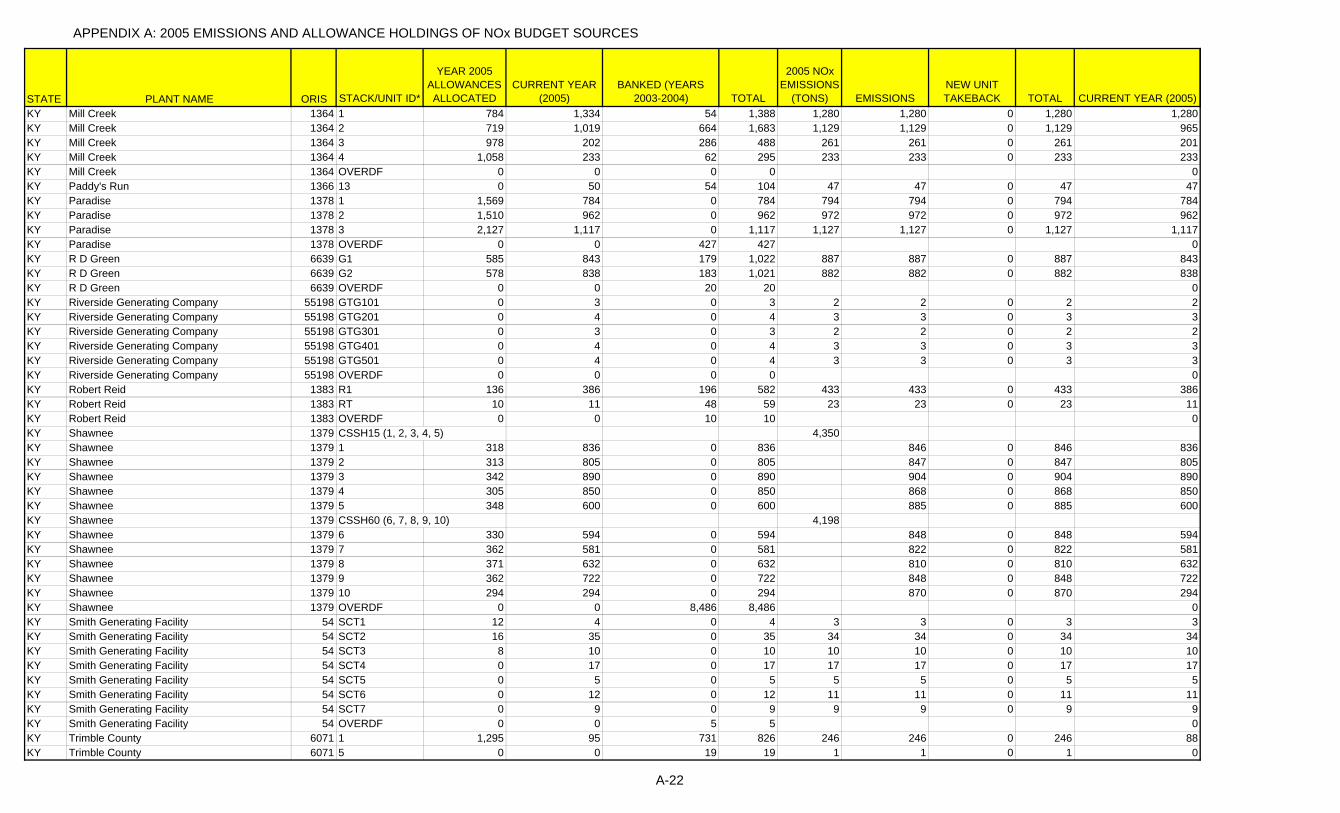
APPENDIX A: 2005 EMISSIONS AND ALLOWANCE HOLDINGS OF NOx BUDGET SOURCES
STATE PLANT NAME ORIS STACK/UNIT ID*
YEAR 2005 ALLOWANCES ALLOCATED
CURRENT YEAR (2005)
BANKED (YEARS 2003-2004) TOTAL
2005 NOx EMISSIONS
(TONS) EMISSIONSNEW UNIT TAKEBACK TOTAL CURRENT YEAR (2005)
KY Mill Creek 1364 1 784 1,334 54 1,388 1,280 1,280 0 1,280 1,280KY Mill Creek 1364 2 719 1,019 664 1,683 1,129 1,129 0 1,129 965KY Mill Creek 1364 3 978 202 286 488 261 261 0 261 201KY Mill Creek 1364 4 1,058 233 62 295 233 233 0 233 233KY Mill Creek 1364 OVERDF 0 0 0 0 0KY Paddy's Run 1366 13 0 50 54 104 47 47 0 47 47KY Paradise 1378 1 1,569 784 0 784 794 794 0 794 784KY Paradise 1378 2 1,510 962 0 962 972 972 0 972 962KY Paradise 1378 3 2,127 1,117 0 1,117 1,127 1,127 0 1,127 1,117KY Paradise 1378 OVERDF 0 0 427 427 0KY R D Green 6639 G1 585 843 179 1,022 887 887 0 887 843KY R D Green 6639 G2 578 838 183 1,021 882 882 0 882 838KY R D Green 6639 OVERDF 0 0 20 20 0KY Riverside Generating Company 55198 GTG101 0 3 0 3 2 2 0 2 2KY Riverside Generating Company 55198 GTG201 0 4 0 4 3 3 0 3 3KY Riverside Generating Company 55198 GTG301 0 3 0 3 2 2 0 2 2KY Riverside Generating Company 55198 GTG401 0 4 0 4 3 3 0 3 3KY Riverside Generating Company 55198 GTG501 0 4 0 4 3 3 0 3 3KY Riverside Generating Company 55198 OVERDF 0 0 0 0 0KY Robert Reid 1383 R1 136 386 196 582 433 433 0 433 386KY Robert Reid 1383 RT 10 11 48 59 23 23 0 23 11KY Robert Reid 1383 OVERDF 0 0 10 10 0KY Shawnee 1379 CSSH15 (1, 2, 3, 4, 5) 4,350KY Shawnee 1379 1 318 836 0 836 846 0 846 836KY Shawnee 1379 2 313 805 0 805 847 0 847 805KY Shawnee 1379 3 342 890 0 890 904 0 904 890KY Shawnee 1379 4 305 850 0 850 868 0 868 850KY Shawnee 1379 5 348 600 0 600 885 0 885 600KY Shawnee 1379 CSSH60 (6, 7, 8, 9, 10) 4,198KY Shawnee 1379 6 330 594 0 594 848 0 848 594KY Shawnee 1379 7 362 581 0 581 822 0 822 581KY Shawnee 1379 8 371 632 0 632 810 0 810 632KY Shawnee 1379 9 362 722 0 722 848 0 848 722KY Shawnee 1379 10 294 294 0 294 870 0 870 294KY Shawnee 1379 OVERDF 0 0 8,486 8,486 0KY Smith Generating Facility 54 SCT1 12 4 0 4 3 3 0 3 3KY Smith Generating Facility 54 SCT2 16 35 0 35 34 34 0 34 34KY Smith Generating Facility 54 SCT3 8 10 0 10 10 10 0 10 10KY Smith Generating Facility 54 SCT4 0 17 0 17 17 17 0 17 17KY Smith Generating Facility 54 SCT5 0 5 0 5 5 5 0 5 5KY Smith Generating Facility 54 SCT6 0 12 0 12 11 11 0 11 11KY Smith Generating Facility 54 SCT7 0 9 0 9 9 9 0 9 9KY Smith Generating Facility 54 OVERDF 0 0 5 5 0KY Trimble County 6071 1 1,295 95 731 826 246 246 0 246 88KY Trimble County 6071 5 0 0 19 19 1 1 0 1 0
A-22
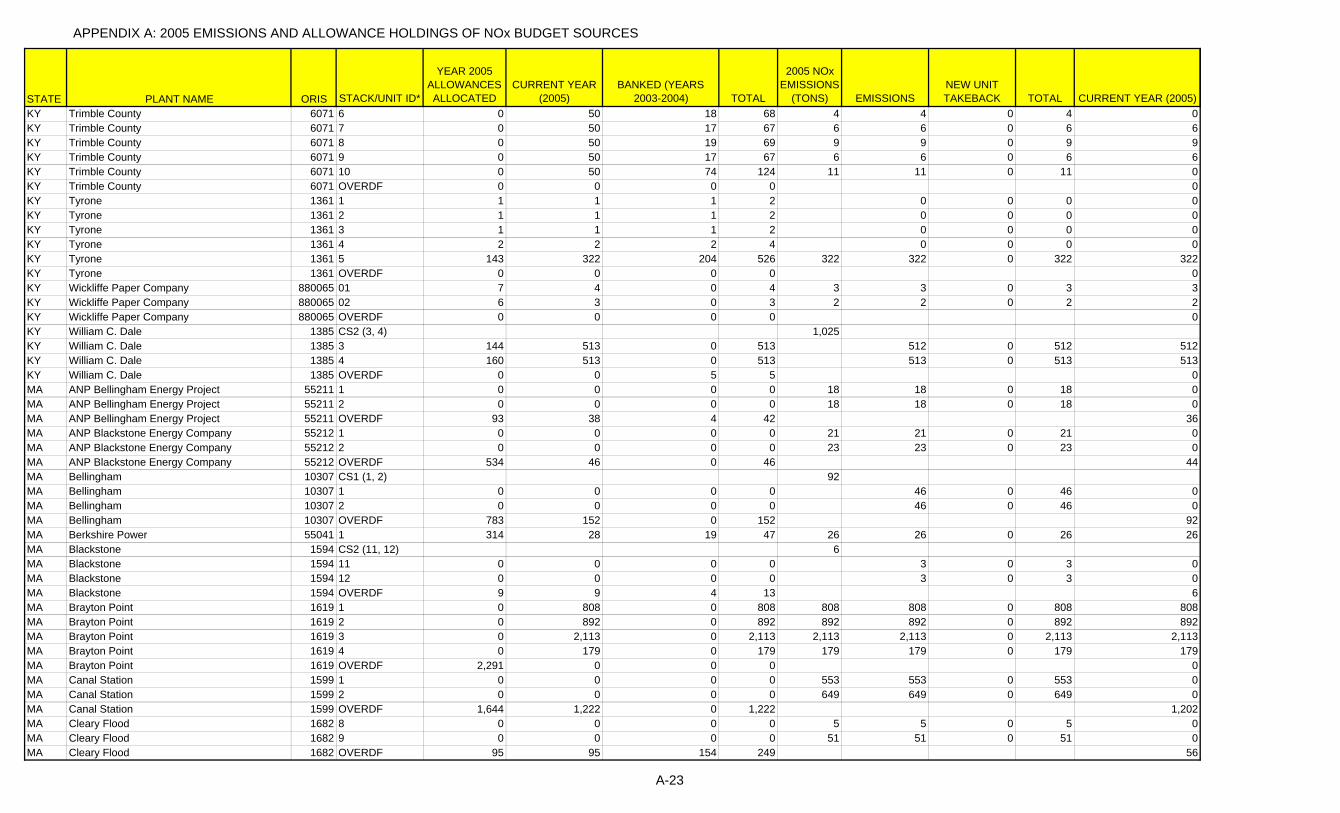
APPENDIX A: 2005 EMISSIONS AND ALLOWANCE HOLDINGS OF NOx BUDGET SOURCES
STATE PLANT NAME ORIS STACK/UNIT ID*
YEAR 2005 ALLOWANCES ALLOCATED
CURRENT YEAR (2005)
BANKED (YEARS 2003-2004) TOTAL
2005 NOx EMISSIONS
(TONS) EMISSIONSNEW UNIT TAKEBACK TOTAL CURRENT YEAR (2005)
KY Trimble County 6071 6 0 50 18 68 4 4 0 4 0KY Trimble County 6071 7 0 50 17 67 6 6 0 6 6KY Trimble County 6071 8 0 50 19 69 9 9 0 9 9KY Trimble County 6071 9 0 50 17 67 6 6 0 6 6KY Trimble County 6071 10 0 50 74 124 11 11 0 11 0KY Trimble County 6071 OVERDF 0 0 0 0 0KY Tyrone 1361 1 1 1 1 2 0 0 0 0KY Tyrone 1361 2 1 1 1 2 0 0 0 0KY Tyrone 1361 3 1 1 1 2 0 0 0 0KY Tyrone 1361 4 2 2 2 4 0 0 0 0KY Tyrone 1361 5 143 322 204 526 322 322 0 322 322KY Tyrone 1361 OVERDF 0 0 0 0 0KY Wickliffe Paper Company 880065 01 7 4 0 4 3 3 0 3 3KY Wickliffe Paper Company 880065 02 6 3 0 3 2 2 0 2 2KY Wickliffe Paper Company 880065 OVERDF 0 0 0 0 0KY William C. Dale 1385 CS2 (3, 4) 1,025KY William C. Dale 1385 3 144 513 0 513 512 0 512 512KY William C. Dale 1385 4 160 513 0 513 513 0 513 513KY William C. Dale 1385 OVERDF 0 0 5 5 0MA ANP Bellingham Energy Project 55211 1 0 0 0 0 18 18 0 18 0MA ANP Bellingham Energy Project 55211 2 0 0 0 0 18 18 0 18 0MA ANP Bellingham Energy Project 55211 OVERDF 93 38 4 42 36MA ANP Blackstone Energy Company 55212 1 0 0 0 0 21 21 0 21 0MA ANP Blackstone Energy Company 55212 2 0 0 0 0 23 23 0 23 0MA ANP Blackstone Energy Company 55212 OVERDF 534 46 0 46 44MA Bellingham 10307 CS1 (1, 2) 92MA Bellingham 10307 1 0 0 0 0 46 0 46 0MA Bellingham 10307 2 0 0 0 0 46 0 46 0MA Bellingham 10307 OVERDF 783 152 0 152 92MA Berkshire Power 55041 1 314 28 19 47 26 26 0 26 26MA Blackstone 1594 CS2 (11, 12) 6MA Blackstone 1594 11 0 0 0 0 3 0 3 0MA Blackstone 1594 12 0 0 0 0 3 0 3 0MA Blackstone 1594 OVERDF 9 9 4 13 6MA Brayton Point 1619 1 0 808 0 808 808 808 0 808 808MA Brayton Point 1619 2 0 892 0 892 892 892 0 892 892MA Brayton Point 1619 3 0 2,113 0 2,113 2,113 2,113 0 2,113 2,113MA Brayton Point 1619 4 0 179 0 179 179 179 0 179 179MA Brayton Point 1619 OVERDF 2,291 0 0 0 0MA Canal Station 1599 1 0 0 0 0 553 553 0 553 0MA Canal Station 1599 2 0 0 0 0 649 649 0 649 0MA Canal Station 1599 OVERDF 1,644 1,222 0 1,222 1,202MA Cleary Flood 1682 8 0 0 0 0 5 5 0 5 0MA Cleary Flood 1682 9 0 0 0 0 51 51 0 51 0MA Cleary Flood 1682 OVERDF 95 95 154 249 56
A-23

APPENDIX A: 2005 EMISSIONS AND ALLOWANCE HOLDINGS OF NOx BUDGET SOURCES
STATE PLANT NAME ORIS STACK/UNIT ID*
YEAR 2005 ALLOWANCES ALLOCATED
CURRENT YEAR (2005)
BANKED (YEARS 2003-2004) TOTAL
2005 NOx EMISSIONS
(TONS) EMISSIONSNEW UNIT TAKEBACK TOTAL CURRENT YEAR (2005)
MA Dartmouth Power 52026 1 147 15 2 17 14 14 0 14 14MA Deer Island Treatment 10823 S42 0 0 0 0 6 6 0 6 0MA Deer Island Treatment 10823 S43 0 0 0 0 2 2 0 2 0MA Deer Island Treatment 10823 OVERDF 38 38 74 112 8MA Dighton 55026 1 272 14 0 14 14 14 0 14 14MA Doreen 1631 10 0 0 5 5 1 1 0 1 0MA Fore River Station 55317 11 0 0 106 106 21 21 0 21 0MA Fore River Station 55317 12 0 0 110 110 21 21 0 21 0MA Fore River Station 55317 OVERDF 149 84 0 84 0MA Framingham Station 1586 FJ-1 0 2 0 2 2 2 0 2 2MA Framingham Station 1586 FJ-2 0 2 0 2 2 2 0 2 2MA Framingham Station 1586 FJ-3 0 2 0 2 2 2 0 2 2MA Framingham Station 1586 OVERDF 0 0 0 0 0MA GE Aircraft Engines Lynn 10029 3 0 0 0 0 18 18 0 18 0MA GE Aircraft Engines Lynn 10029 5 0 0 0 0 3 3 0 3 0MA GE Aircraft Engines Lynn 10029 OVERDF 62 62 83 145 21MA Indeck-Pepperell 10522 CC1 47 0 0 0 0 0 0 0MA Kendall Square 1595 CS12 (1, 2) 7MA Kendall Square 1595 1 0 0 0 0 4 0 4 0MA Kendall Square 1595 2 0 0 0 0 3 0 3 0MA Kendall Square 1595 3 0 0 0 0 4 4 0 4 0MA Kendall Square 1595 4 0 0 0 0 20 20 0 20 0MA Kendall Square 1595 S6 0 0 0 0 24 24 0 24 0MA Kendall Square 1595 OVERDF 256 66 6 72 55MA Kneeland Station 880023 K1 0 2 0 2 35 35 0 35 2MA Kneeland Station 880023 K2 0 1 0 1 44 44 0 44 1MA Kneeland Station 880023 K3 0 0 0 0 55 55 0 55 0MA Kneeland Station 880023 K4 0 0 0 0 10 10 0 10 0MA Kneeland Station 880023 OVERDF 225 152 0 152 141MA Lowell Cogeneration Company 10802 001 26 26 3 29 8 8 0 8 8MA Lowell Power, LLC 54586 1 104 0 0 0 0 0 0 0MA Masspower 10726 1 0 0 0 0 26 26 0 26 0MA Masspower 10726 2 0 0 0 0 28 28 0 28 0MA Masspower 10726 OVERDF 584 54 0 54 54MA Medway Station 1592 J1T1 0 3 0 3 3 3 0 3 3MA Medway Station 1592 J1T2 0 2 0 2 2 2 0 2 2MA Medway Station 1592 J2T1 0 2 0 2 1 1 0 1 1MA Medway Station 1592 J2T2 0 2 0 2 2 2 0 2 2MA Medway Station 1592 J3T1 0 2 0 2 2 2 0 2 2MA Medway Station 1592 J3T2 0 2 0 2 1 1 0 1 1MA Medway Station 1592 OVERDF 2 2 1 3 0MA Milford Power (54805) 54805 1 282 37 1 38 32 32 0 32 32MA Millennium Power Partners 55079 1 437 19 13 32 26 26 0 26 18MA MIT Central Utility 54907 1 111 26 4 30 26 26 0 26 26MA Mount Tom 1606 1 317 567 5 572 560 560 0 560 560
A-24
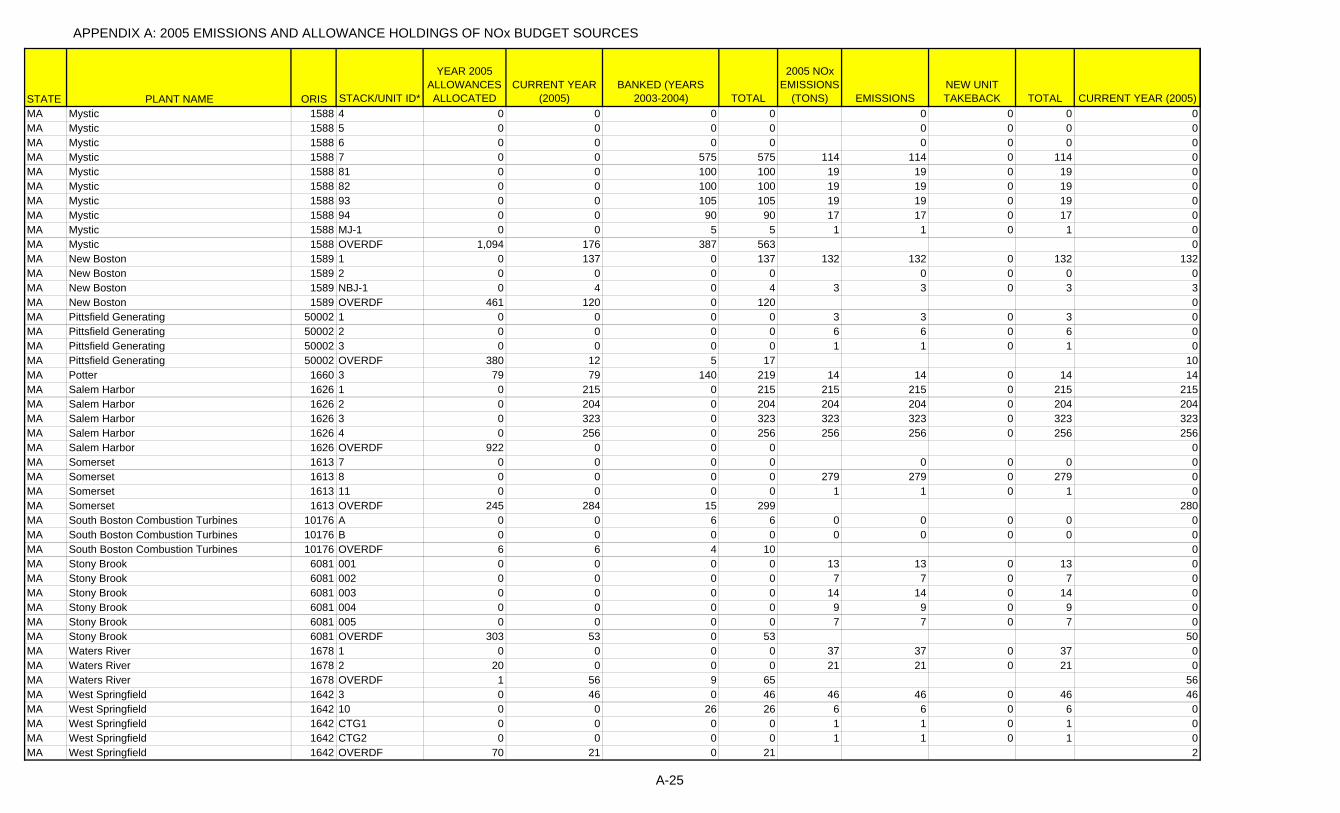
APPENDIX A: 2005 EMISSIONS AND ALLOWANCE HOLDINGS OF NOx BUDGET SOURCES
STATE PLANT NAME ORIS STACK/UNIT ID*
YEAR 2005 ALLOWANCES ALLOCATED
CURRENT YEAR (2005)
BANKED (YEARS 2003-2004) TOTAL
2005 NOx EMISSIONS
(TONS) EMISSIONSNEW UNIT TAKEBACK TOTAL CURRENT YEAR (2005)
MA Mystic 1588 4 0 0 0 0 0 0 0 0MA Mystic 1588 5 0 0 0 0 0 0 0 0MA Mystic 1588 6 0 0 0 0 0 0 0 0MA Mystic 1588 7 0 0 575 575 114 114 0 114 0MA Mystic 1588 81 0 0 100 100 19 19 0 19 0MA Mystic 1588 82 0 0 100 100 19 19 0 19 0MA Mystic 1588 93 0 0 105 105 19 19 0 19 0MA Mystic 1588 94 0 0 90 90 17 17 0 17 0MA Mystic 1588 MJ-1 0 0 5 5 1 1 0 1 0MA Mystic 1588 OVERDF 1,094 176 387 563 0MA New Boston 1589 1 0 137 0 137 132 132 0 132 132MA New Boston 1589 2 0 0 0 0 0 0 0 0MA New Boston 1589 NBJ-1 0 4 0 4 3 3 0 3 3MA New Boston 1589 OVERDF 461 120 0 120 0MA Pittsfield Generating 50002 1 0 0 0 0 3 3 0 3 0MA Pittsfield Generating 50002 2 0 0 0 0 6 6 0 6 0MA Pittsfield Generating 50002 3 0 0 0 0 1 1 0 1 0MA Pittsfield Generating 50002 OVERDF 380 12 5 17 10MA Potter 1660 3 79 79 140 219 14 14 0 14 14MA Salem Harbor 1626 1 0 215 0 215 215 215 0 215 215MA Salem Harbor 1626 2 0 204 0 204 204 204 0 204 204MA Salem Harbor 1626 3 0 323 0 323 323 323 0 323 323MA Salem Harbor 1626 4 0 256 0 256 256 256 0 256 256MA Salem Harbor 1626 OVERDF 922 0 0 0 0MA Somerset 1613 7 0 0 0 0 0 0 0 0MA Somerset 1613 8 0 0 0 0 279 279 0 279 0MA Somerset 1613 11 0 0 0 0 1 1 0 1 0MA Somerset 1613 OVERDF 245 284 15 299 280MA South Boston Combustion Turbines 10176 A 0 0 6 6 0 0 0 0 0MA South Boston Combustion Turbines 10176 B 0 0 0 0 0 0 0 0 0MA South Boston Combustion Turbines 10176 OVERDF 6 6 4 10 0MA Stony Brook 6081 001 0 0 0 0 13 13 0 13 0MA Stony Brook 6081 002 0 0 0 0 7 7 0 7 0MA Stony Brook 6081 003 0 0 0 0 14 14 0 14 0MA Stony Brook 6081 004 0 0 0 0 9 9 0 9 0MA Stony Brook 6081 005 0 0 0 0 7 7 0 7 0MA Stony Brook 6081 OVERDF 303 53 0 53 50MA Waters River 1678 1 0 0 0 0 37 37 0 37 0MA Waters River 1678 2 20 0 0 0 21 21 0 21 0MA Waters River 1678 OVERDF 1 56 9 65 56MA West Springfield 1642 3 0 46 0 46 46 46 0 46 46MA West Springfield 1642 10 0 0 26 26 6 6 0 6 0MA West Springfield 1642 CTG1 0 0 0 0 1 1 0 1 0MA West Springfield 1642 CTG2 0 0 0 0 1 1 0 1 0MA West Springfield 1642 OVERDF 70 21 0 21 2
A-25

APPENDIX A: 2005 EMISSIONS AND ALLOWANCE HOLDINGS OF NOx BUDGET SOURCES
STATE PLANT NAME ORIS STACK/UNIT ID*
YEAR 2005 ALLOWANCES ALLOCATED
CURRENT YEAR (2005)
BANKED (YEARS 2003-2004) TOTAL
2005 NOx EMISSIONS
(TONS) EMISSIONSNEW UNIT TAKEBACK TOTAL CURRENT YEAR (2005)
MA Woodland Road 1643 10 0 0 28 28 12 12 0 12 0MD AES Warrior Run 10678 001 378 176 6 182 179 179 0 179 176MD Brandon Shores 602 1 1,850 484 756 1,240 666 666 0 666 484MD Brandon Shores 602 2 1,819 327 1,496 1,823 694 694 0 694 327MD Brandon Shores 602 OVERDF 0 0 0 0 0MD C P Crane 1552 1 461 852 0 852 843 843 0 843 843MD C P Crane 1552 2 435 1,126 0 1,126 1,115 1,115 0 1,115 1,115MD C P Crane 1552 OVERDF 0 0 0 0 0MD Chalk Point 1571 **GT3 32 20 0 20 20 20 0 20 20MD Chalk Point 1571 **GT4 32 19 0 19 19 19 0 19 19MD Chalk Point 1571 **GT5 54 7 0 7 7 7 0 7 7MD Chalk Point 1571 **GT6 31 21 0 21 21 21 0 21 21MD Chalk Point 1571 CSE12 (1, 2) 4,038MD Chalk Point 1571 1 793 793 0 793 2,156 0 2,156 793MD Chalk Point 1571 2 818 818 0 818 1,882 0 1,882 818MD Chalk Point 1571 3 339 339 0 339 1,410 1,410 0 1,410 339MD Chalk Point 1571 4 408 441 0 441 794 794 0 794 441MD Chalk Point 1571 GT2 1 60 0 60 60 60 0 60 60MD Chalk Point 1571 SMECO 43 33 0 33 33 33 0 33 33MD Chalk Point 1571 OVERDF 0 3,882 0 3,882 3,851MD Dickerson 1572 XS123 (1, 2, 3) 2,089MD Dickerson 1572 1 452 452 0 452 676 0 676 452MD Dickerson 1572 2 441 441 0 441 698 0 698 441MD Dickerson 1572 3 461 570 0 570 715 0 715 570MD Dickerson 1572 GT2 77 31 0 31 31 31 0 31 31MD Dickerson 1572 GT3 89 26 0 26 26 26 0 26 26MD Dickerson 1572 OVERDF 0 646 80 726 626MD Herbert A Wagner 1554 1 74 173 0 173 171 171 0 171 171MD Herbert A Wagner 1554 2 367 929 0 929 920 920 0 920 920MD Herbert A Wagner 1554 3 669 364 0 364 360 360 0 360 360MD Herbert A Wagner 1554 4 156 530 0 530 525 525 0 525 525MD Herbert A Wagner 1554 OVERDF 0 0 0 0 0MD Luke Paper Company 50282 CSPR06 (PR003, PR004, PR005) 900MD Luke Paper Company 50282 PR003 500 510 0 510 509 0 509 509MD Luke Paper Company 50282 PR004 440 390 0 390 389 0 389 389MD Luke Paper Company 50282 PR005 7 2 0 2 2 0 2 2MD Luke Paper Company 50282 OVERDF 0 0 0 0 0MD Morgantown 1573 1 1,231 1,231 0 1,231 2,418 2,418 0 2,418 1,231MD Morgantown 1573 2 1,316 1,316 0 1,316 2,469 2,469 0 2,469 1,316MD Morgantown 1573 GT3 11 11 0 11 58 58 0 58 11MD Morgantown 1573 GT4 13 13 0 13 51 51 0 51 13MD Morgantown 1573 GT5 13 13 0 13 61 61 0 61 13MD Morgantown 1573 GT6 12 12 0 12 59 59 0 59 12MD Morgantown 1573 OVERDF 0 2,534 120 2,654 2,520MD Panda Brandywine 54832 1 109 16 2 18 16 16 0 16 16
A-26
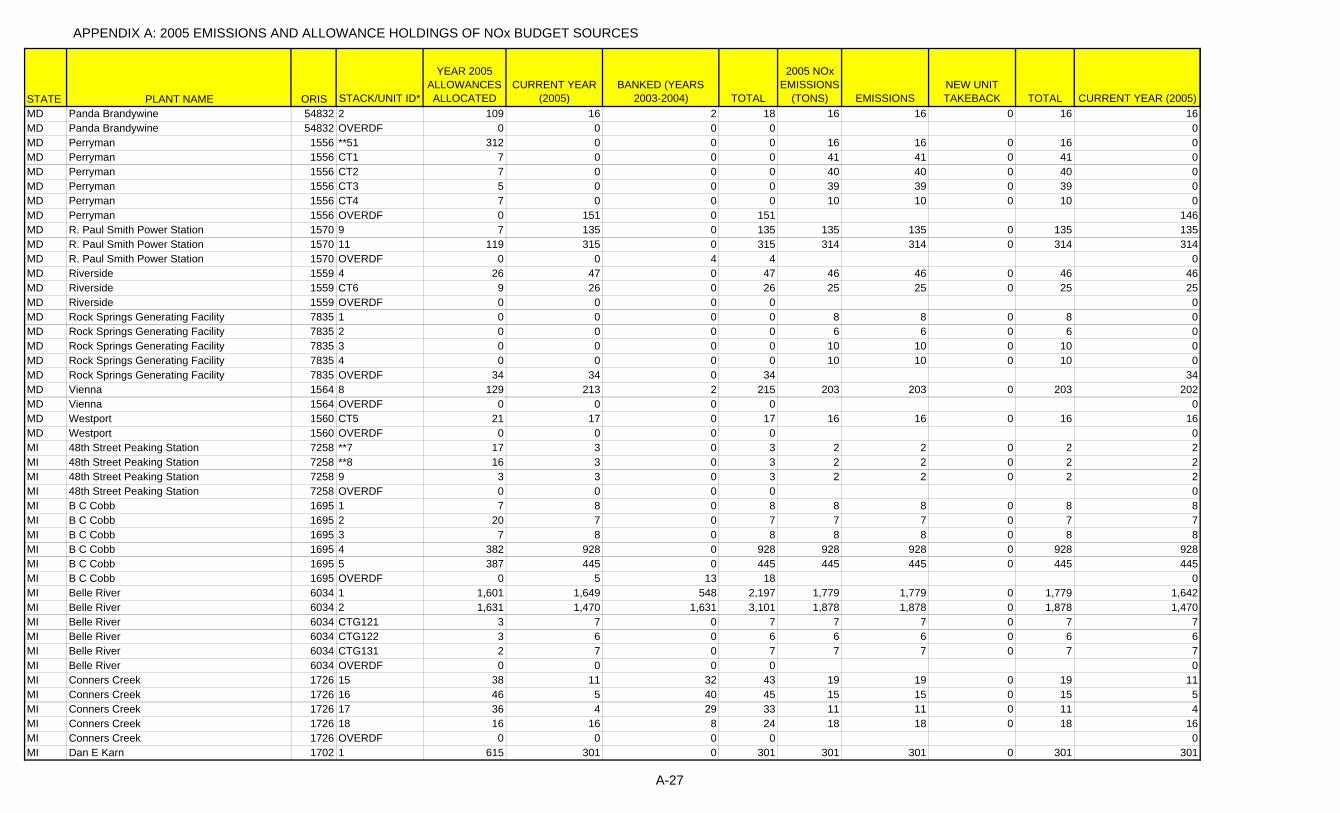
APPENDIX A: 2005 EMISSIONS AND ALLOWANCE HOLDINGS OF NOx BUDGET SOURCES
STATE PLANT NAME ORIS STACK/UNIT ID*
YEAR 2005 ALLOWANCES ALLOCATED
CURRENT YEAR (2005)
BANKED (YEARS 2003-2004) TOTAL
2005 NOx EMISSIONS
(TONS) EMISSIONSNEW UNIT TAKEBACK TOTAL CURRENT YEAR (2005)
MD Panda Brandywine 54832 2 109 16 2 18 16 16 0 16 16MD Panda Brandywine 54832 OVERDF 0 0 0 0 0MD Perryman 1556 **51 312 0 0 0 16 16 0 16 0MD Perryman 1556 CT1 7 0 0 0 41 41 0 41 0MD Perryman 1556 CT2 7 0 0 0 40 40 0 40 0MD Perryman 1556 CT3 5 0 0 0 39 39 0 39 0MD Perryman 1556 CT4 7 0 0 0 10 10 0 10 0MD Perryman 1556 OVERDF 0 151 0 151 146MD R. Paul Smith Power Station 1570 9 7 135 0 135 135 135 0 135 135MD R. Paul Smith Power Station 1570 11 119 315 0 315 314 314 0 314 314MD R. Paul Smith Power Station 1570 OVERDF 0 0 4 4 0MD Riverside 1559 4 26 47 0 47 46 46 0 46 46MD Riverside 1559 CT6 9 26 0 26 25 25 0 25 25MD Riverside 1559 OVERDF 0 0 0 0 0MD Rock Springs Generating Facility 7835 1 0 0 0 0 8 8 0 8 0MD Rock Springs Generating Facility 7835 2 0 0 0 0 6 6 0 6 0MD Rock Springs Generating Facility 7835 3 0 0 0 0 10 10 0 10 0MD Rock Springs Generating Facility 7835 4 0 0 0 0 10 10 0 10 0MD Rock Springs Generating Facility 7835 OVERDF 34 34 0 34 34MD Vienna 1564 8 129 213 2 215 203 203 0 203 202MD Vienna 1564 OVERDF 0 0 0 0 0MD Westport 1560 CT5 21 17 0 17 16 16 0 16 16MD Westport 1560 OVERDF 0 0 0 0 0MI 48th Street Peaking Station 7258 **7 17 3 0 3 2 2 0 2 2MI 48th Street Peaking Station 7258 **8 16 3 0 3 2 2 0 2 2MI 48th Street Peaking Station 7258 9 3 3 0 3 2 2 0 2 2MI 48th Street Peaking Station 7258 OVERDF 0 0 0 0 0MI B C Cobb 1695 1 7 8 0 8 8 8 0 8 8MI B C Cobb 1695 2 20 7 0 7 7 7 0 7 7MI B C Cobb 1695 3 7 8 0 8 8 8 0 8 8MI B C Cobb 1695 4 382 928 0 928 928 928 0 928 928MI B C Cobb 1695 5 387 445 0 445 445 445 0 445 445MI B C Cobb 1695 OVERDF 0 5 13 18 0MI Belle River 6034 1 1,601 1,649 548 2,197 1,779 1,779 0 1,779 1,642MI Belle River 6034 2 1,631 1,470 1,631 3,101 1,878 1,878 0 1,878 1,470MI Belle River 6034 CTG121 3 7 0 7 7 7 0 7 7MI Belle River 6034 CTG122 3 6 0 6 6 6 0 6 6MI Belle River 6034 CTG131 2 7 0 7 7 7 0 7 7MI Belle River 6034 OVERDF 0 0 0 0 0MI Conners Creek 1726 15 38 11 32 43 19 19 0 19 11MI Conners Creek 1726 16 46 5 40 45 15 15 0 15 5MI Conners Creek 1726 17 36 4 29 33 11 11 0 11 4MI Conners Creek 1726 18 16 16 8 24 18 18 0 18 16MI Conners Creek 1726 OVERDF 0 0 0 0 0MI Dan E Karn 1702 1 615 301 0 301 301 301 0 301 301
A-27
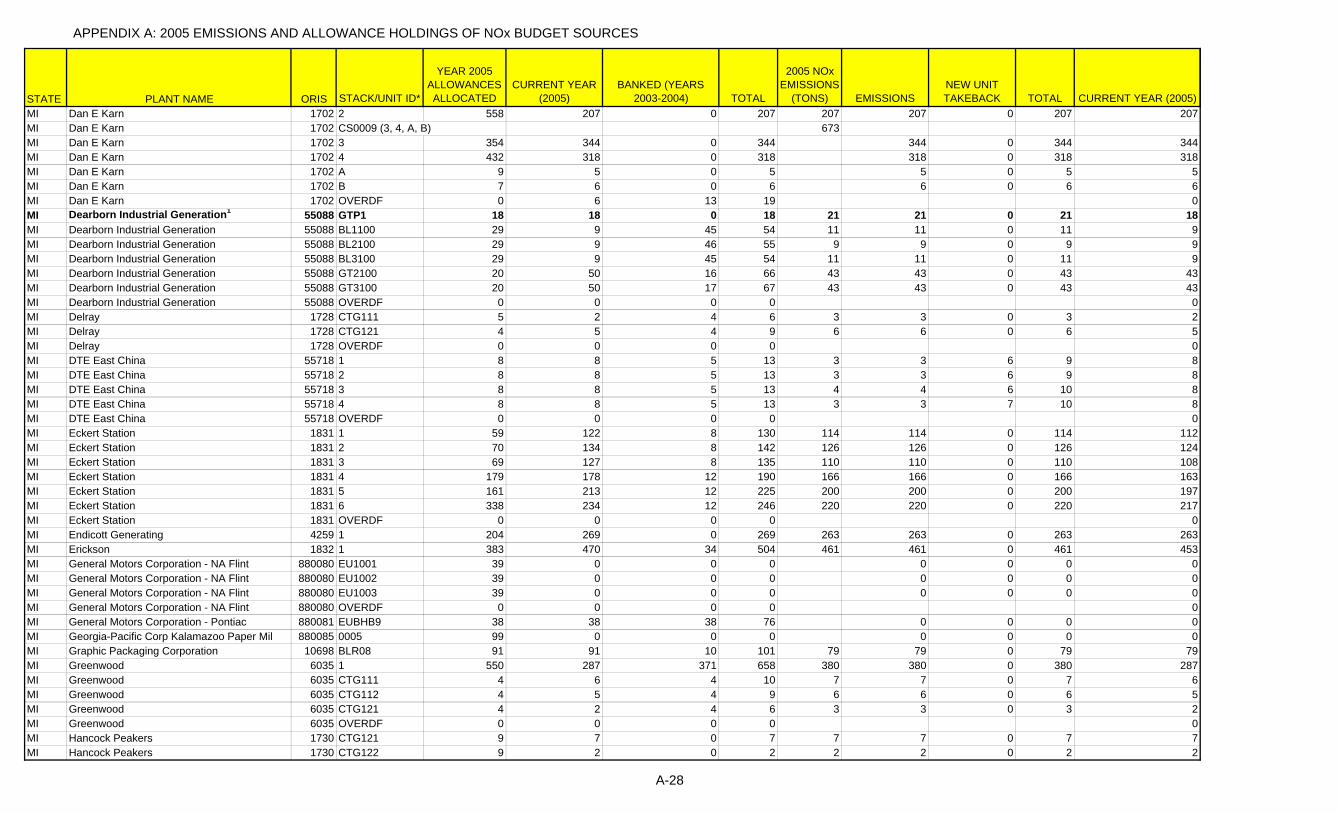
APPENDIX A: 2005 EMISSIONS AND ALLOWANCE HOLDINGS OF NOx BUDGET SOURCES
STATE PLANT NAME ORIS STACK/UNIT ID*
YEAR 2005 ALLOWANCES ALLOCATED
CURRENT YEAR (2005)
BANKED (YEARS 2003-2004) TOTAL
2005 NOx EMISSIONS
(TONS) EMISSIONSNEW UNIT TAKEBACK TOTAL CURRENT YEAR (2005)
MI Dan E Karn 1702 2 558 207 0 207 207 207 0 207 207MI Dan E Karn 1702 CS0009 (3, 4, A, B) 673MI Dan E Karn 1702 3 354 344 0 344 344 0 344 344MI Dan E Karn 1702 4 432 318 0 318 318 0 318 318MI Dan E Karn 1702 A 9 5 0 5 5 0 5 5MI Dan E Karn 1702 B 7 6 0 6 6 0 6 6MI Dan E Karn 1702 OVERDF 0 6 13 19 0MI Dearborn Industrial Generation1 55088 GTP1 18 18 0 18 21 21 0 21 18MI Dearborn Industrial Generation 55088 BL1100 29 9 45 54 11 11 0 11 9MI Dearborn Industrial Generation 55088 BL2100 29 9 46 55 9 9 0 9 9MI Dearborn Industrial Generation 55088 BL3100 29 9 45 54 11 11 0 11 9MI Dearborn Industrial Generation 55088 GT2100 20 50 16 66 43 43 0 43 43MI Dearborn Industrial Generation 55088 GT3100 20 50 17 67 43 43 0 43 43MI Dearborn Industrial Generation 55088 OVERDF 0 0 0 0 0MI Delray 1728 CTG111 5 2 4 6 3 3 0 3 2MI Delray 1728 CTG121 4 5 4 9 6 6 0 6 5MI Delray 1728 OVERDF 0 0 0 0 0MI DTE East China 55718 1 8 8 5 13 3 3 6 9 8MI DTE East China 55718 2 8 8 5 13 3 3 6 9 8MI DTE East China 55718 3 8 8 5 13 4 4 6 10 8MI DTE East China 55718 4 8 8 5 13 3 3 7 10 8MI DTE East China 55718 OVERDF 0 0 0 0 0MI Eckert Station 1831 1 59 122 8 130 114 114 0 114 112MI Eckert Station 1831 2 70 134 8 142 126 126 0 126 124MI Eckert Station 1831 3 69 127 8 135 110 110 0 110 108MI Eckert Station 1831 4 179 178 12 190 166 166 0 166 163MI Eckert Station 1831 5 161 213 12 225 200 200 0 200 197MI Eckert Station 1831 6 338 234 12 246 220 220 0 220 217MI Eckert Station 1831 OVERDF 0 0 0 0 0MI Endicott Generating 4259 1 204 269 0 269 263 263 0 263 263MI Erickson 1832 1 383 470 34 504 461 461 0 461 453MI General Motors Corporation - NA Flint 880080 EU1001 39 0 0 0 0 0 0 0MI General Motors Corporation - NA Flint 880080 EU1002 39 0 0 0 0 0 0 0MI General Motors Corporation - NA Flint 880080 EU1003 39 0 0 0 0 0 0 0MI General Motors Corporation - NA Flint 880080 OVERDF 0 0 0 0 0MI General Motors Corporation - Pontiac 880081 EUBHB9 38 38 38 76 0 0 0 0MI Georgia-Pacific Corp Kalamazoo Paper Mil 880085 0005 99 0 0 0 0 0 0 0MI Graphic Packaging Corporation 10698 BLR08 91 91 10 101 79 79 0 79 79MI Greenwood 6035 1 550 287 371 658 380 380 0 380 287MI Greenwood 6035 CTG111 4 6 4 10 7 7 0 7 6MI Greenwood 6035 CTG112 4 5 4 9 6 6 0 6 5MI Greenwood 6035 CTG121 4 2 4 6 3 3 0 3 2MI Greenwood 6035 OVERDF 0 0 0 0 0MI Hancock Peakers 1730 CTG121 9 7 0 7 7 7 0 7 7MI Hancock Peakers 1730 CTG122 9 2 0 2 2 2 0 2 2
A-28

APPENDIX A: 2005 EMISSIONS AND ALLOWANCE HOLDINGS OF NOx BUDGET SOURCES
STATE PLANT NAME ORIS STACK/UNIT ID*
YEAR 2005 ALLOWANCES ALLOCATED
CURRENT YEAR (2005)
BANKED (YEARS 2003-2004) TOTAL
2005 NOx EMISSIONS
(TONS) EMISSIONSNEW UNIT TAKEBACK TOTAL CURRENT YEAR (2005)
MI Hancock Peakers 1730 OVERDF 0 0 0 0 0MI Harbor Beach 1731 1 112 440 0 440 440 440 0 440 440MI J B Sims 1825 3 179 237 0 237 237 237 0 237 237MI J C Weadock 1720 CS0009 (7, 8) 1,540MI J C Weadock 1720 7 362 830 0 830 830 0 830 830MI J C Weadock 1720 8 366 380 1,318 1,698 710 0 710 380MI J C Weadock 1720 OVERDF 0 2 13 15 0MI J H Campbell 1710 CS0009 (1, 2) 2,481MI J H Campbell 1710 1 528 755 0 755 755 0 755 755MI J H Campbell 1710 2 753 1,726 0 1,726 1,726 0 1,726 1,726MI J H Campbell 1710 3 1,852 4,449 0 4,449 4,448 4,448 0 4,448 4,448MI J H Campbell 1710 OVERDF 0 3 13 16 0MI J R Whiting 1723 1 223 223 822 1,045 429 429 0 429 223MI J R Whiting 1723 2 217 217 974 1,191 461 461 0 461 217MI J R Whiting 1723 3 306 306 282 588 377 377 0 377 306MI J R Whiting 1723 OVERDF 0 3 14 17 0MI Jackson MI Facility 55270 7EA 49 49 37 86 11 11 39 50 49MI Jackson MI Facility 55270 LM1 24 24 18 42 7 7 27 34 24MI Jackson MI Facility 55270 LM2 25 25 18 43 8 8 27 35 25MI Jackson MI Facility 55270 LM3 25 25 18 43 10 10 24 34 25MI Jackson MI Facility 55270 LM4 25 25 18 43 7 7 28 35 25MI Jackson MI Facility 55270 LM5 25 25 18 43 10 10 24 34 25MI Jackson MI Facility 55270 LM6 25 25 18 43 8 8 27 35 25MI Jackson MI Facility 55270 OVERDF 0 0 0 0 0MI James De Young 1830 5 128 155 32 187 172 172 0 172 155MI Kalamazoo River Generating Station 55101 1 3 4 2 6 4 4 0 4 4MI Marysville 1732 CS0001 (9, 10) 0MI Marysville 1732 9 22 0 0 0 0 0 0 0MI Marysville 1732 10 27 0 0 0 0 0 0 0MI Marysville 1732 CS0002 (11, 12) 0MI Marysville 1732 11 27 0 0 0 0 0 0 0MI Marysville 1732 12 23 0 0 0 0 0 0 0MI Marysville 1732 OVERDF 0 0 0 0 0MI Menasha Corp. 55799 0024 59 10 4 14 11 11 0 11 10MI Menasha Corp. 55799 0025 62 11 2 13 11 11 0 11 11MI Menasha Corp. 55799 OVERDF 0 0 0 0 0MI Midland Cogeneration Venture 10745 003 237 0 0 0 189 189 0 189 0MI Midland Cogeneration Venture 10745 004 237 0 0 0 149 149 0 149 0MI Midland Cogeneration Venture 10745 005 237 0 0 0 194 194 0 194 0MI Midland Cogeneration Venture 10745 006 238 0 0 0 179 179 0 179 0MI Midland Cogeneration Venture 10745 007 225 0 0 0 61 61 0 61 0MI Midland Cogeneration Venture 10745 008 238 0 0 0 54 54 0 54 0MI Midland Cogeneration Venture 10745 009 228 0 0 0 49 49 0 49 0MI Midland Cogeneration Venture 10745 010 231 0 0 0 79 79 0 79 0MI Midland Cogeneration Venture 10745 011 239 0 0 0 44 44 0 44 0
A-29

APPENDIX A: 2005 EMISSIONS AND ALLOWANCE HOLDINGS OF NOx BUDGET SOURCES
STATE PLANT NAME ORIS STACK/UNIT ID*
YEAR 2005 ALLOWANCES ALLOCATED
CURRENT YEAR (2005)
BANKED (YEARS 2003-2004) TOTAL
2005 NOx EMISSIONS
(TONS) EMISSIONSNEW UNIT TAKEBACK TOTAL CURRENT YEAR (2005)
MI Midland Cogeneration Venture 10745 012 216 0 0 0 35 35 0 35 0MI Midland Cogeneration Venture 10745 013 237 0 0 0 112 112 0 112 0MI Midland Cogeneration Venture 10745 014 229 0 0 0 140 140 0 140 0MI Midland Cogeneration Venture 10745 OVERDF 0 1,312 0 1,312 1,285MI Mirant Zeeland, LLC 55087 CC1 25 26 16 42 6 6 29 35 26MI Mirant Zeeland, LLC 55087 CC2 25 25 17 42 3 3 33 36 25MI Mirant Zeeland, LLC 55087 CC3 10 24 7 31 24 24 5 29 24MI Mirant Zeeland, LLC 55087 CC4 10 20 7 27 20 20 4 24 20MI Mirant Zeeland, LLC 55087 OVERDF 0 6 0 6 0MI Mistersky 1822 5 39 0 0 0 77 77 0 77 0MI Mistersky 1822 6 85 0 0 0 170 170 0 170 0MI Mistersky 1822 7 99 0 0 0 78 78 0 78 0MI Mistersky 1822 GT-1 46 0 0 0 17 17 0 17 0MI Mistersky 1822 OVERDF 0 269 128 397 269MI Monroe 1733 CS0012 (1, 2) 5,018MI Monroe 1733 1 1,855 2,434 14 2,448 2,438 0 2,438 2,434MI Monroe 1733 2 1,516 2,580 0 2,580 2,580 0 2,580 2,580MI Monroe 1733 CS0034 (3, 4) 6,892MI Monroe 1733 3 1,678 3,426 0 3,426 3,426 0 3,426 3,426MI Monroe 1733 4 1,813 3,276 765 4,041 3,466 0 3,466 3,276MI Monroe 1733 OVERDF 0 0 0 0 0MI New Covert Generating Project 55297 001 10 11 7 18 9 9 7 16 11MI New Covert Generating Project 55297 002 10 10 7 17 10 10 5 15 10MI New Covert Generating Project 55297 003 10 12 8 20 11 11 6 17 12MI New Covert Generating Project 55297 OVERDF 0 0 0 0 0MI Renaissance Power 55402 CT1 14 14 12 26 19 19 0 19 14MI Renaissance Power 55402 CT2 15 13 12 25 15 15 3 18 13MI Renaissance Power 55402 CT3 15 17 12 29 24 24 0 24 17MI Renaissance Power 55402 CT4 15 15 12 27 22 22 0 22 15MI Renaissance Power 55402 OVERDF 0 0 0 0 0MI River Rouge2 1740 1 0 3 0 3 4 4 0 4 3MI River Rouge 1740 2 611 555 0 555 555 555 0 555 555MI River Rouge 1740 3 636 1,041 0 1,041 1,041 1,041 0 1,041 1,041MI River Rouge 1740 OVERDF 0 0 0 0 0MI St. Clair 1743 1 346 1,234 100 1,334 1,259 1,259 0 1,259 1,234MI St. Clair 1743 2 309 620 100 720 645 645 0 645 620MI St. Clair 1743 3 343 636 100 736 661 661 0 661 636MI St. Clair 1743 4 341 587 61 648 602 602 0 602 587MI St. Clair 1743 5 0 0 0 0 0 0 0 0MI St. Clair 1743 6 630 447 180 627 492 492 0 492 447MI St. Clair 1743 7 888 747 85 832 768 768 0 768 747MI St. Clair 1743 OVERDF 0 0 0 0 0MI Sumpter Plant 7972 1 12 12 9 21 3 3 12 15 12MI Sumpter Plant 7972 2 12 12 8 20 3 3 12 15 12MI Sumpter Plant 7972 3 12 12 8 20 3 3 12 15 12
A-30

APPENDIX A: 2005 EMISSIONS AND ALLOWANCE HOLDINGS OF NOx BUDGET SOURCES
STATE PLANT NAME ORIS STACK/UNIT ID*
YEAR 2005 ALLOWANCES ALLOCATED
CURRENT YEAR (2005)
BANKED (YEARS 2003-2004) TOTAL
2005 NOx EMISSIONS
(TONS) EMISSIONSNEW UNIT TAKEBACK TOTAL CURRENT YEAR (2005)
MI Sumpter Plant 7972 4 12 12 8 20 4 4 12 16 12MI Sumpter Plant 7972 OVERDF 0 0 14 14 0MI T B Simon Power Plant 10328 UNIT1 86 0 1 1 101 101 0 101 0MI T B Simon Power Plant 10328 UNIT2 75 0 0 0 76 76 0 76 0MI T B Simon Power Plant 10328 UNIT3 190 0 1 1 128 128 0 128 0MI T B Simon Power Plant 10328 UNIT4 90 0 1 1 39 39 0 39 0MI T B Simon Power Plant 10328 OVERDF 0 341 0 341 341MI Thetford 1719 1 7 17 0 17 17 17 0 17 17MI Thetford 1719 2 7 19 0 19 19 19 0 19 19MI Thetford 1719 3 7 20 0 20 20 20 0 20 20MI Thetford 1719 4 6 21 0 21 21 21 0 21 21MI Thetford 1719 OVERDF 0 0 13 13 0MI Trenton Channel 1745 CS0006 (16, 17, 18, 19) 1,348MI Trenton Channel 1745 16 151 345 4 349 346 0 346 345MI Trenton Channel 1745 17 138 332 5 337 333 0 333 332MI Trenton Channel 1745 18 141 332 5 337 333 0 333 332MI Trenton Channel 1745 19 142 335 5 340 336 0 336 335MI Trenton Channel 1745 9A 1,046 854 1,001 1,855 1,104 1,104 0 1,104 854MI Trenton Channel 1745 OVERDF 0 0 0 0 0MI University of Michigan 880045 260-03 57 49 23 72 55 55 0 55 49MI University of Michigan 880045 260-04 45 29 27 56 36 36 0 36 29MI University of Michigan 880045 260-06 33 0 14 14 3 3 0 3 0MI University of Michigan 880045 OVERDF 0 0 0 0 0MI Wyandotte 1866 5 10 0 0 0 0 0 0 0MI Wyandotte 1866 7 99 165 50 215 201 201 0 201 165MI Wyandotte 1866 8 113 57 0 57 57 57 0 57 57MI Wyandotte 1866 OVERDF 0 4 0 4 4NC Asheville 2706 1 598 842 0 842 842 842 0 842 842NC Asheville 2706 2 583 906 0 906 906 906 0 906 906NC Asheville 2706 3 75 28 0 28 29 29 0 29 28NC Asheville 2706 4 75 21 0 21 22 22 0 22 21NC Asheville 2706 OVERDF 0 0 24 24 0NC Belews Creek 8042 1 2,806 0 0 0 1,125 1,125 0 1,125 0NC Belews Creek 8042 2 3,270 844 404 1,248 944 944 0 944 843NC Belews Creek 8042 OVERDF 0 1,055 321 1,376 1,055NC Blue Ridge Paper Products Inc. 50244 B4 456 0 0 0 178 178 0 178 0NC Blue Ridge Paper Products Inc. 50244 BB 265 0 0 0 160 160 0 160 0NC Blue Ridge Paper Products Inc. 50244 PG 234 0 0 0 190 190 0 190 0NC Blue Ridge Paper Products Inc. 50244 RB 169 0 0 0 227 227 0 227 0NC Blue Ridge Paper Products Inc. 50244 RC 447 0 0 0 186 186 0 186 0NC Blue Ridge Paper Products Inc. 50244 OVERDF 0 921 35 956 921NC Buck 2720 5 72 0 0 0 118 118 0 118 0NC Buck 2720 6 79 0 0 0 127 127 0 127 0NC Buck 2720 7 84 0 0 0 161 161 0 161 0NC Buck 2720 8 346 0 0 0 327 327 0 327 0
A-31

APPENDIX A: 2005 EMISSIONS AND ALLOWANCE HOLDINGS OF NOx BUDGET SOURCES
STATE PLANT NAME ORIS STACK/UNIT ID*
YEAR 2005 ALLOWANCES ALLOCATED
CURRENT YEAR (2005)
BANKED (YEARS 2003-2004) TOTAL
2005 NOx EMISSIONS
(TONS) EMISSIONSNEW UNIT TAKEBACK TOTAL CURRENT YEAR (2005)
NC Buck 2720 9 366 0 0 0 335 335 0 335 0NC Buck 2720 7C 0 0 0 0 4 4 0 4 0NC Buck 2720 8C 0 0 0 0 3 3 0 3 0NC Buck 2720 9C 0 0 0 0 3 3 0 3 0NC Buck 2720 OVERDF 0 899 739 1,638 899NC Butler-Warner Generation Plant 1016 GT-1 33 41 9 50 36 36 0 36 36NC Butler-Warner Generation Plant 1016 GT-2 33 33 11 44 27 27 0 27 27NC Butler-Warner Generation Plant 1016 GT-3 33 33 11 44 24 24 0 24 24NC Butler-Warner Generation Plant 1016 GT-4 33 33 34 67 3 3 0 3 3NC Butler-Warner Generation Plant 1016 GT-5 43 28 34 62 3 3 0 3 3NC Butler-Warner Generation Plant 1016 GT-6 35 35 19 54 28 28 0 28 28NC Butler-Warner Generation Plant 1016 GT-7 33 38 19 57 33 33 0 33 33NC Butler-Warner Generation Plant 1016 GT-8 33 35 10 45 30 30 0 30 30NC Butler-Warner Generation Plant 1016 OVERDF 0 0 0 0 0NC Cape Fear 2708 5 311 329 0 329 329 329 0 329 329NC Cape Fear 2708 6 441 518 0 518 518 518 0 518 518NC Cape Fear 2708 OVERDF 0 0 13 13 0NC Cliffside 2721 1 82 0 0 0 165 165 0 165 0NC Cliffside 2721 2 88 0 0 0 140 140 0 140 0NC Cliffside 2721 3 116 0 0 0 195 195 0 195 0NC Cliffside 2721 4 130 0 0 0 217 217 0 217 0NC Cliffside 2721 5 1,436 0 0 0 518 518 0 518 0NC Cliffside 2721 OVERDF 0 1,065 721 1,786 1,065NC Cogentrix-Rocky Mount 50468 CS001 (BLR01A, BLR01B) 339NC Cogentrix-Rocky Mount 50468 BLR01A 398 0 0 0 170 0 170 0NC Cogentrix-Rocky Mount 50468 BLR01B 0 0 0 0 169 0 169 0NC Cogentrix-Rocky Mount 50468 CS002 (BLR02A, BLR02B) 326NC Cogentrix-Rocky Mount 50468 BLR02A 0 0 0 0 163 0 163 0NC Cogentrix-Rocky Mount 50468 BLR02B 0 0 0 0 163 0 163 0NC Cogentrix-Rocky Mount 50468 OVERDF 0 682 16 698 665NC Dan River 2723 1 143 0 0 0 229 229 0 229 0NC Dan River 2723 2 156 0 0 0 243 243 0 243 0NC Dan River 2723 3 329 0 0 0 422 422 0 422 0NC Dan River 2723 4C 0 0 0 0 4 4 0 4 0NC Dan River 2723 5C 0 0 0 0 4 4 0 4 0NC Dan River 2723 6C 0 0 0 0 5 5 0 5 0NC Dan River 2723 OVERDF 0 737 724 1,461 737NC Elizabethtown Power 10380 CS1 (UNIT1, UNIT2) 0NC Elizabethtown Power 10380 UNIT1 143 0 0 0 0 0 0 0NC Elizabethtown Power 10380 UNIT2 0 0 0 0 0 0 0 0NC Elizabethtown Power 10380 OVERDF 0 0 0 0 0NC G G Allen 2718 1 378 0 0 0 253 253 0 253 0NC G G Allen 2718 2 385 0 0 0 315 315 0 315 0NC G G Allen 2718 3 638 0 0 0 699 699 0 699 0NC G G Allen 2718 4 572 0 0 0 798 798 0 798 0
A-32
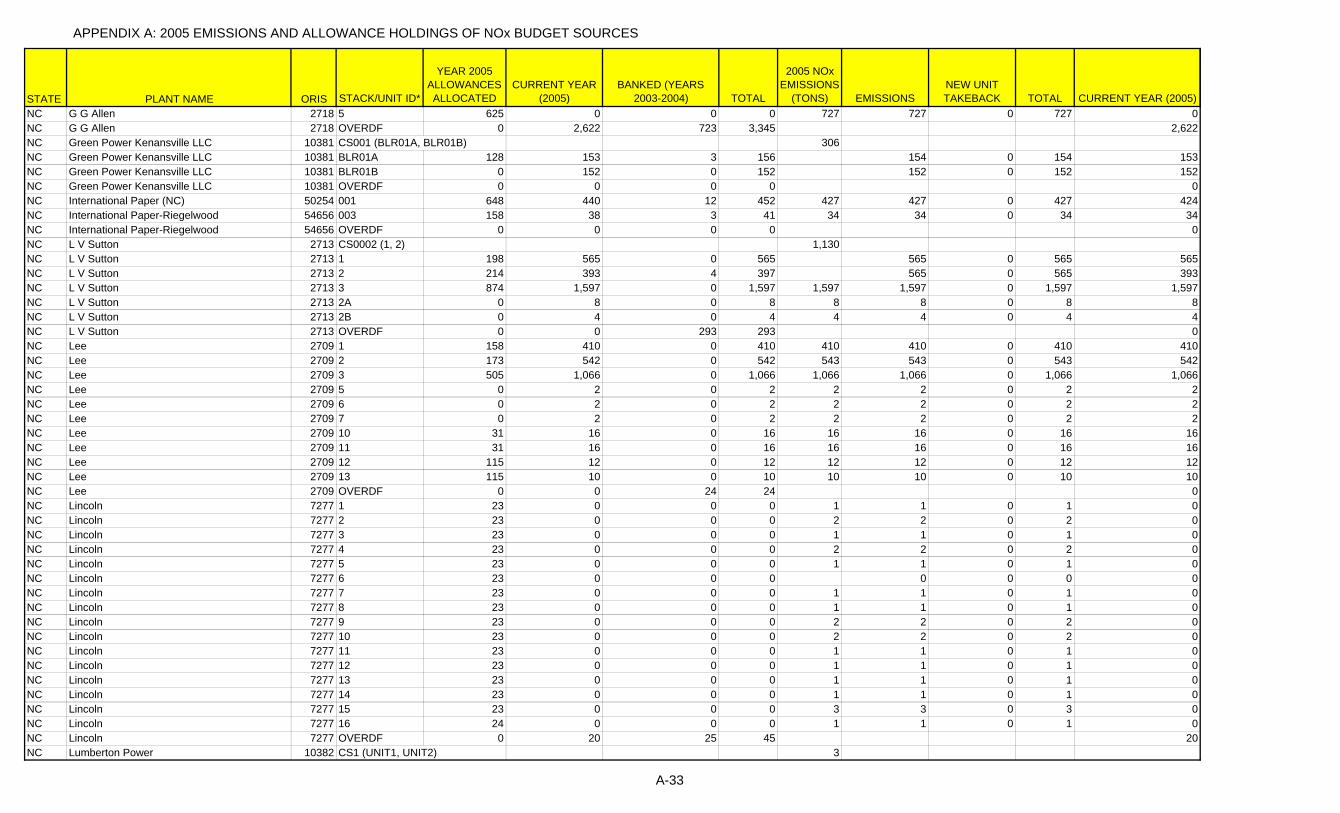
APPENDIX A: 2005 EMISSIONS AND ALLOWANCE HOLDINGS OF NOx BUDGET SOURCES
STATE PLANT NAME ORIS STACK/UNIT ID*
YEAR 2005 ALLOWANCES ALLOCATED
CURRENT YEAR (2005)
BANKED (YEARS 2003-2004) TOTAL
2005 NOx EMISSIONS
(TONS) EMISSIONSNEW UNIT TAKEBACK TOTAL CURRENT YEAR (2005)
NC G G Allen 2718 5 625 0 0 0 727 727 0 727 0NC G G Allen 2718 OVERDF 0 2,622 723 3,345 2,622NC Green Power Kenansville LLC 10381 CS001 (BLR01A, BLR01B) 306NC Green Power Kenansville LLC 10381 BLR01A 128 153 3 156 154 0 154 153NC Green Power Kenansville LLC 10381 BLR01B 0 152 0 152 152 0 152 152NC Green Power Kenansville LLC 10381 OVERDF 0 0 0 0 0NC International Paper (NC) 50254 001 648 440 12 452 427 427 0 427 424NC International Paper-Riegelwood 54656 003 158 38 3 41 34 34 0 34 34NC International Paper-Riegelwood 54656 OVERDF 0 0 0 0 0NC L V Sutton 2713 CS0002 (1, 2) 1,130NC L V Sutton 2713 1 198 565 0 565 565 0 565 565NC L V Sutton 2713 2 214 393 4 397 565 0 565 393NC L V Sutton 2713 3 874 1,597 0 1,597 1,597 1,597 0 1,597 1,597NC L V Sutton 2713 2A 0 8 0 8 8 8 0 8 8NC L V Sutton 2713 2B 0 4 0 4 4 4 0 4 4NC L V Sutton 2713 OVERDF 0 0 293 293 0NC Lee 2709 1 158 410 0 410 410 410 0 410 410NC Lee 2709 2 173 542 0 542 543 543 0 543 542NC Lee 2709 3 505 1,066 0 1,066 1,066 1,066 0 1,066 1,066NC Lee 2709 5 0 2 0 2 2 2 0 2 2NC Lee 2709 6 0 2 0 2 2 2 0 2 2NC Lee 2709 7 0 2 0 2 2 2 0 2 2NC Lee 2709 10 31 16 0 16 16 16 0 16 16NC Lee 2709 11 31 16 0 16 16 16 0 16 16NC Lee 2709 12 115 12 0 12 12 12 0 12 12NC Lee 2709 13 115 10 0 10 10 10 0 10 10NC Lee 2709 OVERDF 0 0 24 24 0NC Lincoln 7277 1 23 0 0 0 1 1 0 1 0NC Lincoln 7277 2 23 0 0 0 2 2 0 2 0NC Lincoln 7277 3 23 0 0 0 1 1 0 1 0NC Lincoln 7277 4 23 0 0 0 2 2 0 2 0NC Lincoln 7277 5 23 0 0 0 1 1 0 1 0NC Lincoln 7277 6 23 0 0 0 0 0 0 0NC Lincoln 7277 7 23 0 0 0 1 1 0 1 0NC Lincoln 7277 8 23 0 0 0 1 1 0 1 0NC Lincoln 7277 9 23 0 0 0 2 2 0 2 0NC Lincoln 7277 10 23 0 0 0 2 2 0 2 0NC Lincoln 7277 11 23 0 0 0 1 1 0 1 0NC Lincoln 7277 12 23 0 0 0 1 1 0 1 0NC Lincoln 7277 13 23 0 0 0 1 1 0 1 0NC Lincoln 7277 14 23 0 0 0 1 1 0 1 0NC Lincoln 7277 15 23 0 0 0 3 3 0 3 0NC Lincoln 7277 16 24 0 0 0 1 1 0 1 0NC Lincoln 7277 OVERDF 0 20 25 45 20NC Lumberton Power 10382 CS1 (UNIT1, UNIT2) 3
A-33

APPENDIX A: 2005 EMISSIONS AND ALLOWANCE HOLDINGS OF NOx BUDGET SOURCES
STATE PLANT NAME ORIS STACK/UNIT ID*
YEAR 2005 ALLOWANCES ALLOCATED
CURRENT YEAR (2005)
BANKED (YEARS 2003-2004) TOTAL
2005 NOx EMISSIONS
(TONS) EMISSIONSNEW UNIT TAKEBACK TOTAL CURRENT YEAR (2005)
NC Lumberton Power 10382 UNIT1 142 0 0 0 2 0 2 0NC Lumberton Power 10382 UNIT2 0 0 0 0 1 0 1 0NC Lumberton Power 10382 OVERDF 0 3 0 3 3NC Marshall 2727 1 1,094 0 0 0 1,047 1,047 0 1,047 0NC Marshall 2727 2 1,143 0 0 0 1,179 1,179 0 1,179 0NC Marshall 2727 3 1,932 0 0 0 1,825 1,825 0 1,825 0NC Marshall 2727 4 1,911 0 0 0 1,965 1,965 0 1,965 0NC Marshall 2727 OVERDF 0 5,847 720 6,567 5,847NC Mayo 6250 CS0005 (1A, 1B) 557NC Mayo 6250 1A 2,155 278 0 278 278 0 278 278NC Mayo 6250 1B 0 278 0 278 279 0 279 278NC Mayo 6250 OVERDF 0 0 10 10 0NC Primary Energy Roxboro 10379 CS001 (BLR01A, BLR01B, BLR01C) 269NC Primary Energy Roxboro 10379 BLR01A 218 0 12 12 90 0 90 0NC Primary Energy Roxboro 10379 BLR01B 0 0 0 0 90 0 90 0NC Primary Energy Roxboro 10379 BLR01C 0 0 0 0 89 0 89 0NC Primary Energy Roxboro 10379 OVERDF 0 270 0 270 261NC Primary Energy Southport 10378 CS001 (BLR01A, BLR01B, BLR01C) 299NC Primary Energy Southport 10378 BLR01A 444 0 0 0 100 0 100 0NC Primary Energy Southport 10378 BLR01B 0 0 0 0 100 0 100 0NC Primary Energy Southport 10378 BLR01C 0 0 0 0 99 0 99 0NC Primary Energy Southport 10378 CS002 (BLR02A, BLR02B, BLR02C) 339NC Primary Energy Southport 10378 BLR02A 0 0 0 0 113 0 113 0NC Primary Energy Southport 10378 BLR02B 0 0 0 0 113 0 113 0NC Primary Energy Southport 10378 BLR02C 0 0 0 0 113 0 113 0NC Primary Energy Southport 10378 OVERDF 0 639 16 655 638NC Richmond County Plant 7805 1 27 19 0 19 19 19 0 19 19NC Richmond County Plant 7805 2 27 18 0 18 18 18 0 18 18NC Richmond County Plant 7805 3 27 18 0 18 18 18 0 18 18NC Richmond County Plant 7805 4 27 19 0 19 19 19 0 19 19NC Richmond County Plant 7805 6 27 13 0 13 13 13 0 13 13NC Richmond County Plant 7805 7 28 12 0 12 12 12 0 12 12NC Richmond County Plant 7805 8 0 14 0 14 14 14 0 14 14NC Richmond County Plant 7805 OVERDF 0 0 13 13 0NC Riverbend 2732 7 234 0 0 0 262 262 0 262 0NC Riverbend 2732 8 243 0 0 0 259 259 0 259 0NC Riverbend 2732 9 308 0 0 0 309 309 0 309 0NC Riverbend 2732 10 324 0 0 0 325 325 0 325 0NC Riverbend 2732 8C 0 0 0 0 6 6 0 6 0NC Riverbend 2732 9C 0 0 0 0 1 1 0 1 0NC Riverbend 2732 10C 0 0 0 0 4 4 0 4 0NC Riverbend 2732 11C 0 0 0 0 6 6 0 6 0NC Riverbend 2732 OVERDF 0 1,005 720 1,725 1,005NC Rockingham Power 55116 CT1 42 28 30 58 3 3 0 3 3NC Rockingham Power 55116 CT2 42 24 30 54 3 3 0 3 3
A-34
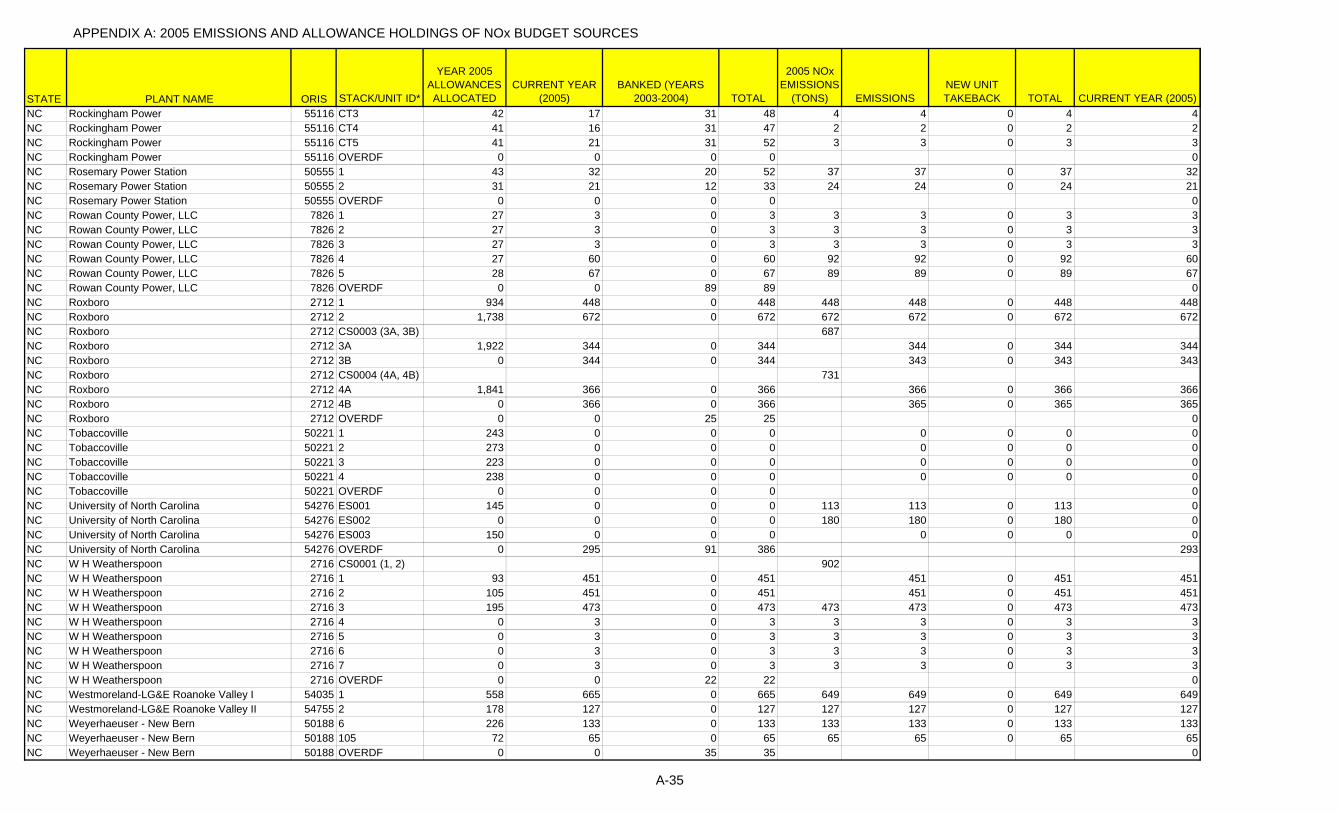
APPENDIX A: 2005 EMISSIONS AND ALLOWANCE HOLDINGS OF NOx BUDGET SOURCES
STATE PLANT NAME ORIS STACK/UNIT ID*
YEAR 2005 ALLOWANCES ALLOCATED
CURRENT YEAR (2005)
BANKED (YEARS 2003-2004) TOTAL
2005 NOx EMISSIONS
(TONS) EMISSIONSNEW UNIT TAKEBACK TOTAL CURRENT YEAR (2005)
NC Rockingham Power 55116 CT3 42 17 31 48 4 4 0 4 4NC Rockingham Power 55116 CT4 41 16 31 47 2 2 0 2 2NC Rockingham Power 55116 CT5 41 21 31 52 3 3 0 3 3NC Rockingham Power 55116 OVERDF 0 0 0 0 0NC Rosemary Power Station 50555 1 43 32 20 52 37 37 0 37 32NC Rosemary Power Station 50555 2 31 21 12 33 24 24 0 24 21NC Rosemary Power Station 50555 OVERDF 0 0 0 0 0NC Rowan County Power, LLC 7826 1 27 3 0 3 3 3 0 3 3NC Rowan County Power, LLC 7826 2 27 3 0 3 3 3 0 3 3NC Rowan County Power, LLC 7826 3 27 3 0 3 3 3 0 3 3NC Rowan County Power, LLC 7826 4 27 60 0 60 92 92 0 92 60NC Rowan County Power, LLC 7826 5 28 67 0 67 89 89 0 89 67NC Rowan County Power, LLC 7826 OVERDF 0 0 89 89 0NC Roxboro 2712 1 934 448 0 448 448 448 0 448 448NC Roxboro 2712 2 1,738 672 0 672 672 672 0 672 672NC Roxboro 2712 CS0003 (3A, 3B) 687NC Roxboro 2712 3A 1,922 344 0 344 344 0 344 344NC Roxboro 2712 3B 0 344 0 344 343 0 343 343NC Roxboro 2712 CS0004 (4A, 4B) 731NC Roxboro 2712 4A 1,841 366 0 366 366 0 366 366NC Roxboro 2712 4B 0 366 0 366 365 0 365 365NC Roxboro 2712 OVERDF 0 0 25 25 0NC Tobaccoville 50221 1 243 0 0 0 0 0 0 0NC Tobaccoville 50221 2 273 0 0 0 0 0 0 0NC Tobaccoville 50221 3 223 0 0 0 0 0 0 0NC Tobaccoville 50221 4 238 0 0 0 0 0 0 0NC Tobaccoville 50221 OVERDF 0 0 0 0 0NC University of North Carolina 54276 ES001 145 0 0 0 113 113 0 113 0NC University of North Carolina 54276 ES002 0 0 0 0 180 180 0 180 0NC University of North Carolina 54276 ES003 150 0 0 0 0 0 0 0NC University of North Carolina 54276 OVERDF 0 295 91 386 293NC W H Weatherspoon 2716 CS0001 (1, 2) 902NC W H Weatherspoon 2716 1 93 451 0 451 451 0 451 451NC W H Weatherspoon 2716 2 105 451 0 451 451 0 451 451NC W H Weatherspoon 2716 3 195 473 0 473 473 473 0 473 473NC W H Weatherspoon 2716 4 0 3 0 3 3 3 0 3 3NC W H Weatherspoon 2716 5 0 3 0 3 3 3 0 3 3NC W H Weatherspoon 2716 6 0 3 0 3 3 3 0 3 3NC W H Weatherspoon 2716 7 0 3 0 3 3 3 0 3 3NC W H Weatherspoon 2716 OVERDF 0 0 22 22 0NC Westmoreland-LG&E Roanoke Valley I 54035 1 558 665 0 665 649 649 0 649 649NC Westmoreland-LG&E Roanoke Valley II 54755 2 178 127 0 127 127 127 0 127 127NC Weyerhaeuser - New Bern 50188 6 226 133 0 133 133 133 0 133 133NC Weyerhaeuser - New Bern 50188 105 72 65 0 65 65 65 0 65 65NC Weyerhaeuser - New Bern 50188 OVERDF 0 0 35 35 0
A-35
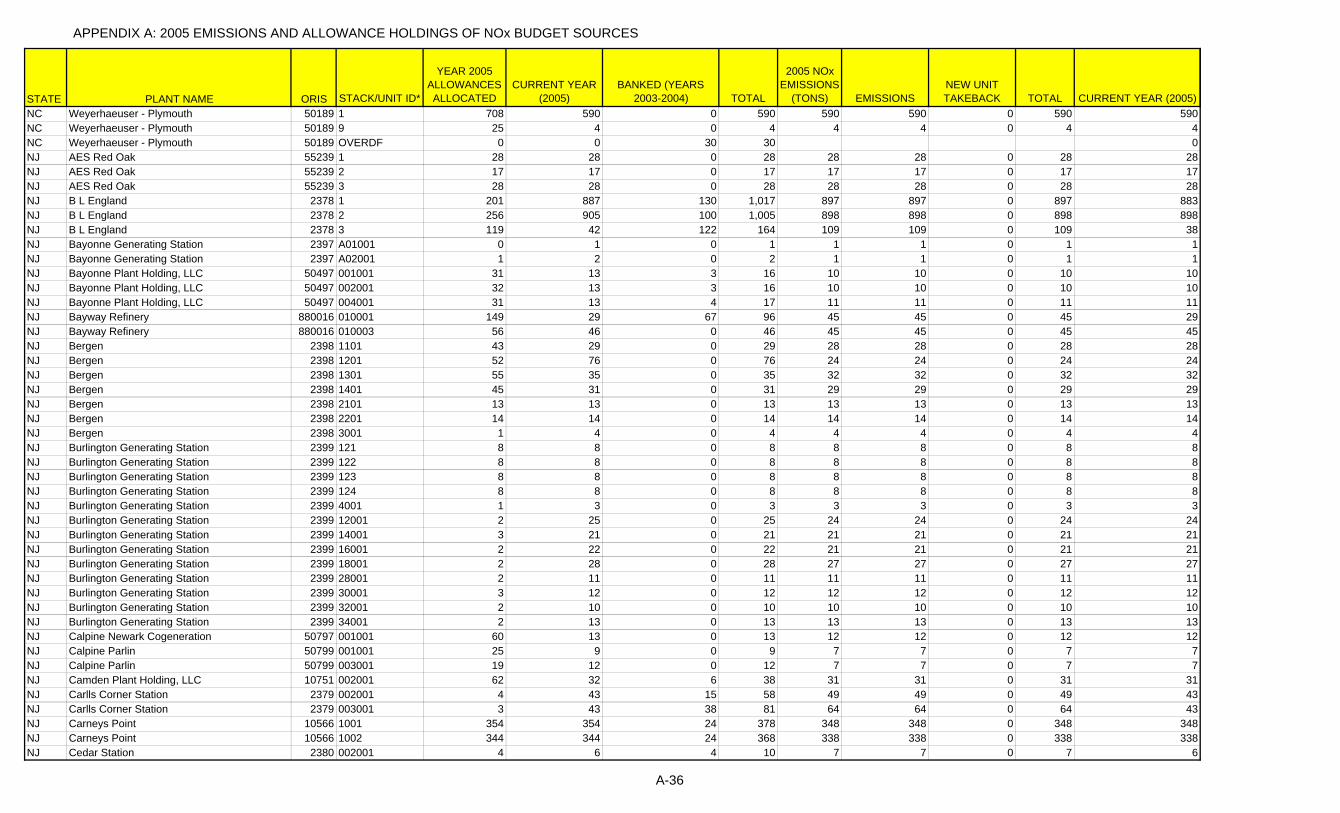
APPENDIX A: 2005 EMISSIONS AND ALLOWANCE HOLDINGS OF NOx BUDGET SOURCES
STATE PLANT NAME ORIS STACK/UNIT ID*
YEAR 2005 ALLOWANCES ALLOCATED
CURRENT YEAR (2005)
BANKED (YEARS 2003-2004) TOTAL
2005 NOx EMISSIONS
(TONS) EMISSIONSNEW UNIT TAKEBACK TOTAL CURRENT YEAR (2005)
NC Weyerhaeuser - Plymouth 50189 1 708 590 0 590 590 590 0 590 590NC Weyerhaeuser - Plymouth 50189 9 25 4 0 4 4 4 0 4 4NC Weyerhaeuser - Plymouth 50189 OVERDF 0 0 30 30 0NJ AES Red Oak 55239 1 28 28 0 28 28 28 0 28 28NJ AES Red Oak 55239 2 17 17 0 17 17 17 0 17 17NJ AES Red Oak 55239 3 28 28 0 28 28 28 0 28 28NJ B L England 2378 1 201 887 130 1,017 897 897 0 897 883NJ B L England 2378 2 256 905 100 1,005 898 898 0 898 898NJ B L England 2378 3 119 42 122 164 109 109 0 109 38NJ Bayonne Generating Station 2397 A01001 0 1 0 1 1 1 0 1 1NJ Bayonne Generating Station 2397 A02001 1 2 0 2 1 1 0 1 1NJ Bayonne Plant Holding, LLC 50497 001001 31 13 3 16 10 10 0 10 10NJ Bayonne Plant Holding, LLC 50497 002001 32 13 3 16 10 10 0 10 10NJ Bayonne Plant Holding, LLC 50497 004001 31 13 4 17 11 11 0 11 11NJ Bayway Refinery 880016 010001 149 29 67 96 45 45 0 45 29NJ Bayway Refinery 880016 010003 56 46 0 46 45 45 0 45 45NJ Bergen 2398 1101 43 29 0 29 28 28 0 28 28NJ Bergen 2398 1201 52 76 0 76 24 24 0 24 24NJ Bergen 2398 1301 55 35 0 35 32 32 0 32 32NJ Bergen 2398 1401 45 31 0 31 29 29 0 29 29NJ Bergen 2398 2101 13 13 0 13 13 13 0 13 13NJ Bergen 2398 2201 14 14 0 14 14 14 0 14 14NJ Bergen 2398 3001 1 4 0 4 4 4 0 4 4NJ Burlington Generating Station 2399 121 8 8 0 8 8 8 0 8 8NJ Burlington Generating Station 2399 122 8 8 0 8 8 8 0 8 8NJ Burlington Generating Station 2399 123 8 8 0 8 8 8 0 8 8NJ Burlington Generating Station 2399 124 8 8 0 8 8 8 0 8 8NJ Burlington Generating Station 2399 4001 1 3 0 3 3 3 0 3 3NJ Burlington Generating Station 2399 12001 2 25 0 25 24 24 0 24 24NJ Burlington Generating Station 2399 14001 3 21 0 21 21 21 0 21 21NJ Burlington Generating Station 2399 16001 2 22 0 22 21 21 0 21 21NJ Burlington Generating Station 2399 18001 2 28 0 28 27 27 0 27 27NJ Burlington Generating Station 2399 28001 2 11 0 11 11 11 0 11 11NJ Burlington Generating Station 2399 30001 3 12 0 12 12 12 0 12 12NJ Burlington Generating Station 2399 32001 2 10 0 10 10 10 0 10 10NJ Burlington Generating Station 2399 34001 2 13 0 13 13 13 0 13 13NJ Calpine Newark Cogeneration 50797 001001 60 13 0 13 12 12 0 12 12NJ Calpine Parlin 50799 001001 25 9 0 9 7 7 0 7 7NJ Calpine Parlin 50799 003001 19 12 0 12 7 7 0 7 7NJ Camden Plant Holding, LLC 10751 002001 62 32 6 38 31 31 0 31 31NJ Carlls Corner Station 2379 002001 4 43 15 58 49 49 0 49 43NJ Carlls Corner Station 2379 003001 3 43 38 81 64 64 0 64 43NJ Carneys Point 10566 1001 354 354 24 378 348 348 0 348 348NJ Carneys Point 10566 1002 344 344 24 368 338 338 0 338 338NJ Cedar Station 2380 002001 4 6 4 10 7 7 0 7 6
A-36

APPENDIX A: 2005 EMISSIONS AND ALLOWANCE HOLDINGS OF NOx BUDGET SOURCES
STATE PLANT NAME ORIS STACK/UNIT ID*
YEAR 2005 ALLOWANCES ALLOCATED
CURRENT YEAR (2005)
BANKED (YEARS 2003-2004) TOTAL
2005 NOx EMISSIONS
(TONS) EMISSIONSNEW UNIT TAKEBACK TOTAL CURRENT YEAR (2005)
NJ Cedar Station 2380 003001 4 6 7 13 8 8 0 8 6NJ Cedar Station 2380 004001 6 7 6 13 9 9 0 9 7NJ Cumberland 5083 004001 21 7 14 21 14 14 0 14 7NJ Deepwater 2384 1 32 100 18 118 104 104 0 104 100NJ Deepwater 2384 8 141 437 29 466 428 428 0 428 428NJ DSM Nutritional Products, Inc 54416 189003 48 48 35 83 27 27 0 27 27NJ E F Kenilworth, Inc. 10805 002001 54 54 9 63 49 49 0 49 49NJ Edison 2400 1001 6 20 0 20 20 20 0 20 20NJ Edison 2400 3001 6 17 0 17 17 17 0 17 17NJ Edison 2400 5001 7 15 0 15 14 14 0 14 14NJ Edison 2400 7001 7 12 0 12 12 12 0 12 12NJ Edison 2400 9001 4 5 0 5 4 4 0 4 4NJ Edison 2400 11001 5 5 0 5 4 4 0 4 4NJ Edison 2400 13001 5 5 0 5 5 5 0 5 5NJ Edison 2400 15001 5 4 0 4 4 4 0 4 4NJ Edison 2400 17001 7 10 0 10 9 9 0 9 9NJ Edison 2400 19001 6 10 0 10 9 9 0 9 9NJ Edison 2400 21001 5 10 0 10 10 10 0 10 10NJ Edison 2400 23001 5 11 0 11 11 11 0 11 11NJ Essex 2401 2001 7 26 0 26 26 26 0 26 26NJ Essex 2401 4001 7 25 0 25 24 24 0 24 24NJ Essex 2401 10001 6 26 0 26 26 26 0 26 26NJ Essex 2401 12001 6 22 0 22 22 22 0 22 22NJ Essex 2401 14001 8 49 0 49 48 48 0 48 48NJ Essex 2401 16001 6 44 0 44 43 43 0 43 43NJ Essex 2401 18001 7 47 0 47 46 46 0 46 46NJ Essex 2401 20001 6 48 0 48 48 48 0 48 48NJ Essex 2401 22001 8 50 0 50 49 49 0 49 49NJ Essex 2401 24001 7 27 0 27 27 27 0 27 27NJ Essex 2401 26001 7 45 0 45 45 45 0 45 45NJ Essex 2401 28001 8 45 0 45 45 45 0 45 45NJ Essex 2401 35001 19 15 0 15 15 15 0 15 15NJ Forked River 7138 002001 16 17 11 28 16 16 0 16 16NJ Forked River 7138 003001 8 7 0 7 6 6 0 6 6NJ Gilbert Generating Station 2393 04 35 26 0 26 24 24 0 24 24NJ Gilbert Generating Station 2393 05 39 24 0 24 22 22 0 22 22NJ Gilbert Generating Station 2393 06 33 25 0 25 23 23 0 23 23NJ Gilbert Generating Station 2393 07 37 23 0 23 21 21 0 21 21NJ Gilbert Generating Station 2393 9 18 14 0 14 12 12 0 12 12NJ Gilbert Generating Station 2393 015001 1 2 0 2 1 1 0 1 1NJ Gilbert Generating Station 2393 016001 1 2 0 2 1 1 0 1 1NJ Gilbert Generating Station 2393 017001 1 2 0 2 1 1 0 1 1NJ Gilbert Generating Station 2393 018001 1 2 0 2 1 1 0 1 1NJ Glen Gardner 8227 003001 2 3 0 3 2 2 0 2 2NJ Glen Gardner 8227 004001 2 3 0 3 2 2 0 2 2
A-37
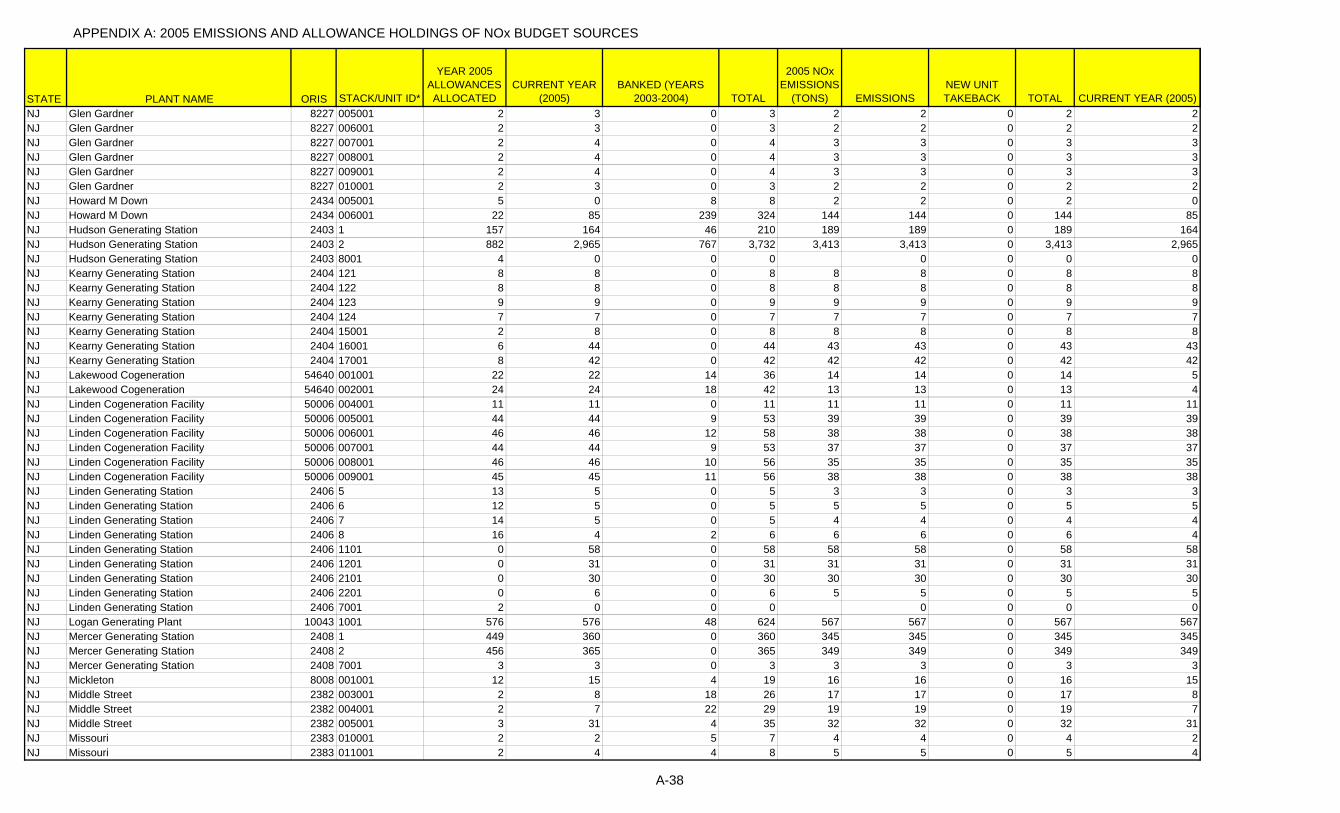
APPENDIX A: 2005 EMISSIONS AND ALLOWANCE HOLDINGS OF NOx BUDGET SOURCES
STATE PLANT NAME ORIS STACK/UNIT ID*
YEAR 2005 ALLOWANCES ALLOCATED
CURRENT YEAR (2005)
BANKED (YEARS 2003-2004) TOTAL
2005 NOx EMISSIONS
(TONS) EMISSIONSNEW UNIT TAKEBACK TOTAL CURRENT YEAR (2005)
NJ Glen Gardner 8227 005001 2 3 0 3 2 2 0 2 2NJ Glen Gardner 8227 006001 2 3 0 3 2 2 0 2 2NJ Glen Gardner 8227 007001 2 4 0 4 3 3 0 3 3NJ Glen Gardner 8227 008001 2 4 0 4 3 3 0 3 3NJ Glen Gardner 8227 009001 2 4 0 4 3 3 0 3 3NJ Glen Gardner 8227 010001 2 3 0 3 2 2 0 2 2NJ Howard M Down 2434 005001 5 0 8 8 2 2 0 2 0NJ Howard M Down 2434 006001 22 85 239 324 144 144 0 144 85NJ Hudson Generating Station 2403 1 157 164 46 210 189 189 0 189 164NJ Hudson Generating Station 2403 2 882 2,965 767 3,732 3,413 3,413 0 3,413 2,965NJ Hudson Generating Station 2403 8001 4 0 0 0 0 0 0 0NJ Kearny Generating Station 2404 121 8 8 0 8 8 8 0 8 8NJ Kearny Generating Station 2404 122 8 8 0 8 8 8 0 8 8NJ Kearny Generating Station 2404 123 9 9 0 9 9 9 0 9 9NJ Kearny Generating Station 2404 124 7 7 0 7 7 7 0 7 7NJ Kearny Generating Station 2404 15001 2 8 0 8 8 8 0 8 8NJ Kearny Generating Station 2404 16001 6 44 0 44 43 43 0 43 43NJ Kearny Generating Station 2404 17001 8 42 0 42 42 42 0 42 42NJ Lakewood Cogeneration 54640 001001 22 22 14 36 14 14 0 14 5NJ Lakewood Cogeneration 54640 002001 24 24 18 42 13 13 0 13 4NJ Linden Cogeneration Facility 50006 004001 11 11 0 11 11 11 0 11 11NJ Linden Cogeneration Facility 50006 005001 44 44 9 53 39 39 0 39 39NJ Linden Cogeneration Facility 50006 006001 46 46 12 58 38 38 0 38 38NJ Linden Cogeneration Facility 50006 007001 44 44 9 53 37 37 0 37 37NJ Linden Cogeneration Facility 50006 008001 46 46 10 56 35 35 0 35 35NJ Linden Cogeneration Facility 50006 009001 45 45 11 56 38 38 0 38 38NJ Linden Generating Station 2406 5 13 5 0 5 3 3 0 3 3NJ Linden Generating Station 2406 6 12 5 0 5 5 5 0 5 5NJ Linden Generating Station 2406 7 14 5 0 5 4 4 0 4 4NJ Linden Generating Station 2406 8 16 4 2 6 6 6 0 6 4NJ Linden Generating Station 2406 1101 0 58 0 58 58 58 0 58 58NJ Linden Generating Station 2406 1201 0 31 0 31 31 31 0 31 31NJ Linden Generating Station 2406 2101 0 30 0 30 30 30 0 30 30NJ Linden Generating Station 2406 2201 0 6 0 6 5 5 0 5 5NJ Linden Generating Station 2406 7001 2 0 0 0 0 0 0 0NJ Logan Generating Plant 10043 1001 576 576 48 624 567 567 0 567 567NJ Mercer Generating Station 2408 1 449 360 0 360 345 345 0 345 345NJ Mercer Generating Station 2408 2 456 365 0 365 349 349 0 349 349NJ Mercer Generating Station 2408 7001 3 3 0 3 3 3 0 3 3NJ Mickleton 8008 001001 12 15 4 19 16 16 0 16 15NJ Middle Street 2382 003001 2 8 18 26 17 17 0 17 8NJ Middle Street 2382 004001 2 7 22 29 19 19 0 19 7NJ Middle Street 2382 005001 3 31 4 35 32 32 0 32 31NJ Missouri 2383 010001 2 2 5 7 4 4 0 4 2NJ Missouri 2383 011001 2 4 4 8 5 5 0 5 4
A-38
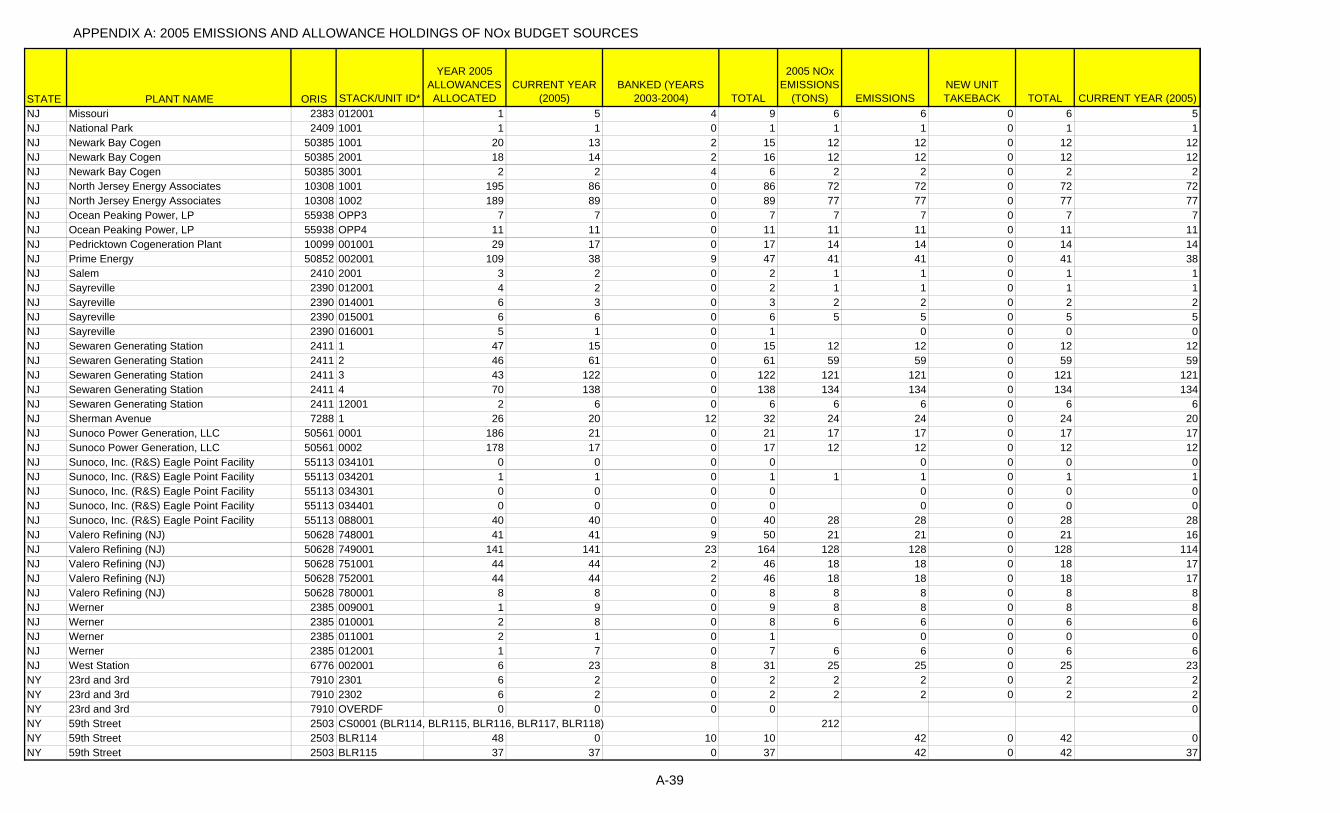
APPENDIX A: 2005 EMISSIONS AND ALLOWANCE HOLDINGS OF NOx BUDGET SOURCES
STATE PLANT NAME ORIS STACK/UNIT ID*
YEAR 2005 ALLOWANCES ALLOCATED
CURRENT YEAR (2005)
BANKED (YEARS 2003-2004) TOTAL
2005 NOx EMISSIONS
(TONS) EMISSIONSNEW UNIT TAKEBACK TOTAL CURRENT YEAR (2005)
NJ Missouri 2383 012001 1 5 4 9 6 6 0 6 5NJ National Park 2409 1001 1 1 0 1 1 1 0 1 1NJ Newark Bay Cogen 50385 1001 20 13 2 15 12 12 0 12 12NJ Newark Bay Cogen 50385 2001 18 14 2 16 12 12 0 12 12NJ Newark Bay Cogen 50385 3001 2 2 4 6 2 2 0 2 2NJ North Jersey Energy Associates 10308 1001 195 86 0 86 72 72 0 72 72NJ North Jersey Energy Associates 10308 1002 189 89 0 89 77 77 0 77 77NJ Ocean Peaking Power, LP 55938 OPP3 7 7 0 7 7 7 0 7 7NJ Ocean Peaking Power, LP 55938 OPP4 11 11 0 11 11 11 0 11 11NJ Pedricktown Cogeneration Plant 10099 001001 29 17 0 17 14 14 0 14 14NJ Prime Energy 50852 002001 109 38 9 47 41 41 0 41 38NJ Salem 2410 2001 3 2 0 2 1 1 0 1 1NJ Sayreville 2390 012001 4 2 0 2 1 1 0 1 1NJ Sayreville 2390 014001 6 3 0 3 2 2 0 2 2NJ Sayreville 2390 015001 6 6 0 6 5 5 0 5 5NJ Sayreville 2390 016001 5 1 0 1 0 0 0 0NJ Sewaren Generating Station 2411 1 47 15 0 15 12 12 0 12 12NJ Sewaren Generating Station 2411 2 46 61 0 61 59 59 0 59 59NJ Sewaren Generating Station 2411 3 43 122 0 122 121 121 0 121 121NJ Sewaren Generating Station 2411 4 70 138 0 138 134 134 0 134 134NJ Sewaren Generating Station 2411 12001 2 6 0 6 6 6 0 6 6NJ Sherman Avenue 7288 1 26 20 12 32 24 24 0 24 20NJ Sunoco Power Generation, LLC 50561 0001 186 21 0 21 17 17 0 17 17NJ Sunoco Power Generation, LLC 50561 0002 178 17 0 17 12 12 0 12 12NJ Sunoco, Inc. (R&S) Eagle Point Facility 55113 034101 0 0 0 0 0 0 0 0NJ Sunoco, Inc. (R&S) Eagle Point Facility 55113 034201 1 1 0 1 1 1 0 1 1NJ Sunoco, Inc. (R&S) Eagle Point Facility 55113 034301 0 0 0 0 0 0 0 0NJ Sunoco, Inc. (R&S) Eagle Point Facility 55113 034401 0 0 0 0 0 0 0 0NJ Sunoco, Inc. (R&S) Eagle Point Facility 55113 088001 40 40 0 40 28 28 0 28 28NJ Valero Refining (NJ) 50628 748001 41 41 9 50 21 21 0 21 16NJ Valero Refining (NJ) 50628 749001 141 141 23 164 128 128 0 128 114NJ Valero Refining (NJ) 50628 751001 44 44 2 46 18 18 0 18 17NJ Valero Refining (NJ) 50628 752001 44 44 2 46 18 18 0 18 17NJ Valero Refining (NJ) 50628 780001 8 8 0 8 8 8 0 8 8NJ Werner 2385 009001 1 9 0 9 8 8 0 8 8NJ Werner 2385 010001 2 8 0 8 6 6 0 6 6NJ Werner 2385 011001 2 1 0 1 0 0 0 0NJ Werner 2385 012001 1 7 0 7 6 6 0 6 6NJ West Station 6776 002001 6 23 8 31 25 25 0 25 23NY 23rd and 3rd 7910 2301 6 2 0 2 2 2 0 2 2NY 23rd and 3rd 7910 2302 6 2 0 2 2 2 0 2 2NY 23rd and 3rd 7910 OVERDF 0 0 0 0 0NY 59th Street 2503 CS0001 (BLR114, BLR115, BLR116, BLR117, BLR118) 212NY 59th Street 2503 BLR114 48 0 10 10 42 0 42 0NY 59th Street 2503 BLR115 37 37 0 37 42 0 42 37
A-39
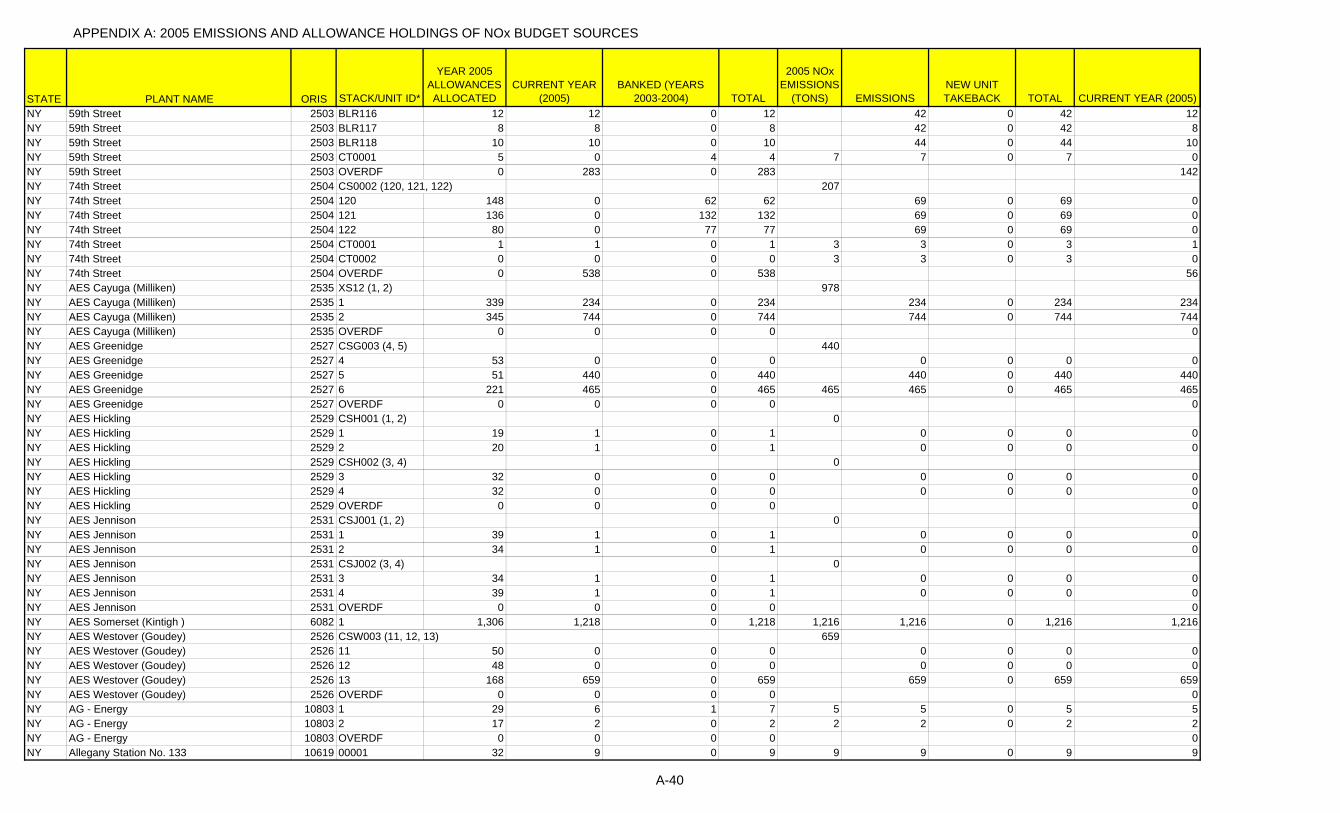
APPENDIX A: 2005 EMISSIONS AND ALLOWANCE HOLDINGS OF NOx BUDGET SOURCES
STATE PLANT NAME ORIS STACK/UNIT ID*
YEAR 2005 ALLOWANCES ALLOCATED
CURRENT YEAR (2005)
BANKED (YEARS 2003-2004) TOTAL
2005 NOx EMISSIONS
(TONS) EMISSIONSNEW UNIT TAKEBACK TOTAL CURRENT YEAR (2005)
NY 59th Street 2503 BLR116 12 12 0 12 42 0 42 12NY 59th Street 2503 BLR117 8 8 0 8 42 0 42 8NY 59th Street 2503 BLR118 10 10 0 10 44 0 44 10NY 59th Street 2503 CT0001 5 0 4 4 7 7 0 7 0NY 59th Street 2503 OVERDF 0 283 0 283 142NY 74th Street 2504 CS0002 (120, 121, 122) 207NY 74th Street 2504 120 148 0 62 62 69 0 69 0NY 74th Street 2504 121 136 0 132 132 69 0 69 0NY 74th Street 2504 122 80 0 77 77 69 0 69 0NY 74th Street 2504 CT0001 1 1 0 1 3 3 0 3 1NY 74th Street 2504 CT0002 0 0 0 0 3 3 0 3 0NY 74th Street 2504 OVERDF 0 538 0 538 56NY AES Cayuga (Milliken) 2535 XS12 (1, 2) 978NY AES Cayuga (Milliken) 2535 1 339 234 0 234 234 0 234 234NY AES Cayuga (Milliken) 2535 2 345 744 0 744 744 0 744 744NY AES Cayuga (Milliken) 2535 OVERDF 0 0 0 0 0NY AES Greenidge 2527 CSG003 (4, 5) 440NY AES Greenidge 2527 4 53 0 0 0 0 0 0 0NY AES Greenidge 2527 5 51 440 0 440 440 0 440 440NY AES Greenidge 2527 6 221 465 0 465 465 465 0 465 465NY AES Greenidge 2527 OVERDF 0 0 0 0 0NY AES Hickling 2529 CSH001 (1, 2) 0NY AES Hickling 2529 1 19 1 0 1 0 0 0 0NY AES Hickling 2529 2 20 1 0 1 0 0 0 0NY AES Hickling 2529 CSH002 (3, 4) 0NY AES Hickling 2529 3 32 0 0 0 0 0 0 0NY AES Hickling 2529 4 32 0 0 0 0 0 0 0NY AES Hickling 2529 OVERDF 0 0 0 0 0NY AES Jennison 2531 CSJ001 (1, 2) 0NY AES Jennison 2531 1 39 1 0 1 0 0 0 0NY AES Jennison 2531 2 34 1 0 1 0 0 0 0NY AES Jennison 2531 CSJ002 (3, 4) 0NY AES Jennison 2531 3 34 1 0 1 0 0 0 0NY AES Jennison 2531 4 39 1 0 1 0 0 0 0NY AES Jennison 2531 OVERDF 0 0 0 0 0NY AES Somerset (Kintigh ) 6082 1 1,306 1,218 0 1,218 1,216 1,216 0 1,216 1,216NY AES Westover (Goudey) 2526 CSW003 (11, 12, 13) 659NY AES Westover (Goudey) 2526 11 50 0 0 0 0 0 0 0NY AES Westover (Goudey) 2526 12 48 0 0 0 0 0 0 0NY AES Westover (Goudey) 2526 13 168 659 0 659 659 0 659 659NY AES Westover (Goudey) 2526 OVERDF 0 0 0 0 0NY AG - Energy 10803 1 29 6 1 7 5 5 0 5 5NY AG - Energy 10803 2 17 2 0 2 2 2 0 2 2NY AG - Energy 10803 OVERDF 0 0 0 0 0NY Allegany Station No. 133 10619 00001 32 9 0 9 9 9 0 9 9
A-40
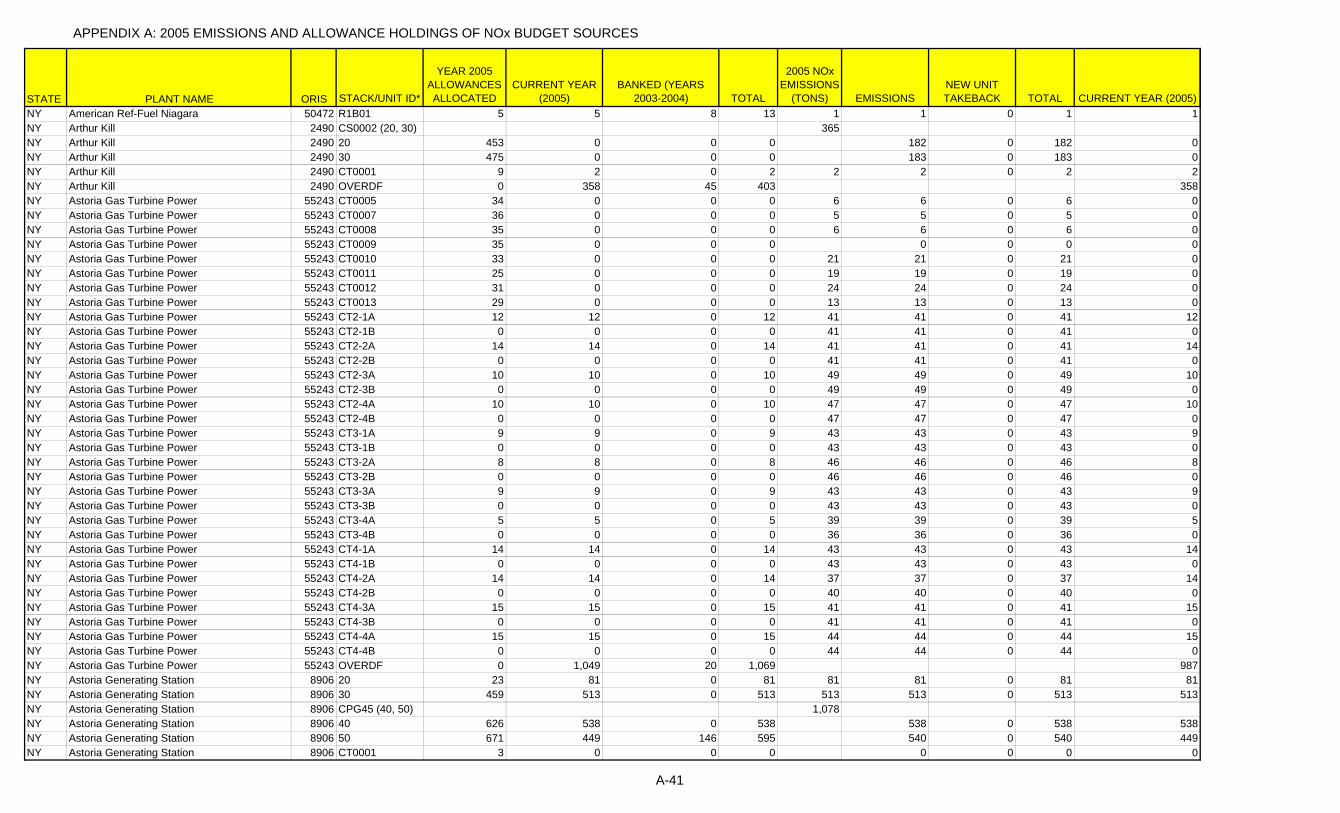
APPENDIX A: 2005 EMISSIONS AND ALLOWANCE HOLDINGS OF NOx BUDGET SOURCES
STATE PLANT NAME ORIS STACK/UNIT ID*
YEAR 2005 ALLOWANCES ALLOCATED
CURRENT YEAR (2005)
BANKED (YEARS 2003-2004) TOTAL
2005 NOx EMISSIONS
(TONS) EMISSIONSNEW UNIT TAKEBACK TOTAL CURRENT YEAR (2005)
NY American Ref-Fuel Niagara 50472 R1B01 5 5 8 13 1 1 0 1 1NY Arthur Kill 2490 CS0002 (20, 30) 365NY Arthur Kill 2490 20 453 0 0 0 182 0 182 0NY Arthur Kill 2490 30 475 0 0 0 183 0 183 0NY Arthur Kill 2490 CT0001 9 2 0 2 2 2 0 2 2NY Arthur Kill 2490 OVERDF 0 358 45 403 358NY Astoria Gas Turbine Power 55243 CT0005 34 0 0 0 6 6 0 6 0NY Astoria Gas Turbine Power 55243 CT0007 36 0 0 0 5 5 0 5 0NY Astoria Gas Turbine Power 55243 CT0008 35 0 0 0 6 6 0 6 0NY Astoria Gas Turbine Power 55243 CT0009 35 0 0 0 0 0 0 0NY Astoria Gas Turbine Power 55243 CT0010 33 0 0 0 21 21 0 21 0NY Astoria Gas Turbine Power 55243 CT0011 25 0 0 0 19 19 0 19 0NY Astoria Gas Turbine Power 55243 CT0012 31 0 0 0 24 24 0 24 0NY Astoria Gas Turbine Power 55243 CT0013 29 0 0 0 13 13 0 13 0NY Astoria Gas Turbine Power 55243 CT2-1A 12 12 0 12 41 41 0 41 12NY Astoria Gas Turbine Power 55243 CT2-1B 0 0 0 0 41 41 0 41 0NY Astoria Gas Turbine Power 55243 CT2-2A 14 14 0 14 41 41 0 41 14NY Astoria Gas Turbine Power 55243 CT2-2B 0 0 0 0 41 41 0 41 0NY Astoria Gas Turbine Power 55243 CT2-3A 10 10 0 10 49 49 0 49 10NY Astoria Gas Turbine Power 55243 CT2-3B 0 0 0 0 49 49 0 49 0NY Astoria Gas Turbine Power 55243 CT2-4A 10 10 0 10 47 47 0 47 10NY Astoria Gas Turbine Power 55243 CT2-4B 0 0 0 0 47 47 0 47 0NY Astoria Gas Turbine Power 55243 CT3-1A 9 9 0 9 43 43 0 43 9NY Astoria Gas Turbine Power 55243 CT3-1B 0 0 0 0 43 43 0 43 0NY Astoria Gas Turbine Power 55243 CT3-2A 8 8 0 8 46 46 0 46 8NY Astoria Gas Turbine Power 55243 CT3-2B 0 0 0 0 46 46 0 46 0NY Astoria Gas Turbine Power 55243 CT3-3A 9 9 0 9 43 43 0 43 9NY Astoria Gas Turbine Power 55243 CT3-3B 0 0 0 0 43 43 0 43 0NY Astoria Gas Turbine Power 55243 CT3-4A 5 5 0 5 39 39 0 39 5NY Astoria Gas Turbine Power 55243 CT3-4B 0 0 0 0 36 36 0 36 0NY Astoria Gas Turbine Power 55243 CT4-1A 14 14 0 14 43 43 0 43 14NY Astoria Gas Turbine Power 55243 CT4-1B 0 0 0 0 43 43 0 43 0NY Astoria Gas Turbine Power 55243 CT4-2A 14 14 0 14 37 37 0 37 14NY Astoria Gas Turbine Power 55243 CT4-2B 0 0 0 0 40 40 0 40 0NY Astoria Gas Turbine Power 55243 CT4-3A 15 15 0 15 41 41 0 41 15NY Astoria Gas Turbine Power 55243 CT4-3B 0 0 0 0 41 41 0 41 0NY Astoria Gas Turbine Power 55243 CT4-4A 15 15 0 15 44 44 0 44 15NY Astoria Gas Turbine Power 55243 CT4-4B 0 0 0 0 44 44 0 44 0NY Astoria Gas Turbine Power 55243 OVERDF 0 1,049 20 1,069 987NY Astoria Generating Station 8906 20 23 81 0 81 81 81 0 81 81NY Astoria Generating Station 8906 30 459 513 0 513 513 513 0 513 513NY Astoria Generating Station 8906 CPG45 (40, 50) 1,078NY Astoria Generating Station 8906 40 626 538 0 538 538 0 538 538NY Astoria Generating Station 8906 50 671 449 146 595 540 0 540 449NY Astoria Generating Station 8906 CT0001 3 0 0 0 0 0 0 0
A-41
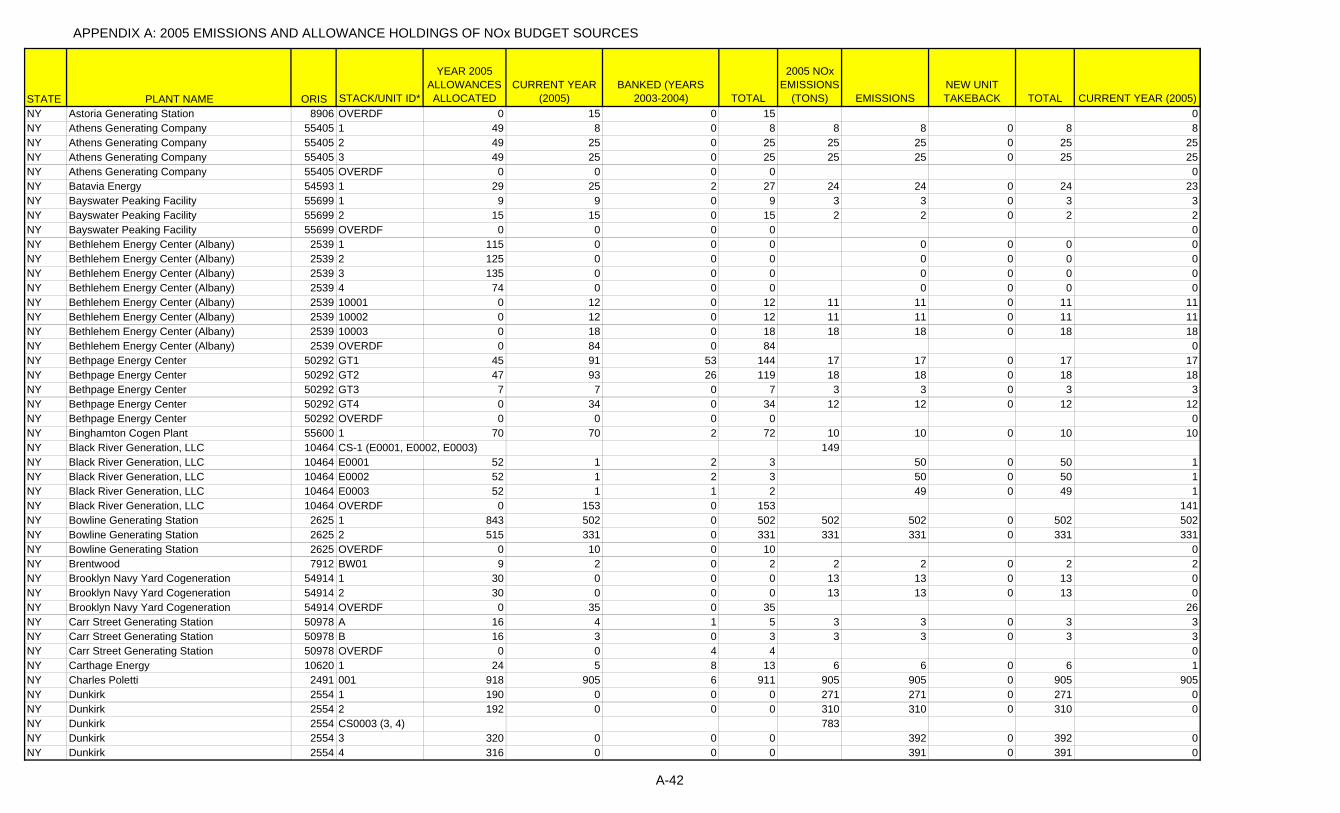
APPENDIX A: 2005 EMISSIONS AND ALLOWANCE HOLDINGS OF NOx BUDGET SOURCES
STATE PLANT NAME ORIS STACK/UNIT ID*
YEAR 2005 ALLOWANCES ALLOCATED
CURRENT YEAR (2005)
BANKED (YEARS 2003-2004) TOTAL
2005 NOx EMISSIONS
(TONS) EMISSIONSNEW UNIT TAKEBACK TOTAL CURRENT YEAR (2005)
NY Astoria Generating Station 8906 OVERDF 0 15 0 15 0NY Athens Generating Company 55405 1 49 8 0 8 8 8 0 8 8NY Athens Generating Company 55405 2 49 25 0 25 25 25 0 25 25NY Athens Generating Company 55405 3 49 25 0 25 25 25 0 25 25NY Athens Generating Company 55405 OVERDF 0 0 0 0 0NY Batavia Energy 54593 1 29 25 2 27 24 24 0 24 23NY Bayswater Peaking Facility 55699 1 9 9 0 9 3 3 0 3 3NY Bayswater Peaking Facility 55699 2 15 15 0 15 2 2 0 2 2NY Bayswater Peaking Facility 55699 OVERDF 0 0 0 0 0NY Bethlehem Energy Center (Albany) 2539 1 115 0 0 0 0 0 0 0NY Bethlehem Energy Center (Albany) 2539 2 125 0 0 0 0 0 0 0NY Bethlehem Energy Center (Albany) 2539 3 135 0 0 0 0 0 0 0NY Bethlehem Energy Center (Albany) 2539 4 74 0 0 0 0 0 0 0NY Bethlehem Energy Center (Albany) 2539 10001 0 12 0 12 11 11 0 11 11NY Bethlehem Energy Center (Albany) 2539 10002 0 12 0 12 11 11 0 11 11NY Bethlehem Energy Center (Albany) 2539 10003 0 18 0 18 18 18 0 18 18NY Bethlehem Energy Center (Albany) 2539 OVERDF 0 84 0 84 0NY Bethpage Energy Center 50292 GT1 45 91 53 144 17 17 0 17 17NY Bethpage Energy Center 50292 GT2 47 93 26 119 18 18 0 18 18NY Bethpage Energy Center 50292 GT3 7 7 0 7 3 3 0 3 3NY Bethpage Energy Center 50292 GT4 0 34 0 34 12 12 0 12 12NY Bethpage Energy Center 50292 OVERDF 0 0 0 0 0NY Binghamton Cogen Plant 55600 1 70 70 2 72 10 10 0 10 10NY Black River Generation, LLC 10464 CS-1 (E0001, E0002, E0003) 149NY Black River Generation, LLC 10464 E0001 52 1 2 3 50 0 50 1NY Black River Generation, LLC 10464 E0002 52 1 2 3 50 0 50 1NY Black River Generation, LLC 10464 E0003 52 1 1 2 49 0 49 1NY Black River Generation, LLC 10464 OVERDF 0 153 0 153 141NY Bowline Generating Station 2625 1 843 502 0 502 502 502 0 502 502NY Bowline Generating Station 2625 2 515 331 0 331 331 331 0 331 331NY Bowline Generating Station 2625 OVERDF 0 10 0 10 0NY Brentwood 7912 BW01 9 2 0 2 2 2 0 2 2NY Brooklyn Navy Yard Cogeneration 54914 1 30 0 0 0 13 13 0 13 0NY Brooklyn Navy Yard Cogeneration 54914 2 30 0 0 0 13 13 0 13 0NY Brooklyn Navy Yard Cogeneration 54914 OVERDF 0 35 0 35 26NY Carr Street Generating Station 50978 A 16 4 1 5 3 3 0 3 3NY Carr Street Generating Station 50978 B 16 3 0 3 3 3 0 3 3NY Carr Street Generating Station 50978 OVERDF 0 0 4 4 0NY Carthage Energy 10620 1 24 5 8 13 6 6 0 6 1NY Charles Poletti 2491 001 918 905 6 911 905 905 0 905 905NY Dunkirk 2554 1 190 0 0 0 271 271 0 271 0NY Dunkirk 2554 2 192 0 0 0 310 310 0 310 0NY Dunkirk 2554 CS0003 (3, 4) 783NY Dunkirk 2554 3 320 0 0 0 392 0 392 0NY Dunkirk 2554 4 316 0 0 0 391 0 391 0
A-42
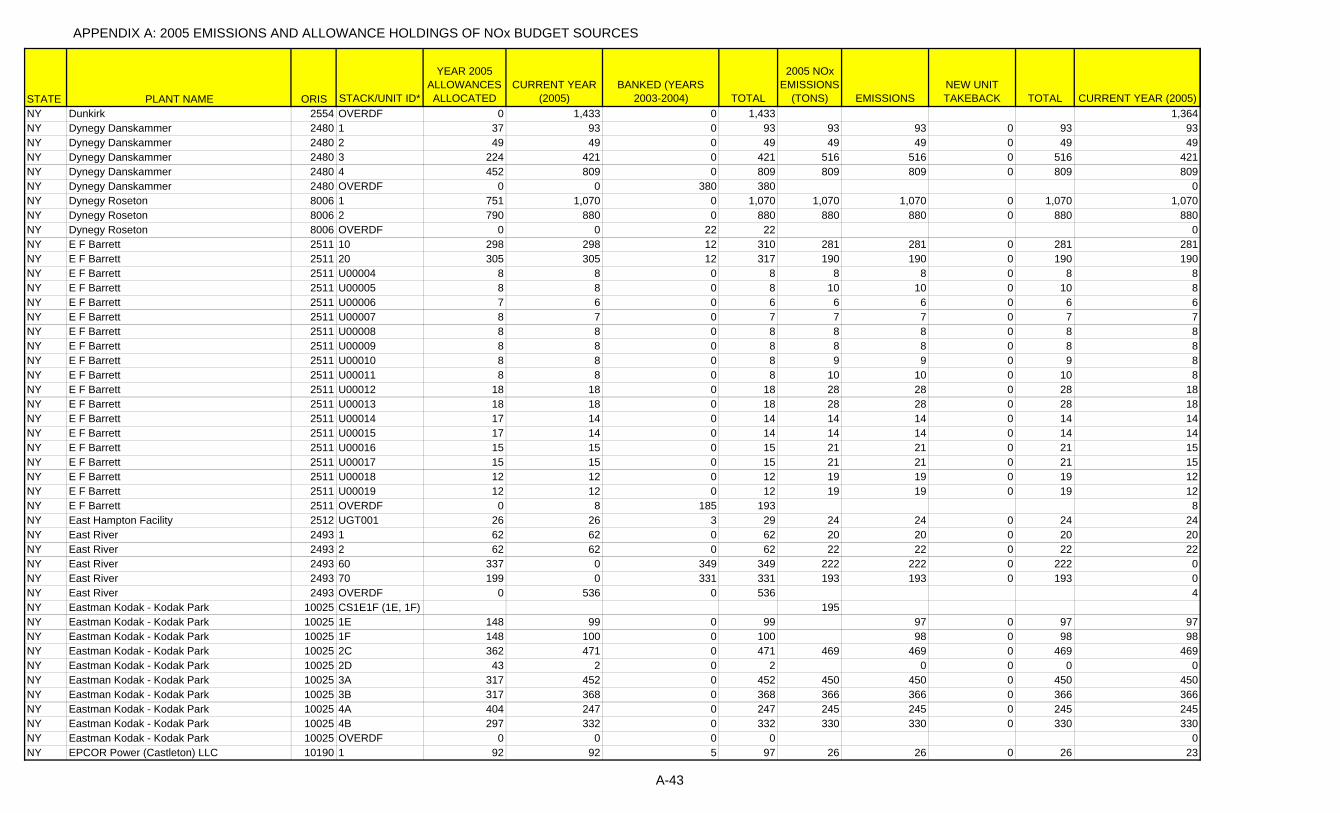
APPENDIX A: 2005 EMISSIONS AND ALLOWANCE HOLDINGS OF NOx BUDGET SOURCES
STATE PLANT NAME ORIS STACK/UNIT ID*
YEAR 2005 ALLOWANCES ALLOCATED
CURRENT YEAR (2005)
BANKED (YEARS 2003-2004) TOTAL
2005 NOx EMISSIONS
(TONS) EMISSIONSNEW UNIT TAKEBACK TOTAL CURRENT YEAR (2005)
NY Dunkirk 2554 OVERDF 0 1,433 0 1,433 1,364NY Dynegy Danskammer 2480 1 37 93 0 93 93 93 0 93 93NY Dynegy Danskammer 2480 2 49 49 0 49 49 49 0 49 49NY Dynegy Danskammer 2480 3 224 421 0 421 516 516 0 516 421NY Dynegy Danskammer 2480 4 452 809 0 809 809 809 0 809 809NY Dynegy Danskammer 2480 OVERDF 0 0 380 380 0NY Dynegy Roseton 8006 1 751 1,070 0 1,070 1,070 1,070 0 1,070 1,070NY Dynegy Roseton 8006 2 790 880 0 880 880 880 0 880 880NY Dynegy Roseton 8006 OVERDF 0 0 22 22 0NY E F Barrett 2511 10 298 298 12 310 281 281 0 281 281NY E F Barrett 2511 20 305 305 12 317 190 190 0 190 190NY E F Barrett 2511 U00004 8 8 0 8 8 8 0 8 8NY E F Barrett 2511 U00005 8 8 0 8 10 10 0 10 8NY E F Barrett 2511 U00006 7 6 0 6 6 6 0 6 6NY E F Barrett 2511 U00007 8 7 0 7 7 7 0 7 7NY E F Barrett 2511 U00008 8 8 0 8 8 8 0 8 8NY E F Barrett 2511 U00009 8 8 0 8 8 8 0 8 8NY E F Barrett 2511 U00010 8 8 0 8 9 9 0 9 8NY E F Barrett 2511 U00011 8 8 0 8 10 10 0 10 8NY E F Barrett 2511 U00012 18 18 0 18 28 28 0 28 18NY E F Barrett 2511 U00013 18 18 0 18 28 28 0 28 18NY E F Barrett 2511 U00014 17 14 0 14 14 14 0 14 14NY E F Barrett 2511 U00015 17 14 0 14 14 14 0 14 14NY E F Barrett 2511 U00016 15 15 0 15 21 21 0 21 15NY E F Barrett 2511 U00017 15 15 0 15 21 21 0 21 15NY E F Barrett 2511 U00018 12 12 0 12 19 19 0 19 12NY E F Barrett 2511 U00019 12 12 0 12 19 19 0 19 12NY E F Barrett 2511 OVERDF 0 8 185 193 8NY East Hampton Facility 2512 UGT001 26 26 3 29 24 24 0 24 24NY East River 2493 1 62 62 0 62 20 20 0 20 20NY East River 2493 2 62 62 0 62 22 22 0 22 22NY East River 2493 60 337 0 349 349 222 222 0 222 0NY East River 2493 70 199 0 331 331 193 193 0 193 0NY East River 2493 OVERDF 0 536 0 536 4NY Eastman Kodak - Kodak Park 10025 CS1E1F (1E, 1F) 195NY Eastman Kodak - Kodak Park 10025 1E 148 99 0 99 97 0 97 97NY Eastman Kodak - Kodak Park 10025 1F 148 100 0 100 98 0 98 98NY Eastman Kodak - Kodak Park 10025 2C 362 471 0 471 469 469 0 469 469NY Eastman Kodak - Kodak Park 10025 2D 43 2 0 2 0 0 0 0NY Eastman Kodak - Kodak Park 10025 3A 317 452 0 452 450 450 0 450 450NY Eastman Kodak - Kodak Park 10025 3B 317 368 0 368 366 366 0 366 366NY Eastman Kodak - Kodak Park 10025 4A 404 247 0 247 245 245 0 245 245NY Eastman Kodak - Kodak Park 10025 4B 297 332 0 332 330 330 0 330 330NY Eastman Kodak - Kodak Park 10025 OVERDF 0 0 0 0 0NY EPCOR Power (Castleton) LLC 10190 1 92 92 5 97 26 26 0 26 23
A-43
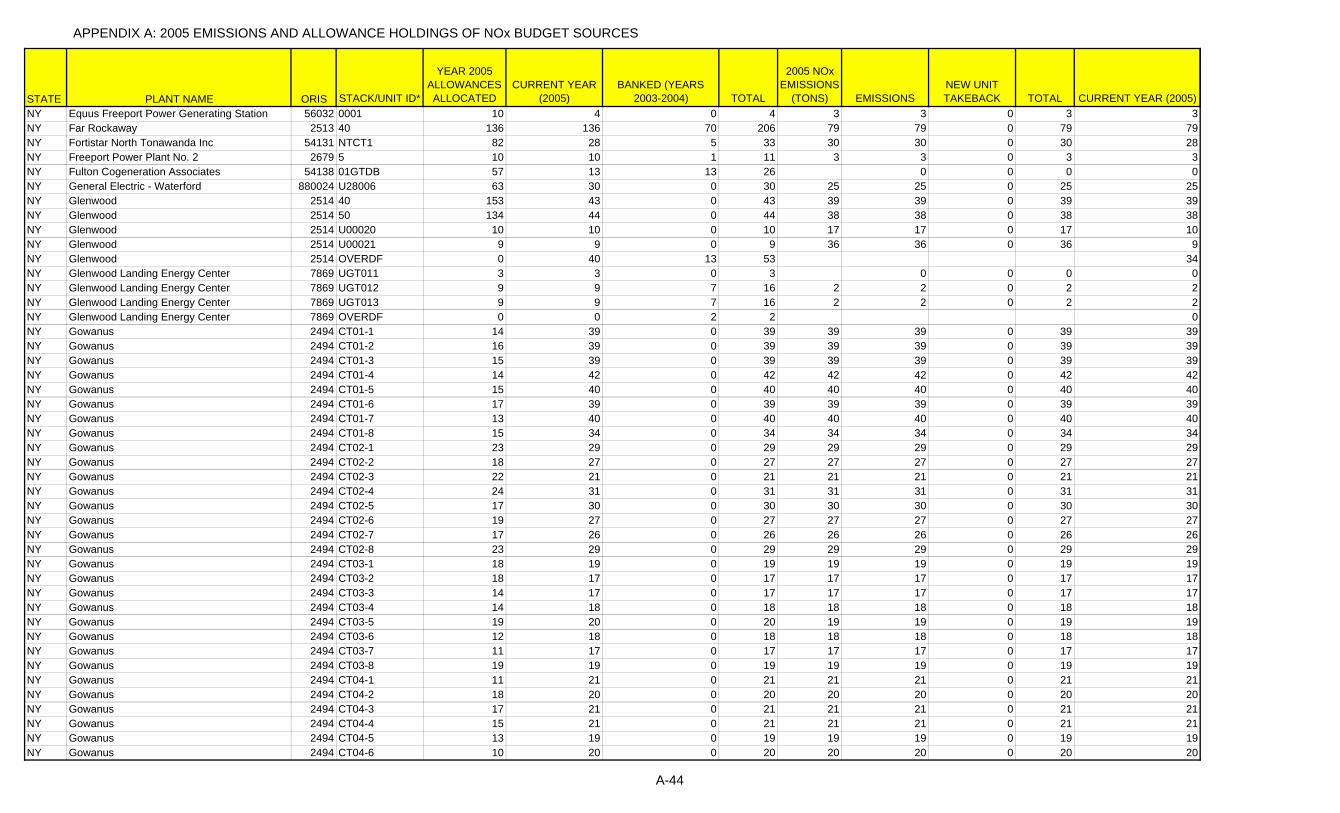
APPENDIX A: 2005 EMISSIONS AND ALLOWANCE HOLDINGS OF NOx BUDGET SOURCES
STATE PLANT NAME ORIS STACK/UNIT ID*
YEAR 2005 ALLOWANCES ALLOCATED
CURRENT YEAR (2005)
BANKED (YEARS 2003-2004) TOTAL
2005 NOx EMISSIONS
(TONS) EMISSIONSNEW UNIT TAKEBACK TOTAL CURRENT YEAR (2005)
NY Equus Freeport Power Generating Station 56032 0001 10 4 0 4 3 3 0 3 3NY Far Rockaway 2513 40 136 136 70 206 79 79 0 79 79NY Fortistar North Tonawanda Inc 54131 NTCT1 82 28 5 33 30 30 0 30 28NY Freeport Power Plant No. 2 2679 5 10 10 1 11 3 3 0 3 3NY Fulton Cogeneration Associates 54138 01GTDB 57 13 13 26 0 0 0 0NY General Electric - Waterford 880024 U28006 63 30 0 30 25 25 0 25 25NY Glenwood 2514 40 153 43 0 43 39 39 0 39 39NY Glenwood 2514 50 134 44 0 44 38 38 0 38 38NY Glenwood 2514 U00020 10 10 0 10 17 17 0 17 10NY Glenwood 2514 U00021 9 9 0 9 36 36 0 36 9NY Glenwood 2514 OVERDF 0 40 13 53 34NY Glenwood Landing Energy Center 7869 UGT011 3 3 0 3 0 0 0 0NY Glenwood Landing Energy Center 7869 UGT012 9 9 7 16 2 2 0 2 2NY Glenwood Landing Energy Center 7869 UGT013 9 9 7 16 2 2 0 2 2NY Glenwood Landing Energy Center 7869 OVERDF 0 0 2 2 0NY Gowanus 2494 CT01-1 14 39 0 39 39 39 0 39 39NY Gowanus 2494 CT01-2 16 39 0 39 39 39 0 39 39NY Gowanus 2494 CT01-3 15 39 0 39 39 39 0 39 39NY Gowanus 2494 CT01-4 14 42 0 42 42 42 0 42 42NY Gowanus 2494 CT01-5 15 40 0 40 40 40 0 40 40NY Gowanus 2494 CT01-6 17 39 0 39 39 39 0 39 39NY Gowanus 2494 CT01-7 13 40 0 40 40 40 0 40 40NY Gowanus 2494 CT01-8 15 34 0 34 34 34 0 34 34NY Gowanus 2494 CT02-1 23 29 0 29 29 29 0 29 29NY Gowanus 2494 CT02-2 18 27 0 27 27 27 0 27 27NY Gowanus 2494 CT02-3 22 21 0 21 21 21 0 21 21NY Gowanus 2494 CT02-4 24 31 0 31 31 31 0 31 31NY Gowanus 2494 CT02-5 17 30 0 30 30 30 0 30 30NY Gowanus 2494 CT02-6 19 27 0 27 27 27 0 27 27NY Gowanus 2494 CT02-7 17 26 0 26 26 26 0 26 26NY Gowanus 2494 CT02-8 23 29 0 29 29 29 0 29 29NY Gowanus 2494 CT03-1 18 19 0 19 19 19 0 19 19NY Gowanus 2494 CT03-2 18 17 0 17 17 17 0 17 17NY Gowanus 2494 CT03-3 14 17 0 17 17 17 0 17 17NY Gowanus 2494 CT03-4 14 18 0 18 18 18 0 18 18NY Gowanus 2494 CT03-5 19 20 0 20 19 19 0 19 19NY Gowanus 2494 CT03-6 12 18 0 18 18 18 0 18 18NY Gowanus 2494 CT03-7 11 17 0 17 17 17 0 17 17NY Gowanus 2494 CT03-8 19 19 0 19 19 19 0 19 19NY Gowanus 2494 CT04-1 11 21 0 21 21 21 0 21 21NY Gowanus 2494 CT04-2 18 20 0 20 20 20 0 20 20NY Gowanus 2494 CT04-3 17 21 0 21 21 21 0 21 21NY Gowanus 2494 CT04-4 15 21 0 21 21 21 0 21 21NY Gowanus 2494 CT04-5 13 19 0 19 19 19 0 19 19NY Gowanus 2494 CT04-6 10 20 0 20 20 20 0 20 20
A-44

APPENDIX A: 2005 EMISSIONS AND ALLOWANCE HOLDINGS OF NOx BUDGET SOURCES
STATE PLANT NAME ORIS STACK/UNIT ID*
YEAR 2005 ALLOWANCES ALLOCATED
CURRENT YEAR (2005)
BANKED (YEARS 2003-2004) TOTAL
2005 NOx EMISSIONS
(TONS) EMISSIONSNEW UNIT TAKEBACK TOTAL CURRENT YEAR (2005)
NY Gowanus 2494 CT04-7 18 22 0 22 22 22 0 22 22NY Gowanus 2494 CT04-8 18 21 0 21 21 21 0 21 21NY Gowanus 2494 OVERDF 0 30 0 30 0NY Harlem River Yard 7914 HR01 6 2 3 5 2 2 0 2 2NY Harlem River Yard 7914 HR02 6 2 1 3 2 2 0 2 2NY Harlem River Yard 7914 OVERDF 0 0 0 0 0NY Hawkeye Energy Greenport, LLC 55969 U-01 22 22 0 22 6 6 0 6 6NY Hell Gate 7913 HG01 6 2 0 2 2 2 0 2 2NY Hell Gate 7913 HG02 6 2 0 2 2 2 0 2 2NY Hell Gate 7913 OVERDF 0 0 0 0 0NY Hillburn 2628 001 4 4 0 4 3 3 0 3 3NY Holtsville Facility 8007 U00001 14 10 3 13 10 10 0 10 10NY Holtsville Facility 8007 U00002 14 10 3 13 10 10 0 10 10NY Holtsville Facility 8007 U00003 19 19 5 24 19 19 0 19 19NY Holtsville Facility 8007 U00004 19 19 5 24 19 19 0 19 19NY Holtsville Facility 8007 U00005 18 16 0 16 16 16 0 16 16NY Holtsville Facility 8007 U00006 18 16 0 16 16 16 0 16 16NY Holtsville Facility 8007 U00007 19 19 10 29 19 19 0 19 19NY Holtsville Facility 8007 U00008 19 19 10 29 19 19 0 19 19NY Holtsville Facility 8007 U00009 25 19 10 29 19 19 0 19 19NY Holtsville Facility 8007 U00010 25 19 10 29 19 19 0 19 19NY Holtsville Facility 8007 U00011 18 18 0 18 22 22 0 22 18NY Holtsville Facility 8007 U00012 18 18 0 18 22 22 0 22 18NY Holtsville Facility 8007 U00013 21 21 0 21 34 34 0 34 21NY Holtsville Facility 8007 U00014 21 21 0 21 34 34 0 34 21NY Holtsville Facility 8007 U00015 24 15 12 27 15 15 0 15 15NY Holtsville Facility 8007 U00016 24 15 12 27 15 15 0 15 15NY Holtsville Facility 8007 U00017 20 20 0 20 28 28 0 28 20NY Holtsville Facility 8007 U00018 20 20 0 20 28 28 0 28 20NY Holtsville Facility 8007 U00019 23 23 2 25 22 22 0 22 22NY Holtsville Facility 8007 U00020 23 23 2 25 22 22 0 22 22NY Holtsville Facility 8007 OVERDF 0 42 85 127 42NY Hudson Avenue 2496 CS0004 (BLR071, BLR072, BLR081, BLR082) 177NY Hudson Avenue 2496 BLR071 45 45 0 45 44 0 44 44NY Hudson Avenue 2496 BLR072 45 45 0 45 44 0 44 44NY Hudson Avenue 2496 BLR081 45 45 0 45 44 0 44 44NY Hudson Avenue 2496 BLR082 45 45 0 45 45 0 45 45NY Hudson Avenue 2496 CT0003 6 6 0 6 0 0 0 0NY Hudson Avenue 2496 CT0004 6 6 0 6 5 5 0 5 5NY Hudson Avenue 2496 CT0005 8 8 0 8 6 6 0 6 6NY Hudson Avenue 2496 OVERDF 0 164 0 164 0NY Huntley Power 2549 CS0002 (63, 64, 65, 66) 1,188NY Huntley Power 2549 63 83 0 0 0 0 0 0 0NY Huntley Power 2549 64 117 0 0 0 0 0 0 0NY Huntley Power 2549 65 111 1,159 117 1,276 1,188 0 1,188 1,159
A-45
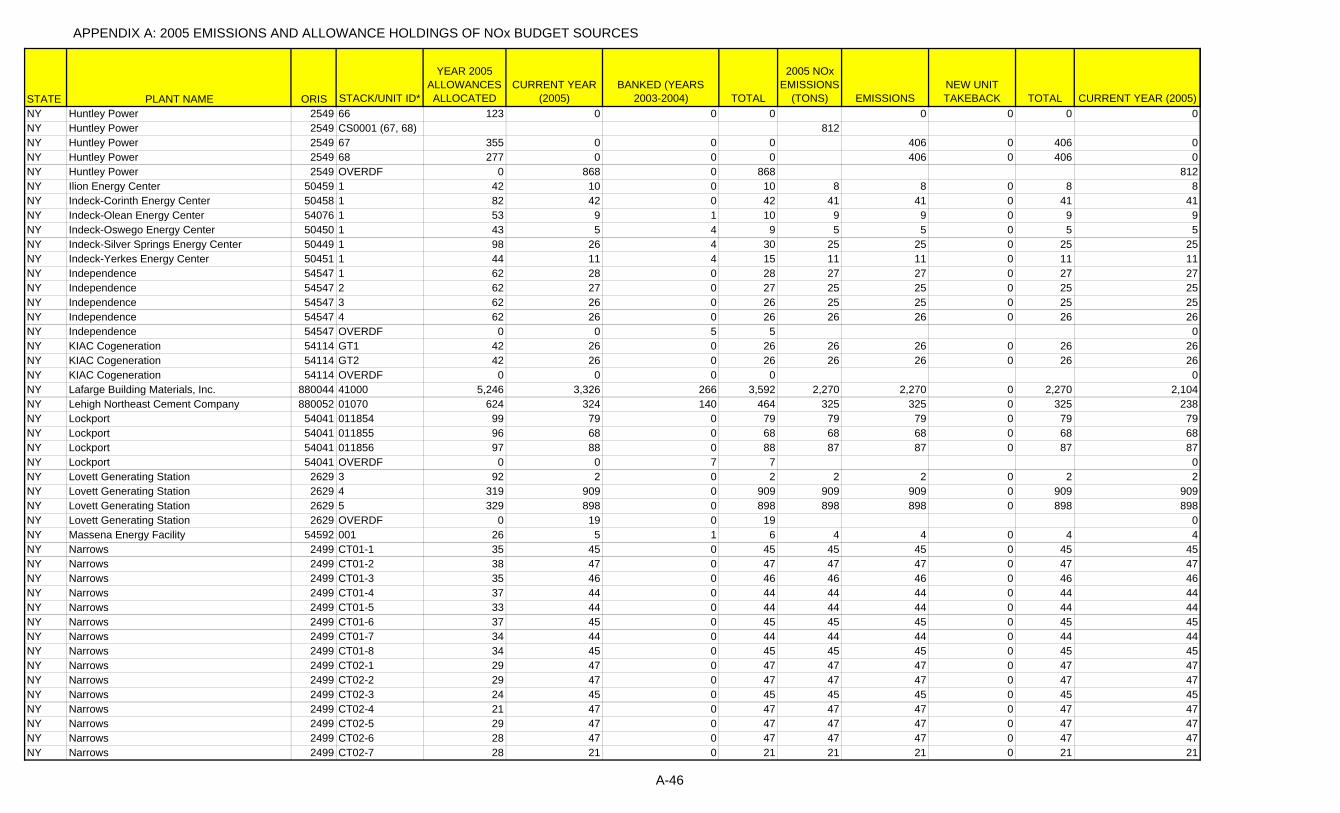
APPENDIX A: 2005 EMISSIONS AND ALLOWANCE HOLDINGS OF NOx BUDGET SOURCES
STATE PLANT NAME ORIS STACK/UNIT ID*
YEAR 2005 ALLOWANCES ALLOCATED
CURRENT YEAR (2005)
BANKED (YEARS 2003-2004) TOTAL
2005 NOx EMISSIONS
(TONS) EMISSIONSNEW UNIT TAKEBACK TOTAL CURRENT YEAR (2005)
NY Huntley Power 2549 66 123 0 0 0 0 0 0 0NY Huntley Power 2549 CS0001 (67, 68) 812NY Huntley Power 2549 67 355 0 0 0 406 0 406 0NY Huntley Power 2549 68 277 0 0 0 406 0 406 0NY Huntley Power 2549 OVERDF 0 868 0 868 812NY Ilion Energy Center 50459 1 42 10 0 10 8 8 0 8 8NY Indeck-Corinth Energy Center 50458 1 82 42 0 42 41 41 0 41 41NY Indeck-Olean Energy Center 54076 1 53 9 1 10 9 9 0 9 9NY Indeck-Oswego Energy Center 50450 1 43 5 4 9 5 5 0 5 5NY Indeck-Silver Springs Energy Center 50449 1 98 26 4 30 25 25 0 25 25NY Indeck-Yerkes Energy Center 50451 1 44 11 4 15 11 11 0 11 11NY Independence 54547 1 62 28 0 28 27 27 0 27 27NY Independence 54547 2 62 27 0 27 25 25 0 25 25NY Independence 54547 3 62 26 0 26 25 25 0 25 25NY Independence 54547 4 62 26 0 26 26 26 0 26 26NY Independence 54547 OVERDF 0 0 5 5 0NY KIAC Cogeneration 54114 GT1 42 26 0 26 26 26 0 26 26NY KIAC Cogeneration 54114 GT2 42 26 0 26 26 26 0 26 26NY KIAC Cogeneration 54114 OVERDF 0 0 0 0 0NY Lafarge Building Materials, Inc. 880044 41000 5,246 3,326 266 3,592 2,270 2,270 0 2,270 2,104NY Lehigh Northeast Cement Company 880052 01070 624 324 140 464 325 325 0 325 238NY Lockport 54041 011854 99 79 0 79 79 79 0 79 79NY Lockport 54041 011855 96 68 0 68 68 68 0 68 68NY Lockport 54041 011856 97 88 0 88 87 87 0 87 87NY Lockport 54041 OVERDF 0 0 7 7 0NY Lovett Generating Station 2629 3 92 2 0 2 2 2 0 2 2NY Lovett Generating Station 2629 4 319 909 0 909 909 909 0 909 909NY Lovett Generating Station 2629 5 329 898 0 898 898 898 0 898 898NY Lovett Generating Station 2629 OVERDF 0 19 0 19 0NY Massena Energy Facility 54592 001 26 5 1 6 4 4 0 4 4NY Narrows 2499 CT01-1 35 45 0 45 45 45 0 45 45NY Narrows 2499 CT01-2 38 47 0 47 47 47 0 47 47NY Narrows 2499 CT01-3 35 46 0 46 46 46 0 46 46NY Narrows 2499 CT01-4 37 44 0 44 44 44 0 44 44NY Narrows 2499 CT01-5 33 44 0 44 44 44 0 44 44NY Narrows 2499 CT01-6 37 45 0 45 45 45 0 45 45NY Narrows 2499 CT01-7 34 44 0 44 44 44 0 44 44NY Narrows 2499 CT01-8 34 45 0 45 45 45 0 45 45NY Narrows 2499 CT02-1 29 47 0 47 47 47 0 47 47NY Narrows 2499 CT02-2 29 47 0 47 47 47 0 47 47NY Narrows 2499 CT02-3 24 45 0 45 45 45 0 45 45NY Narrows 2499 CT02-4 21 47 0 47 47 47 0 47 47NY Narrows 2499 CT02-5 29 47 0 47 47 47 0 47 47NY Narrows 2499 CT02-6 28 47 0 47 47 47 0 47 47NY Narrows 2499 CT02-7 28 21 0 21 21 21 0 21 21
A-46

APPENDIX A: 2005 EMISSIONS AND ALLOWANCE HOLDINGS OF NOx BUDGET SOURCES
STATE PLANT NAME ORIS STACK/UNIT ID*
YEAR 2005 ALLOWANCES ALLOCATED
CURRENT YEAR (2005)
BANKED (YEARS 2003-2004) TOTAL
2005 NOx EMISSIONS
(TONS) EMISSIONSNEW UNIT TAKEBACK TOTAL CURRENT YEAR (2005)
NY Narrows 2499 CT02-8 29 47 0 47 47 47 0 47 47NY Narrows 2499 OVERDF 0 15 0 15 0NY Nissequogue Cogen 54149 1 86 64 0 64 64 64 0 64 64NY North 1st 7915 NO1 9 3 0 3 3 3 0 3 3NY Northport 2516 1 594 579 0 579 579 579 0 579 579NY Northport 2516 2 595 595 0 595 714 714 0 714 595NY Northport 2516 3 507 507 0 507 965 965 0 965 507NY Northport 2516 4 583 583 0 583 667 667 0 667 583NY Northport 2516 UGT001 4 1 0 1 1 1 0 1 1NY Northport 2516 OVERDF 0 401 1,099 1,500 401NY Onondaga Cogeneration 50855 1 33 12 6 18 3 3 0 3 0NY Onondaga Cogeneration 50855 2 24 12 5 17 2 2 0 2 0NY Onondaga Cogeneration 50855 OVERDF 0 0 0 0 0NY Oswego Harbor Power 2594 3 0 0 0 0 0 0 0 0NY Oswego Harbor Power 2594 4 0 0 0 0 0 0 0 0NY Oswego Harbor Power 2594 5 363 0 0 0 490 490 0 490 0NY Oswego Harbor Power 2594 6 376 0 0 0 244 244 0 244 0NY Oswego Harbor Power 2594 OVERDF 0 771 0 771 734NY Pinelawn Power 56188 00001 9 9 0 9 3 3 0 3 3NY Port Jefferson Energy Center 2517 1 0 0 0 0 0 0 0 0NY Port Jefferson Energy Center 2517 2 0 0 0 0 0 0 0 0NY Port Jefferson Energy Center 2517 3 306 250 0 250 249 249 0 249 249NY Port Jefferson Energy Center 2517 4 312 312 0 312 353 353 0 353 312NY Port Jefferson Energy Center 2517 UGT001 2 2 1 3 1 1 0 1 1NY Port Jefferson Energy Center 2517 UGT002 9 2 7 9 2 2 0 2 2NY Port Jefferson Energy Center 2517 UGT003 9 3 7 10 3 3 0 3 3NY Port Jefferson Energy Center 2517 OVERDF 0 56 47 103 41NY Pouch Terminal 7911 PT01 9 2 0 2 2 2 0 2 2NY PPL Edgewood Energy 55786 CT01 7 7 0 7 2 2 0 2 2NY PPL Edgewood Energy 55786 CT02 7 7 0 7 2 2 0 2 2NY PPL Edgewood Energy 55786 OVERDF 0 0 0 0 0NY PPL Shoreham Energy 55787 CT01 11 11 0 11 2 2 0 2 2NY PPL Shoreham Energy 55787 CT02 11 11 0 11 2 2 0 2 2NY PPL Shoreham Energy 55787 OVERDF 0 0 0 0 0NY Project Orange Facility 54425 001 31 31 3 34 24 24 0 24 24NY Project Orange Facility 54425 002 45 14 3 17 7 7 0 7 7NY Project Orange Facility 54425 OVERDF 0 31 0 31 0NY Ravenswood Generating Station 2500 10 442 345 0 345 345 345 0 345 345NY Ravenswood Generating Station 2500 20 494 494 0 494 494 494 0 494 494NY Ravenswood Generating Station 2500 30 1,599 1,094 0 1,094 1,094 1,094 0 1,094 1,094NY Ravenswood Generating Station 2500 CS0001 (BLR001, BLR003) 24NY Ravenswood Generating Station 2500 BLR001 20 0 0 0 12 0 12 0NY Ravenswood Generating Station 2500 CS0002 (BLR002, BLR004) 63NY Ravenswood Generating Station 2500 BLR002 20 0 0 0 32 0 32 0NY Ravenswood Generating Station 2500 BLR003 20 0 0 0 12 0 12 0
A-47
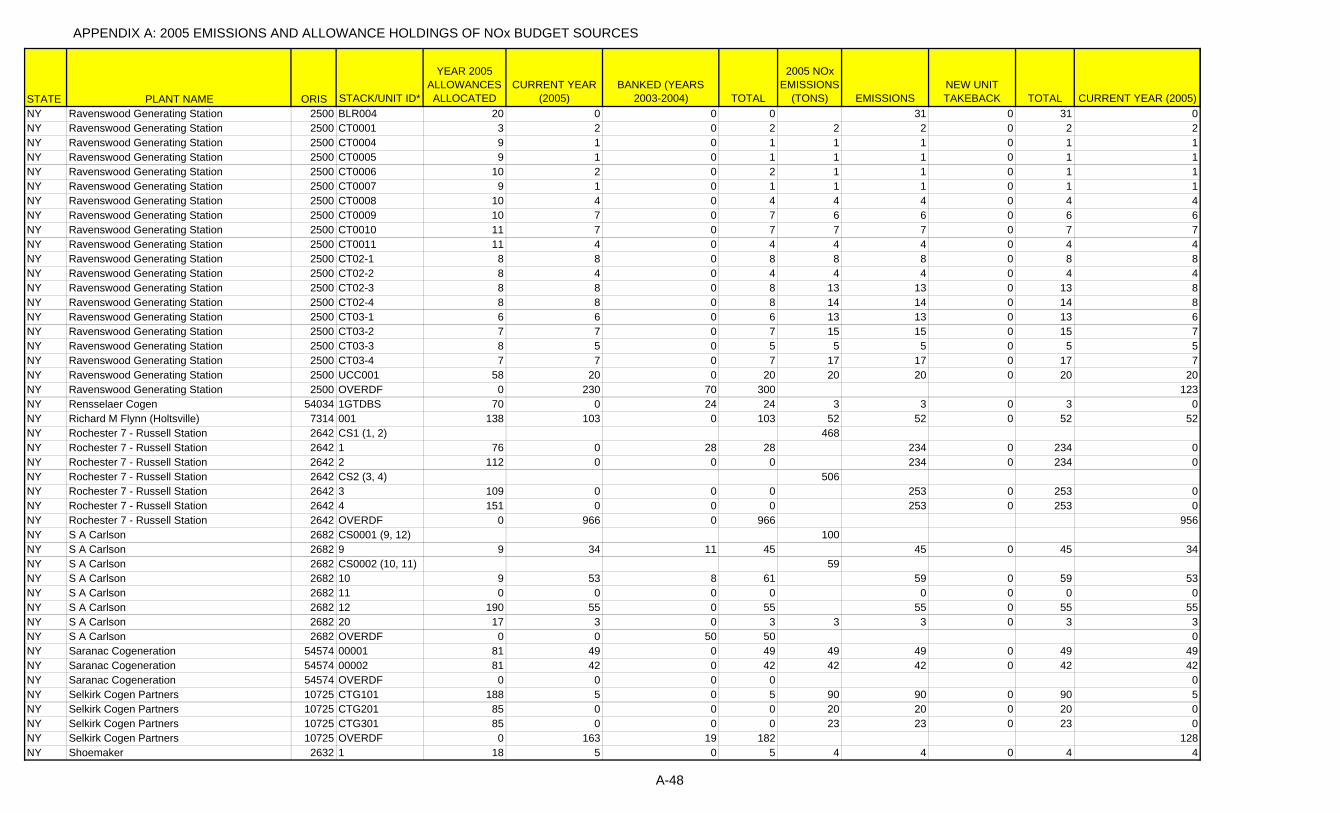
APPENDIX A: 2005 EMISSIONS AND ALLOWANCE HOLDINGS OF NOx BUDGET SOURCES
STATE PLANT NAME ORIS STACK/UNIT ID*
YEAR 2005 ALLOWANCES ALLOCATED
CURRENT YEAR (2005)
BANKED (YEARS 2003-2004) TOTAL
2005 NOx EMISSIONS
(TONS) EMISSIONSNEW UNIT TAKEBACK TOTAL CURRENT YEAR (2005)
NY Ravenswood Generating Station 2500 BLR004 20 0 0 0 31 0 31 0NY Ravenswood Generating Station 2500 CT0001 3 2 0 2 2 2 0 2 2NY Ravenswood Generating Station 2500 CT0004 9 1 0 1 1 1 0 1 1NY Ravenswood Generating Station 2500 CT0005 9 1 0 1 1 1 0 1 1NY Ravenswood Generating Station 2500 CT0006 10 2 0 2 1 1 0 1 1NY Ravenswood Generating Station 2500 CT0007 9 1 0 1 1 1 0 1 1NY Ravenswood Generating Station 2500 CT0008 10 4 0 4 4 4 0 4 4NY Ravenswood Generating Station 2500 CT0009 10 7 0 7 6 6 0 6 6NY Ravenswood Generating Station 2500 CT0010 11 7 0 7 7 7 0 7 7NY Ravenswood Generating Station 2500 CT0011 11 4 0 4 4 4 0 4 4NY Ravenswood Generating Station 2500 CT02-1 8 8 0 8 8 8 0 8 8NY Ravenswood Generating Station 2500 CT02-2 8 4 0 4 4 4 0 4 4NY Ravenswood Generating Station 2500 CT02-3 8 8 0 8 13 13 0 13 8NY Ravenswood Generating Station 2500 CT02-4 8 8 0 8 14 14 0 14 8NY Ravenswood Generating Station 2500 CT03-1 6 6 0 6 13 13 0 13 6NY Ravenswood Generating Station 2500 CT03-2 7 7 0 7 15 15 0 15 7NY Ravenswood Generating Station 2500 CT03-3 8 5 0 5 5 5 0 5 5NY Ravenswood Generating Station 2500 CT03-4 7 7 0 7 17 17 0 17 7NY Ravenswood Generating Station 2500 UCC001 58 20 0 20 20 20 0 20 20NY Ravenswood Generating Station 2500 OVERDF 0 230 70 300 123NY Rensselaer Cogen 54034 1GTDBS 70 0 24 24 3 3 0 3 0NY Richard M Flynn (Holtsville) 7314 001 138 103 0 103 52 52 0 52 52NY Rochester 7 - Russell Station 2642 CS1 (1, 2) 468NY Rochester 7 - Russell Station 2642 1 76 0 28 28 234 0 234 0NY Rochester 7 - Russell Station 2642 2 112 0 0 0 234 0 234 0NY Rochester 7 - Russell Station 2642 CS2 (3, 4) 506NY Rochester 7 - Russell Station 2642 3 109 0 0 0 253 0 253 0NY Rochester 7 - Russell Station 2642 4 151 0 0 0 253 0 253 0NY Rochester 7 - Russell Station 2642 OVERDF 0 966 0 966 956NY S A Carlson 2682 CS0001 (9, 12) 100NY S A Carlson 2682 9 9 34 11 45 45 0 45 34NY S A Carlson 2682 CS0002 (10, 11) 59NY S A Carlson 2682 10 9 53 8 61 59 0 59 53NY S A Carlson 2682 11 0 0 0 0 0 0 0 0NY S A Carlson 2682 12 190 55 0 55 55 0 55 55NY S A Carlson 2682 20 17 3 0 3 3 3 0 3 3NY S A Carlson 2682 OVERDF 0 0 50 50 0NY Saranac Cogeneration 54574 00001 81 49 0 49 49 49 0 49 49NY Saranac Cogeneration 54574 00002 81 42 0 42 42 42 0 42 42NY Saranac Cogeneration 54574 OVERDF 0 0 0 0 0NY Selkirk Cogen Partners 10725 CTG101 188 5 0 5 90 90 0 90 5NY Selkirk Cogen Partners 10725 CTG201 85 0 0 0 20 20 0 20 0NY Selkirk Cogen Partners 10725 CTG301 85 0 0 0 23 23 0 23 0NY Selkirk Cogen Partners 10725 OVERDF 0 163 19 182 128NY Shoemaker 2632 1 18 5 0 5 4 4 0 4 4
A-48
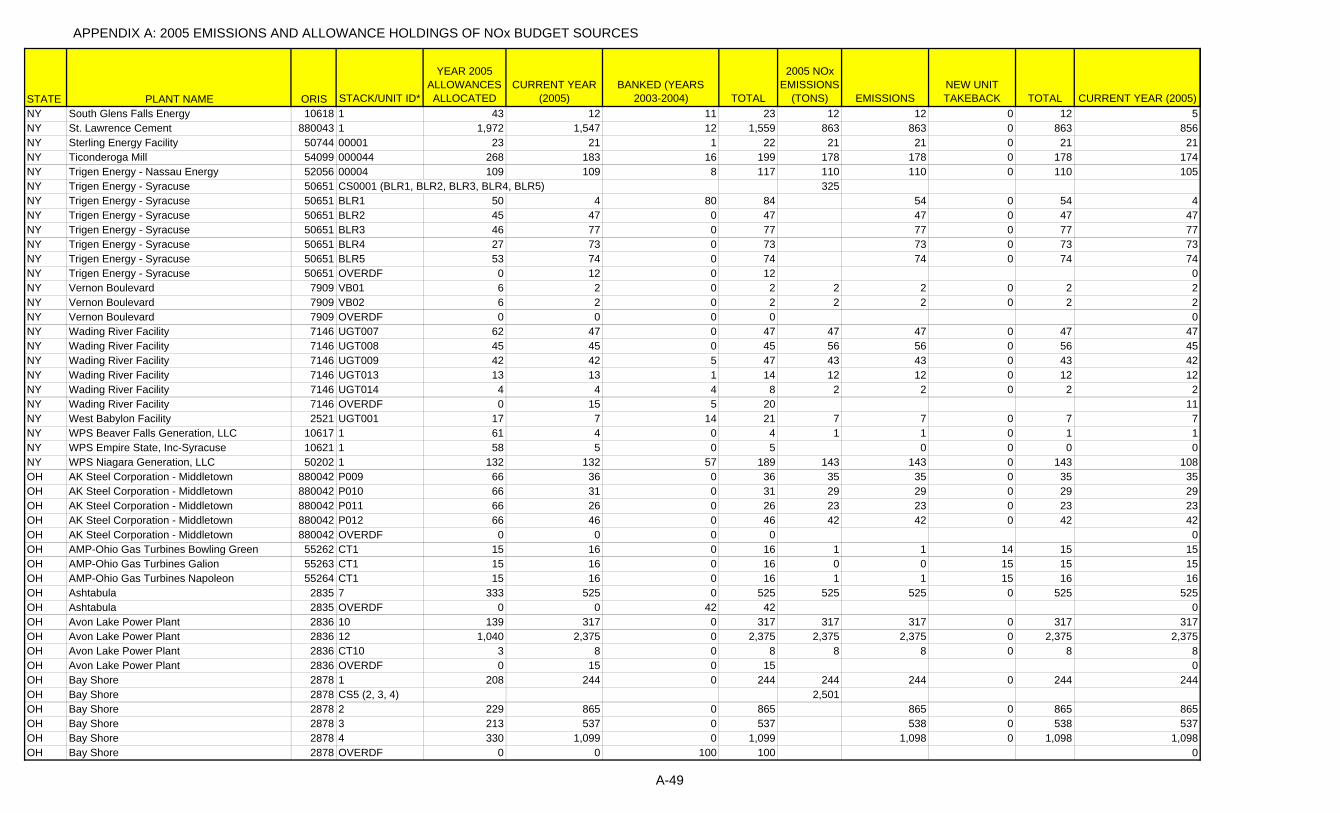
APPENDIX A: 2005 EMISSIONS AND ALLOWANCE HOLDINGS OF NOx BUDGET SOURCES
STATE PLANT NAME ORIS STACK/UNIT ID*
YEAR 2005 ALLOWANCES ALLOCATED
CURRENT YEAR (2005)
BANKED (YEARS 2003-2004) TOTAL
2005 NOx EMISSIONS
(TONS) EMISSIONSNEW UNIT TAKEBACK TOTAL CURRENT YEAR (2005)
NY South Glens Falls Energy 10618 1 43 12 11 23 12 12 0 12 5NY St. Lawrence Cement 880043 1 1,972 1,547 12 1,559 863 863 0 863 856NY Sterling Energy Facility 50744 00001 23 21 1 22 21 21 0 21 21NY Ticonderoga Mill 54099 000044 268 183 16 199 178 178 0 178 174NY Trigen Energy - Nassau Energy 52056 00004 109 109 8 117 110 110 0 110 105NY Trigen Energy - Syracuse 50651 CS0001 (BLR1, BLR2, BLR3, BLR4, BLR5) 325NY Trigen Energy - Syracuse 50651 BLR1 50 4 80 84 54 0 54 4NY Trigen Energy - Syracuse 50651 BLR2 45 47 0 47 47 0 47 47NY Trigen Energy - Syracuse 50651 BLR3 46 77 0 77 77 0 77 77NY Trigen Energy - Syracuse 50651 BLR4 27 73 0 73 73 0 73 73NY Trigen Energy - Syracuse 50651 BLR5 53 74 0 74 74 0 74 74NY Trigen Energy - Syracuse 50651 OVERDF 0 12 0 12 0NY Vernon Boulevard 7909 VB01 6 2 0 2 2 2 0 2 2NY Vernon Boulevard 7909 VB02 6 2 0 2 2 2 0 2 2NY Vernon Boulevard 7909 OVERDF 0 0 0 0 0NY Wading River Facility 7146 UGT007 62 47 0 47 47 47 0 47 47NY Wading River Facility 7146 UGT008 45 45 0 45 56 56 0 56 45NY Wading River Facility 7146 UGT009 42 42 5 47 43 43 0 43 42NY Wading River Facility 7146 UGT013 13 13 1 14 12 12 0 12 12NY Wading River Facility 7146 UGT014 4 4 4 8 2 2 0 2 2NY Wading River Facility 7146 OVERDF 0 15 5 20 11NY West Babylon Facility 2521 UGT001 17 7 14 21 7 7 0 7 7NY WPS Beaver Falls Generation, LLC 10617 1 61 4 0 4 1 1 0 1 1NY WPS Empire State, Inc-Syracuse 10621 1 58 5 0 5 0 0 0 0NY WPS Niagara Generation, LLC 50202 1 132 132 57 189 143 143 0 143 108OH AK Steel Corporation - Middletown 880042 P009 66 36 0 36 35 35 0 35 35OH AK Steel Corporation - Middletown 880042 P010 66 31 0 31 29 29 0 29 29OH AK Steel Corporation - Middletown 880042 P011 66 26 0 26 23 23 0 23 23OH AK Steel Corporation - Middletown 880042 P012 66 46 0 46 42 42 0 42 42OH AK Steel Corporation - Middletown 880042 OVERDF 0 0 0 0 0OH AMP-Ohio Gas Turbines Bowling Green 55262 CT1 15 16 0 16 1 1 14 15 15OH AMP-Ohio Gas Turbines Galion 55263 CT1 15 16 0 16 0 0 15 15 15OH AMP-Ohio Gas Turbines Napoleon 55264 CT1 15 16 0 16 1 1 15 16 16OH Ashtabula 2835 7 333 525 0 525 525 525 0 525 525OH Ashtabula 2835 OVERDF 0 0 42 42 0OH Avon Lake Power Plant 2836 10 139 317 0 317 317 317 0 317 317OH Avon Lake Power Plant 2836 12 1,040 2,375 0 2,375 2,375 2,375 0 2,375 2,375OH Avon Lake Power Plant 2836 CT10 3 8 0 8 8 8 0 8 8OH Avon Lake Power Plant 2836 OVERDF 0 15 0 15 0OH Bay Shore 2878 1 208 244 0 244 244 244 0 244 244OH Bay Shore 2878 CS5 (2, 3, 4) 2,501OH Bay Shore 2878 2 229 865 0 865 865 0 865 865OH Bay Shore 2878 3 213 537 0 537 538 0 538 537OH Bay Shore 2878 4 330 1,099 0 1,099 1,098 0 1,098 1,098OH Bay Shore 2878 OVERDF 0 0 100 100 0
A-49
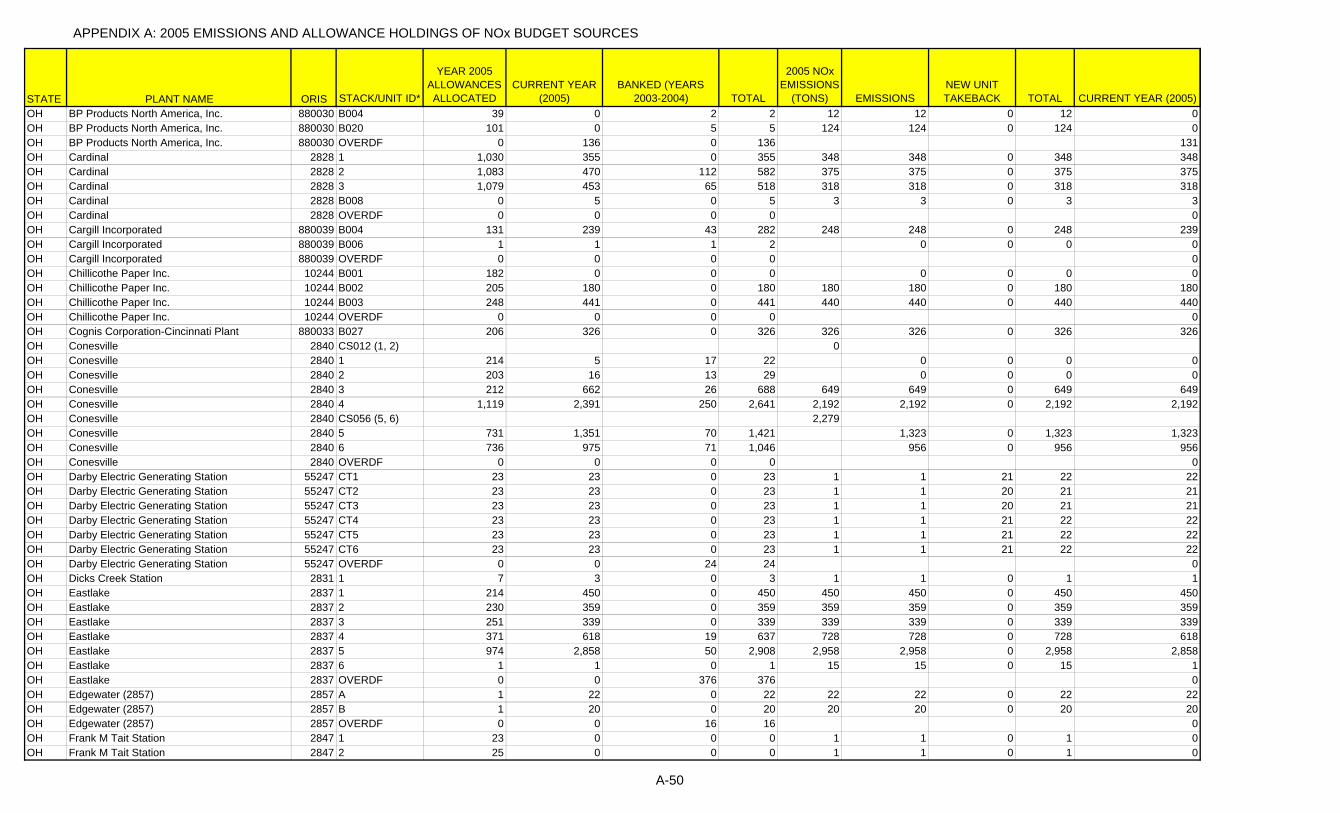
APPENDIX A: 2005 EMISSIONS AND ALLOWANCE HOLDINGS OF NOx BUDGET SOURCES
STATE PLANT NAME ORIS STACK/UNIT ID*
YEAR 2005 ALLOWANCES ALLOCATED
CURRENT YEAR (2005)
BANKED (YEARS 2003-2004) TOTAL
2005 NOx EMISSIONS
(TONS) EMISSIONSNEW UNIT TAKEBACK TOTAL CURRENT YEAR (2005)
OH BP Products North America, Inc. 880030 B004 39 0 2 2 12 12 0 12 0OH BP Products North America, Inc. 880030 B020 101 0 5 5 124 124 0 124 0OH BP Products North America, Inc. 880030 OVERDF 0 136 0 136 131OH Cardinal 2828 1 1,030 355 0 355 348 348 0 348 348OH Cardinal 2828 2 1,083 470 112 582 375 375 0 375 375OH Cardinal 2828 3 1,079 453 65 518 318 318 0 318 318OH Cardinal 2828 B008 0 5 0 5 3 3 0 3 3OH Cardinal 2828 OVERDF 0 0 0 0 0OH Cargill Incorporated 880039 B004 131 239 43 282 248 248 0 248 239OH Cargill Incorporated 880039 B006 1 1 1 2 0 0 0 0OH Cargill Incorporated 880039 OVERDF 0 0 0 0 0OH Chillicothe Paper Inc. 10244 B001 182 0 0 0 0 0 0 0OH Chillicothe Paper Inc. 10244 B002 205 180 0 180 180 180 0 180 180OH Chillicothe Paper Inc. 10244 B003 248 441 0 441 440 440 0 440 440OH Chillicothe Paper Inc. 10244 OVERDF 0 0 0 0 0OH Cognis Corporation-Cincinnati Plant 880033 B027 206 326 0 326 326 326 0 326 326OH Conesville 2840 CS012 (1, 2) 0OH Conesville 2840 1 214 5 17 22 0 0 0 0OH Conesville 2840 2 203 16 13 29 0 0 0 0OH Conesville 2840 3 212 662 26 688 649 649 0 649 649OH Conesville 2840 4 1,119 2,391 250 2,641 2,192 2,192 0 2,192 2,192OH Conesville 2840 CS056 (5, 6) 2,279OH Conesville 2840 5 731 1,351 70 1,421 1,323 0 1,323 1,323OH Conesville 2840 6 736 975 71 1,046 956 0 956 956OH Conesville 2840 OVERDF 0 0 0 0 0OH Darby Electric Generating Station 55247 CT1 23 23 0 23 1 1 21 22 22OH Darby Electric Generating Station 55247 CT2 23 23 0 23 1 1 20 21 21OH Darby Electric Generating Station 55247 CT3 23 23 0 23 1 1 20 21 21OH Darby Electric Generating Station 55247 CT4 23 23 0 23 1 1 21 22 22OH Darby Electric Generating Station 55247 CT5 23 23 0 23 1 1 21 22 22OH Darby Electric Generating Station 55247 CT6 23 23 0 23 1 1 21 22 22OH Darby Electric Generating Station 55247 OVERDF 0 0 24 24 0OH Dicks Creek Station 2831 1 7 3 0 3 1 1 0 1 1OH Eastlake 2837 1 214 450 0 450 450 450 0 450 450OH Eastlake 2837 2 230 359 0 359 359 359 0 359 359OH Eastlake 2837 3 251 339 0 339 339 339 0 339 339OH Eastlake 2837 4 371 618 19 637 728 728 0 728 618OH Eastlake 2837 5 974 2,858 50 2,908 2,958 2,958 0 2,958 2,858OH Eastlake 2837 6 1 1 0 1 15 15 0 15 1OH Eastlake 2837 OVERDF 0 0 376 376 0OH Edgewater (2857) 2857 A 1 22 0 22 22 22 0 22 22OH Edgewater (2857) 2857 B 1 20 0 20 20 20 0 20 20OH Edgewater (2857) 2857 OVERDF 0 0 16 16 0OH Frank M Tait Station 2847 1 23 0 0 0 1 1 0 1 0OH Frank M Tait Station 2847 2 25 0 0 0 1 1 0 1 0
A-50
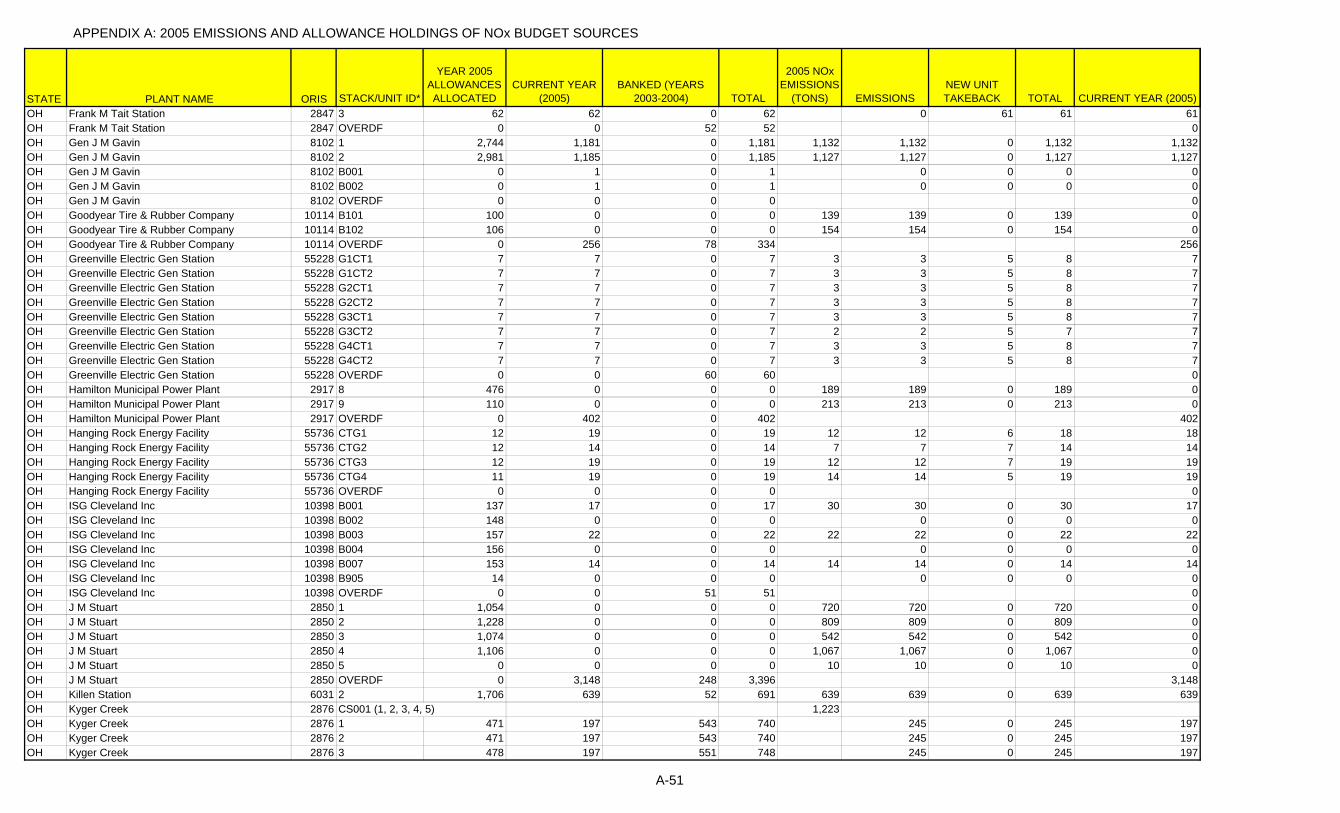
APPENDIX A: 2005 EMISSIONS AND ALLOWANCE HOLDINGS OF NOx BUDGET SOURCES
STATE PLANT NAME ORIS STACK/UNIT ID*
YEAR 2005 ALLOWANCES ALLOCATED
CURRENT YEAR (2005)
BANKED (YEARS 2003-2004) TOTAL
2005 NOx EMISSIONS
(TONS) EMISSIONSNEW UNIT TAKEBACK TOTAL CURRENT YEAR (2005)
OH Frank M Tait Station 2847 3 62 62 0 62 0 61 61 61OH Frank M Tait Station 2847 OVERDF 0 0 52 52 0OH Gen J M Gavin 8102 1 2,744 1,181 0 1,181 1,132 1,132 0 1,132 1,132OH Gen J M Gavin 8102 2 2,981 1,185 0 1,185 1,127 1,127 0 1,127 1,127OH Gen J M Gavin 8102 B001 0 1 0 1 0 0 0 0OH Gen J M Gavin 8102 B002 0 1 0 1 0 0 0 0OH Gen J M Gavin 8102 OVERDF 0 0 0 0 0OH Goodyear Tire & Rubber Company 10114 B101 100 0 0 0 139 139 0 139 0OH Goodyear Tire & Rubber Company 10114 B102 106 0 0 0 154 154 0 154 0OH Goodyear Tire & Rubber Company 10114 OVERDF 0 256 78 334 256OH Greenville Electric Gen Station 55228 G1CT1 7 7 0 7 3 3 5 8 7OH Greenville Electric Gen Station 55228 G1CT2 7 7 0 7 3 3 5 8 7OH Greenville Electric Gen Station 55228 G2CT1 7 7 0 7 3 3 5 8 7OH Greenville Electric Gen Station 55228 G2CT2 7 7 0 7 3 3 5 8 7OH Greenville Electric Gen Station 55228 G3CT1 7 7 0 7 3 3 5 8 7OH Greenville Electric Gen Station 55228 G3CT2 7 7 0 7 2 2 5 7 7OH Greenville Electric Gen Station 55228 G4CT1 7 7 0 7 3 3 5 8 7OH Greenville Electric Gen Station 55228 G4CT2 7 7 0 7 3 3 5 8 7OH Greenville Electric Gen Station 55228 OVERDF 0 0 60 60 0OH Hamilton Municipal Power Plant 2917 8 476 0 0 0 189 189 0 189 0OH Hamilton Municipal Power Plant 2917 9 110 0 0 0 213 213 0 213 0OH Hamilton Municipal Power Plant 2917 OVERDF 0 402 0 402 402OH Hanging Rock Energy Facility 55736 CTG1 12 19 0 19 12 12 6 18 18OH Hanging Rock Energy Facility 55736 CTG2 12 14 0 14 7 7 7 14 14OH Hanging Rock Energy Facility 55736 CTG3 12 19 0 19 12 12 7 19 19OH Hanging Rock Energy Facility 55736 CTG4 11 19 0 19 14 14 5 19 19OH Hanging Rock Energy Facility 55736 OVERDF 0 0 0 0 0OH ISG Cleveland Inc 10398 B001 137 17 0 17 30 30 0 30 17OH ISG Cleveland Inc 10398 B002 148 0 0 0 0 0 0 0OH ISG Cleveland Inc 10398 B003 157 22 0 22 22 22 0 22 22OH ISG Cleveland Inc 10398 B004 156 0 0 0 0 0 0 0OH ISG Cleveland Inc 10398 B007 153 14 0 14 14 14 0 14 14OH ISG Cleveland Inc 10398 B905 14 0 0 0 0 0 0 0OH ISG Cleveland Inc 10398 OVERDF 0 0 51 51 0OH J M Stuart 2850 1 1,054 0 0 0 720 720 0 720 0OH J M Stuart 2850 2 1,228 0 0 0 809 809 0 809 0OH J M Stuart 2850 3 1,074 0 0 0 542 542 0 542 0OH J M Stuart 2850 4 1,106 0 0 0 1,067 1,067 0 1,067 0OH J M Stuart 2850 5 0 0 0 0 10 10 0 10 0OH J M Stuart 2850 OVERDF 0 3,148 248 3,396 3,148OH Killen Station 6031 2 1,706 639 52 691 639 639 0 639 639OH Kyger Creek 2876 CS001 (1, 2, 3, 4, 5) 1,223OH Kyger Creek 2876 1 471 197 543 740 245 0 245 197OH Kyger Creek 2876 2 471 197 543 740 245 0 245 197OH Kyger Creek 2876 3 478 197 551 748 245 0 245 197
A-51
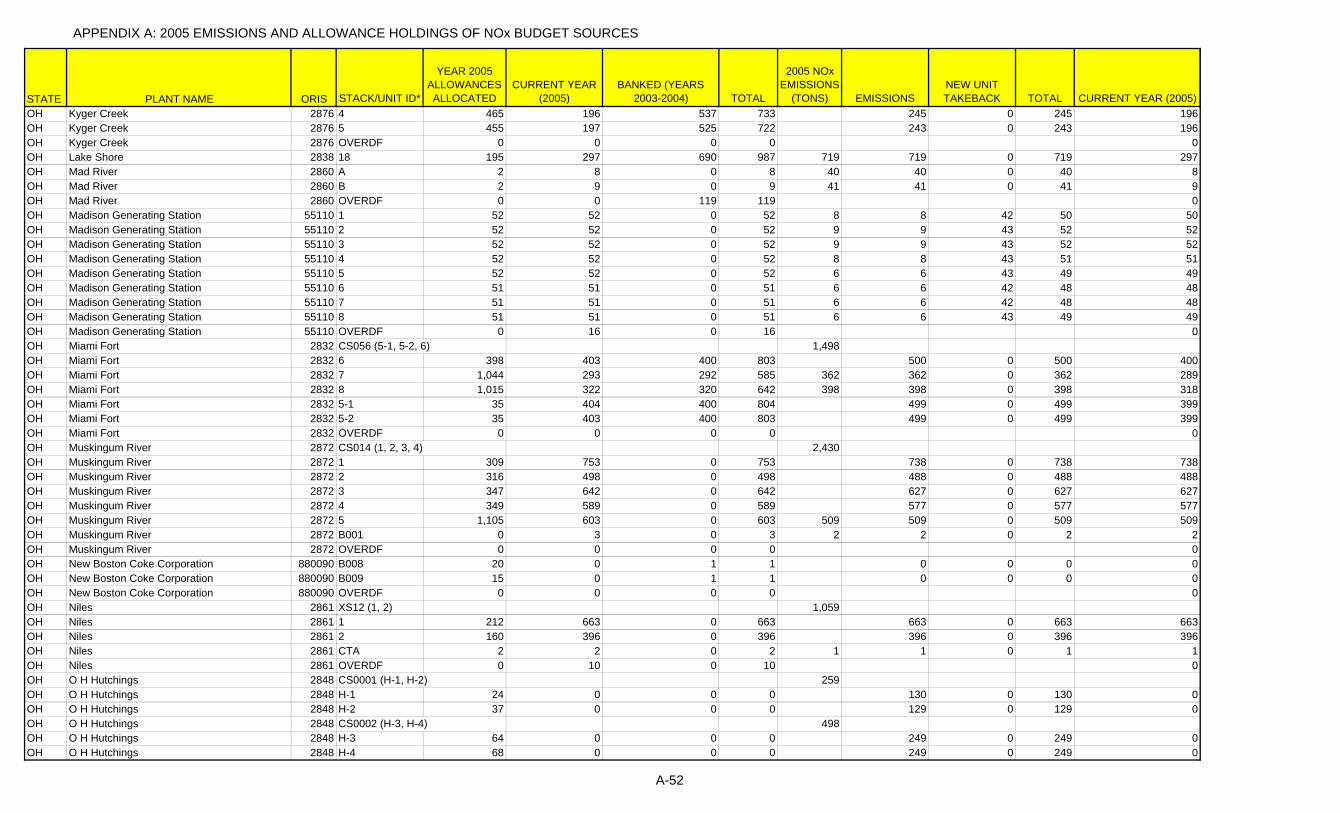
APPENDIX A: 2005 EMISSIONS AND ALLOWANCE HOLDINGS OF NOx BUDGET SOURCES
STATE PLANT NAME ORIS STACK/UNIT ID*
YEAR 2005 ALLOWANCES ALLOCATED
CURRENT YEAR (2005)
BANKED (YEARS 2003-2004) TOTAL
2005 NOx EMISSIONS
(TONS) EMISSIONSNEW UNIT TAKEBACK TOTAL CURRENT YEAR (2005)
OH Kyger Creek 2876 4 465 196 537 733 245 0 245 196OH Kyger Creek 2876 5 455 197 525 722 243 0 243 196OH Kyger Creek 2876 OVERDF 0 0 0 0 0OH Lake Shore 2838 18 195 297 690 987 719 719 0 719 297OH Mad River 2860 A 2 8 0 8 40 40 0 40 8OH Mad River 2860 B 2 9 0 9 41 41 0 41 9OH Mad River 2860 OVERDF 0 0 119 119 0OH Madison Generating Station 55110 1 52 52 0 52 8 8 42 50 50OH Madison Generating Station 55110 2 52 52 0 52 9 9 43 52 52OH Madison Generating Station 55110 3 52 52 0 52 9 9 43 52 52OH Madison Generating Station 55110 4 52 52 0 52 8 8 43 51 51OH Madison Generating Station 55110 5 52 52 0 52 6 6 43 49 49OH Madison Generating Station 55110 6 51 51 0 51 6 6 42 48 48OH Madison Generating Station 55110 7 51 51 0 51 6 6 42 48 48OH Madison Generating Station 55110 8 51 51 0 51 6 6 43 49 49OH Madison Generating Station 55110 OVERDF 0 16 0 16 0OH Miami Fort 2832 CS056 (5-1, 5-2, 6) 1,498OH Miami Fort 2832 6 398 403 400 803 500 0 500 400OH Miami Fort 2832 7 1,044 293 292 585 362 362 0 362 289OH Miami Fort 2832 8 1,015 322 320 642 398 398 0 398 318OH Miami Fort 2832 5-1 35 404 400 804 499 0 499 399OH Miami Fort 2832 5-2 35 403 400 803 499 0 499 399OH Miami Fort 2832 OVERDF 0 0 0 0 0OH Muskingum River 2872 CS014 (1, 2, 3, 4) 2,430OH Muskingum River 2872 1 309 753 0 753 738 0 738 738OH Muskingum River 2872 2 316 498 0 498 488 0 488 488OH Muskingum River 2872 3 347 642 0 642 627 0 627 627OH Muskingum River 2872 4 349 589 0 589 577 0 577 577OH Muskingum River 2872 5 1,105 603 0 603 509 509 0 509 509OH Muskingum River 2872 B001 0 3 0 3 2 2 0 2 2OH Muskingum River 2872 OVERDF 0 0 0 0 0OH New Boston Coke Corporation 880090 B008 20 0 1 1 0 0 0 0OH New Boston Coke Corporation 880090 B009 15 0 1 1 0 0 0 0OH New Boston Coke Corporation 880090 OVERDF 0 0 0 0 0OH Niles 2861 XS12 (1, 2) 1,059OH Niles 2861 1 212 663 0 663 663 0 663 663OH Niles 2861 2 160 396 0 396 396 0 396 396OH Niles 2861 CTA 2 2 0 2 1 1 0 1 1OH Niles 2861 OVERDF 0 10 0 10 0OH O H Hutchings 2848 CS0001 (H-1, H-2) 259OH O H Hutchings 2848 H-1 24 0 0 0 130 0 130 0OH O H Hutchings 2848 H-2 37 0 0 0 129 0 129 0OH O H Hutchings 2848 CS0002 (H-3, H-4) 498OH O H Hutchings 2848 H-3 64 0 0 0 249 0 249 0OH O H Hutchings 2848 H-4 68 0 0 0 249 0 249 0
A-52

APPENDIX A: 2005 EMISSIONS AND ALLOWANCE HOLDINGS OF NOx BUDGET SOURCES
STATE PLANT NAME ORIS STACK/UNIT ID*
YEAR 2005 ALLOWANCES ALLOCATED
CURRENT YEAR (2005)
BANKED (YEARS 2003-2004) TOTAL
2005 NOx EMISSIONS
(TONS) EMISSIONSNEW UNIT TAKEBACK TOTAL CURRENT YEAR (2005)
OH O H Hutchings 2848 CS0003 (H-5, H-6) 434OH O H Hutchings 2848 H-5 62 0 0 0 217 0 217 0OH O H Hutchings 2848 H-6 69 0 0 0 217 0 217 0OH O H Hutchings 2848 H-7 1 0 0 0 1 1 0 1 0OH O H Hutchings 2848 OVERDF 0 617 2,372 2,989 617OH Omega JV2 Bowling Green 7783 P001 37 38 0 38 2 2 36 38 38OH Omega JV2 Hamilton 7782 P001 37 38 0 38 2 2 35 37 37OH Picway 2843 9 141 418 12 430 286 286 0 286 286OH Premcor Lima Refinery 880083 B026 16 29 3 32 29 29 0 29 29OH Proctor & Gamble Company-Ivorydale 880028 B021 71 0 0 0 0 0 0 0OH Proctor & Gamble Company-Ivorydale 880028 B022 292 263 0 263 205 205 0 205 205OH Proctor & Gamble Company-Ivorydale 880028 OVERDF 0 0 0 0 0OH R E Burger 2864 CS0001 (5, 6, 7, 8) 1,777OH R E Burger 2864 5 14 65 0 65 66 0 66 65OH R E Burger 2864 6 13 44 0 44 44 0 44 44OH R E Burger 2864 7 337 787 0 787 787 0 787 787OH R E Burger 2864 8 274 882 0 882 880 0 880 880OH R E Burger 2864 OVERDF 0 0 63 63 0OH Republic Engineered Products-Lorain 880077 B013 157 12 10 22 17 17 0 17 12OH Richard Gorsuch 7253 CS0001 (1, 2, 3, 4) 909OH Richard Gorsuch 7253 1 146 309 8 317 227 0 227 222OH Richard Gorsuch 7253 2 138 227 7 234 227 0 227 223OH Richard Gorsuch 7253 3 144 227 7 234 227 0 227 223OH Richard Gorsuch 7253 4 146 227 9 236 228 0 228 224OH Richard Gorsuch 7253 OVERDF 0 0 0 0 0OH Richland Peaking Station 2880 CTG4 23 23 0 23 13 13 20 33 23OH Richland Peaking Station 2880 CTG5 22 22 0 22 13 13 20 33 22OH Richland Peaking Station 2880 CTG6 22 22 0 22 14 14 19 33 22OH Richland Peaking Station 2880 OVERDF 0 0 90 90 0OH Robert P Mone 7872 1 46 47 0 47 3 3 42 45 45OH Robert P Mone 7872 2 46 47 0 47 3 3 42 45 45OH Robert P Mone 7872 3 45 48 0 48 4 4 41 45 45OH Robert P Mone 7872 OVERDF 0 0 0 0 0OH Rolling Hills Generating LLC 55401 CT-1 28 28 0 28 1 1 27 28 28OH Rolling Hills Generating LLC 55401 CT-2 28 28 0 28 1 1 27 28 28OH Rolling Hills Generating LLC 55401 CT-3 28 28 0 28 1 1 27 28 28OH Rolling Hills Generating LLC 55401 CT-4 27 27 0 27 1 1 26 27 27OH Rolling Hills Generating LLC 55401 CT-5 27 27 0 27 1 1 26 27 27OH Rolling Hills Generating LLC 55401 OVERDF 0 0 0 0 0OH Smart Papers LLC 50247 B010 264 147 0 147 147 147 0 147 147OH South Point Power 880084 B003 106 0 0 0 0 0 0 0OH South Point Power 880084 B004 106 0 0 0 0 0 0 0OH South Point Power 880084 B007 106 0 0 0 0 0 0 0OH South Point Power 880084 OVERDF 0 0 0 0 0OH Sunoco Inc (R&M) Haverhill Plant 880070 2001UF 23 23 4 27 0 0 23 23 23
A-53

APPENDIX A: 2005 EMISSIONS AND ALLOWANCE HOLDINGS OF NOx BUDGET SOURCES
STATE PLANT NAME ORIS STACK/UNIT ID*
YEAR 2005 ALLOWANCES ALLOCATED
CURRENT YEAR (2005)
BANKED (YEARS 2003-2004) TOTAL
2005 NOx EMISSIONS
(TONS) EMISSIONSNEW UNIT TAKEBACK TOTAL CURRENT YEAR (2005)
OH Sunoco, Inc. (R&M) Toledo Refinery 50965 B044 47 17 2 19 2 2 0 2 2OH Tait Electric Generating Station 55248 CT4 166 166 0 166 1 1 162 163 163OH Tait Electric Generating Station 55248 CT5 166 166 0 166 1 1 162 163 163OH Tait Electric Generating Station 55248 CT6 166 166 0 166 1 1 162 163 163OH Tait Electric Generating Station 55248 CT7 165 165 0 165 1 1 161 162 162OH Tait Electric Generating Station 55248 OVERDF 0 0 0 0 0OH The Ohio State University 14013 B132 12 12 2 14 2 2 10 12 12OH Troy Energy, LLC 55348 1 34 34 13 47 8 8 30 38 34OH Troy Energy, LLC 55348 2 34 34 8 42 6 6 30 36 34OH Troy Energy, LLC 55348 3 34 34 0 34 5 5 29 34 34OH Troy Energy, LLC 55348 4 33 33 0 33 5 5 28 33 33OH Troy Energy, LLC 55348 OVERDF 0 0 1 1 0OH W H Sammis 2866 CS0001 (1, 2) 1,446OH W H Sammis 2866 1 402 722 0 722 722 0 722 722OH W H Sammis 2866 2 418 724 0 724 724 0 724 724OH W H Sammis 2866 CS0002 (3, 4) 1,756OH W H Sammis 2866 3 400 1,123 0 1,123 1,124 0 1,124 1,123OH W H Sammis 2866 4 415 633 0 633 632 0 632 632OH W H Sammis 2866 5 631 1,131 0 1,131 1,131 1,131 0 1,131 1,131OH W H Sammis 2866 6 1,221 2,232 0 2,232 2,232 2,232 0 2,232 2,232OH W H Sammis 2866 7 1,259 2,963 0 2,963 2,963 2,963 0 2,963 2,963OH W H Sammis 2866 OVERDF 0 0 354 354 0OH W H Zimmer 6019 1 2,918 890 1,152 2,042 1,174 1,174 0 1,174 886OH W H Zimmer 6019 A 0 2 0 2 2 2 0 2 2OH W H Zimmer 6019 B 0 1 0 1 1 1 0 1 1OH W H Zimmer 6019 OVERDF 0 4 0 4 0OH Walter C Beckjord 2830 1 167 482 480 962 598 598 0 598 478OH Walter C Beckjord 2830 2 198 493 488 981 611 611 0 611 489OH Walter C Beckjord 2830 3 281 567 560 1,127 703 703 0 703 563OH Walter C Beckjord 2830 4 347 626 620 1,246 777 777 0 777 622OH Walter C Beckjord 2830 5 481 642 636 1,278 797 797 0 797 638OH Walter C Beckjord 2830 6 850 1,006 1,340 2,346 1,337 1,337 0 1,337 1,002OH Walter C Beckjord 2830 CT1 3 6 0 6 6 6 0 6 6OH Walter C Beckjord 2830 CT2 3 8 0 8 8 8 0 8 8OH Walter C Beckjord 2830 CT3 4 12 0 12 12 12 0 12 12OH Walter C Beckjord 2830 CT4 2 16 0 16 16 16 0 16 16OH Walter C Beckjord 2830 OVERDF 0 8 0 8 0OH Washington Energy Facility 55397 CT1 26 27 0 27 7 7 20 27 27OH Washington Energy Facility 55397 CT2 26 28 0 28 7 7 21 28 28OH Washington Energy Facility 55397 OVERDF 0 0 0 0 0OH Waterford Plant 55503 1 20 26 0 26 9 9 15 24 24OH Waterford Plant 55503 2 20 25 1 26 9 9 16 25 25OH Waterford Plant 55503 3 19 25 0 25 7 7 16 23 23OH Waterford Plant 55503 OVERDF 0 0 0 0 0OH WCI Steel 54207 B001 111 0 0 0 230 230 0 230 0
A-54

APPENDIX A: 2005 EMISSIONS AND ALLOWANCE HOLDINGS OF NOx BUDGET SOURCES
STATE PLANT NAME ORIS STACK/UNIT ID*
YEAR 2005 ALLOWANCES ALLOCATED
CURRENT YEAR (2005)
BANKED (YEARS 2003-2004) TOTAL
2005 NOx EMISSIONS
(TONS) EMISSIONSNEW UNIT TAKEBACK TOTAL CURRENT YEAR (2005)
OH WCI Steel 54207 B002 29 1 0 1 1 1 0 1 1OH WCI Steel 54207 B004 140 22 0 22 22 22 0 22 22OH WCI Steel 54207 OVERDF 0 221 37 258 221OH West Lorain 2869 2 71 71 0 71 4 4 59 63 63OH West Lorain 2869 3 71 71 0 71 2 2 64 66 66OH West Lorain 2869 4 71 71 0 71 2 2 64 66 66OH West Lorain 2869 5 71 71 0 71 1 1 66 67 67OH West Lorain 2869 6 70 70 0 70 1 1 66 67 67OH West Lorain 2869 1A 0 0 0 0 42 42 0 42 0OH West Lorain 2869 1B 0 0 0 0 43 43 0 43 0OH West Lorain 2869 OVERDF 0 0 183 183 0OH Woodsdale 7158 **GT1 30 2 0 2 2 2 0 2 2OH Woodsdale 7158 **GT2 30 2 0 2 2 2 0 2 2OH Woodsdale 7158 **GT3 39 16 0 16 16 16 0 16 16OH Woodsdale 7158 **GT4 37 2 0 2 2 2 0 2 2OH Woodsdale 7158 **GT5 40 15 0 15 15 15 0 15 15OH Woodsdale 7158 **GT6 39 2 0 2 1 1 0 1 1OH Woodsdale 7158 OVERDF 0 12 0 12 0PA AES Beaver Valley Partners 10676 032 144 283 0 283 283 283 0 283 283PA AES Beaver Valley Partners 10676 033 131 213 13 226 221 221 0 221 213PA AES Beaver Valley Partners 10676 034 133 278 0 278 278 278 0 278 278PA AES Beaver Valley Partners 10676 035 67 104 0 104 104 104 0 104 104PA AES Beaver Valley Partners 10676 OVERDF 0 8 0 8 0PA AES Ironwood 55337 0001 31 31 0 31 20 20 7 27 27PA AES Ironwood 55337 0002 31 31 5 36 21 21 8 29 29PA AES Ironwood 55337 OVERDF 0 0 0 0 0PA Allegheny Energy Unit 1 and Unit 2 55196 1 14 0 24 24 10 10 1 11 0PA Allegheny Energy Unit 1 and Unit 2 55196 2 14 0 24 24 10 10 0 10 0PA Allegheny Energy Unit 1 and Unit 2 55196 OVERDF 0 0 5 5 0PA Allegheny Energy Unit 8 and Unit 9 55377 8 18 0 32 32 8 8 9 17 0PA Allegheny Energy Unit 8 and Unit 9 55377 9 18 0 32 32 7 7 9 16 0PA Allegheny Energy Unit 8 and Unit 9 55377 OVERDF 0 0 6 6 0PA Allegheny Energy Units 3, 4 & 5 55710 3 13 0 28 28 3 3 11 14 0PA Allegheny Energy Units 3, 4 & 5 55710 4 13 0 28 28 3 3 10 13 0PA Allegheny Energy Units 3, 4 & 5 55710 OVERDF 0 0 6 6 0PA Armagh Compressor Station 880071 31301 18 18 0 18 0 18 18 18PA Armstrong Energy Ltd Part 55347 1 95 95 0 95 6 6 75 81 81PA Armstrong Energy Ltd Part 55347 2 95 95 0 95 4 4 83 87 87PA Armstrong Energy Ltd Part 55347 3 95 95 0 95 4 4 85 89 89PA Armstrong Energy Ltd Part 55347 4 95 95 0 95 5 5 81 86 86PA Armstrong Energy Ltd Part 55347 OVERDF 0 0 0 0 0PA Armstrong Power Station 3178 1 363 640 0 640 640 640 0 640 640PA Armstrong Power Station 3178 2 383 627 0 627 627 627 0 627 627PA Armstrong Power Station 3178 OVERDF 0 0 4 4 0PA Bernville Station 880049 32001 98 98 33 131 0 0 0 0
A-55

APPENDIX A: 2005 EMISSIONS AND ALLOWANCE HOLDINGS OF NOx BUDGET SOURCES
STATE PLANT NAME ORIS STACK/UNIT ID*
YEAR 2005 ALLOWANCES ALLOCATED
CURRENT YEAR (2005)
BANKED (YEARS 2003-2004) TOTAL
2005 NOx EMISSIONS
(TONS) EMISSIONSNEW UNIT TAKEBACK TOTAL CURRENT YEAR (2005)
PA Bethlehem Power Plant 55690 1 9 9 13 22 14 14 3 17 9PA Bethlehem Power Plant 55690 2 9 9 13 22 13 13 3 16 9PA Bethlehem Power Plant 55690 3 9 9 13 22 13 13 3 16 9PA Bethlehem Power Plant 55690 5 9 9 9 18 10 10 4 14 9PA Bethlehem Power Plant 55690 6 9 9 9 18 9 9 4 13 9PA Bethlehem Power Plant 55690 7 9 9 9 18 9 9 5 14 9PA Bethlehem Power Plant 55690 OVERDF 0 2 7 9 0PA Bruce Mansfield 6094 1 1,657 1,008 0 1,008 1,008 1,008 0 1,008 1,008PA Bruce Mansfield 6094 2 1,672 1,099 0 1,099 1,099 1,099 0 1,099 1,099PA Bruce Mansfield 6094 3 1,636 948 0 948 948 948 0 948 948PA Bruce Mansfield 6094 OVERDF 0 0 603 603 0PA Brunner Island 3140 CS102 (1, 2) 2,194PA Brunner Island 3140 1 568 1,095 0 1,095 1,095 0 1,095 1,095PA Brunner Island 3140 2 718 1,099 0 1,099 1,099 0 1,099 1,099PA Brunner Island 3140 3 1,539 1,355 5,169 6,524 2,647 2,647 0 2,647 1,355PA Brunner Island 3140 OVERDF 0 3 0 3 0PA Brunot Island Power Station 3096 3 0 1 0 1 0 0 0 0PA Brunot Island Power Station 3096 2A 0 1 0 1 0 0 0 0PA Brunot Island Power Station 3096 2B 0 1 0 1 1 1 0 1 1PA Brunot Island Power Station 3096 OVERDF 0 10 0 10 0PA Cambria Cogen 10641 1 155 155 3 158 98 98 0 98 98PA Cambria Cogen 10641 2 161 161 3 164 101 101 0 101 101PA Cambria Cogen 10641 OVERDF 0 0 0 0 0PA Chambersburg Units 12 and 13 55654 12 17 0 40 40 21 21 0 21 0PA Chambersburg Units 12 and 13 55654 13 17 0 40 40 22 22 0 22 0PA Chambersburg Units 12 and 13 55654 OVERDF 0 0 4 4 0PA Cheswick 8226 1 1,119 568 0 568 563 563 0 563 563PA Colver Power Project 10143 AAB01 291 231 7 238 233 233 0 233 231PA Conemaugh 3118 1 2,167 3,732 0 3,732 3,727 3,727 0 3,727 3,727PA Conemaugh 3118 2 1,995 3,910 0 3,910 3,905 3,905 0 3,905 3,905PA Conemaugh 3118 OVERDF 0 0 0 0 0PA ConocoPhillips Co., Trainer Refinery 880025 032 71 50 8 58 114 114 0 114 50PA ConocoPhillips Co., Trainer Refinery 880025 033 80 80 0 80 96 96 0 96 80PA ConocoPhillips Co., Trainer Refinery 880025 OVERDF 0 80 0 80 75PA Cromby 3159 1 377 614 0 614 609 609 0 609 609PA Cromby 3159 2 201 300 0 300 296 296 0 296 296PA Cromby 3159 OVERDF 0 0 0 0 0PA Croydon Generating Station 8012 11 11 2 0 2 1 1 0 1 1PA Croydon Generating Station 8012 12 9 13 0 13 11 11 0 11 11PA Croydon Generating Station 8012 21 5 33 0 33 31 31 0 31 31PA Croydon Generating Station 8012 22 11 25 0 25 23 23 0 23 23PA Croydon Generating Station 8012 31 13 20 0 20 18 18 0 18 18PA Croydon Generating Station 8012 32 6 11 0 11 6 6 0 6 6PA Croydon Generating Station 8012 41 11 17 0 17 15 15 0 15 15PA Croydon Generating Station 8012 42 9 18 0 18 16 16 0 16 16
A-56
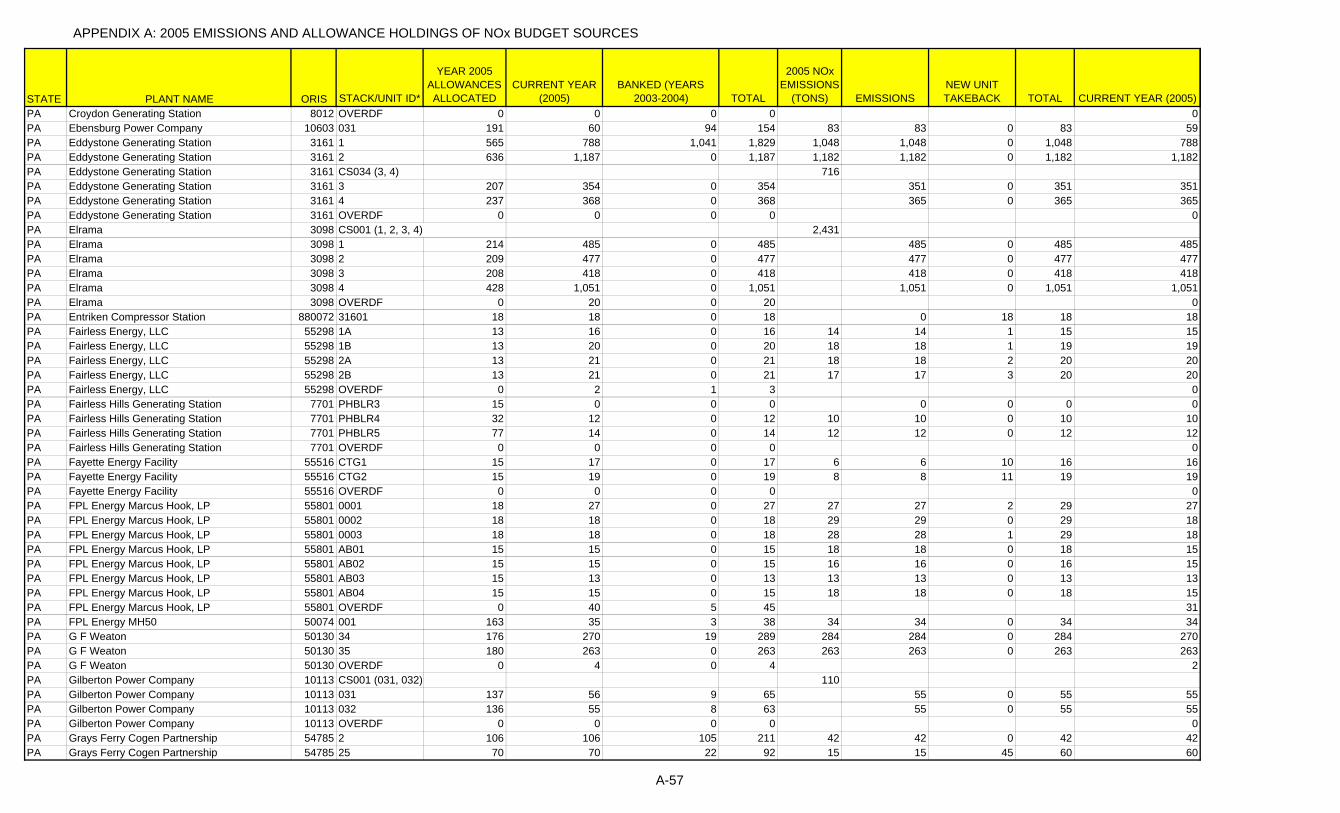
APPENDIX A: 2005 EMISSIONS AND ALLOWANCE HOLDINGS OF NOx BUDGET SOURCES
STATE PLANT NAME ORIS STACK/UNIT ID*
YEAR 2005 ALLOWANCES ALLOCATED
CURRENT YEAR (2005)
BANKED (YEARS 2003-2004) TOTAL
2005 NOx EMISSIONS
(TONS) EMISSIONSNEW UNIT TAKEBACK TOTAL CURRENT YEAR (2005)
PA Croydon Generating Station 8012 OVERDF 0 0 0 0 0PA Ebensburg Power Company 10603 031 191 60 94 154 83 83 0 83 59PA Eddystone Generating Station 3161 1 565 788 1,041 1,829 1,048 1,048 0 1,048 788PA Eddystone Generating Station 3161 2 636 1,187 0 1,187 1,182 1,182 0 1,182 1,182PA Eddystone Generating Station 3161 CS034 (3, 4) 716PA Eddystone Generating Station 3161 3 207 354 0 354 351 0 351 351PA Eddystone Generating Station 3161 4 237 368 0 368 365 0 365 365PA Eddystone Generating Station 3161 OVERDF 0 0 0 0 0PA Elrama 3098 CS001 (1, 2, 3, 4) 2,431PA Elrama 3098 1 214 485 0 485 485 0 485 485PA Elrama 3098 2 209 477 0 477 477 0 477 477PA Elrama 3098 3 208 418 0 418 418 0 418 418PA Elrama 3098 4 428 1,051 0 1,051 1,051 0 1,051 1,051PA Elrama 3098 OVERDF 0 20 0 20 0PA Entriken Compressor Station 880072 31601 18 18 0 18 0 18 18 18PA Fairless Energy, LLC 55298 1A 13 16 0 16 14 14 1 15 15PA Fairless Energy, LLC 55298 1B 13 20 0 20 18 18 1 19 19PA Fairless Energy, LLC 55298 2A 13 21 0 21 18 18 2 20 20PA Fairless Energy, LLC 55298 2B 13 21 0 21 17 17 3 20 20PA Fairless Energy, LLC 55298 OVERDF 0 2 1 3 0PA Fairless Hills Generating Station 7701 PHBLR3 15 0 0 0 0 0 0 0PA Fairless Hills Generating Station 7701 PHBLR4 32 12 0 12 10 10 0 10 10PA Fairless Hills Generating Station 7701 PHBLR5 77 14 0 14 12 12 0 12 12PA Fairless Hills Generating Station 7701 OVERDF 0 0 0 0 0PA Fayette Energy Facility 55516 CTG1 15 17 0 17 6 6 10 16 16PA Fayette Energy Facility 55516 CTG2 15 19 0 19 8 8 11 19 19PA Fayette Energy Facility 55516 OVERDF 0 0 0 0 0PA FPL Energy Marcus Hook, LP 55801 0001 18 27 0 27 27 27 2 29 27PA FPL Energy Marcus Hook, LP 55801 0002 18 18 0 18 29 29 0 29 18PA FPL Energy Marcus Hook, LP 55801 0003 18 18 0 18 28 28 1 29 18PA FPL Energy Marcus Hook, LP 55801 AB01 15 15 0 15 18 18 0 18 15PA FPL Energy Marcus Hook, LP 55801 AB02 15 15 0 15 16 16 0 16 15PA FPL Energy Marcus Hook, LP 55801 AB03 15 13 0 13 13 13 0 13 13PA FPL Energy Marcus Hook, LP 55801 AB04 15 15 0 15 18 18 0 18 15PA FPL Energy Marcus Hook, LP 55801 OVERDF 0 40 5 45 31PA FPL Energy MH50 50074 001 163 35 3 38 34 34 0 34 34PA G F Weaton 50130 34 176 270 19 289 284 284 0 284 270PA G F Weaton 50130 35 180 263 0 263 263 263 0 263 263PA G F Weaton 50130 OVERDF 0 4 0 4 2PA Gilberton Power Company 10113 CS001 (031, 032) 110PA Gilberton Power Company 10113 031 137 56 9 65 55 0 55 55PA Gilberton Power Company 10113 032 136 55 8 63 55 0 55 55PA Gilberton Power Company 10113 OVERDF 0 0 0 0 0PA Grays Ferry Cogen Partnership 54785 2 106 106 105 211 42 42 0 42 42PA Grays Ferry Cogen Partnership 54785 25 70 70 22 92 15 15 45 60 60
A-57
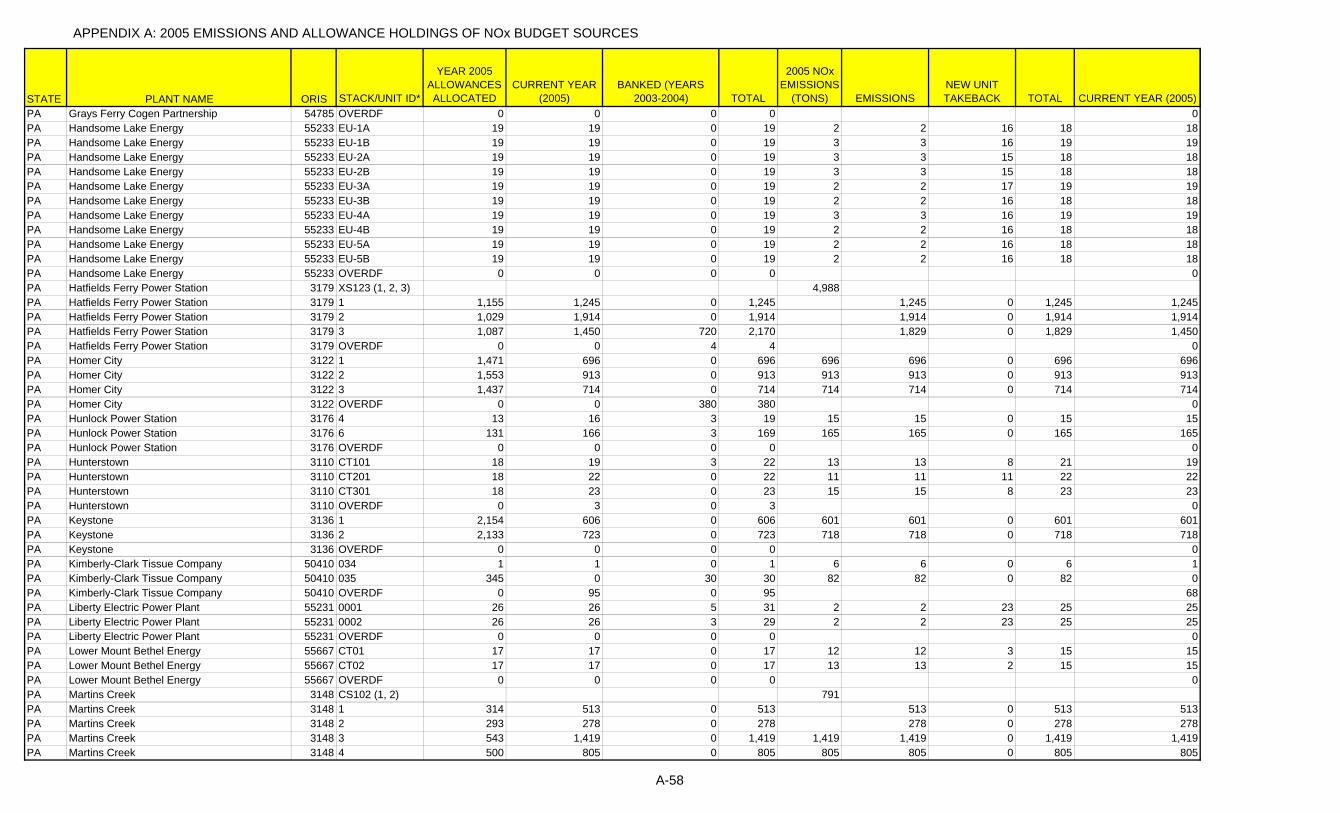
APPENDIX A: 2005 EMISSIONS AND ALLOWANCE HOLDINGS OF NOx BUDGET SOURCES
STATE PLANT NAME ORIS STACK/UNIT ID*
YEAR 2005 ALLOWANCES ALLOCATED
CURRENT YEAR (2005)
BANKED (YEARS 2003-2004) TOTAL
2005 NOx EMISSIONS
(TONS) EMISSIONSNEW UNIT TAKEBACK TOTAL CURRENT YEAR (2005)
PA Grays Ferry Cogen Partnership 54785 OVERDF 0 0 0 0 0PA Handsome Lake Energy 55233 EU-1A 19 19 0 19 2 2 16 18 18PA Handsome Lake Energy 55233 EU-1B 19 19 0 19 3 3 16 19 19PA Handsome Lake Energy 55233 EU-2A 19 19 0 19 3 3 15 18 18PA Handsome Lake Energy 55233 EU-2B 19 19 0 19 3 3 15 18 18PA Handsome Lake Energy 55233 EU-3A 19 19 0 19 2 2 17 19 19PA Handsome Lake Energy 55233 EU-3B 19 19 0 19 2 2 16 18 18PA Handsome Lake Energy 55233 EU-4A 19 19 0 19 3 3 16 19 19PA Handsome Lake Energy 55233 EU-4B 19 19 0 19 2 2 16 18 18PA Handsome Lake Energy 55233 EU-5A 19 19 0 19 2 2 16 18 18PA Handsome Lake Energy 55233 EU-5B 19 19 0 19 2 2 16 18 18PA Handsome Lake Energy 55233 OVERDF 0 0 0 0 0PA Hatfields Ferry Power Station 3179 XS123 (1, 2, 3) 4,988PA Hatfields Ferry Power Station 3179 1 1,155 1,245 0 1,245 1,245 0 1,245 1,245PA Hatfields Ferry Power Station 3179 2 1,029 1,914 0 1,914 1,914 0 1,914 1,914PA Hatfields Ferry Power Station 3179 3 1,087 1,450 720 2,170 1,829 0 1,829 1,450PA Hatfields Ferry Power Station 3179 OVERDF 0 0 4 4 0PA Homer City 3122 1 1,471 696 0 696 696 696 0 696 696PA Homer City 3122 2 1,553 913 0 913 913 913 0 913 913PA Homer City 3122 3 1,437 714 0 714 714 714 0 714 714PA Homer City 3122 OVERDF 0 0 380 380 0PA Hunlock Power Station 3176 4 13 16 3 19 15 15 0 15 15PA Hunlock Power Station 3176 6 131 166 3 169 165 165 0 165 165PA Hunlock Power Station 3176 OVERDF 0 0 0 0 0PA Hunterstown 3110 CT101 18 19 3 22 13 13 8 21 19PA Hunterstown 3110 CT201 18 22 0 22 11 11 11 22 22PA Hunterstown 3110 CT301 18 23 0 23 15 15 8 23 23PA Hunterstown 3110 OVERDF 0 3 0 3 0PA Keystone 3136 1 2,154 606 0 606 601 601 0 601 601PA Keystone 3136 2 2,133 723 0 723 718 718 0 718 718PA Keystone 3136 OVERDF 0 0 0 0 0PA Kimberly-Clark Tissue Company 50410 034 1 1 0 1 6 6 0 6 1PA Kimberly-Clark Tissue Company 50410 035 345 0 30 30 82 82 0 82 0PA Kimberly-Clark Tissue Company 50410 OVERDF 0 95 0 95 68PA Liberty Electric Power Plant 55231 0001 26 26 5 31 2 2 23 25 25PA Liberty Electric Power Plant 55231 0002 26 26 3 29 2 2 23 25 25PA Liberty Electric Power Plant 55231 OVERDF 0 0 0 0 0PA Lower Mount Bethel Energy 55667 CT01 17 17 0 17 12 12 3 15 15PA Lower Mount Bethel Energy 55667 CT02 17 17 0 17 13 13 2 15 15PA Lower Mount Bethel Energy 55667 OVERDF 0 0 0 0 0PA Martins Creek 3148 CS102 (1, 2) 791PA Martins Creek 3148 1 314 513 0 513 513 0 513 513PA Martins Creek 3148 2 293 278 0 278 278 0 278 278PA Martins Creek 3148 3 543 1,419 0 1,419 1,419 1,419 0 1,419 1,419PA Martins Creek 3148 4 500 805 0 805 805 805 0 805 805
A-58

APPENDIX A: 2005 EMISSIONS AND ALLOWANCE HOLDINGS OF NOx BUDGET SOURCES
STATE PLANT NAME ORIS STACK/UNIT ID*
YEAR 2005 ALLOWANCES ALLOCATED
CURRENT YEAR (2005)
BANKED (YEARS 2003-2004) TOTAL
2005 NOx EMISSIONS
(TONS) EMISSIONSNEW UNIT TAKEBACK TOTAL CURRENT YEAR (2005)
PA Martins Creek 3148 AUX4B 0 0 0 0 0 0 0 0PA Martins Creek 3148 OVERDF 0 2 0 2 0PA Merck & Company - West Point 52149 039 126 36 14 50 45 45 0 45 36PA Merck & Company - West Point 52149 040 12 19 0 19 18 18 0 18 18PA Merck & Company - West Point 52149 OVERDF 0 8 0 8 0PA Mitchell Power Station 3181 1 10 0 0 0 1 1 0 1 0PA Mitchell Power Station 3181 2 6 0 12 12 2 2 0 2 0PA Mitchell Power Station 3181 3 9 0 0 0 0 0 0 0PA Mitchell Power Station 3181 33 556 347 580 927 697 697 0 697 347PA Mitchell Power Station 3181 OVERDF 0 0 4 4 0PA Montour 3149 1 1,560 720 0 720 720 720 0 720 720PA Montour 3149 2 1,673 638 0 638 638 638 0 638 638PA Montour 3149 AUX1 0 7 0 7 7 7 0 7 7PA Montour 3149 AUX2 0 10 0 10 10 10 0 10 10PA Montour 3149 OVERDF 0 2 0 2 0PA Mountain 3111 031 5 15 0 15 15 15 0 15 15PA Mountain 3111 032 5 14 0 14 14 14 0 14 14PA Mountain 3111 OVERDF 0 2 0 2 0PA Mt. Carmel Cogeneration 10343 SG-101 152 118 9 127 118 118 0 118 118PA New Castle 3138 3 190 253 0 253 253 253 0 253 253PA New Castle 3138 4 195 249 0 249 249 249 0 249 249PA New Castle 3138 5 245 446 0 446 446 446 0 446 446PA New Castle 3138 OVERDF 0 15 0 15 0PA North East Cogeneration Plant 54571 001 103 7 0 7 6 6 0 6 6PA North East Cogeneration Plant 54571 002 109 5 0 5 3 3 0 3 3PA North East Cogeneration Plant 54571 OVERDF 0 0 0 0 0PA Northampton Generating Plant 50888 NGC01 291 185 12 197 179 179 0 179 179PA Northeastern Power Company 50039 031 188 37 4 41 31 31 0 31 31PA Ontelaunee Energy Center 55193 CT1 9 9 0 9 8 8 1 9 9PA Ontelaunee Energy Center 55193 CT2 9 9 1 10 8 8 0 8 8PA Ontelaunee Energy Center 55193 OVERDF 0 0 0 0 0PA P H Glatfelter Company 50397 034 112 255 16 271 265 265 0 265 255PA P H Glatfelter Company 50397 035 137 198 0 198 198 198 0 198 198PA P H Glatfelter Company 50397 036 211 151 0 151 151 151 0 151 151PA P H Glatfelter Company 50397 OVERDF 0 6 0 6 0PA Panther Creek Energy Facility 50776 1 134 74 8 82 77 77 0 77 74PA Panther Creek Energy Facility 50776 2 130 83 8 91 86 86 0 86 83PA Panther Creek Energy Facility 50776 OVERDF 0 0 0 0 0PA PEI Power Power Corporation 50279 2 29 29 6 35 13 13 16 29 29PA PEI Power Power Corporation 50279 OVERDF 0 0 0 0 0PA Philadelphia Refinery 52106 CS0001 (150137, 150138, 150139, 150140) 395PA Philadelphia Refinery 52106 150137 49 49 0 49 47 0 47 47PA Philadelphia Refinery 52106 150138 83 83 0 83 83 0 83 83PA Philadelphia Refinery 52106 150139 105 105 0 105 103 0 103 103PA Philadelphia Refinery 52106 150140 127 127 61 188 162 0 162 124
A-59

APPENDIX A: 2005 EMISSIONS AND ALLOWANCE HOLDINGS OF NOx BUDGET SOURCES
STATE PLANT NAME ORIS STACK/UNIT ID*
YEAR 2005 ALLOWANCES ALLOCATED
CURRENT YEAR (2005)
BANKED (YEARS 2003-2004) TOTAL
2005 NOx EMISSIONS
(TONS) EMISSIONSNEW UNIT TAKEBACK TOTAL CURRENT YEAR (2005)
PA Philadelphia Refinery 52106 OVERDF 0 0 0 0 0PA Piney Creek Power Plant 54144 031 102 62 3 65 58 58 0 58 58PA Portland 3113 1 266 411 0 411 411 411 0 411 411PA Portland 3113 2 412 753 0 753 753 753 0 753 753PA Portland 3113 5 48 48 0 48 24 24 0 24 24PA Portland 3113 OVERDF 0 15 0 15 0PA Procter & Gamble Paper Products 50463 328001 199 140 0 140 140 140 0 140 140PA Richmond 3168 91 10 18 0 18 16 16 0 16 16PA Richmond 3168 92 9 18 0 18 17 17 0 17 17PA Richmond 3168 OVERDF 0 0 0 0 0PA Schuylkill 3169 1 84 108 0 108 105 105 0 105 105PA Schuylkill 3169 OVERDF 0 0 0 0 0PA Scrubgrass Generating Plant 50974 1 124 70 0 70 62 62 0 62 62PA Scrubgrass Generating Plant 50974 2 123 93 0 93 88 88 0 88 88PA Scrubgrass Generating Plant 50974 OVERDF 0 14 10 24 0PA Seward 3130 CS1 (1, 2) 674PA Seward 3130 1 238 358 0 358 358 0 358 358PA Seward 3130 2 238 316 0 316 316 0 316 316PA Seward 3130 OVERDF 0 10 0 10 0PA Shawville 3131 1 295 665 0 665 665 665 0 665 665PA Shawville 3131 2 294 453 0 453 453 453 0 453 453PA Shawville 3131 CS1 (3, 4) 1,464PA Shawville 3131 3 380 744 0 744 744 0 744 744PA Shawville 3131 4 392 720 0 720 720 0 720 720PA Shawville 3131 OVERDF 0 20 0 20 0PA Shenango Incorporated 54532 6 59 9 30 39 0 0 0 0PA Shenango Incorporated 54532 9 11 0 0 0 0 0 0 0PA Shenango Incorporated 54532 OVERDF 0 0 0 0 0PA Shermans Dale Station 880050 31801 0 0 0 0 0 0 0 0PA St. Nicholas Cogeneration Project 54634 1 289 115 18 133 124 124 0 124 113PA Sunbury 3152 3 263 325 5 330 311 311 0 311 308PA Sunbury 3152 4 302 311 6 317 295 295 0 295 291PA Sunbury 3152 CS1 (1A, 1B) 240PA Sunbury 3152 1A 134 0 228 228 131 0 131 0PA Sunbury 3152 1B 122 0 182 182 109 0 109 0PA Sunbury 3152 CS2 (2A, 2B) 217PA Sunbury 3152 2A 130 5 166 171 102 0 102 0PA Sunbury 3152 2B 134 119 3 122 115 0 115 113PA Sunbury 3152 OVERDF 0 50 0 50 0PA Sunoco Chemicals Frankford Plant 880007 052 86 86 2 88 62 62 0 62 62PA Titus 3115 CS1 (1, 2, 3) 763PA Titus 3115 1 161 262 0 262 262 0 262 262PA Titus 3115 2 152 240 0 240 240 0 240 240PA Titus 3115 3 151 261 0 261 261 0 261 261PA Titus 3115 OVERDF 0 15 0 15 0
A-60

APPENDIX A: 2005 EMISSIONS AND ALLOWANCE HOLDINGS OF NOx BUDGET SOURCES
STATE PLANT NAME ORIS STACK/UNIT ID*
YEAR 2005 ALLOWANCES ALLOCATED
CURRENT YEAR (2005)
BANKED (YEARS 2003-2004) TOTAL
2005 NOx EMISSIONS
(TONS) EMISSIONSNEW UNIT TAKEBACK TOTAL CURRENT YEAR (2005)
PA Tolna 3116 031 3 25 0 25 25 25 0 25 25PA Tolna 3116 032 4 26 0 26 26 26 0 26 26PA Tolna 3116 OVERDF 0 4 0 4 0PA Trigen Energy - Schuykill 50607 23 233 27 5 32 27 27 0 27 27PA Trigen Energy - Schuykill 50607 24 234 1 5 6 1 1 0 1 1PA Trigen Energy - Schuykill 50607 26 234 0 32 32 0 0 0 0PA Trigen Energy - Schuykill 50607 OVERDF 0 0 0 0 0PA Trigen Energy Corporation-Edison St 880006 1 12 9 0 9 8 8 0 8 8PA Trigen Energy Corporation-Edison St 880006 2 10 5 0 5 3 3 0 3 3PA Trigen Energy Corporation-Edison St 880006 3 5 20 0 20 20 20 0 20 20PA Trigen Energy Corporation-Edison St 880006 4 6 17 0 17 16 16 0 16 16PA Trigen Energy Corporation-Edison St 880006 OVERDF 0 0 0 0 0PA US Steel (Clariton Coke) 50729 CLBLR1 191 119 4 123 118 118 0 118 118PA US Steel (Clariton Coke) 50729 CLBLR2 118 71 3 74 71 71 0 71 71PA US Steel (Clariton Coke) 50729 OVERDF 0 1 0 1 0PA US Steel (Edgar Thompson) 50732 ETBLR1 142 24 3 27 24 24 0 24 24PA US Steel (Edgar Thompson) 50732 ETBLR2 157 22 3 25 21 21 0 21 21PA US Steel (Edgar Thompson) 50732 ETBLR3 151 18 4 22 17 17 0 17 17PA US Steel (Edgar Thompson) 50732 OVERDF 0 1 0 1 0PA Warren 3132 005 14 0 0 0 0 0 0 0PA Warren 3132 OVERDF 0 0 0 0 0PA Westwood 50611 031 98 131 49 180 154 154 0 154 124PA Wheelabrator - Frackville 50879 GEN1 161 105 3 108 104 104 0 104 104PA Willamette Industries 54638 CS1 (040, 041) 299PA Willamette Industries 54638 040 90 150 0 150 150 0 150 150PA Willamette Industries 54638 041 89 141 0 141 149 0 149 141PA Willamette Industries 54638 OVERDF 0 0 36 36 0PA Williams Generation Co (Hazleton) 10870 TURB2 13 13 1 14 3 3 10 13 13PA Williams Generation Co (Hazleton) 10870 TURB3 13 13 1 14 3 3 10 13 13PA Williams Generation Co (Hazleton) 10870 TURB4 13 13 1 14 4 4 9 13 13PA Williams Generation Co (Hazleton) 10870 TURBIN 141 5 1 6 6 6 0 6 5PA Williams Generation Co (Hazleton) 10870 OVERDF 0 0 0 0 0RI Manchester Street 3236 9 87 36 0 36 36 36 0 36 36RI Manchester Street 3236 10 87 38 0 38 38 38 0 38 38RI Manchester Street 3236 11 88 37 0 37 37 37 0 37 37RI Manchester Street 3236 OVERDF 0 0 0 0 0RI Ocean State Power 51030 1 68 8 1 9 8 8 0 8 8RI Ocean State Power 51030 2 69 8 1 9 7 7 0 7 7RI Ocean State Power 51030 OVERDF 0 0 0 0 0RI Ocean State Power II 54324 3 69 19 0 19 16 16 0 16 16RI Ocean State Power II 54324 4 69 20 0 20 19 19 0 19 19RI Ocean State Power II 54324 OVERDF 0 0 0 0 0RI Pawtucket Power Associates, LP 54056 1 42 5 5 10 3 3 0 3 3RI Rhode Island State Energy Partners 55107 RISEP1 26 26 0 26 19 19 0 19 19RI Rhode Island State Energy Partners 55107 RISEP2 26 26 0 26 17 17 0 17 17
A-61

APPENDIX A: 2005 EMISSIONS AND ALLOWANCE HOLDINGS OF NOx BUDGET SOURCES
STATE PLANT NAME ORIS STACK/UNIT ID*
YEAR 2005 ALLOWANCES ALLOCATED
CURRENT YEAR (2005)
BANKED (YEARS 2003-2004) TOTAL
2005 NOx EMISSIONS
(TONS) EMISSIONSNEW UNIT TAKEBACK TOTAL CURRENT YEAR (2005)
RI Rhode Island State Energy Partners 55107 OVERDF 0 0 0 0 0RI Tiverton Power Associates 55048 1 46 22 0 22 22 22 0 22 22SC Bowater Incorporated 2440 001 78 36 0 36 28 28 0 28 28SC Broad River Energy Center 55166 CT-1 34 34 23 57 24 24 0 24 24SC Broad River Energy Center 55166 CT-2 34 34 23 57 21 21 0 21 21SC Broad River Energy Center 55166 CT-3 34 34 24 58 25 25 0 25 25SC Broad River Energy Center 55166 CT-4 34 34 25 59 24 24 0 24 24SC Broad River Energy Center 55166 CT-5 34 34 24 58 25 25 0 25 25SC Broad River Energy Center 55166 OVERDF 0 0 0 0 0SC Canadys Steam 3280 CAN1 279 641 501 1,142 760 760 0 760 641SC Canadys Steam 3280 CAN2 295 751 115 866 774 774 0 774 751SC Canadys Steam 3280 CAN3 404 979 167 1,146 1,016 1,016 0 1,016 979SC Canadys Steam 3280 OVERDF 0 0 0 0 0SC Celanese Acetate, Celriver 880073 006 163 0 1 1 0 0 0 0SC Cherokee County Cogen 55043 CCCP1 160 90 9 99 12 12 0 12 12SC Cogen South 7737 B001 733 597 0 597 703 703 0 703 597SC Cogen South 7737 B002 5 9 0 9 8 8 0 8 8SC Cogen South 7737 B003 5 6 0 6 6 6 0 6 6SC Cogen South 7737 B004 5 4 0 4 4 4 0 4 4SC Cogen South 7737 OVERDF 0 150 0 150 106SC Columbia Energy Center (SC) 55386 B-1 7 7 3 10 6 6 0 6 6SC Columbia Energy Center (SC) 55386 B-2 7 7 4 11 7 7 0 7 7SC Columbia Energy Center (SC) 55386 B-3 12 12 7 19 7 7 0 7 7SC Columbia Energy Center (SC) 55386 CT-1 51 51 23 74 9 9 0 9 9SC Columbia Energy Center (SC) 55386 CT-2 52 52 20 72 9 9 0 9 9SC Columbia Energy Center (SC) 55386 OVERDF 0 0 0 0 0SC Cope Station 7210 COP1 1,181 1,867 504 2,371 1,981 1,981 0 1,981 1,867SC Cross 130 1 1,481 649 0 649 649 649 0 649 649SC Cross 130 2 1,366 593 0 593 593 593 0 593 593SC Cross 130 OVERDF 0 10 0 10 0SC Darlington County 3250 1 30 5 0 5 5 5 0 5 5SC Darlington County 3250 2 13 6 0 6 6 6 0 6 6SC Darlington County 3250 3 28 5 0 5 4 4 0 4 4SC Darlington County 3250 4 18 4 0 4 4 4 0 4 4SC Darlington County 3250 5 28 6 0 6 6 6 0 6 6SC Darlington County 3250 6 15 3 0 3 3 3 0 3 3SC Darlington County 3250 7 19 6 0 6 6 6 0 6 6SC Darlington County 3250 8 14 3 0 3 3 3 0 3 3SC Darlington County 3250 9 14 1 0 1 1 1 0 1 1SC Darlington County 3250 10 17 2 0 2 2 2 0 2 2SC Darlington County 3250 11 15 2 0 2 2 2 0 2 2SC Darlington County 3250 12 37 12 0 12 12 12 0 12 12SC Darlington County 3250 13 62 11 0 11 11 11 0 11 11SC Darlington County 3250 OVERDF 0 0 21 21 0SC Dolphus M Grainger 3317 1 209 577 0 577 577 577 0 577 577
A-62
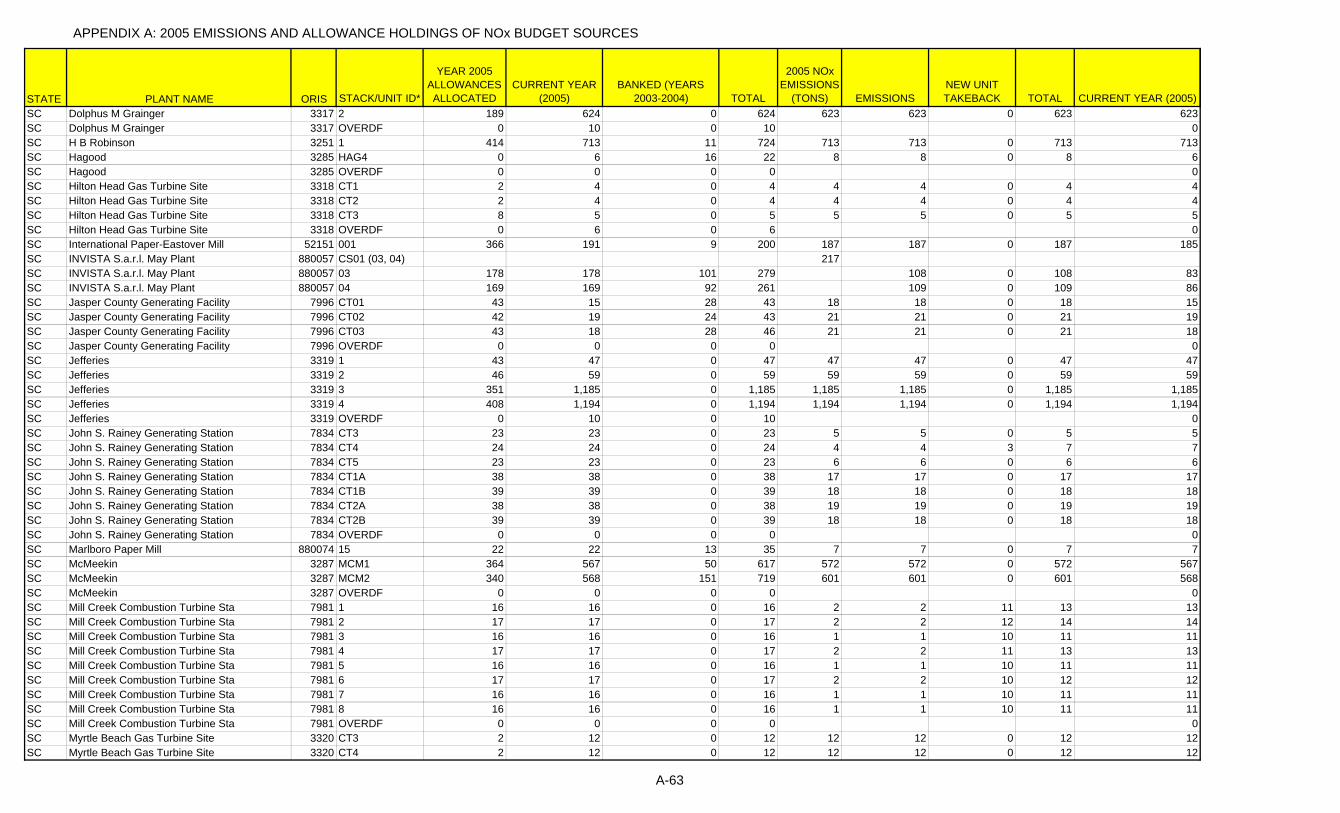
APPENDIX A: 2005 EMISSIONS AND ALLOWANCE HOLDINGS OF NOx BUDGET SOURCES
STATE PLANT NAME ORIS STACK/UNIT ID*
YEAR 2005 ALLOWANCES ALLOCATED
CURRENT YEAR (2005)
BANKED (YEARS 2003-2004) TOTAL
2005 NOx EMISSIONS
(TONS) EMISSIONSNEW UNIT TAKEBACK TOTAL CURRENT YEAR (2005)
SC Dolphus M Grainger 3317 2 189 624 0 624 623 623 0 623 623SC Dolphus M Grainger 3317 OVERDF 0 10 0 10 0SC H B Robinson 3251 1 414 713 11 724 713 713 0 713 713SC Hagood 3285 HAG4 0 6 16 22 8 8 0 8 6SC Hagood 3285 OVERDF 0 0 0 0 0SC Hilton Head Gas Turbine Site 3318 CT1 2 4 0 4 4 4 0 4 4SC Hilton Head Gas Turbine Site 3318 CT2 2 4 0 4 4 4 0 4 4SC Hilton Head Gas Turbine Site 3318 CT3 8 5 0 5 5 5 0 5 5SC Hilton Head Gas Turbine Site 3318 OVERDF 0 6 0 6 0SC International Paper-Eastover Mill 52151 001 366 191 9 200 187 187 0 187 185SC INVISTA S.a.r.l. May Plant 880057 CS01 (03, 04) 217SC INVISTA S.a.r.l. May Plant 880057 03 178 178 101 279 108 0 108 83SC INVISTA S.a.r.l. May Plant 880057 04 169 169 92 261 109 0 109 86SC Jasper County Generating Facility 7996 CT01 43 15 28 43 18 18 0 18 15SC Jasper County Generating Facility 7996 CT02 42 19 24 43 21 21 0 21 19SC Jasper County Generating Facility 7996 CT03 43 18 28 46 21 21 0 21 18SC Jasper County Generating Facility 7996 OVERDF 0 0 0 0 0SC Jefferies 3319 1 43 47 0 47 47 47 0 47 47SC Jefferies 3319 2 46 59 0 59 59 59 0 59 59SC Jefferies 3319 3 351 1,185 0 1,185 1,185 1,185 0 1,185 1,185SC Jefferies 3319 4 408 1,194 0 1,194 1,194 1,194 0 1,194 1,194SC Jefferies 3319 OVERDF 0 10 0 10 0SC John S. Rainey Generating Station 7834 CT3 23 23 0 23 5 5 0 5 5SC John S. Rainey Generating Station 7834 CT4 24 24 0 24 4 4 3 7 7SC John S. Rainey Generating Station 7834 CT5 23 23 0 23 6 6 0 6 6SC John S. Rainey Generating Station 7834 CT1A 38 38 0 38 17 17 0 17 17SC John S. Rainey Generating Station 7834 CT1B 39 39 0 39 18 18 0 18 18SC John S. Rainey Generating Station 7834 CT2A 38 38 0 38 19 19 0 19 19SC John S. Rainey Generating Station 7834 CT2B 39 39 0 39 18 18 0 18 18SC John S. Rainey Generating Station 7834 OVERDF 0 0 0 0 0SC Marlboro Paper Mill 880074 15 22 22 13 35 7 7 0 7 7SC McMeekin 3287 MCM1 364 567 50 617 572 572 0 572 567SC McMeekin 3287 MCM2 340 568 151 719 601 601 0 601 568SC McMeekin 3287 OVERDF 0 0 0 0 0SC Mill Creek Combustion Turbine Sta 7981 1 16 16 0 16 2 2 11 13 13SC Mill Creek Combustion Turbine Sta 7981 2 17 17 0 17 2 2 12 14 14SC Mill Creek Combustion Turbine Sta 7981 3 16 16 0 16 1 1 10 11 11SC Mill Creek Combustion Turbine Sta 7981 4 17 17 0 17 2 2 11 13 13SC Mill Creek Combustion Turbine Sta 7981 5 16 16 0 16 1 1 10 11 11SC Mill Creek Combustion Turbine Sta 7981 6 17 17 0 17 2 2 10 12 12SC Mill Creek Combustion Turbine Sta 7981 7 16 16 0 16 1 1 10 11 11SC Mill Creek Combustion Turbine Sta 7981 8 16 16 0 16 1 1 10 11 11SC Mill Creek Combustion Turbine Sta 7981 OVERDF 0 0 0 0 0SC Myrtle Beach Gas Turbine Site 3320 CT3 2 12 0 12 12 12 0 12 12SC Myrtle Beach Gas Turbine Site 3320 CT4 2 12 0 12 12 12 0 12 12
A-63
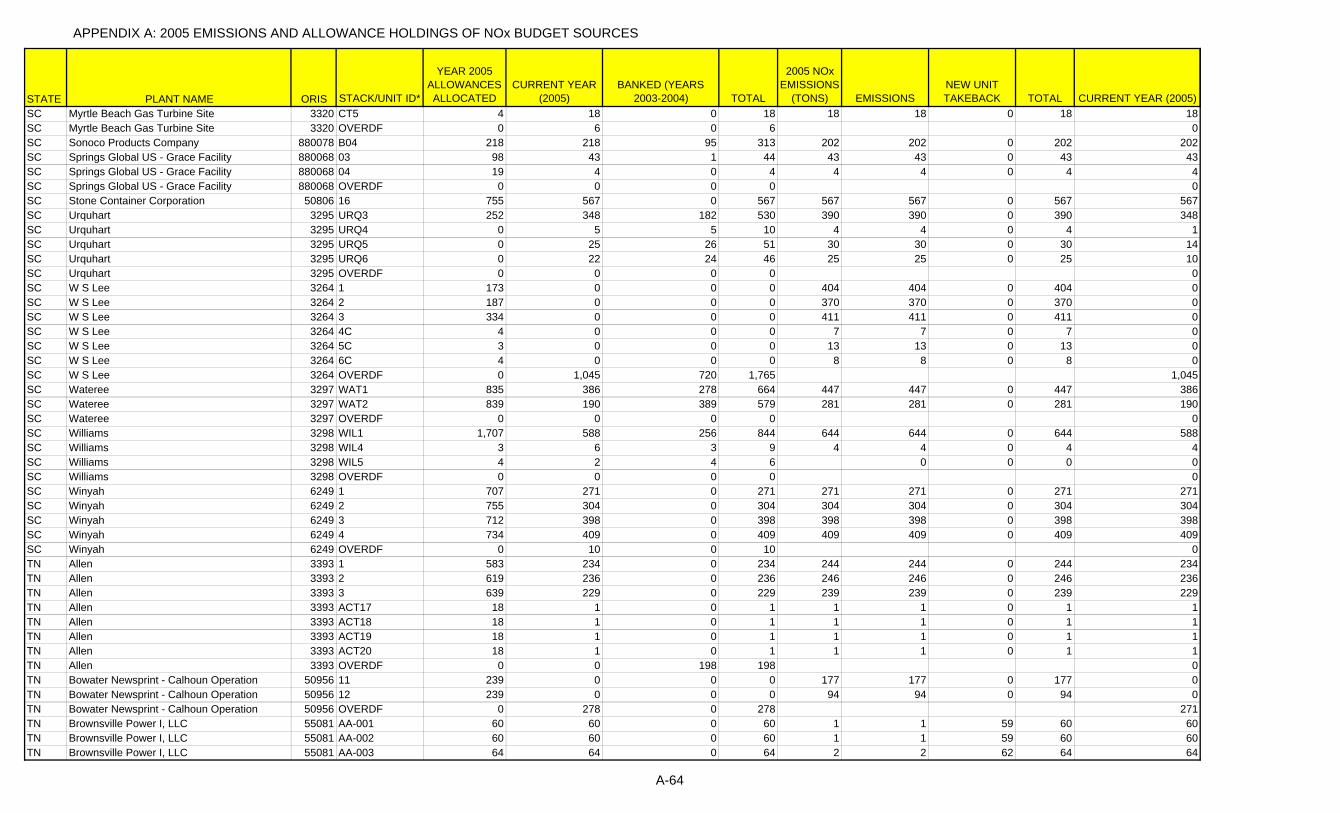
APPENDIX A: 2005 EMISSIONS AND ALLOWANCE HOLDINGS OF NOx BUDGET SOURCES
STATE PLANT NAME ORIS STACK/UNIT ID*
YEAR 2005 ALLOWANCES ALLOCATED
CURRENT YEAR (2005)
BANKED (YEARS 2003-2004) TOTAL
2005 NOx EMISSIONS
(TONS) EMISSIONSNEW UNIT TAKEBACK TOTAL CURRENT YEAR (2005)
SC Myrtle Beach Gas Turbine Site 3320 CT5 4 18 0 18 18 18 0 18 18SC Myrtle Beach Gas Turbine Site 3320 OVERDF 0 6 0 6 0SC Sonoco Products Company 880078 B04 218 218 95 313 202 202 0 202 202SC Springs Global US - Grace Facility 880068 03 98 43 1 44 43 43 0 43 43SC Springs Global US - Grace Facility 880068 04 19 4 0 4 4 4 0 4 4SC Springs Global US - Grace Facility 880068 OVERDF 0 0 0 0 0SC Stone Container Corporation 50806 16 755 567 0 567 567 567 0 567 567SC Urquhart 3295 URQ3 252 348 182 530 390 390 0 390 348SC Urquhart 3295 URQ4 0 5 5 10 4 4 0 4 1SC Urquhart 3295 URQ5 0 25 26 51 30 30 0 30 14SC Urquhart 3295 URQ6 0 22 24 46 25 25 0 25 10SC Urquhart 3295 OVERDF 0 0 0 0 0SC W S Lee 3264 1 173 0 0 0 404 404 0 404 0SC W S Lee 3264 2 187 0 0 0 370 370 0 370 0SC W S Lee 3264 3 334 0 0 0 411 411 0 411 0SC W S Lee 3264 4C 4 0 0 0 7 7 0 7 0SC W S Lee 3264 5C 3 0 0 0 13 13 0 13 0SC W S Lee 3264 6C 4 0 0 0 8 8 0 8 0SC W S Lee 3264 OVERDF 0 1,045 720 1,765 1,045SC Wateree 3297 WAT1 835 386 278 664 447 447 0 447 386SC Wateree 3297 WAT2 839 190 389 579 281 281 0 281 190SC Wateree 3297 OVERDF 0 0 0 0 0SC Williams 3298 WIL1 1,707 588 256 844 644 644 0 644 588SC Williams 3298 WIL4 3 6 3 9 4 4 0 4 4SC Williams 3298 WIL5 4 2 4 6 0 0 0 0SC Williams 3298 OVERDF 0 0 0 0 0SC Winyah 6249 1 707 271 0 271 271 271 0 271 271SC Winyah 6249 2 755 304 0 304 304 304 0 304 304SC Winyah 6249 3 712 398 0 398 398 398 0 398 398SC Winyah 6249 4 734 409 0 409 409 409 0 409 409SC Winyah 6249 OVERDF 0 10 0 10 0TN Allen 3393 1 583 234 0 234 244 244 0 244 234TN Allen 3393 2 619 236 0 236 246 246 0 246 236TN Allen 3393 3 639 229 0 229 239 239 0 239 229TN Allen 3393 ACT17 18 1 0 1 1 1 0 1 1TN Allen 3393 ACT18 18 1 0 1 1 1 0 1 1TN Allen 3393 ACT19 18 1 0 1 1 1 0 1 1TN Allen 3393 ACT20 18 1 0 1 1 1 0 1 1TN Allen 3393 OVERDF 0 0 198 198 0TN Bowater Newsprint - Calhoun Operation 50956 11 239 0 0 0 177 177 0 177 0TN Bowater Newsprint - Calhoun Operation 50956 12 239 0 0 0 94 94 0 94 0TN Bowater Newsprint - Calhoun Operation 50956 OVERDF 0 278 0 278 271TN Brownsville Power I, LLC 55081 AA-001 60 60 0 60 1 1 59 60 60TN Brownsville Power I, LLC 55081 AA-002 60 60 0 60 1 1 59 60 60TN Brownsville Power I, LLC 55081 AA-003 64 64 0 64 2 2 62 64 64
A-64
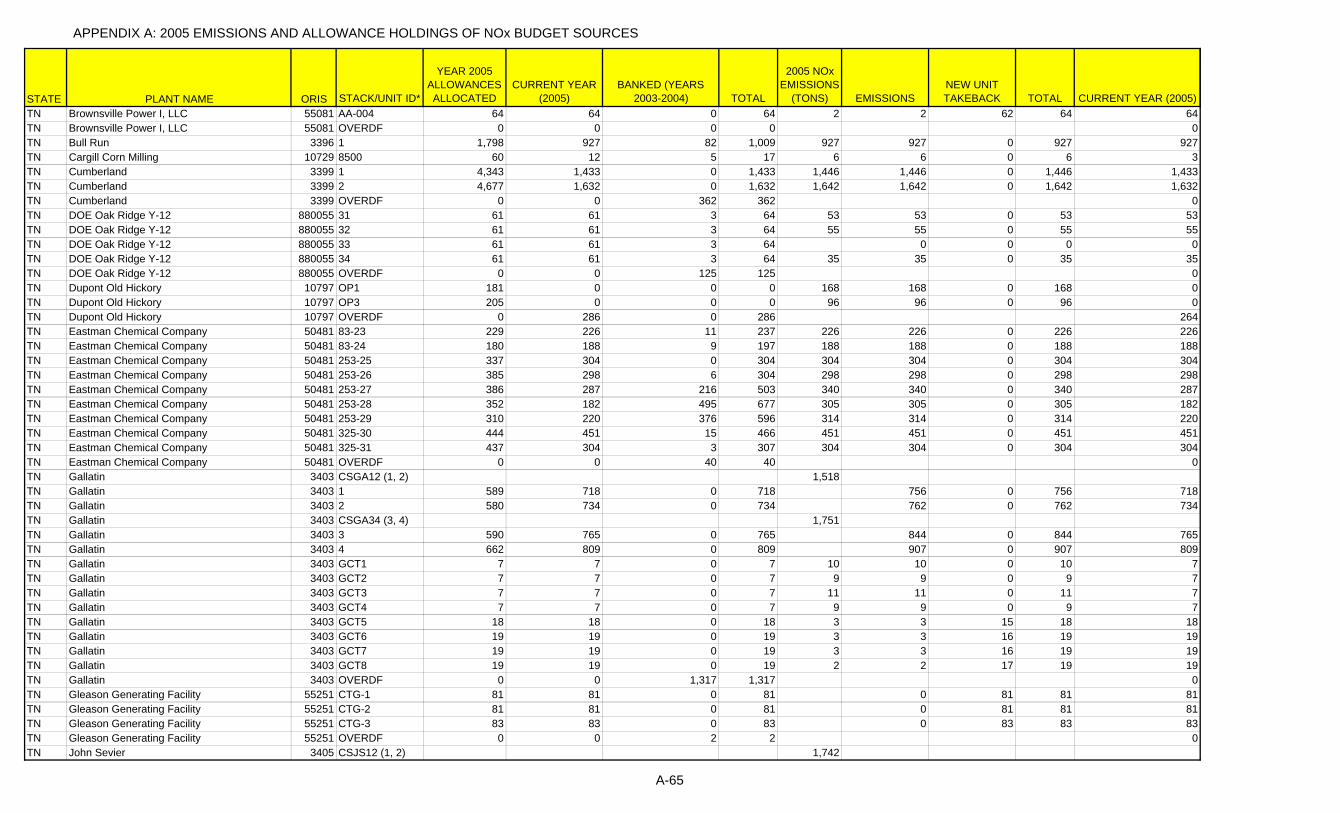
APPENDIX A: 2005 EMISSIONS AND ALLOWANCE HOLDINGS OF NOx BUDGET SOURCES
STATE PLANT NAME ORIS STACK/UNIT ID*
YEAR 2005 ALLOWANCES ALLOCATED
CURRENT YEAR (2005)
BANKED (YEARS 2003-2004) TOTAL
2005 NOx EMISSIONS
(TONS) EMISSIONSNEW UNIT TAKEBACK TOTAL CURRENT YEAR (2005)
TN Brownsville Power I, LLC 55081 AA-004 64 64 0 64 2 2 62 64 64TN Brownsville Power I, LLC 55081 OVERDF 0 0 0 0 0TN Bull Run 3396 1 1,798 927 82 1,009 927 927 0 927 927TN Cargill Corn Milling 10729 8500 60 12 5 17 6 6 0 6 3TN Cumberland 3399 1 4,343 1,433 0 1,433 1,446 1,446 0 1,446 1,433TN Cumberland 3399 2 4,677 1,632 0 1,632 1,642 1,642 0 1,642 1,632TN Cumberland 3399 OVERDF 0 0 362 362 0TN DOE Oak Ridge Y-12 880055 31 61 61 3 64 53 53 0 53 53TN DOE Oak Ridge Y-12 880055 32 61 61 3 64 55 55 0 55 55TN DOE Oak Ridge Y-12 880055 33 61 61 3 64 0 0 0 0TN DOE Oak Ridge Y-12 880055 34 61 61 3 64 35 35 0 35 35TN DOE Oak Ridge Y-12 880055 OVERDF 0 0 125 125 0TN Dupont Old Hickory 10797 OP1 181 0 0 0 168 168 0 168 0TN Dupont Old Hickory 10797 OP3 205 0 0 0 96 96 0 96 0TN Dupont Old Hickory 10797 OVERDF 0 286 0 286 264TN Eastman Chemical Company 50481 83-23 229 226 11 237 226 226 0 226 226TN Eastman Chemical Company 50481 83-24 180 188 9 197 188 188 0 188 188TN Eastman Chemical Company 50481 253-25 337 304 0 304 304 304 0 304 304TN Eastman Chemical Company 50481 253-26 385 298 6 304 298 298 0 298 298TN Eastman Chemical Company 50481 253-27 386 287 216 503 340 340 0 340 287TN Eastman Chemical Company 50481 253-28 352 182 495 677 305 305 0 305 182TN Eastman Chemical Company 50481 253-29 310 220 376 596 314 314 0 314 220TN Eastman Chemical Company 50481 325-30 444 451 15 466 451 451 0 451 451TN Eastman Chemical Company 50481 325-31 437 304 3 307 304 304 0 304 304TN Eastman Chemical Company 50481 OVERDF 0 0 40 40 0TN Gallatin 3403 CSGA12 (1, 2) 1,518TN Gallatin 3403 1 589 718 0 718 756 0 756 718TN Gallatin 3403 2 580 734 0 734 762 0 762 734TN Gallatin 3403 CSGA34 (3, 4) 1,751TN Gallatin 3403 3 590 765 0 765 844 0 844 765TN Gallatin 3403 4 662 809 0 809 907 0 907 809TN Gallatin 3403 GCT1 7 7 0 7 10 10 0 10 7TN Gallatin 3403 GCT2 7 7 0 7 9 9 0 9 7TN Gallatin 3403 GCT3 7 7 0 7 11 11 0 11 7TN Gallatin 3403 GCT4 7 7 0 7 9 9 0 9 7TN Gallatin 3403 GCT5 18 18 0 18 3 3 15 18 18TN Gallatin 3403 GCT6 19 19 0 19 3 3 16 19 19TN Gallatin 3403 GCT7 19 19 0 19 3 3 16 19 19TN Gallatin 3403 GCT8 19 19 0 19 2 2 17 19 19TN Gallatin 3403 OVERDF 0 0 1,317 1,317 0TN Gleason Generating Facility 55251 CTG-1 81 81 0 81 0 81 81 81TN Gleason Generating Facility 55251 CTG-2 81 81 0 81 0 81 81 81TN Gleason Generating Facility 55251 CTG-3 83 83 0 83 0 83 83 83TN Gleason Generating Facility 55251 OVERDF 0 0 2 2 0TN John Sevier 3405 CSJS12 (1, 2) 1,742
A-65
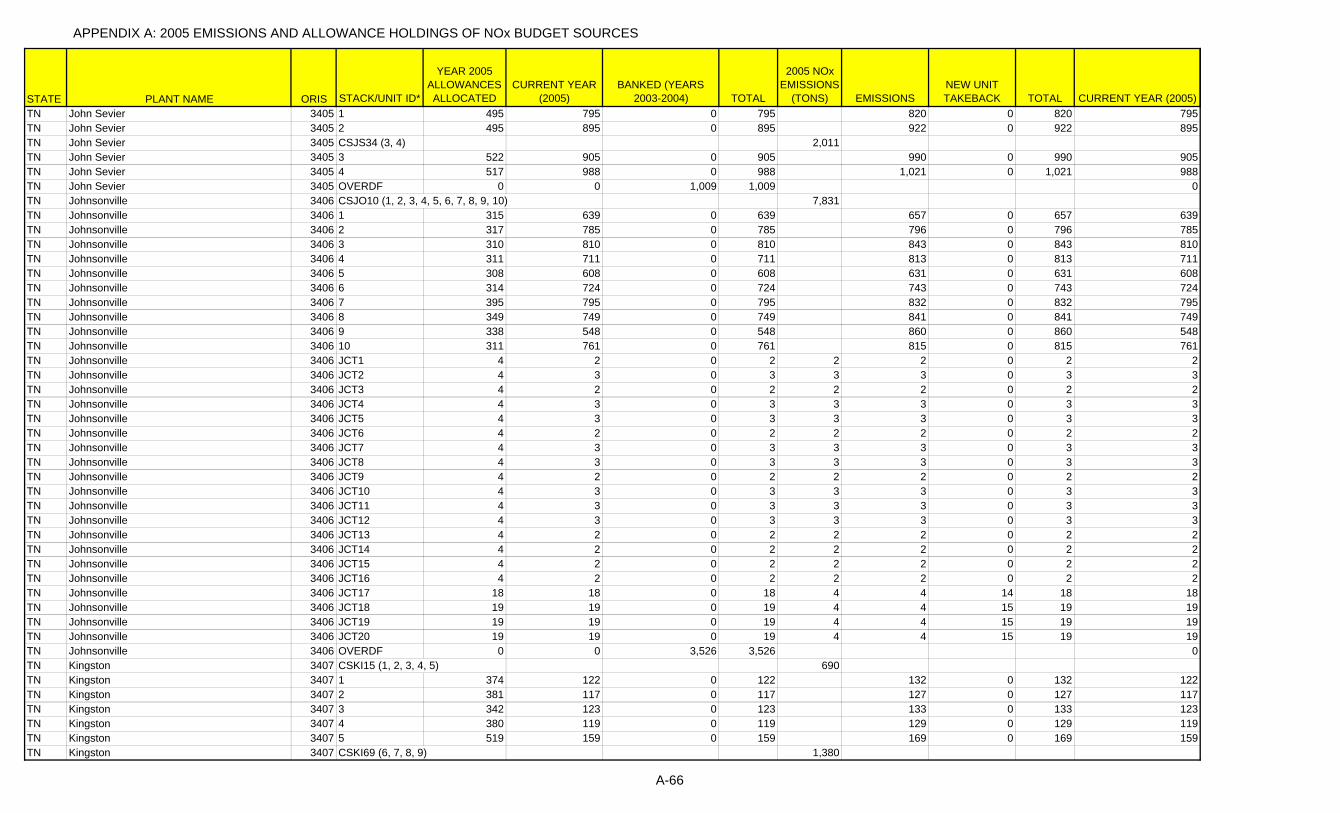
APPENDIX A: 2005 EMISSIONS AND ALLOWANCE HOLDINGS OF NOx BUDGET SOURCES
STATE PLANT NAME ORIS STACK/UNIT ID*
YEAR 2005 ALLOWANCES ALLOCATED
CURRENT YEAR (2005)
BANKED (YEARS 2003-2004) TOTAL
2005 NOx EMISSIONS
(TONS) EMISSIONSNEW UNIT TAKEBACK TOTAL CURRENT YEAR (2005)
TN John Sevier 3405 1 495 795 0 795 820 0 820 795TN John Sevier 3405 2 495 895 0 895 922 0 922 895TN John Sevier 3405 CSJS34 (3, 4) 2,011TN John Sevier 3405 3 522 905 0 905 990 0 990 905TN John Sevier 3405 4 517 988 0 988 1,021 0 1,021 988TN John Sevier 3405 OVERDF 0 0 1,009 1,009 0TN Johnsonville 3406 CSJO10 (1, 2, 3, 4, 5, 6, 7, 8, 9, 10) 7,831TN Johnsonville 3406 1 315 639 0 639 657 0 657 639TN Johnsonville 3406 2 317 785 0 785 796 0 796 785TN Johnsonville 3406 3 310 810 0 810 843 0 843 810TN Johnsonville 3406 4 311 711 0 711 813 0 813 711TN Johnsonville 3406 5 308 608 0 608 631 0 631 608TN Johnsonville 3406 6 314 724 0 724 743 0 743 724TN Johnsonville 3406 7 395 795 0 795 832 0 832 795TN Johnsonville 3406 8 349 749 0 749 841 0 841 749TN Johnsonville 3406 9 338 548 0 548 860 0 860 548TN Johnsonville 3406 10 311 761 0 761 815 0 815 761TN Johnsonville 3406 JCT1 4 2 0 2 2 2 0 2 2TN Johnsonville 3406 JCT2 4 3 0 3 3 3 0 3 3TN Johnsonville 3406 JCT3 4 2 0 2 2 2 0 2 2TN Johnsonville 3406 JCT4 4 3 0 3 3 3 0 3 3TN Johnsonville 3406 JCT5 4 3 0 3 3 3 0 3 3TN Johnsonville 3406 JCT6 4 2 0 2 2 2 0 2 2TN Johnsonville 3406 JCT7 4 3 0 3 3 3 0 3 3TN Johnsonville 3406 JCT8 4 3 0 3 3 3 0 3 3TN Johnsonville 3406 JCT9 4 2 0 2 2 2 0 2 2TN Johnsonville 3406 JCT10 4 3 0 3 3 3 0 3 3TN Johnsonville 3406 JCT11 4 3 0 3 3 3 0 3 3TN Johnsonville 3406 JCT12 4 3 0 3 3 3 0 3 3TN Johnsonville 3406 JCT13 4 2 0 2 2 2 0 2 2TN Johnsonville 3406 JCT14 4 2 0 2 2 2 0 2 2TN Johnsonville 3406 JCT15 4 2 0 2 2 2 0 2 2TN Johnsonville 3406 JCT16 4 2 0 2 2 2 0 2 2TN Johnsonville 3406 JCT17 18 18 0 18 4 4 14 18 18TN Johnsonville 3406 JCT18 19 19 0 19 4 4 15 19 19TN Johnsonville 3406 JCT19 19 19 0 19 4 4 15 19 19TN Johnsonville 3406 JCT20 19 19 0 19 4 4 15 19 19TN Johnsonville 3406 OVERDF 0 0 3,526 3,526 0TN Kingston 3407 CSKI15 (1, 2, 3, 4, 5) 690TN Kingston 3407 1 374 122 0 122 132 0 132 122TN Kingston 3407 2 381 117 0 117 127 0 127 117TN Kingston 3407 3 342 123 0 123 133 0 133 123TN Kingston 3407 4 380 119 0 119 129 0 129 119TN Kingston 3407 5 519 159 0 159 169 0 169 159TN Kingston 3407 CSKI69 (6, 7, 8, 9) 1,380
A-66
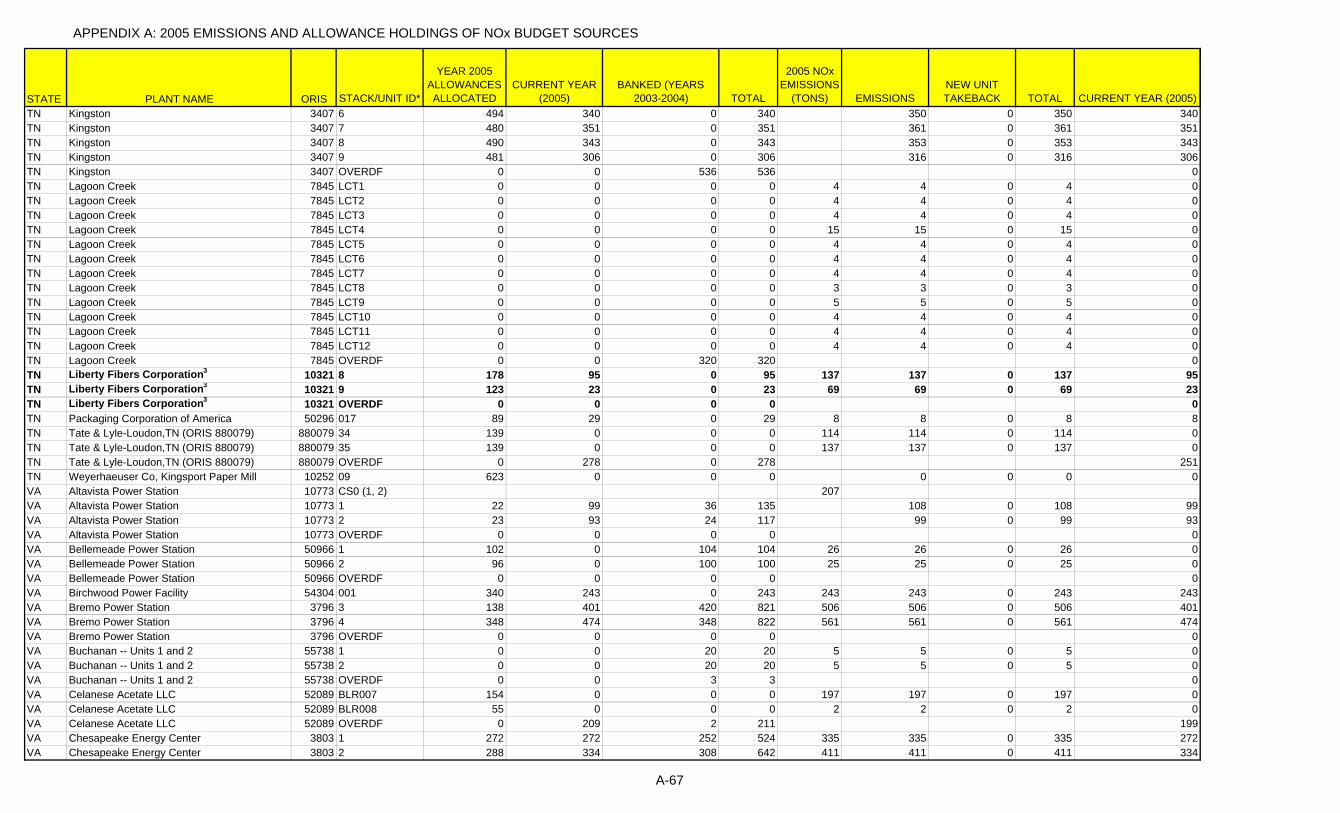
APPENDIX A: 2005 EMISSIONS AND ALLOWANCE HOLDINGS OF NOx BUDGET SOURCES
STATE PLANT NAME ORIS STACK/UNIT ID*
YEAR 2005 ALLOWANCES ALLOCATED
CURRENT YEAR (2005)
BANKED (YEARS 2003-2004) TOTAL
2005 NOx EMISSIONS
(TONS) EMISSIONSNEW UNIT TAKEBACK TOTAL CURRENT YEAR (2005)
TN Kingston 3407 6 494 340 0 340 350 0 350 340TN Kingston 3407 7 480 351 0 351 361 0 361 351TN Kingston 3407 8 490 343 0 343 353 0 353 343TN Kingston 3407 9 481 306 0 306 316 0 316 306TN Kingston 3407 OVERDF 0 0 536 536 0TN Lagoon Creek 7845 LCT1 0 0 0 0 4 4 0 4 0TN Lagoon Creek 7845 LCT2 0 0 0 0 4 4 0 4 0TN Lagoon Creek 7845 LCT3 0 0 0 0 4 4 0 4 0TN Lagoon Creek 7845 LCT4 0 0 0 0 15 15 0 15 0TN Lagoon Creek 7845 LCT5 0 0 0 0 4 4 0 4 0TN Lagoon Creek 7845 LCT6 0 0 0 0 4 4 0 4 0TN Lagoon Creek 7845 LCT7 0 0 0 0 4 4 0 4 0TN Lagoon Creek 7845 LCT8 0 0 0 0 3 3 0 3 0TN Lagoon Creek 7845 LCT9 0 0 0 0 5 5 0 5 0TN Lagoon Creek 7845 LCT10 0 0 0 0 4 4 0 4 0TN Lagoon Creek 7845 LCT11 0 0 0 0 4 4 0 4 0TN Lagoon Creek 7845 LCT12 0 0 0 0 4 4 0 4 0TN Lagoon Creek 7845 OVERDF 0 0 320 320 0TN Liberty Fibers Corporation3 10321 8 178 95 0 95 137 137 0 137 95TN Liberty Fibers Corporation3 10321 9 123 23 0 23 69 69 0 69 23TN Liberty Fibers Corporation3 10321 OVERDF 0 0 0 0 0TN Packaging Corporation of America 50296 017 89 29 0 29 8 8 0 8 8TN Tate & Lyle-Loudon,TN (ORIS 880079) 880079 34 139 0 0 0 114 114 0 114 0TN Tate & Lyle-Loudon,TN (ORIS 880079) 880079 35 139 0 0 0 137 137 0 137 0TN Tate & Lyle-Loudon,TN (ORIS 880079) 880079 OVERDF 0 278 0 278 251TN Weyerhaeuser Co, Kingsport Paper Mill 10252 09 623 0 0 0 0 0 0 0VA Altavista Power Station 10773 CS0 (1, 2) 207VA Altavista Power Station 10773 1 22 99 36 135 108 0 108 99VA Altavista Power Station 10773 2 23 93 24 117 99 0 99 93VA Altavista Power Station 10773 OVERDF 0 0 0 0 0VA Bellemeade Power Station 50966 1 102 0 104 104 26 26 0 26 0VA Bellemeade Power Station 50966 2 96 0 100 100 25 25 0 25 0VA Bellemeade Power Station 50966 OVERDF 0 0 0 0 0VA Birchwood Power Facility 54304 001 340 243 0 243 243 243 0 243 243VA Bremo Power Station 3796 3 138 401 420 821 506 506 0 506 401VA Bremo Power Station 3796 4 348 474 348 822 561 561 0 561 474VA Bremo Power Station 3796 OVERDF 0 0 0 0 0VA Buchanan -- Units 1 and 2 55738 1 0 0 20 20 5 5 0 5 0VA Buchanan -- Units 1 and 2 55738 2 0 0 20 20 5 5 0 5 0VA Buchanan -- Units 1 and 2 55738 OVERDF 0 0 3 3 0VA Celanese Acetate LLC 52089 BLR007 154 0 0 0 197 197 0 197 0VA Celanese Acetate LLC 52089 BLR008 55 0 0 0 2 2 0 2 0VA Celanese Acetate LLC 52089 OVERDF 0 209 2 211 199VA Chesapeake Energy Center 3803 1 272 272 252 524 335 335 0 335 272VA Chesapeake Energy Center 3803 2 288 334 308 642 411 411 0 411 334
A-67

APPENDIX A: 2005 EMISSIONS AND ALLOWANCE HOLDINGS OF NOx BUDGET SOURCES
STATE PLANT NAME ORIS STACK/UNIT ID*
YEAR 2005 ALLOWANCES ALLOCATED
CURRENT YEAR (2005)
BANKED (YEARS 2003-2004) TOTAL
2005 NOx EMISSIONS
(TONS) EMISSIONSNEW UNIT TAKEBACK TOTAL CURRENT YEAR (2005)
VA Chesapeake Energy Center 3803 3 323 17 236 253 76 76 0 76 17VA Chesapeake Energy Center 3803 4 518 68 356 424 157 157 0 157 68VA Chesapeake Energy Center 3803 OVERDF 0 0 0 0 0VA Chesterfield Power Station 3797 **8A 272 42 180 222 87 87 0 87 42VA Chesterfield Power Station 3797 3 234 403 236 639 462 462 0 462 403VA Chesterfield Power Station 3797 4 364 59 256 315 123 123 0 123 59VA Chesterfield Power Station 3797 5 696 49 520 569 179 179 0 179 49VA Chesterfield Power Station 3797 6 1,177 106 788 894 303 303 0 303 106VA Chesterfield Power Station 3797 7 310 76 172 248 119 119 0 119 76VA Chesterfield Power Station 3797 OVERDF 0 0 0 0 0VA Clinch River 3775 CS012 (1, 2) 1,772VA Clinch River 3775 1 479 853 0 853 844 0 844 844VA Clinch River 3775 2 455 938 0 938 928 0 928 928VA Clinch River 3775 3 507 731 0 731 723 723 0 723 723VA Clinch River 3775 OVERDF 0 0 0 0 0VA Clover Power Station 7213 1 1,031 1,429 1,028 2,457 1,686 1,686 0 1,686 1,429VA Clover Power Station 7213 2 1,074 1,351 1,168 2,519 1,643 1,643 0 1,643 1,351VA Clover Power Station 7213 OVERDF 0 0 0 0 0VA Cogentrix of Richmond 54081 CS001 (BLR01A, BLR01B) 351VA Cogentrix of Richmond 54081 BLR01A 282 0 0 0 176 0 176 0VA Cogentrix of Richmond 54081 BLR01B 0 0 0 0 175 0 175 0VA Cogentrix of Richmond 54081 CS002 (BLR02A, BLR02B) 343VA Cogentrix of Richmond 54081 BLR02A 208 0 0 0 172 0 172 0VA Cogentrix of Richmond 54081 BLR02B 0 0 0 0 171 0 171 0VA Cogentrix of Richmond 54081 CS003 (BLR03A, BLR03B) 367VA Cogentrix of Richmond 54081 BLR03A 0 0 0 0 184 0 184 0VA Cogentrix of Richmond 54081 BLR03B 0 0 0 0 183 0 183 0VA Cogentrix of Richmond 54081 CS004 (BLR04A, BLR04B) 302VA Cogentrix of Richmond 54081 BLR04A 0 0 0 0 151 0 151 0VA Cogentrix of Richmond 54081 BLR04B 0 0 0 0 151 0 151 0VA Cogentrix of Richmond 54081 OVERDF 0 1,396 38 1,434 1,363VA Cogentrix-Hopewell 10377 CS001 (BLR01A, BLR01B, BLR01C) 350VA Cogentrix-Hopewell 10377 BLR01A 286 0 0 0 117 0 117 0VA Cogentrix-Hopewell 10377 BLR01B 0 0 0 0 117 0 117 0VA Cogentrix-Hopewell 10377 BLR01C 0 0 0 0 116 0 116 0VA Cogentrix-Hopewell 10377 CS002 (BLR02A, BLR02B, BLR02C) 324VA Cogentrix-Hopewell 10377 BLR02A 0 0 0 0 108 0 108 0VA Cogentrix-Hopewell 10377 BLR02B 0 0 0 0 108 0 108 0VA Cogentrix-Hopewell 10377 BLR02C 0 0 0 0 108 0 108 0VA Cogentrix-Hopewell 10377 OVERDF 0 686 20 706 674VA Cogentrix-Portsmouth 10071 CS001 (BLR01A, BLR01B, BLR01C) 336VA Cogentrix-Portsmouth 10071 BLR01A 311 0 0 0 112 0 112 0VA Cogentrix-Portsmouth 10071 BLR01B 0 0 0 0 112 0 112 0VA Cogentrix-Portsmouth 10071 BLR01C 0 0 0 0 112 0 112 0VA Cogentrix-Portsmouth 10071 CS002 (BLR02A, BLR02B, BLR02C) 351
A-68

APPENDIX A: 2005 EMISSIONS AND ALLOWANCE HOLDINGS OF NOx BUDGET SOURCES
STATE PLANT NAME ORIS STACK/UNIT ID*
YEAR 2005 ALLOWANCES ALLOCATED
CURRENT YEAR (2005)
BANKED (YEARS 2003-2004) TOTAL
2005 NOx EMISSIONS
(TONS) EMISSIONSNEW UNIT TAKEBACK TOTAL CURRENT YEAR (2005)
VA Cogentrix-Portsmouth 10071 BLR02A 0 0 0 0 117 0 117 0VA Cogentrix-Portsmouth 10071 BLR02B 0 0 0 0 117 0 117 0VA Cogentrix-Portsmouth 10071 BLR02C 0 0 0 0 117 0 117 0VA Cogentrix-Portsmouth 10071 OVERDF 0 704 15 719 687VA Commonwealth Chesapeake 55381 CT-001 0 0 0 0 12 12 0 12 0VA Commonwealth Chesapeake 55381 CT-002 0 0 0 0 9 9 0 9 0VA Commonwealth Chesapeake 55381 CT-003 0 0 0 0 12 12 0 12 0VA Commonwealth Chesapeake 55381 CT-004 0 0 0 0 2 2 0 2 0VA Commonwealth Chesapeake 55381 CT-005 0 0 0 0 3 3 0 3 0VA Commonwealth Chesapeake 55381 CT-006 0 0 0 0 2 2 0 2 0VA Commonwealth Chesapeake 55381 CT-007 0 0 0 0 3 3 0 3 0VA Commonwealth Chesapeake 55381 OVERDF 0 35 34 69 35VA Dan River Inc - Schoolfield Complex 50954 17 100 0 0 0 0 0 0 0VA Darbytown Combustion Turbine 7212 1 29 8 56 64 22 22 0 22 8VA Darbytown Combustion Turbine 7212 2 28 0 88 88 22 22 0 22 0VA Darbytown Combustion Turbine 7212 3 29 0 76 76 19 19 0 19 0VA Darbytown Combustion Turbine 7212 4 28 0 88 88 22 22 0 22 0VA Darbytown Combustion Turbine 7212 OVERDF 0 0 0 0 0VA Doswell Limited Partnership 52019 501 140 30 0 30 27 27 0 27 27VA Doswell Limited Partnership 52019 502 154 32 0 32 29 29 0 29 29VA Doswell Limited Partnership 52019 601 159 30 0 30 28 28 0 28 28VA Doswell Limited Partnership 52019 602 154 34 0 34 32 32 0 32 32VA Doswell Limited Partnership 52019 CT1 0 19 0 19 17 17 0 17 17VA Doswell Limited Partnership 52019 OVERDF 0 45 0 45 0VA Elizabeth River Combustion Turbine Sta 52087 CT-1 151 0 16 16 4 4 0 4 0VA Elizabeth River Combustion Turbine Sta 52087 CT-2 0 0 20 20 5 5 0 5 0VA Elizabeth River Combustion Turbine Sta 52087 CT-3 0 0 4 4 1 1 0 1 0VA Elizabeth River Combustion Turbine Sta 52087 OVERDF 0 0 0 0 0VA Georgia-Pacific Big Island Op 50479 4 89 0 0 0 62 62 0 62 0VA Georgia-Pacific Big Island Op 50479 6 103 0 0 0 6 6 0 6 0VA Georgia-Pacific Big Island Op 50479 OVERDF 0 82 0 82 68VA Glen Lyn 3776 6 467 0 6,180 6,180 1,403 1,403 0 1,403 0VA Glen Lyn 3776 51 88 192 0 192 187 187 0 187 187VA Glen Lyn 3776 52 104 202 0 202 197 197 0 197 197VA Glen Lyn 3776 OVERDF 0 0 0 0 0VA Gordonsville Power Station 54844 1 70 0 92 92 23 23 0 23 0VA Gordonsville Power Station 54844 2 65 0 92 92 23 23 0 23 0VA Gordonsville Power Station 54844 OVERDF 0 0 0 0 0VA Gravel Neck Combustion Turbine 7032 3 24 14 48 62 26 26 0 26 14VA Gravel Neck Combustion Turbine 7032 4 22 17 24 41 23 23 0 23 17VA Gravel Neck Combustion Turbine 7032 5 16 22 16 38 26 26 0 26 22VA Gravel Neck Combustion Turbine 7032 6 20 18 20 38 23 23 0 23 18VA Gravel Neck Combustion Turbine 7032 OVERDF 0 0 0 0 0VA Honeywell Intl, Inc Hopewell Plant 50232 10A 0 0 0 0 0 0 0 0VA Honeywell Intl, Inc Hopewell Plant 50232 10B 200 0 0 0 0 0 0 0
A-69

APPENDIX A: 2005 EMISSIONS AND ALLOWANCE HOLDINGS OF NOx BUDGET SOURCES
STATE PLANT NAME ORIS STACK/UNIT ID*
YEAR 2005 ALLOWANCES ALLOCATED
CURRENT YEAR (2005)
BANKED (YEARS 2003-2004) TOTAL
2005 NOx EMISSIONS
(TONS) EMISSIONSNEW UNIT TAKEBACK TOTAL CURRENT YEAR (2005)
VA Honeywell Intl, Inc Hopewell Plant 50232 10C 156 356 217 573 179 179 0 179 179VA Honeywell Intl, Inc Hopewell Plant 50232 OVERDF 0 0 0 0 0VA Hopewell Cogeneration Facility 10633 1 69 69 30 99 74 74 0 74 69VA Hopewell Cogeneration Facility 10633 2 66 66 37 103 77 77 0 77 66VA Hopewell Cogeneration Facility 10633 3 65 65 38 103 84 84 0 84 65VA Hopewell Cogeneration Facility 10633 OVERDF 0 0 0 0 0VA Hopewell Power Station 10771 CS0 (1, 2) 0VA Hopewell Power Station 10771 1 22 0 0 0 0 0 0 0VA Hopewell Power Station 10771 2 22 0 0 0 0 0 0 0VA Hopewell Power Station 10771 OVERDF 0 0 0 0 0VA International Paper-Franklin Mill 52152 003 306 186 9 195 181 181 0 181 179VA International Paper-Franklin Mill 52152 029 262 24 4 28 22 22 0 22 21VA International Paper-Franklin Mill 52152 OVERDF 0 0 0 0 0VA Ladysmith Combustion Turbine Sta 7838 1 0 0 32 32 8 8 0 8 0VA Ladysmith Combustion Turbine Sta 7838 2 0 2 24 26 8 8 0 8 2VA Ladysmith Combustion Turbine Sta 7838 OVERDF 0 0 0 0 0VA Louisa Generation Facility 7837 EU1 0 7 1 8 7 7 0 7 7VA Louisa Generation Facility 7837 EU2 0 7 1 8 7 7 0 7 7VA Louisa Generation Facility 7837 EU3 0 7 1 8 7 7 0 7 7VA Louisa Generation Facility 7837 EU4 0 5 1 6 5 5 0 5 5VA Louisa Generation Facility 7837 EU5 0 11 1 12 11 11 0 11 11VA Louisa Generation Facility 7837 OVERDF 0 10 0 10 0VA Marsh Run Generation Facility 7836 EU1 0 15 0 15 15 15 0 15 15VA Marsh Run Generation Facility 7836 EU2 0 10 0 10 10 10 0 10 10VA Marsh Run Generation Facility 7836 EU3 0 16 0 16 16 16 0 16 16VA Marsh Run Generation Facility 7836 OVERDF 0 14 6 20 0VA MeadWestvaco of Virginia, Covington 50900 CS001 (001, 002, 003, 004) 978VA MeadWestvaco of Virginia, Covington 50900 001 293 242 0 242 242 0 242 242VA MeadWestvaco of Virginia, Covington 50900 002 158 146 0 146 146 0 146 146VA MeadWestvaco of Virginia, Covington 50900 003 243 215 0 215 215 0 215 215VA MeadWestvaco of Virginia, Covington 50900 004 429 376 0 376 375 0 375 375VA MeadWestvaco of Virginia, Covington 50900 005 87 18 0 18 18 18 0 18 18VA MeadWestvaco of Virginia, Covington 50900 011 70 7 0 7 7 7 0 7 7VA MeadWestvaco of Virginia, Covington 50900 OVERDF 0 38 0 38 0VA Mecklenburg Power Station 52007 1 221 207 116 323 236 236 0 236 207VA Mecklenburg Power Station 52007 2 0 252 8 260 254 254 0 254 252VA Mecklenburg Power Station 52007 OVERDF 0 0 0 0 0VA Possum Point Power Station 3804 3 202 0 124 124 31 31 0 31 0VA Possum Point Power Station 3804 4 472 0 172 172 43 43 0 43 0VA Possum Point Power Station 3804 5 371 892 732 1,624 1,075 1,075 0 1,075 892VA Possum Point Power Station 3804 6A 0 31 0 31 31 31 0 31 31VA Possum Point Power Station 3804 6B 0 22 0 22 22 22 0 22 22VA Possum Point Power Station 3804 OVERDF 0 0 0 0 0VA Potomac River 3788 1 194 330 0 330 347 347 0 347 330VA Potomac River 3788 2 154 154 0 154 243 243 0 243 154
A-70

APPENDIX A: 2005 EMISSIONS AND ALLOWANCE HOLDINGS OF NOx BUDGET SOURCES
STATE PLANT NAME ORIS STACK/UNIT ID*
YEAR 2005 ALLOWANCES ALLOCATED
CURRENT YEAR (2005)
BANKED (YEARS 2003-2004) TOTAL
2005 NOx EMISSIONS
(TONS) EMISSIONSNEW UNIT TAKEBACK TOTAL CURRENT YEAR (2005)
VA Potomac River 3788 3 236 195 0 195 195 195 0 195 195VA Potomac River 3788 4 232 137 0 137 137 137 0 137 137VA Potomac River 3788 5 203 203 0 203 240 240 0 240 203VA Potomac River 3788 OVERDF 0 151 0 151 143VA Remington Combustion Turbine Station 7839 1 0 9 0 9 9 9 0 9 9VA Remington Combustion Turbine Station 7839 2 0 5 0 5 5 5 0 5 5VA Remington Combustion Turbine Station 7839 3 0 8 0 8 8 8 0 8 8VA Remington Combustion Turbine Station 7839 4 0 3 8 11 4 4 0 4 3VA Remington Combustion Turbine Station 7839 OVERDF 0 0 0 0 0VA Smurfit-Stone Container Enterprises, Inc 10017 002 292 220 2 222 220 220 0 220 219VA Southampton Power Station 10774 CS0 (1, 2) 396VA Southampton Power Station 10774 1 25 11 764 775 188 0 188 11VA Southampton Power Station 10774 2 33 10 736 746 208 0 208 10VA Southampton Power Station 10774 OVERDF 0 0 0 0 0VA Tasley 3785 TA10 9 9 3 12 9 9 0 9 9VA Tenaska Virginia Generating Station 55439 CTGDB1 0 0 0 0 17 17 0 17 0VA Tenaska Virginia Generating Station 55439 CTGDB2 0 0 0 0 15 15 0 15 0VA Tenaska Virginia Generating Station 55439 CTGDB3 0 0 0 0 15 15 0 15 0VA Tenaska Virginia Generating Station 55439 OVERDF 0 12 140 152 12VA Wolf Hills Energy 55285 WH01 0 0 0 0 3 3 0 3 0VA Wolf Hills Energy 55285 WH02 0 0 0 0 3 3 0 3 0VA Wolf Hills Energy 55285 WH03 0 0 0 0 3 3 0 3 0VA Wolf Hills Energy 55285 WH04 0 0 0 0 3 3 0 3 0VA Wolf Hills Energy 55285 WH05 0 0 0 0 3 3 0 3 0VA Wolf Hills Energy 55285 WH06 0 0 0 0 3 3 0 3 0VA Wolf Hills Energy 55285 WH07 0 0 0 0 3 3 0 3 0VA Wolf Hills Energy 55285 WH08 0 0 0 0 3 3 0 3 0VA Wolf Hills Energy 55285 WH09 0 0 0 0 3 3 0 3 0VA Wolf Hills Energy 55285 WH10 0 0 0 0 3 3 0 3 0VA Wolf Hills Energy 55285 OVERDF 0 34 0 34 30VA Yorktown Power Station 3809 CS0 (1, 2) 1,042VA Yorktown Power Station 3809 1 338 338 628 966 495 0 495 338VA Yorktown Power Station 3809 2 366 366 724 1,090 547 0 547 366VA Yorktown Power Station 3809 3 1,032 669 1,820 2,489 1,124 1,124 0 1,124 669VA Yorktown Power Station 3809 OVERDF 0 0 0 0 0WV Albright Power Station 3942 1 84 219 300 519 319 319 0 319 219WV Albright Power Station 3942 2 83 141 300 441 241 241 0 241 141WV Albright Power Station 3942 3 245 200 300 500 300 300 0 300 200WV Albright Power Station 3942 OVERDF 0 0 4 4 0WV Bayer Cropscience Institute Plant 880053 CS1 (070, 080, 090) 251WV Bayer Cropscience Institute Plant 880053 070 115 115 4 119 84 0 84 84WV Bayer Cropscience Institute Plant 880053 080 104 104 4 108 84 0 84 84WV Bayer Cropscience Institute Plant 880053 090 107 107 14 121 83 0 83 83WV Bayer Cropscience Institute Plant 880053 OVERDF 0 0 0 0 0WV Big Sandy Peaker Plant 55284 GS01 20 20 0 20 2 2 18 20 20
A-71
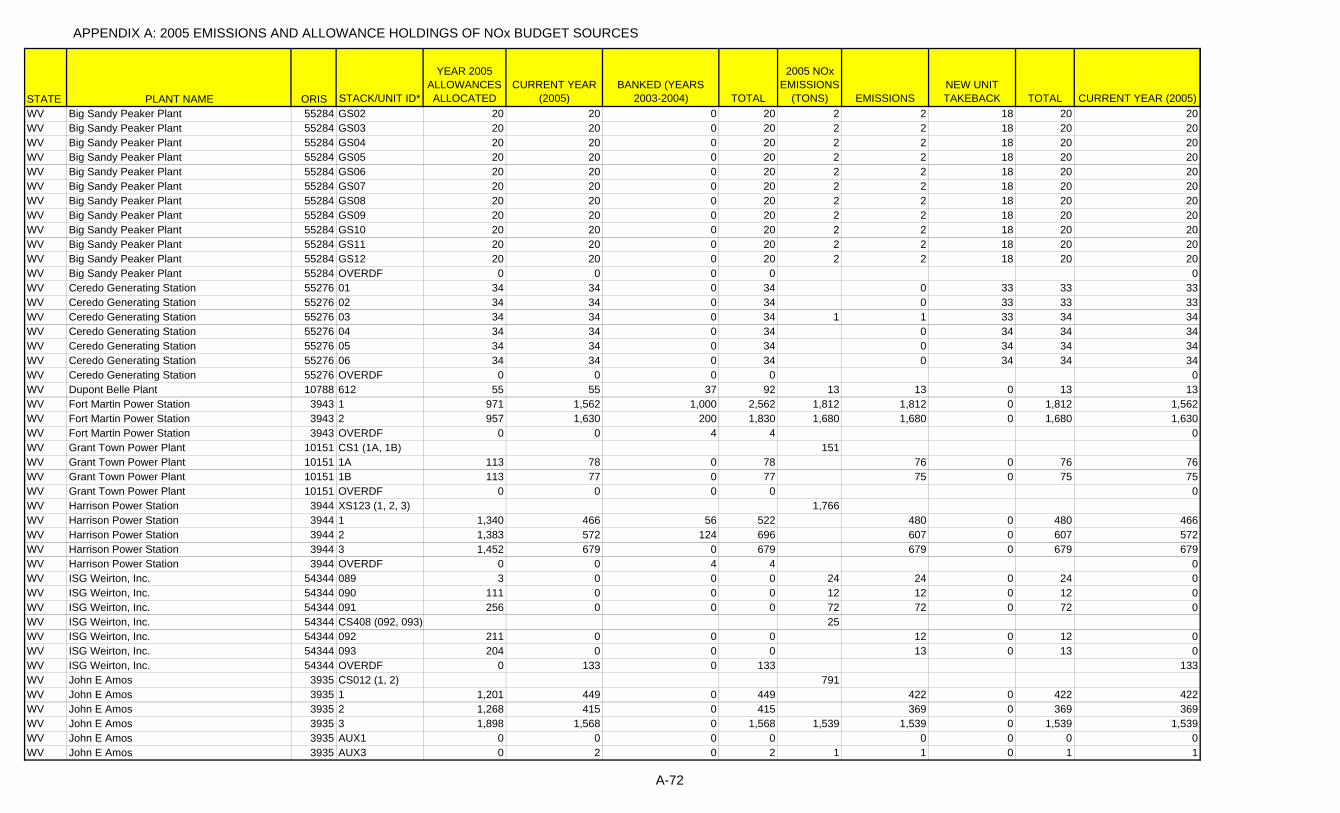
APPENDIX A: 2005 EMISSIONS AND ALLOWANCE HOLDINGS OF NOx BUDGET SOURCES
STATE PLANT NAME ORIS STACK/UNIT ID*
YEAR 2005 ALLOWANCES ALLOCATED
CURRENT YEAR (2005)
BANKED (YEARS 2003-2004) TOTAL
2005 NOx EMISSIONS
(TONS) EMISSIONSNEW UNIT TAKEBACK TOTAL CURRENT YEAR (2005)
WV Big Sandy Peaker Plant 55284 GS02 20 20 0 20 2 2 18 20 20WV Big Sandy Peaker Plant 55284 GS03 20 20 0 20 2 2 18 20 20WV Big Sandy Peaker Plant 55284 GS04 20 20 0 20 2 2 18 20 20WV Big Sandy Peaker Plant 55284 GS05 20 20 0 20 2 2 18 20 20WV Big Sandy Peaker Plant 55284 GS06 20 20 0 20 2 2 18 20 20WV Big Sandy Peaker Plant 55284 GS07 20 20 0 20 2 2 18 20 20WV Big Sandy Peaker Plant 55284 GS08 20 20 0 20 2 2 18 20 20WV Big Sandy Peaker Plant 55284 GS09 20 20 0 20 2 2 18 20 20WV Big Sandy Peaker Plant 55284 GS10 20 20 0 20 2 2 18 20 20WV Big Sandy Peaker Plant 55284 GS11 20 20 0 20 2 2 18 20 20WV Big Sandy Peaker Plant 55284 GS12 20 20 0 20 2 2 18 20 20WV Big Sandy Peaker Plant 55284 OVERDF 0 0 0 0 0WV Ceredo Generating Station 55276 01 34 34 0 34 0 33 33 33WV Ceredo Generating Station 55276 02 34 34 0 34 0 33 33 33WV Ceredo Generating Station 55276 03 34 34 0 34 1 1 33 34 34WV Ceredo Generating Station 55276 04 34 34 0 34 0 34 34 34WV Ceredo Generating Station 55276 05 34 34 0 34 0 34 34 34WV Ceredo Generating Station 55276 06 34 34 0 34 0 34 34 34WV Ceredo Generating Station 55276 OVERDF 0 0 0 0 0WV Dupont Belle Plant 10788 612 55 55 37 92 13 13 0 13 13WV Fort Martin Power Station 3943 1 971 1,562 1,000 2,562 1,812 1,812 0 1,812 1,562WV Fort Martin Power Station 3943 2 957 1,630 200 1,830 1,680 1,680 0 1,680 1,630WV Fort Martin Power Station 3943 OVERDF 0 0 4 4 0WV Grant Town Power Plant 10151 CS1 (1A, 1B) 151WV Grant Town Power Plant 10151 1A 113 78 0 78 76 0 76 76WV Grant Town Power Plant 10151 1B 113 77 0 77 75 0 75 75WV Grant Town Power Plant 10151 OVERDF 0 0 0 0 0WV Harrison Power Station 3944 XS123 (1, 2, 3) 1,766WV Harrison Power Station 3944 1 1,340 466 56 522 480 0 480 466WV Harrison Power Station 3944 2 1,383 572 124 696 607 0 607 572WV Harrison Power Station 3944 3 1,452 679 0 679 679 0 679 679WV Harrison Power Station 3944 OVERDF 0 0 4 4 0WV ISG Weirton, Inc. 54344 089 3 0 0 0 24 24 0 24 0WV ISG Weirton, Inc. 54344 090 111 0 0 0 12 12 0 12 0WV ISG Weirton, Inc. 54344 091 256 0 0 0 72 72 0 72 0WV ISG Weirton, Inc. 54344 CS408 (092, 093) 25WV ISG Weirton, Inc. 54344 092 211 0 0 0 12 0 12 0WV ISG Weirton, Inc. 54344 093 204 0 0 0 13 0 13 0WV ISG Weirton, Inc. 54344 OVERDF 0 133 0 133 133WV John E Amos 3935 CS012 (1, 2) 791WV John E Amos 3935 1 1,201 449 0 449 422 0 422 422WV John E Amos 3935 2 1,268 415 0 415 369 0 369 369WV John E Amos 3935 3 1,898 1,568 0 1,568 1,539 1,539 0 1,539 1,539WV John E Amos 3935 AUX1 0 0 0 0 0 0 0 0WV John E Amos 3935 AUX3 0 2 0 2 1 1 0 1 1
A-72
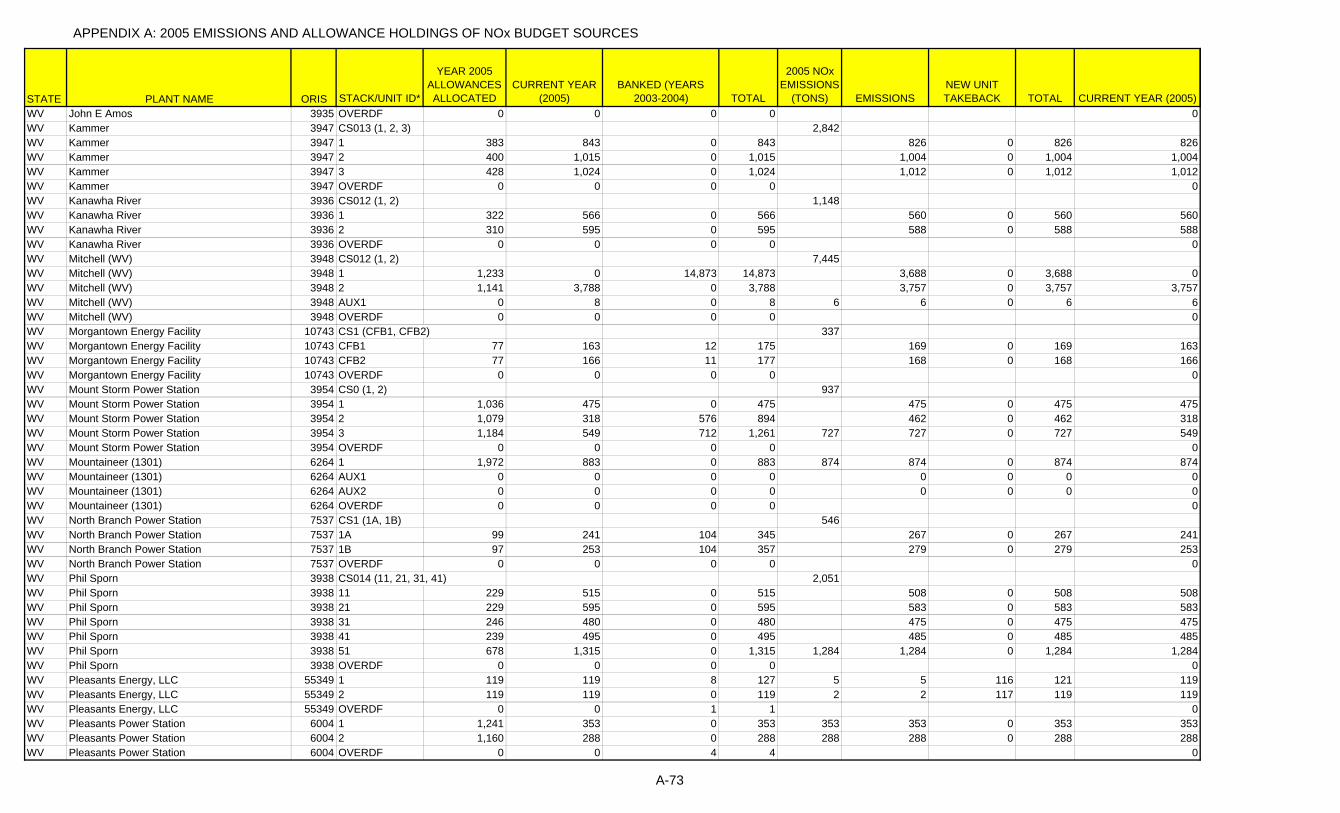
APPENDIX A: 2005 EMISSIONS AND ALLOWANCE HOLDINGS OF NOx BUDGET SOURCES
STATE PLANT NAME ORIS STACK/UNIT ID*
YEAR 2005 ALLOWANCES ALLOCATED
CURRENT YEAR (2005)
BANKED (YEARS 2003-2004) TOTAL
2005 NOx EMISSIONS
(TONS) EMISSIONSNEW UNIT TAKEBACK TOTAL CURRENT YEAR (2005)
WV John E Amos 3935 OVERDF 0 0 0 0 0WV Kammer 3947 CS013 (1, 2, 3) 2,842WV Kammer 3947 1 383 843 0 843 826 0 826 826WV Kammer 3947 2 400 1,015 0 1,015 1,004 0 1,004 1,004WV Kammer 3947 3 428 1,024 0 1,024 1,012 0 1,012 1,012WV Kammer 3947 OVERDF 0 0 0 0 0WV Kanawha River 3936 CS012 (1, 2) 1,148WV Kanawha River 3936 1 322 566 0 566 560 0 560 560WV Kanawha River 3936 2 310 595 0 595 588 0 588 588WV Kanawha River 3936 OVERDF 0 0 0 0 0WV Mitchell (WV) 3948 CS012 (1, 2) 7,445WV Mitchell (WV) 3948 1 1,233 0 14,873 14,873 3,688 0 3,688 0WV Mitchell (WV) 3948 2 1,141 3,788 0 3,788 3,757 0 3,757 3,757WV Mitchell (WV) 3948 AUX1 0 8 0 8 6 6 0 6 6WV Mitchell (WV) 3948 OVERDF 0 0 0 0 0WV Morgantown Energy Facility 10743 CS1 (CFB1, CFB2) 337WV Morgantown Energy Facility 10743 CFB1 77 163 12 175 169 0 169 163WV Morgantown Energy Facility 10743 CFB2 77 166 11 177 168 0 168 166WV Morgantown Energy Facility 10743 OVERDF 0 0 0 0 0WV Mount Storm Power Station 3954 CS0 (1, 2) 937WV Mount Storm Power Station 3954 1 1,036 475 0 475 475 0 475 475WV Mount Storm Power Station 3954 2 1,079 318 576 894 462 0 462 318WV Mount Storm Power Station 3954 3 1,184 549 712 1,261 727 727 0 727 549WV Mount Storm Power Station 3954 OVERDF 0 0 0 0 0WV Mountaineer (1301) 6264 1 1,972 883 0 883 874 874 0 874 874WV Mountaineer (1301) 6264 AUX1 0 0 0 0 0 0 0 0WV Mountaineer (1301) 6264 AUX2 0 0 0 0 0 0 0 0WV Mountaineer (1301) 6264 OVERDF 0 0 0 0 0WV North Branch Power Station 7537 CS1 (1A, 1B) 546WV North Branch Power Station 7537 1A 99 241 104 345 267 0 267 241WV North Branch Power Station 7537 1B 97 253 104 357 279 0 279 253WV North Branch Power Station 7537 OVERDF 0 0 0 0 0WV Phil Sporn 3938 CS014 (11, 21, 31, 41) 2,051WV Phil Sporn 3938 11 229 515 0 515 508 0 508 508WV Phil Sporn 3938 21 229 595 0 595 583 0 583 583WV Phil Sporn 3938 31 246 480 0 480 475 0 475 475WV Phil Sporn 3938 41 239 495 0 495 485 0 485 485WV Phil Sporn 3938 51 678 1,315 0 1,315 1,284 1,284 0 1,284 1,284WV Phil Sporn 3938 OVERDF 0 0 0 0 0WV Pleasants Energy, LLC 55349 1 119 119 8 127 5 5 116 121 119WV Pleasants Energy, LLC 55349 2 119 119 0 119 2 2 117 119 119WV Pleasants Energy, LLC 55349 OVERDF 0 0 1 1 0WV Pleasants Power Station 6004 1 1,241 353 0 353 353 353 0 353 353WV Pleasants Power Station 6004 2 1,160 288 0 288 288 288 0 288 288WV Pleasants Power Station 6004 OVERDF 0 0 4 4 0
A-73

APPENDIX A: 2005 EMISSIONS AND ALLOWANCE HOLDINGS OF NOx BUDGET SOURCES
STATE PLANT NAME ORIS STACK/UNIT ID*
YEAR 2005 ALLOWANCES ALLOCATED
CURRENT YEAR (2005)
BANKED (YEARS 2003-2004) TOTAL
2005 NOx EMISSIONS
(TONS) EMISSIONSNEW UNIT TAKEBACK TOTAL CURRENT YEAR (2005)
WV PPG Industries, Inc - Natrium Plant 50491 001 198 198 8 206 238 238 0 238 198WV PPG Industries, Inc - Natrium Plant 50491 002 458 84 1 85 155 155 0 155 84WV PPG Industries, Inc - Natrium Plant 50491 003 424 313 16 329 313 313 0 313 313WV PPG Industries, Inc - Natrium Plant 50491 OVERDF 0 111 16 127 105WV Rivesville Power Station 3945 7 40 2 0 2 2 2 0 2 2WV Rivesville Power Station 3945 8 120 120 300 420 267 267 0 267 120WV Rivesville Power Station 3945 OVERDF 0 0 4 4 0WV UCC South Charleston Plant 880026 B25 93 135 18 153 147 147 0 147 135WV UCC South Charleston Plant 880026 B26 45 3 0 3 3 3 0 3 3WV UCC South Charleston Plant 880026 B27 109 109 0 109 10 10 85 95 95WV UCC South Charleston Plant 880026 OVERDF 0 0 4 4 0WV Willow Island Power Station 3946 1 109 109 200 309 218 218 0 218 109WV Willow Island Power Station 3946 2 279 418 1,252 1,670 998 998 0 998 418WV Willow Island Power Station 3946 OVERDF 0 0 4 4 0WV WV Alloys, Inc. 50012 BLR4 0 190 5 195 190 190 0 190 190
1 Dearborn Industrial Generation unit GTP1 had 9 year 2006 allowances deducted as a penalty for being 3 allowances short of covering its emissions.2 River Rouge unit 1 had 3 year 2006 allowances deducted as a penalty for being 1 allowance short of covering its emissions.3 Liberty Fibers Corporation units 8 and 9 were 88 allowances short of covering its emissions.* CS stands for Common Stack, which includes emissions from more than one unit. XS stands for Complex Stack, which includes emissions from one or more Common Stacks and/or Multiple Stacks (MS).
A-74
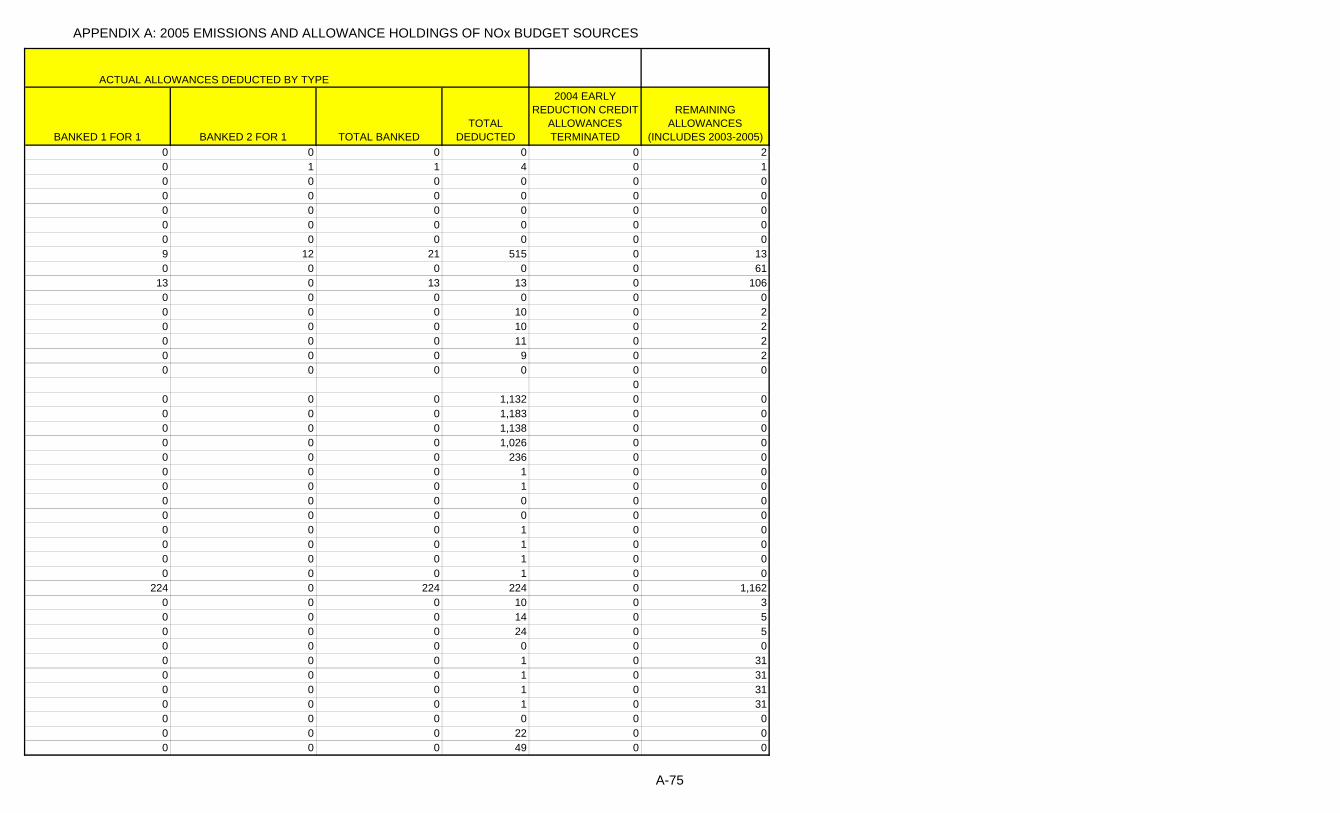
APPENDIX A: 2005 EMISSIONS AND ALLOWANCE HOLDINGS OF NOx BUDGET SOURCES
BANKED 1 FOR 1 BANKED 2 FOR 1 TOTAL BANKEDTOTAL
DEDUCTED
2004 EARLY REDUCTION CREDIT
ALLOWANCES TERMINATED
REMAINING ALLOWANCES
(INCLUDES 2003-2005)0 0 0 0 0 20 1 1 4 0 10 0 0 0 0 00 0 0 0 0 00 0 0 0 0 00 0 0 0 0 00 0 0 0 0 09 12 21 515 0 130 0 0 0 0 61
13 0 13 13 0 1060 0 0 0 0 00 0 0 10 0 20 0 0 10 0 20 0 0 11 0 20 0 0 9 0 20 0 0 0 0 0
00 0 0 1,132 0 00 0 0 1,183 0 00 0 0 1,138 0 00 0 0 1,026 0 00 0 0 236 0 00 0 0 1 0 00 0 0 1 0 00 0 0 0 0 00 0 0 0 0 00 0 0 1 0 00 0 0 1 0 00 0 0 1 0 00 0 0 1 0 0
224 0 224 224 0 1,1620 0 0 10 0 30 0 0 14 0 50 0 0 24 0 50 0 0 0 0 00 0 0 1 0 310 0 0 1 0 310 0 0 1 0 310 0 0 1 0 310 0 0 0 0 00 0 0 22 0 00 0 0 49 0 0
ACTUAL ALLOWANCES DEDUCTED BY TYPE
A-75
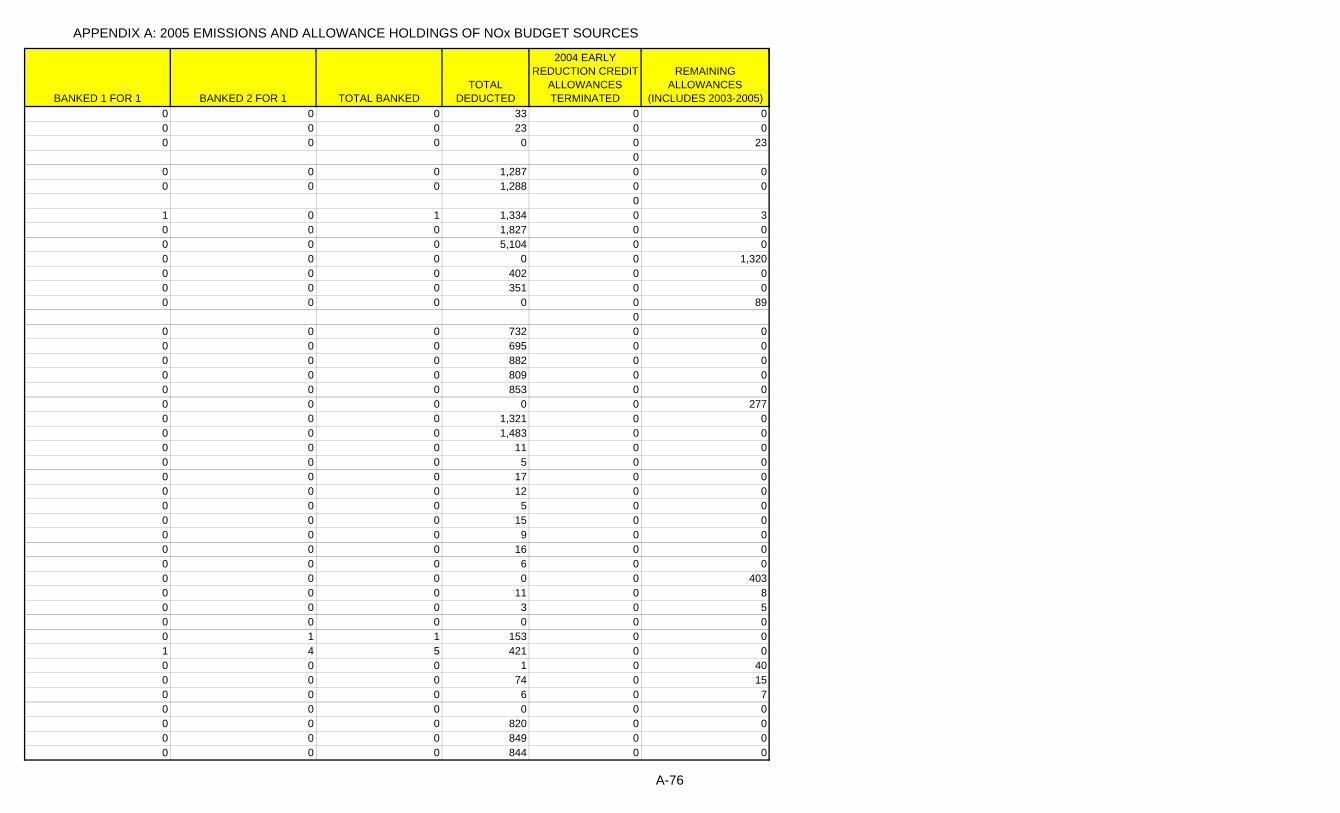
APPENDIX A: 2005 EMISSIONS AND ALLOWANCE HOLDINGS OF NOx BUDGET SOURCES
BANKED 1 FOR 1 BANKED 2 FOR 1 TOTAL BANKEDTOTAL
DEDUCTED
2004 EARLY REDUCTION CREDIT
ALLOWANCES TERMINATED
REMAINING ALLOWANCES
(INCLUDES 2003-2005)0 0 0 33 0 00 0 0 23 0 00 0 0 0 0 23
00 0 0 1,287 0 00 0 0 1,288 0 0
01 0 1 1,334 0 30 0 0 1,827 0 00 0 0 5,104 0 00 0 0 0 0 1,3200 0 0 402 0 00 0 0 351 0 00 0 0 0 0 89
00 0 0 732 0 00 0 0 695 0 00 0 0 882 0 00 0 0 809 0 00 0 0 853 0 00 0 0 0 0 2770 0 0 1,321 0 00 0 0 1,483 0 00 0 0 11 0 00 0 0 5 0 00 0 0 17 0 00 0 0 12 0 00 0 0 5 0 00 0 0 15 0 00 0 0 9 0 00 0 0 16 0 00 0 0 6 0 00 0 0 0 0 4030 0 0 11 0 80 0 0 3 0 50 0 0 0 0 00 1 1 153 0 01 4 5 421 0 00 0 0 1 0 400 0 0 74 0 150 0 0 6 0 70 0 0 0 0 00 0 0 820 0 00 0 0 849 0 00 0 0 844 0 0
A-76

APPENDIX A: 2005 EMISSIONS AND ALLOWANCE HOLDINGS OF NOx BUDGET SOURCES
BANKED 1 FOR 1 BANKED 2 FOR 1 TOTAL BANKEDTOTAL
DEDUCTED
2004 EARLY REDUCTION CREDIT
ALLOWANCES TERMINATED
REMAINING ALLOWANCES
(INCLUDES 2003-2005)0 0 0 798 0 00 0 0 0 0 1,1270 0 0 15 0 00 0 0 63 0 10 0 0 0 0 40 0 0 16 0 40 0 0 22 0 40 0 0 20 0 50 0 0 0 0 00 0 0 24 0 110 0 0 26 0 100 0 0 27 0 91 0 1 34 0 20 0 0 0 0 00 0 0 0 0 00 0 0 0 0 1
00 0 0 0 0 02 6 8 8 0 00 0 0 0 0 00 0 0 299 0 90 0 0 0 0 00 0 0 0 0 00 0 0 0 0 0
21 0 21 21 0 630 0 0 0 0 00 0 0 0 0 00 0 0 0 0 0
22 0 22 31 0 660 0 0 0 0 10 0 0 2 0 10 0 0 63 0 80 0 0 15 0 60 0 0 0 0 6
00 0 0 234 0 00 0 0 256 0 00 0 0 589 0 00 0 0 283 0 00 0 0 610 0 00 0 0 277 0 00 0 0 445 0 00 0 0 297 0 0
1,826 0 1,826 1,826 0 5,9890
A-77

APPENDIX A: 2005 EMISSIONS AND ALLOWANCE HOLDINGS OF NOx BUDGET SOURCES
BANKED 1 FOR 1 BANKED 2 FOR 1 TOTAL BANKEDTOTAL
DEDUCTED
2004 EARLY REDUCTION CREDIT
ALLOWANCES TERMINATED
REMAINING ALLOWANCES
(INCLUDES 2003-2005)5 5 10 78 0 150 0 0 50 0 40 0 0 0 0 00 0 0 107 0 220 0 0 2 0 20 0 0 43 0 10 0 0 40 0 10 0 0 0 0 00 0 0 0 0 00 0 0 24 0 50 0 0 863 0 60 0 0 1 0 10 0 0 0 0 200 0 0 1 0 430 0 0 1 0 00 0 0 1 0 00 0 0 1 0 00 0 0 17 0 2
00 0 0 0 0 30 0 0 0 0 10 0 0 0 0 00 0 0 0 0 00 0 0 0 0 00 0 0 0 0 00 0 0 0 0 00 0 0 5 0 190 0 0 0 0 00 0 0 0 0 00 0 0 0 0 00 0 0 1 0 10 0 0 0 0 00 0 0 0 0 00 0 0 0 0 00 0 0 35 0 150 0 0 7 0 00 0 0 9 0 00 0 0 1 0 00 0 0 0 0 0
106 102 208 722 0 2150 0 0 20 0 10 0 0 19 0 50 0 0 0 0 230 0 0 1 0 00 0 0 4 0 0
A-78

APPENDIX A: 2005 EMISSIONS AND ALLOWANCE HOLDINGS OF NOx BUDGET SOURCES
BANKED 1 FOR 1 BANKED 2 FOR 1 TOTAL BANKEDTOTAL
DEDUCTED
2004 EARLY REDUCTION CREDIT
ALLOWANCES TERMINATED
REMAINING ALLOWANCES
(INCLUDES 2003-2005)35 0 35 292 0 2030 0 0 276 0 24
00 0 0 4 0 00 0 0 9 0 00 0 0 0 0 00 0 0 221 0 251 0 1 1 0 10 0 0 36 0 70 0 0 5 0 110 0 0 0 0 100 0 0 5 0 230 0 0 1 0 00 0 0 1 0 00 0 0 2 0 10 0 0 2 0 20 0 0 2 0 10 0 0 2 0 10 0 0 4 0 00 0 0 3 0 00 0 0 0 0 50 0 0 0 0 0
22 33 55 158 0 760 0 0 1 0 20 0 0 5 0 30 0 0 2 0 00 0 0 1 0 00 0 0 1 0 00 0 0 1 0 00 0 0 1 0 00 0 0 0 0 00 0 0 0 0 00 0 0 1 0 00 0 0 0 0 00 0 0 3 0 0
39 68 107 155 0 49117 22 139 160 0 330
0 0 0 0 0 01 0 1 1 0 10 0 0 0 0 00 0 0 0 0 00 0 0 9 0 291 0 1 6 0 30 0 0 4 0 20 0 0 0 0 0
A-79

APPENDIX A: 2005 EMISSIONS AND ALLOWANCE HOLDINGS OF NOx BUDGET SOURCES
BANKED 1 FOR 1 BANKED 2 FOR 1 TOTAL BANKEDTOTAL
DEDUCTED
2004 EARLY REDUCTION CREDIT
ALLOWANCES TERMINATED
REMAINING ALLOWANCES
(INCLUDES 2003-2005)0 0 0 2 0 10 0 0 0 0 00 0 0 0 0 00 0 0 0 0 00 0 0 0 0 00 0 0 0 0 00 0 0 0 0 00 0 0 0 0 00 0 0 0 0 0
68 202 270 270 0 00 0 0 0 0 00 0 0 0 0 00 0 0 0 0 00 0 0 1,001 0 388
15 12 27 319 0 320 0 0 491 0 24
20 18 38 725 0 431 0 1 5 0 30 0 0 0 0 0
16 42 58 70 0 618 46 64 67 0 710 26 36 66 0 50 0 0 105 0 67 10 17 112 0 103 0 3 115 0 100 0 0 0 0 00 0 0 0 0 00 0 0 0 0 00 0 0 0 0 03 8 11 11 0 00 0 0 0 0 0
77 0 77 2,996 0 5770 0 0 0 0 00 0 0 20 0 00 0 0 21 0 00 0 0 104 0 00 0 0 0 0 00 0 0 180 0 00 0 0 5 0 00 0 0 4 0 10 0 0 12 0 70 0 0 2 0 02 0 2 2 0 40 0 0 5 0 21 0 1 1 0 10
A-80

APPENDIX A: 2005 EMISSIONS AND ALLOWANCE HOLDINGS OF NOx BUDGET SOURCES
BANKED 1 FOR 1 BANKED 2 FOR 1 TOTAL BANKEDTOTAL
DEDUCTED
2004 EARLY REDUCTION CREDIT
ALLOWANCES TERMINATED
REMAINING ALLOWANCES
(INCLUDES 2003-2005)1 0 1 1 0 101 0 1 1 0 90 0 0 0 0 0
00 0 0 0 0 00 0 0 0 0 0
00 0 0 0 0 00 0 0 0 0 00 0 0 0 0 00 0 0 0 0 00 0 0 0 0 00 0 0 0 0 00 0 0 0 0 00 0 0 0 0 00 0 0 0 0 0
78 0 78 1,744 0 2723 0 3 3 0 70 0 0 252 0 25
554 2 556 556 0 1,658242 301 543 694 0 425324 322 646 1,175 0 650
0 0 0 0 0 00 0 0 0 0 00 0 0 0 0 00 0 0 6 0 0
0592 0 592 592 0 1,776781 0 781 915 0 2,343
0 0 0 0 0 100 0 0 0 0 00 0 0 0 0 00 0 0 37 0 170 0 0 288 0 00 0 0 278 0 00 0 0 302 0 00 0 0 0 0 00 0 0 12 0 00 0 0 6 0 00 0 0 11 0 00 0 0 0 0 510 0 0 396 0 80 0 0 560 0 120 0 0 0 0 00 0 0 0 0 0
A-81

APPENDIX A: 2005 EMISSIONS AND ALLOWANCE HOLDINGS OF NOx BUDGET SOURCES
BANKED 1 FOR 1 BANKED 2 FOR 1 TOTAL BANKEDTOTAL
DEDUCTED
2004 EARLY REDUCTION CREDIT
ALLOWANCES TERMINATED
REMAINING ALLOWANCES
(INCLUDES 2003-2005)0 0 0 0 0 00 0 0 0 0 00 0 0 0 0 00 0 0 0 0 10
00 0 0 147 0 00 0 0 147 0 00 0 0 245 0 00 0 0 0 0 105 0 5 388 0 22
00 0 0 554 0 0
11 0 11 1,039 0 330 0 0 335 0 00 0 0 0 0 440 0 0 3 0 00 0 0 2 0 00 0 0 3 0 00 0 0 2 0 00 0 0 0 0 20 0 0 14 0 00 0 0 23 0 00 0 0 13 0 00 0 0 16 0 00 0 0 3 0 10 0 0 3 0 10 0 0 4 0 00 0 0 4 0 00 0 0 3 0 00 0 0 17 0 90 0 0 0 0 00 0 0 0 0 00 0 0 75 0 2370 0 0 0 0 30 0 0 566 0 112 0 2 2 0 62 0 2 2 0 65 0 5 5 0 152 0 2 2 0 61 0 1 1 0 31 0 1 1 0 30 0 0 0 0 00 0 0 0 0 40 0 0 0 0 00 0 0 6 0 1
A-82

APPENDIX A: 2005 EMISSIONS AND ALLOWANCE HOLDINGS OF NOx BUDGET SOURCES
BANKED 1 FOR 1 BANKED 2 FOR 1 TOTAL BANKEDTOTAL
DEDUCTED
2004 EARLY REDUCTION CREDIT
ALLOWANCES TERMINATED
REMAINING ALLOWANCES
(INCLUDES 2003-2005)1 1 2 3 0 40 0 0 8 0 00 0 0 10 0 00 0 0 0 0 20 0 0 2 0 30 0 0 1 0 40 0 0 1 0 40 0 0 2 0 30 0 0 2 0 30 0 0 2 0 30 0 0 0 0 00 0 0 30 0 00 0 0 46 0 00 0 0 0 0 41 1 2 2 0 01 0 1 1 0 11 1 2 2 0 01 1 2 2 0 01 1 2 2 0 01 1 2 2 0 01 1 2 2 0 01 1 2 2 0 01 1 2 2 0 00 0 0 291 0 29
01 1 2 2 0 01 1 2 2 0 00 0 0 556 0 270 0 0 0 0 00 0 0 0 0 00 0 0 43 0 150 0 0 323 0 00 0 0 393 0 00 0 0 1 0 70 0 0 13 0 13
00 0 0 352 0 70 0 0 351 0 8
00 0 0 444 0 100 0 0 445 0 90 0 0 0 0 00 0 0 1,660 0 34
03 0 3 374 0 14
A-83

APPENDIX A: 2005 EMISSIONS AND ALLOWANCE HOLDINGS OF NOx BUDGET SOURCES
BANKED 1 FOR 1 BANKED 2 FOR 1 TOTAL BANKEDTOTAL
DEDUCTED
2004 EARLY REDUCTION CREDIT
ALLOWANCES TERMINATED
REMAINING ALLOWANCES
(INCLUDES 2003-2005)0 0 0 373 0 2
00 0 0 374 0 10 0 0 373 0 2
00 0 0 417 0 10 0 0 417 0 10 0 0 0 0 21
17 0 17 20 0 520 0 0 19 0 30 0 0 19 0 30 0 0 20 0 30 0 0 0 0 72
00 0 0 0 0 00 0 0 0 0 00 0 0 993 0 70 0 0 8 0 10 0 0 6 0 60 0 0 0 0 30
00 0 0 251 0 0
81 0 81 251 0 2811 0 1 1 0 90 0 0 2 0 00 0 0 1 0 00 0 0 2 0 00 0 0 2 0 00 0 0 2 0 00 0 0 1 0 00 0 0 2 0 00 0 0 2 0 00 0 0 0 0 00 0 0 26 0 10 0 0 0 0 00 0 0 0 0 00 0 0 0 0 00 0 0 0 0 00 0 0 0 0 00 0 0 0 0 00 0 0 0 0 00 0 0 0 0 00 0 0 9 0 600 0 0 0 0 00 0 0 0 0 0
A-84

APPENDIX A: 2005 EMISSIONS AND ALLOWANCE HOLDINGS OF NOx BUDGET SOURCES
BANKED 1 FOR 1 BANKED 2 FOR 1 TOTAL BANKEDTOTAL
DEDUCTED
2004 EARLY REDUCTION CREDIT
ALLOWANCES TERMINATED
REMAINING ALLOWANCES
(INCLUDES 2003-2005)0 0 0 78 0 530 0 0 174 0 00 0 0 0 0 10 0 0 2 0 00 0 0 197 0 0
133 0 133 133 0 4160 0 0 5 0 30 0 0 2 0 30 0 0 2 0 30 0 0 2 0 30 0 0 0 0 110 0 0 4 0 30 0 0 5 0 10 0 0 5 0 11 0 1 3 0 40 0 0 2 0 10 0 0 0 0 36
00 0 0 81 0 00 0 0 120 0 00 0 0 84 0 00 0 0 161 0 00 0 0 739 0 00 0 0 59 0 00 0 0 0 0 100 0 0 0 0 00 0 0 0 0 00 0 0 0 0 00 0 0 0 0 00 0 0 0 0 00 0 0 0 0 00 0 0 0 0 00 0 0 0 0 00 0 0 35 0 50 0 0 2 0 300 0 0 10 0 420 0 0 0 0 00 0 0 1,058 0 00 0 0 1,142 0 00 0 0 0 0 90 0 0 0 0 00 0 0 0 0 00 0 0 7 0 10 0 0 10 0 10 0 0 12 0 0
A-85

APPENDIX A: 2005 EMISSIONS AND ALLOWANCE HOLDINGS OF NOx BUDGET SOURCES
BANKED 1 FOR 1 BANKED 2 FOR 1 TOTAL BANKEDTOTAL
DEDUCTED
2004 EARLY REDUCTION CREDIT
ALLOWANCES TERMINATED
REMAINING ALLOWANCES
(INCLUDES 2003-2005)0 0 0 12 0 00 0 0 12 0 00 0 0 12 0 00 0 0 0 0 00 0 0 0 0 00 0 0 0 0 00 0 0 0 0 00 0 0 0 0 61
0191 572 763 1,953 0 0
0 0 0 1,667 0 20 0 0 1,667 0 00 0 0 1,668 0 10 0 0 0 0 3160 0 0 2 0 00 0 0 3 0 00 0 0 3 0 00 0 0 3 0 00 0 0 1 0 20 0 0 2 0 00 0 0 2 0 00 0 0 2 0 00 0 0 1 0 00 0 0 1 0 00 0 0 1 0 00 0 0 1 0 00 0 0 0 0 00 0 0 13 0 00 0 0 11 0 00 0 0 5 0 00 0 0 6 0 00 0 0 8 0 00 0 0 7 0 00 0 0 7 0 00 0 0 7 0 00 0 0 5 0 00 0 0 5 0 00 0 0 0 0 100 0 0 7 0 00 0 0 6 0 00 0 0 6 0 00 0 0 5 0 00 0 0 4 0 00 0 0 5 0 00 0 0 4 0 0
A-86

APPENDIX A: 2005 EMISSIONS AND ALLOWANCE HOLDINGS OF NOx BUDGET SOURCES
BANKED 1 FOR 1 BANKED 2 FOR 1 TOTAL BANKEDTOTAL
DEDUCTED
2004 EARLY REDUCTION CREDIT
ALLOWANCES TERMINATED
REMAINING ALLOWANCES
(INCLUDES 2003-2005)0 0 0 3 0 00 0 0 0 0 80 0 0 1 0 140 0 0 1 0 110 0 0 1 0 40 0 0 1 0 70 0 0 0 0 00 0 0 1 0 10 0 0 1 0 10 0 0 1 0 10 0 0 1 0 10 0 0 1 0 10 0 0 1 0 10 0 0 1 0 10 0 0 1 0 10 0 0 0 0 00 0 0 0 0 00 0 0 0 0 00 0 0 0 0 00 0 0 128 0 221 1 2 2 0 01 1 2 2 0 01 1 2 2 0 01 1 2 2 0 00 0 0 34 0 90 0 0 0 0 00 0 0 0 0 00 0 0 0 0 00 0 0 0 0 00 0 0 390 0 430 0 0 0 0 00 0 0 0 0 00 0 0 0 0 00 0 0 0 0 00 0 0 0 0 00 0 0 0 0 00 0 0 0 0 00 0 0 0 0 00 0 0 0 0 00 0 0 0 0 00 0 0 0 0 00 0 0 0 0 00 0 0 85 0 60 0 0 0 0 60 0 0 0 0 4
A-87

APPENDIX A: 2005 EMISSIONS AND ALLOWANCE HOLDINGS OF NOx BUDGET SOURCES
BANKED 1 FOR 1 BANKED 2 FOR 1 TOTAL BANKEDTOTAL
DEDUCTED
2004 EARLY REDUCTION CREDIT
ALLOWANCES TERMINATED
REMAINING ALLOWANCES
(INCLUDES 2003-2005)0 0 0 0 0 00 0 0 0 0 40 0 0 9 0 50 0 0 3 0 122 0 2 4 0 102 0 2 4 0 140 0 0 0 0 58
01 1 2 2 0 01 1 2 2 0 00 0 0 460 0 230 0 0 583 0 120 0 0 643 0 130 0 0 700 0 153 0 3 3 0 97 0 7 7 0 215 0 5 5 0 155 0 5 5 0 150 0 0 0 0 00 0 0 769 0 170 0 0 597 0 130 0 0 355 0 70 0 0 771 0 160 0 0 0 0 0
01 1 2 2 0 01 0 1 1 0 11 0 1 1 0 11 1 2 2 0 01 1 2 2 0 00 0 0 1,011 0 500 0 0 0 0 00 0 0 0 0 00 0 0 0 0 00 0 0 143 0 500 0 0 3 0 00 0 0 2 0 00 0 0 2 0 40 0 0 0 0 00 0 0 320 0 80 0 0 404 0 101 0 1 11 0 40 0 0 6 0 00 0 0 0 0 00 0 0 0 0 20
A-88

APPENDIX A: 2005 EMISSIONS AND ALLOWANCE HOLDINGS OF NOx BUDGET SOURCES
BANKED 1 FOR 1 BANKED 2 FOR 1 TOTAL BANKEDTOTAL
DEDUCTED
2004 EARLY REDUCTION CREDIT
ALLOWANCES TERMINATED
REMAINING ALLOWANCES
(INCLUDES 2003-2005)0 0 0 1 0 170 0 0 51 0 00 0 0 0 0 0
00 0 0 764 0 00 0 0 765 0 00 0 0 2 0 0
1,136 0 1,136 1,136 0 3,4190
0 0 0 22 0 00 0 0 22 0 0
00 0 0 22 0 00 0 0 22 0 00 0 0 23 0 00 0 0 57 0 340 0 0 23 0 280 0 0 64 0 270 0 0 33 0 380 0 0 38 0 280 0 0 55 0 454 8 12 17 0 47 10 17 22 0 140 0 0 0 0 0
00 0 0 112 0 40 0 0 111 0 130 0 0 30 0 100 0 0 10 0 10
00 0 0 80 0 60 0 0 69 0 50 0 0 0 0 0
120 0 120 1,998 0 364165 0 165 2,746 0 499
0 0 0 7 0 20 0 0 0 0 0
080 0 80 245 0 54880 0 80 245 0 53478 0 78 252 0 547
00 0 0 912 0 3060 0 0 912 0 341
19 0 19 941 0 245
A-89
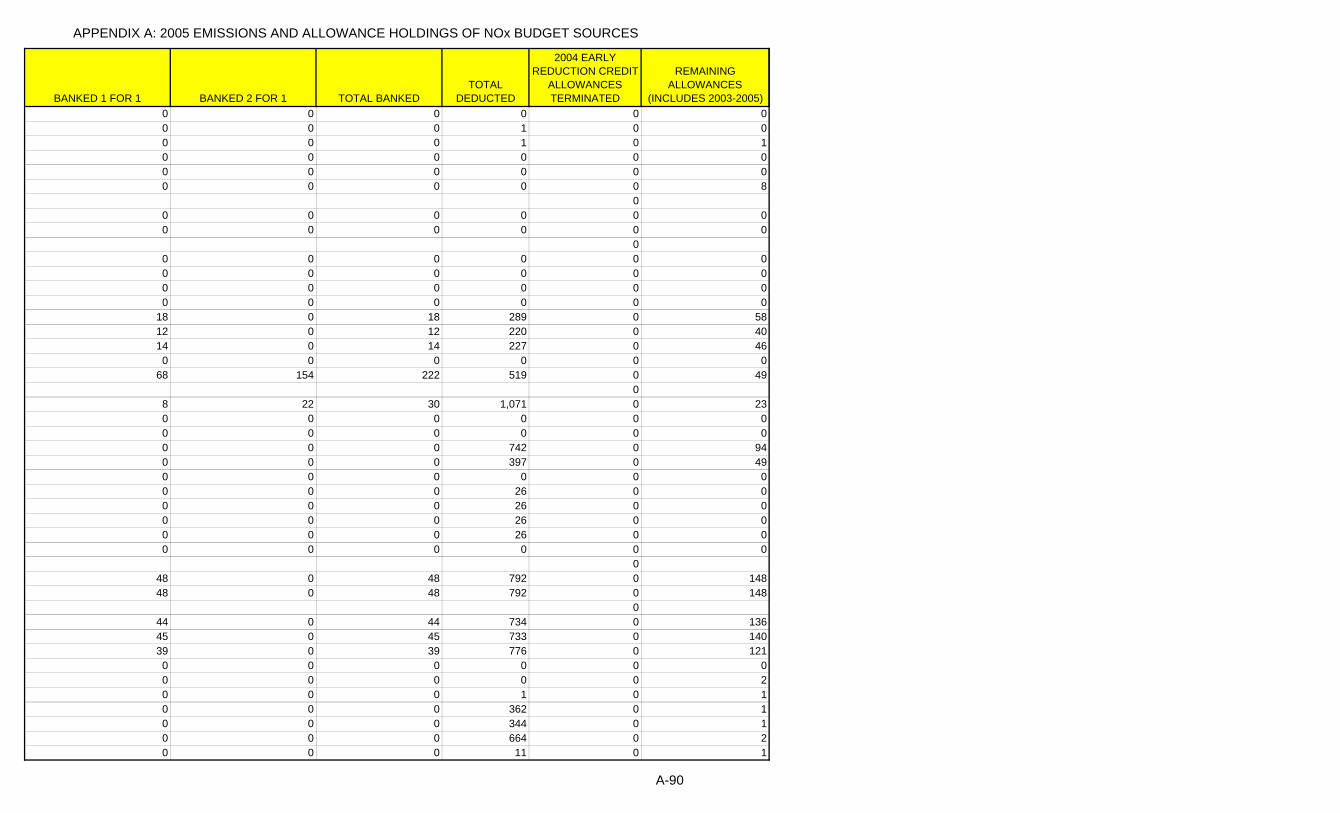
APPENDIX A: 2005 EMISSIONS AND ALLOWANCE HOLDINGS OF NOx BUDGET SOURCES
BANKED 1 FOR 1 BANKED 2 FOR 1 TOTAL BANKEDTOTAL
DEDUCTED
2004 EARLY REDUCTION CREDIT
ALLOWANCES TERMINATED
REMAINING ALLOWANCES
(INCLUDES 2003-2005)0 0 0 0 0 00 0 0 1 0 00 0 0 1 0 10 0 0 0 0 00 0 0 0 0 00 0 0 0 0 8
00 0 0 0 0 00 0 0 0 0 0
00 0 0 0 0 00 0 0 0 0 00 0 0 0 0 00 0 0 0 0 0
18 0 18 289 0 5812 0 12 220 0 4014 0 14 227 0 460 0 0 0 0 0
68 154 222 519 0 490
8 22 30 1,071 0 230 0 0 0 0 00 0 0 0 0 00 0 0 742 0 940 0 0 397 0 490 0 0 0 0 00 0 0 26 0 00 0 0 26 0 00 0 0 26 0 00 0 0 26 0 00 0 0 0 0 0
048 0 48 792 0 14848 0 48 792 0 148
044 0 44 734 0 13645 0 45 733 0 14039 0 39 776 0 1210 0 0 0 0 00 0 0 0 0 20 0 0 1 0 10 0 0 362 0 10 0 0 344 0 10 0 0 664 0 20 0 0 11 0 1
A-90

APPENDIX A: 2005 EMISSIONS AND ALLOWANCE HOLDINGS OF NOx BUDGET SOURCES
BANKED 1 FOR 1 BANKED 2 FOR 1 TOTAL BANKEDTOTAL
DEDUCTED
2004 EARLY REDUCTION CREDIT
ALLOWANCES TERMINATED
REMAINING ALLOWANCES
(INCLUDES 2003-2005)0 0 0 10 0 20 0 0 40 0 00 0 0 0 0 00 0 0 21 0 00 0 0 21 0 00 0 0 21 0 00 0 0 0 0 60 0 0 25 0 00 0 0 25 0 00 0 0 25 0 00 0 0 25 0 00 0 0 25 0 00 0 0 25 0 00 0 0 0 0 00 0 0 1 0 10 0 0 2 0 1
00 0 0 231 0 10 0 0 341 0 2
00 0 0 188 0 20 0 0 350 0 10 0 0 0 0 00 0 0 809 0 7470 0 0 991 0 6270 0 0 0 0 00 0 0 0 0 00 0 0 0 0 00 0 0 0 0 00 0 0 0 0 0
689 0 689 689 0 2,0760 0 0 49 0 00 0 0 49 0 00 0 0 0 0 00 0 0 0 0 00 0 0 4 0 00 1 1 1 0 0
03 6 9 56 0 15 16 21 61 0 05 16 21 61 0 00 0 0 0 0 00 0 0 19 0 00 0 0 19 0 00 0 0 19 0 0
A-91

APPENDIX A: 2005 EMISSIONS AND ALLOWANCE HOLDINGS OF NOx BUDGET SOURCES
BANKED 1 FOR 1 BANKED 2 FOR 1 TOTAL BANKEDTOTAL
DEDUCTED
2004 EARLY REDUCTION CREDIT
ALLOWANCES TERMINATED
REMAINING ALLOWANCES
(INCLUDES 2003-2005)0 0 0 19 0 00 0 0 19 0 00 0 0 19 0 00 0 0 19 0 00 0 0 19 0 00 0 0 0 0 128
13 32 45 361 0 50 0 0 30 0 00 0 0 30 0 00 0 0 30 0 00 0 0 0 0 6
101 0 101 975 0 3030 0 0 360 0 10 0 0 331 0 10 0 0 2,219 0 10 0 0 0 0 00 0 0 16 0 00 0 0 3 0 00 0 0 3 0 00 0 0 0 0 120 0 0 34 0 00 0 0 34 0 10 0 0 34 0 20 0 0 34 0 20 0 0 0 0 0
10 30 40 137 0 00 0 0 98 0 00 0 0 0 0 102 6 8 44 0 00 0 0 17 0 25
024 0 24 500 0 7624 0 24 499 0 77
027 0 27 433 0 8527 0 27 433 0 850 0 0 0 0 00 0 0 0 0 00 0 0 0 0 00 0 0 0 0 00 0 0 0 0 00 0 0 0 0 00 0 0 0 0 0
4,928 0 4,928 4,928 0 14,7920 0 0 1 0 17
A-92
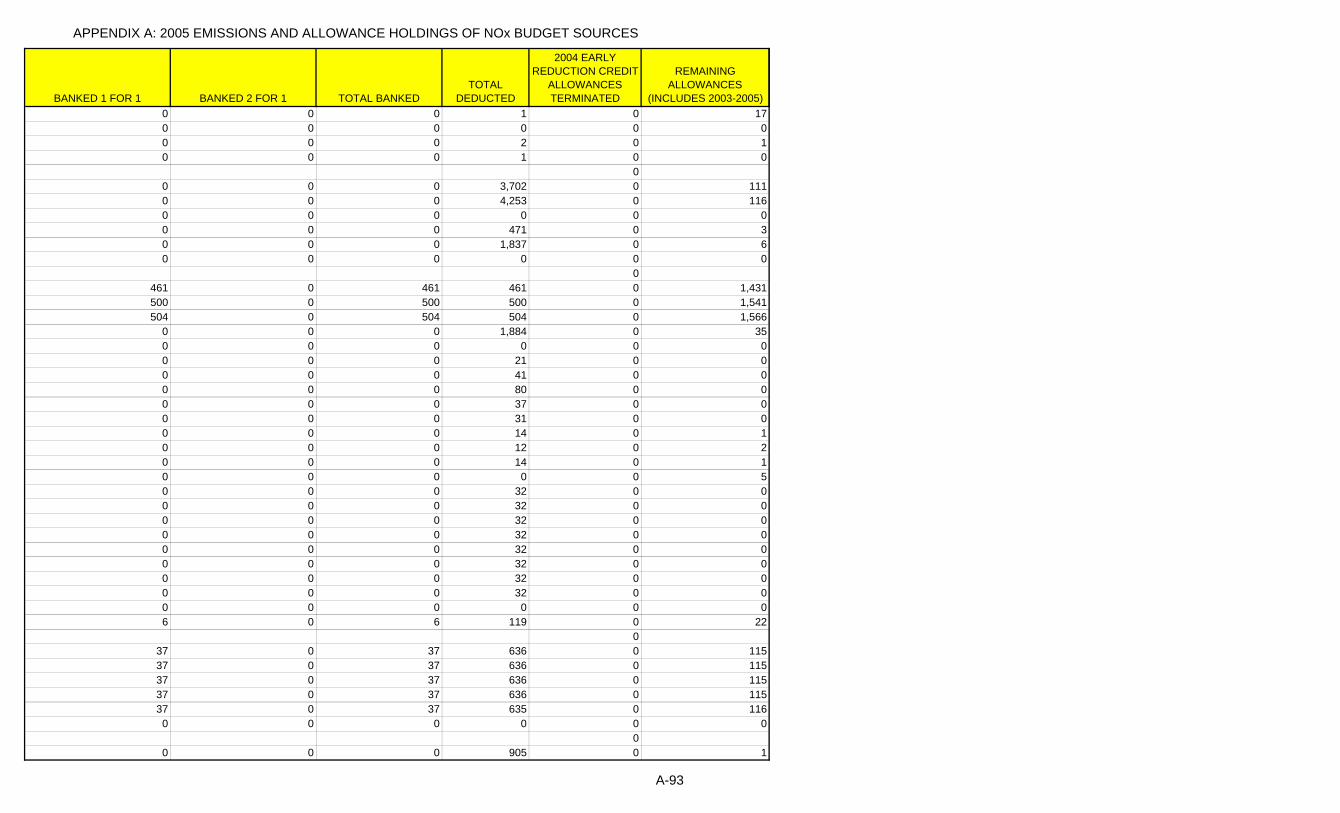
APPENDIX A: 2005 EMISSIONS AND ALLOWANCE HOLDINGS OF NOx BUDGET SOURCES
BANKED 1 FOR 1 BANKED 2 FOR 1 TOTAL BANKEDTOTAL
DEDUCTED
2004 EARLY REDUCTION CREDIT
ALLOWANCES TERMINATED
REMAINING ALLOWANCES
(INCLUDES 2003-2005)0 0 0 1 0 170 0 0 0 0 00 0 0 2 0 10 0 0 1 0 0
00 0 0 3,702 0 1110 0 0 4,253 0 1160 0 0 0 0 00 0 0 471 0 30 0 0 1,837 0 60 0 0 0 0 0
0461 0 461 461 0 1,431500 0 500 500 0 1,541504 0 504 504 0 1,566
0 0 0 1,884 0 350 0 0 0 0 00 0 0 21 0 00 0 0 41 0 00 0 0 80 0 00 0 0 37 0 00 0 0 31 0 00 0 0 14 0 10 0 0 12 0 20 0 0 14 0 10 0 0 0 0 50 0 0 32 0 00 0 0 32 0 00 0 0 32 0 00 0 0 32 0 00 0 0 32 0 00 0 0 32 0 00 0 0 32 0 00 0 0 32 0 00 0 0 0 0 06 0 6 119 0 22
037 0 37 636 0 11537 0 37 636 0 11537 0 37 636 0 11537 0 37 636 0 11537 0 37 635 0 1160 0 0 0 0 0
00 0 0 905 0 1
A-93

APPENDIX A: 2005 EMISSIONS AND ALLOWANCE HOLDINGS OF NOx BUDGET SOURCES
BANKED 1 FOR 1 BANKED 2 FOR 1 TOTAL BANKEDTOTAL
DEDUCTED
2004 EARLY REDUCTION CREDIT
ALLOWANCES TERMINATED
REMAINING ALLOWANCES
(INCLUDES 2003-2005)0 0 0 865 0 00 0 0 917 0 06 19 25 533 0 00 0 0 8 0 150 0 0 25 0 00 0 0 25 0 00 0 0 25 0 00 0 0 25 0 00 0 0 0 0 8
00 0 0 170 0 100 0 0 267 0 170 0 0 0 0 00 0 0 131 0 00 0 0 131 0 00 0 0 0 0 00 0 0 25 0 00 0 0 25 0 00 0 0 25 0 00 0 0 25 0 00 0 0 0 0 00 0 0 1 0 1
0336 0 336 336 0 1,507
0 0 0 1,105 0 120 0 0 0 0 00 0 0 3 0 10 0 0 3 0 10 0 0 5 0 10 0 0 0 0 00 0 0 9 0 30 0 0 11 0 30 0 0 29 0 30 0 0 0 0 0
152 0 152 862 0 5360 0 0 997 0 83
147 0 147 1,145 0 6090 0 0 0 0 06 10 16 45 0 6
20 0 20 737 0 6720 0 20 636 0 649 0 9 756 0 770 0 0 0 0 30
12 0 12 424 0 670 0 0 646 0 511
A-94

APPENDIX A: 2005 EMISSIONS AND ALLOWANCE HOLDINGS OF NOx BUDGET SOURCES
BANKED 1 FOR 1 BANKED 2 FOR 1 TOTAL BANKEDTOTAL
DEDUCTED
2004 EARLY REDUCTION CREDIT
ALLOWANCES TERMINATED
REMAINING ALLOWANCES
(INCLUDES 2003-2005)0
0 0 0 560 0 430 0 0 1,085 0 3210 0 0 46 0 140 0 0 38 0 250 0 0 23 0 430 0 0 1 0 910 0 0 1 0 870 0 0 1 0 810 0 0 1 0 630 0 0 0 0 0
180 0 180 660 0 5440 0 0 432 0 04 11 15 769 0 05 0 5 5 0 400 0 0 339 0 2940 0 0 1,620 0 688
0118 0 118 189 0 446
0 0 0 189 0 4100 0 0 0 0 00 0 0 334 0 2090 0 0 145 0 1320 0 0 0 0 00 0 0 601 0 10 0 0 717 0 10 0 0 367 0 10 0 0 0 0 100 0 0 11 0 510 0 0 213 0 10 0 0 204 0 10 0 0 0 0 12
00 0 0 1,045 0 01 3 4 851 0 0
181 28 209 209 0 5160 0 0 0 0 00 0 0 0 0 00 0 0 0 0 00 0 0 0 0 00 0 0 0 0 00 0 0 0 0 00 0 0 0 0 00 0 0 0 0 00 0 0 0 0 0
A-95
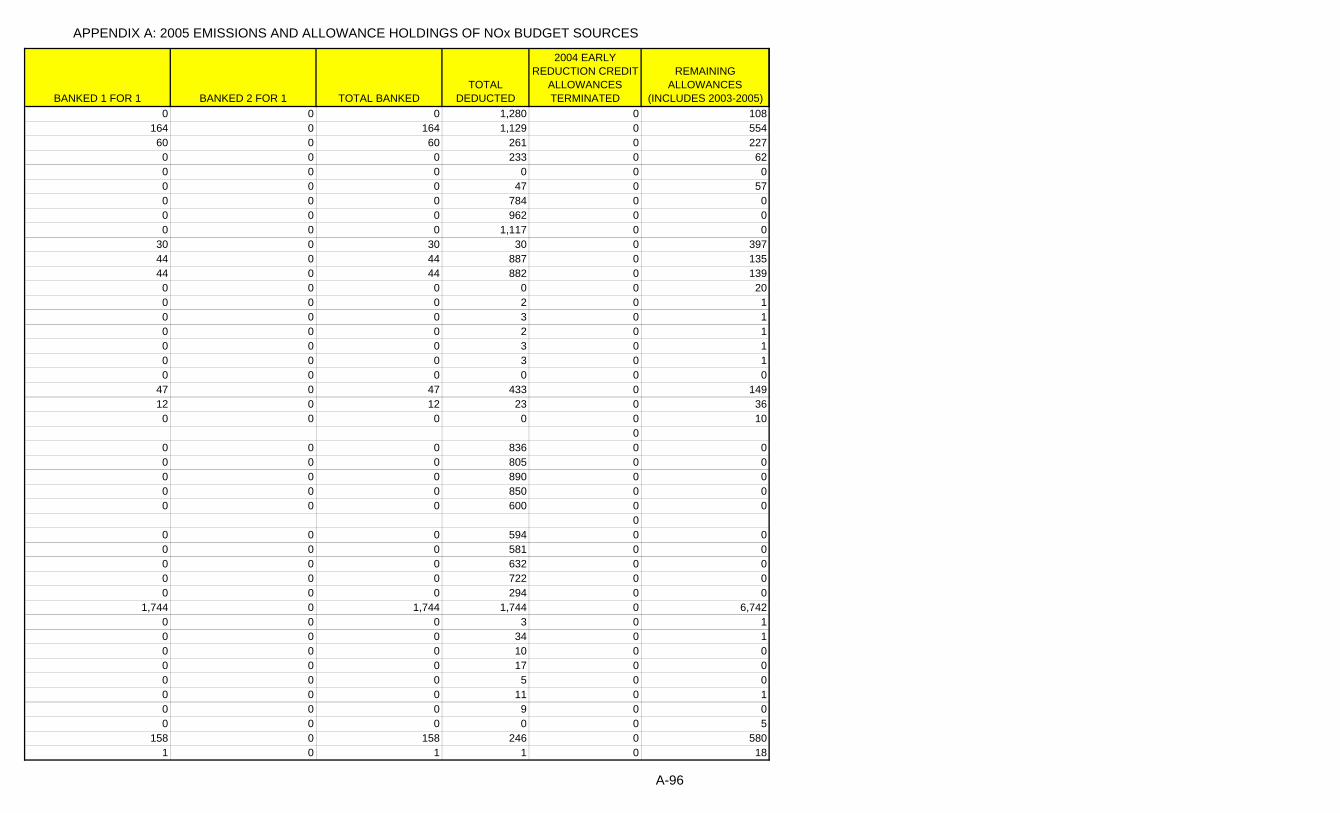
APPENDIX A: 2005 EMISSIONS AND ALLOWANCE HOLDINGS OF NOx BUDGET SOURCES
BANKED 1 FOR 1 BANKED 2 FOR 1 TOTAL BANKEDTOTAL
DEDUCTED
2004 EARLY REDUCTION CREDIT
ALLOWANCES TERMINATED
REMAINING ALLOWANCES
(INCLUDES 2003-2005)0 0 0 1,280 0 108
164 0 164 1,129 0 55460 0 60 261 0 2270 0 0 233 0 620 0 0 0 0 00 0 0 47 0 570 0 0 784 0 00 0 0 962 0 00 0 0 1,117 0 0
30 0 30 30 0 39744 0 44 887 0 13544 0 44 882 0 1390 0 0 0 0 200 0 0 2 0 10 0 0 3 0 10 0 0 2 0 10 0 0 3 0 10 0 0 3 0 10 0 0 0 0 0
47 0 47 433 0 14912 0 12 23 0 360 0 0 0 0 10
00 0 0 836 0 00 0 0 805 0 00 0 0 890 0 00 0 0 850 0 00 0 0 600 0 0
00 0 0 594 0 00 0 0 581 0 00 0 0 632 0 00 0 0 722 0 00 0 0 294 0 0
1,744 0 1,744 1,744 0 6,7420 0 0 3 0 10 0 0 34 0 10 0 0 10 0 00 0 0 17 0 00 0 0 5 0 00 0 0 11 0 10 0 0 9 0 00 0 0 0 0 5
158 0 158 246 0 5801 0 1 1 0 18
A-96

APPENDIX A: 2005 EMISSIONS AND ALLOWANCE HOLDINGS OF NOx BUDGET SOURCES
BANKED 1 FOR 1 BANKED 2 FOR 1 TOTAL BANKEDTOTAL
DEDUCTED
2004 EARLY REDUCTION CREDIT
ALLOWANCES TERMINATED
REMAINING ALLOWANCES
(INCLUDES 2003-2005)4 0 4 4 0 640 0 0 6 0 610 0 0 9 0 600 0 0 6 0 61
11 0 11 11 0 1130 0 0 0 0 00 0 0 0 0 20 0 0 0 0 20 0 0 0 0 20 0 0 0 0 40 0 0 322 0 2040 0 0 0 0 00 0 0 3 0 10 0 0 2 0 10 0 0 0 0 0
00 0 0 512 0 10 0 0 513 0 00 0 0 0 0 50 0 0 0 0 00 0 0 0 0 00 0 0 36 0 60 0 0 0 0 00 0 0 0 0 00 0 0 44 0 2
00 0 0 0 0 00 0 0 0 0 00 0 0 92 0 600 0 0 26 0 21
00 0 0 0 0 00 0 0 0 0 00 0 0 6 0 70 0 0 808 0 00 0 0 892 0 00 0 0 2,113 0 00 0 0 179 0 00 0 0 0 0 00 0 0 0 0 00 0 0 0 0 00 0 0 1,202 0 200 0 0 0 0 00 0 0 0 0 00 0 0 56 0 193
A-97

APPENDIX A: 2005 EMISSIONS AND ALLOWANCE HOLDINGS OF NOx BUDGET SOURCES
BANKED 1 FOR 1 BANKED 2 FOR 1 TOTAL BANKEDTOTAL
DEDUCTED
2004 EARLY REDUCTION CREDIT
ALLOWANCES TERMINATED
REMAINING ALLOWANCES
(INCLUDES 2003-2005)0 0 0 14 0 30 0 0 0 0 00 0 0 0 0 00 0 0 8 0 1040 0 0 14 0 01 0 1 1 0 4
21 0 21 21 0 8521 0 21 21 0 890 0 0 0 0 840 0 0 2 0 00 0 0 2 0 00 0 0 2 0 00 0 0 0 0 00 0 0 0 0 00 0 0 0 0 00 0 0 21 0 1240 0 0 0 0 0
00 0 0 0 0 00 0 0 0 0 00 0 0 0 0 00 0 0 0 0 00 0 0 0 0 00 0 0 55 0 170 0 0 2 0 00 0 0 1 0 00 0 0 0 0 00 0 0 0 0 00 0 0 141 0 110 0 0 8 0 210 0 0 0 0 00 0 0 0 0 00 0 0 0 0 00 0 0 54 0 00 0 0 3 0 00 0 0 2 0 00 0 0 1 0 10 0 0 2 0 00 0 0 2 0 00 0 0 1 0 10 0 0 0 0 30 0 0 32 0 63 10 13 31 0 10 0 0 26 0 40 0 0 560 0 12
A-98

APPENDIX A: 2005 EMISSIONS AND ALLOWANCE HOLDINGS OF NOx BUDGET SOURCES
BANKED 1 FOR 1 BANKED 2 FOR 1 TOTAL BANKEDTOTAL
DEDUCTED
2004 EARLY REDUCTION CREDIT
ALLOWANCES TERMINATED
REMAINING ALLOWANCES
(INCLUDES 2003-2005)0 0 0 0 0 00 0 0 0 0 00 0 0 0 0 0
114 0 114 114 0 46119 0 19 19 0 8119 0 19 19 0 8119 0 19 19 0 8617 0 17 17 0 731 0 1 1 0 40 0 0 0 0 5630 0 0 132 0 50 0 0 0 0 00 0 0 3 0 10 0 0 0 0 1200 0 0 0 0 00 0 0 0 0 00 0 0 0 0 00 0 0 10 0 70 0 0 14 0 2050 0 0 215 0 00 0 0 204 0 00 0 0 323 0 00 0 0 256 0 00 0 0 0 0 00 0 0 0 0 00 0 0 0 0 00 0 0 0 0 00 0 0 280 0 190 0 0 0 0 60 0 0 0 0 00 0 0 0 0 100 0 0 0 0 00 0 0 0 0 00 0 0 0 0 00 0 0 0 0 00 0 0 0 0 00 0 0 50 0 30 0 0 0 0 00 0 0 0 0 02 0 2 58 0 70 0 0 46 0 06 0 6 6 0 200 0 0 0 0 00 0 0 0 0 00 0 0 2 0 19
A-99

APPENDIX A: 2005 EMISSIONS AND ALLOWANCE HOLDINGS OF NOx BUDGET SOURCES
BANKED 1 FOR 1 BANKED 2 FOR 1 TOTAL BANKEDTOTAL
DEDUCTED
2004 EARLY REDUCTION CREDIT
ALLOWANCES TERMINATED
REMAINING ALLOWANCES
(INCLUDES 2003-2005)7 10 17 17 0 112 2 4 180 0 2
182 0 182 666 7 567367 0 367 694 0 1,129
0 0 0 0 0 00 0 0 843 0 90 0 0 1,115 0 110 0 0 0 0 00 0 0 20 0 00 0 0 19 0 00 0 0 7 0 00 0 0 21 0 0
00 0 0 793 0 00 0 0 818 0 00 0 0 339 0 00 0 0 441 0 00 0 0 60 0 00 0 0 33 0 00 0 0 3,851 0 31
00 0 0 452 0 00 0 0 441 0 00 0 0 570 0 00 0 0 31 0 00 0 0 26 0 00 0 0 626 0 1000 0 0 171 0 20 0 0 920 0 90 0 0 360 0 40 0 0 525 0 50 0 0 0 0 0
00 0 0 509 0 10 0 0 389 0 10 0 0 2 0 00 0 0 0 0 00 0 0 1,231 0 00 0 0 1,316 0 00 0 0 11 0 00 0 0 13 0 00 0 0 13 0 00 0 0 12 0 00 0 0 2,520 0 1340 0 0 16 0 2
A-100
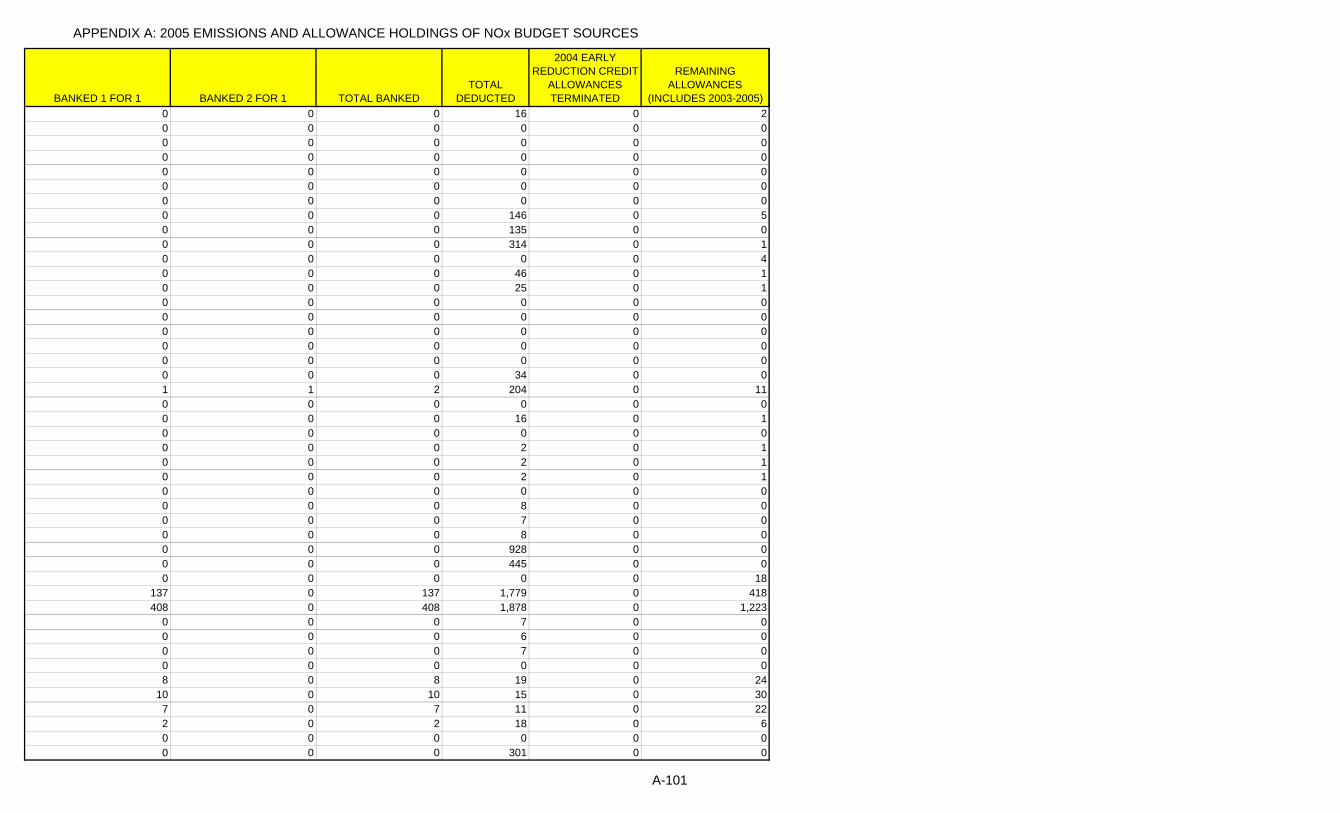
APPENDIX A: 2005 EMISSIONS AND ALLOWANCE HOLDINGS OF NOx BUDGET SOURCES
BANKED 1 FOR 1 BANKED 2 FOR 1 TOTAL BANKEDTOTAL
DEDUCTED
2004 EARLY REDUCTION CREDIT
ALLOWANCES TERMINATED
REMAINING ALLOWANCES
(INCLUDES 2003-2005)0 0 0 16 0 20 0 0 0 0 00 0 0 0 0 00 0 0 0 0 00 0 0 0 0 00 0 0 0 0 00 0 0 0 0 00 0 0 146 0 50 0 0 135 0 00 0 0 314 0 10 0 0 0 0 40 0 0 46 0 10 0 0 25 0 10 0 0 0 0 00 0 0 0 0 00 0 0 0 0 00 0 0 0 0 00 0 0 0 0 00 0 0 34 0 01 1 2 204 0 110 0 0 0 0 00 0 0 16 0 10 0 0 0 0 00 0 0 2 0 10 0 0 2 0 10 0 0 2 0 10 0 0 0 0 00 0 0 8 0 00 0 0 7 0 00 0 0 8 0 00 0 0 928 0 00 0 0 445 0 00 0 0 0 0 18
137 0 137 1,779 0 418408 0 408 1,878 0 1,223
0 0 0 7 0 00 0 0 6 0 00 0 0 7 0 00 0 0 0 0 08 0 8 19 0 24
10 0 10 15 0 307 0 7 11 0 222 0 2 18 0 60 0 0 0 0 00 0 0 301 0 0
A-101

APPENDIX A: 2005 EMISSIONS AND ALLOWANCE HOLDINGS OF NOx BUDGET SOURCES
BANKED 1 FOR 1 BANKED 2 FOR 1 TOTAL BANKEDTOTAL
DEDUCTED
2004 EARLY REDUCTION CREDIT
ALLOWANCES TERMINATED
REMAINING ALLOWANCES
(INCLUDES 2003-2005)0 0 0 207 0 0
00 0 0 344 0 00 0 0 318 0 00 0 0 5 0 00 0 0 6 0 00 0 0 0 0 190 0 0 18 0 02 0 2 11 0 430 0 0 9 0 462 0 2 11 0 430 0 0 43 0 230 0 0 43 0 240 0 0 0 0 01 0 1 3 0 31 0 1 6 0 30 0 0 0 0 01 0 1 9 0 41 0 1 9 0 41 2 3 11 0 21 2 3 11 0 20 0 0 0 0 02 0 2 114 0 162 0 2 126 0 162 0 2 110 0 253 0 3 166 0 243 0 3 200 0 253 0 3 220 0 260 0 0 0 0 00 0 0 263 0 68 0 8 461 0 430 0 0 0 0 00 0 0 0 0 00 0 0 0 0 00 0 0 0 0 00 0 0 0 0 760 0 0 0 0 00 0 0 79 0 22
93 0 93 380 0 2781 0 1 7 0 31 0 1 6 0 31 0 1 3 0 30 0 0 0 0 00 0 0 7 0 00 0 0 2 0 0
A-102

APPENDIX A: 2005 EMISSIONS AND ALLOWANCE HOLDINGS OF NOx BUDGET SOURCES
BANKED 1 FOR 1 BANKED 2 FOR 1 TOTAL BANKEDTOTAL
DEDUCTED
2004 EARLY REDUCTION CREDIT
ALLOWANCES TERMINATED
REMAINING ALLOWANCES
(INCLUDES 2003-2005)0 0 0 0 0 00 0 0 440 0 00 0 0 237 0 0
00 0 0 830 0 0
330 0 330 710 0 9880 0 0 0 0 15
00 0 0 755 0 00 0 0 1,726 0 00 0 0 4,448 0 10 0 0 0 0 16
206 0 206 429 0 616244 0 244 461 0 73071 0 71 377 0 2110 0 0 0 0 171 0 1 50 0 365 10 15 39 0 35 10 15 40 0 35 8 13 38 0 55 10 15 40 0 35 8 13 38 0 55 10 15 40 0 30 0 0 0 0 08 18 26 181 0 60 0 0 4 0 2
00 0 0 0 0 00 0 0 0 0 0
00 0 0 0 0 00 0 0 0 0 00 0 0 0 0 01 0 1 11 0 30 0 0 11 0 20 0 0 0 0 00 0 0 0 0 00 0 0 0 0 00 0 0 0 0 00 0 0 0 0 00 0 0 0 0 00 0 0 0 0 00 0 0 0 0 00 0 0 0 0 00 0 0 0 0 0
A-103

APPENDIX A: 2005 EMISSIONS AND ALLOWANCE HOLDINGS OF NOx BUDGET SOURCES
BANKED 1 FOR 1 BANKED 2 FOR 1 TOTAL BANKEDTOTAL
DEDUCTED
2004 EARLY REDUCTION CREDIT
ALLOWANCES TERMINATED
REMAINING ALLOWANCES
(INCLUDES 2003-2005)0 0 0 0 0 00 0 0 0 0 00 0 0 0 0 00 0 0 1,285 0 274 10 14 40 0 24 13 17 42 0 02 5 7 31 0 02 4 6 26 0 10 0 0 0 0 60 0 0 0 0 00 0 0 0 0 00 0 0 0 0 00 0 0 0 0 0
32 82 114 383 0 140
4 0 4 2,438 0 100 0 0 2,580 0 0
00 0 0 3,426 0 0
190 0 190 3,466 0 5750 0 0 0 0 02 5 7 18 0 02 5 7 17 0 02 6 8 20 0 00 0 0 0 0 03 4 7 21 0 53 4 7 20 0 53 8 11 28 0 13 8 11 26 0 10 0 0 0 0 00 0 0 3 0 00 0 0 555 0 00 0 0 1,041 0 00 0 0 0 0 0
25 0 25 1,259 0 7525 0 25 645 0 7525 0 25 661 0 7515 0 15 602 0 460 0 0 0 0 0
45 0 45 492 0 13521 0 21 768 0 640 0 0 0 0 02 2 4 16 0 52 2 4 16 0 42 2 4 16 0 4
A-104

APPENDIX A: 2005 EMISSIONS AND ALLOWANCE HOLDINGS OF NOx BUDGET SOURCES
BANKED 1 FOR 1 BANKED 2 FOR 1 TOTAL BANKEDTOTAL
DEDUCTED
2004 EARLY REDUCTION CREDIT
ALLOWANCES TERMINATED
REMAINING ALLOWANCES
(INCLUDES 2003-2005)2 4 6 18 0 20 0 0 0 0 140 1 1 1 0 00 0 0 0 0 00 1 1 1 0 00 1 1 1 0 00 0 0 341 0 00 0 0 17 0 00 0 0 19 0 00 0 0 20 0 00 0 0 21 0 00 0 0 0 0 13
01 0 1 346 0 31 0 1 333 0 41 0 1 333 0 41 0 1 336 0 4
250 0 250 1,104 0 7510 0 0 0 0 06 0 6 55 0 177 0 7 36 0 203 0 3 3 0 110 0 0 0 0 00 0 0 0 0 0
13 37 50 215 0 00 0 0 57 0 00 0 0 4 0 00 0 0 842 0 00 0 0 906 0 00 0 0 28 0 00 0 0 21 0 02 0 2 2 0 220 0 0 0 0 0
101 0 101 944 0 30470 0 70 1,125 0 2510 0 0 0 0 00 0 0 0 0 00 0 0 0 0 00 0 0 0 0 00 0 0 0 0 09 22 31 952 0 40 0 0 0 0 00 0 0 0 0 00 0 0 0 0 00 0 0 0 0 0
A-105

APPENDIX A: 2005 EMISSIONS AND ALLOWANCE HOLDINGS OF NOx BUDGET SOURCES
BANKED 1 FOR 1 BANKED 2 FOR 1 TOTAL BANKEDTOTAL
DEDUCTED
2004 EARLY REDUCTION CREDIT
ALLOWANCES TERMINATED
REMAINING ALLOWANCES
(INCLUDES 2003-2005)0 0 0 0 0 00 0 0 0 0 00 0 0 0 0 00 0 0 0 0 0
179 0 179 1,078 0 5600 0 0 36 0 140 0 0 27 0 170 0 0 24 0 200 0 0 3 0 640 0 0 3 0 590 0 0 28 0 260 0 0 33 0 240 0 0 30 0 150 0 0 0 0 00 0 0 329 0 00 0 0 518 0 00 0 0 0 0 130 0 0 0 0 00 0 0 0 0 00 0 0 0 0 00 0 0 0 0 00 0 0 0 0 0
170 0 170 1,235 0 5510
0 0 0 0 0 00 0 0 0 0 0
00 0 0 0 0 00 0 0 0 0 00 0 0 665 0 330 0 0 0 0 00 0 0 0 0 00 0 0 0 0 00 0 0 0 0 00 0 0 0 0 00 0 0 0 0 0
170 0 170 907 0 5540
0 0 0 0 0 00 0 0 0 0 00 0 0 0 0 00 0 0 0 0 00 0 0 0 0 00 0 0 0 0 00 0 0 0 0 0
A-106

APPENDIX A: 2005 EMISSIONS AND ALLOWANCE HOLDINGS OF NOx BUDGET SOURCES
BANKED 1 FOR 1 BANKED 2 FOR 1 TOTAL BANKEDTOTAL
DEDUCTED
2004 EARLY REDUCTION CREDIT
ALLOWANCES TERMINATED
REMAINING ALLOWANCES
(INCLUDES 2003-2005)0 0 0 0 0 0
170 0 170 2,792 0 5530
1 0 1 154 0 20 0 0 152 0 00 0 0 0 0 03 0 3 427 0 250 0 0 34 0 70 0 0 0 0 0
00 0 0 565 0 01 3 4 397 0 00 0 0 1,597 0 00 0 0 8 0 00 0 0 4 0 0
73 192 265 265 0 280 0 0 410 0 00 0 0 542 0 00 0 0 1,066 0 00 0 0 2 0 00 0 0 2 0 00 0 0 2 0 00 0 0 16 0 00 0 0 16 0 00 0 0 12 0 00 0 0 10 0 01 0 1 1 0 230 0 0 0 0 00 0 0 0 0 00 0 0 0 0 00 0 0 0 0 00 0 0 0 0 00 0 0 0 0 00 0 0 0 0 00 0 0 0 0 00 0 0 0 0 00 0 0 0 0 00 0 0 0 0 00 0 0 0 0 00 0 0 0 0 00 0 0 0 0 00 0 0 0 0 00 0 0 0 0 01 0 1 21 0 24
0
A-107

APPENDIX A: 2005 EMISSIONS AND ALLOWANCE HOLDINGS OF NOx BUDGET SOURCES
BANKED 1 FOR 1 BANKED 2 FOR 1 TOTAL BANKEDTOTAL
DEDUCTED
2004 EARLY REDUCTION CREDIT
ALLOWANCES TERMINATED
REMAINING ALLOWANCES
(INCLUDES 2003-2005)0 0 0 0 0 00 0 0 0 0 00 0 0 3 0 00 0 0 0 0 00 0 0 0 0 00 0 0 0 0 00 0 0 0 0 0
169 0 169 6,016 0 5510
0 0 0 278 0 00 0 0 278 0 01 0 1 1 0 9
03 9 12 12 0 00 0 0 0 0 00 0 0 0 0 00 0 0 261 0 9
00 0 0 0 0 00 0 0 0 0 00 0 0 0 0 0
00 0 0 0 0 00 0 0 0 0 00 0 0 0 0 00 0 0 638 0 170 0 0 19 0 00 0 0 18 0 00 0 0 18 0 00 0 0 19 0 00 0 0 13 0 00 0 0 12 0 00 0 0 14 0 00 0 0 0 0 130 0 0 0 0 00 0 0 0 0 00 0 0 0 0 00 0 0 0 0 00 0 0 0 0 00 0 0 0 0 00 0 0 0 0 00 0 0 0 0 0
167 0 167 1,172 0 5530 0 0 3 0 550 0 0 3 0 51
A-108

APPENDIX A: 2005 EMISSIONS AND ALLOWANCE HOLDINGS OF NOx BUDGET SOURCES
BANKED 1 FOR 1 BANKED 2 FOR 1 TOTAL BANKEDTOTAL
DEDUCTED
2004 EARLY REDUCTION CREDIT
ALLOWANCES TERMINATED
REMAINING ALLOWANCES
(INCLUDES 2003-2005)0 0 0 4 0 440 0 0 2 0 450 0 0 3 0 490 0 0 0 0 05 0 5 37 0 153 0 3 24 0 90 0 0 0 0 00 0 0 3 0 00 0 0 3 0 00 0 0 3 0 00 0 0 60 0 00 0 0 67 0 0
22 64 86 86 0 30 0 0 448 0 00 0 0 672 0 0
00 0 0 344 0 00 0 0 343 0 1
00 0 0 366 0 00 0 0 365 0 10 0 0 0 0 250 0 0 0 0 00 0 0 0 0 00 0 0 0 0 00 0 0 0 0 00 0 0 0 0 00 0 0 0 0 00 0 0 0 0 00 0 0 0 0 00 0 0 293 0 93
00 0 0 451 0 00 0 0 451 0 00 0 0 473 0 00 0 0 3 0 00 0 0 3 0 00 0 0 3 0 00 0 0 3 0 00 0 0 0 0 220 0 0 649 0 160 0 0 127 0 00 0 0 133 0 00 0 0 65 0 00 0 0 0 0 35
A-109

APPENDIX A: 2005 EMISSIONS AND ALLOWANCE HOLDINGS OF NOx BUDGET SOURCES
BANKED 1 FOR 1 BANKED 2 FOR 1 TOTAL BANKEDTOTAL
DEDUCTED
2004 EARLY REDUCTION CREDIT
ALLOWANCES TERMINATED
REMAINING ALLOWANCES
(INCLUDES 2003-2005)0 0 0 590 0 00 0 0 4 0 00 0 0 0 0 300 0 0 28 0 00 0 0 17 0 00 0 0 28 0 0
14 0 14 897 0 1200 0 0 898 0 107
31 80 111 149 0 150 0 0 1 0 00 0 0 1 0 10 0 0 10 0 60 0 0 10 0 60 0 0 11 0 6
16 0 16 45 0 510 0 0 45 0 10 0 0 28 0 10 0 0 24 0 520 0 0 32 0 30 0 0 29 0 20 0 0 13 0 00 0 0 14 0 00 0 0 4 0 00 0 0 8 0 00 0 0 8 0 00 0 0 8 0 00 0 0 8 0 00 0 0 3 0 00 0 0 24 0 10 0 0 21 0 00 0 0 21 0 10 0 0 27 0 10 0 0 11 0 00 0 0 12 0 00 0 0 10 0 00 0 0 13 0 00 0 0 12 0 10 0 0 7 0 20 0 0 7 0 50 0 0 31 0 74 4 8 51 0 7
10 22 32 75 0 60 0 0 348 0 300 0 0 338 0 301 0 1 7 0 3
A-110

APPENDIX A: 2005 EMISSIONS AND ALLOWANCE HOLDINGS OF NOx BUDGET SOURCES
BANKED 1 FOR 1 BANKED 2 FOR 1 TOTAL BANKEDTOTAL
DEDUCTED
2004 EARLY REDUCTION CREDIT
ALLOWANCES TERMINATED
REMAINING ALLOWANCES
(INCLUDES 2003-2005)2 0 2 8 0 52 0 2 9 0 44 6 10 17 0 44 0 4 104 0 140 0 0 428 0 380 0 0 27 0 560 0 0 49 0 140 0 0 20 0 00 0 0 17 0 00 0 0 14 0 10 0 0 12 0 00 0 0 4 0 10 0 0 4 0 10 0 0 5 0 00 0 0 4 0 00 0 0 9 0 10 0 0 9 0 10 0 0 10 0 00 0 0 11 0 00 0 0 26 0 00 0 0 24 0 10 0 0 26 0 00 0 0 22 0 00 0 0 48 0 10 0 0 43 0 10 0 0 46 0 10 0 0 48 0 00 0 0 49 0 10 0 0 27 0 00 0 0 45 0 00 0 0 45 0 00 0 0 15 0 00 0 0 16 0 120 0 0 6 0 10 0 0 24 0 20 0 0 22 0 20 0 0 23 0 20 0 0 21 0 20 0 0 12 0 20 0 0 1 0 10 0 0 1 0 10 0 0 1 0 10 0 0 1 0 10 0 0 2 0 10 0 0 2 0 1
A-111

APPENDIX A: 2005 EMISSIONS AND ALLOWANCE HOLDINGS OF NOx BUDGET SOURCES
BANKED 1 FOR 1 BANKED 2 FOR 1 TOTAL BANKEDTOTAL
DEDUCTED
2004 EARLY REDUCTION CREDIT
ALLOWANCES TERMINATED
REMAINING ALLOWANCES
(INCLUDES 2003-2005)0 0 0 2 0 10 0 0 2 0 10 0 0 3 0 10 0 0 3 0 10 0 0 3 0 10 0 0 2 0 12 0 2 2 0 6
59 0 59 144 0 18012 26 38 202 0 8
192 512 704 3,669 0 630 0 0 0 0 00 0 0 8 0 00 0 0 8 0 00 0 0 9 0 00 0 0 7 0 00 0 0 8 0 00 0 0 43 0 10 0 0 42 0 04 10 14 19 0 175 8 13 17 0 250 0 0 11 0 00 0 0 39 0 140 0 0 38 0 200 0 0 37 0 160 0 0 35 0 210 0 0 38 0 180 0 0 3 0 20 0 0 5 0 00 0 0 4 0 11 1 2 6 0 00 0 0 58 0 00 0 0 31 0 00 0 0 30 0 00 0 0 5 0 10 0 0 0 0 00 0 0 567 0 570 0 0 345 0 150 0 0 349 0 160 0 0 3 0 01 0 1 16 0 35 8 13 21 0 56 12 18 25 0 41 0 1 32 0 31 2 3 5 0 21 0 1 5 0 3
A-112

APPENDIX A: 2005 EMISSIONS AND ALLOWANCE HOLDINGS OF NOx BUDGET SOURCES
BANKED 1 FOR 1 BANKED 2 FOR 1 TOTAL BANKEDTOTAL
DEDUCTED
2004 EARLY REDUCTION CREDIT
ALLOWANCES TERMINATED
REMAINING ALLOWANCES
(INCLUDES 2003-2005)1 0 1 6 0 30 0 0 1 0 00 0 0 12 0 30 0 0 12 0 40 0 0 2 0 40 0 0 72 0 140 0 0 77 0 120 0 0 7 0 00 0 0 11 0 00 0 0 14 0 32 2 4 42 0 50 0 0 1 0 10 0 0 1 0 10 0 0 2 0 10 0 0 5 0 10 0 0 0 0 10 0 0 12 0 30 0 0 59 0 20 0 0 121 0 10 0 0 134 0 40 0 0 6 0 03 2 5 25 0 70 0 0 17 0 40 0 0 12 0 50 0 0 0 0 00 0 0 1 0 00 0 0 0 0 00 0 0 0 0 00 0 0 28 0 122 7 9 25 0 256 17 23 137 0 271 1 2 19 0 271 1 2 19 0 270 0 0 8 0 00 0 0 8 0 10 0 0 6 0 20 0 0 0 0 10 0 0 6 0 12 0 2 25 0 60 0 0 2 0 00 0 0 2 0 00 0 0 0 0 0
03 7 10 10 0 00 0 0 37 0 0
A-113

APPENDIX A: 2005 EMISSIONS AND ALLOWANCE HOLDINGS OF NOx BUDGET SOURCES
BANKED 1 FOR 1 BANKED 2 FOR 1 TOTAL BANKEDTOTAL
DEDUCTED
2004 EARLY REDUCTION CREDIT
ALLOWANCES TERMINATED
REMAINING ALLOWANCES
(INCLUDES 2003-2005)0 0 0 12 0 00 0 0 8 0 00 0 0 10 0 01 3 4 4 0 00 0 0 142 0 141
016 46 62 62 0 033 72 105 105 0 2719 58 77 77 0 00 0 0 1 0 00 0 0 0 0 00 0 0 56 0 482
00 0 0 234 0 00 0 0 744 0 00 0 0 0 0 0
00 0 0 0 0 00 0 0 440 0 00 0 0 465 0 00 0 0 0 0 0
00 0 0 0 0 10 0 0 0 0 1
00 0 0 0 0 00 0 0 0 0 00 0 0 0 0 0
00 0 0 0 0 10 0 0 0 0 1
00 0 0 0 0 10 0 0 0 0 10 0 0 0 0 00 0 0 1,216 0 2
00 0 0 0 0 00 0 0 0 0 00 0 0 659 0 00 0 0 0 0 00 1 1 6 0 10 0 0 2 0 00 0 0 0 0 00 0 0 9 0 0
A-114

APPENDIX A: 2005 EMISSIONS AND ALLOWANCE HOLDINGS OF NOx BUDGET SOURCES
BANKED 1 FOR 1 BANKED 2 FOR 1 TOTAL BANKEDTOTAL
DEDUCTED
2004 EARLY REDUCTION CREDIT
ALLOWANCES TERMINATED
REMAINING ALLOWANCES
(INCLUDES 2003-2005)0 0 0 1 0 12
00 0 0 0 0 00 0 0 0 0 00 0 0 2 0 07 0 7 365 0 380 0 0 0 0 00 0 0 0 0 00 0 0 0 0 00 0 0 0 0 00 0 0 0 0 00 0 0 0 0 00 0 0 0 0 00 0 0 0 0 00 0 0 12 0 00 0 0 0 0 00 0 0 14 0 00 0 0 0 0 00 0 0 10 0 00 0 0 0 0 00 0 0 10 0 00 0 0 0 0 00 0 0 9 0 00 0 0 0 0 00 0 0 8 0 00 0 0 0 0 00 0 0 9 0 00 0 0 0 0 00 0 0 5 0 00 0 0 0 0 00 0 0 14 0 00 0 0 0 0 00 0 0 14 0 00 0 0 0 0 00 0 0 15 0 00 0 0 0 0 00 0 0 15 0 00 0 0 0 0 00 0 0 987 0 820 0 0 81 0 00 0 0 513 0 0
00 0 0 538 0 0
37 109 146 595 0 00 0 0 0 0 0
A-115

APPENDIX A: 2005 EMISSIONS AND ALLOWANCE HOLDINGS OF NOx BUDGET SOURCES
BANKED 1 FOR 1 BANKED 2 FOR 1 TOTAL BANKEDTOTAL
DEDUCTED
2004 EARLY REDUCTION CREDIT
ALLOWANCES TERMINATED
REMAINING ALLOWANCES
(INCLUDES 2003-2005)0 0 0 0 0 150 0 0 8 0 00 0 0 25 0 00 0 0 25 0 00 0 0 0 0 01 1 2 25 0 20 0 0 3 0 60 0 0 2 0 130 0 0 0 0 00 0 0 0 0 00 0 0 0 0 00 0 0 0 0 00 0 0 0 0 00 0 0 11 0 10 0 0 11 0 10 0 0 18 0 00 0 0 0 0 840 0 0 17 0 1270 0 0 18 0 1010 0 0 3 0 40 0 0 12 0 220 0 0 0 0 00 0 0 10 0 62
01 1 2 3 0 01 1 2 3 0 00 1 1 2 0 00 0 0 141 0 120 0 0 502 0 00 0 0 331 0 00 0 0 0 0 100 0 0 2 0 00 0 0 0 0 00 0 0 0 0 00 0 0 26 0 90 0 0 3 0 20 0 0 3 0 00 0 0 0 0 42 6 8 9 0 40 0 0 905 0 60 0 0 0 0 00 0 0 0 0 0
00 0 0 0 0 00 0 0 0 0 0
A-116

APPENDIX A: 2005 EMISSIONS AND ALLOWANCE HOLDINGS OF NOx BUDGET SOURCES
BANKED 1 FOR 1 BANKED 2 FOR 1 TOTAL BANKEDTOTAL
DEDUCTED
2004 EARLY REDUCTION CREDIT
ALLOWANCES TERMINATED
REMAINING ALLOWANCES
(INCLUDES 2003-2005)0 0 0 1,364 0 690 0 0 93 0 00 0 0 49 0 00 0 0 421 0 00 0 0 809 0 0
95 0 95 95 0 2850 0 0 1,070 0 00 0 0 880 0 00 0 0 0 0 220 0 0 281 0 290 0 0 190 0 1270 0 0 8 0 00 0 0 8 0 00 0 0 6 0 00 0 0 7 0 00 0 0 8 0 00 0 0 8 0 00 0 0 8 0 00 0 0 8 0 00 0 0 18 0 00 0 0 18 0 00 0 0 14 0 00 0 0 14 0 00 0 0 15 0 00 0 0 15 0 00 0 0 12 0 00 0 0 12 0 0
43 0 43 51 0 1420 0 0 24 0 50 0 0 20 0 420 0 0 22 0 40
87 262 349 349 0 083 220 303 303 0 280 0 0 4 0 532
00 0 0 97 0 20 0 0 98 0 20 0 0 469 0 20 0 0 0 0 20 0 0 450 0 20 0 0 366 0 20 0 0 245 0 20 0 0 330 0 20 0 0 0 0 01 4 5 28 0 69
A-117

APPENDIX A: 2005 EMISSIONS AND ALLOWANCE HOLDINGS OF NOx BUDGET SOURCES
BANKED 1 FOR 1 BANKED 2 FOR 1 TOTAL BANKEDTOTAL
DEDUCTED
2004 EARLY REDUCTION CREDIT
ALLOWANCES TERMINATED
REMAINING ALLOWANCES
(INCLUDES 2003-2005)0 0 0 3 0 10 0 0 79 0 1271 2 3 31 0 20 0 0 3 0 80 0 0 0 0 260 0 0 25 0 50 0 0 39 0 40 0 0 38 0 60 0 0 10 0 00 0 0 9 0 00 0 0 34 0 190 0 0 0 0 30 0 0 2 0 140 0 0 2 0 140 0 0 0 0 20 0 0 39 0 00 0 0 39 0 00 0 0 39 0 00 0 0 42 0 00 0 0 40 0 00 0 0 39 0 00 0 0 40 0 00 0 0 34 0 00 0 0 29 0 00 0 0 27 0 00 0 0 21 0 00 0 0 31 0 00 0 0 30 0 00 0 0 27 0 00 0 0 26 0 00 0 0 29 0 00 0 0 19 0 00 0 0 17 0 00 0 0 17 0 00 0 0 18 0 00 0 0 19 0 10 0 0 18 0 00 0 0 17 0 00 0 0 19 0 00 0 0 21 0 00 0 0 20 0 00 0 0 21 0 00 0 0 21 0 00 0 0 19 0 00 0 0 20 0 0
A-118

APPENDIX A: 2005 EMISSIONS AND ALLOWANCE HOLDINGS OF NOx BUDGET SOURCES
BANKED 1 FOR 1 BANKED 2 FOR 1 TOTAL BANKEDTOTAL
DEDUCTED
2004 EARLY REDUCTION CREDIT
ALLOWANCES TERMINATED
REMAINING ALLOWANCES
(INCLUDES 2003-2005)0 0 0 22 0 00 0 0 21 0 00 0 0 0 0 300 0 0 2 0 30 0 0 2 0 10 0 0 0 0 00 0 0 6 0 160 0 0 2 0 00 0 0 2 0 00 0 0 0 0 00 0 0 3 0 10 0 0 10 0 30 0 0 10 0 30 0 0 19 0 50 0 0 19 0 50 0 0 16 0 00 0 0 16 0 00 0 0 19 0 100 0 0 19 0 100 0 0 19 0 100 0 0 19 0 100 0 0 18 0 00 0 0 18 0 00 0 0 21 0 00 0 0 21 0 00 0 0 15 0 120 0 0 15 0 120 0 0 20 0 00 0 0 20 0 00 0 0 22 0 30 0 0 22 0 38 0 8 50 0 77
00 0 0 44 0 10 0 0 44 0 10 0 0 44 0 10 0 0 45 0 00 0 0 0 0 60 0 0 5 0 10 0 0 6 0 20 0 0 0 0 164
00 0 0 0 0 00 0 0 0 0 0
29 0 29 1,188 0 88
A-119
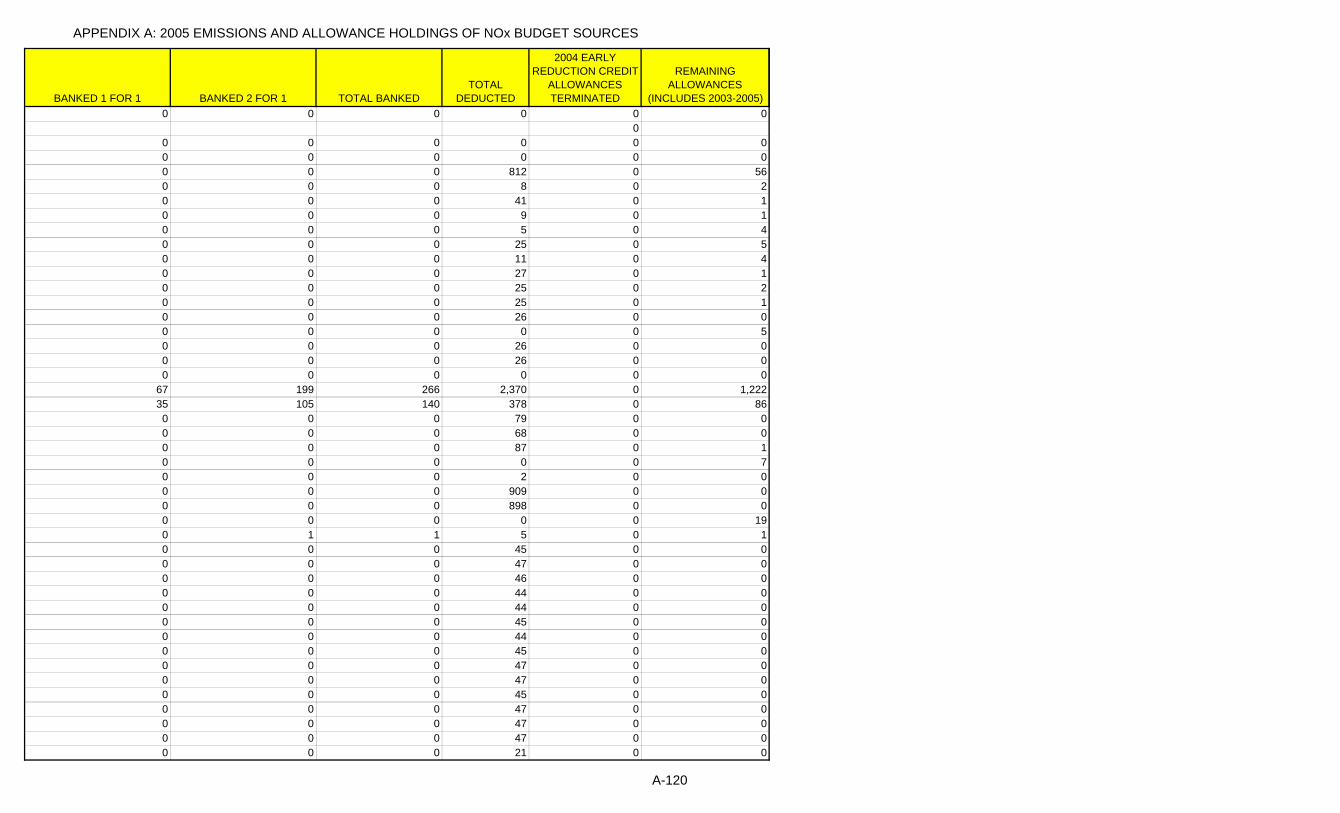
APPENDIX A: 2005 EMISSIONS AND ALLOWANCE HOLDINGS OF NOx BUDGET SOURCES
BANKED 1 FOR 1 BANKED 2 FOR 1 TOTAL BANKEDTOTAL
DEDUCTED
2004 EARLY REDUCTION CREDIT
ALLOWANCES TERMINATED
REMAINING ALLOWANCES
(INCLUDES 2003-2005)0 0 0 0 0 0
00 0 0 0 0 00 0 0 0 0 00 0 0 812 0 560 0 0 8 0 20 0 0 41 0 10 0 0 9 0 10 0 0 5 0 40 0 0 25 0 50 0 0 11 0 40 0 0 27 0 10 0 0 25 0 20 0 0 25 0 10 0 0 26 0 00 0 0 0 0 50 0 0 26 0 00 0 0 26 0 00 0 0 0 0 0
67 199 266 2,370 0 1,22235 105 140 378 0 860 0 0 79 0 00 0 0 68 0 00 0 0 87 0 10 0 0 0 0 70 0 0 2 0 00 0 0 909 0 00 0 0 898 0 00 0 0 0 0 190 1 1 5 0 10 0 0 45 0 00 0 0 47 0 00 0 0 46 0 00 0 0 44 0 00 0 0 44 0 00 0 0 45 0 00 0 0 44 0 00 0 0 45 0 00 0 0 47 0 00 0 0 47 0 00 0 0 45 0 00 0 0 47 0 00 0 0 47 0 00 0 0 47 0 00 0 0 21 0 0
A-120
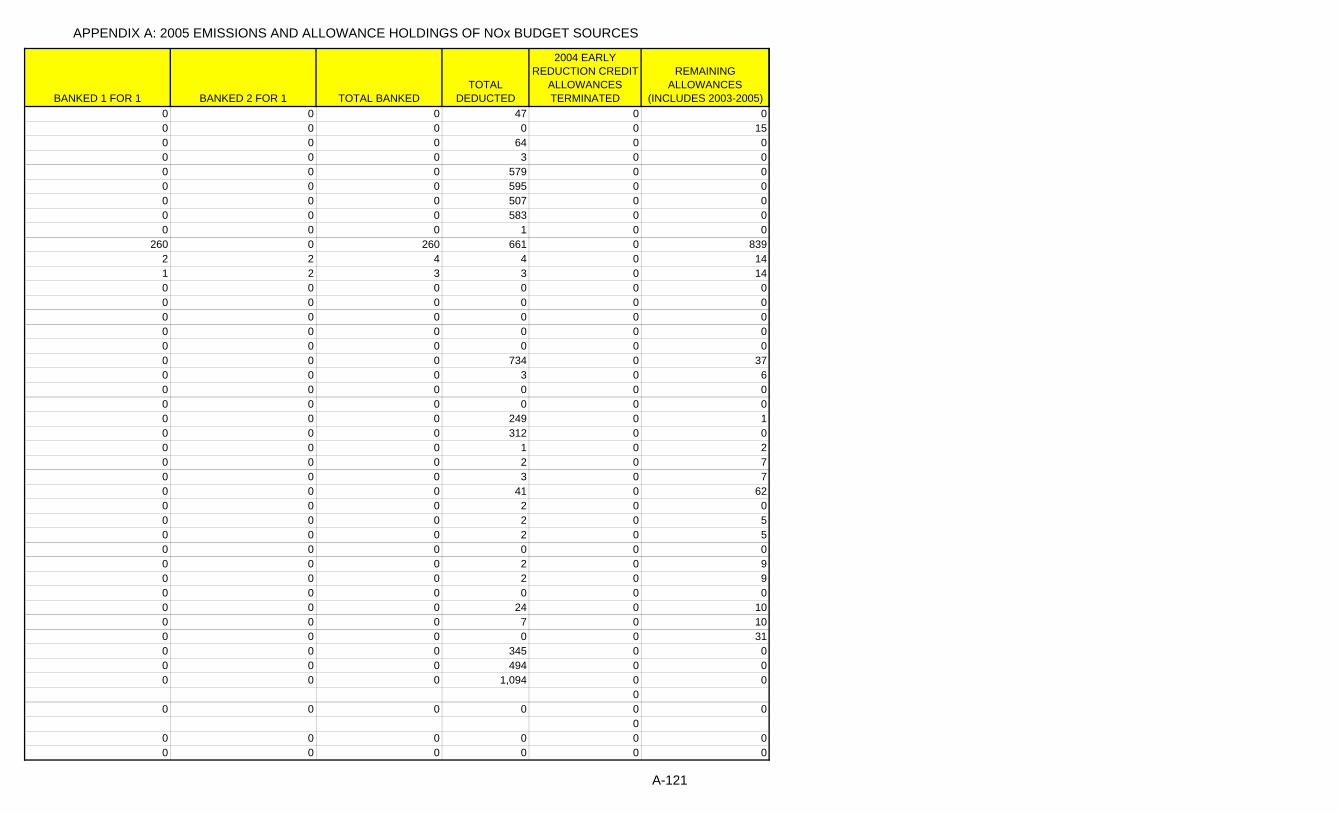
APPENDIX A: 2005 EMISSIONS AND ALLOWANCE HOLDINGS OF NOx BUDGET SOURCES
BANKED 1 FOR 1 BANKED 2 FOR 1 TOTAL BANKEDTOTAL
DEDUCTED
2004 EARLY REDUCTION CREDIT
ALLOWANCES TERMINATED
REMAINING ALLOWANCES
(INCLUDES 2003-2005)0 0 0 47 0 00 0 0 0 0 150 0 0 64 0 00 0 0 3 0 00 0 0 579 0 00 0 0 595 0 00 0 0 507 0 00 0 0 583 0 00 0 0 1 0 0
260 0 260 661 0 8392 2 4 4 0 141 2 3 3 0 140 0 0 0 0 00 0 0 0 0 00 0 0 0 0 00 0 0 0 0 00 0 0 0 0 00 0 0 734 0 370 0 0 3 0 60 0 0 0 0 00 0 0 0 0 00 0 0 249 0 10 0 0 312 0 00 0 0 1 0 20 0 0 2 0 70 0 0 3 0 70 0 0 41 0 620 0 0 2 0 00 0 0 2 0 50 0 0 2 0 50 0 0 0 0 00 0 0 2 0 90 0 0 2 0 90 0 0 0 0 00 0 0 24 0 100 0 0 7 0 100 0 0 0 0 310 0 0 345 0 00 0 0 494 0 00 0 0 1,094 0 0
00 0 0 0 0 0
00 0 0 0 0 00 0 0 0 0 0
A-121
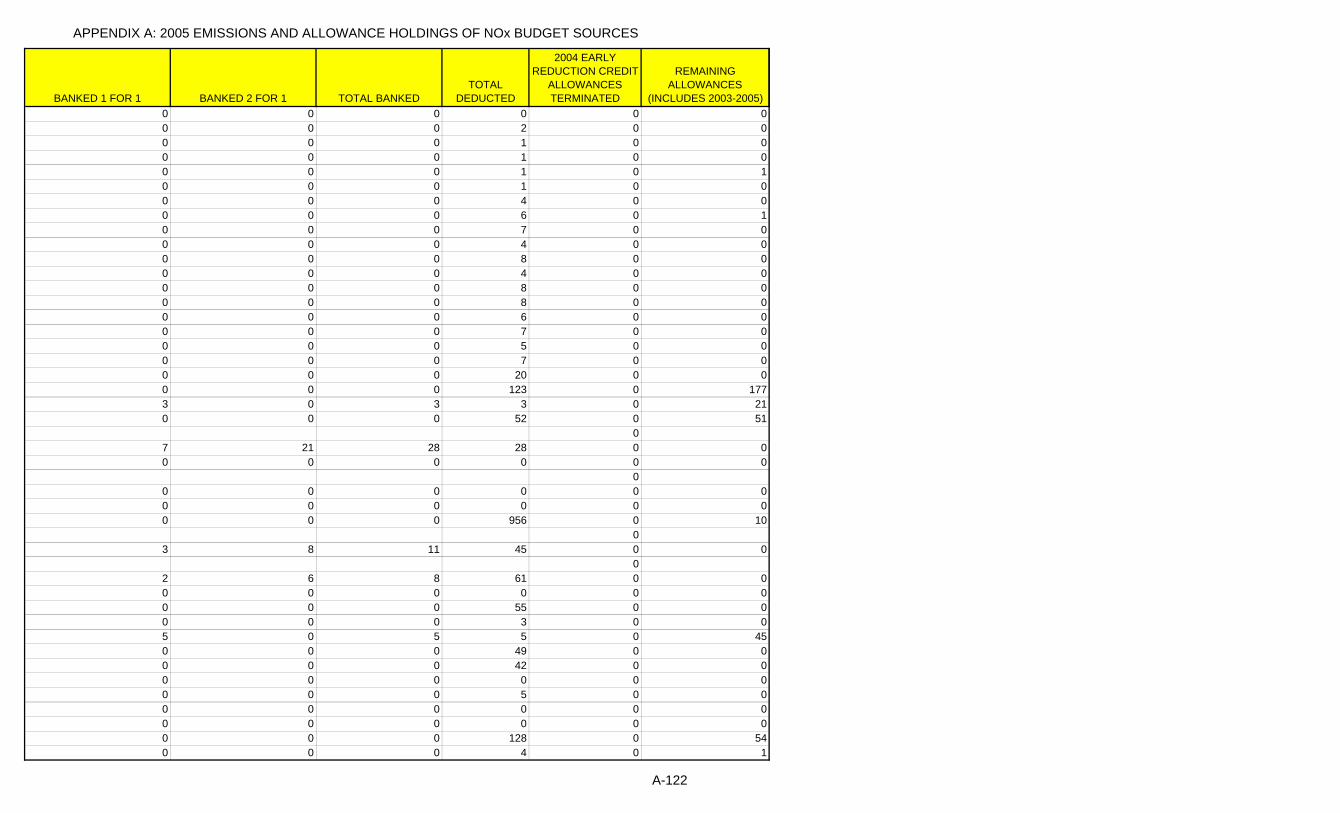
APPENDIX A: 2005 EMISSIONS AND ALLOWANCE HOLDINGS OF NOx BUDGET SOURCES
BANKED 1 FOR 1 BANKED 2 FOR 1 TOTAL BANKEDTOTAL
DEDUCTED
2004 EARLY REDUCTION CREDIT
ALLOWANCES TERMINATED
REMAINING ALLOWANCES
(INCLUDES 2003-2005)0 0 0 0 0 00 0 0 2 0 00 0 0 1 0 00 0 0 1 0 00 0 0 1 0 10 0 0 1 0 00 0 0 4 0 00 0 0 6 0 10 0 0 7 0 00 0 0 4 0 00 0 0 8 0 00 0 0 4 0 00 0 0 8 0 00 0 0 8 0 00 0 0 6 0 00 0 0 7 0 00 0 0 5 0 00 0 0 7 0 00 0 0 20 0 00 0 0 123 0 1773 0 3 3 0 210 0 0 52 0 51
07 21 28 28 0 00 0 0 0 0 0
00 0 0 0 0 00 0 0 0 0 00 0 0 956 0 10
03 8 11 45 0 0
02 6 8 61 0 00 0 0 0 0 00 0 0 55 0 00 0 0 3 0 05 0 5 5 0 450 0 0 49 0 00 0 0 42 0 00 0 0 0 0 00 0 0 5 0 00 0 0 0 0 00 0 0 0 0 00 0 0 128 0 540 0 0 4 0 1
A-122

APPENDIX A: 2005 EMISSIONS AND ALLOWANCE HOLDINGS OF NOx BUDGET SOURCES
BANKED 1 FOR 1 BANKED 2 FOR 1 TOTAL BANKEDTOTAL
DEDUCTED
2004 EARLY REDUCTION CREDIT
ALLOWANCES TERMINATED
REMAINING ALLOWANCES
(INCLUDES 2003-2005)3 8 11 16 0 73 9 12 868 0 6910 1 1 22 0 04 0 4 178 0 212 6 8 113 0 4
020 60 80 84 0 00 0 0 47 0 00 0 0 77 0 00 0 0 73 0 00 0 0 74 0 00 0 0 0 0 120 0 0 2 0 00 0 0 2 0 00 0 0 0 0 00 0 0 47 0 00 0 0 45 0 01 0 1 43 0 40 0 0 12 0 20 0 0 2 0 60 0 0 11 0 90 0 0 7 0 140 0 0 1 0 30 0 0 0 0 5
14 43 57 165 0 240 0 0 35 0 10 0 0 29 0 20 0 0 23 0 30 0 0 42 0 40 0 0 0 0 00 0 0 15 0 10 0 0 15 0 10 0 0 16 0 00 0 0 525 0 00 0 0 0 0 420 0 0 317 0 00 0 0 2,375 0 00 0 0 8 0 00 0 0 0 0 150 0 0 244 0 0
00 0 0 865 0 00 0 0 537 0 00 0 0 1,098 0 11 0 1 1 0 99
A-123

APPENDIX A: 2005 EMISSIONS AND ALLOWANCE HOLDINGS OF NOx BUDGET SOURCES
BANKED 1 FOR 1 BANKED 2 FOR 1 TOTAL BANKEDTOTAL
DEDUCTED
2004 EARLY REDUCTION CREDIT
ALLOWANCES TERMINATED
REMAINING ALLOWANCES
(INCLUDES 2003-2005)1 1 2 2 0 01 4 5 5 0 00 0 0 131 0 50 0 0 348 0 70 0 0 375 0 2070 0 0 318 0 2000 0 0 3 0 20 0 0 0 0 09 0 9 248 0 340 0 0 0 0 20 0 0 0 0 00 0 0 0 0 00 0 0 180 0 00 0 0 440 0 10 0 0 0 0 00 0 0 326 0 0
00 0 0 0 0 220 0 0 0 0 290 0 0 649 0 390 0 0 2,192 0 449
00 0 0 1,323 0 980 0 0 956 0 900 0 0 0 0 00 0 0 22 0 10 0 0 21 0 20 0 0 21 0 20 0 0 22 0 10 0 0 22 0 10 0 0 22 0 10 0 0 0 0 240 0 0 1 0 20 0 0 450 0 00 0 0 359 0 00 0 0 339 0 05 14 19 637 0 0
13 37 50 2,908 0 00 0 0 1 0 0
94 172 266 266 0 1100 0 0 22 0 00 0 0 20 0 00 0 0 0 0 160 0 0 0 0 00 0 0 0 0 0
A-124

APPENDIX A: 2005 EMISSIONS AND ALLOWANCE HOLDINGS OF NOx BUDGET SOURCES
BANKED 1 FOR 1 BANKED 2 FOR 1 TOTAL BANKEDTOTAL
DEDUCTED
2004 EARLY REDUCTION CREDIT
ALLOWANCES TERMINATED
REMAINING ALLOWANCES
(INCLUDES 2003-2005)0 0 0 61 0 12 0 2 2 0 500 0 0 1,132 0 490 0 0 1,127 0 580 0 0 0 0 10 0 0 0 0 10 0 0 0 0 00 0 0 0 0 00 0 0 0 0 0
20 34 54 310 0 240 0 0 7 0 00 0 0 7 0 00 0 0 7 0 00 0 0 7 0 00 0 0 7 0 00 0 0 7 0 00 0 0 7 0 00 0 0 7 0 07 0 7 7 0 530 0 0 0 0 00 0 0 0 0 00 0 0 402 0 00 0 0 18 0 10 0 0 14 0 00 0 0 19 0 00 0 0 19 0 00 0 0 0 0 00 0 0 17 0 00 0 0 0 0 00 0 0 22 0 00 0 0 0 0 00 0 0 14 0 00 0 0 0 0 0
13 0 13 13 0 380 0 0 0 0 00 0 0 0 0 00 0 0 0 0 00 0 0 0 0 00 0 0 0 0 00 0 0 3,148 0 2480 0 0 639 0 52
048 0 48 245 0 49548 0 48 245 0 49548 0 48 245 0 503
A-125

APPENDIX A: 2005 EMISSIONS AND ALLOWANCE HOLDINGS OF NOx BUDGET SOURCES
BANKED 1 FOR 1 BANKED 2 FOR 1 TOTAL BANKEDTOTAL
DEDUCTED
2004 EARLY REDUCTION CREDIT
ALLOWANCES TERMINATED
REMAINING ALLOWANCES
(INCLUDES 2003-2005)49 0 49 245 0 48847 0 47 243 0 4790 0 0 0 0 0
173 498 671 968 0 190 0 0 8 0 00 0 0 9 0 0
30 68 98 98 0 210 0 0 50 0 20 0 0 52 0 00 0 0 52 0 00 0 0 51 0 10 0 0 49 0 30 0 0 48 0 30 0 0 48 0 30 0 0 49 0 20 0 0 0 0 16
0100 0 100 500 0 30373 0 73 362 0 22380 0 80 398 0 244
100 0 100 499 0 305100 0 100 499 0 304
0 0 0 0 0 00
0 0 0 738 0 150 0 0 488 0 100 0 0 627 0 150 0 0 577 0 120 0 0 509 0 940 0 0 2 0 10 0 0 0 0 00 0 0 0 0 10 0 0 0 0 10 0 0 0 0 0
00 0 0 663 0 00 0 0 396 0 00 0 0 1 0 10 0 0 0 0 10
00 0 0 0 0 00 0 0 0 0 0
00 0 0 0 0 00 0 0 0 0 0
A-126

APPENDIX A: 2005 EMISSIONS AND ALLOWANCE HOLDINGS OF NOx BUDGET SOURCES
BANKED 1 FOR 1 BANKED 2 FOR 1 TOTAL BANKEDTOTAL
DEDUCTED
2004 EARLY REDUCTION CREDIT
ALLOWANCES TERMINATED
REMAINING ALLOWANCES
(INCLUDES 2003-2005)0
0 0 0 0 0 00 0 0 0 0 00 0 0 0 0 0
575 0 575 1,192 0 1,7970 0 0 38 0 00 0 0 37 0 10 0 0 286 0 1440 0 0 29 0 30 0 0 0 0 00 0 0 205 0 580 0 0 0 0 0
00 0 0 65 0 00 0 0 44 0 00 0 0 787 0 00 0 0 880 0 21 0 1 1 0 623 4 7 19 0 3
02 6 8 230 0 872 5 7 230 0 42 5 7 230 0 42 5 7 231 0 50 0 0 0 0 00 0 0 23 0 00 0 0 22 0 00 0 0 22 0 0
23 18 41 41 0 490 0 0 45 0 20 0 0 45 0 20 0 0 45 0 30 0 0 0 0 00 0 0 28 0 00 0 0 28 0 00 0 0 28 0 00 0 0 27 0 00 0 0 27 0 00 0 0 0 0 00 0 0 147 0 00 0 0 0 0 00 0 0 0 0 00 0 0 0 0 00 0 0 0 0 00 0 0 23 0 4
A-127

APPENDIX A: 2005 EMISSIONS AND ALLOWANCE HOLDINGS OF NOx BUDGET SOURCES
BANKED 1 FOR 1 BANKED 2 FOR 1 TOTAL BANKEDTOTAL
DEDUCTED
2004 EARLY REDUCTION CREDIT
ALLOWANCES TERMINATED
REMAINING ALLOWANCES
(INCLUDES 2003-2005)0 0 0 2 0 170 0 0 163 0 30 0 0 163 0 30 0 0 163 0 30 0 0 162 0 30 0 0 0 0 00 0 0 12 0 23 2 5 39 0 82 0 2 36 0 60 0 0 34 0 00 0 0 33 0 00 0 0 0 0 1
00 0 0 722 0 00 0 0 724 0 0
00 0 0 1,123 0 00 0 0 632 0 10 0 0 1,131 0 00 0 0 2,232 0 00 0 0 2,963 0 01 0 1 1 0 353
288 0 288 1,174 0 8680 0 0 2 0 00 0 0 1 0 00 0 0 0 0 4
120 0 120 598 0 364122 0 122 611 0 370140 0 140 703 0 424155 0 155 777 0 469159 0 159 797 0 481335 0 335 1,337 0 1,009
0 0 0 6 0 00 0 0 8 0 00 0 0 12 0 00 0 0 16 0 00 0 0 0 0 80 0 0 27 0 00 0 0 28 0 00 0 0 0 0 00 0 0 24 0 20 0 0 25 0 10 0 0 23 0 20 0 0 0 0 00 0 0 0 0 0
A-128

APPENDIX A: 2005 EMISSIONS AND ALLOWANCE HOLDINGS OF NOx BUDGET SOURCES
BANKED 1 FOR 1 BANKED 2 FOR 1 TOTAL BANKEDTOTAL
DEDUCTED
2004 EARLY REDUCTION CREDIT
ALLOWANCES TERMINATED
REMAINING ALLOWANCES
(INCLUDES 2003-2005)0 0 0 1 0 00 0 0 22 0 09 0 9 230 0 280 0 0 63 0 80 0 0 66 0 50 0 0 66 0 50 0 0 67 0 40 0 0 67 0 30 0 0 0 0 00 0 0 0 0 0
46 78 124 124 0 590 0 0 2 0 00 0 0 2 0 00 0 0 16 0 00 0 0 2 0 00 0 0 15 0 00 0 0 1 0 10 0 0 0 0 120 0 0 283 0 03 10 13 226 0 00 0 0 278 0 00 0 0 104 0 00 0 0 0 0 80 0 0 27 0 40 0 0 29 0 70 0 0 0 0 06 10 16 16 0 86 8 14 14 0 100 0 0 0 0 58 18 26 26 0 68 16 24 24 0 80 0 0 0 0 67 14 21 21 0 77 12 19 19 0 90 0 0 0 0 60 0 0 18 0 00 0 0 81 0 140 0 0 87 0 80 0 0 89 0 60 0 0 86 0 90 0 0 0 0 00 0 0 640 0 00 0 0 627 0 00 0 0 0 0 40 0 0 0 0 131
A-129

APPENDIX A: 2005 EMISSIONS AND ALLOWANCE HOLDINGS OF NOx BUDGET SOURCES
BANKED 1 FOR 1 BANKED 2 FOR 1 TOTAL BANKEDTOTAL
DEDUCTED
2004 EARLY REDUCTION CREDIT
ALLOWANCES TERMINATED
REMAINING ALLOWANCES
(INCLUDES 2003-2005)3 10 13 22 0 03 8 11 20 0 23 8 11 20 0 22 6 8 17 0 12 4 6 15 0 32 6 8 17 0 10 0 0 0 0 90 0 0 1,008 0 00 0 0 1,099 0 00 0 0 948 0 00 0 0 0 0 603
00 0 0 1,095 0 00 0 0 1,099 0 0
1,292 0 1,292 2,647 0 3,8770 0 0 0 0 30 0 0 0 0 10 0 0 0 0 10 0 0 1 0 00 0 0 0 0 100 0 0 98 0 600 0 0 101 0 630 0 0 0 0 0
10 22 32 32 0 810 24 34 34 0 60 0 0 0 0 40 0 0 563 0 52 0 2 233 0 50 0 0 3,727 0 50 0 0 3,905 0 50 0 0 0 0 02 6 8 58 0 00 0 0 80 0 00 0 0 75 0 50 0 0 609 0 50 0 0 296 0 40 0 0 0 0 00 0 0 1 0 10 0 0 11 0 20 0 0 31 0 20 0 0 23 0 20 0 0 18 0 20 0 0 6 0 50 0 0 15 0 20 0 0 16 0 2
A-130
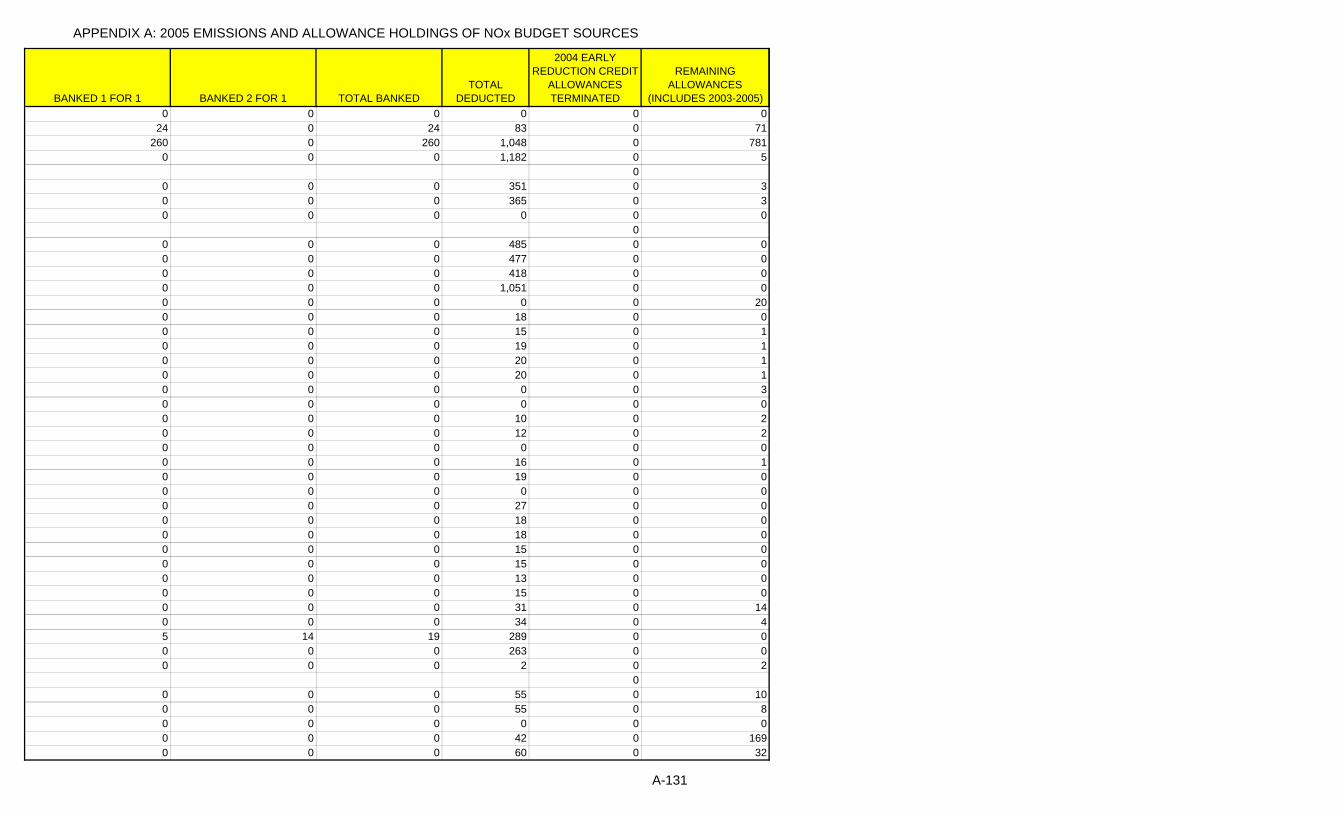
APPENDIX A: 2005 EMISSIONS AND ALLOWANCE HOLDINGS OF NOx BUDGET SOURCES
BANKED 1 FOR 1 BANKED 2 FOR 1 TOTAL BANKEDTOTAL
DEDUCTED
2004 EARLY REDUCTION CREDIT
ALLOWANCES TERMINATED
REMAINING ALLOWANCES
(INCLUDES 2003-2005)0 0 0 0 0 0
24 0 24 83 0 71260 0 260 1,048 0 781
0 0 0 1,182 0 50
0 0 0 351 0 30 0 0 365 0 30 0 0 0 0 0
00 0 0 485 0 00 0 0 477 0 00 0 0 418 0 00 0 0 1,051 0 00 0 0 0 0 200 0 0 18 0 00 0 0 15 0 10 0 0 19 0 10 0 0 20 0 10 0 0 20 0 10 0 0 0 0 30 0 0 0 0 00 0 0 10 0 20 0 0 12 0 20 0 0 0 0 00 0 0 16 0 10 0 0 19 0 00 0 0 0 0 00 0 0 27 0 00 0 0 18 0 00 0 0 18 0 00 0 0 15 0 00 0 0 15 0 00 0 0 13 0 00 0 0 15 0 00 0 0 31 0 140 0 0 34 0 45 14 19 289 0 00 0 0 263 0 00 0 0 2 0 2
00 0 0 55 0 100 0 0 55 0 80 0 0 0 0 00 0 0 42 0 1690 0 0 60 0 32
A-131

APPENDIX A: 2005 EMISSIONS AND ALLOWANCE HOLDINGS OF NOx BUDGET SOURCES
BANKED 1 FOR 1 BANKED 2 FOR 1 TOTAL BANKEDTOTAL
DEDUCTED
2004 EARLY REDUCTION CREDIT
ALLOWANCES TERMINATED
REMAINING ALLOWANCES
(INCLUDES 2003-2005)0 0 0 0 0 00 0 0 18 0 10 0 0 19 0 00 0 0 18 0 10 0 0 18 0 10 0 0 19 0 00 0 0 18 0 10 0 0 19 0 00 0 0 18 0 10 0 0 18 0 10 0 0 18 0 10 0 0 0 0 0
00 0 0 1,245 0 00 0 0 1,914 0 0
180 398 578 2,028 0 1420 0 0 0 0 40 0 0 696 0 00 0 0 913 0 00 0 0 714 0 00 0 0 0 0 3800 0 0 15 0 40 0 0 165 0 40 0 0 0 0 01 2 3 22 0 00 0 0 22 0 00 0 0 23 0 00 0 0 0 0 30 0 0 601 0 50 0 0 718 0 50 0 0 0 0 00 0 0 1 0 08 22 30 30 0 00 0 0 68 0 270 0 0 25 0 60 0 0 25 0 40 0 0 0 0 00 0 0 15 0 20 0 0 15 0 20 0 0 0 0 0
00 0 0 513 0 00 0 0 278 0 00 0 0 1,419 0 00 0 0 805 0 0
A-132

APPENDIX A: 2005 EMISSIONS AND ALLOWANCE HOLDINGS OF NOx BUDGET SOURCES
BANKED 1 FOR 1 BANKED 2 FOR 1 TOTAL BANKEDTOTAL
DEDUCTED
2004 EARLY REDUCTION CREDIT
ALLOWANCES TERMINATED
REMAINING ALLOWANCES
(INCLUDES 2003-2005)0 0 0 0 0 00 0 0 0 0 24 10 14 50 0 00 0 0 18 0 10 0 0 0 0 80 0 0 0 0 02 0 2 2 0 100 0 0 0 0 0
145 410 555 902 0 251 0 1 1 0 30 0 0 720 0 00 0 0 638 0 00 0 0 7 0 00 0 0 10 0 00 0 0 0 0 20 0 0 15 0 00 0 0 14 0 00 0 0 0 0 20 0 0 118 0 90 0 0 253 0 00 0 0 249 0 00 0 0 446 0 00 0 0 0 0 150 0 0 6 0 10 0 0 3 0 20 0 0 0 0 00 0 0 179 0 180 0 0 31 0 100 0 0 9 0 00 0 0 8 0 20 0 0 0 0 04 12 16 271 0 00 0 0 198 0 00 0 0 151 0 00 0 0 0 0 62 2 4 78 0 42 2 4 87 0 40 0 0 0 0 00 0 0 29 0 60 0 0 0 0 0
00 0 0 47 0 20 0 0 83 0 00 0 0 103 0 2
15 46 61 185 0 3
A-133

APPENDIX A: 2005 EMISSIONS AND ALLOWANCE HOLDINGS OF NOx BUDGET SOURCES
BANKED 1 FOR 1 BANKED 2 FOR 1 TOTAL BANKEDTOTAL
DEDUCTED
2004 EARLY REDUCTION CREDIT
ALLOWANCES TERMINATED
REMAINING ALLOWANCES
(INCLUDES 2003-2005)0 0 0 0 0 00 0 0 58 0 70 0 0 411 0 00 0 0 753 0 00 0 0 24 0 240 0 0 0 0 150 0 0 140 0 00 0 0 16 0 20 0 0 17 0 10 0 0 0 0 00 0 0 105 0 30 0 0 0 0 00 0 0 62 0 80 0 0 88 0 50 0 0 0 0 24
00 0 0 358 0 00 0 0 316 0 00 0 0 0 0 100 0 0 665 0 00 0 0 453 0 0
00 0 0 744 0 00 0 0 720 0 00 0 0 0 0 200 0 0 0 0 390 0 0 0 0 00 0 0 0 0 00 0 0 0 0 05 13 18 131 0 21 4 5 313 0 172 4 6 297 0 20
057 148 205 205 0 2346 126 172 172 0 10
042 120 162 162 0 91 2 3 116 0 60 0 0 0 0 500 0 0 62 0 26
00 0 0 262 0 00 0 0 240 0 00 0 0 261 0 00 0 0 0 0 15
A-134

APPENDIX A: 2005 EMISSIONS AND ALLOWANCE HOLDINGS OF NOx BUDGET SOURCES
BANKED 1 FOR 1 BANKED 2 FOR 1 TOTAL BANKEDTOTAL
DEDUCTED
2004 EARLY REDUCTION CREDIT
ALLOWANCES TERMINATED
REMAINING ALLOWANCES
(INCLUDES 2003-2005)0 0 0 25 0 00 0 0 26 0 00 0 0 0 0 40 0 0 27 0 50 0 0 1 0 50 0 0 0 0 320 0 0 0 0 00 0 0 8 0 10 0 0 3 0 20 0 0 20 0 00 0 0 16 0 10 0 0 0 0 00 0 0 118 0 50 0 0 71 0 30 0 0 0 0 10 0 0 24 0 30 0 0 21 0 40 0 0 17 0 50 0 0 0 0 10 0 0 0 0 00 0 0 0 0 0
12 37 49 173 0 70 0 0 104 0 4
00 0 0 150 0 00 0 0 141 0 08 0 8 8 0 280 1 1 14 0 00 1 1 14 0 00 1 1 14 0 00 1 1 6 0 00 0 0 0 0 00 0 0 36 0 00 0 0 38 0 00 0 0 37 0 00 0 0 0 0 00 1 1 9 0 00 1 1 8 0 10 0 0 0 0 00 0 0 16 0 30 0 0 19 0 10 0 0 0 0 00 0 0 3 0 70 0 0 19 0 70 0 0 17 0 9
A-135

APPENDIX A: 2005 EMISSIONS AND ALLOWANCE HOLDINGS OF NOx BUDGET SOURCES
BANKED 1 FOR 1 BANKED 2 FOR 1 TOTAL BANKEDTOTAL
DEDUCTED
2004 EARLY REDUCTION CREDIT
ALLOWANCES TERMINATED
REMAINING ALLOWANCES
(INCLUDES 2003-2005)0 0 0 0 0 00 0 0 22 0 00 0 0 28 0 80 0 0 24 0 330 0 0 21 0 360 0 0 25 0 330 0 0 24 0 350 0 0 25 0 330 0 0 0 0 0
119 0 119 760 0 38223 0 23 774 0 9237 0 37 1,016 0 1300 0 0 0 0 00 0 0 0 0 10 0 0 12 0 870 0 0 597 0 00 0 0 8 0 10 0 0 6 0 00 0 0 4 0 00 0 0 106 0 440 0 0 6 0 40 0 0 7 0 40 0 0 7 0 120 0 0 9 0 650 0 0 9 0 630 0 0 0 0 0
114 0 114 1,981 0 3900 0 0 649 0 00 0 0 593 0 00 0 0 0 0 100 0 0 5 0 00 0 0 6 0 00 0 0 4 0 10 0 0 4 0 00 0 0 6 0 00 0 0 3 0 00 0 0 6 0 00 0 0 3 0 00 0 0 1 0 00 0 0 2 0 00 0 0 2 0 00 0 0 12 0 00 0 0 11 0 00 0 0 0 0 210 0 0 577 0 0
A-136

APPENDIX A: 2005 EMISSIONS AND ALLOWANCE HOLDINGS OF NOx BUDGET SOURCES
BANKED 1 FOR 1 BANKED 2 FOR 1 TOTAL BANKEDTOTAL
DEDUCTED
2004 EARLY REDUCTION CREDIT
ALLOWANCES TERMINATED
REMAINING ALLOWANCES
(INCLUDES 2003-2005)0 0 0 623 0 10 0 0 0 0 100 0 0 713 0 112 0 2 8 0 140 0 0 0 0 00 0 0 4 0 00 0 0 4 0 00 0 0 5 0 00 0 0 0 0 62 0 2 187 0 13
025 0 25 108 0 17123 0 23 109 0 1523 0 3 18 0 252 0 2 21 0 223 0 3 21 0 250 0 0 0 0 00 0 0 47 0 00 0 0 59 0 00 0 0 1,185 0 00 0 0 1,194 0 00 0 0 0 0 100 0 0 5 0 180 0 0 7 0 170 0 0 6 0 170 0 0 17 0 210 0 0 18 0 210 0 0 19 0 190 0 0 18 0 210 0 0 0 0 00 0 0 7 0 285 0 5 572 0 45
33 0 33 601 0 1180 0 0 0 0 00 0 0 13 0 30 0 0 14 0 30 0 0 11 0 50 0 0 13 0 40 0 0 11 0 50 0 0 12 0 50 0 0 11 0 50 0 0 11 0 50 0 0 0 0 00 0 0 12 0 00 0 0 12 0 0
A-137

APPENDIX A: 2005 EMISSIONS AND ALLOWANCE HOLDINGS OF NOx BUDGET SOURCES
BANKED 1 FOR 1 BANKED 2 FOR 1 TOTAL BANKEDTOTAL
DEDUCTED
2004 EARLY REDUCTION CREDIT
ALLOWANCES TERMINATED
REMAINING ALLOWANCES
(INCLUDES 2003-2005)0 0 0 18 0 00 0 0 0 0 60 0 0 202 0 1110 0 0 43 0 10 0 0 4 0 00 0 0 0 0 00 0 0 567 0 0
42 0 42 390 0 1401 4 5 6 0 47 19 26 40 0 116 18 24 34 0 120 0 0 0 0 00 0 0 0 0 00 0 0 0 0 00 0 0 0 0 00 0 0 0 0 00 0 0 0 0 00 0 0 0 0 0
168 0 168 1,213 0 55261 0 61 447 0 21791 0 91 281 0 2980 0 0 0 0 0
56 0 56 644 0 2000 0 0 4 0 50 0 0 0 0 60 0 0 0 0 00 0 0 271 0 00 0 0 304 0 00 0 0 398 0 00 0 0 409 0 00 0 0 0 0 100 0 0 234 0 00 0 0 236 0 00 0 0 229 0 00 0 0 1 0 00 0 0 1 0 00 0 0 1 0 00 0 0 1 0 0
30 0 30 30 0 1680 0 0 0 0 00 0 0 0 0 00 0 0 271 0 70 0 0 60 0 00 0 0 60 0 00 0 0 64 0 0
A-138

APPENDIX A: 2005 EMISSIONS AND ALLOWANCE HOLDINGS OF NOx BUDGET SOURCES
BANKED 1 FOR 1 BANKED 2 FOR 1 TOTAL BANKEDTOTAL
DEDUCTED
2004 EARLY REDUCTION CREDIT
ALLOWANCES TERMINATED
REMAINING ALLOWANCES
(INCLUDES 2003-2005)0 0 0 64 0 00 0 0 0 0 00 0 0 927 0 821 4 5 8 0 90 0 0 1,433 0 00 0 0 1,632 0 0
23 0 23 23 0 3390 0 0 53 0 110 0 0 55 0 90 0 0 0 0 640 0 0 35 0 290 0 0 0 0 1250 0 0 0 0 00 0 0 0 0 00 0 0 264 0 220 0 0 226 0 110 0 0 188 0 90 0 0 304 0 00 0 0 298 0 6
53 0 53 340 0 163123 0 123 305 0 37294 0 94 314 0 2820 0 0 451 0 150 0 0 304 0 30 0 0 0 0 40
00 0 0 718 0 00 0 0 734 0 0
00 0 0 765 0 00 0 0 809 0 00 0 0 7 0 00 0 0 7 0 00 0 0 7 0 00 0 0 7 0 00 0 0 18 0 00 0 0 19 0 00 0 0 19 0 00 0 0 19 0 0
254 0 254 254 0 1,0630 0 0 81 0 00 0 0 81 0 00 0 0 83 0 00 0 0 0 0 2
0
A-139

APPENDIX A: 2005 EMISSIONS AND ALLOWANCE HOLDINGS OF NOx BUDGET SOURCES
BANKED 1 FOR 1 BANKED 2 FOR 1 TOTAL BANKEDTOTAL
DEDUCTED
2004 EARLY REDUCTION CREDIT
ALLOWANCES TERMINATED
REMAINING ALLOWANCES
(INCLUDES 2003-2005)0 0 0 795 0 00 0 0 895 0 0
00 0 0 905 0 00 0 0 988 0 0
170 0 170 170 0 8390
0 0 0 639 0 00 0 0 785 0 00 0 0 810 0 00 0 0 711 0 00 0 0 608 0 00 0 0 724 0 00 0 0 795 0 00 0 0 749 0 00 0 0 548 0 00 0 0 761 0 00 0 0 2 0 00 0 0 3 0 00 0 0 2 0 00 0 0 3 0 00 0 0 3 0 00 0 0 2 0 00 0 0 3 0 00 0 0 3 0 00 0 0 2 0 00 0 0 3 0 00 0 0 3 0 00 0 0 3 0 00 0 0 2 0 00 0 0 2 0 00 0 0 2 0 00 0 0 2 0 00 0 0 18 0 00 0 0 19 0 00 0 0 19 0 00 0 0 19 0 0
701 0 701 701 0 2,8250
0 0 0 122 0 00 0 0 117 0 00 0 0 123 0 00 0 0 119 0 00 0 0 159 0 0
0
A-140
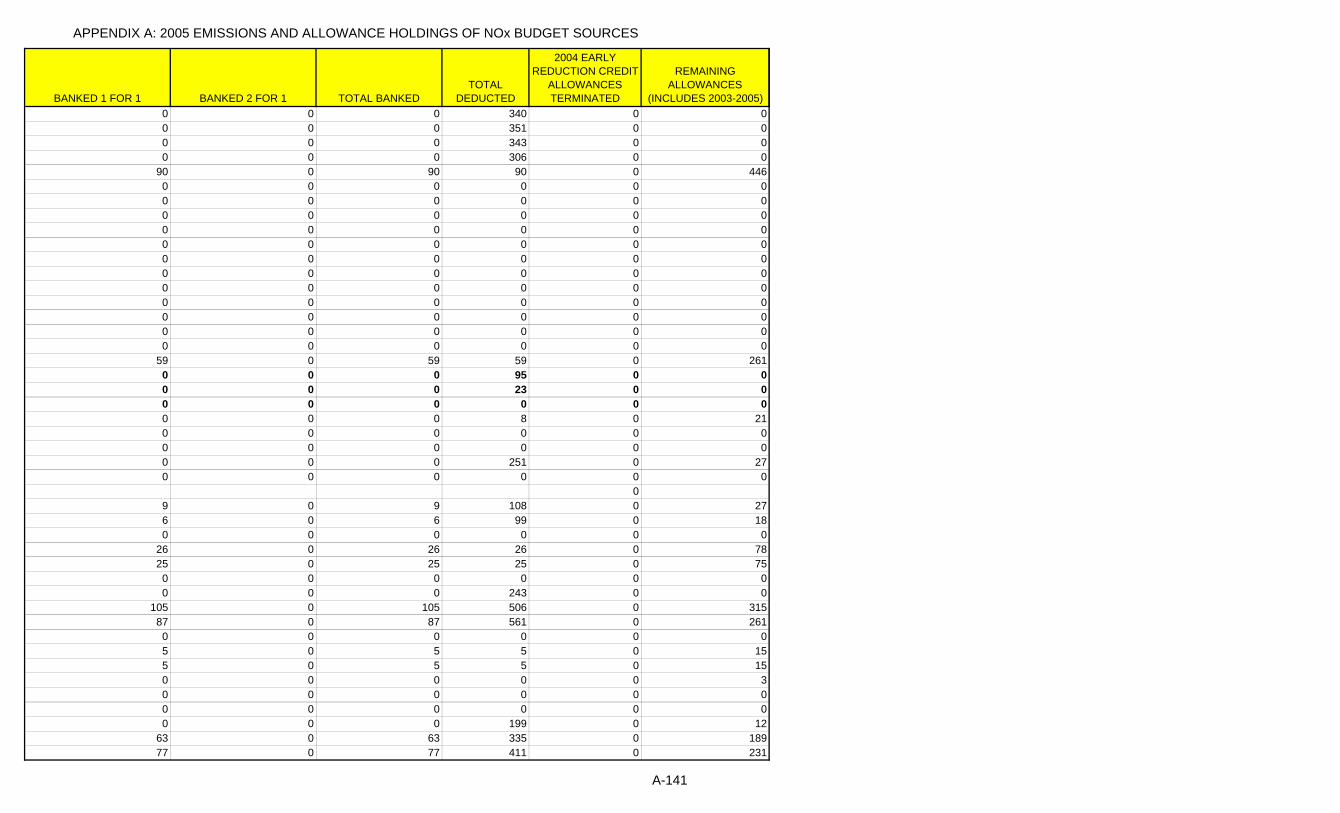
APPENDIX A: 2005 EMISSIONS AND ALLOWANCE HOLDINGS OF NOx BUDGET SOURCES
BANKED 1 FOR 1 BANKED 2 FOR 1 TOTAL BANKEDTOTAL
DEDUCTED
2004 EARLY REDUCTION CREDIT
ALLOWANCES TERMINATED
REMAINING ALLOWANCES
(INCLUDES 2003-2005)0 0 0 340 0 00 0 0 351 0 00 0 0 343 0 00 0 0 306 0 0
90 0 90 90 0 4460 0 0 0 0 00 0 0 0 0 00 0 0 0 0 00 0 0 0 0 00 0 0 0 0 00 0 0 0 0 00 0 0 0 0 00 0 0 0 0 00 0 0 0 0 00 0 0 0 0 00 0 0 0 0 00 0 0 0 0 0
59 0 59 59 0 2610 0 0 95 0 00 0 0 23 0 00 0 0 0 0 00 0 0 8 0 210 0 0 0 0 00 0 0 0 0 00 0 0 251 0 270 0 0 0 0 0
09 0 9 108 0 276 0 6 99 0 180 0 0 0 0 0
26 0 26 26 0 7825 0 25 25 0 750 0 0 0 0 00 0 0 243 0 0
105 0 105 506 0 31587 0 87 561 0 2610 0 0 0 0 05 0 5 5 0 155 0 5 5 0 150 0 0 0 0 30 0 0 0 0 00 0 0 0 0 00 0 0 199 0 12
63 0 63 335 0 18977 0 77 411 0 231
A-141

APPENDIX A: 2005 EMISSIONS AND ALLOWANCE HOLDINGS OF NOx BUDGET SOURCES
BANKED 1 FOR 1 BANKED 2 FOR 1 TOTAL BANKEDTOTAL
DEDUCTED
2004 EARLY REDUCTION CREDIT
ALLOWANCES TERMINATED
REMAINING ALLOWANCES
(INCLUDES 2003-2005)59 0 59 76 0 17789 0 89 157 0 2670 0 0 0 0 0
45 0 45 87 0 13559 0 59 462 0 17764 0 64 123 0 192
130 0 130 179 0 390197 0 197 303 0 59143 0 43 119 0 1290 0 0 0 0 0
00 0 0 844 0 90 0 0 928 0 100 0 0 723 0 80 0 0 0 0 0
257 0 257 1,686 0 771292 0 292 1,643 0 876
0 0 0 0 0 00
0 0 0 0 0 00 0 0 0 0 0
00 0 0 0 0 00 0 0 0 0 0
00 0 0 0 0 00 0 0 0 0 0
00 0 0 0 0 00 0 0 0 0 00 0 0 1,363 0 71
00 0 0 0 0 00 0 0 0 0 00 0 0 0 0 0
00 0 0 0 0 00 0 0 0 0 00 0 0 0 0 00 0 0 674 0 32
00 0 0 0 0 00 0 0 0 0 00 0 0 0 0 0
0
A-142

APPENDIX A: 2005 EMISSIONS AND ALLOWANCE HOLDINGS OF NOx BUDGET SOURCES
BANKED 1 FOR 1 BANKED 2 FOR 1 TOTAL BANKEDTOTAL
DEDUCTED
2004 EARLY REDUCTION CREDIT
ALLOWANCES TERMINATED
REMAINING ALLOWANCES
(INCLUDES 2003-2005)0 0 0 0 0 00 0 0 0 0 00 0 0 0 0 00 0 0 687 0 320 0 0 0 0 00 0 0 0 0 00 0 0 0 0 00 0 0 0 0 00 0 0 0 0 00 0 0 0 0 00 0 0 0 0 08 0 8 43 0 260 0 0 0 0 0
14 0 14 22 0 4222 0 22 22 0 6619 0 19 19 0 5722 0 22 22 0 660 0 0 0 0 00 0 0 27 0 30 0 0 29 0 30 0 0 28 0 20 0 0 32 0 20 0 0 17 0 20 0 0 0 0 454 0 4 4 0 125 0 5 5 0 151 0 1 1 0 30 0 0 0 0 00 0 0 0 0 00 0 0 0 0 00 0 0 68 0 14
1,403 0 1,403 1,403 0 4,7770 0 0 187 0 50 0 0 197 0 50 0 0 0 0 0
23 0 23 23 0 6923 0 23 23 0 690 0 0 0 0 0
12 0 12 26 0 366 0 6 23 0 184 0 4 26 0 125 0 5 23 0 150 0 0 0 0 00 0 0 0 0 00 0 0 0 0 0
A-143

APPENDIX A: 2005 EMISSIONS AND ALLOWANCE HOLDINGS OF NOx BUDGET SOURCES
BANKED 1 FOR 1 BANKED 2 FOR 1 TOTAL BANKEDTOTAL
DEDUCTED
2004 EARLY REDUCTION CREDIT
ALLOWANCES TERMINATED
REMAINING ALLOWANCES
(INCLUDES 2003-2005)0 0 0 179 0 3940 0 0 0 0 05 0 5 74 0 259 4 13 79 0 24
10 18 28 93 0 100 0 0 0 0 0
00 0 0 0 0 00 0 0 0 0 00 0 0 0 0 02 0 2 181 0 141 0 1 22 0 60 0 0 0 0 08 0 8 8 0 246 0 6 8 0 180 0 0 0 0 00 1 1 8 0 00 1 1 8 0 00 1 1 8 0 00 1 1 6 0 00 1 1 12 0 00 0 0 0 0 100 0 0 15 0 00 0 0 10 0 00 0 0 16 0 00 0 0 0 0 20
00 0 0 242 0 00 0 0 146 0 00 0 0 215 0 00 0 0 375 0 10 0 0 18 0 00 0 0 7 0 00 0 0 0 0 38
29 0 29 236 0 872 0 2 254 0 60 0 0 0 0 0
31 0 31 31 0 9343 0 43 43 0 129
183 0 183 1,075 0 5490 0 0 31 0 00 0 0 22 0 00 0 0 0 0 00 0 0 330 0 00 0 0 154 0 0
A-144

APPENDIX A: 2005 EMISSIONS AND ALLOWANCE HOLDINGS OF NOx BUDGET SOURCES
BANKED 1 FOR 1 BANKED 2 FOR 1 TOTAL BANKEDTOTAL
DEDUCTED
2004 EARLY REDUCTION CREDIT
ALLOWANCES TERMINATED
REMAINING ALLOWANCES
(INCLUDES 2003-2005)0 0 0 195 0 00 0 0 137 0 00 0 0 203 0 00 0 0 143 0 80 0 0 9 0 00 0 0 5 0 00 0 0 8 0 01 0 1 4 0 70 0 0 0 0 01 1 2 221 0 1
0177 0 177 188 0 587184 28 212 222 0 524
0 0 0 0 0 00 0 0 9 0 30 0 0 0 0 00 0 0 0 0 00 0 0 0 0 0
35 0 35 47 0 1050 0 0 0 0 00 0 0 0 0 00 0 0 0 0 00 0 0 0 0 00 0 0 0 0 00 0 0 0 0 00 0 0 0 0 00 0 0 0 0 00 0 0 0 0 00 0 0 0 0 00 0 0 30 0 4
0157 0 157 495 0 471181 0 181 547 0 543455 0 455 1,124 0 1,365
0 0 0 0 0 075 50 125 344 0 17575 50 125 266 0 17575 50 125 325 0 1750 0 0 0 0 4
00 0 0 84 0 350 0 0 84 0 240 0 0 83 0 380 0 0 0 0 00 0 0 20 0 0
A-145

APPENDIX A: 2005 EMISSIONS AND ALLOWANCE HOLDINGS OF NOx BUDGET SOURCES
BANKED 1 FOR 1 BANKED 2 FOR 1 TOTAL BANKEDTOTAL
DEDUCTED
2004 EARLY REDUCTION CREDIT
ALLOWANCES TERMINATED
REMAINING ALLOWANCES
(INCLUDES 2003-2005)0 0 0 20 0 00 0 0 20 0 00 0 0 20 0 00 0 0 20 0 00 0 0 20 0 00 0 0 20 0 00 0 0 20 0 00 0 0 20 0 00 0 0 20 0 00 0 0 20 0 00 0 0 20 0 00 0 0 0 0 00 0 0 33 0 10 0 0 33 0 10 0 0 34 0 00 0 0 34 0 00 0 0 34 0 00 0 0 34 0 00 0 0 0 0 00 0 0 13 0 79
250 0 250 1,812 0 75050 0 50 1,680 0 1500 0 0 0 0 4
00 0 0 76 0 20 0 0 75 0 20 0 0 0 0 0
014 0 14 480 0 4231 8 39 611 0 850 0 0 679 0 00 0 0 0 0 40 0 0 0 0 00 0 0 0 0 00 0 0 0 0 0
00 0 0 0 0 00 0 0 0 0 00 0 0 133 0 0
00 0 0 422 0 270 0 0 369 0 460 0 0 1,539 0 290 0 0 0 0 00 0 0 1 0 1
A-146

APPENDIX A: 2005 EMISSIONS AND ALLOWANCE HOLDINGS OF NOx BUDGET SOURCES
BANKED 1 FOR 1 BANKED 2 FOR 1 TOTAL BANKEDTOTAL
DEDUCTED
2004 EARLY REDUCTION CREDIT
ALLOWANCES TERMINATED
REMAINING ALLOWANCES
(INCLUDES 2003-2005)0 0 0 0 0 0
00 0 0 826 0 170 0 0 1,004 0 110 0 0 1,012 0 120 0 0 0 0 0
00 0 0 560 0 60 0 0 588 0 70 0 0 0 0 0
03,688 0 3,688 3,688 0 11,185
0 0 0 3,757 0 310 0 0 6 0 20 0 0 0 0 0
03 6 9 172 0 32 0 2 168 0 90 0 0 0 0 0
00 0 0 475 0 0
144 0 144 462 0 432178 0 178 727 0 534
0 0 0 0 0 00 0 0 874 0 90 0 0 0 0 00 0 0 0 0 00 0 0 0 0 0
026 0 26 267 0 7826 0 26 279 0 780 0 0 0 0 0
00 0 0 508 0 70 0 0 583 0 120 0 0 475 0 50 0 0 485 0 100 0 0 1,284 0 310 0 0 0 0 02 0 2 121 0 60 0 0 119 0 00 0 0 0 0 10 0 0 353 0 00 0 0 288 0 00 0 0 0 0 4
A-147

APPENDIX A: 2005 EMISSIONS AND ALLOWANCE HOLDINGS OF NOx BUDGET SOURCES
BANKED 1 FOR 1 BANKED 2 FOR 1 TOTAL BANKEDTOTAL
DEDUCTED
2004 EARLY REDUCTION CREDIT
ALLOWANCES TERMINATED
REMAINING ALLOWANCES
(INCLUDES 2003-2005)2 6 8 206 0 00 1 1 85 0 00 0 0 313 0 160 0 0 105 0 220 0 0 2 0 0
75 144 219 339 0 810 0 0 0 0 45 13 18 153 0 00 0 0 3 0 00 0 0 95 0 140 0 0 0 0 4
50 118 168 277 0 32313 534 847 1,265 0 405
0 0 0 0 0 40 0 0 190 0 5
A-148

United States
Environmental Protection Agency
Office of Air and Radiation
Office of Atmospheric Programs
Clean Air Markets Division (6204J)
1200 Pennsylvania Ave., NW
Washington, DC 20460
www.epa.gov/airmarkets
EPA430-R-06-013
September 2006
Recycled/Recyclable—Printed with Vegetable Oil Based Inks on 100% Postconsumer, Process Chlorine Free Recycled Paper