Novo Holdings A/S Annual Review 2017 · NOVO OLDINS AS ANNUAL REPORT 2017 5 The Income and...
42
ANNUAL REPORT 2017 2017
Transcript of Novo Holdings A/S Annual Review 2017 · NOVO OLDINS AS ANNUAL REPORT 2017 5 The Income and...
ANNUAL REPORT 20172017

Introduction 3I Improved Income and Investment Result 5II Total assets increases 6III Life Science Investments Portfolio 7 III A Principal Investments 8III B Novo Ventures 9III C Novo Seeds 10 IV Financial Investments 11V Strategy 12VI Governance 13VII Corporate social responsibility 14VIII Knowledge resources 16IX Businessandfinancialrisks 17X The future 18XI Management’s Statement 19XII Independent Auditor’s Report 20XIII Statement of comprehensive income 22XIV Statementoffinancialposition 23XV Statementofcashflows 24XVI Statement of changes in equity 25
Notes: 1. Summaryofsignificantaccountingpolicies 262. Income from Novo Group 293. Return from Life Science Investments 294. Return from Financial Investments 295. Costs 306. Fee to statutory auditors 307. Employee costs 318. Income taxes 329. Novo Group companies 3210. Life Science Investments 3311. Financial Investments 3412. Financialinstrumentsandfinancialriskfactors 3513. Fair Value estimation policies 3614. Other provisions 3815. Contingent liabilities/assets 3816. Related party transactions and ownership 3917. Subsidiaries and associates 40
C O N T E N T S
2

3
Novo Holdings is a holding and investment company, wholly owned by the Novo Nordisk Foundation. Our objective is to meet the Novo Nordisk Foundation’s strategic and commercial goals and, as such, we make investments with a view to long-term returns. Since 2016, our reporting has been modified to include the long-term (five and ten year) investment performance of Life Science Investments and Financial Investments (together the ‘Investment Portfolio’).
I N T R O D U C T I O N
4
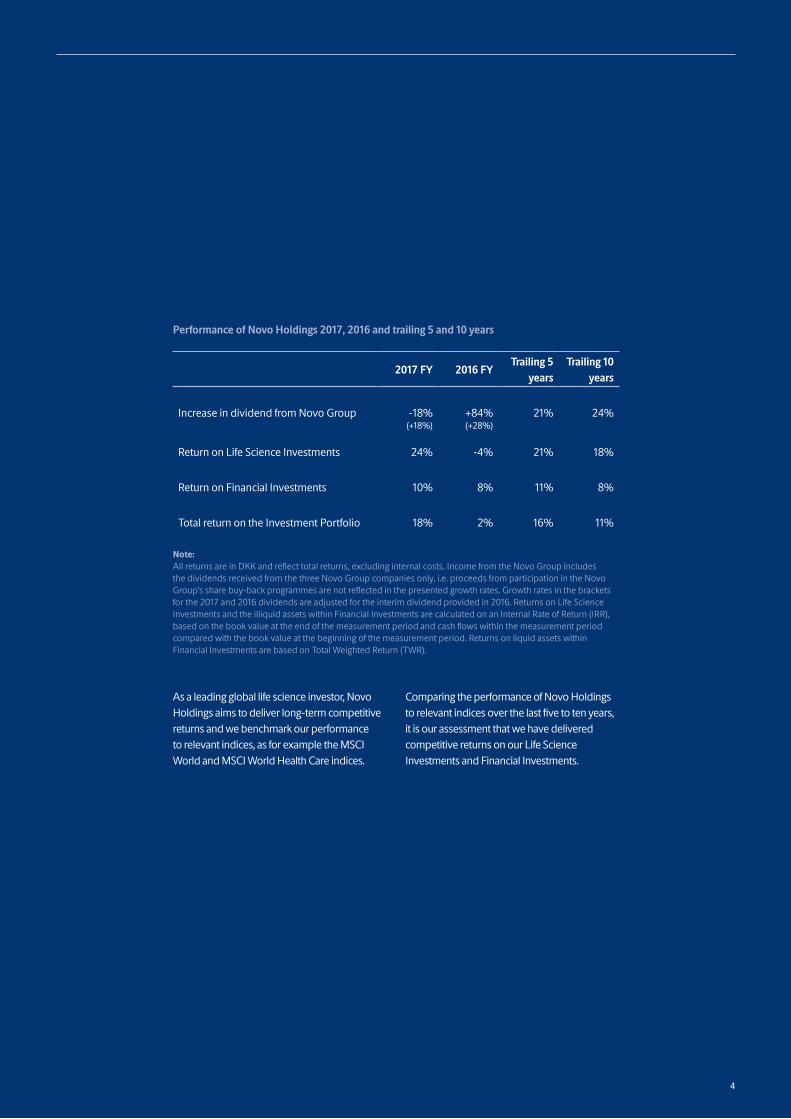
Note:All returns are in DKK and reflect total returns, excluding internal costs. Income from the Novo Group includes the dividends received from the three Novo Group companies only, i.e. proceeds from participation in the Novo Group’s share buy-back programmes are not reflected in the presented growth rates. Growth rates in the brackets for the 2017 and 2016 dividends are adjusted for the interim dividend provided in 2016. Returns on Life Science Investments and the illiquid assets within Financial Investments are calculated on an Internal Rate of Return (IRR), based on the book value at the end of the measurement period and cash flows within the measurement period compared with the book value at the beginning of the measurement period. Returns on liquid assets within Financial Investments are based on Total Weighted Return (TWR).
Performance of Novo Holdings 2017, 2016 and trailing 5 and 10 years
2017 FY 2016 FYTrailing 5
yearsTrailing 10
years
Increase in dividend from Novo Group
-18%
(+18%)
+84%
(+28%)
21%
24%
Return on Life Science Investments 24% -4% 21% 18%
Return on Financial Investments 10% 8% 11% 8%
Total return on the Investment Portfolio 18% 2% 16% 11%
As a leading global life science investor, Novo Holdings aims to deliver long-term competitive returns and we benchmark our performance to relevant indices, as for example the MSCI World and MSCI World Health Care indices.
Comparing the performance of Novo Holdings torelevantindicesoverthelastfivetotenyears,it is our assessment that we have delivered competitive returns on our Life Science Investments and Financial Investments.

NOVO HOLDINGS A/S ANNUAL REPORT 2017
5
The Income and Investment Result in 2017 amounted to a record high DKK 20.7bn versus DKK 8.4bn in 2016. This development is largely attributed to the realised and unrealised returns of Life Science Investments.
AllNovoGroupcompaniescontinuedtoincreaseprofitsin2017 and income from the Novo Group was in line with expectations at DKK 6.0bn. The decrease compared to 2016 is due to the introduction of the interim dividend payment by Novo Nordisk in August 2016. Adjusted for the introduction of the interim dividend of 2016, the DKK 6.0bn in 2017 represents an increase of 20% over 2016.
In 2017, Return from Life Science Investments was positively impacted by increases in, among others, the share prices of Chr. Hansen, Inogen, Evotec and BTG, as well as increases in the valuations of the privately held companies. The Return from Life Science Investments in 2017 reached a record high of DKK 10.9bn, compared to the DKK -1.5bn in 2016 (the 2016 return was negatively impacted by the decrease in the share price of Chr. Hansen and the decrease in the value of Ophthotech Corp). As of December 2017, thefiveandtenyearIRRforLifeScienceInvestmentsstoodat21%and 18%, respectively. Financial Investments delivered a return of DKK 3.8bn in 2017 versus DKK 2.8bn in 2016. This represents a return above the relevant benchmark and was partially driven by the continued appreciation of the shareholding in FLSmidth & Co.
Year-on-yearmarketfluctuations,bothpositiveandnegative,cangive a distorted view of the long-term development of the investment performance.Therefore,wefocusonthefivetotenyearreturns,whichstand at 16% and 11%, respectively, for Novo Holdings. We consider this to be a satisfactory performance.
I M P R O V E D I N C O M E A N D I N V E S T M E N T R E S U LT D R I V E N B Y R E T U R N S I N T H E I N V E S T M E N T P O R T F O L I O
I
Note:Income from the Novo Group includes only dividend and direct income related to the sale of shares in Novo Group companies, whereas the returns from Life Science Investments and Financial Investments (the Investment Portfolio) also represent realised and unrealised gains and losses on these investments.
Performance of Novo Holdings 2017 and 2016
DKK billion 2017 2016
Income from the Novo Group 6.0 7.1
Return from Life Science Investments 10.9 -1.5
Return from Financial Investments 3.8 2.8
Income and Investment Result 20.7 8.4

NOVO HOLDINGS A/S ANNUAL REPORT 2017
6
At the end of 2017, our investment assets totalled DKK 358.3bn, of which the value of our Investment Portfolio accounted for DKK 95.0bn.
In 2017, the value of our holdings in Novo Nordisk and Novozymes increased by 31% and 43%, respectively, whereas the value of our holding in NNIT decreased by 16%. The combined value of the Novo Group companies increased by 32% to DKK 263.2bn, up from DKK 199.2bn in 2016. In 2017, we decided not to participate in the Novo Nordisk share buy-back programme, and by the end of the year we held 537,436,000 A shares and 163,814,000 B shares, equivalent to 28.05% of the share capital and 75.5% of the votes in Novo Nordisk.
As announced in January 2014, and repeated in the Management Report for 2016, Novo Holdings has informed Novo Nordisk that it intends to consider its participation in the Novo Nordisk share repurchase programme on a case-by-case basis. For 2018, Novo Holdings has informed Novo Nordisk that it plans to participate in its share repurchase programme. Novo Holdings currently intends to maintain its ownership of the Novo Nordisk share capital at around 28%.
Of the current ownership, 25.5% is the minimum historical ownership level, and the additional 2.6% held is now part of the liquidity reserve of Novo Holdings. In future, we might consider reducing our holding in Novo Nordisk B shares. Over time this could bring our ownership toward the minimum historical ownership of 25.5%.
As part of Novozymes’ share buy-back programme, we sold 1,275,000 B shares, yielding DKK 0.4bn. At the end of 2017, we held 53,743,600 A shares and 24,031,400 B shares, equivalent to 25.5% of the share capital and 71.2% of the votes in Novozymes.
The value of the Investment Portfolio increased during 2017 to a record high DKK 95.0bn, up from DKK 76.5bn in 2016. This was primarily driven by increases in the share prices of Chr. Hansen, Inogen, Evotec and BTG, combined with higher valuations of some of our privately held companies.
In 2017, Novo Holdings paid a DKK 13.0mn dividend to the Novo Nordisk Foundation, which in accordance with its statutes, provides grants to supportscientific,humanitarianandsocialpurposes.Since2010,theNovoNordisk Foundation has issued more than DKK 16.2bn in grants to support scientific,humanitarianandsocialpurposesinDenmarkandtheNordics.
Note:Novo Holdings’ investment in Novo Nordisk and Novozymes A and B shares in the above table are valued using the quoted B share price at closing on 31 December 2017. Financial Investments includes DKK 13.3bn, which are managed on behalf of the Novo Nordisk Foundation.
Novo Holdings total assets 2017 and 2016
DKK billion 2017 2016
Novo Group 263 199
Life Science Investments 56 38
Financial Investments 39 38
Total Holdings and Investment Assets 358 275
T O TA L A S S E T S I N C R E A S E S B Y 3 0 %
II

NOVO HOLDINGS A/S ANNUAL REPORT 2017
7
We divide our Life Science Investments into three distinct investment areas: Principal Investments, which generally invests in cash flow positive larger enterprises, Novo Ventures, which focuses on venture investments primarily in the US and in Europe, and Novo Seeds, which focuses on early start-ups primarily in the Nordic Region. By the end of 2017, Novo Holdings had DKK 55.8bn allocated to life science investments.
In line with our life science focused investment strategy, we have begun preparations for the establishment of a Principal Investments presence in the US. We have added an additional investment class to our life science activities, namely, Growth Equity. This area, which will initially operate out of Principal Investments, will explore investment opportunities in the space between Novo Ventures and Principal Investments.
In terms of return, Life Science Investments had a strong year in 2017, delivering a 24% IRR.
L I F E S C I E N C E I N V E S T M E N T S P O R T F O L I O AT H I G H E S T L E V E L E V E R B Y E N D 2 0 1 7
III
Total Life Science Investments portfolio value 2017 and 2016
DKK billion 2017 2016
Principal Investments 50.9 31.5
Novo Ventures 4.4 5.9
Novo Seeds 0.4 0.3
Total Life Science Investments 55.8 37.7

NOVO HOLDINGS A/S ANNUAL REPORT 2017
8
Since 2013, more of our investments have been directed towards well-established,dividendyieldingandcashflowpositivecompanies.These investments are made in publicly listed as well as privately owned companies, with a mix of minority and majority positions.
Principal Investments made two major new investments in 2017 – both as minority stakes in publicly traded companies. We acquired 10.1% of the shares in German-based Evotec AG in February 2017. This was followed in March 2017 by the acquisition of a 19.95% stake in the UK medical device company, ConvaTec. Combined, the two investments amounted to DKK 9.6bn. In addition to the two new investments,Principal Investments made a follow-on investment in privately heldSYNLAB, where our current ownership is approximately 20% of the equity.
In 2017, realised and unrealised gains in Principal Investments reached arecordhighDKK9.9bn,whichisasignificantimprovementover2016,where a loss of DKK 2.1bn was recorded. The positive development in the share prices of Chr. Hansen, Inogen, Evotec and BTG, combined with higher valuations of some of the privately held investments, are the main reasons for this development.
At end 2017, our Principal Investments portfolio comprised twelve companies of which ten are located in Europe and two in the US. The portfolio consists of majority positions in Sonion and Xellia, both headquartered in Denmark, and minority positions in Chr. Hansen, Symphogen, SYNLAB, Orexo, Veloxis, BTG, ConvaTec, Evotec (all European) and ERT and Inogen (both in the US).
Following an extensive strategy review in 2016, we intend to continue to allocatesignificantfundstoPrincipalInvestmentsintheyearstocome.
Principal Investments portfolio value, investments, proceeds and gains/losses 2017 and 2016
DKK billion 2017 2016
Value of portfolio at the end of the year 50.9 31.5
Investments during the year 12.0 6.5
Cash proceeds during the year 2.5 0.7
Realised and unrealised gains/losses during the year
9.9 -2.1
P R I N C I P A L I N V E S T M E N T S
III�

NOVO HOLDINGS A/S ANNUAL REPORT 2017
9
During 2017, Novo Ventures added four new public and eight new private investments to their portfolio. There were fourteen exits from the portfolio. Of the DKK 1.7bn invested by Novo Ventures in 2017, DKK 1.5bn was invested in the US and DKK 0.2bn in Europe. DKK 1.0bn was invested into new companies and DKK 0.7bn as follow-on investments in existing portfolio companies. In 2017, thirteen of our portfolio companies were exited and the proceeds from this totalled DKK 4.1bn. As of year-end, our venture portfolio consists of forty-seven companies, of which thirty-seven are located in the US. The proportion of publicly listed companies in the portfolio decreased from 66% in 2016 to 42% in 2017.
ItistheintentionofNovoHoldingstocontinuetoallocatesignificantresources to the private and public venture markets in the US and to EU’s venture market in the coming years.
Novo Ventures portfolio value, investments, proceeds and gains/losses 2017 and 2016
DKK billion 2017 2016
Value of portfolio at the end of the year 4.4 5.9
Investments during the year 1.7 2.1
Cash proceeds during the year 4.1 0.8
Realised and unrealised gains/losses during the year
1.0 0.7
N O V O V E N T U R E S
III�

NOVO HOLDINGS A/S ANNUAL REPORT 2017
10
Novo Seeds celebrated their ten-year anniversary in 2017. The Novo Group has established itself as the leading early stage life science investor in the Nordic Region. Novo Seeds provides: i) pre-seed grants awarded on behalf of the Novo Nordisk Foundation to create biotech start-ups; ii) seed and follow-on investments to bring start-ups to meaningfulvalueinflectionpoints;andiii)InvestmentsasanLPinventure funds, with strategic impact in the Nordics.
In 2017, Novo Seeds further expanded its company creation capabilities by establishing an entrepreneur in residence program, BiOrigin, set up to provide managerial and strategic support to start-ups and pre-seed projects.
In 2017, Novo Seeds invested in four new companies, two in Denmark and two outside the Nordics. The Novo Seeds portfolio companyLysogene,undertookanIPOonEuronext,markingthefirstpublic exit from the Novo Seeds portfolio.
At the end of the year, the total book value of Novo Seeds was DKK 438mn and consisted of twenty active portfolio companies, of which fourteen are located in the Nordics.
ItistheintentionofNovoHoldingstocontinuetoallocatesignificantresources towards building the Nordic biotech industry in the coming years.
Novo Seeds portfolio value, investments, proceeds and gains/losses 2017 and 2016
DKK million 2017 2016
Value of portfolio at the end of the year 438 291
Investments during the year 175 149
Cash proceeds during the year 9 26
Realised and unrealised gains/losses during the year
-19 -81
N O V O S E E D S
III�

NOVO HOLDINGS A/S ANNUAL REPORT 2017
11
Akeypartofourstrategyistohavesomeelementofdiversificationinourportfolio by investing in non-health care assets, as managed by Financial Investments. These investments are to a large extent liquid, which is importantforfinancingthegrant-givingactivitiesoftheNovoNordiskFoundation and for allowing us to support Novo Nordisk and Novozymes in any fund raising they may undertake.
Financial Investments had another strong year in 2017, delivering a return of 10%. At the end of 2017, liquid investments constituted approximately 90% of the portfolio. This liquid part of the portfolio has delivered a return of approximately DKK 20.3bn since its inception in 2005, and has an attractivereturn(measuredasTWR)of11%and8%measuredoverafiveand ten year period, respectively.
At the end of 2017, the value of Financial Investments (including the DKK 13.2bn we manage for the Novo Nordisk Foundation) was DKK 39.2bn. The liquid part of the Financial Investments portfolio was allocated as follows: 64% in equities, 15% in credit investments and 21% in bonds. Since equities comprise the bulk of the portfolio, the return of Financial Investments is closely linked to the performance of the global equity markets. The liquid part of Financial Investments delivered a strong performance in 2017, outperforming its benchmark by generating a return of 9.8% (versus 6.2% for the benchmark). This outperformance is attributed to positive results from most of our external portfolio managers, as well as our direct investments, including FLSmidth and Vestjysk Bank.
F I N A N C I A L I N V E S T M E N T S
I V
Financial Investments portfolio value and gains/losses 2017 and 2016
DKK billion 2017 2016
Value of portfolio at the end of the year
39.2
38.1
Realised and unrealised gains/losses during the year
3.8 2.8

NOVO HOLDINGS A/S ANNUAL REPORT 2017
12
Our strategy is guided by the objectives of the Novo Nordisk Foundation.
We will continue to be a strong owner of the companies in the Novo Group and will invest our capital in the life sciences sector to optimise value creation and to support development in the industry in general. We target returns that allow us to deliver an income to the Novo Nordisk Foundation and grow our investment portfolio.
Due to our extensive experience and expertise, we are particularly well positioned to play an active role in the life sciences sector. We invest across the entire spectrum of life science companies, from early seed investments through to venture investments and investments in large, established companies.Wehaveaflexibleinvestmentapproach, enabling us to take both minority and majority ownership stakes.
We strive to build on and enhance our position as a leading life science investor. We will continue to focus on and increase our investments in the life sciences sector in the US and Europe.
We will maintain an adequate liquidity reserve, which we will continue to allocate to investments inglobalequityandfixedincomesecurities.
S T R AT E G Y
V

NOVO HOLDINGS A/S ANNUAL REPORT 2017
13
We value representative ownership and aim to have board representation in the companies we invest in, and this contribute to the major strategic initiatives that our portfolio companies take. We also take an active interest in the composition of the board and the executive leadership team in portfolio companies, and we monitor their performance. However, when it comes to
daily management and operations, we rely on and entrust the management and board of the respective companies.
As of yet, the Novo Holdings’ Board ofDirectors has no female members. In 2016,the Board decided to set out the target thatby 2020 the Board will consist of at leastone member of each gender. To achieve
this goal, the Board will work to identify suitable candidates.
We refer to the annual report of the Novo Nordisk Foundation where the statutory requirements in regards to §99b are disclosed.
G O V E R N A N C E
VI

NOVO HOLDINGS A/S ANNUAL REPORT 2017
14
C O R P O R AT E S O C I A LR E S P O N S I B I L I T Y
VII
Corporate Social Responsibility is integral to the values of Novo Holdings as a wholly owned subsidiary of the Novo Nordisk Foundation.
The vision of the Foundation is to contribute significantlytoresearchanddevelopmentthat improves the health and welfare of people. In 2017, the Foundation awarded grantsinexcessofDKK5.8bnforscientific,humanitarian and social purposes.
The mission of Novo Holdings is to enable and to make a positive and meaningful impact on health, science and society by:
• generating attractive long-term returns on the wealth of the Novo Nordisk Foundation;
• being a life science focused investor and supporting the application of science by investing in seed, venture and late-stage companies; and
• upholding the Novo Group Charter
The Charter describes a shared set of values, which
all companies in the Novo Group must adhere to.
Novo Group companies must strive to make sure that their products and services make a significantdifferenceinimprovinghowpeoplelive and work. It also includes a commitment tocontinuouslyimprovefinancial,environmental and social performance.
To align the reporting on Corporate Social Responsibility with its overall business performance, Novo Holdings evaluates its focus areas, policies and activities every year and makes adjustments, if any.
We refer to the CSR policies of the Novo Nordisk Foundation where the statutory requirements in regards to §99a are disclosed: issuu.com/nnfoundation/docs/nnf_-_koncernen_og_samfundet_2017
Impact of investment activitieson societyThe impact of Novo Holdings on society dependsonhowwellitmanagesitsfinancial
resources. The aim is to leave a positive footprint on society. Novo Holdings does this byensuringasufficientreturnoninvestmentto support the Novo Nordisk Foundation’s grant giving activities.
In 2017, the Foundation awarded DKK 5.8bn through 432 grants. The Foundation prepares an Annual Report assessing its impact on society.
For more insights on this go to impact.novonordiskfonden.dk. In 2017, Novo Holdings helped start fourteen new companies and invested DKK 13.9bn in seventy-seven new and existing life science companies.
The Novo Group paid corporate tax of DKK 7.3bn in Denmark in 2017.
Charter and valuesNovo Holdings complies with the Novo Group Charter and the Foundation’s three cornerstones.

NOVO HOLDINGS A/S ANNUAL REPORT 2017
15
Charter: The companies in the Novo Group (Novo Holdings, Novo Nordisk, Novozymes and NNIT) each comply with the Charter, and Novo Holdings ensures that the portfolio companiesdonotconflictwiththeCharter.
Values: The values of Novo Holdings are an integrated part of every employee’s performance requirements.
Brand and employeesThemainnon-financialoperationalassetofNovo Holdings is its brand and its employees. We strive to be a well-respected company and a responsible and attractive employer. All employees are expected to help to build the Novo Holdings brand by upholding and promoting its values and culture.
We conduct workplace risk assessment, which includescollectingkeyfiguresonsickleaveand training.
Novo Holdings welcomed twenty-seven new colleagues,includingfivestudentassistants,in 2017. In addition, we hired seven new colleagues in 2017, with start dates in 2018.
Impact of investments on human rights and the environment For information on the impact of investments on human rights and the environment, see the Corporate Social Responsibility Reports of the respective Novo Group companies.

NOVO HOLDINGS A/S ANNUAL REPORT 2017
16
Novo Holdings relies on highly specialised expertise, particularly within the areas of life science and investments. For this reason, the professional competences of our colleagous are of great strategic importance. We focus on training and education to allow the individual employee to increase his or her value to Novo Holdings.
To serve our portfolio companies with the best combination of competences, our life science teams include individuals who have obtained their professional expertise through work and training from within and outside the Novo Group.
Novo Holdings professionals strive to deliver high performance with high responsibility, where what we do and how we do it go hand in hand.
In addition to the Board of Directors, Novo Holdings has an advisory group of external life science professionals (the Novo Advisory Group), who provide Novo Holdings with feedback and advice on life science investment projects.
K N O W L E D G E R E S O U R C E S
VIII

NOVO HOLDINGS A/S ANNUAL REPORT 2017
17
IX
Our most important risks are related to the business risk of the two subsidiaries, Novo Nordisk and Novozymes. The business risks vary in the two subsidiaries as a consequence of theirdifferentactivities.
There are inherent risks associated with investing in Novo Nordisk. A detailed enterprise risk management process is in place at Novo Nordisk to identify critical risks, and mitigate potential adverse impacts and protect value creation. Risks that have an impact on the company’s performance may materialize such as delays or failure of products in the pipeline, supply disruptions, competition and market developments, compromises to product quality and safety, information technology security breaches, currency impact and tax disputes, breach of legislation or ethical standards, and loss of intellectual property rights.
In 2017, the most prominent risk that did materialize was US price pressure. In turn, theoverallshorttermR&Dprofileimprovedconsiderably during the year with results of key clinical trials that were better than expected. Further to this, and important for future growth, in December 2017 Ozempic® (semaglutide) was approved by the US Food and Drug Administration (FDA) and recommended for marketing authorisation in Europe by Committee for Medicinal Products for Human Use (CHMP) under the European Medicines Agency (EMA).
Novozymes is exposed to a range of risks throughout the value chain and has implemented measures to mitigate these. Based on risk analysis, the Novozymes Board ofDirectorshasidentifiedfourkeyrisksthatmay impact the company: competition in industrial enzymes, volatility of the starch-based ethanol business, loss of knowledge,
and delay of BioAg commercialisation. To mitigate the risk of competition from existing and new competitors in industrial enzymes, Novozymes focuses on its strong innovation pipeline and on delivering novel solutions tailored to the needs of customers operating indifferentlocalmarketconditions.
To address the risk of a persistent low-price environment in the starch-based ethanol business, Novozymes is continuously investing in R&D to develop even better enzyme solutionsforimprovingyieldandprofitabilityto ensure biofuels are a commercial alternative to traditional fossil fuels. To ensure protection of knowledge and mitigate the risk of cyber-attacks, Novozymes pursues an active patent strategy and continuously implements key security procedures and behaviours to prevent theftofe.g.productionstrainsanddata.
The Novozymes Board of Directors continues to place the BioAg Alliance high on its agenda, and prioritises and follows developments closely. Although a merged Bayer-Monsanto could cause a delay in the BioAg commercialisation, the new entity could also be an attractive alliance partner for Novozymes in the long-term, sharing vision and commercial commitment, and increasing the commercial reach of the Alliance. In the short-term, Novozymes’ priority is to ensure the success of the Alliance.
For more information about Novo Nordisk and Novozymes and their approach to risk management, please consult the Annual Reports of the companies.
Moreover, Novo Holdings’ Investment Portfolioissignificantlyweightedtowardthelife sciences industry. Whereas the industry is considered broad with several subsectors, including biotech, medtech, pharma, health
care IT, bioindustrials, etc., Novo Holdings is especially exposed to the particular risks associated to the life sciences sector.
Based on a number of risk measures and tolerance levels decided by the Novo Nordisk Foundation, we continued to develop our financialriskframeworkduring2017,asweupdated our methodology, expanded the measures and further detailed our reporting. Hence, by end 2017, we measure and focus upon shortfall risk for growth in grant pay-outs, portfolio volatility, idiosyncratic risk, access toliquidityaswellasdiversificationoftheInvestment Portfolio. In Novo Holdings, we adhere to this risk framework, as we plan and execute our investment strategy.
Morespecifically,weallocatethecapitaltoreflectthati)theNovoNordiskFoundationshould generally be able to increase its grants by at least the growth in nominal GDP, ii) a maximum loss on the investment portfolio, excluding Novo Nordisk, Novozymes and NNIT, in exceptionally negative market conditionsisdefined,iii)nosingleinvestmentshould represent more than a certain percentage of the investment portfolio, iv) the Novo Nordisk Foundation should at any time be able to liquidate assets without incurring losses from forced disposals, for a value corresponding to the actual commitment aswellasexpectedfive-yeargrantpay-outobligationsplusanadditionalbuffer,andv) of the investment portfolio, the Financial Investments should at any time represent a certain minimum of the total portfolio.
Novo Holdings is adaptive and has a range of strategic levers available for meeting these risk objectives.
B U S I N E S S A N D F I N A N C I A L R I S K S
NOVO HOLDINGS A/S ANNUAL REPORT 2017
18
NovoHoldings’financialprospectsarepartlydependentontheresultsofNovo Nordisk and Novozymes. For further information on the outlook for 2018 for these two companies, please consult their Annual Reports.
At their Annual General Meetings, Novo Nordisk and Novozymes approved dividends for 2017 of DKK 7.85 per share and DKK 4.50, respectively. Consequently, Novo Holdings expects to receive DKK 4.4bn in March 2018. In August 2018, we also expect to receive additional interim dividends from Novo Nordisk. Further hereto, we plan to participate in the share repurchase programme of Novo Nordisk and Novozymes, which we anticipate will generate additional income.
In addition to the income from the Novo Group companies, the result of Novo Holdings relies on the investment returns from our Investment Portfolio. As directed by our strategy, the Investment Portfolio is largely allocated and exposed to the life sciences sector.
Although pricing and healthcare reforms are adding pressures on the life sciences industry, we believe that the underlying long-term trends will continue to be positive. Positive developments in the Life Science Investments portfolio, combined with a number of strong exits and public offeringsinrecentyears,providethebasisforourcontinuedoptimism.In support of this, we will also continue to expand and consolidate our investment areas as well as invest further in our operational structure.
T H E F U T U R E
X
DKK million 2017 2016 2015 2014 2013
Income from Novo Group companies
6,033 7,142 4,271 3,666 5,203
Return from investment activities
14,671 1,225 11,487 9,864 5,658
Operatingprofit 20,285 8,155 15,375 13,460 10,814
Netprofitfortheyear
19,148 7,121 14,848 13,460 10,784
Proposed dividend 1,600 13 3,008 4,715 2,745
Investments in property
423 - - - -
Equity 86,197 67,062 62,949 52,816 42,101
Total assets 100,123 80,971 74,390 54,630 42,412
Financial ratios
Equity ratio 86% 83% 85% 97% 99%
Employees 51 41 34 30 27
Five year summary


NOVO HOLDINGS A/S ANNUAL REPORT 2017
20
XII
OpinionIn our opinion, the Financial Statements give a true and fair view of the financialpositionoftheCompanyat31December2017,andoftheresultsoftheCompany’soperationsandcashflowsforthefinancialyear1 January - 31 December 2017 in accordance with International Financial Reporting Standards as adopted by the EU and further requirements in the Danish Financial Statements Act.
We have audited the Financial Statements of Novo Holdings for the financialyear1January-31December2017,whichcomprisestatementofcomprehensiveincomeandstatementoffinancialposition,statementofcashflows,statementofchangesinequityandnotes,includingasummaryofsignificantaccountingpolicies(“financialstatements”).
Basis for OpinionWe conducted our audit in accordance with International Standards on Auditing (ISAs) and the additional requirements applicable in Denmark. Our responsibilities under those standards and requirements are further described in the Auditor’s Responsibilities for the Audit of the Financial Statements section of our report. We are independent of the Company in accordance with the International Ethics Standards Board for Accountants’ Code of Ethics for Professional Accountants (IESBA Code) and the additional requirements applicable in Denmark, and we havefulfilledourotherethicalresponsibilitiesinaccordancewiththeserequirements. We believe that the audit evidence we have obtained is sufficientandappropriatetoprovideabasisforouropinion.
Statement on Management ReportManagement is responsible for Management Report.
OuropiniononthefinancialstatementsdoesnotcoverManagementReport, and we do not express any form of assurance conclusion thereon.
Inconnectionwithourauditofthefinancialstatements,ourresponsibility is to read Management Report and, in doing so, consider whetherManagementReportismateriallyinconsistentwiththefinancialstatements or our knowledge obtained during the audit, or otherwise appears to be materially misstated.
Moreover, it is our responsibility to consider whether Management Report provides the information required under the Danish Financial Statements Act.
Based on the work we have performed, in our view, Management Report is in accordance with the Financial Statements and has been prepared in accordance with the requirements of the Danish Financial Statements Act. We did not identify any material misstatement in the Management Report.
Management’s Responsibilities for the Financial StatementsManagement is responsible for the preparation of Financial Statements that give a true and fair view in accordance with International Financial Reporting Standards as adopted by the EU and further requirements in the Danish Financial Statements Act, and for such internal control as Management determines is necessary to enable the preparation of financialstatementsthatarefreefrommaterialmisstatement,whetherdue to fraud or error.
Inpreparingthefinancialstatements,Managementisresponsiblefor assessing the Company’s ability to continue as a going concern, disclosing, as applicable, matters related to going concern and using the goingconcernbasisofaccountinginpreparingthefinancialstatementsunless Management either intends to liquidate the Company or to cease operations, or has no realistic alternative but to do so. Auditor’s Responsibilities for the Audit of the Financial StatementsOur objectives are to obtain reasonable assurance about whether the financialstatementsasawholearefreefrommaterialmisstatement,whether due to fraud or error, and to issue an auditor’s report that includes our opinion. Reasonable assurance is a high level of assurance, but is not a guarantee that an audit conducted in accordance with ISAs and the additional requirements applicable in Denmark will always detect a material misstatement when it exists. Misstatements can arise from fraud or error and are considered material if, individually or in the aggregate,theycouldreasonablybeexpectedtoinfluencetheeconomicdecisionsofuserstakenonthebasisofthesefinancialstatements.
As part of an audit conducted in accordance with ISAs and the additional requirements applicable in Denmark, we exercise professional judgment and maintain professional skepticism throughout the audit. We also:
• Identify and assess the risks of material misstatement of the financialstatements,whetherduetofraudorerror,designandperform audit procedures responsive to those risks, and obtain auditevidencethatissufficientandappropriatetoprovideabasisfor our opinion. The risk of not detecting a material misstatement
I N D E P E N D E N T A U D I T O R ’ S R E P O R TTo the Shareholder of Novo Holdings


NOVO HOLDINGS A/S ANNUAL REPORT 2017
22
DKK million Note 2017 2016
Income from Novo Group companies 2 6,033 7,142
Return from Life Science Investments 3 10,865 -1,534
Return from Financial Investments 4 3,806 2,758
Costs 5, 6, 7 -419 -212
Operating profit 20,285 8,155
Novo Nordisk Foundation’s share of return of joint investment portfolio -1,137 -1,000
Profit before tax 19,148 7,155
Income tax expense 8 0 -34
Total comprehensive income/Net profit for the year 19,148 7,121
Proposed distribution of profitProposed dividendRetained earnings
1,60017,548
137,108
19,148 7,121
XIIIS TAT E M E N T O F C O M P R E H E N S I V E I N C O M E
1 January to 31 December

NOVO HOLDINGS A/S ANNUAL REPORT 2017
23
DKK million Note 2017 2016
Assets
Novo Group companies 9 4,410 4,422
Life Science Investments 10 55,768 37,670
Financial Investments 11, 12 39,245 38,078
Property 419 -
Total non-current assets 99,842 80,170
Amounts owed by group companies 24 7
Other receivables 49 99
Cash at bank 208 695
Total current assets 281 801
Total assets 100,123 80,971
Equity and liabilities
Share capital 500 500
Retained earnings 85,697 66,562
Total equity 86,197 67,062
Real estate debt 249 -
Joint investment portfolio Novo Nordisk Foundation 13,260 13,573
Trade payables 13 23
Amounts owed to group companies 2 7
Tax payables 24 41
Other liabilities 57 45
Other provisions 14 321 220
Total current liabilities 13,926 13,909
Total liabilities 13,926 13,909
Total equity and liabilities 100,123 80,971
XIVS TAT E M E N T O F F I N A N C I A L P O S I T I O NYear end 31 December

NOVO HOLDINGS A/S ANNUAL REPORT 2017
24
MANAGEMENT REPORT 2017
24
DKK million 2017 2016
Net profit 19,148 7,121
-19,105 -7,607
- 2,900
-1,450
5,039
-1,070
1,182
-13,891
1,520
15,163
-8,723
177
18,935
-12,938
135
-17,786
182
Adjustment for non-cash items
Contribution from the Novo Nordisk Foundation to the joint investment portfolio
Repayments to the Novo Nordisk Foundation from the joint investment portfolio
Divestments of Life Science Investments
Investments in Life Science Investments
Received dividends Life Science Investments
Divestments of Financial Investments
Investments in Financial Investments
Received dividends Financial Investments
Paid corporation tax - -1
Cash flow before change in working capital -6,379 -4,690
Change in working capital
Changes in accounts with affiliated companies 2
Changes in other receivables 42
Changes in other liabilities
-21
50
3 34
Cash flow from operating activities -6,347 -4,612
373
5,673
240
6,909
-423 -
Investment activities
Proceeds from sale of shares in Novo Group
Received dividends Novo Group companies
Investment in property
Repayment of loans from subsidiaries - 87
Cash flow from investment activities 5,623 7,236
Financing activities
Real estate debt 250 -
Dividends paid -13 -3,008
Cash flow from financing activities 237 -3,008
Net cash flow
Cash and cash equivalents at the beginning of the year
-487
695
-384
1,079
Cash and cash equivalents at the end of the year 208 695
XVS TAT E M E N T O F C A S H F L O W S1 January to 31 December

NOVO HOLDINGS A/S ANNUAL REPORT 2017
25
MANAGEMENT REPORT 2017
25
DKK million Share capital Retained earnings Total
2017Equity at the beginning of the year 500 66,562 67,062
Net profit for the year 19,148 19,148
Dividends paid -13 -13
Equity at the end of the year 500 85,697 86,197
2016Equity at the beginning of the year 500 62,449 62,949
Net profit for the year 7,121 7,121
Dividends paid -3,008 -3,008
Equity at the end of the year 500 66,562 67,062
Share capital No.Nominal value
DKK million
A share capital (shares of DKK 1) 115,400,000 115
B share capital (shares of DKK 1) 384,600,000 385
Total share capital at 31 December 500,000,000 500
XVIS TAT E M E N T O F C H A N G E S I N E Q U I T Y
1 January to 31 December
Any share amount of DKK 1 of the A share capital carries ten votes, while any share amount of DKK 1 of the B share capital carries 1 vote.
There have been no changes in the share capital during the last five years.
Paid dividend per share equals DKK 0.03 (2016: DKK 6.02)

NOVO HOLDINGS A/S ANNUAL REPORT 2017
26
The principal accounting policies applied in the preparation of these financialstatementsaresetoutbelow.Thesepolicieshavebeenconsistently applied to all the years presented, unless otherwise stated.
Basis of preparationThefinancialstatementsincludedinthisAnnualReporthavebeenpreparedin accordance with International Financial Reporting Standards (IFRS) as issued by the International Accounting Standards Board (IASB) and endorsed by the EU as well as further Danish disclosure requirements for annualreportsofreportinglarge-sizedclassC(“RegnskabsklasseCstor”).
ThefinancialstatementsarepresentedinDKKmillionunlessotherwisestated.
Effects og new and amended accounting standardsThe company has adopted all new and amended standards and interpretationsissuedbyIASBandendorsedbytheEUeffectiveasof1 January 2017. The application of the new IFRS has not had a material impactontheFinancialStatementsin2017andnosignificantimpactonfuture periods from the adoption of these new IFRS’s are anticipated.
Thefollowingstandards,whicharenotyeteffective,arerelevantforthecompany:
• IFRS9Financialinstruments,whichwillbeeffectivefrom1January2018.
• IFRS16Leases,whichwillbeeffectivefrom1January2019.
It is the management’s assessment that the above-mentioned changes inaccountingstandardsandinterpretationswillnothaveanysignificantimpactonthefinancialstatementsuponadoptionofthesestandards.
Critical accounting policiesThe management of Novo Holdings considers the accounting policies for the investment categories set out below to be the most important to the company.
Investments in Novo Group companiesInvestmentsinthecategoryNovoGroupcompaniesaredefinedasbeingthe company's directly owned shares in Novo Nordisk A/S, Novozymes A/S and NNIT A/S.
Investments in Novo Group companies are included in the company’s financialstatementsatcost.Ifcostexceedstherecoverableamount,the carrying amount is written down to recoverable amount. Dividends received are included in ‘Income from Novo Group companies´ in the company’s statement of comprehensive income.
Life Science InvestmentsInvestmentsinthecategoryLifeScienceInvestmentsaredefinedasdirectorindirectinvestmentsinfinancialassetsthatareprimarilyrelatedtohealthcareanddoesnotmeetthedefinitionofinvestmentsinNovoGroup companies.
Subsidiaries,associatesandotherfinancialassetsthatfallintothiscategoryarerecognisedinaccordancewithIAS39as“Heldfortrading”atfairvaluethroughprofitorloss;Investmentsareinitiallyrecognisedatfair value plus transaction costs and subsequently adjusted to fair value.
Realised and unrealised gains and losses on fair value adjustments are recognisedinthestatementofcomprehensiveincomeinthefinancialyearinwhichtheyarise.Realisedgainsandlossesonsaleoffinancialassetsarecalculated on the basis of the original purchase price. Purchase and sale of Life Science Investments are recognised on the settlement date.
Dividendincomefromfinancialassetsatfairvaluethroughprofitorlossis recognised in the statement of comprehensive income within ‘Return from Life Science Investments’ when the company’s right to receive payments is established.
Interestondebtsecuritiesatfairvaluethroughprofitorlossisrecognisedin the statement of comprehensive income within ‘Return from Life ScienceInvestments’basedontheeffectiveinterestrate.
Financial InvestmentsInvestmentsinthecategoryFinancialInvestmentsaredefinedasinvestmentsinfinancialassetsthatdoesnotmeetthedefinitionofinvestments in Novo Group or Life Science Investments.
Subsidiaries,associatesandotherfinancialassetsthatfallintothiscategoryarerecognisedinaccordancewithIAS39as“Heldfortrading”atfairvaluethroughprofitorloss;Investmentsareinitiallyrecognisedatfair value plus transaction costs and subsequently adjusted to fair value.
N O T E 1 - S U M M A R Y O F S I G N I F I C A N T A C C O U N T I N G P O L I C I E S
NOTES

NOVO HOLDINGS A/S ANNUAL REPORT 2017
27
Realised and unrealised gains and losses on fair value adjustments are recognised in the statement of comprehensive income in the financial year in which they arise. Realised gains and losses on sale of financial assets are calculated on the basis of the original purchase price. Purchase and sale of Financial Investments are recognised on the settlement date.
Dividendincomefromfinancialassetsatfairvaluethroughprofitorloss is recognised in the statement of comprehensive income within ‘Return from Financial Investments’ when the company’s right to receive payments is established.
Interestondebtsecuritiesatfairvaluethroughprofitorlossisrecognisedin the statement of comprehensive income within ‘Return from Financial Investments’basedontheeffectiveinterestrate.
Fair value estimationPlease refer to Note 13.
Other accounting policiesTranslation of foreign currenciesThefinancialstatementsarepresentedinDanishkroner(DKK),whichisthe company’s functional currency and presentation currency.
Transactions in foreign currencies are translated into the functional currency at the exchange rates prevailing on the transaction dates. Foreign exchange gains and losses on completion of these transactions and on the translation of monetary assets and liabilities in foreign currencies to the exchange rates prevailing on the balance sheet date are recognised in the statement of comprehensive income.
Exchangeratedifferencesarisingonthetranslationofnon-monetaryitems,suchasotherfinancialinvestmentsatfairvaluerecognisedinthe statement of comprehensive income, are recognised as part of the gain or loss on fair value adjustments.
Derivative financial instrumentsNovo Holdings does not apply hedge accounting which is why value adjustments are recognised directly in the statement of comprehensive income under Return from Financial investments.
LeasingOperating lease costs are charged to the statement of comprehensive income over the period of the lease.
Other receivablesOther receivables comprise primarily accrued interest at year end on listed and unlisted bonds.
Other receivables are recognised at amortised cost less allowances for
doubtful trade receivables. The allowances are based on an individual assessment of each receivable.
TaxCorporation taxes in the statement of comprehensive income include tax payable for the year and change in provision for deferred tax.
Provision for deferred tax is based on the liability method and covers alltemporarydifferencesbetweencarryingandtaxvaluesandfromrealisable tax-loss carry-forwards.
The tax value of tax-loss carry-forwards is included in deferred tax assets to the extent that the tax losses and other tax assets are expected to be utilised in the future taxable income. The deferred taxes are measured according to current tax rules and at the tax rates expected to be in force oneliminationofthetemporarydifferences.Measurementofdeferredtaxes in Denmark is based on a tax rate of 22%.
Tax payable/receivable includes tax payable computed on the basis of the expected taxable income for the year and any adjustment for tax payable for previous years.
Novo Holdings is covered by the tax rules concerning compulsory joint taxation, as a result of which the company is jointly taxed with its Danish subsidiaries. Corporation tax is allocated between profit-making and lossmaking Danish companies in ratio to their taxable income. Provision is made for tax using the full allocation method.
CostsCosts comprise the costs incurred to investments and the administration of the company including transaction costs and salaries.
Employee benefitsWages, salaries, social security contributions, paid annual leave and sick leave,bonuses,andnon-monetarybenefitsarerecognisedintheyearinwhich the associated services are rendered by the company’s employees. Wherethecompanyprovideslong-termemployeebenefits,thecostsareaccrued to match the rendering of the services by the employees concerned.
PensionsThecompany’scontributionstodefinedcontributionplansarechargedtothe statement of comprehensive income in the year to which they relate.
ProvisionsProvisions are recognised where a legal or constructive obligation has been incurred, as a result of past events, and it is probable that it will lead toanoutflowofresourcesthatcanbereliablyestimated.Provisionsarerecognised for the estimated total liability that is expected to arise, taking intoaccountforeigncurrencyeffectsandthetimevalueofmoney.

NOVO HOLDINGS A/S ANNUAL REPORT 2017
28
PropertyProperty comprise the company’s domicile. Property is measured at cost, less subsequent depreciation and impairment losses, except for land, which is measured at cost less impairment losses. Depreciation is calculated using the straight-line method to allocate the cost of each asset to its residual value over its estimated useful life as follows:
• Buildings 50 years• Installations 20-50 years
The residual values and useful lives of the assets are reviewed and adjusted, if appropriate, at each balance sheet date.
Cost comprises acquisition price and expenses directly related to the acquisition until the time when the asset is ready for use. The cost of self-constructed assets comprises direct expenses for wage consumption and materials.
LiabilitiesLiabilitiesaregenerallyrecognisedatamortisedcostunlessspecifiedotherwise.
DividendsDividends are recognised as a liability in the period in which they are declared at the Annual General Meeting.
Cash flow statementThecashflowstatementispresentedinaccordancewiththeindirectmethodandshowstheCompany´scashflowsfortheyearbrokendownbyoperating,investingandfinancingactivities,changesfortheyear in cash and cash equivalents as well as the Company´s cash and cash equivalents at the beginning and end of the year.
Thecashflowstatementcannotbeimmediatelyderivedfromthepublishedfinancialrecords.
Cash flows from operating activitiesCashflowsfromoperatingactivitiesarecalculatedasthenetprofit/loss for the year adjusted for changes in working capital and noncash operating items such as depreciation, amortization and impairment losses, and provisions. Working capital comprises current assets less short-term debt excluding items included in cash and cash equivalents.
Cash flows from investing activitiesCashflowsfrominvestingactivitiescomprisecashflowsfromacquisitions and disposals of intangible assets, property, plant and equipmentaswellasfixedassetinvestments.
Cash flows from financing activitiesCashflowsfromfinancingactivitiescomprisecashflowsfromtheraisingandrepayment of long-term debt as well as payments to and from shareholders.
Cash and cash equivalentsCash and cash equivalents comprise solely cash at banks.
Critical accounting estimates and judgementsThepreparationoffinancialstatementsinconformitywithgenerallyaccepted accounting principles requires management to make estimates and assumptionsthataffectthereportedamountsofassetsandliabilitiesanddisclosure of contingent assets and liabilities on the balance sheet date(s) and the reported amounts of revenues and expenses during the reporting period(s). Management bases its estimates on historical experience and various other assumptions that are believed to be reasonable under the circumstances, the results of which form the basis for making judgements about the reported carrying amounts of assets and liabilities and the reported amounts of revenues and expenses that may not be readily apparent fromothersources.Actualresultscoulddifferfromthoseestimates.NovoHoldings believes the following to be the critical accounting estimates and relatedjudgementsusedinthepreparationofitsfinancialstatements.
Life Science InvestmentsInvestmentsinbiotechcompaniesareassociatedwithsignificantrisks,as they involve long-term investments in the development of new drugs and technologies. In accordance with the company’s investment strategy, Novo Holdings has a wide spread in its investments in terms of geographical location, technologies and stage of development in order to limit the risk. Life science investments are valued at fair value, if this can besetwithasufficientdegreeofreliability.Bynatureuncertaintiesexistsregarding fair value assesments of life science investments.
The company’s management reviews and assesses the value of the individual investments. Revaluation is carried out if there are current purchase prices for listed securities, and for for unlisted shares based ondeviationstotheresearchandbusinessplans,follow-upfinancinginthe companies and recent transactions for comparable companies.
Explanation of financial ratiosFinancialratioshavebeencalculatedinaccordancewiththe“GuidelinesandFinancialRatios2015”,issuedbytheDanishSocietyofFinancialAnalysts.
Equity ratio = Equity / Total liabilities and equity x 100

NOVO HOLDINGS A/S ANNUAL REPORT 2017
29
MANAGEMENT REPORT 2017
30
N OT E 2 - I N C O M E F R O M N O V O G R O U P
N O T E 3 - R E T U R N F R O M L I F ES C I E N C E I N V E S T M E N T S
N O T E 4 - R E T U R N F R O M F I N A N C I A LI N V E S T M E N T S
DKK million 2017 2016
5,330 6,592
316 279
27 38
Dividends received from Novo Nordisk A/S
Dividends received from Novozymes A/S
Dividends received from NNIT A/S
Gains from sale of shares in Novozymes A/S 360 233
Total Income for the year 6,033 7,142
DKK million 2017 2016
4,099 345Realised gains and returns for the year, net
Appreciation to fair value, net 6,766 -1,879
Total Investment Result for the year 10,865 -1,534
DKK million 2017 2016
3,489 1,739Realised gains and returns for the year, net
Appreciation to fair value, net 317 1,019
Total Investment Result for the year 3,806 2,758

NOVO HOLDINGS A/S ANNUAL REPORT 2017
30
MANAGEMENT REPORT 2017
31
N OT E 5 - C O S T SDKK million 2017 2016
Costs regarding Life Science Investments 162 189
Incentive fees 127 -65
Costs regarding Financial Investments 10 10
Administration & management 120 78
Total cost for the year 419 212
N OT E 6 - F E E TO STAT U TO RY AU D I TO R SDKK million 2017 2016
Statutory audit 0.6 0.6
Tax advisory service 1.9 1.2
Other services 6.0 0.8
Total fee to statutory auditors 8.5 2.6

NOVO HOLDINGS A/S ANNUAL REPORT 2017
31
MANAGEMENT REPORT 2017
32
N O T E 7 - E M P L O Y E E C O S T SDKK million 2017 2016
97 95
27 346
101 -411
15 12
Wages and salaries
Incentive fees, paid
Incentive fees, change in provision
Pension costs, defined contribution plans
Other employee costs 3 7
Total employee costs 243 49
Allocation of employee costs by category:
Life Science Investments 168 -9
Financial Investments 10 6
Administration & management 65 52
243 49
Hereof remuneration to Executive Management:
Salaries and short-term incentives 15 7
Long-term incentives 2 -
Pension 1 1
18 8
DKK thousands Board fee Committee work Total Board fee Committee work Total
Sten Scheibye 1,800 1,800 1,500 1,500
Göran Ando 650 350 1,000 500 325 825
Jeppe Christiansen 650 650 500 500
Per Wold-Olsen 650 450 1,100 500 425 925
Steen Riisgaard 650 650 500 500
Lars Rebien Sørensen 506 506
Jean-Luc Butel 367 350 717
Francis Cuss 293 293
5,566 1,150 6,716 3,500 750 4,250
Average number of full-time employees (no.) 51 41
Severance payment of DKK 23mn to former CEO is not included in the remuneration for 2016 above.In 2016 executive management consisted of Eivind Kolding (1 January - 29 February), Thomas Dyrberg (1 March - 31 August), Kasim Kutay (1 September - 31 December) and Peter Haahr (1 November - 31 December). Thomas Dyrberg was both Managing Partner, Novo Ventures and CEO in the period and we have allocated DKK 0.3mn of his remuneration to the CEO position.
Committee work consists of Novo Advisory Group. Board Fee also covers travel allowance.
In connection with his role as executive chairman from 1 March 2016 to 31 August 2016 Sten Scheibye received an extraordinary remuneration of DKK 2.5mn.
2017 2016
-
-
-
-
-
-
-
-
-
-
-
-
-
-
-
-
-
2017 2016

NOVO HOLDINGS A/S ANNUAL REPORT 2017
32
MANAGEMENT REPORT 2017
33
N O T E 8 - I N C O M E TA X E SDKK million 2017 2016
Computation of effective tax rate
Statutory tax rate 22.0% 22.0%
Non-taxable income less non-deductible expenses -20.2%
Deductable dividend -1.8%
-22.0%
0.0%
Effective tax rate 0.0% 0.0%
DKK million 2017 2016
Cost at the beginning of the year 4,422 4,429
Additions during the year - -
Disposals during the year -12 -7
Carrying amount at the end of the year 4,410 4,422
When assessing Danish corporation tax the company and all Danish subsidiaries are taxed jointly. Novo Holdings is the administrative body in relation to the joint taxation. The Danish group companies are jointly liable for corporation tax on the consolidated taxable income.
The joint income tax paid was DKK 7,329mn (DKK 6,057mn in 2016) for the current year, and received DKK 367mn (DKK 1,068mn in 2016) in taxes regarding the previous year.
N O T E 9 - N O V O G R O U P C O M P A N I E S
Valued at historical cost.
NOVO HOLDINGS A/S ANNUAL REPORT 2017
33
MANAGEMENT REPORT 2017
34
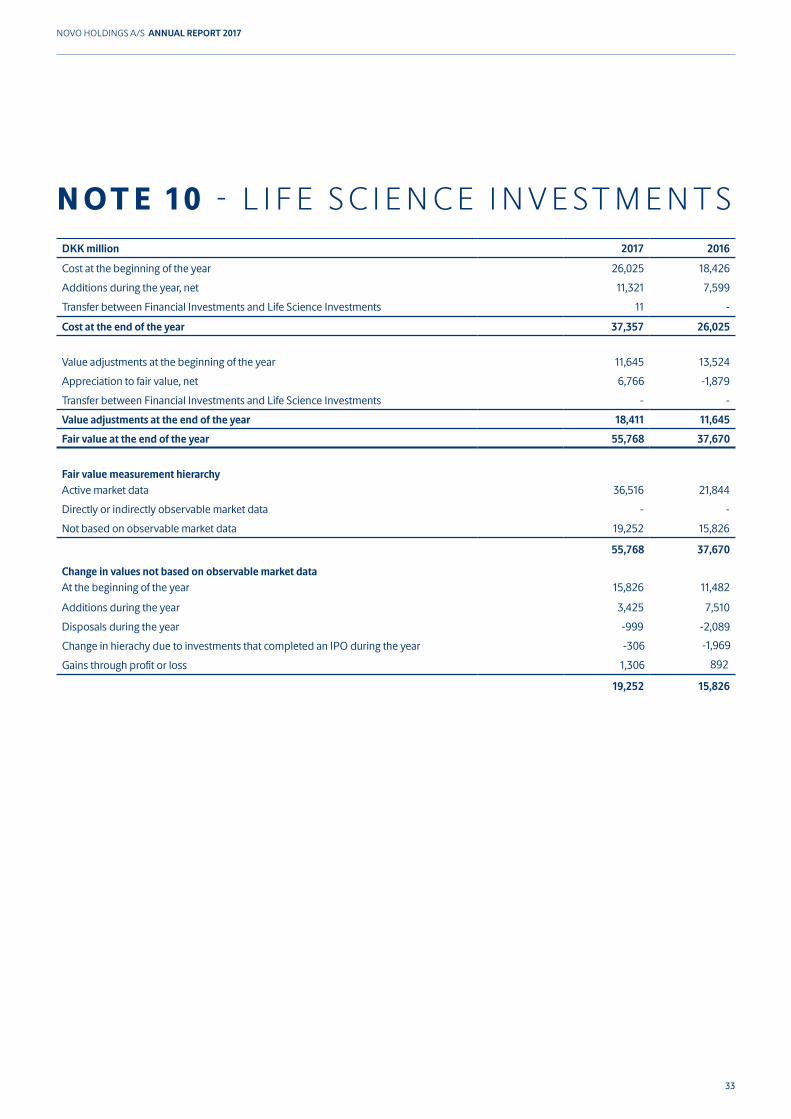
N OT E 1 0 - L I F E S C I E N C E I N V E S T M E N T SDKK million 2017 2016
Cost at the beginning of the year 26,025 18,426
Additions during the year, net 11,321 7,599
Transfer between Financial Investments and Life Science Investments 11 -
Cost at the end of the year 37,357 26,025
Value adjustments at the beginning of the year 11,645 13,524
Appreciation to fair value, net 6,766 -1,879
Transfer between Financial Investments and Life Science Investments - -
Value adjustments at the end of the year 18,411 11,645
Fair value at the end of the year 55,768 37,670
Fair value measurement hierarchyActive market data 36,516 21,844
Directly or indirectly observable market data - -
Not based on observable market data 19,252 15,826
55,768 37,670
Change in values not based on observable market dataAt the beginning of the year 15,826 11,482
Additions during the year 3,425 7,510
Disposals during the year -2,089
Change in hierachy due to investments that completed an IPO during the year
Gains through profit or loss
-999
-306
1,306
-1,969
892
19,252 15,826

NOVO HOLDINGS A/S ANNUAL REPORT 2017
34
MANAGEMENT REPORT 2017
35
N OT E 1 1 - F I N A N C I A L I N V E S T M E N T SDKK million 2017 2016
Cost at the beginning of the year 27,760 27,488
Additions during the year, net 861 272
Transfer between Financial Investments and Life Science Investments -11 -
Cost at the end of the year 28,610 27,760
Value adjustments at the beginning of the year 10,318 9,299
Appreciation to fair value, net 317 1,019
Transfer between Financial Investments and Life Science Investments - -
Value adjustments at the end of the year 10,635 10,318
Fair value at the end of the year 39,245 38,078
Fair value measurement hierarchyActive market data 33,480 33,294
Directly or indirectly observable market data 2,622 2,391
Not based on observable market data 3,143 2,393
39,245 38,078
Change in values not based on observable market dataAt the beginning of the year 2,393 2,338
Additions during the year 604 738
Disposals during the year -92 -706
Gains through profit or loss 238 23
3,143 2,393
7,632 6,142
5,427 5,896
23,043 23,096
Allocation of Financial InvestmentsShort term bonds
Corporate credits and emerging market bonds
Equities
Private equity and real estate companies 3,143 2,944
39,245 38,078

NOVO HOLDINGS A/S ANNUAL REPORT 2017
35
MANAGEMENT REPORT 2017
36
N OT E 1 2 - F I N A N C I A L I N S T R U M E N T S A N D F I N A N C I A L R I S K FA C TO R S
2017 2016
DKK millionContractamount
Market value 31 December
Contractamount
Market value 31 December
USD/DKK 1,737 7 4,173 -207
JPY/DKK 55 10 65 5
CHF/DKK 26 0 27 0
GBP/DKK 129 -1 286 -2
1,947 16 4,551 -204
Financial instrumentsThe company contracts derivatives to hedge financial assets based on individual considerations.
The table below shows the derivatives contracted to hedge currency exposure on investments which give rise to value adjustments in the statement of comprehensive income.
Market risk (interest rate exposure)Interest rate exposure arises in relation to interest-bearing assets and liabilities. Novo Holdings invests in bonds and high interest bonds (Rating AA-AAA).
Novo Holdings’ policy is to place the majority of the interest-bearing assets in Danish government bonds and domestic mortgage credit bonds, and a minority in different high interest bonds. The interest rate risk is not hedged through derivatives, but the duration of the portfolio is adjusted to a desired exposure. An increase of one percentage point in the interest rate would, other things being equal, result in an decrease in the portfolio of DKK 93mn (2016: DKK 166mn).
Market risk (share price)Share price risk arises in relation to investments in share-based assets. Novo Holdings invests in shares through mutual funds and discretionary mandates.
Novo Holdings’ policy is to place up to 80% of the securities in share-based assets. The share quotation risk is not hedged through derivatives.
Financial risk factors Currency exposureCurrency exposure arises when Novo Holdings invests in financial assets in other currencies than DKK. Financial assets are most exposed to the USD and EUR. An increase of 5% in the value of USD would, other things being equal, result in an increase in the value of the portfolio of DKK 188mn (2016: DKK 210mn). An increase of 2.25% in the value of EUR would, other things being equal, result in an increase in the value of the portfolio of DKK 58mn (2016: DKK 82mn).
Novo Holdings’ policy is not to hedge share-based assets, but to hedge bond-based and liquid assets based on individual considerations. Hedging of currency exposure is carried out through currency swaps, which generally have a maturity period that would not exceed six months.
Credit riskCredit risk occurs on financial assets. Novo Holdings’ policy is to have the majority of the bond-based investments in Danish government bonds and domestic mortgage credit bonds and a minority in different high interest bonds. Based on individual consideration of each asset it is decided whether the credit risk should be hedged through derivatives.
The forward exchange contracts are booked at market value and fall due in 2018

NOVO HOLDINGS A/S ANNUAL REPORT 2017
36
Fair value is the price that would be received by selling an asset or paid to transfer a liability in an orderly transaction between market participants at the measurement date.
Novo Holdings has implemented fair value guidelines and procedures, which ensure a consistent fair value measurement of each investment over time. Moreover, the fair value guidelines provide a framework for reasonable, consistent and transparent selection of valuation methodologies for valuing our investments. The selection criteria are in line with the value hierarchy in IFRS 13.
Hierarchy of fair value inputsInvestmentsmeasuredatfairvalueareclassifiedaccordingtoafairvaluehierarchy depending on the inputs used in the valuation method. The fair value hierarchy distinguishes between observable and unobservable inputs, which are categorised within one of the following levels:
Level 1 – Unadjusted quoted market prices for identical assets in an active market.
Level 2 - Inputs, other than quoted market prices included within Level 1, which are observable either directly or indirectly.
Level 3 – Inputs for the asset that are not based on observable market data.
SecuritiestradedonactivemarketsaregenerallyclassifiedinLevel1. Securities traded on inactive markets are generally categorised in level 2. Securities in private operating companies are generally categorised in level 3.
Investmentsinprivateinvestmentcompaniesareclassifiedinlevel2 or level 3 depending on the nature of their investment portfolios, their ability to liquidate their underlying investments, and any other restrictions on the disposition of the investments. If the investment can be redeemed at the reported net asset value on the measurement date or in the near future, the investment is categorised in level 2. Otherwise, the investment is categorised in level 3.
Policy for determining when transfers between levels are deemed to have occurred Transfers into level 3 occurs when quoted market prices (level 1) or other observable inputs (level 2) are no longer available. Transfers out of level 3
occurs if quoted market prices (level 1) or other observable inputs (level 2) becomes available (e.g. when a private company goes public through an IPO, equity investments in the company transfers from level 3 to level 1 as the shares can be valued using the quoted market price (level 1).
Valuation methods and inputThe general principle applied in selection of valuation approach maximizes the use of observable inputs and minimizes the use of unobservable inputs.
If a security trades in an active market the closing price based on the mid-pointinthebid-askspreadisapplied.Anactivemarketisdefinedasoneinwhichtransactionsforthesecurityoccurwithsufficientfrequencyandvolume to provide pricing information on an ongoing basis.
Should a security not trade in an active market it is initially booked and held atcostinthefirsttwelvemonthssucceedingtheinvestment,unlessanymaterial events occur within this timeframe. Beyond the twelve months window, the valuation methodology follows the following hierarchy below:
When independent broker quotes representing contemporaneous trades exist, these will be applied in estimating the fair value of the security;
Ifaportfoliocompanyhascarriedoutanyfinancingroundswithinthelasttwelvemonthsandthepricinginthefinancingroundislikelytorepresenta fair value, the fair value estimate is based on the price obtained in the financinground;
Ifneitherindependentbrokerquotesnorpricingfromfinancingroundsare available, the fair value will be based on application of a modelling approach, which again follows a strict hierarchy:
1. Ifthecompanyrunsanestablishedbusinesswithanidentifiablestreamofcontinuingearningsorcashflowsthatareconsideredto be maintainable, and it is possible to identify comparable companies in terms of risk attributes and earnings growth prospects, the fair value shall be based on application of the market approach (i.e. relevant multiples based on a set of comparable companies);
2. If no comparable companies in terms of risk attributes and earnings growthprospectscanbeidentified,thefairvalueshallbebasedonapplicationofanincomeapproach(i.e.adiscountedcashflowmodel);
N O T E 1 3 - F A I R V A L U E E S T I M AT I O N P O L I C I E S

NOVO HOLDINGS A/S ANNUAL REPORT 2017
37
3. Ifthecompanydoesnotrunanestablishedbusinesswithanidentifiablestreamofcontinuingearningsorcashflowsthatareconsideredtobe maintainable, the fair value shall be based on a value trigger approach, by which the fair value changes based on the occurrence of value triggering events.
Fair value measurement by hierarchyThe following table presents the categorised investments as of December 31 2017:
For the investments in unquoted equities, estimations of fair value rely substantially on non-observable input (level 3) such as pro-forma adjusted operating income multiplied by relevant multiples (e.g. EV/EBITDA) for a set of comparable companies less net interest bearing debt. If comparable companiesarenotavailableorapplicable,fairvalueestimationwillrelyonotherinputssuchasprojectedcashflowsdiscountedwithaweightedaverage cost of capital (WACC). Estimations of fair value that rely substantially on non-observable input (level 3) comprise a total value of DKK 22,395mn of which DKK 8,689mn has been valued by application of the income approach, DKK 8,163mn has been valued by application of trading multiples,andDKK5,543mnhasbeenvaluedbyapplicationofotherapproaches.Thefairvalueforeachinvestmentcanvarysignificantlyifoneormore of these inputs were changed.
The following table shows the range of inputs used in the valuation of unquoted equities.
DKK million Level 1 Level 2 Level 3 Total
Short term bonds 7,632 0 0 7,632
Corporate credits and emerging market bonds 2,805 2,622 0 5,427
Equities 23,043 0 0 23,043
Private Equity and real estate companies 0 0 3,143 3,143
Financial Investments in total 33,480 2,622 3,143 39,245
Life Science Investments 36,516 0 19,252 55,768
Total investments at fair value 69,996 2,622 22,395 95,013
Input Range Sensitivity
Multiples for comparable companies 14.2.-19.0x If multiples decreased by 1x, total investments at fair value would decrease by DKK 893mn
Pro-forma adjusted operating income
Individual
N/A
Weighted average cost of capital
4.1%-9.2%
If WACC increased by 1%-point, total investments at fair value would decrease by DKK 3,286mn
Projectedcashflows
Individual
N/A
Net interest-bearing debt Individual N/A

NOVO HOLDINGS A/S ANNUAL REPORT 2017
38
MANAGEMENT REPORT 2017
38
N OT E 1 4 - OT H E R P R O V I S I O N S
DKK million 2017 2016
Provision for incentive fees at the beginning of the year 220 631
Paid during the year -26 -346
Appreciation during the year, net 127 -65
Provision for incentive fees at the end of the year 321 220
Potential milestone payments related to Life Science Investments 375 2,080
Contractual obligations related to Life Science Investments 1,445 1,269
Contractual obligations related to Financial Investments 630 586
Total continget liabilities 2,075 1,855
In 2017, a Long Term Incentive Programme (the LTIP) was introduced to cover all employees in Novo Holdings, which, subject to meeting certain targets in 2017, 2018 and 2019, might be paid out in 2020. Based on the investment returns for 2017 we have made provision for this incentive scheme.
Further to this, provisions have been made to cover an older incentive scheme covering certain employees and middle managers within life science investment activities. This old incentive scheme will be phased out over during 2018 and 2019.
To cover potential future pay-outs related to these incentive schemes Novo Holdings has made provisions of DKK 321mn in 2017 (DKK 220mn in 2016). Of these provisions, the company expects to pay out DKK 231mn in 2018.
N OT E 1 5 - C O N T I N G E N TL I A B I L I T I E S /A S S E T SContingent assetsIn connection with Novo Holdings sale of certain Life Science companies, agreements on additional payments from the acquirers have been made if certain conditions are fulfilled. The total value of potential future milestone payments amounts to:
Contingent liabilitiesNovo Holdings is engaged in supporting biotech companies, either directly or through capital funds. In connection with previous investments in biotech companies Novo Holdings has committed to make the following investments:

NOVO HOLDINGS A/S ANNUAL REPORT 2017
39
N OT E 1 6 - R E L AT E D PA R T Y T R A N S A C T I O N S A N D O W N E R S H I P
DKK million 2017 2016
Novo Nordisk Foundation
Sale of services 20 14
Purchase of services 2 -
Novo Nordisk Foundation’s share of Joint investment portfolio 13,260 13,573
Novo Nordisk Foundation’s share of result from joint investment portfolio 1,137 1,000
Dividend payment to Novo Nordisk Foundation 13 3,008
Novo Ventures 1 A/SShort-term facility for investment in Alta BioPharma Partners, L.P., Clarus LIfesciencesIII, L.P., SFJ Pharmaceuticals IX L.P. and Leerink Transformation Fund I L.P. at 31 December
343 168
Novo Ventures (US), Inc.
Purchase of services 57 49
Other subsidiaries and associates
Loans to other subsidiaries 1,150 1,306
Loans to associates 81 839
Contingent liabilities regarding commitments to associates 586 586
Related party transactionsThe Novo Nordisk Foundation, Novo Ventures 1 A/S, Novo Ventures (US) Inc., the Sonion Group, the Xellia Group, the Novo Nordisk Group, the Novozymes Group, the NNIT Group, associated companies and the board of directors and the executive managements of Novo Nordisk Foundation and Novo Holdings are considered to be related
parties. All agreements have been negotiated on market-based terms, and the majority of the agreements are valid for one year.
In 2017 and 2016 Novo Holdings had the following transactions and outstanding balances with:
Apartfromthebalancesincludedinamountsowedbyandtoaffiliatedcompanies there are no unsettled transactions with related parties at the end of the year.
There have been no major transactions with the boards of directors or executive management of Novo Holdings, Novo Ventures 1 A/S, Novo Ventures (US), Inc., Xellia Group, Novo Nordisk Group, Novozymes Group, NNITGrouporassociatesotherthandisclosedinNote7“Employeecosts”.
Other than the above mentioned intercompany transactions and normal remuneration to management employees, no transactions have been concluded with the board of directors, management, management employees, major shareholders, or other related parties.
OwnershipPursuant to section 112(1) of the Danish Financial Statements Act,noconsolidatedfinancialstatementshavebeenprepared.Novo Holdings is a wholly owned subsidiary of the Novo Nordisk Foundationandisconsolidatedintothegroupfinancialstatements of the Novo Nordisk Foundation.
TheconsolidatedfinancialstatementsoftheNovoNordiskFoundation can be ordered at:
Novo Nordisk FoundationTuborg Havnevej 19DK-2900 HellerupMunicipaltyofGentofte,Denmark
NOVO HOLDINGS A/S ANNUAL REPORT 2017
40
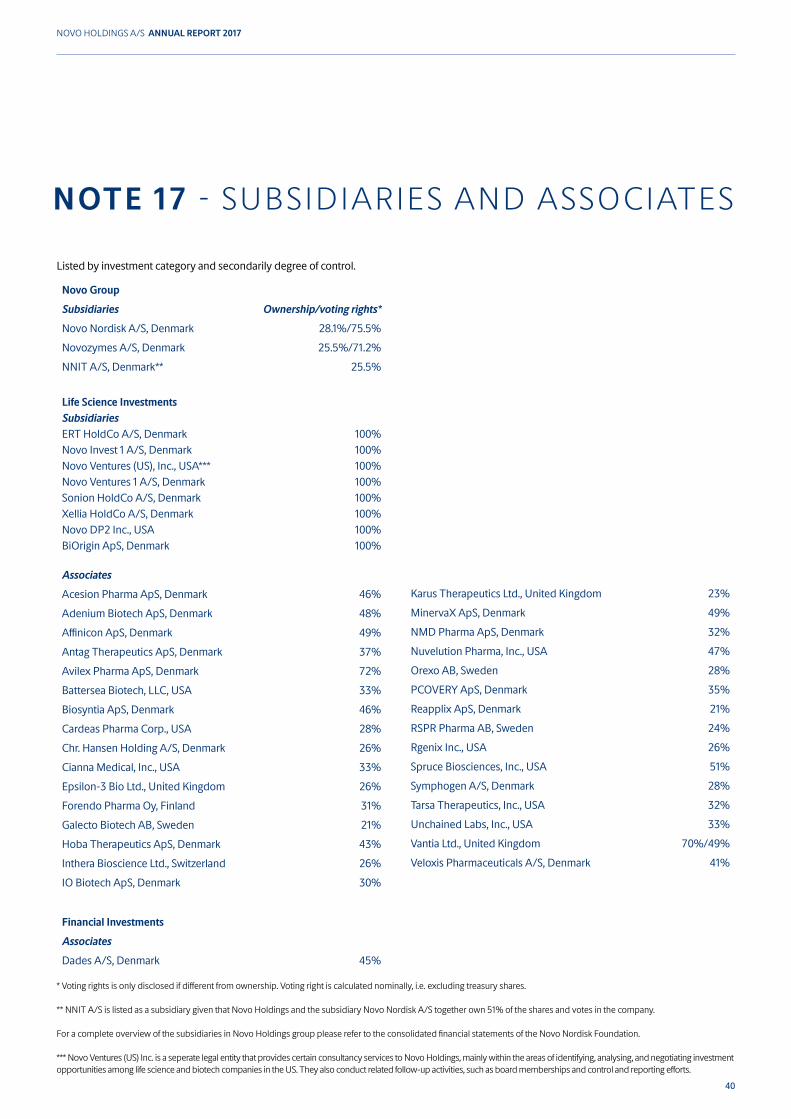
NOTE 17 - SUBSIDIARIES AND ASSOCIATES
Novo Group
Subsidiaries Ownership/voting rights*
Novo Nordisk A/S, Denmark 28.1%/75.5%
Novozymes A/S, Denmark 25.5%/71.2%
NNIT A/S, Denmark** 25.5%
Life Science InvestmentsSubsidiariesERT HoldCo A/S, Denmark Novo Invest 1 A/S, Denmark Novo Ventures (US), Inc., USA*** Novo Ventures 1 A/S, Denmark Sonion HoldCo A/S, Denmark Xellia HoldCo A/S, Denmark Novo DP2 Inc., USA BiOrigin ApS, Denmark
100% 100%100%100%100%100%100%100%
Associates
Acesion Pharma ApS, Denmark 46%
Adenium Biotech ApS, Denmark 48%
AffiniconApS,Denmark 49%
Antag Therapeutics ApS, Denmark 37%
Avilex Pharma ApS, Denmark 72%
Battersea Biotech, LLC, USA 33%
Biosyntia ApS, Denmark 46%
Cardeas Pharma Corp., USA 28%
Chr. Hansen Holding A/S, Denmark 26%
Cianna Medical, Inc., USA 33%
Epsilon-3 Bio Ltd., United Kingdom 26%
Forendo Pharma Oy, Finland 31%
Galecto Biotech AB, Sweden 21%
Hoba Therapeutics ApS, Denmark 43%
Inthera Bioscience Ltd., Switzerland 26%
IO Biotech ApS, Denmark 30%
Karus Therapeutics Ltd., United Kingdom 23%
MinervaX ApS, Denmark 49%
NMD Pharma ApS, Denmark 32%
Nuvelution Pharma, Inc., USA 47%
Orexo AB, Sweden 28%
PCOVERY ApS, Denmark 35%
Reapplix ApS, Denmark 21%
RSPR Pharma AB, Sweden 24%
Rgenix Inc., USA 26%
Spruce Biosciences, Inc., USA 51%
Symphogen A/S, Denmark 28%
Tarsa Therapeutics, Inc., USA 32%
Unchained Labs, Inc., USA 33%
Vantia Ltd., United Kingdom 70%/49%
Veloxis Pharmaceuticals A/S, Denmark 41%
Listed by investment category and secondarily degree of control.
Financial Investments
Associates
Dades A/S, Denmark 45%
* Voting rights is only disclosed if different from ownership. Voting right is calculated nominally, i.e. excluding treasury shares.
** NNIT A/S is listed as a subsidiary given that Novo Holdings and the subsidiary Novo Nordisk A/S together own 51% of the shares and votes in the company.
For a complete overview of the subsidiaries in Novo Holdings group please refer to the consolidated financial statements of the Novo Nordisk Foundation.
*** Novo Ventures (US) Inc. is a seperate legal entity that provides certain consultancy services to Novo Holdings, mainly within the areas of identifying, analysing, and negotiating investment opportunities among life science and biotech companies in the US. They also conduct related follow-up activities, such as board memberships and control and reporting efforts.


NOVO HOLDINGS A/S ANNUAL REPORT 2017
42
Novo Holdings A/STuborg Havnevej 19 2900 Hellerup Denmark +45 3527 6500CVR 24257630www.novoholdings.dk