
Record Rats Amarillo College Ceniza Trip 2004 Environmental Site Assessment Phase I Continued.

For Media Inquiries: 416-443-8159For All Other Inquiries: 416-443-8152
For Media Inquiries: 416-443-8159For All Other Inquiries: 416-443-8152
T O R O N T O R E A L E S T A T E B O A R D
TORONTO - Friday, December 3, 2004.
L ast month was a record Novemberand, with 79,382 sales for the year-to-date, 2004 is already the best
year the Toronto resale home market hasever experienced, TREB President RonAbraham announced today. “TheTorontoMLS system recorded 6,301single-family dwelling sales in November,”said the President. “This is an eight percent increase over November 2003(5,847 sales), which was the previoushigh-water mark for the month. WithDecember still to come, we expect tobreak 80,000 total sales by the end of2004, a first in Board history.”
Prices eased to $318,837 inNovember, a decline of two per centfrom the previous month. This wasabout the same as the decline betweenOctober and November 2003, whereprices fell one per cent to $301,612from $304,844. In addition, totalinventory came in at 20,273 activelistings, up 14 per cent over Novemberof 2003. “This indicates that we areentering a period of relative quietaround the Christmas holiday,” Mr.Abraham said. “However, we still expect
another 4,000 to 5,000 sales beforethe end of the year.”
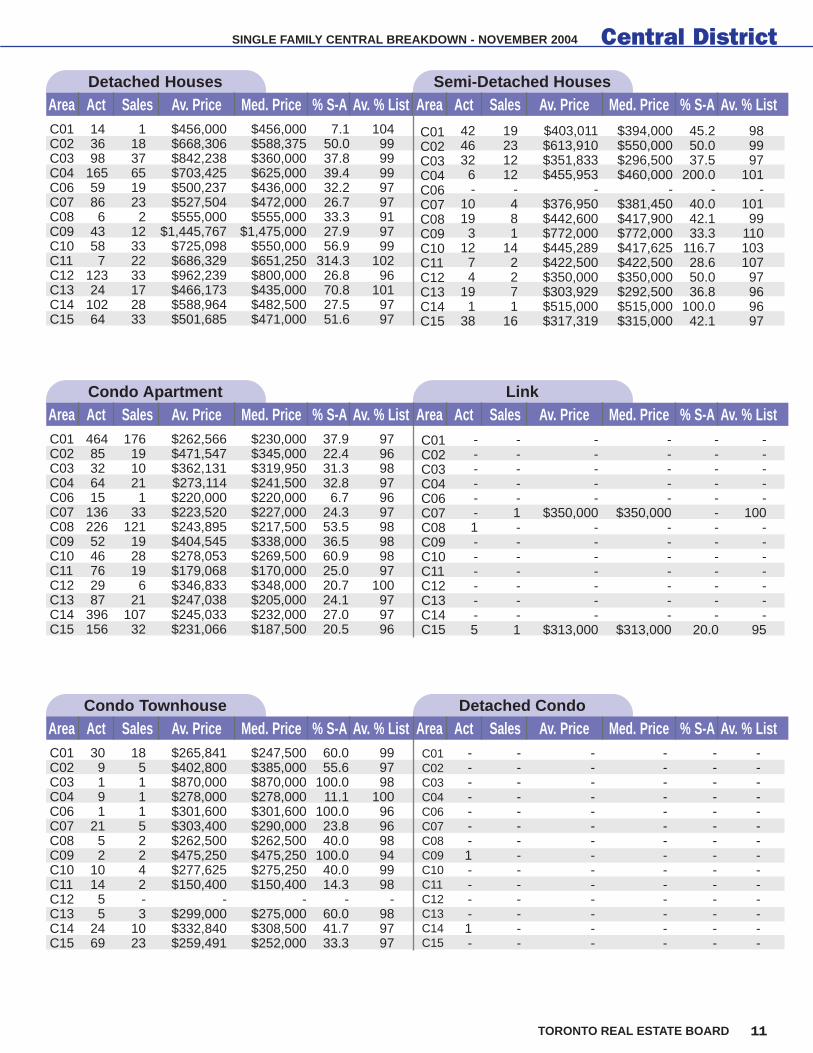
Breaking down the total, 2,401sales were reported in TREB’s 28 Westdistricts and averaged $296,689;1,201 sales were reported in the 14Central districts and averaged$413,445; 1,221 sales were reportedin the 23 North districts and averaged$347,481; and 1,478 sales werereported in TREB’s 21 East districtsand averaged $254,278. ■
November Breaks Record; 2004 Already Best Year Ever
NEIGHBOURHOOD CORNER
Orangeville The Orangeville area (W-29) has seen665 sales this year for an average of$224,307. The sales have increasedseven percent over the same elevenmonth period in 2003, and the price isup 10 per cent over the $204,387recorded at that time. Most (434) salesin Orangeville have been of detachedhomes, and these have averaged$253,405. There have also been 100semi-detached properties sold for anaverage of $177,717. ■
47.6
0.10.36.02.5
21.5
9.1
12.9
%
% %%
%
%
%
%
Dwelling Type Sales % Median
Detached 2,997 97 $338,000
Semi-Detached 814 98 $277,125
Condo Townhouse 573 97 $219,000
Condo Apt 1,354 97 $195,000
Link 157 98 $248,000
Att/Row/Twnhouse 379 98 $257,000
Co-op Apt 22 97 $185,500
Det Condo 5 93 $244,500
Nov. 2003 Nov. 2004 %Change
Housing Market Indicators
SINGLE FAMILY RESIDENTIAL BREAKDOWN
District Map ......................................................2Price Category Breakdown ..............................2East District ......................................................3West District .....................................................6Toronto District ...............................................10North District ..................................................12Annual Summary............................................16Single Family Comparison .............................16
0
10
20
30
40
50
NovOctSepAugJulJuneMayAprMarFebJanDecNov
Days on MarketDays on MarketDays on Market
2003 2004
DAYS ON MARKET
November 2004
Inside
Sales 5,847 6,301 (+8%)New Listings 8,632 9,565 (+11%)Active Listings* 17,827 20,273 (+13%)
* All figures for single-family dwellings.

401
Credit River
BBroc //SScu og TT
Durham/Northum
berlandLin
401 Hwyy.
/115
Taunton Rd.
Townline Rd.
Taunton Rd.4th Concession
Lawrence
Midland
KennedyRd.
St. Clair
DonVa
lleyP
arkway
Dufferin
Park
Yngge
Eglinton
LeslieBayyv
Danforth Ave.All
nRd.
St. Clair
Bloor
H umbe rRiver
409
n
Q.E.W.
Newmarket
Hwyy. 407
Bl on Rd.
Newmarket
Yongg
eiin
King/Vaughan
Hwy.404
Steeles
Hwy. 407
Whitchurch/Stouffville
Davis DriveHwy. 9
Hwy. 89
Steeles
York-DurhamLine
Hwy. 9
Orangeville
Peel TownlineW
inston CChhu
(17th Sideroad
M
dd.
Wellington Townline
Hwy. 50York-Peel Townline
Br mpton g
EtobicokeCreek
Hwy. 6
Wellington Townline
Halton Hills/Milton Townline
Bell School
NNiintth Line Dundas
BurlOak Rd.
RRiiver
Bloor
St. Clair
Bayview
Eglinton
401
C1
C2C3
C8C9
C10C11
W1W2W3
W4
W5
C4
C14C
C13C12
W6
Mavis
Burlington
Milton/Oakville Line
Winston
Churchill
Hamilton/Wentworth
Townline
Burlington
Oakville
Milton
North
Halton Hills
Milton
W25
W26
W27
W22
W21
W13 W12
W16 W15 W1W20
Caledon
W24
W28
Vaughan
King
N08
N14 Aurora
N01
N07 5th Concession
Markham
MarkhamUnionville
N10
N11
N12
N13Regional30
New Tecumseth BradfordWest GwillimburyN19
N18East Gwillimbury
N15
Uxbridge
N16
Lake Simcoe
Georgina
N17
Rouge River
PickeringTownline
DDurham23
Durham23
401
6th Concession
Townline
Durham23
E12
AjaxPickering
Pickering
WhitbyOshawa
E13
E18
E14 E15
E19
E16
Scugog
Brock
E21
N24
Lake Scugog
ScugogIsland
NewcastleBowmanville
E17 E20
Morningside
Markham
Rd.
Brimley Rd.
Coxwell
Lake Ontario
Lake Ontario
E1
E6E3
E2
E4
E5 E7 E11
E10
E8
E9
Pickering-Ajax
N
Bathurst
Regional38
East Gwillimbury
Regional 32
iiona22
Hwy. 9Hwy. 9
Hwy.27
Adjala
N20
TosorontioN21 Essa
N22 InnisfilN23
Hwy. 90
Dufferin/SimcoeLine
Regional15
Hwy. 89
B willimbury/InnisfilDurham
-VictoriRegional22
NewTecum
seth-AdjalaLine
NeTec
mseth/Bradford
–W
estGwillimbury
Sunnidale Townline Vespra
410
Township Line
W29
2
District Map
TORONTO REAL ESTATE BOARD
- - $90,000 19 0.3 10 0.7 2 0.3$90,001 - $100,000 24 0.4 15 1.1 3 0.5$100,001 - $110,000 23 0.4 13 1.0 4 0.7$110,001 - $120,000 28 0.4 19 1.4 2 0.3$120,001 - $130,000 45 0.7 31 2.3 6 1.0$130,001 - $140,000 71 1.1 48 3.5 9 1.6$140,001 - $150,000 135 2.1 86 6.4 29 5.1$150,001 - $160,000 169 2.7 109 8.1 24 4.2$160,001 - $170,000 210 3.3 121 8.9 34 5.9$170,001 - $180,000 201 3.2 112 8.3 37 6.5$180,001 - $190,000 196 3.1 90 6.6 32 5.6$190,001 - $200,000 172 2.7 66 4.9 34 5.9$200,001 - $225,000 534 8.5 159 11.7 97 16.9$225,001 - $250,000 671 10.6 118 8.7 110 19.2$250,001 - $300,000 1,264 20.1 168 12.4 101 17.6$300,001 - $400,000 1,412 22.4 122 9.0 32 5.6$400,001 - $500,000 567 9.0 39 2.9 7 1.2$500,001 - $750,000 360 5.7 15 1.1 8 1.4$750,001 - $1,000,000 118 1.9 7 0.5 2 0.3$1,000,001 - $1,500,000 56 0.9 5 0.4 - -$1,500,001 - - 26 0.4 1 0.1 - -Total: - - 6,301 100 1,354 100 573 100
Price Category Breakdown - November 2004Price Range Total S.F.D %S.F.D Condo Apt. %Condo Apt. Condo T.H. %Condo T.H.

3
East District
TORONTO REAL ESTATE BOARD
Area Active New Sales $ Volume Avg Price Med Price Avg DOM Avg %List
E01 160 130 85 $25,314,500 $297,818 $279,500 20 99E02 112 91 72 $26,663,269 $370,323 $338,900 26 99E03 292 157 111 $32,359,750 $291,529 $275,000 26 99E04 331 144 85 $19,268,444 $226,688 $242,000 39 98E05 319 153 80 $21,392,529 $267,407 $258,500 38 97E06 116 71 46 $12,303,629 $267,470 $253,250 24 97E07 406 159 72 $17,916,900 $248,846 $242,000 48 97E08 336 151 64 $16,830,680 $262,979 $253,650 42 97E09 344 134 89 $18,801,968 $211,258 $202,500 34 97E10 196 90 39 $11,253,400 $288,549 $285,000 33 96E11 529 194 91 $21,885,400 $240,499 $240,000 43 97E12 43 23 12 $3,025,000 $252,083 $246,500 39 98E13 297 124 72 $20,104,850 $279,234 $248,000 34 98E14 296 161 90 $23,436,266 $260,403 $257,250 37 97E15 318 166 128 $32,336,189 $252,626 $240,000 32 98E16 415 198 173 $30,640,600 $177,113 $172,500 37 97E17 211 124 103 $22,451,420 $217,975 $205,000 38 98E18 28 3 2 $1,197,100 $598,550 $598,550 87 99E19 56 22 18 $6,209,000 $344,944 $301,250 42 98E20 85 28 19 $5,182,300 $272,753 $251,000 63 96E21 83 31 27 $7,250,200 $268,526 $245,000 42 98Total 4,973 2,354 1,478 $375,823,394 $254,278 $242,700 35 98
Current Month: November 2004
E01 1,525 888 $282,720,612 $318,379 $299,395 19 101E02 1,360 885 $350,644,604 $396,209 $350,000 19 100E03 2,412 1,399 $392,518,234 $280,571 $272,500 25 99E04 1,883 917 $211,273,646 $230,397 $245,500 35 97E05 2,176 1,164 $306,593,464 $263,396 $247,000 35 97E06 983 568 $174,652,403 $307,487 $260,000 23 98E07 2,457 1,164 $299,965,108 $257,702 $257,500 37 97E08 1,977 935 $235,609,324 $251,989 $250,382 37 97E09 2,107 1,047 $227,878,963 $217,649 $206,000 42 97E10 1,191 604 $182,751,850 $302,569 $290,500 29 98E11 2,732 1,053 $249,942,760 $237,363 $230,000 41 97E12 395 246 $61,429,386 $249,713 $237,000 30 98E13 1,966 1,159 $319,309,033 $275,504 $260,000 31 98E14 2,309 1,403 $359,244,597 $256,055 $245,000 29 98E15 2,465 1,528 $397,555,715 $260,180 $242,500 28 98E16 3,559 2,547 $474,134,178 $186,154 $177,000 29 98E17 1,813 1,277 $277,628,935 $217,407 $202,000 30 98E18 121 47 $22,904,500 $487,330 $405,000 50 95E19 445 299 $88,539,909 $296,120 $276,000 33 98E20 422 240 $60,631,333 $252,631 $229,950 51 97E21 631 412 $116,332,725 $282,361 $254,450 47 97Total 34,929 19,782 $5,092,261,279 $257,419 $241,000 31 98
Area Listed Sales $ Volume Avg Price Med Price Avg DOM Avg %ListYear-to-Date: January 2004 to November 2004

4
East District
TORONTO REAL ESTATE BOARD
SINGLE FAMILY EAST BREAKDOWN - NOVEMBER 2004
Semi-Detached HousesDetached HousesArea Act Sales Av. Price Med. Price % S-A Av. % ListE01 36 15 $328,907 $320,000 41.7 98E02 29 21 $472,518 $411,000 72.4 98E03 126 55 $320,344 $290,000 43.7 98E04 126 41 $283,394 $268,000 32.5 98E05 94 27 $359,594 $346,500 28.7 96E06 94 35 $285,229 $265,000 37.2 98E07 159 27 $337,167 $325,000 17.0 97E08 133 39 $313,672 $290,000 29.3 96E09 112 33 $271,264 $273,600 29.5 96E10 145 28 $316,711 $307,500 19.3 96E11 190 41 $295,122 $286,500 21.6 97E12 28 8 $278,563 $262,000 28.6 98E13 182 36 $355,139 $321,000 19.8 97E14 219 68 $275,998 $270,000 31.1 97E15 211 67 $288,384 $285,000 31.8 97E16 294 111 $192,736 $190,000 37.8 97E17 132 58 $242,056 $224,950 43.9 98E18 28 2 $598,550 $598,550 7.1 99E19 52 14 $375,393 $324,950 26.9 98E20 77 17 $282,141 $263,000 22.1 96E21 81 24 $275,013 $262,250 29.6 98
E01E02E03E04E05E06E07E08E09E10E11E12E13E14E15E16E17E18E19E20E21
Area Act Sales Av. Price Med. Price % S-A Av. % List
20
40
60
80
100
NovOctSepAugJulJunMayAprMarFebJanDecMov
East DistrictSales Active Listing Ratio
2003 2004
20
30
40
50
60
NovOctSepAugJulJunMayAprMarFebJanDecNov
East DistrictDays on Market
2003 2004
85 53 $299,308 $287,000 62.4 9951 39 $338,244 $335,000 76.5 9949 30 $319,482 $317,950 61.2 10121 2 $223,500 $223,500 9.5 9813 5 $301,020 $286,800 38.5 9916 8 $214,829 $229,065 50.0 9531 4 $275,125 $264,000 12.9 9816 2 $225,500 $225,500 12.5 938 2 $226,350 $226,350 25.0 987 3 $279,333 $280,000 42.9 99
53 12 $250,167 $252,750 22.6 983 1 $195,000 $195,000 33.3 98
29 3 $275,133 $296,000 10.3 989 6 $223,800 $217,150 66.7 98
15 13 $219,300 $216,500 86.7 9853 24 $162,513 $160,000 45.3 989 3 $164,500 $164,500 33.3 99- - - - - -- - - - - -- - - - - -- 1 $165,000 $165,000 - 97

5
East District
TORONTO REAL ESTATE BOARD
SINGLE FAMILY EAST BREAKDOWN - NOVEMBER 2004
LinkCondo ApartmentArea Act Sales Av. Price Med. Price % S-A Av. % ListE01 6 3 $249,600 $258,900 50.0 102E02 16 8 $290,113 $291,500 50.0 99E03 109 21 $183,781 $155,000 19.3 98E04 130 30 $145,963 $147,750 23.1 97E05 141 26 $192,296 $191,650 18.4 97E06 5 2 $173,500 $173,500 40.0 97E07 145 29 $167,431 $168,000 20.0 96E08 125 12 $160,090 $157,540 9.6 98E09 161 46 $172,165 $171,500 28.6 97E10 13 4 $149,625 $158,250 30.8 95E11 147 16 $141,938 $148,000 10.9 96E12 4 - - - - -E13 16 11 $171,973 $170,000 68.8 98E14 17 5 $174,420 $160,100 29.4 98E15 6 4 $159,250 $156,000 66.7 98E16 10 2 $135,500 $135,500 20.0 95E17 4 1 $130,000 $130,000 25.0 99E18 - - - - - -E19 - - - - - -E20 - - - - - -E21 2 - - - - -
Area Act Sales Av. Price Med. Price % S-A Av. % ListE01E02E03E04E05E06E07E08E09E10E11E12E13E14E15E16E17E18E19E20E21
- - - - - -- - - - - -- - - - - -- - - - - -8 5 $303,600 $304,000 62.5 97- - - - - -
21 3 $259,500 $263,500 14.3 972 - - - - -- - - - - -1 1 $247,000 $247,000 100.0 99
16 1 $310,000 $310,000 6.3 971 - - - - -9 4 $234,875 $223,000 44.4 97
12 2 $231,000 $231,000 16.7 9737 16 $227,538 $224,000 43.2 9810 9 $183,111 $186,000 90.0 9849 26 $199,876 $196,750 53.1 98
- - - - - -2 2 $235,750 $235,750 100.0 994 2 $192,950 $192,950 50.0 100- 2 $242,450 $242,450 - 99
Detached CondoCondo TownhouseArea Act Sales Av. Price Med. Price % S-A Av. % ListE01 5 - - - - -E02 7 1 $226,000 $226,000 14.3 95E03 3 1 $170,000 $170,000 33.3 94E04 47 12 $235,283 $231,250 25.5 98E05 58 17 $215,335 $218,000 29.3 97E06 - 1 $255,000 $255,000 - 96E07 32 6 $224,950 $222,900 18.8 97E08 47 9 $192,278 $203,000 19.2 97E09 60 7 $177,571 $180,000 11.7 96E10 12 1 $167,000 $167,000 8.3 98E11 62 11 $182,318 $175,000 17.7 97E12 5 3 $200,500 $203,500 60.0 97E13 49 11 $193,523 $187,000 22.5 98E14 15 4 $203,000 $210,000 26.7 97E15 12 8 $204,619 $201,500 66.7 98E16 43 19 $121,200 $130,000 44.2 98E17 4 4 $167,475 $165,500100.0 98E18 - - - - - -E19 1 - - - - -E20 4 - - - - -E21 - - - - - -
Area Act Sales Av. Price Med. Price % S-A Av. % ListE01E02E03E04E05E06E07E08E09E10E11E12E13E14E15E16E17E18E19E20E21
- - - - - -- - - - - -- - - - - -- - - - - -- - - - - -- - - - - -- - - - - -- - - - - -- - - - - -- - - - - -3 - - - - -- - - - - -- - - - - -1 - - - - -- - - - - -- - - - - -- - - - - -- - - - - -- - - - - -- - - - - -- - - - - -

6
East District
TORONTO REAL ESTATE BOARD
W01 120 77 61 $23,614,393 $387,121 $365,000 29 99W02 184 84 69 $24,079,400 $348,977 $310,000 30 98W03 246 106 56 $13,842,900 $247,195 $247,500 38 96W04 224 114 65 $15,626,100 $240,402 $239,900 38 97W05 339 128 67 $16,547,050 $246,971 $280,000 43 96W06 261 126 99 $31,214,840 $315,301 $282,000 45 97W07 87 60 44 $17,552,300 $398,916 $388,500 28 99W08 224 97 92 $38,561,328 $419,145 $359,000 33 98W09 170 69 47 $13,690,850 $291,295 $315,000 35 97W10 429 170 104 $24,730,900 $237,797 $253,750 48 97W12 209 98 86 $28,483,578 $331,204 $272,950 47 97W13 223 120 73 $28,515,350 $390,621 $294,000 32 97W14 137 64 49 $13,195,600 $269,298 $281,000 41 96W15 564 253 139 $28,675,600 $206,299 $180,000 44 97W16 194 115 82 $23,932,850 $291,864 $278,000 32 97W17 1 1 1 $345,000 $345,000 $345,000 70 93W18 144 54 27 $5,866,100 $217,263 $230,000 43 97W19 602 284 199 $59,508,600 $299,038 $286,000 31 97W20 514 293 187 $54,662,550 $292,313 $283,000 33 98W21 234 111 81 $31,087,692 $383,799 $350,000 42 97W22 102 57 23 $6,179,500 $268,674 $270,000 24 97W23 1,148 560 321 $85,901,201 $267,605 $255,000 40 98W24 728 358 201 $53,192,925 $264,641 $253,000 37 97W25 63 31 25 $9,321,500 $372,860 $344,500 44 98W26 7 2 1 $700,000 $700,000 $700,000 105 95W27 155 74 70 $19,722,200 $281,746 $255,000 32 98W28 202 81 71 $29,964,400 $422,034 $345,000 54 96W29 105 55 61 $13,635,099 $223,526 $219,900 44 98Total 7,616 3,642 2,401 $712,349,806 $296,689 $269,900 38 97
Area Active New Sales $ Volume Avg Price Med Price Avg DOM Avg %List
Current Month: November 2004
West District
SINGLE FAMILY EAST BREAKDOWN - NOVEMBER 2004
Attached/Row/TownhouseCo-op ApartmentArea Act Sales Av. Price Med. Price % S-A Av. % ListE01 - - - - - -E02 1 1 $289,000 $289,000 100.0 96E03 1 - - - - -E04 3 - - - - -E05 1 - - - - -E06 - - - - - -E07 4 - - - - -E08 2 - - - - -E09 2 - - - - -E10 2 - - - - -E11 3 - - - - -E12 - - - - - -E13 - 1 $188,000 $188,000 - 99E14 - - - - - -E15 - - - - - -E16 - - - - - -E17 1 - - - - -E18 - - - - - -E19 - - - - - -E20 - - - - - -E21 - - - - - -
Area Act Sales Av. Price Med. Price % S-A Av. % ListE01E02E03E04E05E06E07E08E09E10E11E12E13E14E15E16E17E18E19E20E21
28 14 $269,200 $268,500 50.0 988 2 $356,500 $356,500 25.0 984 4 $281,750 $281,500 100.0 984 - - - - -4 - - - - -1 - - - - -
14 3 $243,067 $245,000 21.4 9711 2 $247,450 $247,450 18.2 981 1 $235,000 $235,000 100.0 97
16 2 $267,500 $267,500 12.5 9655 10 $219,690 $212,000 18.2 972 - - - - -
12 6 $224,417 $229,000 50.0 9723 5 $235,900 $240,000 21.7 9937 20 $212,450 $210,500 54.1 995 8 $140,600 $153,000 160.0 97
12 11 $174,727 $181,000 91.7 99- - - - - -1 2 $241,000 $241,000 200.0 99- - - - - -- - - - - -

TORONTO REAL ESTATE BOARD
SINGLE FAMILY WEST BREAKDOWN - NOVEMBER 2004
7
West District
W01 891 572 $227,898,748 $398,424 $369,500 28 100W02 1,351 754 $273,956,902 $363,338 $321,000 26 99W03 1,550 763 $181,794,416 $238,263 $237,000 34 97W04 1,433 773 $192,318,489 $248,795 $250,000 36 97W05 1,800 937 $222,227,076 $237,169 $264,000 38 97W06 1,727 986 $293,537,343 $297,705 $280,000 39 98W07 733 463 $179,442,548 $387,565 $366,500 29 100W08 1,862 1,174 $519,142,411 $442,200 $365,000 32 98W09 1,008 499 $147,042,314 $294,674 $310,000 35 98W10 2,244 1,098 $251,317,453 $228,887 $243,250 41 97W12 1,587 985 $331,971,995 $337,027 $290,000 34 97W13 1,609 954 $386,039,935 $404,654 $320,000 31 98W14 988 641 $165,752,738 $258,585 $247,900 34 97W15 2,928 1,575 $323,441,221 $205,360 $182,000 38 97W16 1,663 1,084 $327,048,503 $301,705 $274,000 29 98W17 3 2 $985,000 $492,500 $492,500 139 87W18 854 405 $93,054,349 $229,764 $242,000 39 97W19 4,559 2,661 $801,551,462 $301,222 $285,000 31 98W20 4,422 2,958 $866,565,484 $292,957 $275,000 27 98W21 1,627 988 $380,340,800 $384,960 $329,000 37 98W22 574 323 $92,050,150 $284,985 $265,900 28 98W23 7,701 4,295 $1,126,292,762 $262,233 $253,000 33 98W24 4,946 2,775 $716,501,483 $258,199 $250,000 32 98W25 347 206 $61,613,690 $299,096 $254,850 37 98W26 39 21 $10,508,400 $500,400 $457,000 52 96W27 1,094 779 $226,381,782 $290,606 $261,000 32 98W28 1,285 798 $304,489,049 $381,565 $332,000 41 97W29 899 665 $149,163,928 $224,307 $217,000 33 98Total 51,724 30,134 $8,852,430,431 $293,769 $265,000 33 98
Area Listed Sales $ Volume Avg Price Med Price Avg DOM Avg %ListYear-to-Date: January 2004 to November 2004
20
40
60
80
100
NovOctSepAugJulJunMayAprMarFebJanDecNov
West DistrictSales Active Listing Ratio
2003 2004
20
30
40
50
60
NovOctSepAugJulJunMayAprMarFebJanDecNov
West DistrictDays on Market
2003 2004

8
West District
TORONTO REAL ESTATE BOARD
SINGLE FAMILY WEST BREAKDOWN - NOVEMBER 2004
Semi-Detached HousesDetached HousesArea Act Sales Av. Price Med. Price % S-A Av. % List
W01W02W03W04W05W06W07W08W09W10W12W13W14W15W16W17W18W19W20W21W22W23W24W25W26W27W28W29
Area Act Sales Av. Price Med. Price % S-A Av. % ListW01 31 24 $488,312 $420,000 77.4 98W02 62 26 $468,269 $428,000 41.9 98W03 137 32 $256,784 $260,000 23.4 96W04 118 29 $313,317 $290,000 24.6 98W05 63 17 $317,147 $310,000 27.0 95W06 82 36 $305,042 $289,000 43.9 96W07 42 33 $423,952 $406,000 78.6 99W08 93 50 $553,509 $424,000 53.8 99W09 40 28 $374,423 $356,950 70.0 98W10 165 52 $306,358 $282,500 31.5 97W12 112 38 $452,957 $363,750 33.9 97W13 121 36 $553,789 $543,500 29.8 97W14 52 15 $391,467 $390,500 28.9 96W15 35 12 $348,100 $348,500 34.3 98W16 87 37 $355,222 $325,000 42.5 98W17 - 1 $345,000 $345,000 - 93W18 51 8 $255,163 $260,950 15.7 97W19 284 75 $389,101 $371,500 26.4 97W20 251 82 $355,965 $345,000 32.7 97W21 169 56 $429,000 $403,500 33.1 98W22 78 10 $315,700 $311,000 12.8 96W23 703 176 $303,299 $289,000 25.0 98W24 413 93 $323,402 $322,000 22.5 97W25 38 17 $445,441 $397,000 44.7 97W26 7 1 $700,000 $700,000 14.3 95W27 130 55 $302,425 $271,000 42.3 98W28 186 55 $475,055 $390,000 29.6 96W29 78 37 $260,643 $245,000 47.4 98
LinkCondo ApartmentArea Act Sales Av. Price Med. Price % S-A Av. % List
W01W02W03W04W05W06W07W08W09W10W12W13W14W15W16W17W18W19W20W21W22W23W24W25W26W27W28W29
Area Act Sales Av. Price Med. Price % S-A Av. % ListW01 48 16 $235,813 $232,000 33.3 97W02 3 3 $280,667 $317,000 100.0 97W03 23 5 $164,800 $146,000 21.7 97W04 74 21 $136,090 $138,000 28.4 95W05 121 19 $131,513 $145,000 15.7 94W06 146 40 $336,509 $250,450 27.4 97W07 36 5 $189,880 $182,000 13.9 97W08 102 34 $236,159 $180,500 33.3 97W09 112 14 $138,643 $131,000 12.5 94W10 186 33 $146,661 $149,000 17.7 97W12 61 34 $199,318 $175,750 55.7 97W13 35 8 $165,300 $158,750 22.9 98W14 38 9 $162,744 $153,000 23.7 96W15 461 97 $176,773 $171,000 21.0 97W16 28 8 $206,750 $172,500 28.6 94W17 - - - - - -W18 10 2 $141,750 $141,750 20.0 96W19 152 30 $188,590 $165,000 19.7 97W20 35 8 $156,750 $158,000 22.9 96W21 14 4 $415,125 $417,750 28.6 98W22 - 1 $160,000 $160,000 - 96W23 33 11 $193,136 $181,000 33.3 97W24 94 18 $150,332 $145,250 19.2 96W25 6 1 $172,000 $172,000 16.7 100W26 - - - - - -W27 3 1 $193,000 $193,000 33.3 99W28 - - - - - -W29 16 2 $157,500 $157,500 12.5 95
1 - - - - -- - - - - -- - - - - -- - - - - -- - - - - -- - - - - -- - - - - -- - - - - -1 1 $295,000 $295,000 100.0 985 - - - - -- 1 $305,000 $305,000 - 105
- - - - - -3 2 $324,750 $324,750 66.7 971 - - - - -3 2 $265,000 $265,000 66.7 98- - - - - -- - - - - -3 5 $286,600 $285,000 166.7 998 1 $300,000 $300,000 12.5 973 1 $280,000 $280,000 33.3 972 - - - - -5 1 $228,000 $228,000 20.0 953 - - - - -1 - - - - -- - - - - -1 - - - - -- 1 $287,000 $287,000 - 1001 1 $176,000 $176,000 100.0 98
22 17 $394,641 $384,000 77.3 10187 27 $291,796 $265,000 31.0 9878 17 $257,724 $252,500 21.8 9713 7 $249,357 $257,500 53.9 9788 24 $298,596 $295,500 27.3 9713 12 $305,125 $288,750 92.3 992 - - - - -1 - - - - -3 2 $279,000 $279,000 66.7 96
14 3 $269,833 $268,000 21.4 9814 2 $300,000 $300,000 14.3 9820 11 $259,086 $245,000 55.0 9810 10 $285,150 $288,750 100.0 9718 8 $296,313 $285,000 44.4 9736 12 $266,667 $268,750 33.3 971 - - - - -
51 10 $236,940 $244,950 19.6 9767 35 $288,349 $285,000 52.2 98
114 50 $275,104 $273,750 43.9 989 2 $255,250 $255,250 22.2 100
16 4 $259,750 $266,000 25.0 99236 63 $245,137 $247,000 26.7 98129 50 $256,930 $258,050 38.8 98
3 1 $273,000 $273,000 33.3 99- - - - - -4 3 $246,633 $250,000 75.0 100
10 5 $260,680 $265,000 50.0 984 10 $183,490 $182,500 250.0 98

9
West District
TORONTO REAL ESTATE BOARD
SINGLE FAMILY WEST BREAKDOWN - NOVEMBER 2004
Attached/Row/TownhouseCo-op ApartmentArea Act Sales Av. Price Med. Price % S-A Av. % List Area Act Sales Av. Price Med. Price % S-A Av. % ListW01 - - - - - -W02 - - - - - -W03 1 - - - - -W04 - - - - - -W05 11 - - - - -W06 6 3 $108,167 $115,000 50.0 97W07 2 - - - - -W08 3 1 $162,000 $162,000 33.3 97W09 5 1 $120,000 $120,000 20.0 96W10 8 1 $156,500 $156,500 12.5 95W12 - - - - - -W13 - - - - - -W14 2 1 $100,000 $100,000 50.0 91W15 10 - - - - -W16 - - - - - -W17 - - - - - -W18 - - - - - -W19 4 - - - - -W20 1 - - - - -W21 - - - - - -W22 - - - - - -W23 - - - - - -W24 3 - - - - -W25 - - - - - -W26 - - - - - -W27 - - - - - -W28 - - - - - -W29 - - - - - -
Detached CondoCondo TownhouseArea Act Sales Av. Price Med. Price % S-A Av. % List Area Act Sales Av. Price Med. Price % S-A Av. % ListW01 2 - - - - -W02 5 6 $226,000 $232,500 120.0 99W03 - - - - - -W04 16 7 $236,643 $230,000 43.8 98W05 55 7 $212,929 $214,000 12.7 96W06 7 5 $311,300 $295,000 71.4 97W07 1 3 $478,167 $587,000 300.0 97W08 23 6 $359,083 $292,250 26.1 97W09 9 1 $293,000 $293,000 11.1 95W10 44 11 $164,955 $162,000 25.0 97W12 20 10 $336,590 $272,450 50.0 98W13 44 15 $216,433 $200,000 34.1 97W14 32 12 $188,158 $183,500 37.5 97W15 39 22 $226,405 $225,500 56.4 97W16 38 22 $234,802 $224,125 57.9 98W17 - - - - - -W18 32 7 $167,414 $165,000 21.9 96W19 65 43 $235,898 $239,900 66.2 98W20 89 38 $213,112 $210,250 42.7 98W21 19 9 $229,878 $209,900 47.4 96W22 2 1 $167,000 $167,000 50.0 98W23 98 32 $194,225 $192,000 32.7 98W24 62 23 $171,328 $169,000 37.1 98W25 12 5 $215,400 $199,500 41.7 98W26 - - - - - -W27 14 9 $187,878 $178,000 64.3 98W28 1 2 $232,500 $232,500 200.0 99W29 2 8 $146,938 $148,000 400.0 98
W01W02W03W04W05W06W07W08W09W10W12W13W14W15W16W17W18W19W20W21W22W23W24W25W26W27W28W29
- - - - - -- - - - - -- - - - - -- - - - - -- - - - - -- - - - - -
- - - - - -- - - - - -- - - - - -
- - - - - -1 - - - - -1 - - - - -- - - - - -- - - - - -- - - - - -- - - - - -- - - - - -- 1 $298,000 $298,000 - 94- 1 $229,000 $229,000 - 95- - - - - -
- - - - - -- - - - - -2 - - - - -- - - - - -
- - - - - -- - - - - -
- 1 $90,000 $90,000 - 83- - - - - -
W01W02W03W04W05W06W07W08W09W10W12W13W14W15W16W17W18W19W20W21W22W23W24W25W26W27W28W29
16 4 $353,250 $350,000 25.0 10027 7 $261,129 $243,500 25.9 967 2 $210,250 $210,250 28.6 963 1 $280,000 $280,000 33.3 931 - - - - -7 3 $410,163 $410,000 42.9 994 3 $392,667 $378,000 75.0 982 1 $540,000 $540,000 50.0 98- - - - - -7 4 $295,000 $292,000 57.1 971 1 $223,500 $223,500 100.0 992 3 $386,700 $243,600 150.0 97- - - - - -- - - - - -2 1 $240,000 $240,000 50.0 96- - - - - -- - - - - -
27 10 $270,150 $269,500 37.0 9716 7 $262,429 $269,000 43.8 9820 9 $282,644 $261,900 45.0 974 7 $236,643 $230,000 175.0 98
73 38 $223,929 $227,000 52.1 9822 17 $213,147 $218,000 77.3 983 1 $227,000 $227,000 33.3 99- - - - - -3 2 $232,500 $232,500 66.7 995 7 $241,571 $243,500 140.0 984 3 $163,300 $164,000 75.0 95

10
Central District
TORONTO REAL ESTATE BOARD
C01 4,278 2,572 $715,797,421 $278,304 $241,250 40 98C02 1,500 865 $484,298,989 $559,883 $418,000 35 99C03 1,130 660 $398,961,050 $604,486 $379,000 32 99C04 1,954 1,157 $648,219,418 $560,259 $510,000 28 99C06 518 282 $120,369,362 $426,842 $386,500 29 98C07 1,736 914 $290,129,403 $317,428 $279,950 34 97C08 2,080 1,300 $351,285,907 $270,220 $235,000 40 98C09 728 437 $338,023,619 $773,509 $539,000 34 100C10 1,176 801 $442,963,908 $553,014 $431,000 26 101C11 773 422 $167,959,565 $398,008 $377,625 27 100C12 902 460 $439,189,411 $954,760 $764,590 38 98C13 1,013 616 $202,523,949 $328,773 $312,500 30 98C14 3,327 1,744 $553,832,975 $317,565 $250,000 45 98C15 2,329 1,309 $419,483,142 $320,461 $292,000 36 97Total 23,444 13,539 $5,573,038,119 $411,628 $306,000 36 98
Area Listed Sales $ Volume Avg Price Med Price Avg DOM Avg %ListYear-to-Date: January 2004 to November 2004
Area Active New Sales $ Volume Avg Price Med Price Avg DOM Avg %List
C01 587 293 226 $63,042,430 $278,949 $242,500 39 98C02 194 94 70 $40,098,325 $572,833 $451,100 33 98C03 174 92 63 $41,254,113 $654,827 $328,500 29 99C04 261 127 102 $57,549,431 $564,210 $481,000 33 99C06 76 43 21 $10,026,100 $477,433 $420,000 23 97C07 261 131 67 $23,276,050 $347,404 $290,000 37 97C08 298 154 142 $38,295,562 $269,687 $232,000 36 98C09 107 52 41 $29,925,113 $729,881 $399,000 30 99C10 128 84 80 $39,308,291 $491,354 $412,750 27 99C11 108 59 45 $19,647,330 $436,607 $399,000 31 100C12 161 68 41 $34,534,900 $842,315 $787,500 48 97C13 140 71 51 $17,218,233 $337,612 $357,000 36 98C14 539 234 147 $47,062,970 $320,156 $258,500 47 97C15 335 174 105 $35,308,100 $336,268 $307,500 37 97Total 3,369 1,676 1,201 $496,546,948 $413,445 $310,000 36 98
Current Month: November 2004
20
40
60
80
100
NovOctSepAugJulJunMayAprMarFebJanDecNov
Central DistrictSales Active Listing Ratio
2003 2004
20
30
40
50
60
NovOctSepAugJulJunMayAprMarFebJanDecNov
Central DistrictDays on Market
2003 2004
11
Central District
TORONTO REAL ESTATE BOARD
SINGLE FAMILY CENTRAL BREAKDOWN - NOVEMBER 2004
LinkCondo ApartmentArea Act Sales Av. Price Med. Price % S-A Av. % ListC01 464 176 $262,566 $230,000 37.9 97C02 85 19 $471,547 $345,000 22.4 96C03 32 10 $362,131 $319,950 31.3 98C04 64 21 $273,114 $241,500 32.8 97C06 15 1 $220,000 $220,000 6.7 96C07 136 33 $223,520 $227,000 24.3 97C08 226 121 $243,895 $217,500 53.5 98C09 52 19 $404,545 $338,000 36.5 98C10 46 28 $278,053 $269,500 60.9 98C11 76 19 $179,068 $170,000 25.0 97C12 29 6 $346,833 $348,000 20.7 100C13 87 21 $247,038 $205,000 24.1 97C14 396 107 $245,033 $232,000 27.0 97C15 156 32 $231,066 $187,500 20.5 96
Area Act Sales Av. Price Med. Price % S-A Av. % List- - - - - -- - - - - -- - - - - -- - - - - -- - - - - -- 1 $350,000 $350,000 - 1001 - - - - -- - - - - -- - - - - -- - - - - -- - - - - -- - - - - -- - - - - -5 1 $313,000 $313,000 20.0 95
Detached CondoCondo TownhouseArea Act Sales Av. Price Med. Price % S-A Av. % ListC01 30 18 $265,841 $247,500 60.0 99C02 9 5 $402,800 $385,000 55.6 97C03 1 1 $870,000 $870,000 100.0 98C04 9 1 $278,000 $278,000 11.1 100C06 1 1 $301,600 $301,600 100.0 96C07 21 5 $303,400 $290,000 23.8 96C08 5 2 $262,500 $262,500 40.0 98C09 2 2 $475,250 $475,250 100.0 94C10 10 4 $277,625 $275,250 40.0 99C11 14 2 $150,400 $150,400 14.3 98C12 5 - - - - -C13 5 3 $299,000 $275,000 60.0 98C14 24 10 $332,840 $308,500 41.7 97C15 69 23 $259,491 $252,000 33.3 97
Area Act Sales Av. Price Med. Price % S-A Av. % List- - - - - -- - - - - -- - - - - -- - - - - -- - - - - -- - - - - -- - - - - -1 - - - - -- - - - - -- - - - - -- - - - - -- - - - - -1 - - - - -- - - - - -
Semi-Detached HousesDetached HousesArea Act Sales Av. Price Med. Price % S-A Av. % ListC01 14 1 $456,000 $456,000 7.1 104C02 36 18 $668,306 $588,375 50.0 99C03 98 37 $842,238 $360,000 37.8 99C04 165 65 $703,425 $625,000 39.4 99C06 59 19 $500,237 $436,000 32.2 97C07 86 23 $527,504 $472,000 26.7 97C08 6 2 $555,000 $555,000 33.3 91C09 43 12 $1,445,767 $1,475,000 27.9 97C10 58 33 $725,098 $550,000 56.9 99C11 7 22 $686,329 $651,250 314.3 102C12 123 33 $962,239 $800,000 26.8 96C13 24 17 $466,173 $435,000 70.8 101C14 102 28 $588,964 $482,500 27.5 97C15 64 33 $501,685 $471,000 51.6 97
Area Act Sales Av. Price Med. Price % S-A Av. % List
C01C02C03C04C06C07C08C09C10C11C12C13C14C15
C01C02C03C04C06C07C08C09C10C11C12C13C14C15
42 19 $403,011 $394,000 45.2 9846 23 $613,910 $550,000 50.0 9932 12 $351,833 $296,500 37.5 976 12 $455,953 $460,000 200.0 101- - - - - -
10 4 $376,950 $381,450 40.0 10119 8 $442,600 $417,900 42.1 993 1 $772,000 $772,000 33.3 110
12 14 $445,289 $417,625 116.7 1037 2 $422,500 $422,500 28.6 1074 2 $350,000 $350,000 50.0 97
19 7 $303,929 $292,500 36.8 961 1 $515,000 $515,000 100.0 96
38 16 $317,319 $315,000 42.1 97
C01C02C03C04C06C07C08C09C10C11C12C13C14C15

12
Central District
TORONTO REAL ESTATE BOARD
Area Active New Sales $ Volume Avg Price Med Price Avg DOM Avg %List
N01 174 88 55 $22,007,800 $400,142 $337,000 39 97N02 289 139 79 $28,897,588 $365,792 $325,000 38 97N03 463 215 150 $54,734,166 $364,894 $318,250 42 97N04 285 134 66 $25,582,638 $387,616 $354,500 40 97N05 182 77 47 $18,487,400 $393,349 $401,000 32 97N06 191 83 68 $22,702,200 $333,856 $305,000 38 98N07 194 94 98 $29,150,050 $297,449 $277,750 34 98N08 565 265 152 $61,424,724 $404,110 $364,550 35 97N10 284 133 69 $23,584,800 $341,809 $335,000 42 97N11 546 255 162 $60,609,300 $374,131 $353,500 41 97N12 72 31 18 $6,729,100 $373,839 $330,000 58 97N13 73 26 9 $4,972,500 $552,500 $520,000 62 99N14 96 31 20 $10,126,000 $506,300 $544,000 37 95N15 70 29 13 $5,439,800 $418,446 $364,900 38 98N16 62 24 17 $4,824,500 $283,794 $277,000 54 97N17 255 98 65 $12,901,400 $198,483 $190,000 44 97N18 98 41 34 $8,764,500 $257,779 $238,500 63 97N19 128 45 35 $9,005,700 $257,306 $229,900 60 97N20 23 4 1 $318,000 $318,000 $318,000 90 94N21 42 11 7 $1,697,100 $242,443 $232,600 41 96N22 29 3 10 $2,158,400 $215,840 $197,500 50 97N23 116 40 29 $6,837,299 $235,769 $205,000 62 98N24 78 27 17 $3,318,900 $195,229 $164,000 52 98Total 4,315 1,893 1,221 $424,273,865 $347,481 $317,500 42 97
Current Month: November 2004
Attached/Row/TownhouseCo-op ApartmentArea Act Sales Av. Price Med. Price % S-A Av. % ListC01 5 - - - - -C02 3 - - - - -C03 11 2 $254,000 $254,000 18.2 98C04 6 3 $114,000 $110,000 50.0 93C06 - - - - - -C07 1 - - - - -C08 13 1 $261,000 $261,000 7.7 97C09 5 6 $461,344 $383,058 120.0 102C10 2 1 $250,000 $250,000 50.0 98C11 2 - - - - -C12 - - - - - -C13 - - - - - -C14 4 - - - - -C15 2 - - - - -
Area Act Sales Av. Price Med. Price % S-A Av. % List32 12 $327,704 $295,270 37.5 10015 5 $595,100 $420,000 33.3 99
- 1 $870,000 $870,000 - 9711 - - - - -1 - - - - -7 1 $392,500 $392,500 14.3 98
28 8 $418,438 $448,750 28.6 991 1 $399,000 $399,000 100.0 100- - - - - -2 - - - - -- - - - - -5 3 $360,333 $357,000 60.0 97
11 1 $510,000 $510,000 9.1 951 - - - - -
North District
C01C02C03C04C06C07C08C09C10C11C12C13C14C15
SINGLE FAMILY CENTRAL BREAKDOWN - NOVEMBER 2004

13
North District
TORONTO REAL ESTATE BOARD
N01 1,252 691 $254,673,309 $368,558 $338,000 34 98N02 1,807 971 $351,879,455 $362,389 $333,000 37 97N03 3,236 1,808 $652,186,315 $360,723 $312,500 36 98N04 1,953 1,089 $414,590,766 $380,708 $365,000 33 98N05 968 471 $187,928,406 $398,999 $380,000 37 97N06 1,380 949 $339,737,839 $357,996 $300,000 34 98N07 1,825 1,290 $375,827,983 $291,340 $269,900 31 98N08 3,676 2,167 $821,395,148 $379,047 $349,000 33 97N10 1,726 826 $293,573,064 $355,415 $336,750 33 97N11 3,586 1,979 $755,246,261 $381,630 $355,000 35 98N12 364 222 $90,003,600 $405,422 $335,000 48 97N13 259 111 $61,668,865 $555,575 $426,000 64 97N14 455 239 $126,933,914 $531,104 $460,000 51 96N15 432 270 $93,232,445 $345,305 $313,125 38 98N16 486 290 $97,277,932 $335,441 $310,000 50 97N17 1,421 873 $191,563,880 $219,432 $201,000 40 97N18 629 406 $103,679,828 $255,369 $239,000 41 98N19 701 461 $108,628,371 $235,636 $217,000 49 97N20 106 48 $16,299,300 $339,569 $316,500 71 96N21 150 80 $20,386,858 $254,836 $239,123 66 98N22 193 134 $27,894,997 $208,172 $188,435 45 98N23 601 343 $76,254,872 $222,317 $205,000 51 97N24 410 209 $43,081,350 $206,131 $177,000 48 96Total 27,616 15,927 $5,503,944,758 $345,573 $315,000 37 98
Area Listed Sales $ Volume Avg Price Med Price Avg DOM Avg %ListYear-to-Date: January 2004 to November 2004
20
40
60
80
100
NovOctSepAugJulJunMayAprMarFebJanDecNov
North DistrictSales Active Listing Ratio
2003 2004
20
30
40
50
60
NovOctSepAugJulJunMayAprMarFebJanDecNov
North DistrictDays on Market
2003 2004

14
North District
TORONTO REAL ESTATE BOARD
SINGLE FAMILY NORTH BREAKDOWN - NOVEMBER 2004
Semi-Detached HousesDetached HousesArea Act Sales Av. Price Med. Price % S-A Av. % ListN01 67 26 $561,477 $463,750 38.8 97N02 156 36 $466,008 $400,000 23.1 97N03 233 63 $511,541 $475,000 27.0 96N04 209 44 $432,547 $396,950 21.1 97N05 162 37 $418,389 $412,000 22.8 97N06 125 37 $394,092 $338,000 29.6 97N07 126 55 $348,683 $332,000 43.7 98N08 386 92 $476,512 $420,500 23.8 97N10 144 34 $398,718 $404,250 23.6 97N11 367 98 $428,575 $410,000 26.7 97N12 68 17 $383,229 $332,000 25.0 97N13 72 9 $552,500 $520,000 12.5 99N14 96 20 $506,300 $544,000 20.8 95N15 70 10 $481,930 $412,500 14.3 98N16 61 14 $295,893 $279,500 23.0 97N17 242 59 $201,914 $190,000 24.4 97N18 74 21 $283,071 $300,000 28.4 97N19 95 25 $281,352 $254,900 26.3 97N20 23 1 $318,000 $318,000 4.4 94N21 42 7 $242,443 $232,600 16.7 96N22 26 8 $234,175 $221,500 30.8 97N23 111 28 $238,479 $205,000 25.2 98N24 76 15 $201,127 $183,000 19.7 98
Area Act Sales Av. Price Med. Price % S-A Av. % ListN01N02N03N04N05N06N07N08N10N11N12N13N14N15N16N17N18N19N20N21N22N23N24
LinkCondo ApartmentArea Act Sales Av. Price Med. Price % S-A Av. % ListN01 63 16 $230,938 $210,250 25.4 96N02 90 18 $252,072 $226,250 20.0 97N03 133 40 $218,203 $213,000 30.1 97N04 7 2 $170,750 $170,750 28.6 97N05 - - - - - -N06 5 3 $182,667 $178,000 60.0 98N07 11 3 $202,000 $194,000 27.3 98N08 24 6 $261,163 $257,500 25.0 98N10 1 - - - - -N11 9 5 $295,580 $279,900 55.6 97N12 1 - - - - -N13 - - - - - -N14 - - - - - -N15 - - - - - -N16 - 1 $135,000 $135,000 - 96N17 - 2 $97,500 $97,500 - 94N18 1 - - - - -N19 10 1 $172,000 $172,000 10.0 98N20 - - - - - -N21 - - - - - -N22 - - - - - -N23 - - - - - -N24 - - - - - -
Area Act Sales Av. Price Med. Price % S-A Av. % List11 2 $347,500 $347,500 18.2 9716 9 $306,322 $302,900 56.3 9811 1 $339,000 $339,000 9.1 1002 - - - - -3 1 $358,000 $358,000 33.3 99- 3 $336,000 $323,000 - 963 3 $252,333 $265,000 100.0 982 - - - - -
121 27 $295,089 $293,000 22.3 9726 7 $316,543 $308,800 26.9 961 - - - - -- - - - - -- - - - - -- - - - - -- 1 $307,000 $307,000 - 981 - - - - -
15 6 $221,333 $227,500 40.0 978 5 $219,080 $220,000 62.5 99- - - - - -- - - - - -3 1 $165,000 $165,000 33.3 922 - - - - -- - - - - -
7 2 $338,500 $338,500 28.6 991 2 $324,450 $324,450 200.0 99
10 6 $329,567 $331,450 60.0 9820 3 $307,500 $312,500 15.0 989 5 $309,400 $305,000 55.6 98
15 10 $262,000 $256,000 66.7 9830 13 $239,231 $240,000 43.3 9775 26 $312,109 $318,750 34.7 9810 6 $260,333 $256,000 60.0 9665 15 $293,107 $294,000 23.1 98
- 1 $214,200 $214,200 - 98- - - - - -- - - - - -- - - - - -- - - - - -2 3 $197,167 $203,000 150.0 984 5 $226,800 $232,500 125.0 973 - - - - -- - - - - -- - - - - -- - - - - -- - - - - -- - - - - -
N01N02N03N04N05N06N07N08N10N11N12N13N14N15N16N17N18N19N20N21N22N23N24

15
North District
TORONTO REAL ESTATE BOARD
SINGLE FAMILY NORTH BREAKDOWN - NOVEMBER 2004
Detached CondoCondo TownhouseArea Act Sales Av. Price Med. Price % S-A Av. % ListN01 25 8 $251,563 $244,000 32.0 98N02 17 10 $277,930 $266,900 58.8 97N03 36 18 $236,839 $234,750 50.0 97N04 6 4 $287,813 $284,125 66.7 99N05 - - - - - -N06 21 7 $268,614 $217,000 33.3 97N07 12 8 $189,200 $186,800 66.7 98N08 13 2 $264,500 $264,500 15.4 98N10 3 1 $250,000 $250,000 33.3 97N11 24 13 $248,373 $257,000 54.2 97N12 2 - - - - -N13 - - - - - -N14 - - - - - -N15 - - - - - -N16 - 1 $240,000 $240,000 - 98N17 1 - - - - -N18 4 1 $169,000 $169,000 25.0 99N19 3 3 $153,333 $155,000 100.0 99N20 - - - - - -N21 - - - - - -N22 - - - - - -N23 - - - - - -N24 2 1 $147,500 $147,500 50.0 99
Area Act Sales Av. Price Med. Price % S-A Av. % List- - - - - -- - - - - -- - - - - -- - - - - -- - - - - -2 - - - - -- - - - - -- - - - - -- - - - - -1 1 $593,000 $593,000 100.0 94- - - - - -1 - - - - -- - - - - -- - - - - -- - - - - -- - - - - -- - - - - -4 1 $244,500 $244,500 25.0 100- - - - - -- - - - - -- - - - - -- - - - - -- - - - - -
Attached/Row/TownhouseCo-op ApartmentArea Act Sales Av. Price Med. Price % S-A Av. % ListN01 - - - - - -N02 1 - - - - -N03 3 - - - - -N04 1 - - - - -N05 - - - - - -N06 - - - - - -N07 1 - - - - -N08 - - - - - -N10 - - - - - -N11 1 - - - - -N12 - - - - - -N13 - - - - - -N14 - - - - - -N15 - - - - - -N16 - - - - - -N17 - - - - - -N18 - - - - - -N19 1 - - - - -N20 - - - - - -N21 - - - - - -N22 - - - - - -N23 - - - - - -N24 - - - - - -
Area Act Sales Av. Price Med. Price % S-A Av. % List1 1 $329,900 $329,900 100.0 948 4 $349,725 $349,450 50.0 98
37 22 $327,250 $317,750 59.5 9740 13 $318,100 $313,800 32.5 988 4 $275,500 $275,750 50.0 99
23 8 $258,063 $253,750 34.8 9911 16 $249,119 $249,000 145.5 9865 26 $283,646 $280,500 40.0 985 1 $249,000 $249,000 20.0 96
53 23 $291,165 $279,000 43.4 98- - - - - -- - - - - -- - - - - -- 3 $206,833 $202,000 - 971 - - - - -9 1 $202,000 $202,000 11.1 97- 1 $189,000 $189,000 - 984 - - - - -- - - - - -- - - - - -- 1 $120,000 $120,000 - 963 1 $159,900 $159,900 33.3 97- 1 $154,500 $154,500 - 99
N01N02N03N04N05N06N07N08N10N11N12N13N14N15N16N17N18N19N20N21N22N23N24
N01N02N03N04N05N06N07N08N10N11N12N13N14N15N16N17N18N19N20N21N22N23N24

Single Family Dwelling Sales Comparison
16 TORONTO REAL ESTATE BOARD
Annual Summary - Single Family
Year *Number of Sales *Average Price Year *Number of Sales *Average Price
175000
200000
225000
250000
275000
300000
325000
20042003200220012000199919981997199619951994
Average Price
0
5000
10000
15000
20000
25000
30000
35000
NovOctSepAugJulJunMayAprMarFebJanDecNov
Active Listing
2003 2004
0
1000
2000
3000
4000
5000
6000
7000
8000
9000
10000
NovOctSepAugJulJunMayAprMarFebJanDecNov
Sales
2003 2004
* Due to District revisions, caution should be exercised when undertaking historical comparisons. Please refer to appropriate maps.** On June 30th, TREB switched from the old Trebnet system to TorontoMLS. Minor discrepancies may occur between the year-to-date figures provided by the oldsystem and those provided by the new.
1970 10,498 29,4921971 13,085 30,4261972 14,613 32,5131973 16,335 40,6051974 17,318 52,8061975 22,020 57,5811976 19,025 61,3891977 20,512 64,5591978 21,184 67,3331979 23,466 70,8301980 26,017 75,6941981 29,625 90,2031982 25,336 95,4961983 30,046 101,6261984 31,905 102,3181985 45,509 109,0941986 52,919 138,9251987 43,475 189,1051988 49,381 229,6351989 38,960 273,698 1990 26,779 255,0201991 38,144 234,3131992 41,703 214,9711993 38,990 206,4901994 44,237 208,9211995 39,273 203,0281996 55,779 198,1501997 58,014 211,3071998 55,344 216,8151999 58,957 228,3722000 58,343 243,2552001 67,612 251,5082002 74,759 275,231
2003January 4,403 281,292February 5,965 289,954March 6,986 290,185April 7,307 292,783May 8,025 298,451June 8,033 295,053July 8,084 289,880August 6,549 285,366September 6,751 297,398October 7,227 304,844November 5,847 301,612December 4,194 284,955
Total** 78,898 $293,067
2004January 4,256 295,989February 6,060 310,196March 9,076 307,155April 9,168 321,131May 9,193 325,501June 9,275 316,510July 7,329 312,418August 6,743 304,509September 6,588 320,911October 6,666 324,215November 6,301 318,837
Total** 79,382 $315,206
District TotalsNew Active Listed Sales $ Volume Av. Price Med. Price Av. DOM Av. % List
Grand Total: 9,565 20,273 N/A 6,301 $2,008,994,013 $318,837 $275,000 38 97
YTD Grand Total: N/A N/A 137,713 79,382 $25,021,674,587 $315,206 $272,000 34 98


![Bob Wright [mailto:BWright@friendsoftheriver.org] … · 2015-09-17 · Our letter is already in the BDCP/Water Fix Record as of this morning and has already been transmitted electronically](https://static.fdocuments.us/doc/165x107/5f5bf9199583f826aa5edc8c/bob-wright-mailtobwright-2015-09-17-our-letter-is-already-in-the-bdcpwater.jpg)


