
November 30, 2014 with charts
27
Jeanette Schwarz Young, CFP ® , CMT, M.S. Jordan Young, CMT 83 Highwood Terrace Weehawken, New Jersey 07086 www.OptnQueen.com November 30, 2014 The Option Queen Letter By the Option Royals Remember the olden times when at the end of the Macy’s Thanksgiving Parade Santa appeared on his sled signaling to all the beginning of the Christmas shopping season? Wonder of wonders, sales did not meet expectations for retailers on Black Friday. Duh, well if the sales began in September-October, any wonder the shoppers were not as excited by the Black Friday deals? After all, we all have been receiving the pre-Black Friday deals and special discounts on everything. Then there are all the online shopp ing sales…..our inboxes are jammed with special this or special that with this discount code…and we wait to see if a better deal will appear. Oh, and Monday is cyber Monday with more sales and you can point and click your way right through your Christmas list while lounging at your computer in your PJs and slippers. Frankly, we avoid the malls especially during this season when tempting impulse buys are strategically placed for us to snag. Then there are the parking lots where we look for hard-to-find spots miles away from the entrance. Then worry how to get all the purchases back to the car. Why not avoid all the germs at the mall and buy everything online. While we do believe that the Christmas sales this year will be better than last year, there is only so much money in the Christmas gift pot to spend. We still have mortgages, taxes, utilities, and oh the cost of food, etc. The US Dollar remains extremely strong putting pressure on commodities. Both gold and crude oil had a steep decline in the shortened Friday session. While the consumers will enjoy the benefits of cheaper gasoline, international exporter here in the US will suffer declines in sales because of the strength of the US dollar making our products and exports more expensive than other products not priced in US dollars. That will cause our export trade deficit to balloon and will cause some problems for our multinational corporations. Yes much of the currency risk for corporations is likely hedged but the sales are not and the strong dollar will have an effect on those sales. An interesting web-cast by Don Coxe brings up very interesting information as to why the Saudis’ are encouraging lower oil prices, hat tip to Ian McAvity. I suggest you listen to this very interesting pubic webcast: coxeadvisors.net/novermber-28-2014don-cox-oil-and-politics-a- toxis-mix/ . Mr. Coxe states Russia and Iran are the big losers with cheap oil. This decrease in WTC takes some of the funding away from ISIS, now a real threat to the Saudis. The S&P 500 December futures contract did not make a new high in the shortened Friday session but the tech heavy NASDAQ 100 did make a high for the year. This tells us that the money managers, most of whom are lagging their benchmarks, are jumping into trending securities and those seem to be in technology. This action could have also been influenced by
Transcript of November 30, 2014 with charts

Jeanette Schwarz Young, CFP®, CMT, M.S. Jordan Young, CMT
83 Highwood Terrace Weehawken, New Jersey 07086
www.OptnQueen.com November 30, 2014
The Option Queen Letter
By the Option Royals
Remember the olden times when at the end of the Macy’s Thanksgiving Parade Santa appeared
on his sled signaling to all the beginning of the Christmas shopping season? Wonder of wonders, sales did not meet expectations for retailers on Black Friday. Duh, well if the sales
began in September-October, any wonder the shoppers were not as excited by the Black Friday deals? After all, we all have been receiving the pre-Black Friday deals and special discounts on everything. Then there are all the online shopping sales…..our inboxes are jammed with special
this or special that with this discount code…and we wait to see if a better deal will appear. Oh, and Monday is cyber Monday with more sales and you can point and click your way right
through your Christmas list while lounging at your computer in your PJs and slippers. Frankly, we avoid the malls especially during this season when tempting impulse buys are strategically placed for us to snag. Then there are the parking lots where we look for hard-to-find spots miles
away from the entrance. Then worry how to get all the purchases back to the car. Why not avoid all the germs at the mall and buy everything online. While we do believe that the
Christmas sales this year will be better than last year, there is only so much money in the Christmas gift pot to spend. We still have mortgages, taxes, utilities, and oh the cost of food, etc.
The US Dollar remains extremely strong putting pressure on commodities. Both gold and crude oil had a steep decline in the shortened Friday session. While the consumers will enjoy the
benefits of cheaper gasoline, international exporter here in the US will suffer declines in sales because of the strength of the US dollar making our products and exports more expensive than other products not priced in US dollars. That will cause our export trade deficit to balloon and
will cause some problems for our multinational corporations. Yes much of the currency risk for corporations is likely hedged but the sales are not and the strong dollar will have an effect on
those sales. An interesting web-cast by Don Coxe brings up very interesting information as to why the
Saudis’ are encouraging lower oil prices, hat tip to Ian McAvity. I suggest you listen to this very interesting pubic webcast: coxeadvisors.net/novermber-28-2014don-cox-oil-and-politics-a-
toxis-mix/ . Mr. Coxe states Russia and Iran are the big losers with cheap oil. This decrease in WTC takes some of the funding away from ISIS, now a real threat to the Saudis.
The S&P 500 December futures contract did not make a new high in the shortened Friday session but the tech heavy NASDAQ 100 did make a high for the year. This tells us that the
money managers, most of whom are lagging their benchmarks, are jumping into trending securities and those seem to be in technology. This action could have also been influenced by

end of month portfolio adjustments and just might continue into the beginning of the week as new money is put to work. The Russell 2000 was slammed in the Friday session as year-end tax
selling began.
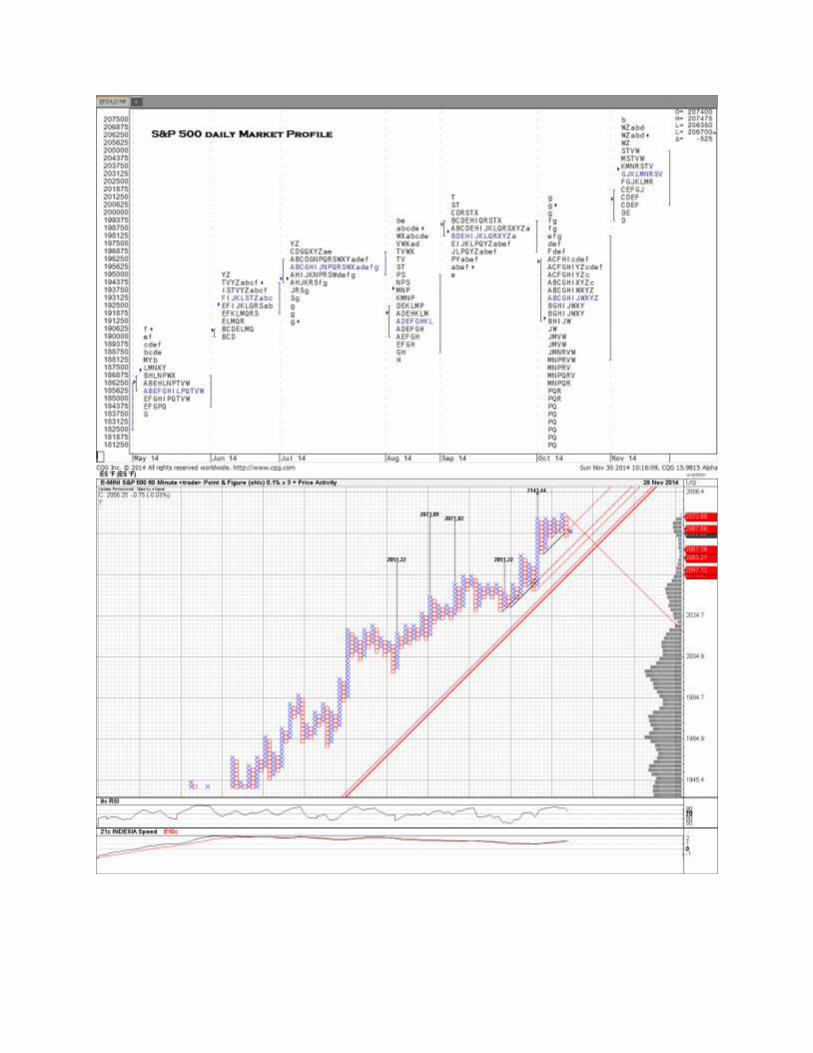
The S&P 500 retreated 0.29% or 6 handles (points) in the Friday session. It should be noted that the Bollinger Bands are compressing illustrating the consolidation of volatility and dullness of this market. The market looks fatigued and could do with either a pull-back or continued
consolidation. We had the 13 count this week and are on alert. So long as we are above the 5-period exponential moving average of 2065.47, as for now, we cannot be negative. As you well
know, this can change almost instantly. We will not address the volume in this session insomuch as it was a half-day session. As to the indicators, they have all turned down and are issuing a sell-signal at overbought areas and thus have lots of room to the downside. The up trending
channel lines are 2052.25 and 2080.87. The top of the Bollinger Band is 2080.04 and the lower edge is seen at 2000.10. Our horizontal support line is 2032.00. Below that level, we likely will
revisit the 2000 area. The daily 1% by 3-box point and figure chart continues to look positive. The 60 minute 0.1% by 3-box chart shows consolidation. The 30 minute Market Profile chart tells us that the most frequently traded price (by brackets) was 2072.70. We notice that the early
trades were positive pushing the index up to the session highs at about 11:22. After that failed attempt at a new high, the market retreated and closed the day at 2066.25. Although we are in a
seasonally strong period for the market, we suggest that caution be maintained and that tight trailing stops be employed. We are not stating that a steep market decline is in the immediate future but we believe that this rally has run a great distance and a rest or retreat is likely. We do
believe that a downdraft will be seen, but not yet. The market will tell us when and so far, it has been mute.


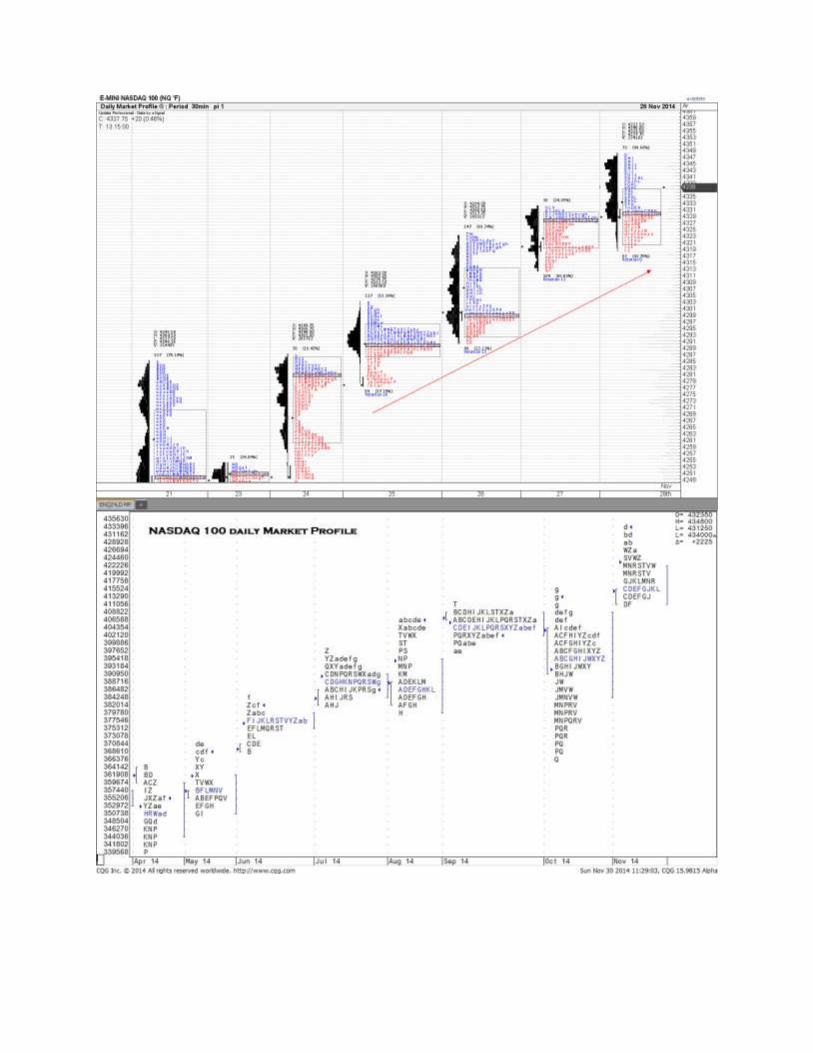
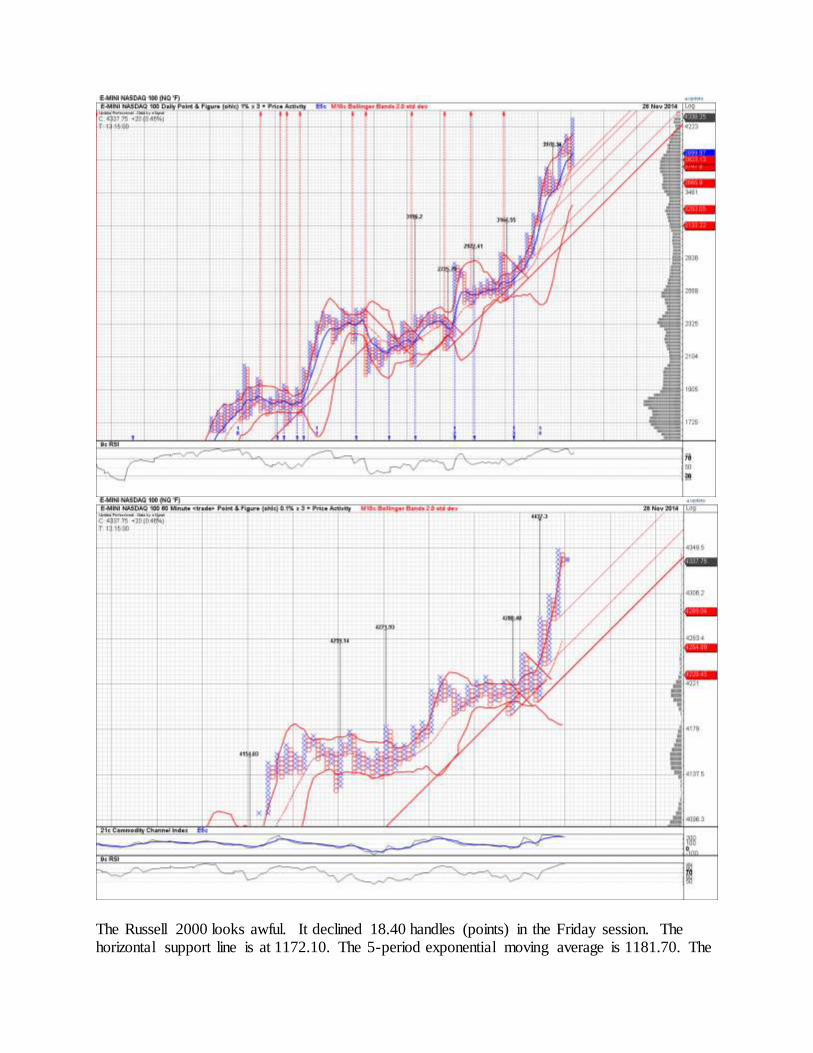
The NASDAQ 100 rallied 20 handles (points) or 0.47% in the Friday session and was the clear
winner among the financials that we review herein. We do have signs of exhaustion on the daily chart. This index, the tech heavy NASDAQ 100, close and printed a new high for the year. The
stochastic indicator and the Thomas DeMark Expert indicator have just issued a sell-signal at overbought levels. The RSI is overbought but continues to point higher although it is losing momentum. Our own indicator is about to issue a sell-signal. The 5-period exponential moving
average is 4301.88. The top of the Bollinger Band is 4331.46 and the lower edge is seen at 4097.23, we closed above the upper band. There are some divergences creeping into this chart
but as to the trend of the market, it continues to point higher. Both the weekly and the monthly charts are overbought. We are above the Ichimoku Clouds for all time-frames. The very steep upward pointing channel lines are 4301.88 and 4355.00. The horizontal support lines are
4245.50 and 4167.00. The daily 1% by 3-box point and figure chart is extremely bullish. The 60 minute 0.1% by 3-box point and figure chart is also very bullish. The 30 minute Market Profile
chart shows us that the most frequently traded price (brackets) was 4319.70 while the heaviest volume was seen at 4329.90 where 10.6% of the day’s volume was seen. Remember the old saying, “the trend is your friend” when trading this index. The slope is a bit steep but can
continue for a short while longer. Let the market tell you what it is going to do. At this time, the money is flowing into this index. Do not fight that trend.


The Russell 2000 looks awful. It declined 18.40 handles (points) in the Friday session. The horizontal support line is at 1172.10. The 5-period exponential moving average is 1181.70. The

top of the Bollinger Band is 1193.16 and the lower edge is seen at 1154.78. The upward trending channel lines are 1207.50 and 1173.50. The range for the Friday session was a
whopping 23.50 handles….yikes, and that was a short session! We are above the Ichimoku Clouds for all time-frames. Both the RSI and the stochastic indicator have issued a sell-signal.
Our own indicator has not yet issued a sell signal but will likely do so in the Monday session. The 110 by 3-box point and figure chart looks, in a word, lousy. The 30 minute Market Profile chart shows just how dreadful the session was with a very long downside tail. The most
frequently traded price was 1192.82; the heaviest volume was seen at 1186.98 where 11.1% of the day’s volume was seen. Although this index will bounce, take care on any bottom fishing
expeditions.


Crude oil plunged 7.70 in the shortened Friday session which is the steepest retreat we have seen in a very long while if ever in a single half-day session. We are oversold as measured by the
indicators that we follow herein and there isn’t an upward bend in sight. The volume for the half-day session was high. We are below the Ichimoku Clouds for all time-frames. The 5-period
exponential moving average is 71.71. The top of the Bollinger Band is 81.86 and the lower edge

is seen at 70.09. The crude market closed far below the lower edge of that band. Naturally the Bollinger Bands are beginning to expand to accommodate the increased volatility. The 30
minute Market Profile chart is bimodal with a long tail. The most frequently traded price was 68.97. The 60 minute 0.2% point and figure chart has a downside trendlines and no upside
recent lines. There is nothing positive on this chart. The daily 0.9% by 3-box point and figure chart has a downside target of 47.97. Again there is nothing remotely positive about this chart.


Gold declined in the Friday session losing 31.70 handles (points). All the indicators that we
follow herein continue to issue a sell-signal. The chart looks awful and the metal will likely
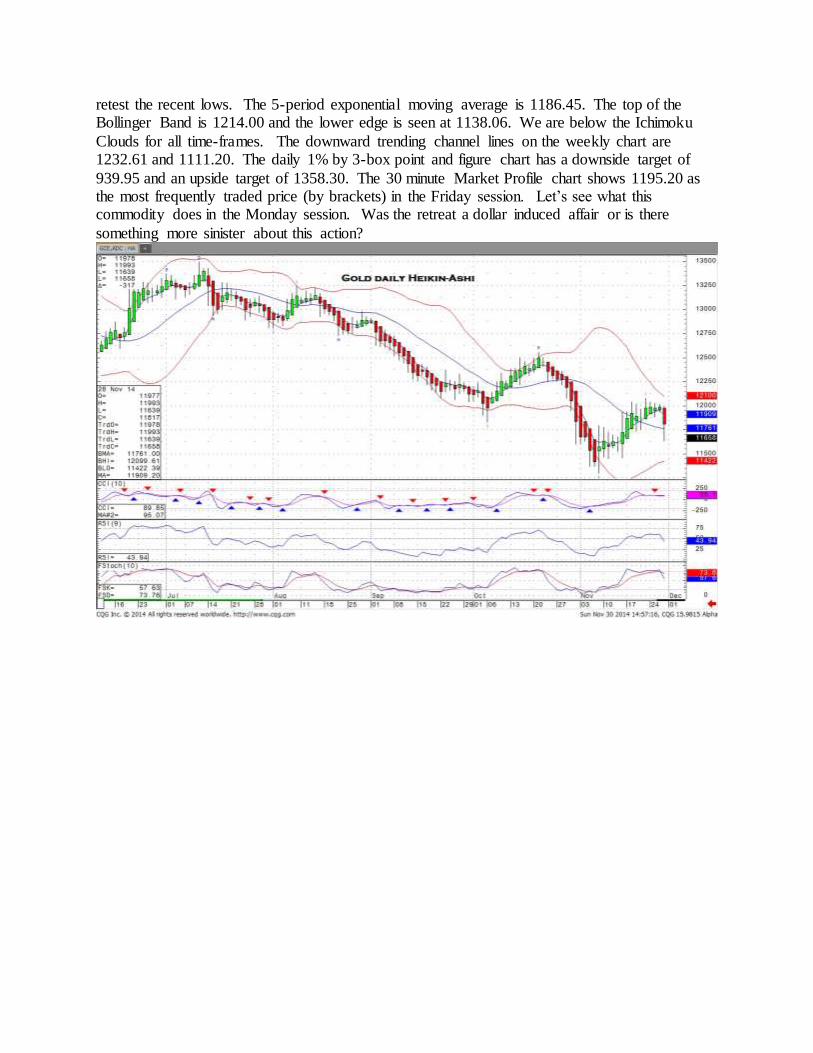
retest the recent lows. The 5-period exponential moving average is 1186.45. The top of the Bollinger Band is 1214.00 and the lower edge is seen at 1138.06. We are below the Ichimoku
Clouds for all time-frames. The downward trending channel lines on the weekly chart are 1232.61 and 1111.20. The daily 1% by 3-box point and figure chart has a downside target of
939.95 and an upside target of 1358.30. The 30 minute Market Profile chart shows 1195.20 as the most frequently traded price (by brackets) in the Friday session. Let’s see what this commodity does in the Monday session. Was the retreat a dollar induced affair or is there
something more sinister about this action?


The US Dollar Index closed the Friday session at 88.41, one penny above our 88.40 resistance
line. The shortened week was for the most part uneventful with the index remaining range locked between 88.40 and 87.47. The Bollinger Bands have significantly consolidated with the upper band at 88.43 and the lower band at 87.18. The 20-period simple moving average is 87.81, the 5-
period exponential moving average is 88.01 and the index is above both. Both the RSI and our own indicator are currently issuing buy signals. The daily candle chart shows the next resistance
line, above 88.40 to be 89.5. This market is being held in check by the 87.47 support level and below this the next level is seen at 86.97. All of these levels are currently supported by the 30 minute .05 x 3 point and figure chart. Here we see activated upside targets at 89.20, 90.1 and
89.40. Clusters of activated targets, such as these, in an environment where upside targets have consistently been being achieved are typically more significant. The index has one activated
downside target at 86.90 and no counter trend internal trend lines. The index will likely make its way to 89.50-90 however; it may yet back and fill before this happens. 10% of the day’s volume was seen at 88.245.


Risk
Trading Futures, Options on Futures, and retail off-exchange foreign currency transactions involves substantial risk of loss and is not suitable for all investors. You should carefully
consider whether trading is suitable for you in light of your circumstances, knowledge, and financial resources. You may lose all or more of your initial investment.