November 22, 2016 VIA EMAIL AND OVERNIGHT DELIVERY · PDF file · 2016-11-28VIA...
74
November 22, 2016 VIA EMAIL AND OVERNIGHT DELIVERY Ms. Melanie A. Bachman Acting Executive Director Connecticut Siting Council Ten Franklin Square New Britain, CT 06051 RE: T-Mobile Northeast LLC – CT11860A Notice of Exempt Modification 48 Quail Trail, Trumbull, CT Pole 838 LAT: 41-13-57.66N LNG: 73-10-20.11W Dear Ms. Bachman: T-Mobile Northeast LLC ("T-Mobile") currently maintains three (3) antennas at the 105' level on the existing 95' transmission tower located at 48 Quail Trail, Trumbull, CT. The structure is owned by Eversource Energy, their use of the structure was approved by the Council on December 14, 2000 (Docket No. 496). T-Mobile submitted a Petition for a 10’ extension on this structure, which was approved by the Council on December 4, 2008 (Petition 872). Please accept this letter as notification pursuant to Regulations of Connecticut State Agencies 16-50j-73, for construction that constitutes an exempt modification pursuant to R.C.S.A.16-50j-72(b)(2). In accordance with R.C.S.A. l6-50j-73, a copy of this letter is being sent to Timothy M. Herbst, First Selectman, Town of Trumbull, and the property owner, Eversource Energy. The planned modifications to the facility fall squarely within those activities explicitly provided for in RC.S.A. 16-50j-72(b)(s). 1. The proposed modifications will not result in an increase in the height of the existing structure. T-Mobile proposes to swap (3) antennas, at a centerline height of 105' on the existing 95' structure. 2. The proposed modifications will not require the extension of the site boundary. There will be no effect on the site compound or T-Mobile's leased area. 3. The proposed modifications will not increase noise levels at the facility by six decibels or more, or to levels that exceed state and local
Transcript of November 22, 2016 VIA EMAIL AND OVERNIGHT DELIVERY · PDF file · 2016-11-28VIA...
November 22, 2016
VIA EMAIL AND OVERNIGHT DELIVERY
Ms. Melanie A. Bachman
Acting Executive Director
Connecticut Siting Council Ten Franklin Square
New Britain, CT 06051
RE: T-Mobile Northeast LLC – CT11860A
Notice of Exempt Modification
48 Quail Trail, Trumbull, CT Pole 838
LAT: 41-13-57.66N
LNG: 73-10-20.11W
Dear Ms. Bachman:
T-Mobile Northeast LLC ("T-Mobile") currently maintains three (3) antennas
at the 105' level on the existing 95' transmission tower located at 48 Quail
Trail, Trumbull, CT. The structure is owned by Eversource Energy, their use of the structure was approved by the Council on December 14, 2000 (Docket
No. 496). T-Mobile submitted a Petition for a 10’ extension on this structure,
which was approved by the Council on December 4, 2008 (Petition 872).
Please accept this letter as notification pursuant to Regulations of
Connecticut State Agencies 16-50j-73, for construction that constitutes an exempt modification pursuant to R.C.S.A.16-50j-72(b)(2). In accordance
with R.C.S.A. l6-50j-73, a copy of this letter is being sent to Timothy M.
Herbst, First Selectman, Town of Trumbull, and the property owner,
Eversource Energy.
The planned modifications to the facility fall squarely within those activities
explicitly provided for in RC.S.A. 16-50j-72(b)(s).
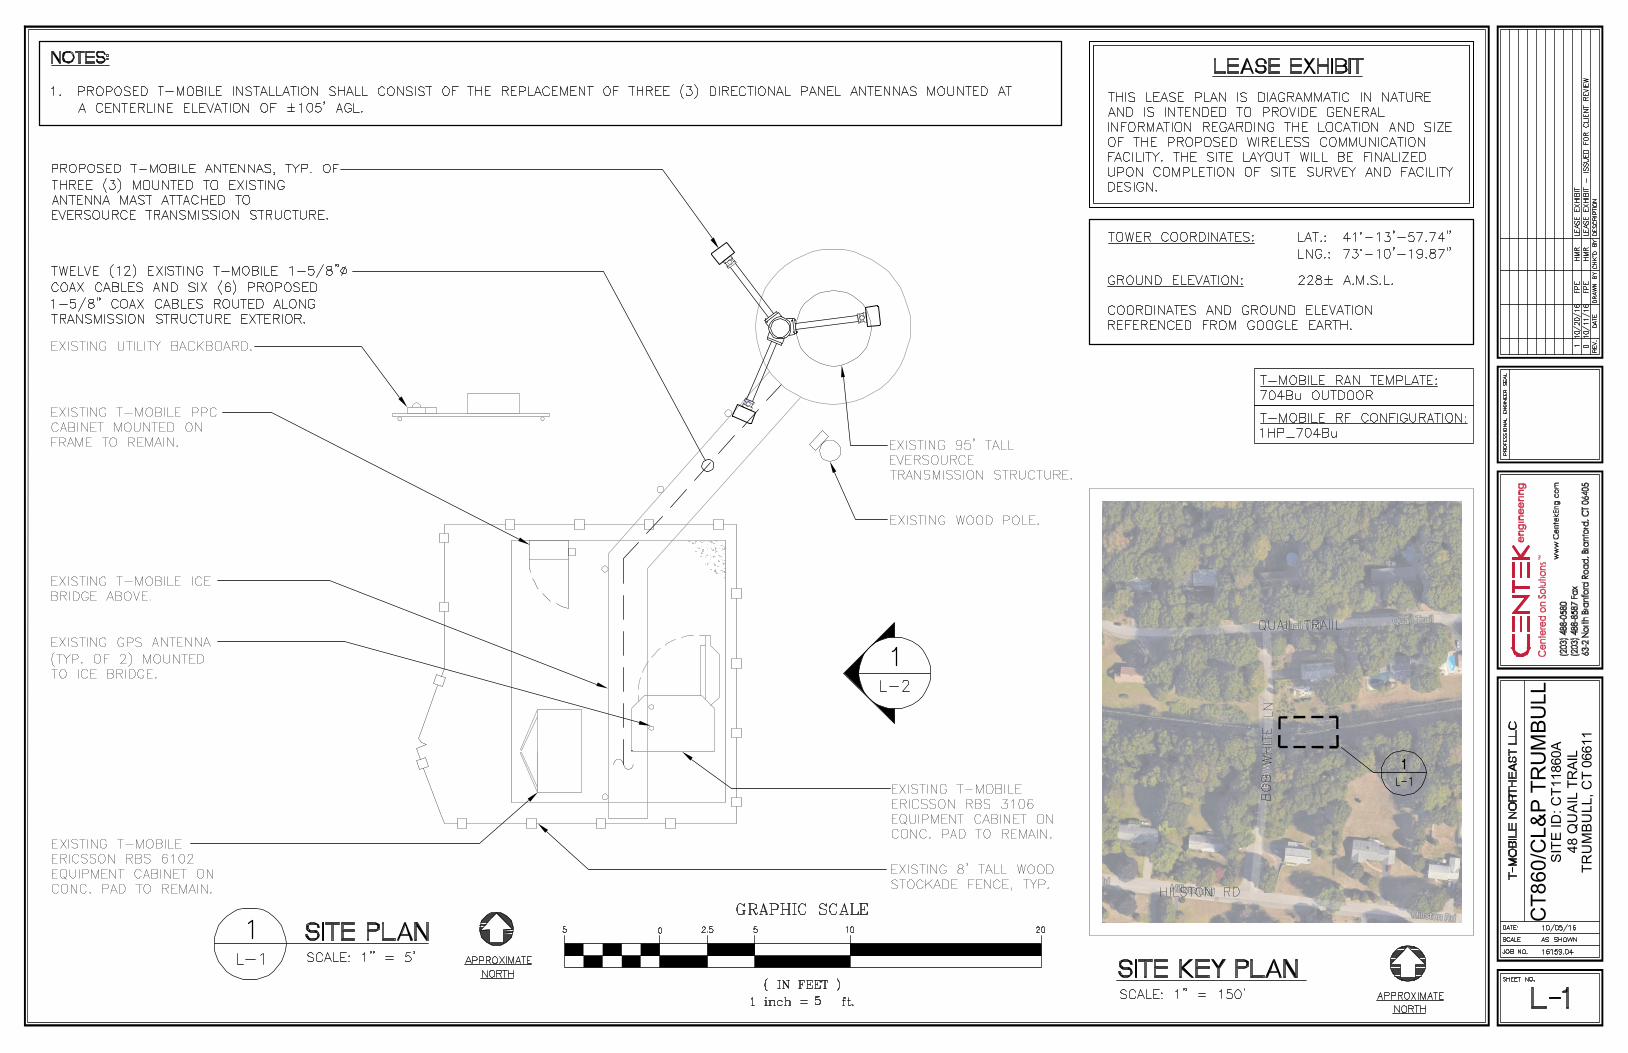
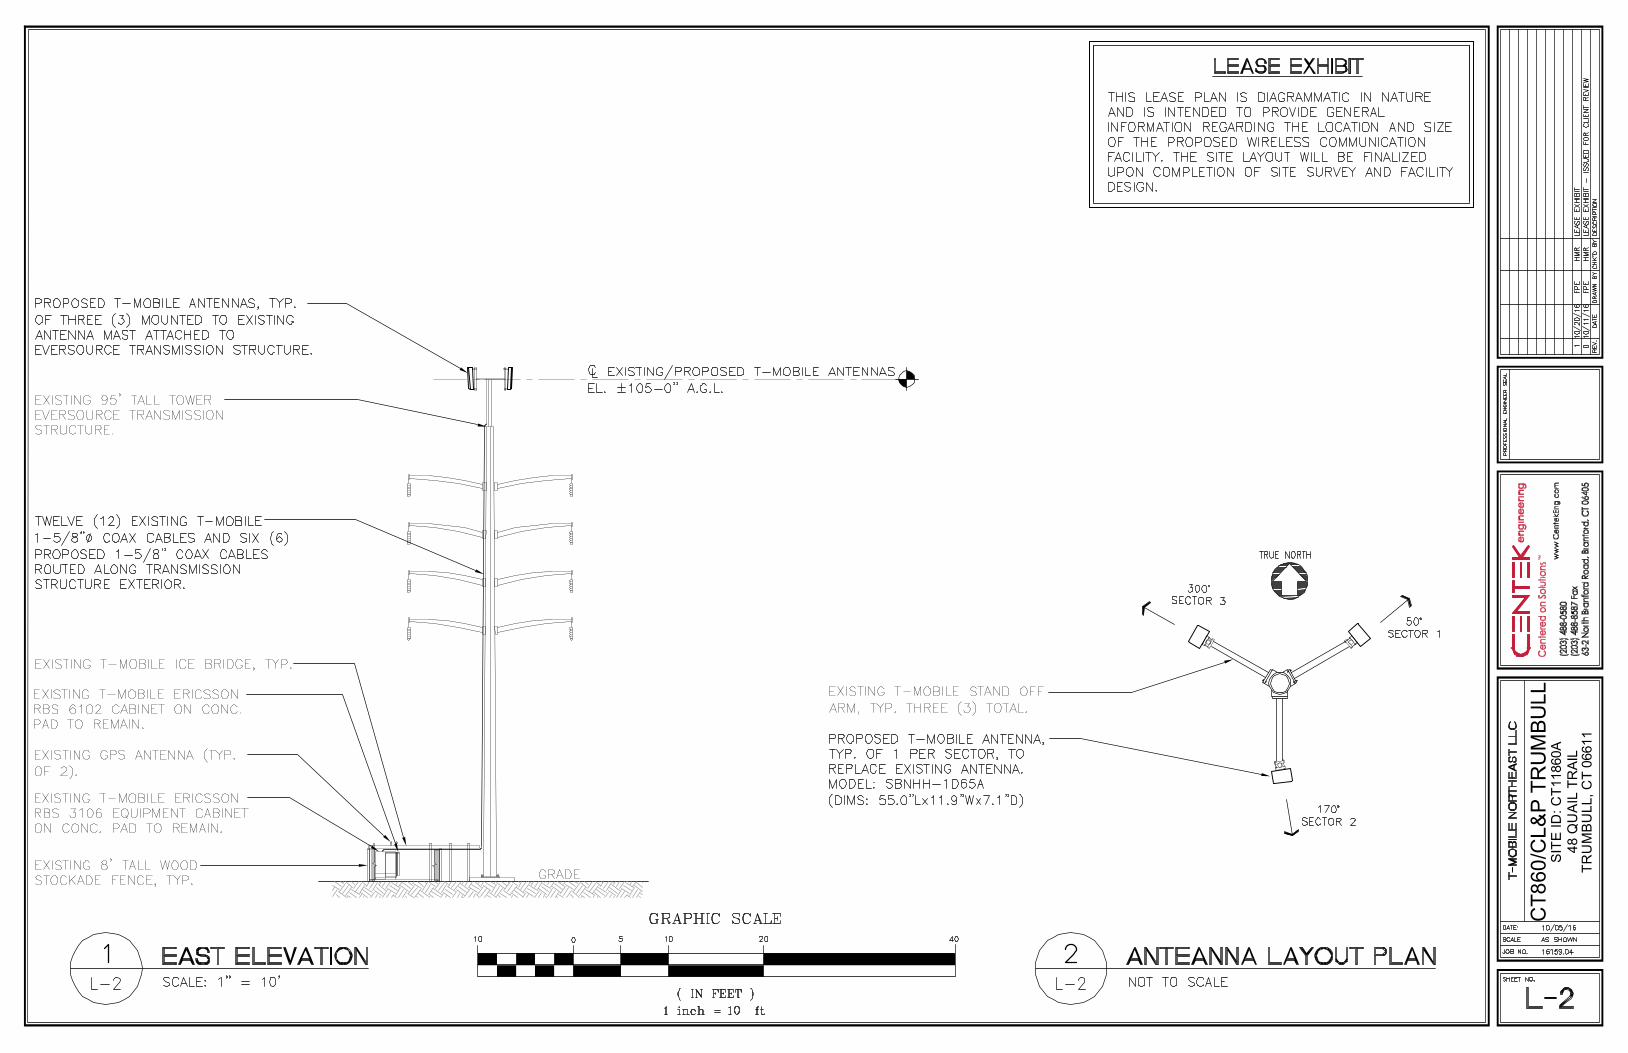
1. The proposed modifications will not result in an increase in the height
of the existing structure. T-Mobile proposes to swap (3) antennas, at a centerline height of 105' on the existing 95' structure.
2. The proposed modifications will not require the extension of the site
boundary. There will be no effect on the site compound or T-Mobile's
leased area.
3. The proposed modifications will not increase noise levels at the facility
by six decibels or more, or to levels that exceed state and local
criteria. The incremental effect of the proposed changes will be
negligible.
4. The operation of the replacement antennas will not increase radio
frequency emissions at the facility to a level at or above the Federal
Communications Commission safety standard. As indicated in the
attached power density calculations, T-Mobile's operations at the site
will result in a power density of 2.50%; the combined site operations will result in a total power density of 2.50%.
5. The proposed modifications will not cause a change or alteration in the
physical or environmental characteristics of the site. T-Mobile will swap
antennas on the existing mounts and the coax lines will be run within
the existing cable tray.
6. The existing structure, and its foundation can support T-Mobile’s
proposed loading, as indicated in the attached structural analysis.
For the foregoing reasons, T-Mobile respectfully submits that the proposed
modifications to the above-referenced telecommunications facility constitute
an exempt modification under R.C.S.A. J 6-50j-72(b)(2) .
Please feel free to call me with any questions or concerns regarding this matter. Thank you for your consideration.
Respectfully submitted,
By: _____________________
Jamie Ford, Agent for T-Mobile
774-248-5373
Attachments
cc: Timothy M. Herbst, First Selectman, Town of Trumbull
Eversource Energy
CT8
60/C
L&P
TRU
MBU
LL48
QU
AIL
TRAI
LTR
UM
BULL
,CT
0661
1
SITE
ID:C
T118
60A
CT8
60/C
L&P
TRU
MBU
LL48
QU
AIL
TRAI
LTR
UM
BULL
,CT
0661
1
SITE
ID:C
T118
60A
S t r u c t u r a l A n a l y s i s o fA n t e n n a M a s t a n d P o l e
T - M o b i l e S i t e R e f : C T 1 1 8 6 0 A
E v e r s o u r c e S t r u c t u r e N o . 8 3 8
9 5 ’ E l e c t r i c T r a n s m i s s i o n P o l e
4 8 Q u a i l T r a i lT r u m b u l l , C T
C E N T E K P r o j e c t N o . 1 6 1 5 9 . 0 4
D a t e : O c t o b e r 2 4 , 2 0 1 6
Prepared for:T-Mobile USA
35 Griff in RoadBloomf ield, CT 06002
CENTEK Engineering, Inc.Structural Analysis – 95-ft Pole # 838T-Mobile Antenna Upgrade – CT11860ATrumbull, CTOctober 24, 2016
TABLE OF CONTENTS TOC-1
T a b l e o f C o n t e n t sSECTION 1 - REPORT§ INTRODUCTION§ PRIMARY ASSUMPTIONS USED IN THE ANALYSIS§ ANALYSIS§ DESIGN BASIS§ RESULTS§ CONCLUSIONSECTION 2 - CONDITIONS & SOFTWARE§ STANDARD ENGINEERING CONDITIONS§ GENERAL DESCRIPTION OF STRUCTURAL ANALYSIS PROGRAMS§ RISA 3-D§ PLS POLE
SECTION 3 - DESIGN CRITERIA§ CRITERIA FOR DESIGN OF PCS FACILITIES ON OR EXTENDING ABOVE
METAL ELECTRIC TRANSMISSON TOWERS§ NU DESIGN CRITERIA TABLE§ PCS SHAPE FACTOR CRITERIA§ WIRE LOADS SHEETSECTION 4 - DRAWINGS§ EL-1 POLE AND MAST ELEVATIONSECTION 5 - TIA-222-G LOAD CALCULATIONS FOR MAST ANALYSIS§ MAST WIND & ICE LOADSECTION 6 - MAST ANALYSIS PER TIA-222G§ LOAD CASES AND COMBINATIONS (TIA LOADING)§ RISA 3-D ANALYSIS REPORT§ MAST CONNECTION TO TOWER ANALYSIS
CENTEK Engineering, Inc.Structural Analysis – 95-ft Pole # 838T-Mobile Antenna Upgrade – CT11860ATrumbull, CTOctober 24, 2016
TABLE OF CONTENTS TOC-2
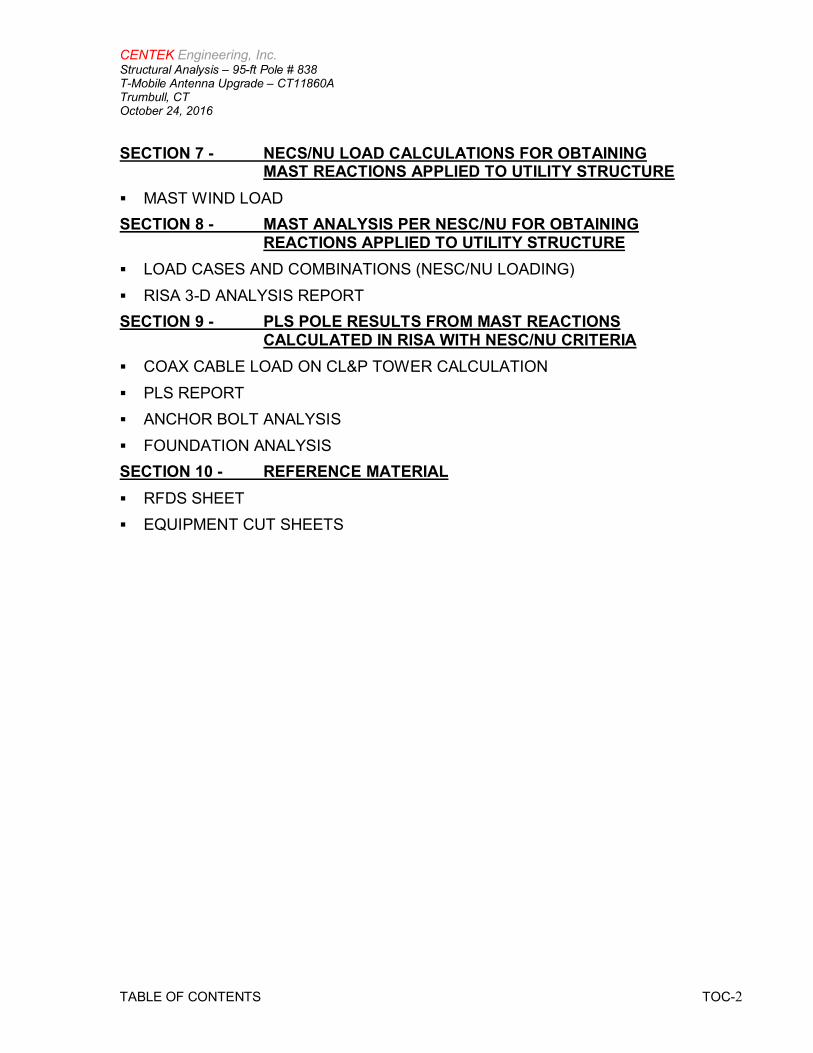
SECTION 7 - NECS/NU LOAD CALCULATIONS FOR OBTAININGMAST REACTIONS APPLIED TO UTILITY STRUCTURE
§ MAST WIND LOADSECTION 8 - MAST ANALYSIS PER NESC/NU FOR OBTAINING
REACTIONS APPLIED TO UTILITY STRUCTURE§ LOAD CASES AND COMBINATIONS (NESC/NU LOADING)§ RISA 3-D ANALYSIS REPORTSECTION 9 - PLS POLE RESULTS FROM MAST REACTIONS
CALCULATED IN RISA WITH NESC/NU CRITERIA§ COAX CABLE LOAD ON CL&P TOWER CALCULATION§ PLS REPORT§ ANCHOR BOLT ANALYSIS§ FOUNDATION ANALYSISSECTION 10 - REFERENCE MATERIAL§ RFDS SHEET§ EQUIPMENT CUT SHEETS

CENTEK Engineering, Inc.Structural Analysis – 95-ft Pole # 838T-Mobile Antenna Upgrade – CT11860ATrumbull, CTOctober 24, 2016
REPORT SECTION 1-1
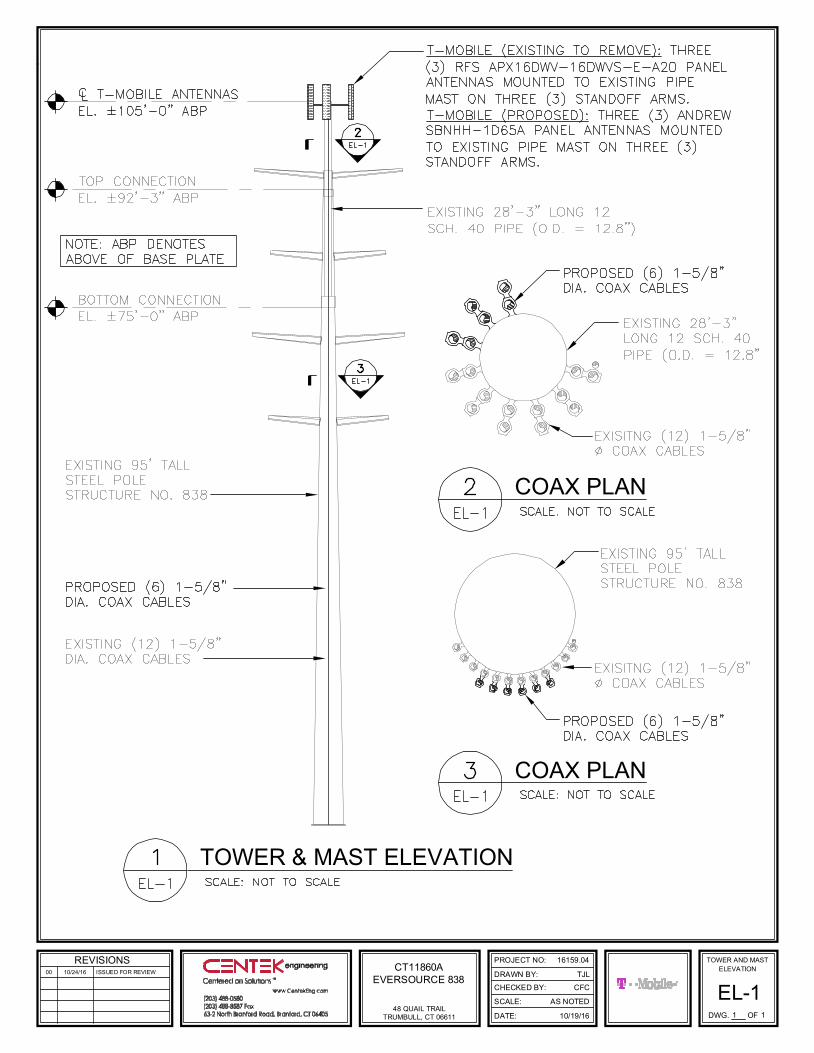
I n t r o d u c t i o nThe purpose of this report is to analyze the existing mast and 95’ utility pole located at 48 Quail Trail inTrumbull, CT for the proposed antenna and equipment upgrade by T-Mobile.
The existing/proposed loads consist of the following:
§ T-MOBILE (Existing to be removed):Antennas: Three (3) RFS APX16DWV-16DWVS-E-A20 panel antennas mounted on a mastwith a RAD center elevation of 105-ft above tower base plate.
§ T-MOBILE (Existing to remain):Coax Cables: Twelve (12) 1-5/8” Æ coax cables running on the outside of the tower asindicated in section 4 of this report.
§ T-MOBILE (Proposed):Antennas: Three (3) Andrew SBNHH-1D65A panel antennas mounted on three (3)existing standoff arms to the existing pipe mast with a RAD center elevation of 105-ftabove tower base plate.Coax Cables: Six (6) 1-5/8” Æ coax cables running on the outside of the tower asindicated in section 4 of this report.
P r i m a r y a s s u m p t i o n s u s e d i n t h e a n a l y s i s§ ASCE Manual No. 72, “Design of Steel Transmission Pole Structures Second Edition”,
defines steel stresses for evaluation of the utility pole.§ All utility pole members are adequately protected to prevent corrosion of steel members.§ All proposed antenna mounts are modeled as listed above.§ Pipe mast will be properly installed and maintained.§ No residual stresses exist due to incorrect pole erection.§ All bolts are appropriately tightened providing the necessary connection continuity.§ All welds conform to the requirements of AWS D1.1.§ Pipe mast and utility pole will be in plumb condition.§ Utility pole was properly installed and maintained and all members were properly designed,
detailed, fabricated, and installed and have been properly maintained since erection.§ Any deviation from the analyzed loading will require a new analysis for verification of
structural adequacy.
CENTEK Engineering, Inc.Structural Analysis – 95-ft Pole # 838T-Mobile Antenna Upgrade – CT11860ATrumbull, CTOctober 24, 2016
REPORT SECTION 1-2
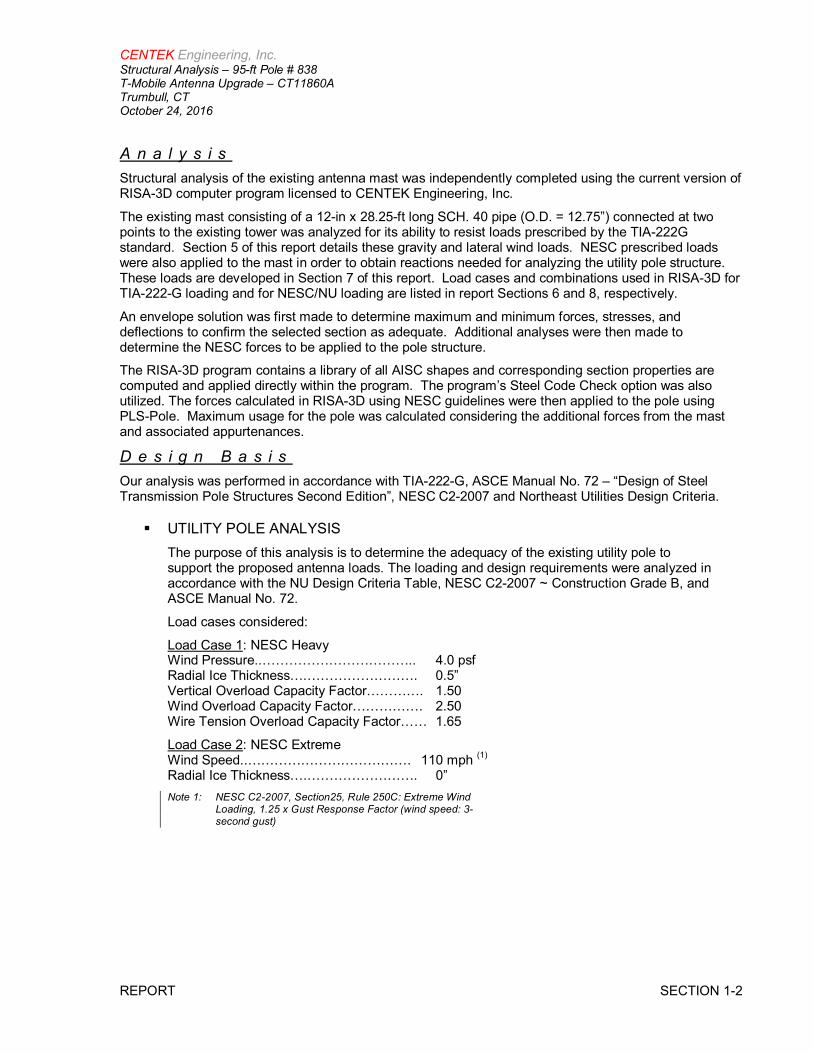
A n a l y s i sStructural analysis of the existing antenna mast was independently completed using the current version ofRISA-3D computer program licensed to CENTEK Engineering, Inc.
The existing mast consisting of a 12-in x 28.25-ft long SCH. 40 pipe (O.D. = 12.75”) connected at twopoints to the existing tower was analyzed for its ability to resist loads prescribed by the TIA-222Gstandard. Section 5 of this report details these gravity and lateral wind loads. NESC prescribed loadswere also applied to the mast in order to obtain reactions needed for analyzing the utility pole structure.These loads are developed in Section 7 of this report. Load cases and combinations used in RISA-3D forTIA-222-G loading and for NESC/NU loading are listed in report Sections 6 and 8, respectively.
An envelope solution was first made to determine maximum and minimum forces, stresses, anddeflections to confirm the selected section as adequate. Additional analyses were then made todetermine the NESC forces to be applied to the pole structure.
The RISA-3D program contains a library of all AISC shapes and corresponding section properties arecomputed and applied directly within the program. The program’s Steel Code Check option was alsoutilized. The forces calculated in RISA-3D using NESC guidelines were then applied to the pole usingPLS-Pole. Maximum usage for the pole was calculated considering the additional forces from the mastand associated appurtenances.
D e s i g n B a s i sOur analysis was performed in accordance with TIA-222-G, ASCE Manual No. 72 – “Design of SteelTransmission Pole Structures Second Edition”, NESC C2-2007 and Northeast Utilities Design Criteria.
§ UTILITY POLE ANALYSISThe purpose of this analysis is to determine the adequacy of the existing utility pole tosupport the proposed antenna loads. The loading and design requirements were analyzed inaccordance with the NU Design Criteria Table, NESC C2-2007 ~ Construction Grade B, andASCE Manual No. 72.
Load cases considered:
Load Case 1: NESC HeavyWind Pressure..…………………………….. 4.0 psfRadial Ice Thickness….……………………. 0.5”Vertical Overload Capacity Factor…………. 1.50Wind Overload Capacity Factor……………. 2.50Wire Tension Overload Capacity Factor…… 1.65
Load Case 2: NESC ExtremeWind Speed..………………………………. 110 mph (1)
Radial Ice Thickness….……………………. 0”Note 1: NESC C2-2007, Section25, Rule 250C: Extreme Wind
Loading, 1.25 x Gust Response Factor (wind speed: 3-second gust)
CENTEK Engineering, Inc.Structural Analysis – 95-ft Pole # 838T-Mobile Antenna Upgrade – CT11860ATrumbull, CTOctober 24, 2016
REPORT SECTION 1-3
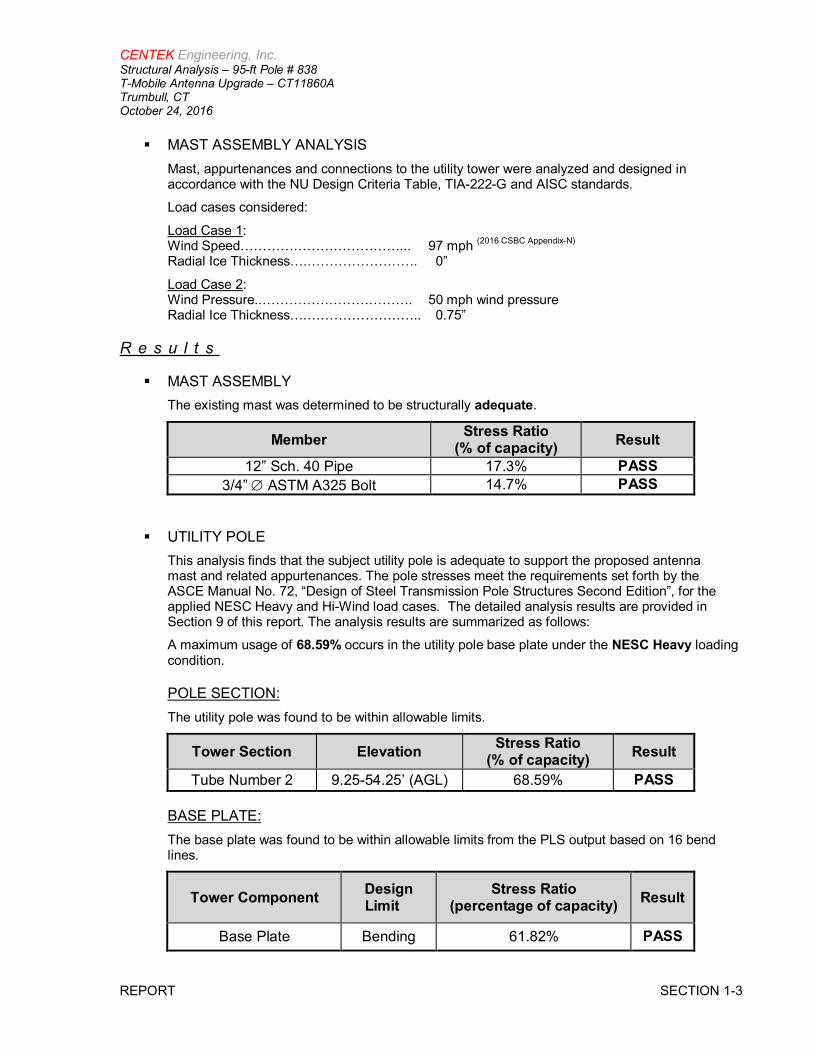
§ MAST ASSEMBLY ANALYSISMast, appurtenances and connections to the utility tower were analyzed and designed inaccordance with the NU Design Criteria Table, TIA-222-G and AISC standards.
Load cases considered:
Load Case 1:Wind Speed………………………………... 97 mph (2016 CSBC Appendix-N)
Radial Ice Thickness….……………………. 0”
Load Case 2:Wind Pressure..……………………………. 50 mph wind pressureRadial Ice Thickness….…………………….. 0.75”
R e s u l t s
§ MAST ASSEMBLYThe existing mast was determined to be structurally adequate.
Member Stress Ratio(% of capacity) Result
12” Sch. 40 Pipe 17.3% PASS3/4” Æ ASTM A325 Bolt 14.7% PASS
§ UTILITY POLEThis analysis finds that the subject utility pole is adequate to support the proposed antennamast and related appurtenances. The pole stresses meet the requirements set forth by theASCE Manual No. 72, “Design of Steel Transmission Pole Structures Second Edition”, for theapplied NESC Heavy and Hi-Wind load cases. The detailed analysis results are provided inSection 9 of this report. The analysis results are summarized as follows:
A maximum usage of 68.59% occurs in the utility pole base plate under the NESC Heavy loadingcondition.
POLE SECTION:The utility pole was found to be within allowable limits.
Tower Section Elevation Stress Ratio(% of capacity) Result
Tube Number 2 9.25-54.25’ (AGL) 68.59% PASS
BASE PLATE:The base plate was found to be within allowable limits from the PLS output based on 16 bendlines.
Tower Component DesignLimit
Stress Ratio(percentage of capacity) Result
Base Plate Bending 61.82% PASS
CENTEK Engineering, Inc.Structural Analysis – 95-ft Pole # 838T-Mobile Antenna Upgrade – CT11860ATrumbull, CTOctober 24, 2016
REPORT SECTION 1-4
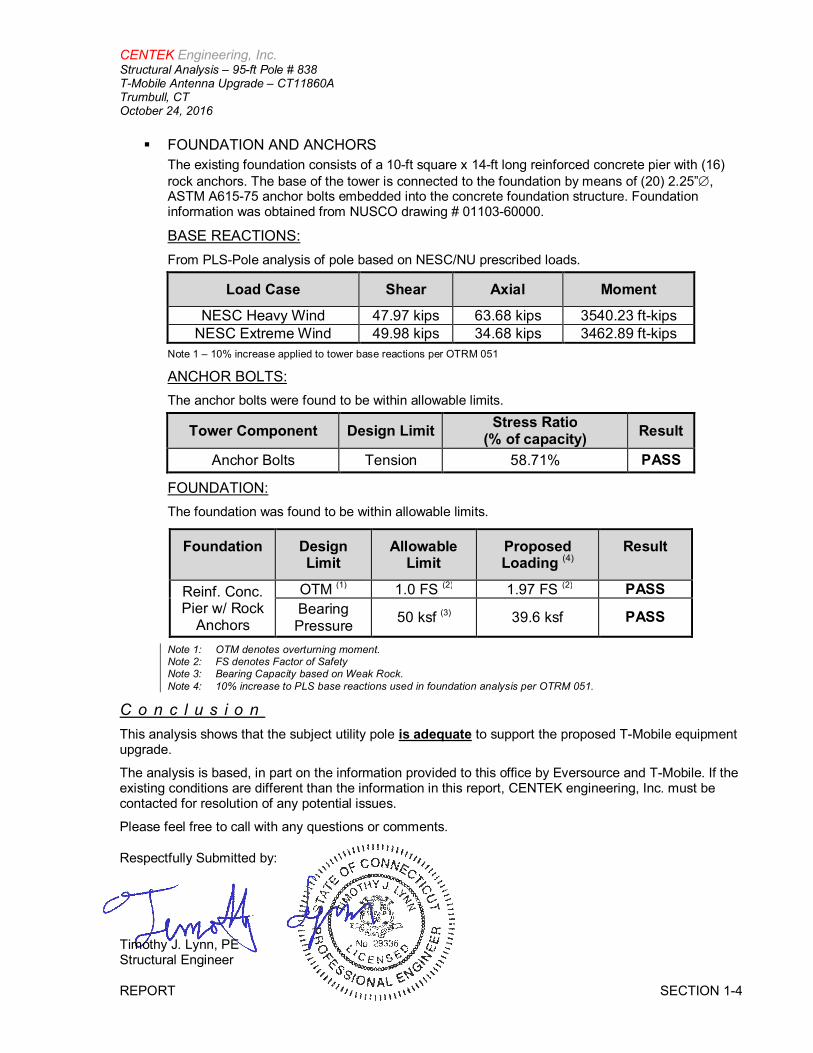
§ FOUNDATION AND ANCHORSThe existing foundation consists of a 10-ft square x 14-ft long reinforced concrete pier with (16)rock anchors. The base of the tower is connected to the foundation by means of (20) 2.25”Æ,ASTM A615-75 anchor bolts embedded into the concrete foundation structure. Foundationinformation was obtained from NUSCO drawing # 01103-60000.
BASE REACTIONS:From PLS-Pole analysis of pole based on NESC/NU prescribed loads.
Load Case Shear Axial MomentNESC Heavy Wind 47.97 kips 63.68 kips 3540.23 ft-kips
NESC Extreme Wind 49.98 kips 34.68 kips 3462.89 ft-kipsNote 1 – 10% increase applied to tower base reactions per OTRM 051
ANCHOR BOLTS:The anchor bolts were found to be within allowable limits.
FOUNDATION:The foundation was found to be within allowable limits.
Note 1: OTM denotes overturning moment.Note 2: FS denotes Factor of SafetyNote 3: Bearing Capacity based on Weak Rock.Note 4: 10% increase to PLS base reactions used in foundation analysis per OTRM 051.
C o n c l u s i o nThis analysis shows that the subject utility pole is adequate to support the proposed T-Mobile equipmentupgrade.
The analysis is based, in part on the information provided to this office by Eversource and T-Mobile. If theexisting conditions are different than the information in this report, CENTEK engineering, Inc. must becontacted for resolution of any potential issues.
Please feel free to call with any questions or comments.
Respectfully Submitted by:
Timothy J. Lynn, PEStructural Engineer
Tower Component Design Limit Stress Ratio(% of capacity) Result
Anchor Bolts Tension 58.71% PASS
Foundation DesignLimit
AllowableLimit
ProposedLoading (4)
Result
Reinf. Conc.Pier w/ Rock
Anchors
OTM (1) 1.0 FS (2) 1.97 FS (2) PASSBearingPressure 50 ksf (3) 39.6 ksf PASS
CENTEK Engineering, Inc.Structural Analysis – 95-ft Pole # 838T-Mobile Antenna Upgrade – CT11860ATrumbull, CTOctober 24, 2016
CONDITIONS & SOFTWARE SECTION 2-1
S T A N D A R D C O N D I T I O N S F O R F U R N I S H I N G O FP R O F E S S I O N A L E N G I N E E R I N G S E R V I C E S O NE X I S T I N G S T R U C T U R E S
All engineering services are performed on the basis that the information used is current and correct. Thisinformation may consist of, but is not necessarily limited to:
§ Information supplied by the client regarding the structure itself, its foundations, the soil conditions, theantenna and feed line loading on the structure and its components, or other relevant information.
§ Information from the field and/or drawings in the possession of CENTEK engineering, Inc. orgenerated by field inspections or measurements of the structure.
§ It is the responsibility of the client to ensure that the information provided to CENTEK engineering,Inc. and used in the performance of our engineering services is correct and complete. In the absenceof information to the contrary, we assume that all structures were constructed in accordance with thedrawings and specifications and are in an un-corroded condition and have not deteriorated. It istherefore assumed that its capacity has not significantly changed from the “as new” condition.
§ All services will be performed to the codes specified by the client, and we do not imply to meet anyother codes or requirements unless explicitly agreed in writing. If wind and ice loads or other relevantparameters are to be different from the minimum values recommended by the codes, the client shallspecify the exact requirement. In the absence of information to the contrary, all work will beperformed in accordance with the latest revision of ANSI/ASCE10 & ANSI/EIA-222.
§ All services are performed, results obtained, and recommendations made in accordance withgenerally accepted engineering principles and practices. CENTEK engineering, Inc. is notresponsible for the conclusions, opinions and recommendations made by others based on theinformation we supply.
CENTEK Engineering, Inc.Structural Analysis – 95-ft Pole # 838T-Mobile Antenna Upgrade – CT11860ATrumbull, CTOctober 24, 2016
CONDITIONS & SOFTWARE SECTION 2-2
G E N E R A L D E S C R I P T I O N O F S T R U C T U R A LA N A L Y S I S P R O G R A M ~ R I S A - 3 D
RISA-3D Structural Analysis Program is an integrated structural analysis and design software package forbuildings, bridges, tower structures, etc.
Modeling Features:
§ Comprehensive CAD-like graphic drawing/editing capabilities that let you draw, modify andload elements as well as snap, move, rotate, copy, mirror, scale, split, merge, mesh, delete,apply, etc.
§ Versatile drawing grids (orthogonal, radial, skewed)§ Universal snaps and object snaps allow drawing without grids§ Versatile general truss generator§ Powerful graphic select/unselect tools including box, line, polygon, invert, criteria,
spreadsheet selection, with locking§ Saved selections to quickly recall desired selections§ Modification tools that modify single items or entire selections§ Real spreadsheets with cut, paste, fill, math, sort, find, etc.§ Dynamic synchronization between spreadsheets and views so you can edit or view any data
in the plotted views or in the spreadsheets§ Simultaneous view of multiple spreadsheets§ Constant in-stream error checking and data validation§ Unlimited undo/redo capability§ Generation templates for grids, disks, cylinders, cones, arcs, trusses, tanks, hydrostatic
loads, etc.§ Support for all units systems & conversions at any time§ Automatic interaction with RISASection libraries§ Import DXF, RISA-2D, STAAD and ProSteel 3D files§ Export DXF, SDNF and ProSteel 3D files
Analysis Features:
§ Static analysis and P-Delta effects§ Multiple simultaneous dynamic and response spectra analysis using Gupta, CQC or SRSS
mode combinations§ Automatic inclusion of mass offset (5% or user defined) for dynamic analysis§ Physical member modeling that does not require members to be broken up at intermediate
joints§ State of the art 3 or 4 node plate/shell elements§ High-end automatic mesh generation — draw a polygon with any number of sides to create a
mesh of well-formed quadrilateral (NOT triangular) elements.§ Accurate analysis of tapered wide flanges - web, top and bottom flanges may all taper
independently§ Automatic rigid diaphragm modeling§ Area loads with one-way or two-way distributions§ Multiple simultaneous moving loads with standard AASHTO loads and custom moving loads
for bridges, cranes, etc.§ Torsional warping calculations for stiffness, stress and design§ Automatic Top of Member offset modeling§ Member end releases & rigid end offsets§ Joint master-slave assignments§ Joints detachable from diaphragms§ Enforced joint displacements§ 1-Way members, for tension only bracing, slipping, etc.
CENTEK Engineering, Inc.Structural Analysis – 95-ft Pole # 838T-Mobile Antenna Upgrade – CT11860ATrumbull, CTOctober 24, 2016
CONDITIONS & SOFTWARE SECTION 2-3
§ 1-Way springs, for modeling soils and other effects§ Euler members that take compression up to their buckling load, then turn off.§ Stress calculations on any arbitrary shape§ Inactive members, plates, and diaphragms allows you to quickly remove parts of structures
from consideration§ Story drift calculations provide relative drift and ratio to height§ Automatic self-weight calculations for members and plates§ Automatic subgrade soil spring generator
Graphics Features:
§ Unlimited simultaneous model view windows§ Extraordinary “true to scale” rendering, even when drawing§ High-speed redraw algorithm for instant refreshing§ Dynamic scrolling stops right where you want§ Plot & print virtually everything with color coding & labeling§ Rotate, zoom, pan, scroll and snap views§ Saved views to quickly restore frequent or desired views§ Full render or wire-frame animations of deflected model and dynamic mode shapes with
frame and speed control§ Animation of moving loads with speed control§ High quality customizable graphics printing
Design Features:
§ Designs concrete, hot rolled steel, cold formed steel and wood§ ACI 1999/2002, BS 8110-97, CSA A23.3-94, IS456:2000,EC 2-1992 with consistent bar sizes
through adjacent spans§ Exact integration of concrete stress distributions using parabolic or rectangular stress blocks§ Concrete beam detailing (Rectangular, T and L)§ Concrete column interaction diagrams§ Steel Design Codes: AISC ASD 9th, LRFD 2nd & 3rd, HSS Specification, CAN/CSA-S16.1-
1994 & 2004, BS 5950-1-2000, IS 800-1984, Euro 3-1993 including local shape databases§ AISI 1999 cold formed steel design§ NDS 1991/1997/2001 wood design, including Structural Composite Lumber, multi-ply, full
sawn§ Automatic spectra generation for UBC 1997, IBC 2000/2003§ Generation of load combinations: ASCE, UBC, IBC, BOCA, SBC, ACI§ Unbraced lengths for physical members that recognize connecting elements and full lengths
of members§ Automatic approximation of K factors§ Tapered wide flange design with either ASD or LRFD codes§ Optimization of member sizes for all materials and all design codes, controlled by standard or
user-defined lists of available sizes and criteria such as maximum depths§ Automatic calculation of custom shape properties§ Steel Shapes: AISC, HSS, CAN, ARBED, British, Euro, Indian, Chilean§ Light Gage Shapes: AISI, SSMA, Dale / Incor, Dietrich, Marino\WARE§ Wood Shapes: Complete NDS species/grade database§ Full seamless integration with RISAFoot (Ver 2 or better) for advanced footing design and
detailing§ Plate force summation tool
CENTEK Engineering, Inc.Structural Analysis – 95-ft Pole # 838T-Mobile Antenna Upgrade – CT11860ATrumbull, CTOctober 24, 2016
CONDITIONS & SOFTWARE SECTION 2-4
Results Features:
§ Graphic presentation of color-coded results and plotted designs§ Color contours of plate stresses and forces with quadratic smoothing, the contours may also
be animated§ Spreadsheet results with sorting and filtering of: reactions, member & joint deflections, beam
& plate forces/stresses, optimized sizes, code designs, concrete reinforcing, materialtakeoffs, frequencies and mode shapes
§ Standard and user-defined reports§ Graphic member detail reports with force/stress/deflection diagrams and detailed design
calculations and expanded diagrams that display magnitudes at any dialed location§ Saved solutions quickly restore analysis and design results.
CENTEK Engineering, Inc.Structural Analysis – 95-ft Pole # 838T-Mobile Antenna Upgrade – CT11860ATrumbull, CTOctober 24, 2016
CONDITIONS & SOFTWARE SECTION 2-5
G E N E R A L D E S C R I P T I O N O F S T R U C T U R A LA N A L Y S I S P R O G R A M ~ P L S - T O W E R
PLS-TOWER is a Microsoft Windows program for the analysis and design of steel latticed towersused in electric power lines or communication facilities. Both self-supporting and guyed towerscan be modeled. The program performs design checks of structures under user specified loads.For electric power structures it can also calculate maximum allowable wind and weight spans andinteraction diagrams between different ratios of allowable wind and weight spans.
Modeling Features:
§ Powerful graphics module (stress usages shown in different colors)§ Graphical selection of joints and members allows graphical editing and checking§ Towers can be shown as lines, wire frames or can be rendered as 3-d polygon surfaces§ Can extract geometry and connectivity information from a DXF CAD drawing§ CAD design drawings, title blocks, drawing borders or photos can be tied to structure model§ XML based post processor interface§ Steel Detailing Neutral File (SDNF) export to link with detailing packages§ Can link directly to line design program PLS-CADD§ Automatic generation of structure files for PLS-CADD§ Databases of steel angles, rounds, bolts, guys, etc.§ Automatic generation of joints and members by symmetries and interpolations§ Automated mast generation (quickly builds model for towers that have regular repeating
sections) via graphical copy/paste§ Steel angles and rounds modeled either as truss, beam or tension-only elements§ Guys are easily handled (can be modeled as exact cable elements)
Analysis Features:
§ Automatic handling of tension-only members§ Automatic distribution of loads in 2-part suspension insulators (v-strings, horizontal vees, etc.)§ Automatic calculation of tower dead, ice, and wind loads as well as drag coefficients
according to:§ ASCE 74-1991§ NESC 2002§ NESC 2007§ IEC 60826:2003§ EN50341-1:2001 (CENELEC)§ EN50341-3-9:2001 (UK NNA)§ EN50341-3-17:2001 (Portugal NNA)§ ESAA C(b)1-2003 (Australia)§ TPNZ (New Zealand)§ REE (Spain)§ EIA/TIA 222-F§ ANSI/TIA 222-G§ CSA S37-01
§ Automated microwave antenna loading as per EIA/TIA 222-F and ANSI/TIA 222-G§ Minimization of problems caused by unstable joints and mechanisms§ Automatic bandwidth minimization and ability to solve large problems§ Design checks according to (other standards can be added easily):
§ ASCE Standard 10-90
CENTEK Engineering, Inc.Structural Analysis – 95-ft Pole # 838T-Mobile Antenna Upgrade – CT11860ATrumbull, CTOctober 24, 2016
CONDITIONS & SOFTWARE SECTION 2-6
§ AS 3995 (Australian Standard 3995)§ BS 8100 (British Standard 8100)§ EN50341-1 (CENELEC, both empirical and analytical methods are available)§ ECCS 1985§ NGT-ECCS§ PN-90/B-03200§ EIA/TIA 222-F§ ANSI/TIA 222-G§ CSA S37-01§ EDF/RTE Resal§ IS 802 (India Standard 802)
Results Features:
§ Design summaries printed for each group of members§ Easy to interpret text, spreadsheet and graphics design summaries§ Automatic determination of allowable wind and weight spans§ Automatic determination of interaction diagrams between allowable wind and weight spans§ Capability to batch run multiple tower configurations and consolidate the results§ Automated optimum angle member size selection and bolt quantity determinationTool for interactive angle member sizing and bolt quantity determination.
CENTEK Engineering, Inc.Structural Analysis – 95-ft Pole # 838T-Mobile Antenna Upgrade – CT11860ATrumbull, CTOctober 24, 2016
DESIGN CRITERIA SECTION 3-1
C r i t e r i a f o r D e s i g n o f P C S F a c i l i t i e s O n o rE x t e n d i n g A b o v e M e t a l E l e c t r i c T r a n s m i s s i o nT o w e r s & A n a l y s i s o f T r a n s m i s s i o n T o w e r sS u p p o r t i n g P C S M a s t s (1)
I n t r o d u c t i o n
This criteria is the result from an evaluation of the methods and loadings specified by the separatestandards, which are used in designing telecommunications towers and electric transmission towers. Thatevaluation is detailed elsewhere, but in summary; the methods and loadings are significantly different.This criteria specifies the manner in which the appropriate standard is used to design PCS facilitiesincluding masts and brackets (hereafter referred to as “masts”), and to evaluate the electric transmissiontowers to support PCS masts. The intent is to achieve an equivalent level of safety and security under theextreme design conditions expected in Connecticut and Massachusetts.
ANSI Standard TIA-222 covering the design of telecommunications structures specifies a workingstrength/allowable stress design approach. This approach applies the loads from extreme weatherloading conditions, and designs the structure so that it does not exceed some defined percentage offailure strength (allowable stress).
ANSI Standard C2-2007 (National Electrical Safety Code) covering the design of electric transmissionmetal structures is based upon an ultimate strength/yield stress design approach. This approach appliesa multiplier (overload capacity factor) to the loads possible from extreme weather loading conditions, anddesigns the structure so that it does not exceed its ultimate strength (yield stress).
Each standard defines the details of how loads are to be calculated differently. Most of the NU effort in“unifying” both codes was to establish what level of strength each approach would provide, and thenincreasing the appropriate elements of each to achieve a similar level of security under extreme weatherloadings.
Two extreme weather conditions are considered. The first is an extreme wind condition (hurricane) basedupon a 50-year recurrence (2% annual probability). The second is a winter condition combining wind andice loadings.
The following sections describe the design criteria for any PCS mast extending above the top of anelectric transmission tower, and the analysis criteria for evaluating the loads on the transmission towerfrom such a mast from the lower portions of such a mast, and loads on the pre-existing electric lowerportions of such a mast, and loads on the pre-existing electric transmission tower and the conductors itsupports.
Note 1: Prepared from documentation provide from Northeast Utilities.
CENTEK Engineering, Inc.Structural Analysis – 95-ft Pole # 838T-Mobile Antenna Upgrade – CT11860ATrumbull, CTOctober 24, 2016
DESIGN CRITERIA SECTION 3-2
P C S M a s t
The PCS facility (mast, external cable/trays, including the initial and any planned future support platforms,antennas, etc. extending the full height above the top level of the electric transmission structure) shall bedesigned in accordance with the provisions of TIA 222-G:
E L E C T R I C T R A N S M I S S I O N T O W E R
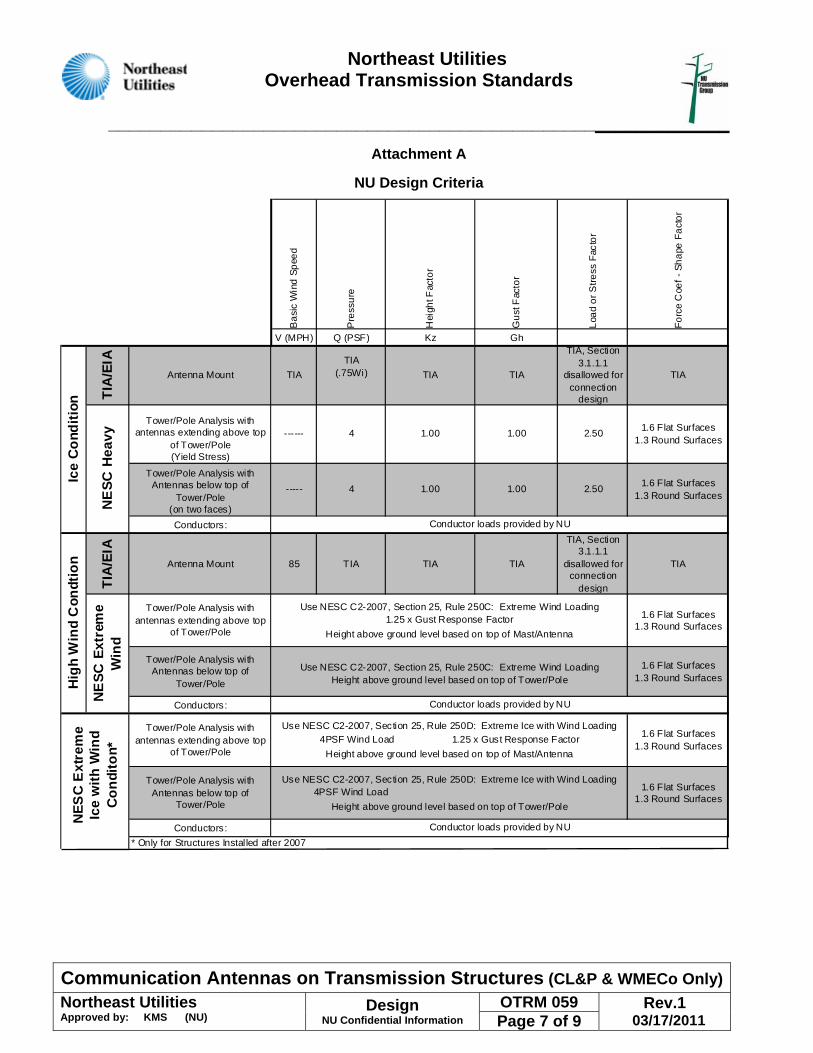
The electric transmission tower shall be analyzed using yield stress theory in accordance with theattached table titled “NU Design Criteria”. This specifies uniform loadings (different from the TIA loadings)on the each of the following components of the installed facility:
§ PCS mast for its total height above ground level, including the initial and planned futuresupport platforms, antennas, etc. above the top of an electric transmission structure.
§ Conductors are related devices and hardware.
§ Electric transmission structure. The loads from the PCS facility and from the electricconductors shall be applied to the structure at conductor and PCS mast attachmentpoints, where those load transfer to the tower.
The uniform loadings and factors specified for the above components in the table are based upon theNational Electrical Safety Code 2007 Edition Extreme Wind (Rule 250C) and Combined Ice and Wind(Rule 250B-Heavy) Loadings. These provide equivalent loadings compared to TIA and its loads andfactors with the exceptions noted above. (Note that the NESC does not require the projected windsurfaces of structures and equipment to be increased by the ice covering.)
In the event that the electric transmission tower is not sufficient to support the additional loadings of thePCS mast, reinforcement will be necessary to upgrade the strength of the overstressed members.
Northeast Utilities Overhead Transmission Standards
____________________________________________________________
Communication Antennas on Transmission Structures (CL&P & WMECo Only)OTRM 059 Northeast Utilities
Approved by: KMS (NU) Design
NU Confidential Information Page 7 of 9 Rev.1
03/17/2011
Attachment A
NU Design Criteria
Ba
sic
Win
d S
pee
d
Pre
ssu
re
Heig
ht F
acto
r
Gu
st F
acto
r
Loa
d o
r S
tre
ss F
ac
tor
Fo
rce
Coe
f -
Sh
ape
Fa
cto
r
V (MPH) Q (PSF) Kz Gh
TIA
(.75Wi)
Conductors:
TIA
/EIA
Antenna Mount 85 TIA TIA TIA
TIA, Section
3.1.1.1
disallowed for
connection
design
TIA
Conductors:
Conductors:
1.6 Flat Surfaces
1.3 Round Surfaces
1.6 Flat Surfaces
1.3 Round Surfaces
1.6 Flat Surfaces
1.3 Round Surfaces
1.6 Flat Surfaces
1.3 Round Surfaces
Tower/Pole Analysis with
antennas extending above top
of Tower/Pole
(Yield Stress)
Tower/Pole Analysis with
Antennas below top of
Tower/Pole
(on two faces)
Tower/Pole Analysis with
antennas extending above top
of Tower/Pole
TIA
/EIA
Antenna Mount
Tower/Pole Analysis with
Antennas below top of
Tower/Pole
4 1.00
4 1.00
Conductor loads provided by NU
1.00 2.50-----
1.00
Use NESC C2-2007, Section 25, Rule 250C: Extreme Wind Loading
Conductor loads provided by NU
TIA TIA
Height above ground level based on top of Tower/Pole
TIA, Section
3.1.1.1
disallowed for
connection
design
TIA
2.50
TIA
------
NES
C E
xtre
me
Ice
with
Win
d C
ondi
ton*
4PSF Wind Load
Height above ground level based on top of Tower/Pole
NE
SC H
eavy
Ice
Con
ditio
nH
igh
Win
d C
ondt
ion
NE
SC E
xtre
me
Win
d
Use NESC C2-2007, Section 25, Rule 250C: Extreme Wind Loading
1.25 x Gust Response Factor
Height above ground level based on top of Mast/Antenna
* Only for Structures Installed after 2007
1.6 Flat Surfaces
1.3 Round Surfaces4PSF Wind Load 1.25 x Gust Response Factor
Height above ground level based on top of Mast/Antenna
Tower/Pole Analysis with
Antennas below top of
Tower/Pole
Use NESC C2-2007, Section 25, Rule 250D: Extreme Ice with Wind Loading1.6 Flat Surfaces
1.3 Round Surfaces
Tower/Pole Analysis with
antennas extending above top
of Tower/Pole
Use NESC C2-2007, Section 25, Rule 250D: Extreme Ice with Wind Loading
Conductor loads provided by NU
Northeast Utilities Overhead Transmission Standards
____________________________________________________________
Communication Antennas on Transmission Structures (CL&P & WMECo Only)OTRM 059 Northeast Utilities
Approved by: KMS (NU) Design
NU Confidential Information Page 3 of 9 Rev.1
03/17/2011
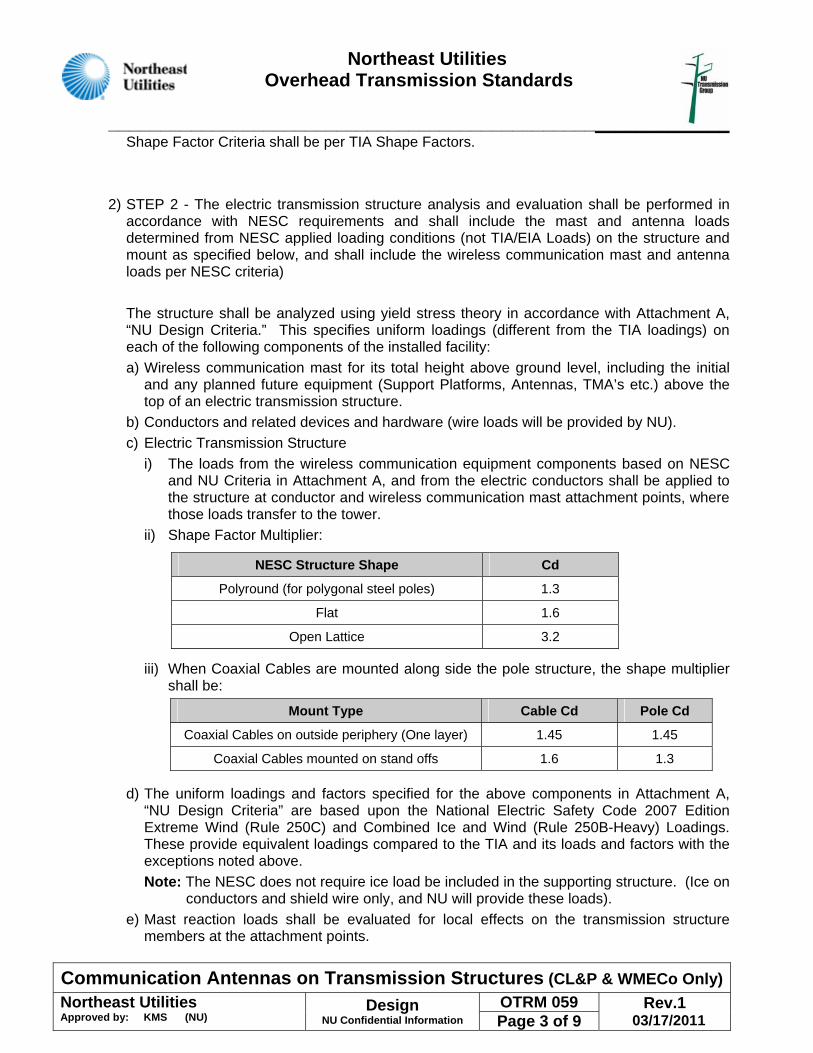
Shape Factor Criteria shall be per TIA Shape Factors.
2) STEP 2 - The electric transmission structure analysis and evaluation shall be performed in accordance with NESC requirements and shall include the mast and antenna loads determined from NESC applied loading conditions (not TIA/EIA Loads) on the structure and mount as specified below, and shall include the wireless communication mast and antenna loads per NESC criteria)
The structure shall be analyzed using yield stress theory in accordance with Attachment A, “NU Design Criteria.” This specifies uniform loadings (different from the TIA loadings) on each of the following components of the installed facility:
a) Wireless communication mast for its total height above ground level, including the initial and any planned future equipment (Support Platforms, Antennas, TMA’s etc.) above the top of an electric transmission structure.
b) Conductors and related devices and hardware (wire loads will be provided by NU).
c) Electric Transmission Structure
i) The loads from the wireless communication equipment components based on NESC and NU Criteria in Attachment A, and from the electric conductors shall be applied to the structure at conductor and wireless communication mast attachment points, where those loads transfer to the tower.
ii) Shape Factor Multiplier:
iii) When Coaxial Cables are mounted along side the pole structure, the shape multiplier shall be:
d) The uniform loadings and factors specified for the above components in Attachment A, “NU Design Criteria” are based upon the National Electric Safety Code 2007 Edition Extreme Wind (Rule 250C) and Combined Ice and Wind (Rule 250B-Heavy) Loadings. These provide equivalent loadings compared to the TIA and its loads and factors with the exceptions noted above.
Note: The NESC does not require ice load be included in the supporting structure. (Ice on conductors and shield wire only, and NU will provide these loads).
e) Mast reaction loads shall be evaluated for local effects on the transmission structure members at the attachment points.
NESC Structure Shape Cd
Polyround (for polygonal steel poles) 1.3
Flat 1.6
Open Lattice 3.2
Mount Type Cable Cd Pole Cd
Coaxial Cables on outside periphery (One layer) 1.45 1.45
Coaxial Cables mounted on stand offs 1.6 1.3
1
TOWER AND MASTELEVATION
EL-1AS NOTED
CFC
TJL
DWG. OF
CHECKED BY:
DRAWN BY:
PROJECT NO:
SCALE:
DATE:
REVISIONS00 10/24/16 ISSUED FOR REVIEW
16159.04
10/19/16 1
CT11860AEVERSOURCE 838
48 QUAIL TRAILTRUMBULL, CT 06611
TOWER & MAST ELEVATION
COAX PLAN
COAX PLAN
Subject:
Location:
Rev. 0: 10/24/16
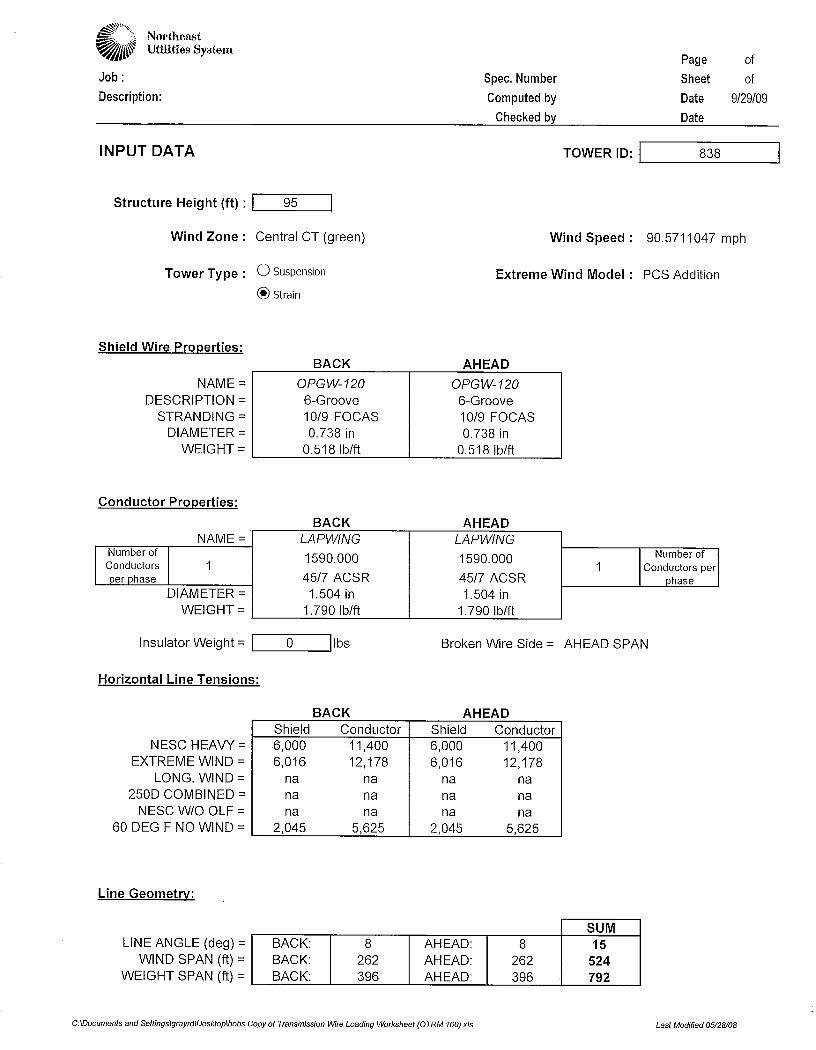
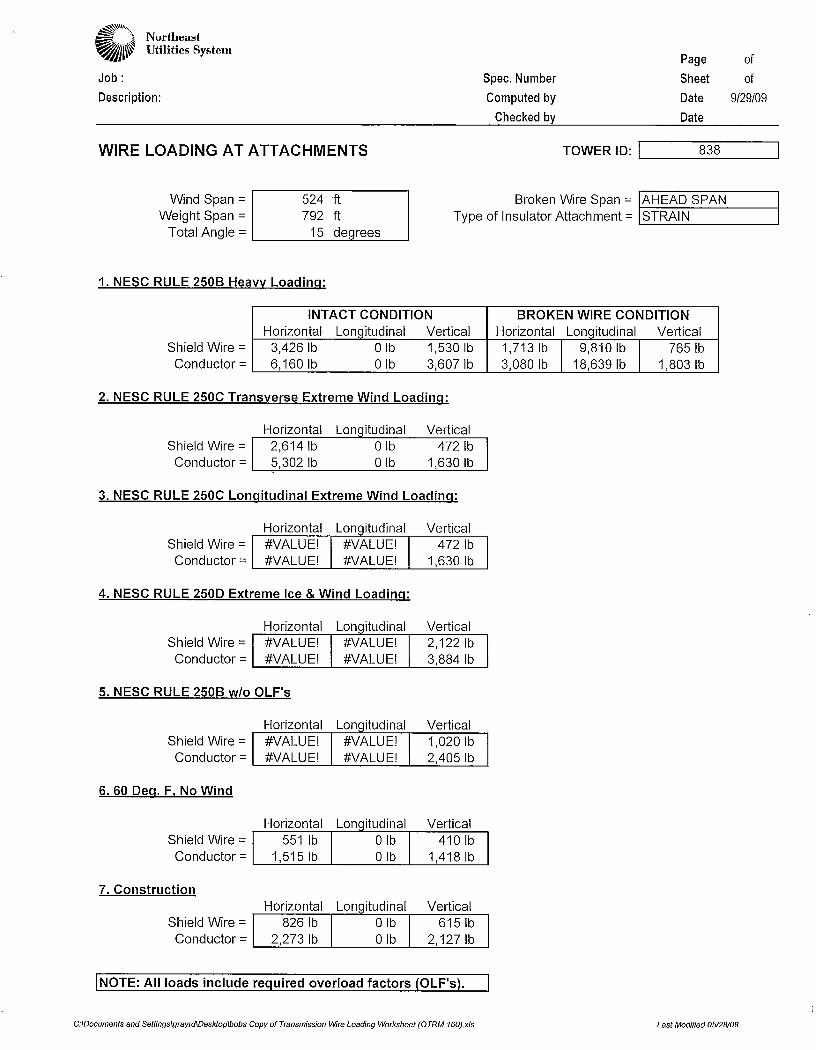
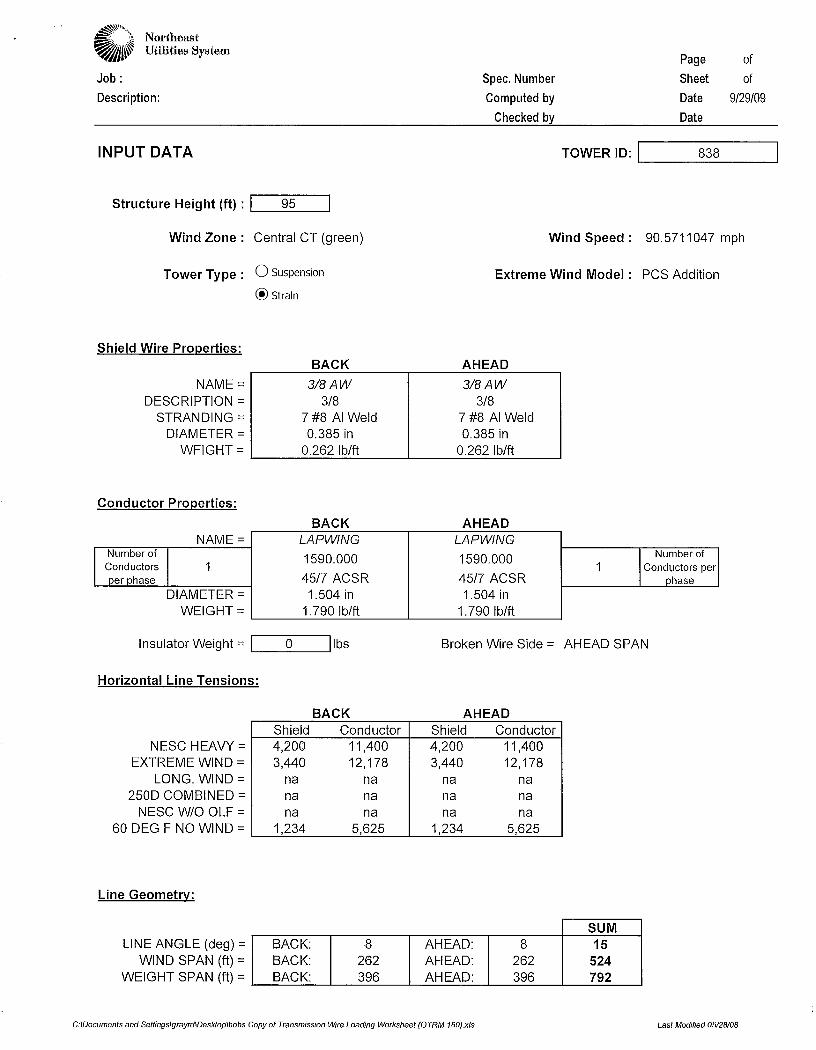
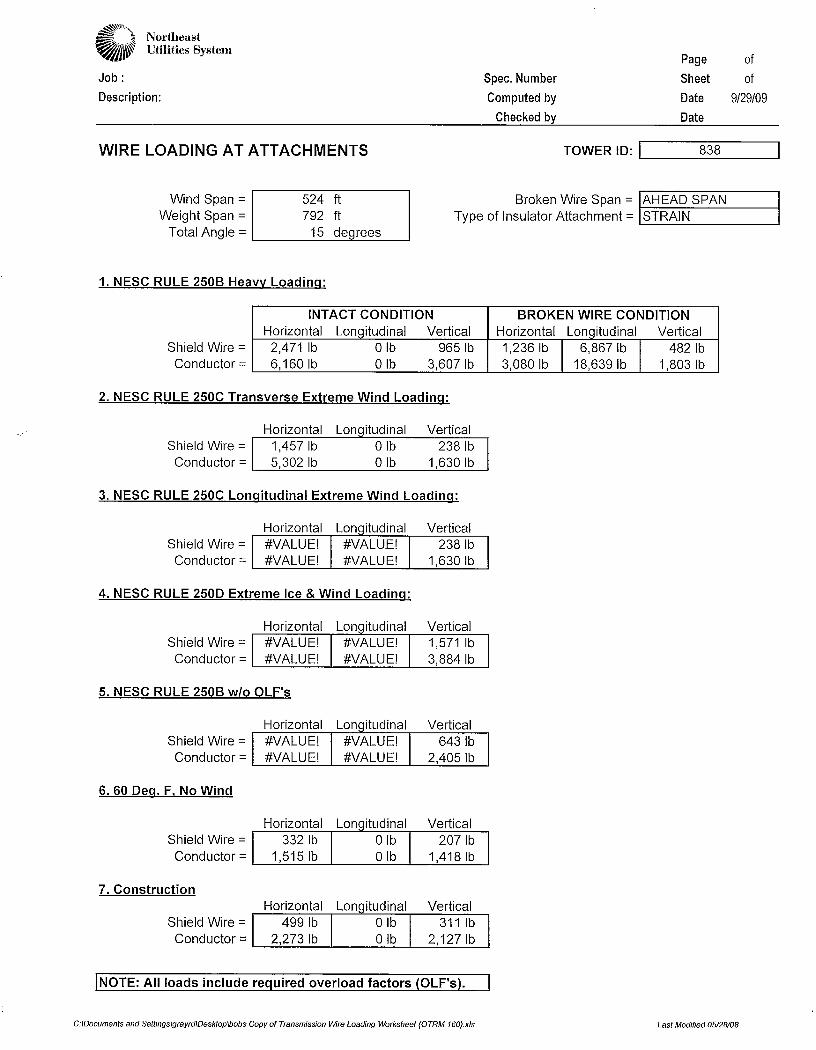
Loads on T-Mobile Equipmnet Structure #838
Trumbull, CT
Prepared by: T.J.L. Checked by: C.F.C.Job No. 16159.04
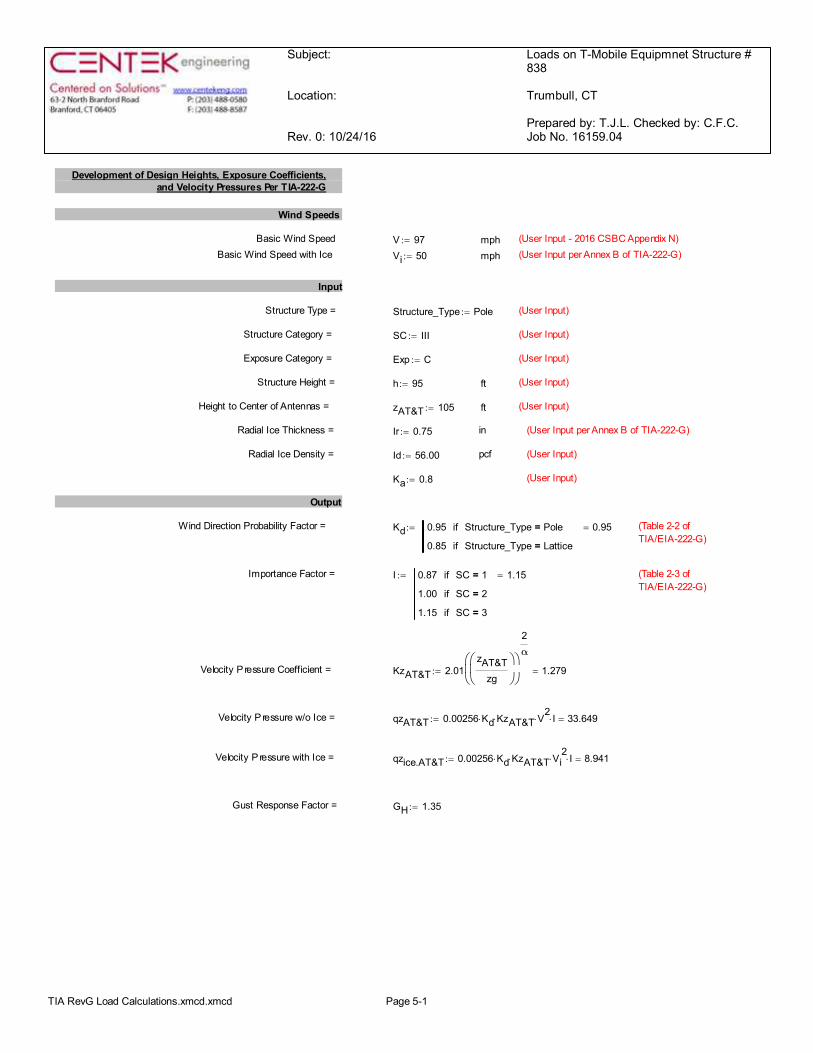
Development of Design Heights, Exposure Coefficients,and Velocity Pressures Per TIA-222-G
Wind Speeds
Basic Wind Speed V 97:= mph (User Input - 2016 CSBC Appendix N)Basic Wind Speed with Ice Vi 50:= mph (User Input per Annex B of TIA-222-G)
Input
Structure Type = Structure_Type Pole:= (User Input)
Structure Category = SC III:= (User Input)
Exposure Category = Exp C:= (User Input)
Structure Height = h 95:= ft (User Input)
Height to Center of Antennas = zAT&T 105:= ft (User Input)
Radial Ice Thickness = Ir 0.75:= in (User Input per Annex B of TIA-222-G)
Radial Ice Density = Id 56.00:= pcf (User Input)
Ka 0.8:= (User Input)
Output
Wind Direction Probability Factor = Kd 0.95 Structure_Type Pole=if
0.85 Structure_Type Lattice=if
0.95=:= (Table 2-2 ofTIA/EIA-222-G)
Importance Factor = I 0.87 SC 1=if
1.00 SC 2=if
1.15 SC 3=if
1.15=:= (Table 2-3 ofTIA/EIA-222-G)
Velocity P ressure Coefficient = KzAT&T 2.01zAT&T
zg
æçè
ö÷ø
æçè
ö÷ø
2α
1.279=:=
Velocity P ressure w/o Ice = qzAT&T 0.00256 Kd× KzAT&T× V2
× I× 33.649=:=
Velocity P ressure with Ice = qzice.AT&T 0.00256 Kd× KzAT&T× Vi2
× I× 8.941=:=
Gust Response Factor = GH 1.35:=
TIA RevG Load Calculations.xmcd.xmcd Page 5-1
Subject:
Location:
Rev. 0: 10/24/16
Loads on T-Mobile Equipmnet Structure #838
Trumbull, CT
Prepared by: T.J.L. Checked by: C.F.C.Job No. 16159.04
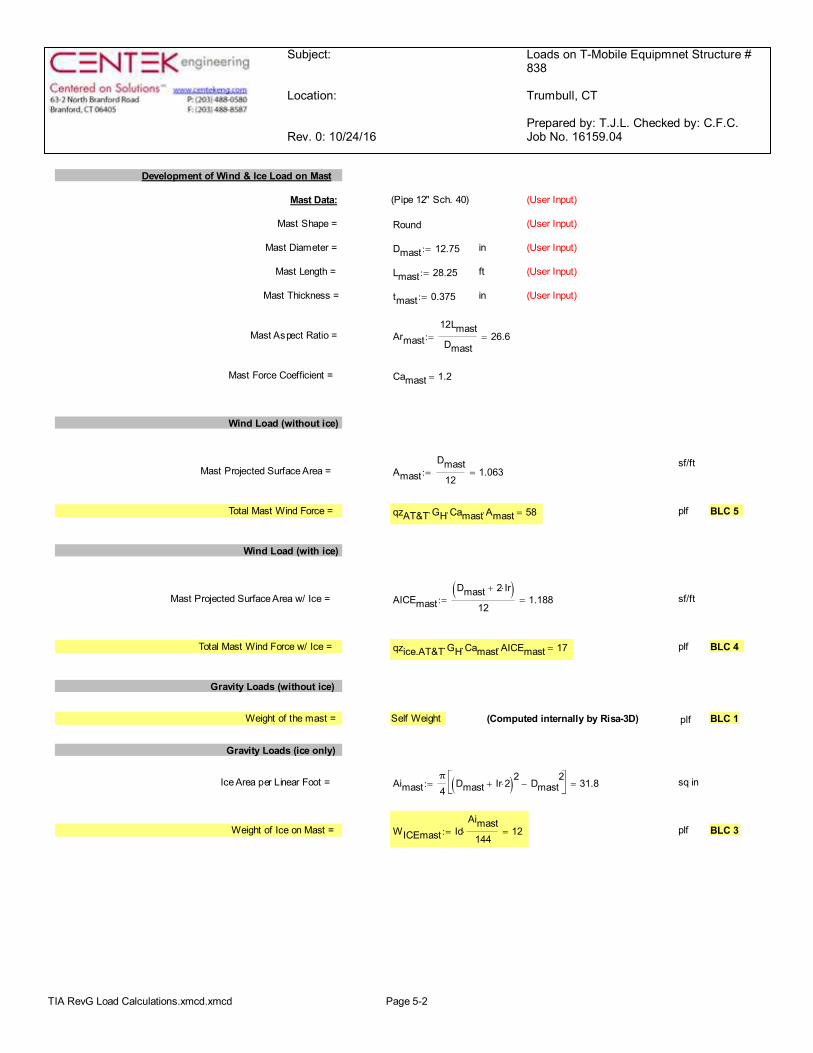
Development of Wind & Ice Load on Mast
Mast Data: (Pipe 12" Sch. 40) (User Input)
Mast Shape = Round (User Input)
Mast Diameter = Dmast 12.75:= in (User Input)
Mast Length = Lmast 28.25:= ft (User Input)
Mast Thickness = tmast 0.375:= in (User Input)
Mast Aspect Ratio = Armast12LmastDmast
26.6=:=
Mast Force Coefficient = Camast 1.2=
Wind Load (without ice)
sf/ftMast Projected Surface Area = Amast
Dmast12
1.063=:=
Total Mast Wind Force = qzAT&T GH× Camast× Amast× 58= plf BLC 5
Wind Load (with ice)
Mast Projected Surface Area w/ Ice = AICEmastDmast 2 Ir×+( )
121.188=:= sf/ft
Total Mast Wind Force w/ Ice = qzice.AT&T GH× Camast× AICEmast× 17= plf BLC 4
Gravity Loads (without ice)
Weight of the mast = Self Weight (Computed internally by Risa-3D) plf BLC 1
Gravity Loads (ice only)
Ice Area per Linear Foot = Aimastπ4
Dmast Ir 2×+( )2 Dmast2
-éë
ùû 31.8=:= sq in
Weight of Ice on Mast = WICEmast IdAimast
144× 12=:= plf BLC 3
TIA RevG Load Calculations.xmcd.xmcd Page 5-2
Subject:
Location:
Rev. 0: 10/24/16
Loads on T-Mobile Equipmnet Structure #838
Trumbull, CT
Prepared by: T.J.L. Checked by: C.F.C.Job No. 16159.04
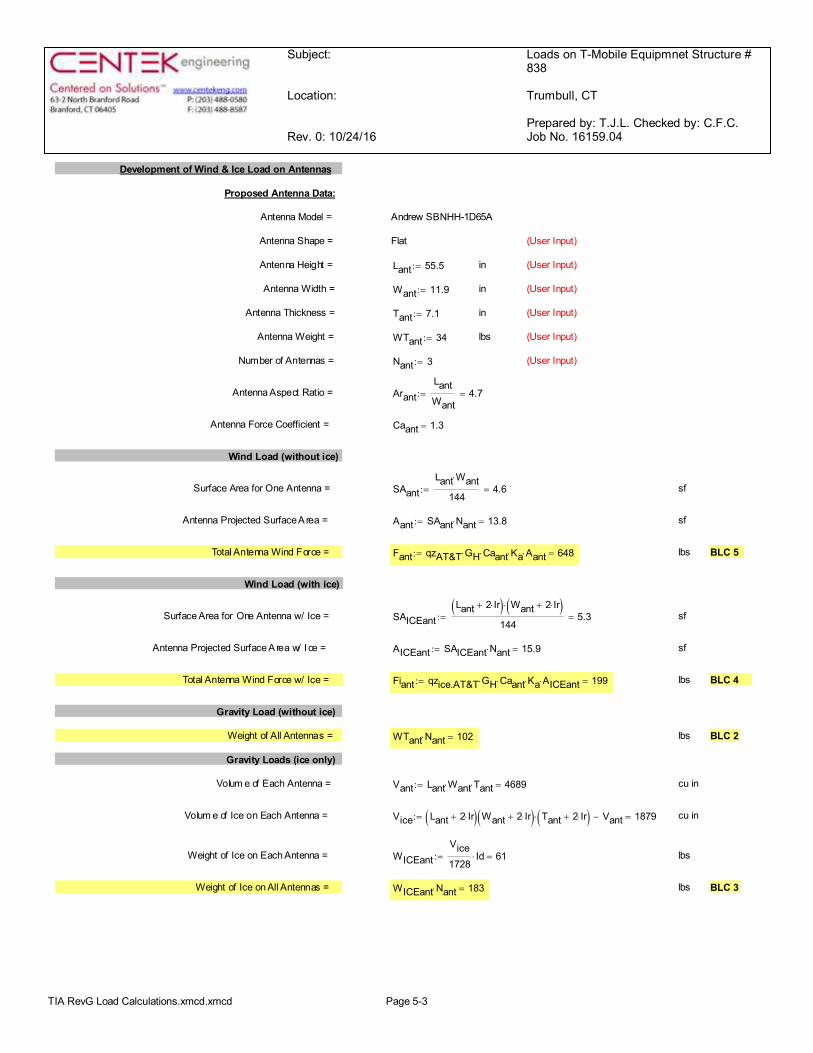
Development of Wind & Ice Load on Antennas
Proposed Antenna Data:
Antenna Model = Andrew SBNHH-1D65A
Antenna Shape = Flat (User Input)
Antenna Height = Lant 55.5:= in (User Input)
Antenna Width = Want 11.9:= in (User Input)
Antenna Thickness = Tant 7.1:= in (User Input)
Antenna Weight = WTant 34:= lbs (User Input)
Number of Antennas = Nant 3:= (User Input)
Antenna Aspect Ratio = ArantLantWant
4.7=:=
Antenna Force Coefficient = Caant 1.3=
Wind Load (without ice)
Surface Area for One Antenna = SAantLant Want×
1444.6=:= sf
Antenna Projected Surface A rea = Aant SAant Nant× 13.8=:= sf
Total Antenna Wind Force = Fant qzAT&T GH× Caant× Ka× Aant× 648=:= lbs BLC 5
Wind Load (with ice)
Surface Area for One Antenna w/ Ice = SAICEantLant 2 Ir×+( ) Want 2 Ir×+( )×
1445.3=:= sf
Antenna Projected Surface A rea w/ I ce = AICEant SAICEant Nant× 15.9=:= sf
Total Antenna Wind Force w/ Ice = Fiant qzice.AT&T GH× Caant× Ka× AICEant× 199=:= lbs BLC 4
Gravity Load (without ice)
Weight of All Antennas = WTant Nant× 102= lbs BLC 2
Gravity Loads (ice only)
Volum e of Each Antenna = Vant Lant Want× Tant× 4689=:= cu in
Volum e of Ice on Each Antenna = Vice Lant 2 Ir×+( ) Want 2 Ir×+( ) Tant 2 Ir×+( )× Vant- 1879=:= cu in
Weight of Ice on Each Antenna = WICEantVice1728
Id× 61=:= lbs
Weight of Ice on All Antennas = WICEant Nant× 183= lbs BLC 3
TIA RevG Load Calculations.xmcd.xmcd Page 5-3
Subject:
Location:
Rev. 0: 10/24/16
Loads on T-Mobile Equipmnet Structure #838
Trumbull, CT
Prepared by: T.J.L. Checked by: C.F.C.Job No. 16159.04
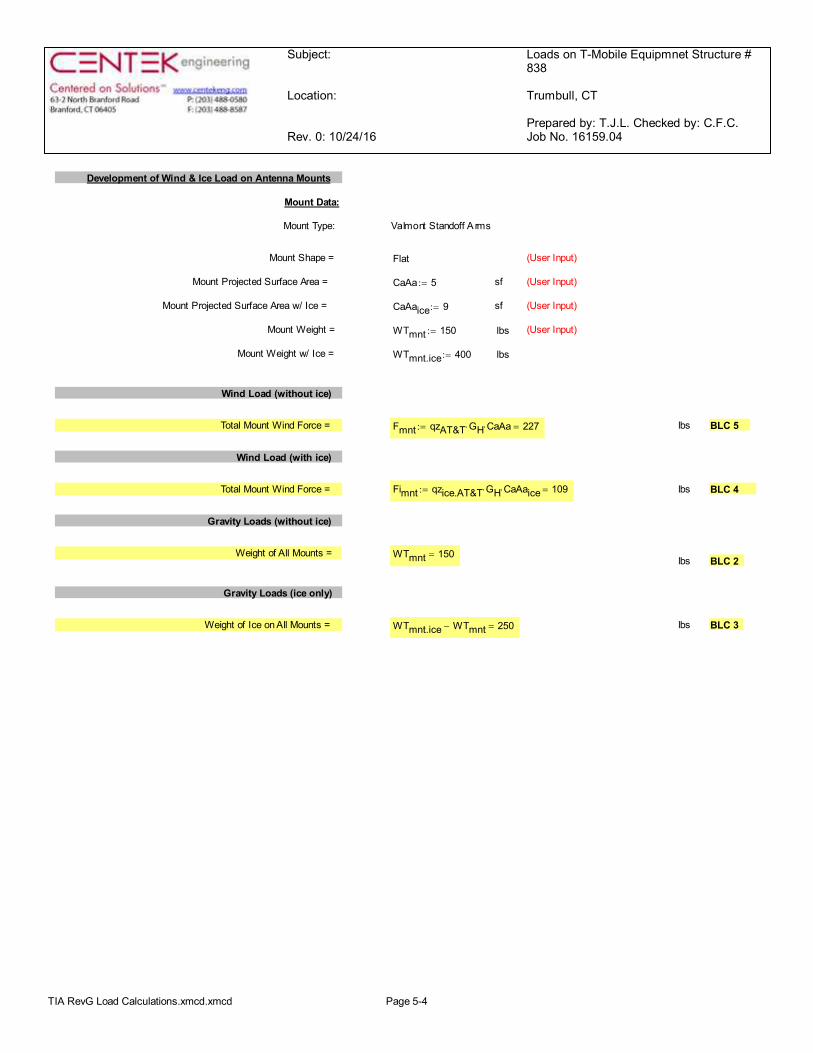
Development of Wind & Ice Load on Antenna Mounts
Mount Data:
Mount Type: Valmont Standoff A rms
Mount Shape = Flat (User Input)
Mount Projected Surface Area = CaAa 5:= sf (User Input)
Mount Projected Surface Area w/ Ice = CaAaice 9:= sf (User Input)
Mount Weight = WTmnt 150:= lbs (User Input)
Mount Weight w/ Ice = WTmnt.ice 400:= lbs
Wind Load (without ice)
Total Mount Wind Force = Fmnt qzAT&T GH× CaAa× 227=:= lbs BLC 5
Wind Load (with ice)
Total Mount Wind Force = Fimnt qzice.AT&T GH× CaAaice× 109=:= lbs BLC 4
Gravity Loads (without ice)
Weight of All Mounts = WTmnt 150=lbs BLC 2
Gravity Loads (ice only)
Weight of Ice on All Mounts = WTmnt.ice WTmnt- 250= lbs BLC 3
TIA RevG Load Calculations.xmcd.xmcd Page 5-4
Subject:
Location:
Rev. 0: 10/24/16
Loads on T-Mobile Equipmnet Structure #838
Trumbull, CT
Prepared by: T.J.L. Checked by: C.F.C.Job No. 16159.04
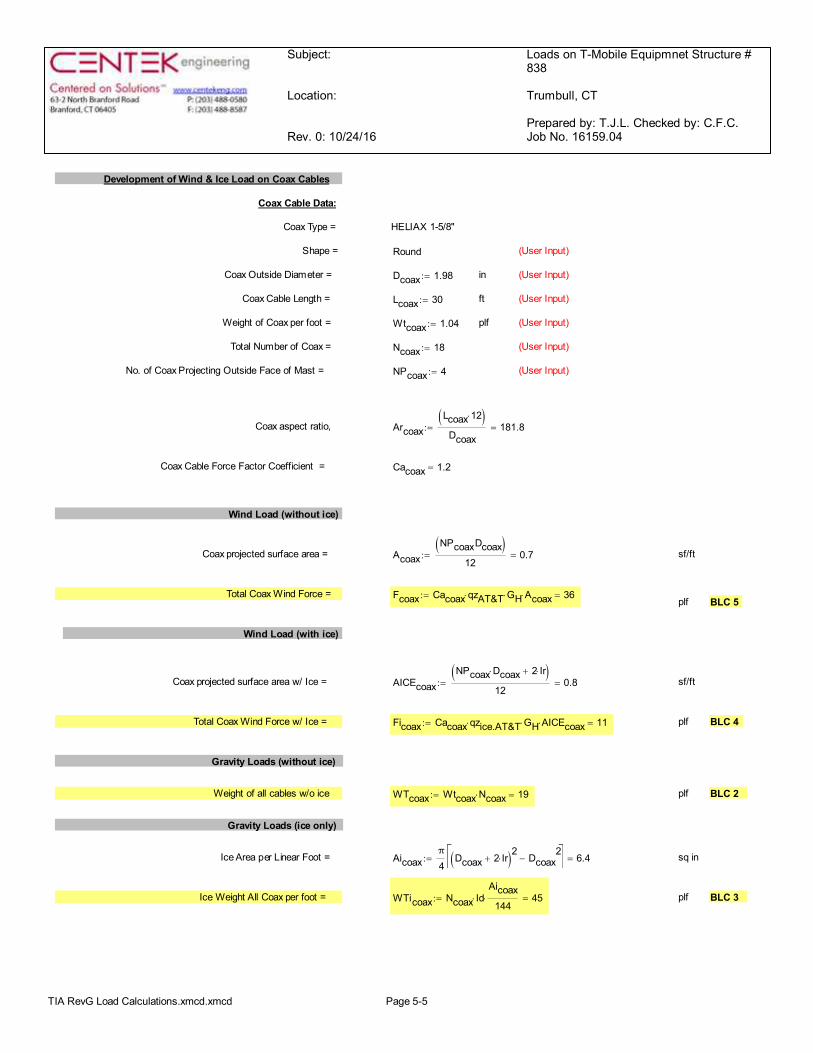
Development of Wind & Ice Load on Coax Cables
Coax Cable Data:
Coax Type = HELIAX 1-5/8"
Shape = Round (User Input)
Coax Outside Diameter = Dcoax 1.98:= in (User Input)
Coax Cable Length = Lcoax 30:= ft (User Input)
Weight of Coax per foot = Wtcoax 1.04:= plf (User Input)
Total Number of Coax = Ncoax 18:= (User Input)
No. of Coax Projecting Outside Face of Mast = NPcoax 4:= (User Input)
Coax aspect ratio, ArcoaxLcoax 12×( )
Dcoax181.8=:=
Coax Cable Force Factor Coefficient = Cacoax 1.2=
Wind Load (without ice)
Coax projected surface area = AcoaxNPcoaxDcoax( )
120.7=:= sf/ft
Total Coax Wind Force = Fcoax Cacoax qzAT&T× GH× Acoax× 36=:=plf BLC 5
Wind Load (with ice)
Coax projected surface area w/ Ice = AICEcoaxNPcoax Dcoax× 2 Ir×+( )
120.8=:= sf/ft
Total Coax Wind Force w/ Ice = Ficoax Cacoax qzice.AT&T× GH× AICEcoax× 11=:= plf BLC 4
Gravity Loads (without ice)
Weight of all cables w/o ice WTcoax Wtcoax Ncoax× 19=:= plf BLC 2
Gravity Loads (ice only)
Ice Area per Linear Foot = Aicoaxπ4
Dcoax 2 Ir×+( )2 Dcoax2
-éë
ùû 6.4=:= sq in
Ice Weight All Coax per foot = WTicoax Ncoax Id×Aicoax
144× 45=:= plf BLC 3
TIA RevG Load Calculations.xmcd.xmcd Page 5-5
Subject:
Location:Date: 10/18/16 Prepared by: T.J.L. Checked by: C.F.C. Job No. 16159.04
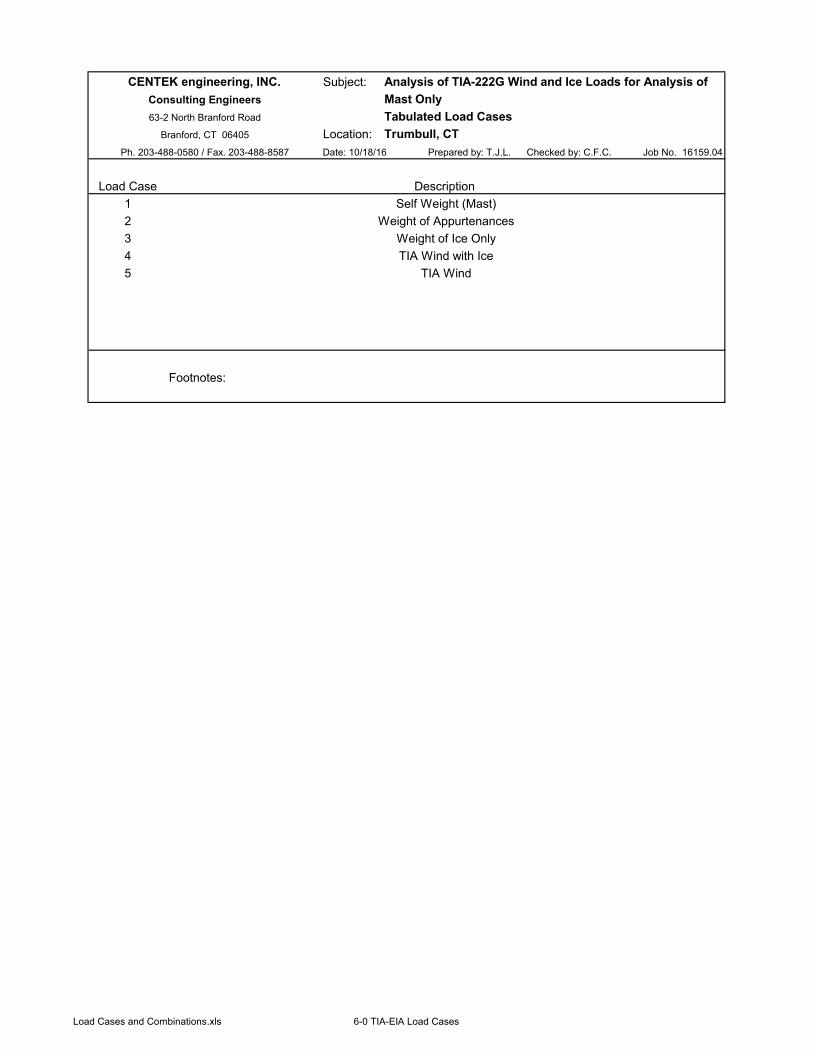
12345
Footnotes:
63-2 North Branford Road Tabulated Load CasesBranford, CT 06405 Trumbull, CT
CENTEK engineering, INC. Analysis of TIA-222G Wind and Ice Loads for Analysis ofConsulting Engineers Mast Only
Weight of AppurtenancesWeight of Ice Only
Ph. 203-488-0580 / Fax. 203-488-8587
DescriptionSelf Weight (Mast)
Load Case
TIA Wind with IceTIA Wind
Load Cases and Combinations.xls 6-0 TIA-EIA Load Cases
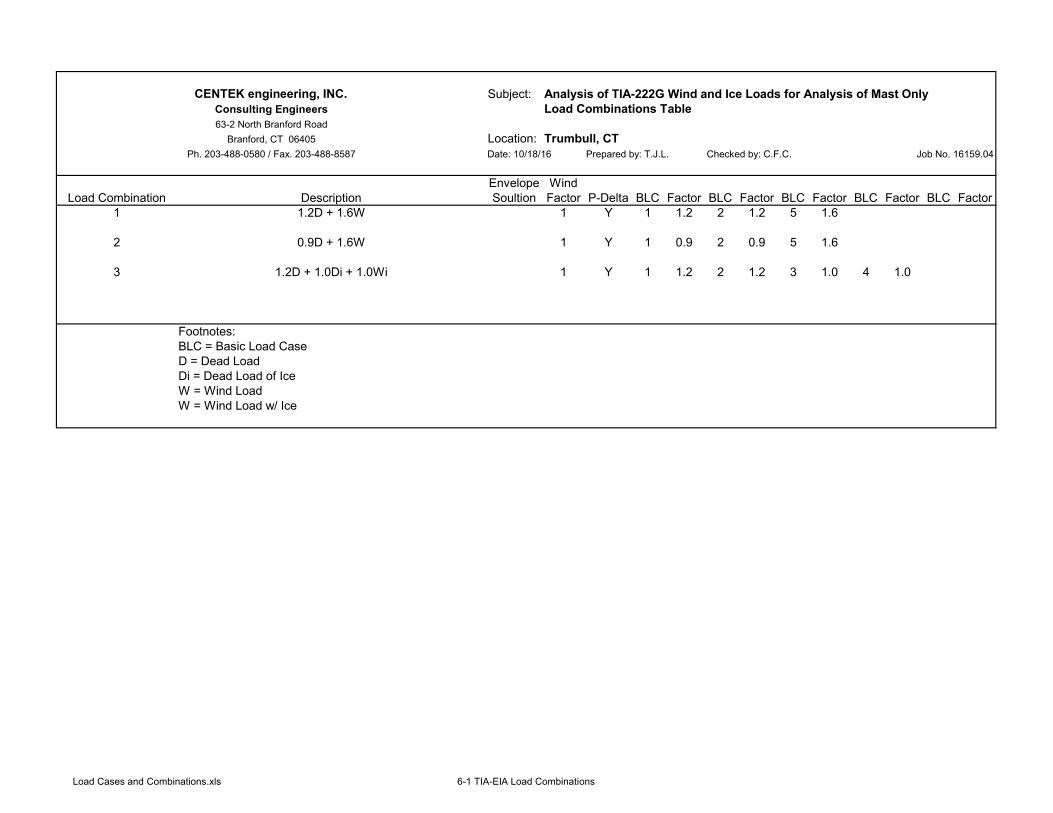
Subject: Analysis of TIA-222G Wind and Ice Loads for Analysis of Mast OnlyLoad Combinations Table
Location: Trumbull, CTDate: 10/18/16 Prepared by: T.J.L. Checked by: C.F.C. Job No. 16159.04
Envelope WindSoultion Factor P-Delta BLC Factor BLC Factor BLC Factor BLC Factor BLC Factor
1 1.2D + 1.6W 1 Y 1 1.2 2 1.2 5 1.6
2 0.9D + 1.6W 1 Y 1 0.9 2 0.9 5 1.6
3 1.2D + 1.0Di + 1.0Wi 1 Y 1 1.2 2 1.2 3 1.0 4 1.0
Footnotes:BLC = Basic Load CaseD = Dead LoadDi = Dead Load of IceW = Wind LoadW = Wind Load w/ Ice
CENTEK engineering, INC.Consulting Engineers63-2 North Branford Road
Branford, CT 06405Ph. 203-488-0580 / Fax. 203-488-8587
Load Combination Description
Load Cases and Combinations.xls 6-1 TIA-EIA Load Combinations
Subject:
Location:
Rev. 0: 10/24/16
Mast Connection to CL&P Tower # 838
Trumbull, CT
Prepared by: T.J.L. Checked by: C.F.C.Job No. 16159.04
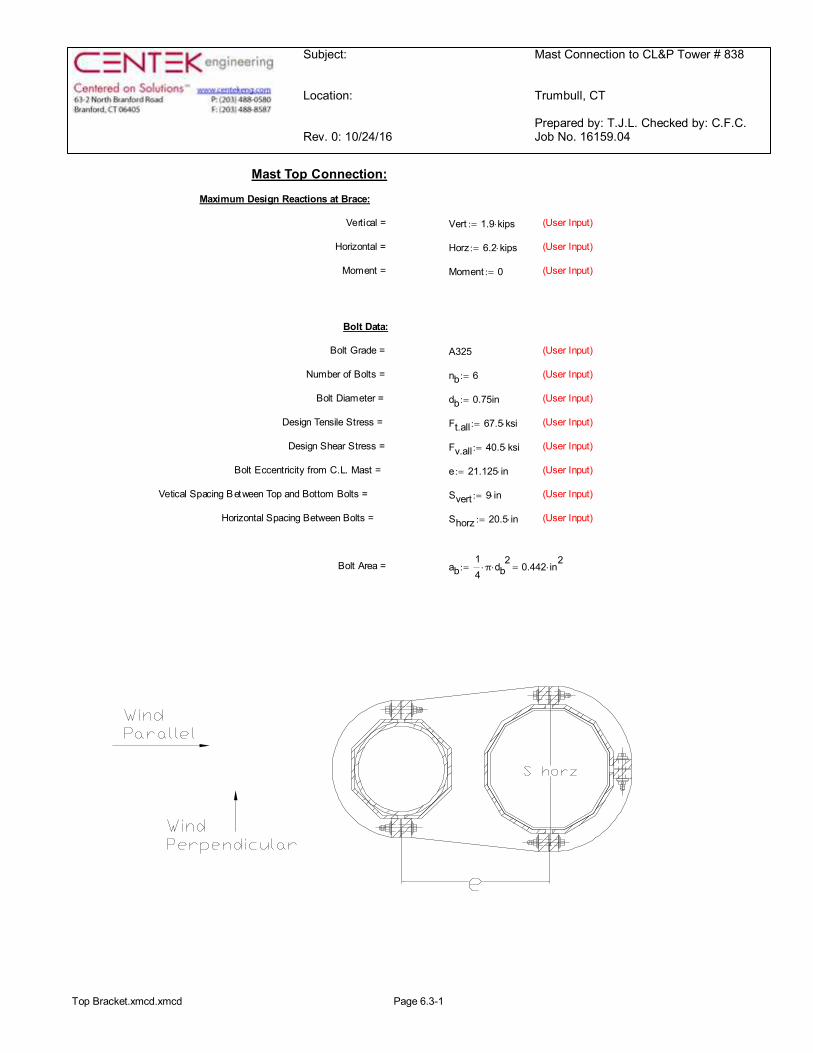
Mast Top Connection:
Maximum Design Reactions at Brace:
Vertical = Vert 1.9 kips×:= (User Input)
Horizontal = Horz 6.2 kips×:= (User Input)
Moment = Moment 0:= (User Input)
Bolt Data:
Bolt Grade = A325 (User Input)
Number of Bolts = nb 6:= (User Input)
Bolt Diameter = db 0.75in:= (User Input)
Design Tensile Stress = Ft.all 67.5 ksi×:= (User Input)
Design Shear Stress = Fv.all 40.5 ksi×:= (User Input)
Bolt Eccentricity from C.L. Mast = e 21.125 in×:= (User Input)
Vetical Spacing Between Top and Bottom Bolts = Svert 9 in×:= (User Input)
Horizontal Spacing Between Bolts = Shorz 20.5 in×:= (User Input)
Bolt Area = ab14π× db
2× 0.442 in
2×=:=
Top Bracket.xmcd.xmcd Page 6.3-1
Subject:
Location:
Rev. 0: 10/24/16
Mast Connection to CL&P Tower # 838
Trumbull, CT
Prepared by: T.J.L. Checked by: C.F.C.Job No. 16159.04
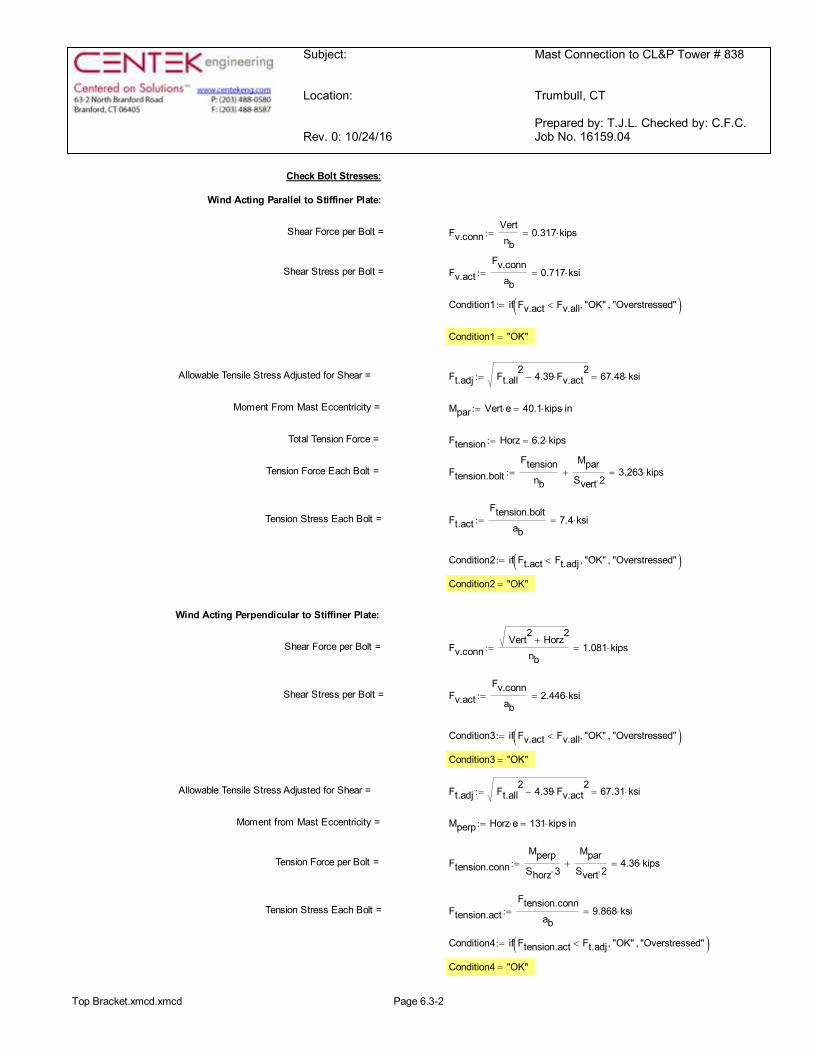
Check Bolt Stresses:
Wind Acting Parallel to Stiffiner Plate:
Shear Force per Bolt = Fv.connVertnb
0.317 kips×=:=
Shear Stress per Bolt = Fv.actFv.conn
ab0.717 ksi×=:=
Condition1 if Fv.act Fv.all< "OK", "Overstressed", ( ):=
Condition1 "OK"=
Allowable Tensile Stress Adjusted for Shear = Ft.adj Ft.all2
4.39 Fv.act2
×- 67.48 ksi×=:=
Moment From Mast Eccentricity = Mpar Vert e× 40.1 kips in××=:=
Total Tension Force = Ftension Horz 6.2 kips×=:=
Tension Force Each Bolt = Ftension.boltFtension
nb
MparSvert 2×
+ 3.263 kips×=:=
Tension Stress Each Bolt = Ft.actFtension.bolt
ab7.4 ksi×=:=
Condition2 if Ft.act Ft.adj< "OK", "Overstressed", ( ):=
Condition2 "OK"=
Wind Acting Perpendicular to Stiffiner Plate:
Shear Force per Bolt = Fv.connVert
2Horz
2+
nb1.081 kips×=:=
Shear Stress per Bolt = Fv.actFv.conn
ab2.446 ksi×=:=
Condition3 if Fv.act Fv.all< "OK", "Overstressed", ( ):=
Condition3 "OK"=
Allowable Tensile Stress Adjusted for Shear = Ft.adj Ft.all2
4.39 Fv.act2
×- 67.31 ksi×=:=
Moment from Mast Eccentricity = Mperp Horz e× 131 kips in××=:=
Tension Force per Bolt = Ftension.connMperp
Shorz 3×
MparSvert 2×
+ 4.36 kips×=:=
Tension Stress Each Bolt = Ftension.actFtension.conn
ab9.868 ksi×=:=
Condition4 if Ftension.act Ft.adj< "OK", "Overstressed", ( ):=
Condition4 "OK"=
Top Bracket.xmcd.xmcd Page 6.3-2
Subject:
Location:
Rev. 0: 10/24/16
Mast Connection to Bottom Bracket
Trumbull, CT
Prepared by: T.J.L. Checked by: C.F.C.Job No. 16159.04
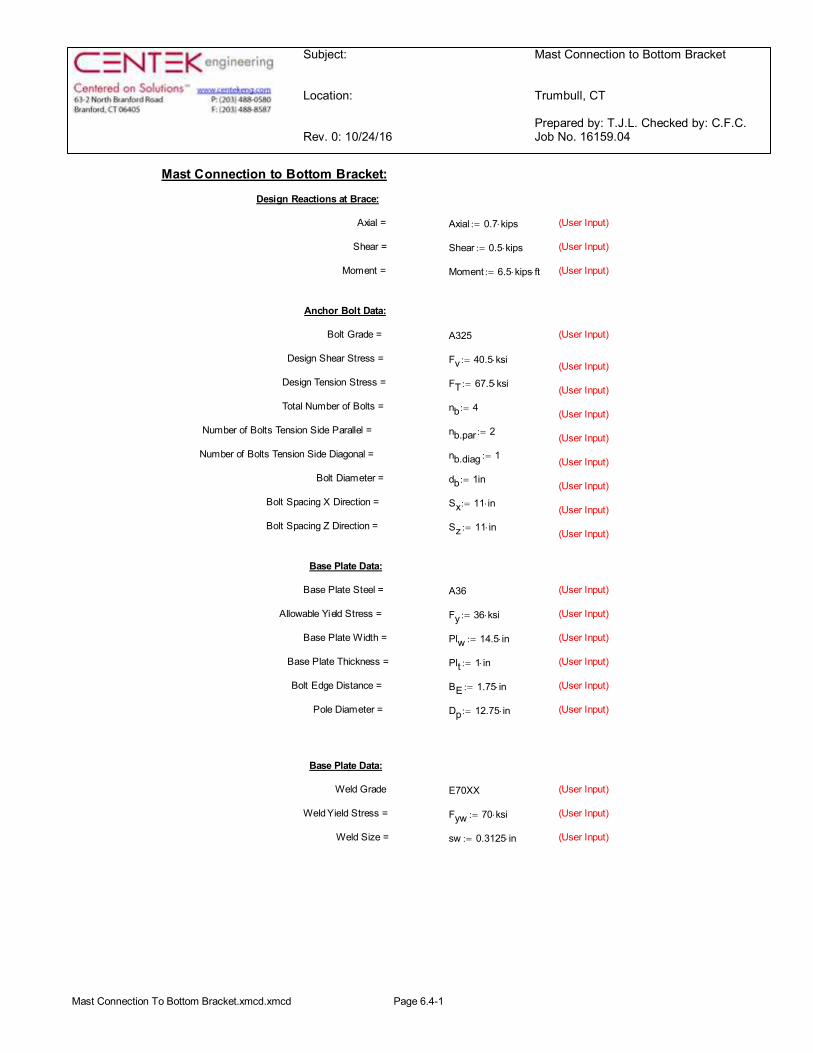
Mast Connection to Bottom Bracket:
Design Reactions at Brace:
Axial = Axial 0.7 kips×:= (User Input)
Shear = Shear 0.5 kips×:= (User Input)
Moment = Moment 6.5 kips× ft×:= (User Input)
Anchor Bolt Data:
Bolt Grade = A325 (User Input)
Design Shear Stress = Fv 40.5 ksi×:= (User Input)Design Tension Stress = FT 67.5 ksi×:= (User Input)Total Number of Bolts = nb 4:= (User Input)
Number of Bolts Tension Side Parallel = nb.par 2:= (User Input)Number of Bolts Tension Side Diagonal = nb.diag 1:= (User Input)
Bolt Diameter = db 1in:= (User Input)Bolt Spacing X Direction = Sx 11 in×:= (User Input)Bolt Spacing Z Direction = Sz 11 in×:= (User Input)
Base Plate Data:
Base Plate Steel = A36 (User Input)
Allowable Yield Stress = Fy 36 ksi×:= (User Input)
Base Plate Width = Plw 14.5 in×:= (User Input)
Base Plate Thickness = Plt 1 in×:= (User Input)
Bolt Edge Distance = BE 1.75 in×:= (User Input)
Pole Diameter = Dp 12.75 in×:= (User Input)
Base Plate Data:
Weld Grade E70XX (User Input)
Weld Yield Stress = Fyw 70 ksi×:= (User Input)
Weld Size = sw 0.3125 in×:= (User Input)
Mast Connection To Bottom Bracket.xmcd.xmcd Page 6.4-1
Subject:
Location:
Rev. 0: 10/24/16
Mast Connection to Bottom Bracket
Trumbull, CT
Prepared by: T.J.L. Checked by: C.F.C.Job No. 16159.04
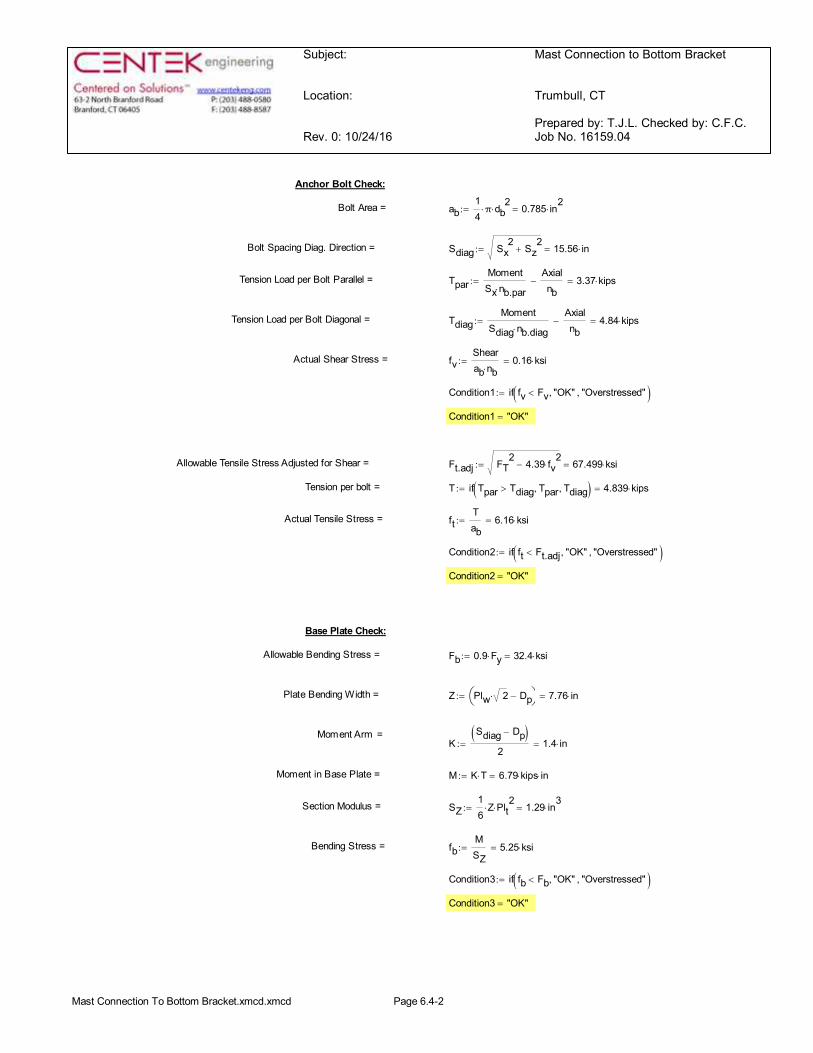
Anchor Bolt Check:
Bolt Area = ab14π× db
2× 0.785 in
2×=:=
Bolt Spacing Diag. Direction = Sdiag Sx2
Sz2
+ 15.56 in×=:=
Tension Load per Bolt Parallel = TparMoment
Sx nb.par×
Axialnb
- 3.37 kips×=:=
Tension Load per Bolt Diagonal = TdiagMoment
Sdiag nb.diag×
Axialnb
- 4.84 kips×=:=
Actual Shear Stress = fvShearab nb×
0.16 ksi×=:=
Condition1 if fv Fv< "OK", "Overstressed", ( ):=
Condition1 "OK"=
Allowable Tensile Stress Adjusted for Shear = Ft.adj FT2
4.39 fv2
×- 67.499 ksi×=:=
Tension per bolt = T if Tpar Tdiag> Tpar, Tdiag, ( ) 4.839 kips×=:=
Actual Tensile Stress = ftTab
6.16 ksi×=:=
Condition2 if ft Ft.adj< "OK", "Overstressed", ( ):=
Condition2 "OK"=
Base Plate Check:
Allowable Bending Stress = Fb 0.9 Fy× 32.4 ksi×=:=
Plate Bending Width = Z Plw 2× Dp-æè öø 7.76 in×=:=
Moment Arm =K
Sdiag Dp-( )2
1.4 in×=:=
Moment in Base Plate = M K T× 6.79 kips in××=:=
Section Modulus = SZ16
Z× Plt2
× 1.29 in3
×=:=
Bending Stress = fbMSZ
5.25 ksi×=:=
Condition3 if fb Fb< "OK", "Overstressed", ( ):=
Condition3 "OK"=
Mast Connection To Bottom Bracket.xmcd.xmcd Page 6.4-2
Subject:
Location:
Rev. 0: 10/24/16
Mast Connection to Bottom Bracket
Trumbull, CT
Prepared by: T.J.L. Checked by: C.F.C.Job No. 16159.04
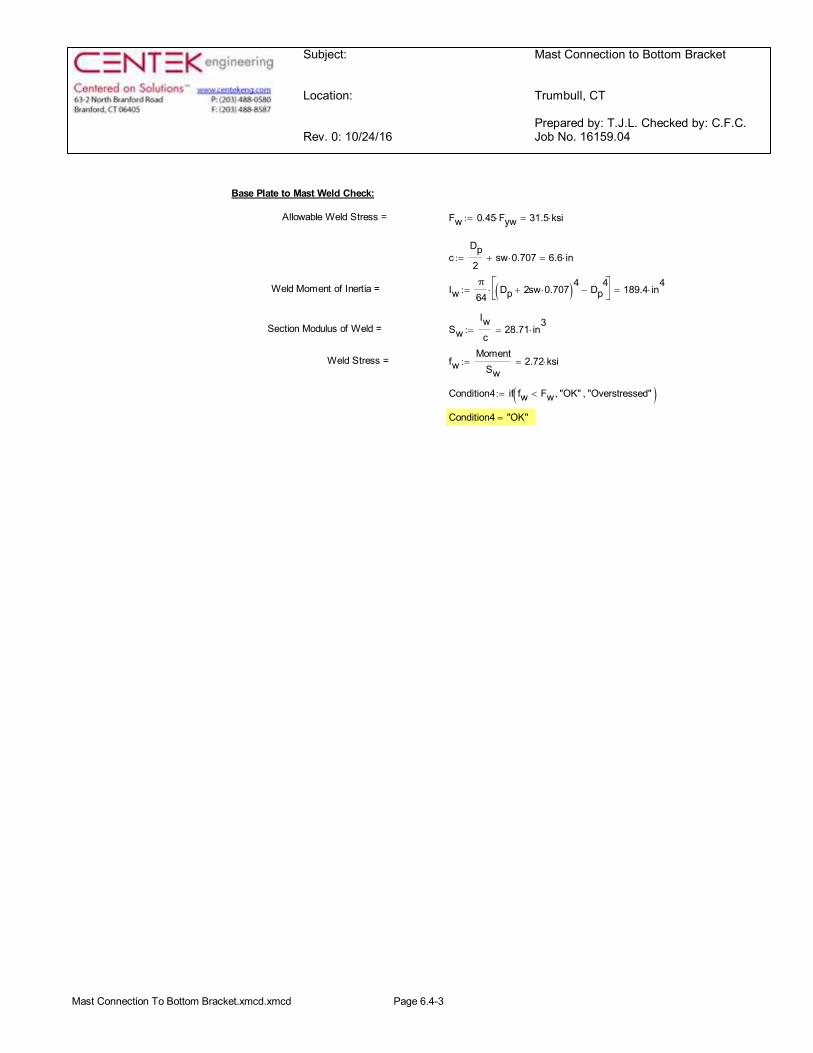
Base Plate to Mast Weld Check:
Allowable Weld Stress = Fw 0.45 Fyw× 31.5 ksi×=:=
cDp2
sw 0.707×+ 6.6 in×=:=
Weld Moment of Inertia = Iwπ64
Dp 2sw 0.707×+( )4Dp
4-é
ëùû× 189.4 in
4×=:=
Section Modulus of Weld = SwIwc
28.71 in3
×=:=
Weld Stress = fwMoment
Sw2.72 ksi×=:=
Condition4 if fw Fw< "OK", "Overstressed", ( ):=
Condition4 "OK"=
Mast Connection To Bottom Bracket.xmcd.xmcd Page 6.4-3
Subject:
Location:
Rev. 0: 10/24/16
Mast Connection to CL&P Tower # 838
Trumbull, CT
Prepared by: T.J.L. Checked by: C.F.C.Job No. 16159.04
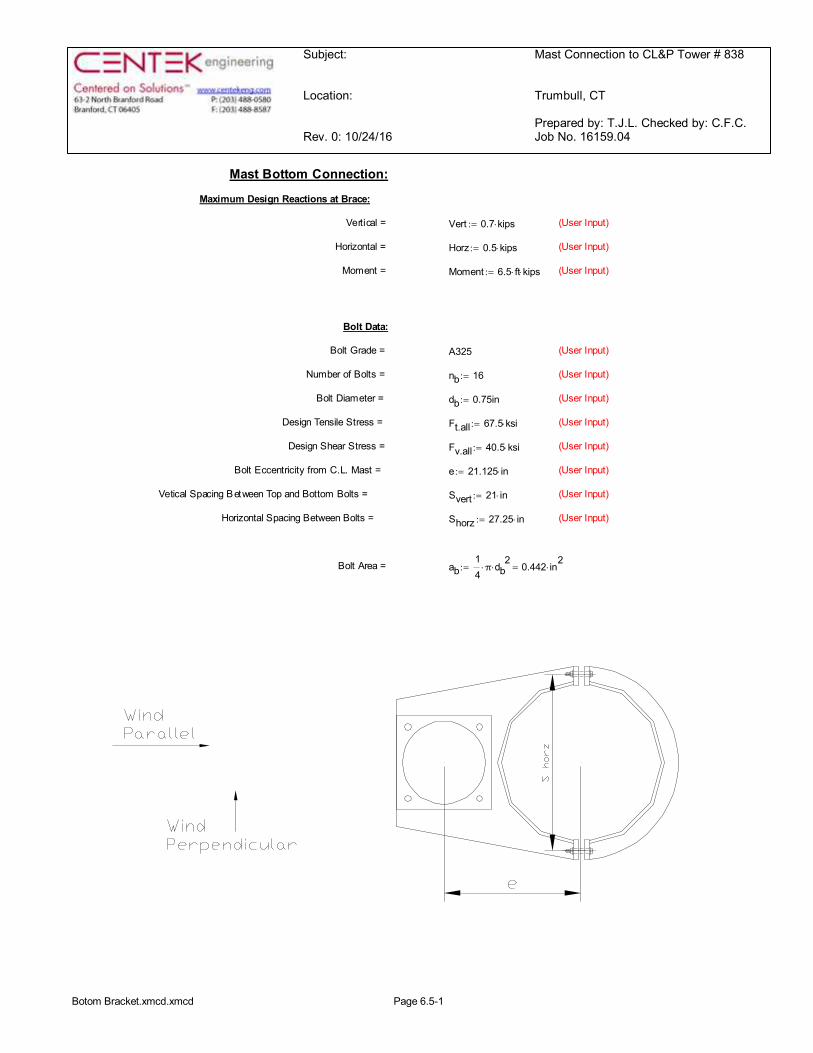
Mast Bottom Connection:
Maximum Design Reactions at Brace:
Vertical = Vert 0.7 kips×:= (User Input)
Horizontal = Horz 0.5 kips×:= (User Input)
Moment = Moment 6.5 ft× kips×:= (User Input)
Bolt Data:
Bolt Grade = A325 (User Input)
Number of Bolts = nb 16:= (User Input)
Bolt Diameter = db 0.75in:= (User Input)
Design Tensile Stress = Ft.all 67.5 ksi×:= (User Input)
Design Shear Stress = Fv.all 40.5 ksi×:= (User Input)
Bolt Eccentricity from C.L. Mast = e 21.125 in×:= (User Input)
Vetical Spacing Between Top and Bottom Bolts = Svert 21 in×:= (User Input)
Horizontal Spacing Between Bolts = Shorz 27.25 in×:= (User Input)
Bolt Area = ab14π× db
2× 0.442 in
2×=:=
Botom Bracket.xmcd.xmcd Page 6.5-1

Subject:
Location:
Rev. 0: 10/24/16
Mast Connection to CL&P Tower # 838
Trumbull, CT
Prepared by: T.J.L. Checked by: C.F.C.Job No. 16159.04
Check Bolt Stresses:
Wind Acting Parallel to Stiffiner Plate:
Shear Force per Bolt = Fv.connVertnb
0.044 kips×=:=
Shear Stress per Bolt = Fv.actFv.conn
ab0.099 ksi×=:=
Condition1 if Fv.act Fv.all< "OK", "Overstressed", ( ):=
Condition1 "OK"=
(AISC 9th Ed.Table J3.3)Allowable Tensile Stress Adjusted for Shear = Ft.adj Ft.all
24.39 Fv.act
2×- 67.5 ksi×=:=
Moment From Mast Eccentricity = Mpar Vert e× Moment+ 92.8 kips in××=:=
Total Tension Force = Ftension Horz 0.5 kips×=:=
Tension Force Each Bolt = Ftension.boltFtension
nb
MparSvert 2×
+ 2.24 kips×=:=
Tension Stress Each Bolt = Ft.actFtension.bolt
ab5.1 ksi×=:=
Condition2 if Ft.act Ft.adj< "OK", "Overstressed", ( ):=
Condition2 "OK"=
Wind Acting Perpendicular to Stiffiner Plate:
Shear Force per Bolt = Fv.conn
VertMoment 2×Shorz nb×
+æçè
ö÷ø
2Horz
2+
nb0.073 kips×=:=
Shear Stress per Bolt = Fv.actFv.conn
ab0.166 ksi×=:=
Condition3 if Fv.act Fv.all< "OK", "Overstressed", ( ):=
Condition3 "OK"=
(AISC 9th Ed.Table J3.3)Allowable Tensile Stress Adjusted for Shear = Ft.adj Ft.all
24.39 Fv.act
2×- 67.5 ksi×=:=
Moment from Mast Eccentricity = Mperp Horz e× 11 kips in××=:=
Tension Force per Bolt = Ftension.connMperp 2×
Shorz nb×
MparSvert 2×
+ 2.258 kips×=:=
Tension Stress Each Bolt = Ftension.actFtension.conn
ab5.11 ksi×=:=
Condition4 if Ftension.act Ft.adj< "OK", "Overstressed", ( ):=
Condition4 "OK"=
Botom Bracket.xmcd.xmcd Page 6.5-2
Subject:
Location:
Rev. 0: 10/18/16
Load Analysis of T-Mobile Equipment onStructure #838
Trumbull, CT
Prepared by: T.J.L Checked by: C.F.C.Job No. 16159.04
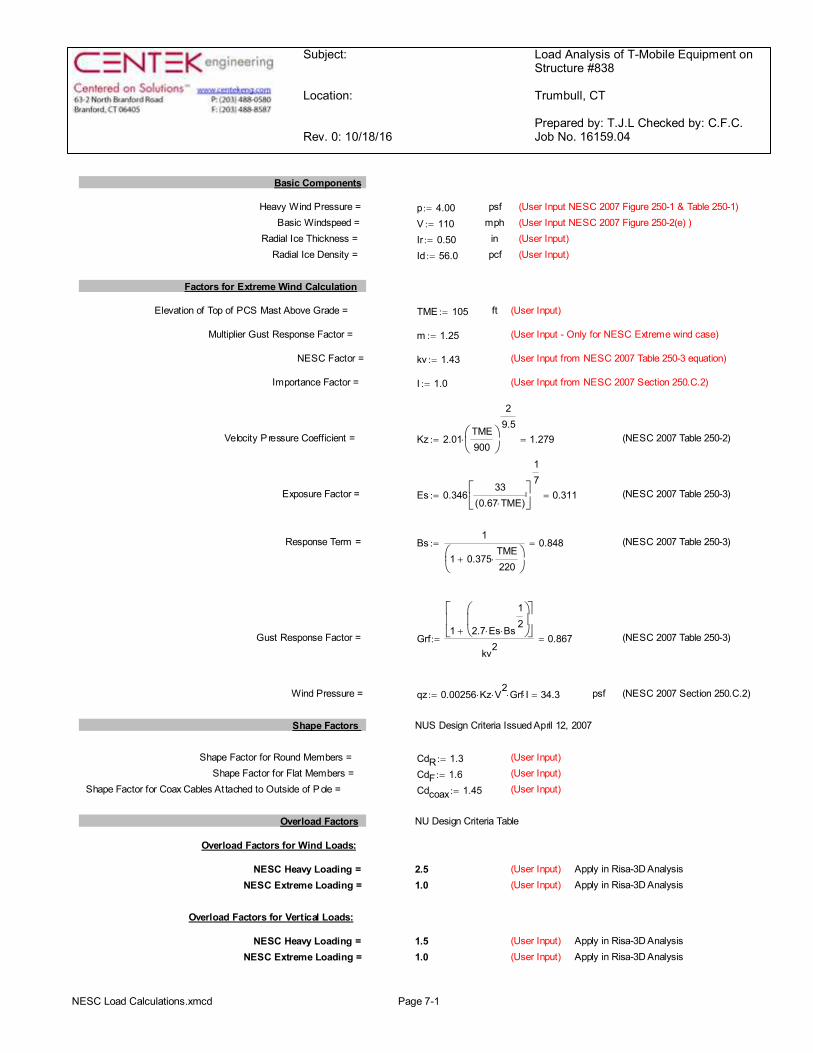
Basic Components
Heavy Wind Pressure = p 4.00:= psf (User Input NESC 2007 Figure 250-1 & Table 250-1)Basic Windspeed = V 110:= mph (User Input NESC 2007 Figure 250-2(e) )
Radial Ice Thickness = Ir 0.50:= in (User Input)Radial Ice Density = Id 56.0:= pcf (User Input)
Factors for Extreme Wind Calculation
Elevation of Top of PCS Mast Above Grade = TME 105:= ft (User Input)
Multiplier Gust Response Factor = m 1.25:= (User Input - Only for NESC Extreme wind case)
NESC Factor = kv 1.43:= (User Input from NESC 2007 Table 250-3 equation)
Importance Factor = I 1.0:= (User Input from NESC 2007 Section 250.C.2)
Velocity P ressure Coefficient = Kz 2.01TME900
æçè
ö÷ø
29.5
× 1.279=:= (NESC 2007 Table 250-2)
Exposure Factor = Es 0.34633
0.67 TME×( )éêë
ùúû
17
0.311=:= (NESC 2007 Table 250-3)
Response Term = Bs1
1 0.375TME220
×+æçè
ö÷ø
0.848=:= (NESC 2007 Table 250-3)
Gust Response Factor = Grf1 2.7 Es× Bs
12
×
æçè
ö÷ø+
éêë
ùúû
kv20.867=:= (NESC 2007 Table 250-3)
Wind Pressure = qz 0.00256 Kz× V2
× Grf× I× 34.3=:= psf (NESC 2007 Section 250.C.2)
Shape Factors NUS Design Criteria Issued April 12, 2007
Shape Factor for Round Members = CdR 1.3:= (User Input)Shape Factor for Flat Members = CdF 1.6:= (User Input)
Shape Factor for Coax Cables At tached to Outside of Pole = Cdcoax 1.45:= (User Input)
Overload Factors NU Design Criteria Table
Overload Factors for Wind Loads:
NESC Heavy Loading = 2.5 (User Input) Apply in Risa-3D Analysis NESC Extreme Loading = 1.0 (User Input) Apply in Risa-3D Analysis
Overload Factors for Vertical Loads:
NESC Heavy Loading = 1.5 (User Input) Apply in Risa-3D AnalysisNESC Extreme Loading = 1.0 (User Input) Apply in Risa-3D Analysis
NESC Load Calculations.xmcd Page 7-1
Subject:
Location:
Rev. 0: 10/18/16
Load Analysis of T-Mobile Equipment onStructure #838
Trumbull, CT
Prepared by: T.J.L Checked by: C.F.C.Job No. 16159.04
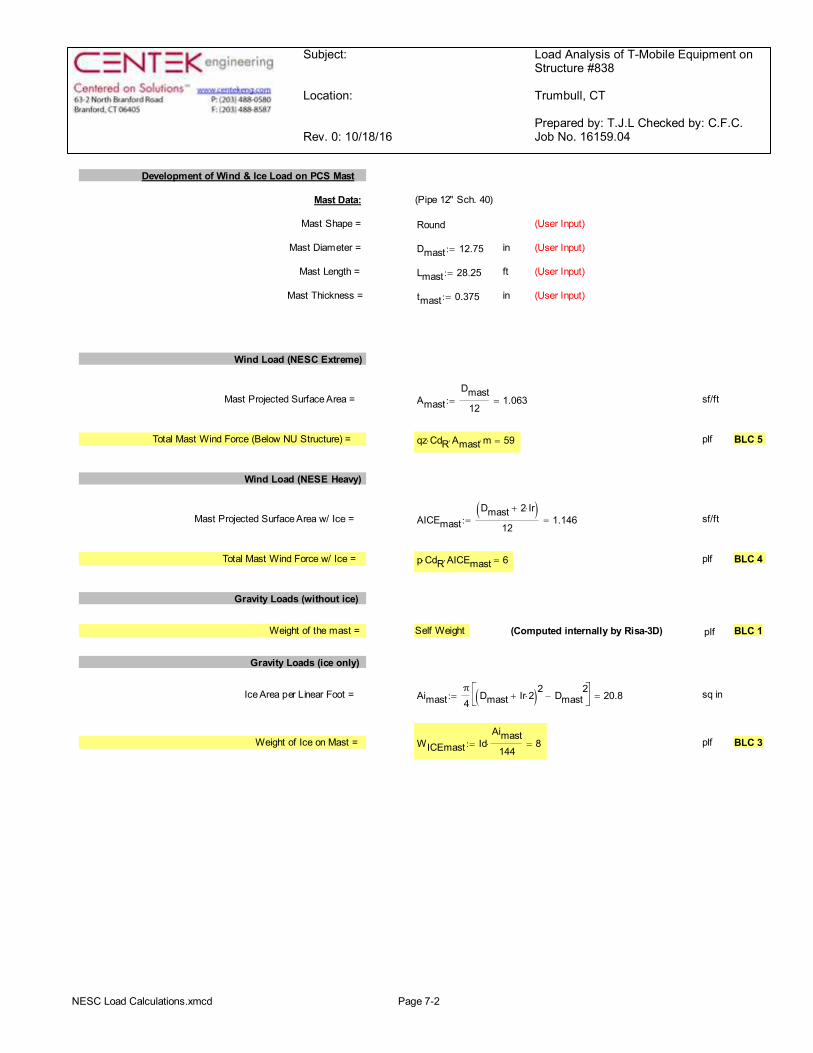
Development of Wind & Ice Load on PCS Mast
Mast Data: (Pipe 12" Sch. 40)
Mast Shape = Round (User Input)
Mast Diameter = Dmast 12.75:= in (User Input)
Mast Length = Lmast 28.25:= ft (User Input)
Mast Thickness = tmast 0.375:= in (User Input)
Wind Load (NESC Extreme)
Mast Projected Surface Area = AmastDmast
121.063=:= sf/ft
Total Mast Wind Force (Below NU Structure) = qz CdR× Amast× m× 59= plf BLC 5
Wind Load (NESE Heavy)
Mast Projected Surface Area w/ Ice = AICEmastDmast 2 Ir×+( )
121.146=:= sf/ft
Total Mast Wind Force w/ Ice = p CdR× AICEmast× 6= plf BLC 4
Gravity Loads (without ice)
Weight of the mast = Self Weight (Computed internally by Risa-3D) plf BLC 1
Gravity Loads (ice only)
Ice Area per Linear Foot = Aimastπ4
Dmast Ir 2×+( )2 Dmast2
-éë
ùû 20.8=:= sq in
Weight of Ice on Mast = WICEmast IdAimast
144× 8=:= plf BLC 3
NESC Load Calculations.xmcd Page 7-2
Subject:
Location:
Rev. 0: 10/18/16
Load Analysis of T-Mobile Equipment onStructure #838
Trumbull, CT
Prepared by: T.J.L Checked by: C.F.C.Job No. 16159.04
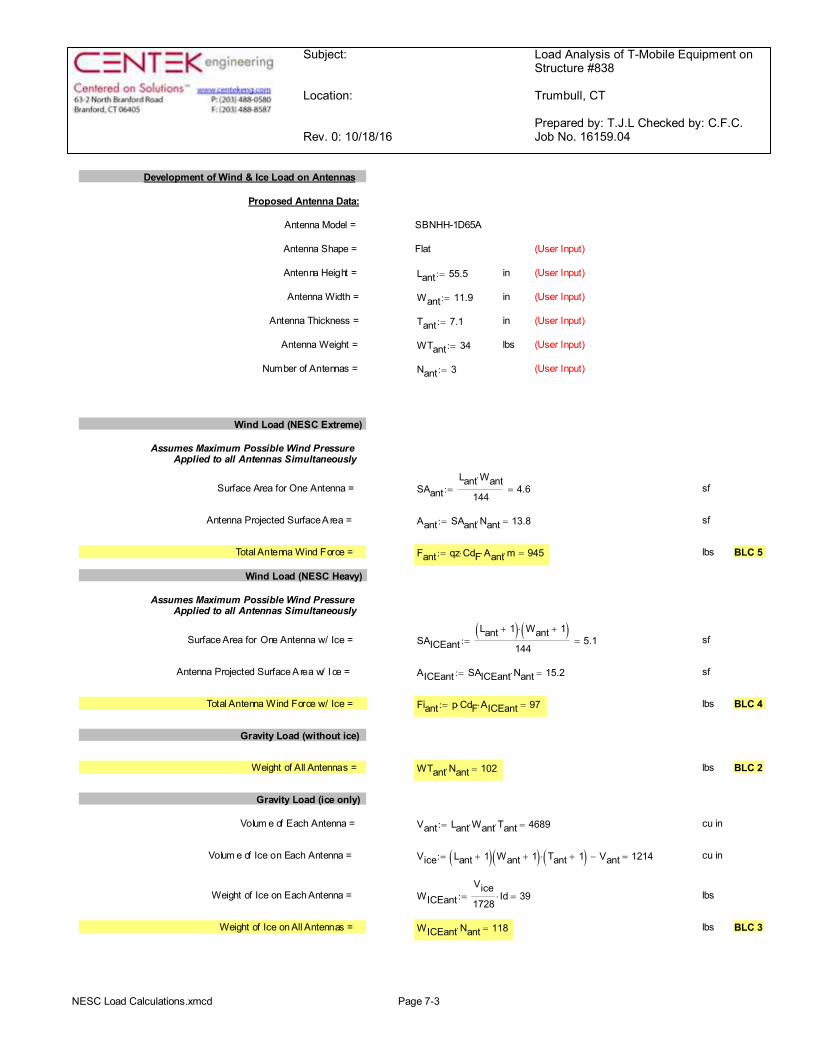
Development of Wind & Ice Load on Antennas
Proposed Antenna Data:
Antenna Model = SBNHH-1D65A
Antenna Shape = Flat (User Input)
Antenna Height = Lant 55.5:= in (User Input)
Antenna Width = Want 11.9:= in (User Input)
Antenna Thickness = Tant 7.1:= in (User Input)
Antenna Weight = WTant 34:= lbs (User Input)
Number of Antennas = Nant 3:= (User Input)
Wind Load (NESC Extreme)
Assumes Maximum Possible Wind PressureApplied to all Antennas Simultaneously
Surface Area for One Antenna = SAantLant Want×
1444.6=:= sf
Antenna Projected Surface A rea = Aant SAant Nant× 13.8=:= sf
Total Antenna Wind Force = Fant qz CdF× Aant× m× 945=:= lbs BLC 5
Wind Load (NESC Heavy)
Assumes Maximum Possible Wind PressureApplied to all Antennas Simultaneously
Surface Area for One Antenna w/ Ice = SAICEantLant 1+( ) Want 1+( )×
1445.1=:= sf
Antenna Projected Surface A rea w/ I ce = AICEant SAICEant Nant× 15.2=:= sf
Total Antenna Wind Force w/ Ice = Fiant p CdF× AICEant× 97=:= lbs BLC 4
Gravity Load (without ice)
Weight of All Antennas = WTant Nant× 102= lbs BLC 2
Gravity Load (ice only)
Volum e of Each Antenna = Vant Lant Want× Tant× 4689=:= cu in
Volum e of Ice on Each Antenna = Vice Lant 1+( ) Want 1+( ) Tant 1+( )× Vant- 1214=:= cu in
Weight of Ice on Each Antenna = WICEantVice1728
Id× 39=:= lbs
Weight of Ice on All Antennas = WICEant Nant× 118= lbs BLC 3
NESC Load Calculations.xmcd Page 7-3
Subject:
Location:
Rev. 0: 10/18/16
Load Analysis of T-Mobile Equipment onStructure #838
Trumbull, CT
Prepared by: T.J.L Checked by: C.F.C.Job No. 16159.04
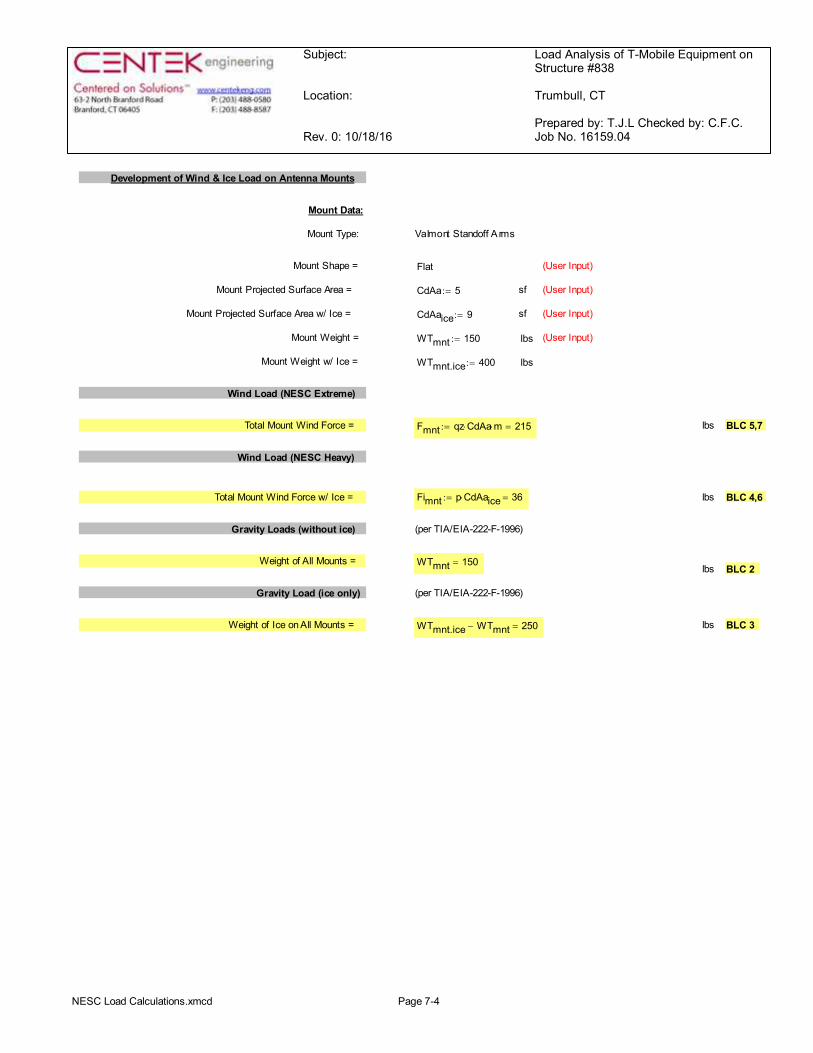
Development of Wind & Ice Load on Antenna Mounts
Mount Data:
Mount Type: Valmont Standoff A rms
Mount Shape = Flat (User Input)
Mount Projected Surface Area = CdAa 5:= sf (User Input)
Mount Projected Surface Area w/ Ice = CdAaice 9:= sf (User Input)
Mount Weight = WTmnt 150:= lbs (User Input)
Mount Weight w/ Ice = WTmnt.ice 400:= lbs
Wind Load (NESC Extreme)
Total Mount Wind Force = Fmnt qz CdAa× m× 215=:= lbs BLC 5,7
Wind Load (NESC Heavy)
Total Mount Wind Force w/ Ice = Fimnt p CdAaice× 36=:= lbs BLC 4,6
Gravity Loads (without ice) (per TIA/EIA-222-F-1996)
Weight of All Mounts = WTmnt 150=lbs BLC 2
Gravity Load (ice only) (per TIA/EIA-222-F-1996)
Weight of Ice on All Mounts = WTmnt.ice WTmnt- 250= lbs BLC 3
NESC Load Calculations.xmcd Page 7-4
Subject:
Location:
Rev. 0: 10/18/16
Load Analysis of T-Mobile Equipment onStructure #838
Trumbull, CT
Prepared by: T.J.L Checked by: C.F.C.Job No. 16159.04
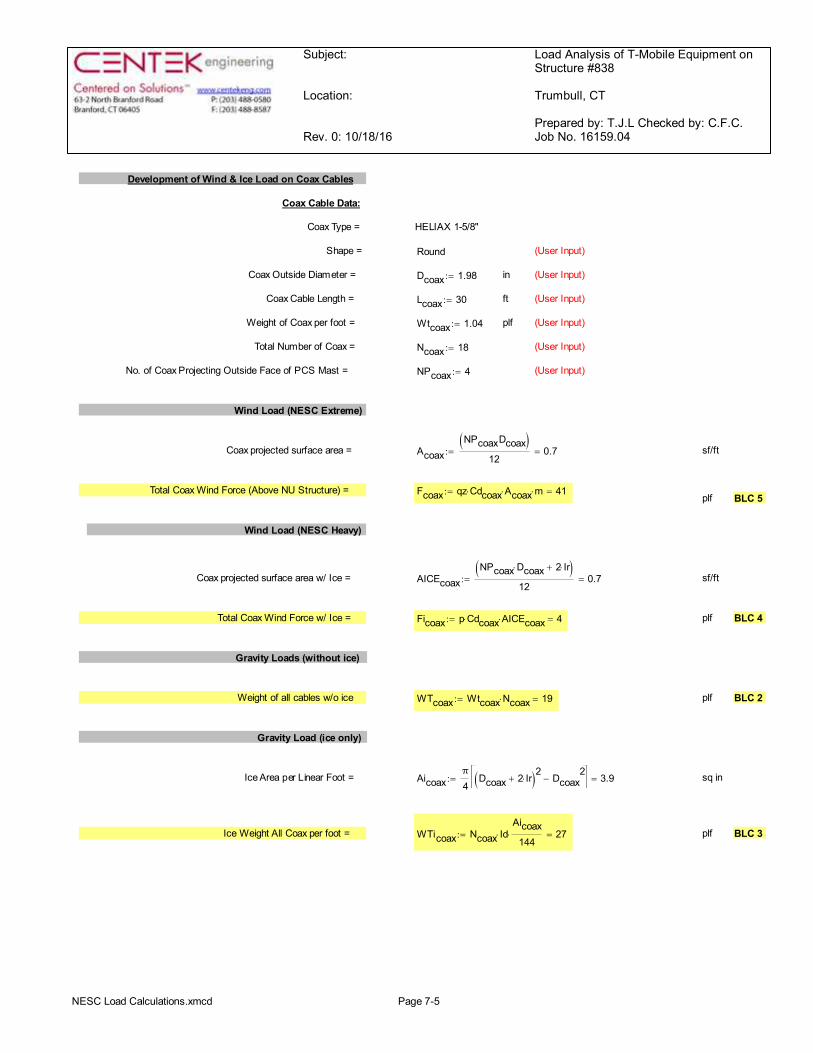
Development of Wind & Ice Load on Coax Cables
Coax Cable Data:
Coax Type = HELIAX 1-5/8"
Shape = Round (User Input)
Coax Outside Diameter = Dcoax 1.98:= in (User Input)
Coax Cable Length = Lcoax 30:= ft (User Input)
Weight of Coax per foot = Wtcoax 1.04:= plf (User Input)
Total Number of Coax = Ncoax 18:= (User Input)
No. of Coax Projecting Outside Face of PCS Mast = NPcoax 4:= (User Input)
Wind Load (NESC Extreme)
Coax projected surface area = AcoaxNPcoaxDcoax( )
120.7=:= sf/ft
Total Coax Wind Force (Above NU Structure) = Fcoax qz Cdcoax× Acoax× m× 41=:=plf BLC 5
Wind Load (NESC Heavy)
Coax projected surface area w/ Ice = AICEcoaxNPcoax Dcoax× 2 Ir×+( )
120.7=:= sf/ft
Total Coax Wind Force w/ Ice = Ficoax p Cdcoax× AICEcoax× 4=:= plf BLC 4
Gravity Loads (without ice)
Weight of all cables w/o ice WTcoax Wtcoax Ncoax× 19=:= plf BLC 2
Gravity Load (ice only)
Ice Area per Linear Foot = Aicoaxπ4
Dcoax 2 Ir×+( )2 Dcoax2
-éë
ùû 3.9=:= sq in
Ice Weight All Coax per foot = WTicoax Ncoax Id×Aicoax
144× 27=:= plf BLC 3
NESC Load Calculations.xmcd Page 7-5
Subject:
Location:Date:10/18/16 Prepared by: T.J.L. Checked by: C.F.C. Job No. 16159.04
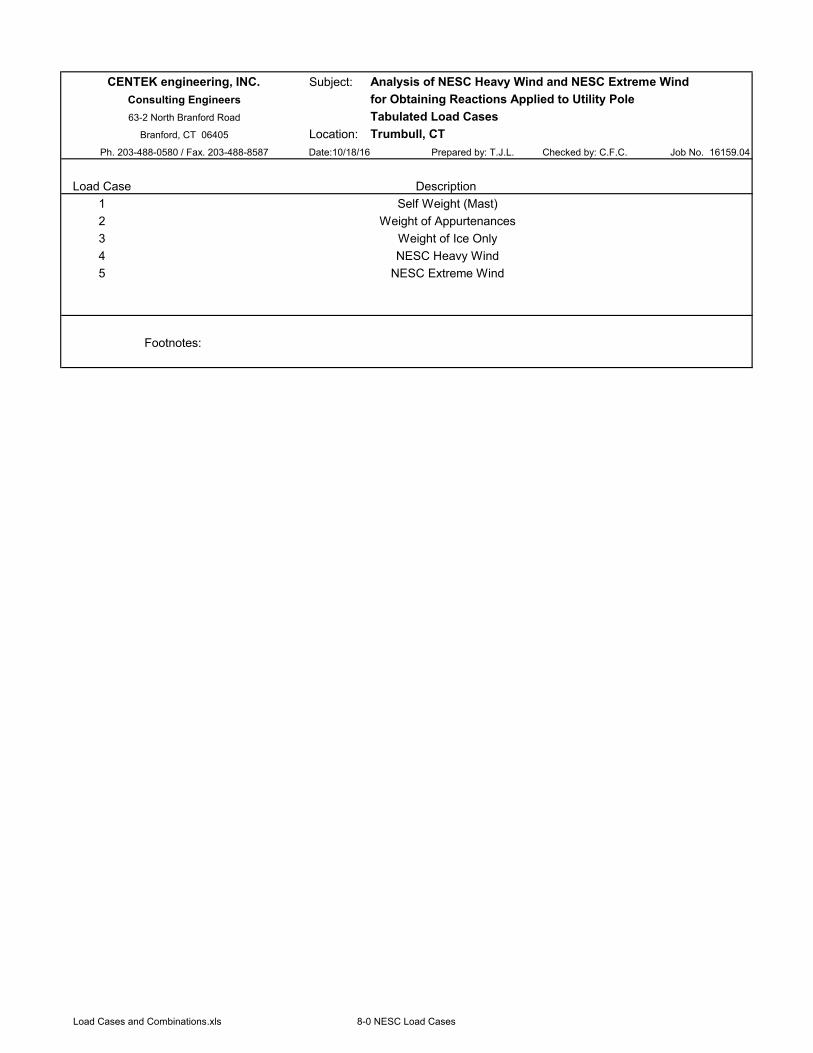
12345
Footnotes:
CENTEK engineering, INC. Analysis of NESC Heavy Wind and NESC Extreme WindConsulting Engineers for Obtaining Reactions Applied to Utility Pole
Ph. 203-488-0580 / Fax. 203-488-8587
Description
Weight of Appurtenances
Load Case
63-2 North Branford Road Tabulated Load CasesBranford, CT 06405 Trumbull, CT
Self Weight (Mast)
Weight of Ice OnlyNESC Heavy Wind
NESC Extreme Wind
Load Cases and Combinations.xls 8-0 NESC Load Cases
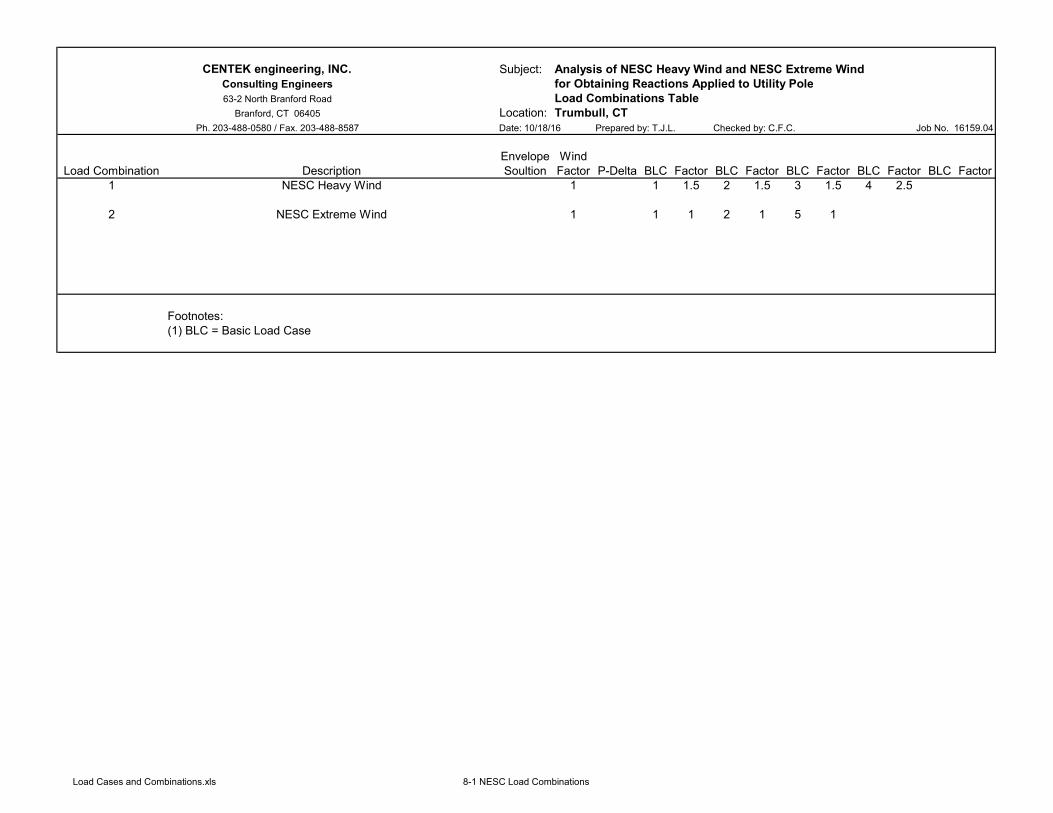
Subject: Analysis of NESC Heavy Wind and NESC Extreme Windfor Obtaining Reactions Applied to Utility PoleLoad Combinations Table
Location: Trumbull, CTDate: 10/18/16 Prepared by: T.J.L. Checked by: C.F.C. Job No. 16159.04
Envelope WindDescription Soultion Factor P-Delta BLC Factor BLC Factor BLC Factor BLC Factor BLC Factor
1 NESC Heavy Wind 1 1 1.5 2 1.5 3 1.5 4 2.5
2 NESC Extreme Wind 1 1 1 2 1 5 1
Footnotes:(1) BLC = Basic Load Case
Ph. 203-488-0580 / Fax. 203-488-8587
Load Combination
CENTEK engineering, INC.Consulting Engineers63-2 North Branford Road
Branford, CT 06405
Load Cases and Combinations.xls 8-1 NESC Load Combinations
Subject:
Location:
Rev. 0: 10/18/16
Coax Cable on Pole #838
Trumbull, CT
Prepared by: T.J.L Checked by: C.F.C.Job No. 16159.04
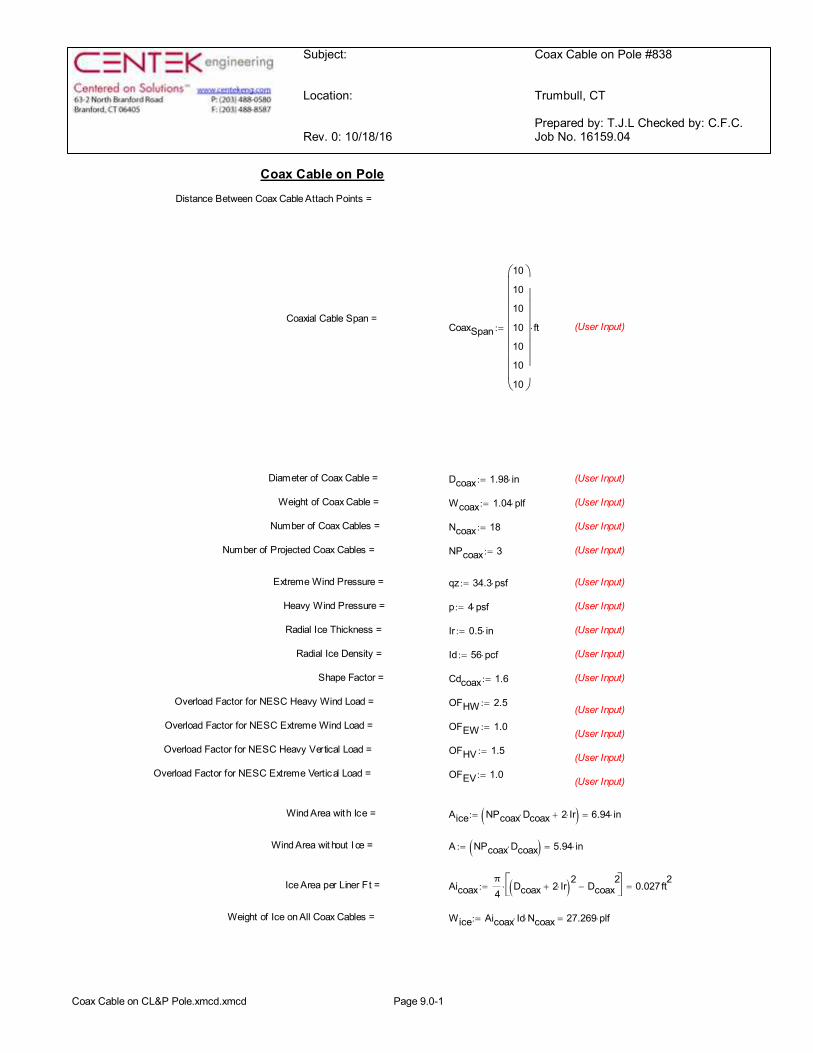
Coax Cable on Pole
Distance Between Coax Cable Attach Points =
Coaxial Cable Span =CoaxSpan
10
10
10
10
10
10
10
æççççççççè
ö÷÷÷÷÷÷÷÷ø
ft×:= (User Input)
Diameter of Coax Cable = Dcoax 1.98 in×:= (User Input)
Weight of Coax Cable = Wcoax 1.04 plf×:= (User Input)
Number of Coax Cables = Ncoax 18:= (User Input)
Number of Projected Coax Cables = NPcoax 3:= (User Input)
Extreme Wind Pressure = qz 34.3 psf×:= (User Input)
Heavy Wind Pressure = p 4 psf×:= (User Input)
Radial Ice Thickness = Ir 0.5 in×:= (User Input)
Radial Ice Density = Id 56 pcf×:= (User Input)
Shape Factor = Cdcoax 1.6:= (User Input)
Overload Factor for NESC Heavy Wind Load = OFHW 2.5:=(User Input)
Overload Factor for NESC Extreme Wind Load = OFEW 1.0:=(User Input)
Overload Factor for NESC Heavy Vertical Load = OFHV 1.5:=(User Input)
Overload Factor for NESC Extreme Vertical Load = OFEV 1.0:=(User Input)
Wind Area with Ice = Aice NPcoax Dcoax× 2 Ir×+( ) 6.94 in×=:=
Wind Area wit hout I ce = A NPcoax Dcoax×( ) 5.94 in×=:=
Ice Area per Liner Ft = Aicoaxπ4
Dcoax 2 Ir×+( )2Dcoax
2-é
ëùû× 0.027ft
2=:=
Weight of Ice on All Coax Cables = Wice Aicoax Id× Ncoax× 27.269 plf×=:=
Coax Cable on CL&P Pole.xmcd.xmcd Page 9.0-1
Subject:
Location:
Rev. 0: 10/18/16
Coax Cable on Pole #838
Trumbull, CT
Prepared by: T.J.L Checked by: C.F.C.Job No. 16159.04
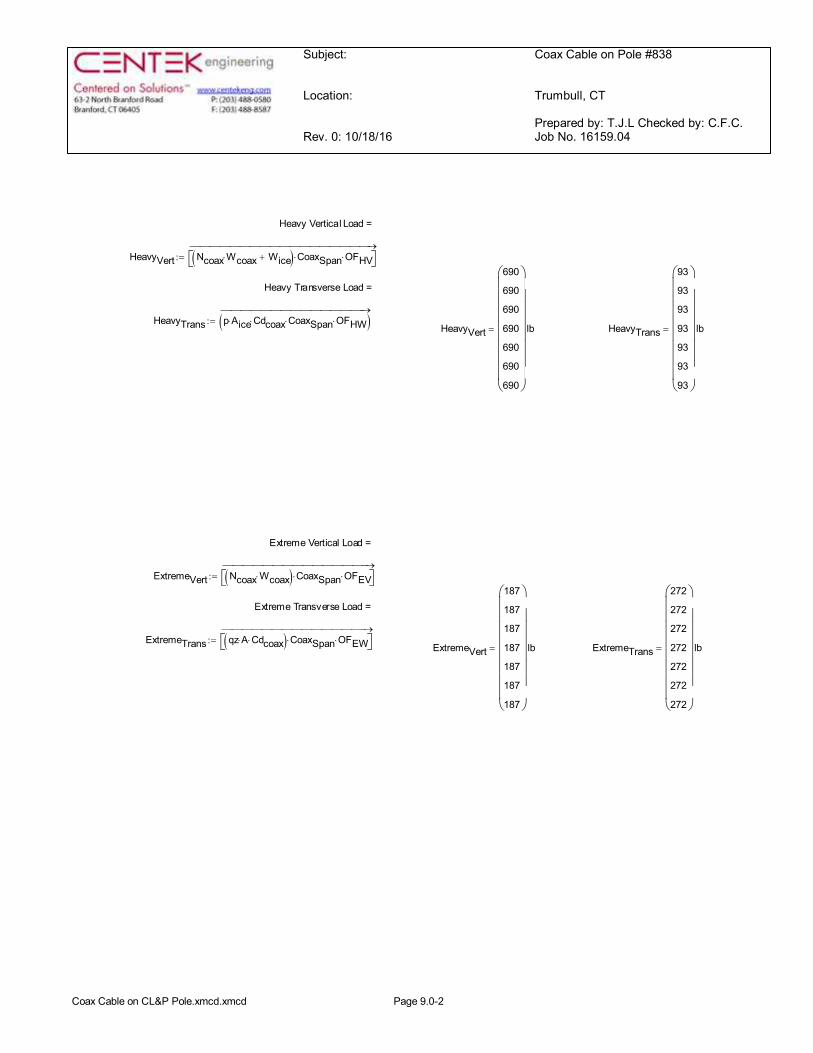
Heavy Vertical Load =
HeavyVert Ncoax Wcoax× Wice+( ) CoaxSpan× OFHV×éë ùû®¾¾¾¾¾¾¾¾¾¾¾¾¾¾¾¾¾¾¾
:=
Heavy Transverse Load =
HeavyTrans p Aice× Cdcoax× CoaxSpan× OFHW×( )®¾¾¾¾¾¾¾¾¾¾¾¾¾¾¾
:=HeavyVert
690
690
690
690
690
690
690
æççççççççè
ö÷÷÷÷÷÷÷÷ø
lb= HeavyTrans
93
93
93
93
93
93
93
æççççççççè
ö÷÷÷÷÷÷÷÷ø
lb=
Extreme Vertical Load =
ExtremeVert Ncoax Wcoax×( ) CoaxSpan× OFEV×éë ùû®¾¾¾¾¾¾¾¾¾¾¾¾¾¾¾
:=
Extreme Transverse Load =
ExtremeTrans qz A× Cdcoax×( ) CoaxSpan× OFEW×éë ùû®¾¾¾¾¾¾¾¾¾¾¾¾¾¾¾
:=ExtremeVert
187
187
187
187
187
187
187
æççççççççè
ö÷÷÷÷÷÷÷÷ø
lb= ExtremeTrans
272
272
272
272
272
272
272
æççççççççè
ö÷÷÷÷÷÷÷÷ø
lb=
Coax Cable on CL&P Pole.xmcd.xmcd Page 9.0-2
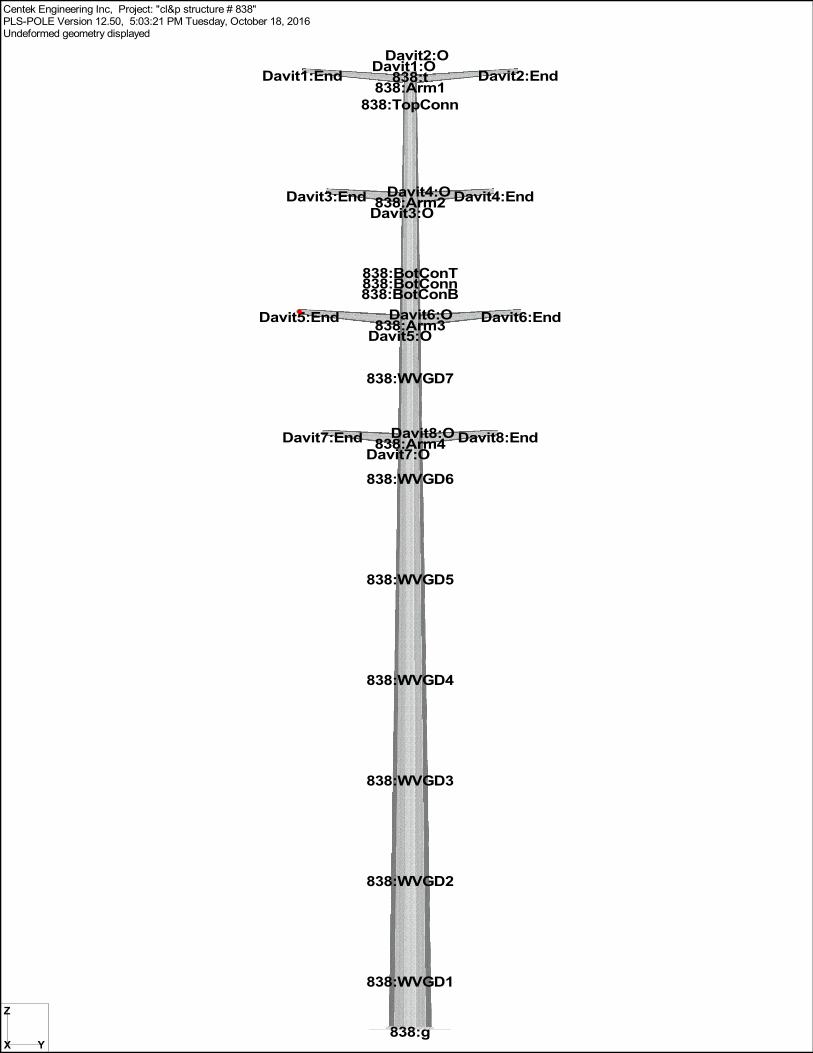
838:g
838:t838:Arm1
838:TopConn
838:Arm2
838:BotConT838:BotConn838:BotConB
838:Arm3
838:WVGD7
838:Arm4
838:WVGD6
838:WVGD5
838:WVGD4
838:WVGD3
838:WVGD2
838:WVGD1
Davit1:ODavit1:EndDavit2:O
Davit2:End
Davit3:ODavit3:End Davit4:O Davit4:End
Davit5:ODavit5:End Davit6:O Davit6:End
Davit7:ODavit7:End Davit8:O Davit8:End
X Y
Z
Centek Engineering Inc, Project: "cl&p structure # 838"PLS-POLE Version 12.50, 5:03:21 PM Tuesday, October 18, 2016Undeformed geometry displayed
Subject:
Location:
Rev. 0: 10/19/16
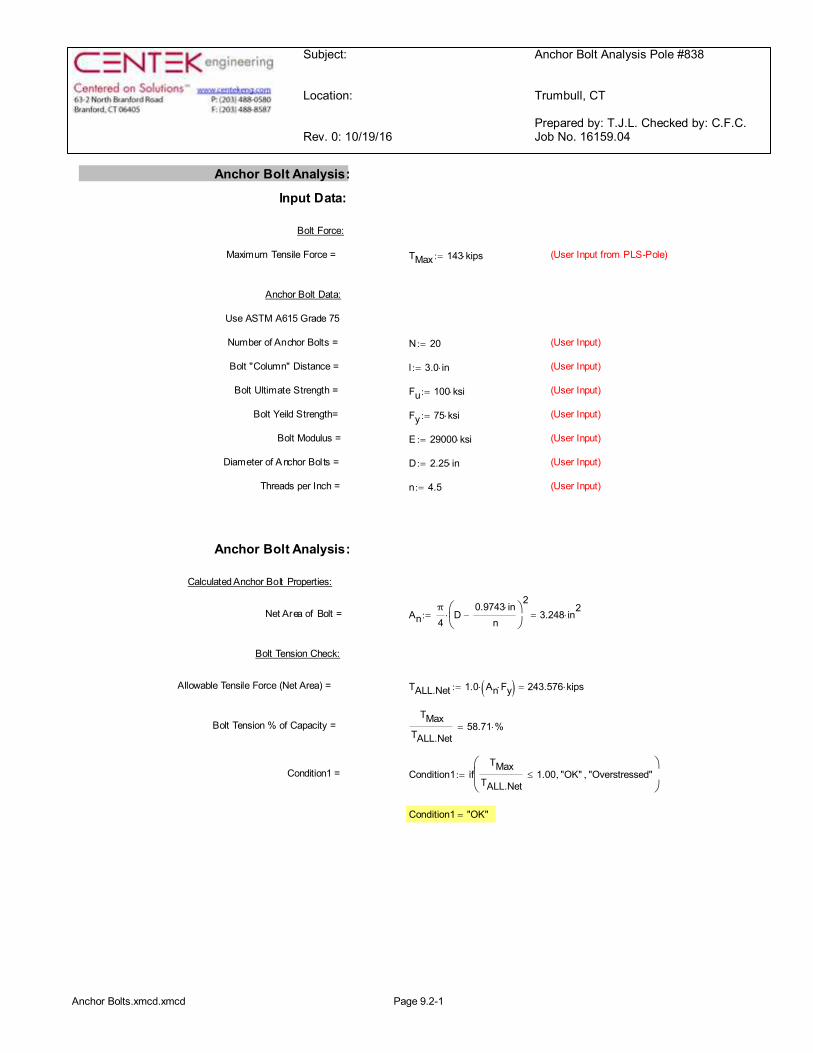
Anchor Bolt Analysis Pole #838
Trumbull, CT
Prepared by: T.J.L. Checked by: C.F.C.Job No. 16159.04
Anchor Bolt Analysis:
Input Data:
Bolt Force:
Maximum Tensile Force = TMax 143 kips×:= (User Input from PLS-Pole)
Anchor Bolt Data:
Use ASTM A615 Grade 75
Number of Anchor Bolts = N 20:= (User Input)
Bolt "Column" Distance = l 3.0 in×:= (User Input)
Bolt Ultimate Strength = Fu 100 ksi×:= (User Input)
Bolt Yeild Strength= Fy 75 ksi×:= (User Input)
Bolt Modulus = E 29000 ksi×:= (User Input)
Diameter of Anchor Bolts = D 2.25 in×:= (User Input)
Threads per Inch = n 4.5:= (User Input)
Anchor Bolt Analysis:
Calculated Anchor Bolt Properties:
Net Area of Bolt = Anπ4
D0.9743 in×
n-æç
èö÷ø
2× 3.248 in
2×=:=
Bolt Tension Check:
Allowable Tensile Force (Net Area) = TALL.Net 1.0 An Fy×( )× 243.576 kips×=:=
Bolt Tension % of Capacity =TMax
TALL.Net58.71 %×=
Condition1 = Condition1 ifTMax
TALL.Net1.00£ "OK", "Overstressed",
æçè
ö÷ø
:=
Condition1 "OK"=
Anchor Bolts.xmcd.xmcd Page 9.2-1
Subject:
Location:
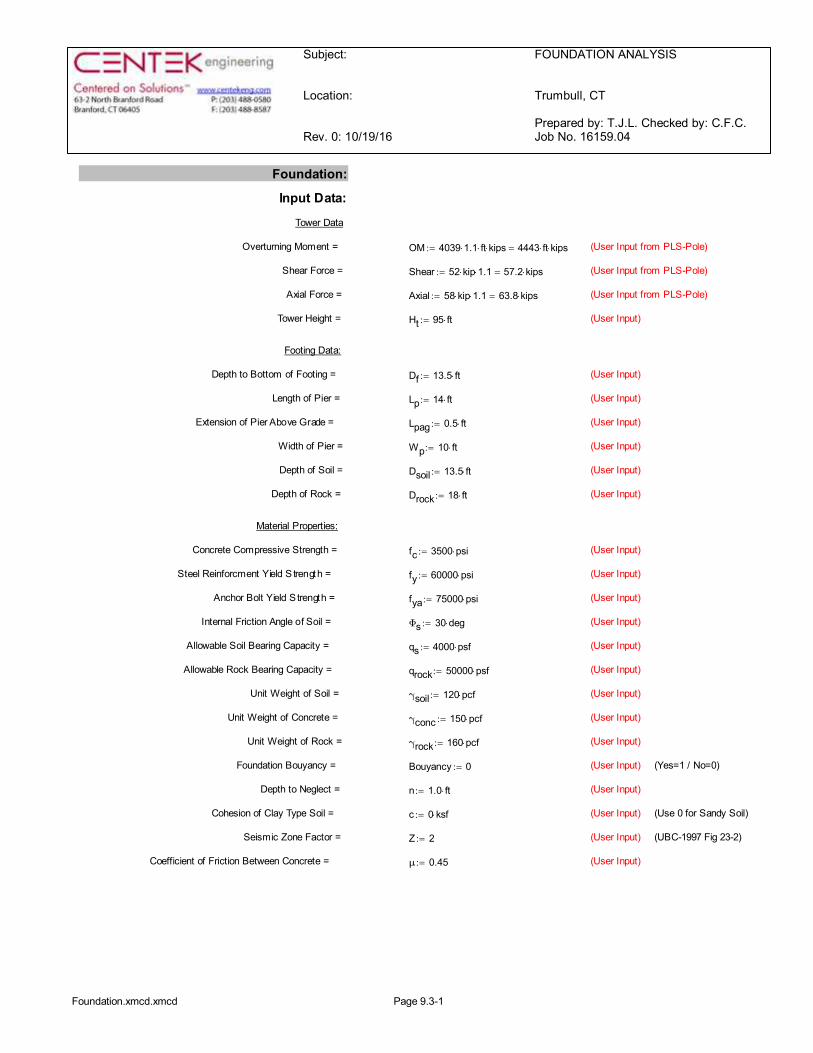
Rev. 0: 10/19/16
FOUNDATION ANALYSIS
Trumbull, CT
Prepared by: T.J.L. Checked by: C.F.C.Job No. 16159.04
Foundation:
Input Data:
Tower Data
Overturning Moment = OM 4039 1.1× ft× kips× 4443 ft kips××=:= (User Input from PLS-Pole)
Shear Force = Shear 52 kip× 1.1× 57.2 kips×=:= (User Input from PLS-Pole)
Axial Force = Axial 58 kip× 1.1× 63.8 kips×=:= (User Input from PLS-Pole)
Tower Height = Ht 95 ft×:= (User Input)
Footing Data:
Depth to Bottom of Footing = Df 13.5 ft×:= (User Input)
Length of Pier = Lp 14 ft×:= (User Input)
Extension of Pier Above Grade = Lpag 0.5 ft×:= (User Input)
Width of Pier = Wp 10 ft×:= (User Input)
Depth of Soil = Dsoil 13.5 ft×:= (User Input)
Depth of Rock = Drock 18 ft×:= (User Input)
Material Properties:
Concrete Compressive Strength = fc 3500 psi×:= (User Input)
Steel Reinforcment Yield S trength = fy 60000 psi×:= (User Input)
Anchor Bolt Yield S trength = fya 75000 psi×:= (User Input)
Internal Friction Angle of Soil = Φs 30 deg×:= (User Input)
Allowable Soil Bearing Capacity = qs 4000 psf×:= (User Input)
Allowable Rock Bearing Capacity = qrock 50000 psf×:= (User Input)
Unit Weight of Soil = γsoil 120 pcf×:= (User Input)
Unit Weight of Concrete = γconc 150 pcf×:= (User Input)
Unit Weight of Rock = γrock 160 pcf×:= (User Input)
Foundation Bouyancy = Bouyancy 0:= (User Input) (Yes=1 / No=0)
Depth to Neglect = n 1.0 ft×:= (User Input)
Cohesion of Clay Type Soil = c 0 ksf×:= (User Input) (Use 0 for Sandy Soil)
Seismic Zone Factor = Z 2:= (User Input) (UBC-1997 Fig 23-2)
Coefficient of Friction Between Concrete = μ 0.45:= (User Input)
Foundation.xmcd.xmcd Page 9.3-1
Subject:
Location:
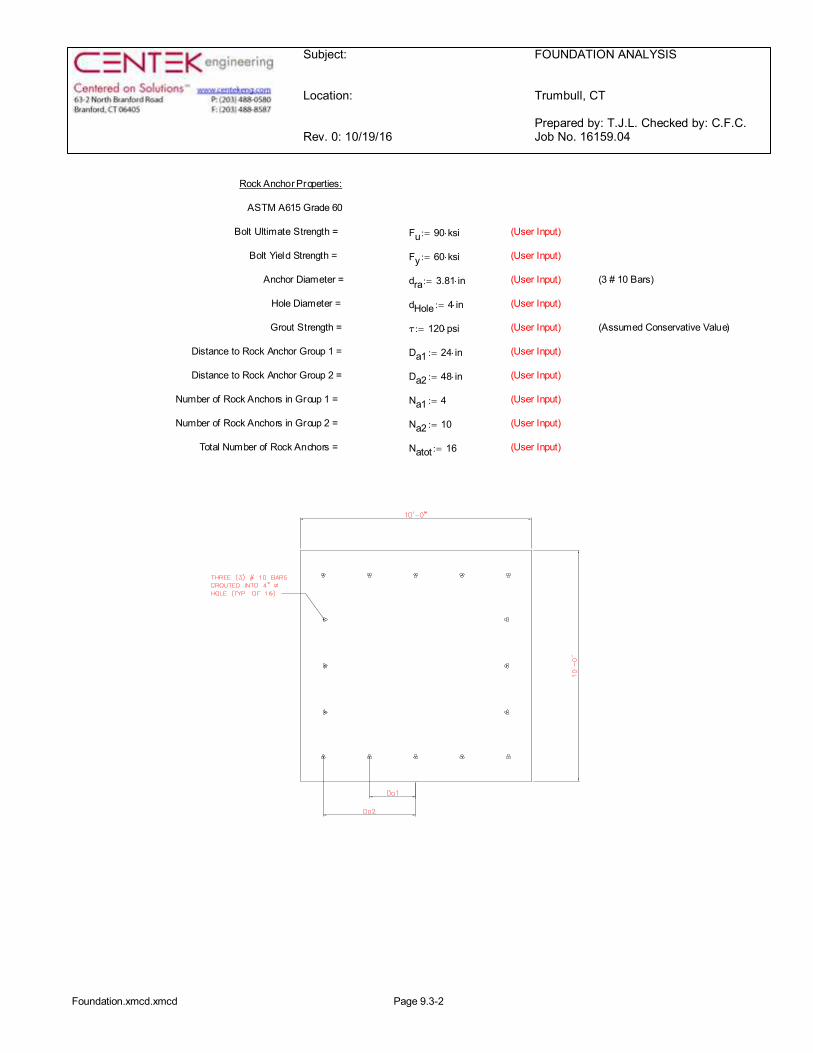
Rev. 0: 10/19/16
FOUNDATION ANALYSIS
Trumbull, CT
Prepared by: T.J.L. Checked by: C.F.C.Job No. 16159.04
Rock Anchor Properties:
ASTM A615 Grade 60
Bolt Ultimate Strength = Fu 90 ksi×:= (User Input)
Bolt Yield Strength = Fy 60 ksi×:= (User Input)
Anchor Diameter = dra 3.81 in×:= (User Input) (3 # 10 Bars)
Hole Diameter = dHole 4 in×:= (User Input)
Grout Strength = τ 120 psi×:= (User Input) (Assumed Conservative Value)
Distance to Rock Anchor Group 1 = Da1 24 in×:= (User Input)
Distance to Rock Anchor Group 2 = Da2 48 in×:= (User Input)
Number of Rock Anchors in Group 1 = Na1 4:= (User Input)
Number of Rock Anchors in Group 2 = Na2 10:= (User Input)
Total Number of Rock Anchors = Natot 16:= (User Input)
Foundation.xmcd.xmcd Page 9.3-2
Subject:
Location:
Rev. 0: 10/19/16
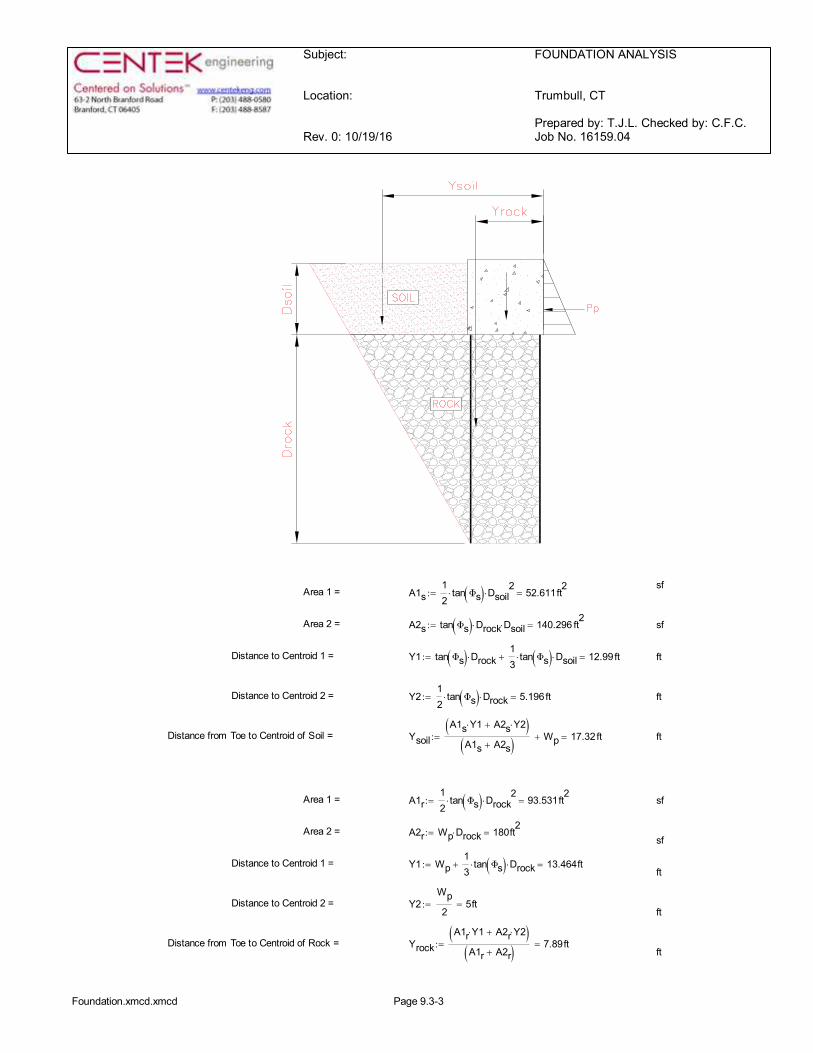
FOUNDATION ANALYSIS
Trumbull, CT
Prepared by: T.J.L. Checked by: C.F.C.Job No. 16159.04
sfArea 1 = A1s
12
tan Φs( )× Dsoil2
× 52.611ft2
=:=
Area 2 = A2s tan Φs( ) Drock× Dsoil× 140.296 ft2
=:= sf
Distance to Centroid 1 = Y1 tan Φs( ) Drock×13
tan Φs( )× Dsoil×+ 12.99ft=:= ft
Distance to Centroid 2 = Y212
tan Φs( )× Drock× 5.196ft=:= ft
Distance from Toe to Centroid of Soil = YsoilA1s Y1× A2s Y2×+( )
A1s A2s+( ) Wp+ 17.32ft=:= ft
Area 1 = A1r12
tan Φs( )× Drock2
× 93.531ft2
=:= sf
Area 2 = A2r Wp Drock× 180ft2
=:=sf
Distance to Centroid 1 = Y1 Wp13
tan Φs( )× Drock×+ 13.464ft=:=ft
Distance to Centroid 2 = Y2Wp2
5ft=:=ft
Distance from Toe to Centroid of Rock = YrockA1r Y1× A2r Y2×+( )
A1r A2r+( ) 7.89ft=:=ft
Foundation.xmcd.xmcd Page 9.3-3
Subject:
Location:
Rev. 0: 10/19/16
FOUNDATION ANALYSIS
Trumbull, CT
Prepared by: T.J.L. Checked by: C.F.C.Job No. 16159.04
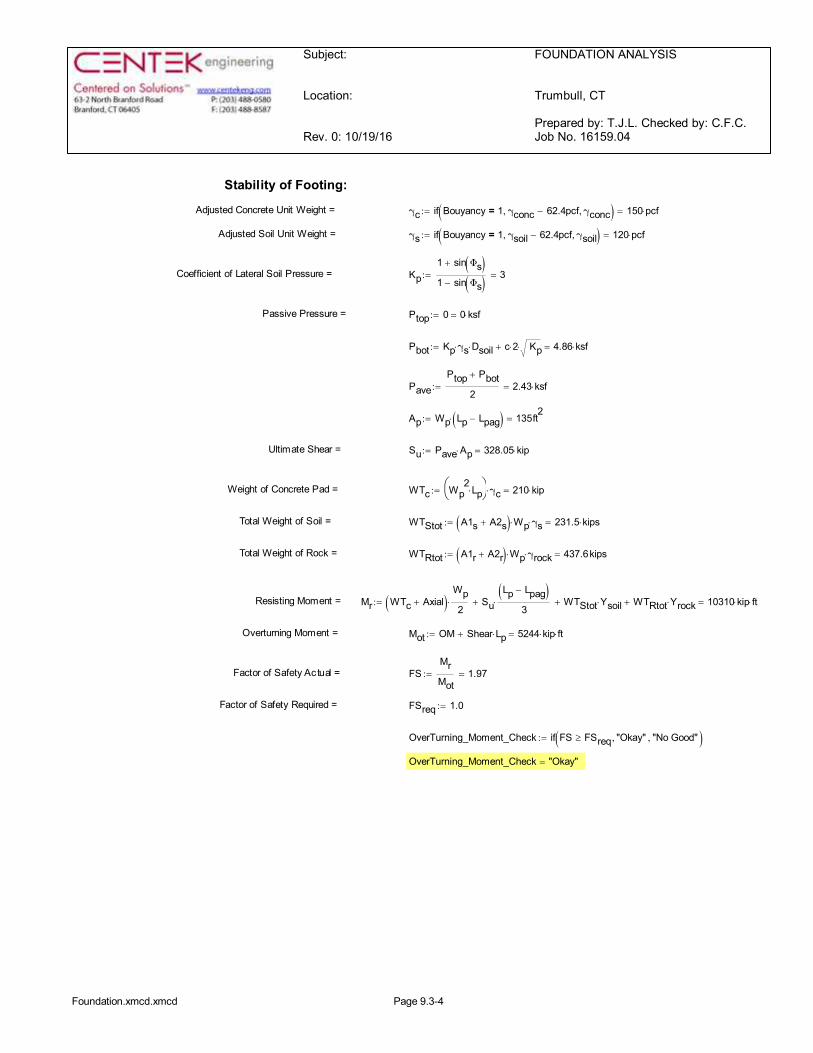
Stability of Footing:
Adjusted Concrete Unit Weight = γc if Bouyancy 1= γconc 62.4pcf-, γconc, ( ) 150 pcf×=:=
Adjusted Soil Unit Weight = γs if Bouyancy 1= γsoil 62.4pcf-, γsoil, ( ) 120 pcf×=:=
Coefficient of Lateral Soil Pressure = Kp1 sin Φs( )+
1 sin Φs( )-3=:=
Passive Pressure = Ptop 0 0 ksf×=:=
Pbot Kp γs× Dsoil× c 2× Kp×+ 4.86 ksf×=:=
PavePtop Pbot+
22.43 ksf×=:=
Ap Wp Lp Lpag-( )× 135ft2
=:=
Ultimate Shear = Su Pave Ap× 328.05 kip×=:=
Weight of Concrete Pad = WTc Wp2
Lp×æè
öø γc× 210 kip×=:=
Total Weight of Soil = WTStot A1s A2s+( ) Wp× γs× 231.5 kips×=:=
Total Weight of Rock = WTRtot A1r A2r+( ) Wp× γrock× 437.6kips=:=
Resisting Moment = Mr WTc Axial+( )Wp2
× SuLp Lpag-( )
3×+ WTStot Ysoil×+ WTRtot Yrock×+ 10310 kip ft××=:=
Overturning Moment = Mot OM Shear Lp×+ 5244 kip ft××=:=
Factor of Safety Actual = FSMrMot
1.97=:=
Factor of Safety Required = FSreq 1.0:=
OverTurning_Moment_Check if FS FSreq³ "Okay", "No Good", ( ):=
OverTurning_Moment_Check "Okay"=
Foundation.xmcd.xmcd Page 9.3-4
Subject:
Location:
Rev. 0: 10/19/16
FOUNDATION ANALYSIS
Trumbull, CT
Prepared by: T.J.L. Checked by: C.F.C.Job No. 16159.04
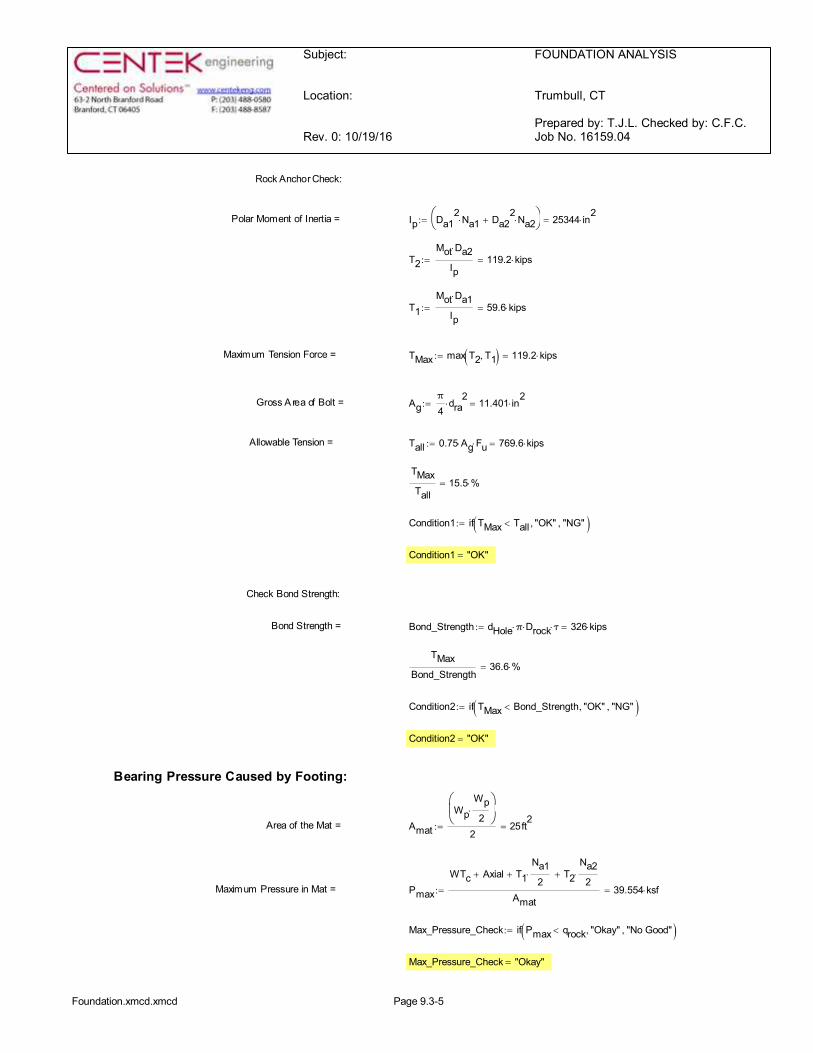
Rock Anchor Check:
Polar Moment of Inertia = Ip Da12
Na1× Da22
Na2×+æè
öø 25344 in
2×=:=
T2Mot Da2×
Ip119.2 kips×=:=
T1Mot Da1×
Ip59.6 kips×=:=
Maximum Tension Force = TMax max T2 T1, ( ) 119.2 kips×=:=
Gross A rea of Bolt = Agπ4
dra2
× 11.401 in2
×=:=
Allowable Tension = Tall 0.75 Ag× Fu× 769.6 kips×=:=
TMaxTall
15.5 %×=
Condition1 if TMax Tall< "OK", "NG", ( ):=
Condition1 "OK"=
Check Bond Strength:
Bond Strength = Bond_Strength dHole π× Drock× τ× 326 kips×=:=
TMaxBond_Strength
36.6 %×=
Condition2 if TMax Bond_Strength< "OK", "NG", ( ):=
Condition2 "OK"=
Bearing Pressure Caused by Footing:
Area of the Mat = Amat
WpWp2
×æçè
ö÷ø
225ft
2=:=
Maximum Pressure in Mat = Pmax
WTc Axial+ T1Na1
2×+ T2
Na22
×+
Amat39.554 ksf×=:=
Max_Pressure_Check if Pmax qrock< "Okay", "No Good", ( ):=
Max_Pressure_Check "Okay"=
Foundation.xmcd.xmcd Page 9.3-5
9/26/2016 rfds.eng.tmobile.com/DataSheet/Printout/11436684
http://rfds.eng.tmobile.com/DataSheet/Printout/11436684 1/10
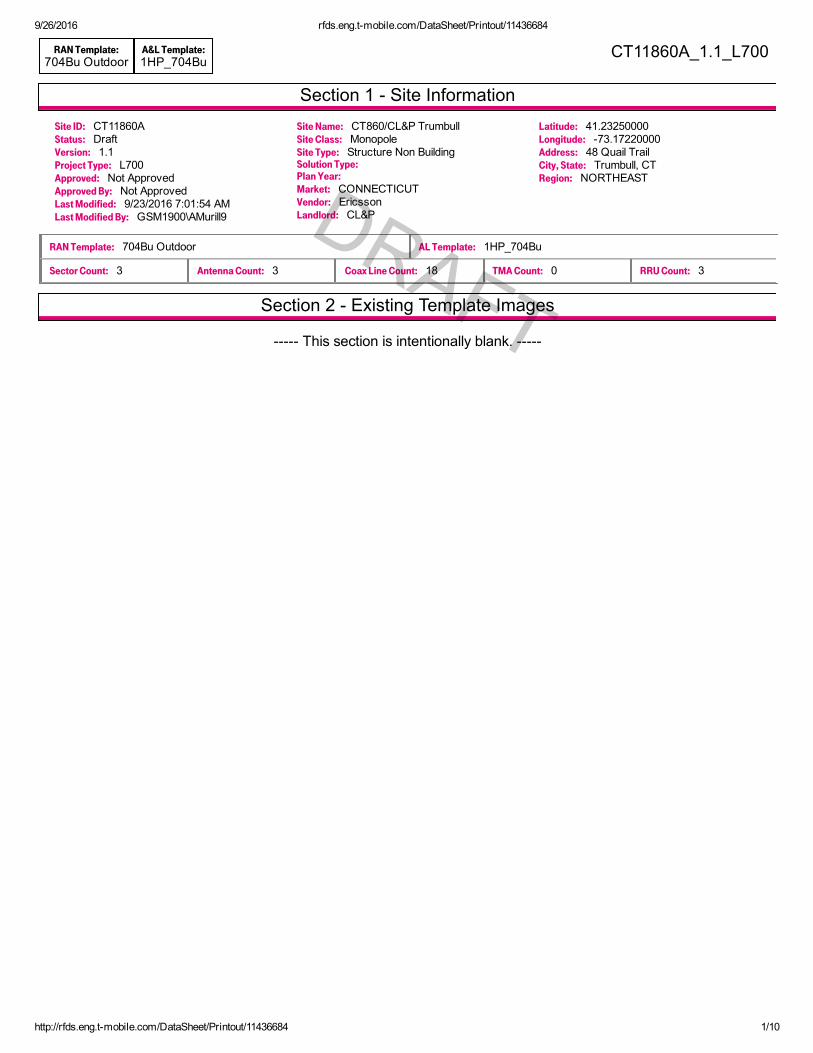
Section 1 Site Information
Section 2 Existing Template Images
RAN Template:704Bu Outdoor
A&L Template:1HP_704Bu
CT11860A_1.1_L700
Site ID: CT11860AStatus: DraftVersion: 1.1Project Type: L700Approved: Not ApprovedApproved By: Not ApprovedLast Modified: 9/23/2016 7:01:54 AMLast Modified By: GSM1900\AMurill9
Site Name: CT860/CL&P TrumbullSite Class: MonopoleSite Type: Structure Non BuildingSolution Type:Plan Year:Market: CONNECTICUTVendor: EricssonLandlord: CL&P
Latitude: 41.23250000Longitude: 73.17220000Address: 48 Quail TrailCity, State: Trumbull, CTRegion: NORTHEAST
RAN Template: 704Bu Outdoor AL Template: 1HP_704Bu
Sector Count: 3 Antenna Count: 3 Coax Line Count: 18 TMA Count: 0 RRU Count: 3
This section is intentionally blank.
DRAFT
DRAFT
9/26/2016 rfds.eng.tmobile.com/DataSheet/Printout/11436684
http://rfds.eng.tmobile.com/DataSheet/Printout/11436684 2/10
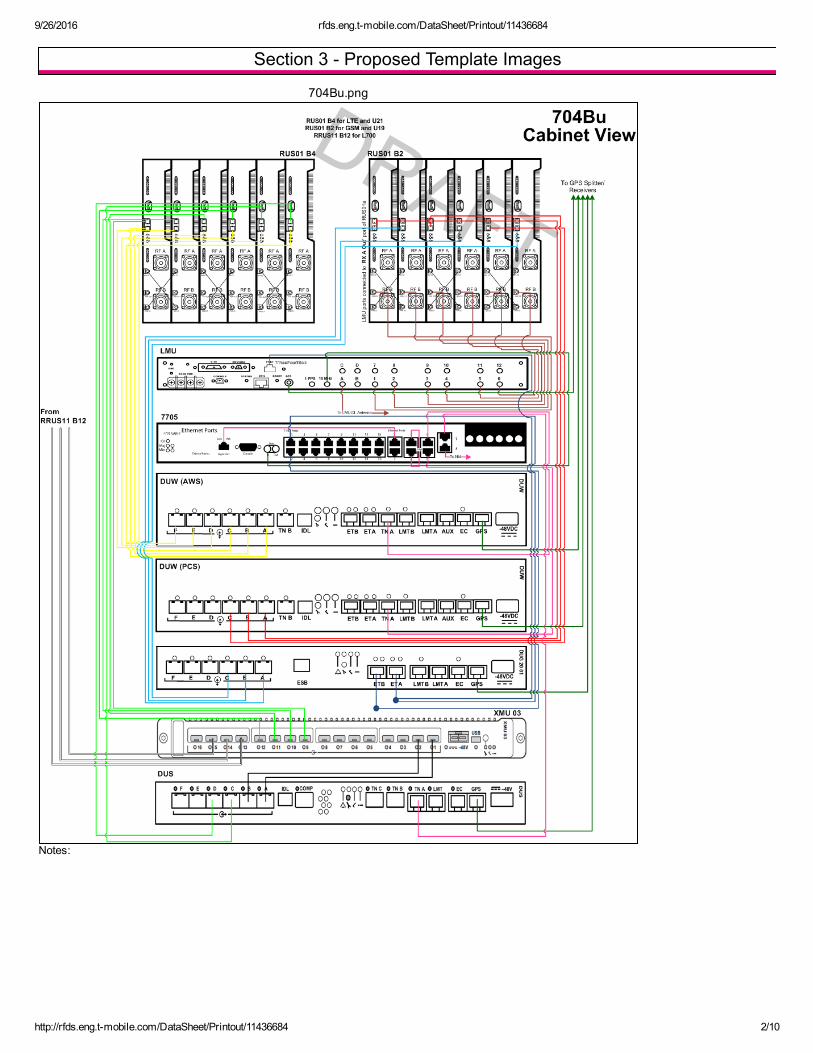
Section 3 Proposed Template Images
704Bu.png
Notes:
DRAFT
DRAFT

9/26/2016 rfds.eng.tmobile.com/DataSheet/Printout/11436684
http://rfds.eng.tmobile.com/DataSheet/Printout/11436684 3/10
Section 4 Siteplan Images
This section is intentionally blank. DRAFT
DRAFT
9/26/2016 rfds.eng.tmobile.com/DataSheet/Printout/11436684
http://rfds.eng.tmobile.com/DataSheet/Printout/11436684 4/10
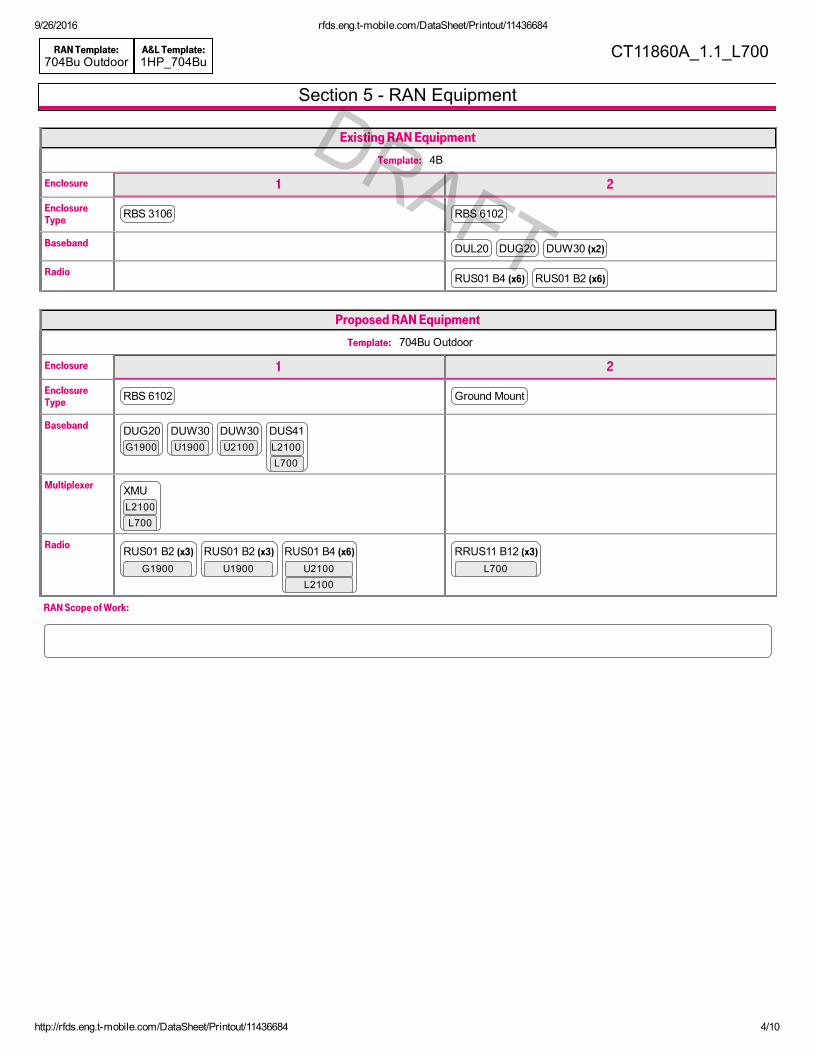
Section 5 RAN Equipment
RAN Template:704Bu Outdoor
A&L Template:1HP_704Bu
CT11860A_1.1_L700
Existing RAN Equipment
Template: 4B
Enclosure 1 2
EnclosureType RBS 3106 RBS 6102
Baseband DUL20 DUG20 DUW30 (x2)
Radio RUS01 B4 (x6) RUS01 B2 (x6)
Proposed RAN Equipment
Template: 704Bu Outdoor
Enclosure 1 2
EnclosureType RBS 6102 Ground Mount
Baseband DUG20 DUW30 DUW30 DUS41G1900 U1900 U2100 L2100
L700
Multiplexer XMUL2100L700
Radio RUS01 B2 (x3) RUS01 B2 (x3) RUS01 B4 (x6) RRUS11 B12 (x3)
G1900 U1900 U2100L2100
L700
RAN Scope of Work:
DRAFT
DRAFT
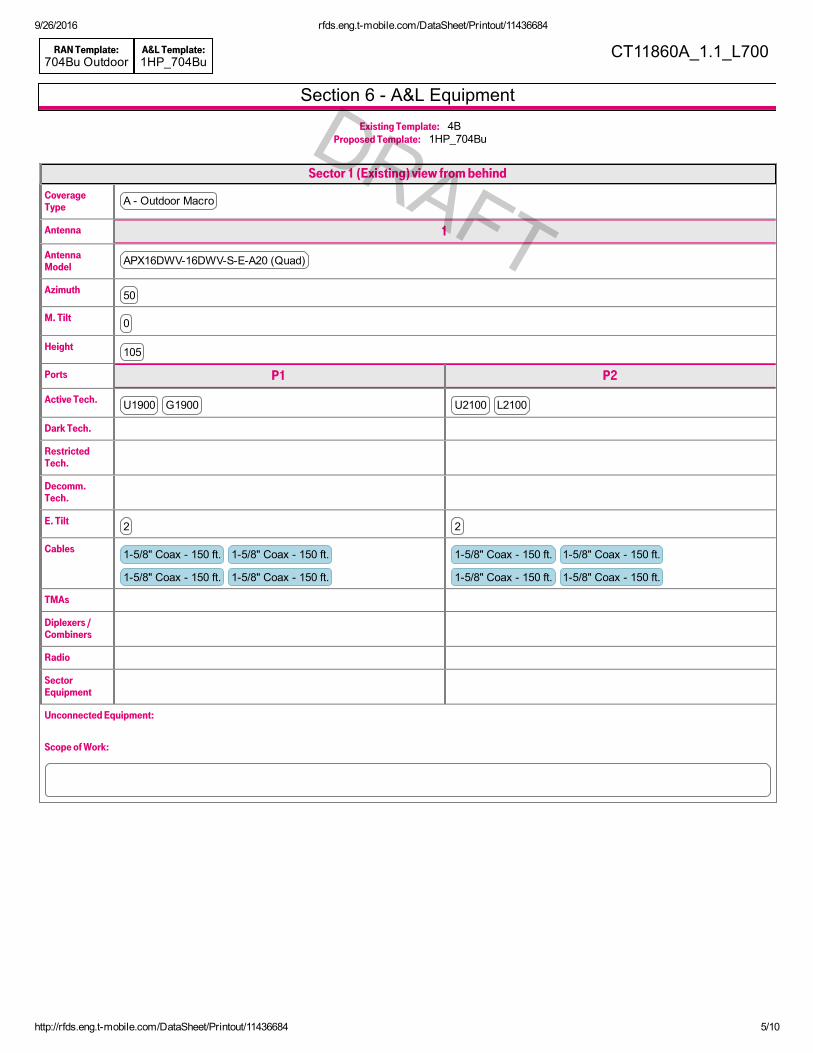
9/26/2016 rfds.eng.tmobile.com/DataSheet/Printout/11436684
http://rfds.eng.tmobile.com/DataSheet/Printout/11436684 5/10
Section 6 A&L Equipment
RAN Template:704Bu Outdoor
A&L Template:1HP_704Bu
CT11860A_1.1_L700
Existing Template: 4BProposed Template: 1HP_704Bu
Sector 1 (Existing) view from behind
CoverageType A Outdoor Macro
Antenna 1
AntennaModel APX16DWV16DWVSEA20 (Quad)
Azimuth 50
M. Tilt 0
Height 105
Ports P1 P2
Active Tech. U1900 G1900 U2100 L2100
Dark Tech.
RestrictedTech.
Decomm.Tech.
E. Tilt 2 2
Cables 15/8" Coax 150 ft. 15/8" Coax 150 ft.
15/8" Coax 150 ft. 15/8" Coax 150 ft.
15/8" Coax 150 ft. 15/8" Coax 150 ft.
15/8" Coax 150 ft. 15/8" Coax 150 ft.
TMAs
Diplexers /Combiners
Radio
SectorEquipment
Unconnected Equipment:
Scope of Work:
DRAFT

9/26/2016 rfds.eng.tmobile.com/DataSheet/Printout/11436684
http://rfds.eng.tmobile.com/DataSheet/Printout/11436684 6/10
RAN Template:704Bu Outdoor
A&L Template:1HP_704Bu
CT11860A_1.1_L700
Sector 1 (Proposed) view from behind
CoverageType A Outdoor Macro
Antenna 1
AntennaModel SBNHH1D65A (Hex)
Azimuth 50
M. Tilt 0
Height 105
Ports P1 P2 P3
Active Tech. U1900 G1900 U2100 L2100 L700
Dark Tech.
RestrictedTech.
Decomm.Tech.
E. Tilt 2 2 2
Cables 15/8" Coax 150 ft.
15/8" Coax 150 ft.
15/8" Coax 150 ft.
15/8" Coax 150 ft.
15/8" Coax 150 ft.
15/8" Coax 150 ft.
TMAs
Diplexers /Combiners
Radio
SectorEquipment
Unconnected Equipment:
Install BiasT's up top for RET's
Scope of Work:

9/26/2016 rfds.eng.tmobile.com/DataSheet/Printout/11436684
http://rfds.eng.tmobile.com/DataSheet/Printout/11436684 7/10
RAN Template:704Bu Outdoor
A&L Template:1HP_704Bu
CT11860A_1.1_L700
Sector 2 (Existing) view from behind
CoverageType A Outdoor Macro
Antenna 1
AntennaModel APX16DWV16DWVSEA20 (Quad)
Azimuth 170
M. Tilt 0
Height 105
Ports P1 P2
Active Tech. U1900 G1900 U2100 L2100
Dark Tech.
RestrictedTech.
Decomm.Tech.
E. Tilt 7 8
Cables 15/8" Coax 150 ft. 15/8" Coax 150 ft.
15/8" Coax 150 ft. 15/8" Coax 150 ft.
15/8" Coax 150 ft. 15/8" Coax 150 ft.
15/8" Coax 150 ft. 15/8" Coax 150 ft.
TMAs
Diplexers /Combiners
Radio
SectorEquipment
Unconnected Equipment:
Scope of Work:
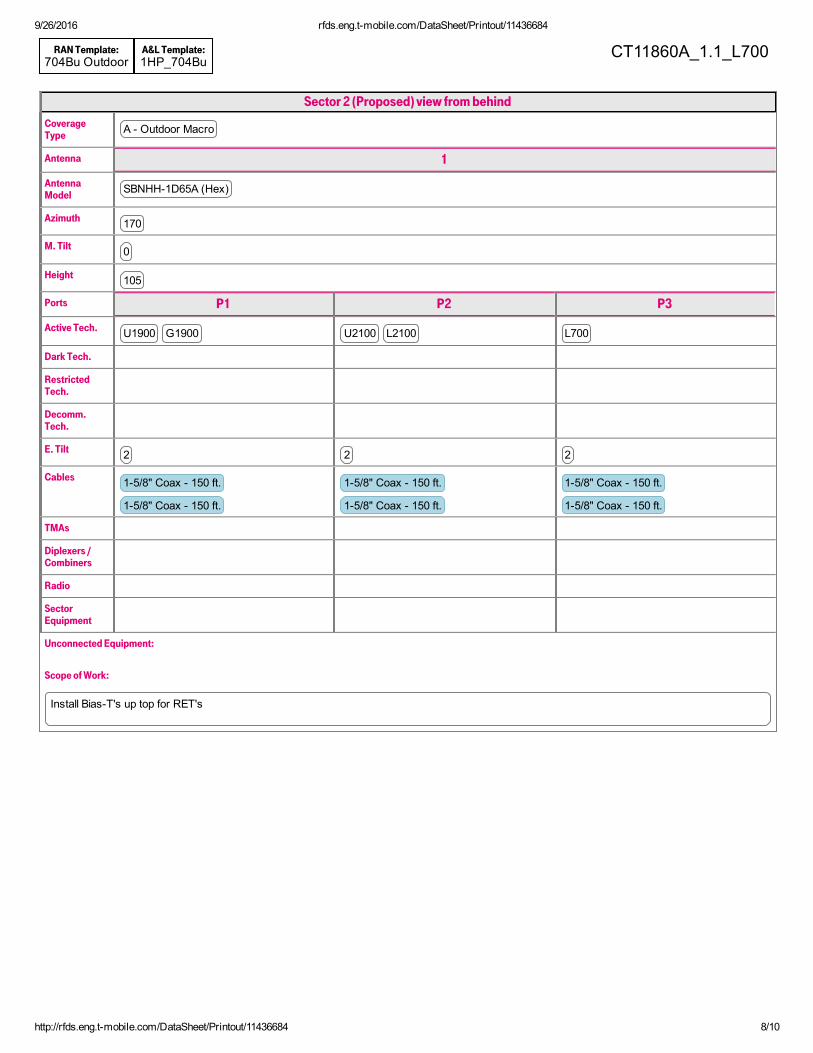
9/26/2016 rfds.eng.tmobile.com/DataSheet/Printout/11436684
http://rfds.eng.tmobile.com/DataSheet/Printout/11436684 8/10
RAN Template:704Bu Outdoor
A&L Template:1HP_704Bu
CT11860A_1.1_L700
Sector 2 (Proposed) view from behind
CoverageType A Outdoor Macro
Antenna 1
AntennaModel SBNHH1D65A (Hex)
Azimuth 170
M. Tilt 0
Height 105
Ports P1 P2 P3
Active Tech. U1900 G1900 U2100 L2100 L700
Dark Tech.
RestrictedTech.
Decomm.Tech.
E. Tilt 2 2 2
Cables 15/8" Coax 150 ft.
15/8" Coax 150 ft.
15/8" Coax 150 ft.
15/8" Coax 150 ft.
15/8" Coax 150 ft.
15/8" Coax 150 ft.
TMAs
Diplexers /Combiners
Radio
SectorEquipment
Unconnected Equipment:
Install BiasT's up top for RET's
Scope of Work:
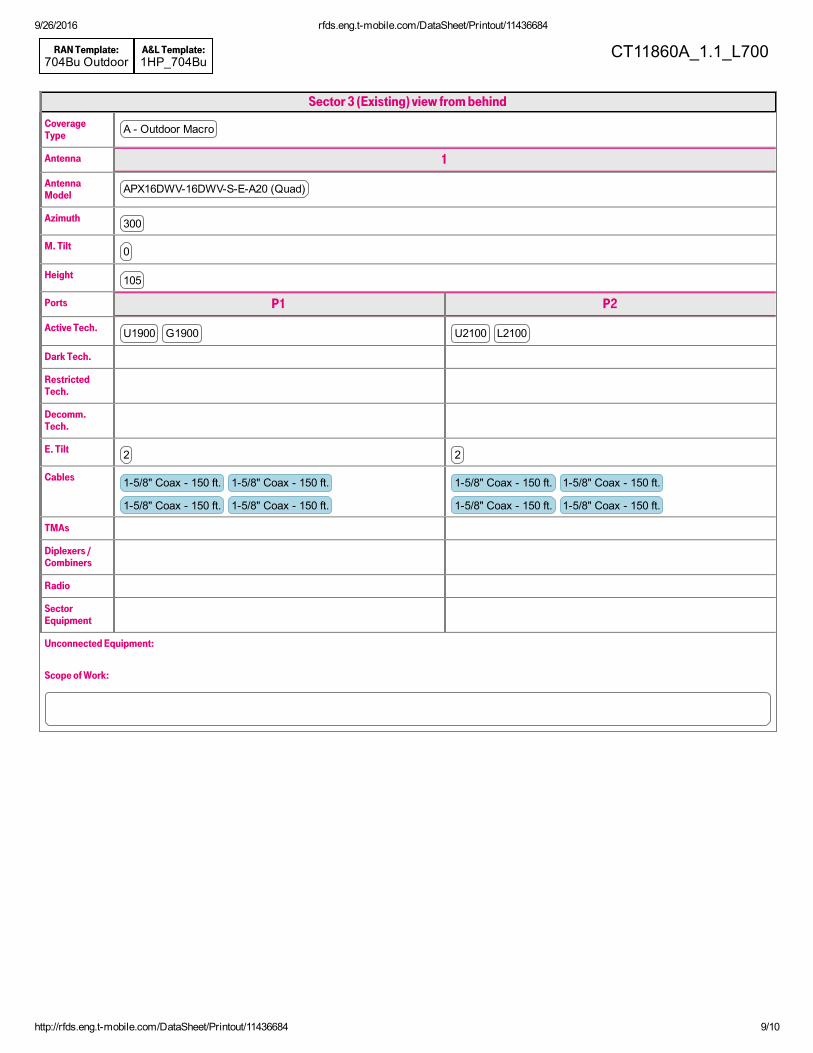
9/26/2016 rfds.eng.tmobile.com/DataSheet/Printout/11436684
http://rfds.eng.tmobile.com/DataSheet/Printout/11436684 9/10
RAN Template:704Bu Outdoor
A&L Template:1HP_704Bu
CT11860A_1.1_L700
Sector 3 (Existing) view from behind
CoverageType A Outdoor Macro
Antenna 1
AntennaModel APX16DWV16DWVSEA20 (Quad)
Azimuth 300
M. Tilt 0
Height 105
Ports P1 P2
Active Tech. U1900 G1900 U2100 L2100
Dark Tech.
RestrictedTech.
Decomm.Tech.
E. Tilt 2 2
Cables 15/8" Coax 150 ft. 15/8" Coax 150 ft.
15/8" Coax 150 ft. 15/8" Coax 150 ft.
15/8" Coax 150 ft. 15/8" Coax 150 ft.
15/8" Coax 150 ft. 15/8" Coax 150 ft.
TMAs
Diplexers /Combiners
Radio
SectorEquipment
Unconnected Equipment:
Scope of Work:

9/26/2016 rfds.eng.tmobile.com/DataSheet/Printout/11436684
http://rfds.eng.tmobile.com/DataSheet/Printout/11436684 10/10
RAN Template:704Bu Outdoor
A&L Template:1HP_704Bu
CT11860A_1.1_L700
Sector 3 (Proposed) view from behind
CoverageType A Outdoor Macro
Antenna 1
AntennaModel SBNHH1D65A (Hex)
Azimuth 300
M. Tilt 0
Height 105
Ports P1 P2 P3
Active Tech. U1900 G1900 U2100 L2100 L700
Dark Tech.
RestrictedTech.
Decomm.Tech.
E. Tilt 2 2 2
Cables 15/8" Coax 150 ft.
15/8" Coax 150 ft.
15/8" Coax 150 ft.
15/8" Coax 150 ft.
15/8" Coax 150 ft.
15/8" Coax 150 ft.
TMAs
Diplexers /Combiners
Radio
SectorEquipment
Unconnected Equipment:
Install BiasT's up top for RET's
Scope of Work:
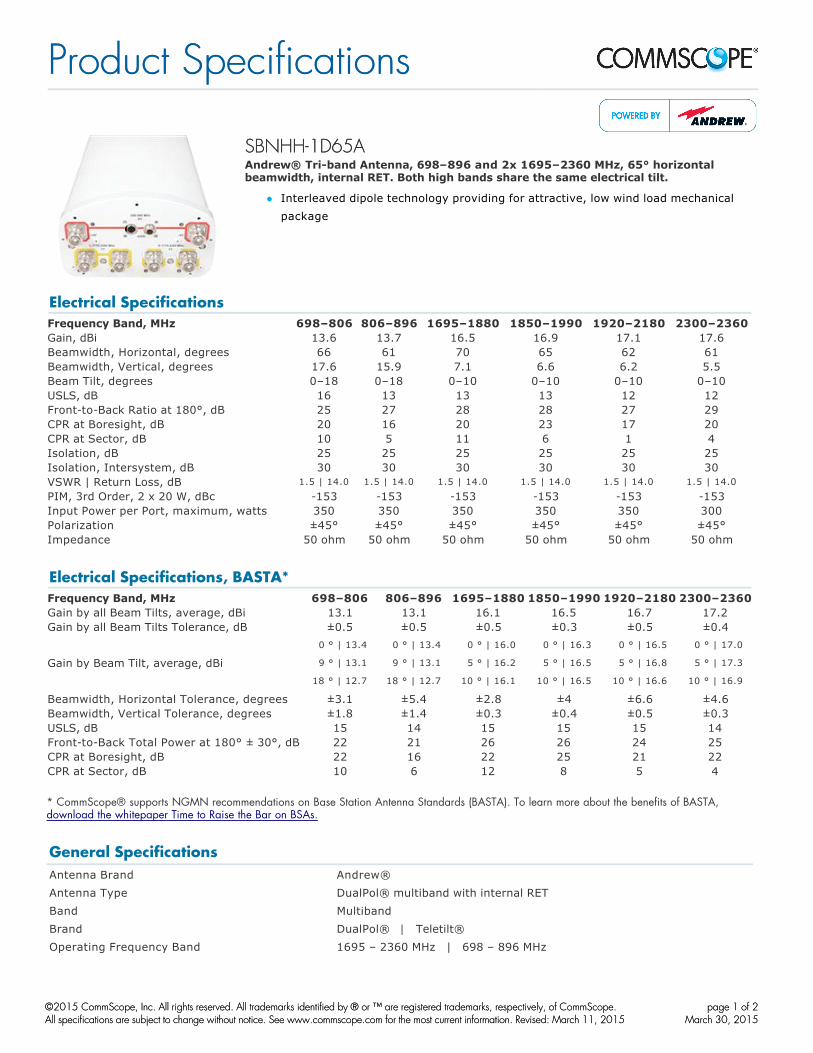
SBNHHSBNHH--1D65A1D65A Andrew® Triband Antenna, 698–896 and 2x 1695–2360 MHz, 65° horizontal beamwidth, internal RET. Both high bands share the same electrical tilt.
l Interleaved dipole technology providing for attractive, low wind load mechanical package
* CommScope® supports NGMN recommendations on Base Station Antenna Standards (BASTA). To learn more about the benefits of BASTA, download the whitepaper Time to Raise the Bar on BSAs.
Electrical SpecificationsFrequency Band, MHz 698–806 806–896 1695–1880 1850–1990 1920–2180 2300–2360Gain, dBi 13.6 13.7 16.5 16.9 17.1 17.6Beamwidth, Horizontal, degrees 66 61 70 65 62 61Beamwidth, Vertical, degrees 17.6 15.9 7.1 6.6 6.2 5.5Beam Tilt, degrees 0–18 0–18 0–10 0–10 0–10 0–10USLS, dB 16 13 13 13 12 12FronttoBack Ratio at 180°, dB 25 27 28 28 27 29CPR at Boresight, dB 20 16 20 23 17 20CPR at Sector, dB 10 5 11 6 1 4Isolation, dB 25 25 25 25 25 25Isolation, Intersystem, dB 30 30 30 30 30 30VSWR | Return Loss, dB 1.5 | 14.0 1.5 | 14.0 1.5 | 14.0 1.5 | 14.0 1.5 | 14.0 1.5 | 14.0
PIM, 3rd Order, 2 x 20 W, dBc 153 153 153 153 153 153Input Power per Port, maximum, watts 350 350 350 350 350 300Polarization ±45° ±45° ±45° ±45° ±45° ±45°Impedance 50 ohm 50 ohm 50 ohm 50 ohm 50 ohm 50 ohm
Electrical Specifications, BASTA*Frequency Band, MHz 698–806 806–896 1695–1880 1850–1990 1920–2180 2300–2360Gain by all Beam Tilts, average, dBi 13.1 13.1 16.1 16.5 16.7 17.2Gain by all Beam Tilts Tolerance, dB ±0.5 ±0.5 ±0.5 ±0.3 ±0.5 ±0.4
Gain by Beam Tilt, average, dBi
0 ° | 13.4
9 ° | 13.1
18 ° | 12.7
0 ° | 13.4
9 ° | 13.1
18 ° | 12.7
0 ° | 16.0
5 ° | 16.2
10 ° | 16.1
0 ° | 16.3
5 ° | 16.5
10 ° | 16.5
0 ° | 16.5
5 ° | 16.8
10 ° | 16.6
0 ° | 17.0
5 ° | 17.3
10 ° | 16.9
Beamwidth, Horizontal Tolerance, degrees ±3.1 ±5.4 ±2.8 ±4 ±6.6 ±4.6Beamwidth, Vertical Tolerance, degrees ±1.8 ±1.4 ±0.3 ±0.4 ±0.5 ±0.3USLS, dB 15 14 15 15 15 14FronttoBack Total Power at 180° ± 30°, dB 22 21 26 26 24 25CPR at Boresight, dB 22 16 22 25 21 22CPR at Sector, dB 10 6 12 8 5 4
General Specifications Antenna Brand Andrew® Antenna Type DualPol® multiband with internal RET Band Multiband Brand DualPol® | Teletilt® Operating Frequency Band 1695 – 2360 MHz | 698 – 896 MHz
Product SpecificationsProduct Specifications
©©2015 CommScope, Inc. All rights reserved. All trademarks identified by 2015 CommScope, Inc. All rights reserved. All trademarks identified by ® ® or ™ are registered trademarks, respectively, of CommScope.or ™ are registered trademarks, respectively, of CommScope. All specifications are subject to change without notice. See www.commscope.com for the most current information. Revised: March 11, 2015All specifications are subject to change without notice. See www.commscope.com for the most current information. Revised: March 11, 2015
page 1 of 2page 1 of 2March 30, 2015March 30, 2015
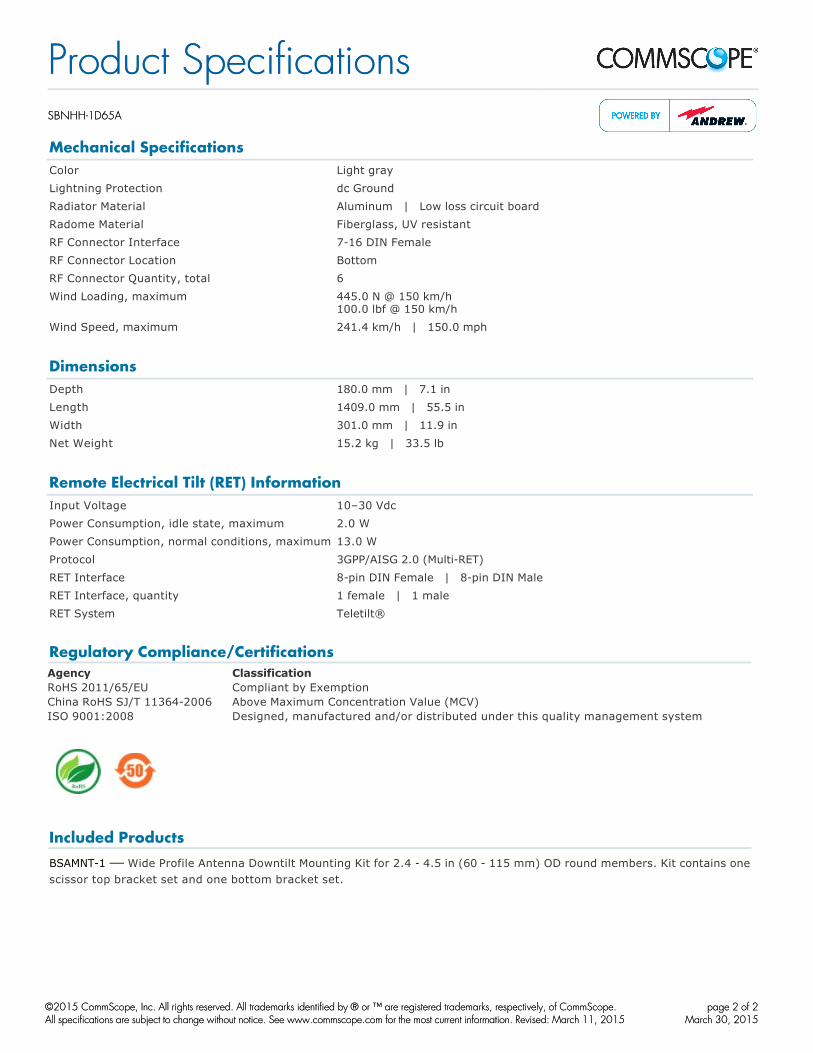
Mechanical Specifications Color Light gray Lightning Protection dc Ground Radiator Material Aluminum | Low loss circuit board Radome Material Fiberglass, UV resistant RF Connector Interface 716 DIN Female RF Connector Location Bottom RF Connector Quantity, total 6 Wind Loading, maximum 445.0 N @ 150 km/h
100.0 lbf @ 150 km/h Wind Speed, maximum 241.4 km/h | 150.0 mph
Dimensions Depth 180.0 mm | 7.1 in Length 1409.0 mm | 55.5 in Width 301.0 mm | 11.9 in Net Weight 15.2 kg | 33.5 lb
Remote Electrical Tilt (RET) Information Input Voltage 10–30 Vdc Power Consumption, idle state, maximum 2.0 W Power Consumption, normal conditions, maximum 13.0 W Protocol 3GPP/AISG 2.0 (MultiRET) RET Interface 8pin DIN Female | 8pin DIN Male RET Interface, quantity 1 female | 1 male RET System Teletilt®
Regulatory Compliance/CertificationsAgency ClassificationRoHS 2011/65/EU Compliant by ExemptionChina RoHS SJ/T 113642006 Above Maximum Concentration Value (MCV)ISO 9001:2008 Designed, manufactured and/or distributed under this quality management system
Included Products
BSAMNT1 — Wide Profile Antenna Downtilt Mounting Kit for 2.4 4.5 in (60 115 mm) OD round members. Kit contains one scissor top bracket set and one bottom bracket set.
Product SpecificationsProduct SpecificationsSBNHHSBNHH--1D65A1D65A
©©2015 CommScope, Inc. All rights reserved. All trademarks identified by 2015 CommScope, Inc. All rights reserved. All trademarks identified by ® ® or ™ are registered trademarks, respectively, of CommScope.or ™ are registered trademarks, respectively, of CommScope. All specifications are subject to change without notice. See www.commscope.com for the most current information. Revised: March 11, 2015All specifications are subject to change without notice. See www.commscope.com for the most current information. Revised: March 11, 2015
page 2 of 2page 2 of 2March 30, 2015March 30, 2015

EBI Consulting environmental | engineering | due diligence
21 B Street . Burlington, MA 01803 . Tel: (781) 273.2500 . Fax: (781) 273.3311
RADIO FREQUENCY EMISSIONS ANALYSIS REPORT EVALUATION OF HUMAN EXPOSURE POTENTIAL
TO NON-IONIZING EMISSIONS
T-Mobile Existing Facility
Site ID: CT11860A
CT860/CL&P Trumbull 48 Quail Trail
Trumbull, CT 06611
November 22, 2016
EBI Project Number: 6216005487
Site Compliance Summary
Compliance Status: COMPLIANT
Site total MPE% of FCC general public allowable limit:
2.50 %

EBI Consulting environmental | engineering | due diligence
21 B Street . Burlington, MA 01803 . Tel: (781) 273.2500 . Fax: (781) 273.3311
November 22, 2016
T-Mobile USA Attn: Jason Overbey, RF Manager 35 Griffin Road South Bloomfield, CT 06002
Emissions Analysis for Site: CT11860A – CT860/CL&P Trumbull
EBI Consulting was directed to analyze the proposed T-Mobile facility located at 48 Quail Trail, Trumbull, CT, for the purpose of determining whether the emissions from the Proposed T-Mobile Antenna Installation located on this property are within specified federal limits.
All information used in this report was analyzed as a percentage of current Maximum Permissible Exposure (% MPE) as listed in the FCC OET Bulletin 65 Edition 97-01and ANSI/IEEE Std C95.1. The
FCC regulates Maximum Permissible Exposure in units of microwatts per square centimeter (W/cm2).
The number of W/cm2 calculated at each sample point is called the power density. The exposure limit for power density varies depending upon the frequencies being utilized. Wireless Carriers and Paging Services use different frequency bands each with different exposure limits, therefore it is necessary to report results and limits in terms of percent MPE rather than power density.
All results were compared to the FCC (Federal Communications Commission) radio frequency exposure rules, 47 CFR 1.1307(b)(1) – (b)(3), to determine compliance with the Maximum Permissible Exposure (MPE) limits for General Population/Uncontrolled environments as defined below.
General population/uncontrolled exposure limits apply to situations in which the general public may be exposed or in which persons who are exposed as a consequence of their employment may not be made fully aware of the potential for exposure or cannot exercise control over their exposure. Therefore, members of the general public would always be considered under this category when exposure is not employment related, for example, in the case of a telecommunications tower that exposes persons in a nearby residential area.
Public exposure to radio frequencies is regulated and enforced in units of microwatts per square centimeter (μW/cm2). The general population exposure limit for the 700 MHz Band is approximately 467 μW/cm2, and the general population exposure limit for the 1900 MHz (PCS) and 2100 MHz (AWS) bands is 1000 μW/cm2. Because each carrier will be using different frequency bands, and each frequency band has different exposure limits, it is necessary to report percent of MPE rather than power density.
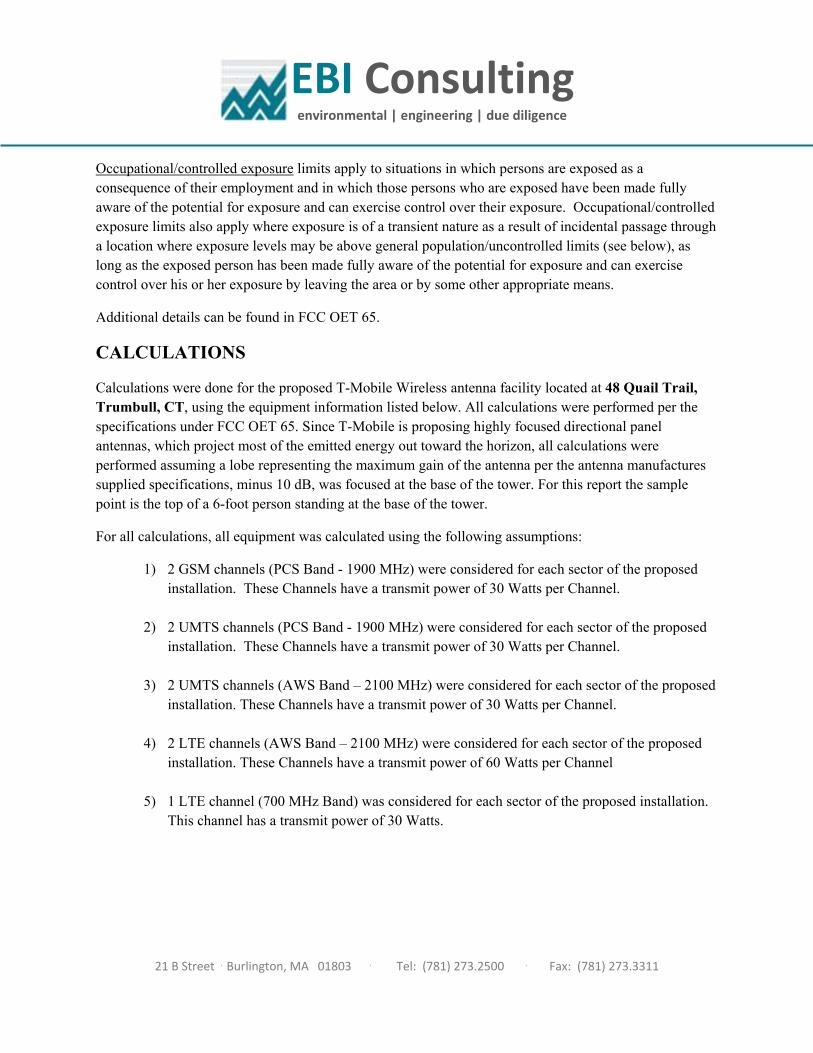
EBI Consulting environmental | engineering | due diligence
21 B Street . Burlington, MA 01803 . Tel: (781) 273.2500 . Fax: (781) 273.3311
Occupational/controlled exposure limits apply to situations in which persons are exposed as a consequence of their employment and in which those persons who are exposed have been made fully aware of the potential for exposure and can exercise control over their exposure. Occupational/controlled exposure limits also apply where exposure is of a transient nature as a result of incidental passage through a location where exposure levels may be above general population/uncontrolled limits (see below), as long as the exposed person has been made fully aware of the potential for exposure and can exercise control over his or her exposure by leaving the area or by some other appropriate means.
Additional details can be found in FCC OET 65.
CALCULATIONS
Calculations were done for the proposed T-Mobile Wireless antenna facility located at 48 Quail Trail, Trumbull, CT, using the equipment information listed below. All calculations were performed per the specifications under FCC OET 65. Since T-Mobile is proposing highly focused directional panel antennas, which project most of the emitted energy out toward the horizon, all calculations were performed assuming a lobe representing the maximum gain of the antenna per the antenna manufactures supplied specifications, minus 10 dB, was focused at the base of the tower. For this report the sample point is the top of a 6-foot person standing at the base of the tower.
For all calculations, all equipment was calculated using the following assumptions:
1) 2 GSM channels (PCS Band - 1900 MHz) were considered for each sector of the proposed installation. These Channels have a transmit power of 30 Watts per Channel.
2) 2 UMTS channels (PCS Band - 1900 MHz) were considered for each sector of the proposed installation. These Channels have a transmit power of 30 Watts per Channel.
3) 2 UMTS channels (AWS Band – 2100 MHz) were considered for each sector of the proposed installation. These Channels have a transmit power of 30 Watts per Channel.
4) 2 LTE channels (AWS Band – 2100 MHz) were considered for each sector of the proposed
installation. These Channels have a transmit power of 60 Watts per Channel 5) 1 LTE channel (700 MHz Band) was considered for each sector of the proposed installation.
This channel has a transmit power of 30 Watts.
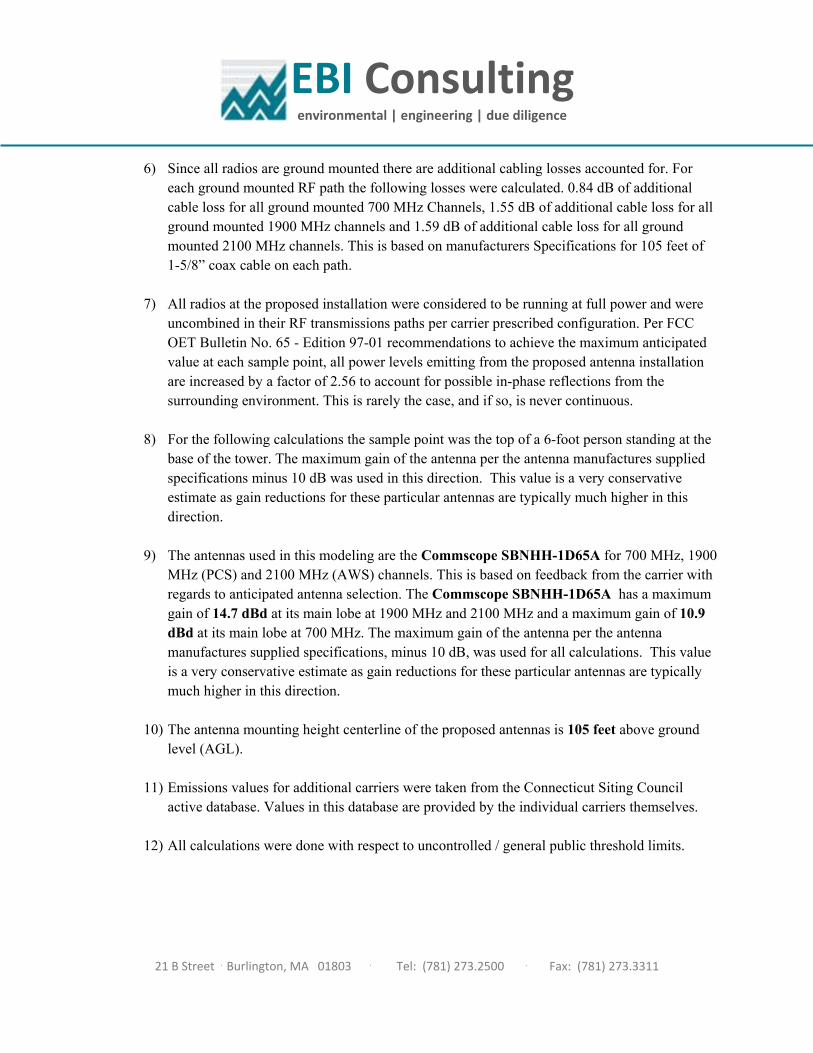
EBI Consulting environmental | engineering | due diligence
21 B Street . Burlington, MA 01803 . Tel: (781) 273.2500 . Fax: (781) 273.3311
6) Since all radios are ground mounted there are additional cabling losses accounted for. For each ground mounted RF path the following losses were calculated. 0.84 dB of additional cable loss for all ground mounted 700 MHz Channels, 1.55 dB of additional cable loss for all ground mounted 1900 MHz channels and 1.59 dB of additional cable loss for all ground mounted 2100 MHz channels. This is based on manufacturers Specifications for 105 feet of 1-5/8” coax cable on each path.
7) All radios at the proposed installation were considered to be running at full power and were
uncombined in their RF transmissions paths per carrier prescribed configuration. Per FCC OET Bulletin No. 65 - Edition 97-01 recommendations to achieve the maximum anticipated value at each sample point, all power levels emitting from the proposed antenna installation are increased by a factor of 2.56 to account for possible in-phase reflections from the surrounding environment. This is rarely the case, and if so, is never continuous.
8) For the following calculations the sample point was the top of a 6-foot person standing at the base of the tower. The maximum gain of the antenna per the antenna manufactures supplied specifications minus 10 dB was used in this direction. This value is a very conservative estimate as gain reductions for these particular antennas are typically much higher in this direction.
9) The antennas used in this modeling are the Commscope SBNHH-1D65A for 700 MHz, 1900 MHz (PCS) and 2100 MHz (AWS) channels. This is based on feedback from the carrier with regards to anticipated antenna selection. The Commscope SBNHH-1D65A has a maximum gain of 14.7 dBd at its main lobe at 1900 MHz and 2100 MHz and a maximum gain of 10.9 dBd at its main lobe at 700 MHz. The maximum gain of the antenna per the antenna manufactures supplied specifications, minus 10 dB, was used for all calculations. This value is a very conservative estimate as gain reductions for these particular antennas are typically much higher in this direction.
10) The antenna mounting height centerline of the proposed antennas is 105 feet above ground
level (AGL). 11) Emissions values for additional carriers were taken from the Connecticut Siting Council
active database. Values in this database are provided by the individual carriers themselves. 12) All calculations were done with respect to uncontrolled / general public threshold limits.
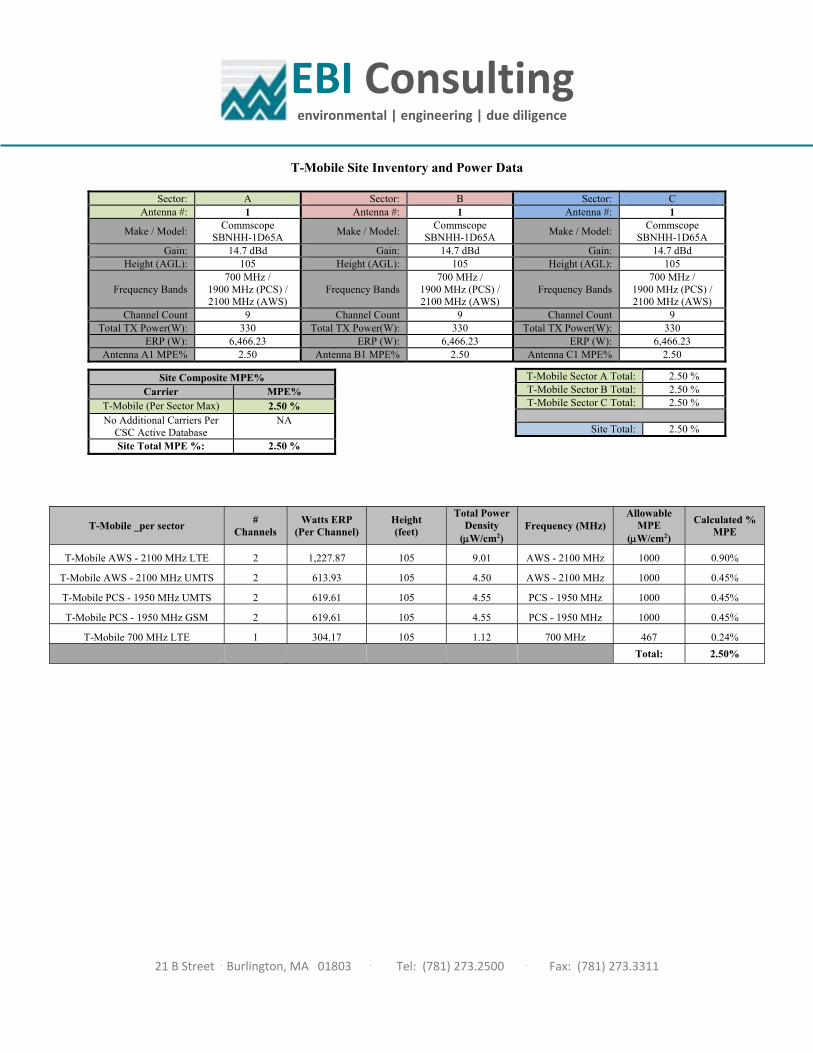
EBI Consulting environmental | engineering | due diligence
21 B Street . Burlington, MA 01803 . Tel: (781) 273.2500 . Fax: (781) 273.3311
T-Mobile Site Inventory and Power Data
Sector: A Sector: B Sector: C Antenna #: 1 Antenna #: 1 Antenna #: 1
Make / Model: Commscope
SBNHH-1D65A Make / Model:
Commscope SBNHH-1D65A
Make / Model: Commscope
SBNHH-1D65A Gain: 14.7 dBd Gain: 14.7 dBd Gain: 14.7 dBd
Height (AGL): 105 Height (AGL): 105 Height (AGL): 105
Frequency Bands 700 MHz /
1900 MHz (PCS) / 2100 MHz (AWS)
Frequency Bands 700 MHz /
1900 MHz (PCS) / 2100 MHz (AWS)
Frequency Bands 700 MHz /
1900 MHz (PCS) / 2100 MHz (AWS)
Channel Count 9 Channel Count 9 Channel Count 9 Total TX Power(W): 330 Total TX Power(W): 330 Total TX Power(W): 330
ERP (W): 6,466.23 ERP (W): 6,466.23 ERP (W): 6,466.23 Antenna A1 MPE% 2.50 Antenna B1 MPE% 2.50 Antenna C1 MPE% 2.50
T-Mobile Sector A Total: 2.50 % T-Mobile Sector B Total: 2.50 % T-Mobile Sector C Total: 2.50 %
Site Total: 2.50 %
Site Composite MPE% Carrier MPE%
T-Mobile (Per Sector Max) 2.50 % No Additional Carriers Per
CSC Active Database NA
Site Total MPE %: 2.50 %
T-Mobile _per sector #
Channels Watts ERP
(Per Channel) Height (feet)
Total Power Density
(W/cm2) Frequency (MHz)
Allowable MPE
(W/cm2)
Calculated % MPE
T-Mobile AWS - 2100 MHz LTE 2 1,227.87 105 9.01 AWS - 2100 MHz 1000 0.90%
T-Mobile AWS - 2100 MHz UMTS 2 613.93 105 4.50 AWS - 2100 MHz 1000 0.45%
T-Mobile PCS - 1950 MHz UMTS 2 619.61 105 4.55 PCS - 1950 MHz 1000 0.45%
T-Mobile PCS - 1950 MHz GSM 2 619.61 105 4.55 PCS - 1950 MHz 1000 0.45%
T-Mobile 700 MHz LTE 1 304.17 105 1.12 700 MHz 467 0.24%
Total: 2.50%

EBI Consulting environmental | engineering | due diligence
21 B Street . Burlington, MA 01803 . Tel: (781) 273.2500 . Fax: (781) 273.3311
Summary
All calculations performed for this analysis yielded results that were within the allowable limits for general public exposure to RF Emissions.
The anticipated maximum composite contributions from the T-Mobile facility as well as the site composite emissions value with regards to compliance with FCC’s allowable limits for general public exposure to RF Emissions are shown here:
T-Mobile Sector Power Density Value (%) Sector A: 2.50 % Sector B: 2.50 % Sector C: 2.50 %
T-Mobile Per Sector Maximum:
2.50 %
Site Total: 2.50 %
Site Compliance Status: COMPLIANT
The anticipated composite MPE value for this site assuming all carriers present is 2.50% of the allowable FCC established general public limit sampled at the ground level. This is based upon values listed in the Connecticut Siting Council database for existing carrier emissions.
FCC guidelines state that if a site is found to be out of compliance (over allowable thresholds), that carriers over a 5% contribution to the composite value will require measures to bring the site into compliance. For this facility, the composite values calculated were well within the allowable 100% threshold standard per the federal government.