
November 2017 Real Estate Update from Referred Realty Group, The Woodlands, TX
10
REAL ESTATE UPDATE The Woodlands NOVEMBER 2017 brought to you by: www.ReferredRealtyTX.com
-
Upload
referred-realty-group -
Category
Real Estate
-
view
48 -
download
2
Transcript of November 2017 Real Estate Update from Referred Realty Group, The Woodlands, TX

REAL ESTATEUPDATE
The Woodlands
NOVEMBER 2017
brought to you by:
www.ReferredRealtyTX.com
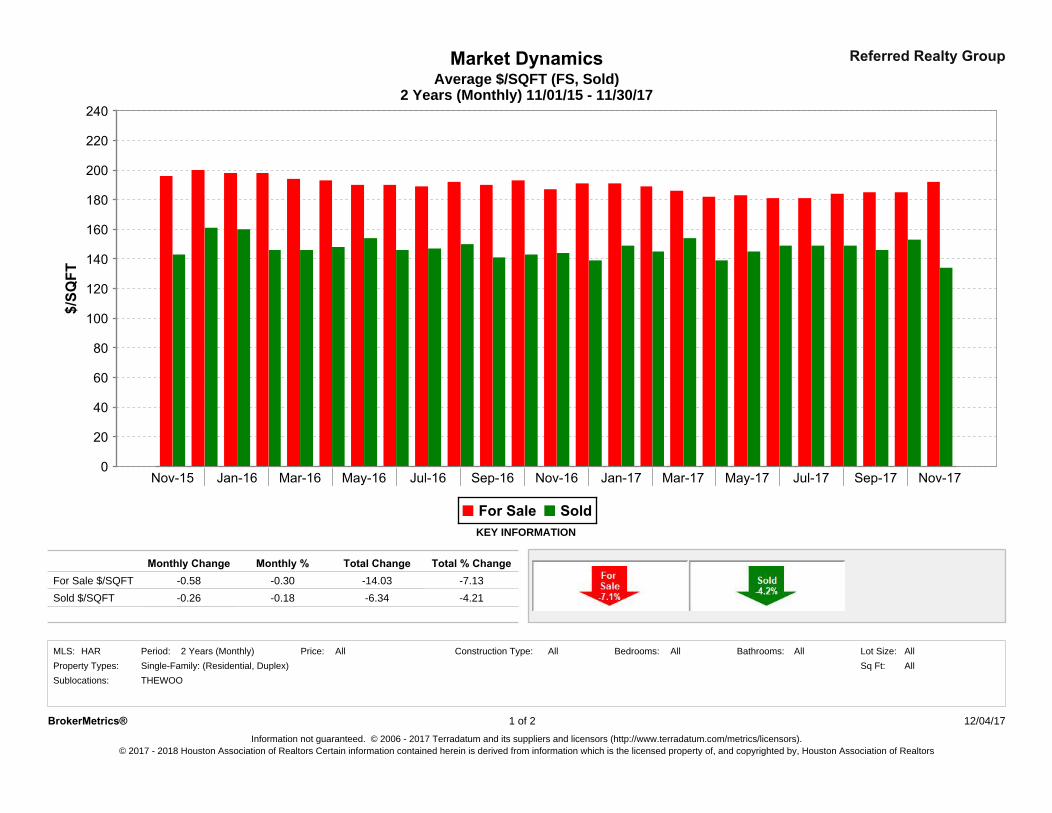
Market DynamicsAverage $/SQFT (FS, Sold)
2 Years (Monthly) 11/01/15 - 11/30/17
Referred Realty Group
Price:
-0.30
AllAll All
-0.18-14.03
Property Types:HAR
Sold $/SQFTFor Sale $/SQFT
MLS: All
-0.26
Bathrooms:
-0.58
All
-4.21-6.34
Construction Type:
Total Change
Sq Ft:
Monthly Change
2 Years (Monthly)
Sublocations:
All
-7.13
Lot Size:Period:
Monthly %
Bedrooms:
KEY INFORMATION
Total % Change
Single-Family: (Residential, Duplex)THEWOO
12/04/17BrokerMetrics®Information not guaranteed. © 2006 - 2017 Terradatum and its suppliers and licensors (http://www.terradatum.com/metrics/licensors).
© 2017 - 2018 Houston Association of Realtors Certain information contained herein is derived from information which is the licensed property of, and copyrighted by, Houston Association of Realtors
1 of 2
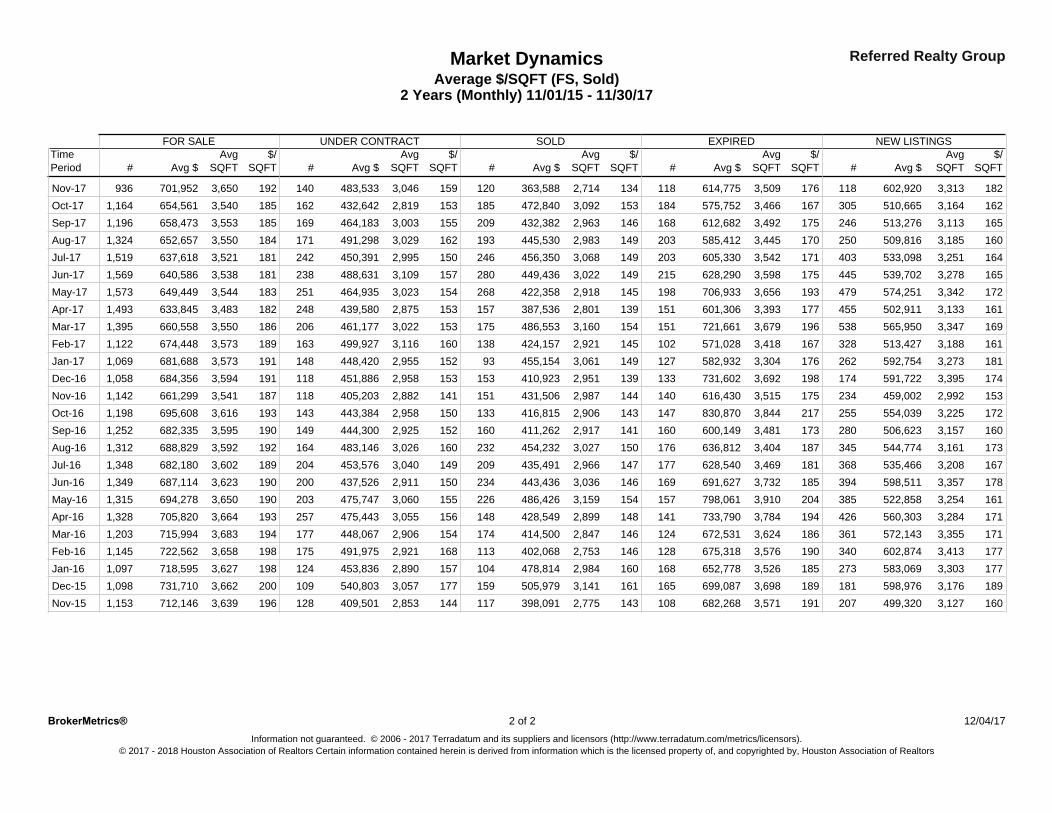
Average $/SQFT (FS, Sold)2 Years (Monthly) 11/01/15 - 11/30/17
Market Dynamics Referred Realty Group
#
FOR SALE
SQFTPeriod$/Avg
SQFTTime
Avg $
UNDER CONTRACT
# Avg $Avg
SQFT$/
SQFT
SOLD EXPIRED NEW LISTINGS
# # #Avg $ Avg $ Avg $Avg
SQFT$/
SQFTAvg
SQFT$/
SQFTAvg
SQFT$/
SQFT
192Nov-17 936 3,650701,952 140 483,533 3,046 159 120 118 118363,588 614,775 602,9202,714 134 3,509 176 3,313 182185Oct-17 1,164 3,540654,561 162 432,642 2,819 153 185 184 305472,840 575,752 510,6653,092 153 3,466 167 3,164 162185Sep-17 1,196 3,553658,473 169 464,183 3,003 155 209 168 246432,382 612,682 513,2762,963 146 3,492 175 3,113 165184Aug-17 1,324 3,550652,657 171 491,298 3,029 162 193 203 250445,530 585,412 509,8162,983 149 3,445 170 3,185 160181Jul-17 1,519 3,521637,618 242 450,391 2,995 150 246 203 403456,350 605,330 533,0983,068 149 3,542 171 3,251 164181Jun-17 1,569 3,538640,586 238 488,631 3,109 157 280 215 445449,436 628,290 539,7023,022 149 3,598 175 3,278 165183May-17 1,573 3,544649,449 251 464,935 3,023 154 268 198 479422,358 706,933 574,2512,918 145 3,656 193 3,342 172182Apr-17 1,493 3,483633,845 248 439,580 2,875 153 157 151 455387,536 601,306 502,9112,801 139 3,393 177 3,133 161186Mar-17 1,395 3,550660,558 206 461,177 3,022 153 175 151 538486,553 721,661 565,9503,160 154 3,679 196 3,347 169189Feb-17 1,122 3,573674,448 163 499,927 3,116 160 138 102 328424,157 571,028 513,4272,921 145 3,418 167 3,188 161191Jan-17 1,069 3,573681,688 148 448,420 2,955 152 93 127 262455,154 582,932 592,7543,061 149 3,304 176 3,273 181191Dec-16 1,058 3,594684,356 118 451,886 2,958 153 153 133 174410,923 731,602 591,7222,951 139 3,692 198 3,395 174187Nov-16 1,142 3,541661,299 118 405,203 2,882 141 151 140 234431,506 616,430 459,0022,987 144 3,515 175 2,992 153193Oct-16 1,198 3,616695,608 143 443,384 2,958 150 133 147 255416,815 830,870 554,0392,906 143 3,844 217 3,225 172190Sep-16 1,252 3,595682,335 149 444,300 2,925 152 160 160 280411,262 600,149 506,6232,917 141 3,481 173 3,157 160192Aug-16 1,312 3,592688,829 164 483,146 3,026 160 232 176 345454,232 636,812 544,7743,027 150 3,404 187 3,161 173189Jul-16 1,348 3,602682,180 204 453,576 3,040 149 209 177 368435,491 628,540 535,4662,966 147 3,469 181 3,208 167190Jun-16 1,349 3,623687,114 200 437,526 2,911 150 234 169 394443,436 691,627 598,5113,036 146 3,732 185 3,357 178190May-16 1,315 3,650694,278 203 475,747 3,060 155 226 157 385486,426 798,061 522,8583,159 154 3,910 204 3,254 161193Apr-16 1,328 3,664705,820 257 475,443 3,055 156 148 141 426428,549 733,790 560,3032,899 148 3,784 194 3,284 171194Mar-16 1,203 3,683715,994 177 448,067 2,906 154 174 124 361414,500 672,531 572,1432,847 146 3,624 186 3,355 171198Feb-16 1,145 3,658722,562 175 491,975 2,921 168 113 128 340402,068 675,318 602,8742,753 146 3,576 190 3,413 177198Jan-16 1,097 3,627718,595 124 453,836 2,890 157 104 168 273478,814 652,778 583,0692,984 160 3,526 185 3,303 177200Dec-15 1,098 3,662731,710 109 540,803 3,057 177 159 165 181505,979 699,087 598,9763,141 161 3,698 189 3,176 189196Nov-15 1,153 3,639712,146 128 409,501 2,853 144 117 108 207398,091 682,268 499,3202,775 143 3,571 191 3,127 160
© 2017 - 2018 Houston Association of Realtors Certain information contained herein is derived from information which is the licensed property of, and copyrighted by, Houston Association of Realtors
2 12/04/172 ofBrokerMetrics®Information not guaranteed. © 2006 - 2017 Terradatum and its suppliers and licensors (http://www.terradatum.com/metrics/licensors).
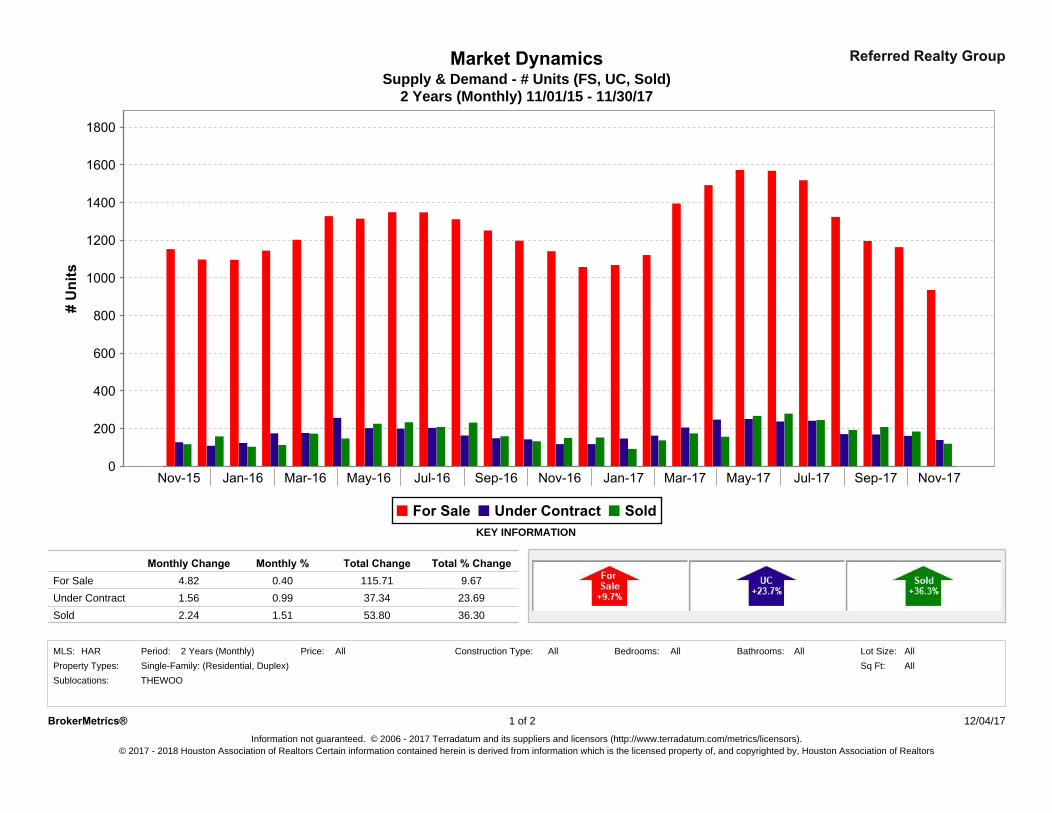
Market DynamicsSupply & Demand - # Units (FS, UC, Sold)
2 Years (Monthly) 11/01/15 - 11/30/17
Referred Realty Group
Price:
0.40
AllAll All
0.99115.71
Property Types:HAR
Under Contract2.24
For Sale
MLS: All
1.56
Bathrooms:
1.51
4.82
Sold
All
23.6937.34
Construction Type:
Total Change
Sq Ft:
Monthly Change
2 Years (Monthly)
Sublocations:
All
9.67
Lot Size:Period:
36.30
Monthly %
Bedrooms:
KEY INFORMATION
Total % Change
53.80
Single-Family: (Residential, Duplex)THEWOO
Information not guaranteed. © 2006 - 2017 Terradatum and its suppliers and licensors (http://www.terradatum.com/metrics/licensors).© 2017 - 2018 Houston Association of Realtors Certain information contained herein is derived from information which is the licensed property of, and copyrighted by, Houston Association of Realtors
1 ofBrokerMetrics® 2 12/04/17
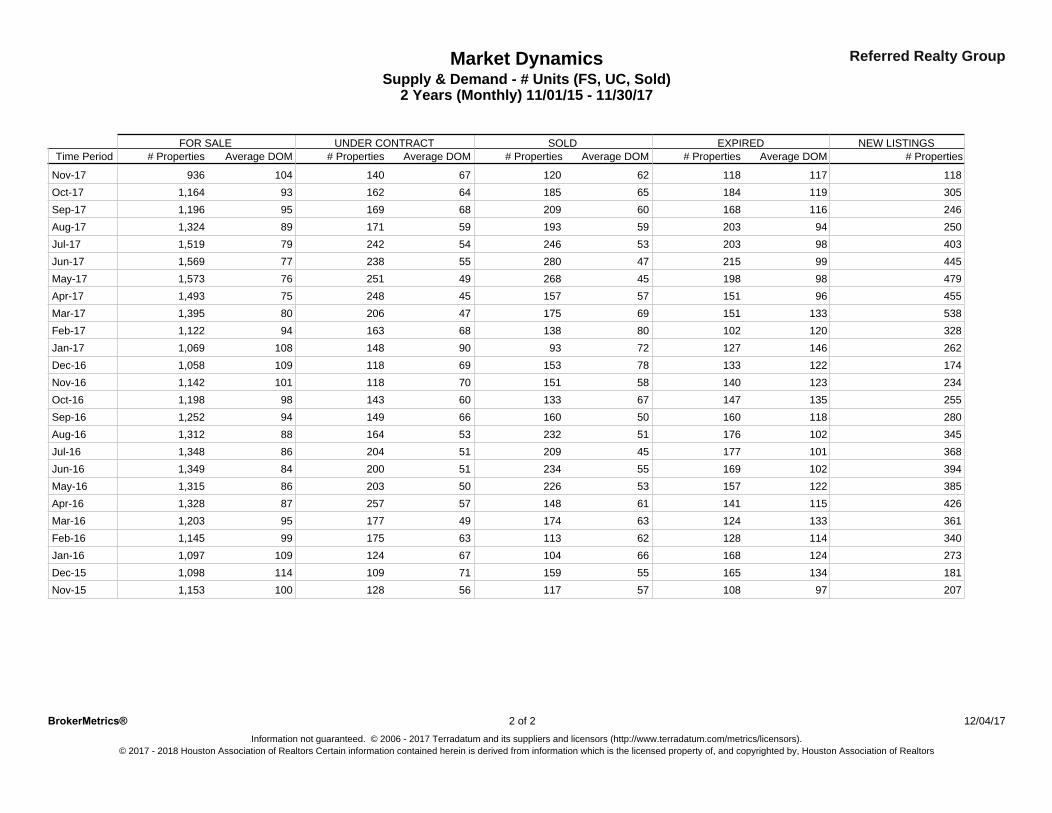
Supply & Demand - # Units (FS, UC, Sold)2 Years (Monthly) 11/01/15 - 11/30/17
Market Dynamics Referred Realty Group
# Properties # PropertiesAverage DOM# PropertiesSOLD
# PropertiesFOR SALE
Average DOM Average DOMUNDER CONTRACT
Average DOMNEW LISTINGS
# PropertiesEXPIRED
Time Period
104 118Nov-17 11762 11867 12014093693 305Oct-17 11965 18464 1851621,16495 246Sep-17 11660 16868 2091691,19689 250Aug-17 9459 20359 1931711,32479 403Jul-17 9853 20354 2462421,51977 445Jun-17 9947 21555 2802381,56976 479May-17 9845 19849 2682511,57375 455Apr-17 9657 15145 1572481,49380 538Mar-17 13369 15147 1752061,39594 328Feb-17 12080 10268 1381631,122
108 262Jan-17 14672 12790 931481,069109 174Dec-16 12278 13369 1531181,058101 234Nov-16 12358 14070 1511181,142
98 255Oct-16 13567 14760 1331431,19894 280Sep-16 11850 16066 1601491,25288 345Aug-16 10251 17653 2321641,31286 368Jul-16 10145 17751 2092041,34884 394Jun-16 10255 16951 2342001,34986 385May-16 12253 15750 2262031,31587 426Apr-16 11561 14157 1482571,32895 361Mar-16 13363 12449 1741771,20399 340Feb-16 11462 12863 1131751,145
109 273Jan-16 12466 16867 1041241,097114 181Dec-15 13455 16571 1591091,098100 207Nov-15 9757 10856 1171281,153
12/04/17 2Information not guaranteed. © 2006 - 2017 Terradatum and its suppliers and licensors (http://www.terradatum.com/metrics/licensors).
2 ofBrokerMetrics®
© 2017 - 2018 Houston Association of Realtors Certain information contained herein is derived from information which is the licensed property of, and copyrighted by, Houston Association of Realtors
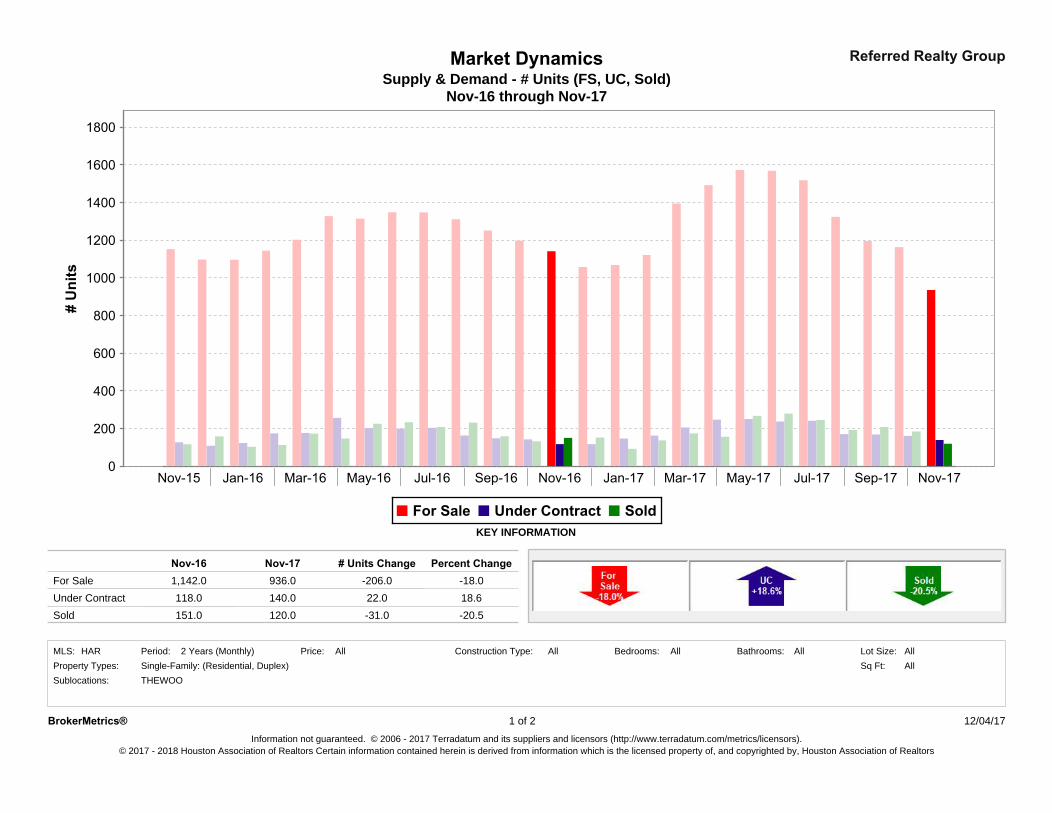
Market DynamicsSupply & Demand - # Units (FS, UC, Sold)
Nov-16 through Nov-17
Referred Realty Group
Price:
936.0
AllAll All
140.0-206.0
Property Types:HAR
Under Contract151.0
For Sale
MLS: All
118.0
Bathrooms:
120.0
1,142.0
Sold
All
18.622.0
Construction Type:
# Units Change
Sq Ft:
Nov-16
2 Years (Monthly)
Sublocations:
All
-18.0
Lot Size:Period:
-20.5
Nov-17
Bedrooms:
KEY INFORMATION
Percent Change
-31.0
Single-Family: (Residential, Duplex)THEWOO
Information not guaranteed. © 2006 - 2017 Terradatum and its suppliers and licensors (http://www.terradatum.com/metrics/licensors).© 2017 - 2018 Houston Association of Realtors Certain information contained herein is derived from information which is the licensed property of, and copyrighted by, Houston Association of Realtors
1 ofBrokerMetrics® 2 12/04/17
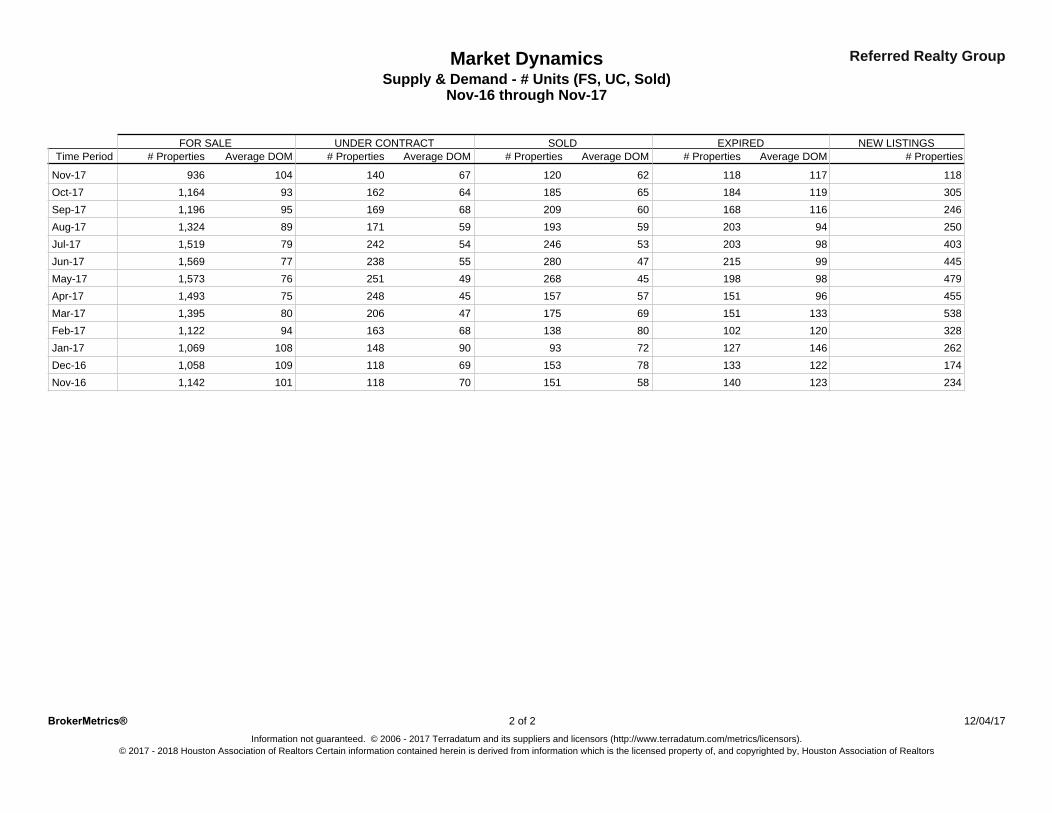
Supply & Demand - # Units (FS, UC, Sold)Nov-16 through Nov-17
Market Dynamics Referred Realty Group
# Properties # PropertiesAverage DOM# PropertiesSOLD
# PropertiesFOR SALE
Average DOM Average DOMUNDER CONTRACT
Average DOMNEW LISTINGS
# PropertiesEXPIRED
Time Period
104 118Nov-17 11762 11867 12014093693 305Oct-17 11965 18464 1851621,16495 246Sep-17 11660 16868 2091691,19689 250Aug-17 9459 20359 1931711,32479 403Jul-17 9853 20354 2462421,51977 445Jun-17 9947 21555 2802381,56976 479May-17 9845 19849 2682511,57375 455Apr-17 9657 15145 1572481,49380 538Mar-17 13369 15147 1752061,39594 328Feb-17 12080 10268 1381631,122
108 262Jan-17 14672 12790 931481,069109 174Dec-16 12278 13369 1531181,058101 234Nov-16 12358 14070 1511181,142
12/04/17 2Information not guaranteed. © 2006 - 2017 Terradatum and its suppliers and licensors (http://www.terradatum.com/metrics/licensors).
2 ofBrokerMetrics®
© 2017 - 2018 Houston Association of Realtors Certain information contained herein is derived from information which is the licensed property of, and copyrighted by, Houston Association of Realtors
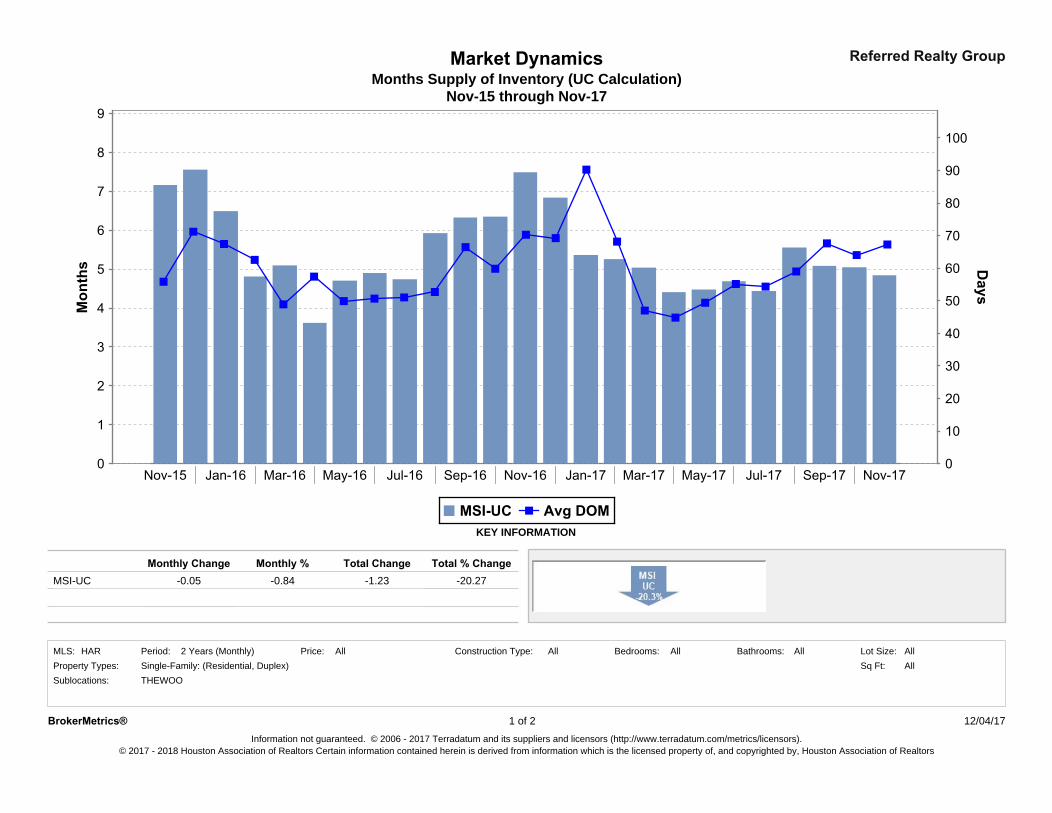
Months Supply of Inventory (UC Calculation)Market Dynamics
Nov-15 through Nov-17
Referred Realty Group
Sublocations:
-20.27
Price:HAR Bedrooms:Period:
Monthly %MSI-UC
2 Years (Monthly)
THEWOO
-0.84
Single-Family: (Residential, Duplex)
Total % Change
Property Types:
KEY INFORMATION
AllAll Lot Size:All
-1.23Monthly Change
-0.05Total Change
Sq Ft:AllAll Bathrooms:MLS: AllConstruction Type:
Information not guaranteed. © 2006 - 2017 Terradatum and its suppliers and licensors (http://www.terradatum.com/metrics/licensors).
BrokerMetrics® 1 of 2
© 2017 - 2018 Houston Association of Realtors Certain information contained herein is derived from information which is the licensed property of, and copyrighted by, Houston Association of Realtors
12/04/17
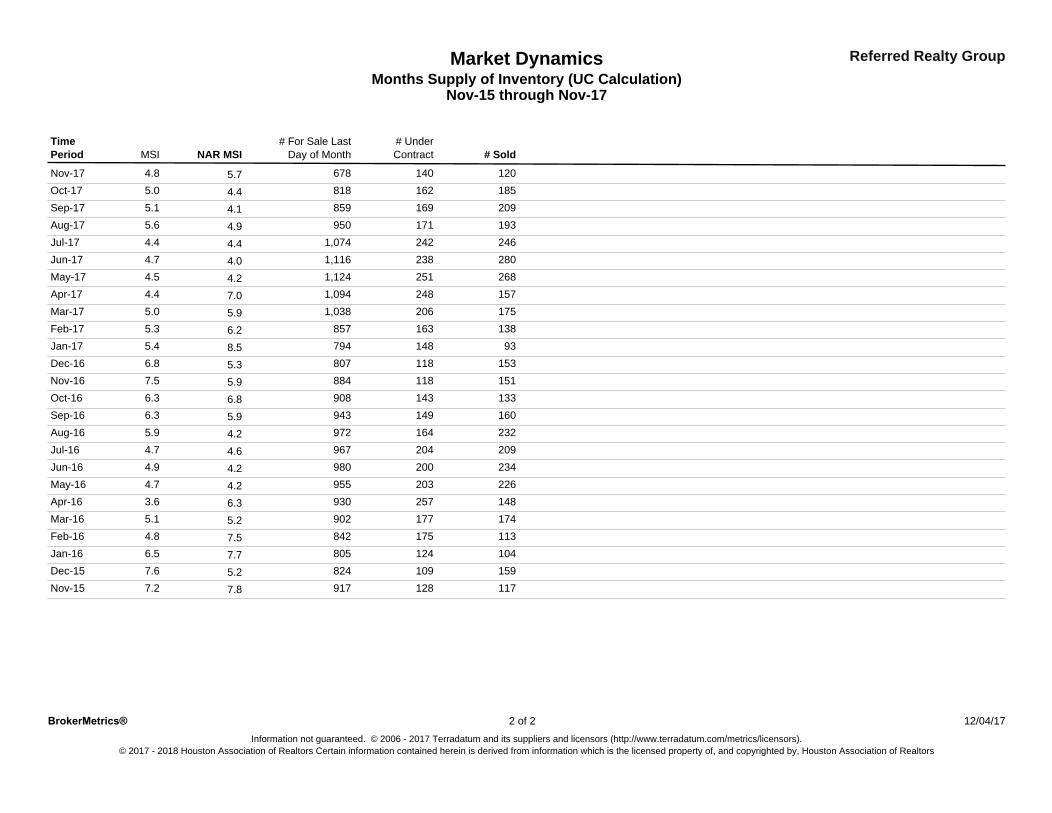
Referred Realty GroupMarket DynamicsMonths Supply of Inventory (UC Calculation)
Nov-15 through Nov-17
Period NAR MSI # SoldMSI# For Sale Last
Day of Month# UnderContract
Time
5.7Nov-17 140 1206784.8
4.4Oct-17 162 1858185.0
4.1Sep-17 169 2098595.1
4.9Aug-17 171 1939505.6
4.4Jul-17 242 2461,0744.4
4.0Jun-17 238 2801,1164.7
4.2May-17 251 2681,1244.5
7.0Apr-17 248 1571,0944.4
5.9Mar-17 206 1751,0385.0
6.2Feb-17 163 1388575.3
8.5Jan-17 148 937945.4
5.3Dec-16 118 1538076.8
5.9Nov-16 118 1518847.5
6.8Oct-16 143 1339086.3
5.9Sep-16 149 1609436.3
4.2Aug-16 164 2329725.9
4.6Jul-16 204 2099674.7
4.2Jun-16 200 2349804.9
4.2May-16 203 2269554.7
6.3Apr-16 257 1489303.6
5.2Mar-16 177 1749025.1
7.5Feb-16 175 1138424.8
7.7Jan-16 124 1048056.5
5.2Dec-15 109 1598247.6
7.8Nov-15 128 1179177.2
2
© 2017 - 2018 Houston Association of Realtors Certain information contained herein is derived from information which is the licensed property of, and copyrighted by, Houston Association of Realtors
12/04/17Information not guaranteed. © 2006 - 2017 Terradatum and its suppliers and licensors (http://www.terradatum.com/metrics/licensors).
BrokerMetrics® 2 of
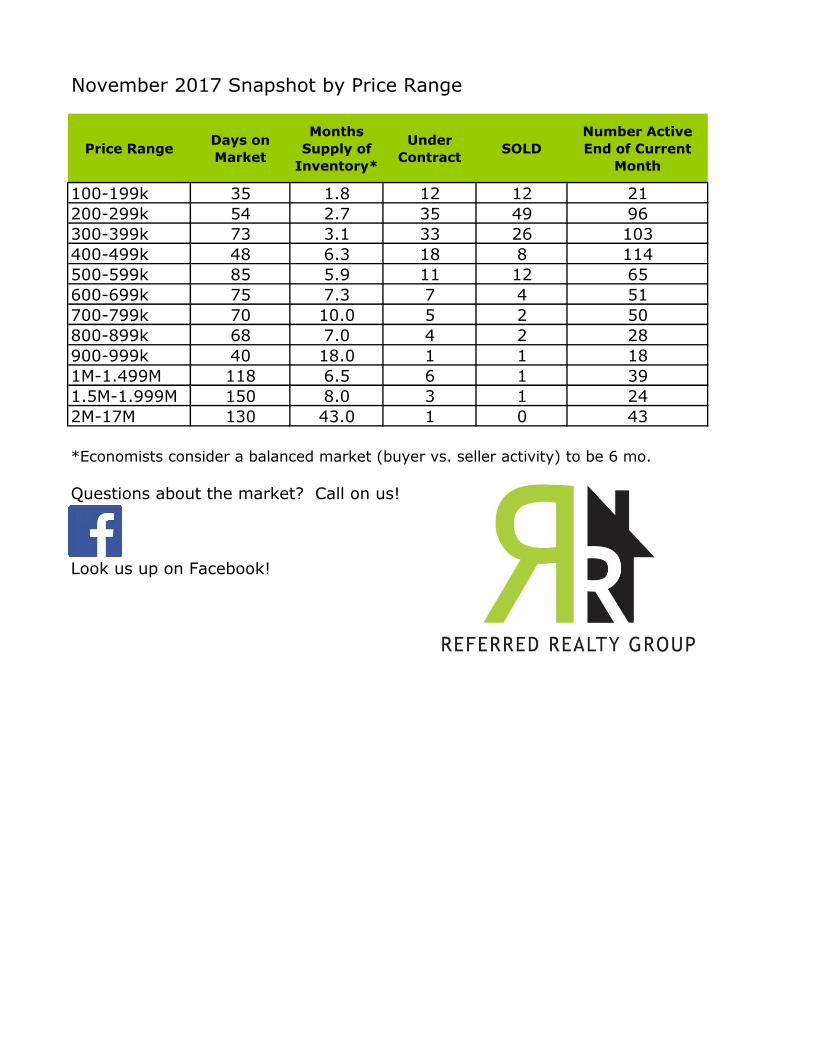
November 2017 Snapshot by Price Range
Price RangeDays on
Market
Months
Supply of
Inventory*
Under
ContractSOLD
Number Active
End of Current
Month
100-199k 35 1.8 12 12 21
200-299k 54 2.7 35 49 96
300-399k 73 3.1 33 26 103
400-499k 48 6.3 18 8 114
500-599k 85 5.9 11 12 65
600-699k 75 7.3 7 4 51
700-799k 70 10.0 5 2 50
800-899k 68 7.0 4 2 28
900-999k 40 18.0 1 1 18
1M-1.499M 118 6.5 6 1 39
1.5M-1.999M 150 8.0 3 1 24
2M-17M 130 43.0 1 0 43
*Economists consider a balanced market (buyer vs. seller activity) to be 6 mo.
Questions about the market? Call on us!
Look us up on Facebook!