November 2008 - CSLS
73
November 2008 CENTRE FOR THE STUDY OF LIVING STANDARDS THE VALUATION OF THE ALBERTA OIL SANDS CSLS Research Report No. 2008-7 Andrew Sharpe, Jean-Francois Arsenault, Alexander Murray and Sharon Qiao 111 Sparks Street, Suite 500 Ottawa, Ontario K1P 5B5 613-233-8891, Fax 613-233-8250 [email protected]
Transcript of November 2008 - CSLS

1
November 2008
CENTRE FOR
THE STUDY OF
LIVING
STANDARDS
THE VALUATION OF THE ALBERTA OIL SANDS
CSLS Research Report No. 2008-7 Andrew Sharpe, Jean-Francois Arsenault, Alexander Murray and Sharon Qiao
111 Sparks Street, Suite 500 Ottawa, Ontario K1P 5B5
613-233-8891, Fax 613-233-8250 [email protected]
i
The Valuation of the Alberta Oil Sands Abstract
The Alberta oil sands reserves represent a very valuable energy resource for Canadians.
In 2007, Statistics Canada valued the oil sands at $342.1 billion, or 5 per cent Canada‟s total
tangible wealth of $6.9 trillion. Given the oil sands‟ importance, it is essential to value them
appropriately. In this report, we critically review the methods used by Statistics Canada in their
valuation of the Alberta oil sands. We find that the official Statistics Canada estimates of the
reserves (22.0 billion barrels) of Alberta‟s oil sands are very small compared to those obtained
using more appropriate definitions, which results in an underestimation of the true value of the
oil sands. Moreover, the failure to take into account the projected growth of the industry
significantly magnifies this underestimation.
We provide new estimates of the present value of oil sands reserves based on a set of
alternative assumptions that are, we argue, more appropriate than those used by Statistic Canada.
We find that the use of more reasonable measures of the total oil sands reserves (172.7 billion
barrels), extraction rate (a linear increase from 482 million barrels per year in 2007 to 1,350
million barrels in 2015, and constant thereafter) and price ($70 per barrel, 2007 CAD) increases
the estimated present value of the oil sands to $1,482.7 billion (2007 CAD), 4.3 times larger than
the official estimate of $342.1 billion. Using our preferred estimate, Canada‟s total tangible
wealth increases by $1.1 trillion (17 per cent), and reaches $8.0 trillion with oil sands now
accounting for 18 per cent of Canada‟s tangible wealth. The importance of these revisions is also
demonstrated by their impact on the per-capita wealth of Canadians, which increases from
$209,359 to $243,950, or by $34,591 (or 17 per cent). Given the importance of the oil sands for
Canada, Statistics Canada should undertake a review of its methodology.
In light of the growing body of climatologic literature supporting an association between
anthropogenic GHG emissions and global climate change, no analysis of the „true value‟ of the
oil sands would be complete without an accounting of the social costs of the GHG emissions that
arise from oil sands development. According to our baseline estimates, the oil sands impose a
total social cost related to GHG emissions of $69.4 billion. In making this estimate, we assume
that each barrel of oil sands output imposes a social cost of $2.25 (based on a cost of $30/tCO2-e
and an intensity of 0.075 tCO2-e/bbl). Our preferred estimate of the net present value of oil sands
wealth net of GHG cost is thus $1,413.3 billion, 4.1 times greater than the Statistics Canada
estimate which does not account for any environmental costs. This report does not account for
non-GHG related environmental and social costs. A comprehensive valuation of all
environmental costs are needed to assess whether future benefits derived from oil sands
development are outweighed by even larger environmental costs.

ii
The Valuation of Alberta’s Oil Sands
Table of Contents
Abstract ............................................................................................................................................ i Executive Summary ....................................................................................................................... iii
List of Tables and Figures............................................................................................................... x I. Introduction ................................................................................................................................. 1 II. Physical Estimates of the Oil Sands ........................................................................................... 3 III. The Valuation of the Oil Sands ................................................................................................. 6
A. The Methodology of Natural Resource Valuation ................................................................. 6 B. Statistics Canada‟s Valuation ................................................................................................. 8
i) Estimates .............................................................................................................................. 8
ii) A Closer Look at the Assumptions ................................................................................... 10 C. CSLS Valuation .................................................................................................................... 19
i) Oil sands Present Value ..................................................................................................... 19 ii) A Comparison With Statistics Canada .............................................................................. 21 iii) Impact on Wealth Estimates ............................................................................................ 21
IV. Additional Considerations: The Social Costs of Greenhouse Gas Emissions ........................ 23 A. Per-Tonne Social Cost of GHG Emissions .......................................................................... 23
B. Emissions and Emissions Intensity ....................................................................................... 25 C. Social Costs of the Oil Sands‟ GHG Emissions ................................................................... 29
D. Present Value of the Oil Sands Net of GHG Costs .............................................................. 30 V. Conclusion ............................................................................................................................... 33
Bibliography ................................................................................................................................. 35 Appendix Tables ........................................................................................................................... 42 Appendix 1: The Methodology of Social GHG Cost Estimation: A Brief Overview .................. 48
Appendix 2: Oil Sands Valuation with Lifecycle Emissions........................................................ 52 Appendix 3: List of Oil Sands Projects ........................................................................................ 55

iii
The Valuation of Alberta’s Oil Sands
Executive Summary
The coming-of-age of the oil sands has transformed the Canadian economic landscape.
With Canada now claiming the second largest oil reserves in the world, the importance of the oil
sands to the rest of the world and its potential impact on the lives of Canadians can not be
underestimated. In this context, valuing the oil sands appropriately is paramount to a vigorous
public debate about the future development of this resource.
According to the Alberta Energy Resource and Conservation Board (ERCB), Alberta
alone contains the second largest proven reserves of oil in the world. There are 173 billion
barrels of oil in the oil sands proven to be recoverable with today‟s technology and under current
economic conditions. However, Statistics Canada‟s most recent estimate of the value of the oil
sands resource takes account of only 22 billion barrels of the oil sands reserves. As a result, the
most recent official estimate of the total value of the Alberta oil sands – $342.1 billion in 2007 –
is a very conservative estimate. Nonetheless, oil sands accounted for about 5 per cent of
Canada‟s total tangible wealth which was estimated at $6.9 trillion.
This report has three principal objectives. The first is to critically review the official
Statistics Canada estimates of the value of the oil sands resource. We argue that their
methodology results in a significant undervaluation of the wealth represented by the oil sands. In
particular, a less conservative estimate of the total volume of economically viable oil sands
reserves and of the future rate of oil extraction would lead to a more reasonable estimate of the
total value of the resource.
In light of these claims, our second objective is to produce new estimates of the value of
the Alberta oil sands. We discuss the various assumptions embedded in the valuation
methodology (e.g. price of oil, production costs, discount rate, reserve life) and argue that our
assumptions are likely to provide a closer approximation of the true value of the oil sands.
Finally, the report‟s third objective is to take the analysis one step further by including
estimates of the social costs of environmental damages arising from the oil sands‟ greenhouse
gas (GHG) emissions. Climate change, caused by the emission of GHGs in the course of human
activity, has the potential to impose many social costs through its effects on weather patterns,
land value, ecological diversity, forestry, fisheries, political conflict, human and animal
migration, energy demands, and a host of other natural and social phenomena. These costs are
subtracted from the valuation of the oil sands to produce a more complete estimate of the „true
value‟ of the resource.
The Methodology and Assumptions
Statistics Canada uses the Net Present Value Method (NPVM) to estimate the value of
the oil sands. The NPVM involves measuring the value of the resource as a stream of present and
future resource rents. The essence of the method is as follows: one estimates the annual resource

iv
rent generated by oil sands development, then sums the annual rents over the entire lifetime of
the resource stock, giving less weight to the rents of years further into the future. Clearly, this
requires assumptions about future economic conditions and the time profile of extraction.
Statistics Canada assumes that economic factors relevant to the oil sands sector – revenues minus
costs and annual extraction rates – remain constant.
Reserves
According to the ERCB, the oil sands contain 1.7 trillion barrels of oil and an ultimate
potential of 315 recoverable billion barrels. Of these 315 billion barrels, 173 billion are currently
labeled as remaining established reserves, and 22 billion are currently under development. In its
measurement of Canada‟s natural resources, Statistics Canada restricts measurement to resources
under development. Yet, most countries use proven reserves to value natural resources in their
System of National Accounts, whether those reserves are under development or not. Thus, in
comparison with other countries, Canada‟s natural resource base is underestimated.
Discount Rate
Statistics Canada uses a real discount rate of four per cent to calculate the present value
of the Alberta oil sands reserves. This rate approximates average interest rates and is almost
universal in natural resource valuation. From a resource assessment perspective, there is nothing
unreasonable about this, and we adopt a 4 per cent discount rate in our base-case analysis. Given
the extent to which discount rates affect valuation – for example the present value of $100
received in 100 years is seven times greater under a 2 per cent discount rate ($13.80) than under
a 4 per cent discount rate ($1.98) – we also present oil sands present value estimates using
discount rates of five per cent, two per cent, and zero.
Extraction Rate
Statistics Canada assumes that in all future years, the annual extraction rate will be equal
to the level of extraction in the current year. In 2007, the base year for our analysis, the
extraction level was 482 million barrels; thus, Statistics Canada assumes a constant extraction
rate of 482 million barrels per year.
The assumption that the annual extraction rate will remain constant in the future is not
justified. The oil sands industry has experienced dramatic growth in recent years. Over the
2000-2007 period oil sands‟ output grew at a compound annual growth rate of 10.0 per cent, and
strong positive output growth is expected to continue into the foreseeable future as new projects
are completed. Based on an evaluation of projects that are under construction or that have been
announced, the National Energy Board (NEB, 2006) estimates that oil sands output will be
between 3.0 and 4.5 million barrels per day (1.1 and 1.6 billion barrels per year) by 2015. These
projects were announced and planned well before 2008, and do not depend on the recent rise in
oil prices to be profitable.
Assuming a constant extraction rate implies that production will occur farther in the
future, at periods when it is severely discounted. Statistics Canada, by failing to internalize

v
available information about the rapid future growth of the industry, thus significantly
underestimates the value of the resource.
In keeping with our approach in this report, we adopt several alternative estimates of the
annual extraction rate. For the base case scenario, we assume that the extraction rate in 2015 and
beyond will be stable at 1.35 billion barrels per year, the mid-point of NEB (2006) estimates for
2015. For the period between 2007 and 2015, we assume that the extraction rate increases
linearly from 482 million barrels in 2007 to 1.35 billion barrels in 2015. This assumption
translates into a total reserve life of 130 years for Canada‟s oil sands‟ reserves of 172.7 billion
barrels. For the lower bound, we adopt a reserve life of 400 years and for the upper bound we
adopt a reserve life of 46 years.
Resource Rent
Statistics Canada does not explicitly use of per-barrel prices in its resource valuation
procedure. Instead, they use industry survey data to measure industry-wide revenues, operating
costs, and capital costs (equivalent to depreciation). In 2007, the implicit price derived from
these data was $56 per barrel of output from the oil sands, and the per-barrel extraction cost was
$21.9.
Crude oil prices have exhibited an upward trend since 2003, and particularly since the
beginning of 2008, although they have fallen sharply since August 2008. The US-based Energy
Information Administration projects that the real price of crude oil based on West Texas
Intermediate (WTI) will fall to about USD $60/bbl by 2020 before rising to USD $70/bbl by
2030 (in 2006 USD). Meanwhile, Stevens (2008) argues that inadequate investment by oil firms
has laid the foundation for USD $200/bbl oil prices in the next five years. Given the volatility of
oil prices and the wide range of estimates, using current output prices as Statistics Canada
currently does may well be the most appropriate assumption going forward.
We evaluate three different price scenarios in our valuation of Alberta‟s oil sands. We
take the view that the best estimate of future oil prices lays between the most optimistic and most
pessimistic estimate. To at least partly reflect the recent increase in price, we adopt an estimate in
line with prices over the last twenty months. On this basis, our preferred estimate for oil sands‟
output (a mix of crude bitumen and synthetic crude) is $70/bbl (in 2007 CAD). This corresponds
to a WTI price of $75/bbl (in 2008 USD), based on a US/Canada purchasing power parity rate of
1.209 in 2007 and the historical price differential between lower quality oil sands‟ output and
WTI. As a lower-bound we choose $56/bbl for oil sands output, the implicit price derived from
Statistics Canada 2007 valuation of the oil sands. This corresponds roughly to a WTI price of
$60/bbl in 2008 USD. For our upper-bound estimate, we assume that the WTI price rises to
$120/bbl in 2008 USD. The corresponding oil sands‟ output price in 2007 CAD is $114/bbl,
which we round down to $110.00/bbl.
Extraction costs mainly include capital and maintenance costs, the costs of input
materials such as steel and natural gas, and labour costs. In line with Statistics Canada‟s
methodology, we assume a zero return to capital in the oil sands valuation. Based on Statistics
Canada‟s official estimates, extraction costs had increased to $21.9 per barrel in 2007, up from

vi
$19.0 in 2005. Trends in extraction costs are difficult to predict. Not only do they vary with the
price of natural gas, materials and labour (all of which depend in part on the pace of
development), but they are also fundamentally affected by long-term technological progress. In
fact, we have no firm basis upon which to predict the future path of per-barrel extraction costs.
Thus, we assume that they remain constant at the 2007 level of $21.9 per barrel (2007 CAD)
implicit in Statistics Canada valuation, an estimate which already embodies recent increases in
costs. In conjunction with our three oil price estimates, this yields three different assumptions
about the resource rent of oil sands output.
Re-estimating the Value of the Oil Sands
A review of Statistics Canada methodology and assumptions has revealed a number of
shortcomings. To estimate the impact of these shortcomings on official estimates, this report
calculates the present value of oil sands reserves given the 172.7 billion barrels estimate, and
provides several estimates based on different assumptions about the discount rate, the extraction
rate and the resource rent. The key findings are highlighted below:
The use of more reasonable measures of the total oil sands reserves (172.7 billion
barrels), extraction rate (a linear increase from 482 million barrels per year in 2007 to
1,350 million barrels in 2015, and constant thereafter) and price ($70 per barrel, 2007
CAD) increases the estimated present value of the oil sands to $1,482.7 billion (2007
CAD), 4.3 times larger than the official estimate of $342.1 billion.
Of the difference between our preferred estimate and Statistics Canada estimate, roughly
19 per cent is attributable to the choice of a wider reserve definition, about 38 per cent
follows from assuming a slightly higher price for oil sands output, and 43 per cent is due
to the adoption of a more realistic future extraction rate. The time profile of extraction is
particularly important – the present value of a barrel of oil extracted in 100 years is worth
only 2 per cent that of a barrel extracted today.
According to official estimates, total tangible wealth in Canada in 2007 was $6.9 trillion.
Using our preferred estimate, total tangible wealth increases to $8.0 trillion, with oil
sands accounting for 18 per cent of Canada‟s tangible wealth. Using our baseline
estimate, oil sands‟ wealth is almost as important as wealth derived from land and is
almost 7 times as important as wealth from all minerals. The oil sands are valued at
almost the same level as residential structures and account in 2007 for 3.5 times more
wealth than Canada‟s capital stock in machinery and equipment.
The importance of these revisions is demonstrated by their impact on the measured
wealth of Canadians and Albertans. The per-capita wealth of Canadians increases from
$209,359 to $243,950, or by $34,591 (or 16.5 per cent), while the per-capita wealth of
Albertans increases from $264,976 to $593,318, or by $328,342 (123.9 per cent).

vii
Taking Into Account the Social Cost of Greenhouse Gas Emissions
Until now, the focus of this report has been on measuring the total rent of the oil sands in
present-value terms. In taking this approach, we have ignored important non-market costs
associated with the development of the oil sands resources. Of particular concern are the social
costs associated with the emission of greenhouse gases (GHGs) during the extraction and early-
stage upgrading of the bitumen. In light of the growing body of climatologic literature supporting
an association between anthropogenic GHG emissions and global climate change, no analysis of
the „true value‟ of the oil sands would be complete without an accounting of the social costs of
the GHG emissions that arise from oil sands development.
Social Cost of Carbon
Estimates of the social cost of carbon (SCC) appear frequently in the literature. The
estimation procedures are complex and depend on a set of key assumptions and methodological
judgments. In this report, we do not make an original contribution to the literature on SCC
estimation; we take the literature as-is and select a set of estimates that reasonably encompasses
the range of estimates found in the literature.
Tol (2007) evaluates 211 estimates of the SCC. The simple averages for the full sample
and for the subsample of peer-reviewed studies are $52.05/tCO2-e and $29.10/tCO2-e,
respectively (2007 CAD). Tol notes that the well publicized estimate from Stern et al. (2006),
which stands at $105.53/tCO2-e (2007 CAD), appears in the top ten percent of all 211 estimates
considered. In previous work pertaining to the costs of environmental deterioration, the CSLS
(Osberg and Sharpe [2002, 2005]) has used the Fankhauser (1994) estimate of $8.76/tCO2-e for
emissions between 1991 and 2000. In light of the more recent literature, this estimate appears to
be conservative
In line with our approach, we adopt three different estimates for the SCC. We maintain
the $8.76/tCO2-e figure as a lower bound, but add two more estimates: $30/tCO2-e and
$105/tCO2-e. These correspond, respectively, to the Tol (2007) mean of estimates from peer-
reviewed studies and to the Stern et al. (2006) estimate. They serve as „best guess‟ and upper
bound estimates in the analysis of the oil sands.
Estimating Future GHG Emissions
Although climate change is increasingly prominent in the public consciousness and in the
Canadian policy debate, publicly-available scientific estimates of future GHG emissions from the
oil sands production are limited. The most recent high-quality estimates of which we are aware
are those of Footitt (2007). Footitt draws upon the database of the National Energy Board (NEB,
2006), which provides output projections for about 160 oil sands projects for each year until
2015. By categorizing the projects according to the type of extraction technology used, the
author estimates how much of the future output will be produced using each technology. These
estimates are then multiplied by technology-specific GHG intensity values and aggregated to
produce estimates of total GHG emissions in each year.

viii
Using these projections of upstream GHG emissions along with the NEB (2006)
projections of future oil sands output, we calculate that the average per-barrel emissions
intensities for each year between 2006 and 2015 ranges between 0.070 tCO2-e/bbl and 0.078
tCO2-e/bbl. The values do not decline over time, reflecting the fact that although technological
progress will improve the efficiency of particular technologies, the overall mix of extraction
technologies across oil sands developments will shift to more energy-intensive technologies. As
our estimates of the per-barrel upstream emissions intensities of oil sands output, we take the
simple averages of the values between 2006 and 2015: 0.075 tCO2-e/bbl.
These figures account for only the so-called upstream emissions from the oil sands; that
is, the emissions arising from the actual extraction, transportation, and early-stage upgrading of
the raw bitumen in the production of crude oil. Downstream emissions include all emissions
from the subsequent transportation and refinement of oil sands output through to the final
burning of fuel by consumers, the latter accounting for the lion‟s share of downstream emissions.
In an ideal valuation of the oil sands, both upstream and downstream costs and benefits would be
included. The downstream valuation of costs and benefits flowing from the oil sands, however,
encompasses significant uncertainties. Given the difficulties associated with valuing downstream
costs and benefits, this report focuses on the upstream valuation of the oil sands. For comparison
purposes we also provide estimates of oil sands wealth net of lifecycle GHG costs assuming no
downstream benefits. These can be viewed as lower-bound estimates of oil sands wealth.
Oil Sands Valuation Net of GHG Costs
According to our baseline estimate, the oil sands impose a total social cost related to
GHG emissions of $69.4 billion. In making this estimate, we assume that each barrel of oil sands
output imposes a social cost of $2.25 (based on a SCC of $30/tCO2-e and an intensity of 0.075
tCO2-e/bbl) and that damages are discounted at a rate of 4 per cent per year over a 130-year
reserve life. This total cost estimate is much less than our baseline estimate of the present value
of oil sands wealth, which was $1,482.7 billion. Our baseline estimate of the net present value of
oil sands wealth net of GHG cost is thus $1,413.3 billion, 4.1 times greater than the Statistics
Canada estimate which does not account for any environmental costs.
As explained earlier, focusing on upstream emissions allows for a more accurate, but
incomplete, comparison of costs and benefits related to oil sands developments. By providing
estimates for both upstream and lifecycle emissions, we can obtain a sense of the degree to
which the focus on upstream emissions may affect the assessment of the oil sands. If we consider
lifecycle emissions, the GHG costs of oil sands development increase by a factor of 4.5. Our
estimate for the costs related to GHG emissions from oil sands‟ production increases to roughly
$315 billion, translating into a net present value of $1,168.3 billion for Canada‟s oil sands.
In the case of lifecycle emissions, the net present value of the oil sands becomes negative
if we assume a low price of oil and a high social GHG cost. The chance that the output of the oil
sands imposes lifecycle environmental costs in excess of its economic value does not appear to
be negligible. However, it is not clear that the oil sands are unique in this respect; if it is true of
the oil sands, then it is probably true of conventional fossil fuels as well. Further study is
warranted.

ix
Conclusion and Recommendations
The future development of the oil sands carries significant challenges, be they political,
environmental or social. On the environment, Canada faces major international criticisms related
to its booming GHG emissions. Moreover, oil sands development not only has global
significance through its impact on climate change, but also domestic significance because of its
potentially negative impact on water supply and human health. Finally, the development of the
oil sands exemplify the economic shift in Canada, from Ontario and Quebec towards the West,
and entails growing geographical disparities which may pose important challenges for Canada‟s
society and unity. In the words of Pierre Fournier (2008), “one way or another…the oil sands is
likely the most important economic and political issue for Canada for the coming decades.”
In our view, given the importance of the oil sands for Canada, Statistics Canada should
undertake a review of its methodology. Our analysis leads us to suggest three key
recommendations:
Statistics Canada should adopt a more realistic assumption about reserves. In particular,
the full established reserves estimate, encompassing 172.7 billion barrels in 2007, is a
more accurate measure of the quantity of oil likely to deliver economic benefits to
Canadians in the future. It should replace the current established reserves under active
development estimate which amounts to 22.0 billion barrels in 2007.
Statistics Canada should adopt a more realistic assumption about extraction rates. Future
extraction rates should internalize all available information, and should thus take into
account projects under construction, projects that have been approved and projects that
have been announced. While the assumption of a constant extraction is acceptable in
mature industries, it should not be used in booming industries like the non-conventional
oil industry.
Statistics Canada should aim to present a variety of estimates based on alternate
assumptions. If only one estimate can be presented, it should use more realistic
assumptions about future reserves and extraction rates.
While this report takes the analysis further by accounting for the social costs of GHG
emissions associated with oil sands development, it fails to account for other environmental and
social costs. Indeed, there is a clear need for further research on the downstream GHG costs and
benefits of oil sands development. While this report provides a preliminary estimate of
downstream costs, it does not estimate downstream benefits. In addition, there is ample scope for
quantitative research focusing on environmental and social costs beyond those related to climate
change. Oil sands development is touted by some as an unacceptable environmental and social
catastrophe. As such, a comprehensive valuation of all environmental costs would allow for a
more conclusive debate on whether Canada should continue to support further oil sands
development, or if the massive future benefits derived from oil sands development are outweigh
by even larger environmental costs.

x
List of Tables and Figures
Tables
Table 1: In-place Volumes and Established Reserves of Crude Bitumen in Alberta, 2000-2007 .. 4
Table 2: Key Parameters and Results in Oil Sands Valuation Procedures ..................................... 9
by Statistics Canada and CSLS, 2006 and2007a ............................................................................. 9
Table 3: Potential Oil Sands Production Capacity Based on Current and Future Projects, Million
of Barrels per Year ........................................................................................................................ 15
Table 4: Crude Oil Prices, 2003-2008 .......................................................................................... 17
Table 5: Estimates on Present Value of Oil Sands Based on the Established Reserve Estimates
(172.7 billion barrels), 2007 (billion of 2007 dollars) .................................................................. 20
Table 6: National Wealth by Asset Using Official and CSLS Estimates, .................................... 22
Billion of Current Dollars, 2007 ................................................................................................... 22
Table 7: Measured Per-capita Wealth Increases as a Result of Revised Oil Sands Valuation,
Current dollars, 2007 .................................................................................................................... 22
Table 8: GHG Emissions Per Barrel in Bitumen Extraction and Upgrading ............................... 27
Table 9: Estimates of Oil Sands Emissions Intensity ................................................................... 28
Table 10: Summary of Estimates Selected for GHG Cost Analysis ............................................. 29
Table 11: Present Value of Upstream GHG Costs Caused by Oil Sands Development............... 30
Table 12: Net Benefit per Barrel in 2007 Dollars ......................................................................... 31
Table 13: Present Value of Oil Sands Net of Upstream Social GHG Costs ................................. 31
Table 14: Measured Per-capita Wealth Increases as a Result of Oil Sands Valuation, Net of GHG
Costs .............................................................................................................................................. 32
Figures
Figure 1: An Illustration of Consumer Surplus............................................................................. 26
Appendix Tables
Appendix Table 1: Calculation of Present Value of Remaining Established Reserves under
Active Development and Remaining Established Reserves of Crude Bitumen, 2005-2007 ........ 42
Appendix Table 2: Present Value of Established Reserve for Crude Bitumen based on the
Established Reserve under Active Development and the Established Reserve Estimates, 2007
(assuming the price of oil sand products = $56 per barrel)........................................................... 43
Appendix Table 3: Present Value of Established Reserve for Crude Bitumen based on the
Established Reserve under Active Development and the Established Reserve Estimates, 2007
(assuming the price of oil sand products = $70 per barrel)........................................................... 44

xi
Appendix Table 4: Present Value of Established Reserve for Crude Bitumen based on the
Established Reserve under Active Development and the Established Reserve Estimates, 2007
(assuming the price of oil sand products = $110 per barrel) ........................................................ 45
Appendix Table 5: Wealth in Canada and Alberta with Various Oil Sands Values, Excluding
GHG Costs .................................................................................................................................... 46
Appendix Table 6: Wealth in Canada and Alberta with Various Oil Sands Values, Net of GHG
Costs .............................................................................................................................................. 47
Appendix Table 7: Benefit per Barrel Net of Lifecycle GHG Emissions, in 2007 dollars .......... 52
Appendix Table 8: Present Value of Oil Sands Net of Lifecycle Social GHG Costs .................. 53

1
The Valuation of the Alberta Oil Sands1
I. Introduction
Natural resources are a major contributor to Canada‟s total wealth and economic well-
being, and an important component of Canada‟s natural resource base is the Alberta oil sands.2
According to recent estimates from the Energy Resources Conservation Board (ERCB; formerly
the Alberta Energy and Utilities Board [EUB]), which are commonly used by the Canadian
Association of Petroleum Producers (CAPP) and other credible sources, such as the Energy
Information Administration (EIA) and the Oil and Gas Journal, oil sands deposits in Alberta
contain 172.7 billion barrels of economically viable oil (ERCB, 2008a). Statistics Canada,
however, adopts a far more conservative estimate of 22 billion barrels in its official
measurements of the oil sands resource. As a result, the official estimates greatly undervalue
Canada‟s natural resource wealth.
This undervaluation is important because of the magnitude of the oil sands in the
economies of Alberta and Canada. Alberta‟s oil sands developments produced 482 million
barrels of crude bitumen in 2007 (ERCB, 2008). Based on a market price of $41 per barrel
(ERCB, 2007b), this output was worth $19.8 billion – 1.2 per cent of Canada‟s GDP and 7.3 per
cent that of Alberta.3 These figures will increase in the future; output is projected to increase at a
compound annual rate of about 8.7 per cent between 2007 and 2020 (CAPP 2008a) – a much
higher rate than annual Canadian GDP growth – while the price of crude bitumen had already
increased to $95 per barrel by June 2008 (ERCB 2008c; EIA 2008). It is true, however, that
these figures exclude important social costs associated with the oil sands, particularly in terms of
environmental deterioration.
Development of the oil sands will have profound implications for the Albertan and
Canadian economies, and for the lives of Albertans and Canadians, for many years to come.
This makes the accurate measurement of the oil sands resources an important goal. Indeed, the
inclusion of the full 172.7 billion barrels in Statistics Canada‟s resource valuation estimates and
the adoption of a realistic future extraction rate and prices would, all else being equal, increase
the measured wealth of every Canadian by roughly $30,000 and increase that of every Albertan
more than $300,000.
This report has three main objectives. The first is to critically review the official
Statistics Canada estimates of the value of the oil sands resource. Statistics Canada aims for
internal consistency in its methodological judgments – a worthy goal, to be sure – but we argue
that its framework results in a significant undervaluation of the wealth represented by the oil
sands. In particular, a less conservative estimate of the total volume of economically viable oil
1 This paper was written with financial support from Alberta Finance and Enterprise. The authors would like to thank Joan
Forbes (Statistics Canada), Kirk Hamilton (World Bank), Michelle Lauriault (Statistics Canada), Lars Osberg (Dalhousie
University), Charles Ruigrok (formerly with Syncrude), Toby Schneider (Government of Alberta), Leslie Shiell (University of
Ottawa) and Robert Smith (Statistics Canada) for helpful comments and Jan Reurink and Duane Pyear for support of the project. 2 Saskatchewan also has oil sands reserves, but they are at an earlier stage of development and are excluded from this report. 3 All dollar amounts in this report are expressed in 2007 Canadian dollars unless otherwise noted.

2
in the oil sands reserves, of the market prices at which it will be sold and of the rate at which it
will be extracted would lead to a more reasonable estimate of the total value of the resource.
In light of these claims, the second aim of this report is to produce new estimates of the
value of the Alberta oil sands resource. We employ a variety of assumptions about pertinent
parameters in order to produce a range of estimates within which the value of the oil sands is
likely to fall. Under reasonable assumptions, we estimate that the present value of the Alberta oil
sands is about $1,482.7 billion – 4.3 times the official Statistics Canada estimate.
Finally, the report‟s third objective is to take the analysis one step further by including
measures of the social costs of environmental damages arising from oil sands development. For
the purposes of this report, we consider only the costs of global climate change associated with
greenhouse gas (GHG) emissions. These costs are subtracted from the total resource rent
generated by the oil sands to produce a more complete estimate of the „true value‟ of the
resource. According to our preferred estimate, the present value of social costs imposed by GHG
emissions from the Alberta oil sands amount to $69.4 billion (in present value terms). Net of
these social costs, we estimate that the present value of the oil sands is $1,413.3 billion. This is
4.1 times the official Statistics Canada estimate, which does not account for environmental costs.
At every stage, we consider the implications of different estimates for the total measured wealth
of Canadians and Albertans.
The rest of this report is divided in three core sections. Section II discusses the different
measures of oil reserves relevant to wealth valuation. The following section discusses the
methodological choices made when valuing oil sands wealth and produces what we believe are
more realistic estimates of Canada‟s oil sands wealth. The final core section produces wealth
estimates of oil sands reserves that include the social costs imposed by GHG emissions related to
oil sands production.

3
II. Physical Estimates of the Oil Sands
The resource in the Alberta oil sands is bitumen, a heavy crude oil. Oil sands are
deposits of bitumen mixed with sand, clay minerals, shale, and water. The valuable bitumen
makes up only 10 to 12 per cent of the oil sands in Alberta; the extraction of oil from the sands
requires that the bitumen be separated from the clay and water. Additional upgrading is typically
performed to transform the bitumen into crude oil suitable for gasoline production and other
commercial uses. With current technology, one barrel of oil requires two tonnes of oil sands, 2
to 3 barrels (318 to 477 litres) of water, and 1 to 1.25 gigajoules of natural gas (Government of
Alberta, 2006).4
There are many ways to measure the size of the resource represented by the oil sands.
The ERCB produces several estimates, including “initial volume in-place,” “initial established
reserves,” “cumulative production,” “remaining established reserves,” and “remaining
established reserves under active development.” Table 1 contains the ERCB estimates of in-
place and established reserves of crude bitumen for the 2000-2007 period.
Initial volume in-place is the largest of the measures. It captures the volume of oil sands
that possess certain geological characteristics that make it reasonable to expect that oil could
feasibly be extracted.5 By this metric, the ERCB estimates that the Alberta oil sands contain as
much as 1.7 trillion barrels of oil. This represents the upper bound of current estimates of the
magnitude of the Alberta oil sands resource. It is worth noting, however, that the ERCB‟s initial
volume in-place estimate increased from 1.631 trillion to 1.712 trillion barrels between 2000 and
2007 in spite of changes in the measurement methodology that made the measure more
restrictive. New exploration resulted in an expansion of the known extent of the oil sands
deposits sufficient to offset the methodologically-driven reduction in measured volume in-place
that would otherwise have occurred (ERCB 2007). There is no reason to think that this estimate
will not continue to increase as new deposits are discovered.6
The initial volume in-place measure provides an intuitive idea of the sheer amount of
bitumen present in the Alberta oil sands, but the vast majority of that bitumen is currently
inaccessible or uneconomical. To call that oil a resource would be difficult to justify. For
practical purposes, we are interested in the volume of oil that is in fact available to us given the
technologies and economic conditions that currently prevail or that are expected in the near
future. The ERCB‟s estimates of “initial established reserves” are intended to capture these
resources. Remaining established reserves measures the total end-of-year volume of
economically viable oil in the oil sands, after cumulative production. The ERCB estimates that
4 The source does not describe the methods used to calculate these averages; presumably, they represent average inputs across the
variety of technology mixes used at different oil sands projects. The per-barrel natural gas requirement, however, refers only to
bitumen extracted by steam assisted gravity drainage in-situ technology (SAGD; see footnote 43 below). 5 In particular, the oil sands in a given region must contain bitumen above a threshold concentration throughout a space above a
threshold size. The ERCB uses different threshold values depending upon the location of the oil sands, the particular extraction
techniques required to access the bitumen, and other criteria. The economic viability of these deposits, however, is not evaluated,
See ERCB (2007) for details. 6 Estimates of oil sands reserves are currently for Alberta only. Yet, drilling in neighbouring Saskatchewan confirms that the
province also contains significant oil sands deposits, even though their economic viability remains to be confirmed and they are
far from being under development (Cattaneo [2007] and Oilsands Quest Inc. [2008]).

4
in 2007 the Alberta oil sands contained about 173 billion barrels in remaining established
reserves.7
Table 1: In-place Volumes and Established Reserves of Crude Bitumen in Alberta,
2000-2007
Year Initial
Volume In-Place
Initial established
reserves
Cumulative production
Production per year
Remaining established
reserves
Remaining established
reserves under active development
A B C D E=B-C F (billions of cubic meters)
2000 259.2 28.3 0.520 0.039 27.81 1.86 2001 259.2 28.3 0.562 0.042 27.77 1.83 2002 259.2 28.3 0.610 0.048 27.72 1.84
2003 258.9 28.4 0.670 0.056 27.73 1.72 2004 269.9 28.4 0.730 0.063 27.66 1.66 2005 269.3 28.4 0.791 0.062 27.60 1.62 2006 270.3 28.4 0.864 0.073 27.53 3.34 2007 272.0 28.4 0.940 0.077 27.45 3.50
(billions of barrels)
2000 1,631 178.3 3.3 0.245 175.0 11.7
2001 1,631 178.3 3.5 0.271 174.8 11.5
2002 1,631 178.3 3.8 0.303 174.4 11.6
2003 1,629 178.7 4.2 0.352 174.5 10.8
2004 1,699 178.7 4.6 0.399 174.1 10.5
2005 1,694 178.7 5.0 0.388 173.7 10.2
2006 1,701 178.7 5.4 0.458 173.2 21.0
2007 1,712 178.7 5.9 0.482 172.7 22.0 Note: 1 cubic metre = 6.29 barrels
Source: ERCB (2000-2008), Table 2.1.
The most restrictive definition is remaining established reserves under active
development, a subcategory of remaining established reserves that includes only those reserves
that are currently in production or in the final stages of development for production (ERCB
2006:2-10). The ERCB estimates that 22.0 billion barrels of oil reserves in the Alberta oil sands
qualify as established reserves under active development in 2007. This is significantly greater
than the 2005 estimate of 10.2 billion barrels used in previous oil sands valuation; the jump,
which occurred between 2005 and 2006, can be attributed to updated production estimates for
mining operations and the inclusion of several newly-approved projects (ERCB 2006:2-11).
7 It must be noted that this estimate excludes economically viable reserves that are yet to be discovered and future additions to
existing pools. The ERCB also produces an estimate of the oil sands‟ “ultimate potential (recoverable) crude bitumen” which
includes estimated additions and discoveries. This estimate falls between volume in-place and established reserves. The ERCB‟s
estimate of the quantity of oil that is ultimately recoverable from the oil sands is 315 billion barrels (ERCB 2008a: 3).

5
The choice of which reserve estimate we take as the most representative of the true
wealth contained in Alberta‟s oil sands has obvious and significant implications for the valuation
of the oil sands as a resource. The estimates vary by orders of magnitude. Consider the fact that
global oil consumption in 2007 was 31.1 billion barrels (British Petroleum, 2008).8 If we accept
that the oil sands contain 1.7 trillion barrels of oil, then the Alberta oil sands alone could supply
100 per cent of the world‟s oil, at current annual demand, for 55 years. If we decide that the 315
billion barrels of “ultimately recoverable” bitumen is the appropriate measure, then at the current
level of demand Alberta could supply the world for 10 years; the 172.7 billion barrels of
established reserves could satisfy world demand for 5.6 years; the 22.0 billion barrels of
established reserves under active development would last only 8.5 months.
The ERCB‟s estimates of remaining established reserves under active development are
the estimates used by Statistics Canada to measure the extent of the oil sands resource. It is clear
that this is a very conservative estimate. The 2007 estimate of 22.0 billion barrels under active
development is only 12.7 per cent of the total remaining established reserves (172.7 billion
barrels). In 2005, this percentage was just 5.9 per cent (10.2 billion barrels actively developed
out of 173.7 billion barrels of established reserves). While it may be useful to know the quantity
of oil deposits currently under active development, we argue that this is not the appropriate
reserve definition for use in the measurement of the full oil sands resource. That argument is
presented in section III-B-c later in the paper. In any case, it is clear that the oil sands represent
an enormous potential wealth. In subsequent sections of the paper, we turn to the problem of
valuing that potential.
8 The source reports global oil consumption as 85.220 million barrels per day. We simply multiply by 365 to obtain the annual
figure. It is also worth noting that the oil sands output of 482 million barrels in 2007 accounted for 1.5 per cent of global oil
consumption.

6
III. The Valuation of the Oil Sands
A. The Methodology of Natural Resource Valuation9
Natural resource wealth depends upon the sales revenue from extracted resources,
extraction costs, the time profile of extraction and the amount of remaining reserves. A widely
used methodology for calculating the value of natural resources is the net present value method
(NPVM). Statistics Canada uses this method to assign a value to Alberta‟s reserves of oil
sands.10
The NPVM involves measuring the value of the resource as a stream of present and
future resource rents. The essence of the method is as follows: one estimates the annual rent
generated by oil sands development, then sums the annual rents over the entire lifetime of the
resource stock, giving less weight to the rents of years further into the future. Clearly, this
requires assumptions about future economic conditions and the time profile of extraction.
Statistics Canada assumes that economic factors relevant to the oil sands sector – revenues minus
costs and annual extraction rates – remain constant.
Given these assumptions, Statistics Canada uses data on present economic conditions as
estimates of future economic conditions. The total undiscounted resource value (U), or quasi-
rent,11
is calculated by the following formula:
U = (TR – C)*T - K
where TR is the total annual revenue of the oil sands sector, C is the annual non-capital cost of
extraction, T is the total reserve life and K is the value of the produced capital stock used in the
extraction projects.12
TR is collected for the current year through industry surveys. Extraction
costs (C) consist in the costs of “fuel, electricity, materials, supplies, and wages” but exclude
9 The focus of this subsection is on the particular estimation methodology used by Statistics Canada. Thus, much of it is based
upon Statistics Canada‟s own natural resource and environmental accounting documentation (Statistics Canada, 2006:35-38). In
subsequent sections, the valuation methods we adopt are based upon the Statistics Canada approach. 10 In addition to the NPVM, Statistics Canada produces resource value estimates using a „net price method‟ based on a Hotelling
model of natural resource exploitation (Hotelling, 1931). The net price method involves estimating the resource rent per unit of
output and then multiplying it by the total resource reserves. It tends to overestimate the market value of subsoil natural
resources. See Statistics Canada (2006:36-37) and Born (1992). 11 This methodology captures partly pure economic rent, partly compensation to a factor of production (or rate of return). It is
thus technically speaking a quasi-rent, as opposed to a pure rent, as it does not exclude normal or accounting profits. As noted in
Statistics Canada (2006:29); “Rent should be net of all extraction costs, including full produced capital costs, to accurately
represent the return to the subsoil asset.” Yet, there is important uncertainty associated with the estimation of the return to
produced capital. We thus follow Statistics Canada (2006) and assume a zero return to capital produced in the NPVM. If we had
used the yield on nominal long-term industrial bond as a proxy for the return on produced capital (4.25 per cent in 2007), as is
done by Statistics Canada for one of their Hotelling-based valuation methodology (Net Price I), the per-barrel cost of production
would have been $4.85 higher in 2007, with a commensurate decrease in the per-barrel rent. For simplicity, the report uses the
term rent when referring to the return to the subsoil asset. 12 Subtracting the capital stock in this way implies that the present capital stock has a useful lifetime exactly equal to the product
of the annual rate of capital depreciation and the reserve life T. In other words, the present capital stock is assumed to be exactly
sufficient to extract the entire resource stock in T years. Like the other assumptions, this is a simplification justified by the
uncertainty of the future; we know that the costs of capital must be included in the calculation, but since we do not know how the
capital stock will evolve in the future, we assume that the present capital stock is all that is needed, which may underestimate
future capital costs. See Statistics Canada (2006:37).
7
royalties, bonuses13
and taxes (Statistics Canada, 2006). For its valuation, Statistics Canada
assumes that the real value of TR - C will be the same in all subsequent years. The annual rate of
resource extraction is assumed to be equal to the actual extraction rate in the most recent year for
which data are available, and the reserve life T is acquired by dividing the annual extraction rate
into the total remaining reserves.
This calculation gives a measure of the real total (non-discounted) amount of revenue
generated by the oil sands over and above extraction costs and capital costs for the entire lifetime
of the reserves. This is then divided by the reserve life to produce average annual rent, which is
used as a measure of the annual value of the natural resource.
However, a given dollar of rent is worth less in the future than it is today because of the
time value of money. The valuation methodology must account for the uncertainty of the future,
the expectation that future generations will have higher income (and, as a consequence, lower
marginal utility of income) than the present generation, and a simple preference for immediate
gratification rather than delayed gratification. As such, a discount rate is applied to the annual
valuation so that values in the distant future receive less weight than those of today. Islam
(2007) provides a simple example of the discounting of future rents in a resource valuation
context:
Suppose last year‟s reserve of a mineral resource was 15 units and 5 units were
extracted. Then the remaining reserve would be 10 units. If sales revenue from the
extracted 5 units was $50, and the total extraction costs were $30, then the
resource rent would be $20. Assuming that all these factors stayed the same, the
remaining reserves would generate $20 worth of rent in each of the following two
years. However, $20 at the end of year one and two is worth less than it is now.
Assuming a 5% annual interest rate, also known as the discount rate, estimated
wealth of the remaining reserve would be:
The net present value (NPV) of the natural resource is the sum of all discounted rents
over the reserve life. Although resource rent is the standard measure of the value of natural
resources, there are caveats associated with its use. First, rent does not necessarily capture all of
the economic benefits that arise from resource extraction. Even if oil sands firms were receiving
zero rent (that is, generating revenues just sufficient to cover operating costs and deliver a
normal rate of return), their operations could still foster wealth production through their
economic activities. For instance, oil firms contribute to the wealth of society by generating
employment in the oil sands region.14
The use of resource rents as a measure of the value of the
13 Bonuses are up-front lump sum payments to acquire the rights to explore, develop and produce oil or natural gas resources.
They are part of the bidding process for awarding rights, which constitutes an economically efficient way to allocate mineral
rights. 14 In cost-benefit analysis, we must be careful about the counterfactual that we are considering. We want to measure the costs
and benefits of oil sands development, but relative to what alternative? Employment generation represents a challenge in this
context. If we say that employment generation is a benefit of the oil sands, we are implicitly suggesting that the opportunity cost
of that labour is close to zero. This is clearly false; it is not true that all the labour employed at the oil sands would be

8
oil sands does not account for these sorts of effects. Everything else being equal, rent may
therefore be a lower-bound estimate of the value of the oil sands resource.
The second caveat is that the extraction cost measure used in the rent calculations
excludes the royalties, bonuses and taxes paid by the private firms that extract the publically-
owned resources. Oil sands firms are subject to a complex royalty framework in Alberta.15
It
makes sense to exclude these costs from the firms‟ measured extraction costs because the oil
sands are owned by the citizens of Alberta; the right to extract the oil is rented to private firms in
return for remuneration in the form of royalties and, to a lesser degree, taxes. In this sense, the
royalties are a mechanism by which oil sands rents are socialized. The amount of rent that is
collected by the government still represents a benefit to Canadians and should therefore be
included in the value of the resource. However, it remains true that royalties and taxes may
influence the rate of extraction; higher royalties lower firms‟ share of the rents, which reduces
the incentive for new investment and may result in the oil sands resource being exploited more
slowly than they would otherwise be. Given a positive discount rate, this would lower the net
present value of the oil sands. Thus, while royalties and taxes are assumed to be paid out of the
measured value of oil sands rent, it cannot necessarily be assumed that that measured rent is
independent of the level of the royalties and taxes.
B. Statistics Canada’s Valuation
i) Estimates
We adopt the approach of Statistics Canada (NPVM) as a benchmark for our analysis.
Table 2 contains key parameters of the estimation procedure and several estimates of the present
value of the oil sands.
Statistics Canada (2008) estimates that the Alberta oil sands resource in 2007 consisted in
22.0 billion barrels of oil with a net present value of $342.1 billion (in 2007 Canadian dollars).
This estimate is contained in the second column of Table 2. Our exploratory estimates are given
in the third through fifth columns. We maintain Statistics Canada‟s method but use remaining
established reserves as the measure of the total resource (172.7 billion barrels). Our exploratory
unemployed if oil sands projects were not undertaken. On the other hand, it seems to be true that the wages paid to oil sands
employees are generally higher than the average wage that prevails throughout the Canadian economy (though one might argue
that we are still in the midst of an adjustment period and that oil sands wages will, in the long run, decline toward the average
wage). This means that the opportunity cost of labour in the oil sands is lower than the wage paid to oil sands workers – as we
would expect, given the substantial migration of workers to Alberta from the rest of Canada in recent years. Further, it is not
clear that the full employment assumption of economic theory aptly describes the real world even in the long run; consider the
high rates of unemployment that have persisted in Newfoundland for decades (and that may finally be reduced by the
development of an oil industry, where no previous development effort had been successful). Thus, it is reasonable to think that
employment generation in the oil sands region does produce some social benefits net of the opportunity cost of labour. However,
the magnitude of those benefits would be difficult to measure. The use of rent as the measure of the value of the oil sands avoids
these thorny issues by ignoring them, but it is important to mention them nevertheless. See Pearce et al. (2006) for a discussion
of the imputed benefits of employment creation in the context of cost-benefit analysis. 15 Currently, oil sands firms pay a base royalty of one per cent of gross revenues and a net royalty of 25 per cent of revenues
above and beyond upfront development costs and a normal rate of return. As a consequence of the report of the Alberta Royalty
Review Panel (2007), the Government of Alberta created a new royalty framework (Government of Alberta 2007). After January
1, 2009, it is expected that oil sands firms will pay a base royalty of one per cent, increasing with WTI oil prices above $55/bbl
(CAD) to a maximum of 9 per cent for WTI oil prices above $120/bbl. Similarly, the net royalty will start at 25 per cent and
increase with WTI oil prices above $55/bbl to a maximum of 40 per cent for WTI oil prices higher than $120/bbl.

9
estimate suggests that if the annual extraction rate is assumed to remain at the 2007 level of 482
million barrels per year, then the Alberta oil sands reserves last for 358 years and have a net
present value of $410.7 billion. This is only 20.1 per cent greater than the actual Statistics
Canada estimate and reflects the low present value for production well into the future. If we
assume that the annual extraction rate increases so that the 172.7 billion barrels are extracted in
just 46 years (the reserve life used by Statistics Canada in 2007), then the present value of the oil
sands rises to $2,682.6 billion – almost 8 times the official Statistics Canada estimate.
Table 2: Key Parameters and Results in Oil Sands Valuation Procedures
by Statistics Canada and CSLS, 2006 and 2007a
Assumptions and Results
Statistics Canada’s estimate based on established reserve
under active development
CSLS’s estimate based on established reserve (172.7 billion barrels)
21.018 billion barrels at
current extraction pace,
in 2006 b
22.025 billion barrels at
current extraction pace,
in 2007 b
At the current
extraction pace c
At a fast extraction pace
d
At a realistic extraction
pace e
Discount rate (per cent) 4 4 4 Price ( per barrel) f $57.2 $56.0 $56.0
Extraction cost g (per barrel)
$21.5 $21.9 $21.9
Rent ( per barrel) $35.7 $34.1 $34.1 Annual rate of extraction (billions of barrels)
0.413 0.482 0.482 3.780 1.350h
Reserve life (years) 51 46 358 46 130
Present value of oil sand reserves (billions of dollars)
$318.6 $342.1 $410.7 $2,682.6 $1,049.9
Source: Appendix Table 1.
Notes:
a. We use 2007 as the benchmark year for this analysis because it is the most recent year for which Statistics Canada valuation data
are available.
b. These are the official Statistics Canada estimates for Canada‟s oil sands present value in 2006 and 2007. The variables underlying
these estimates were derived from official sources (see Appendix Table 1 for more details).
c. Assumes the total reserves (172.7 billion barrels) will be extracted at the same pace as the actual net production in 2007.
d. Assumes the total reserves (172.7 billion barrels) will be extracted in 46 years (identical to Statistics Canada reserve life in 2007
for much lower reserves) at an annual production level of 3.780 billion barrels, which is much faster than the actual rate of
extraction in 2007.
e. Assumes the total reserves (172.7 billion barrels) will be extracted at a linearly increasing pace between 2007 (482 million
barrels) and 2015 (1.35 billion barrels). After 2015, it assumes an annual production level of 1.35 billion barrels per year, translating
into a reserve life of 130 years.
f. The price refers to the price (or more precisely value/volume) for marketable oil sands products, which includes crude bitumen
and synthetic crude oil from upgraded crude bitumen.
g. Extraction costs refer to total costs for the sector (excluding royalties, bonuses and taxes) divided by the production volume.
h. Rate of extraction in 2015 and beyond. See footnote (e) for details.
Neither of these estimates is realistic. The $2,682.6 billion estimate assumes an annual
extraction rate of 3.75 billion barrels; given production constraints associated with skilled labour

10
and specialized technology, as well as environmental constraints, this is far higher than any
realistic projection of future extraction rates. The other estimates, on the other hand, assume that
the extraction rate will remain constant when in fact it has already increased and is sure to
increase further.16
The purpose of these exploratory estimates is to demonstrate the magnitude of
the effects that different assumptions can have on the measured value of the oil sands resource.
It is clear that sound methodological judgments are of paramount importance.
The final column gives a more realistic estimate of the present value of the oil sands.
Based on the assumptions used by Statistics Canada except for the reserves definition and a more
realistic annual extraction rate, we obtain an initial estimate of $1,049.9 billion. In the next
subsection, we argue that these assumptions, along with a few other details, are likely to produce
estimates of the value of the oil sands that are more accurate than the official estimates.
ii) A Closer Look at the Assumptions
Choice of Reserve Definition
Smith (2006) gives two principal reasons for Statistics Canada‟s decision to use
remaining established reserves under active development to measure the size of the oil sands
resource. First, Statistics Canada claims that reserves under active development are the data that
correspond most closely to the definition of a natural asset in the 1993 System of National
Accounts (SNA93, 1993). If this is so, then the use of a different reserve estimate would make
the oil sands measurements inconsistent with other asset definitions used in the SNA balance
sheets. The second reason is the uncertainty surrounding natural resource measurement. It is
difficult for Statistics Canada to value reserves not currently in production because of uncertainty
about future prices, extraction costs and the long time frames associated with developing new
reserves. It is argued that if we do not know when and in what quantity the reserves will be
extracted, it is not reliable to assign a value to them.
That Statistics Canada would like to maintain the internal consistency of its SNA is
understandable. Nevertheless, Statistics Canada‟s arguments do not persuade us that their
conservative approach gives an estimate of the magnitude (and thus the value) of the oil sands
that reasonably approximates the „true value‟ of the resource. Statistics Canada defines natural
resource assets as follows:
Naturally occurring assets over which ownership rights have been established and
are effectively enforced...qualify as economic assets and [are to] be recorded in
balance sheets. [Such assets] do not necessarily have to be owned by individual
units, and may be owned collectively by groups of units or by governments on
behalf of entire communities... In order to comply with the general definition of
an economic asset, natural assets must not only be owned but be capable of
bringing economic benefits to their owners, given the technology, scientific
16 According to ERCB (2008c) crude bitumen production for the first eight months of 2008 was 10.1 per cent above that of 2007.
Synthetic crude production was down 6.5 per cent over the same period. Going forward, the CNRL Horizon mining project is
still projected to become operational before the end of 2008, further boosting non-conventional oil output for that year (IEA,
2008:22).

11
knowledge, economic infrastructure, available resources and set of relative prices
prevailing on the dates to which the balance sheet relates or expected in the near
future. (Statistics Canada, 2006)
It is clear that the less conservative ERCB estimate of remaining established reserves
corresponds with the criteria in this definition. The full 172.7 billion barrels are owned by the
Government of Alberta, and they are recoverable with current technology and under present and
anticipated economic conditions. In other words, they have the potential to bring economic
benefit for the owner in the near future. Indeed, given that substantial investment is being made,
even if the reserves are not under active development at the present time, the return on
investment should be expected in the near future. With available technology and extraction
practices, much of the oil in the established reserves – well over 22.0 billion barrels of it – is
economically viable even if the capacity to extract it does not exist at this moment. There is no
reason to think that the capacity will not eventually exist; oil firms are expanding extraction
capacity as quickly as they can. As such, all remaining established reserves should be valued as
a resource.
Statistics Canada‟s position is based on a very strict interpretation of the „economic
infrastructure‟ criterion in the SNA93 definition. The crux of their argument is that there is no
clear basis upon which to decide what portion of the 172.7 billion barrels of established reserves
will be exploited in the near future. Economic infrastructure (which Statistics Canada take to
mean the physical infrastructure required to extract oil from the oil sands) is being built for some
of that oil, but not all of it. Statistics Canada argues that only the 22 billion barrels currently
under active development are certain to be extracted, so restricting the analysis to that 22 billion
barrels allows Statistics Canada to avoid dealing with too much uncertainty with respect to the
future.
We find this argument unconvincing for several reasons. First, the economic
infrastructure criterion in the SNA93 definition of natural assets does not warrant so strict an
interpretation. The term „economic infrastructure‟ appears only once in the SNA93
documentation; it is used when SNA93 defines a natural asset as a resource that is owned and
that is capable of bringing economic benefits to its owners “given the technology, scientific
knowledge, economic infrastructure, available resources and set of relative prices prevailing on
the dates to which the balance sheet relates or expected in the near future” (SNA93:10.11). The
precise meaning of „economic infrastructure‟ is never provided. Later, however, SNA93 defines
a natural asset as a naturally-occurring resource that is “subject to effective ownership and are
capable of bringing economic benefits to their owners, given the existing technology,
knowledge, economic opportunities, available resources, and set of relative prices”
(SNA93:13.18).
Given the similarity of these two natural asset definitions, are we to take „economic
infrastructure‟ to be synonymous with „economic opportunities‟? If so, it is clear that Statistics
Canada‟s approach is too restrictive to be consistent with the SNA93 definition; if it is
reasonably interpreted, there is nothing in the SNA93 definition that rules out the valuation of
total established reserves rather than just reserves under active development. It is certainly true
that, compared to other countries that also use SNA93 definitions, Canada‟s physical estimates
12
of natural resources tend to be very conservative. For instance, the United Kingdom‟s Office for
National Statistics uses discovered (proven, probable, and possible) and undiscovered deposits in
its resource valuation (London Group 2004).17
In fact, the London Group (2003:315) finds that
most countries include the category of proven or established subsoil reserves in their SNA
valuation of wealth since “it is all that is available.” The group also mentions that “in some other
countries, it is also felt that the restriction to proven reserves is too conservative and proven and
probable reserves are combined, even in the SNA context and even when the two categories are
available separately.” Thus, it is not at all clear that established reserves under active
development correspond more closely to the SNA93 natural asset definition than the full
established reserves do.
By contrast, the Canadian SNA definition restricts measurement to developed resources;
if we want to look at the whole picture of Canada‟s natural resource wealth, Statistics Canada‟s
figures tend to underestimate it. If the oil sands contain 1.7 trillion barrels of oil and an ultimate
potential of 315 billion barrels, then it is exceedingly likely that the „true‟ size of the resource –
the amount that we would value if we could look into the future and see with certainty how much
oil will ultimately be extracted from the oil sands – is far greater than even the 173 billion
currently labeled as remaining established reserves. There is no reason to ignore all this
information just because there is currently no economic infrastructure in place for much of the
oil. The inclusion of all the available information in the Statistics Canada analysis would
provide Canadians with a clearer picture of the country‟s natural resource wealth.
All that having been said, however, there is a subtler methodological reason to think that
Statistics Canada‟s approach is too conservative. Ceteris paribus, it is better to overestimate the
total reserves than to underestimate them because, while an overestimation will be highly
discounted as it affects production far in the future, an underestimation will affect shorter-term
production and will not be as severely discounted. We develop this argument further in the
following paragraphs.
If we accept Statistics Canada‟s strict interpretation of the SNA93 definition, then it is
true that using the full 172.7 billion barrels of remaining established reserves would mean
valuing a large amount of oil for which economic infrastructure is neither in place nor
anticipated in the near future. On the other hand, using only the 22 billion barrels of remaining
established reserves under active development means failing to value some oil for which
economic infrastructure will be built in the near future (not to mention a huge amount of oil that
will ultimately be extracted, either in the near or the distant future, and is therefore, in principle,
a part of Canada‟s resource wealth). Both methods potentially involve some error. The
appropriate approach is to ask which of these imperfect methods is likely to produce the most
accurate estimate of the size of the Alberta oil sands resource.
17 The United Kingdom‟s Office for National Statistics defines proven reserves as reserves which on the available evidence are
virtually certain to be technically and commercially producible, i.e. have a better than 90 per cent chance of being produced.
Probable reserves are not yet proven, but are estimated to have a better than 50 per cent chance of being technically and
commercially producible. Possible reserves at present cannot be regarded as probable, but are estimated to have a significant but
less than 50 per cent chance of being technically and commercially producible. Lower- and upper-bound estimates are given for
undiscovered reserves.

13
We claim that the better method is to use the full remaining established reserves estimate.
Statistics Canada‟s choice of established reserves under active development involves short-term
error; their method fails to value some oil that will no doubt be exploited in the near future. The
use of the larger 173 billion barrel estimate, by contrast, would be associated with long-term
error. Suffice it to say that well over 22 billion barrels of the oil will be extracted in the near
future. What we are unsure about are the conditions under which much of the oil will be
extracted in the distant future. However, any error associated with long-term projections would
be heavily discounted in the analysis if reasonable values of the intertemporal discount rate are
selected.18
All else being equal, then, long-term error is less likely to have a serious effect on the
outcome of the calculations than short-term error, which is not as severely discounted. Statistics
Canada‟s short-term error will have a large impact in widening the gap between their estimate
and the „true value‟ of the oil sands that they are trying to approximate. Our long-term error will
not have such an impact, since it is more heavily discounted under the net present value
methodology.
Remember also that there are larger estimates than the 172.7 billion barrel estimate of
remaining established reserves. The total amount of oil ultimately recoverable from the oil sands
is thought to be 315 billion barrels, with an estimated 1.7 trillion barrels being present in the oil
sands in total. If the past is any guide, future developments will no doubt increase both of these
estimates. The 172.7 billion barrel estimate is far better than the 22 billion barrel estimate as a
compromise estimate of the likely amount of oil that will ultimately deliver economic benefits to
Canadians.
Taken together, these arguments provide a strong case for the claim that Statistics
Canada‟s estimates of the size of the oil sands resource are very conservative. If nothing else, it
must be acknowledged that alternative estimates based on different assumptions would be useful
in providing a clearer picture of the true resource wealth represented by the Alberta oil sands.
Statistics Canada does not publish alternative measures of the oil sands reserves; only the
established reserves under active development are available through CANSIM. Statistics Canada
should reconsider its position and make a full range of natural resource estimates available to
Canadians.
This is not a revolutionary suggestion – Statistics Canada already provides a range of
estimate based on different assumptions when it comes to population projections. Moreover, it
already provides different valuations of the oil sands based on alternative methodologies, but not
on alternative assumptions. In this context, extending the range of available natural resource
estimate not only makes sense, but can surely be done in the existing framework.
Choice of Discount Rate
Statistics Canada uses a discount rate of four per cent to calculate the present value of the
Alberta oil sands reserves.19
This rate approximates average interest rates and is almost
18 The discount rate and other methodological issues associated with natural resource valuation are discussed in greater detail
below. 19 It is important to get some perspective on the importance of discounting on the value of future production. For example, at a 4
per cent discount rate, $100 received next year is worth $96.15 today, but $100 received in 100 years has virtually no value today
($1.98). The following table provides an overview of the effect of discounting over different periods and at different rates:
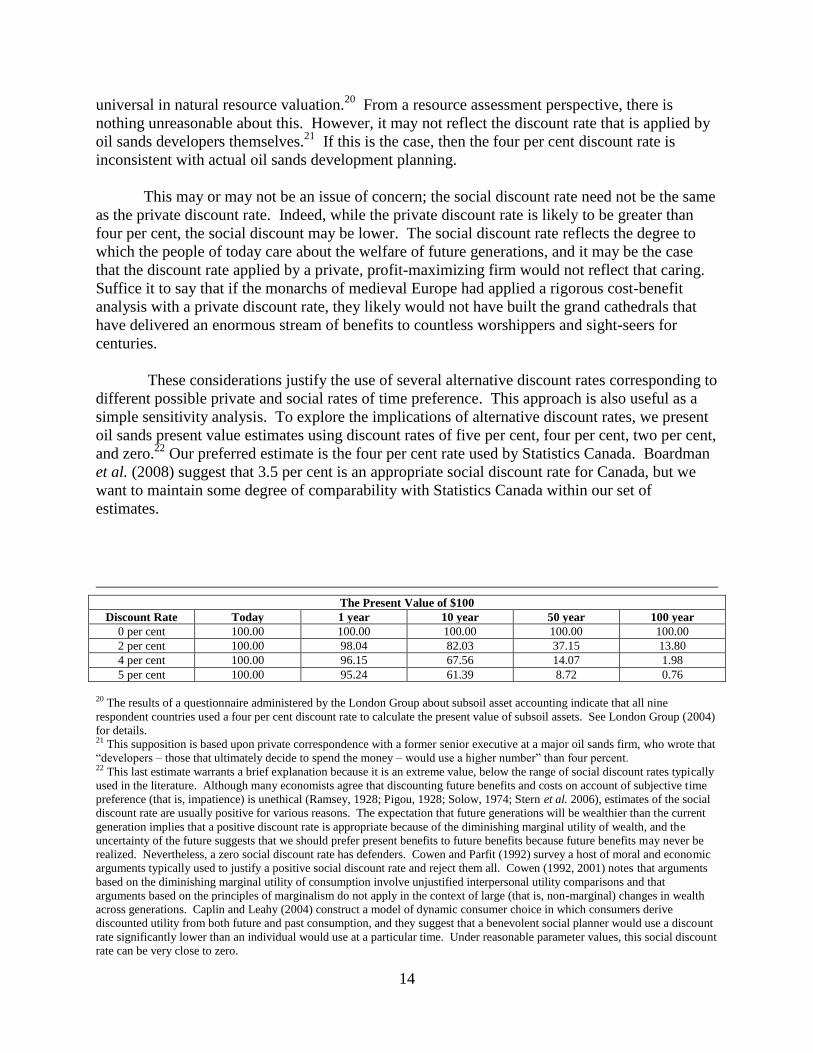
14
universal in natural resource valuation.20
From a resource assessment perspective, there is
nothing unreasonable about this. However, it may not reflect the discount rate that is applied by
oil sands developers themselves.21
If this is the case, then the four per cent discount rate is
inconsistent with actual oil sands development planning.
This may or may not be an issue of concern; the social discount rate need not be the same
as the private discount rate. Indeed, while the private discount rate is likely to be greater than
four per cent, the social discount may be lower. The social discount rate reflects the degree to
which the people of today care about the welfare of future generations, and it may be the case
that the discount rate applied by a private, profit-maximizing firm would not reflect that caring.
Suffice it to say that if the monarchs of medieval Europe had applied a rigorous cost-benefit
analysis with a private discount rate, they likely would not have built the grand cathedrals that
have delivered an enormous stream of benefits to countless worshippers and sight-seers for
centuries.
These considerations justify the use of several alternative discount rates corresponding to
different possible private and social rates of time preference. This approach is also useful as a
simple sensitivity analysis. To explore the implications of alternative discount rates, we present
oil sands present value estimates using discount rates of five per cent, four per cent, two per cent,
and zero.22
Our preferred estimate is the four per cent rate used by Statistics Canada. Boardman
et al. (2008) suggest that 3.5 per cent is an appropriate social discount rate for Canada, but we
want to maintain some degree of comparability with Statistics Canada within our set of
estimates.
The Present Value of $100
Discount Rate Today 1 year 10 year 50 year 100 year
0 per cent 100.00 100.00 100.00 100.00 100.00
2 per cent 100.00 98.04 82.03 37.15 13.80
4 per cent 100.00 96.15 67.56 14.07 1.98
5 per cent 100.00 95.24 61.39 8.72 0.76
20 The results of a questionnaire administered by the London Group about subsoil asset accounting indicate that all nine
respondent countries used a four per cent discount rate to calculate the present value of subsoil assets. See London Group (2004)
for details. 21 This supposition is based upon private correspondence with a former senior executive at a major oil sands firm, who wrote that
“developers – those that ultimately decide to spend the money – would use a higher number” than four percent. 22 This last estimate warrants a brief explanation because it is an extreme value, below the range of social discount rates typically
used in the literature. Although many economists agree that discounting future benefits and costs on account of subjective time
preference (that is, impatience) is unethical (Ramsey, 1928; Pigou, 1928; Solow, 1974; Stern et al. 2006), estimates of the social
discount rate are usually positive for various reasons. The expectation that future generations will be wealthier than the current
generation implies that a positive discount rate is appropriate because of the diminishing marginal utility of wealth, and the
uncertainty of the future suggests that we should prefer present benefits to future benefits because future benefits may never be
realized. Nevertheless, a zero social discount rate has defenders. Cowen and Parfit (1992) survey a host of moral and economic
arguments typically used to justify a positive social discount rate and reject them all. Cowen (1992, 2001) notes that arguments
based on the diminishing marginal utility of consumption involve unjustified interpersonal utility comparisons and that
arguments based on the principles of marginalism do not apply in the context of large (that is, non-marginal) changes in wealth
across generations. Caplin and Leahy (2004) construct a model of dynamic consumer choice in which consumers derive
discounted utility from both future and past consumption, and they suggest that a benevolent social planner would use a discount
rate significantly lower than an individual would use at a particular time. Under reasonable parameter values, this social discount
rate can be very close to zero.

15
Annual Extraction Rate and Total Reserve Life
By definition, the total reserve life is equal to the total reserve volume divided by the
average annual extraction rate. Statistics Canada assumes that in all future years, the annual
extraction rate will be equal to the level of extraction in the current year. In 2007, the base year
for our analysis, the extraction level was 482 million barrels; thus, Statistics Canada assumes a
constant extraction rate of 482 million barrels per year. This, together with their total reserve
estimate of 22.0 billion barrels, yields Statistics Canada‟s reserve life estimate of about 46 years
(see Table 2). We assumed the same extraction rate in one of our exploratory estimates. Along
with the 172.7 billion barrels of remaining established reserves, this produced our estimate of the
total reserve life: 172.7 billion barrels divided by 482 million barrels per year yields 358 years.
The assumption that the annual extraction rate will remain constant in the future is not
justified. The oil sands industry has experienced dramatic growth in recent years. The total
output of the oil sands was 482 million barrels in 2007, 5.2 per cent higher than the 458 million
barrels extracted in 2006 and 24.2 per cent higher than the 388 barrels extracted in 2005. In the
first eight months of 2008 crude bitumen production was up 10.1 per cent over the first eight
months of 2007, but synthetic crude production was down 6.5 per cent (ERCB, 2008c). As noted
earlier, the CNRL Horizon mining project is projected to become operational before the end of
2008, which should further increase non-conventional oil output in 2008.
Table 3: Potential Oil Sands Production Capacity Based on Current and Future Projects,
Million of Barrels per Year
Actual Capacity Additional Potential Capacity
1967-2005 2006-2015 2016 -
Mining In-Situ Total Mining In-Situ Total Mining In-Situ Total 263 122 385 720 742 1,462 132 146 385
Source: Appendix 3. Excludes upgrader projects.
Over the 2000-2007 period oil sands‟ output grew at a compound annual growth rate of
10.0 per cent, and strong positive output growth is expected to continue into the foreseeable
future as new projects are completed.23
According to the most recent projections produced by
CAPP (2008a), output will reach 2.8 million barrels per day (1.02 billion barrels per year) by
2015 and 3.5 million barrels per day (1.28 billion barrels per year) by 2020. The NEB (2006)
estimates that oil sands output will be between 3.0 and 4.5 million barrels per day (1.1 and 1.6
billion barrels per year) by 2015. These estimates already recognized that some of the proposed
23 The NEB (2006) projections for oil sands output are rooted in a comprehensive survey of oil sands projects which will come
on-stream between now and 2023, with many projects with a yet to be determined date of completion. A complete list of these
projects can be found in Appendix 3. Our analysis of these projects suggests that if they are all completed on time (we exclude
upgrader projects), oil sands production would be around 1.85 billion barrels per day in 2015. If only projects currently operating
or under construction (with the last one expected to start production in 2009) were operating in 2015, production would be 610
million barrels per year (26 per cent higher than production in 2007). If we add projects already approved, we obtain a production
level of 967 million barrels per year (twice the 2007 level). The remaining future production is from projects that have either filed
an application (225 million barrels), are under disclosure (148 million barrels) or have been announced (543 million barrels). Of
course, the completion of these projects is by no means certain. In fact, projects at any phase of development can be delayed or
cancelled if costs are skyrocketing and demand conditions do not justify timely completion. Nonetheless, the likeliness of
cancellation is reduced as project move closer to being operational.
16
projects will not be completed. Indeed, if all projects were completed on time, production in
2015 could reach 1.85 billion barrel per year (Table 3).
Given the rapid development of the oil sands, the average annual extraction rate over a
number of future years will be greater than the current extraction rate. This means that the
estimated reserve life should be less than 358 years even if we assume that the total reserve is
172.7 billion barrels. While we know the projections of CAPP, NEB, and others, however, we
do not know the true future extraction rate with certainty. In keeping with our approach in this
report, we adopt several alternative estimates of the total reserve life (and, implicitly, of the
annual extraction rate). For the base case scenario, we assume that the extraction rate in 2015
and beyond will be stable at 1.35 billion barrels per year, the mid-point of NEB (2006) estimates
for 2015. For the period between 2007 and 2015, we assume that the extraction rate increases
linearly from 482 million barrels in 2007 to 1.35 billion barrels in 2015. This assumption
translates into a total reserve life of 130 years for Canada‟s crude bitumen reserves of 172.7
billion barrels. For the lower bound, we adopt a reserve life of 400 years and for the upper bound
we adopt a reserve life of 46 years.
Average Resource Rent per Barrel
Per barrel of output, the amount of rent that accrues to society depends upon the per-
barrel revenue (that is, the price the firm can charge for its output) and the per-barrel costs of
extraction and processing. Both of these vary substantially over time.
Statistics Canada does not explicitly make use of per-barrel prices in its resource
valuation procedure. Instead, they use industry survey data to measure industry-wide revenues,
operating costs, and capital costs (equivalent to depreciation). In 2007, the implicit per-barrel
price derived from these data was $56.0 per barrel of output from the oil sands (Table 4). This
was higher than market prices for crude bitumen which averaged $41.1 over the year, but lower
than the price of West Texas Intermediate (WTI) crude oil which averaged $72.7 over the year.
The explanation lies with the fact that oil sands output is a mix of bitumen (56 per cent of total
production volume in 2006) and synthetic crude oil (44 per cent of total volume in 2006), with
the latter commanding a price roughly in line with WTI crude oil.
To project the value of future oil sands output, we adopt a bottom-up approach and use
per-barrel data to carry out our valuation. This means that we must have reasonable estimates of
future per-barrel resource rents. Crude oil prices have exhibited an upward trend since 2003, and
particularly since the beginning of 2008, although they have fallen sharply since August 2008.24
Table 4 contains ERCB records of average oil prices, including the price of crude bitumen, from
2003 to 2008.
24 Falling prices have raised concerns over the sustainability of profits derived from production in the oil sands. On October 30,
2008, Suncor released a document detailing its ability to make profits despite lower oil prices. It noted that even with oil prices at
$60 USD per barrel, it would make a profit of $28 CAD per barrel (Tait, 2008). In other words, significantly lower oil prices
would be needed for oil sands operations to become unprofitable.
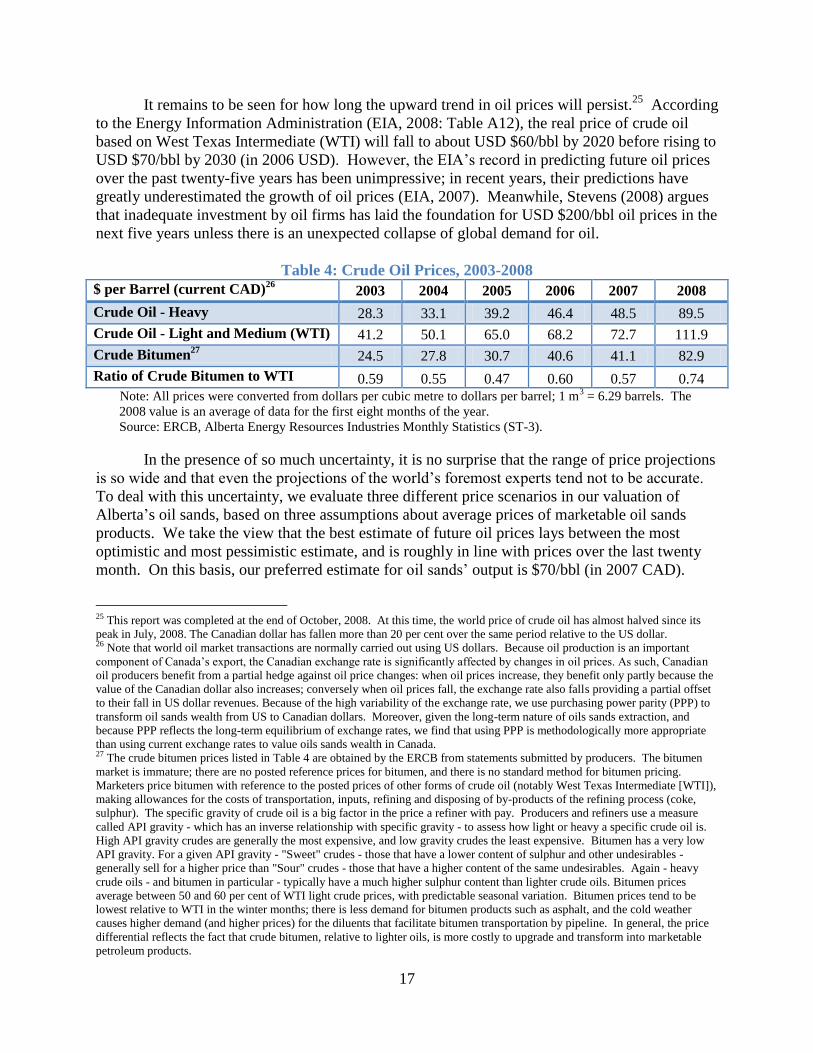
17
It remains to be seen for how long the upward trend in oil prices will persist.25
According
to the Energy Information Administration (EIA, 2008: Table A12), the real price of crude oil
based on West Texas Intermediate (WTI) will fall to about USD $60/bbl by 2020 before rising to
USD $70/bbl by 2030 (in 2006 USD). However, the EIA‟s record in predicting future oil prices
over the past twenty-five years has been unimpressive; in recent years, their predictions have
greatly underestimated the growth of oil prices (EIA, 2007). Meanwhile, Stevens (2008) argues
that inadequate investment by oil firms has laid the foundation for USD $200/bbl oil prices in the
next five years unless there is an unexpected collapse of global demand for oil.
Table 4: Crude Oil Prices, 2003-2008
$ per Barrel (current CAD)26
2003 2004 2005 2006 2007 2008
Crude Oil - Heavy 28.3 33.1 39.2 46.4 48.5 89.5
Crude Oil - Light and Medium (WTI) 41.2 50.1 65.0 68.2 72.7 111.9
Crude Bitumen27
24.5 27.8 30.7 40.6 41.1 82.9
Ratio of Crude Bitumen to WTI 0.59 0.55 0.47 0.60 0.57 0.74
Note: All prices were converted from dollars per cubic metre to dollars per barrel; 1 m3 = 6.29 barrels. The
2008 value is an average of data for the first eight months of the year.
Source: ERCB, Alberta Energy Resources Industries Monthly Statistics (ST-3).
In the presence of so much uncertainty, it is no surprise that the range of price projections
is so wide and that even the projections of the world‟s foremost experts tend not to be accurate.
To deal with this uncertainty, we evaluate three different price scenarios in our valuation of
Alberta‟s oil sands, based on three assumptions about average prices of marketable oil sands
products. We take the view that the best estimate of future oil prices lays between the most
optimistic and most pessimistic estimate, and is roughly in line with prices over the last twenty
month. On this basis, our preferred estimate for oil sands‟ output is $70/bbl (in 2007 CAD).
25 This report was completed at the end of October, 2008. At this time, the world price of crude oil has almost halved since its
peak in July, 2008. The Canadian dollar has fallen more than 20 per cent over the same period relative to the US dollar. 26 Note that world oil market transactions are normally carried out using US dollars. Because oil production is an important
component of Canada‟s export, the Canadian exchange rate is significantly affected by changes in oil prices. As such, Canadian
oil producers benefit from a partial hedge against oil price changes: when oil prices increase, they benefit only partly because the
value of the Canadian dollar also increases; conversely when oil prices fall, the exchange rate also falls providing a partial offset
to their fall in US dollar revenues. Because of the high variability of the exchange rate, we use purchasing power parity (PPP) to
transform oil sands wealth from US to Canadian dollars. Moreover, given the long-term nature of oils sands extraction, and
because PPP reflects the long-term equilibrium of exchange rates, we find that using PPP is methodologically more appropriate
than using current exchange rates to value oils sands wealth in Canada. 27 The crude bitumen prices listed in Table 4 are obtained by the ERCB from statements submitted by producers. The bitumen
market is immature; there are no posted reference prices for bitumen, and there is no standard method for bitumen pricing.
Marketers price bitumen with reference to the posted prices of other forms of crude oil (notably West Texas Intermediate [WTI]),
making allowances for the costs of transportation, inputs, refining and disposing of by-products of the refining process (coke,
sulphur). The specific gravity of crude oil is a big factor in the price a refiner with pay. Producers and refiners use a measure
called API gravity - which has an inverse relationship with specific gravity - to assess how light or heavy a specific crude oil is.
High API gravity crudes are generally the most expensive, and low gravity crudes the least expensive. Bitumen has a very low
API gravity. For a given API gravity - "Sweet" crudes - those that have a lower content of sulphur and other undesirables -
generally sell for a higher price than "Sour" crudes - those that have a higher content of the same undesirables. Again - heavy
crude oils - and bitumen in particular - typically have a much higher sulphur content than lighter crude oils. Bitumen prices
average between 50 and 60 per cent of WTI light crude prices, with predictable seasonal variation. Bitumen prices tend to be
lowest relative to WTI in the winter months; there is less demand for bitumen products such as asphalt, and the cold weather
causes higher demand (and higher prices) for the diluents that facilitate bitumen transportation by pipeline. In general, the price
differential reflects the fact that crude bitumen, relative to lighter oils, is more costly to upgrade and transform into marketable
petroleum products.

18
This estimate corresponds to a WTI price of $75/bbl (in 2008 USD) and reflects oil prices as of
mid-October, 2008.28
It remains slightly below the average price of oil sands output for 2007-
2008 and is only slightly above the EIA (2008) forecast.
As a lower-bound we choose $56/bbl for oil sands output, the implicit price derived from
Statistics Canada 2007 valuation of the oil sands, which allows for a more direct comparison of
our estimates with those of Statistics Canada. This corresponds roughly to a WTI price of
$60.00/bbl in 2008 USD. For our upper-bound estimate, we simply assume that the WTI price
rises to $120.00/bbl in 2008 USD. The corresponding oil sands‟ output price in 2007 CAD is
$113.94/bbl, which we round down to $110.00/bbl.
To recapitulate: our low, base, and high projections of the future price of output for the
oil sands are $56/bbl, $70/bbl, and $110/bbl (CAD), respectively. We believe that these
estimates encompass a realistic range of likely future prices for oil sands output.
Extraction costs mainly include capital and maintenance costs, the costs of input
materials such as steel and natural gas, and labour costs. In a factsheet, the Government of
Alberta Department of Energy records that operating costs to produce a barrel of oil from
bitumen averaged about $18 in 2004 (Government of Alberta 2006). Based on Statistics
Canada‟s official estimates, extraction costs amounted to about $19 per barrel in 2005.
According to CAPP (2008b), costs of extraction in the oil sands have increased in recent years,
largely due to the rising prices of steel and natural gas. A labour shortage in the oil sands region
also accounts for part of increased extraction costs. In fact, based on Statistics Canada‟s official
estimates, extraction costs had increased to about $21.9 per barrel in 2007.
On the other hand, technological progress may reduce extraction costs. As technology
advances, a decrease in the cost of the production of crude bitumen would be expected through
faster processing, reduced production loss, and higher labour productivity. Given stable oil
prices, these changes would make oil sands development more economically profitable,
attracting more investment and, in turn, promoting further technological progress. As more oil
sands projects develop and current developments become older, however, reserves become
harder to extract. Indeed, extraction rates from current oil fields diminish or face rising
production costs as they must reach deeper in the ground, and new developments are
concentrated on previously untapped and generally less productive reserves.
In summary, trends in extraction costs are difficult to predict. Not only do they vary with
the of natural gas, materials and labour (all of which depend in part on the pace of development),
28 We use a composite of the price of WTI crude oil and crude bitumen to value oil sands output. Based on 2007 production
volume, we assume that production is divided roughly half and half between crude bitumen and synthetic crude oil. The average
price ratio of crude bitumen to light and medium crude oil over the 2003-2008 period (based on Table 4) was 0.59. Given that
the current spot price of WTI oil is about USD $75/bbl (as of October 15, 2008), the implied estimate of the price for oil sands
output in current CAD is:
[$75 (USD/bbl) * 1.59 * (119.81/121.71)(2007USD/2008USD) * 1.209(CAD/USD)] / 2 = $70.96 (CAD/bbl),
which we round to $70.00/bbl for simplicity. The adjustments are based on the US GDP Deflator (US Department of Commerce,
Bureau of Economic Analysis) and the 2007 Canada/US PPP exchange rate (OECD). The same approach is used in all such
conversions in this paper.
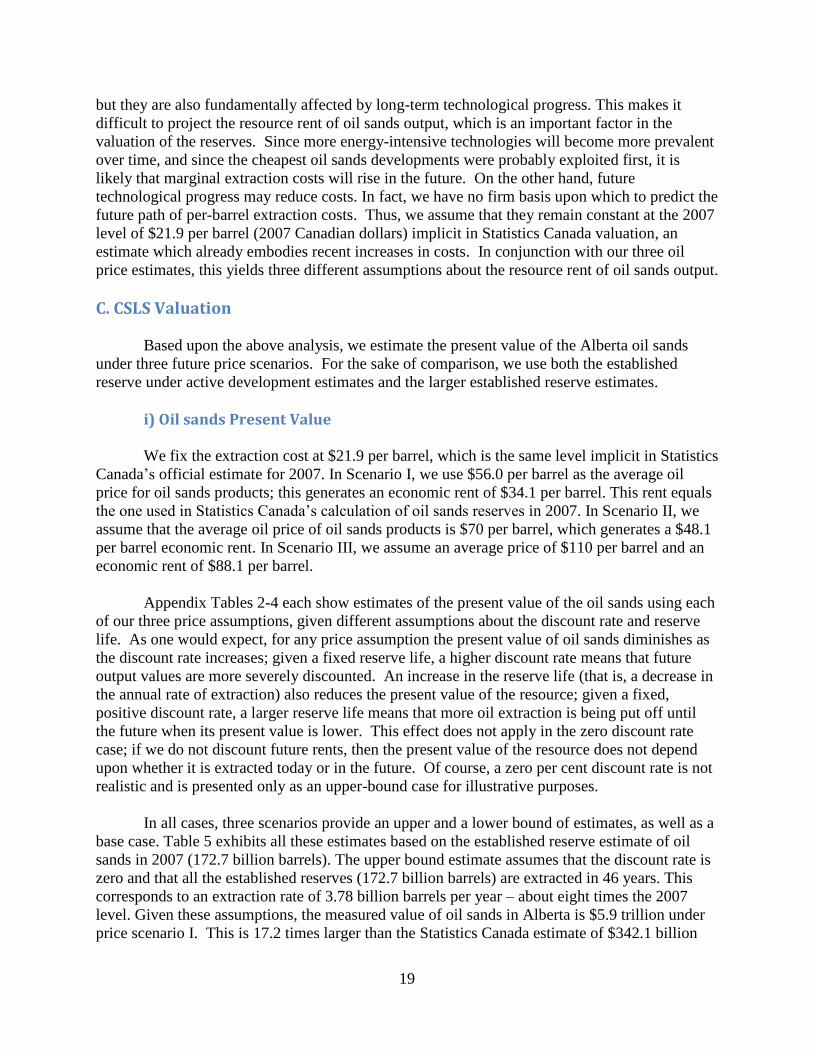
19
but they are also fundamentally affected by long-term technological progress. This makes it
difficult to project the resource rent of oil sands output, which is an important factor in the
valuation of the reserves. Since more energy-intensive technologies will become more prevalent
over time, and since the cheapest oil sands developments were probably exploited first, it is
likely that marginal extraction costs will rise in the future. On the other hand, future
technological progress may reduce costs. In fact, we have no firm basis upon which to predict the
future path of per-barrel extraction costs. Thus, we assume that they remain constant at the 2007
level of $21.9 per barrel (2007 Canadian dollars) implicit in Statistics Canada valuation, an
estimate which already embodies recent increases in costs. In conjunction with our three oil
price estimates, this yields three different assumptions about the resource rent of oil sands output.
C. CSLS Valuation
Based upon the above analysis, we estimate the present value of the Alberta oil sands
under three future price scenarios. For the sake of comparison, we use both the established
reserve under active development estimates and the larger established reserve estimates.
i) Oil sands Present Value
We fix the extraction cost at $21.9 per barrel, which is the same level implicit in Statistics
Canada‟s official estimate for 2007. In Scenario I, we use $56.0 per barrel as the average oil
price for oil sands products; this generates an economic rent of $34.1 per barrel. This rent equals
the one used in Statistics Canada‟s calculation of oil sands reserves in 2007. In Scenario II, we
assume that the average oil price of oil sands products is $70 per barrel, which generates a $48.1
per barrel economic rent. In Scenario III, we assume an average price of $110 per barrel and an
economic rent of $88.1 per barrel.
Appendix Tables 2-4 each show estimates of the present value of the oil sands using each
of our three price assumptions, given different assumptions about the discount rate and reserve
life. As one would expect, for any price assumption the present value of oil sands diminishes as
the discount rate increases; given a fixed reserve life, a higher discount rate means that future
output values are more severely discounted. An increase in the reserve life (that is, a decrease in
the annual rate of extraction) also reduces the present value of the resource; given a fixed,
positive discount rate, a larger reserve life means that more oil extraction is being put off until
the future when its present value is lower. This effect does not apply in the zero discount rate
case; if we do not discount future rents, then the present value of the resource does not depend
upon whether it is extracted today or in the future. Of course, a zero per cent discount rate is not
realistic and is presented only as an upper-bound case for illustrative purposes.
In all cases, three scenarios provide an upper and a lower bound of estimates, as well as a
base case. Table 5 exhibits all these estimates based on the established reserve estimate of oil
sands in 2007 (172.7 billion barrels). The upper bound estimate assumes that the discount rate is
zero and that all the established reserves (172.7 billion barrels) are extracted in 46 years. This
corresponds to an extraction rate of 3.78 billion barrels per year – about eight times the 2007
level. Given these assumptions, the measured value of oil sands in Alberta is $5.9 trillion under
price scenario I. This is 17.2 times larger than the Statistics Canada estimate of $342.1 billion
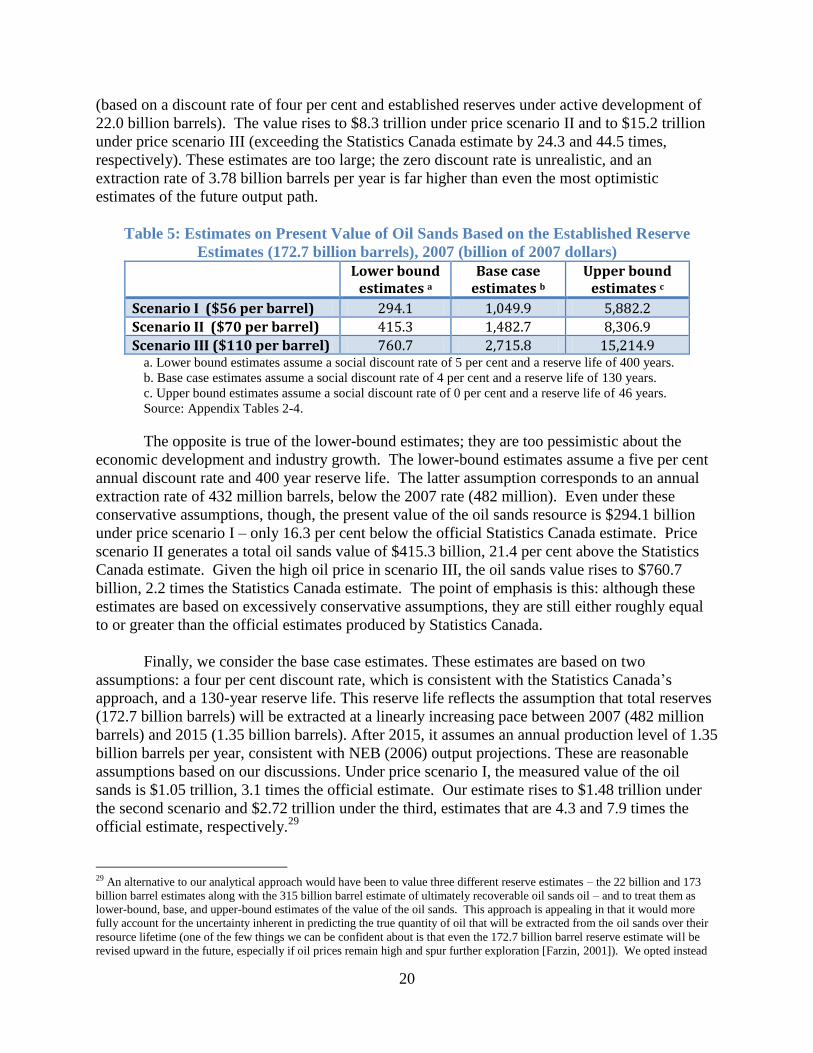
20
(based on a discount rate of four per cent and established reserves under active development of
22.0 billion barrels). The value rises to $8.3 trillion under price scenario II and to $15.2 trillion
under price scenario III (exceeding the Statistics Canada estimate by 24.3 and 44.5 times,
respectively). These estimates are too large; the zero discount rate is unrealistic, and an
extraction rate of 3.78 billion barrels per year is far higher than even the most optimistic
estimates of the future output path.
Table 5: Estimates on Present Value of Oil Sands Based on the Established Reserve
Estimates (172.7 billion barrels), 2007 (billion of 2007 dollars)
Lower bound estimates a
Base case estimates b
Upper bound estimates c
Scenario I ($56 per barrel) 294.1 1,049.9 5,882.2
Scenario II ($70 per barrel) 415.3 1,482.7 8,306.9 Scenario III ($110 per barrel) 760.7 2,715.8 15,214.9
a. Lower bound estimates assume a social discount rate of 5 per cent and a reserve life of 400 years.
b. Base case estimates assume a social discount rate of 4 per cent and a reserve life of 130 years.
c. Upper bound estimates assume a social discount rate of 0 per cent and a reserve life of 46 years.
Source: Appendix Tables 2-4.
The opposite is true of the lower-bound estimates; they are too pessimistic about the
economic development and industry growth. The lower-bound estimates assume a five per cent
annual discount rate and 400 year reserve life. The latter assumption corresponds to an annual
extraction rate of 432 million barrels, below the 2007 rate (482 million). Even under these
conservative assumptions, though, the present value of the oil sands resource is $294.1 billion
under price scenario I – only 16.3 per cent below the official Statistics Canada estimate. Price
scenario II generates a total oil sands value of $415.3 billion, 21.4 per cent above the Statistics
Canada estimate. Given the high oil price in scenario III, the oil sands value rises to $760.7
billion, 2.2 times the Statistics Canada estimate. The point of emphasis is this: although these
estimates are based on excessively conservative assumptions, they are still either roughly equal
to or greater than the official estimates produced by Statistics Canada.
Finally, we consider the base case estimates. These estimates are based on two
assumptions: a four per cent discount rate, which is consistent with the Statistics Canada‟s
approach, and a 130-year reserve life. This reserve life reflects the assumption that total reserves
(172.7 billion barrels) will be extracted at a linearly increasing pace between 2007 (482 million
barrels) and 2015 (1.35 billion barrels). After 2015, it assumes an annual production level of 1.35
billion barrels per year, consistent with NEB (2006) output projections. These are reasonable
assumptions based on our discussions. Under price scenario I, the measured value of the oil
sands is $1.05 trillion, 3.1 times the official estimate. Our estimate rises to $1.48 trillion under
the second scenario and $2.72 trillion under the third, estimates that are 4.3 and 7.9 times the
official estimate, respectively.29
29 An alternative to our analytical approach would have been to value three different reserve estimates – the 22 billion and 173
billion barrel estimates along with the 315 billion barrel estimate of ultimately recoverable oil sands oil – and to treat them as
lower-bound, base, and upper-bound estimates of the value of the oil sands. This approach is appealing in that it would more
fully account for the uncertainty inherent in predicting the true quantity of oil that will be extracted from the oil sands over their
resource lifetime (one of the few things we can be confident about is that even the 172.7 billion barrel reserve estimate will be
revised upward in the future, especially if oil prices remain high and spur further exploration [Farzin, 2001]). We opted instead

21
ii) A Comparison with Statistics Canada
Thus, under reasonable assumptions, we estimate that the present value of the Alberta oil
sands is about $1.48 trillion. Of the difference between this estimate and Statistics Canada
estimate roughly 19 per cent is attributable to the choice of a wider reserve definition, about 38
per cent follows from assuming a slightly higher price for oil sands output, and 43 per cent is due
to the adoption a more realistic future extraction rate.30
Changing only the reserve assumption, from 22.0 to 172.7 billion barrels, increases
Statistics Canada estimate by $68.6 billion; changing the price assumption, from $56 to $70 per
barrel, increases the estimate by $140.5 billion; and changing the extraction rate assumption,
from a constant 482 million barrels per year to 1,350 million barrels per year in 2015 and
beyond, increases the estimate by $159.9 billion. The compound effect of changing all three
assumptions simultaneously is to add 1.14 trillion to the initial estimate ($342.1 billion).
iii) Impact on Wealth Estimates
The importance of these revisions is demonstrated by their impact on the measured
wealth of Canadians and Albertans. In Statistics Canada‟s national wealth accounts, tangible
assets are categorized as produced and non-produced assets. Produced assets include residential
and non-residential structures, machinery and equipment, consumer durable goods, and
businesses‟ inventories. Non-produced assets include natural resources such as the oil sands
forests, minerals, and other naturally-occurring assets, in addition to land.
According to Statistics Canada‟s oil sands valuation, the oil sands accounted for 27 per
cent of the natural resource wealth of Canada in 2007 (Table 6), and 62 per cent that of Alberta
(Appendix Table 5). By comparison, our preferred estimates increase the share of the oil sands
in total natural resource wealth to 61 per cent for Canada and 88 per cent for Alberta. In terms of
total tangible wealth, the oil sands‟ 2007 share was 5 per cent for Canada and 37 per cent for
Alberta31
according to Statistics Canada estimates. Our estimates increase those shares to 18 and
72 per cent, respectively. These are significant increases in the relative importance of the oil
sands.
The oil sands are a very important component of Canada‟s wealth. According to official
estimates, total tangible wealth in Canada in 2007 was $6.9 trillion. Using our preferred estimate,
oil sands‟ wealth is almost as important as wealth derived from land and is almost 7 times as
important as wealth from all minerals. The oil sands are valued at almost the same level as
to focus on the 174 billion barrel estimate because it is the single best estimate of economically viable reserves given current
knowledge (even if we had adopted the alternative approach, 172.7 billion barrels would have been singled out as our preferred
reserve estimate) and because too many additional scenarios would have complicated the paper without adding much more value.
For interest‟s sake, we note that the 315 billion barrel figure yields a present value estimate of $1.06 trillion under base-case
assumptions, which assumes an annual extraction rate of 1,350 million barrels per year after 2015 (for 315 billion barrels, this
translates into a 236 reserve life). In other words, if we used realistic assumption about the extraction rate, the choice of reserves
becomes much less important, with the difference between reserves of 172.7 billion barrels and 315.0 billion barrels amounting
to less than $10 billion because of the low present value of extraction well into the future. 30 This reflects the redistribution of the compound effect of changing all three assumptions at once in proportion of the effect of
changing each of the assumption individually. 31 For Alberta, inventories, consumer durables and land are not included in total tangible wealth. For Alberta, total tangible
wealth refers to net capital stock and natural resources wealth. See Appendix Table 5 for more details.
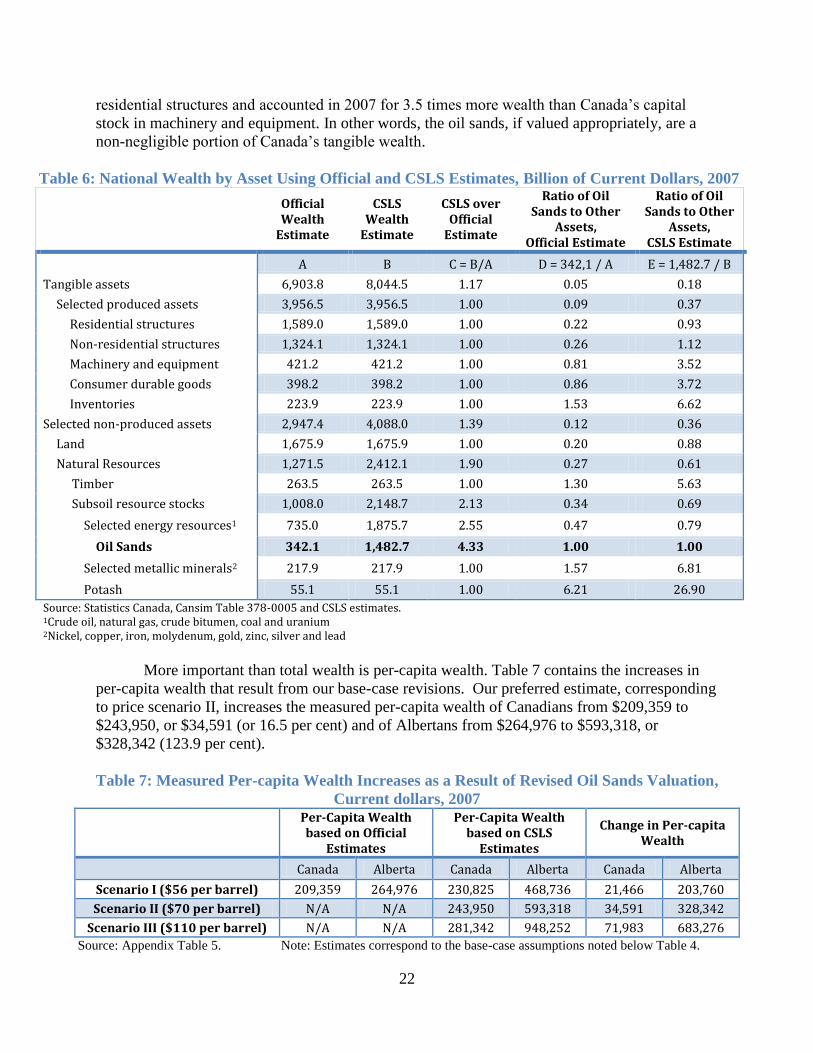
22
residential structures and accounted in 2007 for 3.5 times more wealth than Canada‟s capital
stock in machinery and equipment. In other words, the oil sands, if valued appropriately, are a
non-negligible portion of Canada‟s tangible wealth.
Table 6: National Wealth by Asset Using Official and CSLS Estimates, Billion of Current Dollars, 2007
Official Wealth
Estimate
CSLS Wealth
Estimate
CSLS over Official
Estimate
Ratio of Oil Sands to Other
Assets, Official Estimate
Ratio of Oil Sands to Other
Assets, CSLS Estimate
A B C = B/A D = 342,1 / A E = 1,482.7 / B
Tangible assets 6,903.8 8,044.5 1.17 0.05 0.18
Selected produced assets 3,956.5 3,956.5 1.00 0.09 0.37
Residential structures 1,589.0 1,589.0 1.00 0.22 0.93
Non-residential structures 1,324.1 1,324.1 1.00 0.26 1.12
Machinery and equipment 421.2 421.2 1.00 0.81 3.52
Consumer durable goods 398.2 398.2 1.00 0.86 3.72
Inventories 223.9 223.9 1.00 1.53 6.62
Selected non-produced assets 2,947.4 4,088.0 1.39 0.12 0.36
Land 1,675.9 1,675.9 1.00 0.20 0.88
Natural Resources 1,271.5 2,412.1 1.90 0.27 0.61
Timber 263.5 263.5 1.00 1.30 5.63
Subsoil resource stocks 1,008.0 2,148.7 2.13 0.34 0.69
Selected energy resources1 735.0 1,875.7 2.55 0.47 0.79
Oil Sands 342.1 1,482.7 4.33 1.00 1.00
Selected metallic minerals2 217.9 217.9 1.00 1.57 6.81
Potash 55.1 55.1 1.00 6.21 26.90
Source: Statistics Canada, Cansim Table 378-0005 and CSLS estimates. 1Crude oil, natural gas, crude bitumen, coal and uranium 2Nickel, copper, iron, molydenum, gold, zinc, silver and lead
More important than total wealth is per-capita wealth. Table 7 contains the increases in
per-capita wealth that result from our base-case revisions. Our preferred estimate, corresponding
to price scenario II, increases the measured per-capita wealth of Canadians from $209,359 to
$243,950, or $34,591 (or 16.5 per cent) and of Albertans from $264,976 to $593,318, or
$328,342 (123.9 per cent).
Table 7: Measured Per-capita Wealth Increases as a Result of Revised Oil Sands Valuation,
Current dollars, 2007 Per-Capita Wealth
based on Official Estimates
Per-Capita Wealth based on CSLS
Estimates
Change in Per-capita Wealth
Canada Alberta Canada Alberta Canada Alberta
Scenario I ($56 per barrel) 209,359 264,976 230,825 468,736 21,466 203,760
Scenario II ($70 per barrel) N/A N/A 243,950 593,318 34,591 328,342
Scenario III ($110 per barrel) N/A N/A 281,342 948,252 71,983 683,276
Source: Appendix Table 5. Note: Estimates correspond to the base-case assumptions noted below Table 4.

23
IV. Additional Considerations: The Social Costs of Greenhouse Gas Emissions
Until now, the focus of this report has been on measuring the total rent of the oil sands in
present-value terms. In taking this approach, we have ignored important non-market costs
associated with the development of the oil sands resources. Of particular concern are the social
costs associated with the emission of greenhouse gases (GHGs) during the extraction and early-
stage upgrading of the bitumen. By „social costs of GHG emissions,‟ we mean costs that are
borne by individuals other than the individual actors whose activities produce the emissions.
These may be market costs that can be evaluated with direct reference to market prices; an
example is property damage that might result from desertification, rising sea levels, or an
increase in the frequency and severity of extreme weather events. There may also be non-market
costs, such as a greater number of deaths from extreme weather events or the psychic damages
that one might experience upon learning that a species of animal has become extinct. In light of
the growing body of climatologic literature supporting an association between anthropogenic
GHG emissions and global climate change, no analysis of the „true value‟ of the oil sands would
be complete without an accounting of the social costs of the GHG emissions that arise from oil
sands development.32
In this subsection, we estimate the total social costs of the Alberta oil sands‟ GHG
emissions. Our approach is to combine credible projections of future GHG emissions and oil
sands output to produce estimates of future per-barrel GHG emissions intensity. These, along
with estimates of the per-tonne social costs of GHG emissions, are then used to estimate the per-
barrel social cost of oil sands GHG emissions. We can then estimate the total value of the oil
sands net of those costs. Henceforth, we shall refer to the social cost of CO2-equivalent GHG
emissions as SCC, the common shorthand for the „social cost of carbon.‟
A. Per-Tonne Social Cost of GHG Emissions
Estimates of the SCC appear frequently in the literature. The estimation procedures are
complex and depend on a set of key assumptions and methodological judgments.33
In this report,
we do not make an original contribution to the literature on SCC estimation; we take the
literature as-is and select a set of estimates that reasonably encompasses the range of estimates
found in the literature.
Tol provides two recent and comprehensive meta-studies of the pertinent literature. Tol
(2005) compares 103 estimates of the SCC and finds that studies with greater uncertainties tend
32 In addition to the social costs of GHG emissions, oil sands development may give rise to other social costs through its
deleterious impact on the Athabasca watershed, for example (Griffiths et al., 2006), or through the loss of boreal forests (Grant et
al. (2008) or stresses to social cohesion and public infrastructure associated with rapid economic change (Policy Options, 2006).
A number of recent publication have documented not only the potential environmental, social and political costs of the oil sands,
but also the long-term sustainability of oil sands operations given, for example, the limited supply of water needed to extract
bitumen (e.g. Clarke, 2008, Marsden, 2008, McCullum, 2006, Nikiforuk, 2008 and The Dominion, 2007). These effects are not
explicitly dealt with in this report, but they are important and would be addressed in an ideal study. Given the importance of the
oil sands for Alberta and Canada, quantifying these other costs should rank high on the agenda for further research on the oil
sands. A better understanding of these costs, as well as a national discussion revolving around the need or not to apply the
precautionary principle to avoid potential environmental catastrophes, could well shape the future development of the oil sands. 33 See Appendix 1 for a brief discussion of the methodology of SCC estimation.

24
to produce larger estimates.34
The simple average of the 103 SCC estimates is $40.86/tCO2-e,
expressed in 2007 current dollars.35
When estimates are weighted by quality, the average
declines to $36.23/tCO2-e for the full sample and to $18.11 for the subsample of estimates from
peer-reviewed studies.36
Tol concludes that “studies with better methods yield lower estimates
with smaller uncertainties than do studies with worse methods,” and that the SCC is unlikely to
exceed $21/tCO2-e.
In an updated meta-study, Tol (2007) evaluates 211 estimates of the SCC. He has
dispensed with the quality weighted means, but the simple averages for the full sample and for
the subsample of peer-reviewed studies are $52.05/tCO2-e and $29.10/tCO2-e, respectively.
Estimates have also tended to decline over time; the mean estimate is $87.31/tCO2-e in studies
done prior to 1996, but just $32.70/tCO2-e in studies done after 2001.
Tol himself offers a preferred estimate of $24.24/tCO2-e (Tol 1999). The estimate of
Stern et al. (2006) is $105.53/tCO2-e and appears in the top ten percent of all 211 estimates
considered in Tol [2007].
In previous work pertaining to the costs of environmental deterioration, the CSLS
(Osberg and Sharpe [2002, 2005]) has used the Fankhauser (1994) estimate of $8.76/tCO2-e for
emissions between 1991 and 2000. In light of the more recent literature, this estimate appears to
be conservative. It is well below the Tol (2005) average for quality-weighted peer-reviewed
studies ($18.11/tCO2-e), and less than one third of the Tol (2007) mean for peer-reviewed studies
($29.10/tCO2-e).
Our valuation of the social costs of the Alberta oil sands‟ GHG emissions demands a
more realistic measure of the per-tonne costs. We maintain the $8.76/tCO2-e figure as a lower
bound, but add two more estimates: $30/tCO2-e and $105/tCO2-e. These correspond,
respectively, to the Tol (2007) mean of estimates from peer-reviewed studies and to the Stern et
al. (2006) estimate. 37
They will serve as „best guess‟ and upper bound estimates in the analysis
of the oil sands.
34 Uncertainty is measured by the standard deviation of estimates. Tol finds that high uncertainty is associated with the use of
regional equity weights and low discount rates. 35 Tol (2005, 2007), along with many other studies, reports estimates of the SCC in US dollars per tonne of carbon (USD/tC).
Moreover, Tol (2005, 2007) does not convert the reviewed valuations into a common base year, arguing that the uncertainty
attached to these estimates trumps any price movements over the period concerned. To convert average values in 2007 CAD, we
use the mid-point of all estimates considered (1996 for Tol (2005) and 1998 for Tol (2007)). For specific estimates, we use the
year in which the estimate was published. We thus convert these estimates to 2007 Canadian dollars per tonne of CO2-equivalent
emissions (CAD/tCO2-e) using the US GDP deflator (US Department of Commerce, Bureau of Economic Analysis), the 2007
Canada/US PPP exchange rate (OECD), and a carbon-CO2 mass conversion factor of 1 tC = 3.664 tCO2-e. The factor analysis
is:
USD/tC ∙ (119.81/81.59)(2007USD/1996USD) ∙ 1.209(CAD/USD) ∙ (1/3.664)(tC/tCO2-e) = 2007CAD/tCO2-e
36 The quality weights are based upon the degree to which estimates satisfy a list of methodologically-desirable characteristics.
See Tol (2005:2070). 37 In our valuation of oil sands net of GHG costs, our upper-bound estimates of GHG costs is that obtained by Stern et al. (2006).
That estimate was obtained using a lower discount rate than in our base case, equivalent to approximately 2 per cent or expected
future consumption growth (an elasticity of marginal utility of consumption (η) of unity and a pure rate of time preference (δ) of
0.1 per cent – the discount rate is equal to [η*consumption growth + δ]). The choice of discount rate is far from being the only
variable affecting estimates of carbon prices, but given the importance of potential climate change damages in the far future, it
does significantly affect carbon prices. For example, Stern et al. (2006) mention in a technical annex to the postscript (p. 11) that

25
B. Emissions and Emissions Intensity
Alberta accounted for 32.9 per cent of Canada‟s GHG emissions in 2005, more than any
other province (Environment Canada, 2008:514). This was due to the prominence of the energy
industry in the Alberta economy; altogether, the fossil fuel industry accounts for about 10 per
cent of Canada‟s GHG emissions (Environment Canada, 2008:472).38
The oil sands themselves
account for four percent of Canada‟s emissions, making them the single largest industrial
contributor to the volume of GHG emissions in Canada (CAPP, 2008c). More importantly, they
are the largest contributor to Canadian emissions growth. Since the early 1990s, output growth
in the oil sands sector has been so great that total emissions from this source have increased even
as emissions per unit of output (intensity) have declined by as much as 45 per cent (Government
of Alberta, 2008). These trends are expected to continue into the foreseeable future and the oil
sands are projected to account for 41-47 per cent of „business-as-usual‟ Canadian emissions
growth between 2003 and 2010 (Bramley et al. 2005).39
These figures account for only the so-called upstream emissions from the oil sands; that
is, the emissions arising from the actual extraction, transportation, and early-stage upgrading of
the raw bitumen in the production of crude oil. Downstream emissions include all emissions
from the subsequent transportation and refinement of oil sands output through to the final
burning of fuel by consumers. In an ideal valuation of the oil sands, both upstream and
downstream costs and benefits would be included. The downstream valuation of costs and
benefits flowing from the oil sands, however, encompasses significant uncertainties.
On the cost side, as noted by Bramley et al. (2005:7) downstream emissions account for
75-80 per cent of the total lifecycle emissions of a given barrel of oil sands oil. Thus, the true
marginal contribution of oil sands output to global GHG emissions is estimated to be four to five
times larger than that of upstream emissions produced in the oil sands production process. End-
use combustion is by far the largest contributor to GHG emissions. Neabel and Francis (2005:13)
estimate that the combustion of fuel accounts for 70 per cent of lifecycle GHG emissions, with
bitumen production and upgrading accounting for slightly more than 20 per cent and refining and
transportation accounting for about 8 per cent. Such calculations may overestimate lifecycle
GHG emissions from the oil sands as a portion of oil sands output will likely not be combusted,
but will rather be used for paving roads or to produce waterproof products such as roofing felt.
Yet, it is true that the proportion that is combusted should rise over time as production increases
and demand for bitumen products remains stable.
using δ=2 (which amount to using a discount rate around four per cent) is roughly consistent with a halving of the social cost of
carbon. In an ideal valuation of the oil sands the social discount rate used for valuing GHG emissions and that used for valuing
net benefits from the oil sands would be consistent. In our valuation, we treat the price of carbon as exogenous. This issue is
mitigated by our sensitivity analysis in which a range of discount rates are used. Nonetheless, this aspect should be kept in mind
when assessing which scenarios are more or less likely to reflect an appropriate valuation of the oil sands. 38 Excluding fugitive emissions (e.g. venting and flaring from oil production, methane leaks from pipelines) and emissions by
pipelines which account for another 10 per cent of GHG emissions in Canada (Environment Canada, 2008). 39 Because of the way in which GHG emissions are categorized, it is difficult to obtain estimates of the latest trend for the oil
sands‟ industry. Indeed, the oil sands contribute to GHG emissions in the fossil fuel sector, in the mining sector, in the fugitive
sources sector and in the pipeline sector. Between 2003 and 2006, emissions in the fossil fuel industry decreased 7.7 per cent,
mining emissions were up 5.3 per cent, pipeline emissions increased 6.1 per cent and fugitive emissions increased 1.2 per cent
(Environment Canada 2008:514). By comparison, total GHG emissions in Canada decreased 2.7 per cent.

26
On the benefit side, the valuation
would be even more difficult. Indeed, in order
to obtain a valuation of downstream benefits,
we need to know the exact shape of the
demand curve for crude bitumen so as to
obtain an estimate of consumer surplus
(Figure 1).40 Given that short-term oil demand
is relatively inelastic (that is the demand curve
is steep) any valuation of short-term consumer
surplus would likely be very large. In the
longer-term, however, oil consumption does
appear to be significantly more elastic. For
example, the IEA (2004:140) provides
evidence that a strong correlation exists
between fuel prices and car fuel intensity (e.g.
litre per kilometer). Moreover, it is likely that
new technologies offering an alternative to
current oil-intensive technologies (e.g. electric
car) will become more affordable. Such
technologies would create a much more elastic demand for oil consumption, and would thus
potentially reduce the consumer surplus from end-use consumption. Because we do not have a
clear idea of the shape of the demand curve for both present and future periods, we cannot value
downstream benefits from consumption from the oil sands.
Given the difficulties associated with valuing downstream costs and benefits, this report
focuses on the upstream valuation of the oil sands.41
For comparison purposes, however, we also
provide estimates of oil sands wealth net of lifecycle GHG costs assuming no downstream
benefits (Appendix 3). These can be viewed as lower-bound estimates of oil sands wealth net of
GHG costs.42
40 Formally, we would need to estimate the compensating variation (CV) or the equivalent variation (EV) based on Hicksian
demand functions rather than the consumer surplus (which falls between CV and EV) which is based on Marshallian demand
functions. In simple terms, CV is s the amount of income you need to compensate an individual following a price change so that
he remains on the same level of utility while EV is s the income that you need to take away from an individual to make him
equivalently worse off or better off following a price change. Any such exercise would also require that we know the exact
market structure of the oil market. Figure 1 shows consumer surplus in a competitive market; it would be different for the oil
industry. 41 Another reason to focus on upstream GHG costs is that downstream GHG costs are not specific to the oil sands, but affect all
fossil fuel combustion. 42 Interestingly, one of these estimates suggests that oil sands development is a net cost to Canada and the world. But how likely
is it to be true that the oil sands have a negative present value? There are two aspects that must be considered: how likely are the
assumption buttressing these estimates and what is the future market regime under which oil sands development will occur? On
the first count, we find that a high social cost of carbon -- $105/tCO2-e or even higher – is not out of the question and that recent
developments in the literature suggest that it may be more reasonable than once thought. If nothing else, the possibility of the oil
sands having a negative present value should not be dismissed. Yet, we also note that that even conventional oil production could
give rise to net social costs under assumptions similar to those we have used. On the second count, we stress that if governments
develop a system where carbon is priced appropriately, either through a carbon tax or a cap-and-trade system, the floor NPV for
oil sand wealth would be zero as no production would occur if net benefits were negative. See Appendix 2 for a more detailed
discussion.
Figure 1: An Illustration of Consumer Surplus
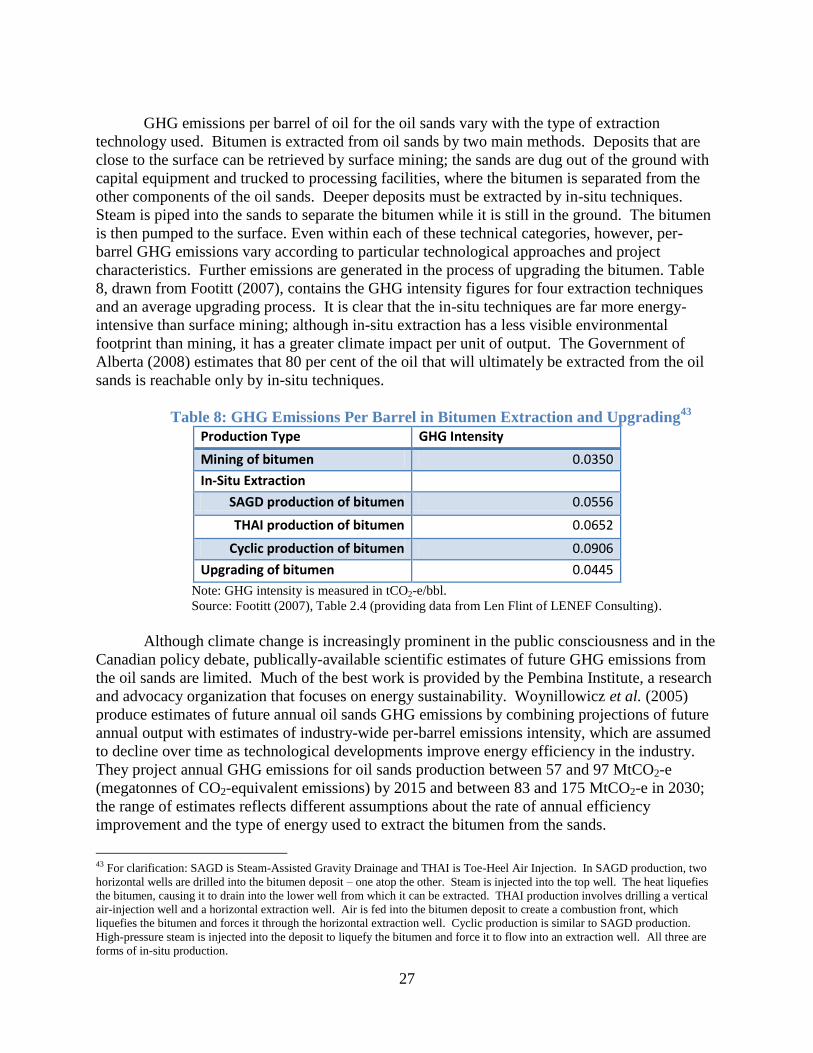
27
GHG emissions per barrel of oil for the oil sands vary with the type of extraction
technology used. Bitumen is extracted from oil sands by two main methods. Deposits that are
close to the surface can be retrieved by surface mining; the sands are dug out of the ground with
capital equipment and trucked to processing facilities, where the bitumen is separated from the
other components of the oil sands. Deeper deposits must be extracted by in-situ techniques.
Steam is piped into the sands to separate the bitumen while it is still in the ground. The bitumen
is then pumped to the surface. Even within each of these technical categories, however, per-
barrel GHG emissions vary according to particular technological approaches and project
characteristics. Further emissions are generated in the process of upgrading the bitumen. Table
8, drawn from Footitt (2007), contains the GHG intensity figures for four extraction techniques
and an average upgrading process. It is clear that the in-situ techniques are far more energy-
intensive than surface mining; although in-situ extraction has a less visible environmental
footprint than mining, it has a greater climate impact per unit of output. The Government of
Alberta (2008) estimates that 80 per cent of the oil that will ultimately be extracted from the oil
sands is reachable only by in-situ techniques.
Table 8: GHG Emissions Per Barrel in Bitumen Extraction and Upgrading43
Production Type GHG Intensity
Mining of bitumen 0.0350
In-Situ Extraction
SAGD production of bitumen 0.0556
THAI production of bitumen 0.0652
Cyclic production of bitumen 0.0906
Upgrading of bitumen 0.0445
Note: GHG intensity is measured in tCO2-e/bbl.
Source: Footitt (2007), Table 2.4 (providing data from Len Flint of LENEF Consulting).
Although climate change is increasingly prominent in the public consciousness and in the
Canadian policy debate, publically-available scientific estimates of future GHG emissions from
the oil sands are limited. Much of the best work is provided by the Pembina Institute, a research
and advocacy organization that focuses on energy sustainability. Woynillowicz et al. (2005)
produce estimates of future annual oil sands GHG emissions by combining projections of future
annual output with estimates of industry-wide per-barrel emissions intensity, which are assumed
to decline over time as technological developments improve energy efficiency in the industry.
They project annual GHG emissions for oil sands production between 57 and 97 MtCO2-e
(megatonnes of CO2-equivalent emissions) by 2015 and between 83 and 175 MtCO2-e in 2030;
the range of estimates reflects different assumptions about the rate of annual efficiency
improvement and the type of energy used to extract the bitumen from the sands.
43 For clarification: SAGD is Steam-Assisted Gravity Drainage and THAI is Toe-Heel Air Injection. In SAGD production, two
horizontal wells are drilled into the bitumen deposit – one atop the other. Steam is injected into the top well. The heat liquefies
the bitumen, causing it to drain into the lower well from which it can be extracted. THAI production involves drilling a vertical
air-injection well and a horizontal extraction well. Air is fed into the bitumen deposit to create a combustion front, which
liquefies the bitumen and forces it through the horizontal extraction well. Cyclic production is similar to SAGD production.
High-pressure steam is injected into the deposit to liquefy the bitumen and force it to flow into an extraction well. All three are
forms of in-situ production.

28
A more detailed analysis is provided by Bramley et al. (2005). They compile a database
of output projections for specific oil sands projects and apply emissions intensity estimates that
are specific to the type of technology being used in each project. The project- and technology-
specific emissions values are then aggregated to produce industry-wide estimates. The Bramley
et al. estimates are higher than those of Woynillowicz et al; they project emissions between 108
and 126.5 MtCO2-e by 2015.
The most recent high-quality estimates of which we are aware are those of Footitt (2007),
whose work is methodologically similar to the Bramley et al. (2005) study. Footitt draws upon
the database of the National Energy Board (NEB, 2006), which provides output projections for
about 160 oil sands projects for each year until 2015. By categorizing the projects according to
the type of extraction technology used, the author estimates how much of the future output will
be produced using each technology. These estimates are then multiplied by technology-specific
GHG intensity values (drawn from the same source used by Bramley et al. [2005]) and
aggregated to produce estimates of total GHG emissions in each year. The result is a set of three
projected emissions paths corresponding to the three output paths in NEB (2006): a Base Case,
which assumes that oil prices remain high and that economic conditions in the oil sands remain
conducive to investment; a Low Case, which assumes that economic conditions will become
unfavourable to oil sands development and cause output to fall; and an All Projects Case, which
assumes that all projects announced as of 2006 begin operations on schedule and at their name-
plate output levels.
Table 9: Estimates of Oil Sands Emissions Intensity
Year Upstream GHG Intensity (tCO2-e/bbl)
2006 0.070
2007 0.074
2008 0.076
2009 0.075
2010 0.078
2011 0.077
2012 0.077
2013 0.076
2014 0.075
2015 0.074
Source: Authors‟ calculations based upon data from NEB (2006), and Footitt (2007).
Under the base case scenario, Footitt projects oil sands GHG emissions of 80.7 MtCO2-e
in 2015. This is lower than all the other estimates mentioned thus far. Footit‟s projection rises to
121.8 MtCO2-e under the all projects scenario; this is closer to the range of the other estimates.
Footitt points out that the CAPP (2006) projection of the 2006-2015 oil sands output path lies
between the NEB (2006) base case and all projects scenarios and suggests that the true path of
total GHG emissions is also likely to end up somewhere between the base case and all projects

29
projections. This is in line with our earlier decision to adopt the mid-point of the NEB (2006)
base case and all projects scenarios as the most likely oil sand output path.
Using these projections of upstream GHG emissions along with the NEB (2006)
projections of future oil sands output, it is easy to calculate estimates of the average per-barrel
emissions intensities for each year between 2006 and 2015.44
The second column of contains
these estimates. They range between 0.070 tCO2-e/bbl and 0.078 tCO2-e/bbl. That the values do
not decline over time is noteworthy; it reflects the fact that although technological progress will
improve the efficiency of particular technologies, the overall mix of extraction technologies
across oil sands developments will shift to more energy-intensive technologies as firms exploit
deeper bitumen deposits that cannot be reached by surface mining. As our estimates of the per-
barrel upstream emissions intensities of oil sands output, we take the simple averages of the
values in Table 9: 0.075 tCO2-e/bbl.
C. Social Costs of the Oil Sands’ GHG Emissions
Table 10 recapitulates the estimates of average GHG emissions intensity and per-tonne
social costs that we have selected and provides a range of estimates of the per-barrel social cost
of oil sands output. The lower-bound, base, and upper-bound estimates correspond to the low,
base, and high estimates of the per-tonne social cost of upstream GHG emissions.
Table 10: Summary of Estimates Selected for GHG Cost Analysis
Estimate Type Social Cost ($/tCO2-e) GHG Intensity (tCO2-e/bbl)
Upstream Social Cost ($/bbl)
A B C = A * B
Lower Bound 8.76 0.075 0.66
Base 30.00 0.075 2.25
Upper Bound 105.00 0.075 7.86 Note: Costs are in 2007 Canadian dollars. Sources: Fankhauser (1994); Tol (2007); Stern et al. (2006); NEB (2006); Footitt (2007).
It is unsurprising that the range of estimates of GHG costs is wide, given the variety of
assumptions underlying them. According to our preferred estimates, the oil sands impose a total
social cost of $69.4 billion (Table 11). In making this estimate, we assume that each barrel of oil
sands output imposes a social cost of $2.25 and that damages are discounted at a rate of 4 per
cent per year over a 130-year reserve life (which implies an extraction rate of 1.35 billion barrels
per year after 2015, with production increasing linearly between 2007 and 2015 – roughly
consistent with the NEB [2006] estimate of oil sands output in 2015 assuming all projects that
had been announced in 2006 become operational on schedule). This total cost estimate is much
less than our preferred base-case estimate of the present value of oil sands rent, which is
$1,482.7 billion (see Table 5).
The extreme estimates are less realistic, but they are interesting as lower and upper
bounds. If each barrel of oil sands output imposes social GHG costs of $0.66 and we discount
costs at 5 per cent per year over a 400-year reserve life (which implies an annual extraction rate
44 GHG emissions intensity for a given year was identical across all three scenarios in Footit (2007).

30
of 432 million barrels – unrealistically low), then the present value of all the GHG damages that
will be imposed by oil sands development is just $5.7 billion. This is less than 2 per cent of our
lower-bound estimate of the present value of total oil sands which was $294.1 billion (see Table
5).
Table 11: Present Value of Upstream GHG Costs Caused by Oil Sands Development Social Cost of GHG Emissions ($/bbl)
Estimates (billions of 2007 CAD)
Lower Bound a Base Case b Upper Bound c
Social Cost at $0.66/bbl 5.7 20.3 114.0
Social Cost at $2.25/bbl 19.4 69.4 388.6
Social Cost at $7.86/bbl 67.9 242.3 1,357.4
a. Lower bound estimates assume a social discount rate of 5 per cent and a reserve life of 400 years.
b. Base case estimates assume a social discount rate of 4 per cent and a reserve life of 130 years.
c. Upper bound estimates assume a social discount rate of 0 per cent and a reserve life of 46 years.
Source: Authors‟ calculations.
If each barrel of output causes social GHG damages worth $7.86 and we discount future
damages at 0 per cent per year over a 46-year reserve life (which implies an annual extraction
rate of 3.75 billion barrels – unrealistically high), then the present value of the oil sands‟
upstream GHG damages is $1,357.4 billion. This is a staggeringly large value, but it remains
well below our upper-bound estimate of the present value of oil sands rent under price scenario I
(a crude bitumen price of $56/bbl) which was $5882.2 billion.
As explained earlier, focusing on upstream emissions allows for a more accurate, but
incomplete, comparison of costs and benefits related to oil sands developments. Almost all GHG
intensity estimates quoted in the literature and in public discourse account only for upstream
emissions. These are the numbers that are likely to be used, for example, to design policy
frameworks for GHG mitigation. By providing total social cost estimates for both upstream and
lifecycle emissions, we can obtain a sense of the degree to which the focus on upstream
emissions may affect the assessment of the oil sands. If we consider lifecycle emissions, the
GHG costs of oil sands development increase by a factor of 4.5 in each scenario (Appendix 3).
D. Present Value of the Oil Sands Net of GHG Costs
We are now in a position to estimate the net present value of a barrel of bitumen
produced from the oil sands net of GHG costs. Table 12 contains estimates of the net social
benefit of extracting one barrel of output today according to our different price and SCC
assumptions. The estimates range from a low of $26.2 per barrel to a high of $88.1 per barrel.
Our base case assumptions, with per-barrel prices at $70/bbl and SCC at $2.25/bbl suggest that
each barrel of output produced from the oil sands generates a net social benefit of $45.8.
Using these per barrel estimates, it is now possible to obtain the present value of the oil
sands net of those social costs. Table 12 contains several estimates of the net present value of the
oil sands based on three different sets of assumptions about the reserve life (or extraction rate)
and the discount rate. In all cases, we assume that the oil sands contain 172.7 billion barrels of
oil reserves.

31
Table 12: Net Benefit per Barrel in 2007 Dollars No Social Cost
$0.00/bbl Social Cost at
$0.66/bbl Social Cost at
$2.25/bbl Social Cost at
$7.86/bbl
Price at $56.00/bbl 34.1 33.4 31.8 26.2
Price at $70.00/bbl 48.1 47.4 45.8 40.2
Price at $110.00/bbl 88.1 87.4 85.8 80.2
Table 13 contains a set of estimates of the present value of the Alberta oil sands net of the
social costs of upstream GHG emissions. The net present value of the oil sands remains positive
and large even with GHG costs are taken into account. Our preferred estimate is $1,413.3 billion,
based upon the most reasonable set of assumptions – a four-percent discount rate, a 130-year
reserve life, and a social GHG cost of $2.25/bbl. This is 4.1 times larger than the official
Statistics Canada estimate of the value of the oil sands in spite of the fact that their estimate does
not account for any environmental damages.
Table 13: Present Value of Oil Sands Net of Upstream Social GHG Costs Estimates (billions of 2007 CAD)
Lower Bound a Base Case b Upper Bound c
Social Cost at $0.66/bbl
Scenario I ($56/bbl) 288.4 1,029.6 5,768.2
Scenario II ($70/bbl) 409.6 1,462.4 8,192.9
Scenario III ($110/bbl) 755 2,695.5 15,100.9
Social Cost at $2.25/bbl
Scenario I ($56/bbl) 274.7 980.5 5,493.6
Scenario II ($70/bbl) 395.9 1,413.3 7,918.3
Scenario III ($110/bbl) 741.3 2,646.4 14,826.3
Social Cost at $7.86/bbl
Scenario I ($56/bbl) 226.2 807.6 4,524.8
Scenario II ($70/bbl) 347.4 1,240.4 6,949.5
Scenario III ($110/bbl) 692.8 2,473.5 13,857.5
a. Lower bound estimates assume a social discount rate of 5 per cent and a reserve life of 400 years. b. Base case estimates assume a social discount rate of 4 per cent and a reserve life of 130 years. c. Upper bound estimates assume a social discount rate of 0 per cent and a reserve life of 46 years.
Table 14 provides the increases in measured per-capita wealth that correspond to our
estimates of the value of the oil sands net of GHG costs. According to our preferred estimate,
the valuation of the full 172.7 billion barrels of established reserves and the use of a realistic
future extraction rate increases the measured per-capita wealth of Canadians and Albertans by
$32,485 (or 15.5 per cent) and $308,355 (or 116.4 per cent).45
These changes are smaller than
45 The wealth from the oil sands will flow to individuals through higher tax revenues, royalty revenues and profits. It should be
noted that unlike taxes and royalty revenues, profits may accrue to foreigners rather than to Canadians. It is difficult, however, to
know what fraction of the benefits will be captured by foreigners in the future. Moreover, this is an issue for all types of resource
wealth. A additional issue arises if we try to attribute wealth specifically to Albertans as a portion of tax revenues will go to the
federal government. In this report, we assume that we can allocate the wealth according to the location of the resource. As such,
we assume that oil sands wealth will primarily accrue to Albertans.

32
before because of the social costs of GHG emissions, but they are still significant increases
compared to official Statistics Canada valuations.
Table 14: Measured Per-capita Wealth Increases as a Result of Oil Sands Valuation,
Net of GHG Costs
Change in Per-capita Wealth (2007 CAD)
Canada Alberta
Scenario I ($56 per barrel) 19,360 183,772
Scenario II ($70 per barrel) 32,485 308,355
Scenario III ($110 per barrel) 69,879 663,306
Note: Estimates correspond to the base-case assumptions noted below Table 4 and a carbon price of
$30/bbl
Source: Appendix Table 6.
Our analysis does demonstrate the practical importance of precise SCC estimates. As
environmental priorities become more prominent as issues of public policy, a strong base of
applied environmental economic research will grow more important. In order for that applied
research to yield firm and useful conclusions, estimates of the SCC must improve. This is an
area that demands further research.
On a smaller scale, our results also suggest that the value of the oil sands warrants further
study. As we have indicated throughout this section of the paper, our analysis is not all-
encompassing. Oil sands rent may not capture all the benefits of oil sands development, and
GHG emissions costs do not capture all of the external costs. Our analysis will hopefully
encourage more extensive and rigorous studies in the near future.

33
V. Conclusion
The future development of the oil sands carries significant challenges, be they political,
environmental or social. In the United States, talks of energy independence from hostile or
unfriendly countries means that US presidents may want to give great weight to the oil sands as a
source of reliable or secure energy supply. Should Canada favor the American market, or should
it diversify and freely welcome investment from other countries, including China, in the oil
sands? On the environment, Canada faces major international criticisms related to its booming
GHG emissions. Moreover, oil sands development not only has global significance through its
impact on climate change, but also domestic significance because of its potentially negative
impact on water supply and human health. Finally, the development of the oil sands exemplify
the economic shift in Canada, from Ontario and Quebec towards the West, and entails growing
geographical inequalities which may pose important challenges for Canada‟s society and unity.
In the words of Pierre Fournier (2008), “one way or another…the oil sands is likely the most
important economic and political issue for Canada for the coming decades.”
This report had three different but equally important objectives. First, we aimed to
critically review the methods used by Statistics Canada in their valuation of the Alberta oil sands
resource. We argued that the reserve definition chosen by Statistics Canada – established
reserves under active development, amounting to 22.0 billion barrels in 2007 – understates the
true magnitude of the oil sands as a natural asset. The full established reserves estimate,
encompassing 172.7 billion barrels in 2007, is a more accurate measure of the quantity of oil
likely to deliver economic benefits to Canadians in the future. Both approaches will inevitably
involve some error, but there is no reason to suppose that the more conservative estimate is likely
to be closer to the true reserve size than the full established reserve estimate. On the contrary,
given that the oil sands are estimated to possess 315 billion barrels of ultimately recoverable oil,
it is probable that the 173.7 billion barrel figure is a more reasonable estimate.
In light of these considerations, we produced new estimates of the total market value of
the Alberta oil sands based upon the 172.7 billion barrel reserve estimate. Under reasonable
assumptions, we estimated that the present value of the Alberta oil sands is about $1.48 trillion –
about 4.3 times the official Statistics Canada estimate. Of the difference between this estimate
and Statistics Canada estimate ($1.14 trillion), roughly 19 per cent was attributable to the choice
of a wider reserve definition, about 38 per cent follows from assuming a slightly higher price for
oil sands output, and 43 per cent was due to the adoption a more realistic future extraction rate.
In our view, given the important of the oil sands for Canada, Statistics Canada should
undertake a review of its methodology. Our analysis leads us to suggest three key
recommendations;
Statistics Canada should adopt a more realistic assumption about reserves. In particular,
the full established reserves estimate, encompassing 172.7 billion barrels in 2007, is a
more accurate measure of the quantity of oil likely to deliver economic benefits to
Canadians in the future. It should replace the current established reserves under active
development estimate which amounts to 22.0 billion barrels in 2007.

34
Statistics Canada should adopt a more realistic assumption about extraction rates. Future
extraction rates should internalize all available information, and should thus take into
account projects under construction, projects that have been approved and projects that
have been announced. While the assumption of a constant extraction is acceptable in
mature industries, it should not be used in booming industries like the non-conventional
oil industry.
Statistics Canada should aim to present a variety of estimates based on alternate
assumptions. If only one estimate can be presented, it should use more realistic
assumptions about future reserves and extraction rates.
The third objective was to take the analysis further by accounting for the social costs of
environmental deterioration associated with oil sands development. In particular, we focused on
the social costs of climate change associated with the emission of greenhouse gases during oil
sands development. Under reasonable assumptions, we estimated that the present value of the oil
sands, net of the social costs of greenhouse gas emissions, was $1.41 trillion, down from $1.48
trillion when these costs are not taken into account. This is 4.1 times the official Statistics
Canada estimate, which does not account for any environmental costs.
Oil sands development, however, have environmental and social costs that go well
beyond the GHG costs associated to upstream oil sands‟ production. There is a clear need for
further research on the downstream GHG costs and benefits of oil sands development. While this
report provides a preliminary estimate of downstream costs, it does not estimate downstream
benefits. In addition, there is ample scope for quantitative research focusing on environmental
and social costs beyond those related to climate change. Oil sands development is touted by
some as an unacceptable environmental and social catastrophe. As such, a comprehensive
valuation of all environmental costs would allow for a more conclusive debate on whether
Canada continue to support oil sands development, or if the massive future benefits derived from
oil sands development are outweigh by even larger environmental costs.
35
Bibliography
Bergerson, J. and Keith, D. (2006) “Life Cycle Assessment of Oil Sands Technologies,” Alberta
Energy Futures Project Paper No. 11, available online at
http://www.iseee.ca/files/iseee/ABEnergyFutures-11.pdf.
Boardman, A., Moore, M., and Vining, A. (2008) “Proposed Social Discount Rates for Canada
Based on Future Growth,” paper prepared for a conference on The Future of Evidence-Based
Regulation, organized by the Policy Research Initiative, Ottawa, on March 13, 2008.
Born, A. (1992) “Development of Natural Resource Accounts: Physical and Monetary Accounts
for Crude Oil and Natural Gas Reserves in Alberta, Canada,” Statistics Canada National
Accounts and Environment Division Discussion Paper no. 11, Ottawa.
Bramley, M., Neabel, D., and Woynillowicz, D. (2005) “The Climate Implications of Canada‟s
Oil Sands Development.” Pembina Institute Backgrounder, available online at
http://pubs.pembina.org/reports/oilsands-climate-implications-backgrounder.pdf.
British Petroleum (2008) “BP Statistical Review of World Energy June 2008,” available online
at http://www.bp.com/statisticalreview.
Canadian Association of Petroleum Producers (2005a) “Oil Sands Economic Impacts Across
Canada,” available online at http://www.capp.ca/raw.asp?x=1&dt=NTV&e=PDF&dn=92079.
Canadian Association of Petroleum Producers (2005b) “Bitumen Pricing Methodology for SEC
Reserves,” available online at http://www.capp.ca/raw.asp?x=1&dt=NTV&e=PDF&dn=91581.
Canadian Association of Petroleum Producers (2006) “Canadian Crude Oil Production and
Supply Forecast 2006-2020,” available online at
http://www.capp.ca/raw.asp?x=1&dt=NTV&dn=103586.
Canadian Association of Petroleum Producers (2008a) “Crude Oil Forecast, Markets and
Pipeline Expansions,” available online at
http://capp.ca/raw.asp?x=1&dt=NTV&e=PDF&dn=138295.
Canadian Association of Petroleum Producers (2008b) “Canadian Oil Sands: the Future of Oil in
Canada,” Presentation made at the London Oil Sands Forum 2008. Available online at
http://www.capp.ca/raw.asp?x=1&dt=PDF&dn=130484.
Canadian Association of Petroleum Producers (2008c) “Canada‟s Oil Sands: A different
conversation,” website available at
http://www.canadasoilsands.ca/en/issues/greenhouse_gas_emissions.aspx.
Caplin, A., and Leahy, J. (2004) “The Social Discount Rate,” Journal of Political Economy, vol.
112, no. 6, pp. 1257-1268.

36
Cattaneo, Claudia (2007) “Oilpacth Eyes Neighour,” Financial Post, April 17, available online at
http://www.financialpost.com/story.html?id=e108138b-8280-4e28-a2c2-
1bf37b9de33a&k=55517&p=1
CBC (2007) “U.S. urges 'fivefold expansion' in Alberta oilsands production”, available online at
http://www.cbc.ca/canada/story/2007/01/17/oil-sands.html.
Clarke, Tony (2008) “Tar Sands Showdown: Canada and the Politics of Oil in an Age of Climate
Change,” Toronto, ON: James Lorimer & Company.
Cowen, T. (1992) “Consequentialism Implies a Zero Rate of Discount.” In Peter Laslett and
James Fishkin, editors, Philosophy, Politics, and Society, sixth series. New Haven: Yale
University Press, pp. 162-168.
Cowen, T. (2001) “What is the Correct Intergenerational Discount Rate?” Unpublished
manuscript, available online at http://www.gmu.edu/jbc/Tyler/DISCOUNT.doc.
Cowen, T. and Parfit, D. (1992) “Against the Social Discount Rate.” In Peter Laslett and James
Fishkin, editors, Philosophy, Politics, and Society, sixth series. New Haven: Yale University
Press, pp. 144-161.
Ebner, David (2008) “Imperial Oil Sands Plans Dealt Blow,” Global and Mail, Monday, March
31.
Energy Information Administration (2008) “Annual Energy Outlook 2008,” available online at
http://www.eia.doe.gov/oiaf/aeo/index.html.
Energy Insights (2007) “Oil Sands in Canada – A Great Opportunity,” available online at
http://www.energyinsights.net/cgi-script/csArticles/articles/000027/002715.htm.
Energy Resource Conservation Board (2001) “Alberta Energy Reserves 2000 and
Supply/Demand Outlook 2001-2010,” Vol. ST98-2001. Available online at
http://www.ercb.ca/docs/products/STs/ST98-2001.pdf.
Energy Resource Conservation Board (2002) “Alberta Energy Reserves 2001 and
Supply/Demand Outlook 2002-2011,” Vol. ST98-2002. Available online at
http://www.ercb.ca/docs/products/STs/ST98-2002.pdf.
Energy Resource Conservation Board (2003) “Alberta Energy Reserves 2002 and
Supply/Demand Outlook 2003-2012,” Vol. ST98-2003. Available online at
http://www.ercb.ca/docs/products/STs/ST98-2003.pdf.
Energy Resource Conservation Board (2004) “Alberta Energy Reserves 2003 and
Supply/Demand Outlook 2004-2013,” Vol. ST98-2004. Available online at
http://www.ercb.ca/docs/products/STs/ST98-2004.pdf.

37
Energy Resource Conservation Board (2005) “Alberta Energy Reserves 2004 and
Supply/Demand Outlook 2005-2014,” Vol. ST98-2005. Available online at
http://www.ercb.ca/docs/products/STs/ST98-2005.pdf.
Energy Resource Conservation Board (2006) “Alberta Energy Reserves 2005 and
Supply/Demand Outlook 2006-2015,” Vol. ST98-2006. Available online at
http://www.ercb.ca/docs/products/STs/ST98-2006.pdf.
Energy Resource Conservation Board (2007a) “Alberta Energy Reserves 2006 and
Supply/Demand Outlook 2007-2016,” Vol. ST98-2007. Available online at
http://www.ercb.ca/docs/products/STs/ST98-2007.pdf.
Energy Resource Conservation Board (2007b) “Alberta Energy Resources Industries Monthly
Statistics,” Vol. ST3-2007. Available online at
http://www.ercb.ca/docs/products/STs/st3/2007/Prices_oil_2007.pdf.
Energy Resource Conservation Board (2008a) “Alberta Energy Reserves 2007 and
Supply/Demand Outlook 2008-2017,” Vol. ST98-2008. Available online at
http://www.ercb.ca/docs/products/STs/ST98-2008.pdf.
Energy Resource Conservation Board (2008b) “ERCB Releases Updated Reserves Report and
Supply/Demand Outlook.” Available online at
http://www.ercb.ca/docs/new/newsrel/2008/nr2008-11.pdf.
Energy Resource Conservation Board (2008c) “Alberta Energy Resources Industries Monthly
Statistics,” available online at
http://www.ercb.ca/portal/server.pt/gateway/PTARGS_0_0_201_0_0_35/http;/ercbContent/publi
shedcontent/publish/ercb_home/industry_zone/alberta_s_energy_resources_and_statistics/oil_an
d_gas/st3.aspx.
Environment Canada (2008) “National Inventory Report, 1990-2006 - Greenhouse Gas Sources
and Sinks in Canada,” available online at
http://www.ec.gc.ca/pdb/ghg/inventory_report/2006_report/tdm-toc_eng.cfm.
Fankhauser, S. (1994) “The social costs of greenhouse gas emissions: an expected value
approach,” Energy Journal, vol. 15, no. 2, pp. 157–184.
Farzin, Y. H. (2001) “The Impact of Oil Price on Additions to US Proven Reserves,” Resource
and Energy Economics, vol. 23, no. 3, pp. 271-292.
Footitt, A. (2007) “Climate Change Policy and Canada‟s Oil Sand Resources: An Update and
Appraisal of Canada‟s New Regulatory Framework for Air Emissions.” Report prepared for
World Wildlife Fund-Canada by the Tyndall Centre for Climate Change Research, available
online at http://climateforchange.ca/files/climateforchange.ca/Public_Files53/Tyndall-WWF.pdf.
38
Fournier, Pierre (2008) “One way or another, the oil sands will play,” Globe and Mail, p. B2,
October 20.
Government of Alberta (2006) “Talk About Oil Sands: Facts on Oil Sands,” available online at
http://www.energy.gov.ab.ca/OilSands/pdfs/FactSheet_OilSands.pdf.
Government of Alberta (2008) “Alberta‟s Oil Sands – Opportunity, Balance,” available online at
http://www.energy.gov.ab.ca/OilSands/pdfs/Oil_Sands_Opp_Balance.pdf.
Grant, J., Dyer, S., and Woynillowicz, D. (2008) Fact or Fiction? Oil Sands Reclamation.
Drayton Valley, AB: The Pembina Institute. Available online at
http://pubs.pembina.org/reports/Fact_or_Fiction-report.pdf.
Griffiths, M., Taylor, A., and Woynillowicz, D. (2006) Troubled Waters, Troubling Trends:
Technology and Policy Options to Reduce Water Use in Oil and Oil Sands Development in
Alberta. Drayton Valley, AB: The Pembina Institute. Available online at
http://pubs.pembina.org/reports/TroubledW_Full.pdf.
Hepburn, C. (2007) “Review for Economics of „The Social Cost of Carbon: Trends, Outliers and
Catastrophes,” available online at http://www.economics-
ejournal.org/economics/discussionpapers/2007-44.
Hotelling, H. (1931) “The Economics of Exhaustible Resources,” Journal of Political Economy,”
vol. 39, no. 2, pp. 137-175.
International Energy Agency (2008) “Oil Market Report,” October, available online at
http://omrpublic.iea.org/omrarchive/10oct08full.pdf
Isaacs, Eddy (2007) “The Canadian Oil Sands in the Context of the Global Energy Demand”,
Extended Abstract for 17th Convocation of the International Council of Academies of
Engineering and Technological Sciences (CAETS), Tokyo, Japan, October 2007.
Islam, Kazi (2007) “Canada‟s natural resource wealth at a glance”, Statistics Canada, Series
NO.16-002-XIE.
London Group (2003) “Handbook of National Accounting: Integrated Environmental and
Economic Accounting” The United Nations Series of Studies in Method, Series F, No.61, Rev.1.
London Group (2004) “Subsoil Asset Account: Results of a questionnaire and points for further
discussion”, available online at
http://unstats.un.org/unsd/envAccounting/londongroup/meeting9/subsoil_questions.ppt.
Marsden, William (2008) “Stupid to the Last Drop: How Alberta is Bringing Environmental
Armageddon to Canada (And Doesn‟t Seem to Care),” Toronto, ON: Vintage Canada.

39
McCarthy, Shawn (2008) “Oil peak theorist warns of chaos, war”, Globe and Mail, Tuesday,
April 8.
McCullum, Hugh (2006) “Fuelling Fortress America: A Report on the Athabasca Tar Sands and
U.S. Demands for Canada‟s Energy,” Canadian Centre for Policy Alternatives Report, March,
available online at http://www.policyalternatives.ca/Reports/2006/03/ReportsStudies1303/
National Energy Board (2006) “National Energy Board 2006 – Canada‟s Oil Sands
Opportunities and Challenges to 2015: An Update,” available online at http://www.neb.gc.ca/clf-
nsi/rnrgynfmtn/nrgyrprt/lsnd/pprtntsndchllngs20152006/pprtntsndchllngs20152006-eng.pdf.
Neabel, Derek and Ellen Francis (2005) “Greenhouse Gas Emissions
Calculations for the Mackenzie Gas Project,” The Pembina Institute, available online at
http://www.mackenziewild.ca/postings/news/pembina-mackenzie-gas.pdf
Nikiforuk, Andrew (2008) “Tar Sands: Dirty Oil and the Future of a Continent,” Vancouver, BC:
Greystone Books.
Nordhaus, W. (2007) “A Review of the Stern Review on the Economics of Climate Change,”
The Journal of Economic Literature vol. 45, iss. 3, pp. 686-702.
Oil Drum Canada (2006) “Canadian Oil Sands Production Update”, available online at
http://canada.theoildrum.com/story/2006/10/20/142436/03.
Oilsands Quest Inc. (2008) “The Beginning of an Oil Sands Industry in Saskatchewan,” available
online at http://www.oilsandsquest.com/our_projects/axe_lake.html.
Osberg, L. and Andrew S. (2002) “An Index of Economic Well-Being for Selected OECD
Countries,” Review of Income and Wealth, vol. 48, Issue 3, pp. 291-316.
Osberg, L. and Andrew S. (2005) “How Should We Measure the “Economic” Aspects of Well-
being?,” Review of Income and Wealth, vol. 51, Issue 2, pp. 311-336.
Pigou, A. (1929) The Economics of Welfare, 3rd
edition, London: MacMillan and Co.
Policy Options (2006) “Sounding an Alarm for Alberta: Interview with Peter Lougheed,” Policy
Options vol. 27, no. 07, pp. 5-9.
Ramsey, F. (1928) “A Mathematical Theory of Saving,” Economic Journal, vol. 38, pp. 543-
559.
Shiell, L. and Loney, S. (2007) “Global Warming Damages and Canada‟s Oil Sands”, Canadian
Public Policy, vol. 33, iss. 4, pp. 419-440.
Smith, Jeremy (2003) “Guide to the Construction and Methodology of the Index of Economic
Well-being”, available online at http://www.csls.ca/iwb.asp.

40
Smith, Robert (2006) “A Note on Oil Sands”, email sent to Dr. Andrew Sharpe entitled “Your
question on tar sands”, December 7.
SNA93 (1993) “System of National Accounts 1993,” published by the Commission of the
European Communities (CEC), the International Monetary Fund (IMF), the Organisation for
Economic Co-operation and Development (OECD), the United Nations (UN) and the World
Bank (WB), available online at http://unstats.un.org/unsd/sna1993/toctop.asp
Solow, R. (1974) “The Economics of Resources or the Resources of Economics,” American
Economic Review Papers and Proceedings, vol. 64, pp. 1-14.
Statistics Canada (2006) “Concepts, Sources and Methods of the Canadian System of
Environmental and Resource Accounts,” Catalogue no. 16-505-GIE.
Statistics Canada (2007) “Oil and Gas Extraction 2005,” Catalogue no. 26-213-XWE.
Statistics Canada (2008) “System of National Economic Accounts/ Environment and Resource
Accounts/ Glossary”, available online at: http://www.statcan.ca/english/nea-cen/sub/env.htm.
Stern, N., S. Peters, V. Bakhshi, A. Bowen, C. Cameron, S. Catovsky, D. Crane, S.
Cruickshank, S. Dietz, N. Edmonson, S.-L. Garbett, L. Hamid, G. Hoffman, D.
Ingram, B. Jones, N. Patmore, H. Radcliffe, R. Sathiyarajah, M. Stock, C. Taylor, T.
Vernon, H. Wanjie, and D. Zenghelis (2006), Stern Review: The Economics of Climate
Change, HM Treasury, London. Available online at http://www.hm-
treasury.gov.uk/independent_reviews/stern_review_economics_climate_change
Tait, Carrie (2008) “We Can Still Make Money: Suncor CEO,” Globe and Mail, Thursday,
October 30.
The Dominion (2007) “Tar Sands: The World‟s Largest Industrial Project and the Future of
Canada,” Autumn.
Timilsina, Govinda R., Nicole LeBlanc and Thorn Walden (2005) “Economic Impacts of
Alberta‟s Oil Sands” Canadian Energy Research Institute Working Paper, ISBN 1-896091-47-4.
Tol, R. (1999) “The Marginal Damage Costs of Greenhouse Gas Emissions,” The Energy
Journal, vol. 20, no. 1, pp. 61-81.
Tol, R. (2005) “The Marginal Damage Costs of Carbon Dioxide Emissions: An Assessment of
the Uncertainties,” Energy Policy, vol. 33, pp. 2064-2074.
Tol, R. (2007) “The Social Cost of carbon: Trends, Outliers and Catastrophes,” Economics
Discussion Papers, No. 2007-44. Available online at http://www.economics-
ejournal.org/economics/discussionpapers/2007-44.

41
Weitzman, M. (2007) “The Stern Review of the Economics of Climate Change,” available online
at http://www.economics.harvard.edu/faculty/weitzman/files/JELSternReport.pdf.
Weitzman, M. (2008) “On Modeling and Interpreting the Economics of Catastrophic Climate
Change.” Working paper, available online at
http://www.economics.harvard.edu/faculty/weitzman/files/REStatModeling.pdf.
Woynillowicz, D., Severson-Baker, C., and Raynolds, M. (2005) Oil Sands Fever: The
Environmental Implications of Canada’s Oil Sands Rush. Drayton Valley, AB: the Pembina
Institute. Available online at http://www.pembina.org/pub/203.

42
Appendix Tables
Appendix Table 1: Calculation of Present Value of Remaining Established Reserves under Active Development and
Remaining Established Reserves of Crude Bitumen, 2005-2007
Total revenue
Total processing
cost
Net production
Total reserves
Reserve life
Capital stock
Cumulative rent
Rent per year
Present value for
oil sands 6
Price per barrel
Rent per barrel
Extraction cost per barrel
million of dollars
million of dollars
million of barrels
million of barrels
years million of
dollars million of
dollars million of
dollars million of
dollars dollars dollars dollars
A B C D E=D/C F
G=[(A-B)*E]-F
H=G/E I J=A/C K=H/C L=J-K
Statistics Canada Estimates
2005 17,620 5,695 359 10,194 28 34,248 304,020 10,717 179,860 49.0 29.8 19.2
2006 23,649 8,051 413 21,018 51 42,836 749,997 14,754 318,625 57.2 35.7 21.5
Preliminary 2007 1 27,008 9,386 482 22,025 46 54,998 750,196 16,419 342,075 56.0 34.1 21.9
CSLS Estimates 2
Same pace of extraction 3 27,008 9,386 482 172,700 358 431,241 5,882,791 16,419 410,467 56.0 34.1 21.9
Fast pace of extraction 4 211,790 73,597 3,780 172,700 46 431,241 5,883,043 128,755 2,682,553 56.0 34.1 21.9
Realistic pace of extraction 5 - - 1,350 172,700 130 431,241 - - 1,049,935 56.0 34.1 21.9
Source: Total revenue, total processing cost and net production from Statistics Canada (2005) "Oil and Gas Extraction," Catalogue no: 26-213-XWE, Text table 1-3. Data obtained directly from the Energy and
Manufacturing division for 2006 and 2007, when possible. Total reserves from the Alberta Energy Resources and Conservation Board, Annual report 2006. Cumulative rent was calculated by the following
formula: (total revenue - total processing cost)*reserve life - capital stock, which is from Statistics Canada (2006) “Concepts, Sources and Methods of the Canadian System of Environmental and Resource
Accounts” Catalogue no.:16-505-GIE. Capital stock from Statistics Canada, CANSIM II Table 031-0002, V1070578, Non-conventional oil extraction, Straight-line end-year net stock.
Notes:
1. The present value of crude bitumen for 2007 is an official Statistics Canada estimate, but was derived by the National Accounts division using confidential preliminary data and is subject to revision. The
underlying data on revenues and costs presented in the table was derived from available official sources, and partly reflect the authors' judgment on the trend for these variables between 2006 and 2007. On
October 8, Statistics Canada' Daily reported a 6 per cent increase in operating expenses in the non-conventional oil sector and a 6 per cent increase in production, suggesting no change in per barrel processing
cost. We used this information, and multiplied the 2006 processing costs by the ratio of production in 2007 and 2006. We obtained revenues as a residual to match the official 2007 crude bitumen valuation
from Statistics Canada.
2. All CSLS estimates are based on remaining established reserves in 2007 (172,700 million barrels).
3. Based on a pace of extraction of 482 million barrels of crude bitumen per year, identical to the extraction rate used by Statistics Canada.
4. Based on a pace of extraction of 3,780 million barrels of crude bitumen per year, so that the entire reserves are depleted in 46 years (identical to the reserve life implicit in Statistics Canada calculations).
5. Based on the assumption that total reserves (172.7 billion barrels) will be extracted at a linearly increasing pace between 2007 (482 million barrels) and 2015 (1.35 billion barrels). After 2015, it assumes an
annual production level of 1.35 billion barrels per year, translating into a reserve life of 130 years. The 2015 extraction rate is in keeping with the NEB (2006) estimate.
6. The calculation of present value uses a four per cent discount rate.
7. All figures in 2007 Canadian dollars, except estimates for 2005 and 2006 (current dollars).

43
Appendix Table 2: Present Value of Established Reserve for Crude Bitumen based on the Established Reserve under Active
Development and the Established Reserve Estimates, 2007 (assuming the price of oil sand products = $56 per barrel) Present value of crude bitumen based on the established
reserves under active development estimate (22.0 billion of barrel), billions of current dollars
Present value of crude bitumen based on the established reserve estimates (172.7 billion of barrels),
billions of current dollars
Discount rate Reserve life
0.0% 2.0% 4.0% 5.0% 0.0% 2.0% 4.0% 5.0%
46 years 750.2 487.5 342.1 291.6 5,882.2 3,822.4 2,682.6 2,286.4
75 years 750.2 386.9 236.9 194.9 5,882.2 3,033.4 1,857.2 1,528.2
130 years* 750.2 609.5 502.0 457.9 5,882.2 2,026.5 1,049.9 827.9
200 years 750.2 184.0 93.7 75.0 5,882.2 1,442.5 735.0 588.2
400 years 750.2 93.7 46.9 37.5 5,882.2 735.0 367.6 294.1
Note: This calculation is based on the price of oil sands product = $56.0 per barrel, and the average rent was $34.1 per barrel for all years. * Based on the assumption that total reserves (172.7 billion barrels) will be extracted at a linearly increasing pace between 2007 (482 million barrels) and 2015 (1.35 billion barrels). After 2015, it assumes an annual production level of 1.35 billion barrels per year, translating into a reserve life of 130 years. The 2015 extraction rate is in keeping with the NEB (2006) estimate.

44
Appendix Table 3: Present Value of Established Reserve for Crude Bitumen based on the Established Reserve under Active
Development and the Established Reserve Estimates, 2007 (assuming the price of oil sand products = $70 per barrel) Present value of crude bitumen based on the established
reserves under active development estimate (22.0 billion of barrel), billions of current dollars
Present value of crude bitumen based on the established reserve estimates (172.7 billion of barrels),
billions of current dollars
Discount rate Reserve life
0.0% 2.0% 4.0% 5.0% 0.0% 2.0% 4.0% 5.0%
46 years 1,059.4 688.4 483.1 411.8 8,306.9 5,398.1 3,788.4 3,228.9
75 years 1,059.4 546.3 334.5 275.2 8,306.9 4,283.8 2,622.8 2,158.1
130 years* 1,059.4 860.7 709.0 646.6 8,306.9 2,861.8 1,482.7 1,169.2
200 years 1,059.4 259.8 132.4 105.9 8,306.9 2,037.1 1,038.0 830.6
400 years 1,059.4 132.4 66.2 53.0 8,306.9 1,038.0 519.2 415.3
Note: This calculation is based on the price of oil sands product = $70.0 per barrel, and the average rent was $48.1 per barrel for all years. * Based on the assumption that total reserves (172.7 billion barrels) will be extracted at a linearly increasing pace between 2007 (482 million barrels) and 2015 (1.35 billion barrels). After 2015, it assumes an annual production level of 1.35 billion barrels per year, translating into a reserve life of 130 years. The 2015 extraction rate is in keeping with the NEB (2006) estimate.

45
Appendix Table 4: Present Value of Established Reserve for Crude Bitumen based on the Established Reserve under Active
Development and the Established Reserve Estimates, 2007 (assuming the price of oil sand products = $110 per barrel) Present value of crude bitumen based on the established
reserves under active development estimate (22.0 billion of barrel), billions of current dollars
Present value of crude bitumen based on the established reserve estimates (172.7 billion of barrels),
billions of current dollars
Discount rate Reserve life
0.0% 2.0% 4.0% 5.0% 0.0% 2.0% 4.0% 5.0%
46 years 1,940.4 1,260.9 884.9 754.2 15,214.9 9,887.1 6,938.8 5,914.0
75 years 1,940.4 1,000.7 612.7 504.1 15,214.9 7,846.2 4,803.9 3,952.8
130 years* 1,940.4 1,576.5 1,298.5 1,184.3 15,214.9 5,241.7 2,715.8 2,141.5
200 years 1,940.4 475.9 242.5 194.0 15,214.9 3,731.2 1,901.1 1,521.4
400 years 1,940.4 242.5 121.3 97.0 15,214.9 1,901.2 950.9 760.7
Note: This calculation is based on the price of oil sands product = $110.0 per barrel, and the average rent was $88.1 per barrel for all years. * Based on the assumption that total reserves (172.7 billion barrels) will be extracted at a linearly increasing pace between 2007 (482 million barrels) and 2015 (1.35 billion barrels). After 2015, it assumes an annual production level of 1.35 billion barrels per year, translating into a reserve life of 130 years. The 2015 extraction rate is in keeping with the NEB (2006) estimate.
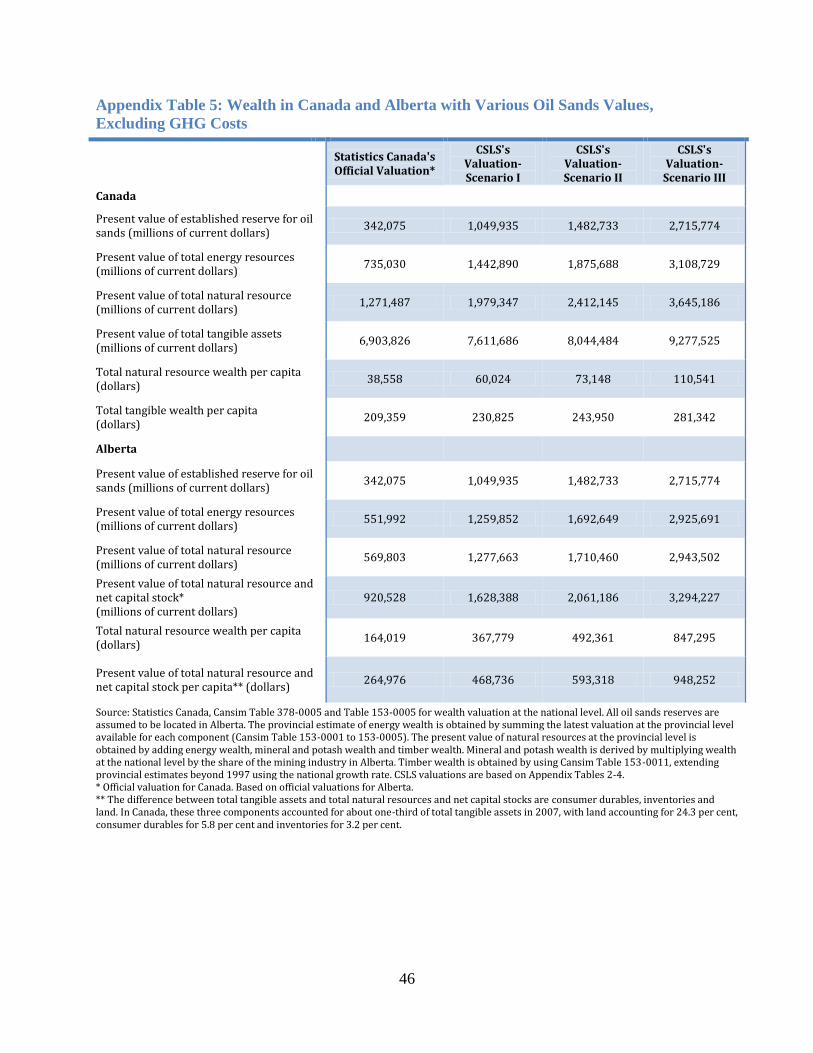
46
Appendix Table 5: Wealth in Canada and Alberta with Various Oil Sands Values,
Excluding GHG Costs
Statistics Canada's Official Valuation*
CSLS's Valuation-Scenario I
CSLS's Valuation-Scenario II
CSLS's Valuation-
Scenario III
Canada
Present value of established reserve for oil sands (millions of current dollars)
342,075 1,049,935 1,482,733 2,715,774
Present value of total energy resources (millions of current dollars)
735,030 1,442,890 1,875,688 3,108,729
Present value of total natural resource (millions of current dollars)
1,271,487 1,979,347 2,412,145 3,645,186
Present value of total tangible assets (millions of current dollars)
6,903,826 7,611,686 8,044,484 9,277,525
Total natural resource wealth per capita (dollars)
38,558 60,024 73,148 110,541
Total tangible wealth per capita (dollars)
209,359 230,825 243,950 281,342
Alberta
Present value of established reserve for oil sands (millions of current dollars)
342,075 1,049,935 1,482,733 2,715,774
Present value of total energy resources (millions of current dollars)
551,992 1,259,852 1,692,649 2,925,691
Present value of total natural resource (millions of current dollars)
569,803 1,277,663 1,710,460 2,943,502
Present value of total natural resource and net capital stock* (millions of current dollars)
920,528 1,628,388 2,061,186 3,294,227
Total natural resource wealth per capita (dollars)
164,019 367,779 492,361 847,295
Present value of total natural resource and net capital stock per capita** (dollars)
264,976 468,736 593,318 948,252
Source: Statistics Canada, Cansim Table 378-0005 and Table 153-0005 for wealth valuation at the national level. All oil sands reserves are assumed to be located in Alberta. The provincial estimate of energy wealth is obtained by summing the latest valuation at the provincial level available for each component (Cansim Table 153-0001 to 153-0005). The present value of natural resources at the provincial level is obtained by adding energy wealth, mineral and potash wealth and timber wealth. Mineral and potash wealth is derived by multiplying wealth at the national level by the share of the mining industry in Alberta. Timber wealth is obtained by using Cansim Table 153-0011, extending provincial estimates beyond 1997 using the national growth rate. CSLS valuations are based on Appendix Tables 2-4. * Official valuation for Canada. Based on official valuations for Alberta. ** The difference between total tangible assets and total natural resources and net capital stocks are consumer durables, inventories and land. In Canada, these three components accounted for about one-third of total tangible assets in 2007, with land accounting for 24.3 per cent, consumer durables for 5.8 per cent and inventories for 3.2 per cent.

47
Appendix Table 6: Wealth in Canada and Alberta with Various Oil Sands Values,
Net of GHG Costs
Statistics Canada's Official Valuation*
CSLS's Valuation-Scenario I
CSLS's Valuation-Scenario II
CSLS's Valuation-
Scenario III
Canada
Present value of established reserve for oil sands (millions of current dollars)
342,075 980,500 1,413,300 2,646,400
Present value of total energy resources (millions of current dollars)
735,030 1,373,455 1,806,255 3,039,355
Present value of total natural resource (millions of current dollars)
1,271,487 1,909,912 2,342,712 3,575,812
Present value of total tangible assets (millions of current dollars)
6,903,826 7,542,251 7,975,051 9,208,151
Total natural resource wealth per capita (dollars)
38,558 57,918 71,043 108,437
Total tangible wealth per capita (dollars)
209,359 228,719 241,844 279,238
Alberta
Present value of established reserve for oil sands (millions of current dollars)
342,075 980,500 1,413,300 2,646,400
Present value of total energy resources (millions of current dollars)
551,992 1,190,417 1,623,217 2,856,317
Present value of total natural resource (millions of current dollars)
569,803 1,208,228 1,641,028 2,874,128
Present value of total natural resource and net capital stock* (millions of current dollars)
920,528 1,558,953 1,991,753 3,224,853
Total natural resource wealth per capita (dollars)
164,019 347,792 472,374 827,325
Present value of total natural resource and net capital stock per capita** (dollars)
264,976 448,749 573,331 928,282
Source: Statistics Canada, Cansim Table 378-0005 and Table 153-0005 for wealth valuation at the national level. All oil sands reserves are assumed to be located in Alberta. The provincial estimate of energy wealth is obtained by summing the latest valuation at the provincial level available for each component (Cansim Table 153-0001 to 153-0005). The present value of natural resources at the provincial level is obtained by adding energy wealth, mineral and potash wealth and timber wealth. Mineral and potash wealth is derived by multiplying wealth at the national level by the share of the mining industry in Alberta. Timber wealth is obtained by using Cansim Table 153-0011, extending provincial estimates beyond 1997 using the national growth rate. CSLS valuations are based on Appendix Tables 2-4. * Official valuation for Canada. Based on official valuations for Alberta. ** The difference between total tangible assets and total natural resources and net capital stocks are consumer durables, inventories and land. In Canada, these three components accounted for about one-third of total tangible assets in 2007, with land accounting for 24.3 per cent, consumer durables for 5.8 per cent and inventories for 3.2 per cent.
48
Appendix 1: The Methodology of Social GHG Cost Estimation: A Brief Overview
Measuring the total social costs of the oil sands‟ GHG emissions involves many
methodological challenges. The purpose of this sub-section is to outline these challenges so that,
in light of them, we can produce reasonable estimates of the total social costs of the oil sands‟
GHG emissions.
GHGs are long-lived in the atmosphere; a tonne of gas emitted today results in a flow of
damages that lasts for years into the future. Thus, just as in the case of natural resource
valuation, the appropriate means of measuring the costs of GHG emissions is the net present
value method. The cost of a tonne of GHG emitted today is the present value of all future
damages attributable to those emissions.
We cannot, however, appeal to the market for the cost information. Oil is a traded
commodity, so in principle it is possible to keep track of all the price and quantity information
that is required to carry out the market valuation of the oil sands via the net present value
method. But the costs of GHGs are externalities; that is, they are external to the market system.
The economic valuation of these costs cannot occur in the normal manner. As a result, GHG
costs are often difficult to perceive, let alone measure in monetary units.
i) Definition of Costs
The first step in environmental cost valuation is to precisely define the costs that are to be
evaluated. The problem of characterizing the social costs we want to value can be broken down
into three component questions:
What sorts of damages will be considered?
Whose damages will be considered?
How will the damages be measured?
A wide range of environmental, ecological, and social damages can be connected to global
climate change; in addition to changes in weather patterns, land value, and ecological diversity,
there may be costs associated with agricultural production, forestry, fisheries, political conflict,
human and animal migration, energy demands, and a host of other issues. The valuation of GHG
costs requires that we assess what should be considered as a cost. For example, should the
extinction of an animal species be valued as a cost in and of itself or only insofar as it might
affect some human industry? We must also decide whose damages we consider to be important.
Should Canadian analysts and policymakers account for the global costs of Canadian emissions,
or only for costs to Canadians? Finally, we must choose a metric by which to measure the costs.
The typical approach is to attempt to assign dollar values to all costs, even non-market costs.
This raises many methodological and ethical challenges. What is the meaning of a dollar value
assigned to something that is not traded in a market? What is the dollar value of human lives lost
as a result of climate change?

49
These are not easy questions to answer. Different studies take different approaches.
Many of the additional challenges that we discuss below are closely related to the fundamental
issue of characterizing the costs we want to measure.
ii) Treatment of Uncertainty
There are several sources of uncertainty associated with the economic valuation of the
social costs of GHG emissions. One source, already mentioned, is the use of a monetary metric
to express non-market impacts of GHG emissions, such as effects on ecosystems or human
health. Since the market does not measure these costs, one must employ alternative valuation
techniques to assign a value to these non-market costs. The standard approaches to this problem
focus on either the willingness to pay (WTP) or the willingness to accept (WTA). The former
involves estimating the maximum amount that an individual would be willing to pay in order to
avoid environmental damage; the latter involves estimating the minimum amount that an
individual would be willing to accept as compensation for that environmental damage. The
WTP approach is the more common of the two, and the choice between them is not
inconsequential. As Shiell and Loney (2008) point out, studies that estimate both WTP and
WTA generally find that WTA is greater than WTP. Since there is no consensus as to which
approach is methodologically superior, it makes sense to regard WTP estimates as lower bounds
of the values people truly assign to environmental costs.
The main source of uncertainty, however, is the fundamental uncertainty of the future.
As before, uncertainty requires that researchers make assumptions about future economic
conditions, policy interventions, and technologies. The complexity of the climate system itself
introduces further uncertainty; although it is widely acknowledged that GHG emissions from
human activities are inducing global climate change, the precise nature and extent of that change
remain uncertain. For instance, the Intergovernmental Panel on Climate Change (IPCC)
estimates that anthropogenic GHG emissions have caused rising sea levels in the late 20th
century and assigns the estimate a probability of at least 90 per cent. However, the probabilities
that human activity has contributed to increases in heat waves and drought are estimated only to
be greater than 50 per cent (IPCC 2007:40). The mean global surface temperature could rise
between 1.1˚C and 6.4˚C over the 21st century (IPCC 2007:45), and while such changes would
be sure to have some effects, it is difficult to predict precisely what those effects will be.
The standard approaches to environmental cost valuation do not offer a well-defined
solution to the uncertainty problem. Studies vary widely with respect to the future scenarios they
entertain and the types of damages they anticipate. In addition, Weitzman (2008) argues that the
methods adopted in most cost-benefit studies of climate change do not adequately account for the
possibility of low-probability catastrophic events, such as the shutdown of the thermohaline
circulation.46
From this perspective, climate change policy should be viewed as a form of
insurance against catastrophe.
46 The thermohaline circulation is sometimes called the ocean conveyor belt, and refers to the part of the large-scale ocean
circulation which transports both energy (in the form of heat) and matter (solids, dissolved substances and gases) around the
globe, which has a large impact on the climate of the Earth.

50
iii) Discount Rate
In the context of social GHG cost measurement, the discount rate consists in two
components: a consumption growth component, which reflects the expectation that future
generations will be wealthier than the current generation, and a pure rate of time preference
(PRTP), which reflects the belief that people simply care more about present costs and benefits
than future ones.
In practical terms, discounting is justified on several grounds. First, it accounts for our
expectation that future generations will be wealthier than the current generation and should
therefore be able to address the costs of climate change at a less severe trade-off in terms of
economic well-being. Second, it makes sense to discount information about the future because
the accuracy of that information is always uncertain. Discounting reduces the influence of that
uncertainty on our present decision-making.
These practical considerations motivate the use of a positive discount rate by most
researchers; three and four per cent are typical values. Whether or not the adoption of a positive
PRTP is ethically justified is a subject of debate. Stern (2006) argues that it is not; he uses a
PRTP of zero, and thus a near-zero discount rate. That choice is unusual and has been criticized
by others in the field (e.g. Nordhaus 2007).
The choice of the discount rate is not without consequence. Generally, a lower discount
rate results in a larger estimate of social cost of GHG emission damages. Azar and Sterner
(1996) apply alternative discount rates between 0.1 per cent and 3 per cent to demonstrate this
tendency. In a meta-study of 103 GHG cost estimates, Tol (2005) shows that high discount rates
are associated with both larger estimates and greater uncertainty.
iv) Equity Weighting
The discount rate can be thought of as a form of intergenerational equity weighting; since
future generations are expected to be wealthier than the present generation, it makes sense to
assign less weight to the costs faced by the future generations. Similarly, there are large income
and wealth disparities between and within countries at a given point in time. Developing
countries are more vulnerable to the effects of climate change because they lack economic and
institutional resources for adaptation and because many depend upon agriculture and other
climate-sensitive industries (Tol 2005). In light of this, most studies weight the costs of poorer
regions more heavily than those of richer regions. Recent models from Eyre et al. (1999) and
Tol and Downing (2000) divide the world into several regions and aggregate world GHG
damages using the following equity weighting formula:
Dworld = Σi(Yworld/Yi) єDi i = region
Di and Yi are the damages and average income of region i, Yworld is global average income, and ε
is the income elasticity of the marginal utility of income.

51
Equity weighting tends to lead to larger estimates of the social costs of GHG emissions
because poor countries, which are expected to suffer disproportionate damages from climate
change, receive larger weights in the social cost calculations. In particular, higher values of ε
produce larger social cost estimates; a high ε implies that economic well-being is greatly affected
by changes in income, so the GHG costs have a large impact on welfare.
v) Summary
It is clear that the valuation of the social costs of GHG emissions requires a large number
of assumptions and methodological judgments. The standard methods of evaluation are still
evolving, but as of now there is no single best methodology. Given these conclusions, the best
approach for our purposes is to use a number of alternative values in order to gain a sense of the
range of values within which the social costs of the oil sands‟ GHG emissions could reasonably
be supposed to fall.
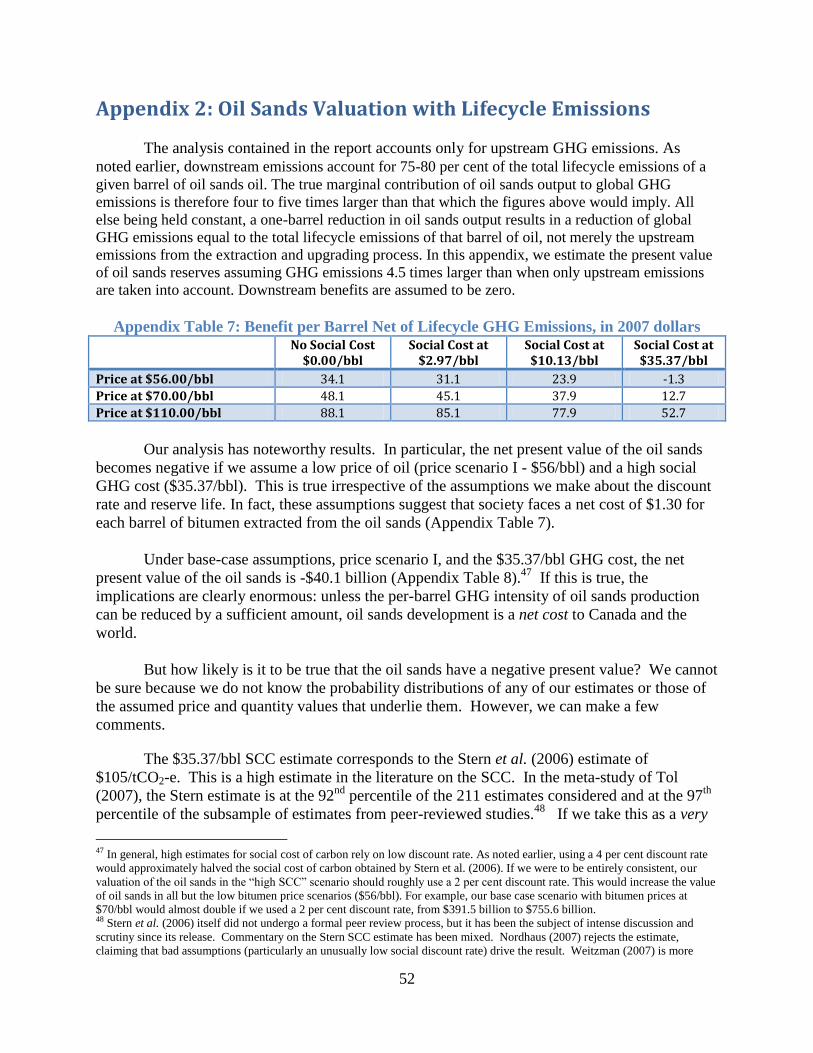
52
Appendix 2: Oil Sands Valuation with Lifecycle Emissions
The analysis contained in the report accounts only for upstream GHG emissions. As
noted earlier, downstream emissions account for 75-80 per cent of the total lifecycle emissions of a
given barrel of oil sands oil. The true marginal contribution of oil sands output to global GHG
emissions is therefore four to five times larger than that which the figures above would imply. All
else being held constant, a one-barrel reduction in oil sands output results in a reduction of global
GHG emissions equal to the total lifecycle emissions of that barrel of oil, not merely the upstream
emissions from the extraction and upgrading process. In this appendix, we estimate the present value
of oil sands reserves assuming GHG emissions 4.5 times larger than when only upstream emissions
are taken into account. Downstream benefits are assumed to be zero.
Appendix Table 7: Benefit per Barrel Net of Lifecycle GHG Emissions, in 2007 dollars No Social Cost
$0.00/bbl Social Cost at
$2.97/bbl Social Cost at $10.13/bbl
Social Cost at $35.37/bbl
Price at $56.00/bbl 34.1 31.1 23.9 -1.3
Price at $70.00/bbl 48.1 45.1 37.9 12.7
Price at $110.00/bbl 88.1 85.1 77.9 52.7
Our analysis has noteworthy results. In particular, the net present value of the oil sands
becomes negative if we assume a low price of oil (price scenario I - $56/bbl) and a high social
GHG cost ($35.37/bbl). This is true irrespective of the assumptions we make about the discount
rate and reserve life. In fact, these assumptions suggest that society faces a net cost of $1.30 for
each barrel of bitumen extracted from the oil sands (Appendix Table 7).
Under base-case assumptions, price scenario I, and the $35.37/bbl GHG cost, the net
present value of the oil sands is -$40.1 billion (Appendix Table 8).47
If this is true, the
implications are clearly enormous: unless the per-barrel GHG intensity of oil sands production
can be reduced by a sufficient amount, oil sands development is a net cost to Canada and the
world.
But how likely is it to be true that the oil sands have a negative present value? We cannot
be sure because we do not know the probability distributions of any of our estimates or those of
the assumed price and quantity values that underlie them. However, we can make a few
comments.
The $35.37/bbl SCC estimate corresponds to the Stern et al. (2006) estimate of
$105/tCO2-e. This is a high estimate in the literature on the SCC. In the meta-study of Tol
(2007), the Stern estimate is at the 92nd
percentile of the 211 estimates considered and at the 97th
percentile of the subsample of estimates from peer-reviewed studies.48
If we take this as a very
47 In general, high estimates for social cost of carbon rely on low discount rate. As noted earlier, using a 4 per cent discount rate
would approximately halved the social cost of carbon obtained by Stern et al. (2006). If we were to be entirely consistent, our
valuation of the oil sands in the “high SCC” scenario should roughly use a 2 per cent discount rate. This would increase the value
of oil sands in all but the low bitumen price scenarios ($56/bbl). For example, our base case scenario with bitumen prices at
$70/bbl would almost double if we used a 2 per cent discount rate, from $391.5 billion to $755.6 billion. 48 Stern et al. (2006) itself did not undergo a formal peer review process, but it has been the subject of intense discussion and
scrutiny since its release. Commentary on the Stern SCC estimate has been mixed. Nordhaus (2007) rejects the estimate,
claiming that bad assumptions (particularly an unusually low social discount rate) drive the result. Weitzman (2007) is more

53
rough indicator of the likelihood of the estimate (keeping in mind that these percentile rankings
in the distribution of published estimates are not the same as rankings based on real probability
distributions about the ‘true’ SCC value), then we would assign the Stern estimate a probability
of 3 to 8 per cent. These are not negligible values.
Appendix Table 8: Present Value of Oil Sands Net of Lifecycle Social GHG Costs Estimates (billions of 2007 CAD)
Lower Bound a Base Case b Upper Bound c
Social Cost at $2.97/bbl
Scenario I ($56/bbl) 268.5 958.7 5,371.0
Scenario II ($70/bbl) 389.4 1,390.3 7,788.8
Scenario III ($110/bbl) 734.8 2,623.3 14,696.8
Social Cost at $10.13/bbl
Scenario I ($56/bbl) 206.4 736.7 4,127.5
Scenario II ($70/bbl) 327.3 1,168.3 6,545.3
Scenario III ($110/bbl) 672.7 2,401.3 13,453.3
Social Cost at $35.37/bbl
Scenario I ($56/bbl) -11.2 -40.1 -224.5
Scenario II ($70/bbl) 109.7 391.5 2,193.3
Scenario III ($110/bbl) 455.1 1,624.5 9,101.3
a. Lower bound estimates assume a social discount rate of 5 per cent and a reserve life of 400 years. b. Base case estimates assume a social discount rate of 4 per cent and a reserve life of 130 years. c. Upper bound estimates assume a social discount rate of 0 per cent and a reserve life of 46 years.
Holding constant the assumption of a $56/bbl, the social GHG cost at which the oil sands
would have a net present value of $0.00 is $34.1/bbl. At a GHG intensity of 0.338 tCO2-e/bbl,
this price corresponds to a per-tonne SCC of $101.04/tCO2-e, which would fall around the 85th
percentile of the 211 estimates in the Tol (2007) study. Again, this ranking within the literature
does not imply that the probability of a social cost exceeding $34.1/bbl is negligible. If we
assume a crude bitumen price of $70/bbl, the oil sands‟ net present value is $0.00 at a social
GHG cost of $48.1/bbl. At a GHG intensity of 0.338 tCO2-e/bbl, this corresponds to a per-tonne
price of $142.5/tCO2-e, which would fall around the 95th
percentile of estimates in Tol‟s study –
not much more unlikely than the Stern et al. (2006) estimate.49
The fact that the Stern estimate is high relative to other published estimates does not
imply that it is incorrect. (The same is true of the other high estimates noted above.) The most
common criticism of the estimate is that it is based upon a social discount rate that is not
“consistent with today‟s marketplace” (in the words of Nordhaus ,2007), but this methodological
ambivalent; he criticizes the Stern et al. study for its discount rate and other assumptions, but argues that its treatment of
uncertain future climate change damages is fundamentally (if not formally) sound and that its SCC estimate may therefore be
“right for the wrong reasons.” 49 The distribution in Tol (2007) is highly skewed to the right, with a right-hand tail that is fairly heavy with probability. Keep in
mind that the sample consists in only 211 estimates. Nevertheless, the „thick upper tail‟ is consistent with the arguments of
Weitzman (2008), who argues that the effects of low-probability, high-cost future events can dominate other influences in the
estimation of the SCC.

54
choice is motivated on ethical grounds. As Hepburn (2007) notes, “Many philosophers find it
incredulous that some economists believe that questions of global and intergenerational justice
should be answered by reference to „today‟s marketplace.‟” Ethical concerns also motivate the
use by Stern et al. of regional equity-weighting schemes in the aggregation of global damages;
this methodology tends to lead to higher estimates of the SCC and is not used in most studies
reviewed by Tol (2007), but it is hardly indefensible. What is more, Weitzman (2008) argues
that the standard methodological approach to SCC estimation indefensibly ignores the „thick
upper tail‟ of the distribution of potential climate change damages. Analysts often choose to
ignore catastrophic events because their probabilities are low or uncertain, but those are the
events that we really care about.
The point is that a high SCC -- $105/tCO2-e or even higher – is not out of the question.
Although we have labeled $105/tCO2-e the „upper bound‟ estimate of the SCC, recent
developments in the literature suggest that it may be more reasonable than once thought. If
nothing else, the possibility of the oil sands having a negative present value should not be
dismissed.
Of course, the story is different when only upstream emissions are considered. The
present value of the oil sands becomes positive under every set of assumptions. Holding
constant the assumptions of a $56/bbl crude bitumen price, the social GHG cost at which the oil
sands would have a net present value of $0.00 is $34.1/bbl. Assuming a GHG intensity of 0.075
tCO2-e/bbl, this corresponds to a per-tonne social cost of $454.67/tCO2-e, which would fall
around the 98th
percentile of the 211 estimates in the Tol (2007) study. Again, this illustrates the
importance of the choice between upstream and lifecycle emissions.
The results that show a negative present value for the oil sands are not our main
estimates; those results should not be used as evidence to support, for example, an immediate
moratorium on oil sands development. Suffice it to say that even conventional oil production
could give rise to net social costs under assumptions similar to those we have used.
Conventional Canadian Light oil produces lifecycle emissions about 16 per cent lower than
Canadian oil sands bitumen (Bergerson and Keith 2006). If we assume a price of $56/bbl for oil
sands output and a lifecycle GHG intensity of 0.284tCO2-e/bbl – equivalent to conventional oil –
then the net present value of the oil sands is $0.00 at an SCC of $120/tCO2-e.50
Even if we accept these estimates, should we conclude that the appropriate response is
immediately to stop all oil production? No. Oil is a useful resource and to end production at the
oil sands would be economically and socially disruptive. Moreover, such a conclusion would
require assuming no downstream benefits – a heroic assumption to say the least. A gradualist
approach – for instance, a carbon tax implemented at a low level and increased over time –
would allow for a stable transition both to alternative energy sources and to more efficient, less
environmentally-damaging means of extracting oil. Indeed, if carbon is priced appropriately, the
possibility of a negative value for oil sands disappears – if the realized rent for oil firms is
negative no production will occur and no further development will take place, in effect putting a
floor value of $0 for the oil sands.
50 This calculation is based on our lifecycle emissions intensity estimate of 0.338tCO2-e/bbl. Given the assumptions, we have
(1 - 0.16)(0.338tCO2-e/bbl) = 0.284tCO-e/bbl and hence, (34.1 $/bbl)/(0.284tCO2-e/bbl) = 120.00 $/tCO2-e.

55
Appendix 3: List of Oil Sands Projects
Company Name Project Name Project Phase Project Status
Startup Date
Bitumen Capacity Project Type Upgrader or not
(b/d) (m³/d)
Suncor Steepbank & Millennium
Mine
Steepbank & N.Steepbank
Extension Operating 1967 276,000 43,800
Mining/Extraction and Upgrading Projects
N
Suncor Tar Island Upgrader
Base U1 and U2 Operating 1967 281,000 44,600 Mining/Extraction and
Upgrading Projects Y
Syncrude Mildred Lake & Aurora Mining and Upgraders
Existing Facilities
Operating 1978 290,700 46,100 Mining/Extraction and
Upgrading Projects N
Shell Cadotte Lake Pilot Operating 1979 1,000 200 Peace River In Situ
Projects N
CNRL Primrose Primrose South Operating 1985 50,000 7,900 Cold Lake Oil Sands Area
In Situ Projects N
Imperial Oil Cold Lake
Phases 1-10: Leming,
Maskwa, Mahikan
Operating 1985 110,000 17,500 Cold Lake Oil Sands Area
In Situ Projects N
Shell Cadotte Lake Phase 1 Operating 1986 11,000 1,700 Peace River In Situ
Projects N
Husky Lloydminster
Upgrader Existing
Operations Operating 1992 71,000 11,300
Mining/Extraction and Upgrading Projects
Y
BlackRock Orion (Hilda
Lake) Pilot Operating 1997 500 100
Cold Lake Oil Sands Area In Situ Projects
N
EnCana Foster Creek Phase 1A Operating 2001 24,000 3,800 Athabasca Oil Sands Area
In Situ Projects N
Petro-Canada Dover SAGD Pilot Operating 2001 1,400 200 Athabasca Oil Sands Area
In Situ Projects N
Athabasca Oil Sands Project
Muskeg River Mine
Existing Facilities
Operating 2002 155,000 24,600 Mining/Extraction and
Upgrading Projects N
EnCana Christina Lake Phase 1A Operating 2002 10,000 1,600 Athabasca Oil Sands Area
In Situ Projects N
JACOS Hangingstone Pilot Operating 2002 10,000 1,600 Athabasca Oil Sands Area
In Situ Projects N
Petro-Canada MacKay River Phase 1 Operating 2002 33,000 5,200 Athabasca Oil Sands Area
In Situ Projects N
Athabasca Oil Sands Project
Scotford Upgrader
Phase 1 Operating 2003 155,000 24,600 Mining/Extraction and
Upgrading Projects Y
EnCana Foster Creek Phase 1B -
Debottleneck Operating 2003 6,000 1,000
Athabasca Oil Sands Area In Situ Projects
N
OPTI /Nexen Long Lake Pilot Operating 2003 2,500 400 Athabasca Oil Sands Area
In Situ Projects N
Petro-Canada Dover VAPEX Pilot Operating 2003 100 16 Athabasca Oil Sands Area
In Situ Projects N
Imperial Oil Cold Lake Phases 11-13:
Mahkeses Operating 2003 30,000 4,800
Cold Lake Oil Sands Area In Situ Projects
N
Suncor Firebag Phase 1 Operating 2004 33,000 5,200 Athabasca Oil Sands Area
In Situ Projects N

56
Company Name Project Name Project Phase Project Status
Startup Date
Bitumen Capacity Project Type Upgrader or not
(b/d) (m³/d)
Total E&P (Deer Creek)
Joslyn Phase 1 Operating 2004 2,000 300 Athabasca Oil Sands Area
In Situ Projects N
Suncor Tar Island Upgrader
Millennium Vacuum Unit
Operating 2005 43,000 6,800 Mining/Extraction and
Upgrading Projects Y
EnCana Foster Creek Phase 1C -
Stage 1 Operating 2005 10,000 1,600
Athabasca Oil Sands Area In Situ Projects
N
Husky Lloydminster
Upgrader Debottleneck Construction 2006 12,000 1,900
Mining/Extraction and Upgrading Projects
Y
Suncor Steepbank & Millennium
Mine
Steepbank Debottleneck
Construction 2006 25,000 4,000 Mining/Extraction and
Upgrading Projects N
Syncrude Mildred Lake & Aurora Mining and Upgraders
Stage 3 Expansion
Construction 2006 116,300 18,500 Mining/Extraction and
Upgrading Projects N
Connacher Great Divide Phase 1 Application 2006 10,000 1,600 Athabasca Oil Sands Area
In Situ Projects N
ConocoPhillips Surmont Phase 1 Construction 2006 25,000 4,000 Athabasca Oil Sands Area
In Situ Projects N
EnCana Foster Creek Phase 1C -
Stage 2 Construction 2006 20,000 3,200
Athabasca Oil Sands Area In Situ Projects
N
EnCana Foster Creek Phase 1D Announced 2006 20,000 3,200 Athabasca Oil Sands Area
In Situ Projects N
OPTI /Nexen Long Lake Phase 1 Construction 2006 72,000 11,400 Athabasca Oil Sands Area
In Situ Projects N
Orion Whitesands Pilot Startup 2006 2,000 300 Athabasca Oil Sands Area
In Situ Projects N
Suncor Firebag Phase 2 Operating 2006 35,000 5,600 Athabasca Oil Sands Area
In Situ Projects N
Total E&P (Deer Creek)
Joslyn Phase 2 Construction 2006 10,000 1,600 Athabasca Oil Sands Area
In Situ Projects N
CNRL Primrose Primrose North Construction 2006 30,000 4,800 Cold Lake Oil Sands Area
In Situ Projects N
Husky Tucker Lake Phase 1 Construction 2006 30,000 4,800 Cold Lake Oil Sands Area
In Situ Projects N
Imperial Oil Cold Lake Phases 14-16:
Nabiye, Mahikan North
Construction 2006 30,000 4,800 Cold Lake Oil Sands Area
In Situ Projects N
Athabasca Oil Sands Project
Scotford Upgrader
Debottleneck Application 2007 45,000 7,100 Mining/Extraction and
Upgrading Projects Y
OPTI /Nexen Long Lake Upgrader
Phase 1 Construction 2007 72,000 11,400 Mining/Extraction and
Upgrading Projects Y
EnCana Foster Creek Phase 1E Announced 2007 20,000 3,200 Athabasca Oil Sands Area
In Situ Projects N
MEG Christina Lake Pilot Construction 2007 3,000 500 Athabasca Oil Sands Area
In Situ Projects N
BlackRock Orion (Hilda
Lake) Phase 1 Approved 2007 10,000 1,600
Cold Lake Oil Sands Area In Situ Projects
N
CNRL Horizon Mine &
Upgrader Phase 1 Construction 2008 135,000 21,400
Mining/Extraction and Upgrading Projects
N

57
Company Name Project Name Project Phase Project Status
Startup Date
Bitumen Capacity Project Type Upgrader or not
(b/d) (m³/d)
Suncor Steepbank & Millennium
Mine
Millennium Debottleneck
Construction 2008 23,000 3,700 Mining/Extraction and
Upgrading Projects N
Suncor Tar Island Upgrader
Millennium Coker Unit
Construction 2008 116,000 18,400 Mining/Extraction and
Upgrading Projects Y
BA Energy Heartland Upgrader
Phase 1 Construction 2008 54,400 8,600 Merchant Upgraders Y
ConocoPhillips Surmont Phase 2 Approved 2008 25,000 4,000 Athabasca Oil Sands Area
In Situ Projects N
Devon Jackfish Jackfish 1 Construction 2008 35,000 5,600 Athabasca Oil Sands Area
In Situ Projects N
EnCana Christina Lake Phase 1B Approved 2008 30,000 4,800 Athabasca Oil Sands Area
In Situ Projects N
Husky Sunrise Phase 1 Approved 2008 50,000 7,900 Athabasca Oil Sands Area
In Situ Projects N
MEG Christina Lake Commercial Application 2008 22,000 3,500 Athabasca Oil Sands Area
In Situ Projects N
North American Kai Kos Dehseh Phase 1 Announced 2008 10,000 1,600 Athabasca Oil Sands Area
In Situ Projects N
Suncor Firebag Phase 3 Approved 2008 35,000 5,600 Athabasca Oil Sands Area
In Situ Projects N
Athabasca Oil Sands Project
Scotford Upgrader
Expansion Application 2009 90,000 14,300 Mining/Extraction and
Upgrading Projects Y
Synenco Northern Lights
Mine Phase 1 Disclosure 2009 50,000 7,900
Mining/Extraction and Upgrading Projects
N
EnCana Christina Lake Phase 1C Approved 2009 30,000 4,800 Athabasca Oil Sands Area
In Situ Projects N
EnCana Foster Creek Unnamed
Expansion 1 Announced 2009 25,000 4,000
Athabasca Oil Sands Area In Situ Projects
N
Petro-Canada MacKay River Phase 2 Application 2009 40,000 6,300 Athabasca Oil Sands Area
In Situ Projects N
Suncor Firebag Cogeneration and Expansion
Construction 2009 25,000 4,000 Athabasca Oil Sands Area
In Situ Projects N
Suncor Firebag Phase 4 Approved 2009 35,000 5,600 Athabasca Oil Sands Area
In Situ Projects N
Total E&P (Deer Creek)
Joslyn Phase 3a Disclosure 2009 15,000 2,400 Athabasca Oil Sands Area
In Situ Projects N
Value Creation Halfway Creek Phase 1 Announced 2009 10,000 1,600 Athabasca Oil Sands Area
In Situ Projects N
BlackRock Orion (Hilda
Lake) Phase 2 Approved 2009 10,000 1,600
Cold Lake Oil Sands Area In Situ Projects
N
CNRL Primrose Primrose East Application 2009 30,000 4,800 Cold Lake Oil Sands Area
In Situ Projects N
Shell Carmon Creek Phase 1 Disclosure 2009 18,000 2,900 Peace River In Situ
Projects N
Athabasca Oil Sands Project
Muskeg River Mine
Expansion and Debottleneck
Application 2010 115,000 18,300 Mining/Extraction and
Upgrading Projects N
Athabasca Oil Sands Project
Jackpine Mine Phase 1A Approved 2010 100,000 15,900 Mining/Extraction and
Upgrading Projects N

58
Company Name Project Name Project Phase Project Status
Startup Date
Bitumen Capacity Project Type Upgrader or not
(b/d) (m³/d)
Imperial/ExxonMobil
Kearl Mine Phase 1 Application 2010 100,000 15,900 Mining/Extraction and
Upgrading Projects N
Suncor Voyageur Upgrader
Phase 1 Application 2010 156,000 24,800 Mining/Extraction and
Upgrading Projects Y
Synenco Northern Lights
Upgrader Phase 1 Disclosure 2010 50,000 7,900
Mining/Extraction and Upgrading Projects
Y
Total E&P (formerly Deer
Creek) Joslyn Mine Phase 1 (North) Application 2010 50,000 7,900
Mining/Extraction and Upgrading Projects
N
Total E&P (formerly Deer
Creek)
Joslyn/Surmont Upgrader
Phase 1 Announced 2010 50,000 7,900 Mining/Extraction and
Upgrading Projects Y
BA Energy Heartland Upgrader
Phase 2 Approved 2010 54,400 8,600 Merchant Upgraders Y
BA Energy North West Upgrading
North West Upgrader
Phase 1 Application 2010 50,000 7,900 Merchant Upgraders Y
Peace River Oil Upgrading
Bluesky Upgrader
Phase 1 Announced 2010 25,000 4,000 Merchant Upgraders Y
Devon Jackfish Jackfish 2 Disclosure 2010 35,000 5,600 Athabasca Oil Sands Area
In Situ Projects N
EnCana Borealis Phase 1 Announced 2010 20,000 3,200 Athabasca Oil Sands Area
In Situ Projects N
EnCana Christina Lake Phase 1D Announced 2010 30,000 4,800 Athabasca Oil Sands Area
In Situ Projects N
Husky Sunrise Phase 2 Approved 2010 50,000 7,900 Athabasca Oil Sands Area
In Situ Projects N
JACOS Hangingstone Phase 1 Disclosure 2010 25,000 4,000 Athabasca Oil Sands Area
In Situ Projects N
North American Kai Kos Dehseh Phase 2 Announced 2010 30,000 4,800 Athabasca Oil Sands Area
In Situ Projects N
OPTI /Nexen Long Lake Phase 2 (South) Disclosure 2010 72,000 11,400 Athabasca Oil Sands Area
In Situ Projects N
CNRL Horizon Mine &
Upgrader Phase 2 Approved 2011 45,000 7,100
Mining/Extraction and Upgrading Projects
N
CNRL Horizon Mine &
Upgrader Phase 3 Approved 2011 90,000 14,300
Mining/Extraction and Upgrading Projects
N
OPTI /Nexen Long Lake Upgrader
Phase 2 (South) Approved 2011 72,000 11,400 Mining/Extraction and
Upgrading Projects Y
Petro-Canada/UTS /Teck Cominco
Fort Hills Mine Phase 1/2 Approved 2011 100,000 15,900 Mining/Extraction and
Upgrading Projects N
Petro-Canada/UTS /Teck Cominco
Fort Hills Upgrader
Phase 1/2 Announced 2011 100,000 15,900 Mining/Extraction and
Upgrading Projects Y
Syncrude Mildred Lake & Aurora Mining and Upgraders
Stage 3 Debottleneck
Announced 2011 46,500 7,400 Mining/Extraction and
Upgrading Projects N
Synenco Northern Lights
Mine Phase 2 Disclosure 2011 50,000 7,900
Mining/Extraction and Upgrading Projects
N
CNRL Kirby Phase 1 Approved 2011 30,000 4,800 Athabasca Oil Sands Area
In Situ Projects N
ConocoPhillips Surmont Phase 3 Approved 2011 25,000 4,000 Athabasca Oil Sands Area
In Situ Projects N

59
Company Name Project Name Project Phase Project Status
Startup Date
Bitumen Capacity Project Type Upgrader or not
(b/d) (m³/d)
EnCana Borealis Phase 2 Announced 2011 20,000 3,200 Athabasca Oil Sands Area
In Situ Projects N
EnCana Christina Lake Unnamed
Expansion 1 Announced 2011 30,000 4,800
Athabasca Oil Sands Area In Situ Projects
N
EnCana Foster Creek Unnamed
Expansion 2 Announced 2011 25,000 4,000
Athabasca Oil Sands Area In Situ Projects
N
North American Kai Kos Dehseh Phase 3 Announced 2011 40,000 6,300 Athabasca Oil Sands Area
In Situ Projects N
Total E&P (Deer Creek)
Joslyn Phase 3b Disclosure 2011 15,000 2,400 Athabasca Oil Sands Area
In Situ Projects N
Athabasca Oil Sands Project
Jackpine Mine Phase 1B Approved 2012 100,000 15,900 Mining/Extraction and
Upgrading Projects N
CNRL Horizon Mine &
Upgrader Phase 1 Announced 2012 145,000 23,000
Mining/Extraction and Upgrading Projects
N
Imperial/ExxonMobil
Kearl Mine Phase 2 Application 2012 100,000 15,900 Mining/Extraction and
Upgrading Projects N
Suncor Voyageur Upgrader
Phase 2 Application 2012 78,000 12,400 Mining/Extraction and
Upgrading Projects Y
Synenco Northern Lights
Upgrader Phase 2 Disclosure 2012 50,000 7,900
Mining/Extraction and Upgrading Projects
Y
BA Energy Heartland Upgrader
Phase 3 Approved 2012 54,400 8,600 Merchant Upgraders Y
EnCana Borealis Phase 3 Announced 2012 20,000 3,200 Athabasca Oil Sands Area
In Situ Projects N
EnCana Christina Lake Unnamed
Expansion 2 Announced 2012 30,000 4,800
Athabasca Oil Sands Area In Situ Projects
N
Husky Sunrise Phase 3 Approved 2012 50,000 7,900 Athabasca Oil Sands Area
In Situ Projects N
JACOS Hangingstone Phase 2 Disclosure 2012 25,000 4,000 Athabasca Oil Sands Area
In Situ Projects N
OPTI /Nexen Long Lake Phase 3 Announced 2012 72,000 11,400 Athabasca Oil Sands Area
In Situ Projects N
Suncor Firebag Phase 5 Announced 2012 50,000 7,900 Athabasca Oil Sands Area
In Situ Projects N
Shell Carmon Creek Phase 1
Expansion Announced 2012 35,000 5,600
Peace River In Situ Projects
N
OPTI /Nexen Long Lake Upgrader
Phase 3 Announced 2013 72,000 11,400 Mining/Extraction and
Upgrading Projects Y
Total E&P (formerly Deer
Creek) Joslyn Mine Phase 2 (North) Application 2013 50,000 7,900
Mining/Extraction and Upgrading Projects
N
Total E&P (formerly Deer
Creek)
Joslyn/Surmont Upgrader
Phase 2 Announced 2013 50,000 7,900 Mining/Extraction and
Upgrading Projects Y
BA Energy North West Upgrading
North West Upgrade
Phase 2 Application 2013 54,400 7,900 Merchant Upgraders Y
CNRL Birch Mountain Phase 1 Announced 2013 30,000 4,800 Athabasca Oil Sands Area
In Situ Projects N
EnCana Borealis Phase 4 Announced 2013 20,000 3,200 Athabasca Oil Sands Area
In Situ Projects N
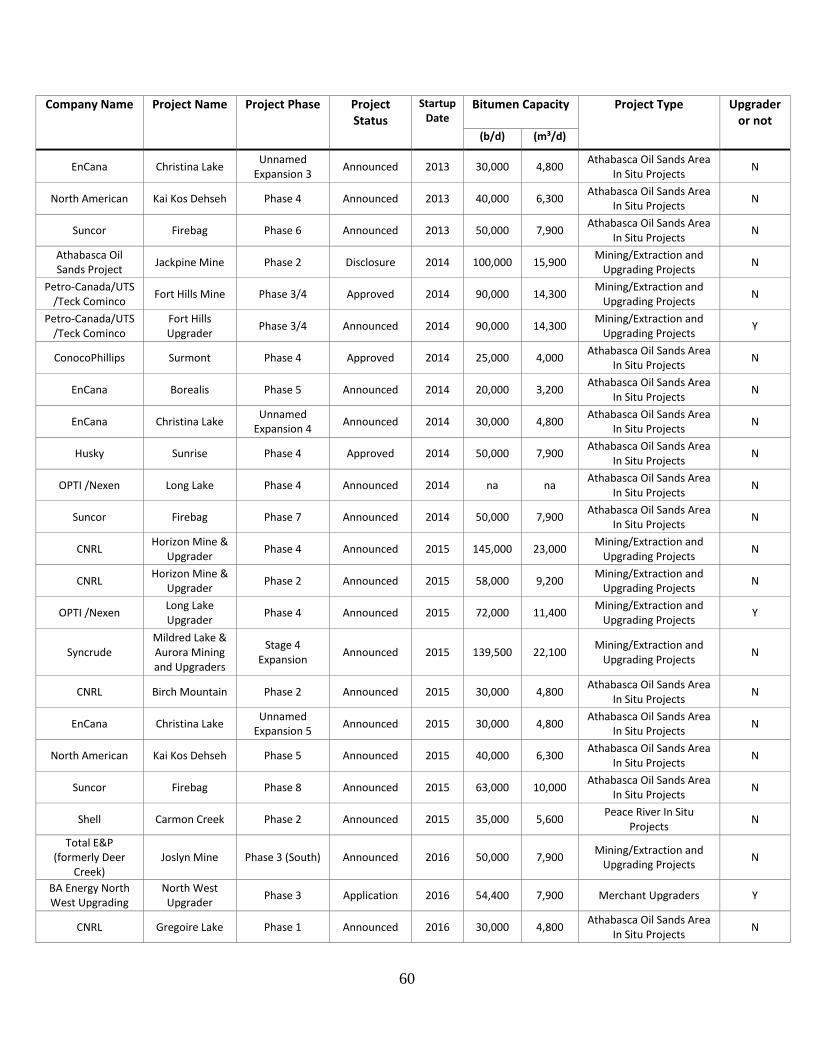
60
Company Name Project Name Project Phase Project Status
Startup Date
Bitumen Capacity Project Type Upgrader or not
(b/d) (m³/d)
EnCana Christina Lake Unnamed
Expansion 3 Announced 2013 30,000 4,800
Athabasca Oil Sands Area In Situ Projects
N
North American Kai Kos Dehseh Phase 4 Announced 2013 40,000 6,300 Athabasca Oil Sands Area
In Situ Projects N
Suncor Firebag Phase 6 Announced 2013 50,000 7,900 Athabasca Oil Sands Area
In Situ Projects N
Athabasca Oil Sands Project
Jackpine Mine Phase 2 Disclosure 2014 100,000 15,900 Mining/Extraction and
Upgrading Projects N
Petro-Canada/UTS /Teck Cominco
Fort Hills Mine Phase 3/4 Approved 2014 90,000 14,300 Mining/Extraction and
Upgrading Projects N
Petro-Canada/UTS /Teck Cominco
Fort Hills Upgrader
Phase 3/4 Announced 2014 90,000 14,300 Mining/Extraction and
Upgrading Projects Y
ConocoPhillips Surmont Phase 4 Approved 2014 25,000 4,000 Athabasca Oil Sands Area
In Situ Projects N
EnCana Borealis Phase 5 Announced 2014 20,000 3,200 Athabasca Oil Sands Area
In Situ Projects N
EnCana Christina Lake Unnamed
Expansion 4 Announced 2014 30,000 4,800
Athabasca Oil Sands Area In Situ Projects
N
Husky Sunrise Phase 4 Approved 2014 50,000 7,900 Athabasca Oil Sands Area
In Situ Projects N
OPTI /Nexen Long Lake Phase 4 Announced 2014 na na Athabasca Oil Sands Area
In Situ Projects N
Suncor Firebag Phase 7 Announced 2014 50,000 7,900 Athabasca Oil Sands Area
In Situ Projects N
CNRL Horizon Mine &
Upgrader Phase 4 Announced 2015 145,000 23,000
Mining/Extraction and Upgrading Projects
N
CNRL Horizon Mine &
Upgrader Phase 2 Announced 2015 58,000 9,200
Mining/Extraction and Upgrading Projects
N
OPTI /Nexen Long Lake Upgrader
Phase 4 Announced 2015 72,000 11,400 Mining/Extraction and
Upgrading Projects Y
Syncrude Mildred Lake & Aurora Mining and Upgraders
Stage 4 Expansion
Announced 2015 139,500 22,100 Mining/Extraction and
Upgrading Projects N
CNRL Birch Mountain Phase 2 Announced 2015 30,000 4,800 Athabasca Oil Sands Area
In Situ Projects N
EnCana Christina Lake Unnamed
Expansion 5 Announced 2015 30,000 4,800
Athabasca Oil Sands Area In Situ Projects
N
North American Kai Kos Dehseh Phase 5 Announced 2015 40,000 6,300 Athabasca Oil Sands Area
In Situ Projects N
Suncor Firebag Phase 8 Announced 2015 63,000 10,000 Athabasca Oil Sands Area
In Situ Projects N
Shell Carmon Creek Phase 2 Announced 2015 35,000 5,600 Peace River In Situ
Projects N
Total E&P (formerly Deer
Creek) Joslyn Mine Phase 3 (South) Announced 2016 50,000 7,900
Mining/Extraction and Upgrading Projects
N
BA Energy North West Upgrading
North West Upgrader
Phase 3 Application 2016 54,400 7,900 Merchant Upgraders Y
CNRL Gregoire Lake Phase 1 Announced 2016 30,000 4,800 Athabasca Oil Sands Area
In Situ Projects N

61
Company Name Project Name Project Phase Project Status
Startup Date
Bitumen Capacity Project Type Upgrader or not
(b/d) (m³/d)
CNRL Horizon Mine &
Upgrader Phase 5 Announced 2017 162,000 25,700
Mining/Extraction and Upgrading Projects
N
Imperial/ExxonMobil
Kearl Mine Phase 3 Application 2018 100,000 15,900 Mining/Extraction and
Upgrading Projects N
CNRL Gregoire Lake Phase 2 Announced 2018 30,000 4,800 Athabasca Oil Sands Area
In Situ Projects N
Total E&P (formerly Deer
Creek) Joslyn Mine Phase 4 (South) Announced 2019 50,000 7,900
Mining/Extraction and Upgrading Projects
N
CNRL Gregoire Lake Phase 3 Announced 2020 30,000 4,800 Athabasca Oil Sands Area
In Situ Projects N
CNRL Gregoire Lake Phase 4 Announced 2023 30,000 4,800 Athabasca Oil Sands Area
In Situ Projects N
Value Creation North Joslyn
Upgrader Phase 1 Announced na 40,000 6,300
Mining/Extraction and Upgrading Projects
Y
Fort Mackay First Nation
Fort Mackay Mine
Phase 1 Announced TBD TBD TBD Mining/Extraction and
Upgrading Projects N
Husky Lloydminster
Upgrader Expansion Announced TBD 67,000 10,600
Mining/Extraction and Upgrading Projects
Y
Peace River Oil Upgrading
Bluesky Upgrader
Phase 2 Announced TBD 25,000 4,000 Merchant Upgraders Y
Peace River Oil Upgrading
Bluesky Upgrader
Phase 3 Announced TBD 25,000 4,000 Merchant Upgraders Y
Peace River Oil Upgrading
Bluesky Upgrader
Phase 4 Announced TBD 25,000 4,000 Merchant Upgraders Y
Petro-Canada Chard Phase 1 Announced TBD 40,000 6,300 Athabasca Oil Sands Area
In Situ Projects N
Petro-Canada Lewis Phase 1 Disclosure TBD 40,000 6,300 Athabasca Oil Sands Area
In Situ Projects N
Petro-Canada Lewis Phase 2 Disclosure TBD 40,000 6,300 Athabasca Oil Sands Area
In Situ Projects N
Petro-Canada Meadow Creek Phase 1 Approved TBD 40,000 6,300 Athabasca Oil Sands Area
In Situ Projects N
Petro-Canada Meadow Creek Phase 2 Approved TBD na na Athabasca Oil Sands Area
In Situ Projects N
Petro-Canada Lewis Phase 1 Disclosure TBD 40,000 6,300 Athabasca Oil Sands Area
In Situ Projects N
Petro-Canada Lewis Phase 2 Disclosure TBD 40,000 6,300 Athabasca Oil Sands Area
In Situ Projects N
Value Creation North Joslyn Phase 1 Announced TBD 40,000 6,300 Athabasca Oil Sands Area
In Situ Projects N
Note: This appendix is drawn directly from Appendix 4 of NEB (2006). The last column was added to clearly identify which
projects were considered in this report‟s calculations of potential future supply and which were considered strictly as upgrader
projects (hence not adding to potential oil sands supply in volume terms).