November 2 , 2016 U.S. Geological Survey Texas Water ... · U.S. Geological Survey Texas Water...
27
November 2 nd , 2016 U.S. Geological Survey Texas Water Science Center Gulf Coast Program Office
Transcript of November 2 , 2016 U.S. Geological Survey Texas Water ... · U.S. Geological Survey Texas Water...

November 2nd, 2016
U.S. Geological Survey
Texas Water Science Center
Gulf Coast Program Office

Old River Lake
Wallisville streamgage
Galveston Bay

Scenario #1
Upstream streamgage
Wallisville streamgage
EXPLANATION
Stre
amfl
ow
Time Scenario #2
Stre
amfl
ow
Time
Indicates water is potentially diverted into wetlands and flowing to Galveston Bay through Old River and delta.
Indicates water may flow into wetlands and released into main channel of Trinity River when flows are decreasing.

Scenario #1
Highest streamflow measured at Wallisville site: 24,000 ft3/s
28 to 82 percent of the flow measured upstream

Old River Lake
Wallisville streamgage
Galveston Bay

PROJECT TASKS
Main task: Analysis of streamflow and nutrient and sediment concentrations in the lower Trinity River watershed
1. Operation and maintenance of index-velocity gage at Trinity River at Wallisville, Tex. and periodic water-quality sample collection.
2. Streamflow measurements and water-quality sample collection at Old River and Wallisville site during high flows.
3. Examine streamflow and water-quality from Lake Livingston to the lower parts of the watershed.

Task 1: Periodic water-quality sample collection and operation and maintenance of index-velocity gage at USGS station 08067252 Trinity River at Wallisville, Texas.
Water-Quality• Nutrients
• Ammonia• Nitrate• Nitrite• Total nitrogen• Total phosphorus• Orthophosphate• Total organic carbon• Dissolved organic carbon
• Water-quality properties• Temperature• pH• Dissolved oxygen
concentration• Turbidity• Specific conductance
• Suspended-sediment

ACOUSTIC SURROGATE FOR SUSPENDED-SEDIMENT
Image Source: SonTek
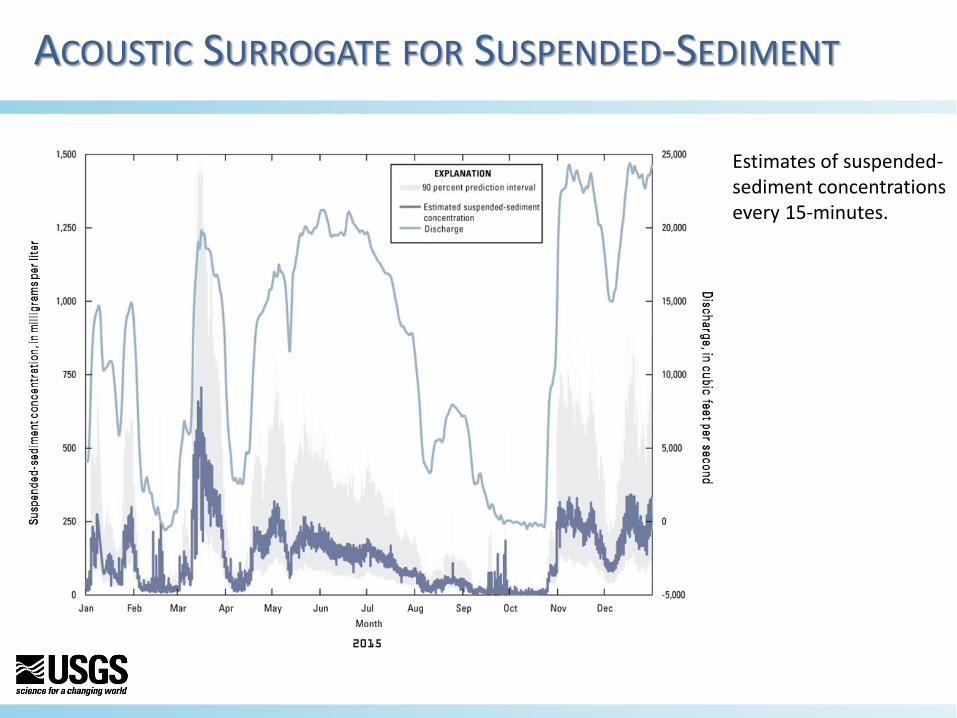
ACOUSTIC SURROGATE FOR SUSPENDED-SEDIMENT
Estimates of suspended-sediment concentrations every 15-minutes.
2015

National Real-Time Water Quality: https://nrtwq.usgs.gov/

Wallisville streamgageOld River at I-10
Old River–Trinity confluence
Questions:• Does discharge at Old River at I-10 +
discharge at Wallisville site equal the streamflow measured upstream during high flows?
• How does the distribution of water vary with the magnitude of the event?
• How much of the water diverted into Old River returns to the main channel of the Trinity River?
• Does this diversion affect water-quality in inflows to Galveston Bay?
Task 2: Streamflow measurements and water-quality sample collection at Old River and Wallisville site during periods of high flow
GalvestonBay

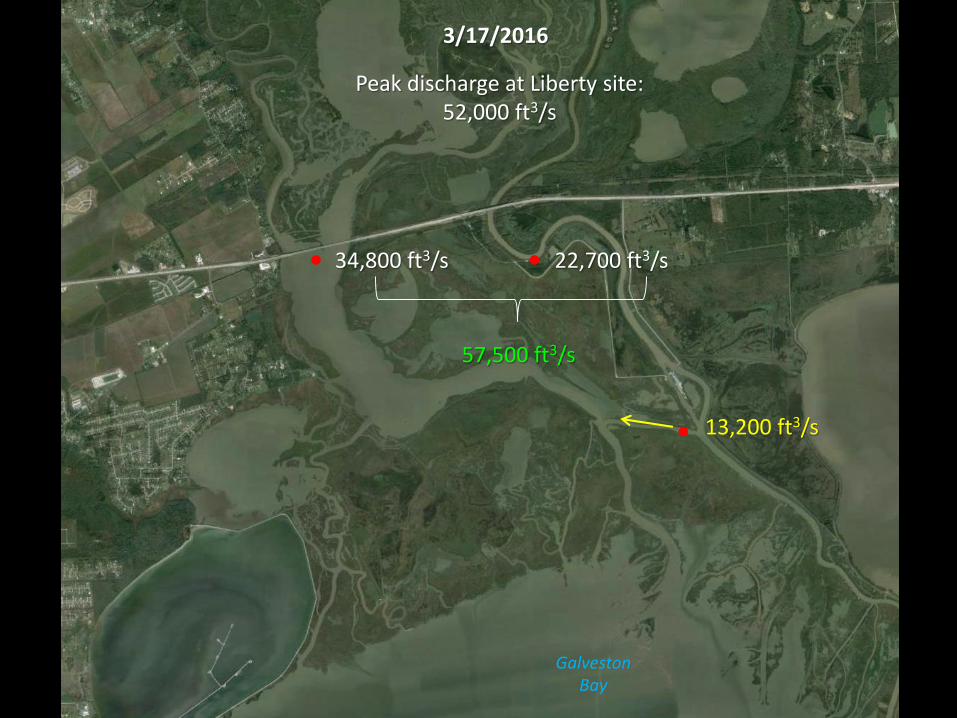
3/17/2016
22,700 ft3/s34,800 ft3/s
Peak discharge at Liberty site: 52,000 ft3/s
57,500 ft3/s
13,200 ft3/s
GalvestonBay

4/26/2016
17,200 ft3/s7,360 ft3/s
Peak discharge at Liberty site: 32,000 ft3/s
24,600 ft3/s
11,300 ft3/s 5,200 ft3/s
GalvestonBay

6/3/2016
22,300 ft3/s62,700 ft3/s
Peak discharge at Liberty site: 81,000 ft3/s
85,000 ft3/s
10,500 ft3/s 10,600 ft3/s
GalvestonBay
What happens at 15-20k ft3/s?

STREAMFLOW SUMMARY
DateTrinity River
at LibertyTrinity River at
WallisvilleOld River
LakeWallisville +
Old RiverDifference in streamflow
6/10/2015 60,000 21,600 44,300 65,900 5,900
3/17/2016 52,000 22,700 34,800 57,500 5,510
4/26/2016 32,000 17,200 7,360 24,600 -7,440
6/3/2016 81,000 22,300 62,700 85,000 4,950
Streamflow (in cubic feet per second) measured at:
Storage in wetlands?
Timing of sample collection and previous conditions matter

STREAMFLOW SUMMARY
3/17/2016
4/26/2016
Peak flow at Liberty site: 52,000 ft3/s Streamflow measured at Old River and Wallisville site add up.
Peak flow at Liberty site: 32,000 ft3/s Streamflow measured at Old River and Wallisville site do not add up.

GalvestonBay
Wallisville streamgageOld River at I-10
Old River–Trinity confluence
What does this mean for water-quality?

SELECTED NUTRIENTS
Total Nitrogen
(mg/L)
Nitrate + Nitrite
(mg/L as N)
Total Phosphorus
(mg/L)
Date Old River Wallisville Old River Wallisville Old River Wallisville
3/17/2016 1.19 1.25 0.663 0.650 0.122 0.129
4/25/2016 1.17 1.16 0.387 0.437 0.142 0.145
6/3/2016 0.87 0.82 0.302 0.230 0.120 0.131
*Preliminary data, subject to revision

SUSPENDED-SEDIMENT
Suspended-sediment
concentration (mg/L)
Percentage of silt and clay
sediment particles
Date Old River Wallisville Old River Wallisville
3/17/2016 43 145 99 60
4/25/2016 52 158 100 67
6/3/2016 41 134 100 67
• Suspended-sediment concentrations and size distribution different between Old River and Wallisville site.
• Suspended-sediment concentrations measured at Wallisville, Liberty, and Romayor sites may not be representative of inflow to bay.
*Preliminary data, subject to revision

April 2016

SUSPENDED-SEDIMENT
*Preliminary data, subject to revision
Liberty site Wallisville site
DateSuspended-sediment concentration (mg/L) Date
Suspended-sediment concentration (mg/L)
3/16/2016 200 3/17/2016 1454/20/2016 438 4/25/2016 1586/1/2016 350 6/3/2016 134
• Floodplain or channel retention of suspended-sediment?• Continuous suspended-sediment record provides information on
peak suspended-sediment concentration at Wallisville site
Task 3: Examine streamflow and water-quality from Lake Livingston to the lower portions of the watershed.

Galveston Bay
Wallisville streamgageOld River at I-10

SUMMARY
• Flow in the lower Trinity River watershed does not follow the expected pattern:• A large part of the water volume (during high-flow events)
enters Galveston Bay through Old River, including a portion of the volume measured at Wallisville site.
• Suspended-sediment transport to Galveston Bay may be affected by these flow patterns. • We need more data to statistically determine if this is the case.

WHAT’S NEXT?
• Continue O&M of index-velocity streamgage and suspended-sediment rating at Wallisville site.
• Collect water-quality samples and conduct discharge measurements:• at target flows of 15-20k ft3/s and 35-50k ft3/s and• during events with varying antecedent conditions.
• Collect water-quality samples at additional locations:• mixing point between Old River and Wallisville site • downstream from saltwater barrier
• Examine spatial trends in water-quality in lower Trinity River watershed.

U.S. Geological SurveyTexas Water Science CenterGulf Coast Program Office
Zulimar [email protected]
Michael T. [email protected]