November 10, 2010DSTS meeting, Copenhagen1 Power and sample size calculations Michael Væth,...
30
November 10, 2010 DSTS meeting, Copenhagen 1 Power and sample size calculations Michael Væth, University of Aarhus ntroductory remarks wo-sample problem with normal data omparison of two proportions ample size and power calculations based on Wald’s wo-sample problem with censored survival data on-inferiority trials and equivalence trials ample size and confidence intervals
-
Upload
aria-tuckness -
Category
Documents
-
view
214 -
download
0
Transcript of November 10, 2010DSTS meeting, Copenhagen1 Power and sample size calculations Michael Væth,...

November 10, 2010 DSTS meeting, Copenhagen 1
Power and sample size calculationsMichael Væth,
University of Aarhus
•Introductory remarks
•Two-sample problem with normal data
•Comparison of two proportions
•Sample size and power calculations based on Wald’s test
•Two-sample problem with censored survival data
•Non-inferiority trials and equivalence trials
•Sample size and confidence intervals
November 10, 2010 DSTS meeting, Copenhagen 2
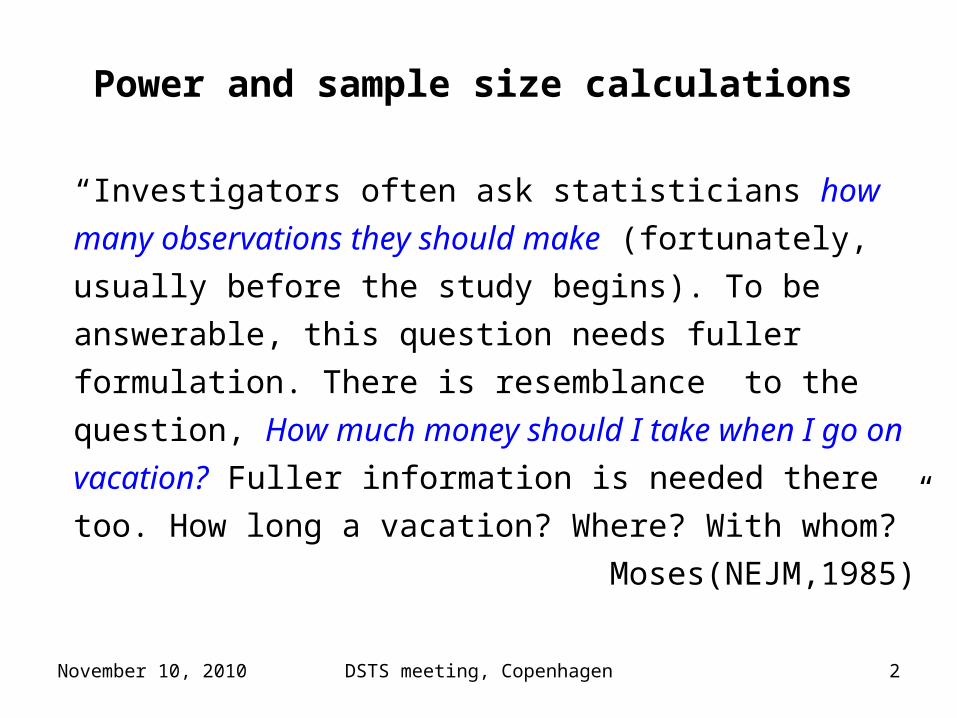
Power and sample size calculations
“Investigators often ask statisticians how many
observations they should make (fortunately, usually
before the study begins). To be answerable, this
question needs fuller formulation. There is
resemblance to the question, How much money
should I take when I go on vacation? Fuller
information is needed there too. How long a
vacation? Where? With whom?”
Moses(NEJM,1985)
November 10, 2010 DSTS meeting, Copenhagen 3
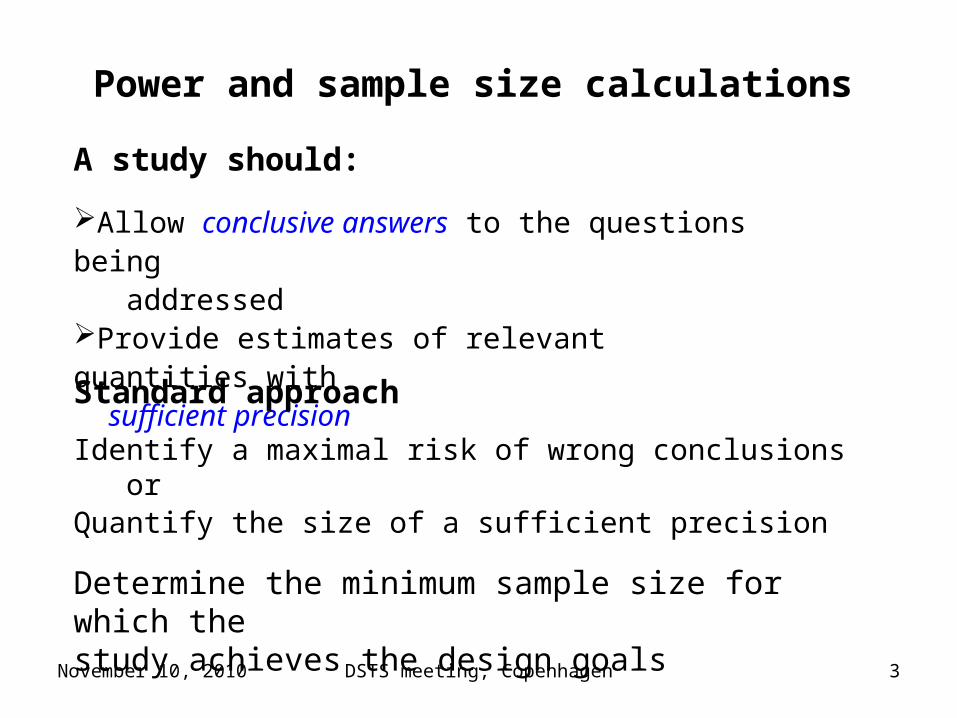
A study should:
Allow conclusive answers to the questions being addressedProvide estimates of relevant quantities with
sufficient precisionStandard approach
Identify a maximal risk of wrong conclusions orQuantify the size of a sufficient precision
Determine the minimum sample size for which the study achieves the design goals
Power and sample size calculations

November 10, 2010 DSTS meeting, Copenhagen 4
Implementation of standard approach
Use commercial special-purpose software
Simulations
Analytic methods
Power and sample size calculations
November 10, 2010 DSTS meeting, Copenhagen 5
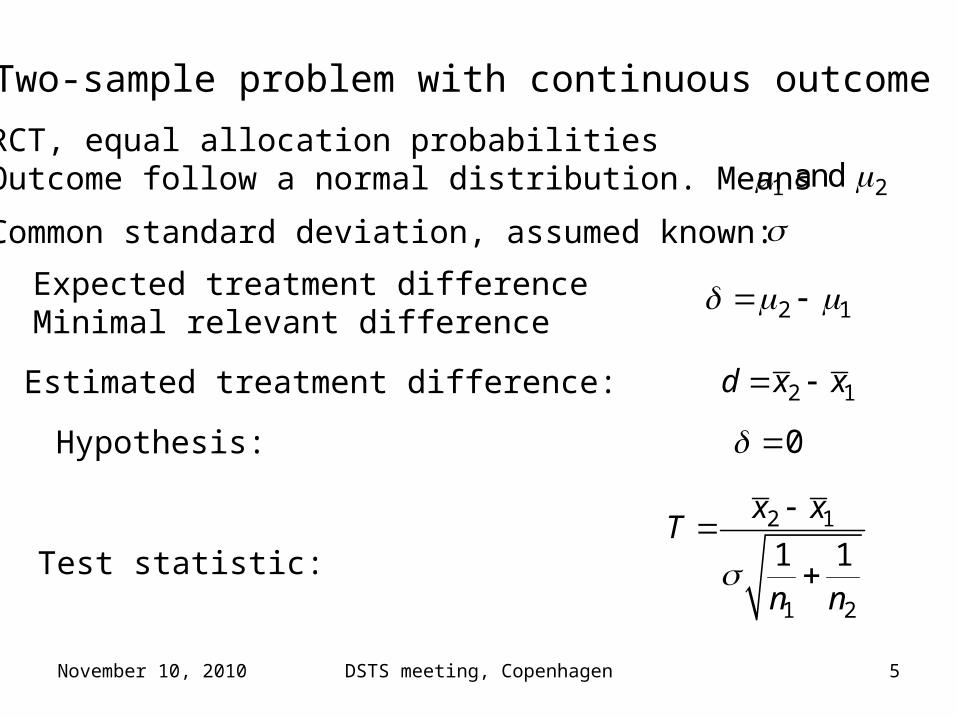
RCT, equal allocation probabilitiesOutcome follow a normal distribution. Means
Common standard deviation, assumed known:
2 1d x x Estimated treatment difference:
Expected treatment differenceMinimal relevant difference 2 1
0 Hypothesis:
2 1
1 2
1 1
x xT
n n
Test statistic:
1 2 and
Two-sample problem with continuous outcome
November 10, 2010 DSTS meeting, Copenhagen 6
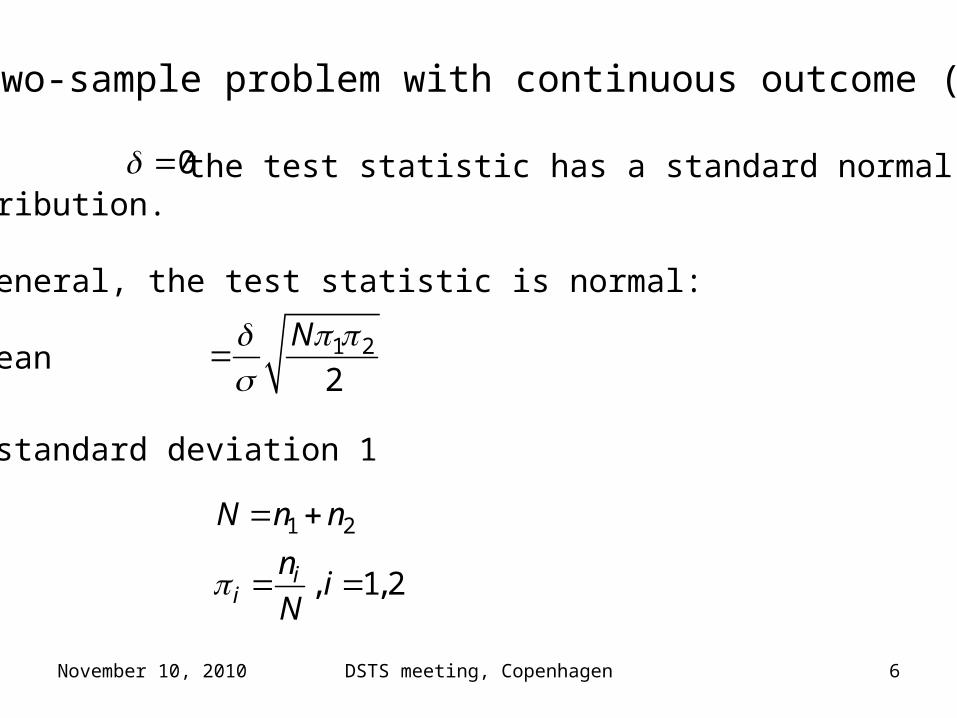
If the test statistic has a standard normal distribution.
In general, the test statistic is normal:
mean
and standard deviation 1
0
Two-sample problem with continuous outcome (2)
1 2
2
N
1 2
, 1, 2ii
N n n
ni
N
November 10, 2010 DSTS meeting, Copenhagen 7
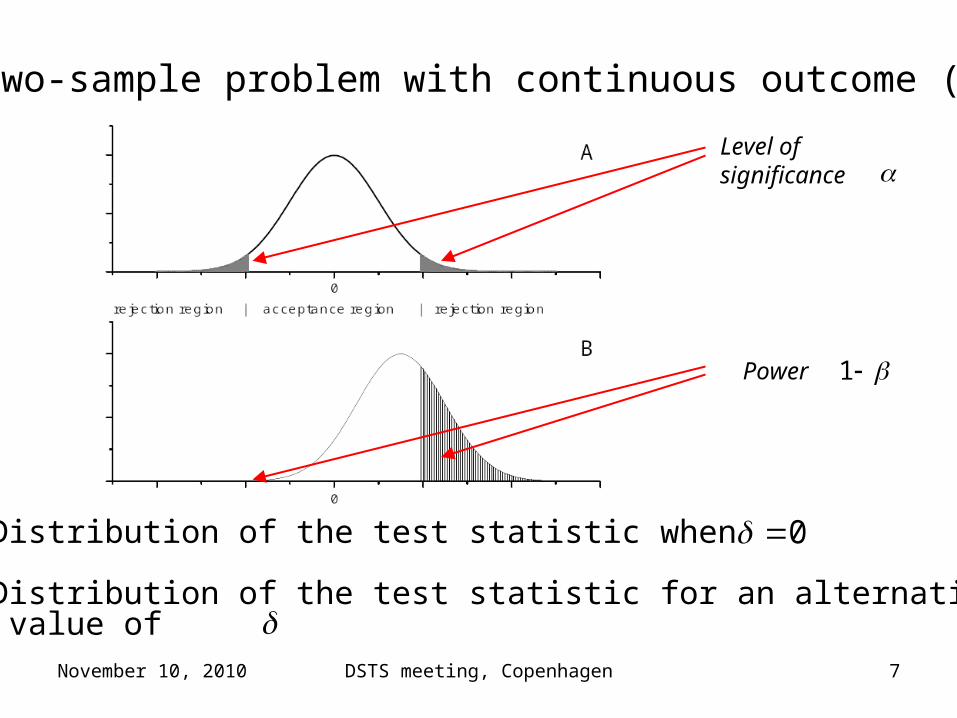
A: Distribution of the test statistic when
B: Distribution of the test statistic for an alternative value of
0
Level of significance
Power 1
Two-sample problem with continuous outcome (3)

November 10, 2010 DSTS meeting, Copenhagen 8
Assume so only the upper term matters
1 2 1 22 1 2
1
2 2
power
N NP Z z P Z z
0 1 20% and
Two-sample problem with continuous outcome (4)
Only contribution from one term unless power close to level of significance
1 21 1 2 2
Nz z
Basic relation

November 10, 2010 DSTS meeting, Copenhagen 9
Two-sample problem with continuous outcome (5)
1 2 1 2| |
power P Z N z
2
211 2 1 2 1 1 2N n n z z
Sample size for given power
Power for given sample size
November 10, 2010 DSTS meeting, Copenhagen 10
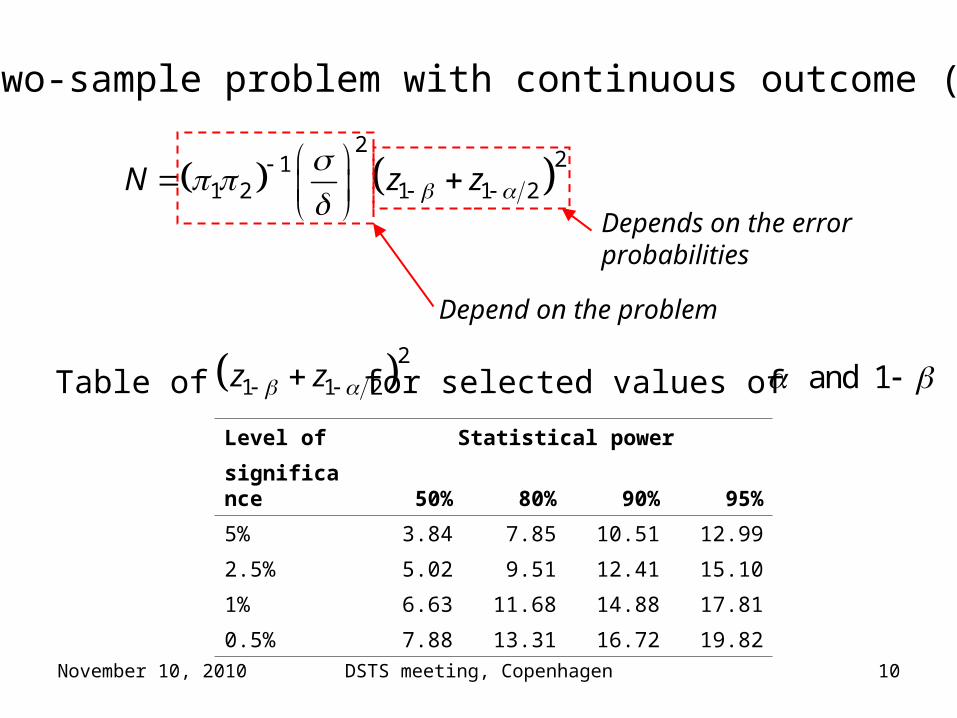
2
211 2 1 1 2N z z
Two-sample problem with continuous outcome (6)
Depends on the error probabilities
Depend on the problem
Level of Statistical power
significance 50% 80% 90% 95%
5% 3.84 7.85 10.51 12.99
2.5% 5.02 9.51 12.41 15.10
1% 6.63 11.68 14.88 17.81
0.5% 7.88 13.31 16.72 19.82
21 1 2z z for selected values of 1 and Table of

November 10, 2010 DSTS meeting, Copenhagen 11
Comparison of two proportions
Score test: 2 1
2 1
1 1
ˆ ˆ
ˆ ˆ1n n
p p
p p
Basic relation becomes 0 1 2 1Az z N
1 2 1 1 1 2 2 2, 1 1A p p p p p p
0 1 2, 1p p p p
with 2 1p p

November 10, 2010 DSTS meeting, Copenhagen 12
2 1
2 2 2 1 1 1
ˆ ˆ
ˆ ˆ ˆ ˆ1 1
p p
p p n p p n
Comparison of two proportions (2)
Wald’s test:
Basic relation becomes 1 2 1 Az z N
The simple structure N = (model term)(error term) is recovered

November 10, 2010 DSTS meeting, Copenhagen 13
Comparison of two proportions (3)
Example 1
1 2
2
1
0.5
0.20
0.16
p
p
0.05
1 0.80
N(Score) = 2894
N(Wald) = 2888
1 20.8, 0.2
N(Score) = 4610
N(Wald) = 4278
N(Score) = 4422
N(Wald) = 4749
Other sample fractions
1 20.2, 0.8

November 10, 2010 DSTS meeting, Copenhagen 14
Sample size and power calculations based on Wald’s test
0:H
0
ˆ
ˆN
Wse
ˆlim NN
Nse
0
1 2| | N
power P Z z
22
1 1 20
N z z
Data and Statistical modelQuestion: Hypothesis about 1-dim. parameter
Wald’s test
with
Sample size for given power
Power for given sample size

November 10, 2010 DSTS meeting, Copenhagen 15
Sample size and power calculations based on Wald’s test (2)
Example 1 (ctd.) Same problem, but now use Wald’s test based on ln(odds)
0 1 2
ln( )
0; 0.16; 0.20 0.272
OR
p p
1 2
1 2
1 2
0.5, 0.5
0.2, 0.8
0.8, 0.2
N = 2906
N = 4778
N = 4304
Score Wald
2894 2888
4610 4278
4422 4749
November 10, 2010 DSTS meeting, Copenhagen 16
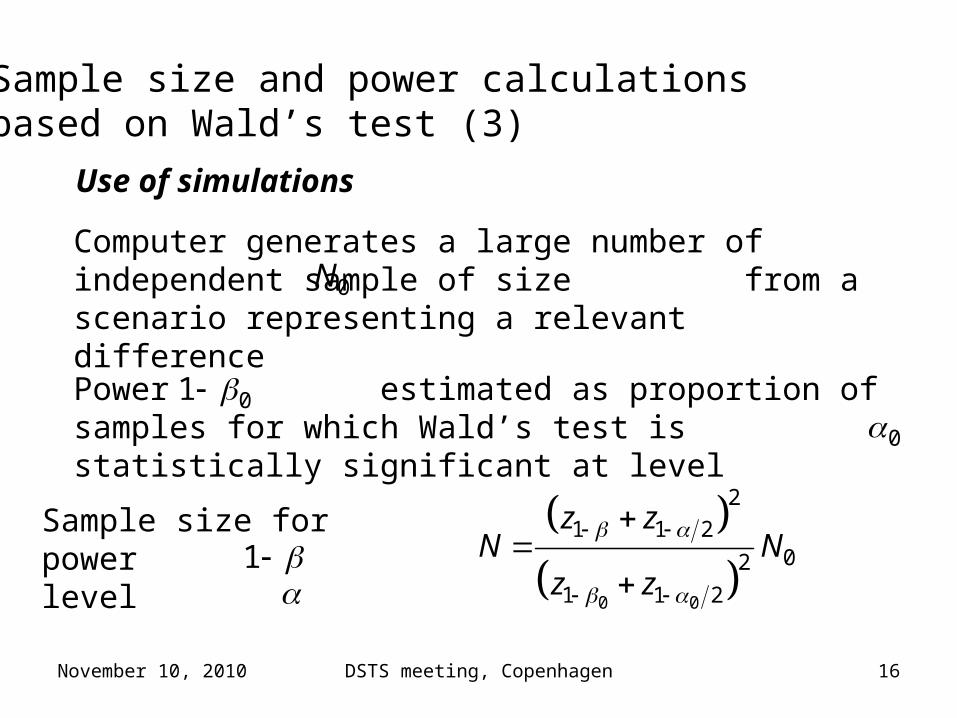
Sample size and power calculations based on Wald’s test (3)
Use of simulations
Computer generates a large number of independent sample of size from a scenario representing a relevant difference
0N
Power estimated as proportion of samples for which Wald’s test is statistically significant at level
01
0 0
2
1 1 202
1 1 2
z zN N
z z
0
Sample size for powerlevel
1
November 10, 2010 DSTS meeting, Copenhagen 17
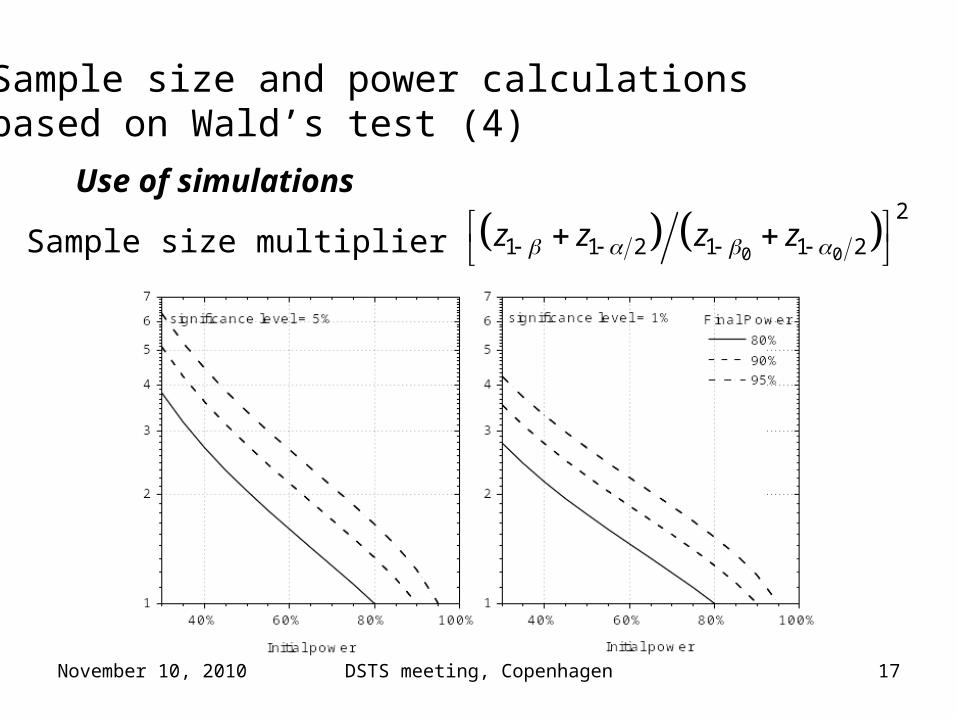
Sample size and power calculations based on Wald’s test (4)
Use of simulations
Sample size multiplier 0 0
2
1 1 2 1 1 2z z z z

November 10, 2010 DSTS meeting, Copenhagen 18
Two-sample problem with censored survival data
Time-to-event dataTwo sample, proportional hazards model
1 2 and t t 2 1ln t t
2 1
1 1ˆNse y y
Hazard ratesParameter of interest
0
ˆ
ˆN
Wse
Wald’s test
with
, 1,2iy i the number of events in group i

November 10, 2010 DSTS meeting, Copenhagen 19
1 12 2 2 1 1
1 1 2 2
2
1 1 2
21 2
P PN z z
z z
P
1 12 2 1 1
NP P
Wald’s test is approximately normal with sd = 1 and
mean
, 1, 2iP i average probability of an event in group i
Sample size
Two-samples with censored data (2)
Sample size depends primarily on number of events
November 10, 2010 DSTS meeting, Copenhagen 20
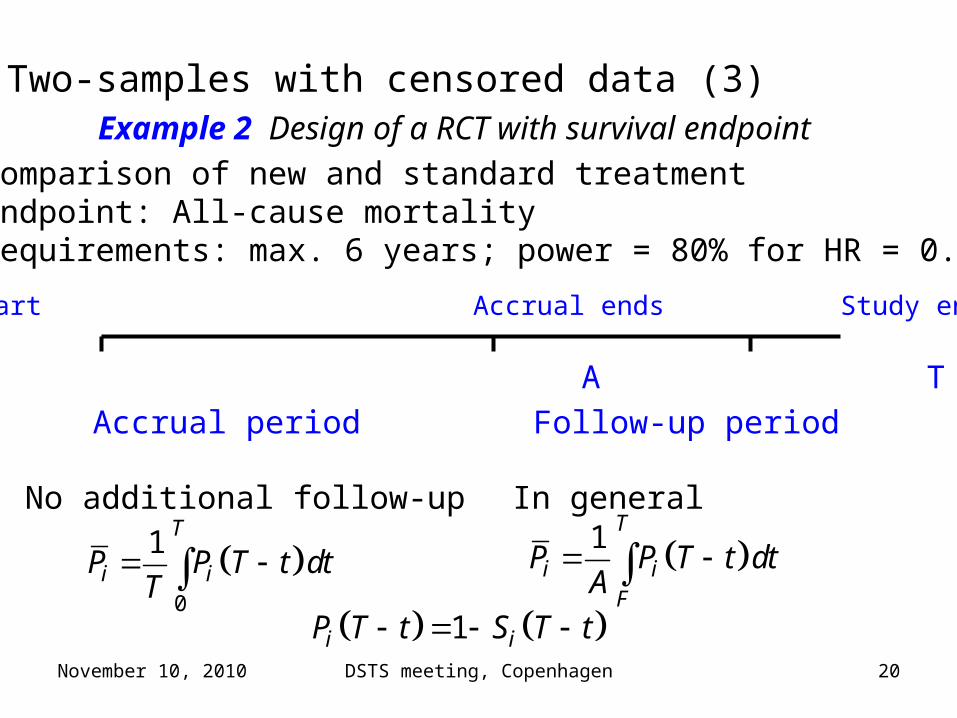
Two-samples with censored data (3)Example 2 Design of a RCT with survival endpoint Comparison of new and standard treatmentEndpoint: All-cause mortalityRequirements: max. 6 years; power = 80% for HR = 0.8
0 A T = A + F
Study start Accrual ends Study ends
Accrual period Follow-up period
1 T
i iF
P P T t dtA
0
1 T
i iP P T t dtT
No additional follow-up In general
1i iP T t S T t

November 10, 2010 DSTS meeting, Copenhagen 21
Two-samples with censored data (3)Example 2 (ctd.)
KM-estimate: standard treatment 1 - KM
Std. Treatment: Average event probability =AUC/baseline
Average event probability with new treatment
0.82 2 1
1 11
T T
F F
P P T t dt S T t dtA A
November 10, 2010 DSTS meeting, Copenhagen 22
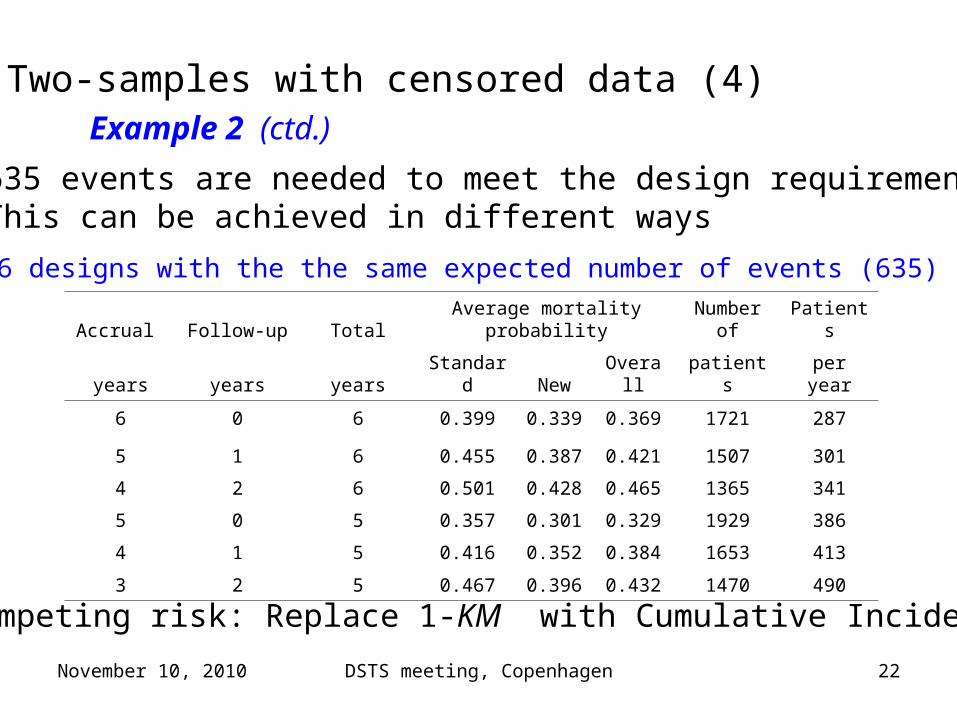
Two-samples with censored data (4)Example 2 (ctd.)
Accrual Follow-up Total Average mortality probabilityNumber
of Patients
years years years Standard New Overall patients per year
6 0 6 0.399 0.339 0.369 1721 287
5 1 6 0.455 0.387 0.421 1507 301
4 2 6 0.501 0.428 0.465 1365 341
5 0 5 0.357 0.301 0.329 1929 386
4 1 5 0.416 0.352 0.384 1653 413
3 2 5 0.467 0.396 0.432 1470 490
6 designs with the the same expected number of events (635)
635 events are needed to meet the design requirementsThis can be achieved in different ways
Competing risk: Replace 1-KM with Cumulative Incidence

November 10, 2010 DSTS meeting, Copenhagen 23
Non-inferiority & equivalence trials
Null hypothesisMinimal relevant difference Maximal irrelevant difference
November 10, 2010 DSTS meeting, Copenhagen 24
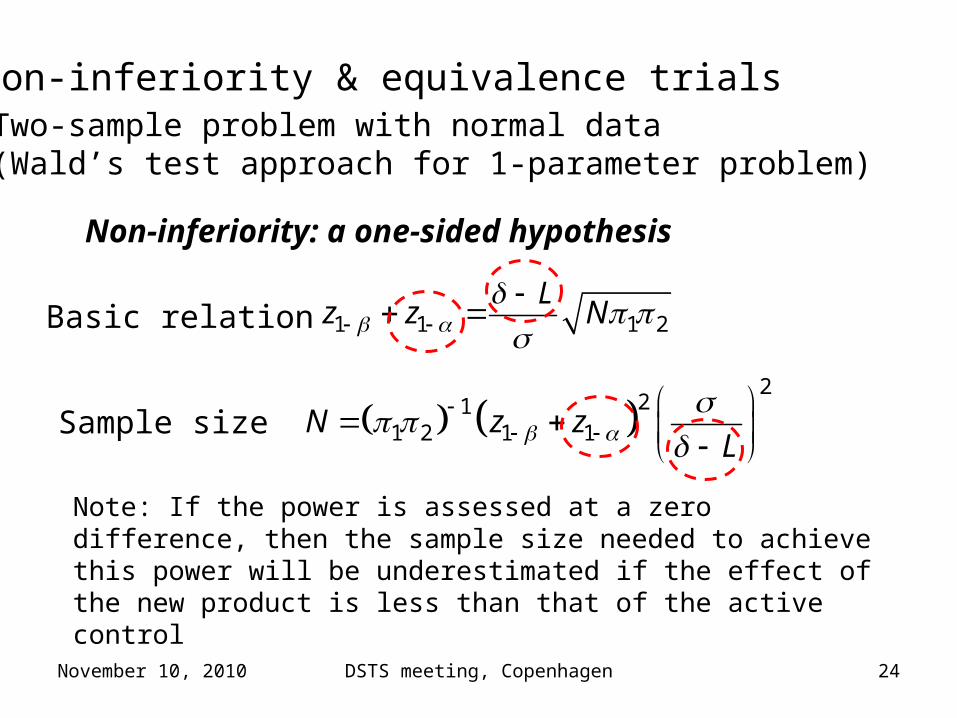
Non-inferiority & equivalence trials
Non-inferiority: a one-sided hypothesis
Two-sample problem with normal data(Wald’s test approach for 1-parameter problem)
1 1 1 2L
z z N
2
211 2 1 1N z z
L
Basic relation
Sample size
Note: If the power is assessed at a zero difference, then the sample size needed to achieve this power will be underestimated if the effect of the new product is less than that of the active control

November 10, 2010 DSTS meeting, Copenhagen 25
Non-inferiority & equivalence trials
Equivalence: union-intersection testTwo one-sided tests
Basic relations
Sample size: is specified for
Note: If the power is assessed at a zero difference, then the sample size needed to achieve this power is underestimated if the true difference is not zero.
1
2
1 1 1 2
1 1 1 2
U
U
z z N
z z N
2
211 2 1 2 1N z z
U
0 1 21power
November 10, 2010 DSTS meeting, Copenhagen 26
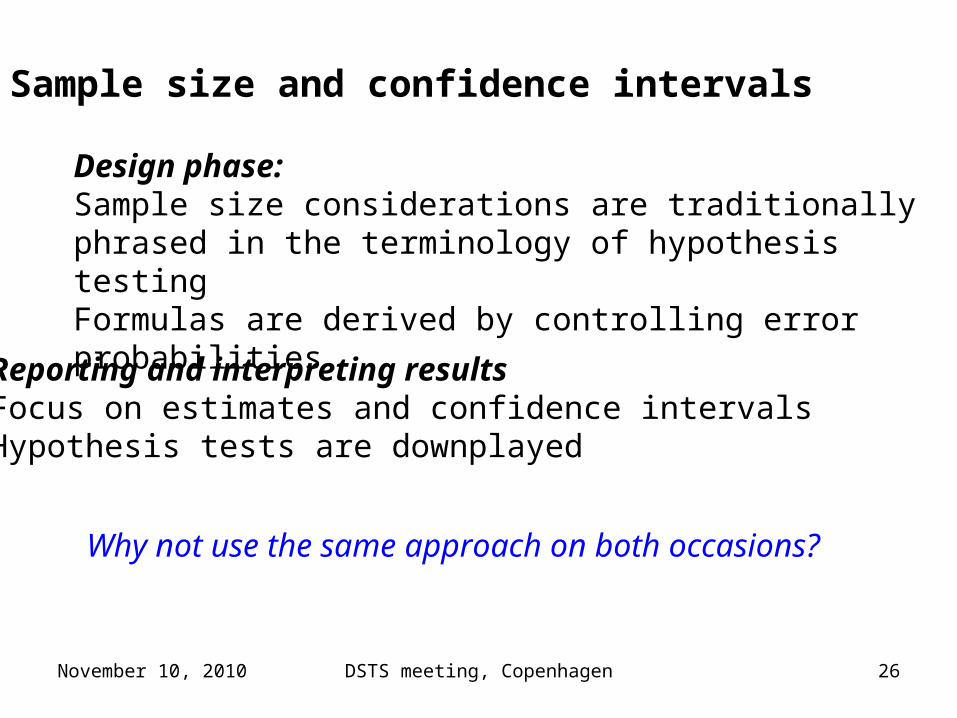
Sample size and confidence intervals
Design phase: Sample size considerations are traditionally phrased in the terminology of hypothesis testingFormulas are derived by controlling error probabilities
Reporting and interpreting resultsFocus on estimates and confidence intervalsHypothesis tests are downplayed
Why not use the same approach on both occasions?

November 10, 2010 DSTS meeting, Copenhagen 27
Sample size and confidence intervals
Power calculations when reporting the results?
Probability statements should utilize the collected data and not be based on anticipated values of the parameters.
Interpretation: Probability of replication
Some statistical packages provide calculation of ”post-hoc power” or ”observed power”, i.e. Power computed at the estimated parameter value.
This does not make sense. The power becomes a (known) function of the significance level.

November 10, 2010 DSTS meeting, Copenhagen 28
Sample size and confidence intervals
Sample size calculations based on confidence intervals?
Two-sample problem with normal data(Wald’s test approach for 1-parameter problem)
1 21 2
d zN
95% confidence interval
Choose smallest N such that a confidence interval centered at excludes 0
2
211 2 1 2N z
Corresponds to power = 0.50
November 10, 2010 DSTS meeting, Copenhagen 29
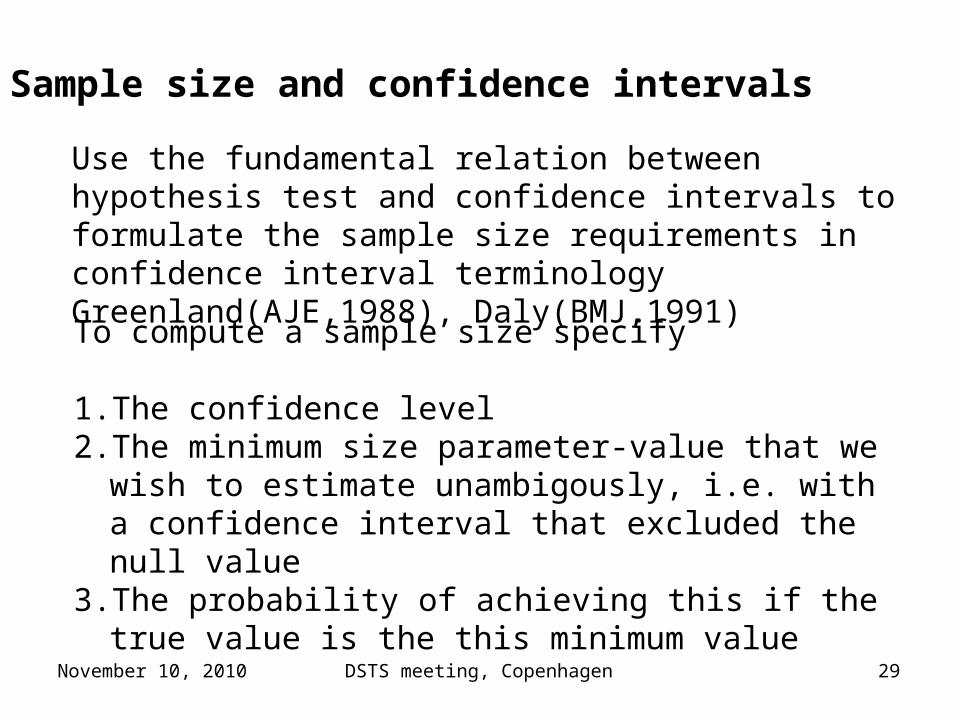
Sample size and confidence intervals
Use the fundamental relation between hypothesis test and confidence intervals to formulate the sample size requirements in confidence interval terminology Greenland(AJE,1988), Daly(BMJ,1991)To compute a sample size specify
1. The confidence level2. The minimum size parameter-value that we wish
to estimate unambigously, i.e. with a confidence interval that excluded the null value
3. The probability of achieving this if the true value is the this minimum value
November 10, 2010 DSTS meeting, Copenhagen 30
"How not to collaborate with a biostatistician”
http://www.xtranormal.com/watch/6878253/
Power and sample size calculations
A ”commentary” on the world-wide-web: