novel material with potential for application in packaging ...
43
1 Jute cellulose nano-fibrils/hydroxypropylmethylcellulose nanocomposite: A 1 novel material with potential for application in packaging and transdermal drug 2 delivery system 3 4 5 Jonathan Tersur Orasugh a,b , Nayan Ranjan Saha a , Dipak Rana c , Gunjan Sarkar a , Md. Masud 6 Rahaman Mollick a , Atiskumar Chattoapadhyay d , Bhairab Chandra Mitra e , Dibyendu Mondal* a , 7 Swapan Kumar Ghosh* b , Dipankar Chattopadhyay* a 8 9 10 a Department of Polymer Science and Technology, University of Calcutta, 92 A.P.C. Road, Kolkata 11 -700 009, West Bengal, India. 12 b Department of Jute and Fiber Technology, Institute of Jute Technology, University of Calcutta, 35 13 Ballygunge Circular Road, Kolkata -700 019, West Bengal, India. 14 c Department of Chemical and Biological Engineering, Industrial Membrane Research Institute, 15 University of Ottawa, 161 Louis Pasteur St., Ottawa, ON, K1N 6N5, Canada. 16 d Secretary, Faculty Council For PG & UG Studies In Science, Jadavpur University, 188 Raja S. C. 17 Mallick Road, Kolkata, West Bengal 700032; India. 18 e Dr. M. N Dastur School of Material Science and Engineering, Indian Institute of Engineering 19 Science and Technology, Shibpur, Howrah -711103, West Bengal, India. 20 21 22 * Corresponding author at: Tel: +91-9433379034; 23 E-mail address: [email protected] 24 25
Transcript of novel material with potential for application in packaging ...

1
Jute cellulose nano-fibrils/hydroxypropylmethylcellulose nanocomposite: A 1
novel material with potential for application in packaging and transdermal drug 2
delivery system 3
4
5
Jonathan Tersur Orasugha,b
, Nayan Ranjan Sahaa, Dipak Rana
c, Gunjan Sarkar
a, Md. Masud 6
Rahaman Mollicka, Atiskumar Chattoapadhyay
d, Bhairab Chandra Mitra
e, Dibyendu Mondal*a
, 7
Swapan Kumar Ghosh*b, Dipankar Chattopadhyay*a
8
9
10
a Department of Polymer Science and Technology, University of Calcutta, 92 A.P.C. Road, Kolkata 11
-700 009, West Bengal, India. 12
b Department of Jute and Fiber Technology, Institute of Jute Technology, University of Calcutta, 35 13
Ballygunge Circular Road, Kolkata -700 019, West Bengal, India. 14
c Department of Chemical and Biological Engineering, Industrial Membrane Research Institute, 15
University of Ottawa, 161 Louis Pasteur St., Ottawa, ON, K1N 6N5, Canada. 16
d Secretary, Faculty Council For PG & UG Studies In Science, Jadavpur University, 188 Raja S. C. 17
Mallick Road, Kolkata, West Bengal 700032; India. 18
e Dr. M. N Dastur School of Material Science and Engineering, Indian Institute of Engineering 19
Science and Technology, Shibpur, Howrah -711103, West Bengal, India. 20
21
22
* Corresponding author at: Tel: +91-9433379034; 23
E-mail address: [email protected] 24
25

2
ABSTRACT 26
Nowadays, bio-derived cellulose nano-fibrils based nanocomposites is gaining utmost interest in 27
the area of barrier films for food packaging, as reinforcing filler to make biodegradable 28
nanocomposites with different biopolymers for various applications such as transdermal drug 29
delivery, edible packaging and tissue scaffolding. Ultrasound-assisted preparation of 30
hydroxypropylmethylcellulose based nanocomposites with cellulose nano-fibrils were carried out 31
following solution mixing technique. The crystalline nature of cellulose nano-fibrils has been 32
scrutinized by X-ray diffraction study. The field emission-scanning electron micrographs of 33
cellulose nano-fibrils revealed a network of nano-fibrillar morphology. The Fourier transform 34
infrared spectroscopy results of cellulose nano-fibrils confirmed the removal of lignin and 35
hemicellulose from raw jute (Corchorus olitorius L.) fibres. The storage modulus and tensile 36
properties of hydroxypropylmethylcellulose films increased up to the addition of 1.00 wt% 37
cellulose nano-fibrils. The moisture affinity of hydrophilic hydroxypropylmethylcellulose has also 38
been reduced at 1.00 wt% cellulose nano-fibrils loading. The impact of cellulose nano-fibrils 39
loading on the cumulative percentage of drug release from prepared nanocomposites films has been 40
explored accordingly. By utilizing these versatilities of cellulose nano-fibrils, the fabricated 41
nanocomposites are expected to be highly promising in the area of packaging and transdermal drug 42
delivery system. 43
44
45
46
Keywords: Jute fibres, Cellulose nano-fibrils, Hydroxypropylmethylcellulose, Nanocomposite, 47
Transdermal drug delivery 48
49
3
1. Introduction 50
Cellulose nano-fibrils (CNF) with at least one of its dimensions ranging between 5-100 nm, 51
obtained from lignocellulose biomass/fibres or cellulosic biomass/fibres is of great interest in the 52
field of nanotechnology today. Some sources of CNF utilized by researchers include bacterial 53
cellulose (George et al., 2014), pineapple leaf fibres (Ananas comosus Merr.) (Cherian et al., 2010), 54
wheat straw (Triticum aestivum L.), and soy hulls (Glycine max L. Merrill.) (Silvério et al., 2014; 55
Wang and Sain 2007; Kaushik and Singh 2011), wood (Bilbao-Sáinz et al., 2011; Wang et al., 56
2014), and tunicin/tunicate (Microcosmus sulcatus (species)) (Azizi Samir et al., 2004; Favier, 57
Chanzy and Cavaille, 1995). 58
Cellulose nano-fibrils has been extracted by different approaches which range from 59
cryocrushing (Bhatnagar and Sain, 2005), high pressure homogenization (Qua et.al., 2011), acid 60
hydrolysis (Kumar et al., 2014), steam explosion (Michell, 1989), enzymic hydrolysis (Pääkkö et 61
al., 2007), grinding (Iwamoto et al., 2007), and a combination of two or more approaches including 62
cryocrushing and high pressure homogenization (Wang and Sain 2007), homogenization and 63
grinding (Iwamoto et al., 2007), refining and high pressure homogenization (Nakagaito et al., 64
2004). 65
The attention drawn to CNFs is as a result of its attractive properties which include high 66
modulus, high tensile strength, and low coefficient of thermal expansion (De Moura et al., 2011). 67
CNF has shown promising potential in several applications, such as, in oil recovery (Chen et al., 68
2011; Jin et al., 2011), pharmaceuticals (Lin and Dufresne, 2014), bio-scaffolds (Lin and Dufresne, 69
2014), foldable paper antenna (Chen et al., 2011), dye carriers (Sun et al., 2014), aerogel 70
membranes for cargo carriers (Jin et al., 2011), filtration media (Asper et al., 2015; Huang et al., 71
4
2016), dental tissue regeneration, barrier films, high strength paper boards, emulsion, dispersion, 72
biomedical (Lin and Dufresne, 2014), bioimaging (Dong and Roman, 2007), nanocomposites for 73
gas barrier films (Nair et al., 2014), novel tablet excipient (Kolakovic et al., 2011), optically 74
transparent functional materials (Koga et al., 2013; Nogi et al., 2009, 2013), and ultra flexible 75
nonvolatile memory (Nagashima et al., 2014). 76
There are three classes of nanocellulose (Lin and Dufresne, 2014) namely cellulose 77
nanocrystals (CNC) (Kumar et al., 2014; Brinchi et al., 2013) or nanocrystalline cellulose (NCC) 78
(Kumar et al., 2014) or cellulose nanowhiskers (CNWs) or cellulose nano-particles (Bilbao-Sáinz et 79
al., 2011) and cellulose nano-fibrils (CNFs) also referred to as nanofibrillated cellulose (NFC) 80
(Bhatnagar and Sain 2005; Iwamoto et al., 2007) and bacterial nanocellulose (Juntaro et al., 2012; 81
Lin and Dufresne 2014). The first category is extracted by chemical method, mainly acid hydrolysis 82
(Bilbao-Sáinz et al., 2011; Kumar et al., 2014), while the second class is extracted by mechanically 83
disintegrating cellulose pulp in water (Bhatnagar and Sain, 2005; Iwamoto et al., 2007), and can be 84
isolated from different sources as stated earlier. The extraction of nanocellulose using H2SO4 has 85
been reported in some literature (Bilbao-Sáinz et al., 2011; Kumar et al., 2014; Youssef et al., 86
2015). The concentration of the acid used as reported in some literature is 63-64% (Bilbao-Sáinz et 87
al., 2011; Kumar et al., 2014; Youssef et al., 2015). It is believed that the concentration of the acid 88
used by previous researchers can be reduced and the process will be more environmentally friendly. 89
Jute is one of the most important fibres which are neglected by humans. Jute fibres possess 90
unique properties which, if utilized effectively will not only solve problems in textiles including 91
technical textiles, medical textiles, agrotextiles, but also in the fields of cosmetics, bioengineering, 92
nano-composites, automobiles, aerospace, etc. The preparation of hydroxypropylmethylcellulose 93
(HPMC) reinforced CNF from jute, which is a potential nanocomposite for advanced applications, 94

5
has not been reported earlier by anyone. Some researchers tried to synthesizing CNF from jute 95
fibres, ended up with a mixture of micro and nano-cellulose (Rahman et al., 2014; Vijay et al., 96
2011). 97
Hydroxypropylmethylcellulose is a biodegradable and biocompatible polymer. The use of 98
HPMC for advanced applications, such as in packaging, requires modifications such as 99
reinforcement with nanomaterials such as CNF, which leads to improved mechanical and moisture 100
barrier properties (Bilbao-Sáinz et al., 2010; 2011; De Moura et al., 2011; George et al., 2014). It is 101
reported that the addition of nanocellulose (NC) to HPMC led to an increase of 22% in tensile 102
strength and 55% in Young’s modulus and the NC only decreased 3–6% in transparency (Bilbao-103
Sáinz et al., 2011). 104
Ketorolac tromethamine (KT) is an anti-inflammatory and analgesic agent (Rokhade et al., 105
2006). It is a potent non-narcotic and non-opioid analgesic with cyclooxygenase inhibitory activity 106
(Estapé et al., 1990; Mroszczak et al., 1987). It is non-addictive in nature, and no respiratory side 107
effects (Saha et al., 2016), and other side effects such as nausea and vomiting are the prevalent side-108
effects in pentazocine treated patients (Estapé et al., 1990). KT has been reported to be 800 times 109
more effective than aspirin (Saha et al., 2016).This non-steroidal analgesic, which is well absorbed 110
after oral administration, has an excellent tolerance profile (Estapé et al., 1990). The administration 111
of KT is done by oral, intramuscular or intravenous routes aimed at treatment of moderate to severe 112
pain for short periods of time (biological half-life 4≥6 h). The transdermal delivery of KT would 113
help to control the therapeutic dose and also reduce the side effects in the gastrointestinal tract 114
(Saha et al., 2016). The investigation of drug loading and release of nanocomposites based on 115
biopolymer bacteria cellulose has been studied (Müller et al., 2013). The use of a 3D-network of 116
nanocellulose as a controlled drug release carrier has been reported (Huang et al., 2013). HPMC-117
6
montmorillonite based as well as other polymer nanocomposite materials have widely been studied 118
due to its superior properties (Mondal et al., 2013b). 119
Nanocomposites made from cellulose regenerated polymers reinforced with naturally 120
derived fillers such as CNF is the focal point of attraction in recent years due to its good mechanical 121
properties, low density, biodegradability, and renewability (De Moura et al., 2011). Synthetic 122
polymers derived from crude oil create the problem of accumulation of non-biodegradable waste 123
(Bilbao-Sáinz et al., 2010). The use of cellulose derived polymers for the preparation of films for 124
packaging and other advanced materials are the alternatives. The effects of incorporating different 125
filler levels (2, 4, 6, 8, and 10%) of cellulose nanocrystals from soy hulls upon the mechanical, 126
thermal, and barrier properties of methylcellulose (MC) nanocomposites have been previously 127
studied (Silvério et al., 2014). The cellulose nanocrystals from soy hulls provided a reduction in 128
water vapor permeability of up to 36.32% of the nanocomposites for 8 wt% incorporated cellulose 129
nanocrystals in the MC. A new way of processing cellulose whisker filled electrolytes with higher 130
mechanical stiffness than the one of highly cross-linked polyether networks has been also reported 131
(Azizi Samir et al., 2004). Amorphous alginate-oxidized nanocellulose with good structural and 132
mechanical strength, induced by oxidized cellulose nanocrystals having semi-interpenetrating 133
polymer network from oxidized microfibrillated cellulose, has been also reported (Lin et al., 2012). 134
At present, there is lack of report on CNF derived from jute as reinforcement filler for 135
HPMC based nanocomposites for food packaging application or for potential application as a 136
carrier for transdermal drug delivery. In this work, a simple and effective process for isolation of 137
CNF from jute lignocellulosic fibres using 48% acid which is much less than earlier reports has 138
been established, and for design/fabrication of CNF reinforced HPMC. The effect of CNF loading 139

7
on the mechanical, moisture barrier, water vapour transmission rate (WVTR), and transdermal drug 140
release properties of HPMC has also been studied. 141
142
2.0 Materials and Methods 143
2.1 Materials 144
Hydroxypropylmethylcellulose (HPMC) (50 cps) was obtained from the Central Drug 145
House (Pvt.) Ltd., New Delhi, India. Cellulose nano-fibrils were extracted from jute fibres. Caustic 146
soda (97% pure), fused calcium chloride, sulphuric acid (98%), and hydrogen peroxide (50%) 147
purchased from Merk Specialities Pvt. Ltd., Mumbai, India. Sodium sulphite was purchased from 148
Qualigens Fine Chemicals, Mumbai, India. Sodium chlorite (80% pure) was purchased from Loba 149
Chemie Laboratory Reagents & Fine Chemicals, Mumbai, India. Ketorolac tromethamine (KT) was 150
a gift sample received from Unichem Labs Ltd., Mumbai, India. 151
152
2.2 Preparation of cellulose nano-fibrils 153
Jute fibres labeled as “JF” were chopped into 2-4 mm lengths and soaked in 17.5-18% 154
NaOH solution and heated at 80-90C for about 2 h under continuous stirring. The fibre suspension 155
was filtered to collect the fibres, then washed with water several times to make neutral and dried in 156
air at 105°C for 3 h. The dried fibres were then treated with 0.70% sodium chlorite at pH 4, at 90°C 157
with stirring at intervals of 5 minutes for 2 h. The fibres were filtered and washed with water to 158
neutral and then antichlored with 2% sodium sulphite for 20 minutes. The fibres were further 159
treated with 50% H2O2 using 3-6% on the weight of fibres. The treatment was carried out for 2 h at 160

8
pH 10-11 and then the treated fibres were washed with water to neutral. After this, the fibres were 161
treated with 17.50% sodium hydroxide to remove hemicelluloses from the fibres at room 162
temperature for 1 h and then, washed repeatedly to make neutral and then dried to a constant weight 163
at 100C. The purified jute cellulose fibres were labeled as “PJF”. 164
The dried mass of PJF was then treated with 47-48% (v/v) solution of sulphuric acid 165
(H2SO4) and digested at room temperature (23-26oC) for 3 hrs under constant stirring. Thereafter, 166
the suspension was neutralized; washed with water by centrifugation, freeze-dried and labeled as 167
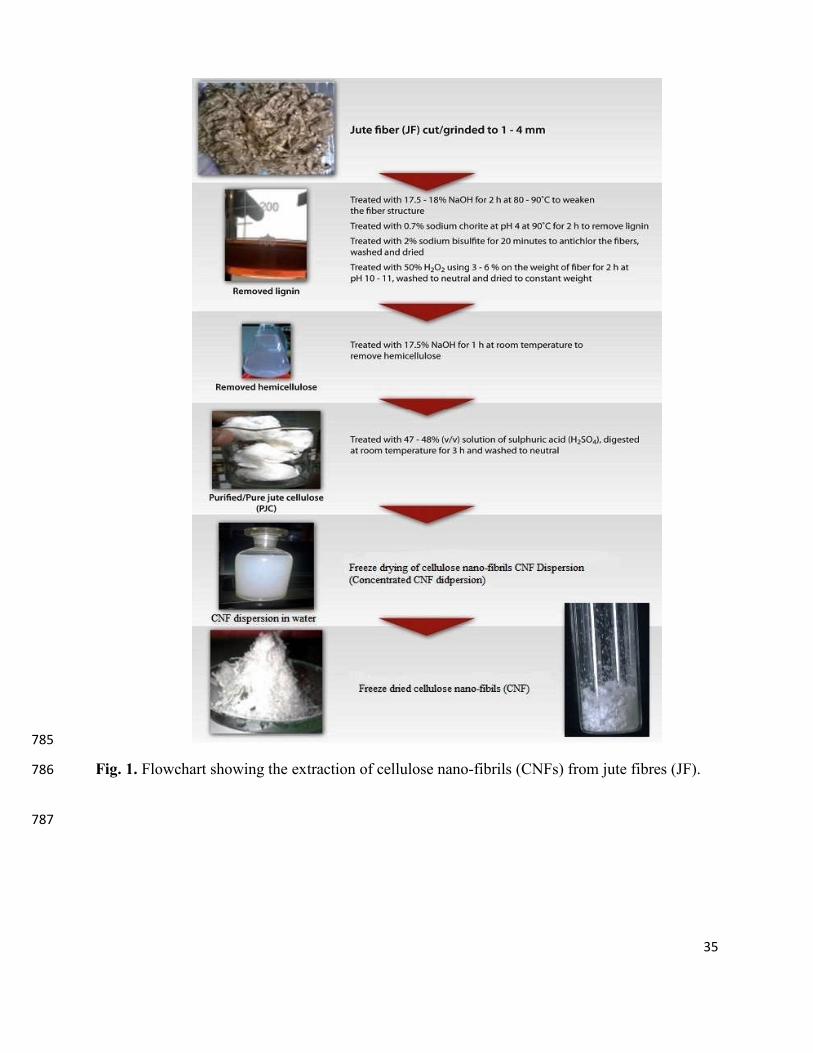
“CNF”. The flow chart of the entire extraction process of CNF is shown in Fig 1. 168
169
2.3 Preparation of nanocomposite films 170
2.3.1 Preparation of HPMC/CNF nanocomposite films 171
Nanocomposite films were prepared using 0.50, 0.75, 1.00, and 3.00 wt% of CNF with 172
respect to the weight of HPMC in 50 ml of distilled water and the dispersions were sonicated for 1 173
hr to obtain a uniform dispersion void of agglomerates. Then, HPMC was dissolved in 50 ml 174
distilled water and also in CNF dispersion for preparation of pure HPMC and HPMC/CNF 175
nanocomposite films. The clear solutions, void of bubbles, was cast into a glass petri dish and dried 176
in a vacuum oven for 12 h at 50°C. The dried films were removed from the petri dish and 177
characterized accordingly. The nanocomposite samples were designated as shown in Tab 1. 178
179
180
181

9
2.3.2 Preparation of drug loaded HPMC/CNF nanocomposite films 182
In order to prepare drug loaded HPMC/CNF nanocomposite films, 0.50, 0.75, 1.00, and 3.00 183
wt% of CNF with respect to the weight of HPMC was dispersed in 50 ml of distilled water and the 184
dispersions were sonicated for 1 hr to obtain a uniform dispersion void of agglomerates. 100 mg of 185
Ketorolac tromethamine (KT) was added to all the dispersions and allowed to dissolve under 186
constant stirring for 1 hr. Then, HPMC was dissolved into all the dispersions at room temperature 187
and stirred continuously until clear dispersions were obtained. The clear dispersions void of bubbles 188
was cast into a glass petri dish and dried in the vacuum oven at 50°C for 12 h. The dried films were 189
removed from the petri dish and characterized accordingly. The five KT loaded nanocomposite 190
samples were designated as shown in Table 1. 191
192
2.4 Characterization 193
2.4.1 Fourier transform infrared (FTIR) spectroscopy 194
Fourier transform infrared spectroscopy (FT-IR) of the extracted CNF was carried out by 195
direct transmittance using KBr pellets with a Perkin Elmer spectrum two at 32 scans and with a 196
resolution of 4 cm-1 with wave number range of 400–4000 cm-1. 197
198
2.4.2. X-ray diffraction (XRD) of CNF and its nanocomposites 199
X-ray diffraction (XRD) analysis of the cellulose nano-fibrils (CNFs) and HPMC/CNF 200
nanocomposite samples were carried out by X-PERT-PRO Panalytical diffractometer using Cu Kα 201
(λ = 1.5406 Å) as the X-ray source at a generator voltage of 40 kV and current of 30 mA. The 202
10
scanning rate was 2°/min. The crystallinity index of the CNFs was calculated from the equation 203
below (Daniel et al., 2015; Segal et al., 1959; Kaushik and Singh, 2011). 204
Crystallinity index = [(I020 – I18.61o)/I020] x 100 (1) 205
Where, I020 is the maximum intensity of the crystalline region (020) of CNF crystallographic 206
planes at 2θ ~ 22.73° and I18.61o is the intensity of the amorphous region of CNF at 2θ ~ 18.61° 207
(Haafiz et al., 2014). 208
209
2.4.3. Field emission-scanning electron microscopy (FE-SEM) of CNF and nanocomposites 210
About 1000 ppm of the freeze-dried CNF was dispersed in triple distilled water and 211
sonicated for 30 minutes. A drop of the dispersion was cast on a silicon slide and dried for 24 hrs. 212
The surface morphology of CNF was examined using a JEOL 6400F FE-SEM microscope. Samples 213
were sputter coated with gold to avoid build-up of electrostatic charge before it was mounted on the 214
sample holder of the FE-SEM. The accelerating voltage was set at 2 and 5 kV. The CNF 215
dimensions were determined directly from the FE-SEM analysis. The cross-sectional morphology 216
of all the prepared nanocomposites was checked using a JEOL 6400F FE-SEM microscope 217
operated with an accelerating voltage of 3 kV, at a working distance of 6-8 mm. 218
219
2.4.4 Dynamic light scattering (DLS) 220
The hydrodynamic particle size of CNF was determined using a Zetasizer Nano ZS, 221
dynamic light scattering (DLS) instrument (Malvern Instruments, Malvern UK). The concentration 222
of CNF in water (as the solvent) was 1000 ppm and the process was repeated three times. 223
11
2.4.5 Mechanical properties 224
Mechanical properties of pure HPMC and its nanocomposite films were carried out using a 225
Zwick Roell (ZO10) tensile testing instrument following a previous approach (Saha et al., 2016). 226
The film samples were cut into a strip 42 mm in length and 5 mm in width and tested within an area 227
of 22 mm length by 5 mm width. The average film thickness of HN0, HN0.5, HN0.75, HN1, and 228
HN3 was measured and found to be 0.13, 0.09, 0.08, 0.09, and 0.10 mm respectively. The samples 229
were tested with a cross-head speed of 5 mm/min. Measurements were performed five times and the 230
mean value was chosen. 231
232
2.4.6 Dynamic mechanical analysis (DMA) 233
Dynamic mechanical analysis is an analytical technique employed in order to characterize 234
the dynamic mechanical behavior of viscoelastic materials (Cespi et al., 2011; Nasseri and 235
Mohammadi, 2014). The dynamic mechanical properties of the nanocomposite samples were 236
analyzed using a PerkinElmer DMA8000 by following a slightly modified approach from previous 237
literature (Cespi et al., 2011). The film sample specifications were 13 mm length and 5 mm width. 238
The tests were carried out by a temperature sweep from 40 to 200°C at a scanning rate of 5°C/min. 239
A constant frequency of 1 Hz and a preload force of 0.01 N were applied on all samples. 240
Measurements were performed in triplicate and the mean value was chosen. 241
242
243
244

12
2.4.7 Moisture absorption (MA) 245
Moisture absorption of the HPMC and its nanocomposite films were determined at a 246
constant humidity in the chamber. A 75% constant relative humidity environment was generated in 247
a hermetic glass container with an aqueous saturated CaCl2 solution. The film samples were cut into 248
dimensions of 3 cm × 3 cm. Then the samples were dried in a vacuum oven at 60°C until constant 249
weight (Wi) was achieved. The samples were kept in the constant humidity chamber. After 24 h, the 250
film samples were weighed immediately to obtain final weight (Wf). Moisture absorption of 251
samples was calculated by the following equation. Measurements were performed in triplicate and 252
the mean value was chosen (Mondal et al., 2013b; Saha et al., 2016). 253
Moisture absorption % = [(Wf –Wi)/Wi] x 100 (2) 254
255
2.4.8 Water vapor transmission rate (WVTR) 256
Water vapor transmission/permeability rates of the CNF nanocomposite films were 257
measured according to previously reported approach (Mondal et al., 2013b). The water vapor 258
transmission rate was determined repeatedly from the weight gained by the cell after 24 h until 259
constant weight gain was reached. Water vapor transmission rate has been calculated by using the 260
following equation (Mondal et al., 2013a). 261
Q = WL/S (3) 262
Where, W is the increase in the desiccant weight per 24 h, L is the film thickness (cm), S is 263
the exposed surface area (cm2) and Q is the water vapor transmission rate (g/cm/24 h). The 264
thickness of the film was measured adopting the previous method (Sarkar et al., 2014). 265

13
266
2.4.9. UV–vis spectroscopy 267
The optical clarity of all the rectangular nanocomposite samples was examined using a 268
Perkin-Elmer Lambda25 UV/Vis spectrophotometer within the wavelength range of 200 to 800 nm. 269
The auto-zero of the instrument was set in respect to an empty compartment (Saha et al., 2016). 270
Absorbance values of all the samples were converted into the transmittance values by employing 271
Lambert-Beer equation. The transmittance values were then plotted against the wavelength (Saha et 272
al., 2016). 273
274
2.4.10. Flatness and folding endurance of the transdermal patches 275
In order to measure the flatness of the samples, three samples each of HN0K, HN0.5K, 276
HN0.75K, HN1K, and HN3K were cut to 10 × 30 mm2 randomly from the transdermal films. The 277
length of each sample was then measured with the view that the variation in length being directly 278
proportional to the non-uniformity in the sample flatness is considered. The final length of each 279
sample was evaluated by calculating the percent constriction, with respect to 0% constriction 280
equivalent to 100% flatness. 281
Again, three samples, each of HN0K, HN0.5K, HN0.75K, HN1K, and HN3K were 282
repeatedly folded at the same point until the sample broke. This was carried out for the three 283
specimens of each sample and the average value was taken. The folding cycles endured by each 284
tested sample specimen without breakage was considered to be the folding endurance value of that 285
sample. 286

14
287
2.4.11 In vitro drug release study 288
The in vitro release studies of HN0K, HN0.5K, HN0.75K, HN1K, and HN3K was 289
performed using a Franz diffusion cell by emulating a previous method (Sarkar et al., 2014). A 290
dialysis membrane (cellulose acetate) (LA390, width 25.27 mm, diameter 15.90 mm and capacity 291
∼1.99 ml/cm) was used to replicate the human skin to study the drug release from the drug-loaded 292
bionanocomposite films. 293
The release of KT from the prepared nanocomposite films is calculated using the power law 294
(Saha et al., 2016; Siepmann and Peppas, 2012). 295
Mt/M∞ = Ktn (4) 296
Where, Mt /M∞ is the absolute cumulative amount of drug released at time t and infinite time, 297
respectively; k is a constant incorporating structural and geometric characteristics of the device, and 298
n is the release or diffusion exponent, indicative of the mechanism of drug release. 299
300
3. Results and Discussion 301
3.1. Fourier transform infrared (FTIR) spectroscopy 302
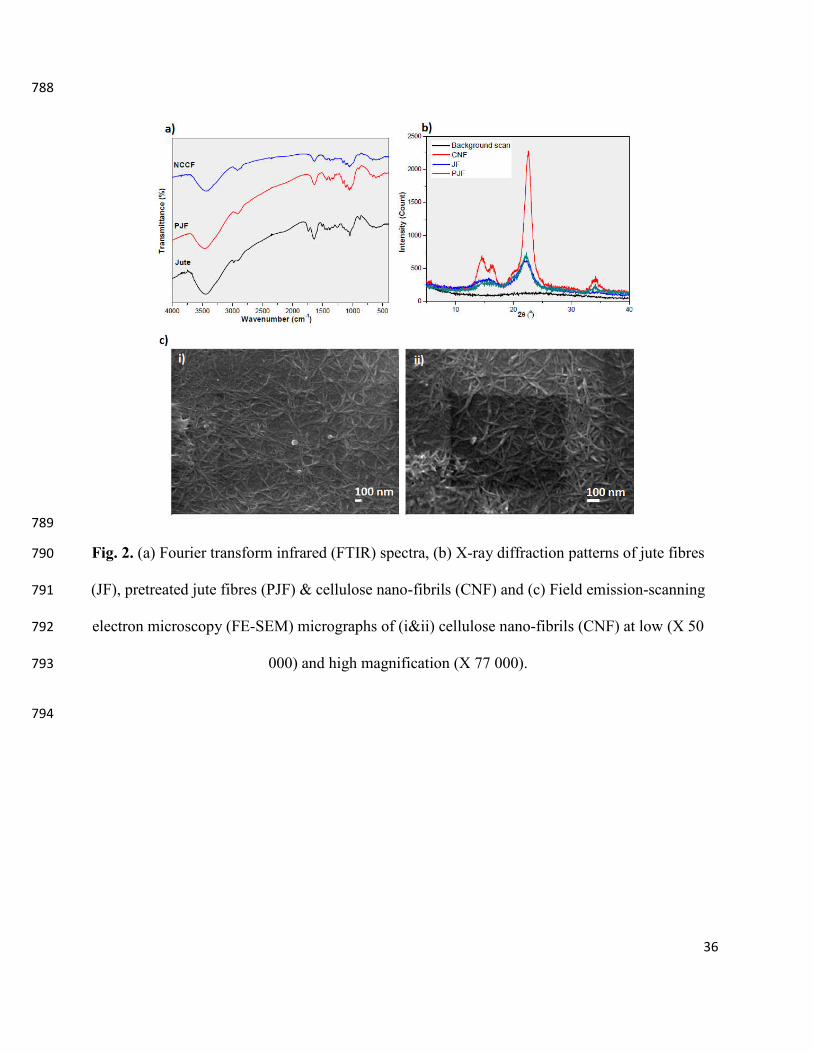
The FTIR spectrum of JF, PJF, and CNF are depicted in Fig. 2a. From the results, it is 303
observed that the peaks at 1513 and 1633 cm-1 present in JF spectra correspond to C=C and the 304
C=O stretching vibrations of the aromatic ring of lignin in JF (He et al., 2013), disappeared in PJF 305
and CNF spectra. Again, this confirmed the complete removal of aromatic lignin. The peaks at 1705 306

15
and 1734 cm-1 in the case of JF are ascribed to the presence of the acetyl ester groups from 307
hemicellulose and also the ester linkage of carboxylic and the -OH groups present in lignin (Daniel 308
et al., 2015), whereas the former peaks disappeared in the case of the PJF and CNF. This confirms 309
the complete removal of lignin and hemicellulose from PJF and CNF. The peak at 2999 cm-1 in JF 310
corresponds to C-H stretching vibrations for the acetyl and ester linkages in lignin, hemicellulose 311
and pectin (Kumar et al., 2014). The absence of this peak in PJF and CNF also proves that lignin 312
and hemicellulose have been removed. The peak at 3458 cm-1 corresponds to O-H stretching 313
vibrations in hemicellulose (Chirayil et al., 2014). The peak at 1111 cm-1 in JF is due to the C-O-C 314
glycoside ether bond in cellulose/hemicellulose (Daniel et al., 2015), which can be seen to have a 315
reduced and is broader due to the reduction in the number of C-O-C glycoside as a result of 316
hemicelluloses removal from the PJF and CNF. The broad peaks at 3700-3100 cm-1 are due to C-H 317
and O-H groups present in cellulose (Kalita et al., 2015), and was observed to decrease and are 318
broader in PJF and CNF due to the presence of more inter hydrogen bonding between the cellulose 319
molecules. The peak at 2919 cm-1 may be due to the C-H stretching vibrations of polysaccharides 320
like cellulose, though this can be seen to be more pronounced in the spectra of PJF and CNF as a 321
result of more organized cellulose structure due to chemical treatment (Kalita et al., 2015; Tang et 322
al., 2015). The peak at 1161 cm-1 represents C-C ring stretching and 1432 cm-1 corresponds to an 323
asymmetric and symmetric -CH2 scissoring motion in cellulose II (Kumar et al., 2014), which is 324
absent in PJF and CNF. So, it is apparent that the structure of cellulose I is changed to cellulose II 325
in the reaction medium. 326
327
328

16
3.2. X-ray diffraction (XRD) 329
Fig. 2b shows the diffraction patterns of JF, PJF, CNF, with each having diffraction peaks at 330
2θ; JF ~15.80° and ~22.27°, corresponding to the Miller indices of (1ī0), (020), for cellulose Iβ 331
convention (French, 2014). PJF ~15.80°, ~20.30°, ~22.29°, and ~34.20° corresponding to the Miller 332
indices of (1ī0), (102), (020), and (004) and CNF ~14.58°,~16.40°, 20.10o ~22.73°, and ~34.15°, 333
corresponding to the Miller indices of (1ī0), (110), (102), (020), and (004) for cellulose II (French, 334
2014; Xu et. al., 2013). The highest intensity peak at 22.27° (JF), 22.29° (PJF), and 22.70° (CNF) is 335
indicative of the crystalline structure of cellulose I (Cherian et al., 2010; Nelson et al., 1964; 336
Oudiani et al., 2011; Park et al., 2010; Xiao et al., 2016). This shows that cellulose I and cellulose II 337
are both present as a mixture in CNF as a result of caustic soda treatment and sulphuric acid 338
hydrolysis processes. Transformation of cellulose I to cellulose II occurs when natural cellulose 339
fibres are treated with alkali (mercerization) or acids (French, 2014; Oudiani et al., 2011; Xu et. al., 340
2013). The crystallinity of JF, PJF, and CNF has been found to be ~66.8%, ~81%, and ~89%. The 341
crystallinity of CNF is higher than previously reported cellulose nanocrystals from wastepaper 342
(~75.9%) (Daniel et al., 2015) and pineapple leaf fibers (~73.6%) (Cherian et al., 2010). 343
From Fig. 3, it can also be seen that the diffraction of HN0 film produced a low-intensity 344
peak at 19.86° which corresponds to the crystal plane (002) of pure HPMC. This low-intensity peak 345
at 19.86° may be due to the amorphous nature of the matrix. Hino et al. (2001) reported a similar 346
diffraction peak of HPMC, although the authors gave no reasons for the said peak. It is also 347
observed that the diffraction of the nanocomposites produced peaks at 10.12° and 19.86° 348
corresponds to the crystal plane (101) and (002), respectively. No peaks of CNF are observed in 349
case of nanocomposites, which may be due to the near perfect interactions of CNF and the matrix 350

17
(HPMC) and also may be due to the presence of a very low wt% of CNF which phenomena is 351
further supported by FESEM results. The isolated CNF from 48% H2SO4 has shown a better CI 352
value than earlier reports. 353
354
3.3. Field emission scanning electron microscopy (FESEM) of CNF 355
Fig. 2c depicts the FESEM images of CNF at low c (i) and high magnification c (ii), 356
respectively. The FESEM results showed that JF was successfully defibrillated via chemical 357
process from dimensions of 2-4 mm in length to 153-160 nm. The morphology of the CNF is a 358
network of needle-shaped fibres crossing each other in nano-dimensions. This kind of fibre like 359
morphology was also observed by other scientists (Abraham et al., 2011; Juntaro et al., 2012). The 360
fibres are almost uniform in dimension (diameter ~11.88–25 nm and length ~153–160 nm). The 361
crystal length and diameter was determined directly from the FESEM instrument by digital image 362
analysis considering about 40 crystals. The aspect ratio of CNF was found to be ~13 ± 6.40. 363
364
3.4. Dynamic light scattering (DLS) 365
The DLS result of extracted CNF is shown in Fig. 4. From the result, it is very clear that the 366
average hydrodynamic size (d. nm) of CNF is ~340 nm, while the length and diameter of CNF 367
measured using FESEM is 153-160 nm and 11.88-25 nm. The difference in size between the 368
FESEM and the DLS results is due to the fact that, DLS measures the hydrodynamic size/diameter 369
(hydrated state) of the nanomaterial (Mollick et al., 2014), which means the size of CNF, along with 370
the surrounding water/solvent used, leads to a larger hydrodynamic volume.In contrast, the FESEM 371
measures the actual dry state size of the CNF. Frone et al., (2011), synthesized cellulose nanofibres 372

18
from microcrystalline cellulose and reported that the diameter is less than 20 nm while the average 373
hydrodynamic size for the same is 989.20 nm and stated that, the larger hydrodynamic size is due to 374
quick aggregation of cellulose nanofibres in water. The size of CNC having a length of 100–400 nm 375
and a width of 15–80 nm from TEM measurement with an average particle size of 1752 nm as 376
measured by DLS has been also reported (Tang et al., 2015), and these researchers stated that the 377
higher value for the size of CNC is as a result of aggregation of CNC in water. 378
In this case, the DLS result is seen to be different from the FESEM results due to the ability 379
of CNFs to link one another through H-bonding in water, resulting to increase in the size of the 380
nanofibres. 381
382
3.5. Field emission scanning electron microscopy (FESEM) of nanocomposites 383
Fig 5 (a, b, c, d, and e), shows the cross-sectional morphology of HN0, HN0.5, HN0.75, 384
HN1, and HN3 respectively. From the results, it is apparent that uniform/isotropic distribution of 385
CNFs in the HPMC matrix occurs in HN1. CNFs are agglomerated beyond the 1 wt% concentration 386
which is very clear from Fig. 5e. Therefore, it can be concluded that HN1 is the best composition in 387
terms of dispersion morphology which may also have a positive effect on the mechanical, moisture 388
absorption (MA) and water vapour transmission rate (WVTR). 389
390
3.6. Mechanical properties 391
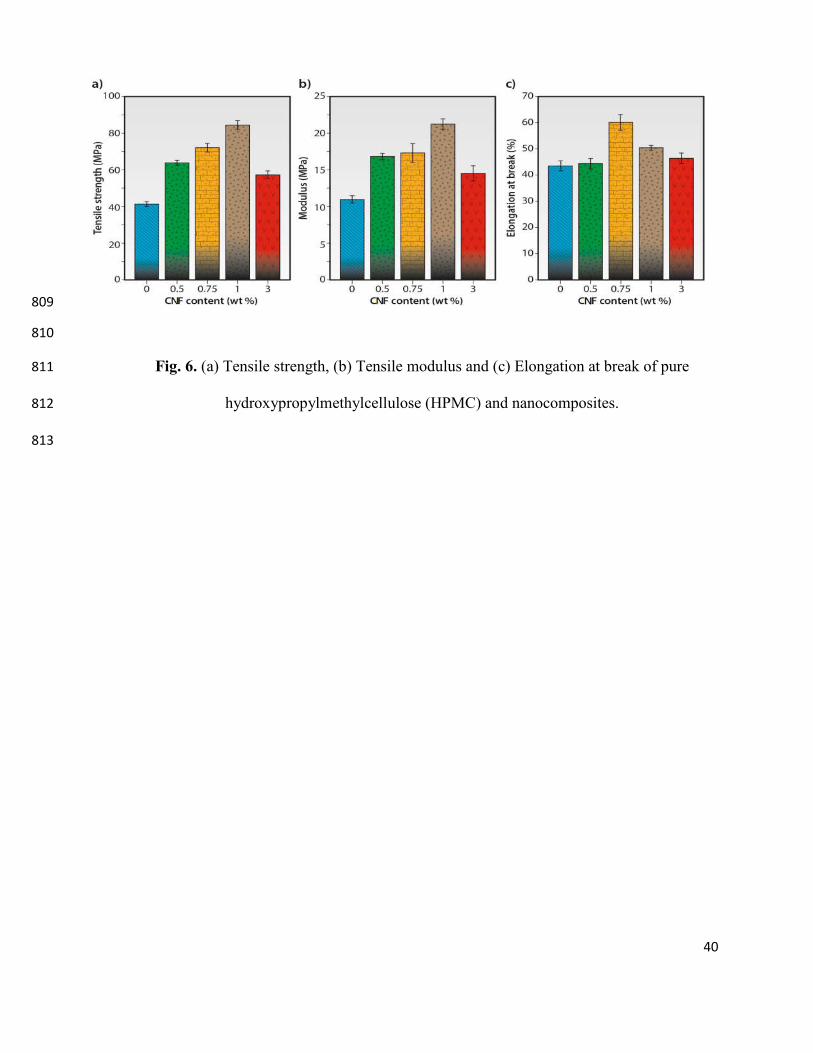
Fig. 6 shows the mechanical properties of HN0, HN0.5, HN0.75, HN1, and HN3. From Fig. 392
6a, it is clear that the tensile strength of HN0 increased from 41.56 MPa to 64.22 MPa, 72.45 MPa, 393

19
84.16 MPa, and 57.87 MPa with the loading of 0.50, 0.75, 1.00, and 3.00 wt% CNF, respectively. 394
Again from Fig. 6b, it is clear that the modulus of HN0 is enhanced from 10.98 MPa to 16.80 MPa, 395
17.27 MPa, 21.20 MPa, and 14.47 MPa with the addition of 0.50, 0.75, 1.00, and 3.00 wt% CNF, 396
respectively. The increase in tensile strength and modulus up to a 1.00 wt% loading of CNF into the 397
HPMC/CNF nanocomposite is attributed to the reinforcing property of CNF into the polymer 398
matrix and the rigidity increases due to intermolecular hydrogen bonding that may have taken place 399
within the CNF and HPMC matrix. It has been reported (Bilbao-Sáinz et al., 2011) that 400
enhancement in mechanical strength of the nanocomposite was due to the high contact surface area 401
of the smaller whiskers, with the HPMC promoting the formation of hydrogen bonds between the 402
HPMC and cellulose whiskers, which might have led to a higher efficiency of the stress transfer 403
from the matrix to the fibers. Another report (Youssef et al., 2015) showed that the addition of 3, 5, 404
and 10 wt% nanocellulose (NC) of length 246 ± 64 nm and diameter of 8 ± 2 nm improved the 405
young modulus and tensile strength of carboxymethyl cellulose (CMC) films by 60%. That report 406
also stated that the improvement in mechanical properties could be attributed to the network 407
formation between the matrix and NC or the formation of hydrogen bonds between the free 408
hydroxyl groups of NC and CMC. But in the case of HN3, both tensile strength and modulus 409
decreased compared with HN1. This is due to the occurrence of an agglomerate of CNF in the 410
polymer matrix after 1.00 wt% reinforcement which is evident from the Fig. 5a-e. The percentage 411
elongation at the break of HN0, HN0.5, HN0.75, HN1, and HN3 is shown in Fig. 6c. The % 412
elongation at the break of HN0 increases with the incorporation of CNF up to 0.75 wt% and then 413
begins to decrease. The percentage elongation at break of HN0 is 43.61% which increased to 414
59.71% with loading 0.75 wt% of CNF. So, from the tensile strength, modulus and elongation break 415

20
results, it is clear that the addition of CNF is responsible for both the strengthening and toughening 416
of the HPMC matrix up to 0.75 wt% of CNF. 417
418
3.7. Dynamic mechanical analysis (DMA) 419
Dynamic mechanical analysis is used to determine the mechanical properties of polymers in 420
dynamic condition as a function of temperature. The DMA analysis results of HN0, HN0.5, 421
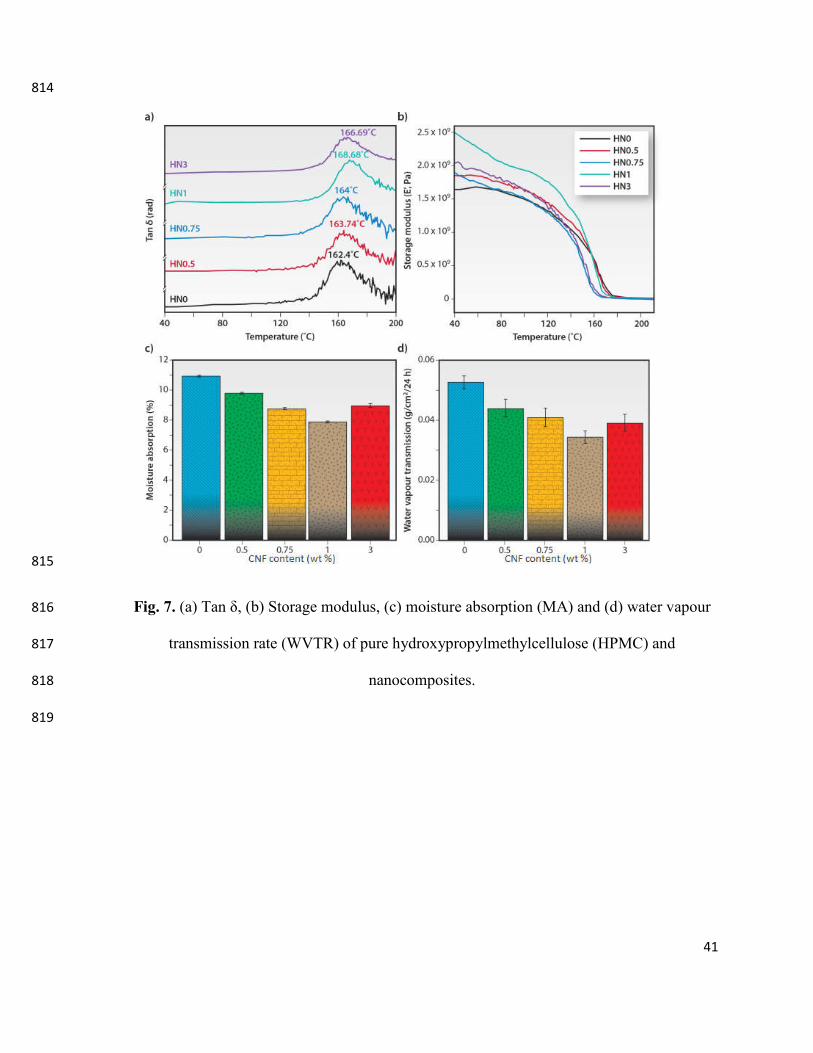
HN0.75, HN1, and HN3 are shown in Fig. 7a and Fig. 7b. Fig. 7a show the tan δ plots of 422
HN0, HN0.5, HN0.75, HN1, and HN3 respectively as a function of temperature. The tan δ peak of 423
HN0 is obtained at 162.4°C which is attributed to the glass transition temperature (Tg) of HPMC. 424
From the result, it is also seen that with an increase in loading wt% of CNF into the HPMC matrix, 425
the tan δ shifted to the higher temperatures. The tan δ peak value of HN0.5, HN0.75, HN1, and 426
HN3 is obtained at 163.70, 164.00, 168.58, and 166.69°C with the addition of 0.50, 0.75, 1.00, and 427
3.00 wt% CNF to the HN0 matrix. Therefore, the Tg of HN0 increased by 1.30, 1.60, 6.18, and 428
4.29°C with the loading of only 0.50, 0.75, 1.00, and 3.00 wt% CNF. This shift of glass transition 429
temperature of HN0, HN0.5, HN0.75, HN1, and HN3 is due to the reinforcing effects of CNF into 430
the polymer matrix and also strong hydrogen bonding interactions with the polymer matrix 431
(Siqueira et al., 2009). Again, from the result, it is apparent that with an increase in the wt% of the 432
CNF, the peak intensity decreases, which indicates that the HPMC/CNF composites become more 433
elastic, and also that less energy is dissipated during mechanical vibrations (Xu et al., 2013). 434
Fig. 7b shows the storage modulus (E') of HN0, HN0.5, HN0.75, HN1, and HN3. From the 435
results, it is observed that E' decreases with increasing temperature representing a reduction of the 436
material stiffness up to a characteristic temperature value (glass transition temperature) where there 437

21
is a large drop of the modulus, indicating the transition from a glassy to a rubbery state. From Fig. 438
7b, it is also clear that the storage modulus of HPMC film (HN0) increased with the addition of 439
CNF. The storage modulus was observed to have increased by 9.30, 6.20, 29.50, and 15.5% with 440
the loading of 0.50, 0.75, 1.00, and 3.00 wt% CNF at 60°C. This phenomenon indicates good 441
interfacial adhesion in the composites (Zaini et al., 2015) and here, CNF acts as a reinforcing 442
material into the nanocomposite films or as a result of efficient interactions between the filler and 443
the matrix through hydrogen bonding (Nasseri and Moohammadi, 2014). 444
445
3.8. Moisture absorption (MA) 446
The effect of nanocellulose on the moisture absorption of the HPMC matrix is shown in Fig. 447
7c. When hydrophilic polymers like HPMC are exposed in the humidity chamber, it absorbs 448
moisture through the interaction of the free –OH groups of polymer molecules with water 449
molecules. Moisture absorption value of HN0 is approximately 11.31% at constant 75% humidity. 450
A very close value of 11.33% for MA of pure HPMC (HNO) has been reported earlier (Mondal et 451
al., 2013b). Mondal et al., 2013b, also reported that the addition of 3.00% MMT to HPMC reduced 452
the MA to 8.75% which is very close to the result obtained in this work for HN3, although the 453
result for HN1 in this work has proven to be better. The addition of CNF reduced the moisture 454
absorption of HN0 from 11.31% to 9.41%, 8.75%, 7.80%, and 8.90% with the loading of 0.50, 455
0.75, 1.00 and 3.00 wt% CNF, respectively. This may be due to the interactions between CNF and 456
the hydrophilic/hydroxyl sites of the HPMC chains, which replace the HPMC–water interactions 457
that predominate in the films without inclusions (Bilbao-Sáinz et al., 2011). Therefore, the 458
interaction between the free hydroxyl groups of HPMC and the water molecules is reduced. From 459
22
the result, it is also observed that after the addition of 1.00 wt% CNF, the moisture absorption 460
began to increase because of agglomeration as well as the increase in the number of free hydroxyl 461
groups of CNF in the nanocomposite (HN3). The reduction in moisture absorption of the 462
nanocomposite is very important in the preparation of edible packaging as also suggested in 463
previously published paper (Bilbao-Sáinz et al., 2010). 464
465
3.9. Water vapour transmission rate (WVTR) 466
The vapour transmission rate of HN0, HN0.5, HN0.75, HN1, and HN3 is shown in Fig. 7d. 467
The average film thicknesses of HN0, HN0.5, HN0.75, HN1, and HN3 were measured and found to 468
be 0.13, 0.09, 0.08, 0.09 and 0.10 mm respectively. The WVTR for HN0, HN0.5, HN0.75, HN1, 469
and HN3 was found to be 0.053, 0.044, 0.041, 0.034, and 0.039 (g/cm/24 h) respectively. From the 470
results, it is apparent that there is a reduction in WVTR of pure HPMC matrix in the 471
nanocomposites by 19.80, 28.75, 53.41, and 34.44% with CNF loading of 0.50, 0.75, 1.00, and 3.00 472
wt% respectively. This may also be due to the presence of impermeable CNF and the interactions 473
between CNF and the hydrophilic sites of the HPMC chains. This replaces the HPMC–water 474
interactions in the nanocomposites (Bilbao-Sáinzet al., 2011) and the increase in tortuosity of the 475
nanocomposite as a result of the hydrogen bridges formed between the matrix and the CNF which 476
slows the diffusion process and lowers the permeability of the composite (Youssef et al., 2015). The 477
% reduction in WVTR of HPMC with the addition of CNF has proven to be more effective than 478
that of MMT as reported in previous literature (Mondal et al., 2013b). It can be noted that the 479
reduction, as evident in Fig. 7d is progressive with the loading of CNF from 0.50% to 1.00% and 480
then an increase with 3.00 wt%. This increase in WVTR of the nanocomposite for 3.00 wt% 481

23
loading of CNF may be due to the presence of free hydroxyl groups from excess CNF and 482
agglomeration in the matrix after 1.00 wt% loading, as can be seen in Fig. 7d. This is evident in Fig. 483
5e and also supports the result from MA for HN3. WVTR of the synthesized nanocomposite does 484
not rely solely on the adsorption and desorption of water molecules but also on the diffusion of 485
water through (inside) the HPMC (Bilbao-Sáinz et al., 2011). 486
The addition of CNF to HPMC led to reduced WVTR as a result of the interaction between 487
the CNF and hydrophilic sites of HPMC and the formation of the tortuous path by the hydrogen 488
bridges formed between CNF and HPMC in the nanocomposite. The reduction in WVTR of the 489
nanocomposite is very important in the preparation of edible packaging as also suggested in 490
previous paper (Bilbao-Sáinz et al., 2010). 491
492
3.10. UV–vis spectroscopy 493
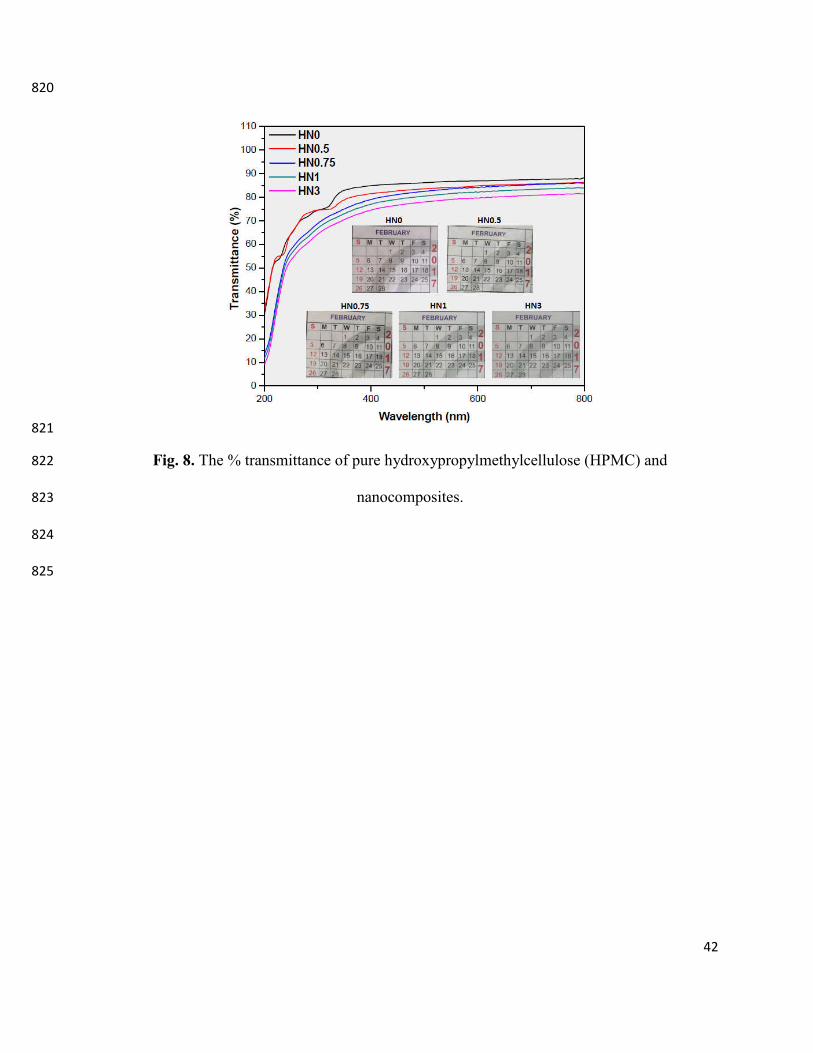
Optical transparency of the films is much important for packaging applications. The 494
comparison of the percentage light transmission against wavelengths of the nanocomposite samples 495
(Fig. 8) was studied in order to ascertain the differences in the optical transparency. The 496
transparency of HN0, HN0.5, HN0.75, HN1, and HN3 at 600 nm was found to be ~89%, ~85%, 497
~84%, ~82%, and ~78% respectively. From the result, it can be stated that the effect of CNF on the 498
percentage transmittance of HPMC within the visible range is very small. This also shows that CNF 499
is very much compatible with HPMC matrix. The percentage transmittance of the polymer matrix 500
(HPMC) and its nanocomposites is lower in the UV region 200-300 nm) which may be due to the 501
good UV resistance property of the prepared nanocomposites (Bilbao-Sáinz et. al., 2011). 502
503

24
3.11. Flatness and folding endurance of the transdermal patches 504
The flatness and folding endurance of the prepared transdermal patches are shown in Fig. 505
9a. The flatness of HN0K, HN0.5K, HN0.75K, HN1K, and HN3K is 490 ± 14.70, 482 ± 14.46, 478 506
± 14.34, 477 ± 14.31, and 449 ± 13.47 while the folding endurance for the same is 98.00 ± 2.94, 507
97.80 ± 2.93, 98.00 ± 2.94, 96.40 ± 2.89, and 96.01 ± 2.88. The folding endurance of the 508
nanocomposite is less than that of the pure HPMC due to increase in stiffness of the 509
nanocomposites with the addition of rigid CNF. 510
511
3.12. In vitro drug release 512
The release of KT from pure HPMC and HPMC/CNF nanocomposites in physiological 513
conditions (PBS pH = 7.4) is recorded so as to understand the release profile of hydrophobic 514
entities in conditions simulating the human body. The in vitro drug release results exhibited 515
prolonged release of nanocomposite films over a period of 8 hrs. From Fig. 9b, it is clear that the 516
release of KT is considerably slower and hence controlled with the addition of different 517
concentrations of CNF in HPMC based nanocomposite formulations. The trace amount of drug 518
release from these nanocomposite films at the initial stage of the in vitro drug release study could 519
probably be due to the surface adhered drug particles. The cumulative percentage of drug release 520
from prepared nanocomposites films after 8 h is 95.12, 62.31, 55.97, 36.97, and 37.15% for HN0K, 521
HN0.5K, HN0.75K, HN1K, and HN3K, respectively. The nanocomposites showed controlled and 522
sustained drug release with HN1 proving to give the best result, though very close to that of HN3K. 523
When n is <0.5, the data indicated that the drug release process of the transdermal patch 524
follows the Fickian diffusion mechanism. When n is >0.5, this also indicated that the drug release 525
25
process of the transdermal patch follows the drug diffusion mechanism based on the anomalous 526
process. The values of n calculated as per the above method are found to be 0.52, 0.59, 0.57, 0.58, 527
and 0.61 for HN0K, HN0.5K, HN0.75K, HN1K, and HN3K, respectively. It is expected that the 528
exponent n of the power law, when applied to the drug release mechanism from slab geometry thin 529
films (polymeric based) controlled delivery systems should fall within the range of 0.5 n 1.0 530
(Siepmann and Peppas, 2012). Therefore, it can be said that the controlled release mechanism of the 531
nanocomposites transport/diffusion could be an anomalous process. 532
The controlled drug release may be as a result of the trapping of the drug particles within 533
the 3D oriented structure of CNF in the composite and the blocking of the drug pathway as the drug 534
tries to leave the composite which can be seen to correlate the FESEM result for Fig. 5. This may 535
also be due to the lesser swelling property of CNF compared with HPMC (Saha et al., 2016). 536
HPMC is reported to have high swellability which makes it release drugs at a faster rate when it 537
comes in contact with water or biological fluid, resulting in the lattice and consequently, relaxation 538
of polymer chains, and then release the incorporated drug into the system (Siepmann and Peppas, 539
2012). It is reported that the best cumulative percentage of controlled drug release from 540
methylcellulose/pectin/montmorillonite nanocomposite films after 4 h was 51.92% (Saha et al., 541
2016), but with the addition of CNF to HPMC, the best cumulative percentage of controlled 542
(reduced) drug release was ~30 ± 2%. This showed that CNF has a fantastic control of drug release 543
rate in CNF based nanocomposite. 544
545
4. Conclusion 546
CNF having a crystallinity index of ~89.50% and a fibrillar network of nanofibres with a 547
diameter of 11-25 nm and length of 153-160 nm has been successfully isolated. The FTIR result of 548

26
CNF confirmed the removal of lignin and hemicellulose. The prepared CNF-polymer 549
nanocomposites have shown improved mechanical properties and reduced MA and WVTR which 550
correlates the FESEM results of the nanocomposites. The in vitro drug release data revealed that the 551
cumulative drug release percentage is decreased with the increase of CNF concentration in the 552
nanocomposites with HN1K as the best formulation. The prepared HPMC/CNF nanocomposites 553
can be used for food packaging and transdermal drug delivery applications. 554
555
Acknowledgements 556
Jonathan Tersur Orasugh appreciates the Centre for Research in Nanoscience and 557
Nanotechnology (CRNN), Department of Polymer Science and Technology, and Department of 558
Jute and Fibre Technology, Institute of Jute Technology, University of Calcutta for giving him the 559
chance to continue his research work. Nayan Ranjan Saha likes to thank the University Grant 560
Commission (UGC), Govt. of India, for his fellowship. Gunjan Sarkar likes to thank the University 561
Grant Commission, Govt. of India, for his fellowship under Rajiv Gandhi National Fellowship 562
(RGNF) scheme. 563
564
27
References 565
Abraham, E, Deepa, B., Pothan, L.A., Jacob, M., Thomas, S., Cvelbard, U., Anandjiwala, R., 2011. 566 Extraction of nanocellulose fibrils from lignocellulosic fibres: A novel approach. 567 Carbohydr. Polym. 86, 1468-1475. 568
Asper, M., Hanrieder, T., Quellmalz, A., Mihranyan, A. 2015. Removal of xenotropic murine 569 leukemia virus by nanocellulose based filter paper. Biologicals 43, 452-456. 570
Azizi Samir, M.A.S., Alloin, F., Sanchez, J.Y, Dufresne, A., 2004. Cross-linkedn nanocomposite 571 polymer electrolytes reinforced with cellulose whiskers. Macromolecules, 37, 4839–4844. 572
Bhatnagar, A., Sain, M., 2005. Processing of cellulose nanofiber-reinforced composites. J. Reinf. 573 Plast. Compos. 24, 1259–1268. 574
Bilbao-Sáinz, C., Avena-Bustillos, R.J., Wood, D.F., Williams, T.G., Mchugh, T.H., 2010. 575 Composite edible films based on hydroxypropyl methylcellulose reinforced with 576 microcrystalline cellulose nanoparticles. J. Agric. Food Chem. 58, 3753–3760. 577
Bilbao-Sáinz, C., Bras, J., Williams, T., Sénechal, T., Orts, W. 2011. HPMC reinforced with 578 different cellulose nano-particles. Carbohydr. Polym. 86, 1549–1557. 579
Brinchi. L., Cotana, F., Fortunati, E., Kenny, J.M., 2013. Production of nanocrystalline cellulose 580 from lignocellulosic biomass: Technology and applications. Carbohydr. Polym. 94, 154-581 169. 582
Cespi, M., Bonacucina, G., Mencarelli, G., Casettari, L., Palmieri, G.F., 2011. Dynamic mechanical 583 thermal analysis of hypromellose 2910 free films. European J Pharm Biopharm 79, 458-584 463. 585
Cherian, B.M., Leão, A.L., Ferreira, de Souza S., Thomas, S., Pothan, L.A., Kottaisamy, M., 2010. 586 Isolation of nanocellulose from pineapple leaf fibres by steam explosion. Carbohydr. Polym. 587 81, 720–725. 588
Chirayil, C.J., Joy, J., Mathew, L., Mozetic, M., Koetz, J., Thomas, S., 2014. Isolation and 589 characterization of cellulose nanofibrils from Helicteresisora plant. Ind. Crops Prod. 59, 27–590
34. 591
Chen, W., Yu, H., Liu, Y., Hai, Y., Zhang, M., Chen, P., 2011. Isolation and characterization of 592 cellulose nanofibers from four plant cellulose fibers using a chemical-ultrasonic process. 593 Cellulose 18:433–442. 594
Daniel, W.H., Majid, Z.A., Mohd Muhid, M.N., Triwahyono, S., Bakar, M.B., Ramli, Z., 2015. The 595 reuse of wastepaper for the extraction of cellulose nanocrystals. Carbohydr. Polym. 118, 596 165–169. 597
De Moura, M.R., Avena-Bustillos, R.J., Mchugh, T.H, Wood, D.F, Otoni, C.G, Mattoso, L.H.C., 598 2011. Miniaturization of cellulose fibers and effect of addition on the mechanical and barrier 599 properties of hydroxypropyl methylcellulose films. J. Food Eng. 104, 154–166. 600
Dong, S., Roman, M., 2007. Fluorescently Labeled Cellulose Nanocrystals for Bioimaging 601
Applications. Am. Chem. Soc. 129 (45), 13810-1. 602
Estapé, J., Viñolas, N., González, B., Inglés, F., Botill, T., Guzmán, M.C., Tarragó, E., 1990. 603 Ketorolac, a new non-opioid analgesic: A double-blind trial versus pentazocine in cancer 604 pain. The J. Int. Med. Res. 18, 298–304. 605
Favier, V., Chanzy, H., Cavaille, J. Y., 1995. Polymer Nanocomposites Reinforced by Cellulose 606 Whiskers. Macromolecules, 28 (18), 6365-6367. 607

28
French, D.F., 2014. Idealized powder diffraction patterns for cellulose polymorphs. Cellulose, 21, 608 885-896. 609
Frone, N.A., Panaitescu, M.D., Donescu, D., 2011. Some aspects concerning the isolation of 610 cellulose micro- and nano-fibers. UPB Scientific Bulletin, Series B: Chem. Mat. Sci. 73, 611 133–152. 612
George, J., Kumar, R., Sanjeev Kumar, V.A., Raman, K.V., Rajamanickam, R., Abhishek, V., 613 Nadanasabapathy, S., Siddaramaiah., 2014. Hybrid HPMC nanocomposites containing 614 bacterial cellulose nanocrystals and silver nanoparticles. Carbohydr. Polym. 105, 285–292. 615
Haafiz, M.M.K., Hassan, A., Zakaria, Z., Inuwa, I.M., 2014. Isolation and characterization of 616 cellulose nanowhiskers from oil palm biomass microcrystalline cellulose. Carbohydr. 617 Polym. 103, 119–125. 618
He, W., Jiang, S., Zhang, Q., Pan, M., 2013. Isolation and characterization of cellulose nanofibres 619 from Bambusa rigida. Bioresources, 8, 5678–5689. 620
Hino, T., Ford, L.J., 2001. Characterization of the hydroxypropylmethylcellulose–nicotinamide 621 binary system. Int. J Pharm. 219:39-49. 622
Huang, L., Chen, X., Nguyen, X.T., Tang, H., Zhang, L., Yang, G., 2013. Nano-cellulose D-623 networks as controlled-release drug carriers. J Mat Chem. B 1, 2976–2984. 624
Huang, W., Wang, Y., Chen, C., Law, M.L.J., Houghton, M., Chen, L., 2016. Fabrication of 625 flexible self-standing all-cellulose nanofibrous composite membranes for virus 626
removal.Carbohydr. Polym. 143, 9-17. 627
Iwamoto, S., Nakagaito, A.N., Yano, H., 2007. Nano-fibrillation of pulp fibers for the processing of 628
transparent nano-composites. App. Phys. A: Mat. Sci. Pro. 89, 461–466. 629
Jin, H., Kettunen, M., Laiho, A., Pynnonen, H., Paltakari, J., Marmur, A., Ikkala, O., Ras, A.H.R., 630 2011. Superhydrophobic and Superoleophobic Nanocellulose Aerogel Membranes as 631
Bioinspired Cargo Carriers on Water and Oil. Langmuir, 27(5), 1930-1934. 632
Juntaro, J., Ummartyotin, S., Sain, M., Manuspiya, H. 2012. Bacterial cellulose reinforced 633
polyurethane-based resin nanocomposite: A study of how ethanol and processing pressure 634
affect physical, mechanical and dielectric properties. Carbohydr. Polym. 87, 2464–2469. 635
Kalita, E., Nath, B.K., Deb, P., Agan, F., Islam, Md R, Saiki, K., 2015. High quality fluorescent 636
cellulose nanofibers from endemic rice husk: Isolation and characterization. Carbohydr. 637
Polym. 122, 308–313. 638
Kaushik, A., Singh, M. 2011. Isolation and characterization of cellulose nanofibrils from wheat 639
straw using steam explosion coupled with high shear homogenization. Carbohydr. Res. 346, 640
76–85. 641
Koga, H., Saito, T., Kitaoka, T., Nogi, M., Suganuma, K., Isogai, A., 2013. Transparent conductive 642
and printable composites consisting of TEMPO-oxidized nanocellulose and carbon 643
nanotube. Biomacromolecules, 14, 1160 1165. 644
Kolakovic, R., Peltonen, L., Laaksonen, T., Putkisto, K., Laukkanen, A., Hirvonen, J., 2011. Spray-645
dried cellulose nanofibers as novel tablet excipient. AAPS Pharm. Sci. Tech. 12, 1366–646
1673. 647

29
Kumar, A., Negi, Y.S., Choudhary, V., Bhardwaj, N.K., 2014. Characterization of cellulose 648 nanocrystals produced by acid-hydrolysis from sugarcane bagasse as agro-waste. J. Mat. 649 Phys. Chem. 2.1, 1–8. 650
Lin, N., Bruzzese, C., Dufresne, A., 2012. TEMPO-oxidized nanocellulose participating as 651 crosslinking aid for alginate-based sponges. ACS App. Mat. Interf. 4, 4948–4959. 652
Lin, N., Dufresne, A., 2014. Nanocellulose in biomedicine: Current status and future prospect. 653 Europ. Polym. J. 59:302-325. 654
Michell, A.J., 1989. Wood cellulose-organic polymer composites. Composite Asia Pacific, 655 Adelaide, Australia, 89, 19–21. 656
Mollick, Md M.R, Bhowmick, B., Mondal, D., Maity, D., Rana, D., Dash, K.S., Chattopadhyay, S., 657 Roy, S., Sarkar, J., Acharya, K., Chakraborty, M., Chattopadhyay, D., 2014. Anticancer (in 658 vitro) and antimicrobial effect of gold nanoparticles synthesized using Abelmoschus 659 esculentus (L.) pulp extract via a green route. RSC Adv. 4, 37838-37848. 660
Mondal, D., Bhowmick, B., Mollick, Md M.R, Bain, M.K., Rana, D., Mukhopadhyay, A., Dana, K., 661 Chattopadhyay, D., 2013a. Effect of poly(vinyl pyrrolidone) on the morphology and 662 physical properties of poly(vinyl alcohol)/sodium montmorillonite nanocomposite films. 663 Progress in Natural Science: Mat. Int. 23, 579–587. 664
Mondal, D, Bhowmick, B, Mollick, Md M.R., Maity, D., Mukhopadhyay, A., Rana, D., 665 Chattopadhyay, D., 2013b. Effect of clay concentration on morphology and properties of 666 hydroxypropylmethylcellulose films. Carbohydr. Polym. 96, 57–63. 667
Mroszczak, E.J., Lee, F.W., Combs, D., Sarnquist, F.H., Huang, B.L., Wu, A.T., Tokes, L.G., 668 Maddox, M.L., Cho, D.K., 1987. Ketorolac tromethamine absorption, distribution, 669 metabolism, excretion, and pharmacokinetics in animals and humans. Drug Met. Dispos. 5, 670 618–626. 671
Müller, A., Ni, Z., Hessler, N., Wesarg, F., Muller, AF., Kralisch, D., Fischer, D., 2013. The 672 biopolymer bacterial nanocellulose as drug delivery system: Investigation of drug loading 673 and release using the model protein albumin. J. Pharm. Sci. 102, 579–592. 674
Nagashima, K., Koga, H., Celano, U., Zhuge, F., Kanai, M., Rahong, S., Meng, G., He, Y., De 675 Boeck, J., Jurczak, M., Vandervorst, W., Kitaoka, T., Nogi, M., Yanagida, T., 2014. 676 Cellulose nanofiber paper as an ultra-flexible nonvolatile memory. Scient. Rep. 4:5532 (7 677 pp). 678
Nakagaito, A.N., Yano, H., 2004. The effect of morphological changes from pulp fiber towards 679 nano-scale fibrillated cellulose on the mechanical properties of high-strength plant fiber 680 based composites. App. Phys. A-Mat. Sci. Pro. 78, 547–552. 681
Nair, S.S., Zhu., Y.J, Deng, Y., Ragauskas, J.A., 2014. High performance green barriers based on 682
nanocellulose. Sust. Chem. Pro 2, 23. 683
Nasseri, R., Mohammadi, N., 2014. Starch-based nanocomposites: A comparative performance 684 study of cellulose whiskers and starch nanoparticles. Carbohydr. Polym. 106, 432–439. 685
Nelson, M.L., O’Connor, R.T., 1964. Relation of certain infrared bands to cellulose crystallinity 686 and crystal lattice type. Part II. A new infrared ratio for estimation of crystallinity in 687 celluloses I and II. J. App. Polym. Sci. 8, 1325–1341. 688
Nogi, M., Iwamoto, S., Nakgaito, A.N., Yano. H., 2009. Optically transparent nanofiber paper. 689 Adv. Mat. 21. 1595–1598. 690
Nogi, M., Kim, C., Sugahara, T., Inui, T., Takahashi, T., Suganuma, K., 2013. High thermal 691 stability of optical transparency in cellulose nanofiber paper. App. Phys. Lett. 102, 181911 692 (4 pp). 693

30
Oudiani, A.E., Chaabouni, Y., Msahli, S., Sakli, F., 2011. Crystal transition from cellulose I to 694 cellulose II in NaOH treated Agave americana L. fibre. Carbohydr. Polym. 86, 1221 1229. 695
Pääkkö, M., Ankerfors, M., Kosonen, H., Nykänen, A., Ahola, S., Osterberg, M., Ruokolainen, J., 696 Laine, J., Larsson, P.T., Ikkala, O., Lindström, T., 2007. Enzymatic hydrolysis combined 697 with mechanical shearing and high-pressure homogenization for nanoscale cellulose fibrils 698 and strong gels. Biomacromolecules, 8, 1934–1941. 699
Park, S., Baker, O.J., Himmel, M.E., Parilla, A.P., Johnson, K.D., 2010. Crystallinity index: 700 measurement techniques and their impact on interpreting cellulase performance. Biotech. 701 Biof. 3, 10. 702
Qua, E.H., Hornsby, P.R., Sharma, H.S.S., Lyons, G., 2011. Preparation and characterization of 703 cellulose nanofibres. J. Mat. Sci. 46, 6029–6045. 704
Rahman, M.M., Afrin, S., Haque, P., Islam, Md M., Islam, Md S., Gafur, Md A., 2014. Preparation 705 and characterization of jute cellulose crystals-reinforced poly(L-lactic acid) biocomposite 706 for biomedical applications. Int. J. Chem. Eng. 2014, 842147. 707
Rokhade, A.P., Agnihotri, S.A., Patila., S.A., Mallikarjuna, N.N., Kulkarni, P.V., Aminabhavi, 708 T.M., 2006. Semi-interpenetrating polymer network microspheres of gelatin and sodium 709 carboxymethylcellulose for controlled release of ketorolac tromethamine. Carbohydr. 710 Polym. 65, 243–252. 711
Saha, N.R., Sarkar, G., Roy, I., Rana, D., Bhattacharyya, A., Adhikari, A., Mukhopadhyay, A., 712 Chattopadhyay, D., 2016. Studies on methylcellulose/pectin/montmorillonite nanocomposite 713 films and their application possibilities. Carbohydr. Polym. 136, 1218–1227. 714
Sarkar, G., Saha, N.R., Roy, I., Bhattacharyya, A., Bose, M., Mishra, R., Rana, D., Bhattacharjee, 715 D., Chattopadhyay, D., 2014. Taro corms mucilage/HPMC based transdermal patch: An 716 efficient device for delivery of diltiazem hydrochloride. Int. J. Bio. Macromol. 66, 158–165. 717
Segal, L., Creely, J.J., Martin, A.E., Conrad, C.M., 1959. An empirical method for estimating the 718 degree of crystallinity of native cellulose using the X-ray diffractometer. Text. Res. J. 719 29(10), 786–794. 720
Silvério, H.A., Neto, W.P.F., Vieira da Silva, I.S., Rosa, J.R., Pasquini, D., Nascimento de 721 Assunção, R.M., da Silva Barud, H., Ribeiro, S.J.L., 2014. Mechanical, thermal, and barrier 722 properties of methylcellulose/cellulose nanocrystals nanocomposites. Polímeros, 24:683–723 688. 724
Siepmann, J., Peppas, A.N., 2012. Modeling of drug release from delivery systems based on 725 hydroxypropylmethylcellulose (HPMC). Adv. Drug. Del. Rev. 64, 163-174. 726
Siqueira, G., Julien, Bras, J., Dufresne, A., 2009. Cellulose whiskers versus microfibrils: Influence 727 of the nature of the nanoparticle and its surface functionalization on the thermal and 728 mechanical properties of nanocomposites. Biomacromolecules, 10, 425-432. 729
Sun, B., Hou, Q., He, Z., Liu, Z., Ni, Y., 2014. Cellulose nanocrystals (CNC) as carriers fora 730 spirooxazine dye and its effect on photochromic efficiency. Carbohydr. Polym. 111, 419–731 424. 732
Tang, Y., Shen, X., Zhang, J., Guo, D., Kong, F., Zhang, N. 2015. Extraction of cellulose nano-733 crystals from old corrugated container fiber using phosphoric acid and enzymatic hydrolysis 734 followed by sonication. Carbohydr. Polym. 125, 360-366. 735
Vijay, B., Miroslava, M., Jiri, M. 2011. Preparation of nanocellulose from jute fibres and its 736 applications as fillers in nanocomposite package films. “Textiles - A Decade Ahead” in 737 PHD House New Delhi. The North India Section of the Textile Institute and Department Of 738 Textile Technology, IIT Delhi jointly organized this conference. 739
31
Wang B, Sain, M., 2007. Dispersion of soybean stock-based nanofiber in a plastic matrix.Polym. 740 Int. 56, 538–546. 741
Wang, H., Li, D., Yano H, Abe, K., 2014. Preparation of tough cellulose II nanofibers with 742 stability from wood. Cellulose, 21, 1505–1515. 743 Xiao, S., Gao, R., Gao, L., Li, J., 2016. Poly(vinyl alcohol) films reinforced with nanofibrillated 744
cellulose (NFC) isolated from corn husk by high intensity ultrasonication. Carbohydr. 745 Polym. 136, 102-1034. 746
Xu, X., Liu, F., Jiang, L., Zhu, J.Y., Haagenson, D., Wiesenborn, D.P., 2013. Cellulose nanocrystals 747 vs. cellulose nanofibrils: A comparative study on their microstructures and effects as 748 polymer reinforcing agents. ACS App. Mat. Interf. 5, 2999-3009. 749
Youssef, B., Soumia, A., Mounir, E. A., Omar, C., Abdelaziz, L., Mehdi, E.B., Mohamed, Z., 2015. 750 Preparation and properties of bionanocomposite films reinforced with nanocellulose isolated 751 from Moroccan Alfa fibres. Autex. Res. J. 15, 164-172. 752
Zaini, L.H., Paridah, M.T., Jawaid, M, Othman, A.Y., Juliana, A.H., 2015. Effect of kenaf cellulose 753 whiskers on cellulose acetate butyrate nanocomposites properties. In book: Nanocellulose 754 Polymer Nanocomposites: Fundamental and Applications. 13, 341–354. 755 DOI: 10.1002/9781118872246.ch13. 756
757

32
Table caption 758
Table 1 Composition of nanocomposite samples 759
760

33
Figure captions 761
762
Fig. 1. Flowchart showing the extraction of cellulose nano-fibrils (CNFs) from jute fibres (JF). 763
Fig. 2. (a) Fourier transform infrared (FTIR) spectra, (b) X-ray diffraction patterns of jute fibres 764
(JF), pretreated jute fibres (PJF) & cellulose nano-fibrils (CNF) and (c) Field emission-scanning 765
electron microscopy (FE-SEM) micrographs of (i&ii) cellulose nano-fibrils (CNF) at low (X 50 766
000) and high magnification (X 77 000). 767
Fig. 3. X-ray diffraction patterns of HN0, HN0.5, HN0.75, HN1, and HN3 768
Fig. 4. Hydrodynamic size of cellulose nano-fibrils (CNF). 769
Fig. 5. The cross-sectional morphology (same magnification “X 70, 000”) of (a) HN0, (b) HN0.5, 770
(c) HN0.75, (d) HN1 and (e) HN3 films. 771
Fig. 6. (a) Tensile strength, (b) Tensile modulus and (c) Elongation at break of pure 772
hydroxypropylmethylcellulose (HPMC) and nanocomposites. 773
Fig. 7. (a) Tan δ, (b) Storage modulus, (c) moisture absorption (MA) and (d) water vapour 774
transmission rate (WVTR) of pure hydroxypropylmethylcellulose (HPMC) and nanocomposites. 775
Fig. 8. The % transmittance of pure hydroxypropylmethylcellulose (HPMC) and nanocomposites. 776
Fig. 9. (a) Folding endurance and flatness (b) In-vitro drug release study from pure 777
hydroxypropylmethylcellulose (HPMC) and its nanocomposites. 778
779

34
Table 1 Composition of nanocomposite samples 780
Sample HPMC*
(%)
CNF**
(wt%)
KT***
(%)
HN0 100 0.00 -
HN0.5 100 0.50 -
HN0.75 100 0.75 -
HN1 100 1.00 -
HN3 100 3.00 -
HN0K 100 0.00 5
HN0.5K 100 0.50 5
HN0.75K 100 0.75 5
HN1K 100 1.00 5
HN3K 100 3.00 5
781
*HPMC: Hydroxypropylmethylcellulose 782
**CNF: Cellulose nano-fibrils 783
***KT: Ketorolac tromethamine 784
35
785
Fig. 1. Flowchart showing the extraction of cellulose nano-fibrils (CNFs) from jute fibres (JF). 786
787
36
788
789
Fig. 2. (a) Fourier transform infrared (FTIR) spectra, (b) X-ray diffraction patterns of jute fibres 790
(JF), pretreated jute fibres (PJF) & cellulose nano-fibrils (CNF) and (c) Field emission-scanning 791
electron microscopy (FE-SEM) micrographs of (i&ii) cellulose nano-fibrils (CNF) at low (X 50 792
000) and high magnification (X 77 000). 793
794

37
795
796
Fig. 3. X-ray diffraction patterns of HN0, HN0.5, HN0.75, HN1, and HN3 797
798

38
799
800
801
Fig. 4. Hydrodynamic size of cellulose nano-fibrils (CNF). 802
803
804

39
805
806
Fig. 5. The cross-sectional morphology (same magnification “X 70, 000”) of (a) HN0, (b) 807
HN0.5, (c) HN0.75, (d) HN1 and (e) HN3 films. 808
40
809
810
Fig. 6. (a) Tensile strength, (b) Tensile modulus and (c) Elongation at break of pure 811
hydroxypropylmethylcellulose (HPMC) and nanocomposites. 812
813
41
814
815
Fig. 7. (a) Tan δ, (b) Storage modulus, (c) moisture absorption (MA) and (d) water vapour 816
transmission rate (WVTR) of pure hydroxypropylmethylcellulose (HPMC) and 817
nanocomposites. 818
819
42
820
821
Fig. 8. The % transmittance of pure hydroxypropylmethylcellulose (HPMC) and 822
nanocomposites. 823
824
825

43
826
827
Fig. 9. (a) Folding endurance and flatness (b) In-vitro drug release study from pure 828
hydroxypropylmethylcellulose (HPMC) and its nanocomposites. 829
830 831