Novel HDL Targeted Therapies: The Search Continues · 2008-07-04 · Novel HDL Targeted Therapies:...
35
Novel HDL Targeted Therapies: The Search Novel HDL Targeted Therapies: The Search Continues Continues Assoc. Prof. Assoc. Prof. K.Kostner K.Kostner , Univ. of Qld, Brisbane , Univ. of Qld, Brisbane Kostner, 2008
Transcript of Novel HDL Targeted Therapies: The Search Continues · 2008-07-04 · Novel HDL Targeted Therapies:...
Slide SourceLipidsOnline
www.lipidsonline.org
Novel HDL Targeted Therapies: The Search Novel HDL Targeted Therapies: The Search ContinuesContinuesAssoc. Prof. Assoc. Prof. K.KostnerK.Kostner, Univ. of Qld, Brisbane, Univ. of Qld, Brisbane
Kostner, 2007Kostner, 2008
Slide SourceLipidsOnline
www.lipidsonline.org
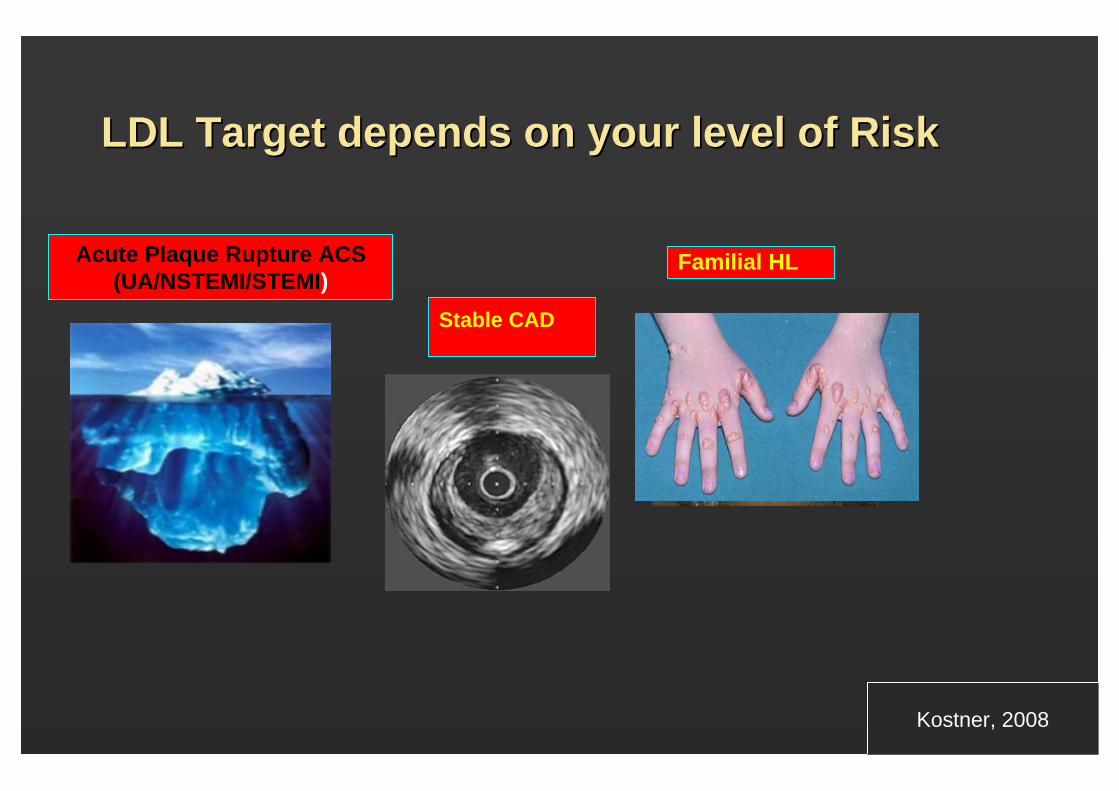
LDL Target depends on your level of RiskLDL Target depends on your level of Risk
Acute Plaque Rupture ACS (UA/NSTEMI/STEMI)
Stable CAD
Familial HL
Kostner, 2008
Slide SourceLipidsOnline
www.lipidsonline.org
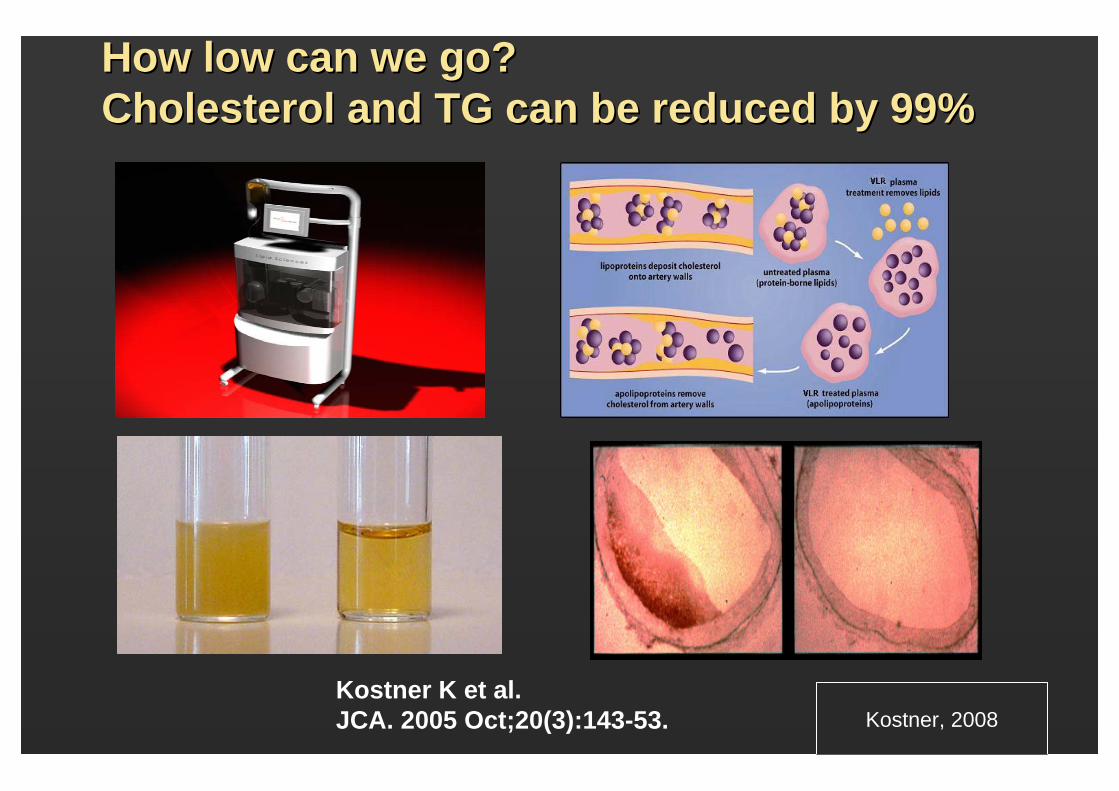
How low can we go? How low can we go? Cholesterol and TG can be reduced by 99%Cholesterol and TG can be reduced by 99%
Kostner K et al.JCA. 2005 Oct;20(3):143-53. Kostner, 2008
Slide SourceLipidsOnline
www.lipidsonline.org
Slide SourceLipidsOnline
www.lipidsonline.org
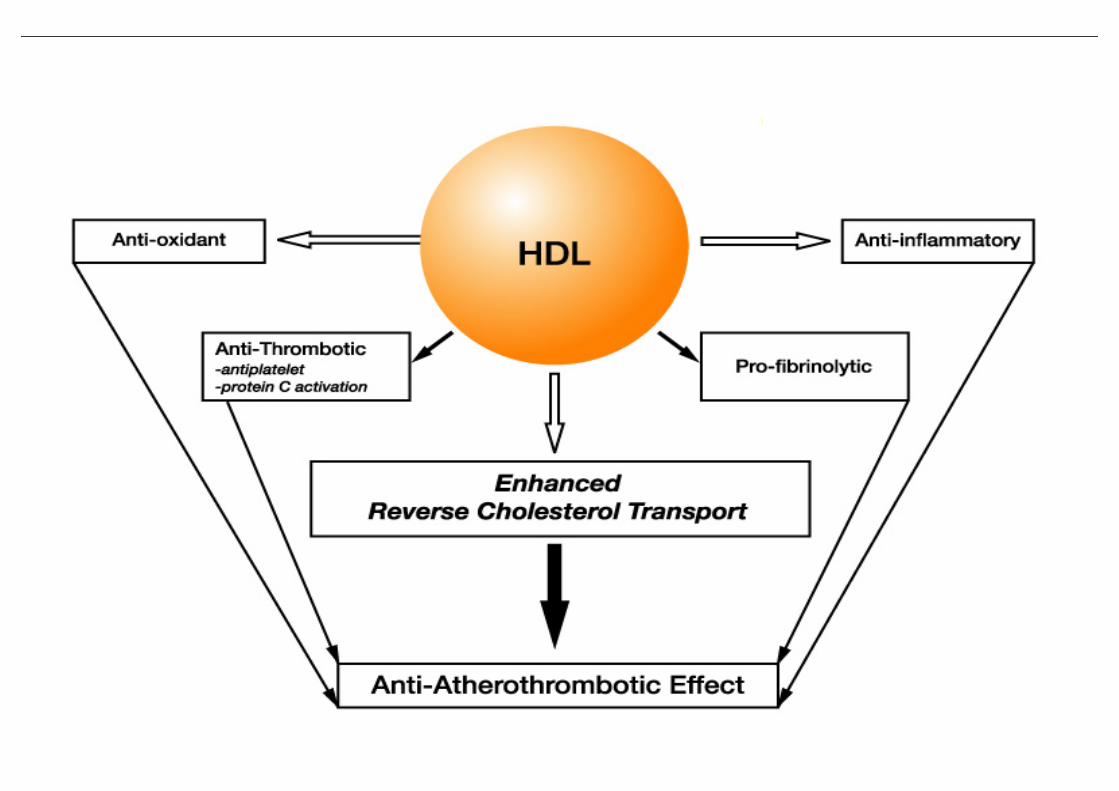
HDLHDL
Slide SourceLipidsOnline
www.lipidsonline.org
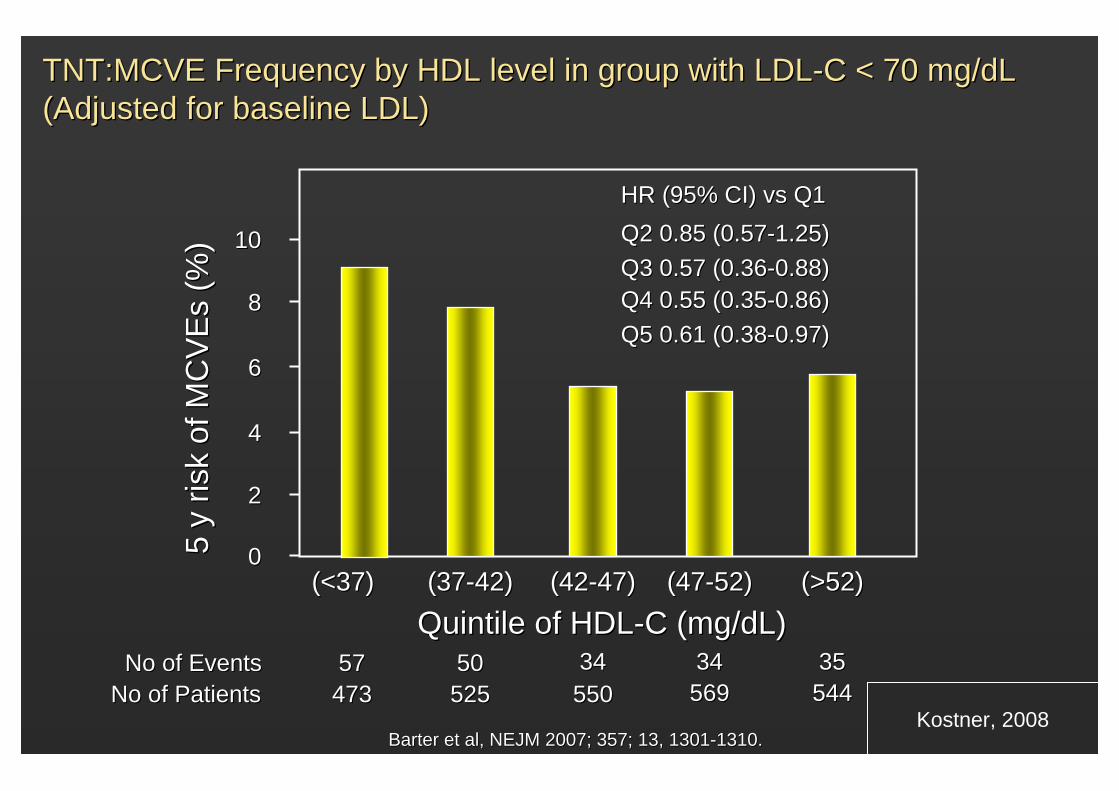
5 y
risk
of
5 y
risk
of M
CV
Es
MC
VE
s(%
)(%
)
(<37)(<37) (37(37--42)42) (42(42--47)47) (47(47--52)52) (>52)(>52)
No of EventsNo of EventsNo of PatientsNo of Patients
5757 5050 3434 3434 3535473473 525525 550550 569569 544544
1010
88
66
44
22
00
HR (95% CI) HR (95% CI) vsvs Q1Q1Q2 0.85 (0.57Q2 0.85 (0.57--1.25)1.25)Q3 0.57 (0.36Q3 0.57 (0.36--0.88)0.88)Q4 0.55 (0.35Q4 0.55 (0.35--0.86)0.86)Q5 0.61 (0.38Q5 0.61 (0.38--0.97)0.97)
Quintile of HDLQuintile of HDL--C (mg/dL)C (mg/dL)
TNT:MCVE Frequency by HDL level in group with LDLTNT:MCVE Frequency by HDL level in group with LDL--C < 70 mg/dL C < 70 mg/dL (Adjusted for baseline LDL)(Adjusted for baseline LDL)
Barter et al, NEJM 2007; 357; 13, 1301Barter et al, NEJM 2007; 357; 13, 1301--1310.1310.Kostner, 2008
Slide SourceLipidsOnline
www.lipidsonline.org
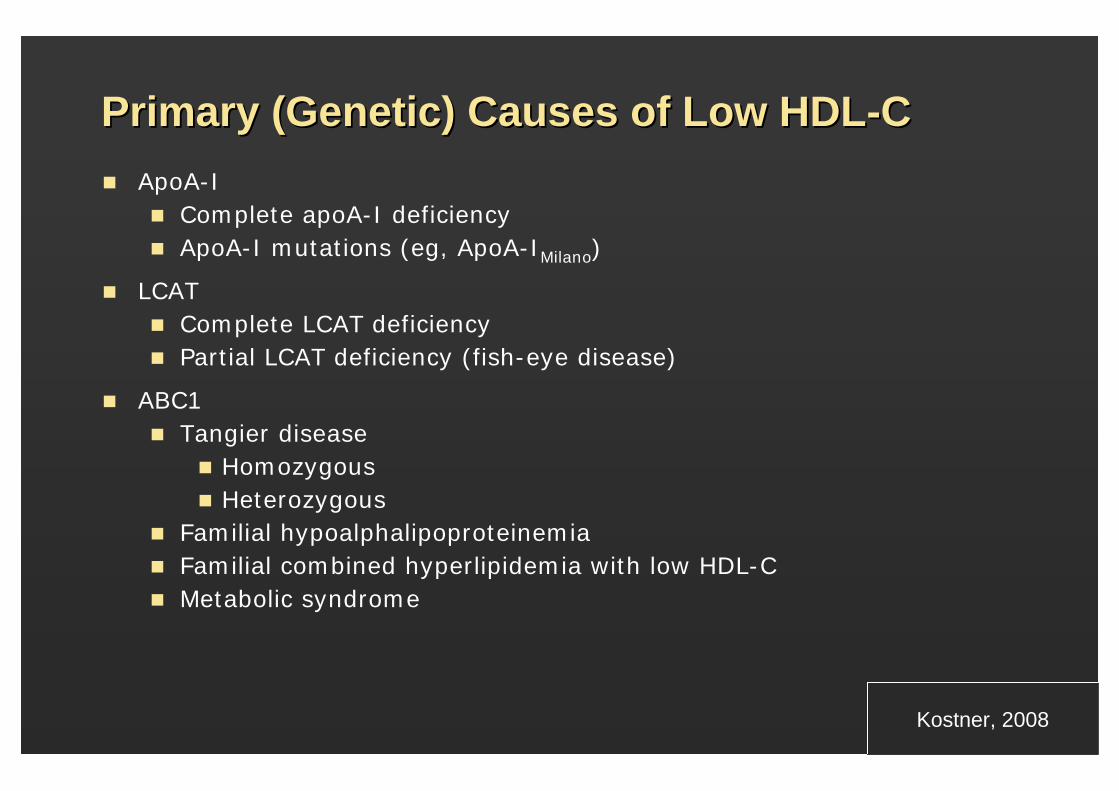
Primary (Genetic) Causes of Low HDLPrimary (Genetic) Causes of Low HDL--CCApoA-I
Complete apoA-I deficiencyApoA-I mutations (eg, ApoA-IMilano)
LCATComplete LCAT deficiencyPartial LCAT deficiency (fish-eye disease)
ABC1Tangier disease
HomozygousHeterozygous
Familial hypoalphalipoproteinemiaFamilial combined hyperlipidemia with low HDL-CMetabolic syndrome
Kostner, ASEANZ 2005Kostner, 2008

Slide SourceLipidsOnline
www.lipidsonline.orgKostner, ASEANZ 2005Kostner, 2008
Slide SourceLipidsOnline
www.lipidsonline.org
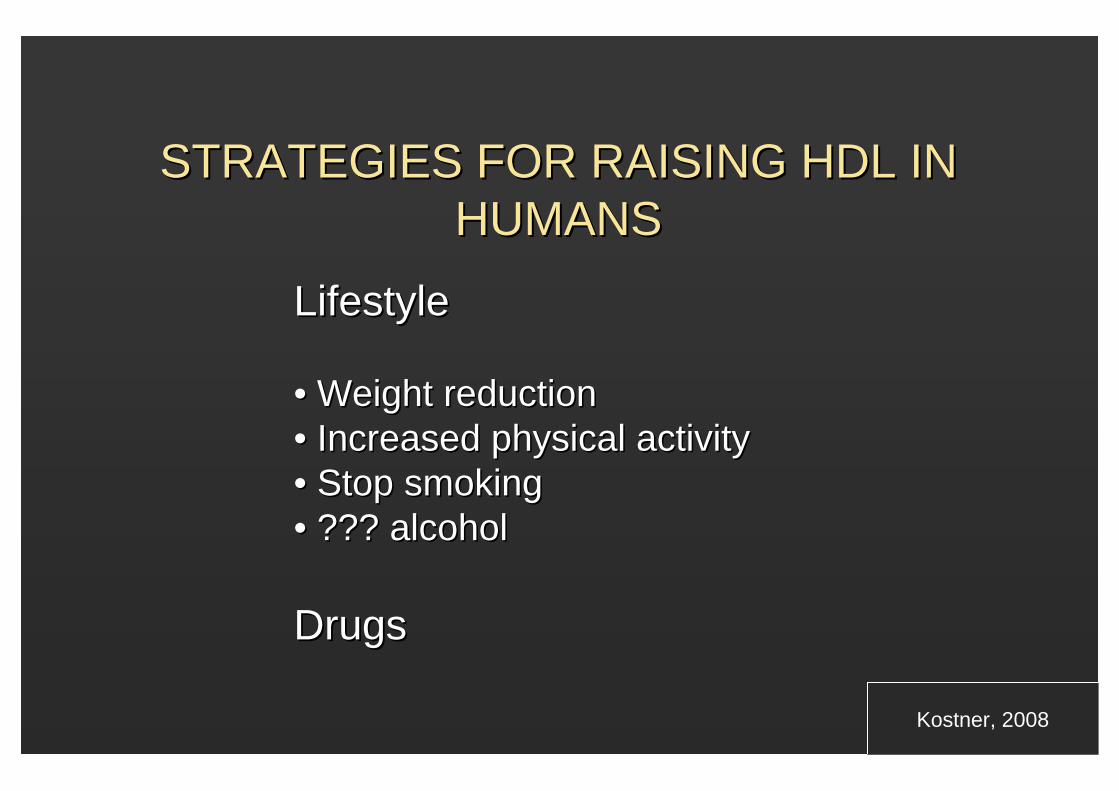
DrugsDrugs
LifestyleLifestyle
•• Weight reductionWeight reduction•• Increased physical activityIncreased physical activity•• Stop smokingStop smoking•• ??? alcohol??? alcohol
STRATEGIES FOR RAISING HDL IN STRATEGIES FOR RAISING HDL IN HUMANSHUMANS
Kostner, 2008
Slide SourceLipidsOnline
www.lipidsonline.org
Slide SourceLipidsOnline
www.lipidsonline.org
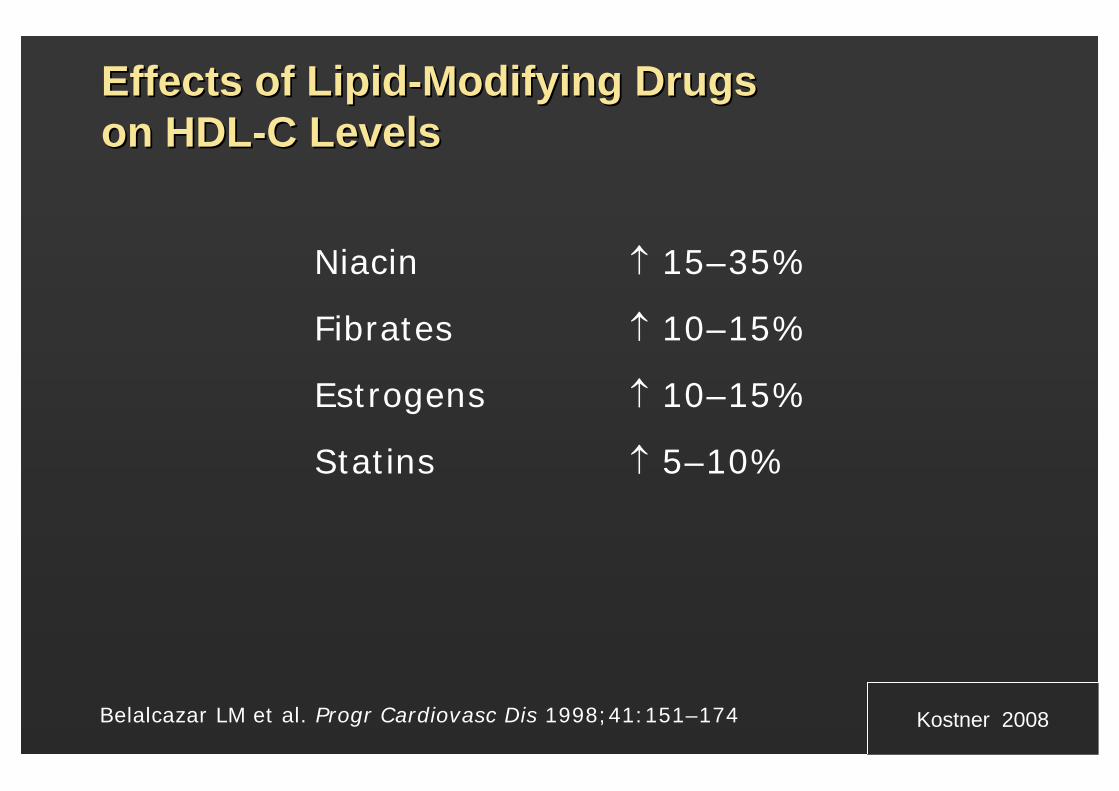
Effects of LipidEffects of Lipid--Modifying Drugs Modifying Drugs on HDLon HDL--C LevelsC Levels
Niacin ↑ 15–35%
Fibrates ↑ 10–15%
Estrogens ↑ 10–15%
Statins ↑ 5–10%
Belalcazar LM et al. Progr Cardiovasc Dis 1998;41:151–174 Kostner 2008
Slide SourceLipidsOnline
www.lipidsonline.org
-50
-40
-30
-20
-10
0
10
20
30
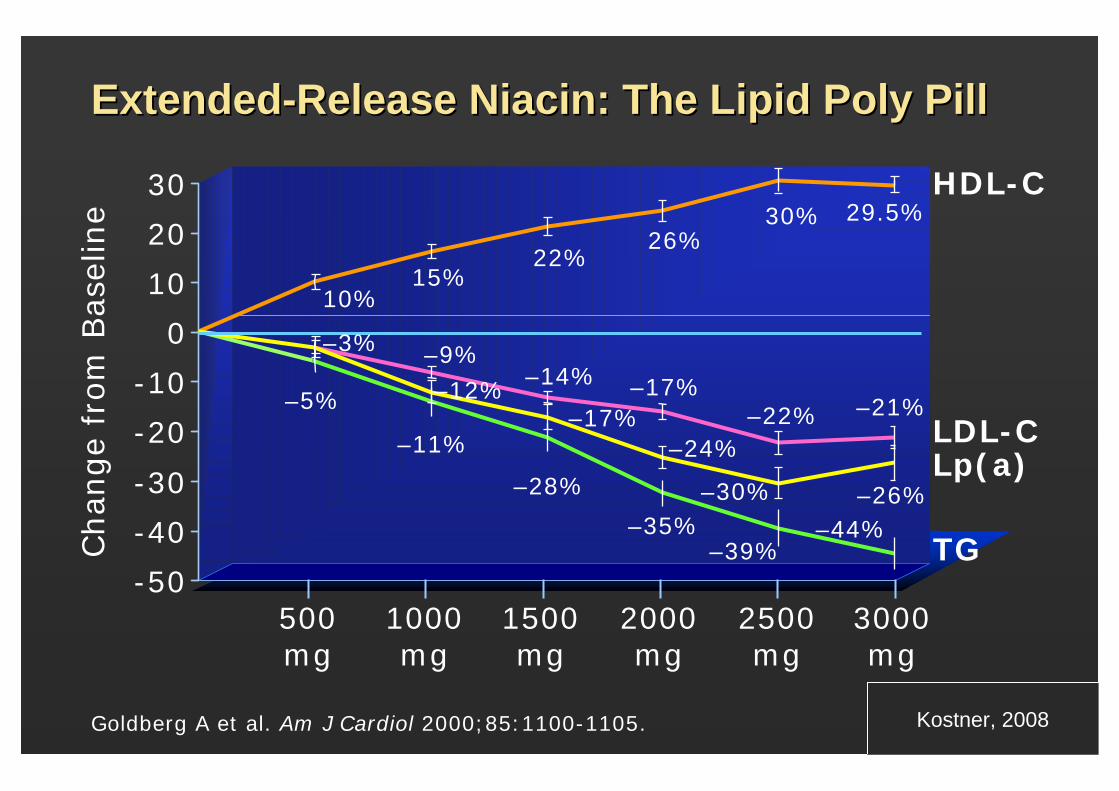
ExtendedExtended--Release Niacin: The Lipid Poly PillRelease Niacin: The Lipid Poly PillChan
ge
from
Bas
elin
e
2500 mg
3000 mg
Goldberg A et al. Am J Cardiol 2000;85:1100-1105.
2000 mg
1500 mg
1000 mg
500mg
HDL-C
LDL-CLp(a)
TG
–9%–14%
–22% –21%–17%
29.5%30%26%
22%15%
10%
–28%
–35% –44%–39%
–11%
–5%
–26%
–3%
–12%
–30%
–24%–17%
Kostner, ASEANZ 2005Kostner, 2008
Slide SourceLipidsOnline
www.lipidsonline.org
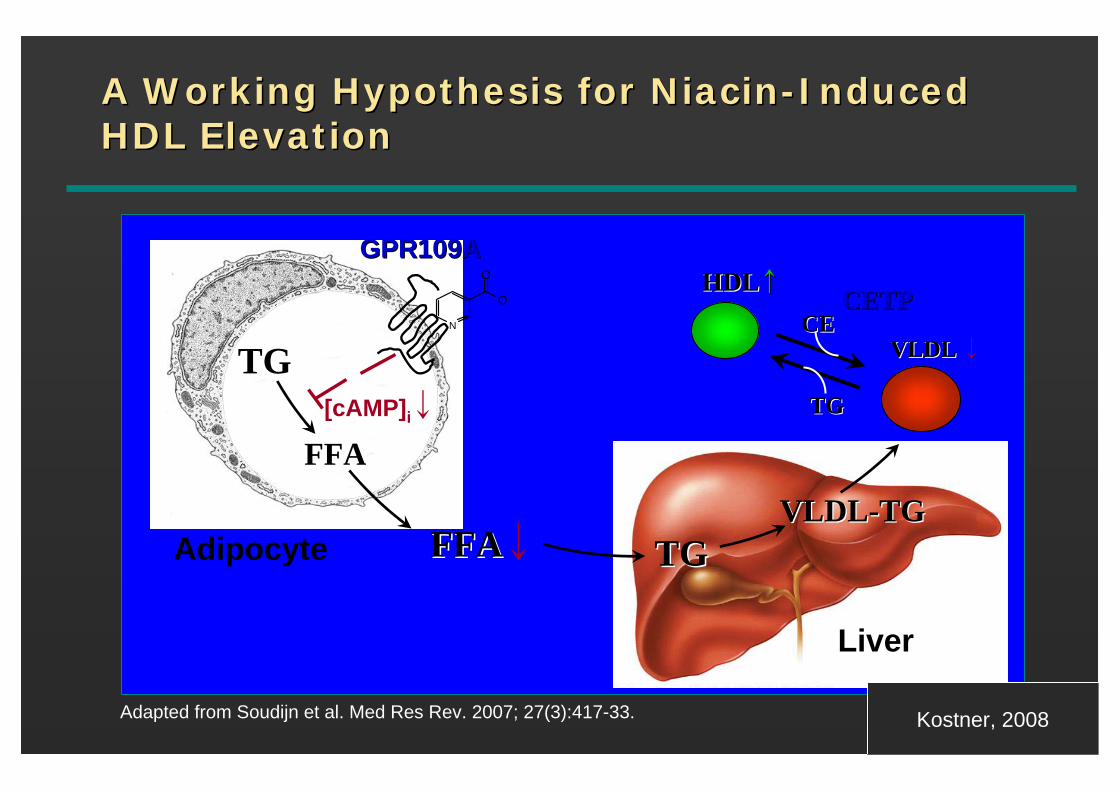
A Working Hypothesis for NiacinA Working Hypothesis for Niacin--Induced Induced HDL ElevationHDL Elevation
FFAFFA↓Adipocyte TGTGVLDLVLDL--TGTG
HDLHDL↑↑
VLDL VLDL ↓
CETPCETP
TGTG
CECE
TGTG
FFAFFA
GPR109AGPR109A
N
O
O
[cAMP]i↓
Liver
Adapted from Soudijn et al. Med Res Rev. 2007; 27(3):417-33. Kostner, 2008
Slide SourceLipidsOnline
www.lipidsonline.org
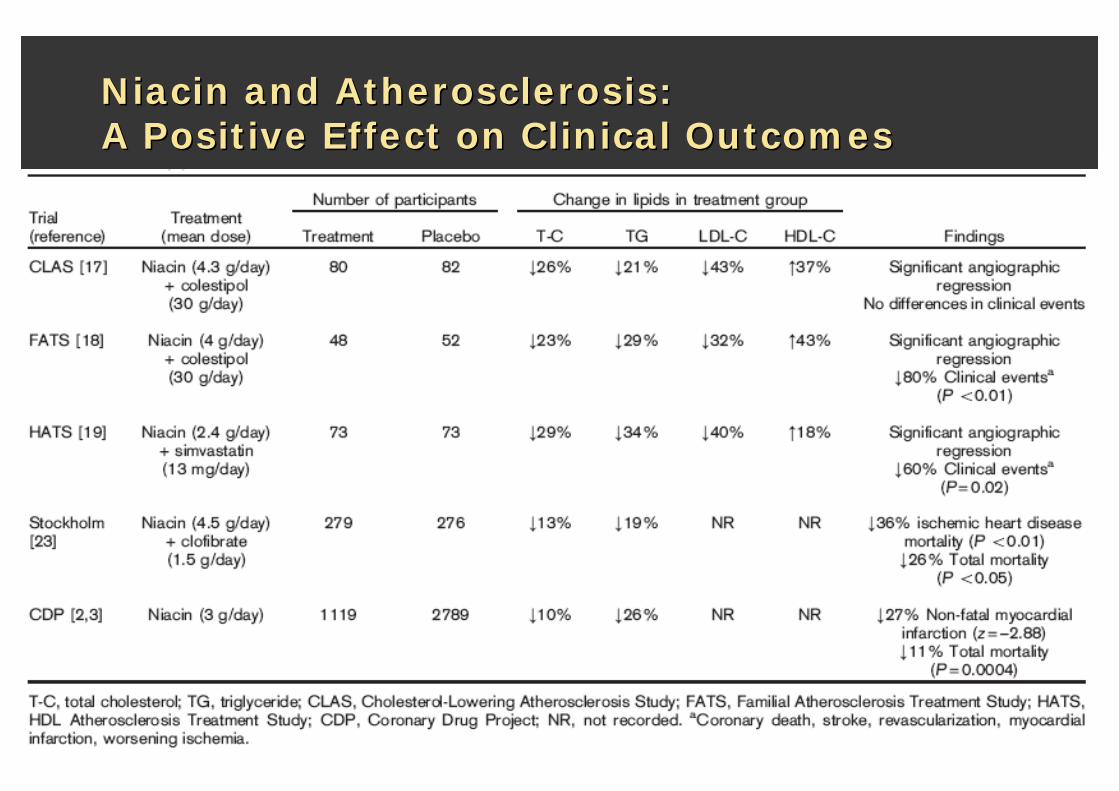
Niacin and Atherosclerosis: Niacin and Atherosclerosis: A Positive Effect on Clinical OutcomesA Positive Effect on Clinical Outcomes
Slide SourceLipidsOnline
www.lipidsonline.org
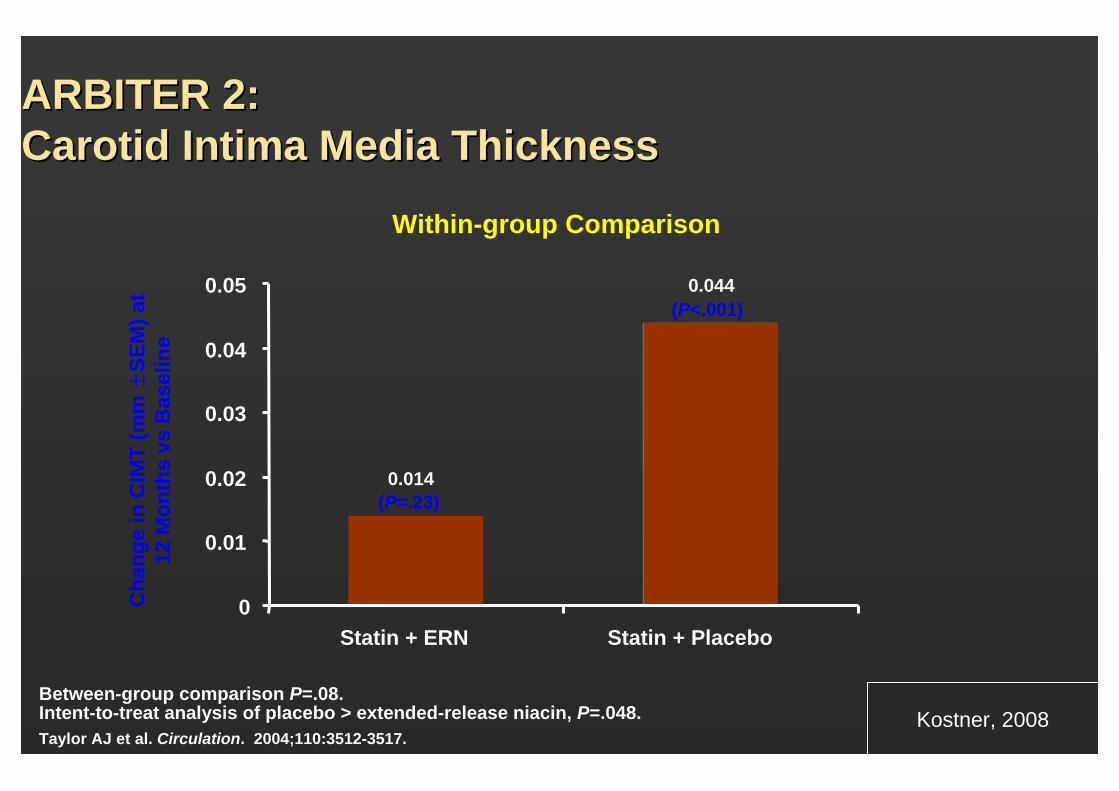
ARBITER 2: ARBITER 2: Carotid Intima Media ThicknessCarotid Intima Media Thickness
Within-group Comparison
Between-group comparison P=.08. Intent-to-treat analysis of placebo > extended-release niacin, P=.048.Taylor AJ et al. Circulation. 2004;110:3512-3517.
Cha
nge
in C
IMT
(mm
±SE
M) a
t 12
Mon
ths
vsB
asel
ine
(P=.23)
(P<.001)0.044
0.014
0
0.01
0.02
0.03
0.04
0.05
Statin + ERN Statin + Placebo
Kostner, 2008
Slide SourceLipidsOnline
www.lipidsonline.org
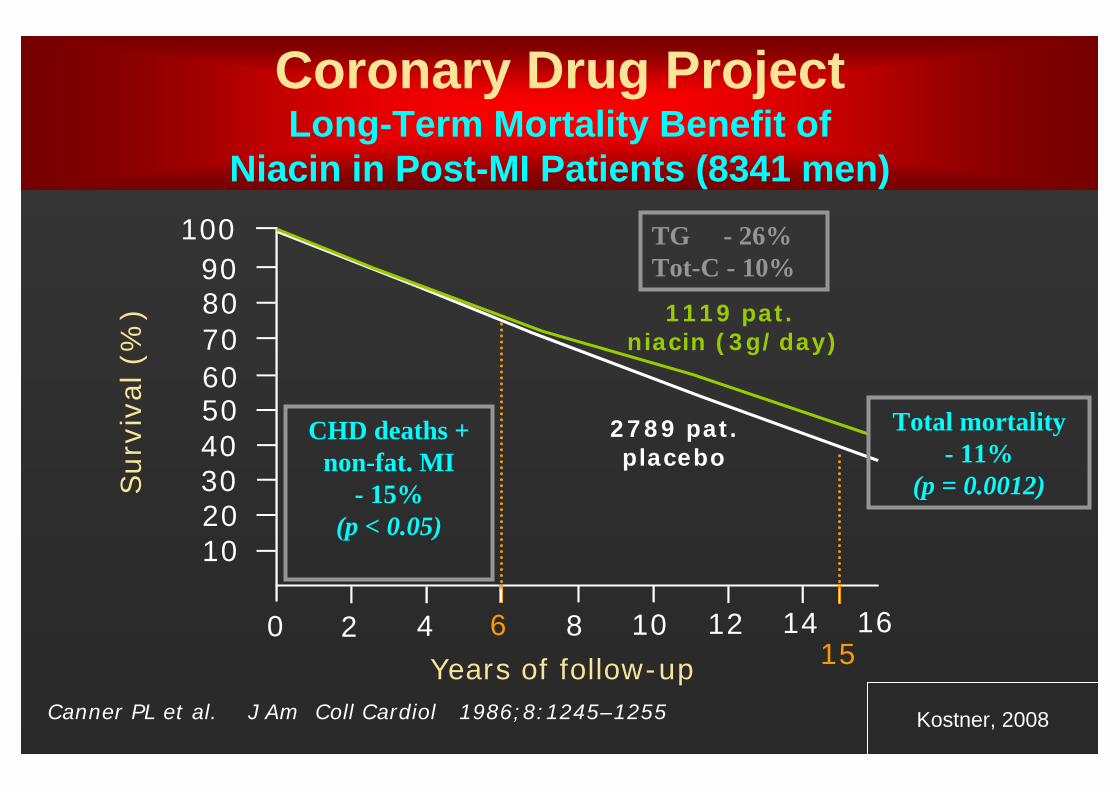
Coronary Drug ProjectLong-Term Mortality Benefit of
Niacin in Post-MI Patients (8341 men)
1119 pat. niacin (3g/day)
100908070605040302010
0 2 4 6 8 10 12 14 16
Years of follow-up
Surv
ival
(%
)
Canner PL et al. J Am Coll Cardiol 1986;8:1245–1255
TG - 26%Tot-C - 10%
Total mortality- 11%
(p = 0.0012)
CHD deaths + non-fat. MI
- 15% (p < 0.05)
15
2789 pat.placebo
Kostner, 2008
Slide SourceLipidsOnline
www.lipidsonline.org
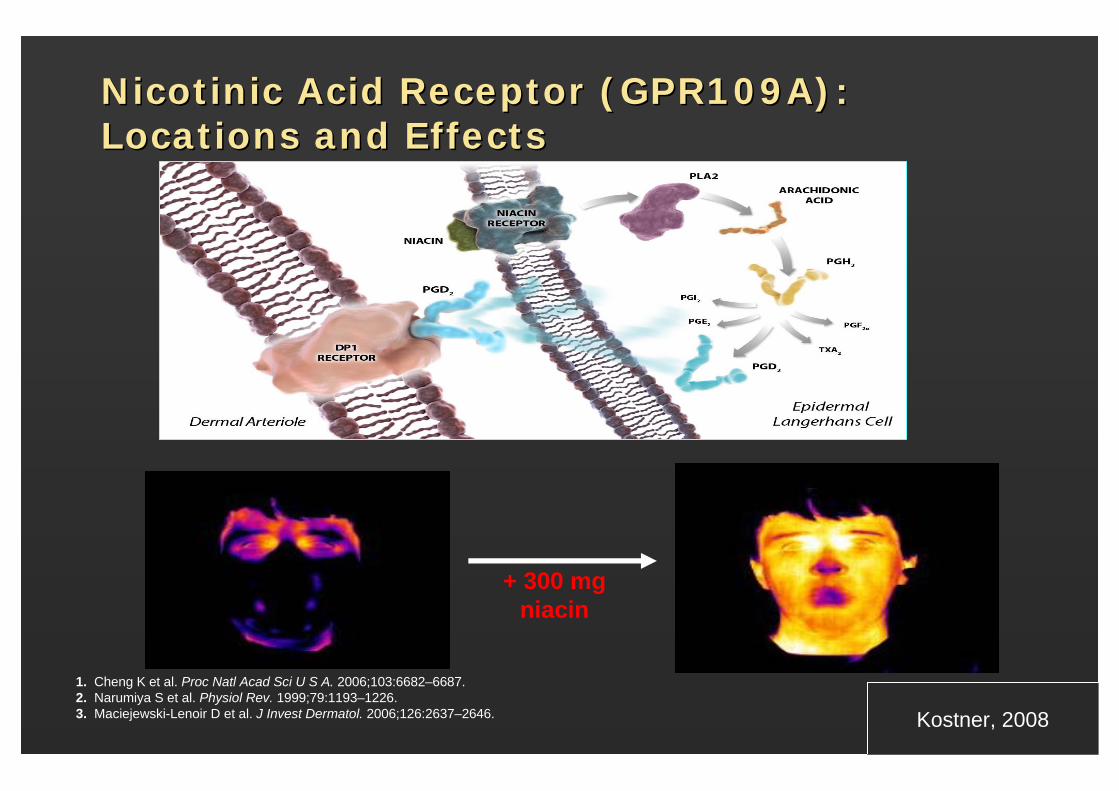
NicotinicNicotinic Acid Receptor (GPR109A): Acid Receptor (GPR109A): Locations and EffectsLocations and Effects
1. Cheng K et al. Proc Natl Acad Sci U S A. 2006;103:6682–6687. 2. Narumiya S et al. Physiol Rev. 1999;79:1193–1226. 3. Maciejewski-Lenoir D et al. J Invest Dermatol. 2006;126:2637–2646. Kostner, 2008
+ 300 mg niacin
Slide SourceLipidsOnline
www.lipidsonline.org
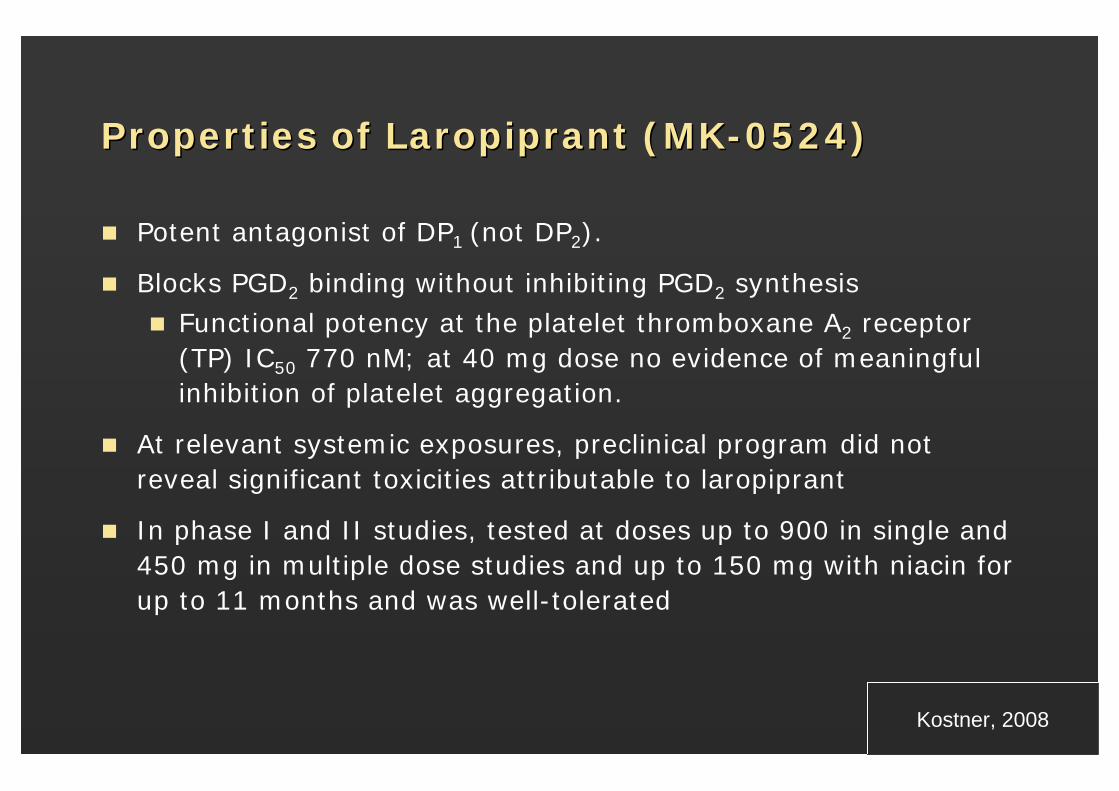
Properties of Properties of LaropiprantLaropiprant (MK(MK--0524)0524)
Potent antagonist of DP1 (not DP2).
Blocks PGD2 binding without inhibiting PGD2 synthesisFunctional potency at the platelet thromboxane A2 receptor (TP) IC50 770 nM; at 40 mg dose no evidence of meaningful inhibition of platelet aggregation.
At relevant systemic exposures, preclinical program did not reveal significant toxicities attributable to laropiprant
In phase I and II studies, tested at doses up to 900 in single and 450 mg in multiple dose studies and up to 150 mg with niacin forup to 11 months and was well-tolerated
Kostner, 2008Kostner, 2008
Slide SourceLipidsOnline
www.lipidsonline.org
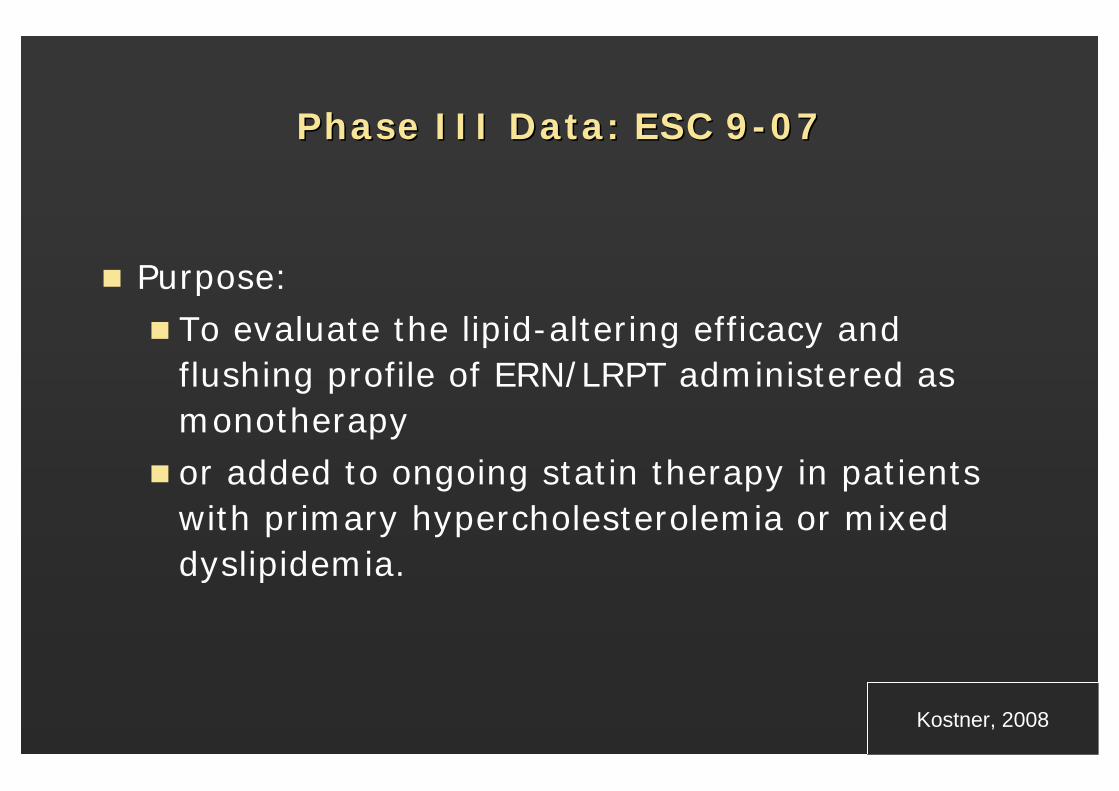
Phase III Data: ESC 9Phase III Data: ESC 9--0707
Purpose:To evaluate the lipid-altering efficacy and flushing profile of ERN/LRPT administered as monotherapyor added to ongoing statin therapy in patients with primary hypercholesterolemia or mixed dyslipidemia.
Kostner, 2008
Slide SourceLipidsOnline
www.lipidsonline.org
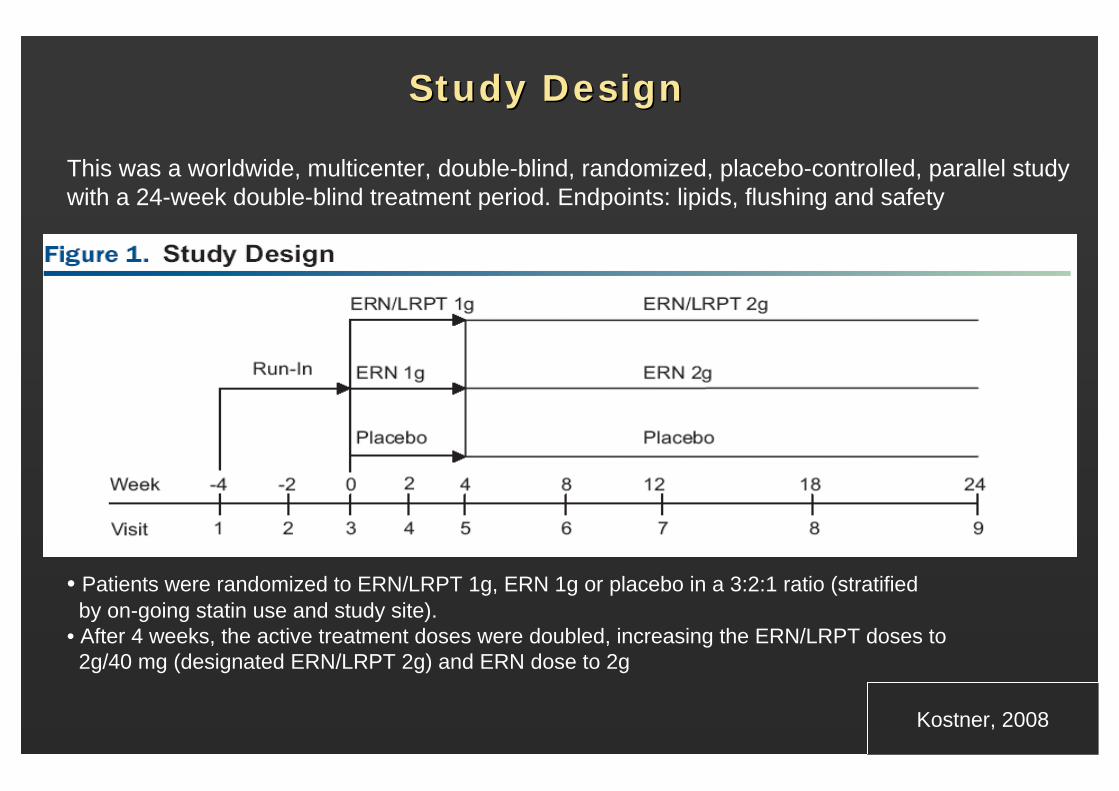
Study DesignStudy Design
This was a worldwide, multicenter, double-blind, randomized, placebo-controlled, parallel study with a 24-week double-blind treatment period. Endpoints: lipids, flushing and safety
• Patients were randomized to ERN/LRPT 1g, ERN 1g or placebo in a 3:2:1 ratio (stratified by on-going statin use and study site).
• After 4 weeks, the active treatment doses were doubled, increasing the ERN/LRPT doses to 2g/40 mg (designated ERN/LRPT 2g) and ERN dose to 2g
N=800
N=543
N=270
Kostner, 2008
Slide SourceLipidsOnline
www.lipidsonline.org
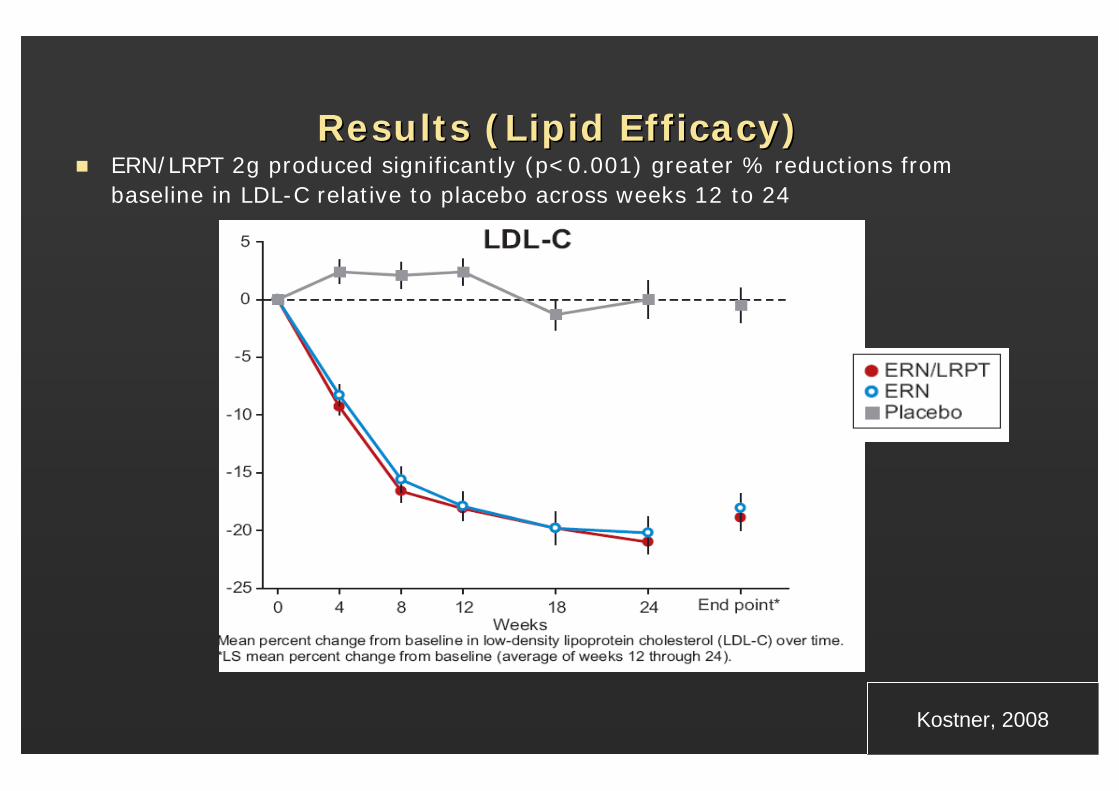
Results (Lipid Efficacy)Results (Lipid Efficacy)ERN/LRPT 2g produced significantly (p<0.001) greater % reductions from baseline in LDL-C relative to placebo across weeks 12 to 24
Kostner, 2008
Slide SourceLipidsOnline
www.lipidsonline.org
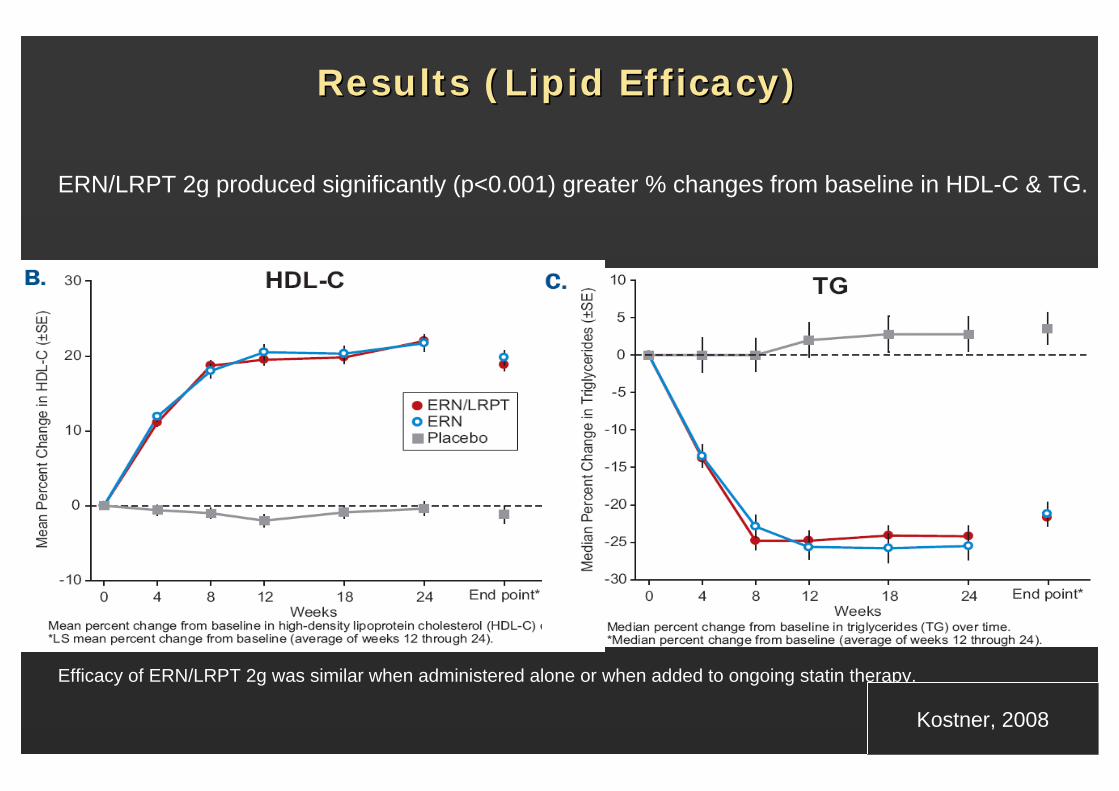
Results (Lipid Efficacy)Results (Lipid Efficacy)
ERN/LRPT 2g produced significantly (p<0.001) greater % changes from baseline in HDL-C & TG.
Efficacy of ERN/LRPT 2g was similar when administered alone or when added to ongoing statin therapy.
Kostner, 2008
Slide SourceLipidsOnline
www.lipidsonline.org
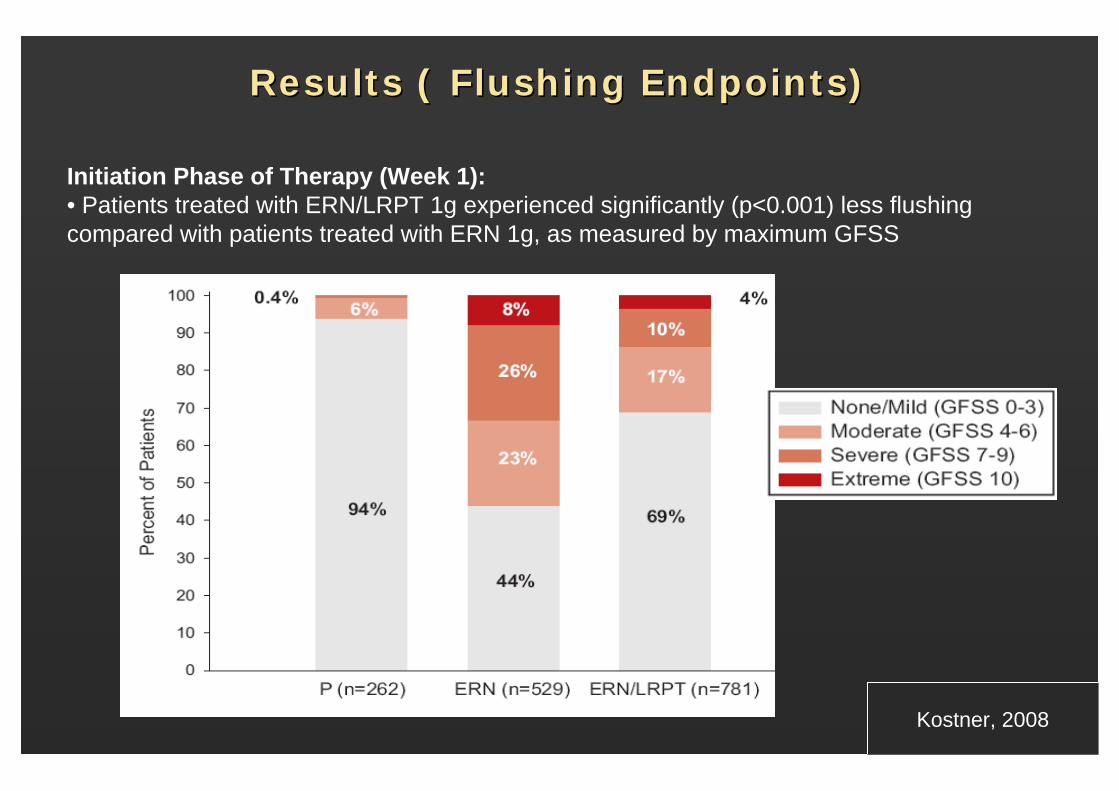
Results ( Flushing Endpoints)Results ( Flushing Endpoints)
Initiation Phase of Therapy (Week 1):• Patients treated with ERN/LRPT 1g experienced significantly (p<0.001) less flushing compared with patients treated with ERN 1g, as measured by maximum GFSS
Kostner, 2008
Slide SourceLipidsOnline
www.lipidsonline.org
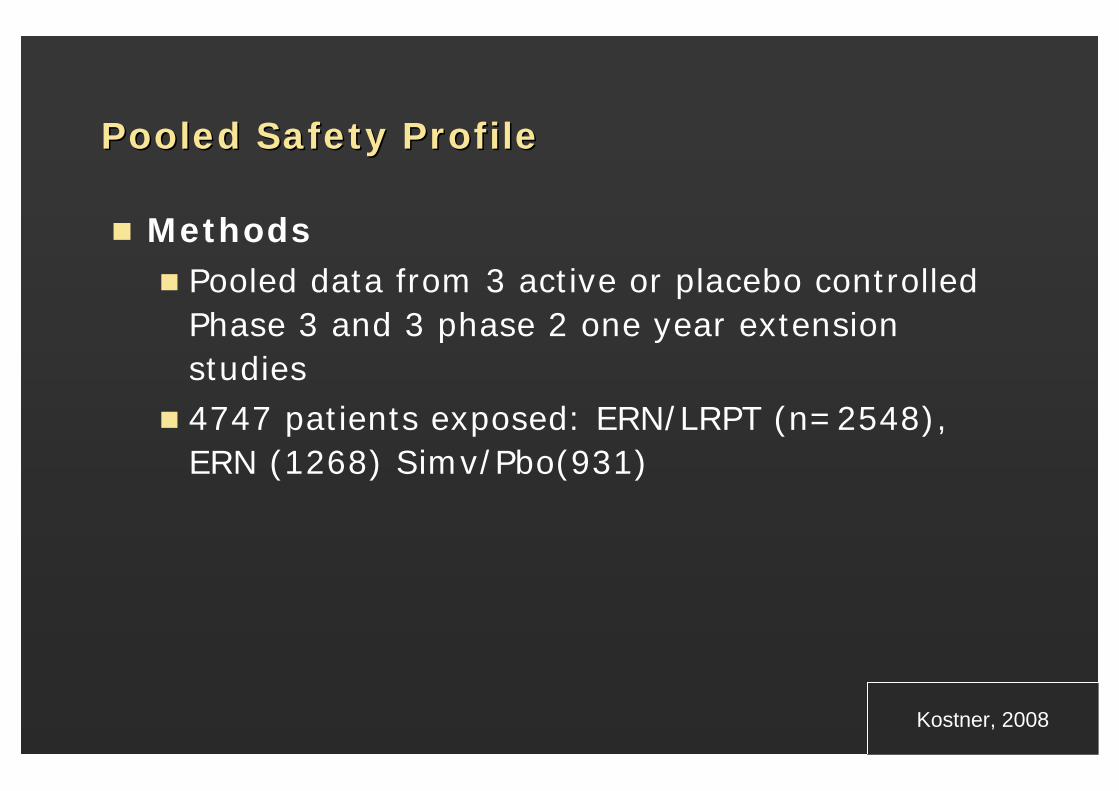
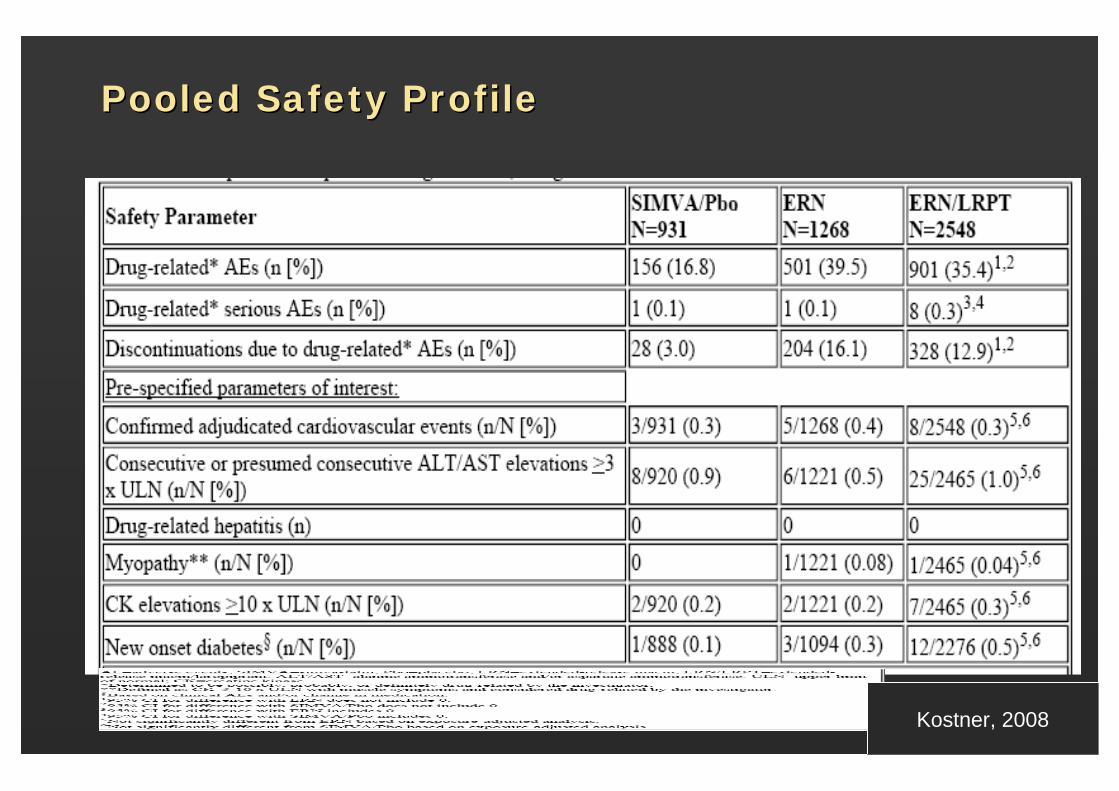
Pooled Safety Profile Pooled Safety Profile
MethodsPooled data from 3 active or placebo controlled Phase 3 and 3 phase 2 one year extension studies4747 patients exposed: ERN/LRPT (n=2548), ERN (1268) Simv/Pbo(931)
Kostner, 2008
Slide SourceLipidsOnline
www.lipidsonline.org
Pooled Safety Profile Pooled Safety Profile
Kostner, 2008
Slide SourceLipidsOnline
www.lipidsonline.org
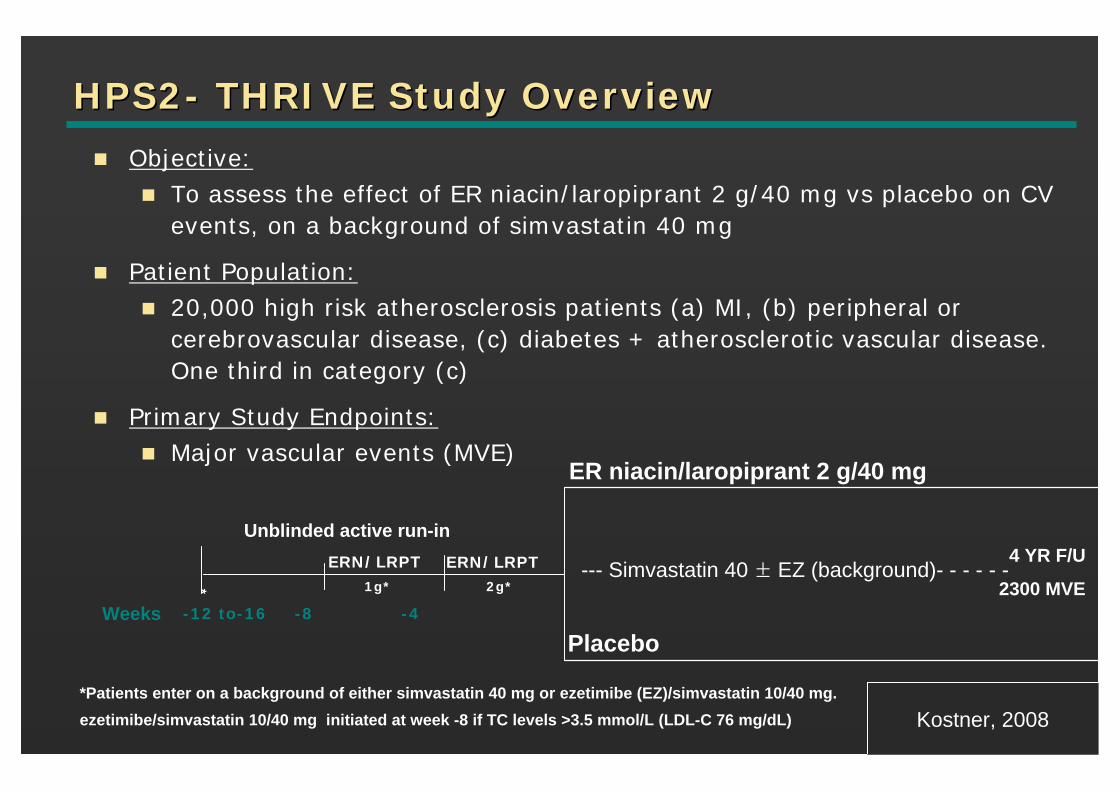
HPS2HPS2-- THRIVE Study OverviewTHRIVE Study Overview
Objective:To assess the effect of ER niacin/laropiprant 2 g/40 mg vs placebo on CV events, on a background of simvastatin 40 mg
Patient Population:20,000 high risk atherosclerosis patients (a) MI, (b) peripheral or cerebrovascular disease, (c) diabetes + atherosclerotic vascular disease. One third in category (c)
Primary Study Endpoints:Major vascular events (MVE)
*Patients enter on a background of either simvastatin 40 mg or ezetimibe (EZ)/simvastatin 10/40 mg.ezetimibe/simvastatin 10/40 mg initiated at week -8 if TC levels >3.5 mmol/L (LDL-C 76 mg/dL)
Placebo-12 to-16 -8 -4
Unblinded active run-inERN/LRPT
1g*
ERN/LRPT2g*
ER niacin/laropiprant 2 g/40 mg
4 YR F/U
2300 MVE*
Weeks
--- Simvastatin 40 ± EZ (background)- - - - - -
Kostner, 2008
Slide SourceLipidsOnline
www.lipidsonline.org
Slide SourceLipidsOnline
www.lipidsonline.org
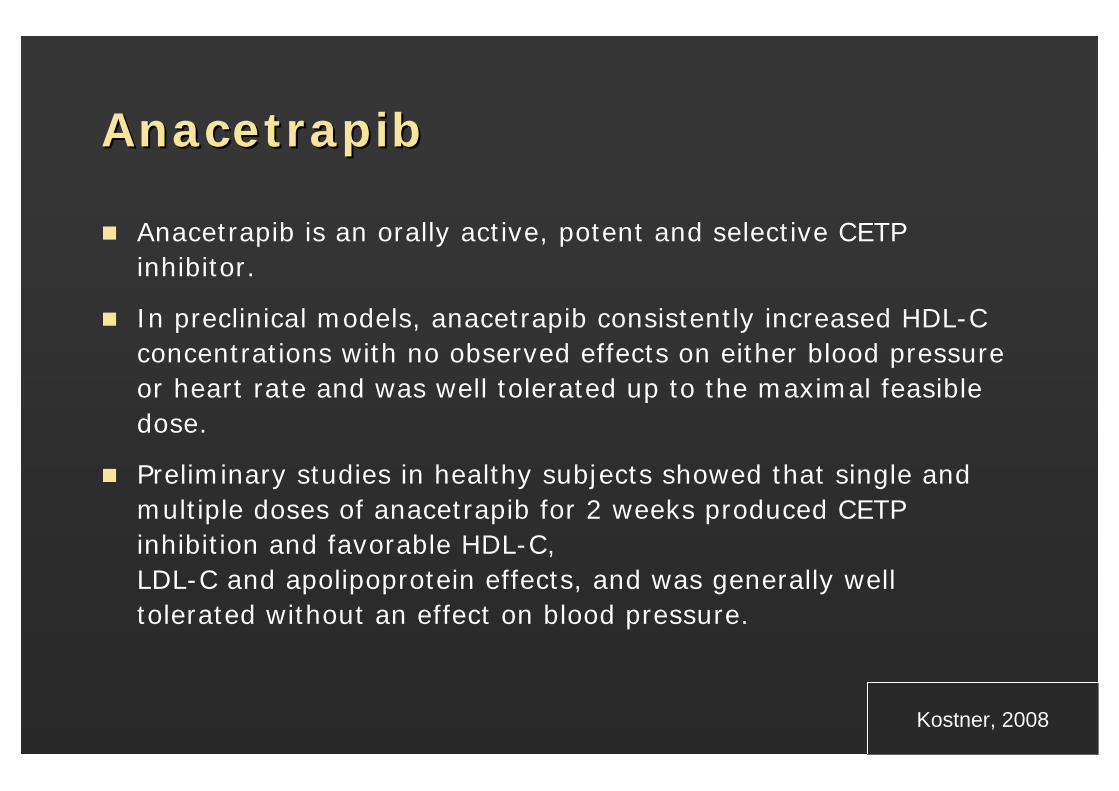
AnacetrapibAnacetrapib
Anacetrapib is an orally active, potent and selective CETP inhibitor.
In preclinical models, anacetrapib consistently increased HDL-C concentrations with no observed effects on either blood pressureor heart rate and was well tolerated up to the maximal feasible dose.
Preliminary studies in healthy subjects showed that single and multiple doses of anacetrapib for 2 weeks produced CETP inhibition and favorable HDL-C, LDL-C and apolipoprotein effects, and was generally well tolerated without an effect on blood pressure.
Kostner, 2008
Slide SourceLipidsOnline
www.lipidsonline.org
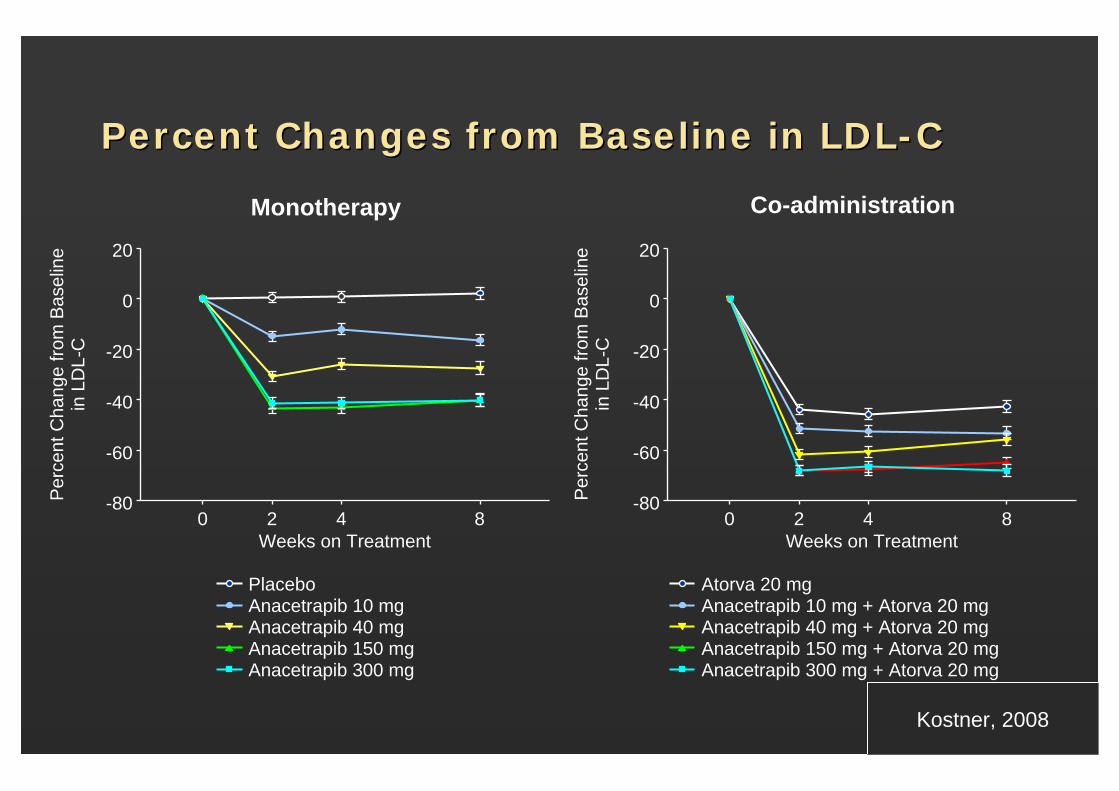
Percent Changes from Baseline in LDLPercent Changes from Baseline in LDL--CC
Monotherapy Co-administration
Per
cent
Cha
nge
from
Bas
elin
ein
LD
L-C
Weeks on Treatment0 2 4 8
-80
-60
-40
-20
0
20
PlaceboAnacetrapib 10 mgAnacetrapib 40 mgAnacetrapib 150 mgAnacetrapib 300 mg
Weeks on Treatment0 2 4 8
-80
-60
-40
-20
0
20
Atorva 20 mgAnacetrapib 10 mg + Atorva 20 mgAnacetrapib 40 mg + Atorva 20 mgAnacetrapib 150 mg + Atorva 20 mgAnacetrapib 300 mg + Atorva 20 mg
Per
cent
Cha
nge
from
Bas
elin
ein
LD
L-C
Kostner, 2008
Slide SourceLipidsOnline
www.lipidsonline.org
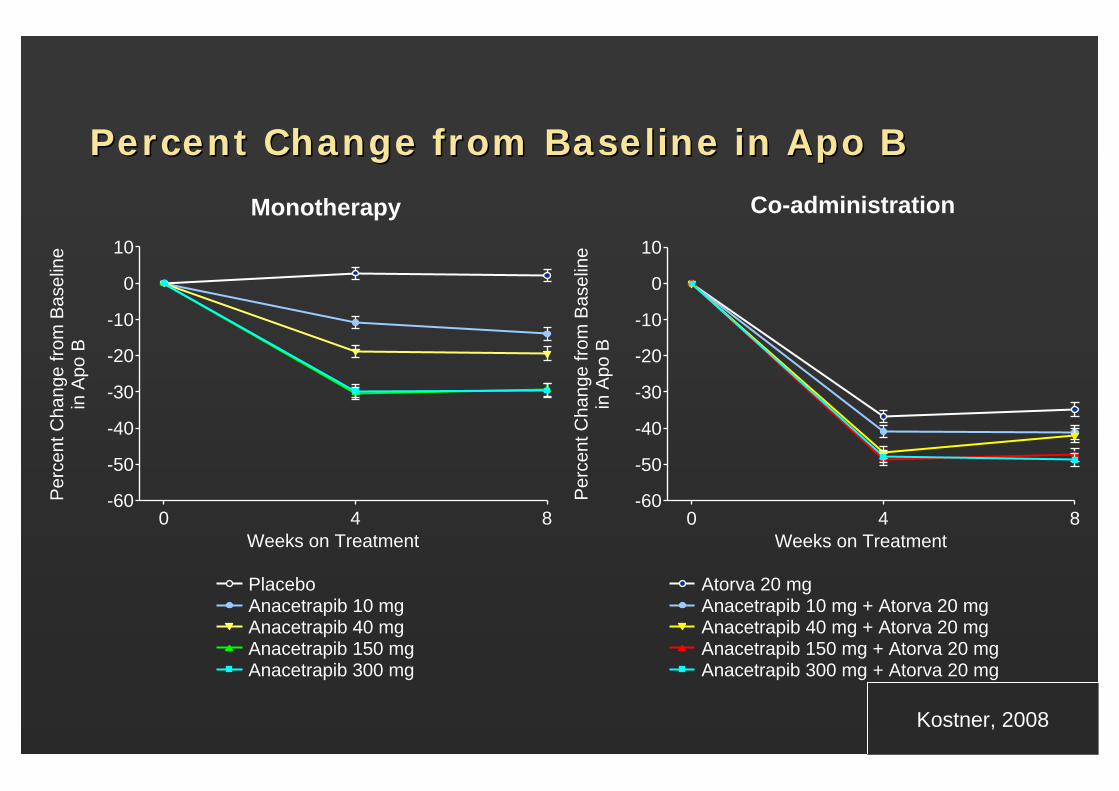
Percent Change from Baseline in Apo BPercent Change from Baseline in Apo B
Per
cent
Cha
nge
from
Bas
elin
ein
Apo
B
Anacetrapib 10 mgAnacetrapib 40 mgAnacetrapib 150 mgAnacetrapib 300 mg
Atorva 20 mgAnacetrapib 10 mg + Atorva 20 mgAnacetrapib 40 mg + Atorva 20 mgAnacetrapib 150 mg + Atorva 20 mgAnacetrapib 300 mg + Atorva 20 mg
Per
cent
Cha
nge
from
Bas
elin
ein
Apo
B
Weeks on Treatment0 4 8
-60
-50
-40
-30
-20
-10
0
10
Weeks on Treatment0 4 8
-60
-50
-40
-30
-20
-10
0
10
Monotherapy Co-administration
Placebo
Kostner, 2008
Slide SourceLipidsOnline
www.lipidsonline.org
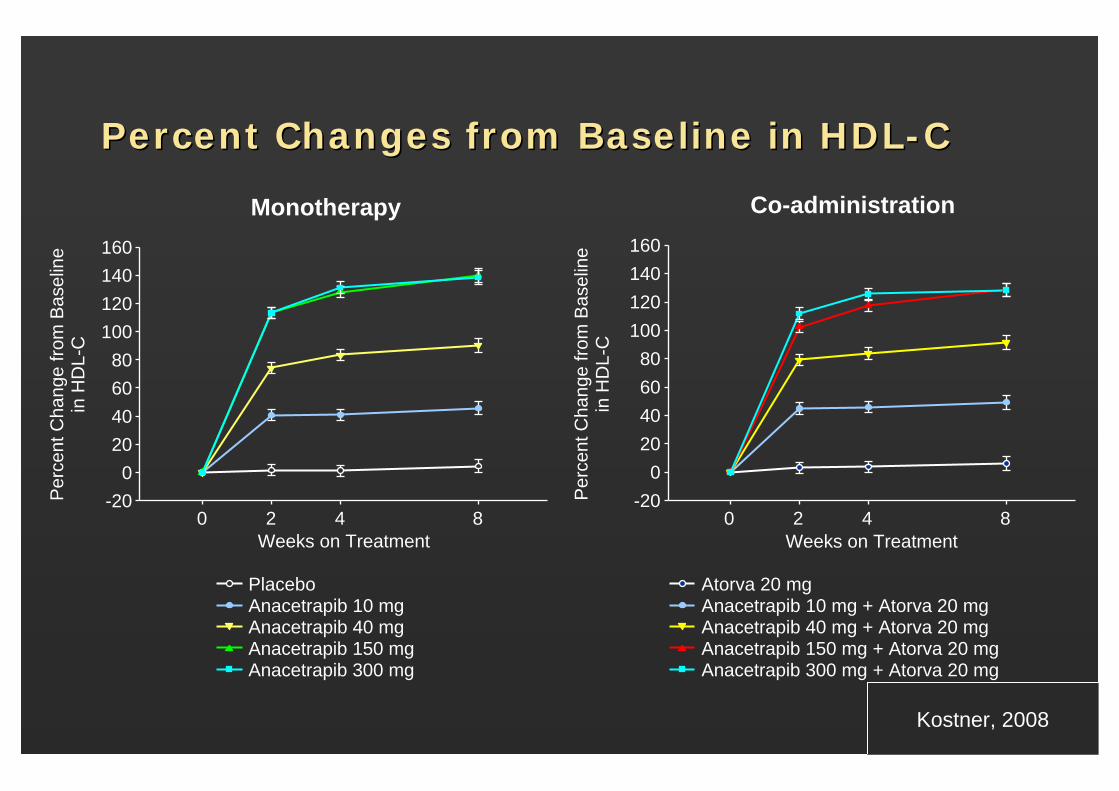
Percent Changes from Baseline in HDLPercent Changes from Baseline in HDL--CC
Weeks on Treatment0 2 4 8
-200
20406080
100120140160
Weeks on Treatment
-200
20406080
100120140160
0 2 4 8
Monotherapy Co-administration
Per
cent
Cha
nge
from
Bas
elin
ein
HD
L-C
PlaceboAnacetrapib 10 mgAnacetrapib 40 mgAnacetrapib 150 mgAnacetrapib 300 mg
Atorva 20 mgAnacetrapib 10 mg + Atorva 20 mgAnacetrapib 40 mg + Atorva 20 mgAnacetrapib 150 mg + Atorva 20 mgAnacetrapib 300 mg + Atorva 20 mg
Per
cent
Cha
nge
from
Bas
elin
ein
HD
L-C
Kostner, 2008
Slide SourceLipidsOnline
www.lipidsonline.org
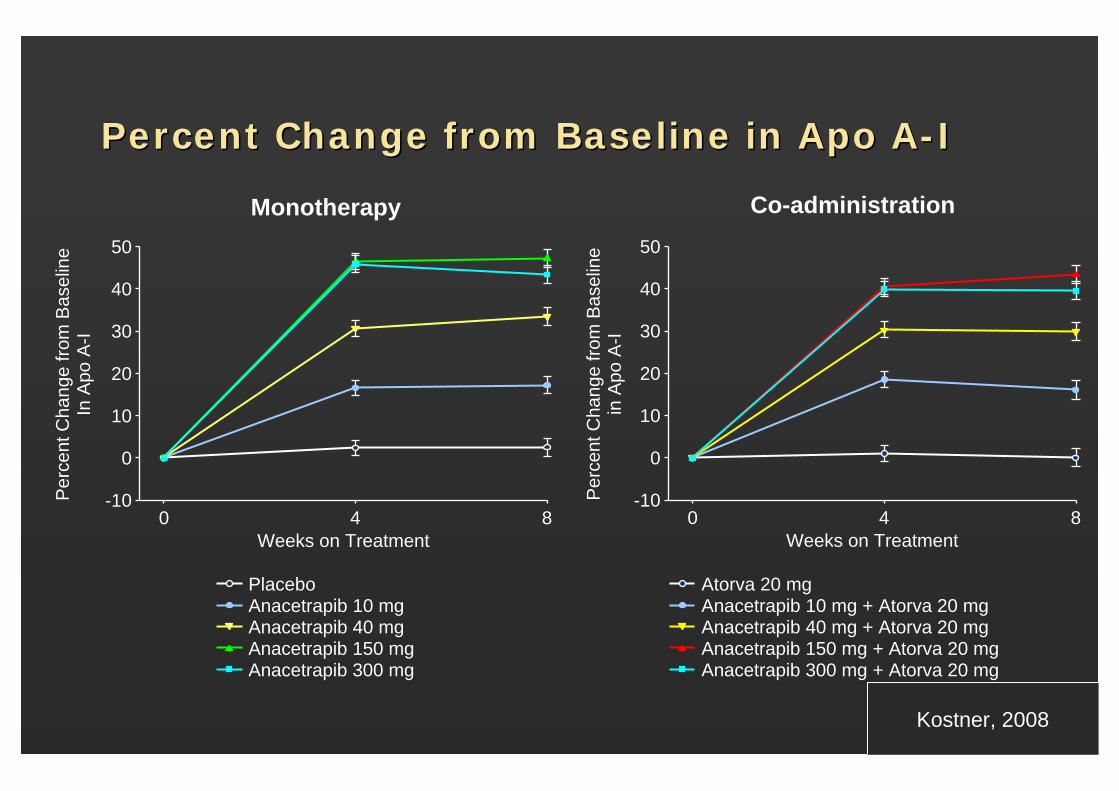
Percent Change from Baseline in Apo APercent Change from Baseline in Apo A--II
Weeks on Treatment0 4 8
-10
0
10
20
30
40
50
Weeks on Treatment0 4 8
-10
0
10
20
30
40
50
Per
cent
Cha
nge
from
Bas
elin
eIn
Apo
A-I
PlaceboAnacetrapib 10 mgAnacetrapib 40 mgAnacetrapib 150 mgAnacetrapib 300 mg
Atorva 20 mgAnacetrapib 10 mg + Atorva 20 mgAnacetrapib 40 mg + Atorva 20 mgAnacetrapib 150 mg + Atorva 20 mgAnacetrapib 300 mg + Atorva 20 mg
Per
cent
Cha
nge
from
Bas
elin
ein
Apo
A-I
Monotherapy Co-administration
Kostner, 2008
Slide SourceLipidsOnline
www.lipidsonline.org
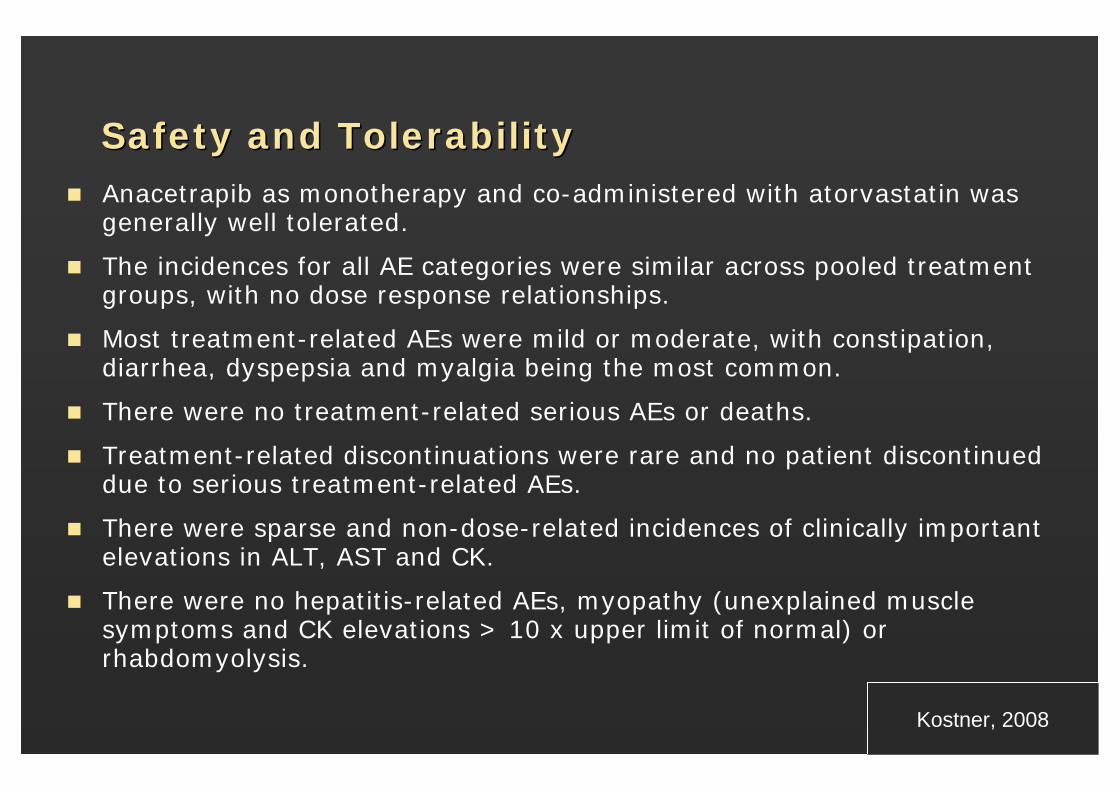
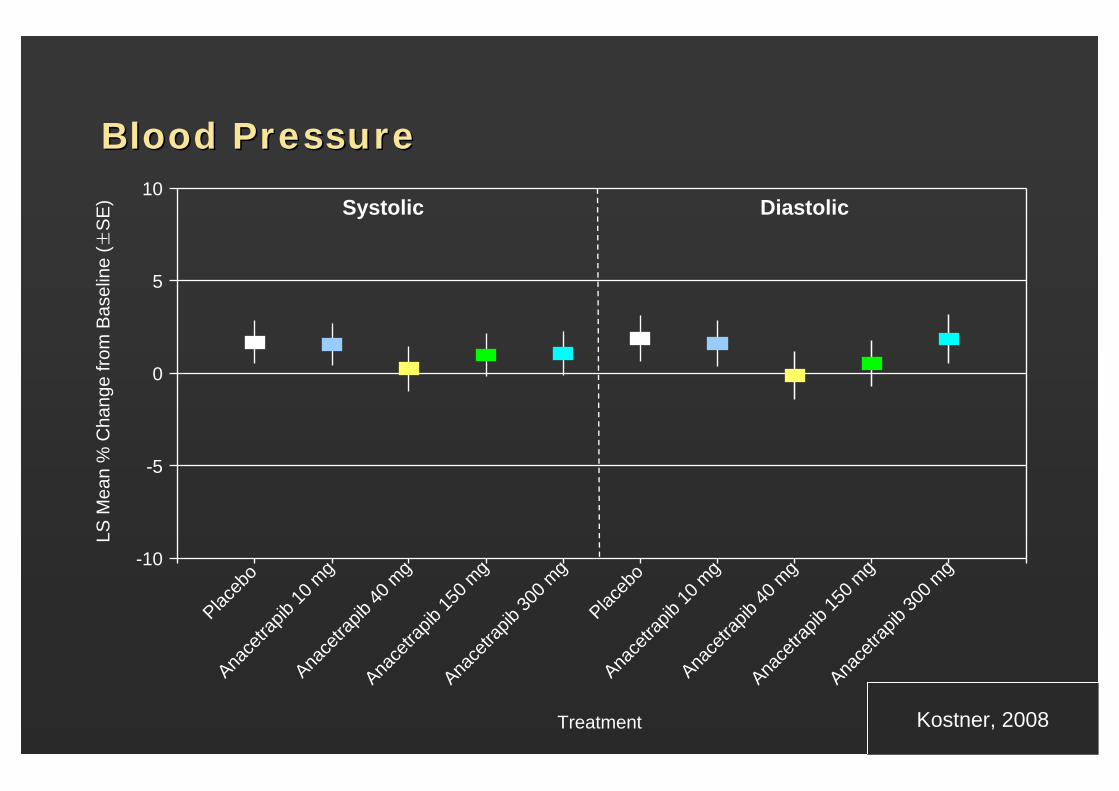
Safety and TolerabilitySafety and TolerabilityAnacetrapib as monotherapy and co-administered with atorvastatin was generally well tolerated.
The incidences for all AE categories were similar across pooled treatment groups, with no dose response relationships.
Most treatment-related AEs were mild or moderate, with constipation, diarrhea, dyspepsia and myalgia being the most common.
There were no treatment-related serious AEs or deaths.
Treatment-related discontinuations were rare and no patient discontinued due to serious treatment-related AEs.
There were sparse and non-dose-related incidences of clinically important elevations in ALT, AST and CK.
There were no hepatitis-related AEs, myopathy (unexplained muscle symptoms and CK elevations > 10 x upper limit of normal) or rhabdomyolysis.
Kostner, 2008
Slide SourceLipidsOnline
www.lipidsonline.org
Blood PressureBlood Pressure
Systolic Diastolic
-10
-5
0
5
10
Placeb
oAna
cetra
pib10
mg
Anace
trapib
40 m
g
Anace
trapib
150 m
g
Anace
trapib
300 m
g
Placeb
oAna
cetra
pib10
mg
Anace
trapib
40 m
g
Anace
trapib
150 m
g
Anace
trapib
300 m
g
LS M
ean
% C
hang
e fro
m B
asel
ine
(±S
E)
Treatment Kostner, 2008
Slide SourceLipidsOnline
www.lipidsonline.org
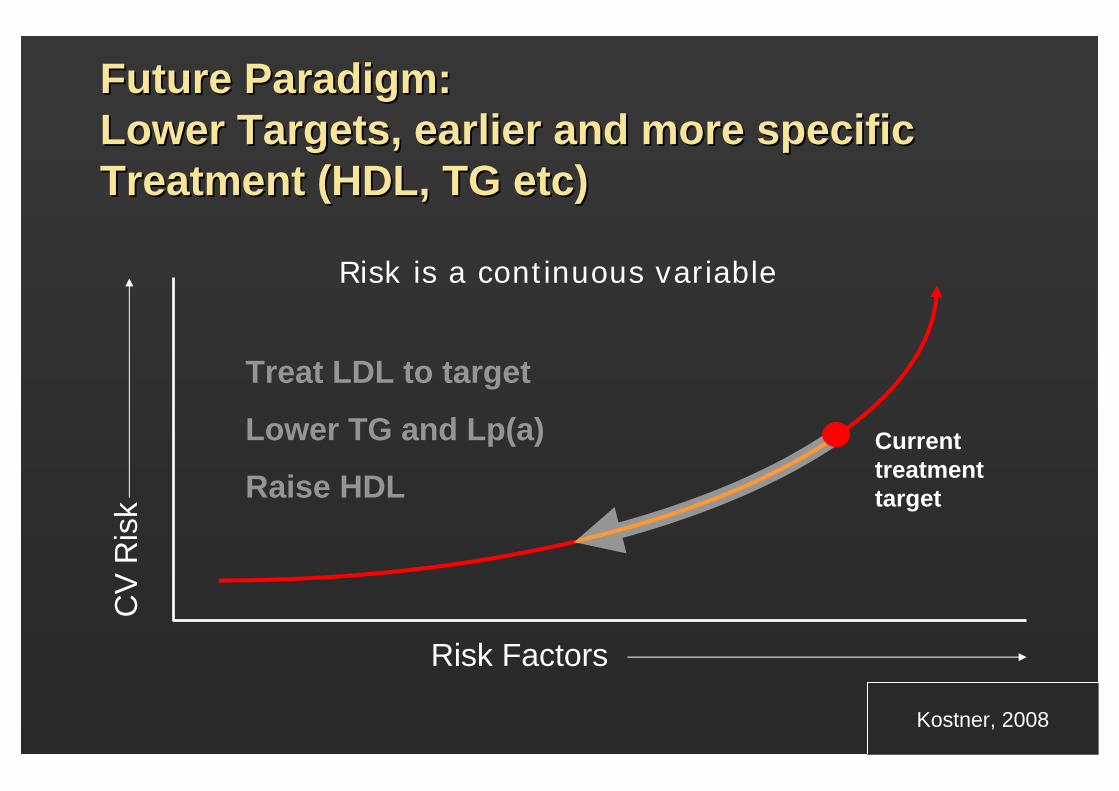
Future Paradigm: Future Paradigm: Lower Targets, earlier and more specific Lower Targets, earlier and more specific Treatment (HDL, TG etc)Treatment (HDL, TG etc)
Risk is a continuous variable
Treat LDL to target
Lower TG and Lp(a)
Raise HDL
Risk Factors
CV
Ris
k
Current treatment target
Kostner, 2008