NOVEL APPLICATIONS OF DATA MINING METHODOLOGIES TO...
82
NOVEL APPLICATIONS OF DATA MINING METHODOLOGIES TO INCIDENT DATABASES A Thesis by SUMIT ANAND Submitted to the Office of Graduate Studies of Texas A&M University in partial fulfillment of the requirements for the degree of MASTER OF SCIENCE May 2005 Major Subject: Chemical Engineering
Transcript of NOVEL APPLICATIONS OF DATA MINING METHODOLOGIES TO...

NOVEL APPLICATIONS OF DATA MINING METHODOLOGIES TO
INCIDENT DATABASES
A Thesis
by
SUMIT ANAND
Submitted to the Office of Graduate Studies of Texas A&M University
in partial fulfillment of the requirements for the degree of
MASTER OF SCIENCE
May 2005
Major Subject: Chemical Engineering

NOVEL APPLICATIONS OF DATA MINING METHODOLOGIES TO
INCIDENT DATABASES
A Thesis
by
SUMIT ANAND
Submitted to Texas A&M University in partial fulfillment of the requirements
for the degree of
MASTER OF SCIENCE
Approved as to style and content by:
Marietta(Mem
Mahmoud(Me
Kenne(Head of D
M. Sam(Chair of
May 2005
Major Subject: Chemical Engineering
El-Halwagi mber)
J. Tretter
ber)
th Hall epartment)
Mannan
Committee)
iii
ABSTRACT
Novel Applications of Data Mining Methodologies to Incident Databases.
(May 2005)
Sumit Anand, B.E., Regional Engineering College, Rourkela, India
Chair of Advisory Committee: Dr. Sam Mannan
Incident databases provide an excellent opportunity to study the repeated situations of
incidents in the process industry. The databases give an insight into the situation which
led to an incident, and if studied properly can help monitor the process, equipment and
chemical involved more closely, and reduce the number of incidents in the future. This
study examined a subset of incidents from National Response Center’s Incident
database, focusing mainly on fixed facility incidents in Harris County, Texas from 1990
to 2002.
Data mining has been used in the financial and marketing arena for many decades to
analyze and find patterns in large amounts of data. Realizing the limited capabilities of
traditional methods of statistics, more robust techniques of data mining were applied to
the subset of data and interesting patterns of chemical involved, equipment failed,
component involved, etc. were found. Further, patterns obtained by data mining on the
subset of data were used in modifying probabilities of failure of equipment and
developing a decision support system.

iv
DEDICATION
To Papa, Mummy, and Bhai who have extended great care and encouragement
throughout my life

v
ACKNOWLEDGEMENTS
I express my profound gratitude to my academic advisor, Dr. Sam Mannan, for his
endless encouragement throughout my two years of study. A person with great concern
for his students, he will remain an exemplar in my future. I am also grateful to
Dr. Mahmoud El-Halwagi for all the help and guidance he offered me since I have been
at Texas A&M University. I thank Dr. Marietta Tretter for her excellent advice in my
research. I wish to extend my special thanks to Dr. Nir Keren for the intuitive and
brainstorming discussions I had with him during my research. I appreciate all the
colleagues and staff of the Mary Kay O’Connor Process Safety Center for their help. I
am thankful to the staff of Chemical Engineering Department as well for helping me
with all the paperwork throughout these two years. Finally, I thank my family and
friends for their firm belief in me.

vi
TABLE OF CONTENTS
Page
ABSTRACT .............................................................................................................. iii
DEDICATION .......................................................................................................... iv
ACKNOWLEDGEMENTS ...................................................................................... v
TABLE OF CONTENTS .......................................................................................... vi
LIST OF FIGURES................................................................................................... ix
LIST OF TABLES .................................................................................................... x
CHAPTER
I INTRODUCTION ..........................................................................................1
1.1 Introduction ..........................................................................................1 1.2 Incident Pyramid ..................................................................................2 1.3 Process Safety Management.................................................................4 1.4 Incident Investigation...........................................................................5
II INCIDENT DATABASES.............................................................................7
2.1 Background ..........................................................................................7 2.2 National Fire Information Reporting System (NFIRS) Database ........7 2.3 National Electronic Injuries Surveillance System (NEISS) ................8 2.4 News Clipping Database ......................................................................9 2.5 Hazardous Material Incidents Reporting System (HMIRS)………...11 2.6 Integrated Pipeline Information System (IPIS) ................................. 12
vii
CHAPTER Page
2.7 Incident Reporting Information System (IRIS) Database ................. 13 2.8 RMP 5-year Accident History Database ........................................... 15 2.9 Hazardous Substances Emergency Events Surveillance (HSEES) Database ............................................................................................ 16
III THE CHALLENGES.................................................................................. 18
3.1 Introduction ....................................................................................... 18 3.2 Types of Variables ............................................................................ 18 3.3 Identification of Important Variables ................................................ 19 3.4 Cleaning, Transformations and Categorization of Variables ……....20
IV DATA MINING.......................................................................................... 24
4.1 Background .......................................................................................... 24 4.2 An Overview of the Data Mining Methodologies................................ 25 4.3 Regression ............................................................................................ 27 4.4 Decision Trees...................................................................................... 28 4.5 Association Rules ................................................................................. 31
V TRADITIONAL VIEWS OF INCIDENT DATABASES.......................... 34
5.1 Background .......................................................................................... 34 5.2 National Response Center, Harris County Fixed facilities Incidents .. 35 5.3 Data Analysis ....................................................................................... 36
VI DATA MINING RESULTS ....................................................................... 44
6.1 Decision Trees Results ......................................................................... 44 6.2 Association Rules Results .................................................................... 47 6.3 Modification of Probability of Failures of Equipments ....................... 48 6.4 Strengths and Weaknesses of Lift Values ............................................ 53

viii
CHAPTER Page
VII CONCLUSIONS AND FUTURE RESEARCH ........................................ 56
LITERATURE CITED ............................................................................................. 58
APPENDIX A ........................................................................................................... 62
VITA ......................................................................................................................... 72

ix
LIST OF FIGURES
Page
Figure 1. Incident pyramid ......................................................................................... 3
Figure 2. Steps to discover knowledge from databases ............................................. 25
Figure 3. Distribution of number of incidents by cause ............................................. 36
Figure 4. Distribution of number of incidents by the type of equipment involved.... 37
Figure 5. Distribution of number of incidents with incident cause and equipment
involved...................................................................................................... 38
Figure 6. Distribution of number of incidents by components of equipment ............ 39
Figure 7. Distribution of number of incidents for seals, gaskets and flanges failures 40
Figure 8. Distribution of number of incidents for the incident with cause ‘other’ .... 40
Figure 9. Distribution of number of incidents related to process unit upsets........... 42
Figure 10. Distribution of number of incidents by consequence ............................... 42
Figure 11. Decision tree for all the incidents leading to fires and explosions ........... 45
Figure 12. Decision tree for all the incidents leading to injuries ............................... 46
Figure 13. Distribution of number of incidents which require better monitoring...... 47
Figure 14. Lift values – part 1 .................................................................................... 49
Figure 15. Lift values – part 2 .................................................................................... 50
Figure 16. Lift values – part 3 .................................................................................... 51
Figure 17. Gasket lift values for butadiene, benzene, and oils................................... 54
Figure 18. Visual basic code ...................................................................................... 65
Figure 19. Main form ................................................................................................. 69
Figure 20. Equipment form ........................................................................................ 70
Figure 21. Component form ....................................................................................... 71

x
LIST OF TABLES
Page
Table 1. Contingency table......................................................................................... .29
Table 2. Average released amount of chemicals along with reportable quantities…...42
Table 3. Modified hose annual failure probabilities ....................................................53
Table 4. Modified gasket annual failure probabilities..................................................54

1
CHAPTER I
INTRODUCTION
1.1. Introduction
Incidents have been ubiquitous in the chemical process industry and can often be
attributed to different natures. It may be an incident with release of a small quantity of
chemical with no injury, property damage, or loss of production. On the other hand it
may be an incident like the unfortunate Bhopal tragedy, leading to the release of deadly
methyl iso-cyanate which resulted in the loss of 3000 innocent civilians and injuring at
least 100,000 people [1].
“An incident is defined as the sudden unintended release of or exposure to a hazardous
substance that results in or might reasonably have resulted in, deaths, injuries, significant
property or environmental damage, evacuation or sheltering in place [2].”
The same report that gives the above definition defines the hazardous material as given
below
“A hazardous material is defined as any chemical, including a petroleum product that is
toxic, reactive, flammable, asphyxiating, or that presents a potential hazard to people, the
environment, or property because of pressure or temperature [2].”
With an increase in the number and intensity of incidents since the 1970s, process safety
has gained a significant importance in everyday operations of the process industry [3].
Apart from the watershed event in Bhopal, some of the other major disasters the
chemical process industry has seen, are given below
This thesis follows the style of Process Safety Progress.
2
• Flixborough, England - It occurred in June 1974 with an explosion of thirty tons
of cyclohexane vapor leveling the entire facility. Twenty-eight people were killed
and thirty six injured in the facility. Another fifty-three civilians were injured [3].
• Pasadena, Texas – An explosion occurred in Texas in 1989 which resulted in
twenty three fatalities, three hundred and fourteen injuries and extensive capital
loss. The explosion followed the release of eighty five thousand pounds of
flammable mixture comprising of ethylene, isobutene, hexane, and hydrogen [3].
• Mexico City, Mexico – It occurred in 1984, at San Juan Ixhautepec, outside
Mexico City, Mexico. A series of BLEVEs (Boiling liquid expanding vapor
explosion) took place due to rupture of a pipeline at an LPG terminal facility.
The flammable vapor reached a flare stack and caused the first explosion. This
propagated more BLEVEs causing total disruption of the facility and death of
five hundred people [1].
• Seveso, Italy – It occurred in Seveso in 1976, a small town 15 miles from Milan,
Italy with a release of 3000 kg of chemicals. These chemicals included unknown
quantity of dioxin and 2 kgs of 2, 3, 7, 8- tetrachlorodibenzoparadioxin. The
incident did not cause any immediate casualties, however thirty-seven-thousand
people were exposed to chemical and roughly eighty-thousand animals died [1].
• Piper Alpha – This incident occurred on an offshore platform in 1988, at Piper
alpha oil production platform in the North Sea. It involved explosion of one of
the modules of the production deck. It led to a large pool of fire and smoke on
the adjacent modules and the accommodation modules. One hundred and sixty
seven people died in one of the worst accident that occurred on an offshore
platform [4].
1.2. Incident Pyramid
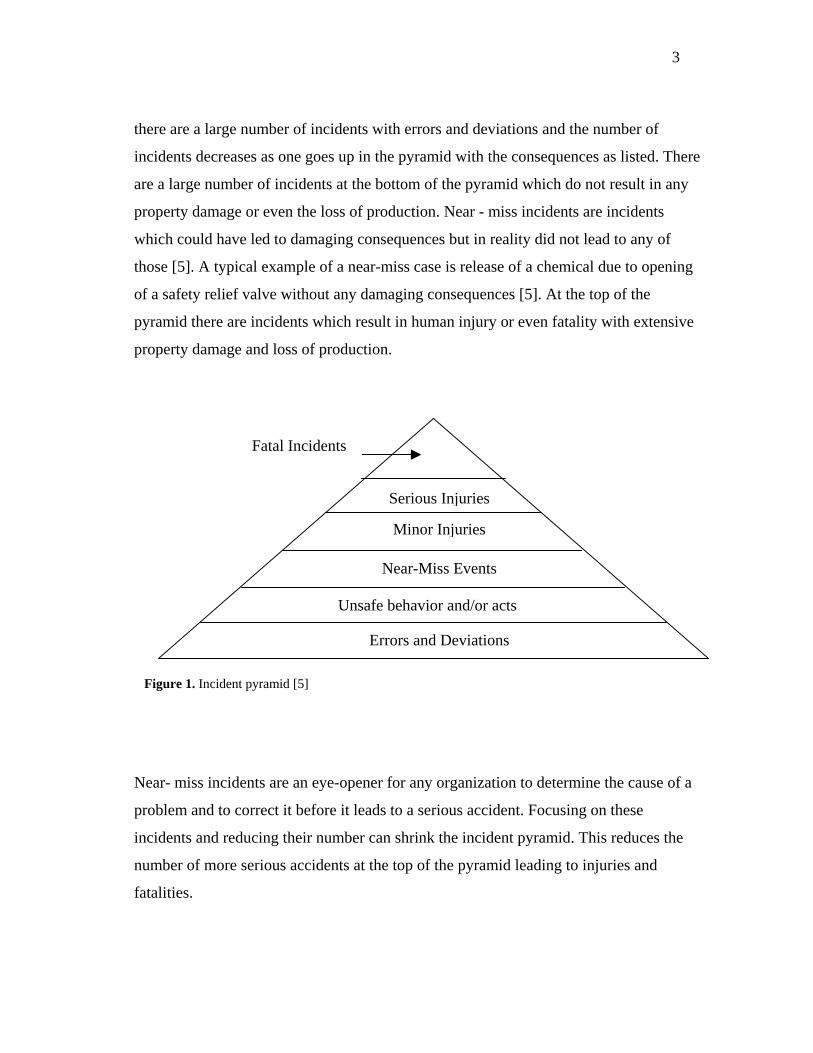
Incidents in the process industry normally follow a pattern in the form of a pyramid as
shown in Figure 1. The incident pyramid or safety pyramid typically demonstrates that
3
there are a large number of incidents with errors and deviations and the number of
incidents decreases as one goes up in the pyramid with the consequences as listed. There
are a large number of incidents at the bottom of the pyramid which do not result in any
property damage or even the loss of production. Near - miss incidents are incidents
which could have led to damaging consequences but in reality did not lead to any of
those [5]. A typical example of a near-miss case is release of a chemical due to opening
of a safety relief valve without any damaging consequences [5]. At the top of the
pyramid there are incidents which result in human injury or even fatality with extensive
property damage and loss of production.
Fatal Incidents
Serious Injuries
Minor Injuries
Near-Miss Events
Unsafe behavior and/or acts
Errors and Deviations
Figure 1. Incident pyramid [5]
Near- miss incidents are an eye-opener for any organization to determine the cause of a
problem and to correct it before it leads to a serious accident. Focusing on these
incidents and reducing their number can shrink the incident pyramid. This reduces the
number of more serious accidents at the top of the pyramid leading to injuries and
fatalities.

4
1.3. Process Safety Management
The Occupational Safety and Health Administration (OSHA), one of the government
organizations, is responsible for creating regulations and standards. OSHA conducts
inspections and issues citations when safety and health violations occur [3]. In 1992,
OSHA promulgated “Process Safety Management of Highly Hazardous Chemicals” [3].
Process safety management, one of the important concerns of OSHA, was developed
after the Bhopal incident in 1984. It is recognized nationwide as a regulation towards
preventing and reducing the number and magnitude of incidents [3].
The PSM standard consists of 14 major elements:
1. Employee Participation
2. Process Safety Information
3. Process Hazard Analysis
4. Operating Procedures
5. Training
6. Contractors
7. Pre-startup Safety Review
8. Mechanical Integrity
9. Hot Work Permit
10. Management of Change
11. Incident Investigation
12. Emergency Planning and Response
13. Audits
14. Trade Secrets

5
1.4. Incident Investigation
Incident investigation is one of the elements in PSM. Incident investigation follows a
problem solving methodology that includes accumulating all the information and
evidence about an incident, analyzing all the initial data collected, and documenting the
conclusions and findings [5].
The extent of investigation basically depends on the intensity of the incident.
Investigations done on the incidents can be a useful feedback to the industry personnel,
determining the root cause of the incident. Root cause of an incident can be related to
any of the elements of PSM as listed above [5].
The Center for Chemical Process Safety (CCPS) categorizes incident investigation into
three basic techniques:
1. Deductive
2. Inductive
3. Morphological
Deductive Technique
This approach involves finding the cause of the incident from general to specific by
proposing that a system has failed in a particular way [5]. Subsequently, an effort is
made to determine the specific components of the system and the organization which led
to that failure. Fault tree analysis is one of the methods followed in the deductive
technique. The deductive approach starts from the time the incident occurred and looks
backward in time to scrutinize earlier events [5].

6
Inductive Technique
This includes analyzing the incident from certain cases to finally coming up with
conclusions. This technique is executed by postulating that a starting event has occurred.
Further the consequences of the starting event are determined. Typical examples of
inductive techniques are Failure Mode and Effects Analysis (FMEA), Hazard and
Operability Study (HAZOP) and Event Tree Analysis (ETA).
Morphological Technique
This technique does not postulate any initiating event or subsequent events rather, it
depends heavily on the likely hazardous elements like operations, situations, past
deviations, and other factors from past experience of the individuals [5]. Some of the
commonly practiced techniques in this approach are Accident Evolution and Barrier
Technique and Work Safety Analysis.

7
CHAPTER II
INCIDENT DATABASES
2.1. Background
Proper documentation of the investigation of incidents is necessary. Incident databases
have been in existence for more than three decades now. These databases have come a
long way and have become more complex and powerful having incorporated the
relational nature in them [6]. The databases have enormous data in them which if
properly explored [7], can identify the greatest risk concerning certain chemicals, types
of equipment involved, and types of processes. This can further help to use the resources
of several Federal Agencies and the Emergency Responders more efficiently. It can also
help in better industrial safety performance assessment and identification of trends [8].
These databases help the design engineers and personnel involved with operations and
maintenance in a facility concentrate on issues on safety which are related to their
domain of work. These databases also bring to the notice of the upper management the
issues related to safety in their respective departments and they tend to be more receptive
towards those concerns.
A brief summary of the various incident databases is discussed in this chapter with the
major attributes of an incident that are mentioned in the particular database and the
strengths and weaknesses of the database.
2.2. National Fire Information Reporting System (NFIRS) Database
The US Fire Administration maintains the NFIRS database [9]. Around 40% of the
29,000 fire departments and about 6,900 emergency departments currently report to the

8
NFIRS database. 42 states are actively involved in this process. Events are reported in
which fire and emergency departments are involved. Departments report directly to the
system, or they can also report to the state fire marshal, from where it is then sent to
NFIRS.
Major attributes of an incident in this database are as follows:
• Date and time
• Location
• Chemical or any other material involved
• Consequences
• Estimation of damage
• Fire and the emergency department details
• Location categories
• Type of equipment involved
• Number of emergency personnel present at the site
Strengths and Weaknesses of the Database
The strengths of this database are that it is able to capture a large amount of data and has
a complete location code. It also includes information on damage estimation. The major
drawback with this database is that it fails to account for significant incidents and is not
comprehensive enough.
2.3. National Electronic Injuries Surveillance System (NEISS)
The U.S. Consumer Product Safety Commission (CPSC) operates this injury
surveillance system known as the National Electronic Injury Surveillance System
(NEISS) [10]. NEISS provides data on consumer product-related injuries in the U.S.
CPSC primarily concentrates on consumers from defective products. NEISS is highly
subjective towards injuries caused by mechanical failures. The data accumulation
9
process starts when a patient is admitted to the emergency department of a NEISS
hospital. An emergency department staff member brings forth information on the
occurrence of injury and enters that into record. At a later stage all emergency
department records for the day are reviewed and those that meet the current criteria for
inclusion in NEISS are selected. The CPSC extrapolates records collected from hospital
emergency rooms across the country. The CPSC also collects data from death
certificates, other regulatory agencies, news reports, and consumer reports.
Major attributes of an incident in this database are as follows:
• Date
• Incident description
• Product
• Consequences
Strengths and Weaknesses of the Database
One of the strong points of this database is experts collect the data .Text is available and
this database is statistically valid and can be extrapolated. One of the drawbacks with
this database is time and location of the incident is not mentioned which causes
duplications in certain cases.
2.4. News Clipping Database
The Mary Kay O’Connor Process Safety Center at Texas A&M University maintains a
News Clipping Database. This database is a collection of incidents from newspaper
databases.
Following is a list of sources:
1. “Pay-Per-View” Archival Services
• NewsLibrary.com

10
• NorthernLight.com
2. Free – Real Time sources
• AltaVista
The sources present a short description of the clipping. Cases that are of interest are
purchased or downloaded from the Web. For 1998 information was extracted from the
sources and entered into the News Clipping database. The free real-time sources gather
articles from a much larger number of sources but only retain information for about 30
days. Google searches more than 4,000 sources.
Following are the attributes of the incidents in the MKOPSC database:
• Name of facility, company, or dealer
• Address of the company or involved facility
• Date
• Fatalities, evacuations, injuries, hospitalizations, and sheltering
• Distribution of the consequences listed above among employees, contractors,
and general public
• Number of response units in the incident site
• Location of the release
• Nature of release
• Cause of the incident
• Material involved
• State of material released
Strengths and Weaknesses of the Database
The news clipping procedure has several strengths such as real-time information that can
be used to summarize incidents. The name of the local responder or correspondent is
often available. It allows direct contact that can be used to obtain investigative

11
information. Text description of the exact incident is available. Important incidents
receive appropriate attention. This database has near- miss incidents as well. At the same
time this database has its own shortcomings like information can be inaccurate or
ambiguous, some of the sources retain the information for a short period of time.
Extensive human resources are required for converting news clipping to electronic
format.
2.5. Hazardous Material Incidents Reporting System (HMIRS)
The Research and Special Programs Administration (RSPA) established the Hazardous
Materials Incident Reporting System (HMIRS) in 1971 to accomplish the requirements
of the federal hazardous materials transportation regulation [11].
All spills meeting the following criteria are reported to the RSPA:
• As a direct result of hazardous materials any of the following happens
A person gets killed or gets injured badly
Property damage exceeds $50,000
Evacuation of general public lasts for more than one hour
Major transport artery or facility is closed for more than one hour
Rerouting of an aircraft is required
• Fire, spillage, and contamination involving shipment of radioactive materials.
• There is a release of a pollutant in a water body exceeding 450 liters
• Any hazardous material is inadvertently released or any quantity of hazardous
waste is spilled during transportation.

12
All modes of transportation are included except pipeline and bulk marine transportation.
The incidents are to be reported by the carrier’s owner.
There are 114 fields in the database .Major attributes of an incident in the database are as
follows:
• Carriers’ information
• Carriers’ Damage
• Incident Cause
• Product
• Destination
• Fires, explosions, or other consequences
• Decontamination costs
• Loss of Product costs
Strengths and Weaknesses of the Database
Information is comprehensive as it is mandatory for the carriers to report within 30 days
and they are well-informed about their business. Data for the incidents where
consequences are below thresholds is not provided.
2.6. Integrated Pipeline Information System (IPIS)
IPIS is also called as Hazardous Liquid Accident Data and it contains releases of
petroleum and its byproducts that meet reporting requirements as outlined in 49 CFR
Parts 191, 192, and 195 [12]. The Hazardous Liquid Accident Data does not include
incidents involving natural gas. Incident reports are to be submitted to the Office of
Pipeline Safety by the accountable operators within 30 days of the incident to avoid
fines.

13
There are 62 fields in the database. Some of the important attributes of an incident in this
database are given below:
• Information on operator
• Date and time of incident
• Location
• Origin of release (e.g., valve, trap, pump, welding, girth, flange, seal, etc.)
• Pipeline production year
• Operating information
• Cause of incident
• Injuries and fatalities of employees and non-employees
• Total property damage involved
• Commodity classification
• Fire/explosion involved
• Corrosion information
Strengths and Weaknesses of the Database
Data accuracy is increased since the incidents are reported by industry people. Most of
the incidents that meet the reporting requirement are submitted. Incidents under the
reporting thresholds are not captured.
2.7. Incident Reporting Information System (IRIS) Database
IRIS contains data on reported releases from fixed facilities, marine, offshore facilities,
pipelines, and transportation vehicles. Many federal statutes require reporting of releases
to the National Response Center (NRC). The NRC basically comprises of Coast Guard
personnel who maintain a 24 hour per day, 7 days a week round the year telephone
watch. NRC personnel who keep a watch on the incidents record telephonic information
14
of incidents into the Incident Reporting Information System (IRIS) and further send the
reports to Federal On-Scene Coordinator (FOSC) [13]. Pipeline spills are reported under
the Hazardous Liquid Pipeline Safety Act.
Air releases are reported under:
• Clean Air Act
• Toxic Substances Control Act
• Federal Hazardous Materials Transportation Laws
• Resource Conservation and Recovery Act
NRC database has 10 tables with over 200 fields covering a gamut of attributes of
different incidents reporting all oil, chemical, radiological, biological, and etiological
discharges into the environment anywhere in the United States and its territories [13].
Some of the major attributes of an incident in the NRC database are given below:
• Date and time of an incident
• Nature of the incident
• A brief description of the incident
• Incident Cause
• Remedial Action taken
• Chemical released
• Amount released
• Evacuations
• Injuries
• Fatalities involved
In addition to all these fields for every incident in the database, NRC also has specific
information related to the nature of incident whether it is related to fixed facilities,
pipelines, and other transportation modes.

15
Strengths and Weaknesses of the Database
The law mandates that every incident of chemical release (above reportable quantity) to
the environment should be reported to the National Response Center [14]. NRC captures
all these incidents and the database is considered to be quite comprehensive. NRC
handles approximately 30,000 telephone calls each year, of which approximately 25,000
are unique incidents. Because this system contains initial reports, the information is
preliminary and therefore in many cases inaccurate or incomplete. There also is
duplicate reporting of incidents as updates to earlier reported incidents. In many cases,
drills are reported as real incidents.
2.8. RMP 5-year Accident History Database
The U.S. Environmental Protection Agency (EPA) is mainly responsible for maintaining
this database [15]. Risk Management Program covers stationary facilities that use, store,
or manufacture certain chemicals above a threshold quantity. Incidents at the RMP-
covered facilities that lead to fatalities, injuries, or environmental and property damage,
are required to be reported to the 5-year accident history database.
RMP facility must provide EPA with the following information for each incident:
• Date and time of an incident
• Approximate duration of the release
• Chemical released
• Quantity of the chemical released in pounds
• Source of release event and its type
• Weather conditions
• Onsite impacts
16
• Off-site impacts, if known
• Initiating event and other contributing factors, if known
• Off-site responders notification, if known
• Operational or process changes that resulted from investigation of the release
Strengths and Weaknesses of the Database
Records are accurate as reporters are skilled in incident investigation. The reports
mention the causes and consequences of the release and steps taken to prevent or
mitigate future incidents.
2.9. Hazardous Substances Emergency Events Surveillance (HSEES) Database
This database is maintained by the Agency for Toxic Substances and Disease Registry
(ATSDR) [16]. Sixteen state health departments actively participate with ATSDR in
developing and maintaining the Hazardous Substances Emergency Events Surveillance
(HSEES) system. The state health departments report an “event” if it meets the HSEES
definition, which is “any release(s) or threatened release(s) of at least one hazardous
substance” [15]. Data is entered by participating state health departments into a Web
application that makes possible for the ATSDR to access data for analysis.
Attributes of an incident in the database are as follows:
• Time and date of the incident
• Exact geographical location within the facility where the incident occurred
• Type of incident (fixed-facility or transportation-related)
• Inherent factors involved contributing to the release
• Environmental sampling and follow-up health activities
• Specific information on injured persons: age, sex, extent of injuries, distance
from spill, and group of people involved (employee, general public, responder,
student)

17
• Type of protective equipment used
• Remedial action
• Evacuation
• Land use and population information to estimate the number of persons present
in the area who were potentially exposed
• Type of contingency plan followed
Strengths and Weaknesses of the Database
ATSDR has a very active approach to incident data gathering that makes possible more
comprehensive and precise reporting. This database has details about the kind of injury
involved in an incident and personal protective equipment (PPE).Only 16 states are
currently participating in the ATSDR HSEES program.

18
CHAPTER III
THE CHALLENGES
3.1. Introduction
In this study a subset of the National Response Center’s database Incident Reporting and
Information System (IRIS) was selected. There are a large number of chemical process
industries including oil and gas, petrochemical, and pharmaceutical facilities located in
and around Houston, Texas. The high density of facilities combined with post - 9/11
terrorism concerns provided the impetus for studying the incidents from fixed facilities
in Harris County, Texas from 1990 to 2002 for the case study.
The challenges faced initially in selecting and transforming the variables presented in
this subset of the database are discussed in this chapter.
3.2. Types of Variables
Normally there are three types of variables (data types) usually seen in any kind of data
analysis as described below:
Continuous Variables
The value is numeric and is in a continuous form. For example, in the case of incident
databases, the amount of chemical released in an incident can be considered as a
continuous variable.

19
Ordinal Variables
The values can be numeric or character. They are discrete categorical values that have an
order. If the values are numbers, the order is the numeric magnitude. For example, the
date an incident occurred, or the time of the incident can be termed as ordinal data in
incident databases.
Nominal Variables
The values can be numeric or character but they do not have any implicit order among
themselves. For example: Type of equipment units in a process plant, different causes of
incidents, and different types of operations during which an incident occurred.
The significant variables in the NRC database which are of concern for incident
investigation are nominal in nature. For example: cause of an incident, type of
equipment failed, the failed component, even different groups or individual chemicals
involved in an incident, and many more. Proper transformations and methodologies are
required to extract knowledge from nominal data.
3.3. Identification of Important Variables
The important variables present in the NRC database which were used directly in data
analysis without any transformations were:
1. Cause of an incident
2. Date of the incident for trend analysis
3. Chemical released

20
Description of the incident and the remedial action taken was useful in determining the
type of equipment failure involved and the failed component. In limited number of cases
even the type of operation involved during the incident could be determined. Another
important variable mentioned in this database was whether a particular incident was
known to the facility from the very moment the incident initiated or the incident was
discovered by means of alarm systems or an employee noticing it. This is an important
variable from the perspective of knowing which types of equipments or processes
require better monitoring.
3.4. Cleaning, Transformations and Categorization of Variables
NRC database has its own shortcomings with repetitions, updates and drills being
mentioned as individual incidents. A large number of residential fires, spills by vehicles,
and incidents at private residences are mentioned as fixed facility incidents in this
database. A total of 7,718 incidents initially given in the database as fixed facility
incidents were considered and following were removed because of the reasons given
below:
• 182 were removed because they were updates to the earlier mentioned incidents
or repetitions
• 29 were removed, as they were drills
• 23 were removed, as the quantity of the chemical released was not even close to
the threshold and were in the units given as one drop etc.
• 219 were removed, as these were spills from motor vehicles at gas stations and
other incidents not at all related to chemical facilities
Finally, after cleaning the file, an auxiliary field was created in the database to
incorporate the type of equipment failure involved in an incident. An equipment
classification taxonomy similar to the one proposed by Chung et. al [17] was used after
incorporating changes required for the NRC database.

21
Following categories of type of equipment failure involved were created:
1. Storage Vessel – this includes all the storage tank, drum failures in the fixed
facilities
2. Pipes and Fittings – this includes all the line and valve failures and the failures of
fittings like flanges etc.
3. Rotating Equipment – this includes all the failures associated with pumps,
compressors, fans, blowers etc.
4. Process Vessels – this includes all the failures of vessels like reactors, converters
etc.
5. Heat Transfer Equipment – this includes failures associated with equipments like
heat exchangers, reboilers, condensers, vaporizers, evaporators, cooling towers
etc.
6. Flare Stack – this category was specifically introduced to include all the incidents
that occurred due to flare upsets, pilot flame of the flares going out etc.
7. Hoses – this category includes all the flexible pipes failures.
8. Relief Equipment – this category includes all the safety relief valves, rupture
disks, knockout drums, and header system failures
9. Separation Equipment – this category includes all the failures involving
scrubbers, strippers, absorbers, filters etc.
10. Electrical Equipment – this category includes all failures involving transformers
and generators.
11. Process Units – this category was created to incorporate the uncertainty in the
data given in the database. When the description of an incident is given as an
upset in the unit without specifying the particular equipment or its component
failure, this category was used.
12. Unclassified – this category was introduced to include particular failures
involving cranes, drilling equipment, and rail cars used in the fixed facility, as
well as hydraulic failures.

22
There were also a number of incidents in the database where the existing information
was not sufficient to finally conclude about the type of equipment failure involved. All
these cases were categorized as unknown.
NRC database has good information on the chemical released in a particular incident.
Certain chemical releases were grouped into categories as follows:
• releases of gasoline, diesel, transformer oil, fuel oil, and others were
categorized as an Oil Release
• releases of all types of acids were categorized as an Acid Release
• releases of chemicals into the process water above the reportable thresholds
were categorized as Contaminated Process Water
NRC database has cause of an incident categorized into the following categories:
1. Equipment Failure
2. Human Error
3. Natural phenomenon
4. Other
5. Dumping
6. Vandalism
7. Unknown
Here every category is self explanatory except for the one mentioned as ‘other’. After
exhaustive analysis of these incidents it was found that in most of these cases following
were the type of operation:
• Maintenance
• Startup and Shutdown operations
• Chemical Transfer operations

23
• Upsets in process units
The original database had amount of chemical released in different units of mass and
volume. These were all converted into uniform units of pounds.

24
CHAPTER IV
DATA MINING
4.1. Background
Mining literally means to extract and is used in the context of mining the earth to get the
valuable resources out of it [18]. Using the word data along with mining signifies
discovering knowledge associated with data which did not come to notice earlier. Data
Mining was initially developed to meet the needs of the business community for sales,
marketing, and customer support [19]. It is now used in many fields like the radio
astronomy, medicine, and industrial process control [19]. Data Mining is used to find
relations and regularities in the observed data [18]. Large amounts of data can now be
analyzed and worked on using linear and non-linear techniques of data mining.
Data mining developed due to the advancements in the following fields:
• Multivariate and Computational Statistics
• Computational Power
Data mining is one of the steps in the process of knowledge discovery from data. The
stepwise procedure is outlined in Figure 2. First, data has to be collected and can be from
different sources and of different forms. The next step is to make a data warehouse
where the original data is cleaned and the different components of data are integrated
into a single form which is suitable for data mining. Finally, based on the integrated
single form of data, important variables are selected, and those variables are transformed
into suitable forms on which data mining methodologies can be finally applied to
discover meaningful patterns which went unnoticed initially.

25
Databases (Excel files/Access
files/Flat files)
Cleaning and Integration
Patterns which give
knowledge
1.Selection and Transformation
Data Warehouse
Figure 2. Steps to discover knowledge from dat
4.2. An Overview of the Data Mining
Data mining consists of two sets of tech
• Classical techniques
• New generation techniques
Classical Techniques
These are the traditional techniques w
Histograms, bar graphs, pie diagrams
describe the data. The horizontal axis re
represents the absolute or relative freq
these there are certain standardized tech
2. Data Miningabases
Methodologies
niques:
hich include analyzing one variable at a time.
and frequencies are the most common tools to
presents the variable categories and vertical axis
uencies of the given variable [18]. Apart from
niques explained in the next page.

26
Regression
When two or more variables in data are considered simultaneously regression plays an
important role. Regression aims at finding correlation between two or more sets of
variables. This helps in revealing following important information in a dataset:
• Significant patterns in the database
• Chance of an event occurring
• Developing predictive modeling
Clustering
Cluster analysis is one of the methodologies used for grouping a given set of
observations. The objective of this methodology is to group the data into separate groups
that are heterogeneous from each other, while the group components are homogeneous
among themselves [18]. A simple example of clustering is the clustering performed in a
super mart to keep different kind of drinks. Separate grouping is done for all the juices,
aerated drinks, beer, wines etc., because they have similar characteristics.
Nearest Neighbor
This technique is a prediction technique. In this technique in order to predict a value for
a variable, one looks into other records with similar prediction values [20]. An example
that can be given in this case is a person’s income and his living standard can be
predicted by knowing the income of his neighbors.
New Generation Techniques
Incident databases contain variables which are mostly qualitative in nature. In order to
extract knowledge from this data, next generation techniques of data mining are more
helpful. Some of them are mentioned briefly below:

27
Decision Trees
Decision trees recursively partition the data, based on the set of variables defined by user
revealing major pockets of data which is extremely cumbersome process otherwise.
Decision trees help in the exploratory analysis of data. Knowing the subtleties of data in
consideration, one can transform the data accordingly to finally apply the right
methodology in order to have a good analysis.
Association Rules
Association rules have been used in market basket analysis. Market basket analysis gives
insight into the merchandise - which products tend to be purchased together and which
are most amenable to promotion [19]. A simple example of this is placement of goods in
a super mart, all the items which tend to be purchased in the same transaction are placed
nearby, in order to boost the sales. The items that are purchased in the same transaction
are determined from the large database maintained by the super marts.
Neural Network
Neural networks are used for prediction as well as descriptive analysis [20]. Neural
networks are able to fit observed data, especially where there is incomplete information.
They developed from the idea to emulate neurons in human brain. Efficient algorithms
have been developed and statistical software employs these algorithms to fit multi-
dimensional databases.
Three of the classical and next generation data mining methodologies are discussed in
this chapter in detail.
4.3. Regression
Regression models aim at finding correlation between the target and the independent

28
variables. Multiple non-linear regression models fit independent variables to the
dependent variable (the target) using forms similar to the form given in equation 1 [21]:
mn
mmnn XCXCXCCY •++•+•+= L2122110 (1)
where,
Y is the Target value
Xi is the ith independent variable
Ci is the coefficient of correlation of variable Xi, and
ni is the power value of variable Xi
Both, Ci and ni are quantified by the regression model.
The coefficient of determination R2 generally determines the quality of fit.
SSTSSER −=12 (2)
where
SSE is the sum of squares of errors 2
1∑
=
∧
⎟⎠⎞
⎜⎝⎛ −=
n
iii yySSE (3)
where y is is the observed value and is the predicted value of the target by the model ∧
y
n is the total number of observations and i is the ith observation.
SST given by equation 4 is the total corrected sum of squares, which represents the
variation in the target values that ideally would be explained by the model
(∑=
−=n
iii yySST
1
2) (4)
where y is the average of all the observed values of target.
R2 =1.0 represents perfect the fit.

29
4.4. Decision Trees
As already mentioned, Decision trees partition the data into groups that can reveal
inherent bias in the data, further it can be used for another set of analysis. The algorithm
used in JMPTM 5.0.1.a, a business unit of SAS Inc. software which has been extensively
used in this study, examines all the independent variables against the dependent variable
and the likelihood chi-square statistic is calculated for all the independent variables.
The variable giving the highest value of is used as the basis of partitioning the
data. This partitioning continues until the data has no more independent variables to be
partitioned. The likelihood-ratio test is a statistic for testing a null hypothesis H
2G2G
o against
an alternative hypothesis Ha. The larger the value of , the more evidence there is
against the null hypothesis [22].
2G
Considering a simple example of two variables X and Y which are categorical in nature,
X with I and Y with J levels, thereby having IJ possible combinations of classifications.
The actual database occurrences for levels I and J can be described in the form of a table
called a contingency table as having I rows for the categories of X and J columns for the
categories of Y. A contingency table has frequency counts of outcomes [22]. Table 1
having I rows and J columns is referred as an I-by-J (or I X J) contingency table [22].
Table 1. Contingency table.
X/Y J1 J2 J3 - - - - - Jn Total I1 n11 n12 n13 - - - - - n1n n1+
I2 n21 n22 n23 - - - - - n2n n2+
- - InTotal
- - nn1n+1
- - nn2n+2
- - - - - - - - - - - - - - - - - - - - nnn - - - - - - n+n
- - nn+n

30
where denotes the frequency of iijn th level of X and jth level of Y and the based on
the observations above is described below:
2G
)/log(21
2ijij
I
i
J
jij mnnG
∧
= =∑∑=
(5)
where is the estimated expected frequency under the assumption of independence
given below
ijm∧
ijm∧
nnn ji ++= (6)
where is the total frequency of i+in th row given by
∑=+j
iji nn (7)
and is the total frequency of jjn+th column given by
∑=+i
ijj nn (8)
where the subscript ‘+’ denotes the sum over the index it replaces.
Instead of frequencies if we have probabilities in a dataset, then the above equations are
valid. In addition to that following conditions also apply:
{ ijπ } is the joint distribution of X and Y. The marginal distributions { +iπ } are the row
totals for row variables and { j+π } are the column totals for column variables which
satisfy [22]:
∑ ∑ ∑ ∑ === ++ 0.1ijjijjii πππ (9)
The above definitions are for a set of two variables. This statistic is examined for all the
independent variables against the dependent variable at every step of data partitioning.

31
4.5. Association Rules
As mentioned earlier, association rules are used to increase sales. They aim identifying
associations among products purchased by the same customer. For example, it is
generally seen that customers buying cereal are likely to buy milk as well. A formal
presentation of the rule and the parameters of confidence, support, and lift which
quantify a rule is given below.
The general form of the rule is as follows:
“IF event X occurs THEN event Y occurs as well, in M% of the times,
and this pattern occurs in N% of all events in the dataset”
where,
M is the Confidence, and
N is the Support.
Support represents the probability that both events X and Y occurred simultaneously in
the dataset. This value is calculated as presented in equation 10:
dataset in the events ofnumber Total
usly simultaneo occured Y and X eventsboth dataset in the timesofNumber S =upport
(10) ( YXP ∩= )
Confidence presents the probability that event Y will occur given that event X has
already occurred. This value is calculated as presented in equation 11:
( )XPYXPonfidence )(
dataset in the events ofnumber Totaloccured has Xin which events ofNumber
Support C ∩=
⎟⎠⎞
⎜⎝⎛
= (11)

32
Confidence is the conditional probability of event Y, given that event X has already
occurred [21].
The Lift value is the ratio of the probability that Y will occur when X occurs to the
independent probability that Y will occur. Lift is calculated as follows:
( )( ) )(
dataset in the events ofnumber Totaloccured Yevent inwhich events ofNumber
ConfidenceYPXP
YXPLift•∩
=⎟⎠⎞
⎜⎝⎛
= (12)
The cereal and milk example can be used to emphasize the meaning of Lift. The value of
Lift is the ratio between the probability that cereal will be purchased when milk is
purchased, to the general probability that cereal will be purchased. A Lift value of one
means that there is no difference between the probabilities that cereal will be purchased
when milk is purchased, to the general probability that cereal will be purchased (no
association). A Lift value that is greater than one means that when cereal is purchased it
is more likely to be purchased with milk (positive association). However, a lift value of
less than one means that if cereal is purchased it is less likely that milk will be purchased
too.
A proper presentation for the explanation of values of Lift is given below [18]:
Lift>1: There exists a positive association between event X and event Y of the rule.
Practically, if Lift =2, it is twice as likely that event Y will occur when event X occurs
than the likelihood that event Y will occur independently.
Lift =1: There is no association between occurrence of events X and Y.
Practically, if Lift=1, it is neither likely nor unlikely that event Y will occur when event
X occurs, than the likelihood that event Y will occur. In this case, X and Y are
independent events.

33
Lift<1: There exists a negative association between event X and event Y of the rule.
Practically, if Lift<1 it is less unlikely that event Y will occur upon occurrence of event
X, than the likelihood that event Y will occur.
Lift=0: Event X and event Y of the rule never occur together.
It means event Y will never occur simultaneously with event X (X and Y are mutually
exclusive [21]).

34
CHAPTER V
TRADITIONAL VIEWS OF INCIDENT DATBASES
5.1. Background
Pattern identification, or in other words finding repeated situations in incident databases,
has been done in the past using various techniques. This can serve as a powerful risk
management tool. Univariate analysis of finding frequency and relative frequencies of
certain variables like type of operation involved in an incident [23] , type of chemical
facility involved [24] as well as others has been done in the past. Bar graphs, pie
diagrams and frequencies are the most common ways to represent the distribution of a
particular attribute of an incident. Trend analysis is also done to identify how the
incident cause, types of processes, types of chemical releases, and types of equipment
failures are distributed over a period of time. It also helps to identify any rise or fall in
the number of incidents in certain periods of time or even with certain regulations
coming into effect.
Individual companies also maintain their own records incorporating company’s internal
safety program and to satisfy inspectors [25]. Complete documentation is done for the
past incidents that have led to injuries and fatalities. In other cases, several organizations
including Federal agencies collect data on industrial incidents. However, they all vary in
their procedures for data collection, maintaining it and finally analyzing it to achieve
their specific objectives. In 2002, The Mary Kay O’Connor Process Safety Center at
Texas A&M University published a report on the feasibility of using federal incident
databases to measure and improve chemical safety [26].
Macro analysis done by McIntosh et. al [27] reveals inherently weak systems in their
incident data and help risk managers to concentrate resources on those systems. This

35
study used pareto technique to focus attention to limited number of chemical releases
and scenarios that were causing most of the incidents in their incident data. A
comprehensive study was done by Mannan et. al [7] on how to use incident databases
more efficiently.
5.2. National Response Center, Harris County Fixed Facilities Incidents
As mentioned earlier, in this study Harris county data consisting of fixed facility
incidents from 1990 to 2002 was selected. US federal regulations require that every
incident of chemical release (above reportable quantity) should be reported to the
National Response Center [1]. In spite of this, NRC data is inaccurate, as it does not
include all the incidents occurring at the fixed facilities. In fact the number reported to
NRC is much less than the actual number of incidents, primarily because the incidents
occurring at small and medium- sized enterprises (SME) do not get reported to NRC.
This is due to the fact, that the SMEs do not have sufficient resources and trained
personnel having a sound process safety background, to report the incidents. The lack of
safety knowledge in the personnel working at these enterprises can be attributed to the
reality that a major portion of these facilities are not covered by the Occupational Safety
and Health Administration’s process safety program (PSM) regulations.
Contrary to all the reasoning given above, NRC data for Harris county for fixed facility
incidents is reasonable accurate. This is primarily because, the information about an
incident is collected and reported by competent personnel at chemical, refinery, and
petrochemical facilities, which are large businesses and covered by PSM. Even though,
the information is collected very close to the time of incident, cause of the incident,
equipment failed, chemical released and a brief discussion of the incident and the
remedial actions taken are given which gives an excellent opportunity to analyze the
incidents occurring in Harris County.

36
NRC data used in this study was first looked at from a traditional point of view.
Univariate analysis was done on various attributes like incident cause, type of equipment
failure involved, type of operation, kind of chemical released etc. using bar graphs. This
helped in exploratory analysis of the data and further data mining methodologies were
applied to reveal interesting patterns.
5.3. Data Analysis
Figure 3 represents distribution of the number of incidents based on the cause of
incidents in Harris County from 1990 to 2002. From the figure it can be said that the
majority of incidents occurred due to equipment failure. A large number of incidents had
insufficient information and cause of the incident could not be concluded. Moreover, the
information was also inadequate to categorize further the broad categories of cause
involved, shown in figure 3.
0
1000
2000
3000
4000
5000
Equi
pmen
tFa
ilure
Unk
now
n
Hum
an E
rror
Oth
er
Nat
ural
Phen
omen
on
Dum
ping
Vand
alis
m
Figure 3. Distribution of number of incidents by cause (Source: NRC, Harris County, 1990-2002)
Patterns were also found in the database on the basis of type of equipment failure
involved in incidents as given in Figure 4. It can be concluded that the most failed

37
equipment involved storage vessels, pipes and fittings, rotating equipment, etc. Electrical
equipment and the separation equipment failures were least involved in incidents.
0
200
400
600
800
1000
1200
1400S
tora
ge V
esse
ls
Pip
es &
Fitt
ings
Rot
atin
gE
quip
men
t
Pro
cess
Uni
ts
Pro
cess
Ves
sels
Hea
t Tra
nsfe
rE
quip
men
t
Unk
now
n
Flar
e S
tack
Flex
ible
Pip
es(H
oses
)
Rel
ief E
quip
men
t
Unc
lass
ified
Sep
arat
ion
Equ
ipm
ent
Ele
ctric
alE
quip
men
t
Figure 4. Distribution of number of incidents by the type of equipment involved
(Source: NRC, Harris County, 1990-2002)
A distribution was worked out to find the particular incident causes that were associated
with certain equipment failures in Figure 5. This distribution revealed that certain
incident causes were associated with certain type of equipment failures more than others.
For example, human error was mostly associated with equipment failures like storage
vessels, pipes and fittings, process vessels, flexible pipes and process units. Similarly,
natural phenomenon like heavy rainfall, lightning, storm and other inclement weather
conditions resulted in storage vessel, separation equipment, stack and rotating equipment
failures.

0
200
400
600
800
1000
1200
1400St
orag
eVe
ssel
s
Pipe
s &
Fitti
ngs
Rot
atin
gEq
uipm
ent
Proc
ess
Uni
ts
Proc
ess
Vess
els
Hea
t Tra
nsfe
rEq
uipm
ent
Flar
e St
ack
Flex
ible
Pipe
s(H
oses
)
Rel
ief
Equi
pmen
t
Sepa
ratio
nEq
uipm
ent
Elec
trica
lEq
uipm
ent
Unknown
Other
NaturalPhenomenonHuman Error
EquipmentFailure
Figure 5. Distribution of number of incidents with incident cause and equipment involved (Source: NRC, Harris County, 1990-2002)
38

39
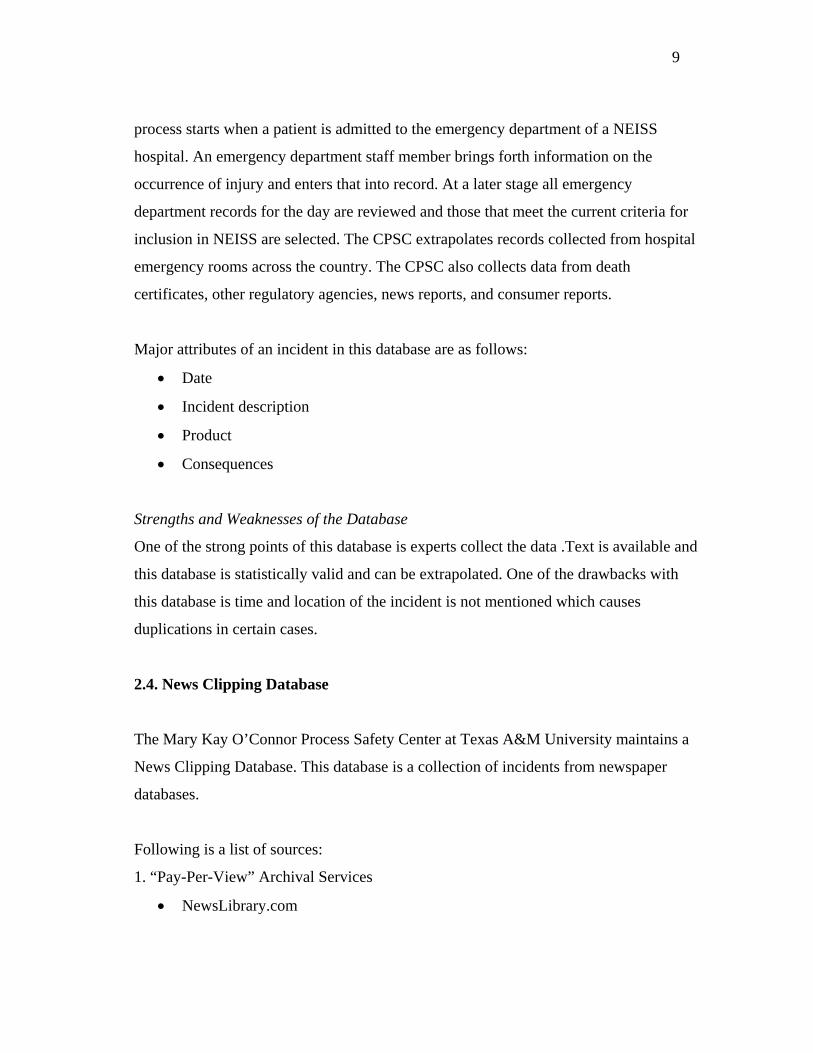
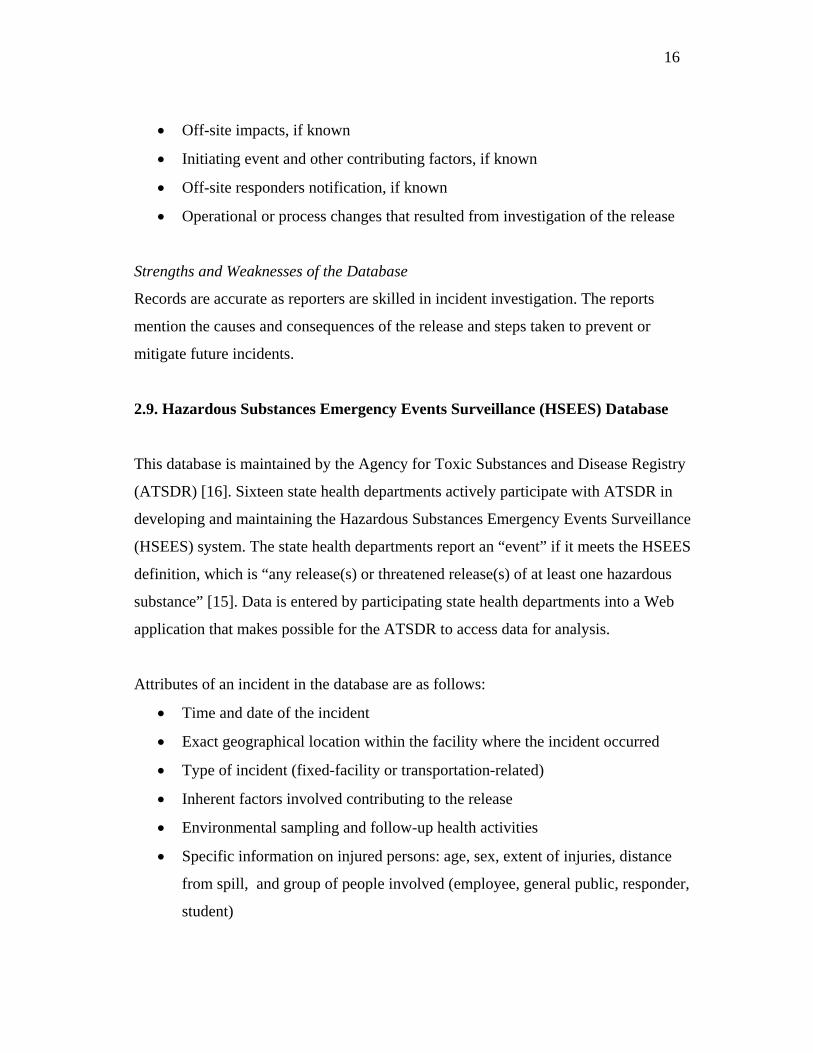
In Figure 6, a distribution of the number of incidents was done for incidents which had
sufficient information about the particular component failures associated with
equipments. The components mainly examined were seals, gaskets and flanges. Out of
the 7,265 incidents 572 occurred due to failures of seals, gaskets and flanges.
0
20
40
60
80
100
120
140
160
180
Pip
es &
Fitt
ings
Rot
atin
gE
quip
men
t
Pro
cess
Ves
sels
Sto
rage
Ves
sels
Pro
cess
Uni
ts
Hea
t Tra
nsfe
rE
quip
men
t
Flex
ible
Pip
es(H
oses
)
Sep
arat
ion
Equ
ipm
ent
Rel
ief
Equ
ipm
ent
Unc
lass
ified
Unk
now
n
Flar
e S
tack
Ele
ctric
alE
quip
men
t
Figure 6. Distribution of number of incidents by components of equipment
(Source: NRC, Harris County, 1990-2002)
For further analysis, all the flange failures were grouped into a separate category as the primary
function of flanges is different from seals and gaskets. Selected categories of equipments
involving majority of incidents were examined and the distribution was found as shown in
Figure 7. This figure illustrates that a major number of incidents involving seal and gasket
failures were associated with rotating equipment, pipe and fitting, process vessel, and storage
vessel but not other equipments.
40
0
50
100
150
200
Rot
atin
gEq
uipm
ent
Hea
t Tra
nsfe
r
Hos
e
Proc
ess
Uni
t
Proc
ess
Vess
el
Rel
ief
Equi
pmen
t
Sepa
ratio
nEq
uipm
ent
Stor
age
Vess
el
Pipe
s&Fi
tting
s
Flanges
Seals&Gaskets
Figure 7. Distribution of number of incidents for seals, gaskets and flanges failures.
(Source: NRC, Harris County, 1990-2002)
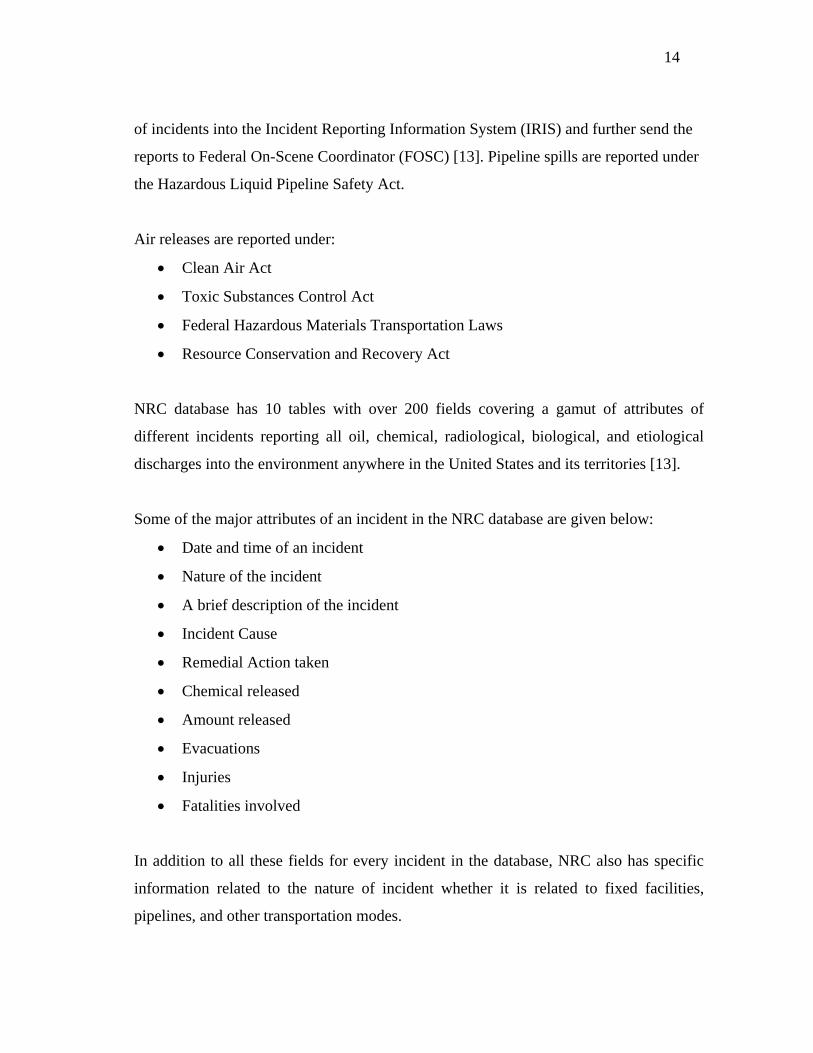
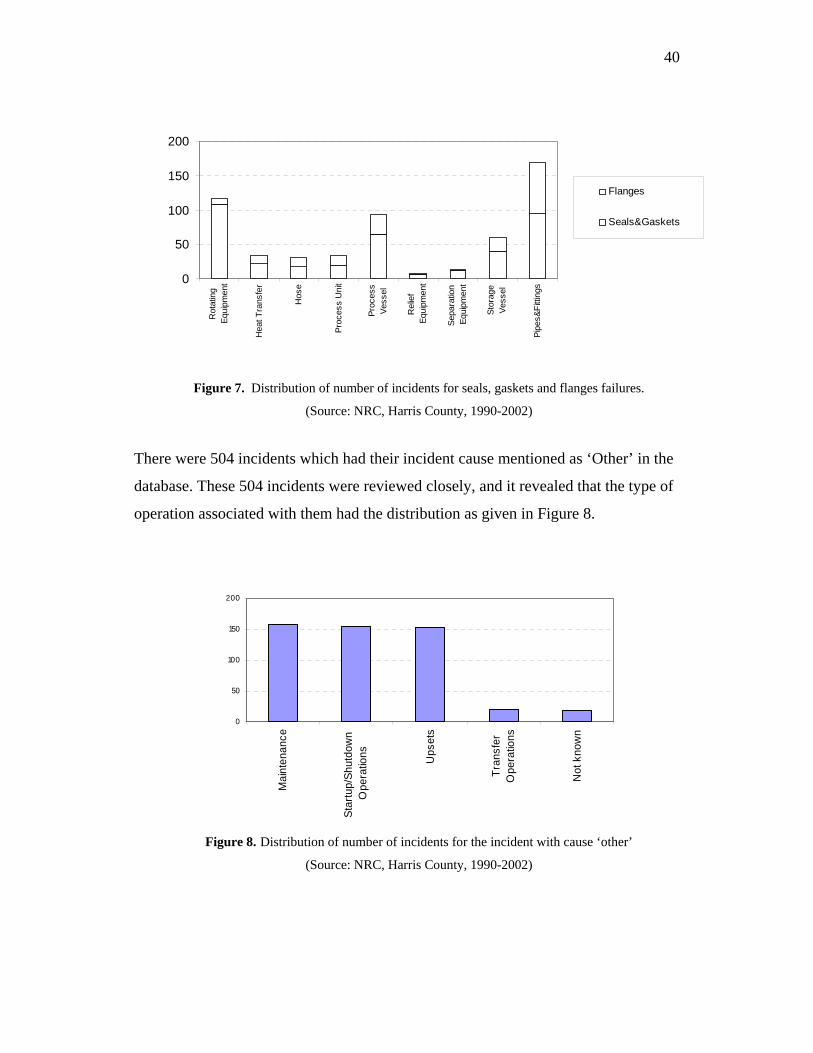
There were 504 incidents which had their incident cause mentioned as ‘Other’ in the
database. These 504 incidents were reviewed closely, and it revealed that the type of
operation associated with them had the distribution as given in Figure 8.
0
50
100
150
200
Mai
nten
ance
Star
tup/
Shut
dow
nO
pera
tions Ups
ets
Tran
sfer
Ope
ratio
ns
Not
kno
wn
Figure 8. Distribution of number of incidents for the incident with cause ‘other’
(Source: NRC, Harris County, 1990-2002)

41
Another pocket of data that was closely looked at was the incidents related to process
units. There were a total of 800 incidents in this category. There was not sufficient
information on these incidents, but 27% of these incidents were identified to be
occurring in 3 major units of refinery processes as given below:
• Sulfur Recovery Units – this included releases of hydrogen sulfide and sulfur
oxides
• Fluidized Catalytic Cracking Units – this included releases of nitrogen dioxide
and nitrogen trioxide
• Coking Units – this included releases of hydrogen sulfide and sulfur oxides
A distribution of the number of incidents in the three units of refinery processes is given
in Figure 9.
Unkown73%
Fluidized Catalytic Cracking Units
8%
Coking Units4%
Sulfur Recovery Units15%
Figure 9. Distribution of number of incidents related to process unit upsets.
(Source: NRC, Harris County, 1990-2002)
Nine chemicals most released into the air in all these incidents in the database were
analyzed, and an average amount of each chemical released from those incidents is given
in Table 2 along with the reportable quantities of these chemicals as given by the code of
42
federal regulations [14]. From a total of 7,265 incidents in the database, the amount of
chemical released into the environment was not mentioned in 2,097 incidents.
Table 2: Average released amount of chemicals along with reportable quantities
(Source: NRC, Harris County, 1990-2002)
Chemical released Amount
(lbs) Reportable
Quantities (lbs) Benzene 4765 10
Butadiene 2333 10 Ammonia 7896 100 Chlorine 864 10 Xylene 2899 100
Hydrogen Sulfide 162 10 Acrolein 5.4 1
Nitrogen Oxides 425 10 Sulfur Oxides 3842 100
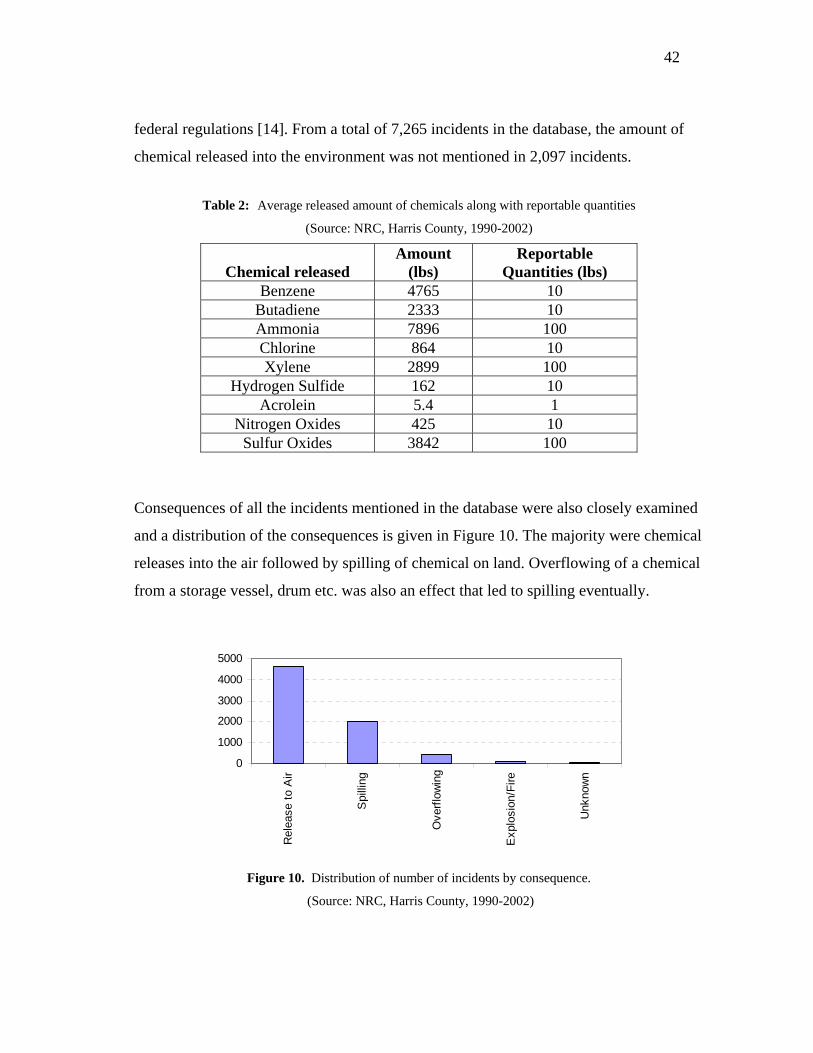
Consequences of all the incidents mentioned in the database were also closely examined
and a distribution of the consequences is given in Figure 10. The majority were chemical
releases into the air followed by spilling of chemical on land. Overflowing of a chemical
from a storage vessel, drum etc. was also an effect that led to spilling eventually.
0
1000
2000
3000
4000
5000
Rel
ease
to A
ir
Spi
lling
Ove
rflow
ing
Exp
losi
on/F
ire
Unk
now
n
Figure 10. Distribution of number of incidents by consequence.
(Source: NRC, Harris County, 1990-2002)

43
All the analysis done so far in this study is based on finding the distribution of incidents,
taking one of the attributes of an incident at a time into consideration. Data mining helps
further to relate two or more attributes at a time, and quantifies the findings which can be
used in a different arena.

44
CHAPTER VI
DATA MINING RESULTS
Data mining methodologies of decision rees and association rules were applied to the
NRC, harris county, 1990 to 2002 incidents. A detailed description of the results, and
further their applicability to modification of probabilities of failures of equipments is
discussed in this chapter.
6.1. Decision Trees Results
Decision trees were applied to some of the attributes of NRC incident database.
Considering incidents with certain consequences at a time and working backwards to
find the incident cause and kind of equipment failure associated with those incidents,
complete tree structures were created. These tree structures give the exact number of
incidents in each category. A total of 143 incidents involved fires and explosions in the
database. Consequence of the incident was taken as the primary variable and the incident
cause and the type of equipment failure involved as the dependent variables. Decision
tree algorithm worked out a tree as given in Figure 11, giving a complete distribution of
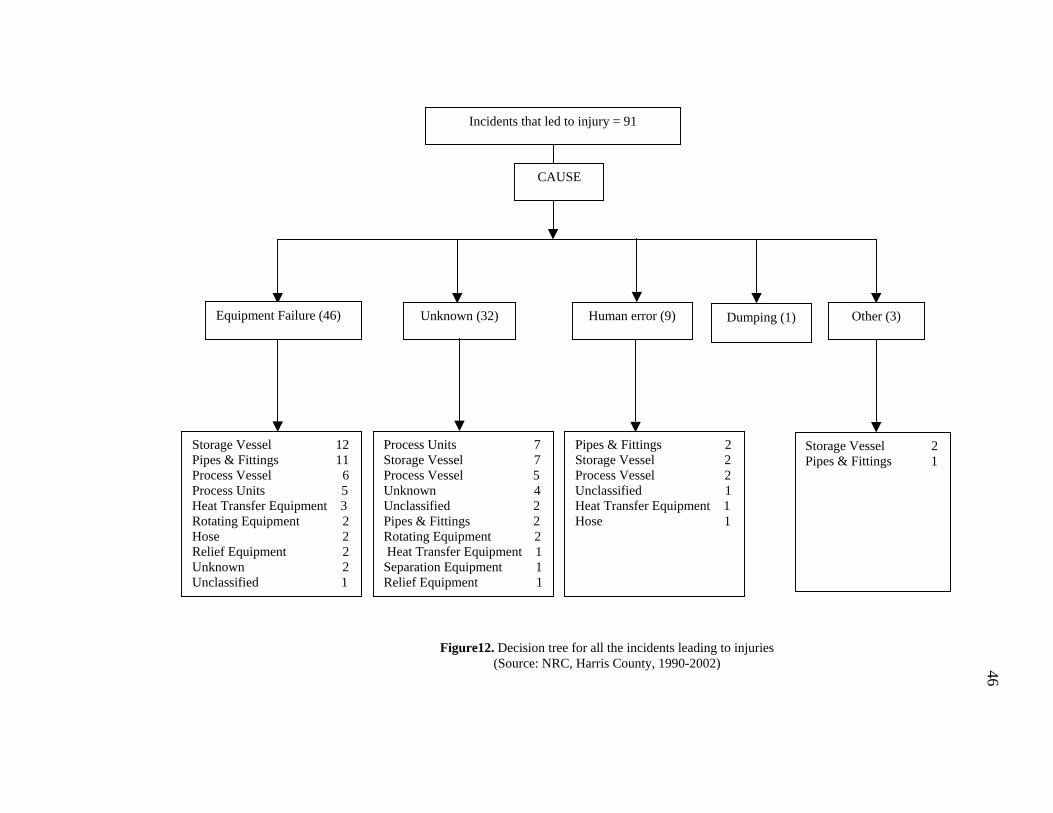
incidents leading to fires and explosions. Similarly, a decision tree was created for all the
91 incidents which led to injury in the database (Figure 12).
Another attribute of the incident that was looked at was the variable, which gave the
information about initiation of an incident, whether it was known to the facility from the
very moment it started or it came to its notice after sometime. This variable was taken as
the primary variable and type of equipment failure involved as the dependent variable.
The decision tree algorithm gave the distribution of incidents that came to the attention
of the facility later on, as given in Figure 13.

45
Vandalism (1)
Process Units 18Storage Vessel 14 Unknown 11 Heat Transfer Equipment 7Process Vessel 7Unclassified 7 Rotating Equipment 3Flare Stack 2Separation Equipment 2Relief Equipment 1Pipes & Fittings 1
Storage Vessel 6 Pipes & Fittings 2Unknown 1 Unclassified 1
Unknown (73) Other (10)
Process Units 10 Heat Transfer Equipment 10Storage Vessel 9 Process Vessel 6Pipes & Fittings 6 Rotating Equipment 5Electrical Equipment 4Flare Stack 1Relief Equipment 1Unknown 1
Equipment Failure (53)
CAUSE
Incidents with Fire/Explosion = 143
Figure 11. Decision tree for all the incidents leading to fires and explosions (Source: NRC, Harris County, 1990-2002)
46
Figure12. Decision tree for all the incidents leading to injuries (Source: NRC, Harris County, 1990-2002)
Equipment Failure (46)
Storage Vessel 12Pipes & Fittings 11Process Vessel 6Process Units 5Heat Transfer Equipment 3Rotating Equipment 2Hose 2Relief Equipment 2Unknown 2 Unclassified 1
Unknown (32) Human error (9) Dumping (1)
Process Units 7Storage Vessel 7Process Vessel 5Unknown 4 Unclassified 2Pipes & Fittings 2Rotating Equipment 2 Heat Transfer Equipment 1Separation Equipment 1Relief Equipment 1
Storage Vessel 2 Pipes & Fittings 1
Other (3)
Pipes & Fittings 2 Storage Vessel 2Process Vessel 2Unclassified 1Heat Transfer Equipment 1Hose 1
CAUSE
Incidents that led to injury = 91

47
The distribution given in Figure 13 emphasizes that the type of equipments having
higher number of incidents require better monitoring either through operators or
automated systems.
0
50
100
150
200
250
300
350
400
450
500
Sto
rage
Ves
sels
Pip
es &
Fitt
ings
Hea
t Tra
nsfe
rE
quip
men
t
Unk
now
n
Pro
cess
Ves
sels
Pro
cess
Uni
ts
Rot
atin
gE
quip
men
t
Unc
lass
ified
Flex
ible
Pip
es(H
oses
)
Flar
e S
tack
Sep
arat
ion
Equ
ipm
ent
Rel
ief
Equ
ipm
ent
Ele
ctric
alE
quip
men
t
Figure 13. Distribution of number of incidents which require better monitoring
(Source: NRC, Harris County, 1990-2002).
6.2. Association Rules Results
Association rules were applied to type of equipment failure involved and twelve of the
chemicals that were involved in the majority of the incidents. Figures 14, 15, and 16
present the lift values of these combinations.

48
Figure 15 reveals that the lift value of acrolein releases involving process vessel failures
is around 3.5. That means the probability that a process vessel will be involved in an
acrolein incident is 3.5 times higher than the individual probability of process vessel
incidents in the database.
Similarly, the lift value of hose incidents in Figure 16 points out that the probability of
hose incidents, in which oil is released, is 4.84 times higher than the individual
probability of hose incidents in the database. Figures 14, 15 and 16 give indications of
the vulnerability of types of equipment to the chemical involved in the process.
6.3. Modification of Probability of Failures of Equipments
The following paragraphs outline how the lift values can be used to modify the annual
probability of failures of equipments.
Background
The expression for probability of failure of equipment or in other words reliability is
given in equation 13 [28]:
( )⎥⎦
⎤⎢⎣
⎡ −+−−=−= ∑
∞
=
−
2 !)1(111)(
n
nnt
nttefP λλλ (13)
where,
P (f) is the failure probability
λ is the failure rate [failure/year]
t is the time of exposure
n is an auxiliary variable

0.00
0.50
1.00
1.50
2.00
2.50
3.00
3.50
4.00
4.50
ELE
CTR
ICA
L E
QU
IPM
EN
T
PU
MP
S/C
CO
MP
RE
SS
OR
S
FLA
RE
STA
CK
HE
AT
TRA
NS
FER
EQ
UIP
ME
NT
HO
SE
S
PR
OC
ES
S U
NIT
S
PR
OC
ES
S V
ES
SE
LS
SE
PA
RA
TIO
NE
QU
IPM
EN
T
STO
RA
GE
VE
SS
ELS
PIP
ES
& F
ITTI
NG
S
RE
LIE
F E
QU
IPM
EN
T
LIFT
butadiene benzene Hydrogen sulfide NOx SOx
Figure 14. Lift values – part 1(Source: NRC, Harris County, 1990-2002)
49

0.00
0.50
1.00
1.50
2.00
2.50
3.00
3.50
4.00EL
ECTR
ICAL
EQ
UIP
MEN
T
PUM
PS/C
CO
MPR
ESSO
RS
FLAR
ESTA
CK
HEA
T TR
ANSF
EREQ
UIP
MEN
T
HO
SES
PRO
CES
S U
NIT
S
PRO
CES
S VE
SSEL
S
SEPA
RAT
ION
EQU
IPM
ENT
STO
RAG
E VE
SSEL
S
PIPE
S &
FITT
ING
S
REL
IEF
EQU
IPM
ENT
LIF T
xylene Acrolein Ammonia Chlorine
z
Figure 15. Lift values – part 2 (Source: NRC, Harris County, 1990-2002)
50

0.00
1.00
2.00
3.00
4.00
5.00
6.00
ELEC
TRIC
AL E
QU
IPM
ENT
PUM
PS/C
CO
MPR
ESSO
RS
FLAR
ESTA
CK
HEA
T TR
ANSF
EREQ
UIP
MEN
T
HO
SES
PRO
CES
S U
NIT
S
PRO
CES
S VE
SSEL
S
SEPA
RAT
ION
EQU
IPM
ENT
STO
RAG
E VE
SSEL
S
PIPE
S &
FITT
ING
S
REL
IEF
EQU
IPM
ENT
LIFT
ACIDS OILS PROCESS WATER
Figure 16. Lift values – part 3 (Source: NRC, Harris County, 1990-2002)
51

52
When λ<<1, equation 13 is approximately equivalent to the following equation:
( ) tn
ttn
nn
λλλ ≅⎥⎥⎦
⎤
⎢⎢⎣
⎡ −+−− ∑
∞
=2 !()111 (14)
The probability of failure can therefore be estimated as given in equation 15. Here λ
represents the annual probability of failure.
tfP λ=)( (15)
With the limitation given in equation 14, lift values can be used to modify annual failure
probabilities of equipments. The annual probability in these cases is represented by λ
(failure rate). In literature the majority of failure rates consist of averaged data.
Multiplying failure rates by lift values will produce an annual failure probability of
equipment that also takes into account the chemical used in the process.
The following two cases illustrate how the modification is done on the annual failure
probabilities of equipments.
Case-1
A hose failure rate of 4 [failures/106 hours] is recommended by Green et. al [29], which
is equivalent to 0.035 [failure/year]. For a set of chemicals, annual failure probabilities
for hose are given in Table 3. The modified annual failure probability was calculated by
multiplying the failure rate with the lift value.
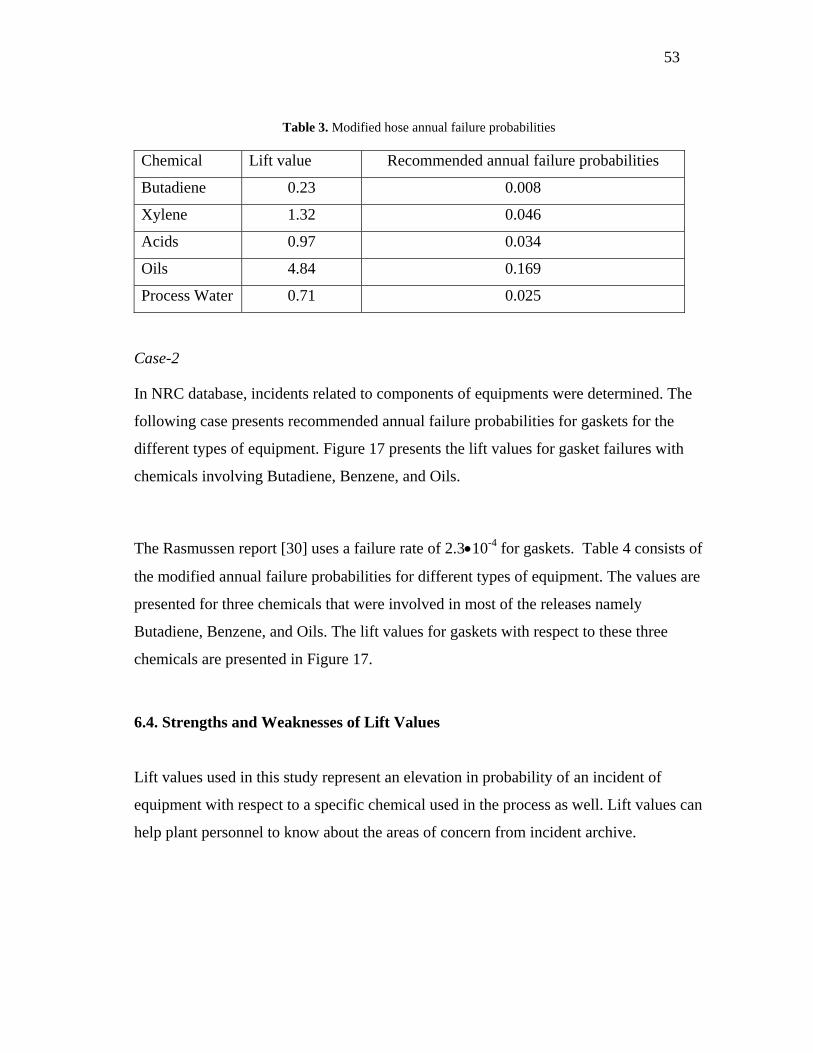
53
Table 3. Modified hose annual failure probabilities
Chemical Lift value Recommended annual failure probabilities
Butadiene 0.23 0.008
Xylene 1.32 0.046
Acids 0.97 0.034
Oils 4.84 0.169
Process Water 0.71 0.025
Case-2
In NRC database, incidents related to components of equipments were determined. The
following case presents recommended annual failure probabilities for gaskets for the
different types of equipment. Figure 17 presents the lift values for gasket failures with
chemicals involving Butadiene, Benzene, and Oils.
The Rasmussen report [30] uses a failure rate of 2.3•10-4 for gaskets. Table 4 consists of
the modified annual failure probabilities for different types of equipment. The values are
presented for three chemicals that were involved in most of the releases namely
Butadiene, Benzene, and Oils. The lift values for gaskets with respect to these three
chemicals are presented in Figure 17.
6.4. Strengths and Weaknesses of Lift Values
Lift values used in this study represent an elevation in probability of an incident of
equipment with respect to a specific chemical used in the process as well. Lift values can
help plant personnel to know about the areas of concern from incident archive.

54
00.5
11.5
22.5
33.5
44.5
5
ELEC
TRIC
AL E
QU
IPM
ENT
PUM
PS/C
CO
MPR
ESSO
RS
FLAR
ESTA
CK
HEA
T TR
ANSF
EREQ
UIP
MEN
T
HO
SES
PRO
CES
S U
NIT
S
PRO
CES
S VE
SSEL
S
SEPA
RAT
ION
EQU
IPM
ENT
STO
RAG
E VE
SSEL
S
PIPE
S &
FITT
ING
S
REL
IEF
EQU
IPM
ENT
LIFT
BUTADIENE BENZENE OILS
Figure 17: Gasket lift values for butadiene, benzene, and oils
(Source: NRC, Harris County, 1990-2002)
Table 4. Modified gasket annual failure probabilities
Equipment Type Butadiene[*10-4] Benzene [*10-4] Oils [*10-4] Electrical Equipment 0 0.04 4.3 Pumps and Compressors 3.6 2.5 1.6 Flare Stack 3.7 2.9 0.02 Heat Transfer Equipment 3.2 4.7 0.05 Hoses 0.5 0.04 11.1 Process Units 2.7 2.6 0.02 Process Vessels 4.3 3.5 0.04 Separation Equipment 0.9 1.3 3.5 Storage Vessels 1.3 1.9 5.1 Pipes & Fittings 1.5 2.2 3.0 Relief Equipment 5.1 2.3 0.04

55
On the other hand, in order to validate the results, it is necessary to verify that the values
are based on a sufficient number of incidents. In the Harris County dataset, there are just
six incidents present for the chemical acrylonitrile. Therefore, the lift values calculated
on this basis will be misleading. The lift values calculated here are based on the fixed
facility incidents in Harris County, US, for the period 1990 to 2002, given in the NRC
database. More accurate values can be calculated by taking into account all the fixed
facility incidents in the United States.
Another dimension can be added to take advantage of lift values. Lift values can be used
to develop a decision support platform giving lift values of chemical releases with
certain equipment failures. This can serve as an important tool for the decision maker. A
detailed description of the software platform with the explanation of database and user
interactive forms developed in this study is given in Appendix – A.

56
CHAPTER VII
CONCLUSIONS AND FUTURE RESEARCH
Data mining can serve as an important tool to find interesting relationships among
variables in incident databases. It is capable of handling extremely large datasets and
results are easily interpreted. This study used the two methodologies of decision trees
and association rules to find some patterns that were not evident using traditional
statistical methods.
Data mining has many other methodologies which if applied can help to better
predict and model the systems which tend to break down more. Neural networks can
be useful in other areas of process safety like data-driven monitoring processes.
Clustering can be used to segregate data into different groups, which can be further
analyzed. Further these patterns found by using data mining techniques can be used
in developing a decision support platform for the decision maker. This platform is
subject to change in its feature and use depending on the information available in the
incident database and the analysis done.
Lift values can be extended in its dimension and can be used to quantify more than
two attributes of an incident database. This was not done in this study as the
information available in the NRC database was limited.
One of the most time consuming process to apply data mining is integrating,
cleaning, and transforming data from unstructured text. Incident databases contain
mostly unstructured text which contains the explanation about incidents. Text mining
one of the techniques of data mining can be used to convert unstructured text into
structured data. Once structured data is obtained, it can be further categorized by
using a set of algorithms. Text miner a module of SAS Inc. can perform text mining

57
making use of a dictionary of keywords. Compiling a dictionary of keywords used in
the incident databases is one of the accomplishing tasks.

58
LITERATURE CITED
1. Mannan, M.S., H.H. West, K. Krishna, A.A. Aldeeb, N.Keren, S. Saraf, and
M. Gentile, “The Legacy of Bhopal: The Impact Over the Last 20 Years and
Future Direction”, International Conference on Bhopal and Its Effects on
Process Safety ,Kanpur, India, December 1-3, 2004.
2. The Mary Kay O’Connor Process Safety Center, “ Feasibility of Using
Federal Incident Databases to Measure and Improve Chemical Safety”, Report
of The Mary Kay O’Connor Process Safety Center, Texas A&M University,
April 2002.
3. Crowl, D. A., and Louvar, J. F., Chemical Process Safety, Prentice Hall PTR,
Upper Saddle River, New Jersey 2001.
4. Mannan, M.S., Lee’s Loss Prevention in the Process Industries: Hazard
Identification, Assessment and Control, 3rd ed., Elsevier Butterworth –
Heinemann, Massachusetts, 2005.
5. Guidelines for Investigating Chemical Process Incidents, CCPS Publication,
New York, 1992.
6. Al-Qurashi, F., G. Sharma, W. J. Rogers, and M. S. Mannan, “Applications
of Relational Chemical Process Safety Databases for Lowering Mean Failure
Rates”, Process Safety Progress, 20, 4, pp 280-285,December 2001.
7. Mannan, M.S. and T.M. O’Connor, “Accident History Database: An
Opportunity”, Environmental Progress, 18, 1, pp- 1-6, Spring 1999.
8. Keren, N., T.M. O’Connor, and M.S. Mannan, “Use of incident data
collection from various sources for Industrial Safety Performance Assessments”,
Workshop on Investigation and Reporting of Incidents and Accidents,
Williamsburg, Virginia, U.S., September 16-17, 2003.
9. Department of Homeland Security, Federal Emergency Management Agency,
US Fire Administration, National Fire Incident Reporting System, website:
http://www.nfirs.fema.gov/, accessed on Feb. 2005.

59
10. US Consumer Product Safety Commission, National Electronic Injury
Surveillance System (NEISS) On-line, website:
http://www.cpsc.gov/library/neiss.html, accessed on Feb. 2005.
11. Pipeline and Hazardous Materials Safety Administration, Office of
Hazardous Materials Safety, website: http://hazmat.dot.gov/, accessed on Feb.
2005.
12. Office of Pipeline Safety, FOIA Online Library, website:
http://ops.dot.gov/stats/IA98.htm, accessed on Feb. 2005.
13. National Response Center, Download NRC Data, website:
http://www.nrc.uscg.mil/, accessed on Feb. 2005.
14. Environmental Protection Agency, Designation, Reportable Quantities, and
Notification, Code of Federal Regulations, Title 40, Volume 25, 2003,
Website:http://www.access.gpo.gov/nara/cfr/waisidx_03/40cfr302_03.html,
accessed on Feb. 2005.
15. Environmental Protection Agency, Chemical Emergency Preparedness and
Prevention, RMP Program Overview, Website: http://www.epa.gov/, accessed on
Feb. 2005.
16. Agency for Toxic Substances and Disease Registry, Hazardous Substances
Emergency Events Surveillance (HSEES), website: http://www.atsdr.cdc.gov,
accessed on Feb. 2005.
17. Iliffe, R.E., P.W.H. Chung, T. A. Kletz, and M. Preston, “The application of
active databases to the problems of human error in industry,” Journal of Loss
Prevention in the Process Industries, 13, pp 19-26, 2000.
18. Giudici, P., Applied Data Mining, John Wiley and Sons, West Sussex, England,
2003.
19. Berry, M.J.A., and Linoff, G., Data Mining Techniques, John Wiley & Sons,
New York, 1997.
20. Berson, A., S. Smith, and K. Thearling, Building Data Mining Application for
CRM, McGraw Hill, New York, 1999.

60
21. Walpole, R. E., and R. H. Myers, Probability and Statistics for Engineers and
Scientists, Prentice Hall, New York,1989.
22. Agresti, A., Categorical Data Analysis, John Wiley and Sons, New York, 2003.
23. Kelly, B.D., and M.S. Clancy, “Use a comprehensive database to better manage
process safety,” Chemical Engineering Progress, pp- 67-69, August 2001.
24. The Mary Kay O’Connor Process Safety Center, “Measuring and
Understanding Public Trust and Awareness to Prevent Chemical Incidents”,
Report of The Mary Kay O’Connor Process Safety Center, Texas A&M
University, April 2002.
25. Re Velle, J. B., and J. Stephenson, Safety Training Methods: Practical
Solutions for the Next Millennium, 2nd ed., John Wiley & Sons, Inc., New York,
1995.
26. The Mary Kay O’Connor Process Safety Center, “Feasibility of Using Federal
Incident Databases to Measure and Improve Chemical Safety”, Report of The
Mary Kay O’Connor Process Safety Center, Texas A&M University, April 2002.
27. McIntosh, J. A., and S. R. Taylor, “Incident Database and Macro Analysis to
Help Set Safety Direction”, Proceedings of the International Conference and
Workshop on Risk Analysis in Process Safety, CCPS, AICHE, pp 491-509, New
York, September 1997.
28. Crowl, D. A., and J. F. Louvar, Chemical Process Safety, Prentice Hall PTR,
Upper Saddle River, New Jersey, 2001.
29. Green, A. E., and A. J. Bourne, Reliability Technology, Wiley-Interscience,
New York, 1972
30. Reactor Safety Study, An Assessment of Accident Risks in U.S. Commercial
Nuclear Power Plants, WASH-1400, U.S. Nuclear Regulatory Commission,
October 1975.
31. Sprague, R.H. Jr., and E.D. Carlson, Building Effective Decision Support
Systems, Prentice Hall International Series, Englewood Cliffs,NJ, 1982.
61
32. Srinivasan, R., and V. Venkatasubramanian, “Automating HAZOP analysis
of batch chemical plants: Part I. The knowledge representation framework,”
Computers and Chemical Engineering, 22, 9, pp 1345-1355, 1998.
33. Srinivasan, R., and V. Venkatasubramanian, “Automating HAZOP analysis
of batch chemical plants: Part II. Algorithms and application,” Computers and
Chemical Engineering, 22, 9, pp 1357-1370, 1998.
34. Qian, Y. L. X., Y. Jiang, and Y. Wen, “An expert system for real-time fault
diagnosis of complex chemical processes,” Expert Systems with Applications, 24,
pp 425- 432, 2003.

62
APPENDIX A
DECISION SUPPORT SYSTEM
A.1. Introduction
With the advent of computers and development of computational power over the years,
decision support system (DSS) came into existence in the 1970s. Initially, it was used in
operations research and financial analysis. It is different from the use of computers in
recordkeeping and transaction processing, and basically involves a high level of
interaction between the user and the machine, in order to have an effective system [31].
Decision support systems can be useful in the field of process safety. It can make the
existing systems to function better, rather than relying on a single human expert.
Decision support systems developed for automated HAZOP analysis in batch processes
[32, 33] and real time fault diagnosis [34] can help in determining abnormal situations.
In a similar approach, a simple decision support platform is developed in this study
based on NRC data using the lift values of chemicals and equipment. These lift values
can give an indication of susceptibility of using a particular chemical with an equipment,
and can help the decision maker to make alternative choices if possible. In case of
nonexistence of an alternative, it can emphasize to monitor the process more closely.
A.2. Software Program
Software program developed in this study uses Visual Basic a product of Microsoft
Corporation. The user interface consisting of a set of user interactive forms in Microsoft
access is developed; it uses the following tables as the database:
• Equipment Table – this includes the list of groups of equipment in the NRC
database
63
• Chemical Table – this includes the twelve most released chemicals in the
database
• Lift Value Table- this includes the lift values of different chemicals
corresponding to different equipment
There are 3 user interactive forms given below:
• Main Form – this form has the linked menus to which a user can go, it includes
options like equipment lift values, component lift values, and also it has the
option of closing down the application. A snapshot of the form is given in Figure
19.
• Equipment form – this includes the two drop down menus for selecting the type
of chemical and the kind of equipment failure involved. Once the user selects
both of the drop down menus, lift values corresponding to that chemical and
equipment failure is retrieved from the database and displayed in a text box. A
snapshot of the form is given in Figure 20.
• Component form- this form is exactly in the same form as the equipment form
and retrieves the lift values for the chemical and the component of equipment
selected by the user. A snapshot of the form is given in Figure 21.
Programming Details
Data Access Object
Microsoft Data Access Objects (DAO) is a collection of objects that can control a
database from any application that supports Visual Basic for Applications, including
Microsoft Access, Excel, and Visual Basic. DAO objects can represent the structure of
the database and even the data itself.
DAO can be useful in doing the following functions:

64
• Manipulate tables by changing the design, querying, and indexing.
• Change the data in the database by adding, deleting, and appending
• It also helps in retrieving the data
• Linking different tables and manipulating data
In developing this software application, DAO object that was extensively used was
Record set. Record set represents the set of records in a table, query etc. ‘Move next’ one
of the properties of record set was extensively used in this application to find the exact
chemical and equipment as selected by the user in the drop down menus.
The algorithm of the software application is described below:
START
Step – 1:
• As the user opens the Application named ‘TEST’, the main form opens up.
This gives the option of going into different menus of equipment form,
component form, or exiting the application
Step -2:
• Once the user is in either of the form, the equipment or the component form,
the basic functionality remains the same. Here the user has to select the
chemical and the equipment type from the drop down menus.
Step- 3:
• Once the chemical and equipment is selected, lift table is accessed and the
corresponding lift value of the chemical and equipment selected by the user is
displayed in the text box by searching through the whole table.
END

65
The main code that was written in Visual Basic is presented below (Figure 18).
GLOBAL DECLARATIONS
Dim Chemical_Name As String
Dim Equipment_Name As String
MAIN PROGRAM BODY
‘This function retrieves the chemical name entered by the user
Private Sub CHEMICALCOMBO_Change()
Chemical_Name = CHEMICALCOMBO.Text
If CHEMICALCOMBO.Text = "" Then
MAINTEXTBOX.SetFocus
MAINTEXTBOX.Text = ""
Else
check_equipment
End If
End Sub
‘This is the main function which opens the record set, does manipulations required for
the functionality and sends and receives variables to other functions
Sub Main_Function()
Dim dbSales As DAO.Database
Dim rst1 As DAO.Recordset
Dim rst12 As DAO.Recordset
Figure 18. Visual basic code
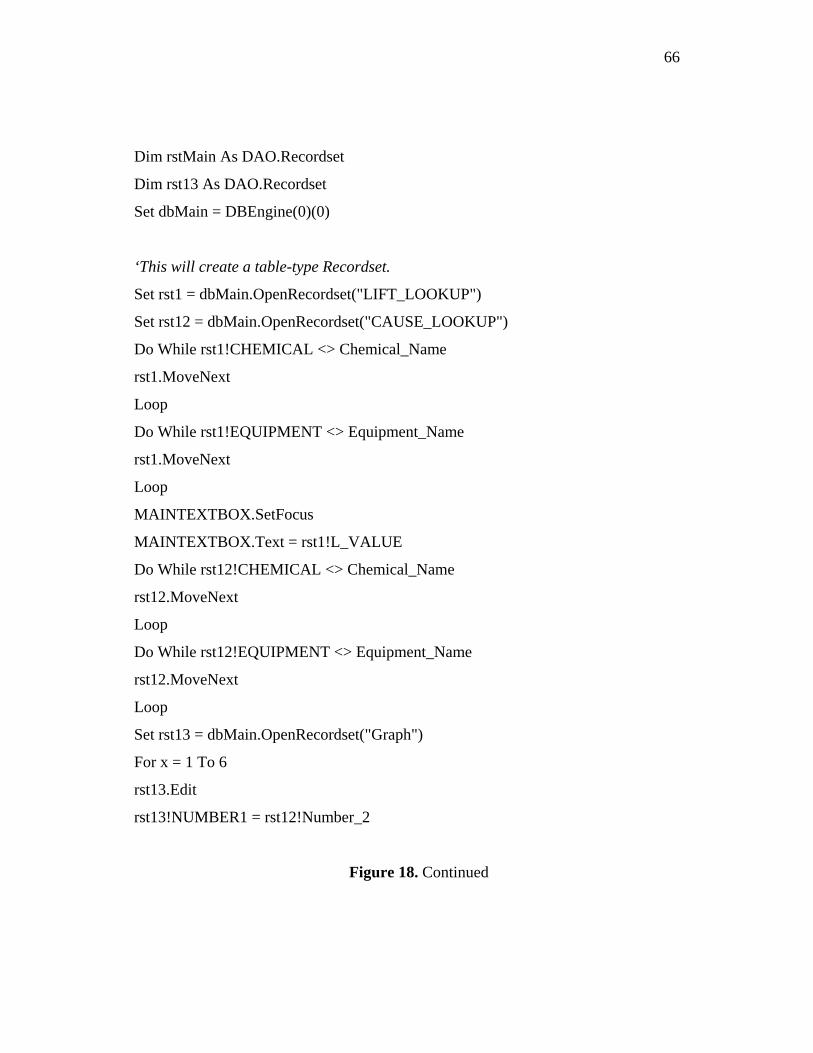
66
Dim rstMain As DAO.Recordset
Dim rst13 As DAO.Recordset
Set dbMain = DBEngine(0)(0)
‘This will create a table-type Recordset.
Set rst1 = dbMain.OpenRecordset("LIFT_LOOKUP")
Set rst12 = dbMain.OpenRecordset("CAUSE_LOOKUP")
Do While rst1!CHEMICAL <> Chemical_Name
rst1.MoveNext
Loop
Do While rst1!EQUIPMENT <> Equipment_Name
rst1.MoveNext
Loop
MAINTEXTBOX.SetFocus
MAINTEXTBOX.Text = rst1!L_VALUE
Do While rst12!CHEMICAL <> Chemical_Name
rst12.MoveNext
Loop
Do While rst12!EQUIPMENT <> Equipment_Name
rst12.MoveNext
Loop
Set rst13 = dbMain.OpenRecordset("Graph")
For x = 1 To 6
rst13.Edit
rst13!NUMBER1 = rst12!Number_2
Figure 18. Continued
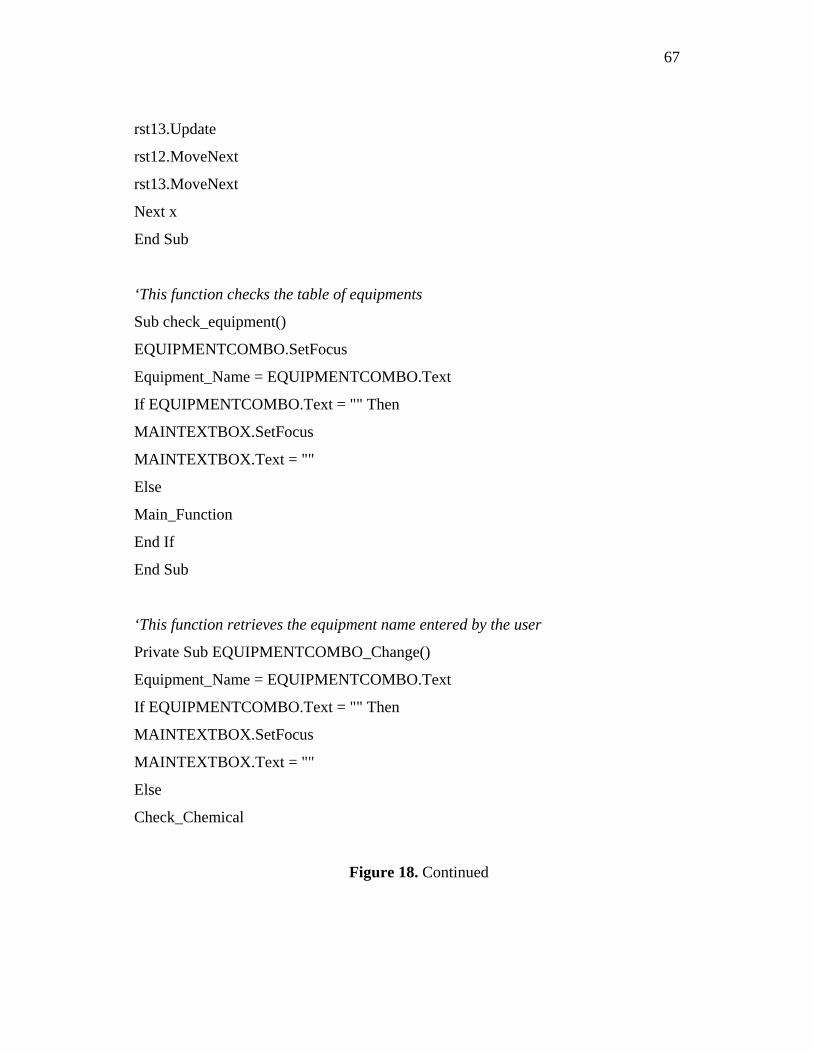
67
rst13.Update
rst12.MoveNext
rst13.MoveNext
Next x
End Sub
‘This function checks the table of equipments
Sub check_equipment()
EQUIPMENTCOMBO.SetFocus
Equipment_Name = EQUIPMENTCOMBO.Text
If EQUIPMENTCOMBO.Text = "" Then
MAINTEXTBOX.SetFocus
MAINTEXTBOX.Text = ""
Else
Main_Function
End If
End Sub
‘This function retrieves the equipment name entered by the user
Private Sub EQUIPMENTCOMBO_Change()
Equipment_Name = EQUIPMENTCOMBO.Text
If EQUIPMENTCOMBO.Text = "" Then
MAINTEXTBOX.SetFocus
MAINTEXTBOX.Text = ""
Else
Check_Chemical
Figure 18. Continued

68
End If
End Sub
‘This function checks the table of chemicals
Sub Check_Chemical()
CHEMICALCOMBO.SetFocus
Chemical_Name = CHEMICALCOMBO.Text
If CHEMICALCOMBO.Text = "" Then
MAINTEXTBOX.SetFocus
MAINTEXTBOX.Text = ""
Else
Main_Function
End If
End Sub
‘This function quits the application
Private Sub Command6_Click()
On Error GoTo Err_Command6_Click
DoCmd.Close
Exit_Command6_Click:
Exit Sub
Err_Command6_Click:
MsgBox Err.Description
Resume Exit_Command6_Click
End Sub
Figure 18.Continued

Figure 19. Main form
69

Figure 20. Equipment form 70

Figure 21. Component form
71

72
VITA
Sumit Anand was born to Dr. A. K. Aggarwal and Dr. (Mrs.) Veera Aggarwal on
September 1, 1980. He received his Bachelor of Engineering in Chemical Engineering
from Regional Engineering College, Rourkela, under the Sambalpur University, India in
2002. Later, Sumit joined Texas A&M University, College Station, Texas in the spring
of 2003 to pursue his master’s in chemical engineering under the guidance of
Dr. M. Sam Mannan.
Sumit Anand’s permanent address is:
C/o Dr. A. K. Aggarwal,
House No.: 1177, Sector: 19,
Faridabad – 121002,
Haryana, INDIA.