Novel Analysis of Immune Cells from Nasal Microbiopsy ...
15
RESEARCH ARTICLE Novel Analysis of Immune Cells from Nasal Microbiopsy Demonstrates Reliable, Reproducible Data for Immune Populations, and Superior Cytokine Detection Compared to Nasal Wash Simon P. Jochems 1☯ , Katherine Piddock 1☯ , Jamie Rylance 1,2 , Hugh Adler 1 , Beatriz F. Carniel 1 , Andrea Collins 1 , Jenna F. Gritzfeld 1 , Carole Hancock 1 , Helen Hill 1 , Jesus Reine ´ 1 , Alexandra Seddon 1 , Carla Solo ´ rzano 1 , Syba Sunny 1 , Ashleigh Trimble 1 , Angela D. Wright 1,3,4 , Seher Zaidi 1 , Stephen B. Gordon 5 , Daniela M. Ferreira 1 * 1 Department of Clinical Sciences, Liverpool School of Tropical Medicine, Liverpool, United Kingdom, 2 Department of Respiratory Medicine, Aintree University Hospital NHS Trust, Liverpool, United Kingdom, 3 Department of Respiratory Medicine, Royal Liverpool University Hospital, Liverpool, United Kingdom, 4 National Institute of Health and Research Clinical Research Network, Leeds, United Kingdom, 5 Malawi Liverpool Wellcome Trust Clinical Research Programme, Blantyre, Malawi ☯ These authors contributed equally to this work. * [email protected] Abstract The morbidity and mortality related to respiratory tract diseases is enormous, with hundreds of millions of individuals afflicted and four million people dying each year. Understanding the immunological processes in the mucosa that govern outcome following pathogenic encoun- ter could lead to novel therapies. There is a need to study responses at mucosal surfaces in humans for two reasons: (i) Immunological findings in mice, or other animals, often fail to translate to humans. (ii) Compartmentalization of the immune system dictates a need to study sites where pathogens reside. In this manuscript, we describe two novel non-invasive nasal mucosal microsampling techniques and their use for measuring immunological parameters: 1) using nasal curettes to collect cells from the inferior turbinate and; 2) absorp- tive matrices to collect nasal lining fluid. Both techniques were well tolerated and yielded reproducible and robust data. We demonstrated differences in immune populations and acti- vation state in nasal mucosa compared to blood as well as compared to nasopharyngeal lumen in healthy adults. We also found superior cytokine detection with absorptive matrices compared to nasal wash. These techniques are promising new tools that will facilitate stud- ies of the immunological signatures underlying susceptibility and resistance to respiratory infections. PLOS ONE | DOI:10.1371/journal.pone.0169805 January 20, 2017 1 / 15 a1111111111 a1111111111 a1111111111 a1111111111 a1111111111 OPEN ACCESS Citation: Jochems SP, Piddock K, Rylance J, Adler H, Carniel BF, Collins A, et al. (2017) Novel Analysis of Immune Cells from Nasal Microbiopsy Demonstrates Reliable, Reproducible Data for Immune Populations, and Superior Cytokine Detection Compared to Nasal Wash. PLoS ONE 12 (1): e0169805. doi:10.1371/journal.pone.0169805 Editor: John S Tregoning, Imperial College London, UNITED KINGDOM Received: September 23, 2016 Accepted: December 21, 2016 Published: January 20, 2017 Copyright: © 2017 Jochems et al. This is an open access article distributed under the terms of the Creative Commons Attribution License, which permits unrestricted use, distribution, and reproduction in any medium, provided the original author and source are credited. Data Availability Statement: All relevant data are within the paper and its Supporting Information files. Funding: This work was supported by the Medical Research Council (grant MR/M011569/1), Bill and Melinda Gates Foundation (grant OPP1117728), the National Institute for Health Research (NIHR) Local Comprehensive Research Network and a Wellcome Trust Multi-User Equipment Grant (104936/Z/14/Z). The funders had no role in study
Transcript of Novel Analysis of Immune Cells from Nasal Microbiopsy ...

RESEARCH ARTICLE
Novel Analysis of Immune Cells from Nasal
Microbiopsy Demonstrates Reliable,
Reproducible Data for Immune Populations,
and Superior Cytokine Detection Compared
to Nasal Wash
Simon P. Jochems1☯, Katherine Piddock1☯, Jamie Rylance1,2, Hugh Adler1, Beatriz
F. Carniel1, Andrea Collins1, Jenna F. Gritzfeld1, Carole Hancock1, Helen Hill1,
Jesus Reine1, Alexandra Seddon1, Carla Solorzano1, Syba Sunny1, Ashleigh Trimble1,
Angela D. Wright1,3,4, Seher Zaidi1, Stephen B. Gordon5, Daniela M. Ferreira1*
1 Department of Clinical Sciences, Liverpool School of Tropical Medicine, Liverpool, United Kingdom,
2 Department of Respiratory Medicine, Aintree University Hospital NHS Trust, Liverpool, United Kingdom,
3 Department of Respiratory Medicine, Royal Liverpool University Hospital, Liverpool, United Kingdom,
4 National Institute of Health and Research Clinical Research Network, Leeds, United Kingdom, 5 Malawi
Liverpool Wellcome Trust Clinical Research Programme, Blantyre, Malawi
☯ These authors contributed equally to this work.
Abstract
The morbidity and mortality related to respiratory tract diseases is enormous, with hundreds
of millions of individuals afflicted and four million people dying each year. Understanding the
immunological processes in the mucosa that govern outcome following pathogenic encoun-
ter could lead to novel therapies. There is a need to study responses at mucosal surfaces in
humans for two reasons: (i) Immunological findings in mice, or other animals, often fail to
translate to humans. (ii) Compartmentalization of the immune system dictates a need to
study sites where pathogens reside. In this manuscript, we describe two novel non-invasive
nasal mucosal microsampling techniques and their use for measuring immunological
parameters: 1) using nasal curettes to collect cells from the inferior turbinate and; 2) absorp-
tive matrices to collect nasal lining fluid. Both techniques were well tolerated and yielded
reproducible and robust data. We demonstrated differences in immune populations and acti-
vation state in nasal mucosa compared to blood as well as compared to nasopharyngeal
lumen in healthy adults. We also found superior cytokine detection with absorptive matrices
compared to nasal wash. These techniques are promising new tools that will facilitate stud-
ies of the immunological signatures underlying susceptibility and resistance to respiratory
infections.
PLOS ONE | DOI:10.1371/journal.pone.0169805 January 20, 2017 1 / 15
a1111111111
a1111111111
a1111111111
a1111111111
a1111111111
OPENACCESS
Citation: Jochems SP, Piddock K, Rylance J, Adler
H, Carniel BF, Collins A, et al. (2017) Novel Analysis
of Immune Cells from Nasal Microbiopsy
Demonstrates Reliable, Reproducible Data for
Immune Populations, and Superior Cytokine
Detection Compared to Nasal Wash. PLoS ONE 12
(1): e0169805. doi:10.1371/journal.pone.0169805
Editor: John S Tregoning, Imperial College London,
UNITED KINGDOM
Received: September 23, 2016
Accepted: December 21, 2016
Published: January 20, 2017
Copyright: © 2017 Jochems et al. This is an open
access article distributed under the terms of the
Creative Commons Attribution License, which
permits unrestricted use, distribution, and
reproduction in any medium, provided the original
author and source are credited.
Data Availability Statement: All relevant data are
within the paper and its Supporting Information
files.
Funding: This work was supported by the Medical
Research Council (grant MR/M011569/1), Bill and
Melinda Gates Foundation (grant OPP1117728),
the National Institute for Health Research (NIHR)
Local Comprehensive Research Network and a
Wellcome Trust Multi-User Equipment Grant
(104936/Z/14/Z). The funders had no role in study

Introduction
Respiratory tract disease is an important cause of morbidity and mortality worldwide [1]. In
addition, lower respiratory tract infections and chronic respiratory disease, such as asthma,
have both been highlighted as leading causes of disability [2, 3]. The nasal mucosa is the key
niche in the pathogenesis of respiratory disease. For example, carriage of Streptococcus pneu-moniae (the pneumococcus) in the nasopharynx has been identified as an essential step in
developing both localised and systemic infection [4]. Alteration of the nasal mucosa, for exam-
ple by viruses, has also been shown to increase susceptibility to pneumococcal infection [5].
Moreover, viral infection of the upper respiratory tract is associated with exacerbation of
asthma and excessive inflammation in the upper respiratory tract is a risk factor for asthma [6,
7]. A greater understanding of the immunological responses to pathogens in the nasal mucosa
and the pathogenesis of respiratory diseases may provide targets for new treatments or vacci-
nations against disease.
There is increasing evidence that mucosal immune responses vary significantly at different
sites within the body [8, 9]. This compartmentalisation necessitates specific study of the nasal
mucosa as it is a key component of host-pathogen interaction. Developing non-invasive tech-
niques to study the nasal mucosa in humans offers clear advantages over animal models,
which frequently lack translational applicability [10].
Currently, the most used method for collecting cells from within the nasopharynx is a nasal
wash (NW) procedure [11]. The NW procedure is generally well tolerated but not suitable for
all groups of patients especially those who are particularly young or unwell. In addition, lumi-
nal cell populations can vary significantly from intra-mucosal cell populations [8, 12]. An
improved method of sampling the nasal mucosa would lead to a greater understanding of the
cellular components of the immune response in the nasopharynx. Cell collection using nasal
curettes has previously been used to collect epithelial cells for culture, as well as for gene
expression analysis [13, 14]. Nasal brushes have also been used to collect samples to investigate
epithelial cell phenotype [15]. Here we use for the first time cell collection with nasal curettes
to analyse the composition and activation state of immune cells using flow cytometry. A NW
is also typically performed to measure cytokine and other soluble immune mediators. An
absorptive matrix to collect nasal fluid (nasosorption) has been used in neonates, and has the
potential to be better tolerated and more widely applicable [16]. This technique has recently
been used to investigate nasal responses to grass pollen, LPS and rhinovirus [17–19]. Here, we
aimed to compare cytokine detection between nasal wash and nasosorption techniques.
Here we describe the novel use of two non-invasive nasal microsampling techniques. We
present data on the reproducibility, utility and tolerability of these techniques in measuring
immunological responses within the nasal mucosa.
Methods
Recruitment of volunteers and ethical statements
We recruited healthy non-smoking adults aged between 18–60 years of age. Volunteers gave
written informed consent. Inclusion criteria were: capacity to give informed consent, aged 18–
50 years and speak fluent English. Exclusion criteria were: current involvement in another
study unless observational or in follow-up phase (non-interventional), influenza vaccination
in the last 2 years, clinically diagnosed with influenza in the last 2 years, egg allergy, previous
significant adverse reaction to any vaccination/immunisation, close contact with at risk indi-
viduals (children under 5 years, immunosuppressed adults, elderly, chronic ill health), current
regular smoker, >10 pack years smoking history, asthma or respiratory disease, pregnant,
Superior Cytokine Detection and Reproducible Data from Nasal Microbiopsy
PLOS ONE | DOI:10.1371/journal.pone.0169805 January 20, 2017 2 / 15
design, data collection and analysis, decision to
publish, or preparation of the manuscript.
Competing Interests: The authors have declared
that no competing interests exist.

women of child-bearing potential without effective birth control in place, allergic to penicillin/
amoxicillin/ gentamicin, on medication that may affect the immune system in any way e.g. ste-
roids, steroid nasal spray, regularly taking acetylsalicylic acid (aspirin), been involved in a clini-
cal trial involving experimental pneumococcal carriage over the last 3 years, current acute
severe febrile illness, taking long term antibiotics. Volunteers were screened for S. pneumoniaecarriage and only carriage-negative volunteers were analysed. In addition, volunteers with
nasal and general symptoms were excluded from the analysis. Ethical approval was given by
NHS Research and Ethics Committee (REC)/Liverpool School of Tropical Medicine (LSTM)
REC, reference numbers: 15/NW/0146 and 14/NW/1460 and Human Tissue Authority licens-
ing number 12548. The individuals in this manuscript have given written informed consent
(as outlined in PLOS consent form) to publish these case details
Nasal sampling procedures
All participants underwent nasal wash procedures as described previously using 20mL of ster-
ile saline [11]. A selection of participants underwent nasal curettage and nasosorption. Nasal
curettage uses a small probe to collect cells from the nasal mucosa (S1 Fig). The nasal inferior
turbinates were visualised with a light with the participant being seated with the head tilted
posteriorly. The curette (ASL Rhino-Pro©, Arlington Scientific) was used to scrape a small col-
lection of cells from the nasal mucosa (S1 Video). Two scrapes per nostril were taken and
placed in a 15mL Falcon tube placed on ice containing phosphate-buffered saline (PBS)
+ 0.5% heat-inactivated fetal bovine serum (FBS) and 2.5 mM ethylenediaminetetraacetic acid
(EDTA) (PBS++, all ThermoFisher). For nasosorption collection, an adsorptive matrix strip
(Nasosorption™, Hunt Developments) was inserted into the nostril and placed against the
nasal lining for 2 minutes and then placed in its transport tube (S2 Fig).
Flow cytometry analysis
Cells were dislodged from the curette by repeated pipetting with PBS+. Cells were spun down
(440 x g for 5 minutes) and resuspended in PBS++ containing LIVE/DEAD1 Fixable Aqua
Dead Cell Stain (ThermoFisher). After 15 minute incubation on ice, an antibody cocktail con-
taining Epcam-PE, HLADR-PECy7, CD16-APC, CD66b-FITC (all Biolegend), CD3-APCCy7,
CD14-PercpCy5.5 (BD Biosciences) and CD45-PACOrange (ThermoFisher) was added to the
cells. Following a further 15 minute incubation on ice, cells were filtered over a 70 μm filter
(ThermoFisher). Cells were spun down (440 x g for 5 minutes), resuspended in PBS++ and
acquired on a flow cytometer (LSRII, BD). Samples with less than five hundred events (15% of
all measured) were excluded from further analysis. Nasal washes were similarly processed
excluding the dislodging step. To 100 μL heparinized blood, the viability dye and antibodies
were directly added sequentially. After the final incubation step, BD FACS lysing solution was
used to remove red blood cells according to manufacturer’s instruction. Flow cytometry data
was analysed using Flowjo V. 10 (Treestar).
Cytokine detection
Nasal lining fluid was extracted from nasosorption strips by centrifugation (1880 x g for 10
minutes) and frozen until use at -80C. Supernatant from nasal wash was collected by centrifu-
gation at 3000 rpm for 3 minutes and was stored at -80C until use. Interferon gamma-induced
protein 10 (IP10), interleukin 8 (IL-8) and monocyte-chemoattractant protein 1 (MCP1) were
measured by enzyme-linked immunosorbent assay (ELISA) (BD OPTEIA) according to man-
ufacturer’s instructions. The human magnetic 30-plex cytokine kit (ThermoFisher) was used
Superior Cytokine Detection and Reproducible Data from Nasal Microbiopsy
PLOS ONE | DOI:10.1371/journal.pone.0169805 January 20, 2017 3 / 15

to detect thirty cytokines simultaneously on a LX200 with xPonent3.1 software (Luminex) fol-
lowing manufacturer’s instructions.
Scoring tolerability of nasal sampling procedures
Following nasal wash, nasal curettage and nasosorption, participants rated by 5-point modified
Likert scale how ‘painful’ and how ‘uncomfortable’ each procedure was, and how much it
made their ‘eyes water’. Thirty-nine participants also completed a symptoms log for 7 days
documenting both local and general symptoms with severity ratings from 1–7.
Multi-dimensional scaling and heat map generation
Multi-dimensional scaling and heat map representations were generated using R. Flow cytom-
etry data (epithelial cell yield, immune composition and activation) was log-transformed and a
distance-matrix was calculated. The Kruskal stress was calculated using the ‘MASS’ package.
Heat maps of log-transformed cytokine data were generated using the ‘gplots’ package
Statistical analysis
Non-parametric two-tailed tests were used throughout using Prism 5 (Graphpad). If two
groups were compared, a Mann-Whitney test was used. If multiple groups were compared, a
Kruskal-Wallis test was used, followed by a Dunn’s post-test. A Spearman test was used to
measure correlations between two continuous variables. Analysis of similarity (ANOSIM) test-
ing was performed using the ‘vegan’ package in R.
Results
Nasal curettage yields robust and reproducible data
We collected nasal cells from the inferior turbinate using curettes (Supplementary Video 1). In
total 240 samples were collected from 139 healthy individuals to investigate their use for study-
ing immune responses at the mucosal level. To verify the repeatability of nasal curettage, we
initially collected samples from the left and right nostril of three healthy volunteers and per-
formed flow cytometry to identify cellular composition (Fig 1). Samples from both nostrils
were processed independently and frequencies of granulocytes, monocytes and T cells were
compared for each of the three volunteers. Cellular samples collected from the two nostrils
were similar for each of the three volunteers, compared to samples collected from the other
two volunteers. This demonstrates the repeatability of nasal curettage as well as the presence of
inter-individual variation in immune cells in the nose.
To verify that nasal curette sampling yields stable data, cells were collected from healthy vol-
unteers (n = 117) over a five month period (Fig 2). The percentage of granulocytes and T cells
among immune cells was stable during this period (Fig 2A). Moreover, for a subset of volun-
teers, up to four nasal samples were collected during a thirty-three day period. The levels of
both granulocytes and T cells correlated on an intra-individual level between repeated sam-
pling (Fig 2B and 2C). This demonstrates that despite variation between individuals, the
immunological profile in the nose is stable in the absence of disease or immune intervention
such as vaccination.
Nasal curettage and nasal wash yield different cell populations
We then compared the yield and composition of nasal cells collected using curettes to those
collected using a NW, the currently most used method for collecting nasopharyngeal cells (Fig
3A and 3B). Nasal curettage yielded a median of 4367 (interquartile range (IQR): 1511–10348)
Superior Cytokine Detection and Reproducible Data from Nasal Microbiopsy
PLOS ONE | DOI:10.1371/journal.pone.0169805 January 20, 2017 4 / 15

immune cells and 1407 (IQR: 570–3194) epithelial cells, respectively. The number of immune
cells obtained was similar between NW and nasal curette. In contrast, there were 22.7 fold
increased numbers of epithelial cells collected by nasal curette (Fig 3A, p< 0.05). Fig 3B shows
the composition of the collected immune cell. NW immune cells consisted almost exclusively
of granulocytes (median 96%, IQR: 93–97%). In contrast, nasal curette samples contained pre-
dominantly granulocytes (median 64%, IQR: 39–79%, p< 0.0001 compared to NW), but also
consisted of a larger fraction of T cells than NW (median 16%, IQR: 9–38%, p< 0.0001 com-
pared to NW). A median of 2591 (IQR: 691–7666) granulocytes and 633 (IQR: 210–1740) T
cells were acquired per sample. Nasal curette samples also contained more lineage- human
Fig 1. Repeatability of nasal curettage sampling. Nasal cells were collected from the left (L) and right (R) nostril of three volunteers,
processed independently and their composition was assessed by flow cytometry. After excluding debris and doublets, epithelial cells
were identified by Epcam expression. A viability dye and CD45 were used to identify live immune cells. Among those cells, side scatter,
CD66b, CD14 and CD3 were used to identify granulocytes, monocytes and T cells respectively.
doi:10.1371/journal.pone.0169805.g001
Superior Cytokine Detection and Reproducible Data from Nasal Microbiopsy
PLOS ONE | DOI:10.1371/journal.pone.0169805 January 20, 2017 5 / 15

Fig 2. Nasal curettage yields reproducible and consistent results over time. (A) The percentage of granulocytes (closed circles) and T cells (open
circles) in 218 nasal cell samples collected over a five month period (n = 117 volunteers, sampled up to five times). Individual samples and loess curves are
depicted for both populations. (B, C) The correlation for individuals in four repeated measurements over a 33-day period for (B) granulocytes and (C) T cells.
doi:10.1371/journal.pone.0169805.g002
Superior Cytokine Detection and Reproducible Data from Nasal Microbiopsy
PLOS ONE | DOI:10.1371/journal.pone.0169805 January 20, 2017 6 / 15
leukocyte antigen-antigen D related (HLA-DR)+ cells, which are likely to consist of B cells and
dendritic cells (median 1.7%, IQR 0.9–3.2%, p< 0.001 compared to NW). Of all immune cells
collected by curettage and NW, 81.7% and 96.4% could be characterized, respectively.
Differences in proportions and activation state of immune cells in blood
and nasal cells
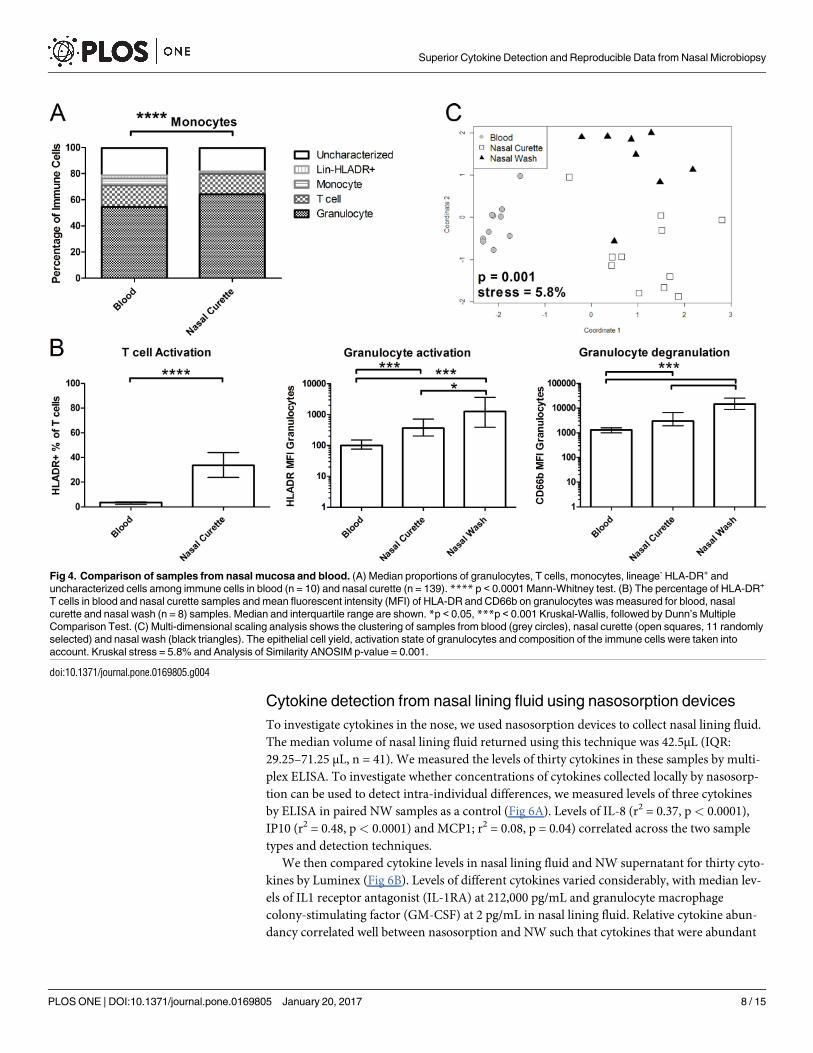
Next, we compared immune populations from nasal samples with those found in blood (Fig
4A). Levels of neutrophils, T cells and Lineage-HLA-DR+ were similar between nasal curette
samples and blood. In contrast, levels of monocytes/macrophages were decreased in nasal
curette samples compared to blood (0.3% and 5.4%, respectively, p< 0.0001). Immune cells
from nasal mucosa differed from blood cells in their activation state (Fig 4B). Levels of
HLA-DR+ T cells were significantly increased in nasal curette samples compared to blood
(p< 0.0001). Similarly, levels of HLA-DR were significantly increased on granulocytes in
nasal curette samples and NW samples compared to blood (p< 0.001). Granulocytes from
nasal curette samples and NW samples also displayed high CD66b expression relative to blood
(p< 0.001), a marker for degranulation. Granulocyte activation and degranulation was even
further increased in NW compared to nasal curette samples (p< 0.05 and p< 0.001, respec-
tively). When taking epithelial cell yield, immune cell composition and activation state into
account, nasal curette samples clustered separately from blood and NW (Fig 4C).
Macroscopic red blood cell contamination does not affect immune cells
recovered using nasal curettage
Red blood cells were visible macroscopically in 44% of collected nasal curette samples (52 of
117 assessed). Blood leukocytes did not contaminate the recovered immune cells in these sam-
ples, as levels of monocytes among immune cells were not increased in the presence of red
blood cells (Fig 5A). Moreover, T cell activation and neutrophil activation and degranulation
were not decreased when red blood cells were present (Fig 5B).
Fig 3. Comparison of samples collected by nasal wash and nasal curette. (A) Epithelial (open circles) and immune (closed circles) and cell yields
were compared between nasal wash pellets and nasal curette samples. Individuals samples and median and interquartile range are shown. (B) Median
proportions of granulocytes, T cells, monocytes, lineage- HLA-DR+ and uncharacterized cells among immune cells in nasal curette (n = 139 individuals)
and nasal wash (n = 8) samples. *p < 0.05, ***p < 0.001, ****p < 0.0001 Mann-Whitney test.
doi:10.1371/journal.pone.0169805.g003
Superior Cytokine Detection and Reproducible Data from Nasal Microbiopsy
PLOS ONE | DOI:10.1371/journal.pone.0169805 January 20, 2017 7 / 15
Cytokine detection from nasal lining fluid using nasosorption devices
To investigate cytokines in the nose, we used nasosorption devices to collect nasal lining fluid.
The median volume of nasal lining fluid returned using this technique was 42.5μL (IQR:
29.25–71.25 μL, n = 41). We measured the levels of thirty cytokines in these samples by multi-
plex ELISA. To investigate whether concentrations of cytokines collected locally by nasosorp-
tion can be used to detect intra-individual differences, we measured levels of three cytokines
by ELISA in paired NW samples as a control (Fig 6A). Levels of IL-8 (r2 = 0.37, p < 0.0001),
IP10 (r2 = 0.48, p< 0.0001) and MCP1; r2 = 0.08, p = 0.04) correlated across the two sample
types and detection techniques.
We then compared cytokine levels in nasal lining fluid and NW supernatant for thirty cyto-
kines by Luminex (Fig 6B). Levels of different cytokines varied considerably, with median lev-
els of IL1 receptor antagonist (IL-1RA) at 212,000 pg/mL and granulocyte macrophage
colony-stimulating factor (GM-CSF) at 2 pg/mL in nasal lining fluid. Relative cytokine abun-
dancy correlated well between nasosorption and NW such that cytokines that were abundant
Fig 4. Comparison of samples from nasal mucosa and blood. (A) Median proportions of granulocytes, T cells, monocytes, lineage- HLA-DR+ and
uncharacterized cells among immune cells in blood (n = 10) and nasal curette (n = 139). **** p < 0.0001 Mann-Whitney test. (B) The percentage of HLA-DR+
T cells in blood and nasal curette samples and mean fluorescent intensity (MFI) of HLA-DR and CD66b on granulocytes was measured for blood, nasal
curette and nasal wash (n = 8) samples. Median and interquartile range are shown. *p < 0.05, ***p < 0.001 Kruskal-Wallis, followed by Dunn’s Multiple
Comparison Test. (C) Multi-dimensional scaling analysis shows the clustering of samples from blood (grey circles), nasal curette (open squares, 11 randomly
selected) and nasal wash (black triangles). The epithelial cell yield, activation state of granulocytes and composition of the immune cells were taken into
account. Kruskal stress = 5.8% and Analysis of Similarity ANOSIM p-value = 0.001.
doi:10.1371/journal.pone.0169805.g004
Superior Cytokine Detection and Reproducible Data from Nasal Microbiopsy
PLOS ONE | DOI:10.1371/journal.pone.0169805 January 20, 2017 8 / 15

in nasosorption were also highly present in NW. Of interest, T cell cytokines (IL-10, IL-17,
Interferon gamma (IFNγ), Tumour necrosis factor alpha (TNFα), IL-4, IL-5, IL-2) were only
present at low levels. This correlates well with the absence of T cells in the lumen (Fig 3B).
Growth factors as epidermal growth factor (EGF), hepatocyte growth factor (HGF) and vascu-
lar endothelial growth factor (VEGF) were expressed at moderately high levels, reflecting the
homeostatic nature of mucosal surfaces.
Levels of cytokines were higher in nasosorption compared to NW (median 4.7x, IQR: 3.1–
8.0x; Fig 6C). However, some cytokines had a ratio between nasosorption and NW that dif-
fered substantially from this: IL-1RA and IL-5 were respectively 51.5x and 45.2x higher in
nasosorption than in NW. In contrast, Monokine induced by IFNγ (MIG), Regulated on acti-
vation, normal T-cell expressed and secreted (Rantes) and IP10 were found at similar levels in
nasosorption and in NW (ratio of 1.5x, 1.0x and 0.9x, respectively).
While all cytokines were within the limit of detection of the assay (0.5 pg/mL) in the nasal
lining fluid, several cytokines could not be detected in one or more NW samples. Five cyto-
kines (GM-CSF, TNFα, Rantes, IL-5 and Macrophage inflammatory protein (MIP)-1a) were
not detectable in the NW of any of the six volunteers. One cytokine (IL-17) could not be
detected in 3/6 samples. Two cytokines, IL-2 Receptor (IL-2R) and G-CSF, were below the
detection limit for 2/6 samples and an additional 9 cytokines were undetectable in 1/6 NW
samples.
Methods of nasal microsampling are well tolerated by volunteers and do
not lead to symptoms
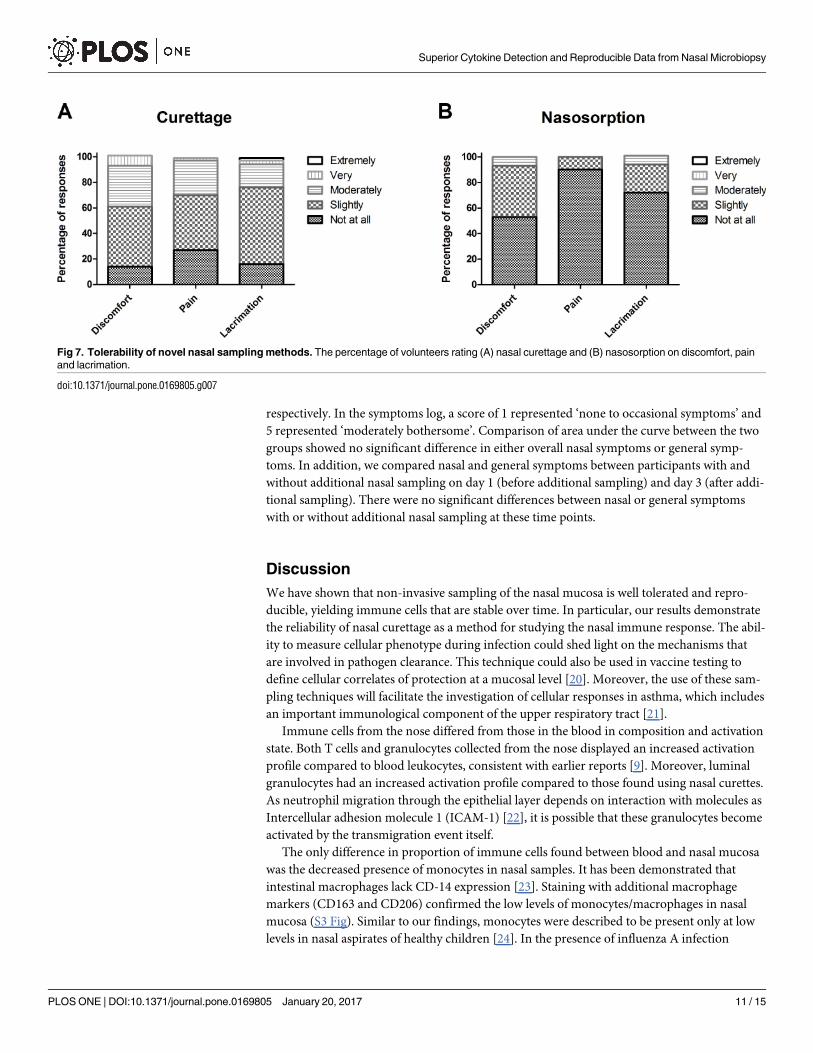
Using the 5-point modified Likert scale, twenty participants gave ratings for nasal curettage
(eighty-eight ratings) and nasosorption (sixty ratings) with regards to pain, discomfort and lac-
rimation. For nasal curettage and nasosorption, the proportion of responses that reported any
degree of pain (any score > 1) were 73% and 10%, respectively (Fig 7). For nasal curettage and
Fig 5. Comparison of nasal curettes with visible red blood cell contamination (n = 55) or not (n = 62). (A) Median proportions of granulocytes, T cells,
monocytes, lineage- HLA-DR+ and uncharacterized cells among immune cells. (B) The percentage of HLA-DR+ T cells (left axis) and mean fluorescent
intensity (MFI) of HLA-DR and CD66b on granulocytes (right axis) of nasal curette samples visibly contaminated with erythrocytes (open squares) or not
(open circles). Individuals samples and median and interquartile range are shown.
doi:10.1371/journal.pone.0169805.g005
Superior Cytokine Detection and Reproducible Data from Nasal Microbiopsy
PLOS ONE | DOI:10.1371/journal.pone.0169805 January 20, 2017 9 / 15

nasosorption, the proportion of responses that reported any degree of discomfort (score > 1)
were 86% and 47%, respectively Fig 7). For nasal curettage and nasosorption, the proportion
of responses that reported any degree of lacrimation (score > 1) were, 84% and 28%, respec-
tively (Fig 7). For nasosorption the maximum rating was moderately for levels of discomfort,
pain or causing lacrimation. A small proportion of responses rated nasal curettage as very
painful (2%), uncomfortable (8%) or causing lacrimation (6%).
Finally, we assessed whether these sampling techniques led to increased general and nasal
symptoms over a longer period in thirty-nine healthy volunteers (S1 Table). All participants
had nasal wash procedures and twenty of those participants had nasal curettage and nasosorp-
tion to investigate whether these additional sampling methods affect nasal symptoms. Daily
symptom logs for nasal and general symptoms were completed by all volunteers. Age and sex
distribution was similar in each group. The median ratings for overall nasal symptoms were
1 (range 1–4) and 1 (range 1–5) in the group with and without additional nasal sampling,
Fig 6. Comparison of cytokine levels in samples collected by nasal wash and using nasosorption devices. (A) Levels of IL-8, IP-10 and MCP1 were
measured by Luminex in nasosorption devices and by ELISA from paired nasal washes (n = 41). The r2 and p indicate goodness-of-fit and p-value calculated
by linear regression analysis (B) A heat map depicts log-transformed cytokine concentrations, with white and black indicating low and high levels,
respectively. Each of the columns corresponds to one sample (n = 6 nasal wash and nasosorption) and each of the rows to one cytokine. A legend assigning
color gradient to log-transformed cytokine levels is displayed. (C) The ratio of cytokine concentrations measured in paired nasosorption and nasal wash
(median and IQR are shown, n = 6).
doi:10.1371/journal.pone.0169805.g006
Superior Cytokine Detection and Reproducible Data from Nasal Microbiopsy
PLOS ONE | DOI:10.1371/journal.pone.0169805 January 20, 2017 10 / 15
respectively. In the symptoms log, a score of 1 represented ‘none to occasional symptoms’ and
5 represented ‘moderately bothersome’. Comparison of area under the curve between the two
groups showed no significant difference in either overall nasal symptoms or general symp-
toms. In addition, we compared nasal and general symptoms between participants with and
without additional nasal sampling on day 1 (before additional sampling) and day 3 (after addi-
tional sampling). There were no significant differences between nasal or general symptoms
with or without additional nasal sampling at these time points.
Discussion
We have shown that non-invasive sampling of the nasal mucosa is well tolerated and repro-
ducible, yielding immune cells that are stable over time. In particular, our results demonstrate
the reliability of nasal curettage as a method for studying the nasal immune response. The abil-
ity to measure cellular phenotype during infection could shed light on the mechanisms that
are involved in pathogen clearance. This technique could also be used in vaccine testing to
define cellular correlates of protection at a mucosal level [20]. Moreover, the use of these sam-
pling techniques will facilitate the investigation of cellular responses in asthma, which includes
an important immunological component of the upper respiratory tract [21].
Immune cells from the nose differed from those in the blood in composition and activation
state. Both T cells and granulocytes collected from the nose displayed an increased activation
profile compared to blood leukocytes, consistent with earlier reports [9]. Moreover, luminal
granulocytes had an increased activation profile compared to those found using nasal curettes.
As neutrophil migration through the epithelial layer depends on interaction with molecules as
Intercellular adhesion molecule 1 (ICAM-1) [22], it is possible that these granulocytes become
activated by the transmigration event itself.
The only difference in proportion of immune cells found between blood and nasal mucosa
was the decreased presence of monocytes in nasal samples. It has been demonstrated that
intestinal macrophages lack CD-14 expression [23]. Staining with additional macrophage
markers (CD163 and CD206) confirmed the low levels of monocytes/macrophages in nasal
mucosa (S3 Fig). Similar to our findings, monocytes were described to be present only at low
levels in nasal aspirates of healthy children [24]. In the presence of influenza A infection
Fig 7. Tolerability of novel nasal sampling methods. The percentage of volunteers rating (A) nasal curettage and (B) nasosorption on discomfort, pain
and lacrimation.
doi:10.1371/journal.pone.0169805.g007
Superior Cytokine Detection and Reproducible Data from Nasal Microbiopsy
PLOS ONE | DOI:10.1371/journal.pone.0169805 January 20, 2017 11 / 15

however, these cells were recruited to the nose [24]. It will be useful to compare nasal cell pro-
files from healthy and diseased individuals using this new sampling technique.
Differences in immune cells were also present between NW and nasal curette samples as
NW yielded almost exclusively granulocytes. The lack of T cells in NW reflects earlier findings
in other body compartments: neutrophils readily enter the lumen in the gut, while T cells are
mostly associated with the epithelial layer [8, 12]. The nasal curette sampling method allows
the collection of such sub-epithelial and intra-epithelial cell populations, while NW is limited
to sampling luminal populations. However, Natural killer (NK) cells and epithelial cells were
found at high levels in nasal washes in a study by Horvath et al [25]. As this study collected
NW through 40 sprays of 100uL of saline followed by forceful expulsion rather than the more
gentle NW approach we employed [11], it is possible that different collection NW techniques
yield different cell populations. Our flow cytometry panel did not include markers that could
assess NK cell frequency in samples collected using NW or curettes. Increased collection of
epithelial cells with nasal curettage compared to NW is likely due to the technique itself (S1
Video) rather than a difference in sample sites.
Although blood and nasal immune cells displayed different profiles, a visible presence of
red blood cells in nasal samples did not change the phenotype of the collected nasal cells. As
the level of leukocytes in blood is relatively low it is not surprising that the presence of red
blood cells at macroscopically visible levels does not indicate a substantial blood leukocyte con-
tamination [26].
Of all immune cells, eighty percent could be identified in both blood and nasal curette sam-
ples. The remaining twenty percent like consists of various types of cells that could not be ana-
lyzed using this flow cytometry panel, such as innate lymphocytes and basophils. Increasing
the number of markers will allow the further study of this fraction, which could potentially
identify other differences in immune composition between blood and nose. As cell yields are
low, the capacity to study rare cell populations or perform functional assays using such col-
lected cells is limited however.
The second nasal sampling technique that we assessed was the use of nasosorption devices
to collect nasal lining fluid. Importantly, the nasal lining fluid contained cytokines in concen-
trations that were increased compared to NW, allowing for the investigation of several cyto-
kines that were undetectable in NW supernatant. A correlation was seen between cytokine
levels that were detected in both nasal lining fluid and those from NW. However, the ratio
between cytokine concentrations in nasal lining fluid and NW was not similar for all cytokines
assessed. One potential explanation is differences in levels could exist for some cytokines in
different nasopharyngeal compartments. As nasal washes sample the entire nasopharynx in
contrast to a localized sample coming from the nasosorption strip this might lead to different
returned cytokine levels. Another possible explanation is that differences exist between cyto-
kines in their propensity to bind to the nasosorption paper. NW is currently the most com-
monly used method to obtain samples from the nasopharynx. Despite this, it has limited
application in multiple clinical scenarios. Here we have demonstrated that nasosorption has
greater sensitivity than the traditional wash and is extremely well tolerated (Fig 7). A potential
problem with sample collection using nasosorption devices can be poor return volume, in par-
ticular if volunteers are dehydrated.
In conclusion, non-invasive mucosal sampling yields nasal cells and nasal lining fluid that
can be used to study both cellular and soluble immune responses at the mucosal surface. Such
sampling is well-tolerated and does not lead to a change in nasal symptoms. These techniques
can be easily implemented and provide researchers with an effective tool to study immunologi-
cal parameters in the upper respiratory tract.
Superior Cytokine Detection and Reproducible Data from Nasal Microbiopsy
PLOS ONE | DOI:10.1371/journal.pone.0169805 January 20, 2017 12 / 15
Supporting Information
S1 Fig. Image of nasal curette (ASL Rhino-Pro©, Arlington Scientific) before insertion into
nostril.
(TIF)
S2 Fig. Image of adsorptive matrix strip (Nasosorption™, Hunt Developments) before
insertion into nostril.
(TIF)
S3 Fig. Flow cytometry data for one volunteer showing with absence of CD163 and CD206
staining in the non-granulocyte immune gate. Some CD14 positive events can be seen for
this volunteer indicating the presence of monocytes in the sample.
(TIF)
S1 Table. Demographics and symptoms of the groups with and without additional nasal
sampling.
(DOCX)
S1 Video. Supplementary video demonstrating correct nasal curette sampling technique.
The curette is placed on the inferior turbinate and then dragged forward to collect cells from
the nasal lining.
(MP4)
Acknowledgments
We thank James Jones and Caroline Corless for assistance in performing Luminex experi-
ments. We would also like to acknowledge Trevor Hansel for his help with establishing curet-
tage sampling procedures.
Author Contributions
Conceptualization: DMF SPJ J. Rylance KP SBG.
Data curation: AS KP SPJ J. Reine.
Formal analysis: SPJ KP J. Rylance.
Funding acquisition: DMF SBG.
Investigation: SPJ KP J. Rylance HA BFC AC JFG CH HH J. Reine AS CS AT ADW SZ DMF.
Methodology: DF SPJ SBG.
Project administration: ADW HH AS DF SBG.
Resources: KP HA CH HH AS SS AT ADW SZ.
Supervision: DMF SBG.
Validation: SPJ BFC J. Reine.
Visualization: SPJ KP.
Writing – original draft: SPJ KP.
Writing – review & editing: SPJ KP J. Rylance HA BFC AC JFG CH HH J. Reine AS CS AT
ADW SZ DMF SBG.
Superior Cytokine Detection and Reproducible Data from Nasal Microbiopsy
PLOS ONE | DOI:10.1371/journal.pone.0169805 January 20, 2017 13 / 15

References1. Lozano R, Naghavi M, Foreman K, Lim S, Shibuya K, Aboyans V, et al. Global and regional mortality
from 235 causes of death for 20 age groups in 1990 and 2010: a systematic analysis for the Global Bur-
den of Disease Study 2010. Lancet. 2012; 380(9859):2095–128. doi: 10.1016/S0140-6736(12)61728-0
PMID: 23245604
2. Murray CJ, Vos T, Lozano R, Naghavi M, Flaxman AD, Michaud C, et al. Disability-adjusted life years
(DALYs) for 291 diseases and injuries in 21 regions, 1990–2010: a systematic analysis for the Global
Burden of Disease Study 2010. Lancet. 2012; 380(9859):2197–223. doi: 10.1016/S0140-6736(12)
61689-4 PMID: 23245608
3. Study GBoD. Global, regional, and national incidence, prevalence, and years lived with disability for
301 acute and chronic diseases and injuries in 188 countries, 1990–2013: a systematic analysis for the
Global Burden of Disease Study 2013. Lancet. 2015; 386(9995):743–800. PubMed Central PMCID:
PMCPMC4561509. doi: 10.1016/S0140-6736(15)60692-4 PMID: 26063472
4. Simell B, Auranen K, Kayhty H, Goldblatt D, Dagan R, O’Brien KL, et al. The fundamental link between
pneumococcal carriage and disease. Expert Rev Vaccines. 2012; 11(7):841–55. doi: 10.1586/erv.12.53
PMID: 22913260
5. Glennie S, Gritzfeld JF, Pennington SH, Garner-Jones M, Coombes N, Hopkins MJ, et al. Modulation of
nasopharyngeal innate defenses by viral coinfection predisposes individuals to experimental pneumo-
coccal carriage. Mucosal Immunol. 2016; 9(1):56–67. PubMed Central PMCID: PMCPMC4703943.
doi: 10.1038/mi.2015.35 PMID: 25921341
6. Traves SL, Proud D. Viral-associated exacerbations of asthma and COPD. Curr Opin Pharmacol. 2007;
7(3):252–8. doi: 10.1016/j.coph.2006.11.010 PMID: 17369093
7. Eggleston PA. Upper airway inflammatory diseases and bronchial hyperresponsiveness. J Allergy Clin
Immunol. 1988; 81(5 Pt 2):1036–41.
8. Jahnsen FL, Farstad IN, Aanesen JP, Brandtzaeg P. Phenotypic distribution of T cells in human nasal
mucosa differs from that in the gut. Am J Respir Cell Mol Biol. 1998; 18(3):392–401. doi: 10.1165/
ajrcmb.18.3.2995 PMID: 9490657
9. Sathaliyawala T, Kubota M, Yudanin N, Turner D, Camp P, Thome JJ, et al. Distribution and compart-
mentalization of human circulating and tissue-resident memory T cell subsets. Immunity. 2013; 38
(1):187–97. PubMed Central PMCID: PMC3557604. doi: 10.1016/j.immuni.2012.09.020 PMID:
23260195
10. Seok J, Warren HS, Cuenca AG, Mindrinos MN, Baker HV, Xu W, et al. Genomic responses in mouse
models poorly mimic human inflammatory diseases. Proceedings of the National Academy of Sciences
of the United States of America. 2013; 110(9):3507–12. PubMed Central PMCID: PMCPMC3587220.
doi: 10.1073/pnas.1222878110 PMID: 23401516
11. Gritzfeld JF, Wright AD, Collins AM, Pennington SH, Wright AK, Kadioglu A, et al. Experimental human
pneumococcal carriage. J Vis Exp. 2013;(72). PubMed Central PMCID: PMC3601207.
12. Fournier BM, Parkos CA. The role of neutrophils during intestinal inflammation. Mucosal Immunol.
2012; 5(4):354–66. doi: 10.1038/mi.2012.24 PMID: 22491176
13. Muller L, Brighton LE, Carson JL, Fischer WA 2nd, Jaspers I. Culturing of human nasal epithelial cells at
the air liquid interface. J Vis Exp. 2013;(80).
14. Proud D, Turner RB, Winther B, Wiehler S, Tiesman JP, Reichling TD, et al. Gene expression profiles
during in vivo human rhinovirus infection: insights into the host response. Am J Respir Crit Care Med.
2008; 178(9):962–8. doi: 10.1164/rccm.200805-670OC PMID: 18658112
15. van Meegen MA, Terheggen-Lagro SW, van der Ent CK, Beekman JM. CFTR expression analysis in
human nasal epithelial cells by flow cytometry. PLoS One. 2011; 6(12):e27658. PubMed Central
PMCID: PMCPMC3233544. doi: 10.1371/journal.pone.0027658 PMID: 22163268
16. Folsgaard NV, Chawes BL, Rasmussen MA, Bischoff AL, Carson CG, Stokholm J, et al. Neonatal cyto-
kine profile in the airway mucosal lining fluid is skewed by maternal atopy. Am J Respir Crit Care Med.
2012; 185(3):275–80. doi: 10.1164/rccm.201108-1471OC PMID: 22077068
17. Leaker BR, Malkov VA, Mogg R, Ruddy MK, Nicholson GC, Tan AJ, et al. The nasal mucosal late aller-
gic reaction to grass pollen involves type 2 inflammation (IL-5 and IL-13), the inflammasome (IL-1beta),
and complement. Mucosal Immunol. 2016.
18. Dhariwal J, Kitson J, Jones RE, Nicholson G, Tunstall T, Walton RP, et al. Nasal Lipopolysaccharide
Challenge and Cytokine Measurement Reflects Innate Mucosal Immune Responsiveness. PLoS One.
2015; 10(9):e0135363. doi: 10.1371/journal.pone.0135363 PMID: 26367003
19. Jackson DJ, Makrinioti H, Rana BM, Shamji BW, Trujillo-Torralbo MB, Footitt J, et al. IL-33-dependent
type 2 inflammation during rhinovirus-induced asthma exacerbations in vivo. Am J Respir Crit Care
Superior Cytokine Detection and Reproducible Data from Nasal Microbiopsy
PLOS ONE | DOI:10.1371/journal.pone.0169805 January 20, 2017 14 / 15

Med. 2014; 190(12):1373–82. PubMed Central PMCID: PMCPMC4299647. doi: 10.1164/rccm.
201406-1039OC PMID: 25350863
20. Schulz AR, Malzer JN, Domingo C, Jurchott K, Grutzkau A, Babel N, et al. Low Thymic Activity and Den-
dritic Cell Numbers Are Associated with the Immune Response to Primary Viral Infection in Elderly
Humans. J Immunol. 2015; 195(10):4699–711. doi: 10.4049/jimmunol.1500598 PMID: 26459351
21. Hinks TS, Zhou X, Staples KJ, Dimitrov BD, Manta A, Petrossian T, et al. Innate and adaptive T cells in
asthmatic patients: Relationship to severity and disease mechanisms. J Allergy Clin Immunol. 2015;
136(2):323–33. PubMed Central PMCID: PMCPMC4534770. doi: 10.1016/j.jaci.2015.01.014 PMID:
25746968
22. Sumagin R, Robin AZ, Nusrat A, Parkos CA. Transmigrated neutrophils in the intestinal lumen engage
ICAM-1 to regulate the epithelial barrier and neutrophil recruitment. Mucosal Immunol. 2014; 7(4):905–
15. PubMed Central PMCID: PMCPMC4062590. doi: 10.1038/mi.2013.106 PMID: 24345805
23. Smith PD, Smythies LE, Mosteller-Barnum M, Sibley DA, Russell MW, Merger M, et al. Intestinal mac-
rophages lack CD14 and CD89 and consequently are down-regulated for LPS- and IgA-mediated activi-
ties. J Immunol. 2001; 167(5):2651–6. PMID: 11509607
24. Gill MA, Long K, Kwon T, Muniz L, Mejias A, Connolly J, et al. Differential recruitment of dendritic cells
and monocytes to respiratory mucosal sites in children with influenza virus or respiratory syncytial virus
infection. J Infect Dis. 2008; 198(11):1667–76. PubMed Central PMCID: PMCPMC2696361. doi: 10.
1086/593018 PMID: 18847373
25. Horvath KM, Herbst M, Zhou H, Zhang H, Noah TL, Jaspers I. Nasal lavage natural killer cell function is
suppressed in smokers after live attenuated influenza virus. Respir Res. 2011; 12:102. PubMed Central
PMCID: PMCPMC3163542. doi: 10.1186/1465-9921-12-102 PMID: 21816072
26. Bonadio WA, Smith DS, Goddard S, Burroughs J, Khaja G. Distinguishing cerebrospinal fluid abnormal-
ities in children with bacterial meningitis and traumatic lumbar puncture. J Infect Dis. 1990; 162(1):251–
4. PMID: 2355199
Superior Cytokine Detection and Reproducible Data from Nasal Microbiopsy
PLOS ONE | DOI:10.1371/journal.pone.0169805 January 20, 2017 15 / 15