Novartis GB06 engl
236
ANNUAL REPORT 2006
Transcript of Novartis GB06 engl

WWW.NOVARTIS.COM ANNUAL REPORT 2006AN
NU
AL R
EP
OR
T 2
00
6 119863_Nova_001_002_ug_e.qxp 24.1.2007 13:10 Uhr Seite 1


1
We want to discover, develop and successfully marketinnovative products to prevent and cure diseases, to ease suffering and to enhance the quality of life.
We also want to provide a shareholder return that reflectsoutstanding performance and to adequately reward those who invest ideas and work in our company.
OUR MISSION
GROUP REVIEW
Overview 2
Letter from Daniel Vasella 5
OPERATIONAL REVIEW
Pharmaceuticals 12
Vaccines and Diagnostics 36
Sandoz 42
Consumer Health 50
CORPORATE CITIZENSHIP
Introduction 56
Commitment to Patients 61
Novartis Foundation for 68Sustainable Development
Commitment to Our People 71
Commitment to Health, 77Safety and Environment
Commitment to Ethical 84Business Conduct
Independent Assurance Report 89
Risk Management 91
CORPORATE GOVERNANCE
Commitment to Corporate Governance 93
Board of Directors 116
Executive Committee 122
Business Unit Heads 125
NOVARTIS GROUP FINANCIAL REPORT 2006
Contents 127
Operating & Financial Review 130
Equity Strategy 153
Novartis Group Consolidated 156Financial Statements
Novartis AG Financial Statements 224
Key Dates 2007 230
Contact Addresses 231
CONTENTS
I N S I D E F R O N T C O V E R : K A M E D A M E D I C A L C E N T E R ; K A M O G A W A C I T Y , C H I B A , J A P A NF R O N T C O V E R : G R U P O D E A P O I O A O A D O L E S C E N T E E À C R I A N Ç A C O M C Â N C E R ; S Ã O P A U L O , B R A Z I L
119863_Nova_000_000_web_e.qxp 24.1.2007 13:19 Uhr Seite 1

2
N O V A R T I S G R O U P B U S I N E S S R E V I E W
KEY FIGURES – GROUP1
(In USD millions unless indicated otherwise)
2006 2005
Group net sales 37 020 32 212Group operating income 8 174 6 905Return on sales (%) 22.1 21.4Group net income 7 202 6 141Research and development 5 364 4 846Research and development
as % of Group net sales 14.5 15.0Free cash flow 4 340 4 673Number of associates at year-end 100 735 90 924
1 Including discontinuing operations
SHARE INFORMATION
2006 2005
Return on average equity (%) 19.3 19.0Earnings per share (USD)1 3.06 2.63Operating cash flow per share (USD) 3.76 3.46ADS price at year-end (USD) 57.44 52.48Share price at year-end (CHF) 70.25 69.05Pay-out ratio based on outstanding
shares (%) 36 33
1 Average number of shares outstanding in 2006: 2 345 232 126(2005: 2 332 848 144)
61%PHARMACEUTICALS
3%VACCINES
AND DIAGNOSTICS
16%SANDOZ
20%CONSUMER HEALTH
2006 GROUP NET SALES BY DIVISION
2006 OPERATING INCOME BY DIVISION1
77%PHARMACEUTICALS
8%SANDOZ
15%CONSUMER HEALTH
Novartis is a world leader in providing medicines to protect health, prevent and treat disease, and toimprove well-being.
Novartis is the only company with leadership positions in patented and generic pharmaceuticals, vaccinesand over-the-counter medicines.
In 2006, Novartis continued to strengthen these strategic growth platforms to meet the needs of patientsand society in a dynamically changing healthcare environment.
GROUP
GROUP NET SALES, OPERATING INCOME AND NET INCOME(Index: 2002 = 100%)
190
175
160
145
130
115
100
20021 20032 20042 2005 2006
Net sales Operating income Net income 1 Not adjusted for new IFRS accounting rules 2 Pro forma adjusted for new IFRS accounting rules
FINANCIAL HIGHLIGHTS
1 Vaccines and Diagnostics had less than 1% impact on Divisional total operating income
119863_Nova_000_000_web_e.qxp 24.1.2007 13:19 Uhr Seite 2

3
0 2 | G R O U P R E V I E W 1 2 | O P E R AT I O N A L R E V I E W 5 6 | C O R P O R AT E C I T I Z E N S H I P 9 3 | C O R P O R AT E G O V E R N A N C E 1 2 7 | N O V A R T I S G R O U P F I N A N C I A L R E P O R T
left: Group Overviewright: News in 2006
GROUP Dynamic 2006 performance from all divisions thanks to a mixture oforganic growth and contributions from recent acquisitions. Group netsales up 15% (+14% in local currencies) to USD 37.0 billion, led byPharmaceuticals. Operating income advances 18% as strong organicgrowth more than offsets acquisition-related costs.
PHARMACEUTICALS Market share gains and double-digit growth in Cardiovascular andOncology franchises drive 11% (+11% lc) net sales increase to USD 22.6 billion. Operating income improvement of 11% despite one-time acquisition costs; up 17% excluding these charges.
VACCINES AND DIAGNOSTICS New strategic growth platform created following Chiron acquisition,making Novartis the world’s second-largest supplier of influenza vaccines in the US. Double-digit net sales growth following April 2006 acquisition.
SANDOZ Sandoz integration of Hexal and Eon Labs largely completed, perform-ing well as sales up 27% (+25% lc) on good underlying retail genericsgrowth. Operating income rises sharply on operational improvements.
CONSUMER HEALTH OTC and Animal Health climb in global rankings thanks to strategicbrands, targeted acquisitions and product innovations. Medical Nutrition, with 2006 sales of approximately USD 1.0 billion, to bedivested during 2007. Net sales, excluding Medical Nutrition, rise 8% (+8% lc) while operating income advances 12%.
PIPELINE One of the industry’s strongest pipelines, with 138 projects in development, focusing on areas of high unmet need. Key R&D areasare cardiovascular/metabolic conditions, oncology and neuroscienceas well as respiratory and infectious diseases.
RESEARCH New discovery approaches and focus on biotechnology compounds at Novartis Institutes for BioMedical Research lead to increase innumber of early-stage projects.
CORPORATE CITIZENSHIP Novartis access-to-medicine programs for those in need reach 33.6 million patients in 2006 through contributions valued at USD 755 million.
DIVIDEND Proposal to shareholders for 2006 of CHF 1.35 per share, an increase of 17% and representing the tenth consecutive year of paying a higher dividend.
NEWS IN 2006
119863_Nova_000_000_web_e.qxp 24.1.2007 13:19 Uhr Seite 3
4
N O V A R T I S G R O U P B U S I N E S S R E V I E W
R H E U M A T O L O G Y S C I E N T I F I C R E S E A R C H I N S T I T U T E ; M O S C O W , R U S S I A
119863_Nova_000_000_web_e.qxp 24.1.2007 13:19 Uhr Seite 4

5
0 2 | G R O U P R E V I E W 1 2 | O P E R AT I O N A L R E V I E W 5 6 | C O R P O R AT E C I T I Z E N S H I P 9 3 | C O R P O R AT E G O V E R N A N C E 1 2 7 | N O V A R T I S G R O U P F I N A N C I A L R E P O R T
Letter from Daniel Vasella
D A N I E L V A S E L L A , M . D .
DEAR SHAREHOLDERS:
It gives me great pleasure in our eleventh busi-ness year to report another set of recordresults.
• Group net sales rose 15% (+14% in localcurrencies) to USD 37 billion
• Operating income advanced 18% to USD8.2 billion
• Net income grew 17% to USD 7.2 billion• Earnings per share (EPS) were up 16%• Free cash flow reached USD 4.3 billion
This outstanding performance reflects ourcontinuous focus on innovation and building abroad portfolio around growth areas of thehealthcare sector. Ultimately, the skills andcommitment of our associates are the key fac-tors for our success, and I would like to thankthem for their contributions.
The pharmaceutical industry is confrontedwith conflicting trends. Demand is continu-ally rising for healthcare services, medicines,vaccines and diagnostics, which is generatinghigher costs that in many countries areincreasingly the focal point of political andsocial debate. Studies have repeatedly proventhat appropriate use of medicines generallyreduces treatment costs and also that themajority of healthcare cost increases are gen-erated in hospitals. However, the pharmaceu-tical industry remains the primary target in thecost debate even though medicines accountfor only 10% to 20% of overall costs, depend-ing on the country.
Still, the healthcare sector will remain adynamic growth area in the future driven bythe following trends:
• The aging of the world’s population contin-ues unabated, generating steadily increas-ing demand for medicines due to the risingincidence of degenerative diseases andcancer as people grow older. The approach-ing wave of retirements in the post-war
“baby boomer” generation will further stimu-late demand in our most important markets.
• The strong economic expansion in popu-lous countries such as China, India andRussia is translating into over-proportionalgrowth in demand for healthcare services.Accompanying this economic growth hasbeen the increasing adoption of lifestylestypical of affluent, industrial countries. That, in turn, has led to a higher incidenceof obesity, chronic cardiovascular disease,diabetes, cancer and lung diseases.
• Finally, new technologies are enabling thediscovery and development of innovativemedicines for patients suffering from otherwise untreatable diseases.
At the same time, our industry faces chal-lenges ranging from government price controlsand intensified competition to increasinglystringent regulatory controls that are escalat-ing the costs of Research & Development.Product liability risks, which can be very cost-ly, are another important factor that is attract-ing a great deal of attention and fueling fun-damental distrust of the industry.
The most far-reaching cost reduction meas-ures taken by various governments includepromoting greater use of generic pharmaceu-ticals, sales of which are likely to experiencedouble-digit growth in the coming years asopposed to the anticipated single-digit growthforecast for patent-protected medicines.
In these industry conditions, “business asusual” is no longer a viable long-term option.Identifying and addressing the needs ofpatients remains at the forefront of all that wedo. This includes taking a serious look at theeconomic and political realities in whichpatients live because this plays a major role indetermining how products are made availableto them. This is why our business portfolio sys-tematically reflects the dynamically changinghealthcare market: growing demand for inno-
119863_Nova_000_000_web_e.qxp 24.1.2007 13:19 Uhr Seite 5
6
N O V A R T I S G R O U P B U S I N E S S R E V I E W
vative medicines (Pharmaceuticals), the risingsupport for greater use of cheaper generics(Sandoz), the increasingly prominent role ofvaccines (Vaccines and Diagnostics) and greaterempowerment of patients (Consumer Health).
We have the best portfolio to optimally lever-age growth opportunities in healthcare in theinterest of both our customers and sharehold-ers while also reducing risks.
Novartis has defined the following strategic ini-tiatives:
• Invest vigorously in R&D to continue bringingnew and innovative products to the market
• Strengthen the Sandoz generics business,which provides affordable treatmentoptions following the expiry of patents
• Expand businesses with synergy potential,such as between Pharmaceuticals, OTC andAnimal Health
• Further build our new growth platform inVaccines and Diagnostics by focusing onpreventive medicine
We sharpened our focus on these priorities in2006, which resulted in the healthcare busi-nesses now accounting for 96% of total netsales compared to just 45% in 1995.
Pharmaceuticals is our most importantdivision, again growing faster than the mar-ket. Strong demand for our top cardiovascularand oncology drugs led the performance.Sales growth in the US and in emerging mar-kets such as China and Russia were particu-larly dynamic, with the performance in Europeless robust. The extraordinary success of ourantihypertensive medicine Diovan is poised tocontinue its dynamic growth. Our cancer ther-apy Gleevec/Glivec generated sales of overUSD 2.5 billion in only its fifth year. Two othercancer medicines, Zometa and Femara, havealso developed well.
Vaccines and Diagnostics enjoyed impres-sive growth, with the integration of the newlyacquired Chiron business proceeding smooth-ly and the successful resolution of qualityproblems in influenza vaccine production. Ournew cell culture production technology forinfluenza vaccines could save lives in the eventof a pandemic flu outbreak due to the shorterlead times. A new seasonal influenza vaccinebased on this technology was submitted forEuropean approval in 2006. New diseases,such as avian flu and SARS as well as resistantbacterial and fungal infections, will continue togenerate strong demand in the future for newvaccines and medicines.
Sandoz expanded its retail generics business,particularly in the US, Eastern and SouthernEurope, Russia, Switzerland, Canada, and Aus-tralia. In Germany, the impact of severe pricepressure was felt. Our recombinant growthhormone Omnitrope became the first follow-on version of an approved biotechnology drugto be granted US and European approvals.Given the large number of biotechnologydrugs already without or set to lose patent pro-tection in the coming years, these so-called“biosimilars” are expected to play an increas-ingly important role by providing patients withaffordable, safe and effective alternatives to theoriginal treatments.
The Consumer Health Division performedvery well as the OTC and Animal Health busi-nesses each posted double-digit net salesgrowth. In line with our continued focus onhealthcare, we signed a definitive agreementto divest the Medical Nutrition business. I amconvinced this transaction is an ideal solutionfor Medical Nutrition, one that offers the man-agement and associates of this business thebest future prospects. Proceeds from thetransaction will further strengthen our financialposition and provide greater strategic flexibility.
Of course, the successes of our businessesdepends not only on strategic objectives butalso in executing them successfully, particu-larly in R&D.
We are planning to launch several innova-tive medicines during the next two yearsand will keep investing vigorously in R&D.We will also further complement our own R&Dprograms through alliances and collaborationsfor development compounds and cutting-edgetechnologies.
Novartis has 138 projects in clinical devel-opment. Among these are 50 new molecularentities (NMEs) and 88 life-cycle managementprojects with new indications or formulations.In 2006, over 20 new projects were added tothe pipeline. Key areas of R&D are cardiovas-cular/metabolic diseases, cancer and neuro-logical conditions as well as respiratory andinfectious diseases.
Shortly before the end of 2006, we receivedapproval from the US Food and Drug Admin-istration (FDA) for Exforge (valsartan andamlodipine), a single-tablet combination of thetwo most prescribed antihypertensives in theirrespective classes, and expect Europeanapproval to follow during the course of thisyear. We also anticipate regulatory decisions in2007 for two other important medicines: Tekturna/Rasilez (aliskiren), a renin inhibitorfor the treatment of hypertension, and Galvus(vildagliptin), a once-daily oral treatment forpatients with type 2 diabetes. The US regula-tory agency extended its review after recentlyavailable data for both Tekturna/Rasilez andGalvus were submitted to clarify open ques-tions. Delays are unfortunately part of ourindustry and inherent in the R&D process.
For two other development compounds, thesubmissions for US and European regulatoryapprovals were accelerated and completedearlier than planned in 2006. Tasigna (nilo-
119863_Nova_000_000_web_e.qxp 24.1.2007 13:19 Uhr Seite 6

7
0 2 | G R O U P R E V I E W 1 2 | O P E R AT I O N A L R E V I E W 5 6 | C O R P O R AT E C I T I Z E N S H I P 9 3 | C O R P O R AT E G O V E R N A N C E 1 2 7 | N O V A R T I S G R O U P F I N A N C I A L R E P O R T
Letter from Daniel Vasella
tinib) is a new treatment option for patientswith certain forms of chronic myeloid leukemiawho have resistance and/or intolerance totreatment with our Gleevec/Glivec, while Aclasta/Reclast (zoledronic acid) is a conven-ient once-yearly infusion lasting only 15 min-utes as a treatment for women with post-menopausal osteoporosis.
Among the many innovative compounds inlate-stage development at Novartis, I would liketo particularly highlight FTY720 and RAD001.
FTY720 (fingolimod) is seeking to become thefirst oral once-daily therapy for patients withrelapsing multiple sclerosis, a condition esti-mated to affect more than 2.5 million patientsworldwide and women at twice the rate asmen. This compound is now in the final stageof development after an earlier Phase II trialshowed positive results during two years oftreatment in helping patients with this poten-tially debilitating neurological condition. Sub-mission is on track for 2009.
RAD001 (everolimus) is a novel oral com-pound in development to inhibit a cell signal-ing pathway called mTOR considered to be animportant therapeutic target in oncology. Ateffective and well-tolerated doses, RAD001 hasdemonstrated broad clinical activity in patientswith various tumor types. This compound actsby directly inhibiting both the growth of tumorcells as well as the formation of new blood ves-sels (angiogenesis). If positive results areachieved in clinical trials with difficult-to-treatforms of cancer, the first regulatory submis-sions could be submitted as early as 2008.
The Novartis Institutes for BioMedical Research(NIBR), created four years ago to strengthen thecompany’s long tradition in drug discovery, isbolstering the pipeline through new discoveryapproaches and an increasing focus on biotech-nology compounds. We are expanding our exist-ing development activities in China by estab-
lishing an integrated R&D institute in Shanghaithat will focus on diseases particular to theregion, such as liver cancer. This is not a “typi-cal” China investment focused on cost savingsbut one aimed at gaining access to the coun-try’s vast talent pool and scientific promise. Thechoice of Shanghai reflects the vitality and eco-nomic potential of this city and the changingglobal economy; it is imperative to have a stronglocal presence in this fast-growing environment.
Novartis has been rapidly advancing itspipeline by complementing internal effortswith collaborations and targeted acquisitions.Last year, we acquired the UK biopharmaceu-ticals company NeuTec and added two com-pounds – Mycograb for fungal infections andAurograb for bacterial infections – that will fur-ther strengthen our presence in the fast-grow-ing hospital infections segment.
Let me close by offering some perspectives onthe challenges facing the pharmaceuticalindustry and how we are addressing the sig-nificant social and political changes underway:
Innovation is our core activity. We must notallow the challenging political environment todistract us from our ultimate goal: discovering,developing and quickly bringing to the marketnew drugs with real therapeutic benefits toboth individual patients and to society. Thepharmaceutical industry is not without criticism,but thanks to the important contributions ofmedicines and vaccines, many infectious diseases can now be prevented or effectivelytreated. Survival rates for children sufferingfrom cancer have doubled in the last 25 years,while the incidence of strokes and heart attackshave been significantly reduced. Novartis medicines – from Gleevec/Glivec and Neoral toCoartem and Clozaril/Leponex – have positivelychanged the lives of thousands, if not millions,of patients around the world. These patientshave benefited enormously from the successof our industry and also Novartis.
Intellectual property rights are central to theeconomy. Without them, many of the breath-taking technological developments since theIndustrial Revolution would not have occurred.Protecting innovation is the best protection forpatients, laying the foundation for the massiveinvestments made by the pharmaceuticalsindustry in R&D that are vital to medicalprogress. Novartis will continue to resist thepressure to soften its position on the need tovigorously protect intellectual property in favorof short-term political gain.
Reputation is valuable capital in the form oftrust, but a resource that cannot be stockpiled.It must be earned daily. Novartis enjoys anexcellent international reputation. However, wemust better explain to the public the positiveimpact of our industry, how it functions, thebenefits of our products for society and therelationship between risk, reward and innova-tion. Our industry has failed to communicateeffectively on the substantial role medicinesplay in reducing overall healthcare costs. Itwould be a serious setback if the demand forinnovative medicines continues but without anunderstanding that innovation requires enor-mous investments and risks – in other words,that innovation has its price.
Corporate citizenship is taken seriously atNovartis and is an integral component of ourbusiness strategy. Our access-to-medicine programs in 2006 reached over 33 millionpatients worldwide, with contributions totalingUSD 755 million. This represented some 2%of our total Group net sales donated to disad-vantaged patients.
The Novartis Institute for Tropical Diseases inSingapore has expanded its research activitiesto include malaria along with tuberculosis anddengue fever, diseases that are still troublingand common in developing countries. Wedecided in 2006 to sharply reduce the averagetreatment price of Coartem, the most effective
119863_Nova_000_000_ih_e.qxp 25.1.2007 10:34 Uhr Seite 7
8
N O V A R T I S G R O U P B U S I N E S S R E V I E W
anti-malaria drug, to USD 1.00 – a loss-mak-ing activity for us. More than 60 million treat-ments were delivered to endemic countrieslast year, a dramatic increase from only fourmillion in 2004 due to our expanded produc-tion capacity.
We are doing what we believe is right: helpingpatients in need while also strengthening ourposition as a reliable partner in the health sec-tor. At the same time, corporate citizenshipalso calls for a strong sense of reality, and thismeans rejecting overblown expectations ofsome stakeholders. We cannot assume theresponsibilities of governments. Well-func-tioning access-to-medicine programs requiregovernments to create the appropriate infra-structure and distribution networks, providelegal certainty and a safe environment – all ofwhich we cannot provide. This can only beachieved through the collaboration of allinvolved stakeholders. It is imperative thatpharmaceutical companies, governments,international organizations and NGOs worktogether to ensure that patients in needreceive proper care.
We must overcome a culture of blaming eachother; the precarious situation in many devel-oping countries is far too serious for symbolicposturing. We are seeking an open dialoguewith all stakeholder groups, one based onmutual trust and tolerance with the aim oflong-term success – not only in access-to-medicine initiatives but also in day-to-daybusiness activities.
Strong values are critical during this time ofrapid change. Now more than ever, strong val-ues are important to hold a company togeth-er: to concentrate energies, guide decisionsand place greater focus on performance objec-tives. Our success during the last 10 years hasbeen based on such values – a consistent focuson performance and results, an open cultureand acting responsibly for patients and soci-
eties. The values of a company become par-ticularly evident during a takeover situation,where there is often a temptation to simplyabsorb the acquired company. I personally seeacquisitions – such as those during the lasttwo years involving Hexal, Eon Labs and Chi-ron – as learning opportunities and assurancethat monotony, complacency and self-satis-faction have no chance of taking hold in ourorganization.
Balancing global aspirations and localidentities is a constant task. The process ofglobalization is not a one-way street; to thinkso would be a dangerous illusion. We mustrespect local and national customs, whetherthey involve languages, cultural aspects or thelaw. At the same time, we have established andare implementing standards throughoutNovartis – particularly our Code of Conductand our Corporate Citizenship Policy andguidelines. For example, Novartis has initiateda “living wage” program to set minimum paystandards around the world for its associates.We expect similar conduct from our businesspartners. We have also set strict global envi-ronmental and safety standards, ones that arethe same at our Basel headquarters as indeveloping countries.
As a shareholder, you naturally have an inter-est in the performance of your company. Ourinnovative and risk-diversified portfolio hasdelivered strong returns when looking at shareprice gains, dividends and spin-offs. Indeed,the value of an investment in Novartis morethan tripled from January 1, 1996, to Decem-ber 31, 2006, exceeding the total shareholderreturn of most of our competitors. I am confi-dent that Novartis will continue to be suc-cessful. Since the creation of Novartis in1996, our company has been a leader ofchange and progress, not a passive observ-er. This remains the case today thanks to ourforward-looking strategy, our considerablepowers of innovation, operational excellence
and solid basic values – Novartis has what ittakes to identify future opportunities and totranslate them into commercial success.
Dr. Marc Moret, a talented leader who servedas Chairman of the Board of Directors of San-doz until the merger with Ciba-Geigy in 1996,passed away on March 17, 2006. One of hismost impressive achievements was certainlythe creation of Novartis. With a strategic fore-sight still admired today, he realized much ear-lier than others how such strong, global organ-izations could succeed in an increasinglycompetitive environment.
The skills, dedication, and integrity of our asso-ciates have enabled us to secure our placeamong the world's most respected and suc-cessful pharmaceutical companies. When itcomes to setting the strategic direction,appointing the best talent to key positions andensuring effective control, our Board of Direc-tors plays a vital role. Dr. h.c. Birgit Breuel willleave the Board at the end of her term at theAnnual General Meeting in March 2007. Wewould like to thank Dr. Breuel for her efficientand valuable contribution to the work of theBoards of both Ciba-Geigy AG and Novartis AG.
I would also like to again thank our associates,whose excellent performance during 2006enabled Novartis to achieve both another yearof record results and improve the lives ofcountless patients worldwide.
My thanks also to you, our shareholders, forthe trust you continue to place in Novartis.
Sincerely,
Daniel Vasella, M.D.Chairman and Chief Executive Officer
119863_Nova_000_000_web_e.qxp 24.1.2007 13:19 Uhr Seite 8

9
0 2 | G R O U P R E V I E W 1 2 | O P E R AT I O N A L R E V I E W 5 6 | C O R P O R AT E C I T I Z E N S H I P 9 3 | C O R P O R AT E G O V E R N A N C E 1 2 7 | N O V A R T I S G R O U P F I N A N C I A L R E P O R T
Letter from Daniel Vasella
T E M B I S A H O S P I T A L ; J O H A N N E S B U R G , S O U T H A F R I C A
119863_Nova_000_000_web_e.qxp 24.1.2007 13:19 Uhr Seite 9

10
N O V A R T I S G R O U P B U S I N E S S R E V I E W
P H A R M A C Y ; M O S C O W , R U S S I A
119863_Nova_000_000_web_e.qxp 24.1.2007 13:19 Uhr Seite 10

11
E M E R G E N C Y D E P A R T M E N T, H O S P I T A L D A S C L Í N I C A S ; S Ã O P A U L O , B R A Z I L
119863_Nova_000_000_web_e.qxp 24.1.2007 13:19 Uhr Seite 11

12
N O V A R T I S G R O U P B U S I N E S S R E V I E W
Excellent performance in our biggest and most profitable business thanks to dynamic growth and market share gains. Approvals were received for new products and indicationsaddressing the needs of patients worldwide.
Strong net sales growth of 11% (+11% lc) to USD 22.6 billion driven by many top-selling products growing at double-digit rates as well as outstanding performances in the US andpriority emerging growth markets.
Operating income rises 17% excluding one-time charges related to integration of Chironpharmaceuticals business, but up 11% to USD 6.7 billion on a reported basis, in line withsales growth.
Cardiovascular, Oncology and Neuroscience franchises all deliver double-digit net sales growth. Hypertension leader Diovan achieves USD 4.2 billion in net sales, while the Oncology drug Gleevec/Glivec tops USD 2.5 billion and Femara delivers 33% growth in localcurrencies.
2007 and 2008 set to be exciting years for new product launches, with approvals pending in the US and Europe – particularly for Exforge and Tekturna (hypertension) as well as Galvus (type 2 diabetes) and Lucentis (blindness).
One of the industry’s top-rated pipelines with six compounds moving into pivotal late-stage trials, led by FTY720 (multiple sclerosis), QAB149 (asthma and COPD), AGO178(depression), RAD001 (cancer), ABF656 (hepatitis C) and SOM230 (Cushing’s disease).
PHARMACEUTICALS
119863_Nova_000_000_web_e.qxp 24.1.2007 13:19 Uhr Seite 12

13
0 2 | G R O U P R E V I E W 1 2 | O P E R AT I O N A L R E V I E W 5 6 | C O R P O R AT E C I T I Z E N S H I P 9 3 | C O R P O R AT E G O V E R N A N C E 1 2 7 | N O V A R T I S G R O U P F I N A N C I A L R E P O R T
Pharmaceuticals
Net sales Operating income 1 Not adjusted for new IFRS accounting rules 2 Pro forma adjusted for new IFRS accounting rules
KEY FIGURES(In USD millions unless indicated otherwise)
2006 2005
Net sales 22 576 20 262Operating income 6 703 6 014Research and development 4 265 3 972Research and development
as % of net sales 18.9 19.6Free cash flow 6 501 5 968Net operating assets 13 640 8 807Additions to property,
plant & equipment1 1 135 686Number of associates at year-end 54 314 49 308
1 Excluding impact of business combinations
NET SALES AND OPERATING INCOME(Index: 2002 = 100%)
180
160
140
120
100
20021 20032 20042 2005 2006
2006
PORTFOLIO REJUVENATION(Net sales in USD millions)
20 000
15 000
10 000
5 000
0
2002 2003 2004 2005
NET SALES BY REGION
2006 2005
US 42% 40%
Europe 32% 34%
Africa/AsiaAustralia 18% 19%
Canada andLatin America 8% 7%
PHARMACEUTICALS
Launch products(0-2 years)
New products(2-5 years)
Mature brands(>5 years)
Non-patentedproducts
119863_Nova_000_000_web_e.qxp 24.1.2007 13:19 Uhr Seite 13

14
N O V A R T I S G R O U P B U S I N E S S R E V I E W
The Novartis Pharmaceuticalsclinical pipeline holds a broad stream of 138 promising future products,with 104 projects in Phase IIand beyond as of December2006, including both newmolecular entities and additional indications or formulations for marketedproducts.
Glossary of terms:
Compound Molecular entity
Generic name International Nonpropri-etary Name (INN) designated by the WorldHealth Organization (WHO)
Indication A disease or condition forwhich a particular drug is believed to bean appropriate therapy
Phase I First clinical trials in patients todetermine safety, tolerability and usuallyproof of concept
Phase II Clinical trials in patients to deter-mine dose ranging, safety and efficacy
Phase III Large clinical trials to determinedefinitive safety and efficacy in patients
Submitted In registration
Therapeutic area Project/compound Generic name Indication
Cardiovascular Galvus vildagliptin Type 2 diabetesand Metabolism Tekturna1/Rasilez1 aliskiren Hypertension
Exforge1 valsartan, amlodipine Hypertension
Diovan/Starlix valsartan, nateglinide Prevention of new-onset type 2 diabetes,NAVIGATOR2 cardiovascular morbidity and mortality
Lotrel ACCOMPLISH amlodipine, benazepril High-risk hypertension
Oncology & Tasigna1 nilotinib Chronic myeloid leukemia (CML)Hematology Tasigna1 nilotinib Gastrointestinal Stromal Tumor (GIST)
PTK7876 vatalanib Colorectal cancer, solid tumors
Gleevec/Glivec imatinib mesylate Glioblastoma multiforme
EPO906 patupilone Ovarian cancer and other solid tumors
RAD001 everolimus Renal cell cancer, pancreatic isletcell tumor and other solid tumors
SOM230 pasireotide Acromegaly, GEP9 tumors, neuroendocrinetumors, Cushing’s Disease
PKC412 midostaurin Acute myeloid leukemia (AML)
LBQ707 gimatecan Solid tumors
LBH589 – Cutaneous T-cell lymphoma,hematologic tumors
Neuroscience Comtan entacapone Parkinson’s disease
Exelon Patch rivastigmine Dementia
LIC477 licarbazepine Bipolar disorder
AGO178 agomelatine10 Depression
FTY720 fingolimod Multiple sclerosis
SAB378 – Chronic pain
Respiratory QAB149 indacaterol COPD11
MFF258 formoterol and mometasone Asthma/COPD11
NVA237 glycopyrronium bromide COPD11
Ophthalmics Lucentis12 ranibizumab Age-related macular degeneration (AMD)Dermatology Lamisil terbinafine Fungal infection of the scalp in childrenGastrointestinal & PTK787 vatalanib AMD14
Urology (ODGU)Elidel pimecrolimus Dry eye
Zelnorm/Zelmac tegaserod Irritable bowel syndrome with constipation
Zelnorm/Zelmac tegaserod Functional dyspepsia
Infectious Certican everolimus Prevention of organ rejectionDiseases, Tyzeka/Sebivo telbivudine Hepatitis BTransplantation Mycograb efungumab Severe fungal infections& Immunology
LDC300 valtorcitabine Hepatitis B(IDTI)Albuferon Albumin interferon alpha 2-b Hepatitis C
NM28316 valopacitabine Hepatitis C
Aurograb – Severe Staphylococcus aureus infections
AEB071 – Transplantation (organ rejection)
Arthritis & Bone Aclasta17 zoledronic acid Paget’s disease of the bone(AB) Aclasta17 zoledronic acid Osteoporosis
Prexige18 lumiracoxib Osteoarthritis, acute pain, primary dysmenorrhea
ACZ885 – Muckle Wells syndrome
ACZ885 – Rheumatoid arthritis
SMC021 calcitonin Osteoporosis
1 Trade name pending regulatory approval2 NAVIGATOR trial examining combination therapy of
Diovan and Starlix3 Bcr-Abl: Breakpoint cluster region-Abelson fusion protein 4 c-Kit: an important receptor tyrosine kinase protein 5 Platelet-derived growth factor receptor protein6 Co-development with Schering AG; registration strategy
under review7 Vascular endothelial growth factor receptor protein8 Mammalian target of rapamycin protein9 Gastroenteropancreatic10 Licensed from Servier; Novartis has rights in the US 11 Chronic obstructive pulmonary disease12 Approved in US; Novartis has rights outside North America13 Vascular endothelial growth factor14 Age-related macular degeneration15 Novartis plans to appeal opinion from European Medicines
Agency (EMEA) committee recommending against Europeanapproval of Zelmac
16 Idenix compound; Novartis has exercised option to license17 Zoledronic acid (5 mg) is marketed under the trade name Aclasta
in Europe and is awaiting US approval of a new trade name18 Lumiracoxib is marketed under the trade name Prexige in vari-
ous markets and is awaiting US approval of a new trade name19 Tentative approval – pending expiration of amlodipine besylate
pediatric exclusivity
119863_Nova_000_000_web_e.qxp 24.1.2007 13:19 Uhr Seite 14

15
0 2 | G R O U P R E V I E W 1 2 | O P E R AT I O N A L R E V I E W 5 6 | C O R P O R AT E C I T I Z E N S H I P 9 3 | C O R P O R AT E G O V E R N A N C E 1 2 7 | N O V A R T I S G R O U P F I N A N C I A L R E P O R T
Pharmaceuticals
Mechanism of action Formulation Planned submission dates Phase I Phase II Phase III Submitted
Dipeptidyl peptidase 4 (DPP 4) inhibitor Oral Submitted EU, US
Renin inhibitor Oral Submitted EU, US
Angiotensin-II receptor antagonist (ARB) Oral Submitted EU, (approved US)19
and calcium channel blocker
Angiotensin-II receptor antagonist (ARB) Oral >2010and insulin secretagogue
Angiotensin I converting enzyme (ACE) Oral 2009inhibitor and calcium channel blocker
Bcr-Abl3, c-Kit4 and PDGFR5 inhibitor Oral Submitted EU, US
Bcr-Abl3, c-Kit4 and PDGFR5 inhibitor Oral 2009
VEGFR7 inhibitor Oral 2007
Bcr-Abl3, c-Kit4 and PDGFR5 inhibitor Oral 2008
Microtubule depolymerization inhibitor Intravenous 2009
mTOR8 inhibitor Oral 2008
Somatostatin analogue Injection 2009
Signal transduction inhibitor Oral >2010
Topoisomerase-I inhibitor Oral >2010
Deacetylase inhibitor Oral 2008
Catechol-O-methyltransferase inhibitor Oral Submitted Japan, (approved EU, US)
Cholinesterase inhibitor Transdermal Patch Submitted EU, US
Voltage-sensitive sodium channel blocker Oral 2008
Melatonin (M1/2) receptor agonist and serotonin Oral 2008(5-HT2C) receptor antagonist
Sphingosine-1-phosphate receptor modulator Oral 2009
Cannabinoid-1 receptor agonist Oral >2010
Once-daily beta-2 agonist Inhalation 2008
Once-daily beta-2 agonist and long-acting steroid Inhalation 2008
Long acting antimuscarinic Inhalation >2010
VEGF13 blocker Intra-vitreal injection Submitted EU
Fungal squalene epoxidase inhibitor Oral Submitted US
Angiogenesis inhibitor Oral >2010
T-cell and mast cell inhibitor Eye drops >2010
5HT4-receptor agonist Oral 2007 (EU)15, (approved US)
5HT4-receptor agonist Oral 2008
Growth-factor-induced cell proliferation inhibitor Oral Submitted US, Japan, (approved EU)
Viral polymerase inhibitor Oral Submitted EU, (approved US)
Anti-HSP90 antibody Intravenous 2009 (US), (submitted EU)
Viral polymerase inhibitor Oral 2009
Long-acting interferon Intravenous 2009
Viral polymerase inhibitor Oral >2010
Anti-Staph. aureus antibody Intravenous >2010
Protein Kinase C inhibitor Oral >2010
Bisphosphonate: osteoclast inhibitor Intravenous Submitted US, (approved EU)
Bisphosphonate: osteoclast inhibitor Intravenous Submitted EU, US
Cyclo-oxygenase-2 inhibitor Oral 2007 (US), (approved EU)
Anti-interleukin-1 beta (IL-1β) antibody Injection 2009
Anti-IL-1β antibody Injection >2010
Regulator of calcium homeostasis Oral >2010
119863_Nova_000_000_web_e.qxp 24.1.2007 13:19 Uhr Seite 15

16
N O V A R T I S G R O U P B U S I N E S S R E V I E W
T R A D I T I O N A L C H I N E S E M E D I C I N E ; M A C A U , C H I N A
119863_Nova_000_000_web_e.qxp 24.1.2007 13:19 Uhr Seite 16

17
0 2 | G R O U P R E V I E W 1 2 | O P E R AT I O N A L R E V I E W 5 6 | C O R P O R AT E C I T I Z E N S H I P 9 3 | C O R P O R AT E G O V E R N A N C E 1 2 7 | N O V A R T I S G R O U P F I N A N C I A L R E P O R T
Pharmaceuticals
High blood pressure and its consequences affect one in four adults – more than a billion people worldwide – and kill more than 7 million people every year. Type 2 diabetes causes 3 million deaths annually. Both diseases remain under-diagnosed and poorly treated – but Novartis is poised to expand its broad Cardiovascular and Metabolism portfolio, offering patients and physicians break-through innovations with the potential to transform treatment.
CARDIOVASCULAR AND METABOLISM
lar and Metabolism franchise. Galvus(vildagliptin) and Tekturna1 (aliskiren) com-pleted clinical testing last year and are nowunder regulatory review in both the US andEurope for treatment of type 2 diabetes andhypertension, respectively.
“We are very confident of the efficacyand safety profiles of Galvus and Tekturna,”says Thomas Ebeling, Head of the Pharma-ceuticals Division and member of the Executive Committee of Novartis. “And weare ready to roll as soon as we receive thego-ahead from regulators.”
Both medicines have innovative mecha-nisms of action and may offer patients theadded promise of delaying, or perhaps evenpreventing, disease onset. Novartis has em-barked on major “outcome” trial programsfor Galvus and Tekturna to realize their fullmedical and commercial potential. Tekturnawas developed in collaboration with Speedel.
Outcome studies can span severalyears, involve thousands of patients and costhundreds of millions of dollars – but they areviewed as the gold standard in demonstrat-ing safety and efficacy of a drug to patientsand physicians. They also are considered thegold standard of value-for-money by cost-conscious governments, insurers and otherpayors.
“We drove Diovan success by creatingand continuously adding to outcome data,”says John Glasspool, Head of the Cardiovas-cular and Metabolism Business Franchise atNovartis. “We aim to do the same for Galvusand Tekturna, and move medical practice1 Marketed under the brand name Rasilez outside the US
US regulatory approval of Exforge in Decem-ber culminated a year packed with submis-sions and decisions for Novartis, setting thestage for a series of major launches over thenext two years.
Exforge is the first treatment for highblood pressure to combine the two mostprescribed, branded antihypertensive medi-cines in their classes – Diovan and the calci-um channel blocker amlodipine besylate.Tentative approval by the US Food and DrugAdministration will permit the launch ofExforge in September 2007, after the expi-ration of market exclusivity for amlodipinebesylate.
In an extensive clinical program involv-ing over 5 000 patients, Exforge helped up to 9 out of 10 patients reach their treat-ment goal (diastolic blood pressure under90 mm Hg, or more than a 10 mm Hg reduc-tion in diastolic pressure from baseline).That high proportion of treatment successstands in sharp contrast to the estimated 7of 10 people with high blood pressure todaywho either remain undiagnosed or fail toreach their blood pressure targets.
“Exforge offers a potential solution tomany people with high blood pressure whocurrently need two or more medicines tocontrol their illness,” says James Shannon,M.D., Head of Pharmaceutical Developmentat Novartis.
Meanwhile, two additional breakthroughmedicines from Novartis are poised to forti-fy the dynamic portfolio of the Cardiovascu-
119863_Nova_000_000_web_e.qxp 24.1.2007 13:19 Uhr Seite 17

18
N O V A R T I S G R O U P B U S I N E S S R E V I E W
forward with studies we believe will demon-strate that these novel therapies can preventand modify progression of type 2 diabetes andhypertension, and ultimately help save lives.”
The Diovan Heritage
Exforge builds upon the heritage of Diovan,the flagship antihypertensive treatmentfrom Novartis. Diovan sustained buoyantgrowth during 2006 as sales climbed 15%,to USD 4.2 billion. Already the world’s mostprescribed angiotensin receptor blocker(ARB), Diovan is expected to pass brandedamlodipine this year and become the top-selling medication for high blood pressureworldwide.
The success of Diovan has been fueledby powerful efficacy and a broad range ofapproved indications. Those multiple appli-cations reflect a comprehensive program of outcome studies involving more than 40 000 patients across the cardiovascularcontinuum.
The megatrial program delivered newresults in 2006 when the biggest clinicalstudy of an ARB to date in Japan confirmedthe efficacy of Diovan, as well as its excellentcardiovascular profile, compared to theother studied antihypertensive therapies.The JIKEI Heart Study – involving more than3 000 patients, and conducted by the JikeiUniversity School of Medicine in Tokyo – washalted early for ethical reasons after aninterim statistical analysis showed Diovanhad reduced stroke by 40%, and heart fail-ure by 46%, compared to non-ARB therapiesbeing used as comparators.
According to Professor Sebu Mochizuki,M.D., of Jikei University, Chairman of theJIKEI Heart Study executive committee, thesignificantly reduced incidence of strokeshown in the trial “will be of particular inter-
est to clinicians because there is a higherprevalence of stroke in the Japanese popu-lation than in Western society.”
Biggest Killer
High blood pressure and its consequencesaffect an estimated one in four adults – a bil-lion people worldwide. The disorder is theleading cause of risk-attributable death,accounting for more than 7 million deathsper year. One person dies somewhere in theworld from a hypertension-related diseaseevery five seconds.
“Blood pressure is very poorly con-trolled,” says Matthew Weir, M.D., Professorof Medicine at University of Maryland. Evenusing a relatively unchallenging definition ofnormal blood pressure, Dr. Weir adds, only30% of patients in the US achieve goal bloodpressure. “And America does better thananyplace else. Our friends in Europe havemuch lower percentages of people with highblood pressure under control.”
Clinical studies have clearly demon-strated that effective treatment of high bloodpressure reduces coronary and renal events,and strokes. Yet to the frustration of healthauthorities around the world, it’s a formida-ble challenge to keep patients on therapylong enough to reap those benefits.
Physicians increasingly view combina-tion therapy as an important tool to improvepatient compliance. “If you use two drugs asa single entity, as opposed to giving them asmultiple tablets, there is significantly betteradherence to therapy,” Dr. Weir says. “I thinkthis is the way we have to go in the future andI suspect that sooner or later we will see thedevelopment of triple combinations as well.”
In the Exforge clinical trial program,involving more than 5 000 people withhypertension, clinically significant blood
pressure reductions and a good safety andtolerability profile were observed. “Exforgereally starts to separate from other highlyeffective agents in treatment of poorly con-trolled patients with severe hypertension,”says Ameet Nathwani, M.D., Head of ClinicalDevelopment and Medical Affairs, Cardio-vascular and Metabolism Business Fran-chise. One example, he says, is a studywhere Exforge produced greater blood pressure reductions than treatment with acombination of lisinopril and hydrochloro-thiazide.
“We believe Exforge may become themost efficacious agent in the antihyperten-sive category,” Dr. Nathwani adds.
Promise of Galvus
An estimated 240 million people worldwidehave diabetes today, and prevalence isexpected to rise rapidly, reaching 380 mil-lion people by 2025, according to the Inter-national Diabetes Federation (IDF). Over thecoming two decades, IDF estimates that thenumber of people with diabetes in Europewill rise by 20%. Corresponding increaseswill be 50% in North America, 85% in LatinAmerica and a doubling of prevalence inAfrica and South-East Asia.
Type 2 diabetes, which accounts forabout 90% of total diabetes cases, hasemerged as a public health epidemic, caus-ing more than 3 million deaths a year. Diabetes is a leading cause of blindness inadults in developed countries, as well as the most common cause of non-accident-related amputation.
Treatment costs for diabetes account forbetween 5% and 10% of national healthcarebudgets worldwide, according to IDF. Boththe human and economic costs of the disease could be reduced by aggressive
119863_Nova_000_000_web_e.qxp 24.1.2007 13:19 Uhr Seite 18

19
0 2 | G R O U P R E V I E W 1 2 | O P E R AT I O N A L R E V I E W 5 6 | C O R P O R AT E C I T I Z E N S H I P 9 3 | C O R P O R AT E G O V E R N A N C E 1 2 7 | N O V A R T I S G R O U P F I N A N C I A L R E P O R T
Pharmaceuticals
investment in prevention – particularly earlydetection to avoid onset of diabetic compli-cations.
That isn’t happening, however, and atleast half of all people with diabetes remainunaware of their condition. Type 2 diabetes,where control of blood sugar deterioratesover time, has traditionally been associatedwith advancing age and is more common inpeople who are overweight or obese, or havea family history of diabetes. That profile ischanging, however, with younger peopleincreasingly being diagnosed with the con-dition.
Dysfunction of insulin-producing isletcells in the pancreas is a major factor under-lying type 2 diabetes, together with insulinresistance, or deterioration in the body’sability to use the insulin that islet cells man-age to produce. Normally, blood glucose ismaintained at optimal levels by an exquisitebalance between insulin – the hormone thatremoves sugar from the blood to be storedas energy in cells – and glucagon, a hormonewhich releases sugar into the blood to feedthe body’s energy requirements.
Once beta islet cells which produceinsulin and alpha islet cells that produceglucagon start failing, the usual fine controlof blood glucose is disrupted. As insulinsecretion dwindles, the usual check-and-balance on glucagon weakens. Alpha cellsare unleashed to flood glucagon into theblood and drive up glucose levels, the hall-mark of type 2 diabetes.
The mechanism of action of Galvus –inhibiting an enzyme called DPP-4 – increasesinsulin release and reduces secretion ofglucagon, improving the ability of beta andalpha islet cells to appropriately sense andrespond to sugar in the blood.
“The impact of glucagon has beenundervalued, and more and more physicians
are recognizing that maintaining theglucagon/insulin balance not only can nor-malize islet function but also have an impacton insulin resistance by peripheral utiliza-tion,” Dr. Nathwani says. “That’s one of thereasons why we are really excited by the newmechanism of action.”
Galvus – a once-daily oral agent – hasbeen evaluated both as monotherapy and incombination with other antidiabetic agents.In clinical studies involving more than 4 500patients, Galvus demonstrated significantreductions in blood sugar that were sus-tained during treatment for up to two years.
Improved tolerability also sets Galvusapart from traditional oral antidiabetic med-icines – and could help to improve currentlow levels of compliance. The majority ofpatients who receive treatment for type 2diabetes today fail to reach the target levelsfor blood glucose set by the American Dia-betes Association.
“Patients aren’t treated optimally be-cause existing drugs have significant limita-tions and aren’t well tolerated,” Dr. Shannonsays. “Patients don’t like to move onto ther-apy because all drugs, including thia-zolidinediones (TZDs), are encumbered byside effects, particularly edema and weightgain. By acting against patients when theyare trying very hard to lose weight, thosedrugs create a significant psychologicalproblem that weakens adherence to therapy.”
In one head-to-head comparison be-tween Galvus and rosiglitazone, an insulinsensitizer, patients treated with Galvus had amean reduction of body weight greater thanone kilogram; there was an overall mean dif-ference of 2.8 kilograms between the Galvusand rosiglitazone groups. This weight losswas achieved with blood sugar-lowering effi-cacy comparable to rosiglitazone.
Extended Review
Late last year, Novartis announced a three-month extension of the US regulatory reviewof Galvus after the company decided to sub-mit additional clinical data to the FDA. Theoriginal regulatory submission to the FDAhad included data from approximately2 800 patients, treated for up to 12 months,and the subsequent submission represent-ed data from an additional 1 000 patientyears of treatment with Galvus.
The submission of supplemental datacame in response to questions from the FDAabout lesions seen on the skin of some mon-keys treated with Galvus in a study request-ed by the agency. In that study, however,monkeys received doses several orders ofmagnitude higher than the proposed thera-peutic dose. The side effects hadn't beenseen in previous studies by Novartis in mon-keys given a therapeutic dose of Galvus.Moreover, there hasn't been a similar findingin any other species – or in any humanpatient treated with Galvus in clinical trialslasting up to 24 months.
“FDA has the right to extend the reviewperiod if they believe that a companyalready has in its possession sufficient datato address concerns the agency may have,”Dr. Shannon says. “We haven’t seen any-thing even resembling this in our patientstudies – that’s why we have submitted theadditional data.”
Underscoring that confidence, Novartishas embarked on a new round of clinicalstudies aiming to demonstrate the full po-tential of Galvus. A study known as GALIANT,involving more than 7 500 people in the US,is comparing safety and efficacy of Galvusand the TZD class of insulin sensitizers in areal-world, primary care setting. Important-ly, the GALIANT study will assess the impact
119863_Nova_000_000_web_e.qxp 24.1.2007 13:19 Uhr Seite 19
20
N O V A R T I S G R O U P B U S I N E S S R E V I E W
H E R S F L A N D O L D A G E H O M E ; J O H A N N E S B U R G , S O U T H A F R I C A
119863_Nova_000_000_web_e.qxp 24.1.2007 13:19 Uhr Seite 20
21
0 2 | G R O U P R E V I E W 1 2 | O P E R AT I O N A L R E V I E W 5 6 | C O R P O R AT E C I T I Z E N S H I P 9 3 | C O R P O R AT E G O V E R N A N C E 1 2 7 | N O V A R T I S G R O U P F I N A N C I A L R E P O R T
Pharmaceuticals
of Galvus in many different patient popula-tions, including the elderly, different ethnicgroups, and patients with varying degrees ofbody mass index.
GALIANT is seeking to confirm results ofa smaller study where patients receivingGalvus as monotherapy had significantreductions in blood sugar similar to levelsseen in patients treated with rosiglitazone, adrug in the TZD class.
The GLORIOUS program comprises fivestudies designed to demonstrate the diseasemodification potential of Galvus. The studieswill explore the potential of Galvus both toprevent progression to diabetes in groups athigh risk of developing the disease – as wellas to delay disease progression in peoplewho already have developed type 2 diabetes.
Like GALIANT, the GLORIOUS studieswill involve diverse patient populations. Onewill test the ability of Galvus to prevent pro-gression to type 2 diabetes in Asian patientswith impaired glucose tolerance, a major riskfactor. “Asian populations have a differentpathophysiology and a very high conversionrate to diabetes,” Dr. Nathwani says.
“We’re also looking to see if we can sta-bilize patients with type 2 diabetes byadding Galvus to metformin, the currentstandard of care,” he adds. “Most doctorsare already using metformin and this studywill provide cutting-edge information theywant. Often, combination studies only appearyears after a new medicine comes to market.”
The GLORIOUS program will seek toconfirm early indications that treatment withGalvus leads to meaningful reductions inblood pressure of patients, parallel with ben-eficial effects on blood sugar levels. “Weplan to look at a novel population of high-risk cardiovascular patients treated withGalvus. Endpoints will include both a reduc-tion in cardiovascular events, as well as
development of their diabetes,” Dr. Nathwaniexplains.
It is an area of longstanding interest.Novartis believes that preventing diabeteswill also lead to a reduction in cardiovascu-lar consequences.
In parallel, groundbreaking data is expect-ed from NAVIGATOR, an ongoing study in theDiovan megatrial program, that is exploringthe possibility of preventing progression oftype 2 diabetes and cardiovascular events inpeople with impaired glucose tolerance.
“In the VALUE study, treatment with Diovan reduced new-onset diabetes by23%,” Dr. Nathwani says. “We’re confidentthat GLORIOUS and NAVIGATOR will providedefinitive evidence that reducing new-onsetdiabetes can prevent heart attacks andstroke.”
“A Long Way to Go…”
Medicines blocking the renin-angiotensin-aldosterone system (RAAS), including ACEinhibitors and ARBs, have led to someimpressive advances in treatment of highblood pressure. “Yet current therapies havenot delivered the major reductions of cardiovascular outcomes researchers andphysicians had hoped for,” Dr. Weir says.“There is a long way yet to go.”
Part of the problem seems to be a bio-logical bypass route that, over time, circum-vents the effect of some drugs that block theoutputs of the RAAS. For several decadesresearchers have speculated that directlyinhibiting the activation point of RAAS maybe more effective. The enzyme renin is thekey activator of the RAAS.
Tekturna, the new first-in-class directrenin inhibitor from Novartis, represents thefirst new treatment approach for high bloodpressure in more than a decade.
Regulatory applications for Tekturnafiled in Europe and the US last year includ-ed data from 44 clinical trials, involvingalmost 8 000 people with hypertension.Results show Tekturna produces sustained,double-digit reductions in blood pressurebeyond 24 hours, with placebo-like tolera-bility within the expected therapeutic doserange.
In particular, clinical data presented latelast year highlighted the power of Tekturnato offer “beyond 24-hour” blood pressurecontrol during up to a full year of therapy.“Control beyond 24 hours may give doctorsconfidence that if a patient does occasional-ly miss a dose, which happens fairly often inthe real world, there would not be a bloodpressure penalty to be paid,” Dr. Weir says.“And that could be a very positive attributein selecting an antihypertensive.”
The FDA’s review of Tekturna was extend-ed by three months in December to enablethe agency to consider additional data sub-mitted by Novartis to support the safety pro-file of the new medicine. Novartis continuesto work closely with the FDA and is confidentthat the supplementary information will helpsecure approval of Tekturna in the US.
Demonstrating Concrete Benefits
A more definitive assessment of renin inhi-bition will come in the Tekturna outcomeprogram called ASPIRE HIGHER – a suite ofstudies involving more than 30 000 peoplewith high blood pressure that will be con-ducted over the coming five years. ASPIREHIGHER aims to demonstrate that Tekturnahas the potential to redefine treatment stan-dards and provide long-term benefitsbeyond blood pressure control – such aspreventing hypertension or the onset of dia-betes, and reducing cardiovascular mortali-
119863_Nova_000_000_web_e.qxp 24.1.2007 13:19 Uhr Seite 21
22
N O V A R T I S G R O U P B U S I N E S S R E V I E W
gram. “Although the science is still emerg-ing, direct renin inhibition may offer substantial benefits to patients,” says Hans-Henrik Parving, M.D., a researcher at theSteno Diabetes Center in Denmark and leadinvestigator for ALTITUDE.
Patients and physicians around theworld will be watching. “Outcome trials suchas Val-HEFT, VALIANT and JIKEI are worthgold to doctors,” says Alan Gradman, M.D.,Chief of Cardiovascular Diseases at TheWestern Pennsylvania Hospital in Pitts-burgh, Pennsylvania.
“Many patients have co-morbidities likekidney disease or a history of heart attackthat I have to consider when treating them.These outcome trials not only advance car-diovascular medicine, they help me answerkey questions about treating patients on aday-to-day basis,” Dr. Gradman adds. “Welook forward to the results of megatrials likeNAVIGATOR as well as the outcome trialsNovartis is planning for Tekturna and Galvus.”
ty and morbidity among high-risk patientsstill at an early stage of the disease.
Direct renin inhibition may offer a ben-eficial effect for both the kidney and theheart. In studies to date, Novartisresearchers have identified a dose-depend-ent increase in renal blood flow amongpatients treated with Tekturna. Resultsexpected this year from studies called AVOIDand ALOFT could give early insight into apossible protective effect of Tekturna.
Moreover, studies have shown that Tekturna reduces plasma renin activity (PRA)– and some scientists believe that loweringPRA will reduce the risk of heart attacks andkidney failure. “There is a huge hypertensivepopulation out there at risk of developingcardiovascular and renal disease,” Dr. Shan-non says. “But if there are concrete benefitsbeyond blood pressure from reducing PRA,we still have to demonstrate them in theASPIRE HIGHER program.”
One opportunity will be a study calledALTITUDE, part of the ASPIRE HIGHER pro-
119863_Nova_000_000_web_e.qxp 24.1.2007 13:19 Uhr Seite 22

23
0 2 | G R O U P R E V I E W 1 2 | O P E R AT I O N A L R E V I E W 5 6 | C O R P O R AT E C I T I Z E N S H I P 9 3 | C O R P O R AT E G O V E R N A N C E 1 2 7 | N O V A R T I S G R O U P F I N A N C I A L R E P O R T
Pharmaceuticals
R H E U M A T O L O G Y S C I E N T I F I C R E S E A R C H I N S T I T U T E ; M O S C O W , R U S S I A
119863_Nova_000_000_web_e.qxp 24.1.2007 13:19 Uhr Seite 23

24
N O V A R T I S G R O U P B U S I N E S S R E V I E W
T R A N S F U S I O N R O O M , D I A G N O S T I C A N D T H E R A P E U T I C C E N T E R O F T R A D I T I O N A L C H I N E S E M E D I C I N E , S H U G U A N G H O S P I T A L ; S H A N G H A I , C H I N A
119863_Nova_000_000_web_e.qxp 24.1.2007 13:19 Uhr Seite 24

25
0 2 | G R O U P R E V I E W 1 2 | O P E R AT I O N A L R E V I E W 5 6 | C O R P O R AT E C I T I Z E N S H I P 9 3 | C O R P O R AT E G O V E R N A N C E 1 2 7 | N O V A R T I S G R O U P F I N A N C I A L R E P O R T
Pharmaceuticals
dose, Exjade has the potential to greatlyenhance acceptance of therapy not justamong people with thalassemia, but also ironoverload in transfused patients with sicklecell disease, myelodysplastic syndromes andother rare anemias.
Leyla Agaoglu, M.D., a hematologistbased in Istanbul, Turkey, sees many peoplewith thalassemia in her practice, reflectingthe relatively high incidence of the disorderamong people of Mediterranean origin orancestry, as well as people of Asian andAfrican descent. Dr. Agaoglu calls Exjade andGlivec, the breakthrough, targeted anticancertherapy from Novartis, “the two most signif-icant advances in hematology in decades.”
Centuries of migration by people cross-ing borders in search of a better life havespread thalassemia and other transfusion-related anemias around the world – buteffective treatment hasn’t kept pace. Up totwo-thirds of the estimated 40 000 people inthe US who have iron overload as a result ofregular blood transfusions don’t currentlyreceive iron chelation therapy. If patientsdon’t receive adequate chelation, iron canaccumulate in the liver, the heart and variousendocrine organs, eventually causing organfailure, significant morbidity and early death.
Ms. Langan insists that Exjade couldmake a positive impact on many people inthe US, and around the world. As she told theFDA panel: “Children could go to sleepoverswithout fear of ridicule and their parentscould let them go without being afraid thekids would skip their medicine. Young adultswould feel more confident and accepted at
Iron overload is a potentially life-threatening disorder – a consequence of repeatedblood transfusions required to treat disorders ranging from thalassemia to sickle cell disease. The promise of Exjade is greater convenience for patients currentlyreceiving treatment – and expansion of benefits to people who haven’t previouslybeen treated.
ONCOLOGY AND HEMATOLOGY
Cathi-Jo Langan – CJ to her friends – wasborn with beta thalassemia, a disease causedby a genetic mutation that damages redblood cells.
Ms. Langan has survived thanks to regu-lar blood transfusions since the age of three– yet those repeated transfusions also have aserious side effect, a potentially fatal build-upof iron in her body. For years, she kept theiron overload under control by injecting amedicine from Novartis called Desferal.
Desferal is an iron chelator that removesexcess iron from the body. The drug is welltolerated and effective – but requires cum-bersome infusions via a portable pump thattake up to 12 hours a day, five to seven daysa week. Eventually, that lifelong regimenbecame all but unbearable to Ms. Langan.
Speaking at an open hearing at the USFood and Drug Administration, she described“pushing and pushing with all my might toget this needle into my stomach but it wouldnever penetrate, causing much aggravationand ending with me sitting on my floor, inpure desperation.”
In 2003, she joined a clinical study test-ing a new oral iron chelator from Novartis.The drug is called Exjade (deferasirox) and itis formulated as a tablet that can be dis-persed in a glass of juice or water. “I cannottell you how much Exjade has changed mylife,” Ms. Langan adds.
As the first and only once-daily oral ironchelator, Exjade is an important break-through in providing continuous protectionagainst the harmful effects of excess iron dueto blood transfusions. With a single daily
119863_Nova_000_000_web_e.qxp 24.1.2007 13:19 Uhr Seite 25

26
N O V A R T I S G R O U P B U S I N E S S R E V I E W
tial data from the US and Switzerland showthat patients who weren’t previously receiv-ing chelation therapy account for about 50%of Exjade prescription volume.
“And treatment of transfusional ironoverload could turn out to be just the begin-ning,” Mr. Epstein adds. “New studies inother disease areas may expand the numberof people who can benefit from Exjade.” Onesuch study is already underway – testingExjade in treatment of hereditary hemochro-matosis, a genetic disorder leading to abnor-mal accumulation of iron in the liver, heartand endocrine organs.
To address the needs of US patientsundergoing chelation therapy, Novartis hasimplemented a patient support program –called EPASS Complete Care. EPASSincludes features ranging from convenienthome delivery of prescription refills by amail-order pharmacy, to ongoing compli-ance programs and individual case man-agement regarding prescription reimburse-ment coverage.
Unmet medical need, and the opportu-nity for Exjade, may be even greater outsidethe US and Europe – where the majority ofthalassemic patients live, often withoutaccess to universal medical care. Writing inthe New England Journal of Medicine in2005, hematologists Deborah Rund, M.D.,and Eliezer Rachmilewitz, M.D., noted thatthalassemia is among the most commongenetic disorders worldwide. Most patientswith the disease, however, reside in less devel-oped countries where “safe transfusion” andchelation are not universally available.
“Many patients with thalassemia inunderdeveloped nations die in childhood oradolescence. Programs that provide accept-able care, including transfusion of safe bloodand supportive therapy including chelation,must be established,” the authors added.
Recognizing the medical need fordeferasirox, Novartis will work with localhealth authorities and others on a country-by-country basis to enhance access. Formost countries, this will be accomplishedthrough the Exjade brand – but for low-income patients in countries in the Indiansubcontinent and Africa, with high medicalneed and sufficient healthcare infrastructureto support treatment, Novartis will providedeferasirox through a specific brand at apreferential price.
Life-threatening Anemia
People with thalassemia have fewer redblood cells than normal and at the sametime have inherited genetic mutations thatreduce output of hemoglobin, the protein inred blood cells that carries oxygen to allparts of the body. The result is anemia thatcan be life-threatening.
Regular transfusions normalize both thenumber of red blood cells and hemoglobinlevels – but at the same time lead to excesslevels of iron which can damage the liver,heart and other parts of the body. By thetime a patient has received 10 transfusions,significant iron overload has already begun.
The body, however, has no mechanismto remove the excess iron. Desferal, the stan-dard of care in chelation, has a half-life inthe body of 20–30 minutes and must begiven by continuous infusion. Survival isexcellent if a patient takes treatment five ormore days per week – but falls off sharply ifpatients fail to comply with prolonged dailyinfusions.
Exjade, by contrast, has a half-life of 12 to 16 hours, so a single daily dose main-tains effective levels of active chelator formore than 24 hours, ensuring that there areno gaps in chelation coverage. Clinical stud-
college,” she added. “We patients wouldhave free lives, no longer tethered to a pump.And we could have less of the anger and frus-tration that we can’t get rid of right now.”
Improving on Desferal
It took 14 years of research to deliver a suc-cessor to Desferal, a medicine launchedmore than 40 years ago and derived from anatural substance originally discovered in aniron-eating bacterium called Streptomycespilosus. Novartis scientists repeatedly en-countered obstacles in their hunt for areplacement and synthesized hundreds ofmolecules before choosing a candidate com-pound called ICL670 to enter clinical testing.
The clinical studies for ICL670 – latergiven the brand name Exjade – were thelargest program ever for an investigationaliron chelator. Data involving more than1 000 patients with a broad range of under-lying diseases demonstrated that Exjade iseffective at managing and reducing bodyiron burden.
After a “priority review” which the FDAreserves for innovations that target majorunmet medical need, Exjade was approvedin November 2005 for treatment of chroniciron overload due to blood transfusions inadults and children age two and older. InAugust 2006, the European Commissionalso granted approval for Exjade in all 25member states of the European Union tohelp patients with transfusional iron over-load. By the end of 2006, Exjade was avail-able in more than 70 countries worldwide.
In its first full year on the market, Exjadeposted sales of USD 143 million. “Theuptake has exceeded our expectations andreflects the significant unmet medical needExjade is addressing,” says David Epstein,Head of Novartis Oncology. Importantly, ini-
119863_Nova_000_000_web_e.qxp 24.1.2007 13:19 Uhr Seite 26

27
0 2 | G R O U P R E V I E W 1 2 | O P E R AT I O N A L R E V I E W 5 6 | C O R P O R AT E C I T I Z E N S H I P 9 3 | C O R P O R AT E G O V E R N A N C E 1 2 7 | N O V A R T I S G R O U P F I N A N C I A L R E P O R T
Pharmaceuticals
ies consistently demonstrated that Exjaderemoves iron from the body in a dose-dependent manner.
Patients who received Exjade doses of 20 milligrams (mg) and 30 mg per kilogramof body weight had maintenance, or reduction,in body iron burden similar to that achievedwith Desferal. In clinical trials, Exjade wasshown to be generally well tolerated withmost adverse events being mild to moderatein severity, and transient in nature.
In developed countries, virtually allpatients with the severe form of thalassemiaare routinely transfused and treated for ironoverload. According to market research byNovartis, a majority of physicians anticipatethat thalassemia patients receiving Exjadewill be treated more days per year for ironoverload than at present. Moreover, the 24-hour continuous chelation coverage pro-vided by Exjade promises to make treatmenteven more effective.
Myelodysplastic Syndromes
While Exjade has the potential to improvecompliance and efficacy among peoplealready receiving chelation therapy, the med-icine is also expected to expand use of chela-tion among undertreated patients with formsof transfusion-dependent anemia.
One example is Myelodysplastic Syn-dromes (MDS), a diverse group of bone mar-row disorders that typically affect peopleover the age of 60. Estimates suggest thatmore than 200 000 people worldwide maybe affected by MDS. Blood transfusions arethe mainstay of supportive care to managesymptoms of anemia.
“But the majority of MDS patients aren’treceiving intensive chelation therapy,” saysProfessor Norbert Gattermann, M.D., Dept. ofHematology at Heinrich-Heine University in
Dusseldorf, Germany. “There is no questionwhatsoever that Exjade is a breakthrough foriron chelation in thalassemia,” Dr. Gatter-mann adds. “But we don’t yet have reliabledata telling us how much morbidity and mortality in MDS can be attributed to ironoverload.”
Ongoing research is beginning to fill thatvacuum. A study by hematologists at the University of Pavia (Italy) demonstrated thatMDS patients who were transfusion dependenthad significantly shorter survival than thosewhose conditions didn’t require transfusions.The study found that developing a secondaryiron overload had a significant, negativeeffect on the survival of transfusion-dependentMDS patients. By contrast, at the 2006 annualmeeting of the American Society of Hema-tology, physicians from the University ofBritish Columbia (Canada) presented thefirst data documenting improvement in clinical outcome in MDS patients receivingiron chelation therapy.
In May 2005, more than 30 leadinginternational hematologists met in conjunc-tion with the 8th International Symposiumon Myelodysplastic Syndromes in Nagasaki,Japan and produced consensus guidelinesfor diagnosis, monitoring and managementof iron overload in MDS. According to Dr. Gattermann, who was a participant, theNagasaki Guidelines suggest that the MDSpatients most likely to benefit from ironchelation are those in the low-risk group,with estimated median survival of five yearsor more. “They are the candidates likely todevelop clinically relevant problems of ironoverload,” he says.
Overall, Dr. Gattermann estimates thatroughly a third of all MDS patients may becandidates for iron chelation. And even asresearch advances, demographics willexpand use of chelation therapy, he adds.
“Older age groups are expanding as apercentage of the total population in indus-trialized countries – and older age groups arethe ones with a particularly high incidence ofMDS, so we’ll see increasing numbers ofMDS patients in coming years,” Dr. Gatter-mann says. “Hematologists and physicianshave been reluctant to start iron chelationtherapy because of all the trouble with com-pliance and complications associated withDesferal. But we’ll see a greater awareness ofthe iron overload problem, and more willing-ness to begin chelation therapy in the future,because Exjade makes the problem so mucheasier to treat.”
Sickle Cell Disease
Sickle cell disease is one of the most com-mon inherited anemias treated with transfu-sions. According to the US National Institutesof Health, more than 70 000 Americans suf-fer from sickle cell disease and an estimated250 000 children worldwide are born withthe disorder every year.
The underlying cause is a mutation inthe sickle cell gene – resulting in abnormal,crescent-shaped red blood cells that canhave difficulty passing through small bloodvessels. Complications range from anemiaand frequent infections, to acute chest syn-drome – a blockage of the flow of oxygen intiny vessels in the lungs – and a dramatical-ly increased risk of stroke, when misshapenblood cells block major blood vessels thatsupply the brain with oxygen.
The mutation has persisted largelybecause it confers a survival advantageagainst falciparium malaria, the most deadlyform of malaria, and the sickle cell mutationis common in people whose families comefrom sub-Saharan Africa, the Mediterraneanregion, Latin America and India.
119863_Nova_000_000_web_e.qxp 24.1.2007 13:19 Uhr Seite 27

28
N O V A R T I S G R O U P B U S I N E S S R E V I E W
In recent decades, advances in diagno-sis and treatment have transformed sicklecell disease from a pediatric affliction oftenleading to early death, to a chronic disorderwith a median life span exceeding 40 years.But improved management of the condition– particularly broader use of chronic bloodtransfusions – could offer further benefits,says Kwaku Ohene-Frempong, M.D., Profes-sor of Pediatrics at the University of Penn-sylvania and Director of the Sickle Cell Cen-ter at the Children’s Hospital of Philadelphia.
“We know that transfusions preventstrokes as well as other complications ofsickle cell disease and we are moving into anera where more and more of our patients aregoing to receive transfusions on a chronicbasis,” Dr. Ohene-Frempong adds. “But asblood transfusions grow more common, iron overload will become one of patients’biggest problems. We are excited about thepotential for Exjade to improve complianceas well as results of chelation therapy amongour patients.”
Dr. Ohene-Frempong has an intenselypersonal connection with sickle cell disease,and as one of the world’s leading authoritiesin the field he has played a key role in land-mark research projects that helped revolu-tionize diagnosis and treatment over thepast four decades. A star athlete who re-presented his native Ghana in the 1968Olympic Games, he wasn’t aware that hecarried a defective copy of the sickle cellgene until a routine physical examinationbefore the Mexico City Olympics. “There wasa lot of concern about possible effects of thehigh altitude in Mexico City on people withthe sickle cell trait,” he recalls. “Our doctorsuggested that all team members be testedand it showed that I had the sickle cell trait.”
Four years later, after Dr. Ohene-Frempong had begun medical studies at YaleUniversity, his newborn son was diagnosedwith sickle cell disease. At the time, Yaleoperated one of only two hospitals in the USthat screened newborn babies for SCD.“Hematology textbooks at the time stillclaimed that it was impossible to detect SCDin newborns,” Dr. Ohene-Frempong says.“We were lucky to have this great doctor whomade the diagnosis, put my son on penicillinprophylaxis and began to teach my wife andme about the disease.”
Today screening of newborns for sicklecell disease is required in 49 states in the USand is routinely conducted in many coun-tries in Europe. Screening is credited formuch of the improved life expectancy forpeople with the disorder in recent decades.
During a stint back home in Ghana towork on a thesis, Dr. Ohene-Frempong wasable to foster his interest in sickle cell dis-ease. Assembling data from a large urbanhospital, he was dismayed to find that onlya handful of children had been treated forsickle cell disease during the previousdecade.
“Doctors in Ghana simply didn’t makethe diagnosis and only a tiny part of the realburden of SCD was acknowledged,” hemuses. “Unlike my son, many children weredying from this disease undiagnosed – withnobody knowing what actually had killedthem.” When he returned to Yale, he switchedthe focus of his medical studies – to hema-tology, with a special focus on sickle cell dis-ease.
During the 1990s, scientists built on thesuccess of newborn screening by developinga technique using ultrasound to identifyyoung children at high risk of stroke and
other severe complications. “As soon as wesee signs of severe disease we put the childon chronic transfusions and it helps preventstroke,” Dr. Ohene-Frempong adds. “And wehave found that transfusions also opened upthe possibility to prevent other complica-tions as well.”
A landmark US study, called Stroke Pre-vention Trial in Sickle Cell Anemia (STOP)demonstrated that regular blood transfu-sions significantly reduced the risk of strokein at-risk children identified by the ultra-sound test. Moreover, transfusions alsoreduce the risk of repeat strokes, whichoccur in nearly two thirds of children withsickle cell disease unless they’re treated.
As a medical student, Dr. Ohene-Frempong had planned to practice in Ghanabut his distinguished career in the US post-poned his return. In 1995, he finally realizedthat dream by opening Ghana’s first centerto screen newborn babies in Kumasi, thecountry’s second-biggest city. Funded inpart by the US National Institutes of Health,the Kumasi clinic has screened tens of thou-sands of newborns and provides treatmenttoday for more than 10 000 people withsickle cell disease.
“There has been a tremendous increasein awareness – expectant mothers fromaround the country come to Kumasi so theirbabies can be tested,” Dr. Ohene-Frempongsays. Despite ongoing expansion of the clin-ic, however, resources are dwarfed by unmetneed in Ghana, and across Africa, whichbears the greatest share of the global bur-den of sickle cell disease. “We don’t haveenough doctors or nurses,” Dr. Ohene-Frempong says. “And the thing that reallypains me is that we don’t have a good trans-fusion service in Ghana. It’s hard – and weneed all the help we can get to develop thesecenters across Africa.”
119863_Nova_000_000_web_e.qxp 24.1.2007 13:19 Uhr Seite 28

29
0 2 | G R O U P R E V I E W 1 2 | O P E R AT I O N A L R E V I E W 5 6 | C O R P O R AT E C I T I Z E N S H I P 9 3 | C O R P O R AT E G O V E R N A N C E 1 2 7 | N O V A R T I S G R O U P F I N A N C I A L R E P O R T
Pharmaceuticals
B Y L N A I R C H A R I T A B L E H O S P I T A L & T O P I W A L A N A T I O N A L M E D I C A L C O L L E G E ; M U M B A I , I N D I A
119863_Nova_000_000_web_e.qxp 24.1.2007 13:19 Uhr Seite 29

N O V A R T I S I N S T I T U T E S F O R B I O M E D I C A L R E S E A R C H ; C A M B R I D G E , M A S S A C H U S E T T S , U S
30
N O V A R T I S G R O U P B U S I N E S S R E V I E W
119863_Nova_000_000_web_e.qxp 24.1.2007 13:19 Uhr Seite 30
31
0 2 | G R O U P R E V I E W 1 2 | O P E R AT I O N A L R E V I E W 5 6 | C O R P O R AT E C I T I Z E N S H I P 9 3 | C O R P O R AT E G O V E R N A N C E 1 2 7 | N O V A R T I S G R O U P F I N A N C I A L R E P O R T
NIBR
When Professor Mark Fishman, M.D., tookthe helm at the Novartis Institutes for Bio-Medical Research (NIBR), he spoke of revo-lutionizing the way major pharmaceuticalcompanies like Novartis discover new med-icines.
Underpinning that vision, Dr. Fishmandelivered an uncompromising diagnosis ofwhere change had to start. “We simply don’tknow enough yet about the molecular caus-es of many diseases, and if you don’t under-stand the mechanism, you can’t make adrug for it,” he said. “Over the coming yearswe will understand more and more, but let’snot presume to try and treat diseases wedon’t understand yet.”
Today, that quest for understanding per-meates NIBR labs worldwide. But the Dia-betes and Metabolism Disease Area isarguably the best example so far of a NIBRunit advancing fundamental knowledgeabout a major disease, while at the sametime continuing to identify novel biologicaltargets, and churn out promising moleculesready to commence development.
Late last year, NIBR unveiled earlyresults from a landmark study with a pair ofacademic partners to decipher genetic causesof diabetes. The initial findings providedstrong support for a link between type 2 diabetes and previously unknown diseasegenes, including those that control functionof mitochondria, tiny power plants foundinside cells, that are a prime focus of diabetes research at NIBR.
At the same time, the collaborationuncovered other stunning genetic influences
on diabetes that could lead to additional revolutionary approaches to therapy. Thestudy is a three-way collaboration, with Sweden’s Lund University, and the BroadInstitute, a prestigious academic center locat-ed near NIBR headquarters in Cambridge,Massachusetts.
“In essence, the collaboration is layingout a foundation for new hypotheses abouttype 2 diabetes,” says Thomas Hughes,Ph.D., Head of the Diabetes and MetabolismDisease Area at NIBR. “Which of thosehypotheses will prove to have high impacton clinical and medical approaches to thedisease will have to be proven over thecourse of the next few years,” he adds. “Butno one in our shop will look at type 2 dia-betes in the same way after this. And we arein a very privileged situation to be sittingwith this information at this time.”
Pragmatic Portfolio
The evolution of the Diabetes and Metabolism(D&M) Disease Area mirrors the dynamicexpansion of NIBR which will celebrate itsfifth anniversary later this year. Since Novartisdecided to relocate global research head-quarters to a new US center in Cambridge,almost a thousand scientists have beenrecruited, trained and placed in jobs at thatcenter.
“The recent history of our area providesa snapshot of the tremendous evolution atNIBR over the past few years,” Dr. Hughessays. “This organization has power unlikeanything that Novartis has ever seen before.”
Discovering innovative medicines demands deep understanding of disease. Type 2 diabetes is a prime example where scientists at the Novartis Institutes for BioMedicalResearch (NIBR) have identified novel biological targets and dispatched promising com-pounds into the development pipeline – while at the same time advancing fundamentalknowledge about the disease through landmark studies with elite academic centers.
TRANSLATIONAL MEDICINE AT NIBR: THE BRIDGE FROM BASIC SCIENCE TO NEW DRUG
119863_Nova_000_000_web_e.qxp 24.1.2007 13:19 Uhr Seite 31

32
N O V A R T I S G R O U P B U S I N E S S R E V I E W
From a core of 30 scientists who movedwith Dr. Hughes to Cambridge from New Jersey in 2002, the D&M group has expand-ed to more than 150 people. During that build-up phase, however, there was noimmunity from the relentless pressure onproductivity and constant evaluation intrin-sic to industrial research.
“Pretty much everybody who was here atthe beginning understood that there was notime to lose,” Dr. Hughes says “We had toestablish a beachhead – by finding first-in-class opportunities that could be phased – sothat we could reach sustainable productivityas rapidly as possible, while at the same time enabling our new people to learn aboutthe various stages of the drug discoveryprocess.”
The solution was a pragmatic portfoliostrategy, comprising short, medium andeventually long-term projects, with diversedegrees of innovation as well as varying levels of risk. The medium-term programrevolved around a potential link betweendysregulation of fatty acid metabolism anddiabetes.
Fats play several roles in the body. Theyare critical raw materials required for pro-duction of cell membranes – and they pro-vide a very efficient energy source. When thebody is exposed to excess fatty acids –through a sedentary lifestyle or obesity –cells have to decide whether to burn fats,producing energy, or to store the excess. Yetaccumulation of fatty acids in some tissues,including skeletal muscle, appears to dam-age insulin signaling and drive the onset ofinsulin resistance.
To address the underlying problem,Novartis scientists zeroed in on biologicalswitches believed to regulate the cell’s deci-sion to burn fats or store them – testing thehypothesis that increasing fat oxidation
might suppress development of insulinresistance and delay onset of type 2 diabetes,even in people exposed to high-fat diets.
“These are not (biological) targets thatwe came up with on our own – they were cho-sen on the basis of some very good scientificpapers and advice we got from collaborators.But the program is very comprehensive andwe are definitely competitive with othergroups in the pharmaceutical industry work-ing in this area,” Dr. Hughes says.
“Still, it looks like we’re going to get moretraction with the fatty acid program in theobesity area than insulin resistance, per se,”he adds. “That’s fine – we went into this withan open mind and there are compoundscoming out of this program that appear tohave good utility in the treatment of obesity.We will have a first compound from the pro-gram enter development by the end of 2006.”
Cellular Power Plants
In 2003, with the fatty acid program underway,Dr. Hughes inaugurated a visionary projecthe had been dreaming about for years.
The opportunity emerged when Dr. Fishman established a “Milestone” program,aiming to give NIBR scientists breathingroom to take on higher-risk projects. Theseprojects offered the potential to continue thetradition of feeding the pipeline with trulyinnovative approaches to disease-modifyingtherapy.
For almost a decade, Dr. Hughes hadbeen convinced that type 2 diabetes mightbe treated effectively by enhancing activity ofmitochondria, tiny power plants that accountfor virtually all the energy generated in a cell.“In my own mind, I concluded that we shouldfind a way to treat diabetes by increasing thenumber or function of mitochondria,” herecalls. “So after stewing on this for so many
119863_Nova_000_000_web_e.qxp 24.1.2007 13:19 Uhr Seite 32
33
0 2 | G R O U P R E V I E W 1 2 | O P E R AT I O N A L R E V I E W 5 6 | C O R P O R AT E C I T I Z E N S H I P 9 3 | C O R P O R AT E G O V E R N A N C E 1 2 7 | N O V A R T I S G R O U P F I N A N C I A L R E P O R T
NIBR
genome – as well as yeast and fruit-fly genes– was systematically tested in assays foractivity on mitochondria. “It’s where we arein science today – for the first time ever, wehave the ability to be really comprehensive,”Dr. Hughes says.
The Milestone program gave Novartis a head start in the field and D&M is currentlyworking with multiple targets to enhancemitochondrial function for treatment of type2 diabetes, and related metabolic disorders.Moreover, mitochondriogenesis has been re-cognized as a possible therapeutic approachin other disease areas including cardiovas-cular disease, muscle wasting and neurode-generation. D&M is collaborating with otherNIBR disease areas to accelerate validationof pathways in these areas.
“The real value of the mitochondria projectmay come out of the broader context ofdegeneration as a process,” Dr. Hughes says.“In the next few years, we are going to findourselves focusing on a number of drug-gable targets that probably will deal withmany of the underlying problems of agingthat manifest themselves in different ways indifferent people. One person will developtype 2 diabetes, and deafness, while anoth-er will lose muscle strength or developdementia.
“This is going to be one of our largerprograms,” he adds. “We have a fully inte-grated effort running, with chemists makingmolecules. We are finding targets that canbe manipulated and when we manipulatethose targets, the right things seem to hap-pen, at least in animals.”
And while Novartis traditionally hasremained tight-lipped about preclinical pro-grams, Dr. Hughes and his team speak open-ly about the company’s interest in mito-chondriogenesis at research updates forfinancial analysts, as well as at major scien-
tific meetings. “We’re not saying exactlywhat we’ve found,” Dr. Hughes says. “But it’sbeen part of our mission to take the basicbiology out to the public, to show how this isworking.”
Hiding in the Genome
In 2004, when Dr. Fishman agreed to joinforces with the Broad Institute and LundUniversity to probe the genetic causes oftype 2 diabetes, he told the journal Sciencethat the three-year project “was a statementto the world of medical science that thepatient should come first.”
It was the latest in a succession of majorprojects at Novartis attempting to unlock thefull potential of the Human Genome Projectby “functionalizing” the genome, unravelingthe biological function of the estimated30 000 human genes and ultimately theirrole in major diseases.
Results to date have exceeded expecta-tions on both counts. “We know that dia-betes is a very strongly heritable disease. Sosurely the information that matters is hidingin the genome,” Dr. Hughes says. “We want-ed to see if we could pull that knowledge out– to show how to look at patient populationsto determine who would be most likely torespond to certain drugs. And we hoped theknowledge would lead us into areas wherewe could find new pathways and nodes totarget as well.”
The collaboration is studying DNA sam-ples from roughly 3 000 diabetic patientstreated by Professor Leif Groop, M.D., andhis team at Lund University in southern Swe-den. The samples are complemented bycarefully annotated patient histories –though the identity of each patient has beenscrupulously protected.
years, when Dr. Fishman started talkingabout the Milestone program, I said immedi-ately ‘I have one’. And we finally got to takea crack at it.”
The role of mitochondria had come intosharp focus as a result of observations thatmitochondrial function was reduced in peoplewith type 2 diabetes – and elderly peoplewho had impaired sensitivity to insulin.Those observations were supported by studieswith electron microscopy showing that mito-chondria were smaller and less functional inpeople with type 2 diabetes, compared tohealthy controls.
Gerald I. Shulman, M.D., Professor ofMedicine at Yale University School of Medi-cine, reported that insulin resistance wasassociated with low mitochondrial activity,especially in the elderly. “Gradually the linkbetween low mitochondrial activity and type 2 diabetes really began to cement itself,” Dr. Hughes recalls.
Even as evidence accumulated, theresearchers faced a major hurdle. No vali-dated targets yet existed for either regulationof mitochondria, or generation of new ones,so-called mitochondriogenesis. “We had tobuild from scratch,” Dr. Hughes says.
The advent of a Milestone programaround mitochondria coincided with the creation of a target discovery team within theD&M group. “We built a brand new team ofpeople who came in to NIBR with skill setsthat had never been present in our groupbefore,” Dr. Hughes says. “In the past, theonly way we could get targets was by read-ing the scientific literature. Today, we investabout a quarter of our biology resources intothese target-discovery initiatives.”
The search for genes involved in regula-tion of mitochondria was a case study in systematic deployment of state-of-the-artresearch tools. Each gene in the human
119863_Nova_000_000_web_e.qxp 24.1.2007 13:19 Uhr Seite 33

34
N O V A R T I S G R O U P B U S I N E S S R E V I E W
collaboration on a public website, accessiblefor researchers around the world.
“It’s a huge amount of information – allof which has to be replicated in an inde-pendent population,” Dr. Hughes says. “Butwhen you actually begin to see what the dataare telling you, you realize very quickly thatwe’ve been looking at the disease throughthe wrong end of the telescope. For example,there are changes in the genome in areasthat control immune function that also arelinked to type 2 diabetes. And there aregenes that appear to influence developmentof the body in a way that eventually leads tosusceptibility to type 2 diabetes. It’s very,very strange and mysterious, and hard tounderstand.
“This is information about this diseasethat we as an industry absolutely have tohave. But it is too big for a single companyto digest on its own,” he adds. “And it reallybelongs to humanity – not just to a pharma-ceutical company. So having and holding it actually isn’t going to help us as much as having it and letting other people chew onit too.”
Faculty at the Broad Institute – whichitself is a partnership between MassachusettsInstitute of Technology, Harvard Universityand affiliated hospitals plus the WhiteheadInstitute for Biomedical Research – includesmany scientists who played key roles in theHuman Genome Project.
“We’re basically sampling 500 000places on the genomes of 3 000 people withtype 2 diabetes. It’s not all the genes – buta huge and highly representative sample,”Dr. Hughes says.
NIBR’s focus on the needs of patientsand physicians “allowed us to filter outthings of low relevance to physicians whileanswering the questions they really want tohave answered,” he adds. “As a result wehope to learn about the key genetic driversof diabetes – plus genetic drivers of a num-ber of other traits that are contained withinthis population – from body mass index andinsulin resistance itself, to levels of high- andlow-density lipoprotein, blood pressure anda bunch of other things.”
Novartis and the Broad Institute will putgenetic variation data collected under the
119863_Nova_000_000_web_e.qxp 24.1.2007 13:19 Uhr Seite 34

35
0 2 | G R O U P R E V I E W 1 2 | O P E R AT I O N A L R E V I E W 5 6 | C O R P O R AT E C I T I Z E N S H I P 9 3 | C O R P O R AT E G O V E R N A N C E 1 2 7 | N O V A R T I S G R O U P F I N A N C I A L R E P O R T
NIBR
N O V A R T I S I N S T I T U T E S F O R B I O M E D I C A L R E S E A R C H ; T S U K U B A , J A P A N
119863_Nova_000_000_web_e.qxp 24.1.2007 13:19 Uhr Seite 35

36
N O V A R T I S G R O U P B U S I N E S S R E V I E W
Newly created strategic growth platform with strong performance in 2006. New divisionformed through acquisition of remaining stake in Chiron Corporation in April 2006.
Net sales of USD 956 million for the period from the acquisition in April 2006, up 42% over the comparable eight months of 2005 reported by Chiron, thanks to sharp increase in influenza vaccine deliveries to the US.
Novartis now the second-largest supplier of influenza vaccines in the US. Robust product portfolio also includes meningococcal, pediatric and travel vaccines that offer protection against many life-threatening viral and bacterial diseases.
Strong pipeline supports key franchises while exploring new disease areas. Primary focus oninfluenza vaccines utilizing modern cell-based manufacturing technology as well as pandemic/pre-pandemic H5N1 vaccines. Meningitis vaccines have potential to become astrong growth driver in the future.
Diagnostic business renamed “Chiron,” dedicated to preventing the spread of infectious diseases through novel blood-screening tools and very strong position in the US. Options are being evaluated to grow business and expand into molecular diagnostics.
VACCINES AND DIAGNOSTICS
119863_Nova_000_000_web_e.qxp 24.1.2007 13:19 Uhr Seite 36

37
0 2 | G R O U P R E V I E W 1 2 | O P E R AT I O N A L R E V I E W 5 6 | C O R P O R AT E C I T I Z E N S H I P 9 3 | C O R P O R AT E G O V E R N A N C E 1 2 7 | N O V A R T I S G R O U P F I N A N C I A L R E P O R T
Vaccines and Diagnostics
KEY FIGURES(In USD millions unless indicated otherwise)
2006
Net sales 956Operating income -26Research and development 148Research and development
as % of net sales 15.5Free cash flow 151Net operating assets 4 536Additions to property,
plant & equipment1 113Number of associates at year-end 3 935
1 Excluding impact of business combinations
NET SALES BY REGION
2006
US 48%
Europe 40%
Africa/AsiaAustralia 10%
Canada andLatin America 2%
Quinvaxem
Optaflu1 EU
H5N1 vaccine2
Japanese encephalitis
MenACWY3 vaccine
Optaflu1 US
MenB4 vaccine
HCV5
HIV6
Phase I Phase II Phase III Registration
VACCINES DEVELOPMENT PIPELINE
1 Flu cell culture vaccine; trade name pending regulatory approval2 Influenza strain predicted most likely to cause a new influenza pandemic;
H5N1 vaccine in Phase II in US3 Neisseria meningitidis serogroups A, C, W and Y 4 Neisseria meningitidis serogroup B5 Hepatitis C virus; therapeutic and prophylactic vaccine 6 Human immunodeficiency virus
USD 885 m
2005 FULL-YEAR NET SALES AS REPORTED BY CHIRON
2006 COMPARABLE FULL-YEAR NET SALES
USD 204 mPRE-ACQUISITION
USD 956 m POST-ACQUISITION
VACCINES AND DIAGNOSTICS
119863_Nova_000_000_web_e.qxp 24.1.2007 13:19 Uhr Seite 37

38
N O V A R T I S G R O U P B U S I N E S S R E V I E W
Acquiring full control of Chiron Corp. in April2006 brought Novartis an attractive newstrategic platform in vaccines, a resurgentindustry where novel products and innova-tive manufacturing technologies are expect-ed to fuel dynamic, double-digit growth overthe next decade.
Integration proceeded smoothly withthe creation of the new Vaccines and Diag-nostics Division, comprising most operationsof the former Chiron. Moreover, the NovartisPharmaceuticals Division absorbed Chiron’sbiopharmaceuticals, while the Novartis Insti-tutes of BioMedical Research gained a newresearch site, with a special emphasis ononcology programs.
An urgent priority for the new Divisionwas continuation of the remediation pro-gram underway at the Liverpool influenzavaccine factory, where contamination prob-lems had forced withdrawal of Chiron’s USinfluenza vaccine in 2004. Those efforts con-tinued to be successful and Novartis Vac-cines became the first manufacturer to shipinfluenza vaccine to US customers for the2006–07 season.
“We are committed to bringing im-proved vaccines, diagnostics and treatmentsto protect the public health – as well as tocontribute to a secure and sufficient supplyof vaccines to address the threat of a flupandemic,” says Daniel Vasella, M.D., Chairman and Chief Executive Officer ofNovartis. “In vaccines we have a challengingtask, not just to fix lingering quality and pro-
ductivity issues, but also to increase ourcapacity and bring innovative new vaccinesto market.”
To head the new Division, Dr. Vasellatapped Joerg Reinhardt, Ph.D., longtimehead of Pharmaceutical Development atNovartis. Along with geographical expansionand operational excellence, Dr. Reinhardtsees innovation as a key to future success.“There is substantial potential for innovativenew vaccines to address unmet medicalneed around the world, with influenza andmeningitis as key areas of focus for us andour competitors,” he says.
Dr. Reinhardt moved aggressively tobroaden the product base at Novartis Vaccines with major initiatives during 2006.In July, Novartis announced plans to buildthe first cell culture-derived influenza vaccine manufacturing plant in the US, at anew site in Holly Springs, North Carolina.Construction of the USD 600 million facilityhas already started. In parallel, Novartis ismaking additional investments to expandcapacity for flu cell culture vaccine productionin Marburg, Germany.
Cell Culture-Based Influenza Vaccines
Cell culture technology promises manyadvantages over traditional egg-based pro-duction, from greater reliability to a reduc-tion in production lead time and shorter pro-duction cycles. Such advantages could bepivotal in the event of an influenza pandemic.
Vaccines are the most cost-effective public health intervention, saving millions oflives every year by preventing major human diseases. New research techniquesand manufacturing technologies have sparked a revival and strong double-digit growth. The new Novartis Vaccine and Diagnostics Division holds leading positions in meningococcal vaccines – as well as vaccines to prevent seasonal flu and potentially also pandemic influenza.
VACCINES AND DIAGNOSTICS
119863_Nova_000_000_web_e.qxp 24.1.2007 13:19 Uhr Seite 38

39
0 2 | G R O U P R E V I E W 1 2 | O P E R AT I O N A L R E V I E W 5 6 | C O R P O R AT E C I T I Z E N S H I P 9 3 | C O R P O R AT E G O V E R N A N C E 1 2 7 | N O V A R T I S G R O U P F I N A N C I A L R E P O R T
Vaccines and Diagnostics
Underscoring its leading position in the newtechnology, Novartis Vaccines submitted thefirst application for a flu cell culture vaccineto European regulators in June of last year,following successful completion of Phase IIIclinical studies. In the US, clinical trials of thecell culture influenza vaccine began in 2005– and are ongoing.
The US government offered key supportfor the new technology when the Dept. ofHealth and Human Services (HHS) awardedNovartis a contract of up to USD 220 millionto support development and manufacture ofcell culture-derived influenza vaccine in theUS. The contract is part of a larger HHS ini-tiative to expand domestic infrastructure forinfluenza vaccines, as well as ensure domes-tic capacity to produce 600 million doses ofpandemic influenza vaccine within sixmonths of a pandemic declaration. The newNovartis facility would represent up to 150 million doses of that capacity. Part of theHHS contract will support planning andequipment for the new cell culture-basedinfluenza vaccine manufacturing plant inHolly Springs, North Carolina.
Predecessor companies of Novartis Vaccines spent more than a decade devel-oping proprietary technology that usesmammalian cell culture as an alternativehost to chicken eggs for virus replication. Thefirst clinical trial of this new flu cell culturevaccine was conducted in Germany in 2002and, in all, six successful clinical trials involv-ing more than 3 000 people have been com-pleted to date.
Dispensing with eggs in production alsopromises benefits to people who are allergicto eggs. Currently, strains of seed virus usedin seasonal influenza vaccine are selectedpartly because of their ability to grow well ineggs. This egg adaptation won’t be neededwith cell culture-based influenza vaccines,
which could translate into better efficacy ofseasonal vaccines by more closely matchingthe vaccine with the influenza strain in cir-culation.
Despite availability of safe and effectivevaccines, seasonal influenza causes millionsof infections and kills an estimated 250 000people worldwide every year. Health author-ities in many countries are gearing up toincrease coverage rates for seasonal flu vac-cine, in line with a recommendation from theWorld Health Organization (WHO) to reach75% coverage of at-risk groups – the elderlyand people with chronic diseases – by 2010.The US is leading the way, recommendingseasonal flu vaccinations for all Americansover the age of 50, children from the age oftwo months to five years and other at-riskgroups, including healthcare workers.
Buoyed by rising demand, sales of sea-sonal flu vaccine are expected to grow atdouble-digit rates over the next five years.Production capacity is also expected to risesharply by 2009 – yet the WHO acknowl-edges that the projected rise in capacity forseasonal flu vaccine won’t reach levels suffi-cient to serve the worldwide population incase of a pandemic.
Pandemic Preparedness
Clearly, cell culture technology represents apotentially critical tool to boost productioncapacity, and thereby help to reduce the cur-rent gap between potential vaccine demandand supply anticipated during an influenzapandemic. The WHO’s latest action plan fora global influenza pandemic warns thatpotential vaccine supply today is “several bil-lion doses short of the amount needed toprovide protection to the global population.”
During the 20th century, there werethree pandemics, or simultaneous worldwide
epidemics of influenza. The 1918 “Spanishflu” killed more than 20 million people. Sub-sequent pandemics in 1957 and 1968 wereless severe but also killed millions aroundthe globe.
A new influenza strain, known as H5N1,is spreading through bird populations inAsia, Africa and Europe. Only 244 humancases have been recorded so far, but chill-ingly, the fatality rate has been more than50%. Though avian flu remains primarily ananimal disease, if the virus develops thecapacity for sustained, efficient human-to-human transmission, it could spread quicklyaround the globe.
Novartis Vaccines has long been in thefront ranks of global pandemic prepared-ness. In 1999, the division was the first man-ufacturer to successfully test an experimen-tal vaccine against a variant of the H5N1influenza virus following the initial outbreakof avian flu in Hong Kong. Ironically, becausethe H5N1 strain that caused the outbreakwas lethal to the egg cells that are needed inegg-based production to support virus repli-cation, Novartis Vaccines was forced to use aclosely related H5N3 strain to produce itsvaccine.
That initial H5 vaccine also included aproprietary adjuvant called MF59. An adju-vant is a substance added to a vaccine toboost the body’s immune response againstthe vaccine’s active constituent, called theantigen. In 2003, a follow-up study showedthat the adjuvanted H5 vaccine from Novar-tis also offered cross-protection againstH5N1 strains that have circulated acrossAsia since the initial Hong Kong outbreak.
Importantly, the use of an adjuvant couldprovide effective protection at lower dosesthan nonadjuvanted vaccines, potentiallyenhancing production capacity, and supply,in the event of a pandemic. The WHO has
119863_Nova_000_000_web_e.qxp 24.1.2007 13:19 Uhr Seite 39

40
N O V A R T I S G R O U P B U S I N E S S R E V I E W
proposed clinical studies of H5N1 vaccines– including MF59 and other adjuvants witha proven safety record in humans – as partof its global pandemic action plan.
The Novartis cell culture-based pan-demic vaccine is still in preclinical develop-ment but clinical trials are expected to beginthis year. In Europe, Novartis was one of sev-eral vaccine producers in 2006 to file“mock-up,” or stand-by registrations for apandemic vaccine that would enable thecompanies to begin production immediate-ly if the WHO declares a pandemic. Novartishas also submitted a dossier to the Euro-pean Medicines Agency (EMEA) for a H5N1pre-pandemic vaccine that could be soldfreely to private individuals and companies,in addition to governments and other payors.
Meanwhile, Novartis Vaccines has re-ceived orders from the US and UK to supplypre-pandemic H5N1 avian influenza vaccine– in some cases containing MF59 adjuvant –for national stockpiles.
“We continue to work closely with regu-latory agencies in Europe and North America,and we expect to have much more visibilityregarding a pandemic, or pre-pandemic,vaccine in 2007,” Dr. Reinhardt says.“Together with other companies, we aim tomake it possible for the public to obtain vol-untary vaccination with a potential pandem-ic strain, in addition to the normal seasonalflu vaccinations.”
Turning Point
Novartis Vaccines also is a world leader inthe battle against meningococcal meningitis.According to the WHO, an estimated 500 000cases, and 50 000 deaths from meningo-coccal meningitis are reported each year.
“But it is a disease that casts a shadowfar beyond what this incidence would sug-
gest,” says Peter Dull, M.D., Team Leader,Clinical Research, Development and MedicalAffairs, at Novartis Vaccines. “It strikesinfants, and adolescents and young adults atthe beginning of their productive lives – intheir prime. And it strikes in an overwhelm-ing fashion,” Dr. Dull adds.
Sometimes, meningococcal meningitiscan lead to death only hours after the onsetof symptoms, despite prompt treatment withantibiotics. A large proportion of people whosurvive meningococcal meningitis suffermajor complications, such as neurologicaldamage or amputations.
And the disease has epidemic potential,causing increased risk among people whocome in close contact to someone with thedisease. In sub-Saharan Africa, major epi-demics are common and constitute a majorpublic health threat. In developed countries,outbreaks occur unpredictably and while theUK and Australia have introduced nation-wide vaccination programs against Neisseriameningitidis serogroup C (MenC), epidemicscaused by N. meningitidis serogroup B (MenB)have occurred in countries ranging fromNorway and New Zealand to the Normandyregion of northern France.
One Novartis vaccine is already in useagainst a strain of MenB found only in NewZealand. Since the launch of the vaccine in2004, the incidence of MenB disease in NewZealand has fallen by more than 80%.
A Novartis conjugate vaccine providingsimultaneous protection against the A, C, W and Y strains of N. meningitidis hasadvanced to Phase III clinical trials. If trialsare successful, the new MenACWY vaccinewould be the first approved by regulators inmajor countries to treat infants and youngchildren less than 11 years of age, a partic-ularly vulnerable group which accounts fora majority of bacterial meningitis cases inthe US every year.
In addition, a vaccine offering protectionagainst most strains of MenB has advancedto Phase II clinical trials and, if successful,could represent a turning point in the wayvaccines are discovered and developed. Thisuniversal MenB vaccine is a prototype foruse of genomics for vaccine development –a radically new approach called “reversevaccinology,” pioneered by scientists atNovartis Vaccines.
Since the days of Louis Pasteur, vaccinedevelopment has been based on growth andinactivation of microorganisms that causedisease. But reverse vaccinology relies asmuch on computers as Petri dishes.
In 1997, Rino Rappuoli, Ph.D., researchdirector at Novartis Vaccines, convincedmaverick American gene hunter Craig Venterand the Institute for Genomic Research(TIGR) to sequence the genome of N. menin-gitidis. Searching the genome sequence forsimilarities to known genes, researchersuncovered dozens of novel targets. “Thewhole scientific community – working for 50years – had only found about a dozen anti-gens to use in a potential MenB vaccine,” Dr.Rappuoli says. “Using reverse vaccinology,we identified more than 90 antigens within18 months.”
That list of candidate antigens was nar-rowed to five finalists which have been com-bined into a multi-component vaccine. Intests, the universal MenB vaccine has showncapacity to kill more than 75% of MenBstrains, a dramatic improvement over thebest previous vaccines, which achieved cov-erage of about 20%. With clinical testing stillat an early stage, Dr. Rapuoli cautions thatit’s premature to predict the long-term util-ity of reverse vaccinology in providing new-generation vaccines. “But we believe we willhave a universal MenB vaccine on the mar-ket in the next five years,” he says.
119863_Nova_000_000_web_e.qxp 24.1.2007 13:19 Uhr Seite 40

41
0 2 | G R O U P R E V I E W 1 2 | O P E R AT I O N A L R E V I E W 5 6 | C O R P O R AT E C I T I Z E N S H I P 9 3 | C O R P O R AT E G O V E R N A N C E 1 2 7 | N O V A R T I S G R O U P F I N A N C I A L R E P O R T
Vaccines and Diagnostics
N O V A R T I S V A C C I N E S A N D D I A G N O S T I C S ; L I V E R P O O L , U K
119863_Nova_000_000_web_e.qxp 24.1.2007 13:19 Uhr Seite 41

42
N O V A R T I S G R O U P B U S I N E S S R E V I E W
Integration of Hexal and Eon Labs – acquired in mid-2005 – largely completed to createworld’s second-largest generics company based on sales. New product launches, differentiation through difficult-to-make generics and leading positions in key markets driving growth.
Net sales advance 27% (+25% lc) to USD 6.0 billion, benefiting from good underlying retailgenerics sales, particularly in the US, Eastern Europe and Russia.
Operating income more than doubles thanks to new product launches, strengthening positions in leading markets, and contributions from Hexal and Eon Labs.
Strengthening leading positions in fast-growing markets – particularly the US and EasternEurope – as new product launches lead to market share gains. Leadership position in Germany maintained in a tough market.
Differentiating Sandoz against the competition through success in difficult-to-make genericsand innovative product applications. Particular focus on applying new technologies, such asskin patches and inhalation devices.
Pioneer US and European approvals of Omnitrope as the first follow-on version of a previously approved recombinant biotechnology drug. Several similar projects are beingdeveloped to further transform the use of generics.
SANDOZ
119863_Nova_000_000_web_e.qxp 24.1.2007 13:19 Uhr Seite 42

43
0 2 | G R O U P R E V I E W 1 2 | O P E R AT I O N A L R E V I E W 5 6 | C O R P O R AT E C I T I Z E N S H I P 9 3 | C O R P O R AT E G O V E R N A N C E 1 2 7 | N O V A R T I S G R O U P F I N A N C I A L R E P O R T
Sandoz
Net sales Operating income 1 Not adjusted for new IFRS accounting rules 2 Pro forma adjusted for new IFRS accounting rules
KEY FIGURES(In USD millions unless indicated otherwise)
2006 2005
Net sales 5 959 4 694Operating income 736 342Research and development 477 434Research and development
as % of net sales 8.0 9.2Free cash flow 876 685Net operating assets 13 464 12 715Additions to property,
plant & equipment1 264 212Number of associates at year-end 21 117 20 066
1 Excluding impact of business combinations
NET SALES AND OPERATING INCOME(Index: 2002 = 100%)
350
300
250
200
150
100
50
20021 20032 20042 2005 2006
NET SALES BY REGION
2006 2005
US 26% 27%
Europe 58% 56%
Africa/AsiaAustralia 10% 11%
Canada andLatin America 6% 6%
Germany
Nordics
Austria
Netherlands
US
Spain
Italy
Switzerland
Canada
South Africa
PolandRomania
10 20 30 40 50 600
NUMBER OF PRODUCT LAUNCHES 20061
1 Launch definition based on new molecules (US: ANDAs)
SANDOZ
119863_Nova_000_000_ih_e.qxp 26.1.2007 16:19 Uhr Seite 43

44
N O V A R T I S G R O U P B U S I N E S S R E V I E W
S A N D O Z ; K A L W E , I N D I A
119863_Nova_000_000_web_e.qxp 24.1.2007 13:19 Uhr Seite 44
45
0 2 | G R O U P R E V I E W 1 2 | O P E R AT I O N A L R E V I E W 5 6 | C O R P O R AT E C I T I Z E N S H I P 9 3 | C O R P O R AT E G O V E R N A N C E 1 2 7 | N O V A R T I S G R O U P F I N A N C I A L R E P O R T
Sandoz
ulatory pathway charted by the EU to allowapproval of biosimilars.
By contrast, approval of Omnitrope inthe US culminated a seven-year processwhere Sandoz worked in close collaborationwith FDA officials to clarify issues and uncer-tainties – then showed tenacity at criticalmoments when the process reached anapparent impasse.
“The approval of Omnitrope shows thescience is there to move forward on approvalof follow-on biologics through abbreviatedapplications,” says Andreas Rummelt, Ph.D.,Head of Sandoz and member of the ExecutiveCommittee of Novartis. “It shows that regu-lators are comfortable approving theseproducts through an abbreviated process.And the Omnitrope case underscores thecommitment and perseverance of Sandoz inmaking sure these products move forward,and increase access to treatment for wholesections of the patient population.”
Biosimilars are a key component of San-doz strategy. Development and marketing ofdifficult-to-produce generics is a dynamicand profitable complement to the Division’sbroad portfolio of more than 840 activeingredients, available in more than 5 000dosage forms and marketed through a globalnetwork stretching across more than 100countries.
Biosimilars are the epitome of difficult-to-produce products – and Sandoz has morethan 25 years of experience in production ofbiological medicines. “For microbiallyexpressed recombinant proteins – producedusing bacteria and yeast – the Sandoz facil-
Approval of Omnitrope in Europe and the US as the first follow-on version of anapproved recombinant biotechnology medicine underscores the commitment andtenacity of Sandoz as it lives its strategy focusing on difficult-to-produce generics.With additional follow-on proteins under development in Sandoz labs, Omnitropecould be just the beginning.
SANDOZ
Novartis achieved a major milestone in thefirst half of 2006 when European Union regulators and the US Food and DrugAdministration approved Omnitrope, thecompany’s recombinant form of humangrowth hormone, as the first follow-on version of a previously approved recombinantbiotechnology medicine.
Follow-on recombinant proteins – alsoknown as “biosimilars” – are subsequentversions of biological reference medicinesthat are not protected by patents. In comingyears, a spate of biological drugs will losepatent protection and competition frombiosimilars could help governments andother healthcare payors lower their costs,freeing resources for innovative drugs andproviding an indirect stimulus to innovation.
“Novartis is uniquely positioned in ahealthcare market that faces intensified costcontainment pressures due to increasingdemand for drugs and services from anaging population,” says Daniel Vasella, M.D.,Chairman and Chief Executive Officer ofNovartis.
“We need to be able to offer truly differ-entiated innovative therapies that addressunmet medical need. But patients and payors also should have access to lessexpensive generics, once innovator drugshave lost their patents. Generics actuallydrive innovation: knowing that innovativedrugs have finite life cycles forces companiesto innovate.”
Sandoz, the generic pharmaceuticalsdivision of Novartis, lives that vision as thefirst company to take advantage of the reg-
119863_Nova_000_000_web_e.qxp 24.1.2007 13:19 Uhr Seite 45
46
N O V A R T I S G R O U P B U S I N E S S R E V I E W
ity in Kundl, Austria is one of the biggestdevelopment and manufacturing sites in theworld,” says Joerg Windisch, Ph.D., HeadTechnical Development and Clinical Manu-facturing for Biopharmaceutical Operations.
Though Sandoz manufactures morethan a dozen recombinant proteins on behalfof other companies, that pedigree isn’t knownbecause of confidentiality agreements withcustomers. “So far, Omnitrope is the onlybiosimilar product developed and producedin Kundl that is being sold under the Sandozname,” Dr. Windisch adds.
Hatch-Waxman Act
There are parallels between regulatory issuesfacing biosimilars today and the rules thatexisted for traditional chemical drugs beforelegislation was passed in the US during the1980s, creating the modern generics industry.At that time, patents had expired on a largenumber of prescription medicines, but nosimple, or abbreviated, regulatory pathway hadbeen defined for approval of generic copies.
The Hatch-Waxman Act, passed in 1984,contained two sets of changes. First, the newlaw provided patent-term extensions forinnovator drugs, adding several years topatent protection to offset time spent duringthe FDA review process and the clinical test-ing phase.
But at the same time, Hatch-Waxmaneliminated duplicative testing requirementsfor generic products, enabling manufactur-ers of generic pharmaceuticals to obtain FDAapproval more quickly once the patent on aninnovator product had expired. Generic man-ufacturers also were allowed to file abbrevi-ated new drug applications – based on devel-opment programs designed to prove bio-equivalence with the innovator medicine.Those changes dramatically shortened the
average time between patent expiration and entry of the first generic – to less thanthree months, from more than three yearspreviously.
Sandoz believes that rigorous scientificcriteria should be consistently applied to theapproval process for all follow-on biotech-nology medicines. Unnecessary duplicationof animal studies and human clinical trialsshould be avoided, however, so thatresources are not wasted that could other-wise be invested in innovation.
Biotechnology medicines are producedin living organisms, altered by recombinanttechnology. But by using advanced productdevelopment, analytical methodologies andmanufacturing processes, Sandoz can man-ufacture biosimilars designed to have thesame quality, efficacy and safety character-istics as the reference product.
Sophisticated analytical tools used todayare more powerful than those available at thetime when reference products wereapproved. “Characterizations of moleculesthat weren’t possible scientifically a decadeago are commonplace today,” Dr. Windischsays. “And Sandoz and Novartis have beenpart of that advance of science all the way.”
Patient Safety Is Paramount
The manufacturer of a biosimilar eliminatessome requirements of a conventional newdrug application by establishing the bridgebetween the reference medicine and its ownproduct. Streamlined requirements for clini-cal trials – and the opportunity for competi-tion once the originator drug has lost patentprotection – translate into lower prices forbiosimilar products.
Above all, patient safety remains para-mount for Sandoz and Novartis. From theoutset of Omnitrope development in 1997,
the medicine was tested in eight Phase III studies over a period of six years, involvingmore than 250 patients in five Europeancountries. Safety and efficacy data from thestudies conform to those of the referenceproduct.
Omnitrope still had a circuitous route tomarket and was forced to overcome repeat-ed legal hurdles in both Europe and the US.Initial approval in 2004 came in Australia,where Omnitrope was launched a year laterfor treatment of growth disorders in children.
But the first regulatory application to theEuropean Medicines Agency (EMEA), theEU’s main medical regulator, was submittedmuch earlier, in May 2001. Omnitrope re-ceived a positive review by EMEA’s scientificcommittee two years later – yet the EU decid-ed not to approve Omnitrope in November2003, for reasons relating to the approvalpathway.
Sandoz filed suit in an EU Court in January 2004, contesting that negative decision on Omnitrope – and resubmitted theregulatory application with additional clinicaldata in July 2004. At the beginning of 2006,EMEA’s scientific committee once again recommended approval of Omnitrope.
This time, the European Commission followed EMEA’s advice, and in March grant-ed marketing authorization in all 25 EU mem-ber states. By year-end, Omnitrope had beenlaunched in four EU markets, – Germany,Austria, the Netherlands and the UK – withplans to launch the product in additional EUcountries during the first half of 2007.
In the US, Sandoz worked in close consultation with the FDA for several years to prepare an abbreviated application for Omnitrope. That application was submitted inJuly 2003. But a year later, FDA announcedthat while there were no deficiencies in theapplication, the agency was unable to reach
119863_Nova_000_000_web_e.qxp 24.1.2007 13:19 Uhr Seite 46
47
0 2 | G R O U P R E V I E W 1 2 | O P E R AT I O N A L R E V I E W 5 6 | C O R P O R AT E C I T I Z E N S H I P 9 3 | C O R P O R AT E G O V E R N A N C E 1 2 7 | N O V A R T I S G R O U P F I N A N C I A L R E P O R T
Sandoz
a decision on whether to approve Omnitrope.In September 2005, Sandoz filed a lawsuit,seeking to compel the FDA to act. In April of2006, the US District Court for the District ofColumbia granted summary judgement infavor of Sandoz, requiring the FDA to issuea decision on the Omnitrope application. OnMay 31, 2006, the FDA approved Omnitropeand by year-end it had been made availableto US patients.
“After working cooperatively with theFDA throughout the process, Sandoz feltcompelled after many meetings and muchcorrespondence to bring the lawsuit,” Dr.Rummelt adds. “Let’s be very clear: the law-suit was not to force an approval. Unfortu-nately, at a key point the process broke downand we sued to get it back on track andensure FDA made the decision it was obligated to make, within the statutory timeframe.”
While approvals of Omnitrope representa breakthrough for biosimilars, major hur-dles remain before regulatory pathways arecomprehensively defined for all recombi-nant biological medicines. In the future, forexample, the EU plans to assess applicationsfor biosimilars on a case-by-case basis. Inthe US, Omnitrope was approved under aregulatory category called 505(b)(2), but themajority of recombinant protein medicinescurrently on the market were approvedthrough a different legislative pathway, thePublic Health Services Act (PHS). An abbre-viated pathway for biosimilars comparableto the one used for Omnitrope hasn’t yet been defined for reference productsapproved under the PHS.
Another key issue is substitution bypharmacists, which is widely allowed forgeneric versions of traditional chemicaldrugs. The possibility to substitute variesfrom country to country and at present there
is no specific guidance on substitution ofbiopharmaceutical reference products bybiosimilars. “Sandoz believes in substitution– but we understand that it will take timebefore substitution of biosimilars is widelyaccepted,” Dr. Rummelt says.
Late last year, however, legislation wasintroduced in the US Congress that wouldauthorize the FDA to approve abbreviatedapplications for biosimilars, without unnec-essarily repeating expensive clinical trials.The “Access to Life-Saving Medicines Act”establishes a rigorous case-by-case scientif-ic process for approving biosimilars toensure they are as safe and as effective asbrand name counterparts. “Recent ap-provals by FDA of (biosimilar products) likeOmnitrope show that this approach is scien-tifically feasible,” the bill’s sponsors said.
Sandoz is working constructively withother members of industry to assure thatthe regulations necessary to bring PHS reference medicines to the market under abbreviated applications will be put in placefor the future.
119863_Nova_000_000_web_e.qxp 24.1.2007 13:19 Uhr Seite 47

H E R S F L A N D O L D A G E H O M E ; J O H A N N E S B U R G , S O U T H A F R I C A
48
N O V A R T I S G R O U P B U S I N E S S R E V I E W
119863_Nova_000_000_web_e.qxp 24.1.2007 13:19 Uhr Seite 48

S C I E N T I F I C A N D R E S E A R C H I N S T I T U T E O F T R A N S P L A N T O L O G Y A N D A R T I F I C I A L O R G A N S ; M O S C O W , R U S S I A
49
119863_Nova_000_000_web_e.qxp 24.1.2007 13:19 Uhr Seite 49

50
N O V A R T I S G R O U P B U S I N E S S R E V I E W
OTC and Animal Health lead the performance and improve their global rankings thanks to strategic brands, expansion in key markets and targeted acquisitions.
Excluding Medical Nutrition, net sales advance 8% (+8% lc) to USD 6.5 billion, thanks todouble-digit expansions in OTC and Animal Health.
OTC becomes the world’s No. 4 OTC company based on net sales, moving up from No. 6. Strategic brands such as Voltaren, Theraflu and Lamisil deliver excellent growth, with market share gains in key countries.
Animal Health continues to grow faster than the market, moving up three positions and now ranking No. 5 in its industry. Growth comes from companion animal business and record performance by the US farm animal business.
Gerber is supported by the launch of innovative new toddler products in the US, where it is the leading baby nutrition company.
CIBA Vision successfully restarts global distribution of lens care supply materials.
Discontinuing Consumer Health operations comprise Nutrition & Santé, divested in February 2006, and Medical Nutrition business, to be divested to Nestlé for USD 2.5 billion in 2007.
CONSUMER HEALTH
119863_Nova_000_000_web_e.qxp 24.1.2007 13:19 Uhr Seite 50

51
0 2 | G R O U P R E V I E W 1 2 | O P E R AT I O N A L R E V I E W 5 6 | C O R P O R AT E C I T I Z E N S H I P 9 3 | C O R P O R AT E G O V E R N A N C E 1 2 7 | N O V A R T I S G R O U P F I N A N C I A L R E P O R T
Consumer Health
Net sales Operating income 1 Not adjusted for new IFRS accounting rules 2 Pro forma adjusted for new IFRS accounting rules
NET SALES AND OPERATING INCOME – CONTINUING OPERATIONS(Index: 2002 = 100%)
160
150
140
130
120
110
100
20021 20032 20042 2005 2006
NET SALES BY REGION – CONTINUING OPERATIONS
2006 2005
US 47% 46%
Europe 32% 33%
Africa/AsiaAustralia 10% 11%
Canada andLatin America 11% 10%
87%CONTINUING OPERATIONS
2006 Net sales (in %)
13%DISCONTINUING
OPERATIONS
100
83%CONTINUING OPERATIONS
2006 Operating income (in %)
17%DISCONTINUING
OPERATIONS
100
CONTINUING AND DISCONTINUING CONSUMER HEALTH OPERATIONS
KEY FIGURES – CONTINUING OPERATIONS(In USD millions unless indicated otherwise)
2006 2005
Net sales 6 540 6 049Operating income 1 068 952Research and development 288 270Research and development
as % of net sales 4.4 4.5 Free cash flow 778 811Net operating assets 4 122 4 433Additions to property,
plant & equipment1 222 233Number of associates at year-end 17 658 16 831
1 Excluding impact of business combinations
CONSUMER HEALTH
119863_Nova_000_000_ih_e.qxp 24.1.2007 17:43 Uhr Seite 51

52
N O V A R T I S G R O U P B U S I N E S S R E V I E W
long condition that can be controlled, butnot cured. Veterinarians estimate that onedog in seven is afflicted with the disorder.
Atopica selectively targets specificimmune cells to block the allergic responsethat causes the dog’s scratching and other symptoms. Sales of the medicine rose morethan 20% during 2006 and future prospectsare upbeat. With a further simplification ofthe diagnosis, more veterinarians areexpected to adopt Atopica to provide relief tothe dogs and their owners.
Atopica is one of several human medi-cines from Novartis – from painkillers to car-dio-renal medications – that have been suc-cessfully developed and registered forveterinary use. Novartis Animal Health hassignificantly outpaced growth of the globalmarket for three consecutive years, fueled inpart by successful versions of human-to-vet-erinary “switches.”
With research centers in Switzerland,the US, Canada and Australia, innovation atNovartis Animal Health covers companionanimals, as well as food animals, includingfish. “Our success is based on innovativeproducts that meet the evolving needs of ourcustomers,” says George Gunn, Head ofNovartis Animal Health.
“Developing veterinary formulations ofmedicines originally discovered for humanindications will remain a valuable synergyfor the Novartis Group, and a key competi-tive strength for Animal Health as we con-tinue to strengthen our global position in afragmented, but expanding industry.”
Sales growth at the Novartis Animal Health Business Unit has outpaced the global market for three consecutive years fueled by successful veterinary versions of human medicines. It’s a major synergy for Novartis and a competitive edge as Animal Health steadily improves its global ranking in a fragmented, but expanding industry.
CONSUMER HEALTH
El Pomar is a nine-year-old Labrador retriever,trained as a service dog for its quadriplegicowner, Jim Pearson.
Mr. Pearson and El Pomar have beentogether for seven years. During much ofthat time, however, the dog suffered fromatopic dermatitis, a canine skin allergy withsymptoms ranging from scratching, hair lossand secondary infections to unpleasantodor. El Pomar responds to dozens of com-mands but Mr. Pearson found himself con-stantly repeating two negative ones – “Leaveit” and “Don’t” – to prevent the dog fromscratching or biting sores on its skin.
“We’ve only been apart one day in sevenyears,” Mr. Pearson says. “His happiness ismy happiness and I’d do anything for him.”
Mr. Pearson tried virtually every therapyavailable but none provided more than temporary relief for El Pomar. Finally, acanine dermatologist ran a gamut of testsand recommended treatment with Atopica,an innovative medicine from Novartis AnimalHealth.
Within days of starting treatment, ElPomar stopped scratching, for the first timein years. A month later, the dog was off shotsand steroids and remains itch-free today, Mr.Pearson says, thanks to one Atopica capsuleevery other day.
Atopica, a veterinary medicine for canineatopic dermatitis, contains the same activeingredient as Neoral, a Novartis medicinethat also is approved for treatment of severeatopic dermatitis in humans. Like humanallergies, canine atopic dermatitis is a life-
119863_Nova_000_000_web_e.qxp 24.1.2007 13:19 Uhr Seite 52
53
0 2 | G R O U P R E V I E W 1 2 | O P E R AT I O N A L R E V I E W 5 6 | C O R P O R AT E C I T I Z E N S H I P 9 3 | C O R P O R AT E G O V E R N A N C E 1 2 7 | N O V A R T I S G R O U P F I N A N C I A L R E P O R T
Consumer Health
Close Cooperation
While Atopica is approved for similar indica-tions in humans and dogs, prescription med-icines often have different activity profiles indifferent species. A drug that is effective forhumans may not be useful or not safe for usein pets – or vice versa.
The search for potential switch candi-dates at Novartis Animal Health focuses pri-marily on diseases afflicting the heart or kid-ney, where the human form is similar to thatfound in dogs and cats. Pain management isanother priority indication.
Convenience of administration is a cru-cial attribute for potential veterinary medi-cines. Deramaxx, a painkiller from Novartisused widely to treat osteoarthritis in dogs, isavailable as a chewy, beef-flavored tablet.The development pipeline at Novartis AnimalHealth includes other novel formulationswith flavors and textures that ease adminis-tration. Moreover, innovative topical medi-cines can be delivered by placing a few dropsonto the skin of an animal.
“Whenever possible, we look for ways tomake it easier for owners to administer themedicine,” says Peter Wells, Ph.D., Head ofResearch and Development at the AnimalHealth Business Unit.
Dr. Wells and the Development teamwork closely with scientists at the NovartisInstitutes for BioMedical Research as well as other Novartis divisions. Certain anti-infectives marketed by Novartis AnimalHealth were discovered by researchers atSandoz, but later developed exclusively forveterinary applications. “We also have anumber of projects in the development port-folio that have come out of cooperation withthe Pharmaceuticals Division,” Dr. Wells adds.“We see real opportunities for the future.”
From Chronic Pain to Separation Anxiety
Fortekor is a veterinary formulation ofbenazepril hydrochloride, the active ingredi-ent in Cibacen/Lotensin, an ACE inhibitorfrom Novartis approved to treat people withhigh blood pressure, heart failure and chron-ic renal disease. Dogs and cats develop bothheart disease and kidney disease, though thecauses of their disorders are different than inhumans. So it seemed logical to explore pos-sible veterinary applications for benazepril.
“When we started development of a vet-erinary version of benazepril, nobody wassure if it would work,” recalls Jonathan King,Ph.D., International Project Leader for Devel-opment at Novartis Animal Health. Subse-quent testing, however, showed that Fortekorwas effective, and well tolerated, in both dogsand cats.
“The big cardiovascular indication indogs is chronic heart failure – where ACEinhibitors already were the standard of carefor humans,” Dr. King says. Fortekor, howev-er, is the only ACE inhibitor approved to datefor veterinary use in cats – to treat chronicrenal insufficiency. “Fortekor is very well tolerated,” Dr. King adds.
Deramaxx, the painkiller launched byNovartis Animal Health in 2002, has beenprescribed by more than 14 000 veterinarypractices to treat chronic pain associatedwith osteoarthritis and postoperative pain indogs. The first drug in the so-called coxib classapproved to date by the US Food and DrugAdministration for veterinary use, Deramaxxwas licensed in by Novartis Animal Healthlargely because its pharmacokinetic profilemade the compound more suitable for usein dogs than other coxibs, Dr. King says.
A further attraction of Deramaxx was clin-ical data in humans demonstrating that
coxibs reduce the incidence of gastrointesti-nal ulcers, compared to treatment with non-selective nonsteroidal anti-inflammatorydrugs (NSAIDs). “That’s what generated ourinterest in Deramaxx from the start,” Dr. Wells says.
Osteoarthritis is the most commoncause of chronic pain in dogs and as manyas one in five adult dogs is afflicted with painsevere enough to make it difficult to jump,climb stairs, or even get in and out of cars.While there is no cure, routine screening byveterinarians is important for early detectionof the disorder. And careful management cancontrol pain and improve a dog’s quality of life.
Another successful switch is Clomicalm,the veterinary version of the human anti-depressant Anafranil originally discovered byNovartis. Clomicalm is the only medicationapproved for the treatment of separationanxiety in dogs. Dogs with separation anxietyare often well behaved when people are present but become anxious when left alone,which can lead to chewing and house soiling.Punishment by frustrated owners oftenaggravates the problem because dogs withthe disorder can’t control their behavior.Clomicalm is used together with behavioraltraining to help relieve anxiety, making it easier for a dog to learn new, positive behaviors. Therapy should only be undertakenby veterinarians familiar with treatment ofbehavioral disorders.
119863_Nova_000_000_web_e.qxp 24.1.2007 13:19 Uhr Seite 53

54
N O V A R T I S G R O U P B U S I N E S S R E V I E W
V E T L A N D A N I M A L H O S P I T A L ; P R E T O R I A , S O U T H A F R I C A
119863_Nova_000_000_web_e.qxp 24.1.2007 13:19 Uhr Seite 54

5555
C I B A V I S I O N ; G R O S S W A L L S T A D T , G E R M A N Y
119863_Nova_000_000_web_e.qxp 24.1.2007 13:19 Uhr Seite 55

56
N O V A R T I S G R O U P B U S I N E S S R E V I E W
Corporate Citizenship at Novartis rests on four pillars: Commitments to Patients; to Our People; to Health, Safety and Environment (HSE); and to Ethical Business Conduct.
Treatments worth USD 755 million were contributed through access-to-medicine programsin 2006, reaching 33.6 million patients in need.
Novartis reduces average treatment price of Coartem to one US dollar, subsidizing access to this leading antimalarial medicine. Deliveries quintupled in 2006 to 62 million treatment courses.
Novartis named the healthcare sector leader in the Dow Jones Sustainability Index (DJSI),which tracks the performance of companies in terms of corporate sustainability.
Novartis included in the FTSE4Good index and also rated a top sustainability performer, with a triple-A score, in the 2006 Global Pharmaceutical Sector Report by Innovest.
Business Week magazine rates Novartis one of the 50 most valuable brands worldwide and across all industries.
Novartis named by Barron’s magazine as one of the 25 most respected companies world-wide, while Fortune magazine lists Novartis among the world's 50 most admired companies.
CORPORATE CITIZENSHIP
119863_Nova_000_000_web_e.qxp 24.1.2007 13:19 Uhr Seite 56

57
0 2 | G R O U P R E V I E W 1 2 | O P E R AT I O N A L R E V I E W 5 6 | C O R P O R AT E C I T I Z E N S H I P 9 3 | C O R P O R AT E G O V E R N A N C E 1 2 7 | N O V A R T I S G R O U P F I N A N C I A L R E P O R T
Introduction
Indicator1 2006 2005 2004 2003 2002
Economic
Group net sales in USD billions 37.0 32.2 28.2 24.9 20.9
Group net income in USD billions (% of Group net sales) 7.2 (19) 6.1 (19) 5.6 (20) 4.9 (20) 4.7 (23)
Research & Development in USD billions (% of Group net sales) 5.4 (15) 4.8 (15) 4.1 (14) 3.7 (15) 2.8 (14)
Purchased goods and services2 in USD billions (% of Group net sales) 17.9 (48) 15.7 (49) 13.0 (46) 11.0 (44) 9.1 (44)
Net value added (NVA) in USD billions (% of Group net sales) 18.1 (49) 15.7 (49) 14.9 (53) 13.7 (55) 12.5 (60)
– to associates in USD billions (% of NVA) 9.1 (51) 7.9 (51) 7.0 (47) 6.3 (45) 5.1 (41)
– retained for future growth in USD billions (% of NVA) 5.2 (29) 4.1 (26) 4.3 (29) 4.3 (31) 3.3 (26)
– to authorities in USD billions (% of NVA) 1.5 (8) 1.3 (8) 1.3 (9) 1.2 (9) 1.1 (9)
– to financial institutions in USD billions (% of NVA) 0.3 (1) 0.3 (2) 0.3 (2) 0.2 (2) 1.6 (13)
– to shareholders/dividends in USD billions (% of NVA) 2.0 (11) 2.1 (13) 2.0 (13) 1.7 (13) 1.4 (11)
Social
Number of associates (headcount) 100 735 90 924 81 392 78 541 72 877
Resignations, separations, hiring (% of associates) 8, 4, 19 8, 4, 16 7, 3, 15 - -
Number of associates trained on Code of Conduct (e-learning courses)3 14 574 33 000 - - -
Cases of misconduct reported 651 4424 4105 - -
Cases of misconduct substantiated 228 1424 2045 - -
Dismissals/resignations (related to misconduct) 130 784 1075 - -
Access to Medicine6: value in USD millions 755 696 570 371 255
Access to Medicine6: patients reached in millions 33.6 6.5 4.25 2.76 -
Number of suppliers informed (turnover more than USD 10 000) 42 200 39 000 30 000 - -
Number of suppliers to confirm key standards (self-declaration) 8 600 5500 4600 - -
Number of suppliers audited (including labor standards) 92 55 5 - -
Health, Safety & Environment7
Lost time accident rate [accidents per 200 000 hours worked] 0.40 8 0.44 9 0.48 0.7 0.71
Resources
Water use [million m3] 90.1 91.5 86.4 92.6 89.9
Energy [million GJ] 18.0 16.9 16.3 16.0 15.7
Emissions
Emission CO2/GHG, Scope 1: Combustion and processes [1000 t] 488 458 470 477 471
Emission into Air: hal- and nonhalogenated VOCs [t] 1 769 1 407 1 317 1 676 1 736
Total Operational Waste [1000 t] 303 288 228 224 251
1 Data reported in the “Economic” and “Social” sections above (except “Number of suppliers” items) include the entire Group; Data reported in “Number of suppliers” items and “Health, Safety and Environment” section (except “Lost time accident rate”) exclude the new Vaccines and Diagnostics Division
2 Element of indirect economic contributions3 Other mandatory courses: Human Rights, E-compliance and Records Management4 From April to December 20055 From October 2003 to September 20046 See table page 697 Details see: www.novartis.com/hse8 Excludes Hexal/Eon Labs and Vaccines and Diagnostics9 Excludes Hexal/Eon Labs
KEY PERFORMANCE INDICATORS
119863_Nova_000_000_web_e.qxp 24.1.2007 13:19 Uhr Seite 57
58
N O V A R T I S G R O U P B U S I N E S S R E V I E W
Novartis has a longstanding commitment toactive engagement in society, reflected in ourPolicy on Corporate Citizenship and itsimplementation through management pro-cesses across the Group. We pledge to rec-ognize the interests of stakeholders, and thepublic at large, in our social behavior and thehealth, safety and environmental impacts ofour business.
We seek to engage in an active dialoguewith diverse stakeholder groups throughcommunity panels, focus groups and collab-orations with patient advocacy organizations.
While remaining externally focused, weare building a reputation as an exciting placeto work, where people can realize their professional ambitions. We strive for a motivating environment where creativity andeffectiveness are encouraged and where cutting-edge technologies are applied.
Novartis places such a strong emphasison Corporate Citizenship because it’s theright thing to do. But sustainable CorporateCitizenship initiatives are also good for busi-ness. For a company to be successful, rela-tionships with the communities it servesmust be based on trust and good will. Bydoing the right thing, we are trusted by com-munities, and by the governments that giveus an opportunitiy to operate, to innovateand to grow.
A strong Corporate Citizenship programreduces business risks and provides a com-petitive advantage by enhancing access tomarkets and customers for Novartis productsand associates. Efficient use of energy andother natural resources saves money and atthe same time mitigates environmental risks.
Neighboring communities also benefit fromsound stewardship of the environment.
Our Corporate Citizenship approach isbased on our values and reflects our com-mitment to the United Nations Global Com-pact. The Global Compact asks companies toembrace, support and enact a set of core val-ues in the areas of human rights, labor stan-dards, the environment and efforts to com-bat corruption.
Our Corporate Citizenship Policy is supported by specific guidelines, coveringmaterial areas such as working conditions,business ethics, human rights and third-partymanagement. Novartis fosters a culture whereassociates are expected to behave not onlylawfully, but ethically. Besides complyingwith laws and regulations that govern ouroperations in more than 140 countriesaround the world, Novartis associates upholdthe ideals and values defined in our Code ofConduct and Corporate Citizenship Policy,and in related policies and guidelines.
Corporate Citizenship at Novartis is firm-ly anchored at the Board level. The Audit andCompliance committee is responsible forauditing Corporate Citizenship implementa-tion and compliance. The Executive Commit-tee of Novartis is responsible for implemen-tation and has established a steeringcommittee which has overall responsibilityfor Corporate Citizenship Policy and guide-lines.
The operating units within each of ourDivisions establish appropriate structures,and allocate sufficient resources to reason-ably meet the expectations of our CorporateCitizenship Policy. Through management
reviews, as well as internal and externalaudits and assurances, we measure progressand verify compliance with the Policy, relat-ed guidelines and regulatory requirements.
Senior managers within Novartis areresponsible for implementing these guide-lines and performance is measured. Progressagainst our objectives is presented each yearin our annual report and in an online reportin accordance with the guidelines of theGlobal Reporting Initiative.
Novartis places a strong emphasis on Corporate Citizenship because it is theright thing to do. But sustainable Corporate Citizenship initiatives are also goodfor business, increasing trust in the communities where we are located and withgovernments that regulate our operations.
CORPORATE CITIZENSHIP
119863_Nova_000_000_web_e.qxp 24.1.2007 13:19 Uhr Seite 58
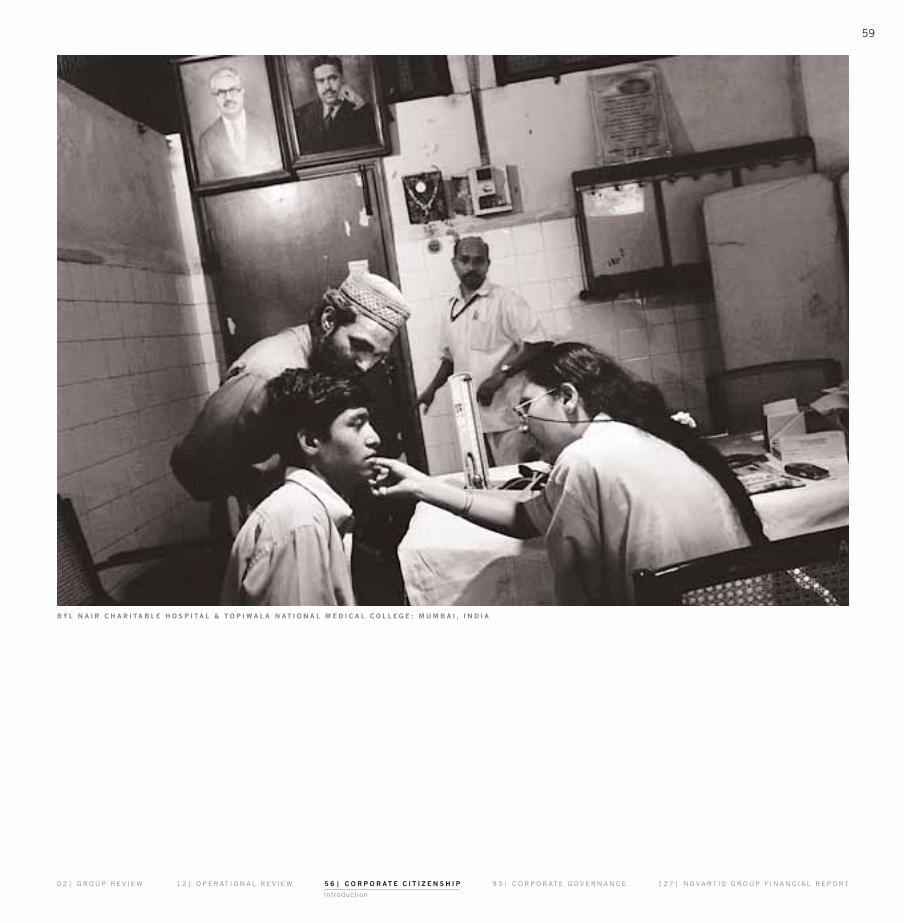
59
0 2 | G R O U P R E V I E W 1 2 | O P E R AT I O N A L R E V I E W 5 6 | C O R P O R AT E C I T I Z E N S H I P 9 3 | C O R P O R AT E G O V E R N A N C E 1 2 7 | N O V A R T I S G R O U P F I N A N C I A L R E P O R T
Introduction
B Y L N A I R C H A R I T A B L E H O S P I T A L & T O P I W A L A N A T I O N A L M E D I C A L C O L L E G E ; M U M B A I , I N D I A
119863_Nova_000_000_web_e.qxp 24.1.2007 13:19 Uhr Seite 59

60
N O V A R T I S G R O U P B U S I N E S S R E V I E W
T R A D I T I O N A L C H I N E S E M E D I C I N E ; B E I J I N G , C H I N A
119863_Nova_000_000_web_e.qxp 24.1.2007 13:19 Uhr Seite 60

61
0 2 | G R O U P R E V I E W 1 2 | O P E R AT I O N A L R E V I E W 5 6 | C O R P O R AT E C I T I Z E N S H I P 9 3 | C O R P O R AT E G O V E R N A N C E 1 2 7 | N O V A R T I S G R O U P F I N A N C I A L R E P O R T
Patients
Novartis endorses the right to health. Webelieve that each sphere of society – govern-ment, medical professionals, individuals andbusiness – has a role to play in support of theright to health.
Our most important contribution to society and to the fulfillment of the right to health is to discover, develop, produce and distribute high-quality healthcare pro-ducts, targeting unmet medical need. Ourcommitment to patients leads us to maintainone of the highest levels of research in-vestment among top-tier pharmaceuticalcompanies. Our drug development programhas been one of the most productive in theglobal pharmaceutical industry in recent years.
We recognize, however, that access toour medicines clearly favors people who livein affluent, developed societies. We want tobe leaders and partners in finding, andimplementing, solutions to help close theaccess gap.
Thanks to our business results, we areable to help where there is immediate needwith products, funds and other supportivemeasures, on a case-by-case basis. Last year,we were able to contribute products valuedUSD 755 million and reach more than 33 million patients in need through access-to-medicine projects around the world.
The Novartis Institute for Tropical Dis-eases – based in Singapore – is bringing theongoing revolution in biomedical scienceand technology to bear on diseases of thedeveloping world, initially tuberculosis anddengue fever, but now also malaria.
We provide medicines at no profit – orsometimes free – to patients in the develop-ing world afflicted by diseases such as lep-rosy, malaria and tuberculosis. We also offerdiscounts and support programs to patientswithout medical insurance or other financialresources in industrialized countries.
For more than 25 years, the NovartisFoundation for Sustainable Development(NFSD) has made significant contributions to the health of people in need in the devel-oping world. The NFSD supports patient-education programs against malaria, and is developing new patient-centered daily-observed-treatment systems for tuberculosis.
Inner Compass
Some nongovernmental organizations arguethat drug prices and patents are the princi-pal obstacles to access to medicine in thedeveloping world. Yet the problem is muchmore complex – involving virtually all aspectsof poverty.
Novartis and other healthcare organiza-tions strongly assert that medicines alonecannot solve the underlying problems ofpoverty, inadequate public health services orthe lack of healthcare personnel and infra-structure that beset all developing countries.Moreover, weakening intellectual propertyrights would jeopardize, rather than expand,long-term access to medicines by removingincentives for innovation.
At the Group’s biennial research confer-ence last year, Daniel Vasella, M.D., Chairman
Through its uniquely broad portfolio of medicine-based businesses, Novartis has pioneered an array of models to enhance both affordability and access to treatment.We recognize that access to our medicines usually favors people who live in affluent,developed societies – but we strive to be leaders and partners in finding solutions tohelp close the access gap.
COMMITMENT TO PATIENTS
119863_Nova_000_000_web_e.qxp 24.1.2007 13:19 Uhr Seite 61

62
N O V A R T I S G R O U P B U S I N E S S R E V I E W
and Chief Executive Officer of Novartis,addressed the major trends influencinghealthcare today. He acknowledged the chal-lenges Novartis faces in dealing with adiverse array of stakeholders – but alsodescribed the distinctive strategy Novartishas adopted to enhance both access andaffordability through a broad portfolio ofmedicine-based businesses.
“If we look at the outside world withwhich Novartis is dealing, it’s an increasing-ly complex map of stakeholders,” Dr. Vasellasaid. “And expectations of these stakehold-ers are often contradictory, so we have tomake a decision about how we are going to navigate. I think it’s extremely important tofollow the direction shown by our own innercompass.”
Aging of populations, changing lifestyles,rapid economic growth in some emergingmarkets and the emergence of new infectiousdiseases – potentially including pandemicinfluenza – will create opportunities for futuregrowth but at the same time impose intensecost pressures on healthcare systems.
“The core of our business in the health-care arena is the Pharmaceuticals Division –highly innovative medicines to address stillunmet medical needs,” he added. “Sandozprovides high-quality, low-cost medicines toreduce the financial burden for healthcaresystems and other payors. Vaccines makesure people don’t get sick in the first place,and Diagnostics prevents contamination ofblood supply. Rounding out the picture isConsumer Health – people taking responsi-bility for self-medication is important to us.”
Pricing: “An investment, not just a cost…”
Pharmaceutical manufacturers do not uni-laterally determine the price of drugs. Inmost European countries, prices must be
negotiated with national agencies which setthe price based on the cost of existing therapies, overall healthcare impact andbenchmarks in other countries. Moreover,price levels for pharmaceuticals, like othergoods, depend on the economic ability andwillingness of different countries andpatients to pay.
Once a prescription medicine leaves thefactory, there are markups at each link of thedistribution chain, from wholesalers throughretail pharmacies – resulting in an averagemarkup in the European Union of 30%. As a consequence, pharmacy prices, which are the ones most visible to consumers, vary much more than the ex-factory pricescharged by manufacturers.
Novartis believes that healthcare spend-ing is an investment, not simply a cost.Health Technology Assessment (HTA) repre-sents an important tool for governments andother payors to develop mechanisms forevaluating the clinical and cost-effectivenessof medicines and other healthcare technolo-gies. At the same time, however, HTA shouldnot be used as a means to delay or excludenew medicines from reaching patients. Tothat end, Novartis urges that governmentsand other healthcare payors conduct HTAsguided by a clear transparent set of key prin-ciples.
Novartis is committed to providing time-ly, accurate and detailed information to gov-ernments and other health payors. Indeed,the Group works with external advisors tomeasure the impact of new therapies usingHTA. By taking into account the perspectiveof payors and patients, Novartis is better ableto highlight added value of its products.
Above all, the price of a medicine mustalways be viewed in relation to the value pro-vided to patients and payors. A study pre-sented at the World Aging & Generations
Congress in St. Gallen, Switzerland last yearshowed that treatment of people with highblood pressure in the US reduced deathsfrom cardiovascular disease by two thirdsbetween 1950 and 1994.
Without antihypertensive therapy, thestudy found, an estimated 86 000 excess premature deaths from cardiovascular diseaseand more than 800 000 hospitalizations forstroke and heart attacks would have occurred.
Treatment of hypertension was highlycost effective, creating USD 10 in value for eachdollar spent for American women, and a pay-back of USD 6 per dollar spent for treatmentof American men with high blood pressure.
To demonstrate the value of its medi-cines, Novartis conducts and supports exten-sive health economic research. The analysisis often based on large clinical trials butincreasingly also “real-world” outcomes.
A study involving Diovan, for example,analyzed claims data from a US pharmacybenefit manager showing treatment out-comes for more than 140 000 patients withhypertension. The study found that patientswho received Diovan “in a usual care setting”had better compliance with therapy thanpeople who received either amlodipine orlisinopril, two other antihypertensive medi-cines. According to the authors, the findingssuggest that choice of Diovan for chronicdrug management of hypertension “has thepotential to affect patient drug-taking behav-ior and perhaps longer-term outcomes in atypical real-world setting.”
Moreover, in one of the clearest exam-ples yet of the value of a pioneering medi-cine, Novartis broke new ground withGleevec/Glivec, an innovative treatment forpeople with chronic myeloid leukemia whowere in an advanced stage of the disease,blast crisis or intolerant to interferon. Afterbeing designated an orphan drug, Glivec was
119863_Nova_000_000_web_e.qxp 24.1.2007 13:19 Uhr Seite 62

63
0 2 | G R O U P R E V I E W 1 2 | O P E R AT I O N A L R E V I E W 5 6 | C O R P O R AT E C I T I Z E N S H I P 9 3 | C O R P O R AT E G O V E R N A N C E 1 2 7 | N O V A R T I S G R O U P F I N A N C I A L R E P O R T
Patients
approved in record time on the basis ofuncontrolled trials demonstrating improve-ments on surrogate outcomes: clearance ofcancer cells from the bloodstream and thebone marrow.
Novartis managed to link these outcomesto long-term survival, and demonstrate thecost-effectiveness of Glivec. Sir Michael Rawlins, Chairman of the UK’s NationalInstitute for Health and Clinical Excellence(NICE), has used Glivec as an example forgood health-economic analyses, and proofthat NICE, a prototype agency for HTA, recognizes the full value of therapies andsocietal judgment in its appraisals.
For the past 50 years, the research-based pharmaceutical industry has been theonly viable model to discover and developeffective treatments for many diseases. Theindustry – and Novartis – have contributednovel medicines to improve both mortalityand morbidity rates in cardiovascular dis-ease, cancer, diabetes, organ transplantation,gastrointestinal disease and many other dis-orders. Without such innovations, medicinewould not be as effective as it is today, andmany patients would suffer and die.
The challenge before the pharmaceuticalindustry is a difficult one. Companies likeNovartis must balance an increased com-mitment to Corporate Citizenship in devel-oping countries and elsewhere against thedemands of investors and financial marketsto generate sufficient financial returns onextensive investments in innovation.
Special pricing arrangements that allowprices for individual products to be adaptedto the specific need of developing countriesoffer a solution by providing incentives forresearch, while at the same time preservinga wider distribution of medicines at anappropriate rate of return. These arrange-ments, however, must be supported by
important safeguards, including provisionsto ensure that artificially low prices for med-icines offered to developing countries are notused subsequently as the basis for referenceprices for drug reimbursement in developedcountries. In addition, effective trade controlsmust prevent re-exportation of such low-priced medicines to affluent markets.
Unique Portfolio
With a unique position among world leadersin innovative medicines as well as generics,Novartis has pioneered a broad array of pro-grams to enhance affordability of treatment.
The generic business highlights anotherdimension of value. Generic products accountfor more than half of all prescription drugsconsumed in the US and fierce competitionamong manufacturers shrinks prices to afraction of what the originator medicinefetched before loss of patent protection.
However, many European nations con-tinue to forgo huge potential savings thatcompetition could deliver. A study by the USDept. of Commerce three years ago exam-ined drug-price regulatory systems in 11OECD countries that rely on some form ofprice controls to limit spending on pharma-ceuticals. For patented drugs that were bestsellers in the US, prices in other OECD coun-tries were 18% to 67% less than US prices,representing a total of USD 27 billion inreduced sales.
Paradoxically, these same 11 OECDcountries also employ regulatory practicesthat limit competition in generic pharma-ceuticals. Higher utilization of generic drugsat lower prices could save up to USD 30 billionannually, according to the Commerce Dept.“This range of potential savings suggests thatif prices of on-patent drugs were to rise tocompetitive market levels, then the addition-
al cost to OECD countries could be signifi-cantly or fully offset by a more competitivegeneric market,” the study said.
Vaccines are widely regarded as amongthe most cost-effective interventions inhealthcare – but they remain underutilizedthroughout the world. The new Vaccines andDiagnostics Division at Novartis has a broadresearch program, focusing on major dis-eases such as pandemic influenza, meningo-coccal disease and HIV/AIDS. But even lesser-known diseases can result in acute unmetmedical need.
Last year Novartis Vaccines announcedthe successful conclusion of a two-year vaccination campaign in New Zealand, thebiggest in the country’s history, using ameningococcal B vaccine tailor-made for thesmall Pacific-island nation.
The MeNZB vaccine, developed jointly byNovartis, the New Zealand government anddrawing upon earlier work by Norway’s Institute of Public Health, halted a 14-year epidemic that struck thousands of NewZealanders, killing more than 200 peopleand leaving more than a thousand peoplepermanently disabled. The epidemic wascaused by a strain of Neisseria meningitidisserogroup B (MenB) found only in NewZealand.
The vaccination campaign ran from July2004 through June 2006. More than a millionpeople were vaccinated, ranging from infantsto adolescents up to 20 years of age. Sincethe launch of the vaccine, the incidence ofMenB disease in New Zealand has fallen bymore than 80%.
“We set out to end an epidemic byundertaking the largest mass immunizationprogram in New Zealand’s history,” says Min-ister of Health Pete Hodgson. “We are nowseeing dramatic declines in meningococcal Bcases. And the rapid decline has given us the
119863_Nova_000_000_web_e.qxp 24.1.2007 13:19 Uhr Seite 63

64
N O V A R T I S G R O U P B U S I N E S S R E V I E W
H O S P I T A L D E L A M I S E R I C O R D I A ; B O G O T Á , C O L O M B I A
119863_Nova_000_000_web_e.qxp 24.1.2007 13:19 Uhr Seite 64
65
0 2 | G R O U P R E V I E W 1 2 | O P E R AT I O N A L R E V I E W 5 6 | C O R P O R AT E C I T I Z E N S H I P 9 3 | C O R P O R AT E G O V E R N A N C E 1 2 7 | N O V A R T I S G R O U P F I N A N C I A L R E P O R T
Patients
confidence to push ahead with an extensionof the campaign.”
Still, the limited commercial potential fora vaccine tailor-made for a small country likeNew Zealand was a major hurdle to theMeNZB project. “People questioned the deci-sion to develop this vaccine many times,arguing that there was no money in it. Andthey were right. We more or less managed tocover our costs,” says Rino Rappuoli, Ph.D.,Head of Research at Novartis Vaccines.
“So this was a philanthropic project – butone that also added to our knowledge andhelped the field to progress,” he adds. “Westarted from scratch and in four years wewere eliminating the disease. A program likethis normally takes closer to a decade. Andwe did it without compromising safety. Itshows that when public-private partnershipsare done the right way, with goodwill and closecooperation, things happen very quickly.”
Public-Private Partnerships
In recent years, Novartis has forged a suc-cession of public-private partnerships andnot-for-profit initiatives with partners rangingfrom the World Health Organization (WHO)and the Economic Development Board ofSingapore (EDB) to the Medicines for MalariaVenture and the Wellcome Trust. The initia-tives target “neglected diseases” such as lep-rosy, malaria, dengue fever and tuberculosis.Since the year 2000, for example, Novartishas provided free treatment for all leprosypatients worldwide in a pioneering collabo-ration with the WHO. More than 4 millionpeople with leprosy have been treatedthrough use of effective multi-drug therapy(MDT) supplied by Novartis.
But the framework for support fromNovartis is dynamic and increasingly, theseinitiatives are evolving as a result of recogni-
tion by payors of the value of a therapy, aswell as countries’ rising ability to pay. Theclearest example of this evolution to date ispatient access initiatives for Glivec, thebreakthrough, targeted anticancer medicinefrom Novartis.
When Glivec was launched, Novartis alsointroduced one of the most comprehensive andfar-reaching patient assistance programsever implemented on a global scale to helppeople who otherwise would not be able to afford treatment. The program has provedsuccessful and in 2006 more than 15 000people with certain forms of chronic myeloidleukemia (CML) or gastrointestinal stromaltumors (GIST) received treatment under theGlivec International Patient Assistance Pro-gram (GIPAP). A separate Patient AssistanceProgram in the US provided treatment for3 500 patients last year.
GIPAP provides Glivec at no cost to eligi-ble patients in developing countries withminimal reimbursement capabilities, and noavailable generic versions of Glivec. Access isprovided to patients who are properly diag-nosed, not covered by local reimbursementor insurance, and have no other financialresources.
Unlike traditional donation programs,GIPAP is based on a “patient-direct” model –facilitating delivery of Glivec to patients bytheir treating physician. Indeed, local physi-cians are the cornerstone of the program,selected to participate because of theirexpertise and willingness to take time frombusy schedules to bring treatment to peoplein need. GIPAP also provides information andreferral assistance to patients, their familymembers and caregivers.
The flexible structure of the access pro-grams makes it possible to maximize effec-tiveness in different countries. BecauseGIPAP does not supplement government
obligation or insurance, access programs areable to adapt to changing healthcare policies– reflecting local conditions, while support-ing sustainability over the long term.
In a number of countries, local Glivecassistance programs have evolved toward anew “shared contribution” model. The tradi-tional donation model – GIPAP – is increas-ingly being reserved for countries that can’tafford to pay.
“When we set up GIPAP, we didn’t dis-tinguish between very poor countries, whichlack sufficient reimbursement capabilities,and emerging economies that have begun todevelop reimbursement capacity in pacewith rapid economic development,” saysStephanie Lassarat, Head Global PatientAccess at the Novartis Oncology BusinessUnit. “Our commitment to shared contribu-tion shows that Novartis believes in theseemerging countries. We are helping them tobridge the gap, and make innovative thera-pies broadly available to patients throughcreative and sustainable public-private col-laborations that enhance access to treatment.”
Details vary from country to country butshared contribution means that local payors– from national healthcare systems to insur-ers and charities – assume a share of thecost of treatment with Glivec. Countries sup-porting expanded access to Glivec through ashared contribution model include HongKong, Colombia, Tunisia, Ukraine, Cuba andsome provinces in China. In Russia, Novartisalso continues to support treatment with Glivecfor some patients in need during a transitionperiod for the country’s healthcare system.
“Joining forces and dividing up the costis an important step toward sustainablepatient access,” Ms. Lassarat adds. “Andonce countries start paying part of the cost,they feel a bigger stake in the success oftreatment. This, in turn, is leading to
119863_Nova_000_000_web_e.qxp 24.1.2007 13:19 Uhr Seite 65

66
N O V A R T I S G R O U P B U S I N E S S R E V I E W
enhanced interaction between Novartis andhealthcare systems in many countries. Andwe believe shared contribution models canbe a trigger for these emerging countries toultimately broaden reimbursement of veryinnovative treatments like Glivec which arehighly cost-effective.”
In another major advance, regulatoryauthorities in Europe and the US approvedGleevec/Glivec to help patients afflicted withrare but potentially life-threatening disorderswith limited treatment options. The actionrepresented the first time that a regulatoryauthority has ever simultaneously approvedone targeted medicine for so many disorders.
“We continue to work on improvingaccess at multiple levels,” says David Epstein,Head of Novartis Oncology. “You start bybringing a drug to market – even thoughsometimes the therapy can be perceived ashaving small value in typical Western mar-kets. But access in developed markets canalso be hindered by having a restrictedlabel,” he adds.
“So even if all these additional approvalsfor rare indications for Gleevec/Glivec won’tmake us all that much money, it means thatpatients in many countries, particularly inEurope, who previously haven’t been able toget treatment through public health systems,will now have improved access.”
Changing the Face of Malaria
In collaboration with the WHO and the UnitedNations Children’s Fund (UNICEF), Novartisis changing the face of malaria by providingthe pioneering antimalarial medicineCoartem on a non-profit basis for public sec-tor use in developing countries where thedisease is endemic. In the meantime, withthe volume of deliveries still climbing rapid-ly, Novartis is moving to broaden distribution
channels to include recognized internationalprocurement agencies, from the UN’s Devel-opment Program and Mission Pharma toCrown Agents and the International Dispen-sary Association, a not-for-profit foundationfounded by pharmacists in the Netherlandsduring the 1970s to supply medicines todeveloping countries.
In September 2006, Novartis announceda significant reduction in the average price ofCoartem for public sector use. “The dramat-ic increase achieved in our productioncapacity – plus the compelling need for aninexpensive and highly effective malariatreatment in low-income countries – prompt-ed our decision to provide Coartem below ourcosts,” Dr. Vasella says. “I am very pleasedthat the WHO and other organizations suchas UNICEF and Médecins Sans Frontièrescan now become even more effective inrolling back malaria.”
This price reduction is expected to havethe greatest impact on children, who sufferdisproportionately from malaria. Nearly 75%of all malaria patients taking Coartem arechildren and adolescents.
In another recent initiative, the NovartisInstitute for Tropical Diseases (NITD), theWellcome Trust, the Economic DevelopmentBoard of Singapore (EDB) and Medicines forMalaria Venture (MMV) agreed to jointly sup-port research aiming to discover and devel-op the next generation of drugs to treatmalaria. The Wellcome Trust, EDB and MMV– a non-profit foundation dedicated to devel-oping affordable new antimalarials – will pro-vide funding of approximately USD 20 mil-lion for the new research partnership. NITDwill manage the program and conductresearch jointly with several institutionsincluding the Genomics Institute of theNovartis Research Foundation and the SwissTropical Institute.
More than 60 countries – 28 in Africaalone – have rewritten their national malariacontrol guidelines in recent years, scrappingolder, ineffective medicines and adoptingartemisinin-based combination therapy(ACT), the class of medicines spearheadedby Coartem. In 2006 Novartis delivered morethan 60 million treatments of Coartem, a 15-fold rise from the 4 million treatmentsdelivered in 2004. Production capacity for Coartem is even higher – 100 milliontreatments – and could be utilized if demandexceeds current projections.
“The scale-up of production capacity forCoartem has been the most rapid increasefor any drug I know – but especially remark-able for a product provided on a not-for-profit basis,” Dr. Vasella says. “Effective drugsare available now, but solving the problem ofmalaria is much more than just a question ofdrug availability. Malaria-endemic countriesare facing a lack of physicians and nurses;the lack of an efficient distribution systemand other preventive steps, such as treatedbednets against unnecessary infection. Gov-ernments, health ministries, internationalorganizations and industry all have roles toplay in addressing and resolving this chal-lenge,” he adds.
Novartis also is pushing ahead with ini-tiatives such as joint development of a newpediatric formulation of Coartem with MMV.Malaria takes a daunting toll among infantsand young children in Africa, where a child isestimated to die of malaria every 30 seconds.
At the moment, parents crush adultCoartem tablets for young children butbecause Coartem has a bitter taste, infantsand young children tend to spit out the med-icine. A more palatable pediatric form couldimprove adherence to therapy and Novartisand MMV are developing a new Coartem for-mulation as a dispersible tablet.
119863_Nova_000_000_web_e.qxp 24.1.2007 13:19 Uhr Seite 66
67
0 2 | G R O U P R E V I E W 1 2 | O P E R AT I O N A L R E V I E W 5 6 | C O R P O R AT E C I T I Z E N S H I P 9 3 | C O R P O R AT E G O V E R N A N C E 1 2 7 | N O V A R T I S G R O U P F I N A N C I A L R E P O R T
Patients
The price cut announced by Novartis inSeptember 2006 reduced the average priceper Coartem treatment course to USD 1.00,from USD 1.57 previously. The move reflect-ed cost reductions as well as benefits fromeconomy of scale – and underscored theGroup’s commitment to remove price as abarrier to access to Coartem. Nevertheless,the price remains below cost, a potentiallysignificant financial risk for Novartis becausecosts are dependent on both production vol-ume and the volatile price of raw materials.
There is growing concern about thefinancial risks manufacturers have incurredto scale-up capacity, and to pay upfront thecosts of raw material procurement, withoutany guarantee that the end product will actu-ally find a market. In Saving Lives, BuyingTime, a recent report on the economics ofmalaria drugs, the Institute of Medicine(IOM), a branch of the US National Acade-mies, describes a “chicken-and-egg dilemmasurrounding ACT supply and demand. With-out an assured market, potential manufac-turers will not commit to adequate ACT pro-duction, nor will farmers expand thecultivation of Artemisia annua, the sourceplant.” To jump start production, the IOMsaid, “The global community must providesufficient funds to encourage investments by manufacturers, guarantee purchases ofACTs and generally stimulate a robust worldmarket.”
Novartis and its partners, for example,invested more than USD 50 million during2005 to expand plant and equipment – plusan even larger dollar amount to secure rawmaterial supplies. “We need something thatremoves the risk of write-offs from compa-nies – so that when we embark on a 14-month production cycle we can be confidentof at least covering our costs through bind-ing forecasts or advance purchase commit-
ments,” says Silvio Gabriel, Executive VicePresident Malaria Initiatives at Novartis.“That risk can’t be transferred to countries –they obviously can’t afford it.”
Various models are under active discus-sion – from binding multi-year forecasts bythe Global Fund, to other forms of marketguarantees to put the supply chain on amore predictable basis.
Distribution through the private sector isone of the biggest remaining challenges forthe Coartem program. The private sectorremains the primary source of care for alarge proportion of Africa’s working poor,particularly in remote rural areas or in coun-tries where the public health system isunderdeveloped.
A potential partner for Novartis in privatesector distribution is Population ServicesInternational, the world’s largest social marketing organization, which has expressedan interest in Coartem as part of integratedmalaria control programs. Other pilot projects are under discussion where subsidiesprovided by Western donors would enableNovartis to offer Coartem at deeply discountedprices.
Tanzania is piloting an innovative privatesector distribution system, aiming tostrengthen delivery of healthcare productsvia shopkeepers certified by the government.Staff receive training and are allowed to dis-pense essential medicines under the statusof Accredited Drug Dispensing Outlets.
Novartis remains confident that newpartners will help Coartem become evenmore successful. “The biggest hurdles inaccess-to-medicine programs in the devel-oping world usually are funding – and find-ing someone willing to take a financial risk inproviding the drugs,” Mr. Gabriel says. In thecase of Coartem, he adds, both funding andthe drug are already available so the missing
links are sustainable procurement practicesand improved processes for transfer of donorfunds. “Now we are talking about operationalthings, where countries can help themselvesby going fast, using money and medicineseffectively and showing positive results.”
119863_Nova_000_000_web_e.qxp 24.1.2007 13:19 Uhr Seite 67

68
N O V A R T I S G R O U P B U S I N E S S R E V I E W
For more than 25 years, the Novartis Founda-tion for Sustainable Development (NFSD)has made significant contributions to easelife for the poorest of the poor in the devel-oping world.
NFSD concentrates its efforts on healthproblems. But its definition of health goesbeyond medical care – the absence of dis-ease or infirmity – to encompass physical,mental and social well-being.
Since the year 2000, Novartis has pro-vided free treatment for all leprosy patientsworldwide in a pioneering collaboration withthe World Health Organization (WHO). Morethan 4 million people with leprosy have beentreated through the use of effective multi-drug therapy supplied by Novartis. In addi-tion to providing free drugs, however, NFSDhas improved access to treatment by helpingto change the traditional stigma surroundingthe disease, integrate effective diagnosis intopublic health services and sponsor compre-hensive rehabilitation programs in both Indiaand Sri Lanka.
“Our focus has always been on doingthings differently,” says Professor KlausLeisinger, President of NFSD. “We try to findbest practice, design pilot programs, and ifthey succeed we help to expand that modelwithin a country, and in other countries.”
Ongoing programs range from supportfor AIDS orphans in sub-Saharan Africa, andcommunity-based health insurance in Mali,to developing new training technologies forhealth personnel in the area of IntegratedManagement of Childhood Illnesses. NFSDalso conducts think-tank activities in fieldsincluding corporate social responsibility, andhuman rights and business.
While NFSD is a related party of Novar-tis, it manages development-related and
humanitarian activities independently. Closelinks with the Group are reflected in the privatesector perspective that the foundation oftenbrings to public debate. Access to professionalskills within Novartis is another benefit.
In one current example, the HumanResources function at Novartis will assist withan upgrade of operations and managementprocesses planned by the Regional Psy-chosocial Support Initiative for ChildrenAffected by AIDS, Poverty and Conflict(REPSSI) to expand support for AIDS orphansbeyond Tanzania, to a dozen additional coun-tries in southern Africa.
Psychosocial Support for AIDS Orphans
As a consequence of the epidemic of HIV /AIDS sweeping sub-Saharan Africa, morethan 12 million children under the age of 18have lost their father, mother or both par-ents. The number of orphaned children isexpected to rise steadily, reaching 16 millionby the year 2010.
Humuliza, a pilot project for AIDSorphans which NFSD has helped to developin northwest Tanzania, provides a lifeline formore than 2 000 youths. The program aimsto help empower the children by providingopportunities for education as well as trainingin agriculture and other types of employment.
As a result of the successful pilot phase,the project is being scaled up across southernAfrica. NFSD and more than 140 nongovern-mental organizations sponsoring REPSSI willroll out the Humuliza model in new countriesranging from the Republic of South Africaand Angola to Mozambique and Zambia.REPSSI is also consulting with governmentsin the region about broader introduction ofpsychosocial support programs.
Community-based Health Insurance
One of the latest examples of the supportNFSD is providing at the local level in devel-oping countries is a pilot program introduc-ing health insurance in 72 remote villages inMali. Launched by the rural commune of Cinzana in 2003, the insurance programseemed a risky initiative. Previous insuranceschemes in the region had collapsed, leavingvillagers who had paid premiums withoutcare when they needed it most.
Over the past three years, however,more than 2 000 members have joined theCinzana insurance program – roughly 12%of all residents in the catchment area. Theannual premium – less than USD 3 – covers60% of the cost of basic healthcare at a localclinic, and a higher 75% of costs whenobstetric complications require more sophis-ticated care at a regional health facility.
A co-founder of the Cinzana program,NFSD provides its local partners with fund-ing, as well as managerial support rangingfrom planning and financial controlling tomarketing. Along with basic health services,the program is stepping up efforts in pre-ventive care – including distribution of insec-ticide-treated bed nets to members.
Cinzana’s program has become thebiggest single health insurer in Ségou, aregion of Mali with two million residents.From 2007, core elements of the Cinzanamodel will be scaled up and introducedthroughout the Segou region, an importantstep toward creating bigger risk pools capa-ble of financing more costly health interven-tions that are urgently needed.
The mission of the Novartis Foundation for Sustainable Development is to easeconditions of life for the poorest of the poor. Contributions, while focused onhealth, extend far beyond medical care to shaping new healthcare models.
NOVARTIS FOUNDATION FOR SUSTAINABLE DEVELOPMENT
119863_Nova_000_000_web_e.qxp 24.1.2007 13:19 Uhr Seite 68

69
0 2 | G R O U P R E V I E W 1 2 | O P E R AT I O N A L R E V I E W 5 6 | C O R P O R AT E C I T I Z E N S H I P 9 3 | C O R P O R AT E G O V E R N A N C E 1 2 7 | N O V A R T I S G R O U P F I N A N C I A L R E P O R T
Patients
Value Patients Project Objective Target region (USD millions) reached
Malaria/WHO1 Provide Coartem at cost for public sector use Africa, Asia,Latin America 179 33 000 000
Leprosy/WHO2 Eliminate leprosy by providing free medications Globalto all patients worldwide, with WHO, through 2010 4 226 000
Tuberculosis2 Donation of fixed-dose combinations Tanzania, Sri Lanka 3 134 000
Novartis Institute Discover novel treatments and prevention methods for major Developing countriesfor Tropical Diseases tropical diseases; NITD discoveries to be available in poor(NITD)3 endemic countries without profit 11 -
Novartis Foundation Work at policy and field level to improve access to healthcare Developing countriesfor Sustainable Development3 for the world’s poorest people 7 95 000
Patient Assistance Assistance to patients experiencing financial hardship, USPrograms (PAP)2; without third-party insurance coverage for their medicinesexcl. Gleevec/Glivec 129 155 000
Gleevec US PAP2 Within capability of Novartis, continue to ensure access USfor patients in the US who cannot afford the drug 55 3 500
Glivec Global PAP2 Within capability of Novartis, continue to ensure access Globalfor patients outside the US who cannot afford the drug (excluding US) 362 15 000
Together Rx Access Discount program for the uninsured US 1 15 000
Emergency Relief2 Support major humanitarian organizations Global 4 -
Total 755 33.6 million
1 During 2006, Novartis shipped 62 million Coartem treatments for public sector use. Of these shipments, an estimated 33 million treatments actually reached patients by year-end, based on preliminary analysis of local distribution. Value of the Coartem program in 2006 was calculated using the number of treatments shipped and the ex-factory price of Coartem to private-sector purchasers in malaria-endemic developing countries, minus payments to Novartis to cover costs under terms of the public-private partnership with WHO. These payments were received through WHO, UNICEF and other procurement agencies, acting on behalf of governments and other public sector institutions in developing countries eligible to receive Coartem at the “not-for-profit” price.
2 Ex-factory price to private market3 Operating costs
NOVARTIS ACCESS-TO-MEDICINE PROJECTS 2006
119863_Nova_000_000_web_e.qxp 24.1.2007 13:19 Uhr Seite 69

70
N O V A R T I S G R O U P B U S I N E S S R E V I E W
B A R C E L O N A , S P A I N
119863_Nova_000_000_web_e.qxp 24.1.2007 13:19 Uhr Seite 70

71
0 2 | G R O U P R E V I E W 1 2 | O P E R AT I O N A L R E V I E W 5 6 | C O R P O R AT E C I T I Z E N S H I P 9 3 | C O R P O R AT E G O V E R N A N C E 1 2 7 | N O V A R T I S G R O U P F I N A N C I A L R E P O R T
Our People
At Novartis, a high-performance, results-driven culture, combined with a steadfastfocus on innovation and breakthrough medicines addressing unmet medical need,has been critical to success.
World-class performance is based onthree priorities: offering the best products forpatients and customers; promoting a fiercecompetitive spirit among associates; anddeveloping skilled and cohesive teams. Look-ing ahead, Novartis will continue to concen-trate on its medicine-based portfolio – protecting health, preventing and treatingdisease, and improving well-being.
Last year, the Group turned to associatesin an attempt to distill the qualities thatmake Novartis attractive, perhaps evenunique, as an employer. Workshops withmore than 4 000 associates identified sixattributes as the core of an Employer ValueProposition (EVP). The Group’s most distinc-tive features, associates said, ranged fromthe achievement-based culture, intensefocus on innovation, and dynamic growth, tothe opportunity to work with extraordinarypeople in a truly global organization, and todo work that really matters to the health andwell-being of humanity.
“Novartis is an attractive employer first of all because we are successful,” says Juergen Brokatzky-Geiger, Ph.D., Head ofHuman Resources and member of the Executive Committee of Novartis. “Our prod-uct pipeline is seen as one of the most prom-ising in the pharmaceutical industry and ourgrowth speaks for itself. But development of
associates is a cornerstone of our culture. Ifyou are willing to perform, you have a prom-ising future with Novartis,” Dr. Brokatzky-Geiger adds.
“The great diversity of nationalities, edu-cational backgrounds, cultures and interestsacross the Group is an enriching experiencethat opens up personal as well as profes-sional horizons.”
Following up the EVP project, Novartislaunched the first, uniform Group-wide cli-mate survey during 2006. In an initial stage,50 000 associates from the PharmaceuticalsDivision worldwide will have a chance torespond via a detailed questionnaire, offeredin about 20 languages. Other Divisions areexpected to complete the survey by the endof 2007.
China
One example of this commitment to peopleat Novartis is the China Leadership Develop-ment Center introduced three years ago.
Nurturing leaders is a perennial chal-lenge for major international companies butit has assumed added urgency for Novartisin China amid rapid growth in recent years.Ambitious expansion plans include both anew research and development center inShanghai, and a development and produc-tion plant in Changshu, which will beginoperations this year.
“We aren’t just a local player any longer– we are an international player in a strate-gic market,” says James Deng, Head Country
The employer value proposition at Novartis offers an achievement-based culture,intense focus on innovation and the opportunity to work with extraordinary people in a truly global organization. Rapid expansion of operations in China exemplifies how those commitments are being translated into concrete career advancement anddevelopment for local managers.
COMMITMENT TO OUR PEOPLE
119863_Nova_000_000_web_e.qxp 24.1.2007 13:19 Uhr Seite 71

72
N O V A R T I S G R O U P B U S I N E S S R E V I E W
Pharma Organization in China. “Everyone iswatching China and we have to upgrade ourtalent standard across the board.”
It won’t be easy. China’s explosive economic growth has translated into accelerating management turnover rates,particularly at international companies.According to estimates, annual averageturnover is approaching 20% and is evenhigher for sales executives.
The limited supply of local talent withappropriate skills isn’t expected to improvesignificantly anytime soon. While China pro-duces more than 3 million university gradu-ates per annum, less than 10% have theskills required by an international group likeNovartis. At the current rate of economicgrowth, China will need an estimated 75 000managers able to assume managerial posi-tions with international firms within fiveyears. But only 5 000 executives with thattraining and background are available today.
At Novartis operations in China, theannual rate of management turnover is cur-rently running below 15%, reflecting at leastin part the rich array of career developmentprograms now available. One key pillar ofleadership development is the Beijing Inter-national MBA program (BiMBA), a popularMBA program at Peking University tailor-made for Novartis middle managers in col-laboration with the China Center for Eco-nomic Research.
Another key leadership initiative is the“Trailblazer” rotation program, enabling sen-ior Novartis sales executives in China tospend 12–18 months in the US, absorbingbest practice from American peers. “It’s amajor commitment. These are our best-performing sales managers and it disturbsour business to remove them from their nor-mal jobs for such a long time,” Mr. Dengsays. “But we’re building for the future and
the exposure these managers are getting inthe US will enable them to develop in newdirections and perform at an even higherlevel when they return home.”
The first two Novartis cohorts in theBiMBA program comprise almost 200 mid-dle managers, out of the Group’s total work-force in China of roughly 2 000 associates.The cohort beginning the BiMBA program in 2007 will be significantly larger than in previous years.
Selection of participants in both theBiMBA and Trailblazer programs is closelycoordinated with the global Organizationand Talent Review at Novartis. The trans-parency of that process is an attractive feature of the program to top performers,says Jennifer Jin, Head of Human Resourcesfor the Novartis Pharmaceuticals Division in China.
“In China, people traditionally look firstat seniority and expect managers who havebeen with the company longest to get theseopportunities,” Ms. Jin says. “We say this isan opportunity you earn based on perform-ance and high potential – and that sends theright message through the organization.”
Moreover, by targeting middle man-agers, the BiMBA program aims to shore upleadership – and motivation of managers
and associates at levels of the organizationthat haven’t received significant attention inthe past. “As BiMBA participants improvetheir management skills and become moremature, they can play a critical role inreducing turnover within their teams,” Ms.Jin says.
Because the Novartis BiMBA program isclosed to outsiders, course material can bebased on actual operations. “We all comefrom some Novartis entity so our discus-sions are closely focused on daily issues andpractices – and Group policy,” says SteeleZhang, Staffing Manager and HumanResource Manager at headquarters in China– and a member of the initial BiMBA cohort.“It’s very useful and we can begin applyingwhat we have learned immediately when wereturn to work.”
Guang Yang, Brand Manager for MatureProducts and another member of the initialBiMBA cohort, says he already is applyingskills and techniques he learned during thecourse. “As a manager you try to make deci-sions that are correct and fact-based,” hesays. “But leading is different than manag-ing. As a leader, you need to go further andmake sure everybody understands theobjectives of the team, and strives to achievethat broader goal.”
STAFF FLUCTUATIONS 2006
Associates as of January 1, 2006 90 924 100%
Separations -3 908 -4%
Retirements -751 -1%
Resignations -7 420 -8%
External hirings 16 982 19%
Acquisition changes 4 908 5%
Associates as of December 31, 2006 100 735 111%
(Figures represent headcount)
119863_Nova_000_000_web_e.qxp 24.1.2007 13:19 Uhr Seite 72

73
0 2 | G R O U P R E V I E W 1 2 | O P E R AT I O N A L R E V I E W 5 6 | C O R P O R AT E C I T I Z E N S H I P 9 3 | C O R P O R AT E G O V E R N A N C E 1 2 7 | N O V A R T I S G R O U P F I N A N C I A L R E P O R T
Our People
Mixing managers from different divi-sions and functions also pays dividends,says Lucy Huang, a finance manager at theNovartis Animal Health Business Unit basedin Shanghai. “There is limited communica-tion between Novartis Business Units inChina and the BiMBA course gives us anopportunity to find out more about what’sgoing on at the Corporate level and in thePharmaceuticals Division,” Ms. Huang says.“Because we’re all middle level managers andshare the same background, it’s easy to ben-efit from experience of other managers, howthey handle problems, issues and pressures.
“This course is very important for mypersonal development and I hope other tal-ents growing up at Novartis here in Chinahave the same chance to improve them-selves,” she adds.
Parallel with the BiMBA program, someNovartis executive learning programs previ-ously held at elite business schools in the USor Europe have been shifted to China – giv-ing Novartis managers around the world anopportunity to see and understand thetransformation of China and its economyfirst-hand. “China used to be a countrywhere companies like Novartis only focusedon manufacturing or selling a small slice oftheir product range,” says John Yang, Ph.D.,
Professor of Management at Peking Univer-sity and a key figure in the Novartis BiMBAprogram.
“Today China is a strategic country globally. And it is exciting for Novartis executives from around the world to comehere,” Dr. Yang says. “They discuss why localculture, organization and management practice is so different in China from theirown country. That’s easier to understandwhile they are here in China and this actually is helping Novartis very much interms of strategic implementation.”
Diversity and Inclusion
Fostering Diversity and Inclusion at Novartisisn’t just the right thing to do – the programunderscores a key business imperative forthe organization around the world.
As our customer base grows increasing-ly diverse, a diverse talent pool becomes acritical bridge between the workplace andthe marketplace. For example, more womenand people from minority groups are enter-ing the medical field than ever before. Andtoday women and minorities account for thevast majority of households’ healthcare buy-ing decisions worldwide.
The Novartis talent pool must evolve tomirror the market. Diversity of our workforceenhances customer insight and our ability tomeet the needs of patients and other stake-holders.
In the US, Novartis associates haveformed a dozen Employee Resource Groups(ERGs) – internal support systems and peernetworks linking dozens or hundreds of peo-ple with shared interests. The ERGs rangefrom gender and ethnic groups, to onescomprising working parents, veterans of thearmed forces, or associates who are livingwith cancer, or have loved ones afflicted withthe disease.
Each ERG is sponsored by a member ofthe US Pharmaceuticals Division’s executivecommittee who helps the group set annual,business-relevant objectives. The AfricanAmerican leaders group served as an in-house focus group during launch prepara-tions by the Exjade brand team last year andis now working closely in a similar capacitywith the Galvus brand team. Meanwhile, theWomen in Leadership group partnered withthe Cardiovascular Business Franchise andthe American Heart Association in develop-ing programs helping physicians promotegood cardiovascular health in women.
ASSOCIATES BY REGION AND DIVISION AS OF DECEMBER 31, 2006
Canada and Africa/Asia/US Latin America Europe Australia Total
Pharmaceuticals 15 331 4 930 24 096 9 957 54 314
Vaccines and Diagnostics 791 2 986 158 3 935
Sandoz 1 286 2 088 14 125 3 618 21 117
Consumer Health 7 475 3 378 5 796 2 956 19 605
Corporate 677 32 902 153 1 764
Total 25 560 10 428 47 905 16 842 100 735
(Figures represent headcount)
119863_Nova_000_000_web_e.qxp 24.1.2007 13:19 Uhr Seite 73

74
N O V A R T I S G R O U P B U S I N E S S R E V I E W
Last year, more than 250 female man-agers from more than 30 countries gatheredin Basel for the second Novartis FemaleLeadership Forum. Michelle Gadsden-Williams, Head of Diversity and Inclusion,said that in addition to attracting and fos-tering female managers, Novartis cultureneeds to accommodate many different man-agement styles to retain that talent.
For the sixth consecutive year, Novartisand the University of Basel offered a men-toring program called Women into Industrythat encourages promising female academ-ics to consider careers in business andindustry. Participants in the program meetmonthly with professional managers fromNovartis, and also assist in planning and net-working.
Diversity and Inclusion is anchored onthe pillars of Novartis Values and LeadershipStandards, and complemented by the com-mitment to the Global Compact and Corpo-rate Citizenship Policy and guidelines. Weare committed to inclusive leadership be-haviors that create and sustain dignity andrespect. We strive to value differences thatare reflected in society. We recognize thatour customer base is growing more diversein our existing markets as well as emerginggrowth markets. By understanding the needsand aspirations of our diverse customerbase, we will be better able to provide tailored services resulting in increased loy-alty and market share.
Living Wage
Novartis is one of the first international com-panies to develop and implement a volun-tary commitment to pay a “living wage” toall its employees around the world.
As an initial step, Novartis commis-sioned the consulting firm Business for
Social Responsibility (BSR) to establish amethodology to calculate living wage levels.Using those BSR calculations as a startingpoint, Novartis rolled out the living wage program, working in close consultation withlocal management in countries with divergenteconomic systems and standards of living.By early 2006, the Group had aligned thepay of more than 90 000 employees world-wide with living wage levels.
Novartis and BSR continue to work onfurther improvements, such as periodicadjustments of the initial living wage calcu-lations for key factors such as inflation. Forcountries with a negative inflation, Novartisrecommends that wages be kept at their cur-rent levels and not reduced.
Novartis believes that paying a livingwage locally is a key benchmark of its com-mitment to the United Nations Global Com-pact – as well as the Group’s longstandingpledge to be a good corporate neighbor incommunities where it operates. A key lessonin taking the living wage from idea to implementation is that active participationof local management in the decision-makingprocess is critical to success. Local manage-ment bears the ultimate responsibility forthe living wage to become accepted as acore principle of a company’s operationsand culture.
A living wage reflects the cost of a cer-tain basket of goods and services that isrequired to cover certain basic goods, takinginto account the social circumstances andrequirements of the environment. A livingwage generally is higher than the minimumwage in the same country, an hourly amountdefined by law which employers must payworkers. While minimum wages apply onlyto discrete geographies, an increasing num-ber of countries across the developed worldhas passed minimum wage laws over the
past century. Many developing countrieshaven’t yet enacted minimum wage laws,however.
Minimum wages often increase slowlyover time and sometimes do not correspondto increases in the cost of goods. A mini-mum wage, for example, may be the resultof a political process or a union negotiation,and not directly based on what that wagewill be able to purchase, or if those pur-chases will provide for a family’s basic needsor ensure an adequate standard of living.
Novartis considers the living wage ini-tiative an opportunity to contribute to theimprovement of labor standards, and have apositive impact on communities where theGroup operates. Such concerns havebecome increasingly important as Novartisand other pharmaceutical companies havestepped up activities in developing coun-tries, where legal protections for workersaren’t as advanced as in industrializednations.
The guideline on fair working conditionsset the stage for the living wage initiative.Much of that guideline is rooted in the language of the third principle of the GlobalCompact principle addressing collective bargaining and freedom of association.Novartis chose to implement the living wagecommitment within a framework of wagestandards that extended beyond the boundaryestablished by the Global Compact.
Following the conclusion of a 2005round of consultations with affiliates, areview by Novartis HR found that 93employees – out of a total workforce of morethan 90 000 – were being paid less than theliving wage level in their country of employ-ment. Wages of those employees wereincreased – bringing the entire global work-force in line with living wage levels.
119863_Nova_000_000_web_e.qxp 24.1.2007 13:19 Uhr Seite 74

75
0 2 | G R O U P R E V I E W 1 2 | O P E R AT I O N A L R E V I E W 5 6 | C O R P O R AT E C I T I Z E N S H I P 9 3 | C O R P O R AT E G O V E R N A N C E 1 2 7 | N O V A R T I S G R O U P F I N A N C I A L R E P O R T
Our People
S A N D O Z ; K A L W E , I N D I A
119863_Nova_000_000_web_e.qxp 24.1.2007 13:19 Uhr Seite 75

76
N O V A R T I S G R O U P B U S I N E S S R E V I E W
N O V A R T I S P H A R M A C E U T I C A L S ; B A S E L , S W I T Z E R L A N D
119863_Nova_000_000_web_e.qxp 24.1.2007 13:19 Uhr Seite 76

77
0 2 | G R O U P R E V I E W 1 2 | O P E R AT I O N A L R E V I E W 5 6 | C O R P O R AT E C I T I Z E N S H I P 9 3 | C O R P O R AT E G O V E R N A N C E 1 2 7 | N O V A R T I S G R O U P F I N A N C I A L R E P O R T
Health, Safety and Environment
Novartis continuously seeks innovative, sus-tainable strategies and systems to strength-en its commitment to Health, Safety andEnvironment (HSE) and Business ContinuityManagement.
Rigorous technical standards, reinforcedwith engineering solutions to ensure that theworkplace is safe for associates, remain thefoundation of HSE performance. At the sametime, the Occupational Medicine organizationoffers proactive programs to maintain health,reduce absenteeism and enhance motivationto return to work after illness or injury.
In recent years 50 Novartis sites, out of 208 reporting units worldwide, haveremained accident-free for more than a million consecutive working hours. Such stellar safety records owe as much to theprudent behavior of well-trained associatesas to elaborately engineered systems.
Indeed, behavior-based programs areincreasingly seen as the key to continuedimprovement of occupational health andsafety, and HSE performance, in comingyears.
In many countries, accidents related towork are less common than lost time due toinjuries sustained by associates off the job.And helping associates modify personalbehaviors to reduce the risk of cardiovascu-lar disease, cancer and other forms of illnesshas become a core element of modern occu-pational health programs.
At Novartis, these support systems arethe shared responsibility of line managementand individual associates. Participation byassociates, however, remains strictly voluntary.
Training is an indispensable element ofthe Group’s commitment to HSE excellence.Annual workshops are held in all regions ofthe world, allowing specialists from HSE to share examples of best practice, and sup-port local implementation of sustainabilitymeasures.
Energy and Climate
Similar behavior-based approaches are alsobeing used to foster more efficient use ofenergy and other resources. The energy-efficiency program at Novartis reflects a balance of incentives and targets to buildpride in achieving challenging objectives,and to maintain vigilance of associates at acontinually high level.
A unit at the Sandoz site in Kundl, Austria that produces final dosage forms of antibiotics such as penicillins andcephalosporins has reduced energy con-sumption per production unit by 30% overthe past three years. Energy-saving meas-ures ranged from a heat recovery project,water-saving valves and reduced pressure inpumps, to turning down air conditioning andwarm-water boiler temperature.
Novartis believes that careful steward-ship of natural resources, particularly tightcontrol of greenhouse gas (GHG) emissionsand energy efficiency, is not only importantfor the Group but critical for global societyand future generations in combating climatechange.
In 2005, as a first step, Novartis made avoluntary commitment to reduce its GHG
Novartis believes that careful stewardship of natural resources, particularly tight control of greenhouse gas emissions and energy efficiency, is not only importantfor the Group but critical for global society and future generations. Social and environmental sustainability is an integral part of our strategy and a key reason forthe success of Novartis.
COMMITMENT TO HEALTH, SAFETY AND ENVIRONMENT
119863_Nova_000_000_web_e.qxp 24.1.2007 13:19 Uhr Seite 77

emissions from global operations for theperiod 2008–2012 to a similar level as thatprescribed in the Kyoto Protocol, i.e. 5%below the corresponding 1990 level.
Good progress has been made towardachieving this long-term GHG target. Scope1 – GHG emissions from internal operationalprocesses and the Novartis vehicle fleet –was stable in 2006, compared to 2005.Scope 2 – GHG emissions from purchasedenergy – increased by 6.2% last year. Bothareas are receiving increased attentionthrough the Group’s energy efficiency targetand programs.
Still, fulfilling this voluntary target promises to be challenging in view of therapid growth of the Group’s operations.Novartis currently projects a gap in reduc-tion of GHG emissions for the 2008–12 peri-od, despite actual and forecast internal ener-gy efficiency improvements. Consequently,the Group plans to make use of the KyotoFlexible Mechanisms, compensating apotential increase in emissions with emis-
GHG EMISSIONS 2003–2006 VERSUS TARGET PATH TO 2012
1 000
800
600
400
200
0
78
N O V A R T I S G R O U P B U S I N E S S R E V I E W
sion reduction and sequestration projects indeveloping countries.
Major initiatives include an overhaul ofthe Group’s vehicle fleet – with the goal ofreducing CO2 emissions by 10% by 2010.Vehicle emissions were measured and incor-porated in Scope 1 for the first time in 2005.The target for vehicle emissions was estab-lished last year.
Currently, Novartis associates make useof over 24 000 cars worldwide which collec-tively emit about 200 000 tons of CO2 annu-ally. The environmental impact of the vehi-cle fleet can be substantially loweredthrough the introduction of hybrid gasoline-electric cars, and increased use of dieselengines fitted with particulate filters as well asother emission-reduction options such as liquid natural gas and bio-fuels. Taking aregional approach, and progressing at a pacedetermined partly by available supply ofhybrid vehicles, these technologies will bephased-in over the replacement cycle of thecar fleet.
To support its energy and climate strategy, Novartis applies a proactive policyfor capital investments associated with ener-gy conservation. As an exception to normalproject requirements, energy projects areallowed to pay back the initial investmentover the lifetime of the asset.
At the same time, energy-efficiency andrenewable-energy challenges have becomemandatory elements of the capital appro-priation procedures for all major projectsworldwide. Strong leadership and commit-ment by senior Group management toimproved energy efficiency in Divisions issupported by organizational measures andintensified promotional activities.
The initial wave of energy-related investments has delivered significant finan-cial benefits in every Division and Business
2003 2004 2005 2006 2007 2008 2009 2010 2011 2012
Scope2 Scope1 w/o Vehicles Scope1 Vehicles
Extrapolation
Group Kyoto Target Group Vehicle Target
Including Hexal/Eon Labs, excluding former Chiron
119863_Nova_000_000_web_e.qxp 24.1.2007 13:19 Uhr Seite 78

79
0 2 | G R O U P R E V I E W 1 2 | O P E R AT I O N A L R E V I E W 5 6 | C O R P O R AT E C I T I Z E N S H I P 9 3 | C O R P O R AT E G O V E R N A N C E 1 2 7 | N O V A R T I S G R O U P F I N A N C I A L R E P O R T
Health, Safety and Environment
Unit. “This campaign has environmentalvalue but also real economic value,” saysKeith Saveal, Head Corporate Health, Safetyand Environment. “We are seeing muchfaster payback times than had been expect-ed initially for these energy efficiency proj-ects.”
Energy consumption is increasing at aconsiderably slower rate than sales. Since2003, Group-wide energy use (includingbusinesses acquired) has increased 12%,compared to a 49% rise in sales during thesame period.
Energy intensity – or energy use in rela-tion to several normalizing factors such assales, number of associates and production– is closely followed and managed by allDivisions and Business Units. Energy effi-ciency has also improved significantly since2003, and the original three-year energyefficiency target of 6% for 2006, set in 2003,has been substantially exceeded.
A new energy efficiency target has beenset – aiming for a further 10% improvementof energy efficiency by 2010, based on the2006 performance.
Increasingly, divisions and businessunits are appointing energy managers andenergy advisors for all their operationsworldwide. Management tools and dedicat-ed training programs are applied systemat-ically, together with continuous monitoringof targets and performance.
Enhanced energy efficiency by itself willnot enable Novartis to achieve the green-house gas target and the Group is focusingincreasingly on energy systems withreduced carbon intensity. Novartis hasalmost completed the switch of fossil fuelsfrom oil or coal to natural gas. The currentchallenge is to reduce carbon intensity fur-ther by fostering combined heat and powersystems and renewable energy sources such
as fuel from waste, bio-fuels or solar, windand geothermal energy.
Bagasse, a locally available bio-fuel fromsugar cane, together with corn and wastesfrom renewable sources available at sites,are being used as fuels for on-site energysystems wherever possible. A Sandoz plantnear Frankfurt, Germany has begun usingby-products from fermentation to generatebiogas for electricity.
Last year, the Novartis site in EastHanover, New Jersey installed a 130-kilowattarray of solar panels. The array comprisesmore than 400 solar panels and producesan estimated 500 gigajoules of power a year,roughly 10% of electricity consumed in thebuilding where it is located.
Employee Health
Lost Time Accident Rate (LTAR) is a bench-mark indicator that allows direct compari-son between the performance of Novartisunits and country organizations.
LTAR for continuing operations at Novartiswas further reduced, to 0.40 per 200 000 hrsworked in 2006 from 0.44 the previous year.
We extend our condolences to the fam-ilies of the two associates who died in amotorcycle accident during 2006.
Despite significant progress, the Group’slong-term LTAR target hasn’t yet beenachieved at businesses acquired during thepast two years. Programs to reduce LTARand reach parity with the rest of Novartishave been introduced at units acquired bySandoz, as well as at the new Vaccines andDiagnostics Division. The ultimate goal forboth established and new businesses is tostrive for zero accidents.
Risk Management
Novartis manages risks proactively byimplementing appropriate preventive andcontingency measures. This risk manage-ment process is designed to identify poten-tial hazards and take action to reduce therisk of an event – the likelihood of occur-rence and severity of consequences – to anacceptable minimum level.
Each year, Novartis sites update theirrisk portfolios, which are consolidated atGroup level and reviewed by senior man-agement. Action plans are developed forthese HSE and business risks, ensuringreduction of the risks and a planned profes-sional response to any incident. During2006, measures were taken to reduce thepriority risks included in the corporate riskportfolio of 2005, and implementation ofaction plans is ongoing.
In addition to a controlling function, regular HSE audits provide direct supportand guidance to the Novartis sites beingaudited. Audits are conducted by both corporate and divisional specialists. Follow-ing audits, sites develop action programs.Implementation of measures to correct deficiencies is closely controlled by the
LOST TIME ACCIDENT RATE 2002 – 2006
LTAR1
0.75
0.50
0.25
0
2002 2003 2004 2005 2006
Including Hexal/Eon Labs, excluding former Chiron
Excluding Hexal/Eon Labs and former Chiron
LOST TIME ACCIDENT RATE 2002 – 2006(accidents per 200 000 hours worked)
119863_Nova_000_000_web_e.qxp 24.1.2007 13:19 Uhr Seite 79
80
N O V A R T I S G R O U P B U S I N E S S R E V I E W 2 0 0 6
lenges are inherited as a result of operationsand practices in past years. Responsibilityfor historical landfills and brownfields inher-ited by Novartis from predecessor companiesremains a relevant environmental issue today.
Novartis shares a number of confirmedor potential liabilities on the surveillanceand remediation of old industrial premisesand historical landfills with other compa-nies.
In order to responsibly manage thesecases and related environmental risks,Novartis, as a principle, takes a cautious sci-ence-based approach, in full cooperationwith the respective local authorities and gov-ernmental agencies. Where and wheneverpotential risks are identified, investigationsand assessments are carried out in a sys-tematic manner and remediation actionstaken when necessary. Novartis has setaside the financial reserves to manage theseliabilities worldwide.
Air Emissions and Hazardous Waste to LandfillsOne current environmental impact target isa voluntary reduction of emissions of halo-genated volatile organic compounds (VOCs)by more then 90% from the 2005 level. In2006, halogenated VOC emissions declinedto 179 metric tons from 372 metric tons theprevious year – achieving the intermediatetarget.
The objective of lowering emissions ofnon-halogenated VOCs to below 800 tons in2006 was not achieved because of addition-al solvent losses associated with increasedproduction at manufacturing facilities. Inthese cases VOC abatement projects areunder preparation.
The amount of hazardous waste dis-posed in landfills has been effectively mini-
mized from 1 127 metric tons in 2005 to467 metric tons in 2006. We are well on ourway to reaching our voluntary target of dis-posing less than 100 tons of the remaininghazardous waste that cannot be incineratedin landfills by 2008.
Pharmaceuticals in the EnvironmentNovartis is committed to minimizing theenvironmental impact of our products. Phar-maceuticals entering the aquatic environ-ment are an inevitable consequence of sci-ence-based healthcare and our businessactivity. Yet as scientific knowledge evolvesin this field, we regularly benchmark ouractivities, and in addition actively supportacademia, regulators and other stakeholdersin developing more efficient risk-manage-ment practices.
The levels of active pharmaceuticalingredients found in the environment arebelow doses approved as safe by medicinalregulatory agencies, according to currentknowledge, and Novartis believes those lev-els do not present a health risk for humans.
We strive to minimize, to the extentpractical, discharges of active pharmaceuticalingredients in our wastewater, and avoidlandfilling of our pharmaceutical waste. Thatwaste is incinerated in approved, state-of-the-art facilities. We work with third partiesto ensure that they are guided by this poli-cy in their waste minimization activities.
Novartis has also supported research bya group of German wastewater engineers bymaking available a selection of in-marketmedicines, as well as innovative compoundsstill in development. The aim of this pio-neering effort is to demonstrate that afford-able, reliable wastewater technology worksin practice – and helps remove existing, aswell as new, pharmaceuticals from waste-water before they reach the environment.
Divisions and also reviewed at the corporatelevel.
As a further element of our risk man-agement strategy, Novartis has establishedan Emergency Management (NEM) systemto safeguard employees, the public and theenvironment in case of an incident. Mem-bers of NEM Teams worldwide attend regu-lar training programs. NEM is a compulsory,uniform system with defined roles andresponsibilities, emergency reporting proce-dures and clear decision-making structuresthroughout the Group.
Anticipating incidents that could affectmission-critical functions and processes – aswell as adopting preventive and contingencymeasures – are key requirements for Busi-ness Continuity Management. Novartis pre-pares response plans defining the actionsthat are necessary, and the resources thatare needed to enable the organization tomanage any interruption.
Minor violations, however, do occur fromtime to time. During 2006, Novartis paid atotal of USD 27 568 in fines for minor HSEviolations at a number of sites.
Minimizing Environmental Impacts
We strive to make efficient use of naturalresources and to minimize the environmen-tal impact of our activities, and our productsover their life cycle. We assess HSE impli-cations to ensure that the benefits of new products, processes and technologies outweigh remaining risks. We periodicallyreview such assessments in light of new con-cerns or evidence.
Historical Landfills and Old Industrial SitesNovartis strives to minimize all environmen-tal impacts and some of the biggest chal-
119863_Nova_000_000_web_e.qxp 24.1.2007 13:19 Uhr Seite 80
81
0 2 | G R O U P R E V I E W 1 2 | O P E R AT I O N A L R E V I E W 5 6 | C O R P O R AT E C I T I Z E N S H I P 9 3 | C O R P O R AT E G O V E R N A N C E 1 2 7 | N O V A R T I S G R O U P F I N A N C I A L R E P O R T
Health, Safety and Environment
Performance Management
Performance of operating units against keyHSE indicators is monitored on a monthlybasis at Novartis. Last year, a tailor-madeHSE Data Management System was devel-oped and introduced worldwide to facilitatedata collection, in line with more stringentreporting standards. This new system formonitoring HSE performance provides allmanagement levels throughout the Groupwith information needed to take early actionif deviations against targets occur.
Novartis sets HSE targets covering peri-ods of at least three years to allow betteranalysis, planning and implementation ofprograms. Progress towards targets isreviewed annually with each division andbusiness unit, that are also involved in tar-get setting based on recommendations byfunctional experts. (See table below for2007 targets.)
Group HSE Targets
Target Change Date
VOC halogenated1 decrease 90% by 2008
VOC nonhalogenated1 decrease 30% by 2008
Hazardous waste to landfill below 100 tons by 2008
Energy efficiencyimprovement2 10% by 2010
Contact water efficiency improvement2 10% by 2010
CO2 from vehicles1 decrease 10% by 2010
Scope 1 GHG emissions 5 % below by 2008 –from operations 1990 level 2012
Lost Time AccidentRate down to 0.2 by 2010
1 Baseline level 20052 Change of 10% from 2006
HSE Reporting Principles
Global Reporting InitiativeSince 2004, Novartis has reported its HSEperformance following the 2002 Guidelinesfor Sustainability Reporting of the GlobalReporting Initiative (GRI). The Novartis GRIReport Index – along with a more detailedoverview of our HSE performance – is avail-able at: www.novartis.com
Reporting EntityHSE performance data for 2006 was col-lected from 208 sites around the world,owned and managed by Novartis Groupcompanies. This covers all sites with relevantHSE impacts, including all production, for-mulation, research and development sites aswell as major headquarter offices. Hexal andEon Labs, which were acquired in 2005, arenow included in all performance manage-ment. Chiron, which was consolidated byNovartis for only part of 2006, is reportedseparately.
Reporting ScopeNovartis believes the performance data pre-sented in this Annual Report and on theadjacent Novartis website represent a fairand balanced picture of the Novartis HSEperformance. Performance Indicators followGRI requirements for core environmentaland social indicators.
119863_Nova_000_000_web_e.qxp 24.1.2007 13:19 Uhr Seite 81
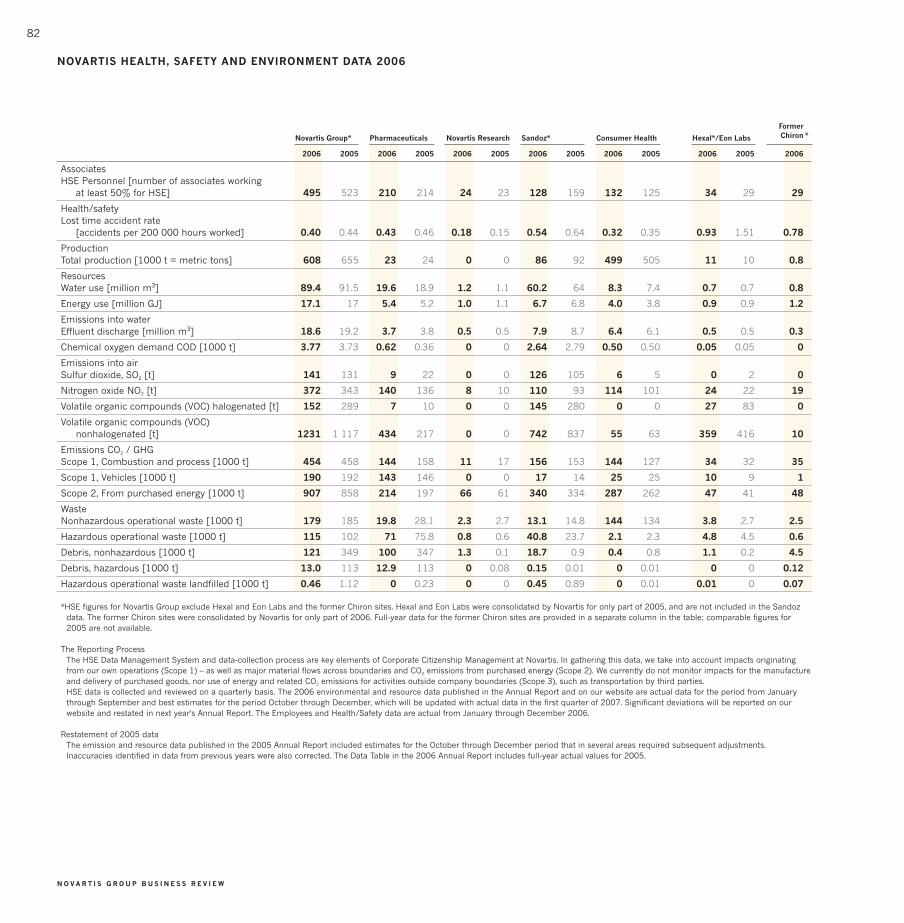
82
N O V A R T I S G R O U P B U S I N E S S R E V I E W
NOVARTIS HEALTH, SAFETY AND ENVIRONMENT DATA 2006
Former
Novartis Group* Pharmaceuticals Novartis Research Sandoz* Consumer Health Hexal*/Eon Labs Chiron *
2006 2005 2006 2005 2006 2005 2006 2005 2006 2005 2006 2005 2006
AssociatesHSE Personnel [number of associates working
at least 50% for HSE] 495 523 210 214 24 23 128 159 132 125 34 29 29
Health/safetyLost time accident rate
[accidents per 200 000 hours worked] 0.40 0.44 0.43 0.46 0.18 0.15 0.54 0.64 0.32 0.35 0.93 1.51 0.78
ProductionTotal production [1000 t = metric tons] 608 655 23 24 0 0 86 92 499 505 11 10 0.8
ResourcesWater use [million m3] 89.4 91.5 19.6 18.9 1.2 1.1 60.2 64 8.3 7.4 0.7 0.7 0.8
Energy use [million GJ] 17.1 17 5.4 5.2 1.0 1.1 6.7 6.8 4.0 3.8 0.9 0.9 1.2
Emissions into waterEffluent discharge [million m3] 18.6 19.2 3.7 3.8 0.5 0.5 7.9 8.7 6.4 6.1 0.5 0.5 0.3
Chemical oxygen demand COD [1000 t] 3.77 3.73 0.62 0.36 0 0 2.64 2.79 0.50 0.50 0.05 0.05 0
Emissions into airSulfur dioxide, SO2 [t] 141 131 9 22 0 0 126 105 6 5 0 2 0
Nitrogen oxide NO2 [t] 372 343 140 136 8 10 110 93 114 101 24 22 19
Volatile organic compounds (VOC) halogenated [t] 152 289 7 10 0 0 145 280 0 0 27 83 0
Volatile organic compounds (VOC) nonhalogenated [t] 1231 1 117 434 217 0 0 742 837 55 63 359 416 10
Emissions CO2 / GHGScope 1, Combustion and process [1000 t] 454 458 144 158 11 17 156 153 144 127 34 32 35
Scope 1, Vehicles [1000 t] 190 192 143 146 0 0 17 14 25 25 10 9 1
Scope 2, From purchased energy [1000 t] 907 858 214 197 66 61 340 334 287 262 47 41 48
WasteNonhazardous operational waste [1000 t] 179 185 19.8 28.1 2.3 2.7 13.1 14.8 144 134 3.8 2.7 2.5
Hazardous operational waste [1000 t] 115 102 71 75.8 0.8 0.6 40.8 23.7 2.1 2.3 4.8 4.5 0.6
Debris, nonhazardous [1000 t] 121 349 100 347 1.3 0.1 18.7 0.9 0.4 0.8 1.1 0.2 4.5
Debris, hazardous [1000 t] 13.0 113 12.9 113 0 0.08 0.15 0.01 0 0.01 0 0 0.12
Hazardous operational waste landfilled [1000 t] 0.46 1.12 0 0.23 0 0 0.45 0.89 0 0.01 0.01 0 0.07
*HSE figures for Novartis Group exclude Hexal and Eon Labs and the former Chiron sites. Hexal and Eon Labs were consolidated by Novartis for only part of 2005, and are not included in the Sandozdata. The former Chiron sites were consolidated by Novartis for only part of 2006. Full-year data for the former Chiron sites are provided in a separate column in the table; comparable figures for2005 are not available.
The Reporting ProcessThe HSE Data Management System and data-collection process are key elements of Corporate Citizenship Management at Novartis. In gathering this data, we take into account impacts originatingfrom our own operations (Scope 1) – as well as major material flows across boundaries and CO2 emissions from purchased energy (Scope 2). We currently do not monitor impacts for the manufactureand delivery of purchased goods, nor use of energy and related CO2 emissions for activities outside company boundaries (Scope 3), such as transportation by third parties.HSE data is collected and reviewed on a quarterly basis. The 2006 environmental and resource data published in the Annual Report and on our website are actual data for the period from Januarythrough September and best estimates for the period October through December, which will be updated with actual data in the first quarter of 2007. Significant deviations will be reported on ourwebsite and restated in next year's Annual Report. The Employees and Health/Safety data are actual from January through December 2006.
Restatement of 2005 dataThe emission and resource data published in the 2005 Annual Report included estimates for the October through December period that in several areas required subsequent adjustments. Inaccuracies identified in data from previous years were also corrected. The Data Table in the 2006 Annual Report includes full-year actual values for 2005.
119863_Nova_000_000_web_e.qxp 24.1.2007 13:19 Uhr Seite 82

83
0 2 | G R O U P R E V I E W 1 2 | O P E R AT I O N A L R E V I E W 5 6 | C O R P O R AT E C I T I Z E N S H I P 9 3 | C O R P O R AT E G O V E R N A N C E 1 2 7 | N O V A R T I S G R O U P F I N A N C I A L R E P O R T
Health, Safety and Environment
K A M E D A M E D I C A L C E N T E R ; K A M O G A W A C I T Y , C H I B A , J A P A N
119863_Nova_000_000_web_e.qxp 24.1.2007 13:19 Uhr Seite 83

84
N O V A R T I S G R O U P B U S I N E S S R E V I E W
Even as senior management focuses more than ever on high standards of ethicalbehavior, and training programs are intensified, compliance can’t be imposedfrom the top. Appropriate conduct is the responsibility of every manager and associate. It can’t be delegated – or separated from other aspects of doingbusiness.
COMMITMENT TO ETHICAL BUSINESS CONDUCT
Today, a major international company likeNovartis is judged by the quality of its productsand financial performance, but also by theway it does business.
“Our customers want good productsand they like a company with a desire to winin the marketplace. But we need to behavewith integrity to keep our license to operate,”says Daniel Vasella, M.D., Chairman andChief Executive Officer of Novartis. “If wedon’t have a set of values – and live by them– the Group won’t be successful.”
Yet even as senior management focusesmore than ever before on high standards ofethical behavior, compliance can’t be im-posed from the top. “Compliance is theresponsibility of every single manager andevery single employee. It can’t be delegated– or separated from other aspects of doingbusiness,” says Thomas Wellauer, Ph.D.,Head Corporate Services at Novartis.
“The role of the Compliance organizationat Novartis is to make sure the Group has acommon set of rules and guidelines that notonly is complete, but simple enough for peo-ple to understand and follow. Our compli-ance officers support managers throughoutthe Group with training and other tools,” Dr.Wellauer adds. “And we also need effectivecontrols in place to find the occasional out-lier because there always will be people whodon’t follow the rules.”
Intensified Training
As part of the commitment to high stan-dards of ethical business conduct, Novartis
119863_Nova_000_000_web_e.qxp 24.1.2007 13:19 Uhr Seite 84
85
0 2 | G R O U P R E V I E W 1 2 | O P E R AT I O N A L R E V I E W 5 6 | C O R P O R AT E C I T I Z E N S H I P 9 3 | C O R P O R AT E G O V E R N A N C E 1 2 7 | N O V A R T I S G R O U P F I N A N C I A L R E P O R T
Business Conduct
has intensified training programs for associ-ates. During 2006, e-learning courses werelaunched in 14 languages, covering topicsfrom human rights and data protection tocompliance with sales and marketing codes.Courses on the Code of Conduct, as well asCorporate Citizenship and Conflict of Inter-est policies, are mandatory for all associatesworldwide. Novartis associates worldwidecompleted more than 218 000 online cours-es, investing more than 155 000 hours inethics compliance training.
Implementation of the Ethics Compli-ance Program is monitored at country level.In 2006, self-assessments were receivedfrom 124 organizational units in 52 coun-tries. The Group’s Internal Audit functioncompleted audits related to adherence tothe Code of Conduct and marketing codes in28 country organizations last year.
As in previous years, as part of a formalcertification process, more than 23 000Novartis managers and “insiders” wererequired to confirm their adherence toGroup policies and standards during 2006.
Updated Code
Under Dr. Vasella’s leadership as presidentof the International Federation of Pharma-ceutical Manufacturers & Associations(IFPMA), Novartis coordinated adoption of anew, updated version of IFPMA’s Code ofMarketing and Promotional Practices. Thecode sets out standards for ethical promo-tion of pharmaceutical products and mem-ber companies’ interactions with healthcareprofessionals. The updated IFPMA code,which clarifies guidelines for events, spon-sorships and other types of promotion, isconsistent with the marketing code imple-mented by the Novartis PharmaceuticalsDivision in 2003.
Last year, the Pharmaceuticals Divisionlaunched a program to streamline the func-tion of “clearance committees” which reviewpromotional materials and other businessactivities to ensure compliance with localregulations, as well as internal and externalmarketing codes. The new clearance proce-dures were piloted in the US and certainEuropean countries during 2006 and will beintroduced into additional markets this year.
“Novartis really is on the leading edgehere,” Dr. Wellauer says. “We are convincedthat high ethical standards will help us sus-tain the success of our business long-term.But at the same time, we recognize that ourassociates face competition day after dayfrom companies that don’t observe equallystrict internal codes. We appreciate the factthat our associates live our values and dothe right thing.”
Business Practices Office
In 2006, the Novartis Business PracticesOffice (BPO) continued expansion of“Integrity Telephone Lines” that enable asso-ciates to report actual or suspected cases ofinternal misconduct, in a manner guaran-teeing confidentiality and nonretaliation for“whistleblowers.” Integrity Telephone Linesare now available in 51 languages.
During 2006, the BPO received reportsof 651 alleged violations of our internalrules. Of these cases, 363 have been fullyinvestigated and 228 fully or partly sub-stantiated. Employment contracts of 130associates were discontinued last year, andother relevant sanctions were taken againstan additional 125 employees, as a result ofmisconduct.
As important as taking firm actionagainst misbehavior is learning from thesecases to prevent them from being repeated.
During 2007, Novartis will initiate more activeand systematic follow-up of BPO inves-tigations by establishing a cross-functionalgroup including representatives from thecompliance organization.
“The group will meet regularly, analyzecases and disseminate recommendationsabout remedial steps,” Dr. Wellauer says.“We want them to ask what the root causesare and what we have to do to stop similarcases from happening in the future.”
Animal Welfare
Novartis supports the use of animal experi-ments in our medical and biological re-search where such experiments are scientif-ically necessary and alternative approachesare inappropriate.
We have an Animal Welfare Policy thatdefines key principles, requirements andresponsibilities governing the use of animalexperiments and we strictly adhere to inter-national conventions (e.g. EC Directive86/609 and the US Animal Welfare Act) andhealth authority regulations and guidelinesin all of the countries where we operate. Wedemand the same of those organizationswith which we partner for research involvinganimal experiments.
We acknowledge the importance of ani-mal welfare and support development ofalternative research methods. Novartis is astrong adherent of the “3R” concept –Reduction, Refinement and Replacement ofAnimal Experimentation. We exceed theminimal animal welfare requirements wher-ever possible and we fully comply with allrequired inspections.
Novartis condemns the use of violenceand campaigns of willful destruction by animal rights activists as a substitute formeaningful, productive dialogue.
119863_Nova_000_000_web_e.qxp 24.1.2007 13:19 Uhr Seite 85

86
N O V A R T I S G R O U P B U S I N E S S R E V I E W
RESULTS OF CORPORATE CITIZENSHIP-RELATED PROJECTS IN 2006 AND TARGETS FOR 2007
Targets 2006 Results 2006 Targets 2007
UN Global Compact
Fair MarketingPractices
Third-Party Management*
Working Conditions
Product Safety
Respect forHuman Rights
Publish case study on implementation ofguideline for third-party suppliers.
Develop e-training modules at Sandozand Consumer Health divisions. Trainmore than 90% of Group sales and marketing staff. Harmonize details ofdivisions’ Promotional Practices Policiesat country level.
Complete audit of 25% of Class 3 suppliers selected for on-site audit ofHSE/labor practices. Expand training.Establish improvement program forthird-party suppliers.
Increase salaries of 93 associates to levelof Living Wage. Establish guidance forthird-party suppliers regarding applicationof living wage initiative to all contractemployees working on Novartis sites.Establish Group Diversity & Inclusion initiative and appoint external Diversity & Inclusion Advisory Council.
Align Product Stewardship boards withoverall Group risk management process.
Publish position statements on Novartiswebsite. Develop and implement e-training module devoted specifically to Human Rights guideline.
Held workshop in South Africa for 200suppliers. Active engagement in GlobalCompact Networks and Learning Forums.Professor Klaus Leisinger served as Special Advisor to United Nations Secretary-General.
E-training modules developed. Trainingprogram launched by Novartis ConsumerHealth and completed by over 85% of division’s associates. Sandoz to launchtraining program in first quarter of 2007.Completed harmonization of divisions’Promotional Practices Policies.
Completed on-site audits of about 10% ofClass 3 suppliers – below target. Receivedself-assessments from 25% of Class 2suppliers – below target of 90%.
Salaries increased to level of local livingwages early in year. Pilot to expand livingwage policy to on-site third parties inSwitzerland identified many challenges.First Diversity & Inclusion Advisory Council meeting with external membersheld in November.
Product Stewardship integrated intoEnterprise Risk Management function.Product Stewardship Officer recruited.
Human Rights e-training module devel-oped – 38 100 associates completed thecourse. Pilot Human Rights ComplianceAssessment done in Turkey, in cooperationwith the Danish Institute for Human Rights.Active participation in the Business Leaders Initiative on Human Rights.
Publish case study on implementation of living wage initiative, plus third-partysupplier case study delayed from 2006.Continue active engagement in countrynetworks. Start conceptual work on proj-ect: accountability of nongovernmentalorganizations.
Complete training of sales force for Sandoz. Ensure consistency with newIFPMA code in relevant businesses.Launch new guidance on grants in Pharmaceuticals Division.
Targets for Class 3 and Class 2 suppliersunchanged. Improve internal processesto increase percentage of audits/self-assessments completed. Implement corrective actions based on audit findings.
Salaries of 21 associates to be increasedin early 2007 as adjustment to LivingWage level of respective locations. Pro-vide systematic framework for Diversity& Inclusion; define priorities, goals andactions for each division.
Develop key performance indicators forimplementation of Product Stewardshipboard decisions. Implement real-timetracking tool for implementation andreporting. Improve alignment betweendivisions.
Evaluate pilot Human Rights ComplianceAssessment; carry out complianceassessment in one new country. Participatein debate on corporate content of the“Right to Health.” Work closely with UNRepresentative on Business and HumanRights, as well as Special Rapporteur onthe Right to Health.
* Novartis has about 183 000 active suppliers worldwide. Class 3 suppliers represent a sub-group of about 900 suppliers (contract manufacturing, waste management, etc.) deemed to have a significant influence on Novartis business activities. Class 3 suppliers are subject to on-site audits for HSE/labor practices. In addition, a second category of 8 600 Class 2 suppliers (chemical products, construction, etc.) are required to submit self-assessments covering their HSE/labor practices.
119863_Nova_000_000_web_e.qxp 24.1.2007 13:19 Uhr Seite 86
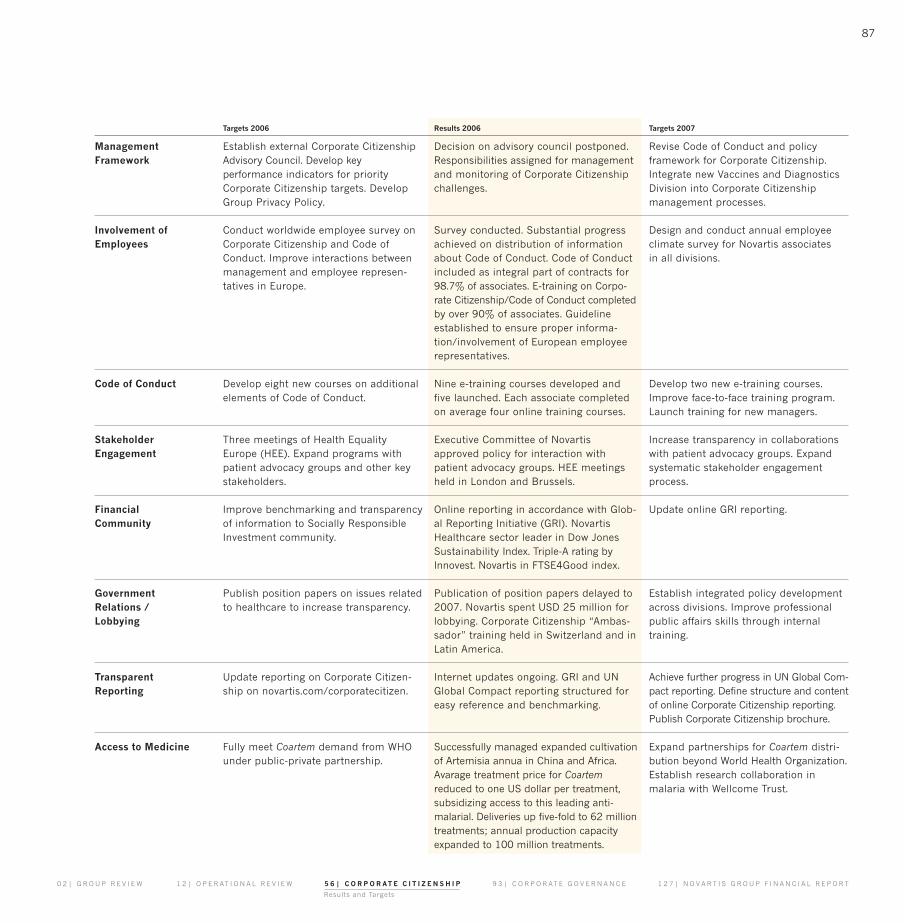
87
0 2 | G R O U P R E V I E W 1 2 | O P E R AT I O N A L R E V I E W 5 6 | C O R P O R AT E C I T I Z E N S H I P 9 3 | C O R P O R AT E G O V E R N A N C E 1 2 7 | N O V A R T I S G R O U P F I N A N C I A L R E P O R T
Results and Targets
Targets 2006 Results 2006 Targets 2007
Management Framework
Involvement ofEmployees
Code of Conduct
Stakeholder Engagement
Financial Community
Government Relations / Lobbying
Transparent Reporting
Access to Medicine
Establish external Corporate CitizenshipAdvisory Council. Develop key performance indicators for priority Corporate Citizenship targets. DevelopGroup Privacy Policy.
Conduct worldwide employee survey onCorporate Citizenship and Code of Conduct. Improve interactions betweenmanagement and employee represen-tatives in Europe.
Develop eight new courses on additionalelements of Code of Conduct.
Three meetings of Health EqualityEurope (HEE). Expand programs withpatient advocacy groups and other keystakeholders.
Improve benchmarking and transparencyof information to Socially ResponsibleInvestment community.
Publish position papers on issues relatedto healthcare to increase transparency.
Update reporting on Corporate Citizen-ship on novartis.com/corporatecitizen.
Fully meet Coartem demand from WHOunder public-private partnership.
Decision on advisory council postponed.Responsibilities assigned for managementand monitoring of Corporate Citizenshipchallenges.
Survey conducted. Substantial progressachieved on distribution of informationabout Code of Conduct. Code of Conductincluded as integral part of contracts for98.7% of associates. E-training on Corpo-rate Citizenship/Code of Conduct completedby over 90% of associates. Guidelineestablished to ensure proper informa-tion/involvement of European employeerepresentatives.
Nine e-training courses developed andfive launched. Each associate completedon average four online training courses.
Executive Committee of Novartisapproved policy for interaction withpatient advocacy groups. HEE meetingsheld in London and Brussels.
Online reporting in accordance with Glob-al Reporting Initiative (GRI). NovartisHealthcare sector leader in Dow JonesSustainability Index. Triple-A rating byInnovest. Novartis in FTSE4Good index.
Publication of position papers delayed to2007. Novartis spent USD 25 million forlobbying. Corporate Citizenship “Ambas-sador” training held in Switzerland and inLatin America.
Internet updates ongoing. GRI and UNGlobal Compact reporting structured foreasy reference and benchmarking.
Successfully managed expanded cultivationof Artemisia annua in China and Africa.Avarage treatment price for Coartemreduced to one US dollar per treatment,subsidizing access to this leading anti-malarial. Deliveries up five-fold to 62 milliontreatments; annual production capacityexpanded to 100 million treatments.
Revise Code of Conduct and policyframework for Corporate Citizenship.Integrate new Vaccines and DiagnosticsDivision into Corporate Citizenship management processes.
Design and conduct annual employeeclimate survey for Novartis associates in all divisions.
Develop two new e-training courses.Improve face-to-face training program.Launch training for new managers.
Increase transparency in collaborationswith patient advocacy groups. Expandsystematic stakeholder engagementprocess.
Update online GRI reporting.
Establish integrated policy developmentacross divisions. Improve professionalpublic affairs skills through internaltraining.
Achieve further progress in UN Global Com-pact reporting. Define structure and contentof online Corporate Citizenship reporting.Publish Corporate Citizenship brochure.
Expand partnerships for Coartem distri-bution beyond World Health Organization.Establish research collaboration inmalaria with Wellcome Trust.
119863_Nova_000_000_web_e.qxp 24.1.2007 13:19 Uhr Seite 87

88
N O V A R T I S G R O U P B U S I N E S S R E V I E W
K A M E D A M E D I C A L C E N T E R ; K A M O G A W A C I T Y , C H I B A , J A P A N
119863_Nova_000_000_web_e.qxp 24.1.2007 13:19 Uhr Seite 88

89
0 2 | G R O U P R E V I E W 1 2 | O P E R AT I O N A L R E V I E W 5 6 | C O R P O R AT E C I T I Z E N S H I P 9 3 | C O R P O R AT E G O V E R N A N C E 1 2 7 | N O V A R T I S G R O U P F I N A N C I A L R E P O R T
Independent Assurance Report
To the Audit and Compliance Committee ofNovartis AG, Basel: We have performed evidence-gathering procedures to providelimited assurance on the following aspectsof Corporate Citizenship (CC) and Health,Safety and Environment (HSE) reporting ofNovartis AG, Basel and its consolidated subsidiaries (the Group), all for the yearended December 31, 2006 (hereafter jointlyreferred to as the subject matter):
• The management and reporting processesfor CC that are designed to ensure theimplementation of the CC Policy, theCode of Conduct, the Business PracticesOffice (BPO) misconduct reporting, theThird Party Management (3PM) initiativeand the marketing practices across theGroup, and the related 2006 CC key performance indicators on page 57 ofthe Novartis Annual Report (the Report);
• The “Novartis access-to-medicine projects2006” figures on page 69 of the Report;
• The management and reporting processesincluding the new HSE Data ManagementSystem, which are designed to collectand check HSE information;
• The HSE key figures “Novartis Health,Safety and Environment Data 2006” onpage 82 of the Report.
We have evaluated the subject matteragainst the following criteria: the CC Policyincluding the CC Guidelines and the Code ofConduct prepared by the Group, the CC andthe compliance reporting guidance and theprinciples summarized in the section “HSEReporting Principles” on page 81 of theReport which define the scope of the report-ing, the inherent limitations of accuracy andcompleteness for the HSE information, andthe fact that the CC management process isin its fifth year of operation.
The Board of Directors of Novartis AG,Basel is responsible for both the subjectmatter and the evaluation criteria.
Our responsibility is to provide a conclusionon the subject matter based on our evidence-gathering procedures in accordancewith the International Standard on Assur-ance Engagements (ISAE) 3000 “AssuranceEngagements other than Audits or Reviewsof Historical Information,” approved Decem-ber 2003 by the International Auditing andAssurance Standards Board (IAASB).
We planned and performed our evidence-gathering procedures to obtain abasis for our conclusions in accordance withan ISAE 3000 limited assurance engage-ment. The evidence gathering proceduresare more limited than for a reasonableassurance engagement. We have not per-formed an audit according to InternationalStandards on Auditing. Accordingly, we donot express such an audit opinion.
Our evidence-gathering procedures includ-ed the following work:
• Interviewing personnel responsible for CCmanagement and reporting at Group level;
• Visiting the Pharma, Sandoz, ConsumerHealth and Gerber global headquarters,selected country and business unit headquarters and specific sites in Canada,Germany, Spain, Switzerland, and theUnited States;
• Interviewing the personnel responsiblefor CC management, including CC reporting and key figures, Code of Conducttraining, the 3PM implementation, theCompliance reporting, and marketingpractices in the different headquarterswhere our visits took place;
• Performing tests on a sample basis of evidence supporting selected HSE parameters (for lost time accident rate,hazardous wastes, water use, energy efficiency and greenhouse gas emission)with regard to the reported data aggregation from the selected sites toGroup level; and
• Reading and performing tests on a sam-ple basis of the relevant documentationincluding Group policies, managementand reporting structures, documentationand systems in place to collect, analyzeand aggregate key figures reported forCC, HSE and Access to Medicine.
Based on our work described and the crite-ria detailed in this Assurance Report, noth-ing has come to our attention that causes usto believe that management assertions onthe subject matter defined above are mate-rially misstated. Additionally, nothing hascome to our attention that causes us tobelieve that the management and reportingprocesses as defined under subject matterabove are not functioning as designed, in allmaterial respects.
From our work, we have provided the fol-lowing recommendations to the manage-ment, which have been agreed:
• Continue to improve processes to measure and report on performance withregard to CC related training activitiesincluding improved tracking of face-to-face training completion rates.
• Continue to improve the implementationof cross-checks at local level to ensurequality of HSE data entered in the sys-tem, and make better use of the existing functionalities and reports.
PricewaterhouseCoopers AG
Dr. Thomas Scheiwiller Thomas FreiBasel, January 17, 2007
INDEPENDENT ASSURANCE REPORT ON THE NOVARTIS GROUP CORPORATE CITIZENSHIP REPORTING
119863_Nova_000_000_web_e.qxp 24.1.2007 13:19 Uhr Seite 89

90
N O V A R T I S G R O U P B U S I N E S S R E V I E W
N O V A R T I S V A C C I N E S A N D D I A G N O S T I C S ; L I V E R P O O L , U K
119863_Nova_000_000_web_e.qxp 24.1.2007 13:19 Uhr Seite 90

91
0 2 | G R O U P R E V I E W 1 2 | O P E R AT I O N A L R E V I E W 5 6 | C O R P O R AT E C I T I Z E N S H I P 9 3 | C O R P O R AT E G O V E R N A N C E 1 2 7 | N O V A R T I S G R O U P F I N A N C I A L R E P O R T
Risk Management
The Corporate Risk Management functioncoordinates risk management throughoutthe Novartis Group, promoting anticipatorymanagement of threats and opportunities,and providing the Board of Directors and theExecutive Committee of Novartis with infor-mation necessary to manage overall riskexposure.
Novartis takes a proactive approachtoward risks that are an intrinsic part ofdoing business. By managing risks in ananticipatory, comprehensive and profession-al manner, Novartis strives to gain maximumvalue from opportunities that guaranteelong-term business success. Attainment ofGroup objectives, however, requires that risksbe adequately assessed and addressed.
Within the context of risk, our majorfocus during 2006 was pandemic prepared-ness – to ensure business continuity, main-tain provision of life-saving medicines andservices to patients, and protect associatesand their immediate families, as well as thereputation of Novartis, in the event of an out-break of pandemic influenza.
A Pandemic Preparedness OperationalPlan was prepared to focus and define rolesand responsibilities within Novartis in case ofa pandemic influenza outbreak. The newplan complemented and reinforced the exist-ing Novartis Emergency Management andBusiness Continuity Management programs.
“The probability of a pandemic is rela-tively low, but the potential impact would beextremely severe,” says Keith Saveal, HeadCorporate Health, Safety and Environment.“We have to take the risk seriously. No one
would forgive us if, given the time we have toprepare, we didn’t take adequate steps toprovide for our patients and customers, aswell as make plans to maintain our businessat a satisfactory level.”
A pandemic is a simultaneous outbreakof an infectious disease worldwide. It requiresthe emergence of a disease new to the population, caused by an agent that causesserious illness, and spreads easily and sustainably among humans. Three humaninfluenza pandemics occurred in the 20thcentury, each resulting in illness in approxi-mately 30% of the world population.
Current concern for a pandemic arisesfrom an unprecedented outbreak of H5N1influenza in birds that began in 1997 andhas spread across bird populations in Asia,Europe and northern Africa. The H5N1 strainmight ultimately adapt into a strain that is con-tagious among humans and potentially be asserious as the pandemic of 1918.
In the US National Strategy for PandemicInfluenza, the Homeland Security Councilwarns that a pandemic “would have significantimplications for the economy, for national security and for basic functioning of society.”Similar sentiments have been expressed byother governments around the world.
Business-critical processes for divisionsand functions were evaluated to be certainNovartis can maintain the ability to bring itsmedicines to the patients who need them.Furthermore, management implementedbusiness continuity plans that would main-tain the business at a satisfactory level evenduring the most severe phase of a pandemic.
Where appropriate, this includes contingencyinventories in strategic locations, to ensurewe are able to meet the needs of patients.
Business-critical roles necessary to main-tain the required level of business were iden-tified and associates holding such positionswere notified directly by line management.Masks and gloves, plus other appropriateprotection, will be distributed to associatesto ensure business continuity.
In the event of a pandemic, transporta-tion likely would be severely affected, withcommercial flights grounded in the firstwave, cross-border travel restricted andcargo transport restricted to land and sea. Toensure continued supply of life-saving med-icines and services to patients, Novartis hasbuilt stocks of these medications to guaran-tee uninterrupted supply during a pandemic.
Early last year, the Group prepared anddistributed a brochure explaining necessaryindividual precaution and preparation meas-ures. In addition, further information on whatprecautions to take during an epidemic arebeing prepared and will be distributed to allassociates.
Novartis takes a proactive approach toward risks that are an intrinsic part of doingbusiness. The major focus during 2006 was pandemic preparedness – to ensurebusiness continuity, maintain provision of life-saving medicines to patients, and protect employees, their families and the reputation of Novartis in the event of a pandemic influenza outbreak.
RISK MANAGEMENT
119863_Nova_000_000_web_e.qxp 24.1.2007 13:19 Uhr Seite 91

92
N O V A R T I S G R O U P B U S I N E S S R E V I E W
B E I J I N G V I S T A C L I N I C ; B E I J I N G , C H I N A
119863_Nova_000_000_web_e.qxp 24.1.2007 13:19 Uhr Seite 92

93
0 2 | G R O U P R E V I E W 1 2 | O P E R AT I O N A L R E V I E W 5 6 | C O R P O R AT E C I T I Z E N S H I P 9 3 | C O R P O R AT E G O V E R N A N C E 1 2 7 | N O V A R T I S G R O U P F I N A N C I A L R E P O R T
Contents
THE APPLICABLE CORPORATE GOVERNANCE STANDARDS 94
GROUP STRUCTURE AND SHAREHOLDERS 94
Group Structure 94
Shareholders of Novartis AG 95
CAPITAL STRUCTURE 95
Share Capital of Novartis AG 95
Changes in Capital, Share Repurchase Programs 95
Convertible or Exchangeable Bonds, Warrants, Options or 95Other Securities granting Rights to Novartis Shares
SHAREHOLDERS' RIGHTS 96
One Share One Vote 96
Other Shareholder Rights 96
Registration as Shareholder 96
Voting Limitations 96
Voting by Nominees 96
Voting by ADS Holders 96
Resolutions and Elections at Annual General Meeting 96
CHANGE OF CONTROL PROVISIONS 97
No Opting up, No Opting out 97
Provisions in Certain Employment Agreements 97
BOARD OF DIRECTORS 97
Composition of the Board of Directors 97
Board Member Independence 97
Election and Term of Office 98
Chairman and Chief Executive Officer 98
The Lead Director 98
Role and Functioning of the Board 98
Role and Functioning of the Board Committees 99
Board and Committees; Membership, Attendance, 100Number and Duration of Meetings
Information and Control Systems 100
CONTENTS MANAGEMENT OF THE COMPANY 101
COMPENSATION, BENEFITS, SHAREHOLDINGS 101
General Principles and Processes 101
Compensation for Novartis Associates 104
Leveraged Share Savings Plans 106
Source of the Shares Awarded 106
Senior Management Compensation 106
Benefits 108
Allocation of Shares under the 110Leveraged Share Savings Plans
Ownership of Novartis Shares and Share 110Options by Senior Management
Loans, Severance Payments, Compensation, 111Former Members of Senior Management
Non-Executive Director Compensation and Shareholdings 111
AUDITORS 112
Duration of the Mandate and Terms of 112Office of the Independent Auditors
Auditing and Additional Fees 112
Supervisory and Control Instruments 113
INFORMATION AND COMMUNICATION POLICY 114
Introduction 114
Information Materials 114
Investor Relations Program 114
PERFORMANCE GRAPH 115
FURTHER INFORMATION 115
BOARD OF DIRECTORS 116
EXECUTIVE COMMITTEE OF NOVARTIS 122
BUSINESS UNIT HEADS 125
COMMITMENT TO CORPORATE GOVERNANCE
119863_Nova_000_000_web_e.qxp 24.1.2007 13:19 Uhr Seite 93
94
N O V A R T I S G R O U P B U S I N E S S R E V I E W
The Applicable Corporate Governance Standards
The following standards apply to Novartis:• The Directive on Information Relating to Corporate Governance
issued by the SWX Swiss Exchange;• The Swiss Code of Best Practices for Corporate Governance;• The securities laws of the United States of America as these
apply to foreign issuers of securities listed on major US stockexchanges; and
• The Rules of the New York Stock Exchange (NYSE).
Novartis has incorporated the above Swiss and US standards – andthe principles of corporate governance under the Swiss Code ofObligations – into the Articles of Incorporation, the Regulations ofthe Board and the Charters of the Board committees. The CorporateGovernance and Nomination Committee as described in detail belowreviews these standards and principles regularly in light of prevail-ing best practices and makes recommendations for improvementsfor consideration by the full Board of Directors (the “Board”).
Novartis complies with Swiss law and US law as well as the rulesand regulations of the SWX and the NYSE. As expressly permittedunder US law and NYSE rules, Novartis deviates from US law andNYSE rules where they conflict with mandatory applicable Swiss cor-porate law. In particular:• External auditors are appointed by the shareholders at the
Annual General Meeting and not by the Audit and ComplianceCommittee, as required in the US.
• Equity compensation plans are established by the CompensationCommittee or the management of local Novartis Group companies (under the principles approved by the CompensationCommittee) but are not approved at the Annual General Meeting.
• Board committees submit all their reports to the Board but do not report to the shareholders directly (Novartis issues noproxy statement reports).
Printed copies of the aforementioned Novartis regulations can beobtained by writing to the following address: Novartis AG, Attn. Corporate Secretary, CH-4056 Basel, Switzerland. Further informationon Corporate Governance can be found by visiting:
www.novartis.com/investors/en/corporate_governance.
Group Structure and Shareholders
Group Structure
The DivisionsThe Novartis Group is divided operationally into four Divisions: Pharmaceuticals, Vaccines and Diagnostics, Sandoz (generic pharmaceuticals) and Consumer Health.
Novartis AG and Group CompaniesThe registered domicile of Novartis AG is Lichtstrasse 35, CH-4056Basel, Switzerland.
Business operations are conducted through Novartis Groupcompanies. Novartis AG, a holding company organized under Swisslaw, owns directly or indirectly all companies worldwide belongingto the Novartis Group. Except as mentioned below, the shares ofthese companies are not publicly traded.
The most important Novartis subsidiaries and associated com-panies are listed in Note 32 to the Group’s consolidated financialstatements.
Majority Holdings in Publicly Traded Group CompaniesThe shares of Idenix Pharmaceuticals, Inc. and Novartis India Limitedare traded on public stock exchanges. Novartis owns directly and indirectly: • 55.8% of Idenix Pharmaceuticals, Inc. (a US company).
The shares of Idenix Pharmaceuticals are listed for trading on the NASDAQ (Valor No. 1630029, ISIN US45166R2040, symbol: IDIX);
• 51% of Novartis India Limited. The remaining shares are registered for trading at the Bombay Stock Exchange (ISININE234A01025, symbol: HCBA).
Significant Minority Holdings in Publicly Traded CompaniesNovartis AG directly or indirectly holds 33.3% of the bearer sharesof Roche Holding AG, registered in Basel, Switzerland, and listed onthe SWX Swiss Exchange (bearer shares: Valor No. 1203211, ISINCH0012032113, symbol RO; nonvoting equity securities: Valor No.1203204, ISIN CH0012032048, symbol: ROG; further securities ofRoche Holding AG are ADSs for nonvoting equity securities, whichare traded on the over-the-counter market in the US, symbol:RHHBY). The market value of this interest in Roche Holding AG onDecember 31, 2006, was USD 10.8 billion.
Novartis is fully committed to good corporate governance.
COMMITMENT TO CORPORATE GOVERNANCE
119863_Nova_000_000_web_e.qxp 24.1.2007 13:19 Uhr Seite 94

95
0 2 | G R O U P R E V I E W 1 2 | O P E R AT I O N A L R E V I E W 5 6 | C O R P O R AT E C I T I Z E N S H I P 9 3 | C O R P O R AT E G O V E R N A N C E 1 2 7 | N O V A R T I S G R O U P F I N A N C I A L R E P O R T
left: Applicable Standards – Group Structureright: Capital Structure
Roche is independently governed, managed and operated, meaningthat Novartis does not control this company.
Shareholders of Novartis AG
As of December 31, 2006, there were more than 150 000 registeredshareholders. Based on the share register, the largest registeredshareholders were: • The Novartis Foundation for Employee Participation, registered
in Basel, Switzerland (holding 2.8% of the share capital); and• Emasan AG, registered in Basel, Switzerland (holding 3.2%). In addition: • Mellon Bank, Everett, holds 2%, Nortrust Nominees, London,
holds 2.7% and JPMorgan Chase Bank, New York, holds 7.6% ofthe registered shares as nominees.
• JPMorgan Chase Bank, the depositary for the shares representedby American Depositary Shares, is registered with 12.1% of theshare capital as part of this role.
No other shareholder is registered as owner of more than 2% of theissued share capital and there are no cross-holdings equal to or higherthan this amount.
Novartis has not entered into any shareholders’ agreement orother agreement regarding the voting or holding of Novartis shares.
Capital Structure
Share Capital of Novartis AG
The share capital of Novartis AG is CHF 1 364 485 500, fully paid-in and divided into 2 728 971 000 registered shares of CHF 0.50nominal value each. Novartis has neither authorized nor conditional capital. There are no preferential voting shares. All shares have equalvoting rights. No participation certificates, nonvoting equity securities(Genussscheine) or profit-sharing certificates have been issued.
Novartis shares are listed on the SWX Swiss Exchange and traded on Virt-X (Valor No. 001200526, ISIN CH0012005267, symbol:NOVN.VX) and on the New York Stock Exchange (NYSE) in the formof American Depositary Shares (ADS) (Valor No. 567514, ISINUS66987V1098, symbol: NVS).
Changes in Capital, Share Repurchase Programs
Since the merger creating Novartis in December 1996, Novartis AGhas implemented four share repurchase programs with a total com-mitment as of December 31, 2006, of CHF 15 billion. Three programshave been completed, with the shares repurchased in the second andthird programs being canceled, and the capital of Novartis AG cor-respondingly being reduced by shareholder resolution at the Annu-al General Meetings held in 2002, 2003, 2004, 2005 and 2006. InAugust 2004, Novartis announced the start of a fourth program torepurchase shares via a second trading line in the SWX SwissExchange. Since the start of the fourth program, a total of 25.4 mil-lion shares have been repurchased for USD 1.2 billion. No shareswere repurchased in 2006. A fifth repurchase program with a maxi-mum value of CHF 4 billion was approved by the shareholders at theAnnual General Meeting held in 2005, but will only be started aftercompletion of the fourth repurchase program.
Capital Reductions
Number of Amount ofYear of Shares Capital Reduced Reduction Canceled in CHF
2002 61 054 680 30 527 340
2003 22 680 000 11 340 000
2004 24 260 000 12 130 000
2005 38 039 000 19 019 500
2006 10 200 000 5 100 000
A table with additional information on the development of the sharecapital structure of Novartis AG over the last two years can be foundin Note 5 to the financial statements of Novartis AG.
Convertible or Exchangeable Bonds, Warrants, Options or OtherSecurities granting Rights to Novartis Shares
There has been no issuance of convertible or exchangeable bonds,warrants, options or other securities granting rights to Novartisshares other than securities granted to associates as a componentof compensation.
Information about shares and share options granted as com-pensation is set forth below in this section under the heading “Compensation, Benefits, Shareholdings” and in the Notes to the consolidated financial statements.
119863_Nova_000_000_web_e.qxp 24.1.2007 13:19 Uhr Seite 95

96
N O V A R T I S G R O U P B U S I N E S S R E V I E W
vide for voting diversity at the General Meeting and to ensure thatno minority shareholder may dominate the General Meeting, whereshareholder representation has been traditionally low for many companies.
Voting by Nominees
Nominees may not vote shares absent registration in the Novartisshare register and, with registration, may only vote shares consti-tuting an amount less than or equal to 0.5% of the registered sharecapital. The Board may register nominees with the right to vote inexcess of that limit if the nominees disclose such particulars of thebeneficial owners of the shares as the Board shall require. Group-ings formed to circumvent this limitation are treated as a single per-son or nominee.
Voting by ADS Holders
Holders of American Depositary Shares (ADS) may vote by instructingJPMorgan Chase Bank to exercise the voting rights attached to theregistered shares underlying the ADSs. JPMorgan Chase Bank, asdepositary, may exercise the voting rights for deposited shares represented by ADS at its discretion to the extent the holders of theADS have not given instructions as to how such underlying sharesshould be voted.
Resolutions and Elections at Annual General Meeting
Resolutions of shareholders at an Annual General Meeting areapproved with a simple majority of the shares represented at themeeting, except in the following matters which by law (Swiss Codeof Obligations, Art. 704) and the Articles of Incorporation require theapproval of two thirds of the shares represented: • Change of the purpose of Novartis AG;• Creation of shares with privileged voting rights;• Implementation or removal of restrictions regarding the
transferability of shares;• Authorized or conditional increase of the share capital;• Increase of the share capital out of equity, or a contribution in
kind or for the purpose of an acquisition of assets, and the grant of special benefits;
• Limitation or withdrawal of preemptive rights;• Change of the domicile of Novartis AG; and• Dissolution of Novartis AG without liquidation.
Shareholders’ Rights
One Share One Vote
Each registered share entitles the holder to one vote at the AnnualGeneral Meeting.
Other Shareholder rights
Shareholders representing at least 10% of the share capital mayrequest to convene an extraordinary General Meeting. Shareholdersrepresenting an aggregate nominal value of at least CHF 1 000 000,may request that an item be included in the agenda of an AnnualGeneral Meeting. Such requests must be made in writing at the latest 45 days before the date of the General Meeting, specifying theitem to be included in the agenda and containing the proposal forwhich the shareholder requests a vote.
Shareholders have the right to receive dividends, appoint a proxyand hold such other rights as are granted under the Swiss Code ofObligations.
Registration as Shareholder
No restrictions exist regarding the transferability of Novartis shares.However, only those persons having their shares registered in theNovartis share register may exercise their voting rights. Pursuant toSwiss law, a person who wishes to register shares must make a dec-laration to the Novartis share register that the shares have beenacquired in his/her own name and for his/her own account.
Only shareholders registered at least five days prior to the AnnualGeneral Meeting may vote their shares at the Annual General Meeting.
Voting Limitations
Each share carries one vote. However, the Articles of Incorporationprovide that no shareholder shall be registered to vote for sharescomprising more than 2% of the registered share capital unless theBoard has granted, upon request, an exemption. Exemptions are inforce for the two largest shareholders reported above (Novartis Foun-dation for Employee Participation and Emasan AG). In 2006, no otherexemptions have been requested.
The statutory voting restrictions can be canceled with a two-thirdsmajority of the shares represented at the Annual General Meeting.
These voting restrictions have been imposed and retained to pro-
119863_Nova_000_000_web_e.qxp 24.1.2007 13:19 Uhr Seite 96
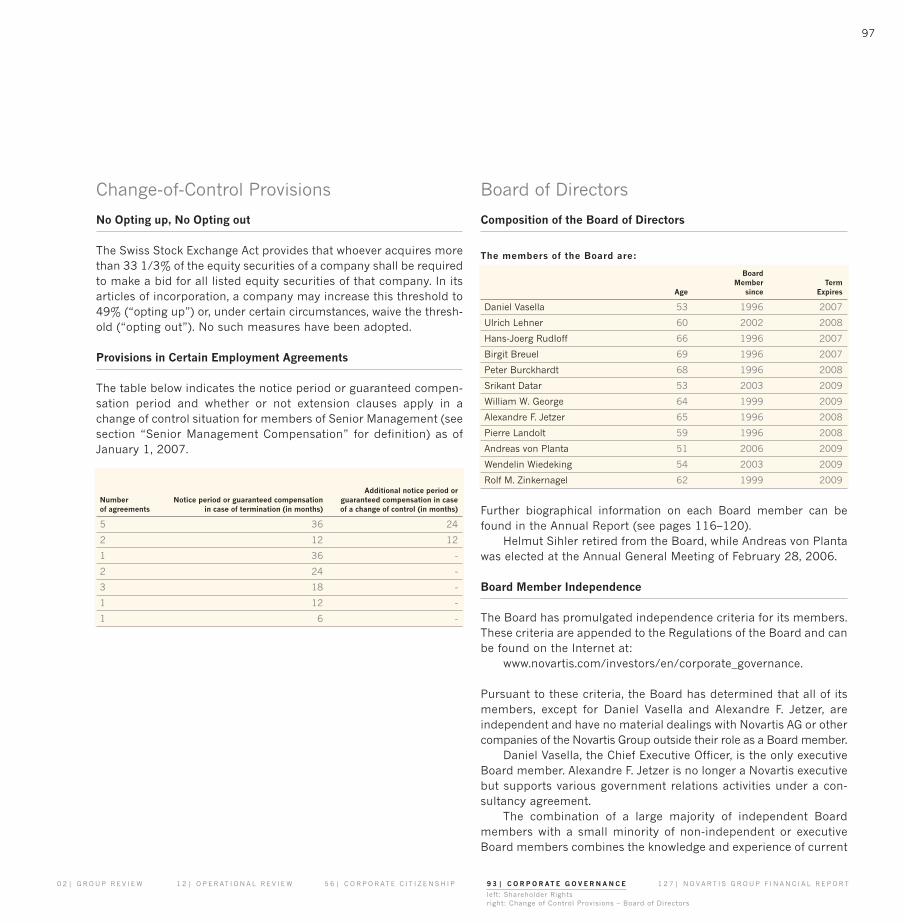
97
0 2 | G R O U P R E V I E W 1 2 | O P E R AT I O N A L R E V I E W 5 6 | C O R P O R AT E C I T I Z E N S H I P 9 3 | C O R P O R AT E G O V E R N A N C E 1 2 7 | N O V A R T I S G R O U P F I N A N C I A L R E P O R T
left: Shareholder Rightsright: Change of Control Provisions – Board of Directors
Change-of-Control Provisions
No Opting up, No Opting out
The Swiss Stock Exchange Act provides that whoever acquires morethan 33 1/3% of the equity securities of a company shall be requiredto make a bid for all listed equity securities of that company. In itsarticles of incorporation, a company may increase this threshold to49% (“opting up”) or, under certain circumstances, waive the thresh-old (“opting out”). No such measures have been adopted.
Provisions in Certain Employment Agreements
The table below indicates the notice period or guaranteed compen-sation period and whether or not extension clauses apply in achange of control situation for members of Senior Management (seesection “Senior Management Compensation” for definition) as ofJanuary 1, 2007.
Additional notice period or Number Notice period or guaranteed compensation guaranteed compensation in case of agreements in case of termination (in months) of a change of control (in months)
5 36 24
2 12 12
1 36 -
2 24 -
3 18 -
1 12 -
1 6 -
Board of Directors
Composition of the Board of Directors
The members of the Board are:
Board Member Term
Age since Expires
Daniel Vasella 53 1996 2007
Ulrich Lehner 60 2002 2008
Hans-Joerg Rudloff 66 1996 2007
Birgit Breuel 69 1996 2007
Peter Burckhardt 68 1996 2008
Srikant Datar 53 2003 2009
William W. George 64 1999 2009
Alexandre F. Jetzer 65 1996 2008
Pierre Landolt 59 1996 2008
Andreas von Planta 51 2006 2009
Wendelin Wiedeking 54 2003 2009
Rolf M. Zinkernagel 62 1999 2009
Further biographical information on each Board member can befound in the Annual Report (see pages 116–120).
Helmut Sihler retired from the Board, while Andreas von Plantawas elected at the Annual General Meeting of February 28, 2006.
Board Member Independence
The Board has promulgated independence criteria for its members.These criteria are appended to the Regulations of the Board and canbe found on the Internet at:
www.novartis.com/investors/en/corporate_governance.
Pursuant to these criteria, the Board has determined that all of itsmembers, except for Daniel Vasella and Alexandre F. Jetzer, are independent and have no material dealings with Novartis AG or othercompanies of the Novartis Group outside their role as a Board member.
Daniel Vasella, the Chief Executive Officer, is the only executiveBoard member. Alexandre F. Jetzer is no longer a Novartis executivebut supports various government relations activities under a con-sultancy agreement.
The combination of a large majority of independent Boardmembers with a small minority of non-independent or executiveBoard members combines the knowledge and experience of current
119863_Nova_000_000_web_e.qxp 24.1.2007 13:19 Uhr Seite 97
98
N O V A R T I S G R O U P B U S I N E S S R E V I E W
or former Novartis managers with the diverse skills of the independent Board members.
Novartis conducts nonadvisory banking business with Barclays Capital, of which Hans-Joerg Rudloff is presently Chairman of theExecutive Committee. The Board concluded that this relationshipdoes not affect the independence of Hans-Joerg Rudloff pursuant tothe Board’s independence criteria.
Rolf M. Zinkernagel has been delegated to the Scientific AdvisoryBoard of the Novartis Institute for Tropical Diseases (NITD). He is alsoa delegate to the Board of Directors of the Genomics Institute of theNovartis Research Foundation (GNF). The Board concluded that thisrelationship does not affect the independence of Rolf M. Zinkernagelpursuant to the Board’s independence criteria.
No Board member is on the board of a listed company with whichany Novartis Group company conducts a material amount of business.
Election and Term of Office
All Board members are elected individually.The terms of office for which Board members are elected do not
exceed three years. The specific terms of office of Board membersare determined by shareholders in the election or re-election at Annu-al General Meetings. However, under Swiss law, a General Meeting ofshareholders is entitled to remove Board members at any timenotwithstanding their term of office.
The average tenure of the Board members is eight years andtheir average age is 60 years. In principle, a Board member is toretire after reaching 70 years of age. Under special circumstances,shareholders may grant an exemption from this rule and re-elect amember of the Board for further terms of office of no more thanthree years at a time.
Chairman and Chief Executive Officer
The Corporate Governance rules regarding the separation of the rolesof the Chairman of the Board and the Chief Executive Officer varyfrom country to country. In most countries, companies have to makea choice and select the model that best ensures effective leadership,efficient decision-making and an adequate balance of power. TheBoard examines the question regularly. Presently, it is of the firmopinion that it is in the best interest of the company and the share-holders that Daniel Vasella serves as Chairman and Chief ExecutiveOfficer of the Group.
The Regulations of the Board provide that an independent LeadDirector is appointed in case the Chairman of the Board also servesas Chief Executive Officer.
The Lead Director
The Board has appointed Ulrich Lehner as Lead Director (replacingHelmut Sihler, who retired from the Board on February 28, 2006).His responsibilities include ensuring an orderly process in the eval-uation of the performance of the Chairman and Chief Executive Offi-cer, chairing the Board’s private sessions (i.e., the meetings of theNon-Executive Board members) and leading the independent mem-bers of the Board in case of a crisis or in matters requiring their sep-arate consideration or decision. The Lead Director is also a memberof all of the Board committees.
The non-executive independent Board members held two com-prehensive private sessions, one of which was chaired by the formerLead Director, Helmut Sihler, and the other by the new Lead Director, Ulrich Lehner.
Role and Functioning of the Board
The Board holds the ultimate decision-making authority of NovartisAG for all matters except for those decisions reserved by law forshareholders.
The agendas of Board meetings are set by the Chairman. AnyBoard member may request a Board meeting or that an item beincluded on the agenda. Board members are provided, in advance ofBoard meetings, with adequate materials to prepare for the items onthe agenda. Decisions are taken by the Board as a whole, with thesupport of its four committees described below (Chairman’s Committee, Compensation Committee, Audit and Compliance Committee, and Corporate Governance and Nomination Committee).The primary functions of the Board include:• Providing the strategic direction of Novartis;• Determining the organizational structure and the manner of
governance of the company;• Supervising the business operations overall;• Approving major acquisitions or divestments;• Structuring the accounting system, the financial controls and the
financial planning;• Reviewing and approving the annual financial statements and
results release of Novartis AG and the Group;
119863_Nova_000_000_web_e.qxp 24.1.2007 13:19 Uhr Seite 98
99
0 2 | G R O U P R E V I E W 1 2 | O P E R AT I O N A L R E V I E W 5 6 | C O R P O R AT E C I T I Z E N S H I P 9 3 | C O R P O R AT E G O V E R N A N C E 1 2 7 | N O V A R T I S G R O U P F I N A N C I A L R E P O R T
Board of Directors
• Appointing and dismissing members of the Executive Committee, the Head of Internal Audit and other key executives;
• Promulgating fundamental corporate policies, in particular on financial matters, corporate governance and citizenship, personnelor environmental matters and overseeing compliance therewith;
• Preparing the matters to be presented at the General Meeting,including Novartis AG’s financial statements and the consolidated financial statements for the Group;
• Evaluating regularly the performance of the Chairman and Chief Executive Officer and reviewing the performance of the members of the Executive Committee; and
• Performing a self-evaluation once a year.
Role and Functioning of the Board Committees
Each Board committee has a written charter outlining its duties andresponsibilities and a chair elected by the Board. The Board com-mittees meet regularly and consider the agenda determined by theChair. Board committee members are provided, in advance of meet-ings, with adequate materials to prepare for the agenda items.
The Chairman’s Committee: The Chairman’s Committee is composed of four Board members;the Chairman and Chief Executive Officer, the two Vice Chairmen, oneof whom is the Lead Director and one other member of the Board.
The Chairman’s Committee takes decisions on financial andother matters delegated by the Board to the Chairman's Committeein accordance with the Regulations of the Board. In addition, theChairman’s Committee also takes decisions and preliminary actionson behalf of the full Board in urgent cases.
The Compensation Committee: The Compensation Committee is composed of three independentBoard members.
The Compensation Committee reviews Group-wide compensationpolicies and programs, including share option programs and otherincentive-based compensation, before the full Board makes finaldecisions. The Compensation Committee is responsible for review-ing and approving the compensation paid to members of the Exec-utive Committee and other selected key executives as well as fordetermining the compensation for the Chairman and Chief ExecutiveOfficer. The Compensation Committee may seek outside expert advicefrom time to time to support its decisions and recommendations.
The Audit and Compliance Committee: The Audit and Compliance Committee is composed of five inde-pendent members. The Board has determined that all the membersof the Audit and Compliance Committee are independent as definedby the rules of the NYSE.
The Audit and Compliance Committee has determined thatUlrich Lehner, Srikant Datar and Hans-Joerg Rudloff possess therequired accounting and financial management expertise requiredunder the rules of the NYSE. Therefore, the Board has appointedthem as the Audit and Compliance Committee’s Financial Experts.The Board has also reassured itself that other members of the Auditand Compliance Committee have sufficient experience and ability infinance and matters of compliance to enable them to adequatelydischarge their responsibilities.The Audit and Compliance Committee’s main duties include:• Evaluating and selecting the external auditors to be nominated
for election at the Annual General Meeting;• Reviewing the terms of engagement of these external auditors;• Determining the scope and the review of the results of external
and internal audits;• Reviewing (together with external and internal auditors and the
financial and accounting management of Novartis) whether theaccounting policies and financial controls are appropriate, effec-tive and compliant with the applicable accounting standards;
• Reviewing and approving the quarterly financial statements of the Group for the first three quarters of each year and the corresponding financial results releases;
• Reviewing internal control and compliance processes and procedures, including those for the management of business risks; and
• Reviewing processes and procedures to ensure compliance with laws and internal regulations.
The Corporate Governance and Nomination Committee: The Corporate Governance and Nomination Committee is composedof five independent Board members.
The Corporate Governance and Nomination Committee devel-ops corporate governance principles and recommends these to theBoard for approval. Its duties include regular reviews of the Articlesof Incorporation with a view to reinforcing shareholder rights, and ofthe composition and size of the Board and its committees. The Corporate Governance and Nomination Committee conducts anannual evaluation of the Board as a whole and gives guidance to
119863_Nova_000_000_web_e.qxp 24.1.2007 13:19 Uhr Seite 99

100
N O V A R T I S G R O U P B U S I N E S S R E V I E W
Information and Control Systems
The Board:The Board ensures that it receives sufficient information from theExecutive Committee to perform its supervisory duty and to makethe decisions that are reserved to the Board through several means:• Since the Chairman is also the Chief Executive Officer of
Novartis, who heads the meetings of the Executive Committee,he is fully informed on all current developments;
• The Chairman and Chief Executive Officer informs all BoardMembers regularly about current developments, including byway of a written monthly report;
• The Minutes of the Executive Committee meetings are madeavailable to the Board members;
• Informal teleconferences are held as required between BoardMembers and the Chairman and Chief Executive Officer or theLead Director;
• A session is held at each Board meeting with all members of theExecutive Committee;
• The Board is informed in detail by each Division Head on aquarterly basis;
• By invitation, members of management attend Board meetingsto report on areas of the business within their responsibility; and
• Board members are entitled to request information from members of the Executive Committee inside and outside ofBoard meetings and may visit any Novartis site.
CorporateAudit and Governance and
Full Chairman’s Compensation Compliance NominationBoard Committee Committee Committee Committee
Number of meetings in 2006 7 11 3 8 2
Approximate duration of each meeting (hours) 6–8 2 2 2–4 2
Daniel Vasella 7 1 11 1
Helmut Sihler2 2 2 2 3
Ulrich Lehner 7 9 1 3 7 1 1
Hans-Joerg Rudloff 7 11 3 1 8 2
Birgit Breuel 7 8
Peter Burckhardt 7
Srikant Datar 7 8
William W. George 7 11 3 2 1
Alexandre F. Jetzer 7
Pierre Landolt 6 2
Andreas von Planta3 5 5
Wendelin Wiedeking 4
Rolf M. Zinkernagel 7 2
1 Chair 2 Until February 28, 2006 3 Since February 28, 2006
Board members on how to avoid potential conflicts of interest.The Corporate Governance and Nomination Committee also
proposes to the Board individuals who are qualified to become (orbe re-elected as) Board members.
Board and Committees; Membership, Attendance, Number and Duration of Meetings
119863_Nova_000_000_web_e.qxp 24.1.2007 13:19 Uhr Seite 100

101
0 2 | G R O U P R E V I E W 1 2 | O P E R AT I O N A L R E V I E W 5 6 | C O R P O R AT E C I T I Z E N S H I P 9 3 | C O R P O R AT E G O V E R N A N C E 1 2 7 | N O V A R T I S G R O U P F I N A N C I A L R E P O R T
left: Board of Directorsright: Compensation, Benefits, Shareholdings
Board Committees:Board committees, in particular the Audit and Compliance Committee, regularly meet with management and outside consultantsto review the business, better understand all laws and policies impact-ing the Group and support the management in meeting the require-ments and expectations of stakeholders. In particular, the ChiefFinancial Officer and the representative of the external auditors areinvited to the meetings of the Audit and Compliance Committee. Furthermore, the Head of Risk Management and the Business Practices Officer report on a regular basis to the Audit and ComplianceCommittee.
Internal Audit:The Internal Audit function carries out operational and systemaudits; assists the organizational units in the accomplishment ofobjectives by providing an independent approach to the evaluation,improvement and effectiveness of their internal control framework;prepares reports regarding the audits it has performed; and reportsany actual or suspected irregularities to the Audit and ComplianceCommittee and the Chairman of the Board.
Corporate Risk Management:The Corporate Risk Management function reports on a regular basison risk management. Organizational and process measures havebeen introduced to mitigate risks at an early stage. Organizational-ly, the responsibility for risk and risk mitigation is allocated to theDivisions, with specialized Corporate Functions such as Group Qual-ity Operations; Corporate Health, Safety and Environment; and Busi-ness Continuity providing support and controlling the effectivenessof the risk management by the Divisions.
Management of the Company
The Board has delegated to the Executive Committee the coordinationof day-to-day business operations of Group companies. The Executive Committee is headed by the Chief Executive Officer. Theinternal organizational structure and the definition of the areas ofresponsibility of the Board and the Executive Committee are setforth in the Board Regulations.
The Board has not concluded any contracts with third parties tomanage the business.
Further biographical information on the members of Senior Man-agement, a group of senior executives, can be found in the Annual Report.
Compensation, Benefits, Shareholdings
General Principles and Processes
Performance Based CompensationNovartis aspires to be an employer of choice with the ability toattract, retain and motivate the most professional and high-caliberassociates all around the world, who are critical to the company’ssuccess. The company compensation programs are designed to:
• endorse the employer of choice aspiration; • align the objectives of our associates with the long-term
interests of the shareholders;• support a performance oriented culture and meritocracy that
allows the company to reward high performing individuals whothrough their commitment and contribution, while adhering to‘best business practices’, allow our company to achieve its goalto be one of the leading global industry performers;
• be comparable and competitive with a relevant group of otherworld class and industry peer companies who operate and compete for talent on a global basis.
Paying for performance is the guiding principle of the Novartiscompensation policy. For superior performance, total compensationawarded to individual associates may reach levels comparable to the levels of compensation offered by the top quartile of relevantbenchmark companies.
Under the performance-dependent variable compensation pro-grams target incentive percentages (of annual base compensation)are typically defined for each participating associate at the start ofthe respective plan performance period. In general, these target percentages are multiplied at the end of the performance periodwith individual payout multipliers for each associate. The size of themultiplier depends on the incentive plan and on the actual per-formance achieved by the associate against individual objectives asagreed at the beginning of the performance period, compliance withthe "Novartis Values and Behaviors," and the overall performance ofthe Group or the relevant business unit.
Incentive payout multipliers can range from 0 to 2. For excep-tional performance, higher payout multipliers may apply. Such casesrequire the approval of the Chairman and Chief Executive Officerand/or the Compensation Committee. All compensation programsand levels are reviewed regularly based on publicly available dataas well as analyses of independent compensation research compa-
119863_Nova_000_000_web_e.qxp 24.1.2007 13:19 Uhr Seite 101

102
N O V A R T I S G R O U P B U S I N E S S R E V I E W
R U S S I A N C H I L D R E N ’ S C L I N I C A L H O S P I T A L ; M O S C O W , R U S S I A
119863_Nova_000_000_web_e.qxp 24.1.2007 13:19 Uhr Seite 102

103
H O S P I T A L D O C Â N C E R ; S Ã O P A U L O , B R A Z I L
119863_Nova_000_000_web_e.qxp 24.1.2007 13:19 Uhr Seite 103
104
N O V A R T I S G R O U P B U S I N E S S R E V I E W
nies and external compensation advisors. Trends and developmentsin the field of compensation and corporate governance are carefullyanalysed, reviewed and discussed on an ongoing basis with outsideexperts, accountants and consultants.
Performance Management ProcessEach Novartis associate is subject to a formal performance andappraisal process. This process is intended to enable all associatesto focus on clear and ambitious goals, to set directions and priori-ties, and to clarify expectations among the overall organization. Fur-thermore, this approach promotes a culture of continuous improve-ment, supports individuals in meeting their development aspirationsand strengthens organizational capabilities. This is a core process forimproving individual, team and overall business performance.
For each performance year, line managers and their directreports jointly determine and agree upon performance measuresand business objectives. These objectives are derived from the cas-cading-down of business objectives as established at the Group,Division, Function and/or Business Unit levels.
Two performance assessments are carried out each year – a mid-year and a year-end review. The reviews consist of formal meetingsbetween each associate and his/her line manager to evaluate theassociate’s performance, both in light of the business objectivesdefined at the beginning of the year and Group-wide “Novartis Values and Behaviors.” Based on the year-end performance rating,line managers and next-level line managers determine the incentiveaward for each associate for the year under review as well as the tar-get compensation for the coming year.
Share OwnershipIn 2003, the Board established share ownership guidelines to further strengthen the ownership philosophy among Novartis senior executives. These guidelines require a small group of approxi-mately 20 key executives to own a minimum multiple of their basesalary in Novartis shares as described in more detail below underthe heading “Ownership of Novartis Shares and Share Options bySenior Management.”
Compensation for Novartis Associates
Competitive compensation packages are designed in considerationof compensation levels of comparable jobs in relevant benchmarkcompanies.
The benchmark companies for compensation differ dependingon the nature of specific jobs. For specific pharmaceutical jobs, apeer group of pharmaceutical companies is considered that typicallyconsists of Abbott Laboratories, Amgen, AstraZeneca, Bristol-MyersSquibb, Eli Lilly, GlaxoSmithKline, Johnson & Johnson, Merck, Pfizer, Roche, Sanofi-aventis, Schering-Plough and Wyeth. For otherpositions, a wider group of relevant benchmark companies is con-sidered from a variety of different industry sectors, such as fast mov-ing consumer goods and general industry. Benchmark informationis adjusted as necessary to reflect the size and scope of the Novartisbusiness and the specific requirements of a particular job.
As long as an associate achieves his/her performance targets,the total amount of compensation awarded is generally comparableto the level of compensation provided by relevant benchmark com-panies. In case of over- or underperformance, the actual total com-pensation delivered is adjusted upwards or downwards.
The compensation packages of associates consist of base com-pensation and variable compensation as described in the followingparagraphs.
Base CompensationThe base compensation is intended to give each associate a regularand predictable salary that does not depend on the annual per-formance of the associate or of the Novartis business. Salary levelsdepend on job characteristics, market competitiveness as well as onthe skills of each associate. The salary evolution depends on the indi-vidual performance of the associate.
Variable CompensationNovartis has three variable compensation plans: a Bonus Plan, aNovartis Equity Plan “Select” and a Long-term Performance Plan.Under these plans, except the Bonus Plan, awards (if any) are manda-torily delivered in equity.
Bonus PlansMost associates participate in bonus plans. Under these plans,awards are made each year based on the associate’s individual year-end performance rating and company or business unit performance.Below a certain rating, no awards are granted under the plans.
Depending on the applicable plan, bonuses are either deliveredin cash or in shares via the Leveraged Share Savings Plans asdescribed below.
119863_Nova_000_000_web_e.qxp 24.1.2007 13:19 Uhr Seite 104
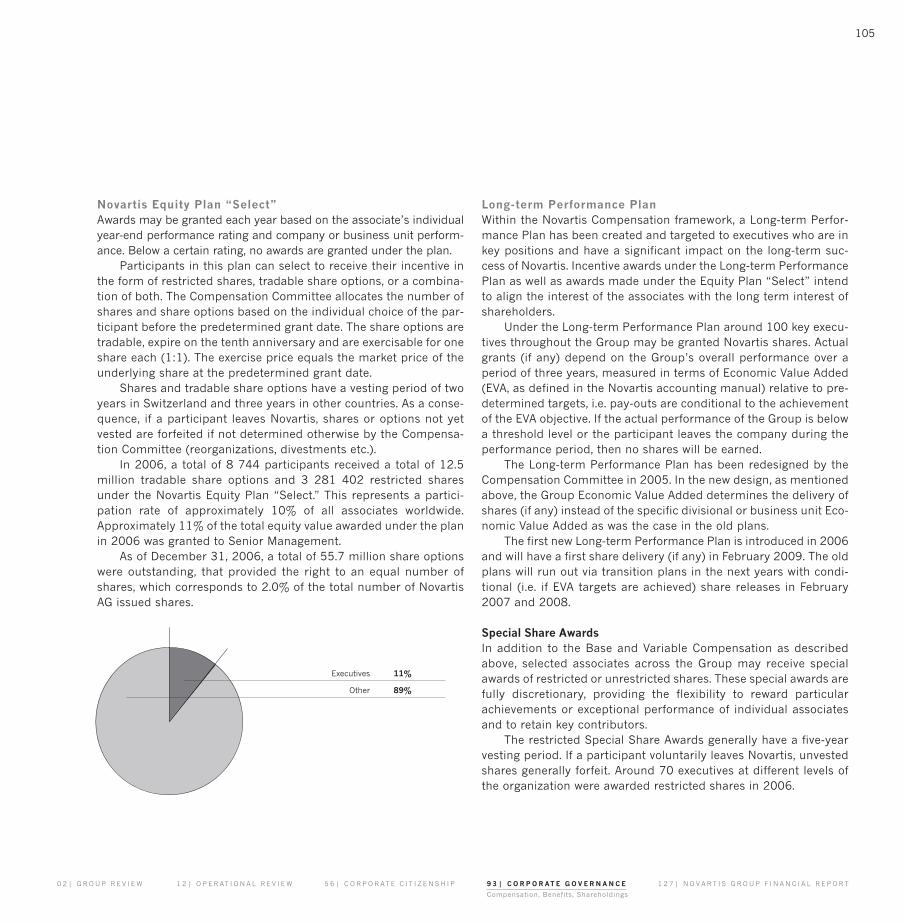
105
0 2 | G R O U P R E V I E W 1 2 | O P E R AT I O N A L R E V I E W 5 6 | C O R P O R AT E C I T I Z E N S H I P 9 3 | C O R P O R AT E G O V E R N A N C E 1 2 7 | N O V A R T I S G R O U P F I N A N C I A L R E P O R T
Compensation, Benefits, Shareholdings
Novartis Equity Plan “Select” Awards may be granted each year based on the associate’s individualyear-end performance rating and company or business unit perform-ance. Below a certain rating, no awards are granted under the plan.
Participants in this plan can select to receive their incentive inthe form of restricted shares, tradable share options, or a combina-tion of both. The Compensation Committee allocates the number ofshares and share options based on the individual choice of the par-ticipant before the predetermined grant date. The share options aretradable, expire on the tenth anniversary and are exercisable for oneshare each (1:1). The exercise price equals the market price of theunderlying share at the predetermined grant date.
Shares and tradable share options have a vesting period of twoyears in Switzerland and three years in other countries. As a conse-quence, if a participant leaves Novartis, shares or options not yetvested are forfeited if not determined otherwise by the Compensa-tion Committee (reorganizations, divestments etc.).
In 2006, a total of 8 744 participants received a total of 12.5million tradable share options and 3 281 402 restricted sharesunder the Novartis Equity Plan “Select.” This represents a partici-pation rate of approximately 10% of all associates worldwide.Approximately 11% of the total equity value awarded under the planin 2006 was granted to Senior Management.
As of December 31, 2006, a total of 55.7 million share optionswere outstanding, that provided the right to an equal number ofshares, which corresponds to 2.0% of the total number of NovartisAG issued shares.
Long-term Performance Plan Within the Novartis Compensation framework, a Long-term Perfor-mance Plan has been created and targeted to executives who are inkey positions and have a significant impact on the long-term suc-cess of Novartis. Incentive awards under the Long-term PerformancePlan as well as awards made under the Equity Plan “Select” intendto align the interest of the associates with the long term interest ofshareholders.
Under the Long-term Performance Plan around 100 key execu-tives throughout the Group may be granted Novartis shares. Actualgrants (if any) depend on the Group’s overall performance over aperiod of three years, measured in terms of Economic Value Added(EVA, as defined in the Novartis accounting manual) relative to pre-determined targets, i.e. pay-outs are conditional to the achievementof the EVA objective. If the actual performance of the Group is belowa threshold level or the participant leaves the company during theperformance period, then no shares will be earned.
The Long-term Performance Plan has been redesigned by theCompensation Committee in 2005. In the new design, as mentionedabove, the Group Economic Value Added determines the delivery ofshares (if any) instead of the specific divisional or business unit Eco-nomic Value Added as was the case in the old plans.
The first new Long-term Performance Plan is introduced in 2006and will have a first share delivery (if any) in February 2009. The oldplans will run out via transition plans in the next years with condi-tional (i.e. if EVA targets are achieved) share releases in February2007 and 2008.
Special Share AwardsIn addition to the Base and Variable Compensation as describedabove, selected associates across the Group may receive specialawards of restricted or unrestricted shares. These special awards arefully discretionary, providing the flexibility to reward particularachievements or exceptional performance of individual associatesand to retain key contributors.
The restricted Special Share Awards generally have a five-yearvesting period. If a participant voluntarily leaves Novartis, unvestedshares generally forfeit. Around 70 executives at different levels ofthe organization were awarded restricted shares in 2006.
Executives 11%
Other 89%
119863_Nova_000_000_web_e.qxp 24.1.2007 13:19 Uhr Seite 105
106
N O V A R T I S G R O U P B U S I N E S S R E V I E W
The Compensation Committee may decide to award restrictedor unrestricted Novartis shares to individual associates as a specialincentive to reward exceptional performance, or grant one-off orannual share awards in recognition of particular achievements orconsistently outstanding performance.
Leveraged Share Savings Plans
As indicated under “Bonus Plans” above, associates are encouragedto receive their bonus awards fully or partially in Novartis sharesinstead of cash to achieve alignment with shareholders interests. Toreinforce this alignment the company therefore sponsors LeveragedShare Savings Plans by matching investments in shares after a cer-tain holding period.
There are several types of Leveraged Share Savings Plans. Participating associates in principle may only participate in one ofthese plans in a given year.
Shares invested in the Swiss Employee Share Ownership Plan(ESOP), which is available in Switzerland to approximately 12 000associates, have a three-year blocking period and are matched atthe end of the blocking period with one share for every two sharesinvested. In 2006 approximately 5 800 associates participated inthis plan.
In the UK associates can invest up to 5% of their monthly salaryup to a maximum of GBP 125 in shares, and might be invited toinvest all or part of their net bonus in shares. Two invested shares arematched with one share immediately which will vest after three years.In 2006, approximately 1 400 associates participated in these plans.
Approximately 30 of the most valued key executives in the worldare invited to participate in a five-year Leveraged Share SavingsPlan. The shares invested in this plan are blocked for a period of fiveyears after the investment date. At the end of the blocking period,the invested shares are matched based on a ratio of 1:1, i.e. oneshare for each invested share.
No shares will be matched under the plans if an associate leavesNovartis prior to expiration of the blocking period other than due toretirement.
Source of the Shares Awarded
The shares awarded under the plans are not newly issued but arerepurchased from the market.
Senior Management Compensation
For the purpose of this Annual Report, “Senior Management” has beendefined to include members of the Executive Committee, PermanentAttendees to the Executive Committee and Business Unit Heads.
In 2006, a total of 19 executives comprised Senior Management.The employment of two executives was terminated during the year, whileone Business Unit (Ophthalmics) was repositioned within the Pharma-ceuticals Division and one Business Unit (Medical Nutrition) is in theprocess of being divested. Based on these changes, as of January 1,2007, Senior Management is comprised of 15 executives.
The compensation policies, the performance managementprocess and the incentive plans described above apply equally toSenior Management, including the Chairman and Chief ExecutiveOfficer.
The decisions on the compensation of Senior Managementmembers are based on an evaluation of the individual performanceof the member as well as the performance of the business for whichthe Senior Management member is responsible. The CompensationCommittee considers the achievement of both short-term and long-term performance targets, including revenue growth, economicvalue creation (operating and net income, earnings per share andeconomic value added), market share growth and ongoing efforts tooptimize organizational effectiveness and productivity.
Compensation of the Chairman and Chief Executive OfficerGeneral ProcessIn the December Board Meeting the Board takes note, discusses andapproves the company’s financial objectives for the following year.The Chairman and Chief Executive Officer presents his individualobjectives, targets and visions which are reviewed, discussed andapproved by the Board. The Board particularly ensures that theChairman and Chief Executive Officer’s objectives are in line with thecompany’s goals to guarantee sustainable long-term performancewhile not being compromised by short-term financial objectives, buton the contrary support the long-term business objectives in theinterest of all stakeholders.
For the year-end the Chairman and Chief Executive Officer pre-pares a self-appraisal, which is discussed with the Lead Director andthe Board. The Lead Director also has individual discussions aboutthe Chairman and Chief Executive Officer’s performance with allBoard Members.
In January, the Board approves the audited results of the com-pany and evaluates the degree of achievement in respect of the tar-
119863_Nova_000_000_ih_e.qxp 25.1.2007 8:59 Uhr Seite 106

107
0 2 | G R O U P R E V I E W 1 2 | O P E R AT I O N A L R E V I E W 5 6 | C O R P O R AT E C I T I Z E N S H I P 9 3 | C O R P O R AT E G O V E R N A N C E 1 2 7 | N O V A R T I S G R O U P F I N A N C I A L R E P O R T
Compensation, Benefits, Shareholdings
geted financial objectives of the past year and compares the resultswith peer industry companies taking into account general financialcriteria and industry development.
In a private session, the independent members of the Boardonly, discuss the overall performance of the Chairman and ChiefExecutive Officer and then share their appraisal with him.
Subsequently the Compensation Committee decides upon thetotal remuneration package for the last year and the target com-pensation (base and variable compensation, and special shareawards) for the coming year, taking into account all relevant factorsincluding available benchmark information.
The performance of the Chairman and Chief Executive Officer isalso reviewed quarterly by the entire Board in connection with thediscussion of the quarterly financial performance of the company.
Compensation of the Chairman and Chief Executive Officer in 2006The Compensation Committee met in a separate session without theChairman and Chief Executive Officer on January 17, 2006, to deter-mine the amount of his variable compensation for 2005 and his tar-get compensation for 2006. Based on the evaluation of the factorsdescribed above, the Compensation Committee concluded that theperformance of the Chairman and Chief Executive Officer during2005 was exceptional and that he had not only met, but exceeded,the performance targets defined at the beginning of the year. Inrecognition of this outstanding and sustained performance, theCompensation Committee decided to reward the Chairman andChief Executive Officer accordingly (the Compensation Table belowprovides the details).
Compensation of Senior Management MembersGeneral Process The Board meets in January together with the Chairman and ChiefExecutive Officer to review and discuss the performance of the othermembers of Senior Management for the previous year, taking intoaccount the audited financial results and the level of achievement ofthe individual financial and nonfinancial targets. In a separate session,the Compensation Committee decides, in presence of the Chairmanand Chief Executive Officer, on the variable compensation for the mem-bers of Senior Management for the past year. At the same meeting,the Compensation Committee decides on the target compensationpackages for the coming year.
In addition to the full-year assessment, the mid-year perform-ance of Senior Management is reviewed in June. At the same time,the Board also carries out a mid-year review of the performance ofthe individual businesses.
During the year restricted Special Share Awards may be grantedfor performance or retention reasons.
Compensation of Senior Management Members in 2006 At its meeting on January 18, 2006, the Compensation Committeedecided on the amount of the variable compensation for 2005 for themembers of Senior Management by applying the principles describedabove.
Members of Senior Management (including the Chairman andChief Executive Officer) received a total of USD 11 897 000 in salaryand USD 4 579 000 in cash bonuses. The number of share optionsgranted to members of Senior Management was 925 040 and thenumber of shares granted was 989 620 (excluding shares matchedunder the Leveraged Share Savings Plans; see pages 106 and 110).Other compensation in the amount of USD 2 865 000 was set asidefor their pension, retirement and other benefits (excluding severancepayments; see further below).
Disclosure of Individual Compensation to Members of theExecutive CommitteeThe following Compensation Table provides details on the total com-pensation awarded to the members of the Executive Committee in2006 (excluding shares matched under the Leveraged Share SavingsPlans). The “Variable compensation” set forth in the table was award-ed in 2006 for 2005 performance. Variable compensation for 2006performance will be disclosed in the 2007 Annual Report. Novartis’“fast-track” publication of its Annual Report determines this timesequence for the disclosure of executive compensation.
The term “blocked shares” used in the footnotes to the Compen-sation Table refers to the ability of associates in Switzerland to volun-tarily and irrevocably commit not to sell their shares for a period of upto ten years (including any vesting period) from the date of grant.Novartis encourages associates to block their shares because doing soaligns the associates’ interests with the shareholders’ interests. TheSwiss Federal Tax Administration, in its Kreisschreiben Nr. 5, Section3.2, ascribes a net present value (the “taxable value”) to such blockedshares. For details see footnote 7 to the Compensation Table. Similar-ly, the Swiss tax authorities also ascribe a taxable value to tradableshare options. In the view of Novartis, the taxable values represent theappropriate values to report in the Compensation Table.
The accounting cost of compensation for Senior Management andBoard members, calculated in accordance with International FinancialReporting Standards, is reported in Note 28 in the consolidated finan-cial statements.
119863_Nova_000_000_web_e.qxp 24.1.2007 13:19 Uhr Seite 107

108
N O V A R T I S G R O U P B U S I N E S S R E V I E W
Benefits
General PolicyPension benefits at Novartis are generally designed to provide asafety net against financial hardship that may result from disabilityor death as well as to provide a reasonable level of retirementincome based on years of service with Novartis. As a general policy,the level of pension benefits provided to associates is country-specific and does not exceed local market practice.
Since a significant number of associates are employed either inSwitzerland or the US, the pension and healthcare benefits in thosecountries are described in more detail below.
Pension Plans in SwitzerlandSwiss Pension FundThe Swiss Pension Fund operates a defined-benefit plan that pro-vides retirement benefits and risk insurance for death or disability.
Compensation Table Executive Committee
BaseCompensation Variable compensation
Long-term Special OtherEquity Plan Performance Share Compen-
Bonus “Select” Plan Awards sation 6 Total 7
Cash Cash Shares Shares Options Shares SharesName and Principal Position Currency (amount) (amount) (number) 1 (number) 2 (number) 3 (number) 4 (number) 5 (amount) (amount)
Daniel VasellaChairman & Chief Executive Officer CHF 3 000 000 - 126 228 210 379 - 84 152 28 051 199 505 21 068 072
Urs BaerlocherHead of Legal and Tax Affairs CHF 836 668 - 12 364 12 364 69 961 8 626 - 140 732 2 906 296
Raymund BreuChief Financial Officer CHF 1 071 670 - 18 409 - 416 667 11 045 15 000 140 732 6 553 054
Juergen Brokatzky-GeigerHead of Human Resources CHF 615 000 - 8 416 8 416 47 620 6 312 - 147 088 2 603 647
Paul ChoffatHead of Consumer Health CHF 820 008 738 000 - 31 052 - 8 626 - 144 549 4 288 058
Thomas EbelingHead of Pharmaceuticals CHF 1 125 004 1 386 000 - 97 195 - 17 357 15 000 197 799 10 702 885
Mark C. FishmanHead of Biomedical Research USD 895 833 13 481 13 352 33 993 124 876 13 289 - 260 662 6 443 462
Andreas RummeltHead of Sandoz CHF 890 004 - 13 149 39 447 - 7 890 - 135 650 4 791 974
1 Participants elected to invest in the Leveraged Share Savings Plans instead of receiving bonus in cash.Daniel Vasella, Urs Baerlocher and Raymund Breu have blocked all these shares for 10 years.
2 These shares include shares granted under the Novartis mandatory Equity Plan “Select”. Daniel Vasella,Urs Baerlocher and Raymund Breu have blocked all of these shares for 10 years. For the other mem-bers of the Executive Committee the combined vesting and voluntary blocking periods of these shareawards range between 2-10 years.
3 Novartis employee share options are tradable. Options granted under the Novartis Equity Plan "Select"outside North-America have an exercise price of CHF 71.30 per share that corresponds to the shareprice at the predetermined grant date on February 6, 2006. In Switzerland, the options have a cliff-vesting period of two years after the date of grant and will expire on February 5, 2016. Options on USADS granted to participants in North America have an exercise price of USD 54.70 per ADS that corre-sponds to the ADS price at the grant date. The US options have a cliff-vesting period of three yearsafter the grant date and will expire on February 5, 2016.
4 These shares were released under the Long-term Performance Plan based on the achievement of EVAobjectives. Daniel Vasella, Urs Baerlocher and Raymund Breu have blocked all these shares for 10years; the other members of the Executive Committee have not blocked these shares.
5 These shares include unrestricted share awards for Daniel Vasella and restricted share awards for Ray-
mund Breu and Thomas Ebeling for their outstanding performance. All these shares are blocked for10 years.
6 Amounts include payments made by Novartis for pension and other benefits.7 The total compensation amounts for all Executive Committee members with the exception of Mark C.
Fishman have been calculated using the taxable value described above. As set out in the Kreis-schreiben Nr. 5 issued by the Swiss Federal Tax Administration, the taxable value of share grantsdepends on the combined vesting and blocking period. The longer the combined vesting/blockingperiod, the lower generally the taxable value. The taxable value of a share award that is subject to atwo-year vesting/blocking period, for example, equals 89% of its market value at the date of grant. Thetaxable value of a share award with a combined vesting/blocking period of 10 years equals 55.84% of its market value at the date of grant (see Section 3.2, Kreisschreiben Nr. 5). At the grant date themarket value of the shares equaled CHF 71.30 per share. Tradable share options under the EquityPlan “Select” have a taxable value of CHF 8.59 per option. Equity awards are generally not taxed at grant in the US. Accordingly, there is no objective basis forcalculating a tax value for Mark C. Fishman’s equity awards. The total compensation amount for MarkC. Fishman is therefore presented on the basis of the market value of the shares and the trinomialvalue of the share options granted. At the grant date, the market value of the US ADS equaled USD54.70 per ADS and the value of the US ADS options equaled USD 15.67 per option.
119863_Nova_000_000_web_e.qxp 24.1.2007 13:19 Uhr Seite 108

109
0 2 | G R O U P R E V I E W 1 2 | O P E R AT I O N A L R E V I E W 5 6 | C O R P O R AT E C I T I Z E N S H I P 9 3 | C O R P O R AT E G O V E R N A N C E 1 2 7 | N O V A R T I S G R O U P F I N A N C I A L R E P O R T
Compensation, Benefits, Shareholdings
The Swiss Pension Fund is funded by contributions from Group com-panies and the insured associates. The Swiss Pension Fund insuresremuneration up to a maximum base salary of CHF 220 000 peryear, reduced with an offset of 30% of salary up to a maximum ofCHF 24 120. The bonus of associates with a base salary belowCHF 220 000 are insured through a defined-contribution incen-tive/bonus pension plan, which is financed through contributions bythe company and the insured associates.
Swiss Management Pension FundThe Swiss Management Pension Fund is basically a defined-contribution plan that also provides retirement annuity benefits andrisk insurance for death and disability for components of remuner-ation in excess of the maximum insurable amount of base salarydescribed in the previous paragraph. The Swiss Management Pen-sion Fund insures base salary above CHF 220 000 and bonus, up toa maximum of CHF 774 000. The Swiss Management Pension Fundis funded through contributions by Novartis and the insured associates.
US-Based Employee Pension Plans US Defined-Benefit Plan The pension plan for certain US-based associates of Novartis Cor-poration and its US affiliates is a funded, tax-qualified, noncontrib-utory defined-benefit pension plan. The amount of annual earningscovered by the pension plan is generally equal to the associate’s basesalary and annual bonus. The amount of annual earnings that maybe considered in calculating benefits under this pension plan is lim-ited by law (in 2006: USD 220 000). Novartis Corporation and itsUS affiliates also maintain various unfunded supplemental pensionplans to cover associates for amounts over and above the limitation.The defined-benefit pension plans are "closed plans"; new associ-ates participate in the US defined-contribution plan.
US Defined-Contribution PlansAssociates of a Group company located in the US generally are eligi-ble to participate in tax-qualified defined-contribution plans throughwhich they may contribute a portion of their annual compensation(subject to the annual limitation described above) and receive acompany match that is generally USD 1 for each USD 1 contributedby the participant. Associates can receive up to 6% of their basesalary and annual bonus as employer contributions.
In addition, certain Group companies in the US sponsor defined-contribution plans, with contributions ranging from 3% to 10% ofannual covered compensation. Associates who still accrue service
years in the US defined-benefit plan do not receive such companycontributions.
Novartis Corporation and its US subsidiaries also maintain var-ious unfunded supplemental defined-contribution plans to cover asso-ciates for amounts over and above the aforementioned limitation.
Healthcare PlansIn Switzerland, Novartis does not provide healthcare benefits to associates. In other countries, healthcare plans have been estab-lished in accordance with local market practices.
In the US, all Group companies offer associates healthcare bene-fits which provide for a company subsidy. Certain Group companiesalso provide contributory post-retirement medical programs which integrate with US government-provided Medicare for participantsover age 65.
Benefits to Senior ManagementThe members of the Executive Committee (with the exception ofMark C. Fishman) participate in the Swiss pension plans describedhereinbefore in the same manner as other associates.
The US defined-benefit pension formula that applies to Mark C.Fishman is a pension equity plan (PEP) formula as it applies to otherparticipating US associates. Benefits under the PEP formula arebased on (i) the associate’s highest average earnings for a five-calendar-year period during the last 10 calendar years of servicewith Novartis, and (ii) the associate’s accumulated PEP credits(expressed as a percentage of final average earnings, and rangingfrom 2% to 13% for each year of service based on the associate’sattained age in a particular year). Benefits accrued under the PEPplan are payable after retirement in the form of an annuity or a lumpsum. The US defined-contribution plan that applies to Mark C. Fishman is the same plan that applies to other participating USassociates; however, the aforementioned additional company contribution does not apply to him.
In 2006, a total of USD 308 000 was contributed to defined-benefit plans and USD 1 266 000 to defined-contribution plans forSenior Management members.
The pension benefits that have been accrued by Executive Committee members in the defined-benefit (DB) plans as of December 31, 2006, as well as the employer pension contributionsin 2006, are summarized in the table next page.The combined pension plans aim at a maximum target pensionannuity of 60% of CHF 774 000 (= CHF 464 400) per annum.
119863_Nova_000_000_web_e.qxp 24.1.2007 13:19 Uhr Seite 109

110
N O V A R T I S G R O U P B U S I N E S S R E V I E W
Allocation of Shares under the Leveraged Share Savings Plans
Recipients of bonus awards in 2001, respectively 2003, were invitedto invest their bonus in the Leveraged Share Savings Plan (five-yearplan) respectively ESOP (three-year plan). These plans matured in2006. Based on associates’ previous investments under these plansand the investments of the associates in the UK in 2006, the com-pany allocated 1 030 000 shares to 6 700 participants. From thetotal number of shares, 150 482 (14.6%) shares were issued toSenior Management. Members of the Executive Committee receivedthe following number of matching shares. The percentages indicatethe ratio by which they invested their past annual incentive in theLeverage Share Savings Plans: Daniel Vasella (107 360; 100%), UrsBaerlocher (8 600; 100%), Raymund Breu (12 880; 100%), Juergen Brokatzky-Geiger (860; 50%), Thomas Ebeling (11 600;100%) and Andreas Rummelt (2 920; 85%). Daniel Vasella, UrsBaerlocher and Raymund Breu have blocked all of these shares for10 years. The other Executive Committee members did not blockthese shares.
Ownership of Novartis Shares and Share Options by Senior Management
Ownership GuidelinesIn 2003, the Board adopted share ownership guidelines that tookeffect in December 2003 under which Executive Committee mem-bers and other nominated executives are required to own at least acertain multiple of their base salary in Novartis shares or vestedtradable options. The multiple equals five for the Chairman and
Number of Shares Owned Directly
or Indirectly
Daniel Vasella 1 466 129
Urs Baerlocher 265 939
Raymund Breu 313 020
Juergen Brokatzky-Geiger 52 333
Paul Choffat 61 757
Thomas Ebeling 173 205
Mark C. Fishman 148 550
Andreas Rummelt 151 563
Total 2 632 496
Chief Executive Officer, three for other Executive Committee mem-bers and one or two for other nominated executives. Executives havethree years from the date of nomination to comply with the minimalshare holding requirements. The first measurement date is December31, 2008. In the event of a substantial drop in the share price, theBoard may, at its discretion, extend the time period to reach the minimal shareholding requirement. Based on the year-end shareprice, most designated executives, including all Executive Commit-tee members, already complied with the share ownership guidelinesas of December 31, 2006.
Shares Owned by Senior ManagementThe total number of Novartis shares owned by the 15 executives whobelonged to Senior Management as of January 1, 2007, and by persons closely linked to them was 3 194 298. This implies an aver-age holding of 212 953 shares. “Persons closely linked to them” are(i) their spouse, (ii) their children below age 18, (iii) any legal enti-ties that they own or otherwise control, and (iv) any legal or natural person who is acting as their fiduciary. No member of SeniorManagement owned 1% or more of outstanding shares. As ofDecember 31, 2006, the individual ownership of Novartis shares ofExecutive Committee members (including persons closely linked tothem) was as follows:
Accrued Employer EmployerBenefit in Contributions Contributions
Currency DB Plans to DB plans to DC plans
Daniel Vasella CHF 83 351 18 632 122 100
Urs Baerlocher CHF 115 711 18 632 122 100
Raymund Breu CHF 103 944 18 632 122 100
Juergen Brokatzky-Geiger CHF 87 522 18 609 117 174
Paul Choffat CHF 95 736 18 609 122 100
Thomas Ebeling CHF 26 493 18 632 110 801
Mark C. Fishman USD 45 761 21 000 54 750
Andreas Rummelt CHF 84 232 18 609 110 801
DB - Defined benefit DC - Defined contribution
Executive Committee Pension Benefits
Options Owned by Senior Management The total number of Novartis share options owned by the 15 executives who belonged to Senior Management as of January 1,2007, and by persons closely linked to them was 5 677 639. This
119863_Nova_000_000_web_e.qxp 24.1.2007 13:19 Uhr Seite 110

111
0 2 | G R O U P R E V I E W 1 2 | O P E R AT I O N A L R E V I E W 5 6 | C O R P O R AT E C I T I Z E N S H I P 9 3 | C O R P O R AT E G O V E R N A N C E 1 2 7 | N O V A R T I S G R O U P F I N A N C I A L R E P O R T
Compensation, Benefits, Shareholdings
Loans, Severance Payments, Compensation to Former Members of Senior Management
No loans were granted by the Group to Senior Management during2006 or were outstanding as of December 31, 2006.
During 2006, two members of Senior Management receivedUSD 1 633 863 as severance upon the termination of their employ-ment with Novartis.
In 2006, total compensation of USD 741 795 was paid to fourformer members of Senior Management. Due to an investment ofpast bonus awards in the Leveraged Share Savings Plans, the invest-ed shares of one former member of Senior Management, werematched with 799 shares in 2006. The matched shares were not for-feited since he continues to be employed.
Non-Executive Director Compensation and Shareholdings
General Principles The Compensation Committee determines the compensation ofNon-Executive Directors. They receive an annual fee in an amountthat varies with the Board and committee responsibilities of eachDirector. They receive no additional fees for attending meetings oracting as committee chairs.
Directors can choose to receive the annual fee in cash, sharesor a combination of both. The conversion between cash and sharesis based on the share price at the predetermined grant date. Thegrant date (February 6, 2006) and related share price (CHF 71.30)are the same as under the Novartis Equity Plan “Select.” As of January 1, 2003, share options were no longer offered to Directors,nor were shares granted to Directors in acknowledgement of busi-ness performance. Directors are reimbursed for travel and other
necessary business expenses incurred in the performance of theirservices; the reimbursement of these expenses is not included in thecompensation figures reported aside. No loans were granted to Non-Executive Directors.
Compensation to Non-Executive Directors in 2006
Annual Cash SharesCompensation (CHF) (number)
Ulrich LehnerVice Chairman, Lead Director1
Chairman’s Committee (Member)Compensation Committee (Member)Audit and Compliance Committee (Chair)Corporate Governance and
Nomination Committee (Member) 656 250 5 523
Hans-Joerg RudloffVice ChairmanChairman’s Committee (Member)Compensation Committee (Chair)Audit and Compliance Committee (Member)Corporate Governance and Nomination
Committee (Member) 789 890 0
Birgit BreuelAudit and Compliance Committee (Member) 473 994 0
Peter Burckhardt 169 903 4 208
Srikant DatarAudit and Compliance Committee (Member) 298 125 2 131
William W. George Chairman’s Committee (Member) Compensation Committee (Member) Corporate Governance and Nomination
Committee (Chair) 375 000 3 156
Alexandre F. Jetzer2 13 911 4 909
Pierre LandoltCorporate Governance and Nomination
Committee (Member) 128 402 4 124
Andreas von PlantaAudit and Compliance Committee (Member) 360 766 1 578
Wendelin Wiedeking 112 490 3 608
Rolf M. Zinkernagel3
Corporate Governance and Nomination Committee (Member) 471 198 3 009
Total 3 849 929 32 246
1 Ulrich Lehner succeeded Helmut Sihler as Lead Director; Helmut Sihler retired from the Boardat the Annual General Meeting of February 28, 2006.
2 In addition, Alexandre F. Jetzer was compensated CHF 300 722 for other consulting services.3 Rolf M. Zinkernagel’s compensation includes CHF 250 000 for acting as the Board’s delegate to
the scientific advisory boards of the Genomics Institute of the Novartis Research Foundation(GNF) and the Novartis Institute for Tropical Diseases (NITD).
ExerciseGrant Options Held 1 Price Term LifeYear (number) (CHF) (years)
2006 905 424 71.30 10
2005 3 144 984 57.45 10
2004 736 301 57.45 10
2003 543 073 49.00 9
2002 281 977 62.00 9
1 Options granted under the Novartis Equity Plan “Select” are exercisable for one share each (1:1)
implies an average holding of 378 509 options. Broken down bygrant year since 2002, the numbers of options held are:
119863_Nova_000_000_web_e.qxp 24.1.2007 13:19 Uhr Seite 111

112
N O V A R T I S G R O U P B U S I N E S S R E V I E W
Ownership of Novartis Shares and Share Options by Non-Executive Directors Ownership GuidelinesUnder the share ownership guidelines, Non-Executive Directors arerequired to own at least 5 000 Novartis shares within three years afterjoining the Board. As of December 31, 2006, all Non-Executive Direc-tors who have served at least three years on the Board comply withthese share ownership guidelines.
Shares Owned by Non-Executive DirectorsAs of December 31, 2006, the individual ownership of Novartisshares by the Non-Executive Directors and persons closely linked tothem was as follows:
Number of SharesBeneficial Owner Owned Directly or Indirectly
Ulrich Lehner 16 788
Hans-Joerg Rudloff 109 791
Birgit Breuel 5 000
Peter Burckhardt 19 472
Srikant Datar 9 403
William W. George 118 865
Alexandre F. Jetzer 65 530
Pierre Landolt 15 670
Andreas von Planta 2 178
Wendelin Wiedeking 15 586
Rolf M. Zinkernagel 19 231
Total 397 514
The total number of Novartis shares owned as of December 31,2006, by the Non-Executive Directors and persons closely linked tothem was 397 514. This implies an average holding of 36 138shares. “Persons closely linked to them” are (i) their spouse, (ii) theirchildren below age 18, (iii) any legal entities that they own or oth-erwise control, or (iv) any legal or natural person who is acting astheir fiduciary. None of the Non-Executive Directors and personsclosely linked to them owned 1% or more of outstanding shares.
Options Owned by Non-Executive DirectorsAs of December 31, 2006, the Non-Executive Directors held a totalof 159 407 Novartis share options. The options held for the previ-ous five years are all from the grant year 2002 (the last year in whichshare options were granted to Directors) and have the following characteristics:
Grant Options Held 1 Exercise Price Term LifeYear (number) (CHF) (years)
2002 79 087 62.0 9
1 Options are exercisable for one share each (1:1)
Compensation to Former Non-Executive DirectorsIn 2006 an amount of USD 50 406 was paid to one former Non-Executive Director.
Auditors
Duration of the Mandate and Terms of Office of the Independent Auditors
Based on a recommendation by the Audit and Compliance Committee, the Board nominates an independent auditor for electionat the Annual General Meeting. PricewaterhouseCoopers (PwC)assumed its existing auditing mandate for Novartis in 1996. The leadauditors responsible for the mandate, Robert P. Muir and DanielSuter, began serving in their roles in 2005 and 2003, respectively.
Auditing and Additional Fees
PwC charged the following fees for professional services renderedfor the 12-month period ended December 31, 2006:
2006 2005USD 000 USD 000
Audit Services 19 785 20 129
Audit-Related Services 1 356 490
Tax Services 329 800
Other Services 344 22
Total 21 814 21 441
Audit Services are defined as the standard audit work that needsto be performed each year in order to issue opinions on the consol-idated financial statements of the Group, to issue opinions relating tomanagement’s assessment of internal controls over financial report-ing and the effectiveness of the Group’s internal controls over finan-cial reporting, and to issue reports on local statutory financial state-ments. Also included are services that can only be provided by theGroup auditor, such as auditing of nonrecurring transactions andimplementation of new accounting policies, audits of significant and
119863_Nova_000_000_web_e.qxp 24.1.2007 13:19 Uhr Seite 112

113
0 2 | G R O U P R E V I E W 1 2 | O P E R AT I O N A L R E V I E W 5 6 | C O R P O R AT E C I T I Z E N S H I P 9 3 | C O R P O R AT E G O V E R N A N C E 1 2 7 | N O V A R T I S G R O U P F I N A N C I A L R E P O R T
Auditors
newly implemented system controls, pre-issuance reviews of quar-terly financial results, consents and comfort letters and any otheraudit services required for US Securities and Exchange Commissionor other regulatory filings.
Audit-Related Services include those other assurance services pro-vided by the independent auditor but not restricted to those that canonly be provided by the auditor signing the audit report. They com-prise amounts for services such as acquisition due diligence andrelated audits, audits of pension and benefit plans, contractualaudits of third-party arrangements, assurance services on corporatecitizenship reporting, and consultation regarding new accountingpronouncements.
Tax Services represent tax compliance, tax returns, assistance withhistorical tax matters and other services.
Other Services include training in the finance area, benchmarkingstudies, assessment of certain non-financial processes and licensefees for use of accounting and other reporting guidance databases.
Supervisory and Control Instruments
Audit and Compliance CommitteeManagement is responsible for creating the financial statements andmanaging the reporting process. Further, Management is responsiblefor designing internal controls over financial reporting and asses-sing and reporting on the effectiveness of those internal controls.The Audit and Compliance Committee reviews financial reportingprocesses on behalf of the Board.
For each quarterly and annual release of financial information,the Disclosure Review Committee reviews the release for accuracyand completeness of the release’s disclosures. The DisclosureReview Committee is chaired by the Chief Financial Officer and isattended by the heads of Divisions, the heads of finance of Divisionsand the heads of the following Corporate Functions: Legal & TaxAffairs, Treasury, Financial Reporting & Accounting, Internal Auditand Investor Relations. The decisions taken by the Disclosure ReviewCommittee are reviewed by the Audit and Compliance Committeebefore publication of the financial release.
The Internal Audit function regularly carries out audits on oper-ations and processes and performs such other functions as areassigned to it by the Board of Directors, the Chairman and Chief
Executive Officer or the Audit and Compliance Committee. As a mat-ter of principle, all organizational units of the Group are subject toaudits from time to time. The Audit and Compliance Committeereviews regularly the internal audit scope, the audit plans and theresults of the internal audits.
As the independent auditor, PwC is responsible for expressingan opinion on the conformity of the audited financial statementswith International Financial Reporting Standards (“IFRS”) and com-pliance with Swiss law. Additionally, PwC is responsible for expressingan opinion on Management’s assessment of the effectiveness ofinternal control over financial reporting and for providing an opinionon the effectiveness of internal control over financial reporting.
The Audit and Compliance Committee is responsible for overseeing the conduct of these activities by Management and PwC.During 2006, the Audit and Compliance Committee held eight meetings. PwC was invited to all those meetings to attend duringthose agenda points that dealt with accounting, financial reportingor auditing matters and all matters of importance were discussed.PwC provided to the Audit and Compliance Committee the writtendisclosures required by US Independence Standards Board Standard No. 1 (Communications with Audit Committees), and theAudit and Compliance Committee and PwC have discussed PwC’sindependence from Novartis and Novartis Management.
Based on the reviews and discussions with Management andPwC referred to above, the Audit and Compliance Committee recommended to the Board, and the Board approved, inclusion ofthe audited financial statements in the Annual Report for the yearended December 31, 2006.
Policy on Pre-Approval of Audit and Non-Audit Services of Independent AuditorsThe Audit and Compliance Committee’s policy is to pre-approve allaudit and non-audit services provided by PwC. These services mayinclude audit services, audit-related services, tax services and otherservices, as described above. Pre-approval is detailed as to the particular service or categories of services, and is subject to a specific budget.
PwC and Management report, on a quarterly basis, to the Auditand Compliance Committee regarding the extent of services pro-vided in accordance with this pre-approval and the fees for the serv-ices performed to date on a quarterly basis. The Audit and Compli-ance Committee may also pre-approve additional services on acase-by-case basis.
119863_Nova_000_000_web_e.qxp 24.1.2007 13:19 Uhr Seite 113

114
N O V A R T I S G R O U P B U S I N E S S R E V I E W
Information and Communication Policy
Introduction
Novartis is committed to open and transparent communication withshareholders, investors, financial analysts, customers, suppliers andother interested parties. Material information pertaining to Novartisbusinesses is timely and broadly disseminated in a manner thatcomplies with obligations under the rules of both the SWX SwissExchange and the New York Stock Exchange. Novartis voluntarilycomplies with Regulation FD of the United States Securities andExchange Commission (SEC). Forward-looking statements, whichreflect Managment’s understanding of the situation and perform-ance as of the date of such statements, are made in an effort to helpstakeholders better understand the progress of Novartis businesses.
Information Materials
Each year a detailed Annual Report to shareholders is published,which provides information on the results and operations of Novartisbusinesses. The Annual Report also provides information on devel-opments in efforts regarding Corporate Citizenship, Health, Safetyand Environment and Human Resources. Central to the AnnualReport is one section entirely devoted to Corporate Governance andanother to the audited financial statements of the reported year.
Financial statements are prepared in accordance with Interna-tional Financial Reporting Standards (IFRS) and a bridging state-ment to US GAAP is provided. Apart from the Annual Report, anannual report on Form 20-F is also produced and filed with the SEC.
Since 2003, on a quarterly basis, results have been filed with theSEC on Form 6-K. Financial results releases are disseminated in thesame manner as press releases. The quarterly results press releas-es contain unaudited financial statements in accordance with IFRSand US GAAP.
Press releases are issued from time to time regarding develop-ments in various Novartis businesses and other activities in whichthey are involved. All releases are disseminated broadly and simul-taneously pursuant to the rules and regulations of the Swiss andNew York Stock Exchanges. Press releases relating to financialresults and material events are also filed with the SEC on Form 6-K.An archive containing Annual Reports to Shareholders, annual reportsto the SEC on Form 20-F, and quarterly results releases as well asrelated materials, such as slide presentations and conference call
webcasts, can be found on the Novartis Investor Relations website(www.novartis.com/investors). A press release archive is also main-tained on:
www.novartis.com/news/en/media.shtml
Information contained in all reports and releases is deemed correct and accurate at the time of release. Past releases are not updated to take into account changes in the marketplace or Novartis businesses.
Investor Relations Program
Novartis has an Investor Relations program which includes the following:• A full-year results presentation;• Investor events focusing on the Novartis R&D pipeline;• Themed events, covering areas of interest such as therapeutic
advances in medicine, pharmaceutical research or the genericsbusiness (Sandoz);
• One-on-one and group meetings with investors and analysts at aNovartis site or during roadshows at major financial centers;
• Conference calls for quarterly results or in conjunction withother press releases; and
• Presentations at broker-sponsored industry conferences.
These activities focus on recently announced activities or financialresults and are conducted in line with stock exchange disclosurerules and Regulation FD.
Presentations are regularly posted to the financial communityin an archive on the Novartis Investor Relations website, as audiowebcasts and/or PDF documents for slide presentations. These pre-sentations are not regularly updated, but reflect the developmentswithin Novartis over time.
Novartis Investor Relations is managed from the global head-quarters in Basel, Switzerland. A team of professionals is located inNew York to assist in coordinating responses to inquiries from theUS. Their contact details as well as an Investor Relations mailbox aremade available on the Novartis Investor Relations website
(www.novartis.com/investors).
On the Novartis website, you can also subscribe to the NovartisInvestor Relations e-mail distribution system.
119863_Nova_000_000_web_e.qxp 24.1.2007 13:19 Uhr Seite 114

115
0 2 | G R O U P R E V I E W 1 2 | O P E R AT I O N A L R E V I E W 5 6 | C O R P O R AT E C I T I Z E N S H I P 9 3 | C O R P O R AT E G O V E R N A N C E 1 2 7 | N O V A R T I S G R O U P F I N A N C I A L R E P O R T
left: Information and Communication Policyright: Performance Graph – Further Information
Performance Graph
This graph compares the total shareholder return of Novartis, theMorgan Stanley World Pharmaceuticals Index and the Swiss MarketIndex (SMI). The graph assumes an investment of CHF 100 in Novartisat the closing price on December 31, 1995, and an equal amountinvested in each of the indices.
Topic Location
SHARE CAPITALCapital Structure Articles of Incorporation of Novartis AG
(www.novartis.com/investors/en/corporate_governance)
Novartis Key Share Data http://www.novartis.com/investors/en/share_information/key_share_data.shtml
SHAREHOLDER RIGHTSInformation on the Novartis share and the shareholder’s participation rightsArticles of Incorporation of Novartis AG (www.novartis.com/investors/en/corporate_governance)
Investor Relation information: (www.novartis.com/investors)
BOARD OF DIRECTORS AND EXECUTIVE COMMITTEEInternal organization and allocation of responsibilities Board Regulations and Board Committee Charters
(www.novartis.com/investors/en/corporate_governance)
SENIOR MANAGEMENT Management Teamhttp://www.novartis.com/about_novartis/en/structure.shtml
NOVARTIS CODE FOR SENIOR FINANCIAL OFFICERS (http://www.novartis.com/investors/en/corporate_governance)
ADDITIONAL INFORMATIONSources for further information and anticipated key IR Calendarreporting dates in 2007 (http://www.novartis.com/investors/en/contact_us/ir_calendar.shtml)
Dec95
Dec96
Dec97
Dec98
Dec99
Dec00
Dec01
Dec02
Dec03
Dec04
Dec05
Dec06
Novartis Swiss market Index (SMI)
Morgan Stanley World Pharmaceuticals Index (MSWPI)
Dec Dec Dec Dec Dec Dec Dec Dec Dec Dec Dec Dec95 96 97 98 99 00 01 02 03 04 05 06
Novartis 100 147 244 281 247 317 269 230 260 270 330 338
SMI 100 122 197 228 245 268 215 158 191 201 273 319
MSWPI 100 142 221 292 302 380 334 229 237 219 261 279
Further Information
100
150
200
250
300
350
400
50
www_Nova_000_000_ih_e.qxp 28.2.2007 8:39 Uhr Seite 115
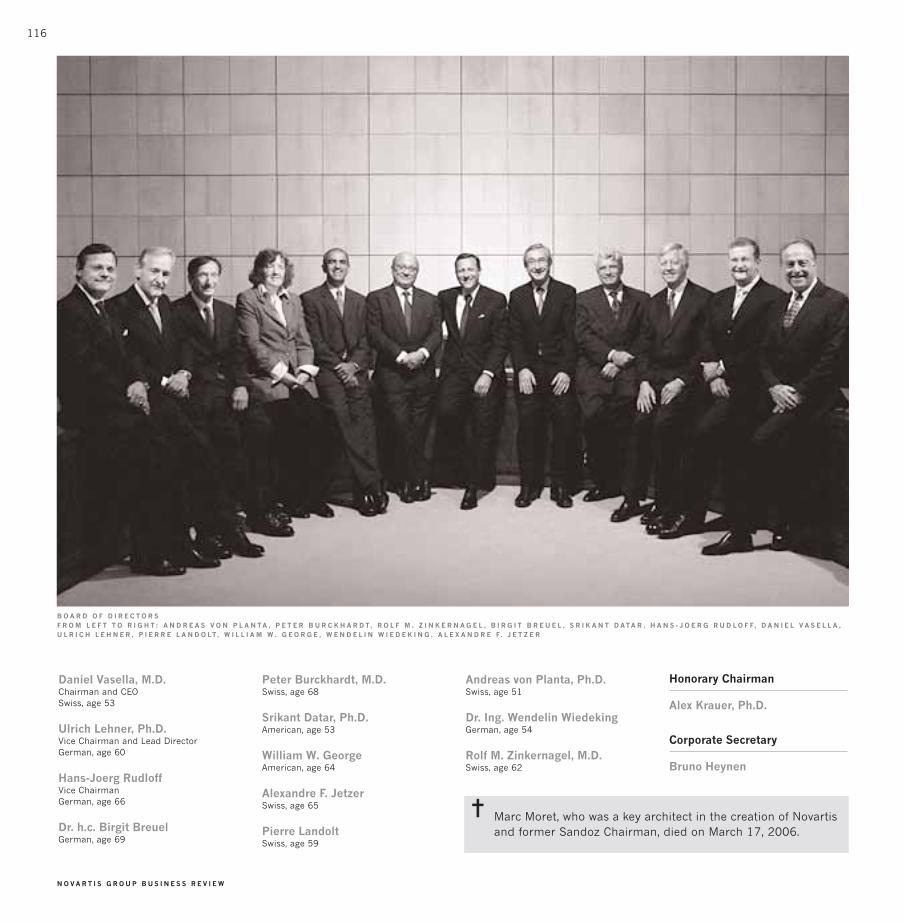
116
N O V A R T I S G R O U P B U S I N E S S R E V I E W
B O A R D O F D I R E C T O R SF R O M L E F T T O R I G H T : A N D R E A S V O N P L A N T A , P E T E R B U R C K H A R D T, R O L F M . Z I N K E R N A G E L , B I R G I T B R E U E L , S R I K A N T D A T A R , H A N S - J O E R G R U D L O F F, D A N I E L V A S E L L A ,U L R I C H L E H N E R , P I E R R E L A N D O LT , W I L L I A M W . G E O R G E , W E N D E L I N W I E D E K I N G , A L E X A N D R E F . J E T Z E R
Daniel Vasella, M.D.Chairman and CEOSwiss, age 53
Ulrich Lehner, Ph.D.Vice Chairman and Lead DirectorGerman, age 60
Hans-Joerg RudloffVice ChairmanGerman, age 66
Dr. h.c. Birgit BreuelGerman, age 69
Peter Burckhardt, M.D.Swiss, age 68
Srikant Datar, Ph.D.American, age 53
William W. GeorgeAmerican, age 64
Alexandre F. JetzerSwiss, age 65
Pierre LandoltSwiss, age 59
Andreas von Planta, Ph.D.Swiss, age 51
Dr. Ing. Wendelin WiedekingGerman, age 54
Rolf M. Zinkernagel, M.D.Swiss, age 62
Honorary Chairman
Alex Krauer, Ph.D.
Corporate Secretary
Bruno Heynen
Marc Moret, who was a key architect in the creation of Novartisand former Sandoz Chairman, died on March 17, 2006.
✝
119863_Nova_000_000_web_e.qxp 24.1.2007 13:19 Uhr Seite 116

117
0 2 | G R O U P R E V I E W 1 2 | O P E R AT I O N A L R E V I E W 5 6 | C O R P O R AT E C I T I Z E N S H I P 9 3 | C O R P O R AT E G O V E R N A N C E 1 2 7 | N O V A R T I S G R O U P F I N A N C I A L R E P O R T
Board of Directors
Daniel Vasella, M.D.Swiss, age 53
Function at Novartis AG Since 1996 Dr. Vasella hasserved as Chief Executive Officer of the Group and as executive member of the Board of Directors. In 1999, headditionally was appointed Chairman of the Board ofDirectors.
Activities in governing or supervisory bodies Dr. Vasellais also a member of the Board of Directors of Pepsico,Inc.*, United States, a member of the Board of Dean’sAdvisors at the Harvard Business School, and a memberof the INSEAD Board of Directors.
Professional background Dr. Vasella graduated with anM.D. from the University of Bern in 1979. After holding anumber of medical positions in Switzerland, he joinedSandoz Pharmaceuticals Corporation in the US in 1988.From 1993 to 1995, Dr. Vasella advanced from Head ofCorporate Marketing and Senior Vice President and Headof Worldwide Development to Chief Operating Officer ofSandoz Pharma Ltd. In 1995 and 1996, Dr. Vasella was amember of the Sandoz Group Executive Committee andChief Executive Officer of Sandoz Pharma Ltd. He receivedthe Harvard Business School’s Alumni Achievement Awardand the Appeal of Conscience Award as well as the AJ Con-gress Humanitarian Award and numerous other awards.Dr. Vasella was awarded an honorary doctorate by the Uni-versity of Basel. He has also been honored with the OrdemNacional do Cruzeiro do Sul (Brazil) and holds the rank ofChevalier in the Ordre National de la Légion d’honneur(France).
Permanent management or consultancy engagementsDr. Vasella is a member of the International Board of Governors of the Peres Center for Peace in Israel and amember of the International Business Leaders AdvisoryCouncil for the Mayor of Shanghai. He also serves as amember of several industry associations and educationalinstitutions.
Ulrich Lehner, Ph.D.German, age 60
Function at Novartis AG Ulrich Lehner was elected in2002 to the Board of Directors of Novartis AG. He becameVice Chairman and Lead Director in 2006 and is Chair-man of the Audit and Compliance Committee. He is amember of the Chairman’s Committee, the CompensationCommittee and the Corporate Governance and Nomina-tion Committee. The Board has appointed him as AuditCommittee Financial Expert. He qualifies as an independ-ent Non-Executive Director.
Activities in governing or supervisory bodies UlrichLehner is Chairman of the Management Board of HenkelKGaA, Germany. He also serves as a member of the Boardof Ecolab Inc.*, United States, as member of the supervisoryboard of E.ON AG* and of HSBC Trinkaus & BurkhardtKGaA*, both in Germany.
Professional background Ulrich Lehner studied busi-ness administration and mechanical engineering. From1975 to 1981, Ulrich Lehner was an auditor with KPMGDeutsche Treuhand-Gesellschaft AG in Duesseldorf. In1981, he joined Henkel KGaA. After heading the Control-ling Department of Fried. Krupp GmbH in Germany from1983 to 1986, he returned to Henkel as Finance Director.From 1991 to 1994, Ulrich Lehner headed the Manage-ment Holding Henkel Asia-Pacific Ltd. in Hong Kong. From1995 to 2000, he served as Executive Vice President,Finance/Logistics (CFO), of Henkel.
Hans-Joerg RudloffGerman, age 66
Function at Novartis AG Since 1996 Hans-Joerg Rudloffhas served as Vice Chairman. In 1999, he became a mem-ber of the Chairman’s Committee and the CompensationCommittee and since 2002 he has been a member of theCorporate Governance and Nomination Committee. Hequalifies as an independent, Non-Executive Director. Since2004 Hans-Joerg Rudloff has been a member of the Auditand Compliance Committee.
Activities in governing or supervisory bodies Hans-Joerg Rudloff joined Barclays Capital* in 1998, where heis presently Chairman. Hans-Joerg Rudloff also serves ona number of boards of other companies, including theBoards of Directors of the TBG Group (Thyssen-Borne-misza Group), Monaco, Marcuard Group, Geneva, RBC,Russia and ADB Consulting, Geneva, Switzerland. In 2005,Hans-Joerg Rudloff became Chairman of the Internation-al Capital Markets Association (ICMA) and is Chairman ofthe Compensation Committee of ICMA. In 2006, he joinedRosneft and became Chairman of the Audit Committeeand the Remuneration Committee. He also is the Chair-man of the Board of Bluebay Asset Management Ltd.
Professional background Hans-Joerg Rudloff studiedeconomics at the University of Bern and graduated in1965. He joined Credit Suisse in Geneva and moved toNew York in 1968 to join the investment banking firm ofKidder Peabody Inc. He was in charge of the Swiss oper-ation and was elected Chairman of Kidder Peabody Inter-national and a member of the Board of Kidder PeabodyInc. in 1978. In 1980 he joined Credit Suisse First Bostonand was elected Vice Chairman in 1983 and Chairmanand CEO in 1989. From 1986 to 1990, Hans-Joerg Rudloffwas also a member of the Executive Board of Credit Suissein Zurich in charge of all securities and capital marketdepartments. From 1994 to 1998 Hans-Joerg Rudloff wasChairman of MC-BBL in Luxembourg. In 1994, Hans-JoergRudloff was elected to the Board of Directors of Sandoz AG.
Permanent management or consultancy engagementsHans-Joerg Rudloff is a member of the Advisory Board ofthe MBA program of the University of Bern, Switzerland,of Landeskreditbank Baden-Wuerttemberg, Germany, andEnBW (Energie Baden-Wuerttemberg), Germany.
*Publicly listed companies
119863_Nova_000_000_web_e.qxp 24.1.2007 13:19 Uhr Seite 117

118
N O V A R T I S G R O U P B U S I N E S S R E V I E W
Dr. h.c. Birgit BreuelGerman, age 69
Function at Novartis AG Since 1996, Birgit Breuel hasserved as a Member of the Board. In 1999, she became amember of the Audit and Compliance Committee. Shequalifies as an independent, Non-Executive Director.
Professional background Birgit Breuel studied politicsat the Universities of Hamburg, Oxford and Geneva. Shewas Minister of Economy and Transport (1978–1986) andMinister of Finance (1986–1990) of Niedersachsen (LowerSaxony), the second-largest state of Germany. In 1990,Birgit Breuel was elected to the Executive Board of theTreuhandanstalt, which was responsible for the privatiza-tion of the former East Germany’s economy. In 1991, shealso became the President of the Treuhandanstalt. From1995 to 2000, she acted as the General Commissionerand CEO of the world exhibition EXPO 2000 in Hanover,Germany.
Peter Burckhardt, M.D.Swiss, age 68
Function at Novartis AG Dr. Burckhardt has been amember of the Board of Directors since 1996. He quali-fies as an independent, Non-Executive Director.
Activities in governing or supervisory bodies From1982 to 2004 Dr. Burckhardt has been the Chairman ofthe Novartis (formerly Sandoz) Foundation for BiomedicalResearch in Switzerland. Since 1982, Dr. Burckhardt hasbeen the Head of the Department of Internal Medicine atthe University Hospital of Lausanne, then chief of medicalservice A, until 2004.
Professional background Dr. Burckhardt is a Professorof Medicine and the former Chairman of the Departmentof Internal Medicine at the University Hospital of Lau-sanne, Switzerland. He has an M.D. from the University ofBasel and is a trained internal medicine and endocrinol-ogy specialist from the University of Lausanne and theMassachusetts General Hospital, Boston. In addition to his clinical activities, Dr. Burckhardt conducts clinicalresearch, mainly in bone diseases and calcium metabo-lism. He has authored more than 300 scientific publica-tions and is an editorial board member of several inter-national scientific journals. He was president of the SwissSociety of Internal Medicine, a member of the appeal com-mittee of the national agency for drug controls, Chairmanof National Societies and member of the Executive Com-mittee of the International Foundation of Osteoporosis,and treasurer until 2006. Other experiences compriseboard membership in several scientific societies includingthe Swiss Societies of Nutrition, Clinical Chemistry,Endocrinology, Bone and Mineral Research, the Commit-tee for Endocrinology of the European Community andadvisory roles to scientific foundations in Switzerland andGermany.
Permanent management or consultancy engagementsSince 1990, he has been the organizer and chairman ofthe International Symposia on Nutrition and Osteoporosis.
Srikant Datar, Ph.D.American, age 53
Function at Novartis AG Srikant Datar became a mem-ber of the Board in 2003. He qualifies as an independent,Non-Executive Director.
Activities in governing or supervisory bodies SrikantDatar is a member of the Board of ICF International, Fairfax, Virginia.
Professional background In 1973, Srikant Datar gradu-ated with distinction in mathematics and economics at theUniversity of Bombay. He is a Chartered Accountant andholds two masters degrees and a Ph.D. from Stanford Uni-versity. Srikant Datar has worked as an accountant andplanner in industry and as a professor at the Universitiesof Carnegie Mellon, Stanford and Harvard in the US. Hecurrently holds the Arthur Lowes Dickinson Professorshipat Harvard University. His research interests are in theareas of cost management, measurement of productivity,new product development, time-based competition, incen-tives and performance evaluation. He is the author ofmany scientific publications and has received several aca-demic awards and honors. Srikant Datar has advised andworked with numerous renowned firms such as GeneralMotors, Mellon Bank and Morgan Stanley in research,development and training.
Permanent management or consultancy engagementsSrikant Datar is Senior Associate Dean at the GraduateSchool of Business Administration of Harvard University,Boston, Massachusetts.
*publicly listed companies
119863_Nova_000_000_web_e.qxp 24.1.2007 13:19 Uhr Seite 118

119
0 2 | G R O U P R E V I E W 1 2 | O P E R AT I O N A L R E V I E W 5 6 | C O R P O R AT E C I T I Z E N S H I P 9 3 | C O R P O R AT E G O V E R N A N C E 1 2 7 | N O V A R T I S G R O U P F I N A N C I A L R E P O R T
Board of Directors
William W. GeorgeAmerican, age 64
Function at Novartis AG In 1999, William W. George waselected as a member of the Board of Directors. In 2000,he became a member of the Compensation Committee. In2001, he became a member of the Chairman’s Commit-tee and also the Chairman of the Corporate Governanceand Nomination Committee. He qualifies as an independ-ent, Non-Executive Director.
Activities in governing or supervisory bodies WilliamW. George is a member of the Boards of Directors of Gold-man Sachs* and Exxon Mobil*.
Professional background William W. George received hisBSIE from Georgia Institute of Technology in 1964 and hisMBA from Harvard University in 1966. From 1966 to1969, he worked in the US Department of Defense as spe-cial assistant to the Secretary of the Navy and as assistantto the Comptroller. After having served as President of Lit-ton Microwave Cooking Products, William W. George helda series of executive positions with Honeywell from 1978to 1989. Thereafter he served as President and ChiefOperating Officer of Medtronic, Inc. in Minneapolis, and,from 1991 to 2001, as its Chief Executive Officer. From1996 to 2002, he was Medtronic’s Chairman. He hasserved as Executive-in-Residence at Yale School of Man-agement and Professor of Leadership and Governance atIMD International in Lausanne, Switzerland.
Permanent management or consultancy engagementsWilliam W. George is Professor of Management Practice atHarvard Business School. In addition, he is a trustee of theCarnegie Endowment for International Peace and theWorld Economic Forum USA.
Alexandre F. JetzerSwiss, age 65
Function at Novartis AG Alexandre F. Jetzer has servedas a Director since 1996. He is a Non-Executive Director.
Activities in governing or supervisory bodies Alexan-dre F. Jetzer is also a member of the Board of Directors ofClariden Bank, Zurich, Switzerland, of the SupervisoryBoard of Compagnie Financière Michelin, Granges-Paccot(FR), Switzerland, and of the Board of the Lucerne Festi-val Foundation, Lucerne, Switzerland.
Professional background Alexandre F. Jetzer graduatedwith Masters of law and economics from the University ofNeuchâtel, Switzerland and is a licensed attorney. Afterserving as General Secretary of the Swiss Federation ofCommerce and Industry (Vorort) from 1967 on, AlexandreF. Jetzer joined Sandoz in 1980. In 1981 he was appoint-ed Member of the Sandoz Group Executive Committee inthe capacity of Chief Financial Officer (CFO) and, as of1990, as Head of Management Resources and Interna-tional Coordination. From 1995 to 1996, he was Chairmanand Chief Executive Officer of Sandoz PharmaceuticalsCorporation in East Hanover, New Jersey (US) and headditionally served as President and CEO of Sandoz Cor-poration in New York (NY). After the merger which creat-ed Novartis in 1996 until 1999, he was appointed as amember of the Executive Committee of Novartis and Headof International Coordination, Legal & Taxes.
Permanent management or consultancy engagementsAlexandre F. Jetzer has a consultancy agreement withNovartis International AG (Government Relations Sup-port). In addition he is a member of the International Advi-sory Panel (IAP) on Biotechnology Strategy of the PrimeMinister of Malaysia and a member of the DevelopmentCommittee of the Neuroscience Center of the Universityof Zurich, Switzerland.
Pierre LandoltSwiss, age 59
Function at Novartis AG Pierre Landolt has served as aDirector since 1996. He qualifies as an independent, Non-Executive Director.
Activities in governing or supervisory bodies PierreLandolt is President of the Sandoz Family Foundation,Glaris, Switzerland, Chairman of the Board of Directors ofEmasan AG, Basel, Switzerland, and of Vaucher Manufac-ture Fleurier SA, Fleurier, Switzerland. He is a member ofthe Board of Directors of Syngenta AG*, where he alsoserves as member of the Audit Committee, and of the Syn-genta Foundation for Sustainable Agriculture, both inBasel, Switzerland. In addition, Pierre Landolt is AssociatePartner of Banque Landolt & Cie, Lausanne, Switzerland,and Vice Chairman of the Board of Directors of Parmigiani Fleurier SA., Fleurier, Switzerland, and of the “Fondation du Montreux Jazz Festival,” Montreux,Switzerland.
Professional background Pierre Landolt graduated witha Bachelor of Law degree from the University of Paris-Assas. From 1974 to 1976, he worked for Sandoz BrazilSA. In 1977, he acquired an agricultural estate in the aridNortheast region of Brazil and transformed it into a modelfarm for organic and biotechnological development. Healso created an irrigation company, initially for his ownfarm and today active in the entire northern region ofBrazil. Since 1997, Pierre Landolt has been Associate andChairman of AxialPar Ltda, São Paulo, Brazil, an invest-ment company focussed on sustainable development. In2000, he co-founded EcoCarbone France, Paris, a com-pany active in the design and development of carbonsequestration processes in Asia, Africa, South America andEurope.
119863_Nova_000_000_web_e.qxp 24.1.2007 13:19 Uhr Seite 119

120
N O V A R T I S G R O U P B U S I N E S S R E V I E W
Andreas von Planta, Ph.D.Swiss, age 51
Function at Novartis AG In 2006, Andreas von Plantawas elected to the Board of Directors of Novartis AG. Hehas been a member of the Audit and Compliance Com-mittee since 2006. He qualifies as an independent, Non-Executive Director.
Activities in governing or supervisory bodies Andreasvon Planta is Vice Chairman of Holcim Ltd* and theSchweizerische National-Versicherungs-Gesellschaft AG*,and is a member of the boards of various Swiss sub-sidiaries of foreign companies.
Professional background Andreas von Planta holds lic.iur. and Ph.D. degrees from the University of Basel and anLL.M. from Columbia University School of Law, New York.He passed his bar examinations in Basel in 1982. Since1983, he has lived in Geneva, working for the law firmLenz & Staehelin where he became a partner in 1988. His areas of specialization include corporate law, corpo-rate finance, company reorganizations and mergers &acquisitions.
Permanent management or consultancy engagementsAndreas von Planta sits on the Board of Editors of theSwiss Review of Business Law, and is a former Chairmanof the Geneva Association of Business Law.
Dr. Ing. Wendelin WiedekingGerman, age 54
Function at Novartis AG Wendelin Wiedeking was elect-ed as a member of the Board in 2003. He qualifies as anindependent, Non-Executive Director.
Activities in governing or supervisory bodies WendelinWiedeking is Chairman of the Executive Board of Dr.-Ing.h.c. F. Porsche AG*, Germany.
Professional background Born in Ahlen, Germany, Mr.Wiedeking studied mechanical engineering and worked asa scientific assistant in the Machine Tool Laboratory of theRhine-Westphalian College of Advanced Technology inAachen. His professional career began in 1983 as Direc-tor’s Assistant in the Production and Materials Manage-ment area of Dr.-Ing. h.c. F. Porsche AG in Stuttgart-Zuf-fenhausen. In 1988, he moved to the Glyco Metall-WerkeKG in Wiesbaden as Division Manager, where he advancedby 1990 to the position of Chief Executive and Chairmanof the Board of Management of Glyco AG. In 1991, hereturned to Porsche AG as Production Director. A yearlater, the Supervisory Board appointed him spokesman ofthe Executive Board (CEO), and Chairman in 1993.
Rolf M. Zinkernagel, M.D.Swiss, age 62
Function at Novartis AG In 1999, Dr. Zinkernagel waselected to the Board of Directors of Novartis AG. He hasbeen a member of the Corporate Governance and Nomi-nation Committee since 2001. He qualifies as an inde-pendent, Non-Executive Director.
Professional background Dr. Zinkernagel graduatedfrom the University of Basel with an M.D. in 1970. Since1992 he has been Professor and Director of the Instituteof Experimental Immunology at the University of Zurich.Dr. Zinkernagel has received many awards and prizes forhis work and contribution to science, the most prestigiousbeing the Nobel Prize for Medicine which he was award-ed in 1996. Dr. Zinkernagel was a member of the Boardof Directors of Cytos Biotechnology AG*, Schlieren/Zurich,Switzerland until April 2003.
Permanent management or consultancy engagementsDr. Zinkernagel is a member of the Swiss Society of Aller-gy and Immunology, the American Associations of Immu-nologists and of Pathologists, the ENI European Networkof Immunological Institutions, and President of the Exec-utive Board of the International Union of ImmunologicalSocieties (IUIS). He is also a member of the Scientific Advi-sory Boards of: Bio-Alliance AG, Frankfurt, Germany;Aravis General Partner Ltd., Cayman Islands; Bioxell*,Milan, Italy; Esbatech, Zurich, Switzerland; Novimmune,Geneva, Switzerland; Miikana Therapeutics, Fremont CA(until January 2006); Nuvo Research* (until September2005: Dimethaid), Toronto, Canada; Humab, San Francis-co CA, US; xbiotech, Vancouver, Canada; ImVision, Han-nover, Germany; MannKind*, Sylmar CA, US; and Labora-toire Koch, Lausanne, Switzerland (since 2006). Dr.Zinkernagel is also a Science Consultant to: GenPat77,Berlin/Munich, Germany; Liponova*, Hannover, Germany;Solis Therapeutics, Palo Alto, US; Ganymed, Mainz, Ger-many; and Zhen-Ao Group, Dalian, China.
*Publicly listed companies
119863_Nova_000_000_web_e.qxp 24.1.2007 13:19 Uhr Seite 120

121
0 2 | G R O U P R E V I E W 1 2 | O P E R AT I O N A L R E V I E W 5 6 | C O R P O R AT E C I T I Z E N S H I P 9 3 | C O R P O R AT E G O V E R N A N C E 1 2 7 | N O V A R T I S G R O U P F I N A N C I A L R E P O R T
Board of Directors
R U S S I A N C H I L D R E N ’ S C L I N I C A L H O S P I T A L ; M O S C O W , R U S S I A
119863_Nova_000_000_web_e.qxp 24.1.2007 13:19 Uhr Seite 121
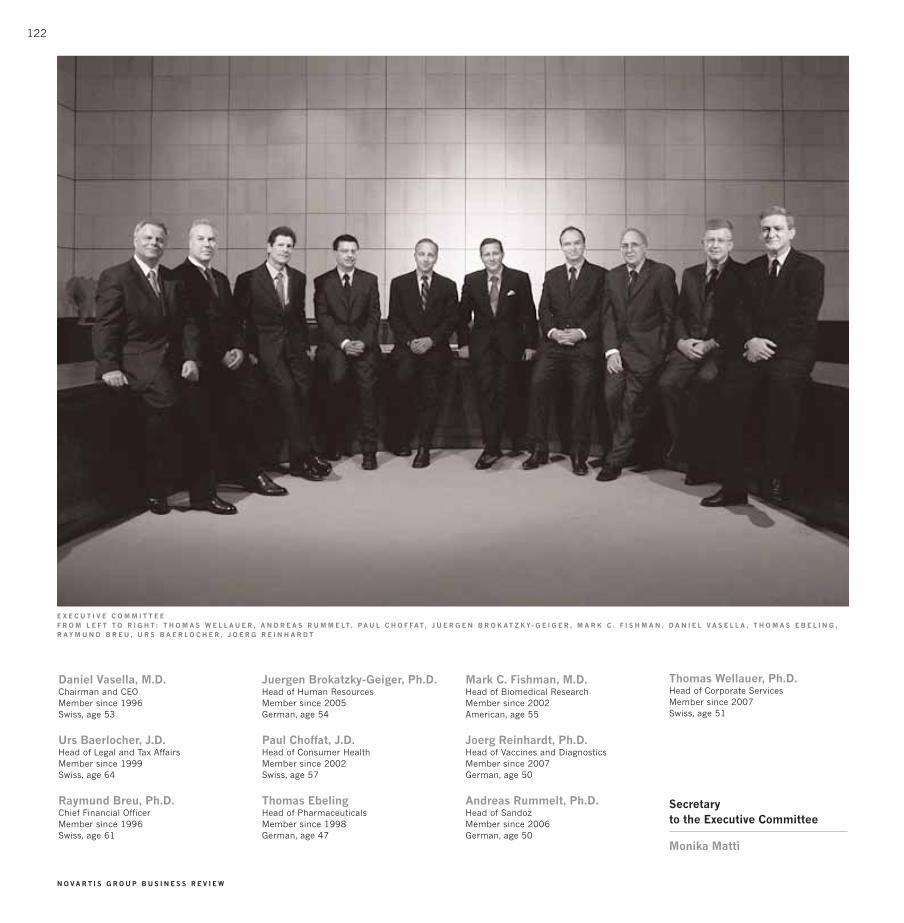
122
N O V A R T I S G R O U P B U S I N E S S R E V I E W
E X E C U T I V E C O M M I T T E EF R O M L E F T T O R I G H T : T H O M A S W E L L A U E R , A N D R E A S R U M M E LT , P A U L C H O F FA T , J U E R G E N B R O K A T Z K Y- G E I G E R , M A R K C . F I S H M A N , D A N I E L V A S E L L A , T H O M A S E B E L I N G ,R A Y M U N D B R E U , U R S B A E R L O C H E R , J O E R G R E I N H A R D T
Daniel Vasella, M.D.Chairman and CEOMember since 1996Swiss, age 53
Urs Baerlocher, J.D.Head of Legal and Tax AffairsMember since 1999Swiss, age 64
Raymund Breu, Ph.D.Chief Financial OfficerMember since 1996Swiss, age 61
Juergen Brokatzky-Geiger, Ph.D.Head of Human ResourcesMember since 2005German, age 54
Paul Choffat, J.D.Head of Consumer HealthMember since 2002Swiss, age 57
Thomas EbelingHead of PharmaceuticalsMember since 1998German, age 47
Mark C. Fishman, M.D.Head of Biomedical ResearchMember since 2002American, age 55
Joerg Reinhardt, Ph.D.Head of Vaccines and DiagnosticsMember since 2007German, age 50
Andreas Rummelt, Ph.D.Head of SandozMember since 2006German, age 50
Thomas Wellauer, Ph.D.Head of Corporate ServicesMember since 2007Swiss, age 51
Secretaryto the Executive Committee
Monika Matti
119863_Nova_000_000_web_e.qxp 24.1.2007 13:19 Uhr Seite 122
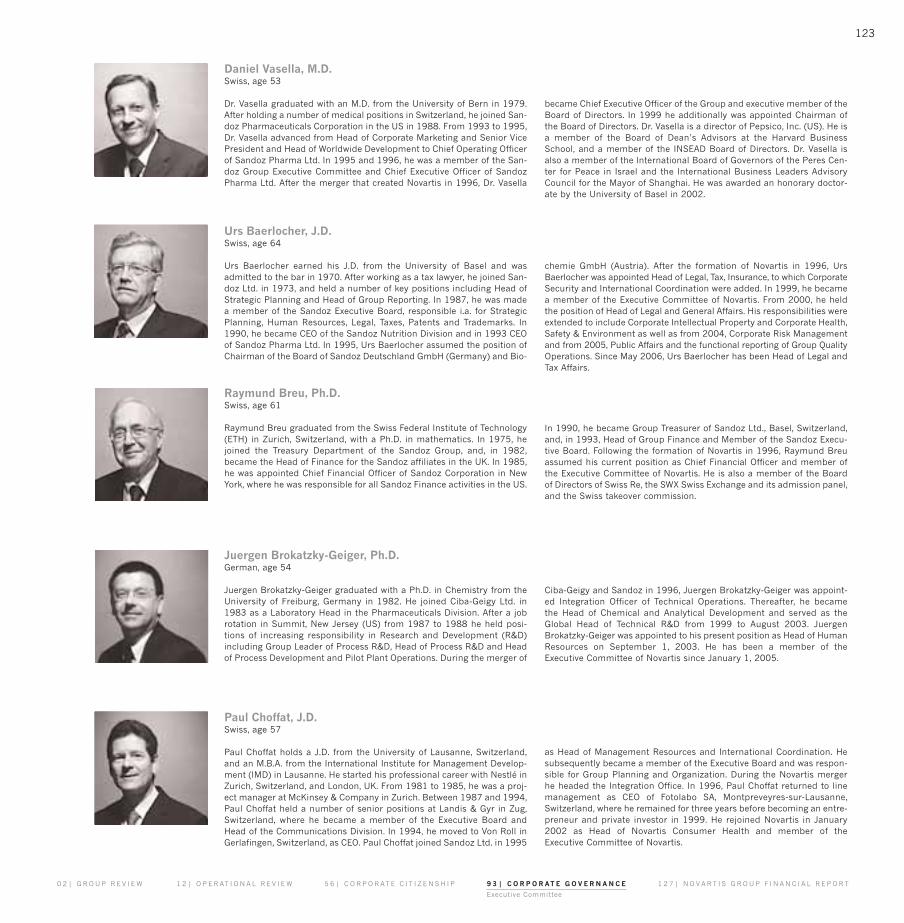
123
0 2 | G R O U P R E V I E W 1 2 | O P E R AT I O N A L R E V I E W 5 6 | C O R P O R AT E C I T I Z E N S H I P 9 3 | C O R P O R AT E G O V E R N A N C E 1 2 7 | N O V A R T I S G R O U P F I N A N C I A L R E P O R T
Executive Committee
Daniel Vasella, M.D. Swiss, age 53
Dr. Vasella graduated with an M.D. from the University of Bern in 1979.After holding a number of medical positions in Switzerland, he joined San-doz Pharmaceuticals Corporation in the US in 1988. From 1993 to 1995,Dr. Vasella advanced from Head of Corporate Marketing and Senior VicePresident and Head of Worldwide Development to Chief Operating Officerof Sandoz Pharma Ltd. In 1995 and 1996, he was a member of the San-doz Group Executive Committee and Chief Executive Officer of SandozPharma Ltd. After the merger that created Novartis in 1996, Dr. Vasella
became Chief Executive Officer of the Group and executive member of theBoard of Directors. In 1999 he additionally was appointed Chairman ofthe Board of Directors. Dr. Vasella is a director of Pepsico, Inc. (US). He isa member of the Board of Dean’s Advisors at the Harvard BusinessSchool, and a member of the INSEAD Board of Directors. Dr. Vasella isalso a member of the International Board of Governors of the Peres Cen-ter for Peace in Israel and the International Business Leaders AdvisoryCouncil for the Mayor of Shanghai. He was awarded an honorary doctor-ate by the University of Basel in 2002.
Urs Baerlocher, J.D. Swiss, age 64
Urs Baerlocher earned his J.D. from the University of Basel and wasadmitted to the bar in 1970. After working as a tax lawyer, he joined San-doz Ltd. in 1973, and held a number of key positions including Head ofStrategic Planning and Head of Group Reporting. In 1987, he was madea member of the Sandoz Executive Board, responsible i.a. for StrategicPlanning, Human Resources, Legal, Taxes, Patents and Trademarks. In1990, he became CEO of the Sandoz Nutrition Division and in 1993 CEOof Sandoz Pharma Ltd. In 1995, Urs Baerlocher assumed the position ofChairman of the Board of Sandoz Deutschland GmbH (Germany) and Bio-
chemie GmbH (Austria). After the formation of Novartis in 1996, Urs Baerlocher was appointed Head of Legal, Tax, Insurance, to which CorporateSecurity and International Coordination were added. In 1999, he becamea member of the Executive Committee of Novartis. From 2000, he heldthe position of Head of Legal and General Affairs. His responsibilities wereextended to include Corporate Intellectual Property and Corporate Health,Safety & Environment as well as from 2004, Corporate Risk Managementand from 2005, Public Affairs and the functional reporting of Group QualityOperations. Since May 2006, Urs Baerlocher has been Head of Legal andTax Affairs.
Raymund Breu, Ph.D. Swiss, age 61
Raymund Breu graduated from the Swiss Federal Institute of Technology(ETH) in Zurich, Switzerland, with a Ph.D. in mathematics. In 1975, hejoined the Treasury Department of the Sandoz Group, and, in 1982,became the Head of Finance for the Sandoz affiliates in the UK. In 1985,he was appointed Chief Financial Officer of Sandoz Corporation in NewYork, where he was responsible for all Sandoz Finance activities in the US.
In 1990, he became Group Treasurer of Sandoz Ltd., Basel, Switzerland,and, in 1993, Head of Group Finance and Member of the Sandoz Execu-tive Board. Following the formation of Novartis in 1996, Raymund Breuassumed his current position as Chief Financial Officer and member ofthe Executive Committee of Novartis. He is also a member of the Boardof Directors of Swiss Re, the SWX Swiss Exchange and its admission panel,and the Swiss takeover commission.
Juergen Brokatzky-Geiger, Ph.D.German, age 54
Juergen Brokatzky-Geiger graduated with a Ph.D. in Chemistry from theUniversity of Freiburg, Germany in 1982. He joined Ciba-Geigy Ltd. in1983 as a Laboratory Head in the Pharmaceuticals Division. After a jobrotation in Summit, New Jersey (US) from 1987 to 1988 he held posi-tions of increasing responsibility in Research and Development (R&D)including Group Leader of Process R&D, Head of Process R&D and Headof Process Development and Pilot Plant Operations. During the merger of
Ciba-Geigy and Sandoz in 1996, Juergen Brokatzky-Geiger was appoint-ed Integration Officer of Technical Operations. Thereafter, he became the Head of Chemical and Analytical Development and served as the Global Head of Technical R&D from 1999 to August 2003. JuergenBrokatzky-Geiger was appointed to his present position as Head of HumanResources on September 1, 2003. He has been a member of the Executive Committee of Novartis since January 1, 2005.
Paul Choffat, J.D.Swiss, age 57
Paul Choffat holds a J.D. from the University of Lausanne, Switzerland,and an M.B.A. from the International Institute for Management Develop-ment (IMD) in Lausanne. He started his professional career with Nestlé inZurich, Switzerland, and London, UK. From 1981 to 1985, he was a proj-ect manager at McKinsey & Company in Zurich. Between 1987 and 1994,Paul Choffat held a number of senior positions at Landis & Gyr in Zug,Switzerland, where he became a member of the Executive Board andHead of the Communications Division. In 1994, he moved to Von Roll inGerlafingen, Switzerland, as CEO. Paul Choffat joined Sandoz Ltd. in 1995
as Head of Management Resources and International Coordination. Hesubsequently became a member of the Executive Board and was respon-sible for Group Planning and Organization. During the Novartis mergerhe headed the Integration Office. In 1996, Paul Choffat returned to linemanagement as CEO of Fotolabo SA, Montpreveyres-sur-Lausanne,Switzerland, where he remained for three years before becoming an entre-preneur and private investor in 1999. He rejoined Novartis in January2002 as Head of Novartis Consumer Health and member of the Executive Committee of Novartis.
119863_Nova_000_000_web_e.qxp 24.1.2007 13:19 Uhr Seite 123

124
N O V A R T I S G R O U P B U S I N E S S R E V I E W
Mark C. Fishman, M.D.American, age 55
Dr. Fishman graduated with a B.A. from Yale College in 1972 and an M.D.from Harvard Medical School in 1976. He was appointed President of theNovartis Institutes for BioMedical Research (NIBR) in 2002. Before join-ing Novartis, Dr. Fishman was Chief of Cardiology and Director of the Car-diovascular Research Center at the Massachusetts General Hospital inBoston, Massachusetts. He continues to hold a professorship in theDepartment of Medicine at Harvard Medical School. Dr. Fishman serves
Joerg Reinhardt, Ph.D.German, age 50
Joerg Reinhardt graduated with a Ph.D. in Pharmaceutical Sciences fromthe University of Saarbruecken, Germany in 1981. In April 2006, hebecame CEO of the new Novartis Vaccines and Diagnostics Division thatcombines the vaccines and blood testing businesses of the former Chi-ron Corp. Previously, Joerg Reinhardt was Head of Development at theNovartis Pharmaceuticals Division, overseeing the company's clinical,pharmaceutical, chemical and biotechnological product development, aswell as drug safety assessment and regulatory affairs. Joerg Reinhardt
Andreas Rummelt, Ph.D.German, age 50
Andreas Rummelt graduated with a Ph.D. in Pharmaceutical Sciencesfrom the University of Erlangen-Nuernberg, Germany. He joined SandozPharma Ltd. in 1985 and held various positions in Development. From1985 to 1994, he served as a Laboratory Head, then Group Head, andfinally as Department Head in the area of Drug Delivery Systems. In 1994he was appointed Head of Worldwide Technical Research & Development,
Thomas Wellauer, Ph.D.Swiss, age 51
Thomas Wellauer graduated with a Ph.D. in Systems Engineering and anM.S. in Chemical Engineering from the Swiss Federal Institute of Tech-nology (ETH). He also holds a M.B.A. from the University of Zurich. ThomasWellauer joined Novartis in 2006 as Head of Corporate Services. He start-ed his career with McKinsey and Company, becoming a Partner in 1991and Senior Partner in 1996. In 1997, he was named CEO of the WinterthurInsurance Group, which later was acquired by Credit Suisse. At Credit
Thomas EbelingGerman, age 47
Thomas Ebeling graduated from the University of Hamburg, Germany witha degree in psychology. From 1987 to 1991, he held several positions ofincreasing responsibility at Reemstma Germany. In 1991, he joined Pepsi-Cola Germany as Marketing Director. He became Marketing Director forGermany and Austria in 1993, and was National Sales and FranchiseDirector for Pepsi’s retail and on-premise sales from 1994. He then servedas General Manager of Pepsi-Cola Germany. In 1997, Thomas Ebeling
on several editorial boards and has worked with national policy and sci-entific committees including those of the US National Institutes of Health(NIH) and the Wellcome Trust. He completed his Internal Medicine resi-dency, Chief residency, and Cardiology training at the Massachusetts Gen-eral Hospital. He has been honored with many awards and distinguishedlectureships, and is a member of the Institute of Medicine of the Nation-al Academies (US) and Fellow of the American Academy of Arts and Sciences.
joined Sandoz Pharma Ltd. in 1982 and held positions of increasingresponsibility in research and development for the company. In 1994, hewas made Head of Development for Sandoz Pharma Ltd. After the mergerthat created Novartis in 1996, Joerg Reinhardt became Head of PreclinicalDevelopment and Project Management for Novartis and assumed theposition of Head of Pharmaceutical Development in 1999. He chairs theBoard of Directors of the Genomics Institute of the Novartis Foundationin La Jolla, California. He has been a member of the Executive Committeeof Novartis since January 1, 2007.
a position he retained following the merger that created Novartis in 1996.From 1999 until October 2004, Andreas Rummelt served as Head of Tech-nical Operations of Novartis Pharma AG. He was appointed to his presentposition as CEO of Sandoz on November 1, 2004 and has been a mem-ber of the Executive Committee of Novartis since January 1, 2006.
Suisse he was a member of the Group Executive Board, initially respon-sible for the group's insurance business before becoming CEO of theFinancial Services Division. Most recently before joining Novartis, ThomasWellauer headed and completed the Clariant Performance ImprovementProgram, a global turnaround project at the specialty chemicals maker.He has been a member of the Executive Committee of Novartis since January 1, 2007.
joined Novartis as General Manager of Novartis Nutrition for Germany andAustria. After serving as CEO of Novartis Nutrition worldwide, he becameCEO of Novartis Consumer Health Division and Chief Operating Officer ofNovartis Pharma AG before attaining his present position in 2000. He hasbeen a member of the Board of Directors of Idenix Pharmaceuticals Inc.since 2003.
119863_Nova_000_000_web_e.qxp 24.1.2007 13:19 Uhr Seite 124

125
0 2 | G R O U P R E V I E W 1 2 | O P E R AT I O N A L R E V I E W 5 6 | C O R P O R AT E C I T I Z E N S H I P 9 3 | C O R P O R AT E G O V E R N A N C E 1 2 7 | N O V A R T I S G R O U P F I N A N C I A L R E P O R T
Executive CommitteeBusiness Unit Heads
Name, nationality and age Head of Business Unit Active for Novartis since Significant positions previously held Education
David Epstein American, 45
Larry Allgaier American, 48
George Gunn British, 56
Kurt T. Schmidt American, 49
Michael KehoeCanadian, 49
Oncology
OTC
Animal Health
Gerber
CIBA Vision
1989
2003
2003
2002
2006
Chief Operating Officer and member of the Executive Committeeof Novartis Pharmaceuticals Corporation
VP and General Manager, NorthAmerica Baby Care, for Procter &Gamble
President Animal Health, PharmaciaCorp.; Head Animal Health, US andRegion North America, for NovartisAnimal Health
Head, Novartis Animal Health Busi-ness Unit; Area Director Australasia,Kraft Foods; General Manager Foodfor Kraft Foods, Germany
President Global Oral Care for Procter & Gamble
Bachelor of Science, Pharmacy, Rutgers University, M.B.A., Columbia University
Bachelor of Science, Chemical Engineering, Christian Brothers University
Bachelor of Veterinary Medicine and Surgery from the Royal DickSchool of Veterinary Studies, Edinburgh, UK
Bachelor of Science, United StatesNaval Academy, Annapolis; M.B.A.,University of Chicago
Bachelor of Commerce, Queen’sUniversity, Kingston, Canada
Michael Kehoe succeeded Joseph Mallof, effective February 21, 2006
BUSINESS UNIT HEADS
119863_Nova_000_000_web_e.qxp 24.1.2007 13:19 Uhr Seite 125

126
N O V A R T I S G R O U P B U S I N E S S R E V I E W
M O S C O W , R U S S I A
119863_Nova_000_000_web_e.qxp 24.1.2007 13:19 Uhr Seite 126

127
0 2 | G R O U P R E V I E W 1 2 | O P E R AT I O N A L R E V I E W 5 6 | C O R P O R AT E C I T I Z E N S H I P 9 3 | C O R P O R AT E G O V E R N A N C E 1 2 7 | N O V A R T I S G R O U P F I N A N C I A L R E P O R T
Contents
NOVARTIS GROUP FINANCIAL REPORT 2006
NOVARTIS GROUP FINANCIAL REPORT 2006
Contents 127
Financial Highlights 128
Key Financial Developments 129
Operating and Financial Review 130
Summary of Financial Data 151
Equity Strategy and Share Information 153
Novartis Group Consolidated Financial Statements 156
including:Principal Group Subsidiaries and Associated Companies 208Reconciliation to US GAAP 210
Report of Novartis Management on Internal Control over Financial Reporting 221
Report of the Group Auditors on the Novartis Consolidated Financial Statements and Internal Control over Financial Reporting 222
Financial Statements of Novartis AG 224
Report of the Auditors on the Novartis AG Financial Statements 229
DATES/CONTACTS
Key dates 2007 230Contact addresses 231
CONTENTS
s_127-128_Finanz_Key.qxd 23.1.2007 16:00 Uhr Seite 127

128
N O V A R T I S G R O U P F I N A N C I A L R E P O R T
GROUP FINANCIAL HIGHLIGHTS 2006
GROUP KEY FIGURES
2006 2005 %USD millions USD millions Change
Net sales 37 020 32 212 15Operating income 8 174 6 905 18Net income 7 202 6 141 17Change in net liquidity -1 826 -4 558 -60Equity at year end 41 294 33 164 25Earnings per share (USD) 3.06 2.63 16Dividends per share (CHF)1 1.35 1.15 17
1 2006: Proposal to shareholders’ meeting
Pharmaceuticals
Sandoz
Consumer Health
Group
0 10 20 30
Net sales growth in USD Net sales growth in local currencies
NET SALES GROWTH1
(in %)
US
Europe
Asia/Australia/Africa
Rest of Americas
0 5 10 15 20
USD local currencies
GROUP NET SALES GROWTH BY REGION(in %)
Group
Pharmaceuticals Sandoz Consumer Health Group
OPERATING INCOME GROWTH1
(in %)
OPERATING MARGIN1
0 10 20 30
Pharmaceuticals Sandoz Consumer Health Group
Liquid funds
Other currentassets
Non-current assets
2005
TOTAL ASSETS TOTAL EQUITY & LIABILITIES
2006 2005 2006
USD68.0bn
USD57.7bn
USD68.0bn
USD57.7bn
12%
69%
19%
18%
63%
11%
28%
61%
Financial debts
Other liabilities
Equity
15%
28%
57%
19%
0 10 20 30 110 120
1 No comparisons available for newly acquired Vaccines and Diagnostics Division
1 No comparisons available for newly acquired Vaccines and Diagnostics Division.
Investment in property,plant and equipment1
0 3 000 6 000
CASH FLOW FROM OPERATING ACTIVITIES AND FREE CASH FLOW (in USD millions)
Investment in intangibleand financial assets1
Sale of long-term assets1
Dividends
Group free cash flow
9 000
Cash flow fromoperating activities1
2006 2005 1 Continuing operations
s_127-128_Finanz_Key.qxd 23.1.2007 16:00 Uhr Seite 128
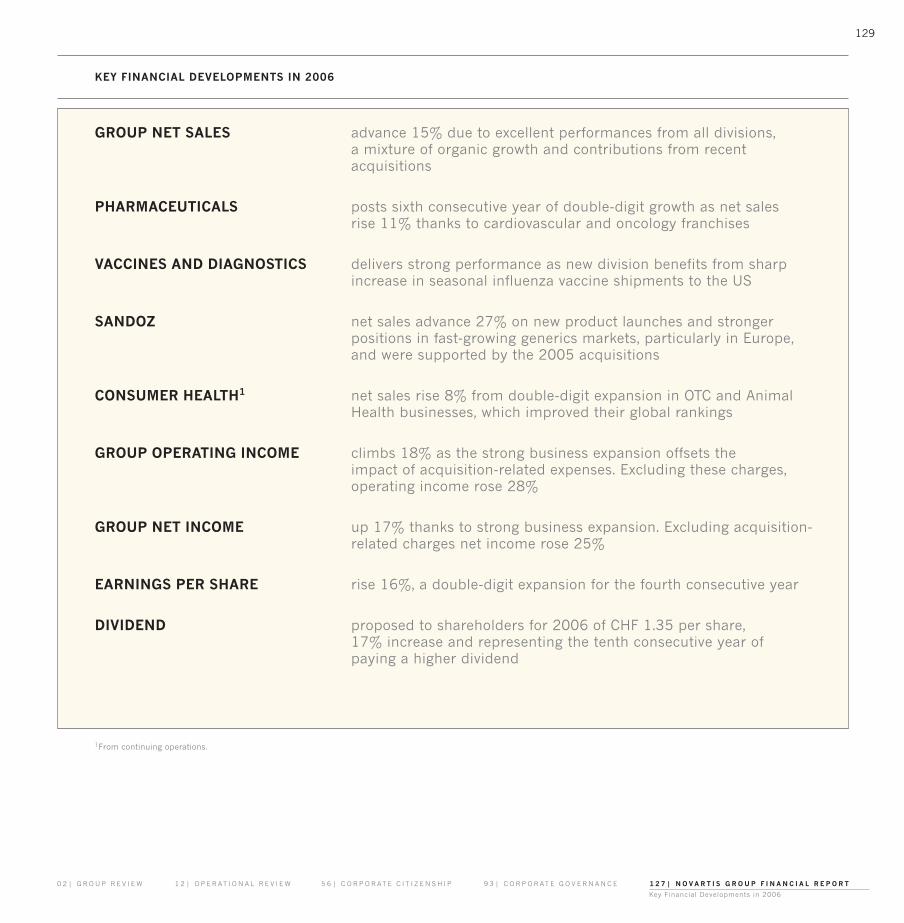
129
0 2 | G R O U P R E V I E W 1 2 | O P E R AT I O N A L R E V I E W 5 6 | C O R P O R AT E C I T I Z E N S H I P 9 3 | C O R P O R AT E G O V E R N A N C E 1 2 7 | N O V A R T I S G R O U P F I N A N C I A L R E P O R T
Key Financial Developments in 2006
GROUP NET SALES advance 15% due to excellent performances from all divisions, a mixture of organic growth and contributions from recent acquisitions
PHARMACEUTICALS posts sixth consecutive year of double-digit growth as net sales rise 11% thanks to cardiovascular and oncology franchises
VACCINES AND DIAGNOSTICS delivers strong performance as new division benefits from sharpincrease in seasonal influenza vaccine shipments to the US
SANDOZ net sales advance 27% on new product launches and stronger positions in fast-growing generics markets, particularly in Europe, and were supported by the 2005 acquisitions
CONSUMER HEALTH1 net sales rise 8% from double-digit expansion in OTC and AnimalHealth businesses, which improved their global rankings
GROUP OPERATING INCOME climbs 18% as the strong business expansion offsets the impact of acquisition-related expenses. Excluding these charges,operating income rose 28%
GROUP NET INCOME up 17% thanks to strong business expansion. Excluding acquisition-related charges net income rose 25%
EARNINGS PER SHARE rise 16%, a double-digit expansion for the fourth consecutive year
DIVIDEND proposed to shareholders for 2006 of CHF 1.35 per share, 17% increase and representing the tenth consecutive year of paying a higher dividend
KEY FINANCIAL DEVELOPMENTS IN 2006
1From continuing operations.
s_129-145_OFR_1.qxd 23.1.2007 16:01 Uhr Seite 129

130
N O V A R T I S G R O U P F I N A N C I A L R E P O R T
This operating and financial review should be read in conjunctionwith the consolidated financial statements. The consolidated finan-cial statements and the financial information discussed below havebeen prepared in accordance with International Financial ReportingStandards (IFRS). Please see Note 33 of the consolidated financialstatements for a discussion of the significant differences betweenIFRS and US Generally Accepted Accounting Principles (US GAAP).
Overview
Novartis is a world leader in offering medicines to protect health, treatdisease and improve well-being. The Group’s goal is to discover,develop and successfully market innovative products to treat patients,ease suffering and enhance quality of life. Novartis is the only com-pany with leadership positions in both patented and generic pharma-ceuticals as well as human vaccines and OTC products.
The Group’s businesses are divided on a worldwide basis intothe following four operating divisions:• Pharmaceuticals (brand-name patented pharmaceuticals)• Vaccines and Diagnostics (human vaccines and molecular
diagnostics)• Sandoz (generic pharmaceuticals)• Consumer Health (OTC, Animal Health, Gerber and CIBA Vision)
Vaccines and Diagnostics is a new Division formed in 2006 fol-lowing the acquisition of the remaining stake in Chiron Corporationnot already held by Novartis.
The Group’s Medical Nutrition Business Unit was previouslyincluded in the Consumer Health Division, but has been classified as a discontinuing operation as a consequence of an announcementduring 2006 to divest this Business Unit. The Nutrition & Santé activ-ity of this Business Unit which was divested in February 2006 hasalso been classified as a discontinuing operation.
In 2006, the Group’s businesses achieved net sales of USD 37.0billion (2005: USD 32.2 billion) and net income of USD 7.2 billion(2005: USD 6.1 billion). Approximately USD 5.4 billion was investedin Research & Development (2005: USD 4.8 billion).
Headquartered in Basel, Switzerland, the Group employs approx-imately 101 000 people and has operations in approximately 140countries around the world.
Factors affecting results of operations
There are a number of key factors that influence the Group’s resultsof operations and the development of its business.
The overall global healthcare market is growing rapidly, due to acombination of socio-economic factors, including aging populationsin many developed countries and rapid economic growth in manydeveloping countries, which is leading to a change in life-styles anda growing demand for better healthcare. At the same time, the Groupis operating in an ever more challenging competitive environmentand the healthcare industry is generally subject to significant ongo-ing pricing pressures. Widespread efforts by both governments andprivate stakeholders to control and reduce healthcare cost createparticular challenges for the Pharmaceuticals Division.
To address these challenges, Novartis has established severalstrategic growth platforms, both with brand-name patented medi-cines and beyond, including innovation-driven prescription medi-cines, cost-effective and high-quality generic medicines, leadingself-medication (OTC) brands and human vaccines. The Group hasinvested heavily into these strategic growth platforms in recentyears, including through the acquisitions of Chiron Corporation andNeuTec Pharma plc in 2006 and Hexal AG and Eon Labs, Inc., andthe North American Consumer Medicines Business of Bristol-MyersSquibb in 2005.
Patent protection and the exclusive right to sell certain productsin key markets are particularly important for the Pharmaceuticals Divi-sion. The loss of exclusivity with regard to one or more important prod-ucts (e.g. due to patent expiration, generic challenges or competitionfrom new branded products) can therefore have a significant negativeimpact on the results of operation of the Pharmaceuticals Division. Asa result, the Group’s ability to identify and develop new breakthroughproducts and to bring these products to market is particularly impor-tant for the Group’s long-term business prospects. To be able to meetthis challenge, Novartis has invested heavily in Research & Develop-ment and plans to continue to do so in the future. The loss of patentprotection for important products by competing pharmaceuticalscompanies, of course, can also create significant opportunities for theSandoz Division to market generic versions of such products.
Finally, Novartis is constantly exploring ways to improve produc-tivity across the Group, in particular to optimize its Marketing & Salesactivities in the Pharmaceuticals Division. The failure or success ofthese initiatives can have a significant impact on the Group’s over-all business success.
Novartis believes that these factors, which are described in moredetail below, will continue to be the principal drivers for the devel-opment of its business, its results of operations and its financial con-dition over the coming years.
OPERATING AND FINANCIAL REVIEW
s_129-145_OFR_1.qxd 23.1.2007 16:01 Uhr Seite 130

131
0 2 | G R O U P R E V I E W 1 2 | O P E R AT I O N A L R E V I E W 5 6 | C O R P O R AT E C I T I Z E N S H I P 9 3 | C O R P O R AT E G O V E R N A N C E 1 2 7 | N O V A R T I S G R O U P F I N A N C I A L R E P O R T
Operating and Financial Review
Rapidly Growing Global Healthcare Market
The global healthcare market is growing rapidly based on a combina-tion of many factors that include demographic changes and other socio-economic developments. The most important demographic change isthe increasingly aging population in developed countries and the factthat the incidence and prevalence of disease rises with age. Other keysocio-economic factors include the rising number of people with chron-ic diseases related to lifestyle changes (particularly hypertension anddiabetes) and the demand for better healthcare in many developingcountries which are currently witnessing rapid economic growth.
Novartis believes that there are a large number of currentlyuntreated patients worldwide that could benefit from the Group’sproducts, particularly from products marketed by key therapeuticareas of the Pharmaceuticals Division and are to treat patients withcardiovascular/metabolic diseases, cancer, conditions related to thecentral nervous system or respiratory illnesses. According to theAmerican Heart Association, for example, high blood pressure andits consequences affect one in four adults – more than a billion peo-ple worldwide – and kill more than seven million people every yearwhile, according to the American Diabetes Association, type 2 diabetescauses three million deaths annually in the US. Both diseases remainunder-diagnosed and insufficiently treated.
As a result of these and other factors, Novartis expects the over-all healthcare market and its own business to continue to grow overthe coming years, not only in developing countries, but also in theGroup’s key established markets such as the United States, WesternEurope and Japan, even if annual industry sales growth in theseestablished markets has slowed in recent years and is likely to con-tinue to slow further due to the pressure of healthcare payors toreduce costs. However, rapid economic growth in many emergingmarkets such as China, India, Russia and Turkey is expected toincreasingly support the global healthcare market. The overall eco-nomic expansion in these countries is leading to improvements inthe provision of public healthcare. In line with changes in the stan-dard of living and lifestyles, these countries are also experiencing anincreasing incidence of chronic diseases.
Group net sales, which increased 14% in 2006 in local curren-cies to USD 37.0 billion, were still driven mainly by growth in theUnited States and other developed markets. However, during thesame period, the Group’s combined net sales in its priority emerg-ing growth markets of China, India, Russia and Turkey rose at asharply higher rate of 25%. Although net sales in these four countriesonly accounted for 4% of total Group net sales in 2006, Novartisexpects these and other emerging markets to have an increasinglysignificant impact on the Group’s future business prospects andresults of operations.
Challenging Business Environment and On-going Pricing Pressures
While the overall healthcare market is growing, the competitive oper-ating environment is becoming ever more challenging, particularlyfor the Pharmaceuticals Division, as a result of a combination of fac-tors. These include industry-wide price reductions, government-man-dated reference prices, an increase in parallel imports, the shiftingof the payment burden to patients through higher co-payments andgrowing pressure on physicians to reduce the prescribing of patent-ed prescription medicines. The outcome has been widespread effortsby various stakeholders to reduce pharmaceutical product prices. Weexpect this trend to continue as governments and other interestedparties step up initiatives to reduce the overall cost of healthcare topatients, restrict the prescribing of new medicines, increase the useof generics and impose overall price cuts. One of the main reasonsfor these pressures is the cost associated with providing healthcareto an aging population. In addition to pricing pressures, there alsoappears to be a renewed focus on product safety by regulatoryagencies following widely publicized recent product recalls such asMerck & Co., Inc.’s recall of its pain medicine, Vioxx®.
At the same time, competition in the generic pharmaceuticalsindustry continues to intensify as companies in this industry are alsoaffected by efforts to curb healthcare spending. Novartis is the onlymajor pharmaceuticals company to have a leadership position inboth branded pharmaceuticals through its Pharmaceuticals Divisionas well as in generics through its Sandoz Division. Although the vol-ume of generic pharmaceuticals is growing, pressure is also increas-ing in some markets, particularly in Europe, to further reduce theprice of these medicines.
In addition, research-based pharmaceutical companies havetaken aggressive steps to counter the growth of the generics indus-try by selling their own branded products at sharply lower prices fol-lowing the expiry of patent protection, which reduces the attractive-ness of the generic versions. An important factor is that no significantregulatory approvals are required for a brand-name pharmaceuticalmanufacturer to sell directly or through a third party to the genericmarket. This is a significant competitive advantage for the brandedpharmaceutical company since, by doing so, the companies offeringthe branded pharmaceutical are able to undercut the generic man-ufacturers’ revenues and profitability. Certain brand-name pharma-ceutical companies are also continually seeking new ways to delaythe introduction of generics and to reduce the impact of genericcompetition. Pricing pressure as well as various efforts by competi-tors of the Sandoz Division have had, and likely will continue to have,a negative effect on this Division’s results of operations.
In the newly created Vaccines and Diagnostics Division, thedemand for some human vaccines is seasonal, such as for theinfluenza vaccine Fluvirin, while others are dependent upon birthrates in developed countries. Many of these products are also con-sidered to be commodities, meaning that there is little therapeuticdifference among the various vaccines offered by competitors. The
s_129-145_OFR_1.qxd 23.1.2007 16:01 Uhr Seite 131

132
N O V A R T I S G R O U P F I N A N C I A L R E P O R T
ability to develop effective and safe vaccines, to gain approval fornational immunization recommendation lists, and to consistentlyproduce and deliver the required vaccines in time for the relevantdisease season are critical to the success of this Division.
Investing in Strategic Growth Platforms
To address the various challenges facing the healthcare industry,Novartis has established and has been making significant invest-ments in a number of strategic growth platforms within all four of itsoperating Divisions. These strategic growth platforms include inno-vation-driven prescription medicines, cost-effective and high-qualitygeneric medicines, leading self-medication (OTC) brands and humanvaccines that address public health and therapeutic needs.
In the Pharmaceuticals Division, Novartis acquired the UK bio-pharmaceuticals company NeuTec Pharma plc in 2006, giving itaccess to Aurograb and Mycograb, two promising development com-pounds for the treatment of life-threatening infections. The Vac-cines and Diagnostics Division was created in April 2006 followingthe acquisition of the remaining stake in Chiron Corporation notheld by Novartis, providing access to the human vaccines market.In the Sandoz Division, Novartis acquired two generic pharmaceu-ticals companies (Hexal AG and Eon Labs, Inc.) in 2005, makingSandoz a global leader in generics with particular strengths in difficult-to-make generics and innovative product applications,including device technologies. In the Consumer Health Division, andalso in 2005, Novartis acquired the rights to various OTC productsin North America from Bristol-Myers Squibb Co. For more detailson these acquisitions and how they have affected the Group’sresults of operations see “Acquisitions” below.
Novartis expects these strategic growth platforms to play a sig-nificant role in the ongoing success of the Group, providing oppor-tunities for growth by offering a range of medicines and vaccines topatients, physicians and payors. Novartis will continue to evaluatepotential opportunities for additional targeted acquisitions to furtherstrengthen these platforms and to better position the Group for suc-cess in a dynamically changing healthcare market.
Loss of Exclusivity for Certain Products
The products of the Pharmaceuticals Division are generally protect-ed by patents that give Novartis the exclusive right to market themin various countries. These exclusive marketing rights are, however,limited both in terms of geographical scope and impacted by theexpiration of patents. For example, patents for the antifungal medi-cine Lamisil will expire in June 2007 in the US, where this productaccounted for USD 574 million in annual sales, or 1.6% of the netsales from continuing operations in 2006 (3.9% of the sales in US). Similarly, patent protection for Trileptal’s active ingredient hasexpired in the US and other major countries. In 2006, this productaccounted for USD 549 million in sales in the US, or 1.5% of the netsales from continuing operations (3.8% of the sales in US).
In the ordinary course of its business, Novartis (like other majorresearch-based pharmaceutical companies) defends its intellectualproperty against challenges by generic drug manufacturers. Patentinfringement actions have been initiated for a number of the Phar-maceutical Division’s products, including Neoral, Lotrel, Trileptal,Femara, Visudyne, Exelon and Famvir. Loss of exclusivity and the intro-duction of a generic version of the same medicine typically resultsin a significant and sharp reduction in net sales for the relevant prod-uct, given that generic manufacturers typically offer their versions ofthe same medicine at sharply lower prices. Some products that arestill among the top-20 selling products of Novartis have alreadyencountered generic competition in some markets, such as Lamisil,Neoral, Sandostatin SC and Voltaren. In addition, some of the Group’sproducts do, or may in the future, face intense competition in theform of new branded products with potentially better safety/effica-cy profiles or from generic versions of competing branded drugs indi-cated for treating the same diseases or indications.
Although Novartis has been rated by industry experts as havingone of the lowest rates of net sales at risk to potential generic compe-tition, a number of leading products could potentially face genericcompetition in the coming five to ten years in various markets, partic-ularly the US and Europe. These include the top-selling products ofNovartis: the anti-hypertension drugs Diovan and Lotrel as well as theoncology drugs Gleevec/Glivec and Zometa.
Importance of Research & Development and the ability to obtainapprovals for New Products
The ability of Novartis to continue to grow its business and toreplace any lost sales due to the loss of exclusivity for its productsin the future depends upon the ability of the Group’s R&D activi-ties to identify and develop high-potential breakthrough productsand to bring them to market.
Given that the development and regulatory approval for a newpharmaceutical product frequently takes more than 10 years andcan involve costs of over USD 1 billion, the need for efficient andproductive R&D activities is critical to the continued business
s_129-145_OFR_1.qxd 23.1.2007 16:01 Uhr Seite 132
133
0 2 | G R O U P R E V I E W 1 2 | O P E R AT I O N A L R E V I E W 5 6 | C O R P O R AT E C I T I Z E N S H I P 9 3 | C O R P O R AT E G O V E R N A N C E 1 2 7 | N O V A R T I S G R O U P F I N A N C I A L R E P O R T
Operating and Financial Review
success of Novartis. Competition in the development of new phar-maceuticals is intense since other pharmaceutical companies arealso searching for efficacious and cost-efficient medicines. Thesharply rising resource requirements to access the full range ofnew technologies, particularly following the decoding of the humangenome, has been one reason for industry consolidation as well asfor the increase in collaborations between major pharmaceuticalscompanies and specialized niche players at the forefront of theirparticular field.
The quality of the current Novartis Pharmaceuticals Divisiondevelopment pipeline reflects investments made in the Group’sown R&D activities, in many cases more than ten years ago, as wellas recent acquisitions and licensing collaborations. The Group hasconsistently had one of the highest R&D investment rates in theindustry as a percentage of net sales, reflecting its commitment tobring innovative and differentiated products to the market withnovel therapeutic benefits.
Up to one-third of annual Pharmaceuticals Division R&D expen-ditures are used to reach licensing agreements with other compa-nies, particularly specialized biotechnology companies, to co-developpromising pharmaceutical compounds. These co-development andalliance agreements are intended to allow the Group to capitalize onthe potential of these compounds and to expand its developmentpipeline. Novartis has entered into more than 100 alliances during2005 and 2006 to complement internal R&D activities. From time totime, Novartis also makes equity investments in a licensing partneror fully acquires a company to gain access to novel compounds, asin the case of the acquisition of NeuTec Pharma plc in 2006.
Funding requirements for R&D activities are likely to continueto grow in the future and may, at times, even grow at a faster ratethan net sales. These investments, however, are critical for thecontinuing success of Novartis. In 2006, Novartis invested a totalof USD 5.4 billion in Research & Development, an 11% increaseover 2005.
As a result of past investments, Novartis has been able to suc-cessfully launch a number of new products in 2006, particularlyExjade, Prexige and Xolair and there are a number of additional prod-uct launches are scheduled for 2007. Subject to obtaining necessaryregulatory approvals, Novartis is planning for multiple new productlaunches in the Pharmaceuticals Division in 2007–2008 and itexpects some of these products to generate peak annual sales of overUSD 1 billion. These products include Tekturna/Rasilez and Exforgefor hypertension, Galvus for type 2 diabetes, Tasigna for cancer andLucentis for blindness.
For further information see “Operational Review – Pharmaceuti-cals product pipeline”.
Technology is Driving Innovation
Ongoing technological discoveries and developments are laying thefoundation for both improvements upon existing therapies and forinnovative treatments for diseases where none currently exist.Novartis expects the growth in new technologies, particularly thosethat analyze data from the mapping of the human genome, to havea fundamental impact on the pharmaceutical industry and upon itsown future product pipeline, which in turn could have a significantimpact on the Group’s results of operations.
Continuing Efforts to Improve Productivity and to OptimizeMarketing & Sales Efforts
As a response to the increasingly challenging operating environmentfor the healthcare industry as well as to support the launch of newproducts and improve profitability margins, Novartis is constantlyexploring new ways to further improve productivity across the Group.The guiding principles of all productivity initiatives include inno-vation, cost savings, process excellence and accountability. In parti-cular, Novartis is constantly reviewing its global production networkto achieve efficiencies and to reduce production costs for importantproducts. In the Pharmaceuticals Division, for example, an initiativeis underway to reduce annual expenses by more than USD 1 billionwhen compared to a 2005 base by the end of 2008 through variousinitiatives that include streamlining and consolidating operations.Novartis will continue with its efforts to further improve productivitythroughout 2007 and beyond, with the objective of making the Groupmore efficient and effective.
As the costs involved in developing a new drug and in obtainingthe necessary regulatory approvals for marketing a new product continue to increase, and the time between innovative products and“me-too” versions or generic competition is continuing to decrease,the importance of effectively marketing a new or existing drug can-not be underestimated. A strong marketing message and rapid penetration of the potential market across different geographic territories are vital if a drug is to attain peak sales as rapidly as pos-sible and maximize the total revenue achievable over its patentedlife. It is therefore critical to the Group’s success that Novartis continually evaluates the appropriateness of its marketing modelsand optimizes its Marketing & Sales efforts, including by adjustingthe size of its sales force in key markets to address changingdemands (e.g. in anticipation of upcoming new product launches) orby responding to new developments such as the advent of direct-to-consumer advertising in the United States. As a result, Novartishas recently added approximately 1 000 new sales representativesin the United States to support the launch of new products.
s_129-145_OFR_1.qxd 23.1.2007 16:01 Uhr Seite 133

134
N O V A R T I S G R O U P F I N A N C I A L R E P O R T
IMPACT OF INTANGIBLE ASSET CHARGES AND SIGNIFICANT EXCEPTIONAL ITEMS
Vaccines andPharmaceuticals Diagnostics Sandoz
2006 2005 2006 2006 2005USD millions USD millions USD millions USD millions USD millions
Reported operating income 6 703 6 014 -26 736 342
Recurring amortization 268 178 172 279 189
Impairments 76 359 47 37
Intangible asset charges 344 537 172 326 226
Impairment charges on property, plant & equipment 3 7 14
Impact of increasing inventory acquired in business combinations to selling price less distribution margin 95 117 161
Restructuring and acquisition related integration costs 131 44 61 76
Exceptional restructuring and acquisition expenses 229 168 61 251
Exceptional gains/losses from divesting subsidiaries and major products -87 -231 7
Operating income excluding the above items 7 189 6 320 314 1 130 819
Acquisitions and Divestments
Novartis has made a number of significant acquisitions and divest-ments in recent years that have had, and are expected to continueto have, a significant impact on its financial condition and results of operations. In particular, the consolidation of Chiron Corporationfollowing its acquisition in April 2006 and the full-year consolidationof Hexal AG and Eon Labs, Inc. in 2006 following their acquisition in mid-2005 had a significant impact on the Group’s 2006 results ofoperations, as described in more detail below. Novartis will continueto evaluate potential opportunities for additional targeted acquisi-tions as well as divestments to better position the Group for successin a dynamically changing healthcare market. As a result of theGroup’s recent acquisitions, divestments and other factors, its oper-ating income is also increasingly impacted by charges for the amor-tization of intangible assets as well as impairment charges and otherone-time costs relating to the integration of acquisitions, as describedin more detail under “Impact of Intangible Asset Charges and Signif-icant Exceptional Items”.
Acquisitions in 2006 On April 19, 2006, the shareholders of Chiron Corporation approvedthe acquisition of the remaining 56% of the shares of Chiron Corporation that Novartis did not already own for USD 48.00 per
share. The amounts paid for the shares, related options of associ-ates and transaction costs totaled approximately USD 5.7 billion.The transaction was completed on April 20, 2006. For the periodfrom January 1, 2006 until completion of the acquisition, the 44%minority interest in Chiron held by Novartis has been accounted forusing the equity method. For the period after completion of theacquisition, Chiron has been fully consolidated with its identifiableassets and liabilities being revalued to their fair value at the date ofacquisition. In 2006, acquisition-related charges of USD 451 millionnet of tax were recorded for this transaction.
Following the acquisition, Novartis created the new Vaccines andDiagnostics Division that consists of Chiron’s human vaccines andmolecular diagnostics businesses. Chiron’s pharmaceuticals activi-ties have been integrated into the Pharmaceuticals Division, whileearly-stage research projects were integrated into the Pharmaceuti-cals Division research unit, the Novartis Institutes for BioMedicalResearch (NIBR). For the period following the acquisition up toDecember 31, 2006, the income statement and cash flows from Chi-ron’s pharmaceuticals activities have been consolidated into thePharmaceuticals Division’s results.
On July 14, 2006, Novartis announced that the majority of theshareholders of NeuTec Pharma plc (NeuTec), a biopharmaceuticalscompany specialized in hospital anti-infectives, had accepted itsoffer to acquire the company for GBP 10.50 per share. NeuTec has
Impact of Intangible Asset Charges and Significant Exceptional Items
As a result of recent acquisitions, divestments and other factors, the operating income of Novartis is increasingly impacted by the amorti-zation of intangible assets as well as impairment charges and exceptional costs relating to integration of acquisitions. The following showsoperating income excluding these factors.
s_129-145_OFR_1.qxd 23.1.2007 16:01 Uhr Seite 134

135
0 2 | G R O U P R E V I E W 1 2 | O P E R AT I O N A L R E V I E W 5 6 | C O R P O R AT E C I T I Z E N S H I P 9 3 | C O R P O R AT E G O V E R N A N C E 1 2 7 | N O V A R T I S G R O U P F I N A N C I A L R E P O R T
Operating and Financial Review
Consumer Health Consumer Healthcontinuing operations Corporate Total continuing operations discontinuing operations Total Group
2006 2005 2006 2005 2006 2005 2006 2005 2006 2005USD millions USD millions USD millions USD millions USD millions USD millions USD millions USD millions USD millions USD millions
1 068 952 -532 -506 7 949 6 802 225 103 8 174 6 905
107 81 8 12 834 460 21 21 855 481
3 5 126 401 126 401
110 81 8 17 960 861 21 21 981 882
1 11 14 11 14
212 161 21 212 182
236 76 19 236 95
1 459 251 40 459 291
-8 -80 -239 -129 -209 -239
1 179 1 025 -524 -489 9 288 7 675 117 164 9 405 7 839
been fully consolidated from this date. Novartis paid a total consid-eration of USD 606 million to acquire 100% of the shares of the com-pany. NeuTec had no post-acquisition sales, although its expenseshave been consolidated into the results of the Pharmaceuticals Divi-sion from the acquisition date.
In total for the whole Novartis Group, these acquisitions con-tributed USD 1.4 billion in net sales for 2006 and resulted in a USD242 million operating loss for the Group.
Divestments/discontinuing operations 2006During 2006 Novartis announced plans to divest the components ofits Medical Nutrition Business Unit, which was part of the ConsumerHealth Division.
On February 17, 2006, Novartis completed the sale of Nutrition &Santé for USD 211 million to ABN AMRO Capital France, resulting ina pre-tax divestment gain of USD 129 million.
On December 14, 2006, Novartis announced the signing of adefinitive agreement to divest the balance of the Medical NutritionBusiness Unit to Nestlé S.A., Switzerland for USD 2.5 billion. Thistransaction, which is subject to customary regulatory approvals, isexpected to be completed in the second half of 2007.
Both Nutrition & Santé and Medical Nutrition are disclosed asdiscontinuing operations in all periods in the Group’s consolidatedfinancial statements.
Acquisitions in 2005On June 6, 2005, Novartis completed the 100% acquisition of HexalAG for USD 5.3 billion in cash, with the results consolidated into theSandoz Division from that date. Goodwill on this transaction atDecember 31, 2006, amounted to USD 3.7 billion.
On July 20, 2005, Novartis completed the acquisition of 100%of Eon Labs, Inc. for USD 2.6 billion, with the results consolidatedinto the Sandoz Division from that date. Goodwill on this transactionat December 31, 2006, amounted to USD 1.8 billion.
On July 14, 2005, the OTC Business Unit announced the acqui-sition of the rights to produce and market a portfolio of over-the-counter (OTC) brands from Bristol-Myers Squibb sold principally inthe US for USD 660 million in cash. The closing date for the NorthAmerican product portfolio was August 31, 2005; that for the SouthAmerican portfolio, September 30, 2005 and for the Europe, MiddleEast and African portfolio, January 6, 2006 with the results consoli-dated into the OTC Business Unit of the Consumer Health Divisionfrom these dates.
s_129-145_OFR_1.qxd 23.1.2007 16:01 Uhr Seite 135

136
N O V A R T I S G R O U P F I N A N C I A L R E P O R T
Effects of currency fluctuations
Novartis transacts its business in many currencies other than the US dollar, its reporting currency. In 2006, 45% of Group net saleswere made in US dollars, 26% in euros, 6% in Japanese yens, 2%in Swiss francs and 21% in other currencies. During the same peri-od, 39% of Novartis Group expenses arose in US dollars, 24% ineuros, 16% in Swiss francs, 5% in Japanese yens and 16% in othercurrencies. As a result, the Group’s business is affected by fluctu-ations in the exchange rates between these different currencies.
Because Novartis prepares its financial statements in US dollars,fluctuations in the exchange rates between the US dollar and othercurrencies may have an effect both on the Group’s results of opera-tions and on the reported value of its assets, liabilities, revenue andexpenses as measured in US dollars, which in turn may significant-ly affect reported earnings (both positively and negatively) and thecomparability of period-to-period results of operations.
For purposes of the Group’s consolidated balance sheets,Novartis translates non-US dollar denominated equity items intoUS dollars at historical exchange rates and all other non-US dollardenominated assets and liabilities into US dollars at the exchangerates prevailing in the market as of the relevant balance sheet date.
For purposes of the Group’s consolidated income statements,non-US dollar revenue and expense items are translated into US dol-lars at average exchange rates prevailing during the relevant period.
Consequently, even if the amounts or values of these itemsremain unchanged in the respective currency, changes in exchangerates have an impact on the amounts or values of such items in theGroup’s consolidated financial statements.
Novartis seeks to minimize its currency exposure by engaging inhedging transactions where Management deems it appropriate to doso. For 2006, Novartis entered into various contracts that change in value as foreign exchange rates change to preserve the value ofassets, commitments and anticipated transactions. Novartis also usesforward contracts and foreign currency options to hedge certain antic-ipated net revenues in foreign currencies. For more information onhow these transactions affect the Group’s consolidated financialstatements and on how Novartis manages its foreign exchange rateexposure, see also “Derivative financial instruments and hedging”under Note 1 of the Group’s consolidated financial statements as wellas Notes 5 and 15.
The average exchange rates between the US dollar and otherimportant currencies for Novartis have remained relatively stableover the past two years as shown by the following table which setsforth the foreign exchange rates of the US dollar against the euro,the Swiss franc and the Japanese yen, respectively, that were usedfor foreign currency translation when preparing the Group’s consol-idated income statements.
2006 2005
Rates in units Average Averageper USD Year end for year Year end for year
EUR 1.317 1.256 1.186 1.245
CHF 0.819 0.798 0.762 0.804
JPY 0.841 0.860 0.851 0.910
As a result, currency fluctuations have not had a significant effect on the Group’s financial condition or results of operation over theperiods under review, as shown by the following tables:
CURRENCY IMPACT ON KEY FIGURES
Local LocalCurrencies Currencies USD USD
Growth in % Growth in % Growth in % Growth in %2006 2005 2006 2005
Group net sales 14 13 15 14
Group operating income 19 10 18 10
Group net income 18 10 17 10
NET SALES AND OPERATING EXPENSES BY CURRENCIES
Net sales % Net sales % Expenses % Expenses %2006 2005 2006 2005
USD 45 42 39 34
EUR 26 27 24 26
CHF 2 2 16 16
JPY 6 8 5 5
Other 21 21 16 19
100 100 100 100
LIQUID FUNDS AND FINANCIAL DEBT BY CURRENCIES
Liquid Liquid Financial Financialfunds % funds % debt % debt %
2006 2005 2006 2005
USD 61 62 15 13
EUR 19 15 44 41
CHF 15 20 14 24
JPY 23 18
Other 5 3 4 4
100 100 100 100
s_129-145_OFR_1.qxd 23.1.2007 16:01 Uhr Seite 136

137
0 2 | G R O U P R E V I E W 1 2 | O P E R AT I O N A L R E V I E W 5 6 | C O R P O R AT E C I T I Z E N S H I P 9 3 | C O R P O R AT E G O V E R N A N C E 1 2 7 | N O V A R T I S G R O U P F I N A N C I A L R E P O R T
Operating and Financial Review
Critical accounting policies and estimates
The Novartis Group’s principal accounting policies are set out in note1 of the Group’s consolidated financial statements and conform toInternational Financial Reporting Standards (IFRS). As a result of theuncertainties inherent in the Group’s business activities, Manage-ment needs to make certain estimates and assumptions that requireManagement to make difficult, subjective and complex judgments.Because of the uncertainties inherent in such judgments, actualoutcomes and results may differ from Management’s assumptionsand estimates. Application of the following accounting policiesrequires certain assumptions and estimates that have the potentialfor the most significant impact on the Group’s consolidated finan-cial statements.
Revenue
Novartis recognizes product sales when title and risks and rewardsfor the products are transferred to the customer, price is fixed anddeterminable, and collectability is reasonably assured. At the time ofsale, Novartis also records estimates for a variety of sales deductions,including rebates, discounts and incentives, and product returns.Sales deductions are reported as a reduction of revenue.
Deductions from RevenuesAs is typical in the pharmaceutical industry, the gross sales of Novartis are subject to various deductions, primarily comprised ofrebates and discounts to retail customers, government agencies,wholesalers and managed healthcare organizations. These deduc-tions represent estimates of the related obligations, requiring the useof judgment when estimating the impact of these sales deductionson gross sales for a reporting period. These adjustments are report-ed as a reduction of Gross Sales to arrive at Net Sales.
The following briefly describes the nature of each deductionand how the deduction is estimated. The US market has the mostcomplex arrangements related to revenue deductions. Specific reference is therefore made to the US market and where appli-cable to the Pharmaceuticals Division’s primary US operating unit,Novartis Pharmaceuticals Corporation (NPC). However, in a numberof countries outside the US, including major European countries,Novartis provides rebates to government entities. These rebates areoften legislatively mandated. • The US Medicaid program is a state government-administered
program that uses state and federal funds to provide assistanceto certain vulnerable and needy individuals and families. In 1990,the Medicaid Drug Rebate Program was established to reducestate and federal expenditures for prescription drugs. Under therebate program, certain Novartis subsidiaries have signed agree-ments to provide a rebate on drugs paid for by a state. Provisionsfor estimating Medicaid rebates are calculated using a combina-tion of historical experience, product and population growth,price increases, the impact of contracting strategies and specific
terms in the individual state agreements. These provisions are adjusted based upon established processes for re-filing data with individual states. For Medicaid, the calculation of rebates involves interpretation of relevant regulations, which are subjectto challenge or change in interpretative guidance by governmentauthorities. Since Medicaid rebate claims are typically submittedto Novartis up to six months after the products are dispensed to patients, any rebate adjustments may involve revisions of pro-visions for several periods.
• On January 1, 2006, an additional prescription drug benefit wasadded to the US Medicare program which funds healthcare ben-efits to individuals over the age of 65. Individuals that previouslyhad dual Medicaid/Medicare drug benefit eligibility had theirMedicaid prescription drug coverage replaced on January 1,2006, by the new Medicare Part D coverage, provided throughprivate prescription drug plans. The change led to a significantshift of plan participants between programs in which the US sub-sidiaries participate. Provisions for estimating Medicare Part Drebates are calculated using a combination of specific terms ofindividual plan agreements, product and population growth,price increases and the impact of contracting strategies.
• Novartis subsidiaries in the US participate in prescription drugsavings programs (industry and government sponsored) thatoffer savings to eligible patients. These savings vary based on apatient’s current drug coverage and personal income levels.Provisions for the subsidiaries’ obligations under these programsare based on historical experience, trend analysis and currentprogram terms. The introduction of Medicare Part D has reducedthe materiality of these programs.
• Wholesaler chargebacks relate to contractual arrangements that certain Novartis subsidiaries have with several indirect cus-tomers in the US to sell products at prices that are lower thanthe list price charged to wholesalers. A wholesaler chargebackrepresents the difference between the invoice price to thewholesaler and the indirect customer’s contract discount price.Provisions for estimating chargebacks are calculated using a combination of factors such as historical experience, productgrowth rates and the specific terms in each agreement. Wholesaler chargebacks are generally settled within one to three months of incurring the liability by reducing accountsreceivable.
• Customer rebates are offered to key managed healthcare plans,group purchasing organizations and other direct and indirectcustomers to sustain and increase Novartis product marketshare. These rebate programs provide that the customer receivesa rebate after attaining certain performance parameters relating to product purchases, formulary status and/or pre-establishedmarket share milestones relative to competitors. Since rebatesare contractually agreed upon, rebates are estimated based on the specific terms in each agreement, historical experience,anticipated reimbursement channel mix and product growthrates. Novartis considers the sales performance of products sub-
s_129-145_OFR_1.qxd 23.1.2007 16:01 Uhr Seite 137

138
N O V A R T I S G R O U P F I N A N C I A L R E P O R T
The following table shows the worldwide extent of revenue deductions, related payment experiences and provisions of Novartis:
PROVISIONS FOR REVENUE DEDUCTIONS
Income statement charge
Provisions offset Impact of Provisions offsetagainst gross trade translation and against gross trade
accounts receivable Provisions at business Payments/ Adjustments accounts receivable Provisions atat Jan 1, 2006 Jan 1, 2006 combinations utilizations of prior years Current year at Dec 31, 2006 Dec 31, 2006
USD millions USD millions USD millions USD millions USD millions USD millions USD millions USD millions
US Medicaid, Medicare and State programrebates and credits including prescription drug savings card 497 -643 -35 719 538
US managed healthcare rebates 256 -457 -5 441 235
Other healthcare plans and programs (non-US) rebates 35 6 -108 2 141 76
Chargebacks (including hospitals) 379 7 -2 340 -3 2 286 329
Direct customer discounts, cash discounts and other rebates 256 66 89 -989 -22 981 273 108
Sales returns and other deductions 408 43 -579 -13 612 471
Total 635 1 262 145 -5 116 -76 5 180 602 1 428
• During 2006, NPC finalized fee-for-service agreements with certain US pharmaceutical wholesalers. These agreements coveritems such as product returns, timing of payment, processing of chargebacks, provision of inventory data and the quantity ofinventory held by the respective wholesaler. These agreementsprovide a financial disincentive for wholesalers to purchasequantities of product in excess of what is necessary to meet current demand, and should help to create a more efficientpharmaceutical supply chain.
• Cash discounts are offered to customers in the US and certainother countries to encourage prompt payment. Cash discounts,which are typically 2% of gross sales in the US, are accrued at the time of invoicing and are recorded as revenue deductions.
• Shelf-stock adjustments are generally granted to customersbased on the existing inventory of a customer following de-creases in the invoice or contract price of the related product.Provisions for shelf-stock adjustments, which are primarily relevant within the Sandoz Division, are determined at the timeof the price decline or at the point of sale if a price decline is reasonably estimable and are based on estimated inventorylevels expected to be subject to price adjustments.
• Other sales discounts, such as consumer coupons and discountcards, are also offered. These discounts are recorded at the time of sale or when the coupon is issued and estimated utiliz-ing historical experience and the specific terms for eachprogram.
• Discounts, rebates or other deductions shown on the invoice are generally recorded directly as a reduction in the gross to netsales value and do not pass through the provision account.
ject to managed healthcare rebates and other contract discountsand adjusts the provision periodically to reflect actual experience.
• In order to evaluate the adequacy of ending provision balances,Novartis uses both internal and external estimates of the level of inventory in the distribution channel and the rebate claimsprocessing lag time. External data sources include periodicreports of wholesalers and third party market data purchased byNovartis. Management internally estimates the inventory level in the retail channel and in transit.
• Where a product with right of customer returns is sold, Novartisrecords a provision for estimated sales returns through a com-parison of historical return data to related sales. Other factorsare also considered, such as product recalls and, in the case ofNPC in the US, introductions of generic products. In the US,historical rates of return are utilized and are adjusted for knownor expected changes in the marketplace when appropriate. Salesreturns amount to approximately 1% of gross product sales.
• The policy of Novartis relating to the supply of pharmaceuticalproducts is to adjust shipping patterns in order to maintaincustomer inventories that are consistent with underlying patientdemand. A process exists in the US to monitor on a monthlybasis inventory levels at wholesalers based on gross sales volume,prescription volumes based on third party data and informationreceived from the key wholesalers. Based on this information, theNPC inventories on hand at wholesalers and other distributionchannels in the US are estimated to be approximately onemonth at December 31, 2006. Novartis believes the third partydata sources of information are sufficiently reliable, however, the accuracy of some data sources cannot be verified.
s_129-145_OFR_1.qxd 23.1.2007 16:01 Uhr Seite 138

139
0 2 | G R O U P R E V I E W 1 2 | O P E R AT I O N A L R E V I E W 5 6 | C O R P O R AT E C I T I Z E N S H I P 9 3 | C O R P O R AT E G O V E R N A N C E 1 2 7 | N O V A R T I S G R O U P F I N A N C I A L R E P O R T
Operating and Financial Review
GROSS TO NET SALES RECONCILIATION
Income statement charge
Charged directlyCharged through without being
revenue deduction recorded in revenueprovisions deduction provisions Total In % of In % of
2006 2006 2006 2006 2005USD millions USD millions USD millions gross sales gross sales
Group gross sales subject to deductions 44 844 100 100
US Medicaid, Medicare and State program rebates and credits including prescriptions drug savings card -684 -28 -712 -1.6 -2.0
US managed healthcare rebates -436 -436 -1.0 -1.3
Other healthcare plans and programs (non-US) rebates -143 -83 -226 -0.5 -0.2
Chargebacks (including hospitals) -2 283 -119 -2 402 -5.4 -4.6
Direct customer discounts, cash discounts and other rebates -960 -2 022 -2 982 -6.5 -5.9
Sales returns and other deductions -598 -468 -1 066 -2.4 -3.0
Total gross to net sales adjustments -5 104 -2 720 -7 824 -17.4 -17.0
Group net sales 37 020 82.6 83.0
Acquisition accounting
The Group’s consolidated financial statements and results of opera-tions reflect an acquired business after the completion of the acqui-sition. Acquired businesses are accounted for using the purchasemethod of accounting which requires that the assets acquired andliabilities assumed be recorded at the date of acquisition at theirrespective fair values. Any excess of the purchase price over the esti-mated fair values of the net assets acquired is recorded as goodwillin the balance sheet and is denominated in the local currency of therelated acquisition. Goodwill is allocated to operations using a con-cept which requires Management to define appropriate cash-gener-ating units. Under IFRS 3 Business Combinations, In-Process Research& Development (IPR&D) is valued as part of the process of allocatingthe purchase price in a new business combination. This amountneeds to be recorded separately from goodwill and is allocated tocash-generating units and must be assessed for impairment on anannual basis. Under IAS 38 (revised Intangible Assets), acquiredassets in development, such as those related to initial and milestonepayments on licensed or acquired compounds are capitalized asintangible assets, even if uncertainties exist as to whether the R&Dwill ultimately be successful in producing a saleable product. Thejudgments made in determining the estimated fair value assigned to each class of assets acquired and liabilities assumed, as well asasset lives, can materially impact the Group’s results of operations.Accordingly, for significant acquisitions, Novartis obtains assistancefrom third party valuation specialists. The valuations are based on information available at the acquisition date and are based onexpectations and assumptions that have been deemed reasonableby Management.
Impairment of long-lived assets
Long-lived assets, including identifiable intangible assets and goodwillare regularly reviewed for impairment, whenever events or changes incircumstance indicate that the balance sheet carrying amount of theasset may not be recoverable. In order to assess if there is any impair-ment, estimates are made of the future cash flows expected to resultfrom the use of the asset and its eventual disposal.
All goodwill is considered to have an indefinite life and is subjectto at least annual impairment testing. Any goodwill impairment chargeis recorded in the income statement under Other Income and Expenseand IPR&D must also be assessed for impairment on an annual basisand any impairment charge is recorded in Research & Developmentexpenses. Once a project included in IPR&D has been successfullydeveloped and is available for use, it is amortized over its useful lifeinto Cost of Goods Sold where any related impairment charge is alsorecorded. Other long-lived assets are reviewed when there is an indi-cation that an impairment may have occurred.
If the balance sheet carrying amount of the asset exceeds thehigher of its value in use to Novartis or its anticipated fair value lesscosts to sell, an impairment loss for the difference is recognized.There are several methods that can be used to determine the fairvalue of assets. For intangible assets, including IPR&D or productand marketing rights, Novartis typically uses the discounted cashflow method. This method starts with a forecast of all expectedfuture net cash flows. These cash flows are then adjusted to pres-ent value by applying an appropriate discount rate that reflects therisks and uncertainties associated with the forecasted cash flowstreams. Actual outcomes could vary significantly from the fore-casted future cash flows. The development of discounted future
s_129-145_OFR_1.qxd 23.1.2007 16:01 Uhr Seite 139

140
N O V A R T I S G R O U P F I N A N C I A L R E P O R T
cash flows, in particular for IPR&D, involves highly sensitive esti-mates and assumptions specific to the nature of the Group’s acti-vities with regard to:• the amount and timing of projected future cash flows; • the discount rate selected to measure the risks inherent in the
future cash flows;• the outcome of Research & Development activities (compound
efficacy, results of clinical trials, etc.);• the amount and timing of projected costs to develop the IPR&D
into commercially viable products;• the probability of obtaining regulatory approval;• long-term sales forecasts for periods of up to 20 years;• selling price erosion rates after the end of patent protection and
entry of generic competition; and• the behavior of competitors (launch of competing products,
marketing initiatives, etc.).
Factors that could result in shortened useful lives or impairmentinclude lower than anticipated sales for acquired products; or forsales associated with patents and trademarks; or lower than antici-pated future sales resulting from acquired Research & Development;or the closing of facilities; or changes in the planned use of proper-ty, plant or equipment. Changes in the discount rates used for thesecalculations also could lead to impairments.
Novartis has adopted a uniform method for assessing goodwill forimpairment and any other intangible asset indicated as possiblyimpaired. If no cash flow projections for the whole useful life of anintangible asset are available, cash flow projections for the next 5 yearsare utilized based on Management’s range of forecasts with a termi-nal value using sales projections usually in line or lower than inflationthereafter. Typically three probability-weighted scenarios are used.
The discount rates used are based on the Group’s weighted aver-age cost of capital adjusted for specific country and currency risksassociated with the cash flow projections. Since the cash flows alsotake into account tax expenses a post-tax discount rate is utilized.
The recoverable amount of a cash-generating unit and relatedgoodwill is usually based on the value-in-use which is derived fromapplying discounted future cash flows using the key assumptionsindicated below:
Vaccines and ConsumerPharmaceuticals Diagnostics Sandoz Health
% % % %
Sales growth rate assumptions afterforecast period 1 2 -1 to 6 -2 to 3
Discount rate 7 to 9 2 8 to 10 9 to 10
1Forecast period covers useful life2No value-in-use analysis performed as newly acquired and no indication of impairment
In 2006, impairment charges of USD 126 million were recorded,principally relating to capitalized milestone payments in NIBR andmarketed products in the Sandoz Division. In 2005, impairmentcharges of USD 401 million were recorded, principally relating tothe impairment of NKS 104 marketing rights in the Pharmaceuti-cals Division of USD 332 million and USD 37 million of IPR&D inthe Sandoz Division.
The amount of goodwill and other intangible assets on theGroup’s consolidated balance sheet has increased significantly inrecent years, primarily as a result of the Group’s recent acquisi-tions. Although Novartis does not currently have an indication ofany significant additional impairments, impairment testing underIFRS 3 may lead to further impairment charges in the future. Formore detail on the increasing impact of intangible asset charges onthe Group’s operating income as a result of recent acquisitions, see“Impact of Intangible Asset Charges and Significant ExceptionalItems” above.
Investments in associated companies
Novartis has investments in associated companies (defined as invest-ments in companies that correspond to holdings of between 20%and 50% of a company’s voting shares or over which it otherwisehas significant influence) accounted for by using the equity method.Due to the various estimates that have been made in applying theequity method, the amounts recorded in the consolidated financialstatements in respect to the investment in Roche Holding AG mayrequire adjustments in the following year after more financial andother information becomes publicly available.
Retirement and other post-employment benefit plans
The Novartis Group sponsors pension and other post-employmentbenefit plans in various forms covering associates who meet eligibil-ity requirements. These plans cover a significant portion of Groupassociates. Several statistical and other factors that attempt to antic-ipate future events are used in calculating the expense and liabilityrelated to the plans. These factors include assumptions about thediscount rate, expected return on plan assets and rate of future com-pensation increases, as determined by Management within certainguidelines. In addition, the Group’s actuarial consultants use statis-tical information such as withdrawal and mortality rates for their esti-mates. The actuarial assumptions used may differ materially fromactual results due to changing market and economic conditions,higher or lower withdrawal rates or longer or shorter life spans ofparticipants. The Group records differences between assumed andactual income and expense as gains or losses in the Statement ofRecognized Income and Expense. The differences could have a sig-nificant impact on the Group’s total equity. For more detail on theGroup’s obligations under retirement and other post-employmentbenefit plans and the underlying actuarial assumption, see note 26.1of the Group’s consolidated financial statements.
s_129-145_OFR_1.qxd 23.1.2007 16:01 Uhr Seite 140

141
0 2 | G R O U P R E V I E W 1 2 | O P E R AT I O N A L R E V I E W 5 6 | C O R P O R AT E C I T I Z E N S H I P 9 3 | C O R P O R AT E G O V E R N A N C E 1 2 7 | N O V A R T I S G R O U P F I N A N C I A L R E P O R T
Operating and Financial Review
Equity-based compensation
The fair value of Novartis shares, Novartis American DepositaryShares (ADS) and related options granted to associates as compen-sation is recognized as an expense. Novartis calculates the fair valueof the options at the grant date using the trinomial valuation method,which is a variant of the lattice binomial approach. Accurately meas-uring the value of share options granted to associates is difficult andrequires an estimate of certain factors that Novartis inputs into thevaluation model. The key factors involve an estimate of future uncer-tain events amongst others, the expected term of the option, theexpected share price volatility factor and the expected dividend yield.Shares and ADSs are valued using the market value on the grantdate. The amounts for options and other share-based compensationare charged to income over the relevant vesting or service periods,adjusted to reflect actual and expected levels of vesting. The chargefor share-based compensation is included in the personnel expens-es of the various subsidiaries where the associates are employed. Fordetailed information on Novartis’ equity-based compensation plansand on the assumptions on which the valuation of share optionsgranted to associates was based for 2006, see note 27 of the Group’sconsolidated financial statements.
Contingencies and environmental liabilities
A number of Novartis Group entities are involved in various intellec-tual property, product liability, commercial, employment and wrong-ful discharge, environmental and tax litigations and claims, govern-ment investigations and other legal proceedings arising out of thenormal conduct of their businesses. See note 19 of the Group’s con-solidated financial statements for further detail.
Novartis records accruals for contingencies when it is probablethat a liability has been incurred and the amount can be reasonablyestimated. These accruals are adjusted periodically as assessmentschange or additional information becomes available. For product lia-bility claims, a portion of the overall accrual is actuarially determinedand considers such factors as past experience, amount and numberof claims reported and estimates of claims incurred but not yetreported. Individually significant cases are provided for when prob-able and reasonably estimable. Legal defense costs expected to beincurred in connection with a loss contingency are accrued whenprobable and reasonably estimable.
Provisions for non-recurring environmental remediation costsare made when expenditure on remedial work is probable and thecost can be reliably estimated. Cost of future expenditure does notreflect any insurance or other claims or recoveries, as Novartis onlyrecognizes insurance or other recoveries at such time the amount isreasonably estimable and collection is virtually certain. Recurringremediation costs are provided under non-current liabilities and areestimated by calculating the discounted amounts of such annualcosts for the next 30 years.
Segment reporting
Novartis is divided on a worldwide basis into four operating divisions(Pharmaceuticals, Vaccines and Diagnostics, Sandoz, ConsumerHealth) and Corporate activities. The Group’s four operating divisionsare based on internal Management structures. They are managedseparately because they each manufacture, distribute and sell dis-tinct products that require differing marketing strategies.
Inter-divisional sales are made at amounts considered to approx-imate arm’s-length transactions. The accounting policies of the Divisions are the same as those of the Group. The Group principallyevaluates Divisional performance and allocates resources based onoperating income.
Pharmaceuticals Division
The Pharmaceuticals Division researches, develops, manufactures,distributes, and sells branded pharmaceuticals in the following ther-apeutic areas: cardiovascular and metabolism; oncology and hema-tology; neuroscience; respiratory and dermatology; infectious dis-eases, transplantation and immunology; arthritis, bone, gastrointesti-nal and urinary; and ophthalmics. The Pharmaceuticals Division isorganized into global business franchises responsible for the mar-keting of various products as well as a Business Unit called NovartisOncology responsible for the global development and marketing ofoncology products. The Oncology Business Unit is not required to beseparately disclosed as a segment, since it shares common long-term economic perspectives, customers, research, development, pro-duction, distribution and regulatory environments with the remain-der of the Pharmaceuticals Division. The Pharmaceuticals Division is the most important division of Novartis, accounting in 2006 forUSD 22.6 billion, or 61%, of Group net sales and for USD 6.7 billion,or 82%, of Group operating income.
Vaccines and Diagnostics Division
The Vaccines and Diagnostics Division is a new division focused on thedevelopment of preventive vaccine treatments and diagnostic tools. Itwas formed in April 2006 following the acquisition of the remainingstake in Chiron Corporation not already held by Novartis. The divisionhas two activities: Novartis Vaccines and Chiron. Novartis Vaccines isthe world’s fifth-largest vaccines manufacturer of vaccines and thesecond-largest supplier of influenza vaccines in the US. Key productsalso include meningococcal, pediatric and travel vaccines. Chiron is ablood testing and molecular diagnostics business dedicated to pre-venting the spread of infectious diseases through the development ofnovel blood-screening tools that protect the world’s blood supply. In2006, the Vaccines and Diagnostics Division accounted for USD 956million, or 3% of Group net sales, and produced a USD 26 millionoperating loss.
s_129-145_OFR_1.qxd 23.1.2007 16:01 Uhr Seite 141
142
N O V A R T I S G R O U P F I N A N C I A L R E P O R T
Sandoz Division
The Sandoz Division is a leading global generic pharmaceuticalscompany that develops, produces and markets drugs along withpharmaceutical and biotechnological active substances. ThroughSandoz, Novartis is the only major pharmaceutical company to haveleadership positions in both patented prescription drugs as well asgeneric pharmaceuticals. The Sandoz Division maintains a RetailGenerics activity and an Anti-Infectives activity. In Retail Generics,Sandoz develops and manufactures active ingredients and finisheddosage forms that are no longer covered by patents. Retail Genericsincludes the development and manufacture of biopharmaceuticals.Retail Generics also supplies certain active ingredients to third par-ties. In Anti-Infectives, Sandoz develops and manufactures off-patentactive pharmaceutical ingredients and intermediates, mainly antibi-otics, for internal use by Retail Generics and for sale to third-partycustomers. Sandoz offers some 840 compounds in over 5000 formsin 110 countries. The most important product groups include antibi-otics, treatments for central nervous system disorders, gastrointesti-nal medicines, cardiovascular treatments and hormone therapies.Sandoz is the Group’s third largest division, both in terms of Groupnet sales and operating income. In 2006, the Sandoz Divisionaccounted for USD 6.0 billion, or 16%, of Group net sales and forUSD 736 million, or 9%, of Group operating income.
Consumer Health Division
The Consumer Health Division consists of the following four Busi-ness Units: OTC (over-the-counter medicines), Animal Health, Gerberand CIBA Vision. Each has manufacturing, distribution and sellingcapabilities. However, none are material enough to the Group to beseparately disclosed as a segment. The OTC Business Unit coversover-the-counter self medications. The Animal Health Business Unitcovers veterinary products for farm and companion animals. TheGerber Business Unit covers foods as well as other products andservices designed to serve the particular needs of babies and infants.The CIBA Vision Business Unit covers contact lenses, lens care prod-ucts, and ophthalmic products.
The Medical Nutrition Business Unit was previously included inthe Consumer Health Division, but has been classified as a dis-continuing operation as a consequence of announcements during2006 to divest the activities of this Business Unit. For more detail,see “Factors Affecting Results of Operations – Acquisitions and Divest-ments” above. The Medical Nutrition Business Unit covers health andmedical nutrition products.
In 2006, the Consumer Health Division (excluding discontinuingoperations) was the Group’s second largest division, both in termsof Group net sales and operating income and accounted for USD 6.5billion, or 18%, of Group net sales and for USD 1.1 billion, or 13%,of Group operating income.
Corporate
Income and expenses relating to Corporate include the costs of theGroup headquarters and those of corporate coordination functionsin major countries. In addition, Corporate includes certain items ofincome and expense that are not attributable to specific Divisions.No allocation of Corporate items is usually made to the Divisions.
Factors affecting comparability ofyear-on-year results of operations
Recent Acquisitions and Divestments
The comparability of the year-on-year results of operations for theGroup was significantly affected by a number of significant acquisi-tions and divestments both during 2005 and 2006. For more detailon these acquisitions and divestments and how they have affectedthe Group’s results, see “Factors Affecting Results of Operations –Acquisitions and Divestments” and “Impact of Intangible AssetCharges and Significant Exceptional Items” above.
Divestment of Medical Nutrition Business Unit
The results of the Medical Nutrition Business Unit of the ConsumerHealth Division are reported as discontinuing operations for both2006 and 2005 in the Group’s consolidated financial statements. Asa result, the divestment of the Medical Nutrition Business Unit doesnot affect the comparability of year-on-year results of operation ona continuing operations basis, either for the Group or for the Con-sumer Health Division.
Currency Fluctuations
Despite movements in the exchange rate of the US dollar, the report-ing currency of Novartis, compared to major currencies, currencyfluctuations have not had a significant effect on the Group’s resultsof operations in 2006. For more information, see “Effects of Curren-cy Fluctuations” above.
s_129-145_OFR_1.qxd 23.1.2007 16:01 Uhr Seite 142
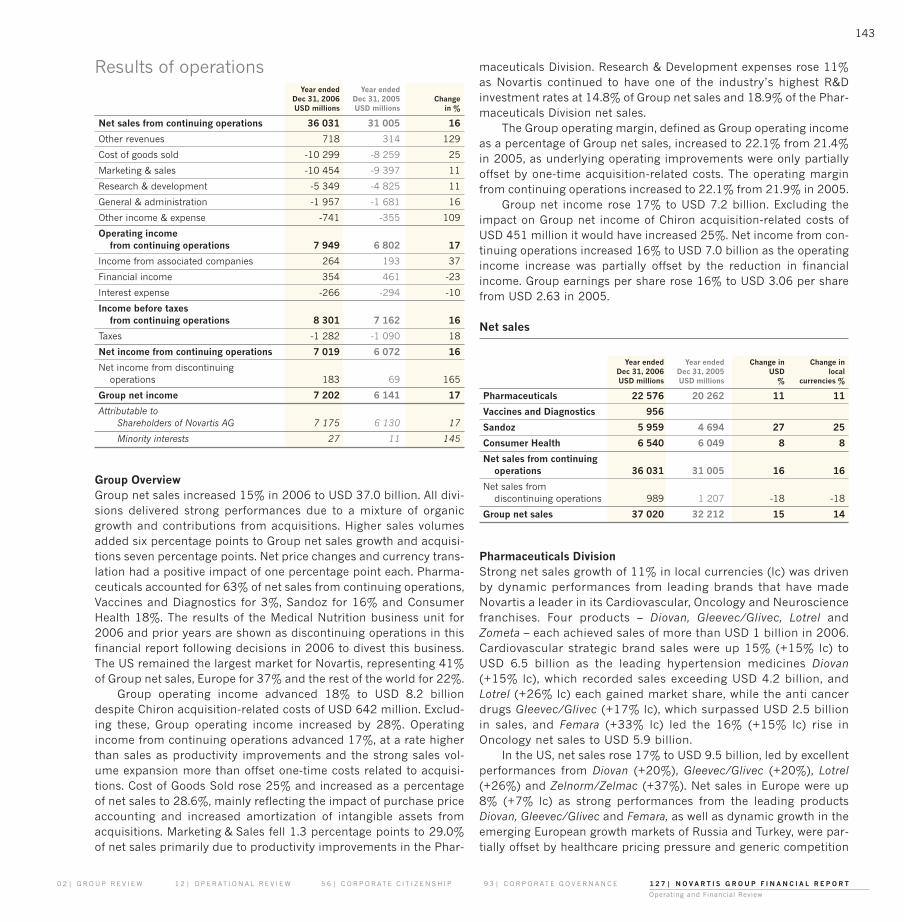
143
0 2 | G R O U P R E V I E W 1 2 | O P E R AT I O N A L R E V I E W 5 6 | C O R P O R AT E C I T I Z E N S H I P 9 3 | C O R P O R AT E G O V E R N A N C E 1 2 7 | N O V A R T I S G R O U P F I N A N C I A L R E P O R T
Operating and Financial Review
Results of operationsYear ended Year ended
Dec 31, 2006 Dec 31, 2005 ChangeUSD millions USD millions in %
Net sales from continuing operations 36 031 31 005 16
Other revenues 718 314 129
Cost of goods sold -10 299 -8 259 25
Marketing & sales -10 454 -9 397 11
Research & development -5 349 -4 825 11
General & administration -1 957 -1 681 16
Other income & expense -741 -355 109
Operating income from continuing operations 7 949 6 802 17
Income from associated companies 264 193 37
Financial income 354 461 -23
Interest expense -266 -294 -10
Income before taxesfrom continuing operations 8 301 7 162 16
Taxes -1 282 -1 090 18
Net income from continuing operations 7 019 6 072 16
Net income from discontinuing operations 183 69 165
Group net income 7 202 6 141 17
Attributable toShareholders of Novartis AG 7 175 6 130 17
Minority interests 27 11 145
Group Overview Group net sales increased 15% in 2006 to USD 37.0 billion. All divi-sions delivered strong performances due to a mixture of organicgrowth and contributions from acquisitions. Higher sales volumesadded six percentage points to Group net sales growth and acquisi-tions seven percentage points. Net price changes and currency trans-lation had a positive impact of one percentage point each. Pharma-ceuticals accounted for 63% of net sales from continuing operations,Vaccines and Diagnostics for 3%, Sandoz for 16% and ConsumerHealth 18%. The results of the Medical Nutrition business unit for2006 and prior years are shown as discontinuing operations in thisfinancial report following decisions in 2006 to divest this business.The US remained the largest market for Novartis, representing 41%of Group net sales, Europe for 37% and the rest of the world for 22%.
Group operating income advanced 18% to USD 8.2 billiondespite Chiron acquisition-related costs of USD 642 million. Exclud-ing these, Group operating income increased by 28%. Operatingincome from continuing operations advanced 17%, at a rate higherthan sales as productivity improvements and the strong sales vol-ume expansion more than offset one-time costs related to acquisi-tions. Cost of Goods Sold rose 25% and increased as a percentageof net sales to 28.6%, mainly reflecting the impact of purchase priceaccounting and increased amortization of intangible assets fromacquisitions. Marketing & Sales fell 1.3 percentage points to 29.0%of net sales primarily due to productivity improvements in the Phar-
maceuticals Division. Research & Development expenses rose 11%as Novartis continued to have one of the industry’s highest R&Dinvestment rates at 14.8% of Group net sales and 18.9% of the Phar-maceuticals Division net sales.
The Group operating margin, defined as Group operating incomeas a percentage of Group net sales, increased to 22.1% from 21.4%in 2005, as underlying operating improvements were only partiallyoffset by one-time acquisition-related costs. The operating marginfrom continuing operations increased to 22.1% from 21.9% in 2005.
Group net income rose 17% to USD 7.2 billion. Excluding theimpact on Group net income of Chiron acquisition-related costs ofUSD 451 million it would have increased 25%. Net income from con-tinuing operations increased 16% to USD 7.0 billion as the operatingincome increase was partially offset by the reduction in financialincome. Group earnings per share rose 16% to USD 3.06 per sharefrom USD 2.63 in 2005.
Net sales
Year ended Year ended Change in Change inDec 31, 2006 Dec 31, 2005 USD localUSD millions USD millions % currencies %
Pharmaceuticals 22 576 20 262 11 11
Vaccines and Diagnostics 956
Sandoz 5 959 4 694 27 25
Consumer Health 6 540 6 049 8 8
Net sales from continuing operations 36 031 31 005 16 16
Net sales from discontinuing operations 989 1 207 -18 -18
Group net sales 37 020 32 212 15 14
Pharmaceuticals DivisionStrong net sales growth of 11% in local currencies (lc) was drivenby dynamic performances from leading brands that have madeNovartis a leader in its Cardiovascular, Oncology and Neurosciencefranchises. Four products – Diovan, Gleevec/Glivec, Lotrel andZometa – each achieved sales of more than USD 1 billion in 2006.Cardiovascular strategic brand sales were up 15% (+15% lc) toUSD 6.5 billion as the leading hypertension medicines Diovan(+15% lc), which recorded sales exceeding USD 4.2 billion, andLotrel (+26% lc) each gained market share, while the anti cancerdrugs Gleevec/Glivec (+17% lc), which surpassed USD 2.5 billionin sales, and Femara (+33% lc) led the 16% (+15% lc) rise inOncology net sales to USD 5.9 billion.
In the US, net sales rose 17% to USD 9.5 billion, led by excellentperformances from Diovan (+20%), Gleevec/Glivec (+20%), Lotrel(+26%) and Zelnorm/Zelmac (+37%). Net sales in Europe were up8% (+7% lc) as strong performances from the leading productsDiovan, Gleevec/Glivec and Femara, as well as dynamic growth in theemerging European growth markets of Russia and Turkey, were par-tially offset by healthcare pricing pressure and generic competition
s_129-145_OFR_1.qxd 23.1.2007 16:01 Uhr Seite 143
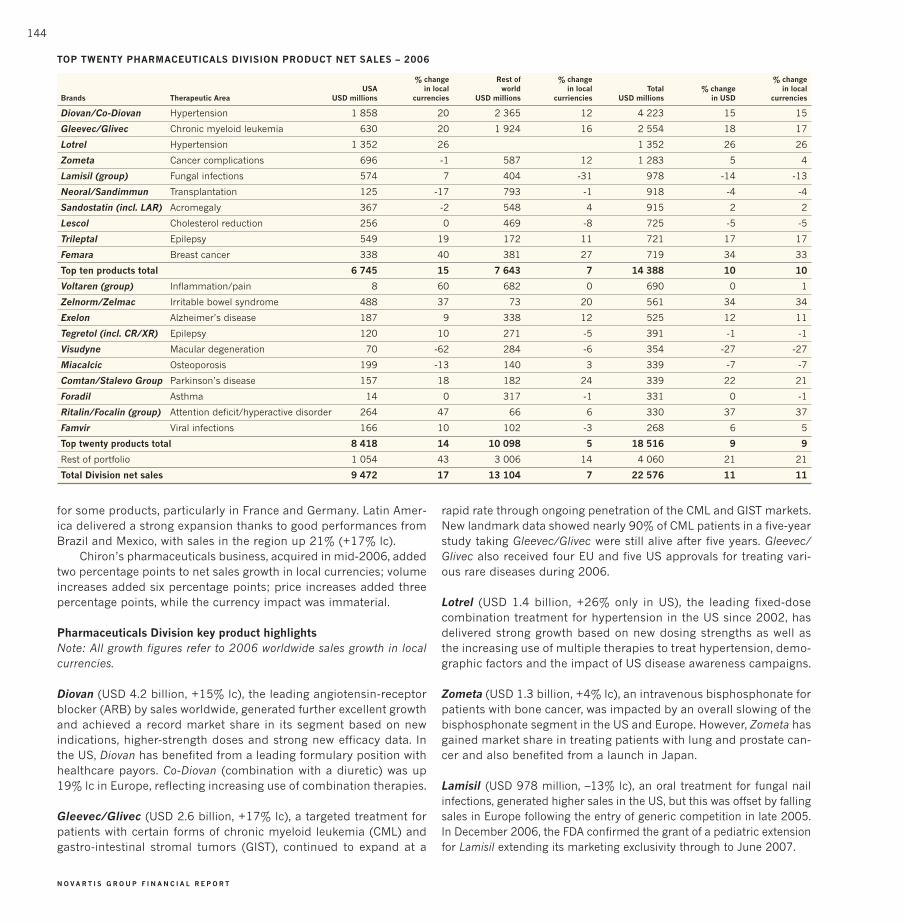
144
N O V A R T I S G R O U P F I N A N C I A L R E P O R T
TOP TWENTY PHARMACEUTICALS DIVISION PRODUCT NET SALES – 2006
% change Rest of % change % changeUSA in local world in local Total % change in local
Brands Therapeutic Area USD millions currencies USD millions curriencies USD millions in USD currencies
Diovan/Co-Diovan Hypertension 1 858 20 2 365 12 4 223 15 15
Gleevec/Glivec Chronic myeloid leukemia 630 20 1 924 16 2 554 18 17
Lotrel Hypertension 1 352 26 1 352 26 26
Zometa Cancer complications 696 -1 587 12 1 283 5 4
Lamisil (group) Fungal infections 574 7 404 -31 978 -14 -13
Neoral/Sandimmun Transplantation 125 -17 793 -1 918 -4 -4
Sandostatin (incl. LAR) Acromegaly 367 -2 548 4 915 2 2
Lescol Cholesterol reduction 256 0 469 -8 725 -5 -5
Trileptal Epilepsy 549 19 172 11 721 17 17
Femara Breast cancer 338 40 381 27 719 34 33
Top ten products total 6 745 15 7 643 7 14 388 10 10
Voltaren (group) Inflammation/pain 8 60 682 0 690 0 1
Zelnorm/Zelmac Irritable bowel syndrome 488 37 73 20 561 34 34
Exelon Alzheimer’s disease 187 9 338 12 525 12 11
Tegretol (incl. CR/XR) Epilepsy 120 10 271 -5 391 -1 -1
Visudyne Macular degeneration 70 -62 284 -6 354 -27 -27
Miacalcic Osteoporosis 199 -13 140 3 339 -7 -7
Comtan/Stalevo Group Parkinson’s disease 157 18 182 24 339 22 21
Foradil Asthma 14 0 317 -1 331 0 -1
Ritalin/Focalin (group) Attention deficit/hyperactive disorder 264 47 66 6 330 37 37
Famvir Viral infections 166 10 102 -3 268 6 5
Top twenty products total 8 418 14 10 098 5 18 516 9 9
Rest of portfolio 1 054 43 3 006 14 4 060 21 21
Total Division net sales 9 472 17 13 104 7 22 576 11 11
for some products, particularly in France and Germany. Latin Amer-ica delivered a strong expansion thanks to good performances fromBrazil and Mexico, with sales in the region up 21% (+17% lc).
Chiron’s pharmaceuticals business, acquired in mid-2006, addedtwo percentage points to net sales growth in local currencies; volumeincreases added six percentage points; price increases added threepercentage points, while the currency impact was immaterial.
Pharmaceuticals Division key product highlightsNote: All growth figures refer to 2006 worldwide sales growth in localcurrencies.
Diovan (USD 4.2 billion, +15% lc), the leading angiotensin-receptorblocker (ARB) by sales worldwide, generated further excellent growthand achieved a record market share in its segment based on newindications, higher-strength doses and strong new efficacy data. Inthe US, Diovan has benefited from a leading formulary position withhealthcare payors. Co-Diovan (combination with a diuretic) was up19% lc in Europe, reflecting increasing use of combination therapies.
Gleevec/Glivec (USD 2.6 billion, +17% lc), a targeted treatment forpatients with certain forms of chronic myeloid leukemia (CML) andgastro-intestinal stromal tumors (GIST), continued to expand at a
rapid rate through ongoing penetration of the CML and GIST markets.New landmark data showed nearly 90% of CML patients in a five-yearstudy taking Gleevec/Glivec were still alive after five years. Gleevec/Glivec also received four EU and five US approvals for treating vari-ous rare diseases during 2006.
Lotrel (USD 1.4 billion, +26% only in US), the leading fixed-dosecombination treatment for hypertension in the US since 2002, hasdelivered strong growth based on new dosing strengths as well asthe increasing use of multiple therapies to treat hypertension, demo-graphic factors and the impact of US disease awareness campaigns.
Zometa (USD 1.3 billion, +4% lc), an intravenous bisphosphonate forpatients with bone cancer, was impacted by an overall slowing of thebisphosphonate segment in the US and Europe. However, Zometa hasgained market share in treating patients with lung and prostate can-cer and also benefited from a launch in Japan.
Lamisil (USD 978 million, –13% lc), an oral treatment for fungal nailinfections, generated higher sales in the US, but this was offset by fallingsales in Europe following the entry of generic competition in late 2005.In December 2006, the FDA confirmed the grant of a pediatric extensionfor Lamisil extending its marketing exclusivity through to June 2007.
s_129-145_OFR_1.qxd 23.1.2007 16:01 Uhr Seite 144

145
0 2 | G R O U P R E V I E W 1 2 | O P E R AT I O N A L R E V I E W 5 6 | C O R P O R AT E C I T I Z E N S H I P 9 3 | C O R P O R AT E G O V E R N A N C E 1 2 7 | N O V A R T I S G R O U P F I N A N C I A L R E P O R T
Operating and Financial Review
Neoral/Sandimmum (USD 918 million, –4% lc), for transplantation,achieved steady sales despite generic competition in many markets.
Sandostatin (USD 915 million, +2% lc), for cancer, benefited fromdouble-digit growth of the long-acting patent protected version.
Lescol (USD 725 million, –5% lc), for cholesterol reduction, main-tained sales in the US but suffered a reduction in the rest of the worlddue to generic competition.
Trileptal (USD 721 million, +17% lc), against epilepsy, continued to growsignificantly in its last year before generic competition is expected.
Femara (USD 719 million, +33% lc), a leading oral treatment forwomen with hormone-related breast cancer, was a key growth driv-er due to ongoing market share gains. Clinical data has confirmedthe benefits of use in women after surgery (adjuvant) as well as aftercompletion of tamoxifen therapy (extended adjuvant). Recent four-year data from a major trial confirmed Femara significantly reducesthe risk of breast cancer returning.
Zelnorm/Zelmac (USD 561 million, +34% lc), for treatment of irrita-ble bowel syndrome with constipation and chronic idiopathic consti-pation, has benefited from outstanding US growth due to broaderuse of the product and ongoing disease awareness programs.
Visudyne (USD 354 million, –27% lc), a treatment for the eye disease“wet” age-related macular degeneration, reported a sharp decline innet sales linked to off-label competition in the US and in other keymarkets, but sales in Japan were higher.
Exjade (USD 143 million), the first once-daily oral iron chelator forchronic iron overload, has performed well since its approval in theUS and over 70 countries in 2006 as a new treatment for iron over-load associated with blood disorders such as sickle cell anemia,myelodysplastic syndrome and thalassemia.
Xolair (USD 102 million), for severe allergic asthma, has now beenlaunched in over 20 countries following EU approval in October 2005,with approvals received in over 50 countries. In the US, Novartis co-promotes Xolair with Genentech, which distributes it and shares a portion of operating income. Xolair had 2006 net sales of USD 425 million in the US, resulting in a contribution to Novartis of USD140 million reported as Other Revenues.
Vaccines and Diagnostics DivisionVaccines and Diagnostics, a new division created following the acqui-sition of Chiron in April 2006, generated net sales growth of 42% inthe eight months since acquisition over the comparable eight month2005 period recorded by Chiron, mainly from increased seasonalinfluenza vaccine sales in the US. Sales of diagnostics products, pri-marily for testing of blood donations, also showed steady growth.
Sandoz DivisionNet sales advanced 27% due to new product launches and strongerpositions in fast-growing markets, particularly Europe and support-ed by Hexal AG and Eon Labs, Inc. following their mid-2005 acqui-sition. These transactions made Sandoz a global leader in generics.Sandoz maintained its leadership position in Germany in tough mar-ket conditions marked by price cuts during 2006. Key growth driv-ers have been differentiation through difficult-to-make generics andinnovative product applications, including device technologies. Vol-ume increases contributed seven percentage points to 2006 netsales growth; currency effects two percentage points and acquisitioneffects 24 percentage points, offset by a decline of six percentagepoints due to reduced prices.
Consumer Health Division continuing operationsStrong sales expansions in OTC and Animal Health, due to theincreasing focus on strategic brands and product innovationsunderpinned the net sales growth of the continuing operations of8%. OTC brands acquired from Bristol-Myers Squibb Co. in mid-2005 supported the sales expansion.
Discontinuing Consumer Health Division operationsNovartis announced plans in December to divest the remainder ofthe Medical Nutrition Business Unit in the Consumer Health Division for USD 2.5 billion to Nestlé S.A., Switzerland. This followsthe sale of the Business Unit’s Nutrition & Santé unit in February2006. The sale of the remainder of Medical Nutrition, which is sub-ject to customary regulatory approvals, is expected to be completedin the second half of 2007. The financial data for this Business Unit,including Nutrition & Santé is disclosed in 2005 and 2006 under“Discontinuing operations.”
Operating income
Year ended Year endedDec 31, 2006 % of Dec 31, 2005 % of ChangeUSD millions net sales USD millions net sales %
Pharmaceuticals 6 703 29.7 6 014 29.7 11
Vaccines and Diagnostics -26
Sandoz 736 12.4 342 7.3 115
Consumer Health 1 068 16.3 952 15.7 12
Corporate, net -532 -506
Operating income from continuing operations 7 949 22.1 6 802 21.9 17
Discontinuing operations 225 22.8 103 8.5 118
Group operating income 8 174 22.1 6 905 21.4 18
Operating income from continuing operations advanced 17%, at ahigher pace than sales growth as the strong sales volume expansionand productivity improvements were only partially offset by one-timeand other acquisition-related costs related to the Chiron transactionof USD 642 million. Group operating income would have increasedby 28% if these costs were excluded.
s_129-145_OFR_1.qxd 23.1.2007 16:01 Uhr Seite 145

146
N O V A R T I S G R O U P F I N A N C I A L R E P O R T
Pharmaceuticals Division The Pharmaceuticals Division operating income (excluding Chironacquisition-related costs of USD 309 million) advanced 17% and thecorresponding operating margin reached 31%. Reported operatingincome kept pace with net sales, rising 11% from productivity gains inall areas and despite the impact of costs to integrate Chiron’s pharma-ceuticals business. These amounted to USD 226 million for restructur-ing and inventory step-up charges and USD 83 million for increasedamortization of intangible assets. The Division also had lower divest-ment gains than in 2005. The operating margin on net sales remainedat 29.7% despite these factors. Other revenues rose significantly, prin-cipally due to US co-promotion contributions for the asthma medicineXolair. Cost of Goods Sold rose 17%, as one-time Chiron costs offsetsavings from good cost management and improved product mix. Marketing & Sales expenses rose at a slower pace than net sales, climb-ing 9%, as productivity gains offset marketing investments to supportmultiple planned new product launches, particularly in the US, as wellas the expansion of activities in emerging growth markets such asChina and Turkey. Research & Development expenses were up 7% toUSD 4.3 billion as investments were made in key late-stage projects.Research & Development increased 17% if the exceptional USD 332million NKS 104 impairment is excluded from the 2005 amounts.
Vaccines and Diagnostics DivisionAlthough Vaccines and Diagnostics reported an operating loss of USD26 million, this is after recording substantial acquisition-related costs.Excluding these, the Division had an operating income of USD 307 mil-lion for the period following the acquisition in April 2006. This strongperformance was more than offset by one-time restructuring and otheracquisition-related costs of USD 333 million comprised of restructur-ing charges of USD 44 million, one-time inventory step-up costs of USD117 million and amortization of intangible assets of USD 172 million.
Sandoz DivisionSandoz operating income advanced significantly faster than net salesgrowth, rising 115% to USD 736 million due to operational improve-ments and the non-recurrence of integration costs in the year agoperiod. An accounting irregularity in France resulted in a USD 69 mil-lion operating income charge.
Consumer Health Division continuing operationsConsumer Health operating income rose 12% for continuing opera-tions on strong performances of strategic brands in OTC and AnimalHealth, offset by a weak performance in CIBA Vision due to productsupply issues.
Discontinuing Consumer Health Division operationsThe Nutrition & Santé unit of the Medical Nutrition Business Unitgenerated USD 2 million operating income until its divestment inFebruary 2006. The pre-tax divestment gain on selling this unitamounted to USD 129 million. The balance of the Medical NutritionBusiness Unit generated operating income of USD 94 million in 2006.
Corporate Income & Expense, netNet corporate expense totaled USD 532 million compared to USD 506 million in 2005.
Other revenues and operating expenses
Year ended Year endedDec 31, 2006 Dec 31, 2005 ChangeUSD millions USD millions %
Net sales from continuing operations 36 031 31 005 16
Other revenues 718 314 129
Cost of goods sold -10 299 -8 259 25
Marketing & sales -10 454 -9 397 11
Research & development -5 349 -4 825 11
General & administration -1 957 -1 681 16
Other income & expense -741 -355 109
Operating income from continuing operations 7 949 6 802 17
Operating income from discontinuing operations 225 103 118
Group operating income 8 174 6 905 18
Other revenuesOther revenues rose 129%, primarily due to additional royalty incomearising in the new Vaccines and Diagnostics Division mainly from itsdiagnostic activities and also increasing co-promotion contributionsin the Pharmaceuticals Division from sales of the asthma medicineXolair in the US, where it is co-marketed and co-developed in partner-ship with Genentech and Tanox.
Cost of Goods Sold from continuing operationsCost of Goods Sold rose 25% to USD 10.3 billion in 2006. As a per-centage of net sales from continuing operations Cost of Goods Soldincreased to 28.6% compared to 26.6% in 2005. The negative impactincreased amortization charges for intangible assets and one-timeinventory step-up costs from the Chiron acquisition more than offsetlower costs in the Pharmaceuticals Division related to productivitygains and product mix improvements.
Marketing & Sales from continuing operationsMarketing & Sales expenses increased 11% to USD 10.5 billion andreflects an increase in the US Pharmaceuticals Division sales force.However, Marketing & Sales expenses declined as a percentage of netsales from continuing operations to 29.0% compared to 30.3% in 2005.
Research & Development from continuing operationsResearch & Development expenses rose 11% to USD 5.3 billion as a result of ongoing investments in the Novartis Institutes forBioMedical Research in the US as well as clinical trials for late stagecompounds. These compounds include FTY 720 (multiple sclerosis)and QAB 149 (respiratory diseases). R&D expenses as a percentageof net sales from continuing operations declined to 14.8% of netsales compared to 15.6% in 2005.
s_146-155_OFR_2.qxd 23.1.2007 16:02 Uhr Seite 146
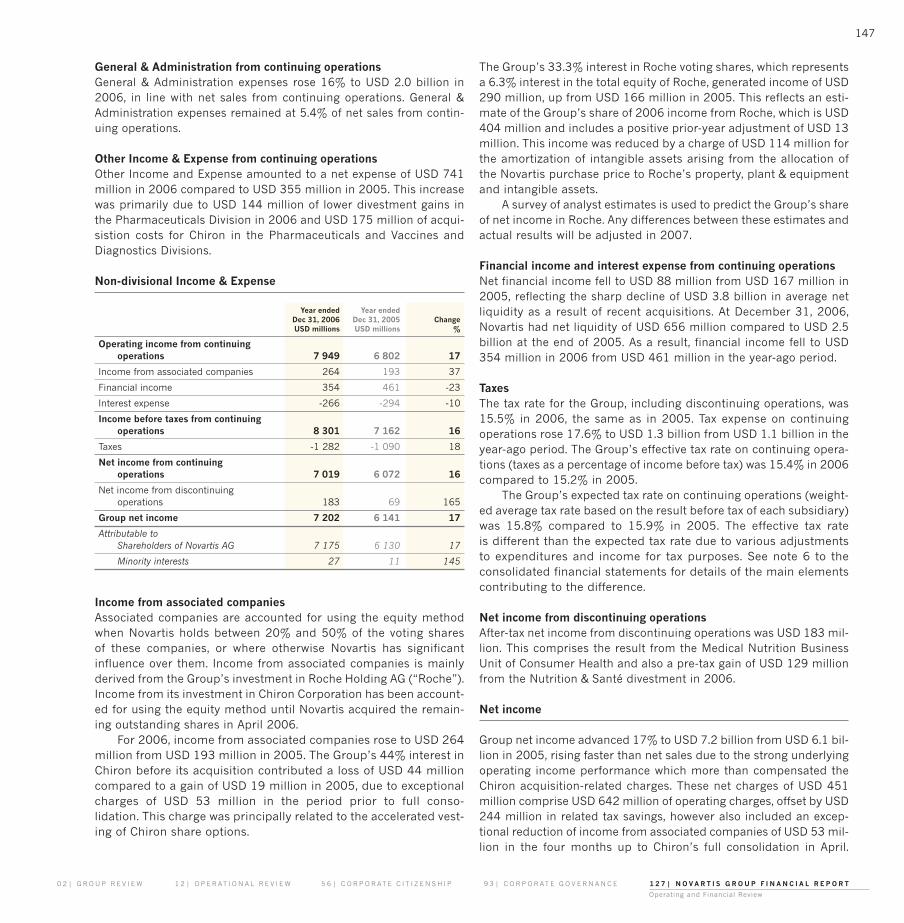
147
0 2 | G R O U P R E V I E W 1 2 | O P E R AT I O N A L R E V I E W 5 6 | C O R P O R AT E C I T I Z E N S H I P 9 3 | C O R P O R AT E G O V E R N A N C E 1 2 7 | N O V A R T I S G R O U P F I N A N C I A L R E P O R T
Operating and Financial Review
General & Administration from continuing operationsGeneral & Administration expenses rose 16% to USD 2.0 billion in2006, in line with net sales from continuing operations. General &Administration expenses remained at 5.4% of net sales from contin-uing operations.
Other Income & Expense from continuing operationsOther Income and Expense amounted to a net expense of USD 741million in 2006 compared to USD 355 million in 2005. This increasewas primarily due to USD 144 million of lower divestment gains inthe Pharmaceuticals Division in 2006 and USD 175 million of acqui-sistion costs for Chiron in the Pharmaceuticals and Vaccines andDiagnostics Divisions.
Non-divisional Income & Expense
Year ended Year endedDec 31, 2006 Dec 31, 2005 ChangeUSD millions USD millions %
Operating income from continuingoperations 7 949 6 802 17
Income from associated companies 264 193 37
Financial income 354 461 -23
Interest expense -266 -294 -10
Income before taxes from continuingoperations 8 301 7 162 16
Taxes -1 282 -1 090 18
Net income from continuing operations 7 019 6 072 16
Net income from discontinuing operations 183 69 165
Group net income 7 202 6 141 17
Attributable toShareholders of Novartis AG 7 175 6 130 17
Minority interests 27 11 145
Income from associated companiesAssociated companies are accounted for using the equity methodwhen Novartis holds between 20% and 50% of the voting shares of these companies, or where otherwise Novartis has significant influence over them. Income from associated companies is mainlyderived from the Group’s investment in Roche Holding AG (“Roche”).Income from its investment in Chiron Corporation has been account-ed for using the equity method until Novartis acquired the remain-ing outstanding shares in April 2006.
For 2006, income from associated companies rose to USD 264million from USD 193 million in 2005. The Group’s 44% interest inChiron before its acquisition contributed a loss of USD 44 millioncompared to a gain of USD 19 million in 2005, due to exceptionalcharges of USD 53 million in the period prior to full conso-lidation. This charge was principally related to the accelerated vest-ing of Chiron share options.
The Group’s 33.3% interest in Roche voting shares, which representsa 6.3% interest in the total equity of Roche, generated income of USD290 million, up from USD 166 million in 2005. This reflects an esti-mate of the Group’s share of 2006 income from Roche, which is USD404 million and includes a positive prior-year adjustment of USD 13million. This income was reduced by a charge of USD 114 million forthe amortization of intangible assets arising from the allocation ofthe Novartis purchase price to Roche’s property, plant & equipmentand intangible assets.
A survey of analyst estimates is used to predict the Group’s shareof net income in Roche. Any differences between these estimates andactual results will be adjusted in 2007.
Financial income and interest expense from continuing operationsNet financial income fell to USD 88 million from USD 167 million in2005, reflecting the sharp decline of USD 3.8 billion in average netliquidity as a result of recent acquisitions. At December 31, 2006,Novartis had net liquidity of USD 656 million compared to USD 2.5billion at the end of 2005. As a result, financial income fell to USD354 million in 2006 from USD 461 million in the year-ago period.
TaxesThe tax rate for the Group, including discontinuing operations, was15.5% in 2006, the same as in 2005. Tax expense on continuingoperations rose 17.6% to USD 1.3 billion from USD 1.1 billion in theyear-ago period. The Group’s effective tax rate on continuing opera-tions (taxes as a percentage of income before tax) was 15.4% in 2006compared to 15.2% in 2005.
The Group’s expected tax rate on continuing operations (weight-ed average tax rate based on the result before tax of each subsidiary)was 15.8% compared to 15.9% in 2005. The effective tax rate is different than the expected tax rate due to various adjustmentsto expenditures and income for tax purposes. See note 6 to the consolidated financial statements for details of the main elementscontributing to the difference.
Net income from discontinuing operationsAfter-tax net income from discontinuing operations was USD 183 mil-lion. This comprises the result from the Medical Nutrition BusinessUnit of Consumer Health and also a pre-tax gain of USD 129 millionfrom the Nutrition & Santé divestment in 2006.
Net income
Group net income advanced 17% to USD 7.2 billion from USD 6.1 bil-lion in 2005, rising faster than net sales due to the strong underlyingoperating income performance which more than compensated theChiron acquisition-related charges. These net charges of USD 451million comprise USD 642 million of operating charges, offset by USD244 million in related tax savings, however also included an excep-tional reduction of income from associated companies of USD 53 mil-lion in the four months up to Chiron’s full consolidation in April.
s_146-155_OFR_2.qxd 23.1.2007 16:02 Uhr Seite 147

Excluding these acquisition-related effects net income rose 25%. Alsoeffecting net income was lower net financial income due to the loweraverage net liquidity as a result of the 2006 acquisitions. Group netincome increased to 19.5% of Group net sales compared to 19.1% in2005. Net income from continuing operations was also 19.5% of therelated net sales. The return on average equity arising from the Groupnet income was 19.3% compared to 19.0% in 2005.
Earnings per share
Earnings per share rose 16% to USD 3.06 from USD 2.63 in the year-ago period.
Condensed consolidated balance sheetsDec 31, 2006 Dec 31, 2005 ChangeUSD millions USD millions USD millions
Total non-current assets 46 604 36 289 10 315
Cash, marketable securities andderivative financial instruments 7 955 10 933 -2 978
Other current assets 12 713 10 510 2 203
Assets related to discontinuing operations 736 736
Total assets 68 008 57 732 10 276
Total equity 41 294 33 164 8 130
Financial debts 7 299 8 454 -1 155
Other liabilities 19 208 16 114 3 094
Liabilities related to discontinuing operations 207 207
Total equity and liabilities 68 008 57 732 10 276
Total non-current assets increased by USD 10.3 billion principallyfrom the Chiron acquisition. The Group’s equity increased by USD8.1 billion during 2006 to USD 41.3 billion at December 31, 2006,as a result of net income (USD 7.2 billion), positive translationadjustments (USD 1.5 billion), the revaluation of and change inaccounting method for Chiron (USD 0.6 billion), valuation differ-ences on marketable securities and cash-flow hedges, share-basedcompensation, net sale of treasury shares, actuarial net gains fromdefined benefit plans and other items (USD 0.8 billion), offset bythe dividend payment (USD 2.0 billion). Total financial debtsdecreased by USD 1.2 billion. The valuation differences on avail-able-for-sale marketable securities and deferred cash-flow hedgesincreased from unrealized gains of USD 304 million at December31, 2005, to unrealized gains of USD 398 million at December 31,2006. The year-end debt/equity ratio decreased to 0.18:1 from0.25:1 in 2005 due to the increase in equity and a decrease infinancial liabilities.
Novartis has long-term financial debt principally in the form ofbonds. A total of USD 1.3 billion of straight bonds were outstandingat December 31, 2006, compared with USD 2.3 billion at December31, 2005. For details on the maturity profile of debt, currency andinterest rate structure, see note 18 to the consolidated financialstatements.
148
N O V A R T I S G R O U P F I N A N C I A L R E P O R T
Novartis debt continues to be rated by Standard & Poor’s, Moody’sand Fitch as AAA, Aaa and AAA for long-term maturities and A1+, P1and F1+ for short-term debt, respectively making the Group one ofthe few non-financial companies worldwide to have attained thehighest rating from these three benchmark rating agencies. TheGroup considers its financing arrangements to be sufficient for itspresent requirements.
Liquidity and capital resources
The following table sets forth certain information about the Group’scash flow and net liquidity.
2006 2005 ChangeUSD millions USD millions USD millions
Cash flow from operating activities ofcontinuing operations 8 710 7 975 735
Cash flow used for investing activities ofcontinuing operations -6 575 -7 449 874
Cash flow used for financing activities ofcontinuing operations -4 970 -270 -4 700
Cash flow from discontinuing operations 308 76 232
Translation effect on cash and cashequivalents 25 -94 119
Cash and cash equivalents at the end ofthe year of discontinuing operations -4 -4
Net change in cash and cash equivalentsof continuing operations -2 506 238 -2 744
Change in current and non-current marketable securities -472 -3 197 2 725
Change in current and non-current financial debts 1 155 -1 599 2 754
Change in net liquidity -1 823 -4 558 2 735
Net liquidity at January 1 2 479 7 037 -4 558
Net liquidity of continuing operations at December 31 656 2 479 -1 823
Net debts of discontinuing operations at December 31 -3 -3
Net liquidity at December 31 653 2 479 -1 826
Cash flow from continuing operating activities increased by 9% (USD735 million) to USD 8.7 billion reflecting the strong business expan-sion and good working capital management of the Divisions.
Cash outflow due to continuing investing activities was USD 6.6billion. A total net amount of USD 4.5 billion was spent on acquisi-tions principally Chiron Corporation and NeuTec Pharma plc, whileinvestments in property, plant & equipment amounted to USD 1.8billion and USD 0.3 billion was spent on other investing activities.
Cash flow used for continuing financing activities was USD 5.0billion, an increase of USD 4.7 billion from 2005. USD 2.0 billionwas spent on dividend payments. USD 2.9 billion net cash outflowwas due to the repayment of current and non-current financialdebts which included the repayment of USD 1.1 billion for an out-standing euro bond; repayment of USD 0.9 billion of convertible
s_146-155_OFR_2.qxd 23.1.2007 16:02 Uhr Seite 148

149
0 2 | G R O U P R E V I E W 1 2 | O P E R AT I O N A L R E V I E W 5 6 | C O R P O R AT E C I T I Z E N S H I P 9 3 | C O R P O R AT E G O V E R N A N C E 1 2 7 | N O V A R T I S G R O U P F I N A N C I A L R E P O R T
Operating and Financial Review
bonds acquired with the Chiron transaction and repayment of USD1.2 billion of current debt taken up to finance the 2005 Hexal AGacquisition.
Overall liquidity (cash, cash equivalents and marketable secu-rities including financial derivatives) amounted to USD 8.0 billionat December 31, 2006. Net liquidity fell by USD 1.8 billion to a totalof USD 656 million at December 31, 2006, compared to USD 2.5billion at the start of the year, reflecting the acquisitions made during the year.
Group free cash flow
The Group defines free cash flow as cash flow from operating activ-ities less purchase/sale of property, plant & equipment, intangibleand financial assets and dividends paid. Cash effects on acquisitionor divestment of subsidiaries, associated companies and minorityinterests are excluded from free cash flow. The following is a sum-mary of the Group’s free cash flow:
2006 2005 ChangeUSD millions USD millions USD millions
Cash flow from operating activities ofcontinuing operations 8 710 7 975 735
Purchase of property, plant & equipment -1 802 -1 157 -645
Purchase of intangible assets -520 -358 -162
Purchase of financial assets -825 -782 -43
Proceeds from sale of property,plant & equipment 87 73 14
Proceeds from sale of intangibleand financial assets 632 957 -325
Dividends paid to shareholders of Novartis AG -2 049 -2 107 58
Free cash flow from continuing operations 4 233 4 601 -368
Free cash flow from discontinuing operations 107 72 35
Group free cash flow 4 340 4 673 -333
Free cash flow from continuing operations decreased by 8% to USD4.2 billion in 2006 from USD 4.6 billion in 2005 as the increase incash flow from operating activities was offset by increased paymentsfor property, plant, equipment and intangible assets and lower pro-ceeds from asset disposals.
Capital expenditure for continuing operations on property,plant & equipment for 2006 amounted to USD 1.8 billion (5% ofnet sales of continuing operations compared to 3.7% in 2005). Thislevel reflects the continuing investment in production sites as wellas Research & Development facilities. In 2007 capital expendituresfor property, plant and equipment are forecast to be approximate-ly 5.5 to 6.0% of net sales. These expenditures will be funded frominternally generated resources.
Free cash flow is presented as additional information since it is a use-ful indicator of the Group’s ability to operate without relying on addi-tional borrowing or the use of existing cash. Free cash flow is a meas-ure of the net cash generated which is available for debt repaymentand investment in strategic opportunities.
The Group uses free cash flow as a performance measure whenmaking internal comparisons of the results of Divisions. Free cashflow of the Divisions uses the same definition as for the Group. How-ever no dividends, tax or financial receipts or payments are includ-ed in the Divisional calculation.
The following summarizes the free cash flow by Division:
2006 2005 ChangeUSD millions USD millions USD millions
Pharmaceuticals 6 501 5 968 533
Vaccines and Diagnostics 151 151
Sandoz 876 685 191
Consumer Health continuing operations 778 811 -33
Corporate and other -2 024 -756 -1 268
Dividends paid to shareholders of Novartis AG -2 049 -2 107 58
Total continuing operations 4 233 4 601 -368
Discontinuing operations 107 72 35
Group free cash flow 4 340 4 673 -333
Contractual obligations
The following summarizes the Group’s contractual obligations andother commercial commitments and the effect such obligations andcommitments are expected to have on the Group’s liquidity and cashflow in future periods.
Payments due by period
Less than 2–3 4–5 AfterTotal 1 year years years 5 years
USD millions USD millions USD millions USD millions USD millions
Non-current financial debt 1 996 1 340 560 33 63
Operating leases 1 193 309 370 183 331
Unfunded pensions andother post-retirementobligations 1 860 99 205 222 1 334
Research & Development– unconditional 77 33 27 17
– potential milestonepayments 2 785 199 865 631 1 090
Purchase commitments– property, plant &
equipment 563 376 158 29
Total contractualcash obligations 8 474 2 356 2 185 1 115 2 818
The Group expects to fund the operating leases and long-term andother purchase commitments with internally generated resources.
s_146-155_OFR_2.qxd 23.1.2007 16:02 Uhr Seite 149

150
N O V A R T I S G R O U P F I N A N C I A L R E P O R T
Compliance with Sarbanes-Oxley Act of 2002on internal control over Financial Reporting
In line with domestic US registrants with the Securities and ExchangeCommission (SEC), Novartis successfully completed its assessmentof internal control over financial reporting under Section 404 of theSarbanes-Oxley Act in 2004 and 2005 and repeated this approachin 2006. Management’s assessment was reviewed and attested in areport from its independent auditors. No material weaknesses wererevealed in 2004, 2005 or 2006 from this review of the internal con-trol over financial reporting.
Special purpose entities
The Novartis Group has no unconsolidated special purpose financ-ing or partnership entities.
Earnings before interest, tax, depreciationand amortization (EBITDA)
The Group defines EBITDA as operating income before depreciationof property, plant & equipment and amortization of intangible assets,and any related impairment charges.
2006 2005 ChangeUSD millions USD millions USD millions
Operating income from continuing operations 7 949 6 802 1 147
Depreciation of property, plant & equipment 1 016 804 212
Amortization of intangible assets 834 460 374
Impairments of property, plant & equipment and intangible assets 137 415 -278
Group EBITDA continuing operations 9 936 8 481 1 455
EBITDA discontinuing operations 258 141 117
Group EBITDA 10 194 8 622 1 572
The segmentation of the Group EBITDA into the Divisions is as follows:
EBITDA EBITDA2006 % of 2005 % of
USD millions net sales USD millions net sales
Pharmaceuticals 7 601 33.7 7 041 34.7
Vaccines and Diagnostics 201 21.0
Sandoz 1 295 21.7 777 16.6
Consumer Health 1 330 20.3 1 170 19.3
Corporate and other -491 -507
Group EBITDA continuing operations 9 936 27.6 8 481 27.4
EBITDA discontinuing operations 258 26.1 141 11.7
Group EBITDA 10 194 27.5 8 622 26.8
Enterprise value
Enterprise value represents the total amount that shareholders and debt holders have invested in Novartis, less the Group’s liqui-dity. This is the base used by investors in Novartis to measure their EBITDA return.
Dec 31, 2006 Dec 31, 2005 ChangeUSD millions USD millions USD millions
Market capitalization 135 105 122 887 12 218
Minority interests 183 174 9
Financial debts1 7 306 8 454 -1 148
Less liquidity1 -7 959 -10 933 2 974
Enterprise value 134 635 120 582 14 053
Enterprise value/EBITDA 13 14
1including discontinuing operations
Value added statement
A total of 48% of the revenue from net sales was used to purchasegoods and services from our suppliers. Of the Net Value Added of USD18.1 billion, 51% was paid either directly or indirectly to the employ-ees, 29% was retained in the business for future expansion and 9%was paid to public authorities and financial institutions. Dividendspaid to shareholders represented 11% of the Net Value Added.
ORIGIN OF VALUE ADDED
2006 20052006 % of % of
USD millions net sales net sales
Group net sales 37 020 100 100
Other revenues, change in inventory andown manufactured items 602 1.6 1.5
37 622 101.6 101.1
Services bought from third parties:Material costs -6 315 -17.0 -18.0
Other operating expenses -11 584 -31.3 -30.9
Gross value added 19 723 53.3 52.6
Depreciation, amortization andimpairments on property, plant &equipment and intangible assets -2 020 -5.5 -5.3
Financial income 354 1.0 1.4
Net Value Added 18 057 48.8 48.7
s_146-155_OFR_2.qxd 23.1.2007 16:02 Uhr Seite 150

151
0 2 | G R O U P R E V I E W 1 2 | O P E R AT I O N A L R E V I E W 5 6 | C O R P O R AT E C I T I Z E N S H I P 9 3 | C O R P O R AT E G O V E R N A N C E 1 2 7 | N O V A R T I S G R O U P F I N A N C I A L R E P O R T
Summary of Financial Data
SUMMARY OF QUARTERLY FINANCIAL DATA FOR 2006 AND 2005
USD millions unless indicated otherwise Q1 Q2 Q3 Q4 2006 Q1 Q2 Q3 Q4 2005
Net sales from continuing operations 8 057 8 944 9 229 9 801 36 031 7 040 7 479 8 114 8 372 31 005
Other revenues 93 163 205 257 718 73 71 74 96 314
Cost of goods sold -2 182 -2 463 -2 753 -2 901 -10 299 -1 782 -1 817 -2 294 -2 366 -8 259
Gross profitfrom continuing operations 5 968 6 644 6 681 7 157 26 450 5 331 5 733 5 894 6 102 23 060
Marketing & sales -2 292 -2 604 -2 567 -2 991 -10 454 -2 213 -2 352 -2 299 -2 533 -9 397
Research & development -1 131 -1 259 -1 411 -1 548 -5 349 -1 082 -1 090 -1 187 -1 466 -4 825
General & administration -406 -473 -463 -615 -1 957 -385 -390 -414 -492 -1 681
Other income & expense -81 -266 -185 -209 -741 -80 -135 -140 -355
Operating income from continuing operations 2 058 2 042 2 055 1 794 7 949 1 651 1 821 1 859 1 471 6 802
Income from associated companies 104 1 88 71 264 33 28 65 67 193
Financial income 108 79 72 95 354 116 137 98 110 461
Interest expense -58 -75 -76 -57 -266 -71 -76 -80 -67 -294
Income before taxesfrom continuing operations 2 212 2 047 2 139 1 903 8 301 1 729 1 910 1 942 1 581 7 162
Taxes -373 -349 -296 -264 -1 282 -271 -282 -295 -242 -1 090
Net incomefrom continuing operations 1 839 1 698 1 843 1 639 7 019 1 458 1 628 1 647 1 339 6 072
Net incomefrom discontinuing operations 117 15 27 24 183 19 18 19 13 69
Group net income 1 956 1 713 1 870 1 663 7 202 1 477 1 646 1 666 1 352 6 141
Attributable toShareholders of Novartis AG 1 947 1 707 1 867 1 654 7 175 1 481 1 640 1 659 1 350 6 130
Minority interests 9 6 3 9 27 -4 6 7 2 11
EPS (USD)– total 0.83 0.73 0.80 0.70 3.06 0.63 0.70 0.71 0.58 2.63
– continuing operations 0.78 0.72 0.78 0.69 2.98 0.63 0.70 0.70 0.57 2.60
– discontinuing operations 0.05 0.01 0.01 0.01 0.08 0.01 0.01 0.01 0.01 0.03
Net sales by Division
Pharmaceuticals 5 052 5 699 5 776 6 049 22 576 4 789 5 132 5 093 5 248 20 262
Vaccines and Diagnostics 127 374 455 956
Sandoz 1 431 1 450 1 425 1 653 5 959 803 832 1 486 1 573 4 694
Consumer Health 1 574 1 668 1 654 1 644 6 540 1 448 1 515 1 535 1 551 6 049
Total continuing operations 8 057 8 944 9 229 9 801 36 031 7 040 7 479 8 114 8 372 31 005
Discontinuing operations 244 238 255 252 989 301 320 301 285 1 207
Group net sales 8 301 9 182 9 484 10 053 37 020 7 341 7 799 8 415 8 657 32 212
Operating income by Division
Pharmaceuticals 1 626 1 677 1 779 1 621 6 703 1 364 1 611 1 681 1 358 6 014
Vaccines and Diagnostics -38 10 2 -26
Sandoz 238 207 87 204 736 110 79 34 119 342
Consumer Health 314 294 317 143 1 068 257 261 261 173 952
Corporate income & expense, net -120 -98 -138 -176 -532 -80 -130 -117 -179 -506
Total continuing operations 2 058 2 042 2 055 1 794 7 949 1 651 1 821 1 859 1 471 6 802
Discontinuing operations 144 18 33 30 225 29 28 29 17 103
Group operating income 2 202 2 060 2 088 1 824 8 174 1 680 1 849 1 888 1 488 6 905
s_146-155_OFR_2.qxd 23.1.2007 16:02 Uhr Seite 151
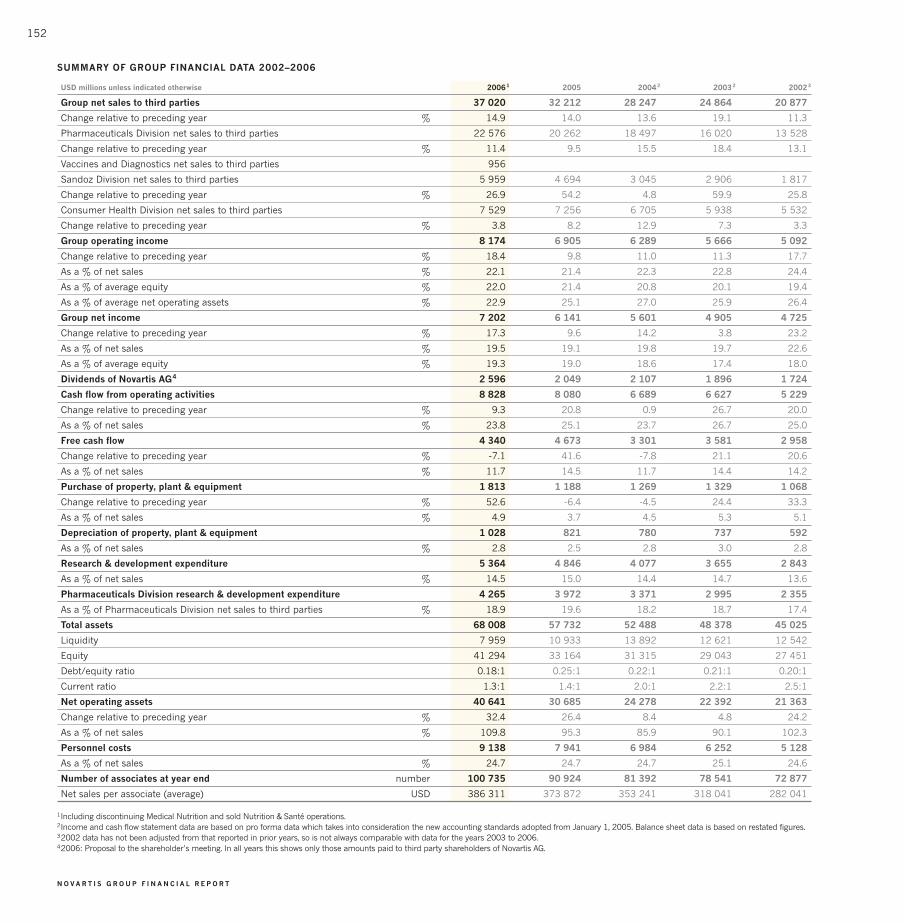
152
N O V A R T I S G R O U P F I N A N C I A L R E P O R T
SUMMARY OF GROUP FINANCIAL DATA 2002–2006
USD millions unless indicated otherwise 20061 2005 20042 20032 20023
Group net sales to third parties 37 020 32 212 28 247 24 864 20 877
Change relative to preceding year % 14.9 14.0 13.6 19.1 11.3
Pharmaceuticals Division net sales to third parties 22 576 20 262 18 497 16 020 13 528
Change relative to preceding year % 11.4 9.5 15.5 18.4 13.1
Vaccines and Diagnostics net sales to third parties 956
Sandoz Division net sales to third parties 5 959 4 694 3 045 2 906 1 817
Change relative to preceding year % 26.9 54.2 4.8 59.9 25.8
Consumer Health Division net sales to third parties 7 529 7 256 6 705 5 938 5 532
Change relative to preceding year % 3.8 8.2 12.9 7.3 3.3
Group operating income 8 174 6 905 6 289 5 666 5 092
Change relative to preceding year % 18.4 9.8 11.0 11.3 17.7
As a % of net sales % 22.1 21.4 22.3 22.8 24.4
As a % of average equity % 22.0 21.4 20.8 20.1 19.4
As a % of average net operating assets % 22.9 25.1 27.0 25.9 26.4
Group net income 7 202 6 141 5 601 4 905 4 725
Change relative to preceding year % 17.3 9.6 14.2 3.8 23.2
As a % of net sales % 19.5 19.1 19.8 19.7 22.6
As a % of average equity % 19.3 19.0 18.6 17.4 18.0
Dividends of Novartis AG4 2 596 2 049 2 107 1 896 1 724
Cash flow from operating activities 8 828 8 080 6 689 6 627 5 229
Change relative to preceding year % 9.3 20.8 0.9 26.7 20.0
As a % of net sales % 23.8 25.1 23.7 26.7 25.0
Free cash flow 4 340 4 673 3 301 3 581 2 958
Change relative to preceding year % -7.1 41.6 -7.8 21.1 20.6
As a % of net sales % 11.7 14.5 11.7 14.4 14.2
Purchase of property, plant & equipment 1 813 1 188 1 269 1 329 1 068
Change relative to preceding year % 52.6 -6.4 -4.5 24.4 33.3
As a % of net sales % 4.9 3.7 4.5 5.3 5.1
Depreciation of property, plant & equipment 1 028 821 780 737 592
As a % of net sales % 2.8 2.5 2.8 3.0 2.8
Research & development expenditure 5 364 4 846 4 077 3 655 2 843
As a % of net sales % 14.5 15.0 14.4 14.7 13.6
Pharmaceuticals Division research & development expenditure 4 265 3 972 3 371 2 995 2 355
As a % of Pharmaceuticals Division net sales to third parties % 18.9 19.6 18.2 18.7 17.4
Total assets 68 008 57 732 52 488 48 378 45 025
Liquidity 7 959 10 933 13 892 12 621 12 542
Equity 41 294 33 164 31 315 29 043 27 451
Debt/equity ratio 0.18:1 0.25:1 0.22:1 0.21:1 0.20:1
Current ratio 1.3:1 1.4:1 2.0:1 2.2:1 2.5:1
Net operating assets 40 641 30 685 24 278 22 392 21 363
Change relative to preceding year % 32.4 26.4 8.4 4.8 24.2
As a % of net sales % 109.8 95.3 85.9 90.1 102.3
Personnel costs 9 138 7 941 6 984 6 252 5 128
As a % of net sales % 24.7 24.7 24.7 25.1 24.6
Number of associates at year end number 100 735 90 924 81 392 78 541 72 877
Net sales per associate (average) USD 386 311 373 872 353 241 318 041 282 041
1Including discontinuing Medical Nutrition and sold Nutrition & Santé operations.2Income and cash flow statement data are based on pro forma data which takes into consideration the new accounting standards adopted from January 1, 2005. Balance sheet data is based on restated figures.32002 data has not been adjusted from that reported in prior years, so is not always comparable with data for the years 2003 to 2006.42006: Proposal to the shareholder’s meeting. In all years this shows only those amounts paid to third party shareholders of Novartis AG.
s_146-155_OFR_2.qxd 23.1.2007 16:02 Uhr Seite 152
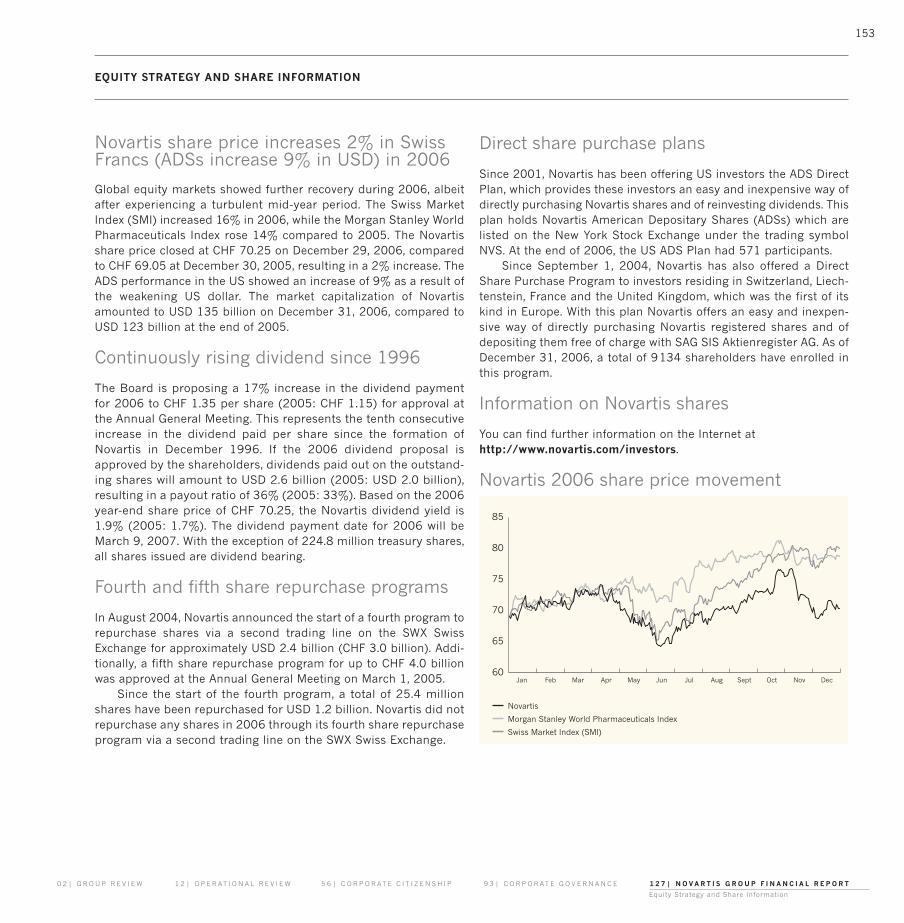
153
0 2 | G R O U P R E V I E W 1 2 | O P E R AT I O N A L R E V I E W 5 6 | C O R P O R AT E C I T I Z E N S H I P 9 3 | C O R P O R AT E G O V E R N A N C E 1 2 7 | N O V A R T I S G R O U P F I N A N C I A L R E P O R T
Equity Strategy and Share Information
Novartis share price increases 2% in SwissFrancs (ADSs increase 9% in USD) in 2006
Global equity markets showed further recovery during 2006, albeitafter experiencing a turbulent mid-year period. The Swiss MarketIndex (SMI) increased 16% in 2006, while the Morgan Stanley WorldPharmaceuticals Index rose 14% compared to 2005. The Novartisshare price closed at CHF 70.25 on December 29, 2006, comparedto CHF 69.05 at December 30, 2005, resulting in a 2% increase. TheADS performance in the US showed an increase of 9% as a result ofthe weakening US dollar. The market capitalization of Novartisamounted to USD 135 billion on December 31, 2006, compared toUSD 123 billion at the end of 2005.
Continuously rising dividend since 1996
The Board is proposing a 17% increase in the dividend payment for 2006 to CHF 1.35 per share (2005: CHF 1.15) for approval atthe Annual General Meeting. This represents the tenth consecutiveincrease in the dividend paid per share since the formation ofNovartis in December 1996. If the 2006 dividend proposal isapproved by the shareholders, dividends paid out on the outstand-ing shares will amount to USD 2.6 billion (2005: USD 2.0 billion),resulting in a payout ratio of 36% (2005: 33%). Based on the 2006year-end share price of CHF 70.25, the Novartis dividend yield is1.9% (2005: 1.7%). The dividend payment date for 2006 will beMarch 9, 2007. With the exception of 224.8 million treasury shares,all shares issued are dividend bearing.
Fourth and fifth share repurchase programs
In August 2004, Novartis announced the start of a fourth program torepurchase shares via a second trading line on the SWX SwissExchange for approximately USD 2.4 billion (CHF 3.0 billion). Addi-tionally, a fifth share repurchase program for up to CHF 4.0 billionwas approved at the Annual General Meeting on March 1, 2005.
Since the start of the fourth program, a total of 25.4 millionshares have been repurchased for USD 1.2 billion. Novartis did notrepurchase any shares in 2006 through its fourth share repurchaseprogram via a second trading line on the SWX Swiss Exchange.
Direct share purchase plans
Since 2001, Novartis has been offering US investors the ADS DirectPlan, which provides these investors an easy and inexpensive way ofdirectly purchasing Novartis shares and of reinvesting dividends. Thisplan holds Novartis American Depositary Shares (ADSs) which arelisted on the New York Stock Exchange under the trading symbolNVS. At the end of 2006, the US ADS Plan had 571 participants.
Since September 1, 2004, Novartis has also offered a DirectShare Purchase Program to investors residing in Switzerland, Liech-tenstein, France and the United Kingdom, which was the first of itskind in Europe. With this plan Novartis offers an easy and inexpen-sive way of directly purchasing Novartis registered shares and ofdepositing them free of charge with SAG SIS Aktienregister AG. As ofDecember 31, 2006, a total of 9134 shareholders have enrolled inthis program.
Information on Novartis shares
You can find further information on the Internet athttp://www.novartis.com/investors.
Novartis 2006 share price movement
EQUITY STRATEGY AND SHARE INFORMATION
60
65
70
75
80
85
Jan Feb Mar Apr May Jun Jul Aug Sept Oct Nov Dec
Novartis
Morgan Stanley World Pharmaceuticals Index
Swiss Market Index (SMI)
s_146-155_OFR_2.qxd 23.1.2007 16:02 Uhr Seite 153

154
N O V A R T I S G R O U P F I N A N C I A L R E P O R T
KEY NOVARTIS SHARE DATA
2006 2005
Issued shares 2 728 971 000 2 739 171 000
Of which treasury shares
Reserved for share-based compensation 33 558 017 40 291 620
Not specifically reserved 347 181 524 362 962 880
Treasury shares 380 739 541 403 254 500
Outstanding shares at December 31 2 348 231 459 2 335 916 500
Average number of shares outstanding 2 345 232 126 2 332 848 144
PER SHARE INFORMATION1 (IN USD EXCEPT DIVIDEND WHICH IS IN CHF)
2006 2005
Basic earnings per share – total 3.06 2.63
– continuing operations 2.98 2.60
– discontinuing operations 0.08 0.03
Diluted earnings per share – total 3.04 2.62
– continuing operations 2.96 2.59
– discontinuing operations 0.08 0.03
Operating cash flow – total 3.76 3.46
– continuing operations 3.71 3.42
– discontinuing operations 0.05 0.05
Year end equity for Novartis AG shareholders 17.51 14.12
Dividend2 (CHF) 1.35 1.15
1Calculated on average number of shares outstanding except year end equity per share22006: Proposal to shareholders’ meeting
KEY RATIOS – DECEMBER 31
2006 2005
Price/earnings ratio1 18.8 20.0
Enterprise value/EBITDA1 13.2 14.0
Dividend yield (%) 1.9 1.7
1Based on share price at the year end
KEY DATA ON AMERICAN DEPOSITARY SHARES (ADSs) ISSUED IN THE US
2006 2005
Year end ADS price (USD) 57.44 52.48
ADSs outstanding1 328 847 804 279 064 646
1The depositary, JP Morgan Chase Bank, holds one Novartis AG share for every American Depositary Share (ADS) issued
SHARE PRICE (CHF)
2006 2005
Year end 70.25 69.05
Highest 76.80 71.50
Lowest 64.20 55.35
Year-end market capitalization 135 105 122 887(USD millions)
s_146-155_OFR_2.qxd 23.1.2007 16:02 Uhr Seite 154

0 2 | G R O U P R E V I E W 1 2 | O P E R AT I O N A L R E V I E W 5 6 | C O R P O R AT E C I T I Z E N S H I P 9 3 | C O R P O R AT E G O V E R N A N C E 1 2 7 | N O V A R T I S G R O U P F I N A N C I A L R E P O R T
Equity Strategy and Share Information
Trading
Novartis shares are listed in Switzerland and traded on virt-x, anexchange for pan-European blue chip shares. The American Deposi-tary Shares (ADSs) are listed on the New York Stock Exchange.Novartis shares are also traded on the International Retail Service(IRS) of the London Stock Exchange.
SYMBOLS
virt-x IRS NYSE(Reuters/Bloomberg) (Bloomberg) (Reuters/Bloomberg)
Shares NOVN.VX/NOVN VX NOV LN
ADSs NVS
Widely dispersed shareholdings
Novartis shares are widely held. As of December 31, 2006, Novartishad approximately 153 000 shareholders (2005: 160 000) registeredin its share register. Based on the Novartis AG share register, approx-imately 50% (2005: 53%) of the Novartis AG shares registered byname are held in Switzerland and 39% are held by approximately800 holders in the US (2005: 36% and 850 holders, respectively).The above numbers are not representative of the actual number ofbeneficial owners located in Switzerland or the US since certainshares are held by brokers or other nominees. Approximately 14% ofthe shares registered in the share registry are held by retail or indi-vidual investors while 86% are held by institutions such as banks,nominees, insurers, pension funds and investment funds. A total of24% of the Novartis AG shares are not entered in the share register.
Limitation of registration, voting rights andmajor shareholders
No person or entity shall be registered with the right to vote for morethan 2% of the share capital as set forth in the Commercial Regis-ter. The Board of Directors may allow exemptions from the limitationfor registration in the share register.
Based upon information available to the Group, shareholdersowning 2% or more of Novartis AG’s capital at December 31 are list-ed in the table below.
% holding of share capital % holding of share capitalDecembre 31, 2006 Decembre 31, 2005
Novartis Foundation forEmployee Participation, Basel 2.8 2.9
Emasan AG, Basel 3.2 3.2
In addition:• Mellon Bank, Everett, holds 2.0% (2005: 1.9%), Nortrust
Nominees, London, holds 2.7% (2005: 2.5%) and JPMorganChase Bank, New York, holds 7.6% (2005: 8.3%) of the registered shares, respectively as nominees.
• JPMorgan Chase Bank, the depositary for the shares representedby American Depositary Shares, is registered with 12.1% of theshare capital.
155
s_146-155_OFR_2.qxd 23.1.2007 16:02 Uhr Seite 155

156
N O V A R T I S G R O U P F I N A N C I A L R E P O R T
CONSOLIDATED INCOME STATEMENTS (for the years ended December 31, 2006 and 2005)
2006 2005Note USD millions USD millions
Net sales from continuing operations 3/4 36 031 31 005
Other revenues 718 314
Cost of goods sold -10 299 -8 259
Gross profit from continuing operations 26 450 23 060
Marketing & sales -10 454 -9 397
Research & development -5 349 -4 825
General & administration -1 957 -1 681
Other income & expense -741 -355
Operating income from continuing operations 3 7 949 6 802
Income from associated companies 10 264 193
Financial income 5 354 461
Interest expense -266 -294
Income before taxes from continuing operations 8 301 7 162
Taxes 6 -1 282 -1 090
Net income from continuing operations 7 019 6 072
Net income from discontinuing operations 3 183 69
Group net income 7 202 6 141
Attributable to
Shareholders of Novartis AG 7 175 6 130
Minority interests 27 11
Earnings per share 7
– Continuing operations earnings per share (USD) 2.98 2.60
– Discontinuing operations earnings per share (USD) 0.08 0.03
– Total earnings per share (USD) 3.06 2.63
Diluted earnings per share 7
– Continuing operations diluted earnings per share (USD) 2.96 2.59
– Discontinuing operations diluted earnings per share (USD) 0.08 0.03
– Total diluted earnings per share (USD) 3.04 2.62
The accompanying notes form an integral part of the consolidated financial statements.
NOVARTIS GROUP CONSOLIDATED FINANCIAL STATEMENTS
s_156-185_Notes.qxd 23.1.2007 16:02 Uhr Seite 156

157
0 2 | G R O U P R E V I E W 1 2 | O P E R AT I O N A L R E V I E W 5 6 | C O R P O R AT E C I T I Z E N S H I P 9 3 | C O R P O R AT E G O V E R N A N C E 1 2 7 | N O V A R T I S G R O U P F I N A N C I A L R E P O R T
Novartis Group Consolidated Financial Statements
CONSOLIDATED BALANCE SHEETS (at December 31, 2006 and 2005)
2006 2005Note USD millions USD millions
Assets
Non-current assets
Property, plant & equipment 8 10 945 8 679
Intangible assets 9 21 230 13 294
Associated companies 10 6 111 7 086
Deferred tax assets 11 3 903 3 401
Financial and other non-current assets 12 4 415 3 829
Total non-current assets 46 604 36 289
Current assets
Inventories 13 4 498 3 725
Trade accounts receivable 14 6 161 5 343
Marketable securities & derivative financial instruments 15 4 140 4 612
Cash and cash equivalents 3 815 6 321
Other current assets 16 2 054 1 442
Total current assets from continuing operations 20 668 21 443
Assets related to discontinuing operations 23 736
Total current assets 21 404 21 443
Total assets 68 008 57 732
Equity and liabilities
Equity
Share capital 17 990 994
Treasury shares 17 -140 -146
Reserves 40 261 32 142
Issued share capital and reserves attributable to shareholders of Novartis AG 41 111 32 990
Minority interests 183 174
Total equity 41 294 33 164
Liabilities
Non-current liabilities
Financial debts 18 656 1 319
Deferred tax liabilities 11 5 290 3 472
Provisions and other non-current liabilities 19 4 534 4 449
Total non-current liabilities 10 480 9 240
Current liabilities
Trade accounts payable 2 487 1 961
Financial debts and derivative financial instruments 20 6 643 7 135
Current income tax liabilities 1 161 1 253
Provisions and other current liabilities 21 5 736 4 979
Total current liabilities from continuing operations 16 027 15 328
Liabilities related to discontinuing operations 23 207
Total current liabilities 16 234 15 328
Total liabilities 26 714 24 568
Total equity and liabilities 68 008 57 732
The accompanying notes form an integral part of the consolidated financial statements.
s_156-185_Notes.qxd 23.1.2007 16:02 Uhr Seite 157

158
N O V A R T I S G R O U P F I N A N C I A L R E P O R T
CONSOLIDATED CASH FLOW STATEMENTS (for the years ended December 31, 2006 and 2005)
2006 2006 2005 2005Note USD millions USD millions USD millions USD millions
Net income from continuing operations 7 019 6 072
Reversal of non-cash items Taxes 1 282 1 090
Depreciation, amortization and impairments on
Property, plant & equipment 1 027 818
Intangible assets 960 861
Financial assets 39 48
Income from associated companies -264 -193
Divestment loss/gain from disposal of subsidiaries 7 -8
Gains on disposal of property, plant & equipment, intangible and financial assets, net -135 -393
Equity settled share-based compensation expense 522 415
Net financial income -88 -167
Total reversal of non-cash items 3 350 2 471
Dividends from associated companies 114 96
Dividends received from marketable securities 8 4
Interest and other financial receipts 398 437
Interest and other financial payments -281 -313
Taxes paid -1 760 -1 345
Cash flow before working capital and provision changes from continuing operations 8 848 7 422
Restructuring payments and other cash payments out of provisions -304 -285
Change in net current assets and other operating cash flow items 22 166 838
Cash flow from operating activities of continuing operations 8 710 7 975
Purchase of property, plant & equipment -1 802 -1 157
Proceeds from disposals of property, plant & equipment 87 73
Purchase of intangible assets -520 -358
Proceeds from disposals of intangible assets 113 250
Purchase of financial assets -825 -782
Proceeds from disposals of financial assets 519 707
Acquisition of additional interests in associated companies -300
Acquisitions and divestments of businesses 23 -4 522 -8 536
Acquisition of minority interests -1 -30
Proceeds from disposals of marketable securities 5 112 6 724
Purchase of marketable securities -4 736 -4 040
Cash flow used for investing activities of continuing operations -6 575 -7 449
Acquisition or disposal of treasury shares, net 253 -231
Proceeds from issuance of share capital to third parties by subsidiaries 1 67
Increase in non-current financial debts 540 15
Repayment of non-current financial debts -182 -886
Change in current financial debts -3 266 2 904
Withholding tax recoverable -232
Dividend payments and cash contributions to minority interests -35 -32
Dividends paid to shareholders of Novartis AG -2 049 -2 107
Cash flow used for financing activities of continuing operations -4 970 -270
Cash flow from discontinuing operations 23 308 76
Net effect of currency translation on cash and cash equivalents 25 -94
Cash and cash equivalents at the end of the year of discontinuing operations -4
Net change in cash and cash equivalents of continuing operations -2 506 238
Cash and cash equivalents at the beginning of the year 6 321 6 083
Cash and cash equivalents at the end of the year of continuing operations 3 815 6 321
The accompanying notes form an integral part of the consolidated financial statements.
s_156-185_Notes.qxd 23.1.2007 16:02 Uhr Seite 158

159
0 2 | G R O U P R E V I E W 1 2 | O P E R AT I O N A L R E V I E W 5 6 | C O R P O R AT E C I T I Z E N S H I P 9 3 | C O R P O R AT E G O V E R N A N C E 1 2 7 | N O V A R T I S G R O U P F I N A N C I A L R E P O R T
Novartis Group Consolidated Financial Statements
CONSOLIDATED STATEMENTS OF RECOGNIZED INCOME AND EXPENSE (for the years ended December 31, 2006 and 2005)
2006 2005Note USD millions USD millions
Net income from continuing operations 7 019 6 072
Fair value adjustments on financial instruments 24.1 94 -75
Actuarial gains/losses from defined benefit plans, net 24.2 141 -400
Novartis share of equity recognized by associated companies 24.3 -76 41
Revaluation of initial minority Chiron Corporation investment 24.4 592
Translation effects1 24.5 1 486 -1 968
Amounts related to discontinuing operations– net income 183 69
– other 5 -10
Total recognized income and expense 9 444 3 729
Attributable to shareholders of Novartis AG 9 416 3 720
Attributable to minority interests 28 9
1Thereof USD 1 million associated with minority interests (2005: USD -2 million) The accompanying notes form an integral part of the consolidated financial statements.
CONSOLIDATED STATEMENT OF CHANGES IN EQUITY (for the years ended December 31, 2006 and 2005)
Totalfair values Fair value
adjustments adjustments ofShare Treasury Share Retained attributable Total discontinuing Minority Total
capital shares premium earnings to Novartis reserves operations interests equityNote USD millions USD millions USD millions USD millions USD millions USD millions USD millions USD millions USD millions
Total equity at January 1, 2005 1 008 -159 202 29 661 465 30 328 138 31 315
Total recognized income and expense 6 171 -2 451 3 720 9 3 729
Dividends 25.1 -2 107 -2 107 -2 107
Acquisition of treasury shares, net 25.2 -1 -244 -244 -245
Reduction in share capital 25.3 -14 14
Share-based compensation 25.4 445 445 445
Changes in minority interests 27 27
Transfers 25.5 -3 3
Total of other equity movements -14 13 -3 -1 903 -1 906 27 -1 880
Total equity at December 31, 2005 994 -146 199 33 929 -1 986 32 142 174 33 164
Total recognized income and expense 7 099 2 317 9 416 28 9 444
Transfers to discontinuing operations 25.5 1 1 -1
Dividends 25.1 -2 049 -2 049 -2 049
Sales of treasury shares, net 25.2 2 246 246 248
Reduction in share capital 25.3 -4 4
Share-based compensation 25.4 506 506 506
Changes in minority interests -19 -19
Transfers 25.5 -1 1 -5 -5 5
Total of other equity movements -4 6 -1 -1 296 -4 -1 301 4 -19 -1 314
Total equity at December 31, 2006 990 -140 198 39 732 327 40 257 4 183 41 294
The accompanying notes form an integral part of the consolidated financial statements.
s_156-185_Notes.qxd 23.1.2007 16:02 Uhr Seite 159

160
N O V A R T I S G R O U P F I N A N C I A L R E P O R T
1. Accounting policies
The Novartis Group (Group or Novartis) consolidated financial state-ments comply with the International Financial Reporting Stan-dards (IFRS) and interpretations formulated by the InternationalAccounting Standards Board (IASB) and with International Account-ing Standards (IAS) and interpretations formulated by its prede-cessor organization the International Accounting Standards Com-mittee (IASC), as well as with the following significant accountingpolicies. They are prepared in accordance with the historical costconvention except for items which are required to be accounted forat fair value.
The preparation of financial statements requires managementto make estimates and other judgments that affect the reportedamounts of assets and liabilities as well as disclosure of contingentassets and liabilities at the date of the financial statements and thereported amounts of revenues and expenses during the reportingperiod. Actual outcomes could differ from those estimates.
Scope of consolidation The consolidated financial statements include all companies whichNovartis AG, Basel, Switzerland directly or indirectly controls (gener-ally over 50% of voting interest). Special purpose entities, irrespec-tive of their legal structure, are consolidated in instances where theGroup has the power to govern the financial and operating policiesof an entity so as to obtain benefits from their activities.
Investments in associated companies (defined as investments incompanies where Novartis holds between 20% and 50% of a com-pany’s voting shares or over which it otherwise has significant influ-ence) and joint ventures are accounted for by using the equitymethod, with the Group recording its share of the associated com-pany’s net income and equity. The Group’s share in the results of itsassociated companies is included in one income statement line andis calculated after deduction of their respective taxes and minorityinterests.
Principles of consolidationThe annual closing date of the individual financial statements isDecember 31. The financial statements of consolidated companiesoperating in high-inflation economies are adjusted to eliminate theimpact of high inflation.
The purchase method of accounting is used to account for businesscombinations by the Group in transactions where the Group takescontrol of another entity. The cost of an acquisition is measured asthe fair value of the assets transferred to the seller and liabilitiesincurred or assumed at the date of exchange, plus costs directlyattributable to the acquisition. Identifiable assets acquired and lia-bilities and contingent liabilities assumed in a business combinationare measured initially at their full fair values at the acquisition date,irrespective of the extent of any minority interest. The excess of thecost of acquisition over the fair value of the Group’s share of theidentifiable net assets acquired is recorded as goodwill. Companiesacquired or disposed of during the year are included in the consol-idated financial statements from the date of acquisition or up to thedate of disposal.
Novartis was formed on December 20, 1996 when all assets andliabilities of Sandoz AG and Ciba-Geigy AG were transferred by uni-versal succession to Novartis AG. The uniting of interests methodwas used to account for this transaction. If it were undertaken today,the merger would require a different accounting treatment.
Intercompany income and expenses, including unrealized prof-its from internal Novartis transactions and intercompany receivablesand payables have been eliminated.
Early adoption of new IFRS standards IFRS 7, Financial Instruments: Disclosures, and the complementaryAmendment to IAS 1; Presentation of Financial Statements – CapitalDisclosures, were early adopted in 2006. These standards introducenew disclosures relating to financial instruments, which have beenincorporated into these consolidated financial statements. They donot have any impact on the classification and valuation of theGroup’s financial instruments.
Foreign currenciesThe consolidated financial statements of Novartis are expressed inUS dollars (USD). The functional currency of certain Swiss and for-eign finance companies used for preparing the financial statementsis USD instead of the respective local currency. This reflects theseentities’ cash flows and transactions being primarily denominated in USD. Generally, the local currency is used as the functional cur-rency for other entities. In the respective entity financial statements,monetary assets and liabilities denominated in foreign currenciesare translated at the rate prevailing at the balance sheet date. Trans-actions are recorded using the approximate exchange rate at thetime of the transaction. All resulting foreign exchange transactiongains and losses are recognized in the entity’s income statement.
NOTES TO THE NOVARTIS GROUP CONSOLIDATED FINANCIAL STATEMENTS
s_156-185_Notes.qxd 23.1.2007 16:02 Uhr Seite 160

161
0 2 | G R O U P R E V I E W 1 2 | O P E R AT I O N A L R E V I E W 5 6 | C O R P O R AT E C I T I Z E N S H I P 9 3 | C O R P O R AT E G O V E R N A N C E 1 2 7 | N O V A R T I S G R O U P F I N A N C I A L R E P O R T
Notes to the Novartis Group Consolidated Financial Statements
Income, expense and cash flows of the consolidated entities havebeen translated into US dollars using the average of the monthlyexchange rates during the year. Balance sheets are translated usingthe year end exchange rates. Translation differences arising frommovements in the exchange rates used to translate equity and long-term intercompany financing transactions relating to the net invest-ment in a foreign entity, retained earnings and other equity com-ponents and net income for the year are allocated directly to thecumulative translation effects included in the fair value adjustmentsin equity. Translation gains and losses accumulated in the fair valueadjustments in equity are included in the income statement whenthe foreign operation is completely or partially liquidated or sold.
Derivative financial instruments and hedgingDerivative financial instruments are initially recognized in the balancesheet at fair value and subsequently remeasured to their fair value.
The method of recognizing the resulting gain or loss is depend-ent on whether a derivative contract is designed to hedge a specificrisk and qualifies for hedge accounting. The purpose of hedgeaccounting is to match the impact of the hedged item and thehedging instrument in the income statement. To qualify for hedgeaccounting, the hedging relationship must meet several strict con-ditions with respect to documentation, probability of occurrence,hedge effectiveness and reliability of measurement. At the inceptionof the transaction the Group documents the relationship betweenhedging instruments and hedged items, as well as its risk man-agement objective and strategy for undertaking various hedge trans-actions. This process includes linking all derivatives designated ashedges to specific assets and liabilities or to specific firm commit-ments or forecasted transactions. The Group also documents itsassessment, both at the hedge inception and on an ongoing basis,as to whether the derivatives that are used in hedging transactionsare highly effective in offsetting changes in fair values or cash flows of hedged items. On the date a derivative contract is enteredinto, the Group designates derivatives which qualify as hedges foraccounting purposes as either a) a hedge of the fair value of a recog-nized asset or liability (fair value hedge), or b) a hedge of a forecast-ed transaction or firm commitment (cash flow hedge) or c) a hedgeof a net investment in a foreign entity.
Changes in the fair value of derivatives which are fair valuehedges and that are highly effective are recognized in the incomestatement, along with any changes in the fair value of the hedgedasset or liability that is attributable to the hedged risk. Any gain orloss on the hedging instrument relating to the effective portion ofchanges in the fair value of derivatives in cash flow hedges are rec-ognized in the statement of recognized income and expense. Thegain or loss relating to the ineffective portion is recognized immedi-ately in the income statement. Where a forecasted transaction orfirm commitment results in the recognition of a non-financial assetor non-financial liability, the gains or losses previously recorded inthe statement of recognized income and expense are included in theinitial measurement of the asset or liability. Otherwise, amounts
recorded in the statement of recognized income and expense aretransferred to the income statement and classified as revenue orexpense in the same period in which the forecasted transactionaffects the income statement.
Hedges of net investments in foreign entities are accounted forsimilarly to cash flow hedges. The Group hedges certain net invest-ments in foreign entities. All foreign exchange gains or losses arisingon translation are included in cumulative translation effects and rec-ognized in the statement of recognized income and expense. Gainsand losses accumulated in equity are included in the income state-ment when the foreign operation is completely or partially liquidat-ed or sold.
Certain derivative instruments, while providing effective eco-nomic hedges under the Group’s policies, do not qualify for hedgeaccounting. Changes in the fair value of any derivative instrumentsthat do not qualify for cash flow hedge accounting are recognizedimmediately in financial income in the income statement.
When a hedging instrument expires or is sold, or when a hedgeno longer meets the criteria for hedge accounting, any cumulativegain or loss existing in the statement of recognized income andexpense at that time is recognized in the income statement whenthe committed or forecasted transaction is ultimately recognized inthe income statement. However, if a forecasted or committed trans-action is no longer expected to occur, the cumulative gain or lossthat was recognized in the statement of recognized income andexpense is immediately transferred to the income statement.
Property, plant & equipmentProperty, plant & equipment have been valued at cost of acquisitionor production cost and are depreciated on a straight-line basis to theincome statement over the following estimated useful lives:Buildings 20 to 40 years Other property, plant and equipment:
– Machinery and equipment 7 to 20 years – Furniture and vehicles 5 to 10 years – Computer hardware 3 to 7 years Land is valued at acquisition cost except if held under long-term
lease arrangements, when it is amortized over the life of the lease.Land held under long-term lease agreements relates to initial pay-ments to lease land on which certain of the Group’s buildings arelocated. Additional costs which enhance the future economic bene-fit of property, plant & equipment are capitalized. Property, plant &equipment is reviewed for impairment whenever events or changesin circumstances indicate that the balance sheet carrying amountmay not be recoverable. Financing costs associated with the con-struction of property, plant & equipment are not capitalized. Proper-ty, plant & equipment which are financed by leases giving Novartissubstantially all the risks and rewards of ownership are capitalizedat the lower of the fair value of the leased property or the presentvalue of minimum lease payments at the inception of the lease, anddepreciated in the same manner as other property, plant & equip-ment over the shorter of the lease term or their useful life.
s_156-185_Notes.qxd 23.1.2007 16:02 Uhr Seite 161
162
N O V A R T I S G R O U P F I N A N C I A L R E P O R T
Intangible assetsFor business combinations, the excess of the purchase price over thefair value of net identifiable assets acquired is recorded as goodwillin the balance sheet and is denominated in the local currency of therelated acquisition. Goodwill is allocated to operations using a con-cept based on defining cash-generating units, which are at least onelevel below the divisional segmentation. All goodwill is considered tohave an indefinite life and is subject to at least annual impairment testing. Any goodwill impairment charge is recorded in the incomestatement in Other Income and Expense. Goodwill that is embeddedin the equity accounting for associated companies is also assessedannually for impairment with any resulting charge recorded in theresults from associated companies.
Under IFRS 3, In-Process Research & Development (IPR&D) isvalued as part of the process of allocating the purchase price in anew business combination. This amount needs to be recorded sepa-rately from goodwill and is allocated to cash-generating units andmust be assessed for impairment on an annual basis. Any impair-ment charge is recorded in Research & Development (R&D) expenses.Once a project included in IPR&D has been successfully developedand is available for use, it is amortized over its useful life into Cost ofGoods Sold where any related impairment charge is also recorded.
Under IAS 38 (revised), acquired assets in development, such asthose related to initial and milestone payments on licensed oracquired compounds are capitalized as intangible assets, even ifuncertainties exist as to whether the R&D will ultimately be success-ful in producing a saleable product.
Acquired intangible assets are amortized on a straight-line basisover the following periods with the charge recorded in the applicablefunctional cost lines in the income statement:
Trademarks Over their estimated eco-nomic or legal life with amaximum of 20 years
Product and marketing rights 5 to 20 years Core development technologies Over their estimated use-
ful life, typically between15 and 30 years
Software 3 years Others 3 to 5 years Product and marketing rights are acquired either individually
or as part of a business combination, in which case they are allocat-ed to cash-generating units. The useful lives assigned to acquiredproduct rights are based on the maturity of the products and theestimated economic benefit that such product rights can provide.Amortization of trademarks, product and marketing rights ischarged to Cost of Goods Sold over their useful lives, commencingin the year in which the rights first generate sales. Core developmenttechnologies, which represent identified and separable acquired
know-how used in the development process, is amortized into Costof Goods Sold or R&D. Any impairment charges are recorded in theincome statement in the same functional cost lines as the amor-tization charges.
Intangibles other than goodwill and IPR&D are reviewed forimpairment whenever facts and circumstances indicate that theircarrying value may not be recoverable. When there is an indicationthat the asset value may not be fully recoverable, the Group esti-mates its fair value less cost to sell based on the future cash flowsexpected to result from the use of the asset and its eventual dispo-sition. If the balance sheet carrying amount of the asset is greaterthan the higher of its value in use to Novartis or its anticipated fairvalue less costs to sell, an impairment loss for the difference is rec-ognized. For purposes of assessing impairment, assets are groupedat the lowest level for which there are separately identifiable cash-generating units. Considerable management judgment is necessaryto estimate discounted future cash flows. Accordingly, actual cashflows could vary significantly from forecasted cash flows.
Financial assetsInvestments other than those related to associated companies andjoint ventures are initially recorded at fair value on the trade dateand subsequently carried at fair value. Debt and equity securitiesare carried at fair value. The fair values of quoted investments arebased on current market prices. If the market for a financial asset isnot active or no market is available, fair values are established byusing valuation techniques. These include the use of most recentarm’s length transactions, such as new financing rounds or partialsales, reference to other instruments that are substantially the sameor discounted cash flow analysis, and other pricing models makingmaximum use of market inputs and relying as little as possible onentity-specific inputs. Exchange rate gains and losses on loans arerecorded in the income statement. Loans are carried at amortizedcost, less any allowances for uncollectable amounts. All otherchanges in the fair value of financial assets are deferred as a fair value adjustment in the statement of recognized income andexpense and recycled to the income statement when the asset issold. Impairments in value are immediately expensed.
InventoriesPurchased products are valued at acquisition cost while own-manu-factured products are valued at manufacturing cost including relat-ed production expenses. In the balance sheet, inventory is valued athistorical cost determined on a first-in first-out basis, and this valueis used for the Cost of Goods Sold in the income statement. Provi-sions are made for inventories with a lower market value or whichare slow-moving. If it becomes apparent that the inventory can beused, provisions are reversed with inventory being revalued up tothe lower of its estimated market value or original cost. Unsaleableinventory is fully written off.
1. Accounting policies (continued)
s_156-185_Notes.qxd 23.1.2007 16:02 Uhr Seite 162
163
0 2 | G R O U P R E V I E W 1 2 | O P E R AT I O N A L R E V I E W 5 6 | C O R P O R AT E C I T I Z E N S H I P 9 3 | C O R P O R AT E G O V E R N A N C E 1 2 7 | N O V A R T I S G R O U P F I N A N C I A L R E P O R T
Notes to the Novartis Group Consolidated Financial Statements
Trade accounts receivableThe reported values represent the invoiced amounts, less adjust-ments for doubtful receivables, chargebacks and cash discounts.Doubtful receivable provisions are established based upon the differ-ence between the receivable value and the estimated net collectibleamount. The amount of the respective estimated loss is recognizedin the income statement within Marketing & Sales expenses. When a trade account receivable becomes uncollectible, it is written offagainst the doubtful accounts receivable provisions.
Cash and cash equivalentsCash and cash equivalents include highly liquid investments withoriginal maturities of three months or less. This position is readilyconvertible to known amounts of cash. Bank overdrafts are present-ed within other bank and financial debt within current financialdebts on the balance sheet.
Marketable securitiesMarketable securities consist of equity and debt securities which areprincipally traded in liquid markets. The Group has classified all itsmarketable securities as available-for-sale, as they are not acquiredto generate profit from short-term fluctuations in price. All purchas-es and sales of marketable securities are recognized on the tradedate, which is the date that the Group commits to purchase or sellthe asset. Marketable securities are initially recorded at fair value and subsequently carried at fair value. Exchange rate gains and losses ondebt securities are recorded in the income statement. All otherchanges in the fair value of unhedged securities are deferred as a fairvalue adjustment in the statement of recognized income and expenseand recycled to the income statement when the asset is sold orimpaired. Where hedge accounting is applied, the change in fair value of effectively hedged securities is recorded in the income statement where it offsets the gains or losses of the hedging derivative.
Unrealized losses on impaired marketable securities are includ-ed as a reduction of financial income in the income statement. A security is assessed for impairment when its market value at thebalance sheet date is less than initial cost reduced by any previ-ously recognized impairment.
Repurchase agreementsUnderlying securities related to repurchase agreements are includ-ed within marketable securities. Repurchase financing agreementsfor sold but agreed to be repurchased securities are recognizedgross and included in short-term financial debts. Income andexpenses are recorded in interest income and expense, respectively.
TaxesTaxes on income are provided in the same periods as the revenuesand expenses to which they relate. Deferred taxes are determinedusing the comprehensive liability method and are calculated on thetemporary differences that arise between the tax base of an asset orliability and its carrying value in the entity’s balance sheet preparedfor consolidation purposes, except for those temporary differencesrelated to investments in entities and associated companies, wherethe timing of their reversal can be controlled and it is probable thatthe difference will not reverse in the foreseeable future. Furthermore,withholding or other taxes on eventual distribution of entities’retained earnings are only taken into account where a dividend hasbeen planned since generally the retained earnings are reinvested.Deferred tax assets or liabilities, measured at the tax rates that areexpected to apply in the period of tax settlement or realization bythe applicable entity, are included in the consolidated balance sheetas either a non-current asset or liability, with changes in the yearrecorded in the income statement in tax expense or in the statementof recognized income and expense, if they relate to an item directlyrecorded in this statement. Deferred tax assets on an entity’s taxableloss are recognized to the extent future taxable profits will probablybe available against which they can be utilized.
Defined benefit pension plans, other post-employment benefits and other non-current benefits of associates
a) Defined benefit pension plans
The liability in respect of defined benefit pension plans is the definedbenefit obligation calculated annually by independent actuaries usingthe projected unit credit method. The defined benefit obligation ismeasured at the present value of the estimated future cash flows. Thecharge for such pension plans, representing the net periodic pensioncost, is included in the personnel expenses of the various functionswhere the associates are located. Plan assets are recorded at their fairvalues. Unvested past service costs arising from amendments to pen-sion plans are charged or credited to income over the associates’remaining vesting period. Vested past service costs and amountsrelated to retired associates are immediately recognized in theincome statement. Gains or losses arising from plan curtailments orsettlements are accounted for at the time they occur. Any recognizedpension asset is limited to the present value of future economic ben-efits available in the form of refunds from the plan and/or expectedreductions in future contributions to the plan.
s_156-185_Notes.qxd 23.1.2007 16:02 Uhr Seite 163
164
N O V A R T I S G R O U P F I N A N C I A L R E P O R T
Novartis adopts an alternative under IAS 19, with the effects ofchanges in actuarial assumptions and experience adjustments usedfor valuing the assets and liabilities of defined benefit plans at fairvalue at the balance sheet date, being immediately recognized in thebalance sheet with a corresponding movement in the statement ofrecognized income and expense.
b) Other post-employment benefits
Certain subsidiaries provide healthcare and insurance benefits for a portion of their retired associates and their eligible depend-ents. The cost of these benefits is actuarially determined and amor-tized over the service lives of the related associates and included inthe personnel expenses of the various functions where the associ-ates are located. The related obligation is recognized in non-currentliabilities.
c) Other non-current benefits of associates
Other non-current benefits of associates represent amounts due toassociates under deferred compensation arrangements mandatedby certain jurisdictions in which the Group conducts its operations.Benefit costs are recognized on an accrual basis in the personnelexpenses of the various functions where the associates are located.The related obligation is recognized in other non-current liabilities.
Share-based compensationThe fair value of Novartis shares, Novartis American DepositaryShares (ADS) and related options granted to associates as compen-sation is recognized as an expense. Novartis calculates the fair value of the options at the grant date using the trinomial valuationmethod, which is a variant of the lattice binomial approach. Sharesand ADSs are valued using the market value on the grant date. Theamounts for options and other share-based compensation arecharged to income over the relevant vesting or service periods,adjusted to reflect actual and expected levels of vesting. The chargefor share-based compensation is included in the personnel expens-es of the various functions where the associates are located.
Revenue recognitionRevenue is recognized when title and risks and rewards for the prod-ucts are transferred to the customer. Provisions for rebates and discounts granted to government agencies, wholesalers, managedcare and other customers are recorded as a reduction of revenue atthe time the related revenues are recorded or when the incentivesare offered. They are calculated on the basis of historical experienceand the specific terms in the individual agreements. Cash discountsare offered to customers to encourage prompt payment and arerecorded as revenue deductions. Wholesaler shelf-inventory adjust-ments are granted to customers based on the existing inventory ofa product at the time of decreases in the invoice or contract price ofa product or at the point of sale if a price decline is reasonablyestimable. Where there is a historical experience of Novartis agree-ing to customer returns, Novartis records a provision for estimatedsales returns by applying historical experience of customer returnsto the amounts invoiced and the amount of returned products to be destroyed versus products that can be placed back in inventoryfor resale. Provisions for revenue deductions are adjusted to actualamounts as rebates, discounts and returns are processed.
Internal research & developmentInternal research and development expenses are fully charged to theincome statement. The Group considers that regulatory and otheruncertainties inherent in the development of new products precludeit from capitalizing internal development costs.
Laboratory buildings and equipment included in property, plant &equipment are depreciated, and acquired core development tech-nologies included in intangibles are amortized, over their estimateduseful lives.
External research & developmentExpenses for research & development contracts with external partiesif they are not qualifying for capitalization are recognized based ontheir percentage of completion.
Government grantsGovernment grants are deferred and recognized in the income state-ment over the period necessary to match them with the relatedcosts which they are intended to compensate.
Product liabilitiesProvisions are made for present obligations resulting from past salesincluding supporting legal fees. The provision is actuarially deter-mined taking into consideration such factors as past experience,amount and number of claims reported and estimates of claimsincurred but not yet reported. Individually significant cases are pro-vided for when probable and reasonably estimable.
1. Accounting policies (continued)
s_156-185_Notes.qxd 23.1.2007 16:02 Uhr Seite 164

165
0 2 | G R O U P R E V I E W 1 2 | O P E R AT I O N A L R E V I E W 5 6 | C O R P O R AT E C I T I Z E N S H I P 9 3 | C O R P O R AT E G O V E R N A N C E 1 2 7 | N O V A R T I S G R O U P F I N A N C I A L R E P O R T
Notes to the Novartis Group Consolidated Financial Statements
Environmental liabilitiesNovartis is exposed to environmental liabilities relating to its pastoperations, principally in respect to remediation costs. Provisions fornon-recurring remediation costs are made when expenditure onremedial work is probable and the cost can be reliably estimated.Cost of future expenditures do not usually reflect any insurance orother claims or recoveries, as Novartis only recognizes insurance orother recoveries at such time the amount is reasonably estimableand collection is virtually certain. Recurring remediation costs areprovided under non-current liabilities and are estimated by calculat-ing the discounted amounts of such annual costs for the next 30years.
Restructuring chargesRestructuring charges are accrued against operating income in theperiod in which Management has committed to a plan, the liabilityhas been incurred and the amount can be reasonably estimated.Restructuring charges or releases are included in Other Income &Expense.
DividendsDividends are recorded in the Group’s financial statements in theperiod in which they are approved by the Group’s shareholders.
Treasury sharesTreasury shares are deducted from equity at their nominal value ofCHF 0.50 per share. Differences between this amount and theamount paid for acquiring, or received for disposing of, treasuryshares are recorded in retained earnings.
2. Business combinations and othersignificant transactions
The following business combinations and other significant trans-actions occurred during 2006 and 2005. See notes 3 and 23 for fur-ther details of the impact of these transactions on the consolidatedfinancial statements.
Acquisitions 2006
Corporate – Chiron acquisitionOn April 19, Chiron shareholders approved the acquisition of theremaining 56% of the shares of Chiron Corporation that Novartis didnot already own for USD 48.00 per share. The amounts paid for theshares, related options of associates and transaction costs totaledapproximately USD 5.7 billion. The transaction was completed on April20. Novartis has created a new division called Vaccines and Diagnosticsconsisting of two activities: human vaccines named Novartis Vaccinesand a diagnostics activity named Chiron. Chiron’s biopharmaceuticalsactivities were integrated into the Pharmaceuticals Division.
For the period from January 1 to the date of acquisition, the prior44% interest in Chiron has been accounted for using the equitymethod. From its date of acquisition Chiron has been fully consoli-dated with its identifiable assets and liabilities being revalued to theirfair value at the date of acquisition. The acquisition of the remaining56% of this company has resulted in the requirement to revalue theinitial 44% interest by USD 0.6 billion to the proportionate share ofthe fair value of identified assets and liabilities.
PharmaceuticalsAs part of the Chiron transaction, which was completed on April 20and discussed above, Chiron’s pharmaceuticals activities have beenintegrated into the Pharmaceuticals Division. Included in this port-folio are products for the treatment of cystic fibrosis, renal/skincancer and skin infections. Chiron’s early-stage research has beenincorporated into the Pharmaceuticals Division research unit, theNovartis Institutes for BioMedical Research (NIBR). For the periodfollowing the acquisition up to December 31, the income statementand cash flows from Chiron’s pharmaceuticals activities have beenconsolidated into the Division’s results. The balance sheet that hasbeen consolidated is provisional pending finalization of the pur-chase price allocation as a result of continuing negotiations withBayer-Schering AG concerning the rights of each party in connectionwith the Betaseron regulatory, development, manufacturing andsupply agreements and the impact that this has on related intan-gible and other asset values. Due to this, and continuing tax relateduncertainties as of the April 20, 2006 acquisition date, goodwill onthis transaction at December 31, 2006, of USD 1.9 billion remainsprovisional.
s_156-185_Notes.qxd 23.1.2007 16:02 Uhr Seite 165
166
N O V A R T I S G R O U P F I N A N C I A L R E P O R T
On July 14, Novartis announced that its offer for the UK biopharma-ceutical company NeuTec Pharma plc, which is specialized in hos-pital anti-infectives, became unconditional and the company hasbeen consolidated from this date. Novartis paid a total considerationof USD 606 million (GBP 328 million) to fully acquire the company.NeuTec Pharma plc had no post-acquisition sales, although expens-es and cash flows have been consolidated from the acquisition date.Goodwill on this transaction at December 31, 2006 amounted toUSD 129 million.
Vaccines and DiagnosticsFor the period following the Chiron acquisition up to December 31,the income statement and cash flows from the vaccines and diagnos-tics activities have been consolidated into the Division’s results. Good-will on this transaction at December 31, 2006, amounted to USD 1.1billion. Due to continuing tax related uncertainties as of the April 20,2006 acquisition date this goodwill amount remains provisional.
Pro forma data including acquisitions for all of 2006
Had the Chiron Corporation and NeuTec Pharma plc transactionsbeen consummated on January 1, 2006, then pro forma 2006 twelvemonth Novartis net sales and operating income on continuing oper-ations would have been approximately USD 36.4 billion and USD 7.5billion, respectively.
Divestments/discontinuing operations 2006
Consumer HealthOn February 17, Novartis announced the completion of the sale ofits Nutrition & Santé unit, part of the Medical Nutrition BusinessUnit, for USD 211 million to ABN AMRO Capital France, resulting ina divestment gain before taxes of USD 129 million.
On December 14, Novartis announced its intention to divest theremainder of the Medical Nutrition Business Unit to Nestlé S.A.,Switzerland for USD 2.5 billion. This transaction, which is subject to customary regulatory approvals, is expected to be completed inthe second half of 2007.
Both the Nutrition & Santé unit and the remainder of the MedicalNutrition Business Unit are disclosed as discontinuing operations inall periods in the Group’s consolidated financial statements.
Acquisitions 2005
SandozOn June 6, Novartis completed the 100% acquisition of Hexal AG forUSD 5.3 billion in cash, with the results and cash flows consolidatedfrom that date. Goodwill on this transaction at December 31, 2006,amounted to USD 3.7 billion.
On July 20, Novartis completed the acquisition of 100% of EonLabs, Inc. for a total cost of USD 2.6 billion, with the results and cashflows consolidated from that date. Goodwill on this transaction atDecember 31, 2006, amounted to USD 1.8 billion.
Consumer HealthOn July 14, the Novartis OTC Business Unit announced the acquisi-tion of the rights to produce and market a portfolio of over-the-counter (OTC) brands from Bristol-Myers Squibb Company soldprincipally in the US for USD 660 million in cash. The closing datefor the main North American product portfolio was August 31, 2005; that for the South American portfolio, September 30, 2005and for the Europe, Middle East and Africa portfolio, January 6, 2006 with the results and cash flows consolidated from these dates.Goodwill on the transaction at December 31, 2006, amounted toUSD 49 million.
2. Business combinations and othersignificant transactions (continued)
s_156-185_Notes.qxd 23.1.2007 16:02 Uhr Seite 166

167
0 2 | G R O U P R E V I E W 1 2 | O P E R AT I O N A L R E V I E W 5 6 | C O R P O R AT E C I T I Z E N S H I P 9 3 | C O R P O R AT E G O V E R N A N C E 1 2 7 | N O V A R T I S G R O U P F I N A N C I A L R E P O R T
Notes to the Novartis Group Consolidated Financial Statements
Operating DivisionsNovartis is divided operationally on a worldwide basis into fourDivisions: Pharmaceuticals, Vaccines and Diagnostics, Sandoz andConsumer Health. These Divisions, which are based on internalmanagement structures and are managed separately because theymanufacture, distribute, and sell distinct products which require differing marketing strategies, are as follows:
The Pharmaceuticals Division researches, develops, manufac-tures, distributes, and sells branded pharmaceuticals in the follow-ing therapeutic areas: cardiovascular and metabolism, oncology andhematology, neuroscience, respiratory and dermatology, arthritis,bone therapy, gastrointestinal and urinary tract diseases, infectiousdiseases, transplantation and immunology, and ophthalmics. ThePharmaceuticals Division is organized into business franchisesresponsible for marketing certain products, and a business unitresponsible for the Novartis Oncology Business. The Oncology busi-ness unit is not required to be separately disclosed as a segment,due to the fact that it shares common long-term economic perspec-tives, customers, research, development, production, distributionand regulatory environments with the remainder of the Pharmaceu-ticals Division.
The Vaccines and Diagnostics Division consists of two activities:Vaccines and Chiron. Novartis Vaccines manufactures, distributesand sells vaccines worldwide, Chiron manufactures, distributes andsells blood testing and molecular diagnostics products.
The Sandoz Division is organized as a Retail Generics activitywhich also operates an Anti-Infectives activity. In Retail Generics,Sandoz develops and manufactures active ingredients and finisheddosage forms that are no longer covered by patents. Retail Genericsincludes the development and manufacture of biopharmaceuticals.Retail Generics also supplies certain active ingredients to third par-ties. In Anti-Infectives, Sandoz develops and manufactures off-patent active pharmaceutical ingredients and intermediates – main-ly antibiotics – for internal use by Retail Generics and for sale tothird-party customers.
The Consumer Health Division consists of the following fourBusiness Units: OTC (over-the-counter medicines), Animal Health,Gerber and CIBA Vision. Each has manufacturing, distribution andselling capabilities, however, none are material enough to the Groupto be separately disclosed as segments. The OTC Business Unitactivities cover over-the-counter self medications. The activities ofthe Animal Health Business Unit cover veterinary products for farmand companion animals. The activities of the Gerber Business Unitcover foods and other products and services designed to serve theparticular needs of infants and babies. The activities of the CIBAVision Business Unit cover contact lenses, lens care products, andophthalmic products.
The Medical Nutrition Business Unit has been classified as a discon-tinuing operation for all periods in these consolidated financialstatements as a consequence of the December 14, 2006 announce-ment to divest this activity. The activities of the Medical NutritionBusiness Unit cover health and medical nutrition products. Alsotreated as a discontinuing operations for all periods is the Nutrition& Santé unit of the Medical Nutrition Business Unit which was divest-ed in February 2006.
Inter-Divisional sales are made at amounts which are consid-ered to approximate arm’s length transactions. The accounting poli-cies of the Divisions are the same as those of the Group. The Groupprincipally evaluates Divisional performance and allocates resourcesbased on operating income.
Division net operating assets consist primarily of property, plant &equipment, intangible assets, inventories and receivables less oper-ating liabilities.
CorporateIncome and expenses relating to Corporate include the costs of theGroup headquarters and those of corporate coordination functionsin major countries. In addition, Corporate includes certain items ofincome and expense which are not attributable to specific Divisions.Usually, no allocation of Corporate items is made to the Divisions.Corporate assets and liabilities principally consist of net liquidity(cash and cash equivalents, marketable securities less financialdebts), investments in associated companies and deferred and cur-rent taxes.
3. Divisional segmentation of key figures2006 and 2005
s_156-185_Notes.qxd 23.1.2007 16:02 Uhr Seite 167

168
N O V A R T I S G R O U P F I N A N C I A L R E P O R T
DIVISIONAL SEGMENTATION OF KEY FIGURES 2006 AND 2005
Vaccines andPharmaceuticals Diagnostics Sandoz
(in USD millions) 2006 2005 2006 2006 2005
Net sales to third parties 22 576 20 262 956 5 959 4 694
Sales to other Divisions 162 128 9 148 144
Net sales of Divisions 22 738 20 390 965 6 107 4 838
Other revenues 424 253 231 24 18
Cost of goods sold -3 826 -3 275 -795 -3 420 -2 883
Of which amortization and impairments of product and marketing rights and trademarks -225 -195 -172 -288 -169
Gross profit 19 336 17 368 401 2 711 1 973
Marketing & sales -7 069 -6 485 -124 -1 061 -816
Research & development -4 265 -3 972 -148 -477 -434
General & administration -703 -657 -92 -311 -270
Other income & expense -596 -240 -63 -126 -111
Of which amortization and impairments of capitalized intangible assetsincluded in function costs -119 -342 -38 -57
Operating income 6 703 6 014 -26 736 342
Income from associated companies -44 19 7 2
Financial income
Interest expense
Income before taxes
Taxes
Group net income
Attributable to Shareholders of Novartis AG
Minority interests
Included in operating income are: Depreciation of property, plant & equipment -551 -490 -48 -233 -195
Amortization of intangible assets -268 -178 -172 -279 -189
Impairment charges on property, plant & equipment -3 -7 -14
Impairment charges on intangible assets -76 -359 -47 -37
Impairment charges on financial assets -34 -38
Additions to restructuring provision -85 -54 -30 -51
Divestment gains or losses from disposal of subsidiaries -7
Share-based compensation of Novartis equity plans -450 -384 -1 -25 -9
Total assets 20 418 14 655 5 609 15 009 14 057
Total liabilities -6 778 -5 848 -1 073 -1 545 -1 342
Total equity 13 640 8 807 4 536 13 464 12 715
Less net liquidity
Net operating assets 13 640 8 807 4 536 13 464 12 715
Included in total assets are: Total property, plant & equipment 6 439 5 053 605 2 430 2 216
Additions to property, plant & equipment 1 135 686 113 264 212
Total intangible assets 6 071 1 670 3 632 9 542 9 331
Additions to intangible assets 351 211 13 38 24
Total investment in associated companies 2 1 471 1 15 10
3. Divisional segmentation of key figures 2006 and 2005 (continued)
s_156-185_Notes.qxd 23.1.2007 16:02 Uhr Seite 168
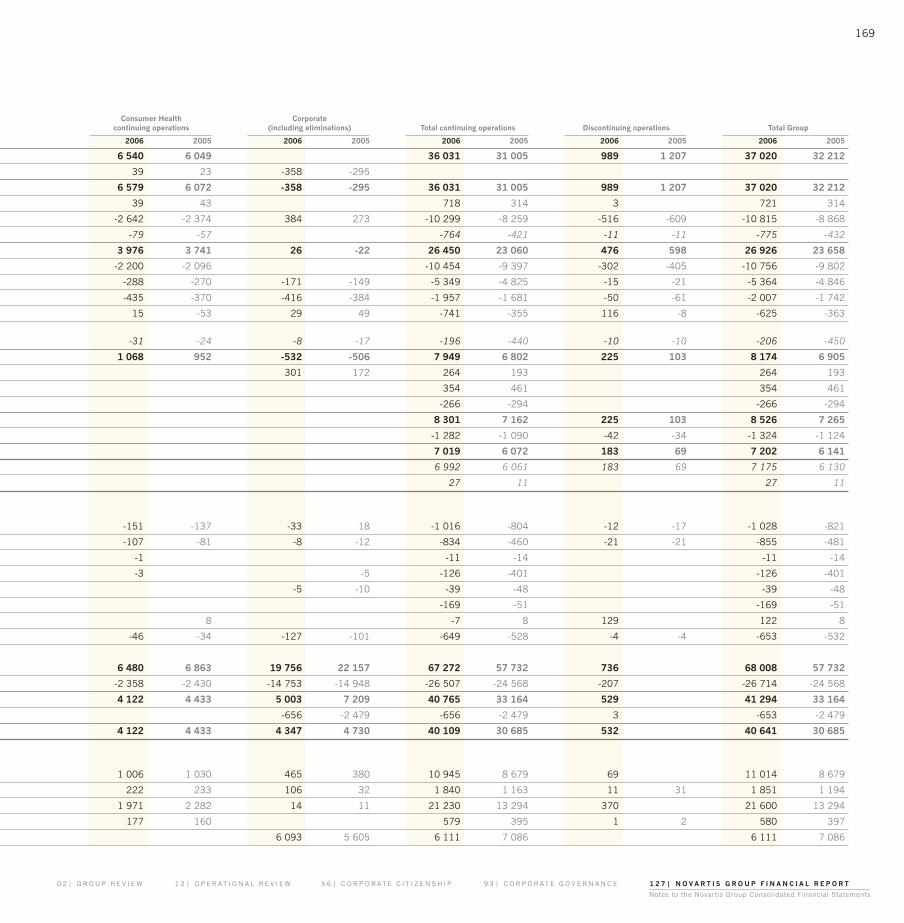
169
0 2 | G R O U P R E V I E W 1 2 | O P E R AT I O N A L R E V I E W 5 6 | C O R P O R AT E C I T I Z E N S H I P 9 3 | C O R P O R AT E G O V E R N A N C E 1 2 7 | N O V A R T I S G R O U P F I N A N C I A L R E P O R T
Notes to the Novartis Group Consolidated Financial Statements
Consumer Health Corporatecontinuing operations (including eliminations) Total continuing operations Discontinuing operations Total Group
2006 2005 2006 2005 2006 2005 2006 2005 2006 2005
6 540 6 049 36 031 31 005 989 1 207 37 020 32 212
39 23 -358 -295
6 579 6 072 -358 -295 36 031 31 005 989 1 207 37 020 32 212
39 43 718 314 3 721 314
-2 642 -2 374 384 273 -10 299 -8 259 -516 -609 -10 815 -8 868
-79 -57 -764 -421 -11 -11 -775 -432
3 976 3 741 26 -22 26 450 23 060 476 598 26 926 23 658
-2 200 -2 096 -10 454 -9 397 -302 -405 -10 756 -9 802
-288 -270 -171 -149 -5 349 -4 825 -15 -21 -5 364 -4 846
-435 -370 -416 -384 -1 957 -1 681 -50 -61 -2 007 -1 742
15 -53 29 49 -741 -355 116 -8 -625 -363
-31 -24 -8 -17 -196 -440 -10 -10 -206 -450
1 068 952 -532 -506 7 949 6 802 225 103 8 174 6 905
301 172 264 193 264 193
354 461 354 461
-266 -294 -266 -294
8 301 7 162 225 103 8 526 7 265
-1 282 -1 090 -42 -34 -1 324 -1 124
7 019 6 072 183 69 7 202 6 141
6 992 6 061 183 69 7 175 6 130
27 11 27 11
-151 -137 -33 18 -1 016 -804 -12 -17 -1 028 -821
-107 -81 -8 -12 -834 -460 -21 -21 -855 -481
-1 -11 -14 -11 -14
-3 -5 -126 -401 -126 -401
-5 -10 -39 -48 -39 -48
-169 -51 -169 -51
8 -7 8 129 122 8
-46 -34 -127 -101 -649 -528 -4 -4 -653 -532
6 480 6 863 19 756 22 157 67 272 57 732 736 68 008 57 732
-2 358 -2 430 -14 753 -14 948 -26 507 -24 568 -207 -26 714 -24 568
4 122 4 433 5 003 7 209 40 765 33 164 529 41 294 33 164
-656 -2 479 -656 -2 479 3 -653 -2 479
4 122 4 433 4 347 4 730 40 109 30 685 532 40 641 30 685
1 006 1 030 465 380 10 945 8 679 69 11 014 8 679
222 233 106 32 1 840 1 163 11 31 1 851 1 194
1 971 2 282 14 11 21 230 13 294 370 21 600 13 294
177 160 579 395 1 2 580 397
6 093 5 605 6 111 7 086 6 111 7 086
s_156-185_Notes.qxd 23.1.2007 16:02 Uhr Seite 169

170
N O V A R T I S G R O U P F I N A N C I A L R E P O R T
GEOGRAPHICAL SEGMENTATION (in USD millions)
The Asia/Africa/Europe Americas Australia Total
2006
Group net sales1 13 591 17 929 5 500 37 020
Group operating income2 5 188 2 784 202 8 174
Depreciation of property, plant &equipment included in operating income 634 336 58 1 028
Group assets 45 378 19 194 3 436 68 008
Additions to property, plant & equipment 1 097 486 268 1 851
Additions to intangible assets 75 499 6 580
Personnel costs 4 405 4 030 703 9 138
The Asia/Africa/Europe Americas Australia Total
2005
Group net sales1 12 000 15 011 5 201 32 212
Group operating income2 4 518 1 916 471 6 905
Depreciation of property, plant &equipment included in operating income 508 264 49 821
Group assets 37 977 17 049 2 706 57 732
Additions to property, plant & equipment 683 396 115 1 194
Additions to intangible assets 162 210 25 397
Personnel costs 3 948 3 341 652 7 941
4. Supplementary segmentation of key figures 2006 and 2005
The following countries accounted for more than 5% of at least one of the respective Group totals as at, or for the years ended, December31, 2006 and 2005:
Country Net sales1 Additions to property, plant & equipment Additions to intangible assets Total assets
USD millions 2006 % 2005 % 2006 % 2005 % 2006 % 2005 % 2006 % 2005 %
Switzerland 412 1 366 1 528 29 305 26 325 56 260 65 25 086 37 25 586 44
USA 14 998 41 12 587 39 409 22 332 28 235 41 86 22 16 327 24 15 601 27
Germany 3 187 9 2 470 8 129 7 89 7 3 1 13 3 5 189 8 1 870 3
Japan 2 464 7 2 591 8 13 1 16 1 5 1 1 1 933 3 1 605 3
France 1 763 5 1 856 6 25 1 27 2 975 1 934 2
UK 1 037 3 924 3 160 9 60 5 3 218 5 1 461 3
Austria 308 1 275 1 66 4 49 4 2 3 1 1 508 2 1 324 2
Slovenia 94 100 42 2 73 6 1 1 1 424 2 1 292 2
Other 12 757 33 11 043 34 479 25 243 21 9 1 33 9 12 348 18 8 059 14
Total Group 37 020 100 32 212 100 1 851 100 1 194 100 580 100 397 100 68 008 100 57 732 100
Less discontinuing operations 989 1 207 11 31 1 2 736
Total continuing operations 36 031 31 005 1 840 1 163 579 395 67 272 57 732
1Net sales from operations by location of third party customer.2Operating income from operations as recorded in the legal entities in the respective region.
The largest customers account for approximately 10%, 9% and 7% respectively, of Group net sales. No other customer accounts for 5% or more of the Group’s total net sales and trade accounts receivable. The highest amounts of trade accounts receivable outstanding are the ones for the largest customers and are approximately 12%, 8% and 7% respectively of Group’s trade accounts receivable at Decem-ber 31, 2006.
s_156-185_Notes.qxd 23.1.2007 16:02 Uhr Seite 170

PHARMACEUTICALS DIVISION THERAPEUTIC AREA NET SALES
Therapeutic areas
2006 2005 ChangeUSD millions USD millions USD (%)
Cardiovascular
Strategic franchise products
Diovan 4 223 3 676 15
Lotrel 1 352 1 075 26
Lescol 725 767 -5
Other 172 128 34
Total strategic franchise products 6 472 5 646 15
Mature products 648 665 -3
Total Cardiovascular products 7 120 6 311 13
Oncology
Strategic franchise products
Gleevec/Glivec 2 554 2 170 18
Zometa 1 283 1 224 5
Sandostatin (group) 915 896 2
Femara 719 536 34
Exjade 143 2
Other 295 268 10
Total Oncology products 5 909 5 096 16
Neuroscience
Strategic franchise products
Trileptal 721 615 17
Exelon 525 467 12
Tegretol (incl. CR/XR) 391 393 -1
Other 1 020 758 35
Total strategic franchise products 2 657 2 233 19
Mature products 440 476 -8
Total Neuroscience products 3 097 2 709 14
171
0 2 | G R O U P R E V I E W 1 2 | O P E R AT I O N A L R E V I E W 5 6 | C O R P O R AT E C I T I Z E N S H I P 9 3 | C O R P O R AT E G O V E R N A N C E 1 2 7 | N O V A R T I S G R O U P F I N A N C I A L R E P O R T
Notes to the Novartis Group Consolidated Financial Statements
Therapeutic areas
2006 2005 ChangeUSD millions USD millions USD (%)
Respiratory & Dermatology
Strategic franchise products
Lamisil (group) 978 1 133 -14
Foradil 331 332
Elidel 179 270 -34
Xolair 102 5
Other 246 53 364
Total strategic franchise products 1 836 1 793 2
Mature products 123 142 -13
Total Respiratory & Dermatology products 1 959 1 935 1
Arthritis/Bone/Gastrointestinal/Urinary (ABGU)
Strategic franchise products
Zelnorm/Zelmac 561 418 34
Prexige 47 8 488
Other 117 47 149
Total strategic franchise products 725 473 53
Mature products 1 526 1 581 -3
Total ABGU products 2 251 2 054 10
Infectious Diseases, Transplantation & Immunology (IDTI)
Neoral/Sandimmun 918 953 -4
Other 330 162 104
Total strategic franchise products 1 248 1 115 12
Mature products 266 270 -1
Total IDTI products 1 514 1 385 9
Ophthalmics
Visudyne 354 484 -27
Other 372 350 6
Total Ophthalmics products 726 834 -13
Total strategic franchise products 19 573 17 190 14
Total mature products 3 003 3 134 -4
Prior-years’ US sales rebate accounting adjustment -62
Total division net sales 22 576 20 262 11
s_156-185_Notes.qxd 23.1.2007 16:02 Uhr Seite 171

172
N O V A R T I S G R O U P F I N A N C I A L R E P O R T
2006 2005USD millions USD millions
Interest income 367 405
Dividend income 8 3
Net capital gains 282 94
Impairment of marketable securities -25 -49
Income on options and forward contracts 48 83
Expenses on options and forward contracts -316 -144
Other financial income 1 3
Other financial expense -49 -49
Currency result, net 38 115
Total financial income 354 461
5. Financial income
INCOME BEFORE TAXES
2006 2005USD millions USD millions
Switzerland 4 090 2 081
Foreign 4 211 5 081
Total income before taxes for continuing operations 8 301 7 162
CURRENT AND DEFERRED INCOME TAX EXPENSE
2006 2005USD millions USD millions
Switzerland -328 -333
Foreign -1 289 -1 142
Total current income tax expense -1 617 -1 475
Switzerland -69 43
Foreign 404 342
Total deferred tax income 335 385
Total income tax expense for continuing operations -1 282 -1 090
6. Taxes Analysis of tax rateThe main elements contributing to the difference between theGroup’s overall expected tax rate (the weighted average tax ratebased on the income before tax of each subsidiary) and the effectivetax rate are:
2006 2005% %
Expected tax rate for continuing operations 15.8 15.9
Effect of disallowed expenditures 2.2 1.6
Effect of utilization of tax losses brought forward from prior periods -0.6 -0.7
Effect of income taxed at reduced rates -0.2 -0.1
Effect of tax credits and allowances -1.2 -1.1
Prior year and other items -0.6 -0.4
Effective tax rate for continuing operations 15.4 15.2
The change in the expected tax rate is caused by the change in theprofitability of the Group’s subsidiaries in the respective countries.
The utilization of tax loss carryforwards lowered the tax chargeby USD 48 million and USD 48 million in 2006 and 2005, respec-tively.
s_156-185_Notes.qxd 23.1.2007 16:02 Uhr Seite 172

173
0 2 | G R O U P R E V I E W 1 2 | O P E R AT I O N A L R E V I E W 5 6 | C O R P O R AT E C I T I Z E N S H I P 9 3 | C O R P O R AT E G O V E R N A N C E 1 2 7 | N O V A R T I S G R O U P F I N A N C I A L R E P O R T
Notes to the Novartis Group Consolidated Financial Statements
Basic earnings per share (EPS) is calculated by dividing the netincome attributable to shareholders of Novartis AG by the weightedaverage number of shares outstanding during the year, excludingfrom the issued shares the average number of shares purchased bythe Group and held as treasury shares.
2006 2005
Net income (USD millions) 7 175 6 130
Weighted average number of shares outstanding 2 345 232 126 2 332 848 144
Basic earnings per share (USD) 3.06 2.63
2006 2005
Net income from continuing operations (USD millions) 6 992 6 061
Weighted average number of shares outstanding 2 345 232 126 2 332 848 144
Basic earnings per share (USD) on continuing operations 2.98 2.60
2006 2005
Net income from discontinuing operations (USD millions) 183 69
Weighted average number of shares outstanding 2 345 232 126 2 332 848 144
Basic earnings per share (USD) on discontinuing operations 0.08 0.03
For diluted EPS, the weighted average number of shares outstand-ing is adjusted to assume conversion of all potentially dilutive sharesarising from options on Novartis shares.
2006 2005
Net income (USD millions) 7 175 6 130
Weighted average number of shares outstanding 2 345 232 126 2 332 848 144
Adjustment for dilutive share options 15 224 345 9 605 470
Weighted average number of shares for diluted earnings per share 2 360 456 471 2 342 453 614
Diluted earnings per share (USD) 3.04 2.62
2006 2005
Net income from continuing operations (USD millions) 6 992 6 061
Weighted average number of shares outstanding 2 345 232 126 2 332 848 144
Adjustment for dilutive share options 15 224 345 9 605 470
Weighted average number of shares for diluted earnings per share 2 360 456 471 2 342 453 614
Diluted earnings per share (USD) on continuing operations 2.96 2.59
2006 2005
Net income from discontinuing operations (USD millions) 183 69
Weighted average number of shares outstanding 2 345 232 126 2 332 848 144
Adjustment for dilutive share options 15 224 345 9 605 470
Weighted average number of shares for diluted earnings per share 2 360 456 471 2 342 453 614
Diluted earnings per share (USD) on discontinuing operations 0.08 0.03
Options equivalent to 4.4 million shares (2005: 16.7 million) wereexcluded from the calculation of diluted earnings per share as theywere not dilutive.
7. Earnings per share
s_156-185_Notes.qxd 23.1.2007 16:02 Uhr Seite 173

174
N O V A R T I S G R O U P F I N A N C I A L R E P O R T
Plant and other Other equipment under property, plant
Land Buildings construction and equipment TotalUSD millions USD millions USD millions USD millions USD millions
2006
Cost
January 1 419 6 067 912 9 116 16 514
Cost of assets related to discontinuing operations -4 -79 -18 -179 -280
Impact of business combinations 117 398 259 257 1 031
Reclassifications1 -2 369 -982 615
Additions 17 124 1 306 393 1 840
Disposals -5 -109 -18 -464 -596
Translation effects 28 384 86 696 1 194
December 31 570 7 154 1 545 10 434 19 703
Accumulated depreciation
January 1 -3 -2 621 -5 211 -7 835
Accumulated depreciation of assets related to discontinuing operations 46 129 175
Depreciation charge -3 -244 -769 -1 016
Depreciation of disposals 79 416 495
Impairment charge -1 1 -11 -11
Translation effects -178 -388 -566
December 31 -7 -2 917 -5 834 -8 758
Net book value – December 31 563 4 237 1 545 4 600 10 945
Insured value – December 31 19 196
Net book value of property, plant & equipment under finance lease contracts 18
Commitments for purchases of property, plant & equipment 563
2005
Cost
January 1 403 6 029 1 363 9 051 16 846
Impact of business combinations 34 265 45 321 665
Reclassifications1 5 421 -1 105 679
Additions 12 74 753 355 1 194
Disposals -1 -151 -23 -396 -571
Translation effects -34 -571 -121 -894 -1 620
December 31 419 6 067 912 9 116 16 514
Accumulated depreciation
January 1 -2 -2 860 -5 487 -8 349
Depreciation charge -1 -170 -650 -821
Depreciation on disposals 114 376 490
Impairment charge -8 -6 -14
Translation effects 303 556 859
December 31 -3 -2 621 -5 211 -7 835
Net book value – December 31 416 3 446 912 3 905 8 679
Insured value – December 31 16 506
Net book value of property, plant & equipment under finance lease contracts 26
Commitments for purchases of property, plant & equipment 417
1Reclassifications between various asset categories due to completion of plant and other equipment under construction.
8. Property, plant & equipment movements
s_156-185_Notes.qxd 23.1.2007 16:02 Uhr Seite 174

175
0 2 | G R O U P R E V I E W 1 2 | O P E R AT I O N A L R E V I E W 5 6 | C O R P O R AT E C I T I Z E N S H I P 9 3 | C O R P O R AT E G O V E R N A N C E 1 2 7 | N O V A R T I S G R O U P F I N A N C I A L R E P O R T
Notes to the Novartis Group Consolidated Financial Statements
Acquired Core Trademarks,research & development product & Other
Goodwill development technologies marketing rights intangible assets TotalUSD millions USD millions USD millions USD millions USD millions USD millions
2006
Cost
January 1 8 080 875 508 6 455 727 16 645
Cost of assets related to discontinuing operations -255 -216 -29 -500
Impact of business combinations 3 138 1 216 140 3 254 167 7 915
Reclassifications -115 114 1
Additions 1 407 12 159 579
Disposals -59 -1 -11 -13 -84
Translation effects 499 89 12 391 34 1 025
December 31 11 404 2 471 660 9 999 1 046 25 580
Accumulated amortization
January 1 -801 -37 -10 -2 090 -413 -3 351
Accumulated amortization of assets related to discontinuing operations 49 52 10 111
Reclassifications -1 -25 6 20
Amortization charge -49 -666 -119 -834
Amortization of disposals 60 8 12 80
Impairment charge -2 -67 -47 -10 -126
Translation effects -50 -1 -2 -164 -13 -230
December 31 -745 -105 -86 -2 901 -513 -4 350
Net book value – December 31 10 659 2 366 574 7 098 533 21 230
2005
Cost
January 1 2 739 323 4 655 639 8 356
Impact of business combinations 5 531 619 305 2 123 41 8 619
Reclassifications1 11 -251 210 67 -9 28
Additions 24 211 77 85 397
Disposals -3 -1 -64 -12 -80
Translation effects -222 -26 -7 -403 -17 -675
December 31 8 080 875 508 6 455 727 16 645
Accumulated amortization
January 1 -840 -23 -1 515 -349 -2 727
Reclassifications1 -13 23 -12 2
Amortization charge -10 -382 -89 -481
Amortization of disposals 2 55 9 66
Impairment charge -5 -38 -358 -401
Translation effects 55 1 122 14 192
December 31 -801 -37 -10 -2 090 -413 -3 351
Net book value – December 31 7 279 838 498 4 365 314 13 294
1Reclassifications between various assets categories as a result of recording final acquisition balance sheets and product launches of acquired research & development. In 2005 there was a net USD 28 million change in a provisional purchase price allocation that increased intangible assets and deferred tax liabilities by this amount.
9. Intangible asset movements
s_156-185_Notes.qxd 23.1.2007 16:02 Uhr Seite 175
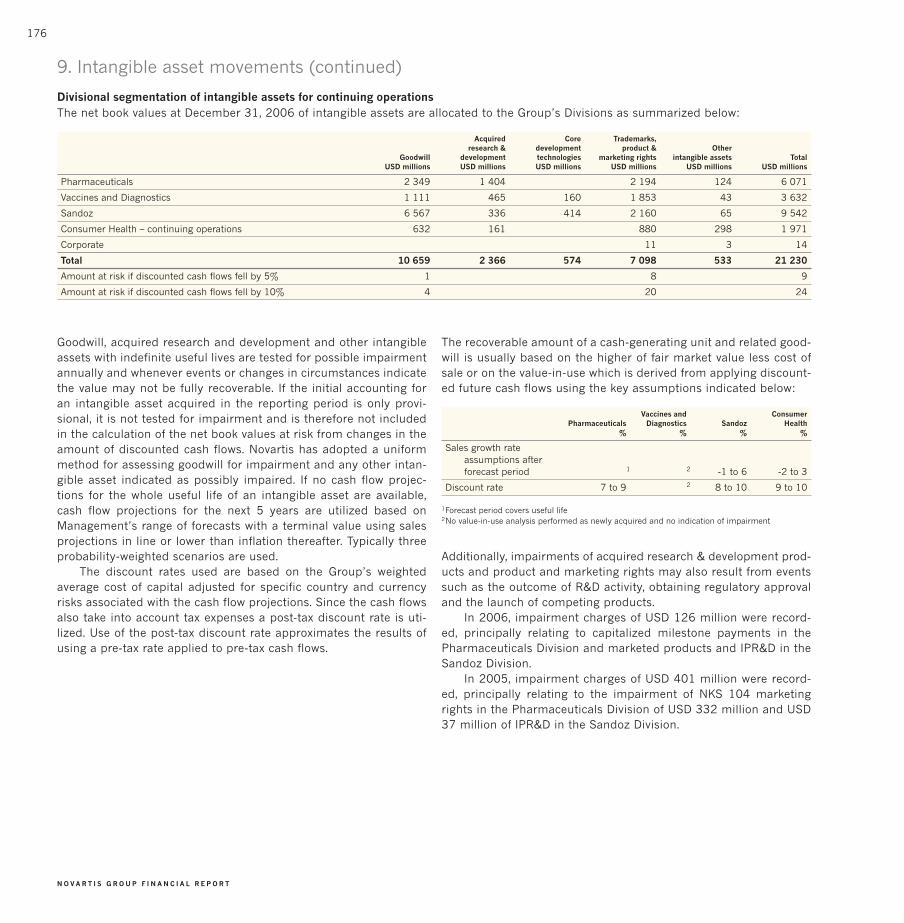
176
N O V A R T I S G R O U P F I N A N C I A L R E P O R T
Divisional segmentation of intangible assets for continuing operationsThe net book values at December 31, 2006 of intangible assets are allocated to the Group’s Divisions as summarized below:
Acquired Core Trademarks,research & development product & Other
Goodwill development technologies marketing rights intangible assets TotalUSD millions USD millions USD millions USD millions USD millions USD millions
Pharmaceuticals 2 349 1 404 2 194 124 6 071
Vaccines and Diagnostics 1 111 465 160 1 853 43 3 632
Sandoz 6 567 336 414 2 160 65 9 542
Consumer Health – continuing operations 632 161 880 298 1 971
Corporate 11 3 14
Total 10 659 2 366 574 7 098 533 21 230
Amount at risk if discounted cash flows fell by 5% 1 8 9
Amount at risk if discounted cash flows fell by 10% 4 20 24
9. Intangible asset movements (continued)
The recoverable amount of a cash-generating unit and related good-will is usually based on the higher of fair market value less cost ofsale or on the value-in-use which is derived from applying discount-ed future cash flows using the key assumptions indicated below:
Vaccines and ConsumerPharmaceuticals Diagnostics Sandoz Health
% % % %
Sales growth rate assumptions afterforecast period 1 2 -1 to 6 -2 to 3
Discount rate 7 to 9 2 8 to 10 9 to 10
1Forecast period covers useful life2No value-in-use analysis performed as newly acquired and no indication of impairment
Additionally, impairments of acquired research & development prod-ucts and product and marketing rights may also result from eventssuch as the outcome of R&D activity, obtaining regulatory approvaland the launch of competing products.
In 2006, impairment charges of USD 126 million were record-ed, principally relating to capitalized milestone payments in thePharmaceuticals Division and marketed products and IPR&D in theSandoz Division.
In 2005, impairment charges of USD 401 million were record-ed, principally relating to the impairment of NKS 104 marketingrights in the Pharmaceuticals Division of USD 332 million and USD37 million of IPR&D in the Sandoz Division.
Goodwill, acquired research and development and other intangibleassets with indefinite useful lives are tested for possible impairmentannually and whenever events or changes in circumstances indicatethe value may not be fully recoverable. If the initial accounting for an intangible asset acquired in the reporting period is only provi-sional, it is not tested for impairment and is therefore not includedin the calculation of the net book values at risk from changes in theamount of discounted cash flows. Novartis has adopted a uniformmethod for assessing goodwill for impairment and any other intan-gible asset indicated as possibly impaired. If no cash flow projec-tions for the whole useful life of an intangible asset are available,cash flow projections for the next 5 years are utilized based onManagement’s range of forecasts with a terminal value using salesprojections in line or lower than inflation thereafter. Typically threeprobability-weighted scenarios are used.
The discount rates used are based on the Group’s weightedaverage cost of capital adjusted for specific country and currencyrisks associated with the cash flow projections. Since the cash flowsalso take into account tax expenses a post-tax discount rate is uti-lized. Use of the post-tax discount rate approximates the results ofusing a pre-tax rate applied to pre-tax cash flows.
s_156-185_Notes.qxd 23.1.2007 16:02 Uhr Seite 176
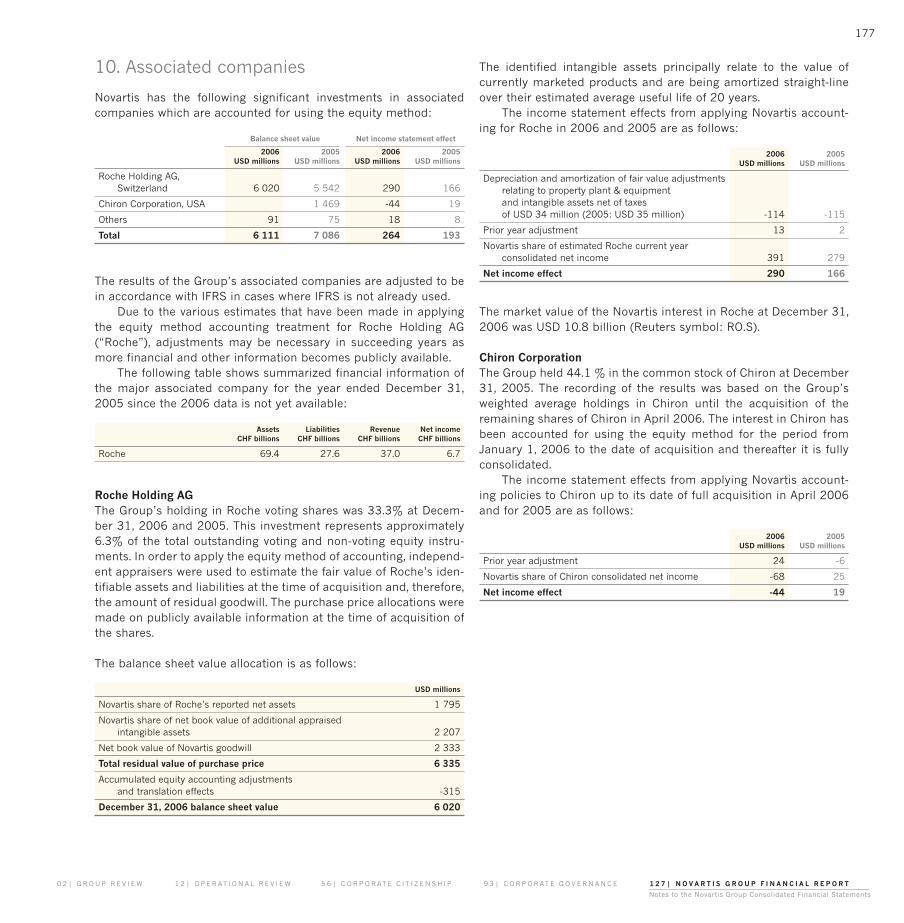
177
0 2 | G R O U P R E V I E W 1 2 | O P E R AT I O N A L R E V I E W 5 6 | C O R P O R AT E C I T I Z E N S H I P 9 3 | C O R P O R AT E G O V E R N A N C E 1 2 7 | N O V A R T I S G R O U P F I N A N C I A L R E P O R T
Notes to the Novartis Group Consolidated Financial Statements
The identified intangible assets principally relate to the value of currently marketed products and are being amortized straight-lineover their estimated average useful life of 20 years.
The income statement effects from applying Novartis account-ing for Roche in 2006 and 2005 are as follows:
2006 2005USD millions USD millions
Depreciation and amortization of fair value adjustmentsrelating to property plant & equipment and intangible assets net of taxes of USD 34 million (2005: USD 35 million) -114 -115
Prior year adjustment 13 2
Novartis share of estimated Roche current year consolidated net income 391 279
Net income effect 290 166
The market value of the Novartis interest in Roche at December 31,2006 was USD 10.8 billion (Reuters symbol: RO.S).
Chiron Corporation The Group held 44.1 % in the common stock of Chiron at December31, 2005. The recording of the results was based on the Group’sweighted average holdings in Chiron until the acquisition of theremaining shares of Chiron in April 2006. The interest in Chiron hasbeen accounted for using the equity method for the period fromJanuary 1, 2006 to the date of acquisition and thereafter it is fullyconsolidated.
The income statement effects from applying Novartis account-ing policies to Chiron up to its date of full acquisition in April 2006and for 2005 are as follows:
2006 2005USD millions USD millions
Prior year adjustment 24 -6
Novartis share of Chiron consolidated net income -68 25
Net income effect -44 19
Novartis has the following significant investments in associatedcompanies which are accounted for using the equity method:
Balance sheet value Net income statement effect
2006 2005 2006 2005USD millions USD millions USD millions USD millions
Roche Holding AG, Switzerland 6 020 5 542 290 166
Chiron Corporation, USA 1 469 -44 19
Others 91 75 18 8
Total 6 111 7 086 264 193
The results of the Group’s associated companies are adjusted to bein accordance with IFRS in cases where IFRS is not already used.
Due to the various estimates that have been made in applyingthe equity method accounting treatment for Roche Holding AG(“Roche”), adjustments may be necessary in succeeding years asmore financial and other information becomes publicly available.
The following table shows summarized financial information ofthe major associated company for the year ended December 31,2005 since the 2006 data is not yet available:
Assets Liabilities Revenue Net income CHF billions CHF billions CHF billions CHF billions
Roche 69.4 27.6 37.0 6.7
Roche Holding AG The Group’s holding in Roche voting shares was 33.3% at Decem-ber 31, 2006 and 2005. This investment represents approximately6.3% of the total outstanding voting and non-voting equity instru-ments. In order to apply the equity method of accounting, independ-ent appraisers were used to estimate the fair value of Roche’s iden-tifiable assets and liabilities at the time of acquisition and, therefore,the amount of residual goodwill. The purchase price allocations weremade on publicly available information at the time of acquisition ofthe shares.
The balance sheet value allocation is as follows:
USD millions
Novartis share of Roche’s reported net assets 1 795
Novartis share of net book value of additional appraised intangible assets 2 207
Net book value of Novartis goodwill 2 333
Total residual value of purchase price 6 335
Accumulated equity accounting adjustments and translation effects -315
December 31, 2006 balance sheet value 6 020
10. Associated companies
s_156-185_Notes.qxd 23.1.2007 16:02 Uhr Seite 177

178
N O V A R T I S G R O U P F I N A N C I A L R E P O R T
A reversal of valuation allowance could occur when circumstancesmake the realization of deferred taxes probable. This would result ina decrease in the Group’s effective tax rate.
Deferred tax assets of USD 1.8 billion (2005: USD 1.9 billion)and deferred tax liabilities of USD 4.6 billion (2005: USD 2.9 billion)are expected to be recovered after more than twelve months.
At December 31, 2006 unremitted earnings of USD 31 billion(2005: USD 30 billion) have been retained by subsidiary companiesfor reinvestment. No provision is made for income taxes that wouldbe payable upon the distribution of such earnings. If the earningswere remitted, an income tax charge could result based on the taxstatutes currently in effect.
11. Deferred tax assets and liabilitiesPensions and other benefit Other
Property, plant & Intangible obligations Tax loss provisions Valuationequipment assets of associates Inventories carry forwards and accruals allowance Total
USD millions USD millions USD millions USD millions USD millions USD millions USD millions USD millions
Deferred tax assets at January 1, 2005 22 43 1 006 791 47 655 -29 2 535
Deferred tax liabilities at January 1, 2005 -670 -189 -564 -235 -682 -2 340
Net deferred tax balance at January 1, 2005 -648 -146 442 556 47 -27 -29 195
At January 1, 2005 -648 -146 442 556 47 -27 -29 195
(Charged)/credited to income 23 154 -77 211 -14 90 387
Credited to equity 192 123 315
Acquisitions/divestments -66 -1 040 -2 2 6 79 -1 021
Other movements 20 10 4 -6 15 10 53
Net deferred tax balance at December 31, 2005 -671 -1 022 559 763 54 275 -29 -71
Deferred tax assets at December 31, 2005 23 232 1 360 956 54 805 -29 3 401
Deferred tax liabilities at December 31, 2005 -694 -1 254 -801 -193 -530 -3 472
Net deferred tax balance at December 31, 2005 -671 -1 022 559 763 54 275 -29 -71
At January 1, 2006 -671 -1 022 559 763 54 275 -29 -71
Deferred tax related to discontinuing operations 3 -3 -5 -1 1 -5
(Charged)/credited to income -11 273 -298 152 2 215 2 335
Charged to equity -97 -69 -166
Acquisitions/divestments -17 -1 624 5 -37 145 115 -1 413
Other movements -49 -12 30 -8 6 -34 -67
Net deferred tax balance at December 31, 2006 -745 -2 388 194 870 206 503 -27 -1 387
Deferred tax assets at December 31, 2006 64 286 1 059 1 123 206 1 192 -27 3 903
Deferred tax liabilities at December 31, 2006 -809 -2 674 -865 -253 -689 -5 290
Net deferred tax balance at December 31, 2006 -745 -2 388 194 870 206 503 -27 -1 387
2006 2005USD millions USD millions
Temporary differences on which no deferred tax has been provided as they are permanent in nature related to: – write-down of investments in subsidiaries 841 1 803
– goodwill from acquisitions 6 262 3 383
s_156-185_Notes.qxd 23.1.2007 16:02 Uhr Seite 178

179
0 2 | G R O U P R E V I E W 1 2 | O P E R AT I O N A L R E V I E W 5 6 | C O R P O R AT E C I T I Z E N S H I P 9 3 | C O R P O R AT E G O V E R N A N C E 1 2 7 | N O V A R T I S G R O U P F I N A N C I A L R E P O R T
Notes to the Novartis Group Consolidated Financial Statements
2006 2005USD millions USD millions
Financial investments and long-term loans 2 313 1 910
Prepaid post-employment benefit plans 2 102 1 919
Total financial and other non-current assets 4 415 3 829
12. Financial and other non-current assets Financial investments are valued at market value (2006: USD 1 912million, 2005: USD 1 455 million) and long-term loans at amortizedcost.
During 2006, USD 21 million (2005: USD 43 million) of unreal-ized losses on available-for-sale investments and USD 18 million(2005: USD 5 million) on other investments were considered to beimpaired and were charged to the income statement within otherincome and expense.
2006 2005USD millions USD millions
Raw material, consumables 810 665
Finished products 3 688 3 060
Total inventories 4 498 3 725
13. Inventories The following summarizes the movement in inventory write-downsdeducted from inventory categories. Reversals of inventory provi-sions mainly result from the reassessment of inventory values man-ufactured prior to regulatory approval but for which approval wassubsequently received:
2006 2005USD millions USD millions
January 1 -295 -260
Provisions on inventory related to discontinuing operations 7
Inventory write-downs charged to income statement -659 -544
Utilization of inventory provisions 300 329
Reversal of inventory provisions 183 150
Translation effects -27 30
December 31 -491 -295
not capitalized capitalized 2006USD millions USD millions USD millions
One year 54 54
Two years 37 1 38
Three years 38 8 46
Four years 39 110 149
Five years 350 138 488
More than five years 643 522 1 165
Total 1 161 779 1 940
not capitalized capitalized 2005USD millions USD millions USD millions
One year 5 1 6
Two years 57 7 64
Three years 29 2 31
Four years 252 28 280
Five years 180 7 187
More than five years 737 383 1 120
Total 1 260 428 1 688
Tax loss carryforwards are capitalized if it is probable that future taxable profits will be available to utilize the losses.
USD 12 million of unused tax loss carryforwards expired during2006 (2005: USD 7 million).
The gross value of unused tax loss carryforwards which have, or have not, been capitalized as deferred tax assets, with their expiry datesis as follows:
s_156-185_Notes.qxd 23.1.2007 16:02 Uhr Seite 179

180
N O V A R T I S G R O U P F I N A N C I A L R E P O R T
2006 2005USD millions USD millions
Total gross trade accounts receivable 6 359 5 546
Less provision for doubtful trade accounts receivable -198 -203
Total trade accounts receivable, net 6 161 5 343
Provisions for chargebacks and discounts are adjusted based uponactual experience. Such adjustments to the historic estimates havenot been material.
The following summarizes the movement in the provision fordoubtful trade accounts receivable:
2006 2005USD millions USD millions
January 1 -203 -251
Provisions on trade accounts receivable related todiscontinuing operations 7
Provision for doubtful trade accounts receivable charged to income statement -158 -184
Utilization or reversal of provision for doubtfultrade accounts receivable 167 211
Translation effects -11 21
December 31 -198 -203
The following table sets forth details of the age of trade accountsreceivable that are not overdue as the payment terms specified inthe terms and conditions established with Novartis customers havenot been exceeded as well as an analysis of overdue amounts andrelated provisions for doubtful trade accounts receivable:
2006 2005USD millions USD millions
Total 6 359 5 546
Less provision for doubtful trade accounts receivable -198 -203
Total trade accounts receivable, net 6 161 5 343
of which:Not overdue 5 313 4 593
Past due not more than one month 452 429
Past due more than one month and not more than three months 186 202
Past due more than three months and not more than six months 172 117
Past due more than six months and not more than one year 213 166
Past due more than one year 23 39
Provision for doubtful trade accounts receivable -198 -203
Total trade accounts receivable, net 6 161 5 343
Provisions for doubtful trade accounts receivable are establishedbased upon the difference between the receivable value and theestimated net collectible amount. Novartis establishes its provisionfor doubtful trade accounts receivable based on its historical lossexperiences.
Trade accounts receivable include amounts denominated in thefollowing major currencies:
2006 2005Currency USD millions USD millions
CHF 124 132
EUR 1 523 1 295
GBP 181 131
JPY 890 914
USD 2 171 1 887
other 1 272 984
Total trade accounts receivable, net 6 161 5 343
14. Trade accounts receivable
s_156-185_Notes.qxd 23.1.2007 16:02 Uhr Seite 180

181
0 2 | G R O U P R E V I E W 1 2 | O P E R AT I O N A L R E V I E W 5 6 | C O R P O R AT E C I T I Z E N S H I P 9 3 | C O R P O R AT E G O V E R N A N C E 1 2 7 | N O V A R T I S G R O U P F I N A N C I A L R E P O R T
Notes to the Novartis Group Consolidated Financial Statements
The following tables show the contract or underlying principal amounts and fair values of derivative financial instruments analyzed by typeof contract at December 31, 2006 and 2005. Contract or underlying principal amounts indicate the volume of business outstanding at thebalance sheet date and do not represent amounts at risk. The fair values are determined by reference to market prices or standard pricingmodels using observable market inputs at December 31, 2006 and 2005.
15. Marketable securities and derivative financial instruments
DERIVATIVE FINANCIAL INSTRUMENTSContract or underlying
principal amount Positive fair values Negative fair values
2006 2005 2006 2005 2006 2005USD millions USD millions USD millions USD millions USD millions USD millions
Currency related instruments
Forward foreign exchange rate contracts 8 510 9 536 33 149 -54 -223
Over the counter currency options 2 252 44 4 1 -2
Cross currency swaps 31 1 092 231 -27 -18
Total of currency related instruments 10 793 10 672 37 381 -83 -241
Interest rate related instruments
Interest rate swaps 2 479 3 -3
Forward rate agreements 1 386 -1
Total of interest rate related instruments 3 865 3 -4
Options on equity securities 21 9
Total derivative financial instruments included in marketable securities and in current financial debt 10 814 14 546 37 384 -83 -245
The contract or underlying principal amount of derivative financial instruments at December 31, 2006 and 2005 are set forth by currencyin the table below.
Other Total TotalEUR USD JPY currencies 2006 2005
USD millions USD millions USD millions USD millions USD millions USD millions
Currency related instruments
Forward foreign exchange rate contracts 4 027 3 844 59 580 8 510 9 536
Over the counter currency options 2 252 2 252 44
Cross currency swaps 31 31 1 092
Total of currency related instruments 6 279 3 875 59 580 10 793 10 672
Interest rate related instruments
Interest rate swaps 2 479
Forward rate agreements 1 386
Total of interest rate related instruments 3 865
Options on equity securities 21 21 9
Total derivative financial instruments 6 279 3 896 59 580 10 814 14 546
s_156-185_Notes.qxd 23.1.2007 16:02 Uhr Seite 181
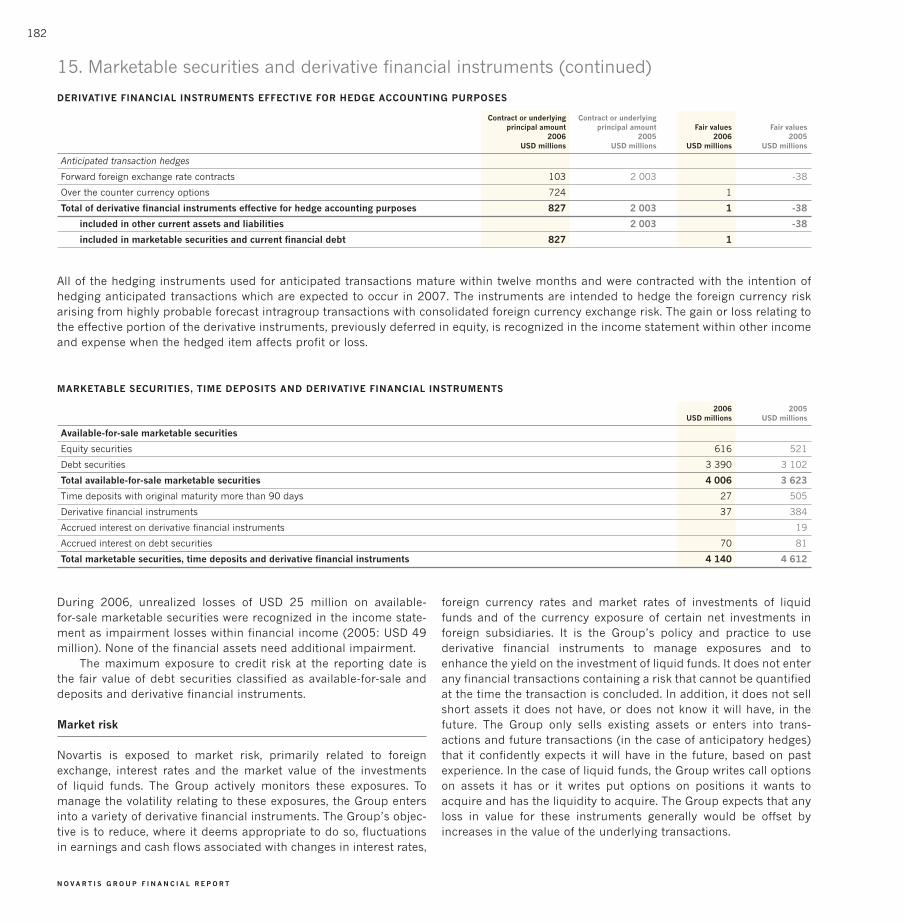
182
N O V A R T I S G R O U P F I N A N C I A L R E P O R T
During 2006, unrealized losses of USD 25 million on available-for-sale marketable securities were recognized in the income state-ment as impairment losses within financial income (2005: USD 49million). None of the financial assets need additional impairment.
The maximum exposure to credit risk at the reporting date is the fair value of debt securities classified as available-for-sale anddeposits and derivative financial instruments.
Market risk
Novartis is exposed to market risk, primarily related to foreignexchange, interest rates and the market value of the investments of liquid funds. The Group actively monitors these exposures. Tomanage the volatility relating to these exposures, the Group entersinto a variety of derivative financial instruments. The Group’s objec-tive is to reduce, where it deems appropriate to do so, fluctuationsin earnings and cash flows associated with changes in interest rates,
foreign currency rates and market rates of investments of liquidfunds and of the currency exposure of certain net investments in foreign subsidiaries. It is the Group’s policy and practice to usederivative financial instruments to manage exposures and toenhance the yield on the investment of liquid funds. It does not enterany financial transactions containing a risk that cannot be quantifiedat the time the transaction is concluded. In addition, it does not sellshort assets it does not have, or does not know it will have, in thefuture. The Group only sells existing assets or enters into trans-actions and future transactions (in the case of anticipatory hedges)that it confidently expects it will have in the future, based on pastexperience. In the case of liquid funds, the Group writes call optionson assets it has or it writes put options on positions it wants toacquire and has the liquidity to acquire. The Group expects that anyloss in value for these instruments generally would be offset byincreases in the value of the underlying transactions.
DERIVATIVE FINANCIAL INSTRUMENTS EFFECTIVE FOR HEDGE ACCOUNTING PURPOSES
Contract or underlying Contract or underlyingprincipal amount principal amount Fair values Fair values
2006 2005 2006 2005USD millions USD millions USD millions USD millions
Anticipated transaction hedges
Forward foreign exchange rate contracts 103 2 003 -38
Over the counter currency options 724 1
Total of derivative financial instruments effective for hedge accounting purposes 827 2 003 1 -38
included in other current assets and liabilities 2 003 -38
included in marketable securities and current financial debt 827 1
All of the hedging instruments used for anticipated transactions mature within twelve months and were contracted with the intention ofhedging anticipated transactions which are expected to occur in 2007. The instruments are intended to hedge the foreign currency riskarising from highly probable forecast intragroup transactions with consolidated foreign currency exchange risk. The gain or loss relating tothe effective portion of the derivative instruments, previously deferred in equity, is recognized in the income statement within other incomeand expense when the hedged item affects profit or loss.
MARKETABLE SECURITIES, TIME DEPOSITS AND DERIVATIVE FINANCIAL INSTRUMENTS
2006 2005USD millions USD millions
Available-for-sale marketable securities
Equity securities 616 521
Debt securities 3 390 3 102
Total available-for-sale marketable securities 4 006 3 623
Time deposits with original maturity more than 90 days 27 505
Derivative financial instruments 37 384
Accrued interest on derivative financial instruments 19
Accrued interest on debt securities 70 81
Total marketable securities, time deposits and derivative financial instruments 4 140 4 612
15. Marketable securities and derivative financial instruments (continued)
s_156-185_Notes.qxd 23.1.2007 16:02 Uhr Seite 182

183
0 2 | G R O U P R E V I E W 1 2 | O P E R AT I O N A L R E V I E W 5 6 | C O R P O R AT E C I T I Z E N S H I P 9 3 | C O R P O R AT E G O V E R N A N C E 1 2 7 | N O V A R T I S G R O U P F I N A N C I A L R E P O R T
Notes to the Novartis Group Consolidated Financial Statements
Foreign exchange rate risk
The Group uses the USD as its reporting currency. As a result, theGroup is exposed to foreign exchange movements, primarily in Euro-pean, Japanese and other Asian and Latin American currencies. Con-sequently, it enters into various contracts that reflect the changes inthe value of foreign exchange rates to preserve the value of assets,commitments and anticipated transactions. Novartis also uses for-ward contracts and foreign currency option contracts to hedge cer-tain anticipated net revenues in foreign currencies.
Net investments in foreign countries are long-term investments.Their fair value changes through movements of currency exchangerates. In the very long term, however, the difference in the inflationrate should match the currency exchange rate movement, so thatthe market value of the foreign non-monetary assets will compen-sate for the change due to currency movements. For this reason, theGroup only hedges the net investments in foreign subsidiaries inexceptional cases.
Commodity price risk
The Group has only a very limited exposure to price risk related toanticipated purchases of certain commodities used as raw materialsby the Group’s businesses. A change in those prices may alter thegross margin of a specific business, but generally by not more than10% of the margin and thus below the Group’s risk managementtolerance levels. Accordingly, it does not enter into significant com-modity futures, forward and option contracts to manage fluctuationsin prices of anticipated purchases.
Interest rate risk
The Group manages its net exposure to interest rate risk through theproportion of fixed rate financial debt and variable rate financial debtin its total financial debt portfolio. To manage this mix, Novartis mayenter into interest rate swap agreements, in which it exchanges peri-odic payments based on a notional amount and agreed-upon fixedand variable interest rates.
Equity risk
The Group purchases equities as investments of its liquid funds. Asa policy, it limits its holdings in an unrelated company to less than5% of its liquid funds. Potential investments are thoroughly ana-lyzed in respect to their past financial track record (mainly cash flowand return on investment), their market potential, their manage-ment and their competitors. Call options are written on equities thatthe Group owns, and put options are written on equities which theGroup wants to buy and for which cash has been reserved.
Credit Risk
Credit risks arise from the possibility that customers may not be ableto settle their obligations as agreed. To manage this risk the Groupperiodically assesses the financial reliability of customers. Three cus-tomers account for approximately 10%, 9% and 7%, respectively, of Group net sales in 2006. No other customer accounts for 5% ormore of the Group’s total net sales. The highest amounts of tradeaccounts receivable are approximately 12%, 8% and 7% respective-ly of Group trade accounts receivable at December 31, 2006, andthere is no other significant concentration of credit risk.
The nominal value less impairment provision of trade accountsreceivables and payables are assumed to approximate their fair value.
Counterparty risk
Counterparty risk encompasses issuer risk on marketable securities,settlement risk on derivative and money market contracts and creditrisk on cash and time deposits. Issuer risk is minimized by only buy-ing securities which are at least AA rated. Settlement and credit riskis reduced by the policy of entering into transactions with counter-parties that are usually at least AA rated banks or financial institu-tions. Exposure to these risks is closely monitored and kept withinpredetermined parameters. Novartis has policies that limit theamount of credit exposure to any financial institution.
The Group does not expect any losses from non-performance bythese counterparties and does not have any significant grouping ofexposures to financial sector or country risk.
Liquidity risk
Liquidity risk is defined as the risk that the Group could not be ableto settle or meet its obligations on time or at a reasonable price.Group Treasury is responsible for liquidity, funding as well as settle-ment management. In addition, liquidity and funding risks, relatedprocesses and policies are overseen by management. Novartis man-ages its liquidity risk on a consolidated basis based on businessneeds, tax, capital or regulatory considerations, if applicable, throughnumerous sources of finance in order to maintain flexibility.
s_156-185_Notes.qxd 23.1.2007 16:02 Uhr Seite 183

184
N O V A R T I S G R O U P F I N A N C I A L R E P O R T
Value at risk
The Group uses a value at risk (VAR) computation to estimate thepotential ten-day loss in the fair value of its financial instruments.
It uses a ten day period because of an assumption that not allpositions could be undone in a single day given the size of the posi-tions. The VAR computation includes the Group’s financial debt,short-term and long-term investments, foreign currency forwards,swaps and options as well as anticipated transactions. Foreign cur-rency trade payables and receivables as well as net investments inforeign subsidiaries are included in the computation.
The VAR estimates are made assuming normal market con-ditions, using a 95% confidence interval. The Group uses a “DeltaNormal” model to determine the observed inter-relationshipsbetween movements in interest rates, stock markets and variouscurrencies. These inter-relationships are determined by observinginterest rate, stock market movements and forward currency ratemovements over a 60 day period for the calculation of VAR amounts.
The estimated potential ten day loss in pre-tax earnings fromthe Group’s foreign currency instruments, the estimated potentialten day loss on its equity holdings, and the estimated potential tenday loss in fair value of its interest rate sensitive instruments, prima-rily financial debt and investments of liquid funds under normalmarket conditions, as calculated in the VAR model, are the following:
Dec 31, 2006 Dec 31, 2005USD millions USD millions
All financial instruments 49 113
Analyzed by components:
Instruments sensitive to foreign currency rates 30 108
Instruments sensitive to equity market movements 28 22
Instruments sensitive to interest rates 27 4
The average, high, and low VAR amounts for 2006 are as follows:
Average High LowUSD millions USD millions USD millions
All financial instruments 90 138 49
Analyzed by components:
Instruments sensitive to foreign currency rates 81 134 30
Instruments sensitive to equity market movements 29 40 21
Instruments sensitive to interest rates 11 29 4
The VAR computation is a risk analysis tool designed to statisticallyestimate the maximum potential ten day loss from adverse move-ments in foreign currency rates, equity prices and interest ratesunder normal market conditions. The computation does not purportto represent actual losses in fair value on earnings to be incurred by the Group, nor does it consider the effect of favorable changes in market rates. The Group cannot predict actual future movementsin such market rates and it does not claim that these VAR results are indicative of future movements in such market rates or to berepresentative of any actual impact that future changes in marketrates may have on the Group’s future results of operations or finan-cial position.
In addition to these VAR analyses, the Group uses stress testingtechniques that aim to reflect a worst case scenario. For these cal-culations, the Group uses the worst movements during a period ofsix months over the past 20 years in each category. For 2006 and2005, the worst case loss scenario was configured as follows:
Dec 31, 2006 Dec 31, 2005USD millions USD millions
Bond portfolio 158 244
Money market and linked financial instruments 69 550
Equities 415 308
Foreign exchange risks 473 943
Total 1 115 2 045
In the Group’s risk analysis, Novartis considered this worst case sce-nario acceptable inasmuch as it could reduce income, but would notendanger the solvency and/or the investment grade credit standingof the Group. While it is highly unlikely that all worst case fluctuationswould happen simultaneously, as shown in the model, the actualmarket can of course produce bigger movements in the future thanit has historically. Additionally, in such a worst case environment,management actions could further mitigate the Group’s exposure.
15. Marketable securities and derivative financial instruments (continued)
s_156-185_Notes.qxd 23.1.2007 16:02 Uhr Seite 184
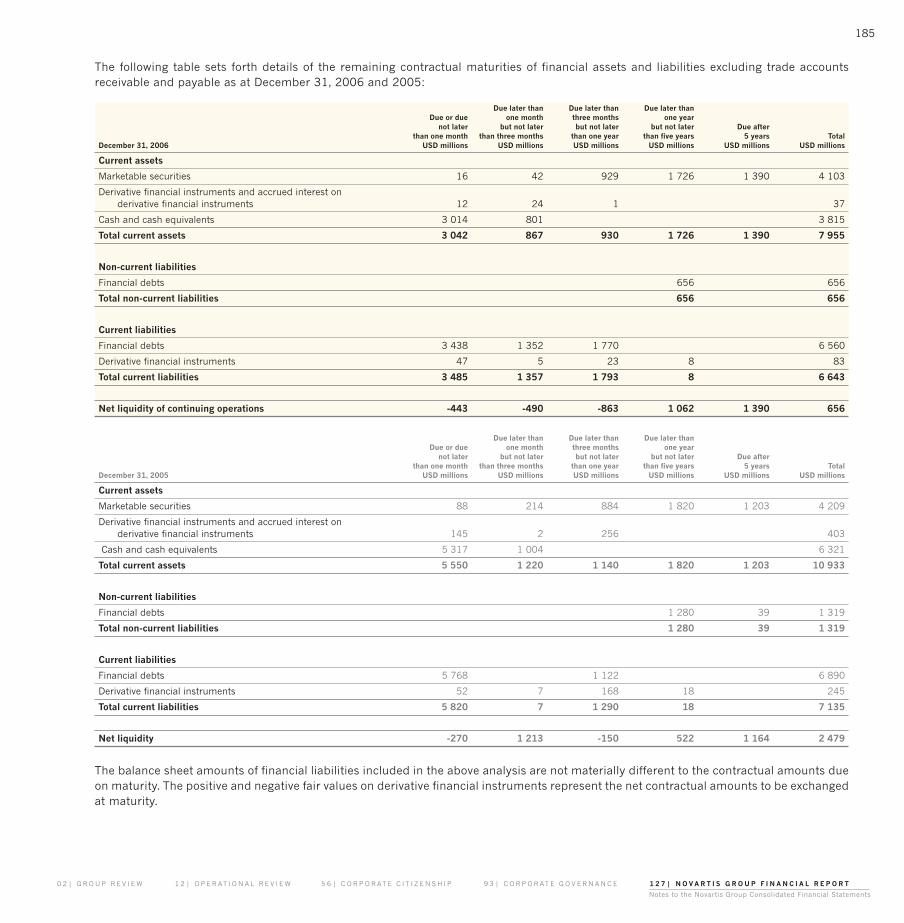
185
0 2 | G R O U P R E V I E W 1 2 | O P E R AT I O N A L R E V I E W 5 6 | C O R P O R AT E C I T I Z E N S H I P 9 3 | C O R P O R AT E G O V E R N A N C E 1 2 7 | N O V A R T I S G R O U P F I N A N C I A L R E P O R T
Notes to the Novartis Group Consolidated Financial Statements
The following table sets forth details of the remaining contractual maturities of financial assets and liabilities excluding trade accountsreceivable and payable as at December 31, 2006 and 2005:
Due later than Due later than Due later thanDue or due one month three months one year
not later but not later but not later but not later Due afterthan one month than three months than one year than five years 5 years Total
December 31, 2006 USD millions USD millions USD millions USD millions USD millions USD millions
Current assets
Marketable securities 16 42 929 1 726 1 390 4 103
Derivative financial instruments and accrued interest onderivative financial instruments 12 24 1 37
Cash and cash equivalents 3 014 801 3 815
Total current assets 3 042 867 930 1 726 1 390 7 955
Non-current liabilities
Financial debts 656 656
Total non-current liabilities 656 656
Current liabilities
Financial debts 3 438 1 352 1 770 6 560
Derivative financial instruments 47 5 23 8 83
Total current liabilities 3 485 1 357 1 793 8 6 643
Net liquidity of continuing operations -443 -490 -863 1 062 1 390 656
Due later than Due later than Due later thanDue or due one month three months one year
not later but not later but not later but not later Due afterthan one month than three months than one year than five years 5 years Total
December 31, 2005 USD millions USD millions USD millions USD millions USD millions USD millions
Current assets
Marketable securities 88 214 884 1 820 1 203 4 209
Derivative financial instruments and accrued interest onderivative financial instruments 145 2 256 403
Cash and cash equivalents 5 317 1 004 6 321
Total current assets 5 550 1 220 1 140 1 820 1 203 10 933
Non-current liabilities
Financial debts 1 280 39 1 319
Total non-current liabilities 1 280 39 1 319
Current liabilities
Financial debts 5 768 1 122 6 890
Derivative financial instruments 52 7 168 18 245
Total current liabilities 5 820 7 1 290 18 7 135
Net liquidity -270 1 213 -150 522 1 164 2 479
The balance sheet amounts of financial liabilities included in the above analysis are not materially different to the contractual amounts dueon maturity. The positive and negative fair values on derivative financial instruments represent the net contractual amounts to be exchangedat maturity.
s_156-185_Notes.qxd 23.1.2007 16:02 Uhr Seite 185

186
N O V A R T I S G R O U P F I N A N C I A L R E P O R T
Number of shares1
Dec 31, Movement Dec 31, Movement Dec 31, 2004 in year 2005 in year 2006
Total Novartis shares 2 777 210 000 -38 039 000 2 739 171 000 -10 200 000 2 728 971 000
Treasury shares
Shares reserved for share-based compensation of associates 41 569 718 -1 278 098 40 291 620 -6 733 603 33 558 017
Unreserved treasury shares 398 145 155 -35 182 275 362 962 880 -15 781 356 347 181 524
Total treasury shares 439 714 873 -36 460 373 403 254 500 -22 514 959 380 739 541
Total outstanding shares 2 337 495 127 -1 578 627 2 335 916 500 12 314 959 2 348 231 459
USD millions USD millions USD millions USD millions USD millions
Share capital 1 008 -14 994 -4 990
Treasury shares -159 13 -146 6 -140
Outstanding share capital 849 -1 848 2 850
1All shares are registered, authorized, issued and fully paid. All are voting shares and, except for 224 831 405 treasury shares, are dividend bearing.
There are outstanding written call options on Novartis shares of 18.4 million originally issued as part of the share-based compensation ofassociates. The market maker has acquired these options but they have not yet been exercised. The weighted average exercise price ofthese options is USD 37.99 and they have remaining contractual lives of up to 8 years.
17. Details of shares and share capital movements
2006 2005USD millions USD millions
Withholding tax recoverable 272 35
Life insurance subsidiary receivables 146 167
Prepaid expenses – third parties 237 202
– associated companies 7 20
Other receivables – third parties 1 382 1 005
– associated companies 10 13
Total other current assets 2 054 1 442
16. Other current assets
s_186-209_Notes_Groups.qxd 23.1.2007 16:03 Uhr Seite 186

187
0 2 | G R O U P R E V I E W 1 2 | O P E R AT I O N A L R E V I E W 5 6 | C O R P O R AT E C I T I Z E N S H I P 9 3 | C O R P O R AT E G O V E R N A N C E 1 2 7 | N O V A R T I S G R O U P F I N A N C I A L R E P O R T
Notes to the Novartis Group Consolidated Financial Statements
2006 2005USD millions USD millions
Straight bonds 1 318 2 294
Liabilities to banks and other financial institutions1 666 128
Finance lease obligations 12 19
Total (including current portion of non-current financial debt) 1 996 2 441
Less current portion of non-current financial debt -1 340 -1 122
Total non-current financial debts 656 1 319
Straight bonds
USD 9.0% bonds 2006 of Gerber Products Company, Fremont, Michigan, US 34
EUR 4.0% EUR 900 million bond 2001/2006 of Novartis Securities Investment Ltd., Hamilton, Bermuda2 1 068
EUR 3.75% EUR 1 billion bond 2002/2007 of Novartis Securities Investment Ltd., Hamilton, Bermuda 1 318 1 192
Total straight bonds 1 318 2 294
1Average interest rate 2.3% (2005: 3.9%)2Swapped into Swiss francs in 2002
2006 2005USD millions USD millions
Breakdown by maturity 2006 1 122
2007 1 340 1 224
2008 32 23
2009 528 19
2010 17 14
2011 16
Thereafter 63 39
Total 1 996 2 441
2006 2005USD millions USD millions
Breakdown by currency USD 6 9
EUR 1 473 1 318
CHF 1 069
JPY 504
Others 13 45
Total 1 996 2 441
2006 2006 2005 2005Balance sheet Fair values Balance sheet Fair values
Fair value comparison USD millions USD millions USD millions USD millions
Straight bonds 1 318 1 318 2 294 2 321
Others 678 678 147 147
Total 1 996 1 996 2 441 2 468
Collateralized non-current 2006 2005financial debt and pledged assets USD millions USD millions
Total amount of collateralized non-current financial debts 29 19
Total net book value of property, plant & equipment pledged as collateral for non-current financial debts 118 91
The assets are pledged for bank overdraft facilities at usual marketconditions.
The percentage of fixed rate financial debt to total financial debtwas 27% and 28% at December 31, 2006 and 2005, respectively.
The financial debts, including current financial debts, containonly general default covenants. The Group is in compliance withthese covenants.
The average interest rate on total financial debt is 3.0% (2005:4.2%).
18. Non-current financial debts
s_186-209_Notes_Groups.qxd 23.1.2007 16:03 Uhr Seite 187

188
N O V A R T I S G R O U P F I N A N C I A L R E P O R T
2006 2005USD millions USD millions
Accrued liability for employee benefits:– defined benefit pension plans 1 343 1 480
– other long-term employee benefitsand deferred compensation 343 284
– other post-employment benefits 993 1 033
Liabilities for life insurance subsidiary activities 638 559
Environmental provisions 239 189
Provision for legal matters 634 621
Other non-current liabilities 344 283
Total 4 534 4 449
19.1) Environmental matters
Novartis has provisions in respect of environmental remediation costsin accordance with the accounting policy described in Note 1. Theprovision recorded at December 31, 2006 consists of USD 141 mil-lion (2005: USD 105 million) provided for remediation at third partysites and USD 112 million (2005: USD 97 million) for remediation atowned facilities. In the US, Novartis has been named under federallegislation (the Comprehensive Environmental Response, Compen-sation and Liability Act of 1980, as amended) as a potentially respon-sible party (PRP) in respect to certain sites. Novartis actively partici-pates in, or monitors, the clean-up activities at the sites in which it isa PRP. The estimated provision takes into consideration the numberof other PRPs at each site and the identity and financial position ofsuch parties in light of the joint and several nature of the liability.
The requirement in the future for Novartis ultimately to takeaction to correct the effects on the environment of prior disposal orrelease of chemical substances by Novartis or other parties, and itscosts, pursuant to environmental laws and regulations, is inherentlydifficult to estimate. The material components of the environmentalprovisions consist of costs to fully clean and refurbish contaminat-ed sites and to treat and contain contamination at sites where theenvironmental exposure is less severe. The Novartis future remedia-tion expenses are affected by a number of uncertainties whichinclude, but are not limited to, the method and extent of remedia-tion, the percentage of material attributable to Novartis at the reme-diation sites relative to that attributable to other parties, and thefinancial capabilities of the other potentially responsible parties.
In connection with the 1997 spin-off of CIBA Specialty Chemi-cals AG (CSC) from Novartis AG, a Novartis subsidiary has agreed toreimburse CSC 50% of the costs: (i) associated with environmental liabilities arising in the US from the operations of the specialtychemicals business of the US subsidiary of the former Ciba-GeigyAG, and (ii) which exceed provisions agreed between that subsidiary
and CSC. The reimbursement obligations are not subject to any timeor amount limits but could terminate for certain liabilities in the USupon the occurrence of certain contingencies which include themerger of CSC or the sale of its assets.
In connection with the acquisition of the Hexal group of compa-nies, a subsidiary within the Sandoz Division has entered into a leaseagreement for a factory in Radebeul, Germany owned by a Hexalcompany that was not acquired by Novartis. Because the Radebeulsite has supported chemical manufacturing for many years Novartisis continuing, with the support of the local Saxony government, athorough review of potential environmental contamination. Novartisbelieves that it has limited liability exposure for pre-existing environ-mental contamination or health risks associated therewith, if any,and should liability accrue, Novartis has been indemnified by theSellers under the Hexal acquisition documents and separately bycommitments of the local government.
Novartis believes that its total provisions for environmental matters are adequate based upon currently available information,however, given the inherent difficulties in estimating liabilities in thisarea, it cannot be guaranteed that additional costs will not beincurred beyond the amounts provided. The effect of resolution ofenvironmental matters on results of operations cannot be predicteddue to uncertainty concerning both the amount and the timing offuture expenditures and the results of future operations. Manage-ment believes that such additional amounts, if any, would not bematerial to the Group’s financial condition but could be material tothe results of operations or cash flows in a given period.
The following table shows the movements in the environmentalliability provisions during 2006 and 2005:
2006 2005USD millions USD millions
January 1 202 218
Impact of business combinations 18
Cash payments -15 -19
Releases -1
Additions 36 26
Translation effects 12 -22
December 31 253 202
Less current liability -14 -13
Non-current liability at December 31 239 189
19. Provisions and other non-current liabilities
s_186-209_Notes_Groups.qxd 23.1.2007 16:03 Uhr Seite 188

189
0 2 | G R O U P R E V I E W 1 2 | O P E R AT I O N A L R E V I E W 5 6 | C O R P O R AT E C I T I Z E N S H I P 9 3 | C O R P O R AT E G O V E R N A N C E 1 2 7 | N O V A R T I S G R O U P F I N A N C I A L R E P O R T
Notes to the Novartis Group Consolidated Financial Statements
19.2) Legal matters
A number of Novartis subsidiaries are subject to various legal pro-ceedings that arise from time to time in the ordinary course ofbusiness, including product liability, commercial, employment andwrongful discharge, securities, environmental and tax litigations andclaims, government investigations, intellectual property matters, andother legal proceedings. As a result, claims could be made againstthem which, in whole or in part, might not be covered by insurance.While Novartis does not believe that any of the matters will have amaterial adverse effect on its financial position, litigation is inherent-ly unpredictable and excessive verdicts do occur. As a consequence,Novartis may in the future incur judgments or enter into settlementsof claims that could have a material adverse effect on its results ofoperations or cash flows in any particular period.
From time to time, Novartis subsidiaries may be subject to gov-ernment investigations arising out of the normal conduct of theirbusiness. Consistent with the Novartis Code of Conduct and policiesregarding compliance with law, it is Novartis policy to cooperate withsuch investigations.
In the interest of transparency, Novartis is providing informationon the following matters:
Product Liability matters
HRT Litigation Novartis subsidiaries are defendants, along with various other pharmaceutical companies, in approximately 177 cases brought by approximately 1 425 plaintiffs claiming to have been injured byhormone replacement therapy (HRT) products. Discovery is under-way in these cases.
SMON (Subacute Myelo Optico Neuropathy)In 1996 a subsidiary of Ciba-Geigy, one of the predecessor compa-nies of Novartis, together with two other pharmaceutical companies,settled certain product liability issues related to sales of its productClioquinol in Japan. Under the settlement, a Novartis subsidiary isrequired to pay certain future healthcare costs of the claimants.
Zometa/Aredia Litigation A Novartis subsidiary is a defendant in approximately 201 casesbrought by approximately 253 named plaintiffs who claim to haveexperienced osteonecrosis of the jaw after having been treated withZometa or Aredia. Three of these cases purport to be class actions.Discovery is continuing in these cases.
Novartis maintains property damage, business interruption, productliability and other insurance policies with third parties, coveringclaims on a worldwide basis. Changes in the product liability in-surance market for originator pharmaceutical products have madepurchase of such policies not economical. For certain pharma-ceutical substances, coverage cannot be obtained at all. To copewith this change in market dynamics, Novartis has established provisions for the product liability risks of the Group up to certainlimits. Since January 1, 2006, these provisions have provided thesole means for affirmatively managing the product liability risks of Novartis Pharmaceuticals Division. Product liability insurance coverage for all other Divisions continue to be acquired from thirdparties. Novartis records product liability provisions for estimatedobligations for claims and related legal defense cost. Novartisbelieves that its insurance coverage and provisions are reasonableand provide the best estimate in the light of its business and therisks to which it is subject. The provisions are based on Manage-ment’s judgement, opinion of legal counsel and actuarially deter-mined estimates. However, events may occur which in whole or inpart, might not be covered by insurance or the provisions thatNovartis have put in place.
The largest portion of product liability risk provisions have beenactuarially determined taking into consideration such factors as pastexperience, number and amount of claims reported, estimates ofclaims incurred but not reported, cost of defending claims and oth-er assumptions. As actual experience becomes known the Group willcontinue to refine and adjust its product liability estimates. Actualexperience may also include provisions for product liability litigationand claims that differ significantly in size or frequency from histori-cal experience. Novartis will provide for those matters when known.If any of the assumptions used in this actuarial calculation wereproven to be incorrect or require material adjustment, there couldbe a material discrepancy between the amount of provisions thathave been booked and the potential liability.
At December 31, 2006 the following key assumptions were usedfor the actuarially determined provisions:
%
Weighted average worldwide inflation rate used for defending and settling claims 5.8
Weighted average worldwide discount rate for determining the net present value of estimated product liabilities not yet reported 4.5
A one percentage point change in the difference between these tworates amounts to an approximate USD 30 million income statementeffect.
s_186-209_Notes_Groups.qxd 24.1.2007 13:37 Uhr Seite 189

190
N O V A R T I S G R O U P F I N A N C I A L R E P O R T
Other matters
Average Wholesale Price Litigation Claims have been brought against various pharmaceutical compa-nies, including Novartis subsidiaries, alleging that they have fraudu-lently overstated the Average Wholesale Price (AWP) and “bestprice”, which are used by the US government to calculate, respec-tively, Medicare and Medicaid reimbursements. Discovery is ongoingin certain of these cases. Motions to dismiss the complaint or forsummary judgment have been filed by the defendants in certainother of these cases.
Chiron/FluvirinThe former Chiron Corporation, which Novartis acquired during2006, was the subject of a number of legal proceedings arising outof Chiron’s inability to deliver its Fluvirin influenza vaccine to the USmarket for the 2004/05 flu season, including class action lawsuitsalleging breaches of the securities laws and of shareholder derivativelawsuits alleging breaches of fiduciary duties. The securities fraudclass actions were settled in April 2006. Once the memorandum ofunderstanding has been executed, it will be submitted to the courtfor approval. The share derivative litigations have all been dismissed.
Gender DiscriminationCertain US Novartis subsidiaries are defendants in a purportedclass action brought in Federal Court in New York by certain femalepharmaceutical sales representatives who allege that they werediscriminated against because of their gender. A motion for sum-mary judgement has been filed by a Novartis subsidiary.
Trileptal InvestigationThe US Attorney’s Office for the Eastern District of Pennsylvaniaserved an administrative subpoena pursuant to the Health Insur-ance Portability and Accountability Act on a Novartis subsidiary.Novartis understands that the US Attorney’s Office is conductingparallel civil and criminal investigations into allegations of potentialoff-label promotion of Trileptal. At this time, Novartis is unable toexpress an opinion as to the likely outcome of these investigations.
Wage and Hour LitigationCertain pharmaceutical sales representatives have filed suit in StateCourt in California and in Federal Court in New York against USNovartis subsidiaries alleging that they violated wage and hour lawsby failing to pay overtime pay to the sales representatives. Certain ofthe claims are brought on behalf of a purported class of plaintiffs.The California State Court action has been removed to Federal Courtand transferred to New York for pretrial proceedings.
Intellectual Property matters
Contact Lenses Several lawsuits are pending relating to the Nicolson patents, whichprotect CIBA Vision NIGHT & DAY and O2OPTIX silicone hydrogelcontact lens technology. Johnson & Johnson filed a suit againstCIBA Vision in 2003, seeking a declaration that their Acuvue®
Advance™ product does not infringe the Nicolson patents and/orthat the patents are invalid. Two subsequent additional suits werefiled by Johnson & Johnson, seeking declaration that the launch oftheir Oasys™ and Advance™ toric products do not infringe theseCIBA Vision patents. Discovery is ongoing in these cases. Similar-ly, CooperVision filed suit in April 2006 seeking a declaratory judg-ment of invalidity and non-infringement of the Nicolson patents,and alleging infringement of five patents relating to optical designsand edge profiles of certain kinds of contact lenses by CIBA Vision’sproduct, O2OPTIX. Rembrandt Vision Technologies has also filed apatent infringement suit against CIBA Vision in October 2005. Theasserted patent relates to the surface treatment of lenses andinvolves CIBA Vision’s O2OPTIX and NIGHT & DAY, products.
LotrelLotrel is a combination of benazepril hydrochloride and amlodipinebesylate. Patent protection for the benazepril substance has expiredin the US. Patent protection for the amlodipine besylate substancewill expire in the US in March 2007. In addition to these patents, Lotrelis protected by an additional combination patent in the US until 2017.Generic manufacturers have challenged this patent, and Novartis hassued them. Our action against one of these manufacturers is current-ly stayed.
19. Provisions and other non-current liabilities (continued)
s_186-209_Notes_Groups.qxd 23.1.2007 16:03 Uhr Seite 190

191
0 2 | G R O U P R E V I E W 1 2 | O P E R AT I O N A L R E V I E W 5 6 | C O R P O R AT E C I T I Z E N S H I P 9 3 | C O R P O R AT E G O V E R N A N C E 1 2 7 | N O V A R T I S G R O U P F I N A N C I A L R E P O R T
Notes to the Novartis Group Consolidated Financial Statements
Several matters which Novartis previously disclosed were resolved in 2006, or are likely to be resolved in 2007 or afterwards, with no significant risk to the Group’s financial position absent unfore-seen events or circumstances. These matters are: Fen-Phen and PPA product liability litigation; Chiron Acquisition, PharmaceuticalAntitrust Litigation, Canadian Importation Litigation and Terazosinlitigation; the UK Generics investigation; and intellectual property lit-igation involving the Group’s products Exelon, Famvir, Focalin, Miacal-cin/Miacalcic, Neoral and Omeprazole.
Novartis believes that its total provisions for legal and product liabil-ity matters are adequate based upon currently available informa-tion, however, given the inherent difficulties in estimating liabilities,it cannot be guaranteed that additional costs will not be incurredbeyond the amounts provided. Management believes that suchadditional amounts, if any, would not be material to the Group’sfinancial condition but could be material to the results of operationsand cash flows in a given period.
The following table shows the movements in the legal and productliability provisions during 2006 and 2005:
2006 2005USD millions USD millions
January 1 825 1 012
Impact of business combinations 46 79
Cash payments -159 -249
Releases -56 -107
Additions 233 115
Translation effects 14 -25
December 31 903 825
Less current liability -269 -204
Total non-current liability at December 31 634 621
2006 2005USD millions USD millions
Interest bearing employee accounts 972 897
Other bank and financial debt 2 809 4 047
Commercial paper 1 439 824
Current portion of non-current financial debt 1 340 1 122
Fair value of derivative financial instruments 83 245
Total current financial debt 6 643 7 135
20. Current financial debt The balance sheet values of current financial debt, other than thecurrent portion of non-current financial debts, approximates to theestimated fair value due to the short-term nature of these instru-ments.
The weighted average interest rate on the bank and other cur-rent financial debt including employee accounts was 2.4% and 2.1%in 2006 and 2005, respectively.
s_186-209_Notes_Groups.qxd 23.1.2007 16:03 Uhr Seite 191
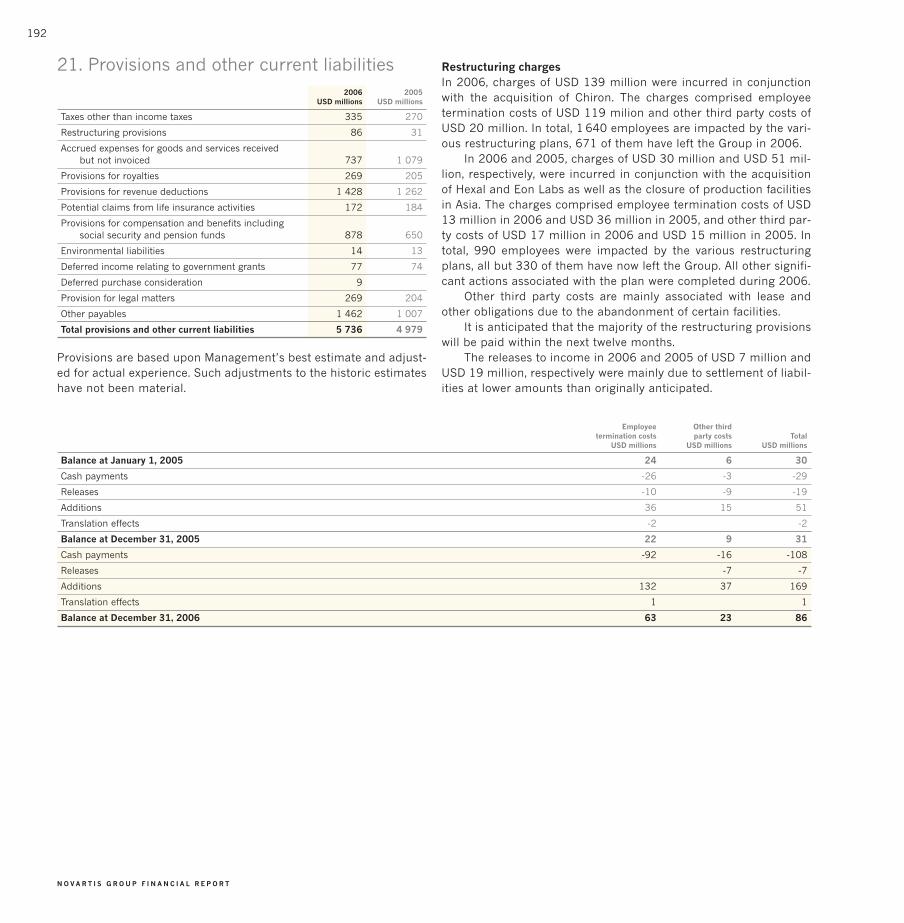
192
N O V A R T I S G R O U P F I N A N C I A L R E P O R T
2006 2005USD millions USD millions
Taxes other than income taxes 335 270
Restructuring provisions 86 31
Accrued expenses for goods and services received but not invoiced 737 1 079
Provisions for royalties 269 205
Provisions for revenue deductions 1 428 1 262
Potential claims from life insurance activities 172 184
Provisions for compensation and benefits including social security and pension funds 878 650
Environmental liabilities 14 13
Deferred income relating to government grants 77 74
Deferred purchase consideration 9
Provision for legal matters 269 204
Other payables 1 462 1 007
Total provisions and other current liabilities 5 736 4 979
Provisions are based upon Management’s best estimate and adjust-ed for actual experience. Such adjustments to the historic estimateshave not been material.
21. Provisions and other current liabilities Restructuring charges In 2006, charges of USD 139 million were incurred in conjunctionwith the acquisition of Chiron. The charges comprised employee termination costs of USD 119 milion and other third party costs ofUSD 20 million. In total, 1 640 employees are impacted by the vari-ous restructuring plans, 671 of them have left the Group in 2006.
In 2006 and 2005, charges of USD 30 million and USD 51 mil-lion, respectively, were incurred in conjunction with the acquisitionof Hexal and Eon Labs as well as the closure of production facilitiesin Asia. The charges comprised employee termination costs of USD13 million in 2006 and USD 36 million in 2005, and other third par-ty costs of USD 17 million in 2006 and USD 15 million in 2005. Intotal, 990 employees were impacted by the various restructuringplans, all but 330 of them have now left the Group. All other signifi-cant actions associated with the plan were completed during 2006.
Other third party costs are mainly associated with lease and other obligations due to the abandonment of certain facilities.
It is anticipated that the majority of the restructuring provisionswill be paid within the next twelve months.
The releases to income in 2006 and 2005 of USD 7 million andUSD 19 million, respectively were mainly due to settlement of liabil-ities at lower amounts than originally anticipated.
Employee Other thirdtermination costs party costs Total
USD millions USD millions USD millions
Balance at January 1, 2005 24 6 30
Cash payments -26 -3 -29
Releases -10 -9 -19
Additions 36 15 51
Translation effects -2 -2
Balance at December 31, 2005 22 9 31
Cash payments -92 -16 -108
Releases -7 -7
Additions 132 37 169
Translation effects 1 1
Balance at December 31, 2006 63 23 86
s_186-209_Notes_Groups.qxd 23.1.2007 16:03 Uhr Seite 192

193
0 2 | G R O U P R E V I E W 1 2 | O P E R AT I O N A L R E V I E W 5 6 | C O R P O R AT E C I T I Z E N S H I P 9 3 | C O R P O R AT E G O V E R N A N C E 1 2 7 | N O V A R T I S G R O U P F I N A N C I A L R E P O R T
Notes to the Novartis Group Consolidated Financial Statements
2006 2005USD millions USD millions
Change in inventories -117 185
Change in trade accounts receivable -513 -505
Change in trade accounts payable 258 -28
Change in other net current assets and other operating cash flow items 382 987
Change in other long-term liabilities 156 199
Total 166 838
22. Cash flows from continuing operations arising from changes in working capital and other operating items included in operating cash flow
23. Acquisitions and divestments of businesses
23.1) Cash flow arising from acquisitions and divestments of businesses
The following is a summary of the cash flow impact of acquisitions and divestments of businesses:
2006 2006 2005 2005Acquisitions Divestments Acquisitions Divestments
USD millions USD millions USD millions USD millions
Property, plant & equipment -1 031 38 -665
Currently marketed products including trademarks -3 256 2 -2 123
In-process research and development -1 216 -619
Other intangible assets -307 -346
Financial assets including deferred tax assets -438 21 -199
Inventories -540 35 -692
Trade accounts receivable and other current assets -535 68 -409
Marketable securities and cash -1 771 1 -319
Long-term and short-term financial debts 1 462 -150 338
Trade accounts payable and other liabilities including deferred tax liabilities 2 346 -82 1 866
Accrued liabilities to seller 11
Translation effects 10
Identifiable net assets acquired or divested -5 286 -46 -3 168
Proportionate fair value of acquired identifiable net assets of existing interest 2 154
Acquired/divested liquidity 1 739 -1 155
Sub-total -1 393 -47 -3 013
Refinancing of intercompany financial debt, net 129
Goodwill -3 155 23 -5 531
Divestment gain 122 8
Net cash flow -4 548 227 -8 544 8
thereof:Net cash flow from discontinuing operations 201
Net cash flow from continuing operations -4 548 26 -8 544 8
Notes 2 and 3 provide further information regarding acquisitions and divestments of businesses. All acquisitions were for cash.
s_186-209_Notes_Groups.qxd 23.1.2007 16:33 Uhr Seite 193
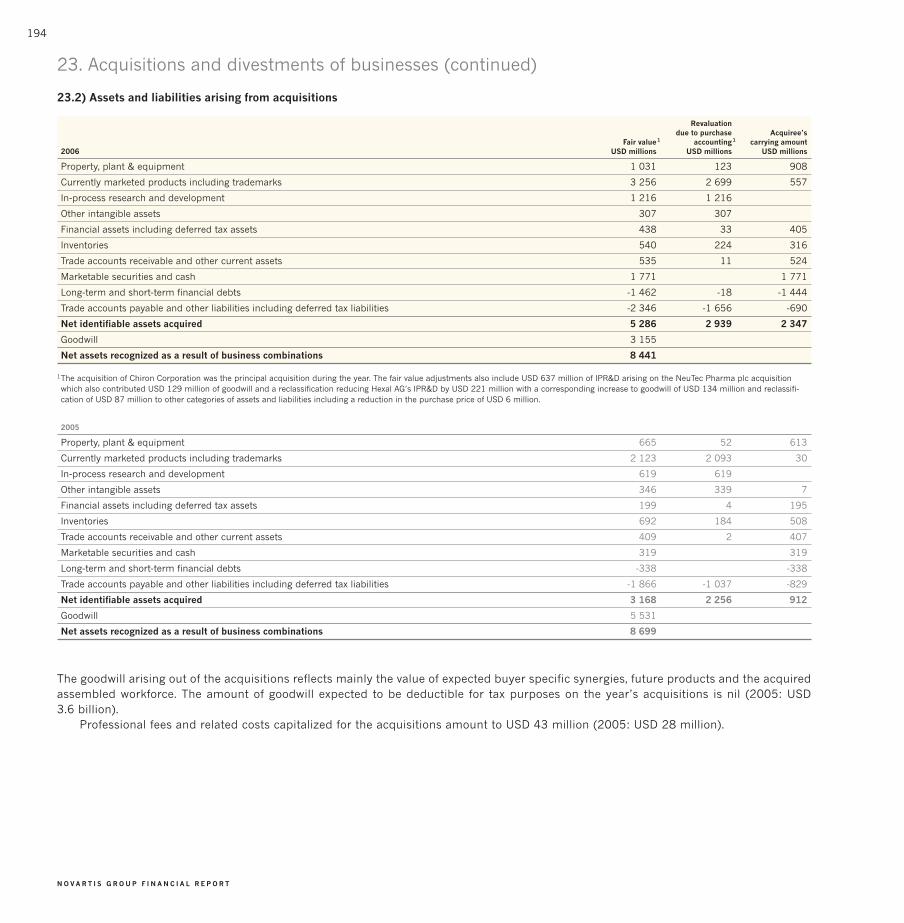
194
N O V A R T I S G R O U P F I N A N C I A L R E P O R T
23. Acquisitions and divestments of businesses (continued)
23.2) Assets and liabilities arising from acquisitions
Revaluation due to purchase Acquiree’s
Fair value1 accounting1 carrying amount2006 USD millions USD millions USD millions
Property, plant & equipment 1 031 123 908
Currently marketed products including trademarks 3 256 2 699 557
In-process research and development 1 216 1 216
Other intangible assets 307 307
Financial assets including deferred tax assets 438 33 405
Inventories 540 224 316
Trade accounts receivable and other current assets 535 11 524
Marketable securities and cash 1 771 1 771
Long-term and short-term financial debts -1 462 -18 -1 444
Trade accounts payable and other liabilities including deferred tax liabilities -2 346 -1 656 -690
Net identifiable assets acquired 5 286 2 939 2 347
Goodwill 3 155
Net assets recognized as a result of business combinations 8 441
1The acquisition of Chiron Corporation was the principal acquisition during the year. The fair value adjustments also include USD 637 million of IPR&D arising on the NeuTec Pharma plc acquisitionwhich also contributed USD 129 million of goodwill and a reclassification reducing Hexal AG’s IPR&D by USD 221 million with a corresponding increase to goodwill of USD 134 million and reclassifi-cation of USD 87 million to other categories of assets and liabilities including a reduction in the purchase price of USD 6 million.
2005
Property, plant & equipment 665 52 613
Currently marketed products including trademarks 2 123 2 093 30
In-process research and development 619 619
Other intangible assets 346 339 7
Financial assets including deferred tax assets 199 4 195
Inventories 692 184 508
Trade accounts receivable and other current assets 409 2 407
Marketable securities and cash 319 319
Long-term and short-term financial debts -338 -338
Trade accounts payable and other liabilities including deferred tax liabilities -1 866 -1 037 -829
Net identifiable assets acquired 3 168 2 256 912
Goodwill 5 531
Net assets recognized as a result of business combinations 8 699
The goodwill arising out of the acquisitions reflects mainly the value of expected buyer specific synergies, future products and the acquiredassembled workforce. The amount of goodwill expected to be deductible for tax purposes on the year’s acquisitions is nil (2005: USD 3.6 billion).
Professional fees and related costs capitalized for the acquisitions amount to USD 43 million (2005: USD 28 million).
s_186-209_Notes_Groups.qxd 23.1.2007 16:03 Uhr Seite 194

195
0 2 | G R O U P R E V I E W 1 2 | O P E R AT I O N A L R E V I E W 5 6 | C O R P O R AT E C I T I Z E N S H I P 9 3 | C O R P O R AT E G O V E R N A N C E 1 2 7 | N O V A R T I S G R O U P F I N A N C I A L R E P O R T
Notes to the Novartis Group Consolidated Financial Statements
23.3) Assets and liabilities related to discontinuing operations
ASSETS RELATED TO DISCONTINUING OPERATIONS
2006USD millions
Property, plant & equipment 69
Intangible assets 370
Deferred tax assets 10
Other financial assets 8
Total non-current assets reclassified as assets related to discontinuing operations 457
Inventories 120
Trade accounts receivable 139
Other current assets 16
Cash and cash equivalents 4
Total current assets reclassified as assets related to discontinuing operations 279
Total assets related to discontinuing operations 736
LIABILITIES RELATED TO DISCONTINUING OPERATIONS
2006USD millions
Financial debts 2
Deferred tax liabilities 18
Provisions and other non-current liabilities 31
Total non-current liabilities reclassified as liabilities related to discontinuing operations 51
Trade accounts payable 69
Financial debts 5
Current income tax liabilities 17
Provisions and other current liabilities 65
Total current liabilities reclassified as liabilities related to discontinuing operations 156
Total liabilities related to discontinuing operations 207
23.4) Cash flow from discontinuing operationsThe following is a summary of the cash flow components of the discontinuing operations:
2006 2005USD millions USD millions
Cash flow from operating activities 118 105
Cash flow used for investing activities 190 -33
Cash flow used for financing activities 4
Total cash flow from discontinuing operations 308 76
s_186-209_Notes_Groups.qxd 23.1.2007 16:03 Uhr Seite 195

196
N O V A R T I S G R O U P F I N A N C I A L R E P O R T
The statement of recognized income and expense includes the Group’s net income for the year as well as all other valuation adjustmentsrecorded in the Group’s consolidated balance sheet but which under IFRS are not recorded in the income statement. These include fairvalue adjustments to marketable securities, actuarial losses or gains on defined benefit pension and other post-employment plans andtranslation effects. These amounts are subject to significant volatility outside of the control of management due to such factors as shareprice, currency and interest rate movements.
The following table summarizes these fair value adjustments attributable to Novartis shareholders:
Fair value Fair value Actuarial gains/adjustments adjustments losses from Revaluation Cumulative Total
on marketable of deferred cash defined benefit of initial minority translation Discontinuing fair valuesecurities flow hedges plans interest in Chiron effects operations adjustments
USD millions USD millions USD millions USD millions USD millions USD millions USD millions
Fair value adjustments at January 1, 2005 399 -20 -1 691 1 777 465
Fair value adjustments on financial instruments -76 1 -75
Actuarial net losses from defined benefit plans -400 -400
Translation effects -1 976 -1 976
Total fair value adjustments in 2005 -76 1 -400 -1 976 -2 451
Fair value adjustments at December 31, 2005 323 -19 -2 091 -199 -1 986
Transfers relating to discontinuing operations 8 -7 -1
Fair value adjustments on financial instruments 67 27 94
Actuarial net gains from defined benefit plans 141 141
Revaluation of initial minority interest in Chiron 592 592
Translation effects 1 485 1 485
Fair value movements for discontinuing operations in year 5 5
Total fair value adjustments in 2006 67 27 149 592 1 478 4 2 317
Fair value adjustments at December 31, 2006 390 8 -1 942 592 1 279 4 331
24.1) The 2006 and 2005 changes in the fair value of financial instruments consist of the following:
Fair value Fair valueadjustments to adjustments of
marketable deferred cashsecurities flow hedges Total
USD millions USD millions USD millions
Fair value adjustments at January 1, 2006 323 -19 304
Changes in fair value: – available-for-sale marketable securities -27 -27
– cash flow hedges -31 -31
– other financial assets 80 80
– associated companies’ equity movements -5 -5
Realized net losses transferred to the income statement:– marketable securities sold -2 -2
– derivative financial instruments 65 65
– other financial assets sold -15 -15
Impaired marketable securities and other financial assets 46 46
Deferred tax on above -10 -7 -17
Fair value adjustments during the year 67 27 94
Fair value adjustmentsat December 31, 2006 390 8 398
Fair value Fair valueadjustments to adjustments of
marketable deferred cashsecurities flow hedges Total
USD millions USD millions USD millions
Fair value adjustments at January 1, 2005 399 -20 379
Changes in fair value: – available-for-sale marketable securities -81 -81
– cash flow hedges -14 -14
– other financial assets 25 25
– associated companies’ equity movements -6 -6
Realized net gains transferred to the income statement:– marketable securities sold -69 -69
– derivative financial instruments 15 15
– other financial assets sold -65 -65
Impaired marketable securities and other financial assets 92 92
Deferred tax on above 28 28
Fair value adjustments during the year -76 1 -75
Fair value adjustments at December 31, 2005 323 -19 304
24. Changes in consolidated statement of recognized income and expense
s_186-209_Notes_Groups.qxd 23.1.2007 16:03 Uhr Seite 196
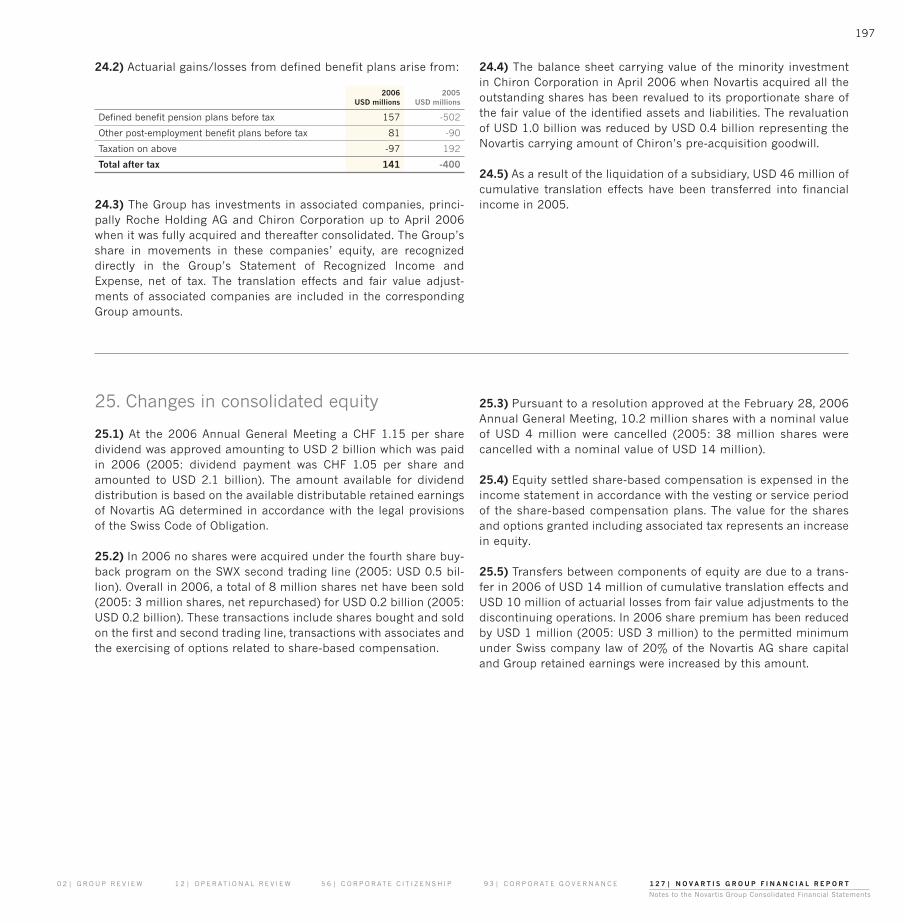
197
0 2 | G R O U P R E V I E W 1 2 | O P E R AT I O N A L R E V I E W 5 6 | C O R P O R AT E C I T I Z E N S H I P 9 3 | C O R P O R AT E G O V E R N A N C E 1 2 7 | N O V A R T I S G R O U P F I N A N C I A L R E P O R T
Notes to the Novartis Group Consolidated Financial Statements
24.2) Actuarial gains/losses from defined benefit plans arise from:
2006 2005USD millions USD millions
Defined benefit pension plans before tax 157 -502
Other post-employment benefit plans before tax 81 -90
Taxation on above -97 192
Total after tax 141 -400
24.3) The Group has investments in associated companies, princi-pally Roche Holding AG and Chiron Corporation up to April 2006when it was fully acquired and thereafter consolidated. The Group’sshare in movements in these companies’ equity, are recognizeddirectly in the Group’s Statement of Recognized Income andExpense, net of tax. The translation effects and fair value adjust-ments of associated companies are included in the correspondingGroup amounts.
24.4) The balance sheet carrying value of the minority investment in Chiron Corporation in April 2006 when Novartis acquired all theoutstanding shares has been revalued to its proportionate share ofthe fair value of the identified assets and liabilities. The revaluationof USD 1.0 billion was reduced by USD 0.4 billion representing theNovartis carrying amount of Chiron’s pre-acquisition goodwill.
24.5) As a result of the liquidation of a subsidiary, USD 46 million ofcumulative translation effects have been transferred into financialincome in 2005.
25.1) At the 2006 Annual General Meeting a CHF 1.15 per share dividend was approved amounting to USD 2 billion which was paidin 2006 (2005: dividend payment was CHF 1.05 per share andamounted to USD 2.1 billion). The amount available for dividend distribution is based on the available distributable retained earningsof Novartis AG determined in accordance with the legal provisions of the Swiss Code of Obligation.
25.2) In 2006 no shares were acquired under the fourth share buy-back program on the SWX second trading line (2005: USD 0.5 bil-lion). Overall in 2006, a total of 8 million shares net have been sold(2005: 3 million shares, net repurchased) for USD 0.2 billion (2005:USD 0.2 billion). These transactions include shares bought and soldon the first and second trading line, transactions with associates andthe exercising of options related to share-based compensation.
25. Changes in consolidated equity 25.3) Pursuant to a resolution approved at the February 28, 2006 Annual General Meeting, 10.2 million shares with a nominal valueof USD 4 million were cancelled (2005: 38 million shares werecancelled with a nominal value of USD 14 million).
25.4) Equity settled share-based compensation is expensed in theincome statement in accordance with the vesting or service periodof the share-based compensation plans. The value for the sharesand options granted including associated tax represents an increasein equity.
25.5) Transfers between components of equity are due to a trans-fer in 2006 of USD 14 million of cumulative translation effects andUSD 10 million of actuarial losses from fair value adjustments to thediscontinuing operations. In 2006 share premium has been reducedby USD 1 million (2005: USD 3 million) to the permitted minimumunder Swiss company law of 20% of the Novartis AG share capitaland Group retained earnings were increased by this amount.
s_186-209_Notes_Groups.qxd 23.1.2007 16:03 Uhr Seite 197
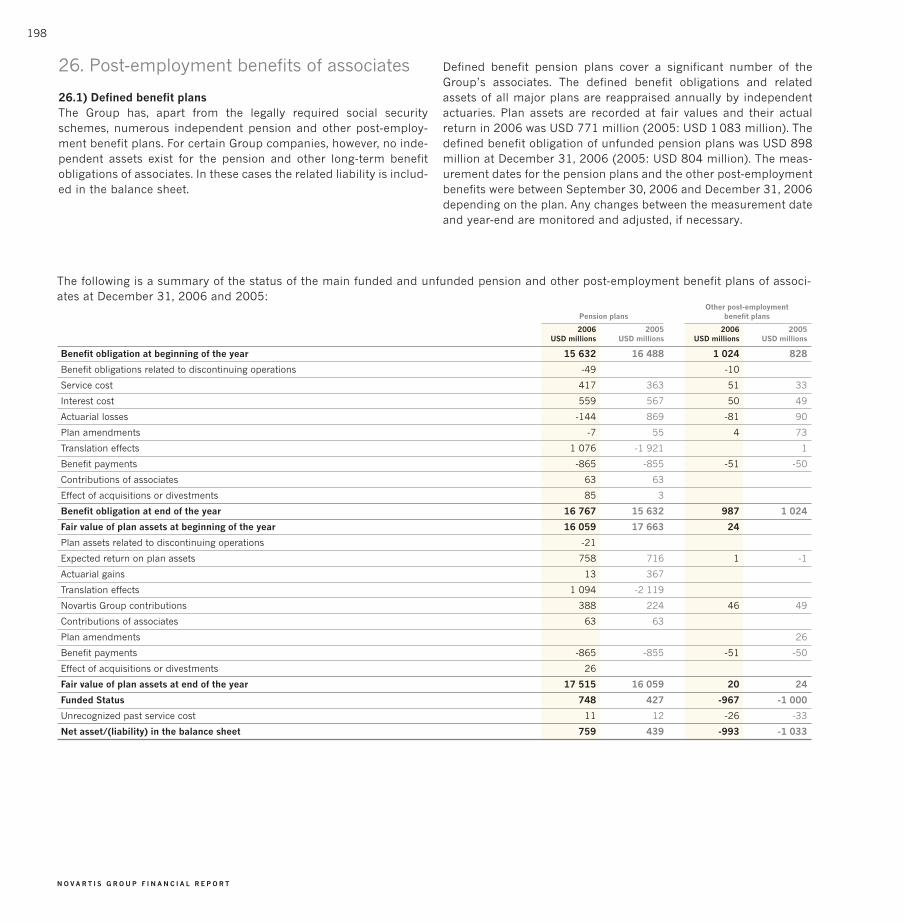
198
N O V A R T I S G R O U P F I N A N C I A L R E P O R T
26.1) Defined benefit plansThe Group has, apart from the legally required social securityschemes, numerous independent pension and other post-employ-ment benefit plans. For certain Group companies, however, no inde-pendent assets exist for the pension and other long-term benefitobligations of associates. In these cases the related liability is includ-ed in the balance sheet.
26. Post-employment benefits of associates Defined benefit pension plans cover a significant number of theGroup’s associates. The defined benefit obligations and relatedassets of all major plans are reappraised annually by independentactuaries. Plan assets are recorded at fair values and their actualreturn in 2006 was USD 771 million (2005: USD 1 083 million). Thedefined benefit obligation of unfunded pension plans was USD 898million at December 31, 2006 (2005: USD 804 million). The meas-urement dates for the pension plans and the other post-employmentbenefits were between September 30, 2006 and December 31, 2006depending on the plan. Any changes between the measurement dateand year-end are monitored and adjusted, if necessary.
The following is a summary of the status of the main funded and unfunded pension and other post-employment benefit plans of associ-ates at December 31, 2006 and 2005:
Other post-employmentPension plans benefit plans
2006 2005 2006 2005USD millions USD millions USD millions USD millions
Benefit obligation at beginning of the year 15 632 16 488 1 024 828
Benefit obligations related to discontinuing operations -49 -10
Service cost 417 363 51 33
Interest cost 559 567 50 49
Actuarial losses -144 869 -81 90
Plan amendments -7 55 4 73
Translation effects 1 076 -1 921 1
Benefit payments -865 -855 -51 -50
Contributions of associates 63 63
Effect of acquisitions or divestments 85 3
Benefit obligation at end of the year 16 767 15 632 987 1 024
Fair value of plan assets at beginning of the year 16 059 17 663 24
Plan assets related to discontinuing operations -21
Expected return on plan assets 758 716 1 -1
Actuarial gains 13 367
Translation effects 1 094 -2 119
Novartis Group contributions 388 224 46 49
Contributions of associates 63 63
Plan amendments 26
Benefit payments -865 -855 -51 -50
Effect of acquisitions or divestments 26
Fair value of plan assets at end of the year 17 515 16 059 20 24
Funded Status 748 427 -967 -1 000
Unrecognized past service cost 11 12 -26 -33
Net asset/(liability) in the balance sheet 759 439 -993 -1 033
s_186-209_Notes_Groups.qxd 23.1.2007 16:03 Uhr Seite 198

199
0 2 | G R O U P R E V I E W 1 2 | O P E R AT I O N A L R E V I E W 5 6 | C O R P O R AT E C I T I Z E N S H I P 9 3 | C O R P O R AT E G O V E R N A N C E 1 2 7 | N O V A R T I S G R O U P F I N A N C I A L R E P O R T
Notes to the Novartis Group Consolidated Financial Statements
The movement in the net asset and the amounts recognized in the balance sheet were as follows:
Other post-employmentPension plans benefit plans
2006 2005 2006 2005USD millions USD millions USD millions USD millions
Movement in net asset or (liability)
Net asset or (liability) in the balance sheet at beginning of the year 439 1 181 -1 033 -862
Net asset or (liability) related to discontinuing operations 28 10
Net periodic benefit cost -199 -218 -96 -58
Novartis Group contributions 388 224 46 49
Past service costs arisen in the current year -12 10 -6
Plan amendments, net -1 -55 3 -65
Effect of acquisitions or divestments -59 -3 -4
Change in actuarial gain/losses 157 -502 81 -90
Translation effects 18 -198 -1
Net asset or (liability) in the balance sheet at end of the year 759 439 -993 -1 033
Amounts recognized in the balance sheet
Prepaid benefit cost 2 102 1 919
Accrued benefit liability -1 343 -1 480 -993 -1 033
Net asset or (liability) in the balance sheet at the end of the year 759 439 -993 -1 033
The net periodic benefit cost recorded in the income statement consists of the following components:
Other post-employmentPension plans benefit plans
2006 2005 2006 2005USD millions USD millions USD millions USD millions
Components of net periodic benefit cost
Service cost 417 363 51 33
Interest cost 559 567 50 49
Expected returns on plan assets -758 -716 -1 1
Recognized past service cost -11 4 -4 -7
Curtailment/settlement gains -8 -18
Net periodic benefit cost 199 218 96 58
The principal actuarial weighted average assumptions used for calculating defined benefit plans and other post-employment benefits ofassociates are as follows:
Other post-employmentPension plans benefit plans
2006 2005 2006 2005% % % %
Weighted average assumptions used to determine benefit obligations at the end of year
Discount rate 3.6 3.4 5.8 5.5
Expected rate of salary increase 3.7 2.7
Weighted average assumptions used to determine net periodic pension cost for the year ended
Discount rate 3.4 3.8 5.5 5.8
Expected return on plan assets 4.5 4.5
Expected rate of salary increase 2.7 2.8
s_186-209_Notes_Groups.qxd 23.1.2007 16:03 Uhr Seite 199
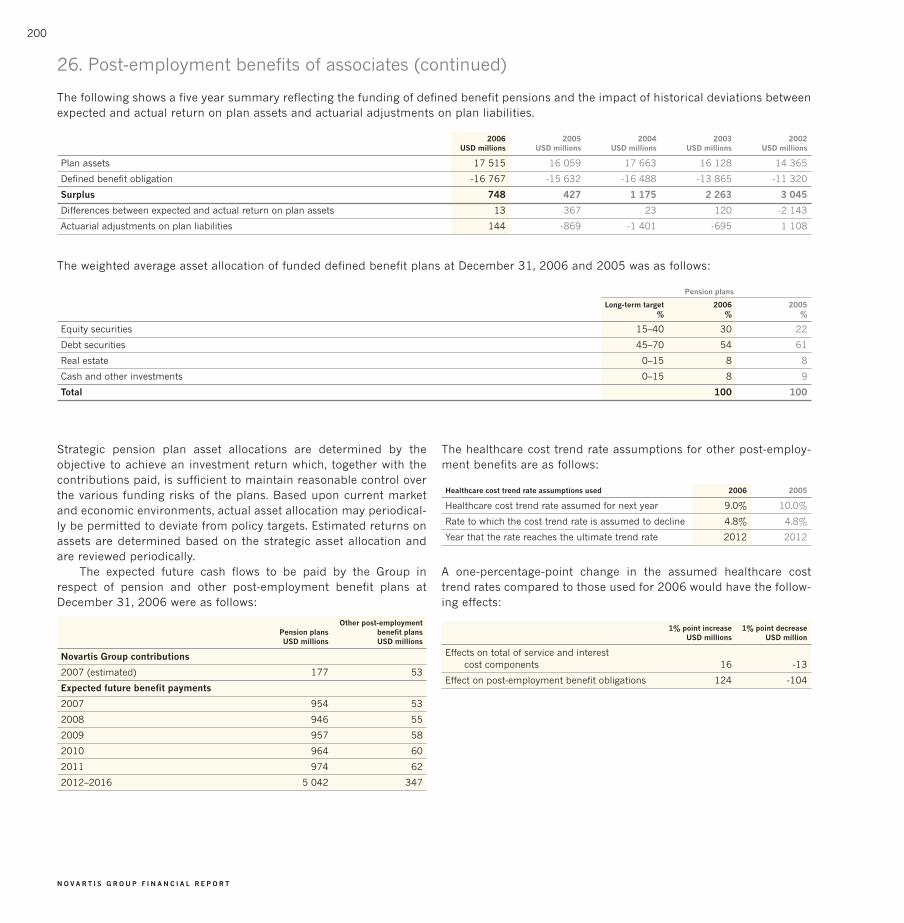
200
N O V A R T I S G R O U P F I N A N C I A L R E P O R T
The following shows a five year summary reflecting the funding of defined benefit pensions and the impact of historical deviations betweenexpected and actual return on plan assets and actuarial adjustments on plan liabilities.
2006 2005 2004 2003 2002USD millions USD millions USD millions USD millions USD millions
Plan assets 17 515 16 059 17 663 16 128 14 365
Defined benefit obligation -16 767 -15 632 -16 488 -13 865 -11 320
Surplus 748 427 1 175 2 263 3 045
Differences between expected and actual return on plan assets 13 367 23 120 -2 143
Actuarial adjustments on plan liabilities 144 -869 -1 401 -695 1 108
The weighted average asset allocation of funded defined benefit plans at December 31, 2006 and 2005 was as follows:
Pension plans
Long-term target 2006 2005% % %
Equity securities 15–40 30 22
Debt securities 45–70 54 61
Real estate 0–15 8 8
Cash and other investments 0–15 8 9
Total 100 100
26. Post-employment benefits of associates (continued)
Strategic pension plan asset allocations are determined by theobjective to achieve an investment return which, together with thecontributions paid, is sufficient to maintain reasonable control overthe various funding risks of the plans. Based upon current marketand economic environments, actual asset allocation may periodical-ly be permitted to deviate from policy targets. Estimated returns onassets are determined based on the strategic asset allocation andare reviewed periodically.
The expected future cash flows to be paid by the Group inrespect of pension and other post-employment benefit plans atDecember 31, 2006 were as follows:
Other post-employmentPension plans benefit plansUSD millions USD millions
Novartis Group contributions
2007 (estimated) 177 53
Expected future benefit payments
2007 954 53
2008 946 55
2009 957 58
2010 964 60
2011 974 62
2012–2016 5 042 347
The healthcare cost trend rate assumptions for other post-employ-ment benefits are as follows:
Healthcare cost trend rate assumptions used 2006 2005
Healthcare cost trend rate assumed for next year 9.0% 10.0%
Rate to which the cost trend rate is assumed to decline 4.8% 4.8%
Year that the rate reaches the ultimate trend rate 2012 2012
A one-percentage-point change in the assumed healthcare costtrend rates compared to those used for 2006 would have the follow-ing effects:
1% point increase 1% point decreaseUSD millions USD million
Effects on total of service and interest cost components 16 -13
Effect on post-employment benefit obligations 124 -104
s_186-209_Notes_Groups.qxd 23.1.2007 16:03 Uhr Seite 200

201
0 2 | G R O U P R E V I E W 1 2 | O P E R AT I O N A L R E V I E W 5 6 | C O R P O R AT E C I T I Z E N S H I P 9 3 | C O R P O R AT E G O V E R N A N C E 1 2 7 | N O V A R T I S G R O U P F I N A N C I A L R E P O R T
Notes to the Novartis Group Consolidated Financial Statements
The number of Novartis AG shares held by pension and similarbenefit funds at December 31, 2006 was 21.6 million shares witha market value of USD 1.2 billion (2005: 21.6 million shares with amarket value of USD 1.1 billion). These funds sold no Novartis AGshares during the year ended December 31, 2006 (2005: 9.3 mil-lion). The amount of dividends received on Novartis AG shares heldas plan assets by these funds were USD 20 million for the yearended December 31, 2006 (2005: USD 26 million).
26.2) Defined contribution plansIn some Group companies associates are covered by defined con-tribution plans and other long-term benefits of associates. The lia-bility of the Group for these benefits is reported in other long-termbenefits of associates and deferred compensation and at Decem-ber 31, 2006 amounts to USD 343 million (2005: USD 284 mil-lion). In 2006 contributions charged to the consolidated incomestatement for the defined contribution plans were USD 123 million(2005: USD 118 million).
Associate and management share participation plans can be sepa-rated into the Novartis equity plan “Select” and other share plans(the “Plans”). The expense recorded in the income statementspreads the cost of each grant equally over the vesting period.Assumptions are made concerning the forfeiture rate which isadjusted during the vesting period so that at the end of the vestingperiod there is only a charge for vested amounts. As permitted bythe transitional rules of IFRS 2, grants prior to November 7, 2002,have not been included in the income statement. Total expenserelated to all Novartis equity plans in the 2006 income statementwas USD 653 million (2005: USD 532 million) resulting in a totalcarrying amount for liabilities arising from share-based paymenttransactions of USD 154 million (2005: USD 149 million). The totalamount of cash used to settle awards was USD 100 million (2005:USD 97 million). As of December 31, 2006, there was USD 478 mil-lion of total unrecognized compensation cost related to non-vestedshare-based compensation arrangements granted under the Plans.That cost is expected to be recognized over a weighted-average peri-od of 1.75 years. The amount of related income tax benefit recog-nized in the income statement was USD 172 million (2005: USD148 million). In addition, due to its majority owned US quoted sub-sidiary Idenix Pharmaceuticals Inc., Novartis recognized an addition-al share-based compensation expense of USD 9 million (2005: USD6 million). Participants in the Novartis equity plans from discontin-uing operations were granted 32 428 shares (2005: 58 194 shares)and 135 463 options (2005: 157 539 options). The expense record-ed in the 2006 income statement amounted to USD 4 million (2005:USD 4 million).
27. Share participation plans of associates 27.1) Novartis Equity Plan “Select”
Under the plan called “Select” as adopted by the Board of Directorsin 2004, participants can elect to receive their equity awards in theform of restricted shares, tradable share options, or a combinationthereof. The Compensation Committee allocates the number ofshares and share options based on the individual choice of the par-ticipant before the predetermined grant date. The share options aretradable, expire at the tenth anniversary and are exercisable for oneshare each (1:1). The exercise price equals the market price of theunderlying share at the predetermined grant date. Shares and trad-able share options have a vesting period of two years in Switzerlandand three years in other countries. As a consequence, if a participantleaves Novartis, shares or options not yet vested are forfeited if notdetermined otherwise by the Compensation Committee (e.g. forreorganizations or divestments).
These long-term incentive awards in the form of restrictedshares and/or tradable share options are made each year based onthe associate’s individual year-end performance rating. Participantsin the Novartis equity plan Select were granted 1 171 478 shares(2005: 1 294 567 shares) for the Novartis Equity Plan “Select” out-side North America and 2 109 924 ADS (2005: 2 270 646 ADS) forthe Novartis Equity Plan “Select” for North America.
A) Novartis Equity Plan “Select” outside North AmericaDirectors (through 2002), executives and other selected employeesof Group companies (collectively, the “Participants”) may receiveequity awards. These equity awards are made both in recognition ofpast performance and as an incentive for future contributions by theParticipants. They allow the Participants to benefit as the price of theshares increases over time, and so provide a long-term incentive forimprovements in the Group’s profitability and success. The shareoptions are tradable; therefore they can be used to purchase theunderlying Novartis share or they can be transferred to a marketmaker. In 2004, the vesting period for the plan was changed from a two-year vesting period to a three-year vesting period for mostcountries. Due to pending new tax legislation in Switzerland, it was
s_186-209_Notes_Groups.qxd 23.1.2007 16:03 Uhr Seite 201

202
N O V A R T I S G R O U P F I N A N C I A L R E P O R T
decided not to implement the three-year vesting period in Switzer-land. The current view is that the new law will not come into forcebefore 2008, at the earliest, at which point the vesting period mightbe reviewed.
The following table shows the assumptions on which the valua-tion of share options granted during the period was based:
Novartis Equity Plan Novartis Equity Plan“Select” outside “Select” outside
North America North America2006 2005
Valuation date February 6, 2006 February 4, 2005
Expiration date February 5, 2016 February 3, 2015
Closing share price on grant date CHF 71.30 CHF 57.45
Exercise price CHF 71.30 CHF 57.45
Volatility 16% 16%
Expected dividend yield 2.05% 1.8%
Interest rate 2.5% 2.4%
Market value of option at grant date CHF 13.91 CHF 11.07
The expense recorded in the 2006 income statement amounted toUSD 111 million (2005: USD 95 million).
The weighted average prices in the table below are translatedfrom Swiss Francs into USD at historical rates for the granted, sold,and forfeited figures. The year-end prices are translated using thecorresponding year-end rates.
2006 2005
Weighted Weightedaverage average
Options exercise price Options exercise price(millions) USD (millions) USD
Options outstanding at January 1 16.5 43.6 18.6 48.1
Granted 4.5 54.0 7.1 47.8
Sold -3.5 41.6 -8.6 35.9
Forfeited -0.4 50.1 -0.6 46.8
Outstanding at December 31 17.1 46.6 16.5 43.6
Exercisable at December 31 6.1 40.2 5.4 36.4
Weighted average fair value of options granted during the year (USD) 9.7 14
All options were granted at an exercise price which, since 2004, wasequal to the market price of the Group’s shares at the grant date and between 2000 and 2003 was greater than the market price ofthe Group’s shares at the grant date. The weighted average exerciseprice during the period the options were sold in 2006 was USD 41.6,which led to the realization of a total intrinsic value of approximate-ly USD 45.9 million. The weighted average remaining contractualterm for options outstanding at the year end was 7.3 years and 5.3years for options exercisable. Options outstanding had an aggregateintrinsic value of USD 138 million and USD 69 million for optionsexercisable.
The following table summarizes information about share optionsoutstanding at December 31, 2006:
Options outstanding Options exercisable
Average Weighted WeightedNumber remaining average Number average
Range of outstanding contractual exercise exercisable exerciseexercice prices (USD) (millions) life (years) price (USD) (millions) price (USD)
30–34 2.1 4.8 34.5 2.0 34.6
35–39 1.2 3.8 36.7 1.2 36.7
40–44 0.4 3.2 42.7 0.4 42.7
45–49 9.1 7.7 47.3 2.5 46.1
50–54 4.3 9.0 54.0
Total 17.1 7.3 46.6 6.1 40.2
B) Novartis Equity Plan “Select” for North America The plan provides for equity awards to North America-based Direc-tors (through 2002), executives and other selected associates, thusreplacing the US Management ADS Appreciation Rights plan. Theterms and conditions of the Novartis Equity Plan “Select” for NorthAmerica are substantially equivalent to the Novartis Equity Plan“Select” outside North America. As of 2004, ADS options grantedunder the plan are tradable, therefore they can be used to pur-chase the underlying Novartis share or they can be transferred toa market maker.
The following table shows the assumptions on which the valua-tion of share options granted during the period was based:
Novartis Equity Plan Novartis Equity Plan“Select” for “Select” for
North America North America2006 2005
Valuation date February 6, 2006 February 4, 2005
Expiration date February 5, 2016 February 3, 2015
Closing ADS price on grant date USD 54.70 USD 47.84
Exercise price USD 54.70 USD 47.84
Volatility 15% 15%
Expected dividend yield 2.05% 1.8%
Interest rate 5.0% 4.5%
Market value of option at grant date USD 15.67 USD 12.85
27. Share participation plans of associates (continued)
s_186-209_Notes_Groups.qxd 23.1.2007 16:03 Uhr Seite 202
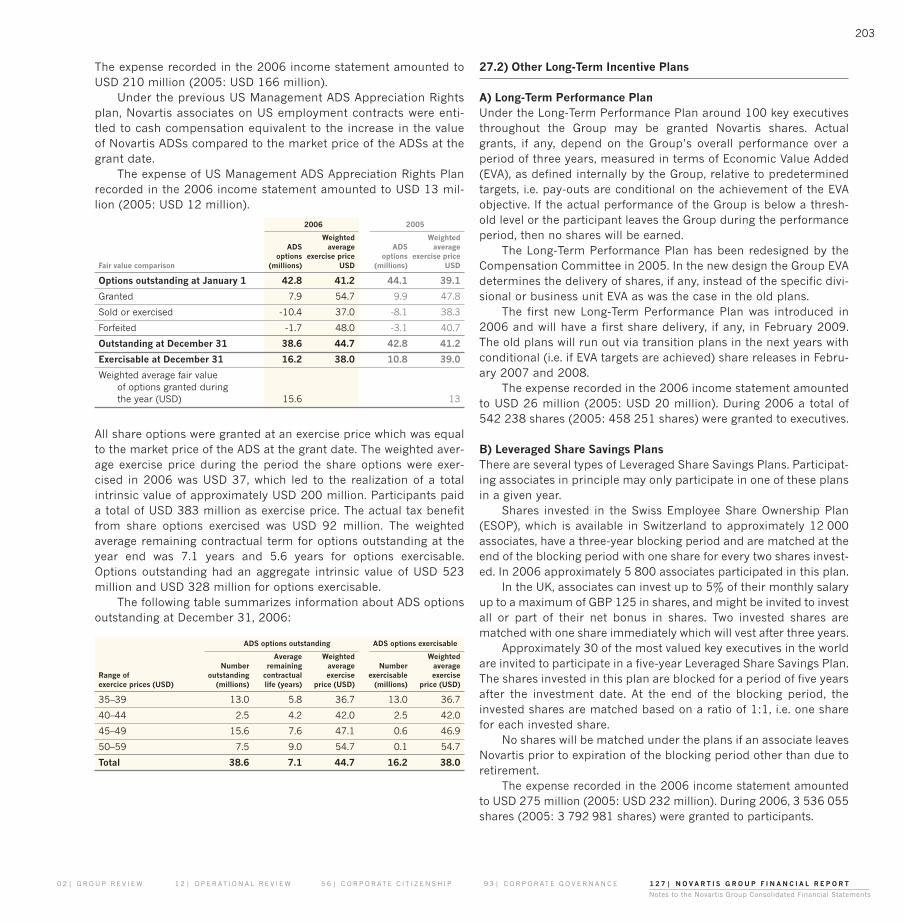
203
0 2 | G R O U P R E V I E W 1 2 | O P E R AT I O N A L R E V I E W 5 6 | C O R P O R AT E C I T I Z E N S H I P 9 3 | C O R P O R AT E G O V E R N A N C E 1 2 7 | N O V A R T I S G R O U P F I N A N C I A L R E P O R T
Notes to the Novartis Group Consolidated Financial Statements
The expense recorded in the 2006 income statement amounted toUSD 210 million (2005: USD 166 million).
Under the previous US Management ADS Appreciation Rightsplan, Novartis associates on US employment contracts were enti-tled to cash compensation equivalent to the increase in the valueof Novartis ADSs compared to the market price of the ADSs at thegrant date.
The expense of US Management ADS Appreciation Rights Planrecorded in the 2006 income statement amounted to USD 13 mil-lion (2005: USD 12 million).
2006 2005
Weighted WeightedADS average ADS average
options exercise price options exercise priceFair value comparison (millions) USD (millions) USD
Options outstanding at January 1 42.8 41.2 44.1 39.1
Granted 7.9 54.7 9.9 47.8
Sold or exercised -10.4 37.0 -8.1 38.3
Forfeited -1.7 48.0 -3.1 40.7
Outstanding at December 31 38.6 44.7 42.8 41.2
Exercisable at December 31 16.2 38.0 10.8 39.0
Weighted average fair value of options granted during the year (USD) 15.6 13
All share options were granted at an exercise price which was equalto the market price of the ADS at the grant date. The weighted aver-age exercise price during the period the share options were exer-cised in 2006 was USD 37, which led to the realization of a totalintrinsic value of approximately USD 200 million. Participants paida total of USD 383 million as exercise price. The actual tax benefitfrom share options exercised was USD 92 million. The weightedaverage remaining contractual term for options outstanding at theyear end was 7.1 years and 5.6 years for options exercisable.Options outstanding had an aggregate intrinsic value of USD 523million and USD 328 million for options exercisable.
The following table summarizes information about ADS optionsoutstanding at December 31, 2006:
ADS options outstanding ADS options exercisable
Average Weighted WeightedNumber remaining average Number average
Range of outstanding contractual exercise exercisable exerciseexercice prices (USD) (millions) life (years) price (USD) (millions) price (USD)
35–39 13.0 5.8 36.7 13.0 36.7
40–44 2.5 4.2 42.0 2.5 42.0
45–49 15.6 7.6 47.1 0.6 46.9
50–59 7.5 9.0 54.7 0.1 54.7
Total 38.6 7.1 44.7 16.2 38.0
27.2) Other Long-Term Incentive Plans
A) Long-Term Performance PlanUnder the Long-Term Performance Plan around 100 key executivesthroughout the Group may be granted Novartis shares. Actualgrants, if any, depend on the Group’s overall performance over aperiod of three years, measured in terms of Economic Value Added(EVA), as defined internally by the Group, relative to predeterminedtargets, i.e. pay-outs are conditional on the achievement of the EVAobjective. If the actual performance of the Group is below a thresh-old level or the participant leaves the Group during the performanceperiod, then no shares will be earned.
The Long-Term Performance Plan has been redesigned by theCompensation Committee in 2005. In the new design the Group EVAdetermines the delivery of shares, if any, instead of the specific divi-sional or business unit EVA as was the case in the old plans.
The first new Long-Term Performance Plan was introduced in2006 and will have a first share delivery, if any, in February 2009.The old plans will run out via transition plans in the next years withconditional (i.e. if EVA targets are achieved) share releases in Febru-ary 2007 and 2008.
The expense recorded in the 2006 income statement amountedto USD 26 million (2005: USD 20 million). During 2006 a total of542 238 shares (2005: 458 251 shares) were granted to executives.
B) Leveraged Share Savings PlansThere are several types of Leveraged Share Savings Plans. Participat-ing associates in principle may only participate in one of these plansin a given year.
Shares invested in the Swiss Employee Share Ownership Plan(ESOP), which is available in Switzerland to approximately 12 000associates, have a three-year blocking period and are matched at theend of the blocking period with one share for every two shares invest-ed. In 2006 approximately 5 800 associates participated in this plan.
In the UK, associates can invest up to 5% of their monthly salaryup to a maximum of GBP 125 in shares, and might be invited to investall or part of their net bonus in shares. Two invested shares arematched with one share immediately which will vest after three years.
Approximately 30 of the most valued key executives in the worldare invited to participate in a five-year Leveraged Share Savings Plan.The shares invested in this plan are blocked for a period of five yearsafter the investment date. At the end of the blocking period, theinvested shares are matched based on a ratio of 1:1, i.e. one sharefor each invested share.
No shares will be matched under the plans if an associate leavesNovartis prior to expiration of the blocking period other than due toretirement.
The expense recorded in the 2006 income statement amountedto USD 275 million (2005: USD 232 million). During 2006, 3 536 055shares (2005: 3 792 981 shares) were granted to participants.
s_186-209_Notes_Groups.qxd 23.1.2007 16:03 Uhr Seite 203

204
N O V A R T I S G R O U P F I N A N C I A L R E P O R T
C) Special Share AwardsIn addition to the components of compensation described above,selected associates across the Group may receive special awards ofrestricted or unrestricted shares. These special awards are fully dis-cretionary. They provide the flexibility to reward particular achieve-ments or exceptional performance of individual associates and toretain key contributors. The restricted share awards generally havea five-year vesting period. If a participant voluntarily leaves Novartis,unvested shares generally forfeit. Around 70 executives at differentlevels of our organization were awarded restricted shares in 2006.The expense recorded in the 2006 income statement amounted toUSD 18 million (2005: USD 7 million). During 2006 a total of830 856 shares (2005: 792 369 shares) were granted to executivesand selected associates.
The table below provides a roll forward of non-vested sharesunder all plans mentioned above:
Number Numberof shares of shares Fair value in Fair value in
in millions in millions USD millions USD millions2006 2005 2006 2005
Non-vested shares at January 1 12.6 7.4 626.6 324.5
Granted 8.2 8.6 466.1 424.1
Vested -5.9 -3.0 -289.1 -104.4
Forfeited -0.6 -0.4 -30.8 -17.6
Non-vested shares at December 31 14.3 12.6 772.8 626.6
27.3) Idenix Pharmaceuticals Inc.
Idenix Pharmaceuticals Inc. (Idenix), a majority owned subsidiary,recognizes compensation expense for share options granted to non-employees. In May 1998, it adopted the 1998 Equity Incentive Plan,as amended (“1998 Plan”), which provides for the grant of incentiveshare options, nonqualified share options, share awards and shareappreciation rights. It initially reserved 1 468 966 shares of com-mon stock for issuance pursuant to the 1998 Plan. It subsequentlyamended the 1998 Plan and reserved an additional 3 600 000shares of common stock for issuance under the 1998 Plan. In June2005, it approved the 2005 Share Incentive Plan (“2005 Plan”). The2005 Plan allows for the granting of incentive share options, non-qualified share options, share appreciation rights, performanceshare awards and restricted share awards (“Awards”). The 2005Plan provides for the authorization of awards covering an aggregateof 3 000 000 shares of common stock. As of September 30, 2006,the last date when information is available to Novartis, Idenix had964 513 shares available for grant under its equity incentive plans.
The following table shows the Idenix share-based compensationexpense:
Nine months ended Year endedSeptember 30, 2006 December 31, 2005
USD millions USD millions
Total share-based compensation expense 7 6
Idenix has an aggregate of USD 19 748 000 of share-based compen-sation as of September 30, 2006 remaining to be amortized over aweighted average life of 2.5 years.
The assumptions used for the Black-Scholes method are as follows:
Nine months ended Year endedSeptember 30, 2006 December 31, 2005
Expected dividend yield 0% 0%
Risk-free interest rate 4.81% 3.94%
Expected option term (in years) 5.0 5.0
Expected volatility 63% 83%
No dividend yield was assumed as Idenix does not pay dividends onits common stock. The risk-free interest rate is based on the yield ofUS Treasury securities consistent with the expected life of the option.The expected option term and expected volatility were determinedby examining the expected option term and expected volatility of theIdenix shares as well as the expected terms and expected volatilitiesof similarly sized biotechnology companies. During 2006 and 2005,respectively, Idenix recorded no tax benefit associated with the exer-cise of employee share options.
Information regarding outstanding share options for the ninemonths ended September 30, 2006 and year ended December 31,2005 is as follows:
Nine months ended Year endedSeptember 30, 2006 December 31, 2005
Weighted Weightedaverage average
Options exercise price Options exercise price(millions) USD (millions) USD
Options outstanding at January 1 3.6 12.2 3.2 7.5
Granted 1.1 15.4 1.2 20.3
Exercised -0.2 3.5 -0.6 3.4
Forfeited -0.2 17.4 -0.2 10.7
Outstanding at September 30, 2006 or December 31, 2005 4.3 13.3 3.6 12.2
Exercisable at September 30, 2006 or December 31, 2005 2.3 10.7 1.8 8.3
27. Share participation plans of associates (continued)
s_186-209_Notes_Groups.qxd 23.1.2007 16:03 Uhr Seite 204

205
0 2 | G R O U P R E V I E W 1 2 | O P E R AT I O N A L R E V I E W 5 6 | C O R P O R AT E C I T I Z E N S H I P 9 3 | C O R P O R AT E G O V E R N A N C E 1 2 7 | N O V A R T I S G R O U P F I N A N C I A L R E P O R T
Notes to the Novartis Group Consolidated Financial Statements
28.1) Roche/GenentechNovartis has two agreements with Genentech, Inc., USA, a subsidiaryof Roche Holdings AG (Roche) which is indirectly included in the con-solidated financial statements using equity accounting as Novartisholds 33.3% of the outstanding voting shares of Roche.
Novartis Ophthalmics, part of the Novartis PharmaceuticalsDivision, has licensed the exclusive rights to develop and marketLucentis outside the US for indications related to diseases of the eye.As part of this agreement, Novartis paid an initial milestone and R&Dreimbursement fee of approximately USD 47 million and the partieswill share the cost of Genentech’s ongoing Phase III and other relat-ed development expenses of this product. Novartis may pay addition-al payments for the achievement of certain clinical development andproduct approval milestone payments and will pay royalties on thenet sales of Lucentis products outside the US. Since Lucentis has onlybeen launched in some countries during 2006, sales of only USD 19million have been recognized by Novartis.
In February 2004, Novartis Pharma AG, Genentech, Inc., andTanox, Inc., finalized a three-party collaboration to govern thedevelopment and commercialization of certain anti-IgE antibodiesincluding Xolair and TNX-901. Under this agreement, all three par-ties have co-developed Xolair in the US, and Novartis and Genen-tech are co-promoting Xolair in the US and both are making certainjoint and individual payments to Tanox. Novartis and Tanox havethe non-US commercialization rights. Genentech records all salesand related costs in the US. Novartis markets the product andrecords all sales and related costs in Europe as well as co-promo-tion costs in the US. Genentech and Novartis share the resulting USand European operating profits, respectively, according to agreedprofit-sharing percentages.
The net fund inflow out of the two agreements described aboveamounted to USD 116 million in 2006 (2005: USD 80 million).Xolair was launched in Europe in late 2005 and Novartis recognizedtotal sales related to this product of USD 102 million in 2006(including sales to Genentech for the US market).
28.2) Other Related Parties (except for Executives and Directors) The Group has formed approximately 25 foundations, principally forcharitable purposes, which have not been consolidated as the Groupdoes not receive a benefit therefrom. The main charitable founda-tion fosters healthcare and social development in rural countries.Each of these foundations is autonomous and its board is responsi-ble for its respective administration in accordance with the founda-tion’s purpose and applicable law.
In 2006, the Group received short-term loans totaling USD 20million (2005: USD 14 million) from the foundations.
As of December 31, 2006 these foundations held approximate-ly 6 million shares of Novartis, with a cost of approximately USD 32 million.
28. Related parties
Idenix granted 1 187 692 and 1 090 125 share options for the ninemonths ended September 30, 2006 and the year ended Decem-ber 31, 2005, respectively. The weighted average fair value ofoptions granted during the nine months ended September 30, 2006and the year ended December 31, 2005 was USD 8.89 and USD14.01, respectively. The weighted average remaining contractual
term for options outstanding at September 30, 2006 was 7.7 yearsand 6.8 years for options exercisable. The total intrinsic value ofoptions exercised during the nine months ended September 30,2006 was USD 1 542 000. The intrinsic value was calculated as thedifference between the market value as of September 30, 2006 andthe weighted average exercise price of the shares.
s_186-209_Notes_Groups.qxd 23.1.2007 16:03 Uhr Seite 205

206
N O V A R T I S G R O U P F I N A N C I A L R E P O R T
Leasing commitments
2006USD millions
Commitments arising from fixed-term operational leases in effect at December 31 are as follows:2007 309
2008 222
2009 148
2010 96
2011 87
Thereafter 331
Total 1 193
Expense of current year 339
Research & Development commitments The Group has entered into long-term research agreements withvarious institutions including potential milestone payments whichmay be capitalized. As of December 31, 2006 they are as follows:
PotentialUnconditional milestonecommitments payments Total
2006 2006 2006USD millions USD millions USD millions
2007 33 199 232
2008 17 321 338
2009 10 544 554
2010 9 277 286
2011 8 354 362
Thereafter 1 090 1 090
Total 77 2 785 2 862
Other commitments The Novartis Group entered into various purchase commitments for services and materials as well as for equipment as part of theordinary business. These commitments are not in excess of currentmarket prices in all material respects and reflect normal businessoperations.
29. Commitments and contingencies
28.3) Executive and Director CompensationIn 2006, there were 19 (2005: 20) Executive Committee members, Permanent Attendees to the Executive Committee and Business UnitHeads (“Executives”), including those who retired or terminated their employment in 2005.
The total compensation for the Executives and the 11 (2005: 11) non-Executive Directors using IFRS 2 rules for accounting for share-based compensation was as follows:
Executives Non-Executive Directors Total
2006 2005 2006 2005 2006 2005USD millions USD millions USD millions USD millions USD millions USD millions
Short-term benefits of associates 16.3 15.5 5.2 4.7 21.5 20.2
Post-employment benefits 2.1 1.7 2.1 1.7
Termination benefits 1.8 0.3 1.8 0.3
Share-based compensation1 80.2 64.8 80.2 64.8
Total 100.4 82.3 5.2 4.7 105.6 87.0
1If the transitional rules of IFRS 2 of only using grants after November 7, 2002 had not been used the fair value of share-based compensation in 2006 would have been USD 82.0 million (2005: USD 67.8 million)
The annual incentive award, which includes share-based compensation, is granted in February in the year following the reporting period.At that time it is partly at the Executive’s discretion to choose the portion to be received in cash or as share-based compensation. There-fore the split between cash and share-based compensation is estimated.
28. Related parties (continued)
s_186-209_Notes_Groups.qxd 23.1.2007 16:03 Uhr Seite 206
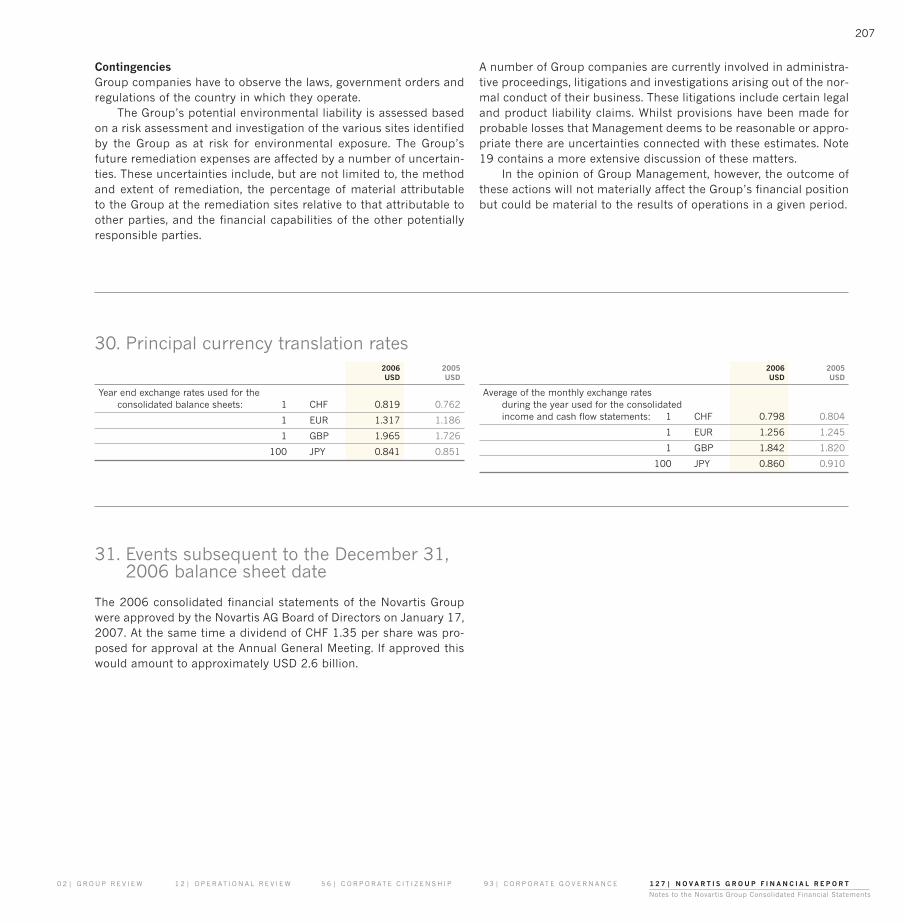
207
0 2 | G R O U P R E V I E W 1 2 | O P E R AT I O N A L R E V I E W 5 6 | C O R P O R AT E C I T I Z E N S H I P 9 3 | C O R P O R AT E G O V E R N A N C E 1 2 7 | N O V A R T I S G R O U P F I N A N C I A L R E P O R T
Notes to the Novartis Group Consolidated Financial Statements
2006 2005USD USD
Year end exchange rates used for the consolidated balance sheets: 1 CHF 0.819 0.762
1 EUR 1.317 1.186
1 GBP 1.965 1.726
100 JPY 0.841 0.851
30. Principal currency translation rates
The 2006 consolidated financial statements of the Novartis Groupwere approved by the Novartis AG Board of Directors on January 17,2007. At the same time a dividend of CHF 1.35 per share was pro-posed for approval at the Annual General Meeting. If approved thiswould amount to approximately USD 2.6 billion.
31. Events subsequent to the December 31,2006 balance sheet date
2006 2005USD USD
Average of the monthly exchange rates during the year used for the consolidated income and cash flow statements: 1 CHF 0.798 0.804
1 EUR 1.256 1.245
1 GBP 1.842 1.820
100 JPY 0.860 0.910
ContingenciesGroup companies have to observe the laws, government orders andregulations of the country in which they operate.
The Group’s potential environmental liability is assessed basedon a risk assessment and investigation of the various sites identifiedby the Group as at risk for environmental exposure. The Group’sfuture remediation expenses are affected by a number of uncertain-ties. These uncertainties include, but are not limited to, the methodand extent of remediation, the percentage of material attributable to the Group at the remediation sites relative to that attributable to other parties, and the financial capabilities of the other potentiallyresponsible parties.
A number of Group companies are currently involved in administra-tive proceedings, litigations and investigations arising out of the nor-mal conduct of their business. These litigations include certain legaland product liability claims. Whilst provisions have been made forprobable losses that Management deems to be reasonable or appro-priate there are uncertainties connected with these estimates. Note19 contains a more extensive discussion of these matters.
In the opinion of Group Management, however, the outcome ofthese actions will not materially affect the Group’s financial positionbut could be material to the results of operations in a given period.
s_186-209_Notes_Groups.qxd 23.1.2007 16:03 Uhr Seite 207

208
N O V A R T I S G R O U P F I N A N C I A L R E P O R T
Share/paid-in Equitycapital1 interest % Activities
ArgentinaNovartis Argentina S.A., Buenos Aires ARS 36.4 m 100 ◆
Sandoz S.A., Buenos Aires ARS 11.8 m 100 ◆▼
AustraliaNovartis Australia Pty Ltd., North Ryde, NSW AUD 11.0 m 100 ■
Novartis Pharmaceuticals Australia Pty Ltd., North Ryde, NSW AUD 3.8 m 100 ◆ ▲
Sandoz Pty Ltd., North Ryde, NSW AUD 11.6 m 100 ◆
Novartis Consumer Health Australasia Pty Ltd., Mulgrave, Victoria AUD 7.6 m 100 ◆▼
Novartis Animal Health Australasia Pty Ltd.,North Ryde, NSW AUD 3.0 m 100 ◆ ▲
AustriaNovartis Pharma GmbH, Vienna EUR 1.1 m 100 ◆
Sandoz GmbH, Kundl EUR 32.7 m 100 ■ ◆▼▲
Novartis Animal Health GmbH, Kundl EUR 37 000 100 ◆
BangladeshNovartis (Bangladesh) Limited, Dhaka BDT 162.5 m 60 ◆▼
BelgiumN.V. Novartis Management Services S.A., Vilvoorde EUR 7.5 m 100 ■
N.V. Novartis Pharma S.A., Vilvoorde EUR 7.1 m 100 ◆
N.V. Sandoz S.A., Vilvoorde EUR 4.2 m 100 ◆
N.V. Novartis Consumer Health S.A., Vilvoorde EUR 4.3 m 100 ◆
N.V. CIBA Vision Benelux S.A., Mechelen EUR 62 000 100 ◆
BermudaTriangle International Reinsurance Ltd., Hamilton CHF 1.0 m 100 ■
Novartis Securities Investment Ltd., Hamilton CHF 30 000 100 ■
Novartis International Pharmaceutical Ltd., Hamilton CHF 10.0 m 100 ■ ◆▼▲
BrazilNovartis Biociências S.A., São Paulo BRL 255.8 m 100 ◆▼
Sandoz do Brasil Indústria Farmacêutica Ltda., Cambé BRL 139.5 m 100 ◆▼▲
Novartis Saúde Animal Ltda., São Paulo BRL 50.7 m 100 ◆▼
CanadaNovartis Pharmaceuticals Canada Inc., Dorval/Montreal CAD 02 100 ◆ ▲
Sandoz Canada Inc., Boucherville, Quebec CAD 76.8 m 100 ◆▼▲
Novartis Consumer Health Canada Inc., Mississauga, Ontario CAD 2 100 ◆
CIBA Vision Canada Inc., Mississauga, Ontario CAD 1 100 ◆▼
Novartis Animal Health Canada Inc., Ontario CAD 2 100 ◆ ▲
ChileNovartis Chile S.A., Santiago de Chile CLP 2.0 bn 100 ◆
ChinaBeijing Novartis Pharma Co., Ltd., Beijing CNY 111.3 m 100 ◆▼
Novartis Pharmaceuticals (HK) Limited, Hong Kong HKD 200 100 ◆
Shanghai Novartis Trading Ltd., Shanghai CNY 20.3 m 100 ◆
ColombiaNovartis de Colombia S.A., Santafé de Bogotá COP 20.9 bn 100 ◆▼
CroatiaLek Zagreb d.o.o., Zagreb HRK 25.6 m 100 ◆
Czech RepublicNovartis s.r.o., Prague CZK 51.5 m 100 ◆
Sandoz s.r.o., Prague CZK 44.7 m 100 ◆
DenmarkNovartis Healthcare A/S, Copenhagen DKK 12.0 m 100 ◆
Sandoz A/S, Odense DKK 8.0 m 100 ◆
EcuadorNovartis Ecuador S.A., Quito USD 4.0 m 100 ◆
EgyptNovartis Pharma S.A.E., Cairo EGP 33.8 m 99 ▼
Novartis Egypt (Healthcare) S.A.E., Cairo EGP 250 000 95 ◆
FinlandNovartis Finland Oy, Espoo EUR 459 000 100 ◆
Share/paid-in Equitycapital1 interest % Activities
FranceNovartis Groupe France S.A., Rueil-Malmaison EUR 103.0 m 100 ■
Novartis Pharma S.A.S., Rueil-Malmaison EUR 43.4 m 100 ◆▼▲
Sandoz S.A.S., Levallois-Perret EUR 2.6 m 100 ◆
Novartis Santé Familiale S.A.S., Rueil-Malmaison EUR 21.9 m 100 ◆▼
Novartis Santé Animale S.A.S., Rueil-Malmaison EUR 900 000 100 ◆▼
Novartis Nutrition S.A.S., Revel EUR 300 000 100 ◆▼
CIBA Vision S.A.S., Blagnac EUR 1.8 m 100 ◆
GermanyNovartis Deutschland GmbH, Wehr EUR 155.5 m 100 ■
Novartis Pharma GmbH, Nuremberg EUR 25.6 m 100 ◆ ▲
Novartis Pharma Produktions GmbH, Wehr EUR 2.0 m 100 ▼
Sandoz International GmbH, Holzkirchen EUR 100 000 100 ■
Sandoz Pharmaceuticals GmbH, Ismaning EUR 5.1 m 100 ◆▼
Sandoz Industrial Products GmbH, Frankfurt a. M. EUR 2.6 m 100 ◆▼
Hexal Aktiengesellschaft, Holzkirchen EUR 93.7 m 100 ■ ◆▼
Salutas Pharma GmbH, Barleben EUR 42.0m 100 ◆▼
1 A Pharma GmbH, Oberhaching EUR 26 000 100 ◆
Novartis Consumer Health GmbH, Munich EUR 14.6 m 100 ◆▼▲
Novartis Nutrition GmbH, Munich EUR 23.5 m 100 ◆▼▲
CIBA Vision Vertriebs GmbH, Grossostheim EUR 2.6 m 100 ◆
CIBA Vision GmbH, Grosswallstadt EUR 15.4 m 100 ◆▼▲
GibraltarNovista Insurance Limited, Gibraltar CHF 130.0 m 100 ■
Great BritainNovartis UK Limited, Frimley/Camberley GBP 25.5 m 100 ■
Novartis Pharmaceuticals UK Limited, Frimley/Camberley GBP 5.4 m 100 ◆▼▲
Novartis Grimsby Limited, Frimley/Camberley GBP 230 m 100 ▼
Sandoz Limited, Bordon GBP 2.0 m 100 ◆
Novartis Consumer Health UK Limited, Horsham GBP 25 000 100 ◆▼
Novartis Animal Health UK Limited, Royston GBP 100 000 100 ◆ ▲
Vericore Limited, Royston GBP 2 100 ◆▼
CIBA Vision (UK) Limited, Southampton GBP 550 000 100 ◆
GreeceNovartis (Hellas) S.A.C.I., Athens EUR 14.6 m 100 ◆
HungaryNovartis Hungary Healthcare Limited Liability
Company, Budapest HUF 545.6 m 100 ◆
Sandoz Hungary Limited Liability Company, Budapest HUF 3.0 m 100 ◆
IndiaNovartis India Limited, Mumbai INR 159.8 m 51 ◆▼
Sandoz Private Limited, Mumbai INR 32.0 m 100 ◆▼
IndonesiaPT Novartis Indonesia, Jakarta IDR 7.7 bn 100 ◆▼
PT CIBA Vision Batam, Batam IDR 11.9 bn 100 ▼
IrelandNovartis Ireland Limited, Dublin EUR 25 000 100 ◆
Novartis Ringaskiddy Limited, Ringaskiddy, County Cork EUR 2.0 m 100 ▼
ItalyNovartis Farma S.p.A., Origgio EUR 18.2 m 100 ■ ◆▼▲
Sandoz S.p.A., Origgio EUR 390 000 100 ◆
Sandoz Industrial Products S.p.A., Rovereto EUR 2.6 m 100 ▼
Novartis Consumer Health S.p.A., Origgio EUR 2.9 m 100 ◆
CIBA Vision S.r.l., Marcon EUR 2.4 m 100 ◆
JapanNovartis Holding Japan K.K., Tokyo JPY 10.0 m 100 ■
Novartis Pharma K.K., Tokyo JPY 6.0 bn 100 ◆ ▲
Ciba-Geigy Japan Limited, Tokyo JPY 3.8 bn 100 ▼
Sandoz K.K., Tokyo JPY 100.05 m 100 ◆▼▲
CIBA Vision K.K., Tokyo JPY 495.0 m 100 ◆
Novartis Nutrition K.K., Tokyo JPY 100.0 m 100 ◆ ▲
LiechtensteinNovista Insurance Aktiengesellschaft, Vaduz CHF 5.0 m 100 ■
Luxembourg Novartis Investments S.à r.l., Luxembourg USD 2.6 bn 100 ■
32. Principal Group subsidiaries and associated companies As at December 31, 2006
s_186-209_Notes_Groups.qxd 23.1.2007 16:03 Uhr Seite 208

209
0 2 | G R O U P R E V I E W 1 2 | O P E R AT I O N A L R E V I E W 5 6 | C O R P O R AT E C I T I Z E N S H I P 9 3 | C O R P O R AT E G O V E R N A N C E 1 2 7 | N O V A R T I S G R O U P F I N A N C I A L R E P O R T
Principal Group Companies
MalaysiaNovartis Corporation (Malaysia) Sdn. Bhd., Kuala Lumpur MYR 3.3 m 70 ◆
MexicoNovartis Farmacéutica, S.A. de C.V., Mexico City MXN 205.0 m 100 ◆▼
Productos Gerber, S.A. de C.V., Querétaro MXN 12.5 m 100 ◆▼
NetherlandsNovartis Netherlands B.V., Arnhem EUR 1.4 m 100 ■
Novartis Pharma B.V., Arnhem EUR 4.5 m 100 ◆
Sandoz B.V., Almere EUR 907 570 100 ◆▼
Novartis Consumer Health B.V., Breda EUR 23 830 100 ◆▼
Netherlands AntillesSandoz N.V., Curação USD 6 000 100 ■ ◆
New ZealandNovartis New Zealand Ltd., Auckland NZD 820 000 100 ◆
NorwayNovartis Norge AS, Oslo NOK 1.5 m 100 ◆
PakistanNovartis Pharma (Pakistan) Limited, Karachi PKR 24.8 m 98 ◆▼
PanamaNovartis Pharma (Logistics), Inc., Panama USD 10 000 100 ◆
PhilippinesNovartis Healthcare Philippines, Inc., Makati/Manila PHP 298.8 m 100 ◆
PolandNovartis Poland Sp. z o.o., Warsaw PLN 44.2 m 100 ◆
Lek S.A., Strykow PLN 2.6 m 100 ◆▼
Alima-Gerber S.A., Warsaw PLN 57.1 m 100 ◆▼
PortugalNovartis Portugal SGPS Lda., Sintra EUR 500 000 100 ■
Novartis Farma – Produtos Farmacêuticos S.A., Sintra EUR 2.4 m 100 ◆
Novartis Consumer Health – Produtos Farmacêuticos e Nutrição Lda., Lisbon EUR 100 000 100 ◆
Puerto RicoEx-Lax, Inc., Humacao USD 10 000 100 ▼
Gerber Products Company of Puerto Rico, Inc., Carolina USD 100 000 100 ◆▼
CIBA Vision Puerto Rico, Inc., Cidra USD 1 000 100 ▼
RomaniaSandoz S.R.L., Targu-Mures RON 19.3 m 100 ◆▼
Russian Federation Novartis Pharma ZAO, Moscow RUR 17.5 m 100 ◆
ZAO Lek, Moscow RUR 57.4 m 100 ◆
SingaporeNovartis Institute for Tropical Diseases Pte Ltd., Singapore SGD 2 004 100 ▲
Ciba Vision Asian Manufacturing and Logistics Pte Ltd, Singapore SGD 1.04 m 100 ▼
SloveniaLek Pharmaceuticals d.d., Ljubljana SIT 11.6 bn 100 ■ ◆▼▲
South AfricaNovartis South Africa (Pty) Ltd., Spartan/Johannesburg ZAR 86.4 m 100 ◆▼
Sandoz South Africa (Pty) Ltd, Kempton Park ZAR 3.0 m 100 ◆▼
South KoreaNovartis Korea Ltd., Seoul KRW 24.5 bn 99 ◆
SpainNovartis Farmacéutica, S.A., Barcelona EUR 63.0 m 100 ■ ◆▼
Sandoz Farmacéutica, S.A., Barcelona EUR 270 450 100 ◆
Sandoz Industrial Products, S.A., Les Franqueses del Vallés/Barcelona EUR 9.3 m 100 ◆▼▲
Novartis Consumer Health, S.A., Barcelona EUR 876 919 100 ◆
CIBA Vision, S.A., Barcelona EUR 1.4 m 100 ◆
SwedenNovartis Sverige Participations AB, Täby/Stockholm SEK 1.0 m 100 ■
Novartis Sverige AB, Täby/Stockholm SEK 5.0 m 100 ◆
CIBA Vision Nordic AB, Askim/Göteborg SEK 2.5 m 100 ◆
SwitzerlandNovartis International AG, Basel CHF 10.0 m 100 ■
Novartis Holding AG, Basel CHF 100.2 m 100 ■
Novartis Research Foundation, Basel CHF 29.3 m 100 ▲
Novartis Foundation for Management Development, Basel CHF 100 000 100 ■
Novartis Foundation for Employee Participation, Basel CHF 100 000 100 ■
Roche Holding AG, Basel CHF 160.0 m 33 ■ ◆▼▲
Novartis Pharma AG, Basel CHF 350.0 m 100 ■ ◆▼▲
Novartis Pharma Services AG, Basel CHF 20.0 m 100 ◆
Novartis Pharma Schweizerhalle AG, Schweizerhalle CHF 18.9 m 100 ▼
Novartis Pharma Stein AG, Stein CHF 251 000 100 ▼▲
Novartis Pharma Schweiz AG, Bern CHF 5.0 m 100 ◆
Sandoz AG, Basel CHF 5.0 m 100 ◆ ▲
Sandoz Pharmaceuticals AG, Steinhausen CHF 100 000 100 ◆
Novartis Consumer Health S.A., Nyon CHF 30.0 m 100 ■ ◆▼▲
Novartis Consumer Health Schweiz AG, Bern CHF 250 000 100 ◆
Novartis Animal Health AG, Basel CHF 101 000 100 ■ ◆▼▲
Novartis Centre de Recherche Santé Animale S.A., St. Aubin CHF 250 000 100 ▲
CIBA Vision AG, Embrach CHF 300 000 100 ■ ◆
TaiwanNovartis (Taiwan) Co., Ltd., Taipei TWD 170.0 m 100 ◆▼
ThailandNovartis (Thailand) Limited, Bangkok THB 230.0 m 100 ◆
TurkeyNovartis Saglik, Gida ve Tarim Ürünleri Sanayi ve
Ticaret A.S., Istanbul TRY 98.0 m 100 ◆▼
Sandoz Ilaç Sanayi ve Ticaret A.S., Gebze-Kocaeli TRY 31.7 m 100 ◆▼
USANovartis Corporation, Florham Park, NJ USD 72.2 m 100 ■
Novartis Finance Corporation, New York, NY USD 1.7 bn 100 ■
Novartis Pharmaceuticals Corporation, East Hanover, NJ USD 5.2 m 100 ◆▼▲
Novartis Institutes for BioMedical Research, Inc., Cambridge, MA USD 1 100 ▲
Novartis Institute for Functional Genomics, Inc., San Diego, CA USD 1 000 100 ▲
Novartis Vaccines and Diagnostics, Inc., Emeryville, CA USD 3 100 ■ ◆▼▲
Idenix Pharmaceuticals, Inc., Cambridge, MA USD 56 023 56 ▲
Sandoz Inc., Princeton, NJ USD 25 000 100 ◆▼▲
Lek Pharmaceuticals, Inc., Wilson, NC USD 200 000 100 ◆
Eon Labs, Inc., Lake Success, NY USD 1 100 ◆▼
Novartis Consumer Health, Inc., Parsippany, NJ USD 02 100 ◆▼▲
Novartis Animal Health US, Inc., Greensboro, NC USD 100 100 ◆▼▲
Novartis Nutrition Corporation, Minneapolis, MN USD 50 000 100 ◆▼▲
Gerber Products Company, Fremont, MI USD 10 100 ■ ◆▼▲
Gerber Life Insurance Company, White Plains, NY USD 148.5 m 100 ◆
CIBA Vision Corporation, Duluth, GA USD 301.3 m 100 ■ ◆▼▲
VenezuelaNovartis de Venezuela, S.A., Caracas VEB 1.4 bn 100 ◆
Novartis Nutrition de Venezuela, S.A., Caracas VEB 877.8 m 100 ◆▼
In addition, the Group is represented by subsidiaries, associated companies or joint ventures in the following countries: Algeria, Cayman Islands, Costa Rica, Dominican Republic,Guatemala, the former Yugoslav Republic of Macedonia, Morocco, Peru and Uruguay.
Share/paid-in Equitycapital1 interest % Activities
Share/paid-in Equitycapital1 interest % Activities
The following describe the various types of entities within the Group:■ Holding/Finance: This entity is a holding company and/or performs finance functions
for the Group.◆ Sales: This entity performs sales and marketing activities for the Group.▼ Production: This entity performs manufacturing and/or production activities for the Group.▲ Research: This entity performs research and development activities for the Group.
Equity interest % – above 50% and up to 100% of the voting rights – fully consolidated – above 20% and up to 50% of the voting rights – investment in
associated company – equity method accounting
1 Share/paid-in capital may not reflect the taxable share/paid-in capital amount and does notinclude any paid-in surplus.
2 shares without par value m = million; bn = billion
s_186-209_Notes_Groups.qxd 23.1.2007 16:03 Uhr Seite 209
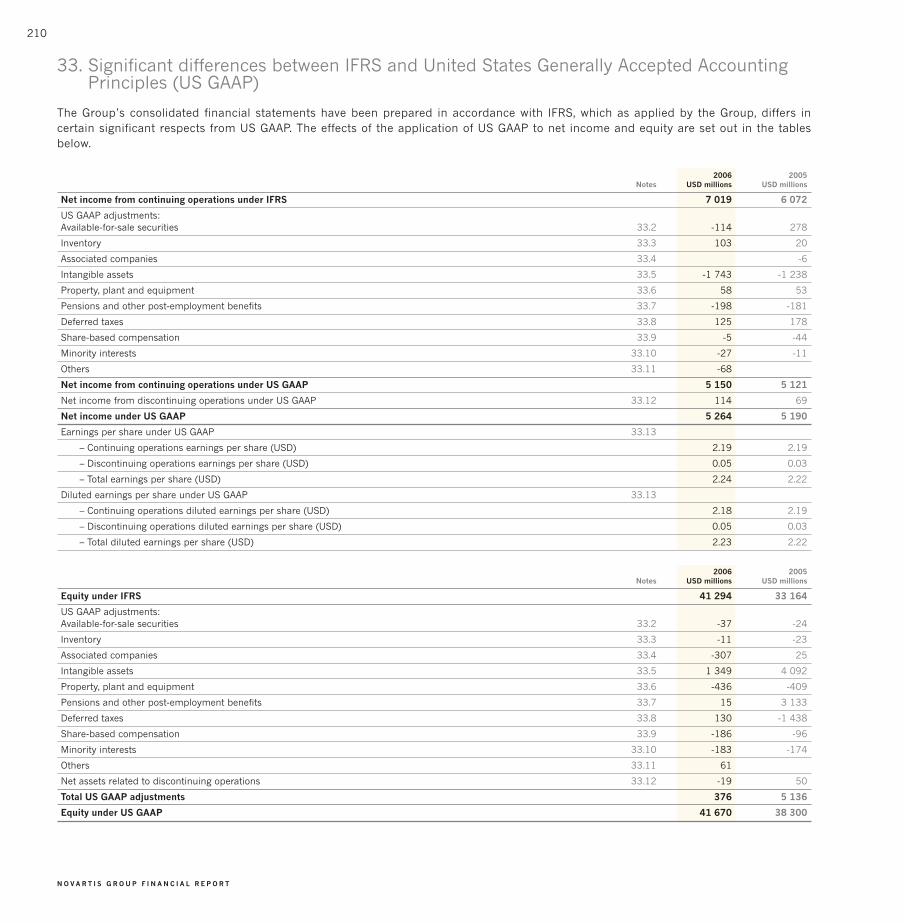
210
N O V A R T I S G R O U P F I N A N C I A L R E P O R T
2006 2005Notes USD millions USD millions
Net income from continuing operations under IFRS 7 019 6 072
US GAAP adjustments:Available-for-sale securities 33.2 -114 278
Inventory 33.3 103 20
Associated companies 33.4 -6
Intangible assets 33.5 -1 743 -1 238
Property, plant and equipment 33.6 58 53
Pensions and other post-employment benefits 33.7 -198 -181
Deferred taxes 33.8 125 178
Share-based compensation 33.9 -5 -44
Minority interests 33.10 -27 -11
Others 33.11 -68
Net income from continuing operations under US GAAP 5 150 5 121
Net income from discontinuing operations under US GAAP 33.12 114 69
Net income under US GAAP 5 264 5 190
Earnings per share under US GAAP 33.13
– Continuing operations earnings per share (USD) 2.19 2.19
– Discontinuing operations earnings per share (USD) 0.05 0.03
– Total earnings per share (USD) 2.24 2.22
Diluted earnings per share under US GAAP 33.13
– Continuing operations diluted earnings per share (USD) 2.18 2.19
– Discontinuing operations diluted earnings per share (USD) 0.05 0.03
– Total diluted earnings per share (USD) 2.23 2.22
2006 2005Notes USD millions USD millions
Equity under IFRS 41 294 33 164
US GAAP adjustments:Available-for-sale securities 33.2 -37 -24
Inventory 33.3 -11 -23
Associated companies 33.4 -307 25
Intangible assets 33.5 1 349 4 092
Property, plant and equipment 33.6 -436 -409
Pensions and other post-employment benefits 33.7 15 3 133
Deferred taxes 33.8 130 -1 438
Share-based compensation 33.9 -186 -96
Minority interests 33.10 -183 -174
Others 33.11 61
Net assets related to discontinuing operations 33.12 -19 50
Total US GAAP adjustments 376 5 136
Equity under US GAAP 41 670 38 300
33. Significant differences between IFRS and United States Generally Accepted AccountingPrinciples (US GAAP)
The Group’s consolidated financial statements have been prepared in accordance with IFRS, which as applied by the Group, differs in certain significant respects from US GAAP. The effects of the application of US GAAP to net income and equity are set out in the tablesbelow.
s_210-223_US_GAAP.qxd 23.1.2007 16:03 Uhr Seite 210

211
0 2 | G R O U P R E V I E W 1 2 | O P E R AT I O N A L R E V I E W 5 6 | C O R P O R AT E C I T I Z E N S H I P 9 3 | C O R P O R AT E G O V E R N A N C E 1 2 7 | N O V A R T I S G R O U P F I N A N C I A L R E P O R T
Reconciliation to US GAAP
Impact due to adoption of SFAS 158 Employers’ Accounting forDefined Benefit Pension and Other Postretirement Plans. See note 33.7 for further details.
USD millions
US GAAP equity at December 31, 2006 prior to adoption of SFAS 158 44 121
Adoption of SFAS 158 -3 215
Deferred tax on above 764
US GAAP equity after adoption of SFAS 158 at December 31, 2006 41 670
Notes to the US GAAP Reconciliation
33.1) Acquisition accounting differences
33.1.1) Merger between Sandoz and Ciba-Geigy in 1996 The accounting treatment for the 1996 merger of Sandoz AG andCiba-Geigy AG under IFRS was different from the accounting treat-ment under US GAAP. For IFRS purposes the merger was accountedfor under the uniting of interests method, however, for US GAAP themerger did not meet all of the required conditions of AccountingPrinciples Board Opinion No. 16, Business Combinations for a pool-ing of interests and therefore was accounted for as a purchase underUS GAAP. Under US GAAP, Sandoz was deemed to be the acquirerwith the assets and liabilities of Ciba-Geigy being recorded at theirestimated fair values with the results of Ciba-Geigy being includedfrom December 20, 1996. Under US GAAP, the cost of Ciba-Geigy toSandoz was approximately USD 28.5 billion. The entire purchaseprice was allocated to identified property, plant & equipment andintangible assets with a definite useful life. There was no residualgoodwill arising from the accounting for this transaction.
The components of equity and the income statement adjust-ments related to the US GAAP purchase accounting adjustment ofCiba-Geigy for 2006 and 2005 are as follows:
2006 components to reconcile
TranslationNet income effects Equity
USD millions USD millions USD millions
Intangible assets relatedto product rights and trademarks -530 199 2 506
Property, plant & equipment 55 -42 -562
Deferred taxes 119 -39 -493
Total IFRS to US GAAP adjustment1 -356 118 1 451
1The 2005 balances of USD 129 million for the investment in Chiron and a related USD 32 milliondeferred tax asset have been adjusted for as part of the Chiron acquisition. See note 33.1.2
2005 components to reconcile
TranslationNet income effects Equity
USD millions USD millions USD millions
Intangible assets relatedto product rights and trademarks -678 -510 2 837
Property, plant & equipment 55 96 -575
Investments in Chiron -20 129
Deferred taxes 156 109 -604
Total adjustment -467 -325 1 787
33.1.2) Chiron acquisition On April 20, 2006, Novartis acquired the remaining shares of ChironCorporation that it did not already own. Prior to the date of the acqui-sition, the interest in Chiron was accounted for using the equitymethod. Prior to the acquisition, the US GAAP to IFRS differences inthe accounting for the investment in Chiron related to a net USD 310million of goodwill included in the investment in associated compa-nies balance resulting from the Sandoz/Ciba-Geigy acquisition and a USD 113 million deferred tax asset representing the outside taxbasis of the investment. As a result of the acquisition, a balance ofUSD 388 million of the original investment in associated companiesremains as an equity difference associated with goodwill with anadjustment to the revaluation reserves in equity of USD 78 millionrelated to IPR&D capitalized under IFRS. The deferred tax asset hasbeen adjusted through an increase to goodwill of USD 145 millionand a USD 32 million increase in income. As part of the fair valueadjustment to the initial 44% investment in Chiron under IFRS, USD0.4 billion of Chiron’s own goodwill has been eliminated. Under thestep acquisition accounting approach under US GAAP this Chironrelated goodwill is retained.
The acquisition of the remaining interest in Chiron was account-ed for as a step acquisition under SFAS 141, Business Combinations.Under IFRS, the acquired identified assets and liabilities are revaluedto 100% of their fair value and a revaluation reserve on the initialinterest is recorded in equity. Under SFAS 141, only the newlyacquired portion of the identified assets and liabilities are revaluedto their fair value. As a result, under US GAAP only the newly acquiredportion of 56% of the identified assets and liabilities was revalued to its full fair value with the 44% balance remaining at its historicvalue. The effect of these differences between IFRS and US GAAP is a USD 1.0 billion reduction of US GAAP equity. The amortization,depreciation and cost of sales will be adjusted for the lower asset values under US GAAP.
In addition to the revaluation adjustment, the acquisition alsocreated other IFRS to US GAAP differences related to purchaseaccounting, including accounting for fair value adjustments, IPR&Dand other intangible assets, contingent liabilities, as well as certainrestructuring costs.
As part of the purchase price adjustments, an amount of USD499 million was written off under US GAAP associated with variousassets and liabilities.
s_210-223_US_GAAP.qxd 23.1.2007 16:03 Uhr Seite 211

212
N O V A R T I S G R O U P F I N A N C I A L R E P O R T
The following shows the IFRS to US GAAP adjustments for Chiron atDecember 31, 2006:
2006 components to reconcile
Net income EquityUSD millions USD millions
Intangible assets related to:
Goodwill 64 648
Product rights and trademarks 89 -972
In-process research & development -470 -800
Other -58 -192
Property, plant & equipment -8 -51
Inventories 91
Liabilities -68 61
Deferred taxes -43 734
Total IFRS to US GAAP adjustment -403 -572
33.2) Available-for-sale marketable securities and derivative financial instruments
Under IFRS, fair value changes which relate to the underlying move-ment in exchange rates on available-for-sale debt securities have tobe recognized in the income statement. US GAAP requires the entiremovement in the fair value of these securities to be recognized inequity, including any part that relates to foreign exchange move-ments. This resulted in an additional US GAAP expense of USD 114million in 2006 (2005: income USD 278 million).
Under IFRS, the Group remeasures its investment in privatelyheld companies to fair value. Under US GAAP such investments areaccounted for at cost. A revaluation gain of USD 37 million (2005:USD 24 million) was recorded in the IFRS equity and reversed in theUS GAAP equity.
The carrying value of marketable securities under US GAAP isas follows:
2006 2005USD millions USD millions
Carrying values of marketable securities (note 15) 3 997 3 623
Adjustment to carrying values of financial investments(note 12) 1 884 1 431
Total marketable securities and other investments under US GAAP 5 881 5 054
The components of available-for-sale marketable securities underUS GAAP at December 31, 2006 and 2005 are the following:
Gross Gross Carrying valueunrealized unrealized and estimated
Cost gains losses fair valueUSD millions USD millions USD millions USD millions
As at December 31, 2006
Available-for sale securities:
Equity securities 1 004 422 -1 1 425
Debt securities 4 317 192 -53 4 456
Total 5 321 614 -54 5 881
As at December 31, 2005
Available-for sale securities:
Equity securities 717 259 -2 974
Debt securities 3 995 120 -35 4 080
Total 4 712 379 -37 5 054
Proceeds from sales of available-for-sale securities were USD 1.8 billion and USD 4.4 billion in 2006 and 2005 respectively. Gross realized gains were USD 67 million and USD 88 million on thosesales in 2006 and 2005 respectively. Gross realized losses were USD19 million and USD 70 million on those sales in 2006 and 2005respectively. The gain or loss on these sales was determined usingthe weighted average cost method. As of December 31, 2006 therewere no unrealized losses on equity securities (2005: nil) and USD19 million on debt securities (2005: USD 15 million) that existed formore than 12 months.
The maturities of the available-for-sale debt securities includedabove at December 31, 2006 are as follows:
2006USD millions
Within one year 905
Over one year through five years 1 807
Over five years through ten years 927
Over ten years 817
Total 4 456
33. Significant differences between IFRS and United States Generally Accepted AccountingPrinciples (US GAAP) (continued)
s_210-223_US_GAAP.qxd 23.1.2007 16:03 Uhr Seite 212
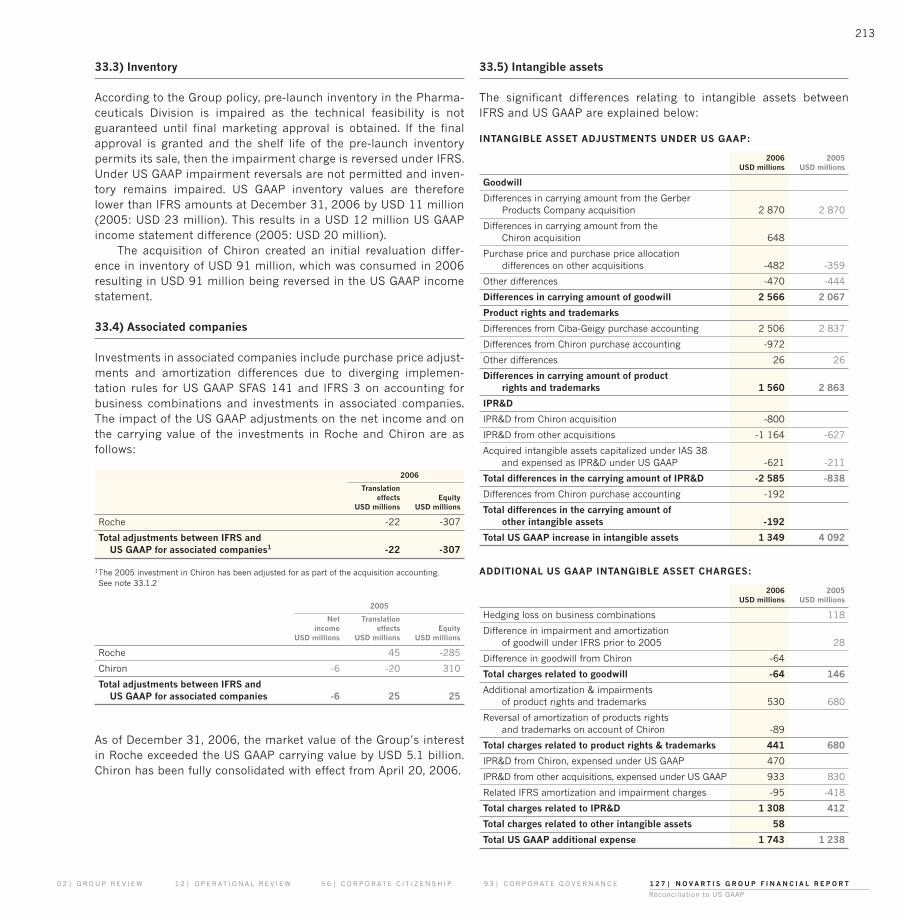
213
0 2 | G R O U P R E V I E W 1 2 | O P E R AT I O N A L R E V I E W 5 6 | C O R P O R AT E C I T I Z E N S H I P 9 3 | C O R P O R AT E G O V E R N A N C E 1 2 7 | N O V A R T I S G R O U P F I N A N C I A L R E P O R T
Reconciliation to US GAAP
33.3) Inventory
According to the Group policy, pre-launch inventory in the Pharma-ceuticals Division is impaired as the technical feasibility is notguaranteed until final marketing approval is obtained. If the finalapproval is granted and the shelf life of the pre-launch inventorypermits its sale, then the impairment charge is reversed under IFRS.Under US GAAP impairment reversals are not permitted and inven-tory remains impaired. US GAAP inventory values are therefore lower than IFRS amounts at December 31, 2006 by USD 11 million(2005: USD 23 million). This results in a USD 12 million US GAAPincome statement difference (2005: USD 20 million).
The acquisition of Chiron created an initial revaluation differ-ence in inventory of USD 91 million, which was consumed in 2006resulting in USD 91 million being reversed in the US GAAP incomestatement.
33.4) Associated companies
Investments in associated companies include purchase price adjust-ments and amortization differences due to diverging implemen-tation rules for US GAAP SFAS 141 and IFRS 3 on accounting forbusiness combinations and investments in associated companies.The impact of the US GAAP adjustments on the net income and onthe carrying value of the investments in Roche and Chiron are as follows:
2006
Translationeffects Equity
USD millions USD millions
Roche -22 -307
Total adjustments between IFRS and US GAAP for associated companies1 -22 -307
1The 2005 investment in Chiron has been adjusted for as part of the acquisition accounting. See note 33.1.2
2005
Net Translationincome effects Equity
USD millions USD millions USD millions
Roche 45 -285
Chiron -6 -20 310
Total adjustments between IFRS and US GAAP for associated companies -6 25 25
As of December 31, 2006, the market value of the Group’s interestin Roche exceeded the US GAAP carrying value by USD 5.1 billion.Chiron has been fully consolidated with effect from April 20, 2006.
33.5) Intangible assets
The significant differences relating to intangible assets betweenIFRS and US GAAP are explained below:
INTANGIBLE ASSET ADJUSTMENTS UNDER US GAAP:
2006 2005USD millions USD millions
Goodwill
Differences in carrying amount from the GerberProducts Company acquisition 2 870 2 870
Differences in carrying amount from theChiron acquisition 648
Purchase price and purchase price allocation differences on other acquisitions -482 -359
Other differences -470 -444
Differences in carrying amount of goodwill 2 566 2 067
Product rights and trademarks
Differences from Ciba-Geigy purchase accounting 2 506 2 837
Differences from Chiron purchase accounting -972
Other differences 26 26
Differences in carrying amount of productrights and trademarks 1 560 2 863
IPR&D
IPR&D from Chiron acquisition -800
IPR&D from other acquisitions -1 164 -627
Acquired intangible assets capitalized under IAS 38 and expensed as IPR&D under US GAAP -621 -211
Total differences in the carrying amount of IPR&D -2 585 -838
Differences from Chiron purchase accounting -192
Total differences in the carrying amount of other intangible assets -192
Total US GAAP increase in intangible assets 1 349 4 092
ADDITIONAL US GAAP INTANGIBLE ASSET CHARGES:
2006 2005USD millions USD millions
Hedging loss on business combinations 118
Difference in impairment and amortizationof goodwill under IFRS prior to 2005 28
Difference in goodwill from Chiron -64
Total charges related to goodwill -64 146
Additional amortization & impairmentsof product rights and trademarks 530 680
Reversal of amortization of products rights and trademarks on account of Chiron -89
Total charges related to product rights & trademarks 441 680
IPR&D from Chiron, expensed under US GAAP 470
IPR&D from other acquisitions, expensed under US GAAP 933 830
Related IFRS amortization and impairment charges -95 -418
Total charges related to IPR&D 1 308 412
Total charges related to other intangible assets 58
Total US GAAP additional expense 1 743 1 238
s_210-223_US_GAAP.qxd 23.1.2007 16:03 Uhr Seite 213

214
N O V A R T I S G R O U P F I N A N C I A L R E P O R T
Goodwill
The difference in the carrying amount of goodwill between IFRS andUS GAAP is on account of purchase price differences on acquisi-tions, various differences prior to the implementation of SFAS 141and IFRS 3, and timing differences in the implementation of certainaccounting standards.
The largest difference arises from the goodwill associated withthe acquisition of Gerber Products Company of USD 2 870 mil-lion which was written off to equity in accordance with the IFRSstandards in place before 1995. US GAAP does not allow such a write-off to equity. Gerber Products Company goodwill is reviewedannually for potential impairments, however, there were no impair-ment charges necessary in 2006 and 2005.
Additional goodwill differences arise from the purchase account-ing associated with the Chiron acquisition, primarily related to differ-ences in accounting for the step acquisition. The impact of theseadjustments increased equity by USD 648 million.
Under IFRS a deferred tax liability of USD 364 million (2005:USD 241 million) was recorded related to acquired IPR&D on otheracquisitions. As a result of recording the deferred tax liability, good-will was increased by the same amount. Under US GAAP, IPR&D is
expensed without tax effect and the carrying value of goodwill is low-er under US GAAP by the amount of the deferred tax. This amountincludes an adjustment of USD 69 million on account of the refine-ments to the purchase price allocations for Hexal. Other purchaseprice differences relate to the hedging of the purchase price of certainacquisitions of USD 118 million (2005: USD 118 million). Under IFRS,the hedging gains and losses on the purchase price are included aspart of the cost of acquisition; however, this is not permitted under USGAAP. The impact of these adjustments reduced equity by USD 482million (2005: USD 359 million).
Other goodwill differences, primarily related to IPR&D includedin goodwill under IFRS prior to March 31, 2004, SFAS 142 Goodwilland Other Intangible Assets and IFRS 3 transition differences and dif-ferences in impairments, reduced equity by USD 470 million (2005:USD 444 million).
The income statement difference of USD 64 million relate tothe Chiron acquisition for expenses recognized under IFRS butconsidered as part of the goodwill under US GAAP. There were nodifferences between IFRS and US GAAP due to impairment andamortization of goodwill in the current year (2005: USD 28 millionadditional expense).
33. Significant differences between IFRS and United States Generally Accepted AccountingPrinciples (US GAAP) (continued)
The changes in the carrying amount of goodwill under US GAAP for the years ended December 31, 2006 and 2005 are as follows:
Vaccines and ConsumerPharmaceuticals Diagnostics Sandoz Health
Division Division Division Division TotalUSD millions USD millions USD millions USD millions USD millions
January 1, 2005 23 732 3 685 4 440
Additions 15 4 958 223 5 196
Impairment losses -9 -8 -16 -33
Goodwill written off related to disposal of businesses -1 -1
Reclassification from separately identified intangible assets -4 -20 12 -12
Translation effects 5 -176 -24 -195
December 31, 2005 30 5 486 3 879 9 395
Goodwill associated with discontinuing operations -256 -256
Additions 2 276 1 350 213 -174 3 665
Impairment losses -2 -2
Goodwill written off related to disposal of businesses
Translation effects 10 405 8 423
December 31, 2006 2 316 1 350 6 104 3 455 13 225
s_210-223_US_GAAP.qxd 23.1.2007 16:03 Uhr Seite 214
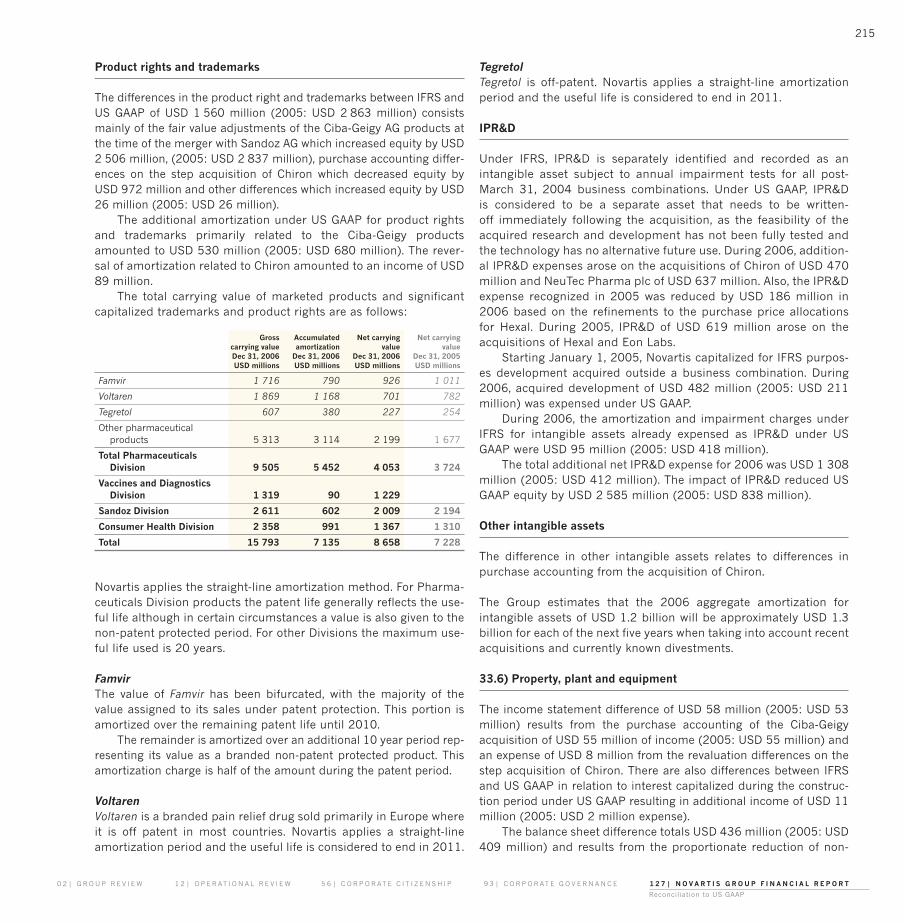
215
0 2 | G R O U P R E V I E W 1 2 | O P E R AT I O N A L R E V I E W 5 6 | C O R P O R AT E C I T I Z E N S H I P 9 3 | C O R P O R AT E G O V E R N A N C E 1 2 7 | N O V A R T I S G R O U P F I N A N C I A L R E P O R T
Reconciliation to US GAAP
Product rights and trademarks
The differences in the product right and trademarks between IFRS andUS GAAP of USD 1 560 million (2005: USD 2 863 million) consistsmainly of the fair value adjustments of the Ciba-Geigy AG products atthe time of the merger with Sandoz AG which increased equity by USD2 506 million, (2005: USD 2 837 million), purchase accounting differ-ences on the step acquisition of Chiron which decreased equity byUSD 972 million and other differences which increased equity by USD26 million (2005: USD 26 million).
The additional amortization under US GAAP for product rightsand trademarks primarily related to the Ciba-Geigy productsamounted to USD 530 million (2005: USD 680 million). The rever-sal of amortization related to Chiron amounted to an income of USD89 million.
The total carrying value of marketed products and significantcapitalized trademarks and product rights are as follows:
Gross Accumulated Net carrying Net carryingcarrying value amortization value valueDec 31, 2006 Dec 31, 2006 Dec 31, 2006 Dec 31, 2005USD millions USD millions USD millions USD millions
Famvir 1 716 790 926 1 011
Voltaren 1 869 1 168 701 782
Tegretol 607 380 227 254
Other pharmaceutical products 5 313 3 114 2 199 1 677
Total Pharmaceuticals Division 9 505 5 452 4 053 3 724
Vaccines and Diagnostics Division 1 319 90 1 229
Sandoz Division 2 611 602 2 009 2 194
Consumer Health Division 2 358 991 1 367 1 310
Total 15 793 7 135 8 658 7 228
Novartis applies the straight-line amortization method. For Pharma-ceuticals Division products the patent life generally reflects the use-ful life although in certain circumstances a value is also given to thenon-patent protected period. For other Divisions the maximum use-ful life used is 20 years.
FamvirThe value of Famvir has been bifurcated, with the majority of the value assigned to its sales under patent protection. This portion isamortized over the remaining patent life until 2010.
The remainder is amortized over an additional 10 year period rep-resenting its value as a branded non-patent protected product. Thisamortization charge is half of the amount during the patent period.
VoltarenVoltaren is a branded pain relief drug sold primarily in Europe whereit is off patent in most countries. Novartis applies a straight-lineamortization period and the useful life is considered to end in 2011.
TegretolTegretol is off-patent. Novartis applies a straight-line amortizationperiod and the useful life is considered to end in 2011.
IPR&D
Under IFRS, IPR&D is separately identified and recorded as anintangible asset subject to annual impairment tests for all post-March 31, 2004 business combinations. Under US GAAP, IPR&D is considered to be a separate asset that needs to be written-off immediately following the acquisition, as the feasibility of theacquired research and development has not been fully tested andthe technology has no alternative future use. During 2006, addition-al IPR&D expenses arose on the acquisitions of Chiron of USD 470million and NeuTec Pharma plc of USD 637 million. Also, the IPR&Dexpense recognized in 2005 was reduced by USD 186 million in2006 based on the refinements to the purchase price allocationsfor Hexal. During 2005, IPR&D of USD 619 million arose on theacquisitions of Hexal and Eon Labs.
Starting January 1, 2005, Novartis capitalized for IFRS purpos-es development acquired outside a business combination. During2006, acquired development of USD 482 million (2005: USD 211million) was expensed under US GAAP.
During 2006, the amortization and impairment charges underIFRS for intangible assets already expensed as IPR&D under USGAAP were USD 95 million (2005: USD 418 million).
The total additional net IPR&D expense for 2006 was USD 1 308million (2005: USD 412 million). The impact of IPR&D reduced USGAAP equity by USD 2 585 million (2005: USD 838 million).
Other intangible assets
The difference in other intangible assets relates to differences inpurchase accounting from the acquisition of Chiron.
The Group estimates that the 2006 aggregate amortization forintangible assets of USD 1.2 billion will be approximately USD 1.3billion for each of the next five years when taking into account recentacquisitions and currently known divestments.
33.6) Property, plant and equipment
The income statement difference of USD 58 million (2005: USD 53million) results from the purchase accounting of the Ciba-Geigyacquisition of USD 55 million of income (2005: USD 55 million) andan expense of USD 8 million from the revaluation differences on thestep acquisition of Chiron. There are also differences between IFRSand US GAAP in relation to interest capitalized during the construc-tion period under US GAAP resulting in additional income of USD 11million (2005: USD 2 million expense).
The balance sheet difference totals USD 436 million (2005: USD409 million) and results from the proportionate reduction of non-
s_210-223_US_GAAP.qxd 23.1.2007 16:03 Uhr Seite 215

216
N O V A R T I S G R O U P F I N A N C I A L R E P O R T
current assets due to the negative goodwill from the Ciba-Geigyacquisition of USD 562 million (2005: USD 575 million), decreasefrom the revaluation differences on the step acquisition of Chiron ofUSD 51 million and an increase from capitalized interest of USD 177million (2005: USD 166 million) under US GAAP.
33.7) Pensions and other post-employment benefits
Under the Group’s adoption of an alternative under IAS 19, actuarialgains and losses arising from differences between expected andactual changes in the fair value of assets and liabilities in theGroup’s pension and post-employment defined benefit plans arerecognized immediately in the statement of recognized income andexpense. Under US GAAP, these differences are recognized in theincome statement only when they fall outside the “corridor” of thehigher of 10% of plan assets or liabilities. Differences in theamounts of net periodic benefit costs and the prepaid benefit costalso exist due to different accounting policy adoption dates andtransition rules, pre-1999 accounting rule differences and differentprovisions for recognition of a prepaid pension asset and past serv-ice costs. However with the adoption of SFAS 158 Employers’Accounting for Defined Benefit Pension and Other PostretirementPlans as of December 31, 2006, which requires the immediaterecognition in equity of actuarial gains and losses on pension andother post-employment benefit plans, all the existing IFRS to USGAAP difference in equity, except for amounts due to past servicecosts unrecognized under IFRS, are eliminated. Differences will con-tinue to exist in the recognition of expense in the income statement.The following is a reconciliation of the balance sheet and incomestatement amounts recognized for IFRS and US GAAP for pensionplans. Also the impact of the new US GAAP requirement on US GAAPequity at December 31, 2006 is presented.
2006 2005USD millions USD millions
Pension plans:
Net asset recognized for IFRS 759 439
Difference in unrecognized amounts 3 470 3 566
Additional minimum liability -475 -760
Net asset recognized for US GAAP before adoption of SFAS 158 3 754 3 245
Adoption of SFAS 158 -3 006
Net asset recognized for US GAAP after adoption of SFAS 158 748
Net periodic pension costrecognized for IFRS -199 -218
Difference in recognition of actuarial andpast service amounts -187 -153
Net periodic pension costrecognized for US GAAP -386 -371
The funded status of other post-employment benefit plans under US GAAP is comparable to that presented in note 26. The plans aresubstantially foreign and the differences in income statement andbalance sheet treatment of actuarial losses are as follows:
2006 2005USD millions USD millions
Other post-employment benefit plans:
Liability recognized for IFRS -993 -1 033
Difference in unrecognized amounts 235 327
Liability recognized for US GAAP prior to adoption of SFAS 158 -758 -706
Adoption of SFAS 158 -209
Liability recognized for US GAAP after adoption of SFAS 158 -967
Net periodic post-employment benefitcost recognized for IFRS -96 -58
Difference in recognition of actuarial andpast service amounts -11 -28
Net periodic post-employment benefit costrecognized for US GAAP -107 -86
Total US GAAP income statement difference onpensions and other post-employment benefits -198 -181
Total US GAAP equity difference on pensions and other post-employment benefits prior toadoption of SFAS 158 3 230 3 133
Adoption of SFAS 158 – recognition of actuarial gains/losses -3 288
Adoption of SFAS 158 – Past service costs 73
Total US GAAP equity differences after adoptionof SFAS 158 15
Next year’s amortization of past service cost/credits and actuarialgains/losses is expected to be in line with this year’s amount.
33. Significant differences between IFRS and United States Generally Accepted AccountingPrinciples (US GAAP) (continued)
s_210-223_US_GAAP.qxd 23.1.2007 16:03 Uhr Seite 216

217
0 2 | G R O U P R E V I E W 1 2 | O P E R AT I O N A L R E V I E W 5 6 | C O R P O R AT E C I T I Z E N S H I P 9 3 | C O R P O R AT E G O V E R N A N C E 1 2 7 | N O V A R T I S G R O U P F I N A N C I A L R E P O R T
Reconciliation to US GAAP
217
SUMMARY OF PENSION PLANS
Swiss pension plans Foreign pension plans
2006 2005 2006 2005USD millions USD millions USD millions USD millions
Benefit obligation at beginning of the year 10 835 11 920 4 797 4 568
Benefit obligations related to discontinued operations -49
Service cost 208 167 209 196
Interest cost 316 340 243 227
Actuarial losses -138 631 -6 238
Plan amendments -7 55
Foreign currency translation 820 -1 646 256 -275
Benefit payments -634 -630 -231 -225
Contributions from associates 52 53 11 10
Effect of business combinations or divestments 85 3
Benefit obligation at end of the year 11 459 10 835 5 308 4 797
Fair value of plan assets at beginning of the year 12 660 14 436 3 399 3 227
Fair value of plan assets related to discontinued operations -21
Actual return on plan assets 352 770 419 313
Foreign currency translation 957 -1 969 137 -150
Novartis Group contributions 388 224
Contributions from associates 52 53 11 10
Effect of business combination or divestments 26
Benefit payments -634 -630 -231 -225
Fair value of plan assets at end of the year 13 387 12 660 4 128 3 399
Funded Status 1 928 1 825 -1 180 -1 398
Unrecognized past service cost -22 -27
Unrecognized net actuarial losses 2 702 2 585 801 1 020
Additional minimum liability -475 -760
Net asset/(liability) in the balance sheet before adoption of SFAS 158 4 630 4 410 -876 -1 165
Adoption of SFAS 158 -2 702 -304
Net asset/(liability) in the balance sheet after adoption of SFAS 158 1 928 -1 180
Components of net periodic benefit cost
Service cost 208 167 209 196
Interest cost 316 340 243 227
Expected returns on plan assets -531 -504 -227 -212
Recognized actuarial losses 119 107 72 50
Recognized past service cost -15
Plan amendments -8
Net periodic benefit cost 112 110 274 261
Accumulated benefit obligation 10 735 10 125 4 938 4 447
Principal actuarial assumptions used % % % %
Weighted average assumptions used to determine benefit obligations at the end of year
Discount rate 3.0 2.8 5.0 4.8
Expected rate of salary increase 3.7 2.2 3.8 3.6
Weighted average assumptions used to determine net periodic pension cost for the year ended
Discount rate 2.8 3.3 4.8 5.2
Expected return on plan assets 4.0 4.0 6.5 6.6
Expected rate of salary increase 2.2 1.5 3.6 3.6
s_210-223_US_GAAP.qxd 23.1.2007 16:03 Uhr Seite 217
218
N O V A R T I S G R O U P F I N A N C I A L R E P O R T
33.8) Deferred taxes
Unrealized profits resulting from intercompany transactions areeliminated from the carrying amount of assets, such as inventory. Inaccordance with IAS 12 (revised) Income Taxes, the Group calculatesthe tax effect with reference to the local tax rate of the company thatholds the inventory (the buyer) at period-end. However, US GAAPrequires that the tax effect is calculated with reference to the localtax rate in the seller's or manufacturer's jurisdiction. The effect ofthis difference decreased US GAAP net income in 2006 by USD 66million (2005: USD 69 million) and reduced equity by USD 647 mil-lion (2005: USD 581 million).
The deferred tax effect related to the US GAAP purchaseaccounting of Ciba-Geigy resulted in an additional USD 119 millionincome (2005: USD 156 million) and reduced equity by USD 493million (2005: USD 604 million).
The deferred tax effect on other US GAAP adjustments for 2006resulted in an additional USD 72 million income (2005: USD 91 mil-lion) and increased equity by USD 1 270 million (2005: reduction ofUSD 253 million).
The deferred tax asset less valuation allowance at December 31,2006 and 2005 comprises USD 1 997 million and USD 1 455 millionof current assets and USD 2 196 million and USD 2 798 million ofnon-current assets, respectively. The deferred tax liability at Decem-ber 31, 2006 and 2005 comprises USD 729 million and USD 552million of current liabilities and USD 4 720 million and USD 5 210million of non-current liabilities, respectively.
33.9) Share-based compensation
There are differences in the transitional rules on adopting the expens-ing of share-based compensation between IFRS and US GAAP, whichresults in a difference in the income statement charge between IFRSand US GAAP. As a result of this difference, an additional expensewas recognized under US GAAP in 2006 of USD 5 million (2005:USD 44 million).
In addition, under IFRS, the Group accounts for all share-basedcompensation equity-settled transactions in equity. However, underUS GAAP an arrangement which is a fixed monetary amount that is settleable with a variable number of the issuer’s equity shares is classified as a liability. The USD 186 million booked in the IFRSequity at December 31, 2006 (2005: USD 96 million) was reversedfor US GAAP purposes.
33.10) Minority Interests
In contrast to IFRS, minority interests are deducted in the determi-nation of US GAAP net income and excluded from total equity.
33.11) Other differences
In 2006 there were other income statement differences associatedwith the Chiron acquisition which included the recognition of USD58 million of liabilities under US GAAP previously considered ascontingent liabilities under IFRS as well as USD 10 million repre-senting fair value adjustments that were recorded in the revaluationreserve in equity under IFRS but which were considered a post-acquisition charge under US GAAP.
The other balance sheet differences of USD 61 million consist ofthe remaining separately recognized contingent liabilities recordedunder IFRS as part of the Chiron acquisition.
33.12) Discontinuing operations
The net assets related to discontinuing operations are associatedwith a decrease in equity of USD 19 million (2005: USD 19 million)from other goodwill differences recognized due to SFAS 142 andIFRS 3 transition differences (2005: USD 69 million increase in equi-ty due to differences in carrying amounts of goodwill written off toequity under IFRS prior to 1995).
Differences of USD 69 million due to carrying amounts of good-will written off to equity under IFRS were reversed due to divest-ments, reducing net income from discontinuing operations fromUSD 183 million under IFRS to USD 114 million under US GAAP.
33. Significant differences between IFRS and United States Generally Accepted AccountingPrinciples (US GAAP) (continued)
s_210-223_US_GAAP.qxd 23.1.2007 16:03 Uhr Seite 218

219
0 2 | G R O U P R E V I E W 1 2 | O P E R AT I O N A L R E V I E W 5 6 | C O R P O R AT E C I T I Z E N S H I P 9 3 | C O R P O R AT E G O V E R N A N C E 1 2 7 | N O V A R T I S G R O U P F I N A N C I A L R E P O R T
Reconciliation to US GAAP
33.13) Additional US GAAP disclosures
(i) Earnings per share
Basic earnings per share 2006 2005
Net income under US GAAP(USD millions) 5 264 5 190
Weighted average numberof shares outstanding 2 345 232 126 2 332 848 144
Basic earnings per share underUS GAAP (USD) 2.24 2.22
2006 2005
Net income from continuing operations under US GAAP (USD millions) 5 150 5 121
Weighted average numberof shares outstanding 2 345 232 126 2 332 848 144
Basic earnings per share under US GAAP (USD) from continuing operations 2.19 2.19
2006 2005
Net income from discontinuing operations under US GAAP (USD millions) 114 69
Weighted average numberof shares outstanding 2 345 232 126 2 332 848 144
Basic earnings per share under US GAAP(USD) from discontinuing operations 0.05 0.03
Diluted earnings per share 2006 2005
Net income under US GAAP(USD millions) 5 264 5 190
Weighted average numberof shares outstanding 2 345 232 126 2 332 848 144
Adjustment for dilutive share options 15 224 345 9 605 470
Weighted average number of sharesfor diluted earnings per share 2 360 456 471 2 342 453 614
Diluted earnings per shareUS GAAP (USD) 2.23 2.22
2006 2005
Net income from continuing operations US GAAP (USD millions) 5 150 5 121
Weighted average numberof shares outstanding 2 345 232 126 2 332 848 144
Adjustment for dilutive share options 15 224 345 9 605 470
Weighted average number of sharesfor diluted earnings per share 2 360 456 471 2 342 453 614
Diluted earnings per share US GAAP (USD)from continuing operations 2.18 2.19
2006 2005
Net income from discontinuing operations US GAAP (USD millions) 114 69
Weighted average numberof shares outstanding 2 345 232 126 2 332 848 144
Adjustment for dilutive share options 15 224 345 9 605 470
Weighted average number of sharesfor diluted earnings per share 2 360 456 471 2 342 453 614
Diluted earnings per share US GAAP (USD) from discontinuing operations 0.05 0.03
For diluted EPS, the weighted average number of shares outstand-ing is adjusted to assume conversion of all potentially dilutive sharesarising from options on Novartis shares.
s_210-223_US_GAAP.qxd 23.1.2007 16:03 Uhr Seite 219

220
N O V A R T I S G R O U P F I N A N C I A L R E P O R T
33. Significant differences between IFRS and United States Generally Accepted AccountingPrinciples (US GAAP) (continued)
(ii) Effect of New Accounting Pronouncements
US GAAP In June 2005, the FASB ratified EITF Issue 05-5, Accounting for Early Retirement or Post-employment Programs with Specific Features.Novartis will adopt EITF 05-5 in the first quarter of 2007. The adop-tion of EITF 05-5 is not expected to have a material impact on theGroup’s consolidated financial statements.
In June 2006, the FASB issued FASB Interpretation (FIN) 48,Accounting for Uncertainty in Income Taxes, an Interpretation of SFAS109, Accounting for Income Taxes, to create a single model to addressaccounting for uncertainty in tax positions taken or expected to betaken in a tax return. Under FIN 48, the tax benefit from an uncer-tain tax position may be recognized only if it is more likely than notthat the tax position will be sustained, based solely on its technicalmerits. The Group plans to adopt FIN 48 beginning January 1, 2007.The cumulative effect of adopting FIN 48 will be recorded in retainedearnings. The Group is currently evaluating the potential impact, ifany, that the adoption of FIN 48 will have on the Group’s consolidat-ed financial statements.
In September 2006, the FASB issued SFAS 157, Fair Value Measure-ments. This Statement defines fair value, establishes a framework formeasuring fair value in US GAAP, and expands disclosures about fairvalue measurements. This Statement applies to other accountingpronouncements that require or permit fair value measurements,the FASB having previously concluded in those accounting pro-nouncements that fair value is the relevant measurement attribute.Accordingly, this Statement does not require any new fair valuemeasurements. The Group plans to adopt this Statement beginningJanuary 1, 2007.
IFRS There are no new IFRS pronouncements not yet implemented whichare considered to have a significant impact on the Group’s consoli-dated financial statements.
s_210-223_US_GAAP.qxd 23.1.2007 16:03 Uhr Seite 220

221
0 2 | G R O U P R E V I E W 1 2 | O P E R AT I O N A L R E V I E W 5 6 | C O R P O R AT E C I T I Z E N S H I P 9 3 | C O R P O R AT E G O V E R N A N C E 1 2 7 | N O V A R T I S G R O U P F I N A N C I A L R E P O R T
Management’s Report on Internal Control
The Board of Directors and Management of the Group are respon-sible for establishing and maintaining adequate internal control overfinancial reporting. The Novartis Group’s internal control system wasdesigned to provide reasonable assurance to the Novartis Group’sManagement and Board of Directors regarding the reliability offinancial reporting and the preparation and fair presentation of itspublished consolidated financial statements.
All internal control systems no matter how well designed, haveinherent limitations. Therefore, even those systems determined tobe effective may not prevent or detect misstatements and can pro-vide only reasonable assurance with respect to financial statementpreparation and presentation. Also, projections of any evaluation ofeffectiveness to future periods are subject to the risk that controlsmay become inadequate because of changes in conditions, or thatthe degree of compliance with the policies or procedures may dete-riorate.
Novartis Group Management assessed the effectiveness of theGroup’s internal control over financial reporting as of December 31,2006. In making this assessment, it used the criteria established in Internal Control – Integrated Framework issued by the Committeeof Sponsoring Organizations of the Treadway Commission (COSO).Based on our assessment Management has concluded that, as ofDecember 31, 2006, the Novartis Group’s internal control overfinancial reporting is effective based on those criteria.
Management has excluded Chiron Corporation and NeuTec Phar-ma plc, from its assessment of internal control over financial report-ing as of December 31, 2006 because they were acquired by theNovartis Group in business combinations during 2006. Total assetsand total revenues of Chiron Corporation, and NeuTec Pharma plc,represent approximately 16%, or USD 10.9 billion and 4%, or USD1.6 billion, respectively, of the related consolidated financial state-ment amounts as of and for the year ended December 31, 2006.
Management’s assessment of the effectiveness of internal controlover financial reporting as of December 31, 2006 has been auditedby PricewaterhouseCoopers AG, Switzerland, an independent regis-tered public accounting firm, as stated in their report which isincluded in this Financial Report on pages 222 and 223.
Daniel Vasella, M. D. Raymund Breu, Ph. D.Chairman & Chief Executive Officer Chief Financial Officer
Basel, January 17, 2007
REPORT OF NOVARTIS MANAGEMENT ON INTERNAL CONTROL OVER FINANCIAL REPORTING
s_210-223_US_GAAP.qxd 23.1.2007 16:03 Uhr Seite 221
N O V A R T I S G R O U P F I N A N C I A L R E P O R T
222
To the general meeting of Novartis AG, Basel As auditors of the Group, we have audited the consolidated financialstatements of the Novartis Group for the year ended December 31,2006. We have also audited Management’s assessment on internalcontrol over financial reporting as of December 31, 2006. Our opin-ions, based on our audits, are presented below.
Consolidated financial statementsAs auditors of the Group, we have audited the consolidated financialstatements (comprising consolidated balance sheet, income state-ment, cash flow statement, statement of recognized income andexpense, statement of changes in equity and notes), set out onpages 156 to 220 of the Novartis Group for the year ended Decem-ber 31, 2006.
These consolidated financial statements are the responsibility ofthe Board of Directors. Our responsibility is to express an opinion onthese consolidated financial statements based on our audit. We con-firm that we meet the legal requirements concerning professionalqualification and independence.
We conducted our audit in accordance with Swiss Auditing Standards, International Standards on Auditing and the standards ofthe Public Company Accounting Oversight Board of the UnitedStates of America. Those standards require that we plan and per-form the audit to obtain reasonable assurance about whether theconsolidated financial statements are free of material misstatement.An audit of consolidated financial statements includes examining,on a test basis, evidence supporting the amounts and disclosures inthe consolidated financial statements, assessing the accountingprinciples used and significant estimates made and evaluating theoverall consolidated financial statement presentation. We believethat our audit provides a reasonable basis for our opinion.
In our opinion, the consolidated financial statements presentfairly, in all material respects, the financial position of the NovartisGroup, the results of its operations and its cash flows in accordancewith International Financial Reporting Standards (IFRS) and complywith Swiss law.
We recommend that the consolidated financial statements sub-mitted to you be approved.
Internal control over financial reportingWe have also audited Management’s assessment, included in theaccompanying “Report of Novartis Management on Internal Controlover Financial Reporting” appearing on page 221, that Novartismaintained effective internal control over financial reporting as ofDecember 31, 2006, based on criteria established in Internal Control– Integrated Framework issued by the Committee of SponsoringOrganizations of the Treadway Commission (COSO).
Novartis’ Board of Directors and Management of the Group areresponsible for maintaining effective internal control over financialreporting and Management is responsible for the assessment of theeffectiveness of internal control over financial reporting. Our respon-sibility is to express opinions on Management’s assessment and onthe effectiveness of the Novartis Group’s internal control over finan-cial reporting based on our audit.
We conducted our audit of internal control over financial report-ing in accordance with the standards of the Public CompanyAccounting Oversight Board of the United States of America. Thosestandards require that we plan and perform the audit to obtain rea-sonable assurance about whether effective internal control overfinancial reporting was maintained in all material respects. An auditof internal control over financial reporting includes obtaining anunderstanding of internal control over financial reporting, evaluatingManagement’s assessment, testing and evaluating the design andoperating effectiveness of internal control, and performing such oth-er procedures as we consider necessary in the circumstances. Webelieve that our audit provides a reasonable basis for our opinions.
REPORT OF THE GROUP AUDITORS ON THE NOVARTIS CONSOLIDATED FINANCIAL STATEMENTS AND INTERNAL CONTROL
OVER FINANCIAL REPORTING
s_210-223_US_GAAP.qxd 23.1.2007 16:03 Uhr Seite 222
223
0 2 | G R O U P R E V I E W 1 2 | O P E R AT I O N A L R E V I E W 5 6 | C O R P O R AT E C I T I Z E N S H I P 9 3 | C O R P O R AT E G O V E R N A N C E 1 2 7 | N O V A R T I S G R O U P F I N A N C I A L R E P O R T
Auditors Report on Novartis Consolidated Financial Statements
A company’s internal control over financial reporting is a processdesigned to provide reasonable assurance regarding the reliability offinancial reporting and the preparation of financial statements forexternal purposes in accordance with the applicable accountingstandards. A company’s internal control over financial reportingincludes those policies and procedures that (i) pertain to the main-tenance of records that, in reasonable detail, accurately and fairlyreflect the transactions and dispositions of the assets of the compa-ny; (ii) provide reasonable assurance that transactions are recordedas necessary to permit preparation of financial statements in accor-dance with the applicable accounting standards, and that receiptsand expenditures of the company are being made only in accor-dance with authorizations of Management and Directors of the com-pany; and (iii) provide reasonable assurance regarding prevention ortimely detection of unauthorized acquisition, use, or disposition ofthe company’s assets that could have a material effect on the finan-cial statements.
Because of its inherent limitations, internal control over finan-cial reporting may not prevent or detect misstatements. Also, projec-tions of any evaluation of effectiveness to future periods are subjectto the risk that controls may become inadequate because ofchanges in conditions, or that the degree of compliance with thepolicies or procedures may deteriorate.
In our opinion, Management’s assessment that the NovartisGroup maintained effective internal control over financial reportingas of December 31, 2006, is fairly stated, in all material respects,based on criteria established in Internal Control – Integrated Frame-work issued by the COSO.
Also, in our opinion, the Novartis Group maintained, in all mate-rial respects, effective internal control over financial reporting as ofDecember 31, 2006, based on criteria established in Internal Control– Integrated Framework issued by the COSO.
As described in the “Report of Novartis Management on InternalControl over Financial Reporting”, Management has excluded ChironCorporation and NeuTec Pharma plc from its assessment of internalcontrol over financial reporting as of December 31, 2006 becausethey were acquired by the Novartis Group in business combinationsduring 2006. We have also excluded Chiron Corporation and NeuTecPharma plc from our audit of internal controls over financial report-ing. Chiron Corporation and NeuTec Pharma plc are wholly-ownedbusinesses whose total assets and total revenues represent approx-imately 16% or USD 10.9 billion and 4% or USD 1.6 billion, respec-tively, of the related consolidated financial statement amounts as ofand for the year ended December 31, 2006.
PricewaterhouseCoopers AG
R. P. Muir D. Suter Auditor in Charge
Basel, January 17, 2007
s_210-223_US_GAAP.qxd 23.1.2007 16:03 Uhr Seite 223
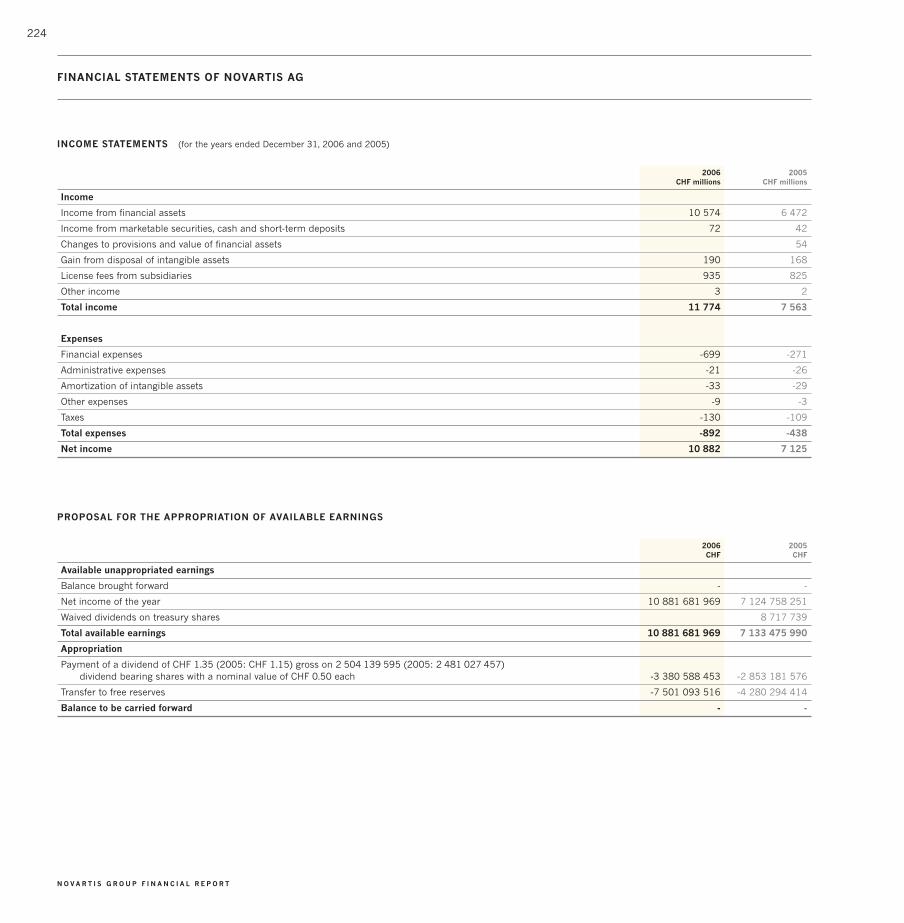
224
N O V A R T I S G R O U P F I N A N C I A L R E P O R T
INCOME STATEMENTS (for the years ended December 31, 2006 and 2005)
2006 2005CHF millions CHF millions
Income
Income from financial assets 10 574 6 472
Income from marketable securities, cash and short-term deposits 72 42
Changes to provisions and value of financial assets 54
Gain from disposal of intangible assets 190 168
License fees from subsidiaries 935 825
Other income 3 2
Total income 11 774 7 563
Expenses
Financial expenses -699 -271
Administrative expenses -21 -26
Amortization of intangible assets -33 -29
Other expenses -9 -3
Taxes -130 -109
Total expenses -892 -438
Net income 10 882 7 125
PROPOSAL FOR THE APPROPRIATION OF AVAILABLE EARNINGS
2006 2005CHF CHF
Available unappropriated earnings
Balance brought forward - -
Net income of the year 10 881 681 969 7 124 758 251
Waived dividends on treasury shares 8 717 739
Total available earnings 10 881 681 969 7 133 475 990
Appropriation
Payment of a dividend of CHF 1.35 (2005: CHF 1.15) gross on 2 504 139 595 (2005: 2 481 027 457) dividend bearing shares with a nominal value of CHF 0.50 each -3 380 588 453 -2 853 181 576
Transfer to free reserves -7 501 093 516 -4 280 294 414
Balance to be carried forward - -
FINANCIAL STATEMENTS OF NOVARTIS AG
s_224-231_Novartis_AG.qxd 23.1.2007 16:16 Uhr Seite 224

225
0 2 | G R O U P R E V I E W 1 2 | O P E R AT I O N A L R E V I E W 5 6 | C O R P O R AT E C I T I Z E N S H I P 9 3 | C O R P O R AT E G O V E R N A N C E 1 2 7 | N O V A R T I S G R O U P F I N A N C I A L R E P O R T
Financial Statements of Novartis AG
BALANCE SHEETS (PRIOR TO PROFIT APPROPRIATION) (at December 31, 2006 and 2005)
2006 2005Notes CHF millions CHF millions
Assets
Non-current assets
Intangible assets 278 310
Financial assets 3 27 488 21 568
Total non-current assets 27 766 21 878
Current assets
Receivables
– subsidiaries 3 869 1 456
– others 26 39
Marketable securities 4 265 1 016
Cash and short-term deposits 1
Total current assets 4 160 2 512
Total assets 31 926 24 390
Equity and liabilities
Equity
Total share capital 5 1 365 1 370
Reserves
Legal reserves 6
General reserve 320 320
Reserve for treasury shares 7 470 8 653
Free reserves 7 10 930 6 048
Total reserves 18 720 15 021
Unappropriated earnings
Net income of the year 10 882 7 125
Waived dividends on treasury shares 9
Total unappropriated earnings 10 882 7 134
Total equity 30 967 23 525
Liabilities
Provisions 526 592
Accounts payable and accrued liabilities
– subsidiaries 289 160
– others 144 113
Total liabilities 959 865
Total equity and liabilities 31 926 24 390
The notes form an integral part of these unconsolidated financial statements
s_224-231_Novartis_AG.qxd 23.1.2007 16:16 Uhr Seite 225

226
N O V A R T I S G R O U P F I N A N C I A L R E P O R T
The financial statements of Novartis AG comply with the require-ments of the Swiss law for companies, the Code of Obligations(SCO).
Exchange rate differences Current assets denominated in foreign currencies are converted atyear end exchange rates. Exchange differences arising from these aswell as those from business transactions are recorded in the incomestatement.
Intangible assets These are capitalized and amortized over a period of between five totwenty years.
Financial assetsThese are valued at acquisition cost less adjustments for impair-ment of value.
Marketable securitiesThese are valued at the lower of cost and market value.
ProvisionsProvisions are made to cover general business risks of the Group.
2. Accounting Policies
Included in financial assets are CHF 11 700 million (2005: CHF11 615 million) of investments in subsidiaries and CHF 15 788 mil-lion (2005: CHF 9 953 million) of loans to subsidiaries and otherrelated entities.
3. Financial Assets
Included in marketable securities are treasury shares with a netbook value of CHF 262 million (2005: CHF 1 013 million) (see 5 and6 below).
4. Marketable Securities
1. Introduction
NOTES TO THE FINANCIAL STATEMENTS OF NOVARTIS AG
The principal direct and indirect subsidiaries and other holdings ofNovartis AG are shown on pages 208 and 209.
s_224-231_Novartis_AG.qxd 23.1.2007 16:16 Uhr Seite 226

227
0 2 | G R O U P R E V I E W 1 2 | O P E R AT I O N A L R E V I E W 5 6 | C O R P O R AT E C I T I Z E N S H I P 9 3 | C O R P O R AT E G O V E R N A N C E 1 2 7 | N O V A R T I S G R O U P F I N A N C I A L R E P O R T
Notes to the Financial Statements of Novartis AG
5. Share CapitalNumber of shares
Dec 31, Movement Dec 31, Movement Dec 31,2004 in year 2005 in year 2006
Total Novartis AG shares 2 777 210 000 -38 039 000 2 739 171 000 -10 200 000 2 728 971 000
Treasury shares
Treasury shares held by Novartis AG 159 067 000 -33 474 472 125 592 528 -13 483 063 112 109 465
Treasury shares held by subsidiaries 132 395 603 230 077 132 625 680 -7 877 561 124 748 119
Total treasury shares 291 462 603 -33 244 395 258 218 208 -21 360 624 236 857 584
The Novartis AG share capital consists of registered shares with anominal value of CHF 0.50 each.
The total share capital reduced from CHF 1 369.6 million atDecember 31, 2005 to CHF 1 364.5 million at December 31, 2006due to a share capital reduction and subsequent cancellation of 10.2 million shares with a nominal value of CHF 5.1 millionapproved at the Annual General Meeting of February 28, 2006,which became effective on May 17, 2006.
The total share capital reduced from CHF 1 388.6 million atDecember 31, 2004 to CHF 1 369.6 million at December 31, 2005due to a share capital reduction and subsequent cancellation of38.0 milllion shares with a nominal value of CHF 19.0 millionapproved at the Annual General Meeting of March 1, 2005, whichbecame effective on May 25, 2005.
Treasury share purchases totaled 0.5 million (2005: 14.7 million)with an average purchase price per share of CHF 68 (2005: CHF 57)and treasury share sales totaled 11.7 million (2005: 9.9 million)with an average sale price of CHF 70 (2005: CHF 59)
The number of treasury shares held by the Company and sub-sidiaries meet the definitions and requirements of Art. 659b SCO.Out of the 236 857 584 treasury shares held at December 31, 2006,224 831 405 are non-dividend bearing with the balance held forshare-based compensation and being dividend bearing. NovartisGroup’s consolidated financial statements comply with IFRS SICInterpretation No. 12. This requires consolidation of entities whichdo not qualify as subsidiaries in the sense of Article 659b SCO.
GENERAL RESERVE
2006 2005CHF millions CHF millions
January 1 320 281
Gain on merging a subsidiary into Novartis AG 39
December 31 320 320
6. Legal Reserves
RESERVE FOR TREASURY SHARES HELD BY THE GROUP
2006 2005CHF millions CHF millions
January 1 8 653 10 573
Reduction due to cancellation of treasury shares(CHF 586 million of repurchased shares less their nominal value of CHF 5 million, 2005: CHF 2 183 million and CHF 19 million, respectively) -581 -2 164
Transfer from/to free reserves -602 244
December 31 7 470 8 653
The general reserve must be at least 20% of the share capital ofNovartis AG in order to comply with the SCO.
Novartis AG has met the legal requirements for legal reservesunder Articles 659 et. seq. and 663b.10 SCO for the treasury sharesdetailed in note 5.
s_224-231_Novartis_AG.qxd 23.1.2007 16:16 Uhr Seite 227
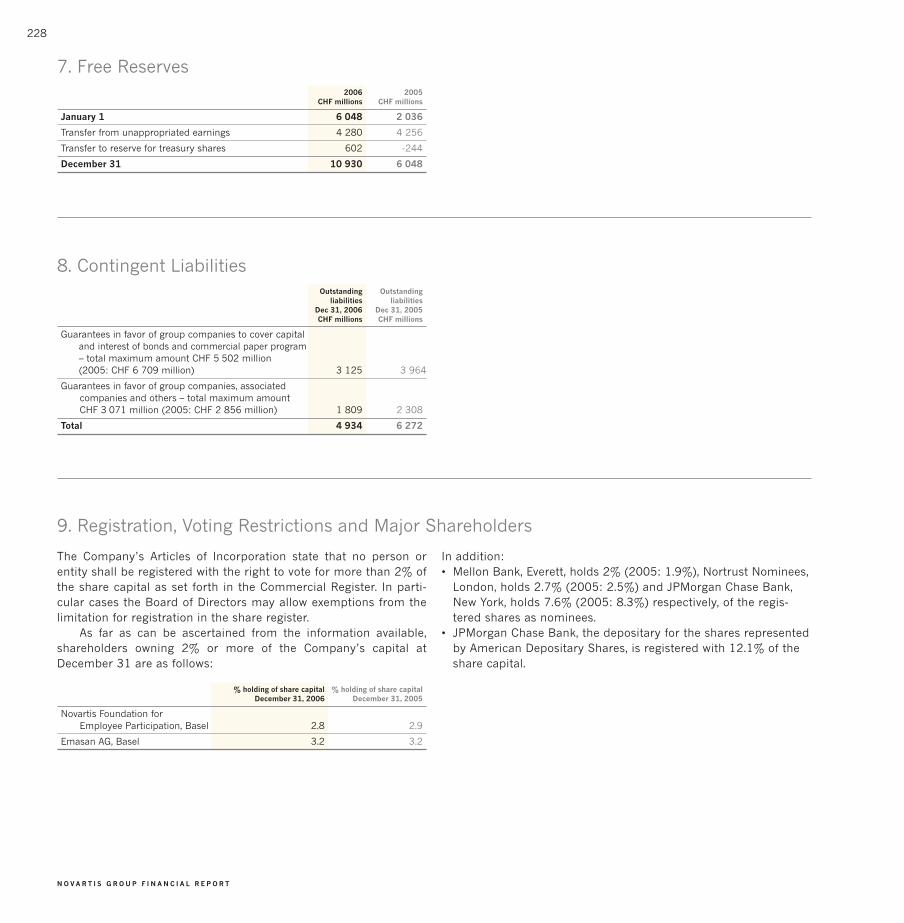
228
N O V A R T I S G R O U P F I N A N C I A L R E P O R T
2006 2005CHF millions CHF millions
January 1 6 048 2 036
Transfer from unappropriated earnings 4 280 4 256
Transfer to reserve for treasury shares 602 -244
December 31 10 930 6 048
7. Free Reserves
Outstanding Outstandingliabilities liabilities
Dec 31, 2006 Dec 31, 2005CHF millions CHF millions
Guarantees in favor of group companies to cover capital and interest of bonds and commercial paper program– total maximum amount CHF 5 502 million (2005: CHF 6 709 million) 3 125 3 964
Guarantees in favor of group companies, associatedcompanies and others – total maximum amountCHF 3 071 million (2005: CHF 2 856 million) 1 809 2 308
Total 4 934 6 272
8. Contingent Liabilities
The Company’s Articles of Incorporation state that no person orentity shall be registered with the right to vote for more than 2% ofthe share capital as set forth in the Commercial Register. In parti-cular cases the Board of Directors may allow exemptions from thelimitation for registration in the share register.
As far as can be ascertained from the information available,shareholders owning 2% or more of the Company’s capital atDecember 31 are as follows:
% holding of share capital % holding of share capitalDecember 31, 2006 December 31, 2005
Novartis Foundation forEmployee Participation, Basel 2.8 2.9
Emasan AG, Basel 3.2 3.2
9. Registration, Voting Restrictions and Major Shareholders
In addition:• Mellon Bank, Everett, holds 2% (2005: 1.9%), Nortrust Nominees,
London, holds 2.7% (2005: 2.5%) and JPMorgan Chase Bank,New York, holds 7.6% (2005: 8.3%) respectively, of the regis-tered shares as nominees.
• JPMorgan Chase Bank, the depositary for the shares representedby American Depositary Shares, is registered with 12.1% of theshare capital.
s_224-231_Novartis_AG.qxd 24.1.2007 18:02 Uhr Seite 228

229
0 2 | G R O U P R E V I E W 1 2 | O P E R AT I O N A L R E V I E W 5 6 | C O R P O R AT E C I T I Z E N S H I P 9 3 | C O R P O R AT E G O V E R N A N C E 1 2 7 | N O V A R T I S G R O U P F I N A N C I A L R E P O R T
Report of the Auditors on the Novartis AG Financial Statements
To the General Meeting of Novartis AG, BaselAs statutory auditors, we have audited the accounting records andthe financial statements (balance sheet, income statement andnotes), pages 224 to 228, of Novartis AG, Basel, for the year endedDecember 31, 2006.
These financial statements are the responsibility of the Board ofDirectors. Our responsibility is to express an opinion on these finan-cial statements based on our audit. We confirm that we meet thelegal requirements concerning professional qualification and inde-pendence.
Our audit was conducted in accordance with Swiss AuditingStandards, which require that an audit be planned and performed toobtain reasonable assurance about whether the financial statementsare free from material misstatement. We have examined on a testbasis evidence supporting the amounts and disclosures in the finan-cial statements. We have also assessed the accounting principlesused, significant estimates made and the overall financial statementpresentation. We believe that our audit provides a reasonable basisfor our opinion.
In our opinion, the accounting records and financial statementsand the proposed appropriation of available earnings comply withSwiss law and the Company’s articles of incorporation.
We recommend that the financial statements submitted to yoube approved.
PricewaterhouseCoopers AG
G. Tritschler R. P. MuirAuditor in Charge
Basel, January 17, 2007
REPORT OF THE AUDITORS ON THE NOVARTIS AG FINANCIAL STATEMENTS
s_224-231_Novartis_AG.qxd 23.1.2007 16:16 Uhr Seite 229

230
Anticipated key reporting dates
Annual General Meeting for the financial year 2006 March 6, 2007
First Quarter 2007 (sales and results) April 23, 2007
First Half 2007 (year to date and second quartersales and results) July 17, 2007
Nine Months 2007 (year to date and third quartersales and results) October 18, 2007
Full Year 2007 (year to date and fourth quartersales and results) January 2008
KEY DATES FOR 2007
s_224-231_Novartis_AG.qxd 23.1.2007 16:16 Uhr Seite 230

231
For further information regarding Novartis please contact:
Novartis International AGNovartis CommunicationsCH-4002 BaselSwitzerland
Investor relations For US investorsRuth Metzler-Arnold Ronen TamirTel: +41 61 324 7944 Tel: +1 212 830 2433Fax:+41 61 324 8444 Fax:+1 212 830 2405
Media relations Share registryJohn Gilardi Kurt HoeinTel: +41 61 324 2200 Tel: +41 61 324 4415Fax:+41 61 324 9090 Fax:+41 61 324 3244
General informationTel: +41 61 324 1111Fax:+41 61 324 8001
Novartis on the Internetwww.novartis.com
Novartis Annual Report on the Internetwww.novartis.com/annualreport2006
CONTACT ADDRESSES
s_224-231_Novartis_AG.qxd 23.1.2007 16:16 Uhr Seite 231

232
I N S I D E B A C K C O V E R : H O S P I T A L D O C Â N C E R ; S Ã O P A U L O , B R A Z I LB A C K C O V E R : G R U P O D E A P O I O A O A D O L E S C E N T E E À C R I A N Ç A C O M C Â N C E R ; S Ã O P A U L O , B R A Z I L
Forward-Looking Statements
This Annual Report contains certain forward-looking statements within the meaning of the securitieslaws of the United States relating to the Company’s business, which can be identified by the use offorward-looking terminology such as “will,” “growth,” “future,” “likely,” “anticipated,” “strategic,” “ontrack,” “submitted,” “to divest,” “planning,” “expect,” “anticipate,” “seeking to become,” “development,”“could be”, “pipeline,” “planned,” “forward-looking strategy,” or similar expressions, or by express orimplied discussions regarding potential future growth in the healthcare industry or in Novartis rev-enues, potential new products, potential new indications for existing products, or regarding potentialfuture revenues from such products, or by discussions of strategy, plans, intentions or expectations.Such forward-looking statements involve known and unknown risks, uncertainties and other factorsthat may cause actual results to be materially different from any future results, performance orachievements expressed or implied by such statements. There can be no guarantee that Novartisrevenues, or the healthcare industry will grow in the future, or that they will achieve any particularlevels. Neither can there be any guarantees that any of the development projects described will suc-ceed or that any new products or indications will be brought to market. Similarly, there can be noguarantee that Novartis or any future product or indication will achieve any particular level of rev-enue. In particular, management’s expectations could be affected by, among other things, uncer-tainties involved in the development of new pharmaceutical products, including unexpected clinicaltrial results; unexpected regulatory actions or delays or government regulation generally; the com-pany’s ability to obtain or maintain patent or other proprietary intellectual property protection; com-petition in general; government, industry, and general public pricing and other political pressures;as well as factors discussed in the Company’s Form 20-F filed with the US Securities and ExchangeCommission. Should one or more of these risks or uncertainties materialize, or should underlyingassumptions prove incorrect, actual results may vary materially from those described in this Annu-al Report as anticipated, believed, estimated or expected. Novartis is providing the information in thishandout as of the date of the publication of this Annual Report, and does not undertake any obliga-tion to update any forward-looking statements contained in this Annual Report as a result of newinformation, future events or otherwise.
All product names printed in italics in this Annual Report are trademarks owned by or licensedto the Novartis Group.
® The use of the registered trademark ® in combination with products in normal script indicatesthird-party brands.
The business policy of Novartis takes into account the OECD’s Guidelines for Multinational Enterprises, with their recommendations on the disclosure of information.Our Annual Report is originally published in English, with French and German versions available.
Publisher: Novartis International AG, Basel, SwitzerlandDesign and production: Com.factory, Basel, SwitzerlandPrint: NZZ Fretz AG, Schlieren, Switzerland
© Novartis AG, 2007
Alex Majoli was born in Ravenna, Italy in 1971. At the age of 15, he joined the F45 Studio inRavenna, working alongside Daniele Casadio. While studying at the Art Institute in Ravenna, hebecame a photojournalist and joined the Grazia Neri Agency. After graduation, he traveled toYugoslavia to document the conflict in that country. He returned many times in later years.
For almost a decade Majoli photographed psychiatric hospitals around the world, including anintimate portrait of a mental institution on the island of Leros, Greece. This project culminatedin the publication of Majoli’s first major monograph, Leros.
With the aim of documenting life in harbor cities around the world, Majoli started the large-scalepersonal project Hotel Marinum that was further developed as a theatrical multimedia show. Atthe same time, he began experimenting with cinematography and made a series of short filmsand documentaries.
After becoming a full member at Magnum Photos, Majoli covered the fall of the Taliban regimein Afganistan and two years later the invasion of Iraq. He continues to follow and document con-flicts worldwide for various magazines such as Newsweek, The New York Times Magazine, Gran-ta and National Geographic.
Majoli was recently involved in a project for the French Ministry of Culture entitled “BPS,” or Bio-Position System, about the social transformation of the city of Marseille.
He lives and works in New York and Milan.
We would like to thank everyone who contributed to this report by sharing personal experience and knowledge with us.
We are particularly grateful to Alex Majoli for the artistic photographs in our Annual Report.
119863_Nova_000_000_web_e.qxp 24.1.2007 13:19 Uhr Seite 232


WWW.NOVARTIS.COM ANNUAL REPORT 2006AN
NU
AL R
EP
OR
T 2
00
6
119863_Nova_001_002_ug_e.qxp 18.1.2007 10:03 Uhr Seite 1