Nova Scotia - energycities.org
162
Nova Scotia NOVA SCOTIA DEPARTMENT OF ENERGY EXPORT MARKET ANALYSIS MARCH 2017
Transcript of Nova Scotia - energycities.org
N===
Nova Scotia
NOVA SCOTIA
DEPARTMENT OF ENERGY
EXPORT MARKET ANALYSIS
MARCH 2017
Duggan International Group 2017 2 | P a g e
Executive Summary……………………………………………………………………………………………………………………………………….3
Best Prospects Charts…….………………………………………………………………………………….…...……………………………………..6
Angola Country Profile .................................................................................................................................................................... 10
Australia Country Profile ................................................................................................................................................................. 19
Brazil Country Profile ....................................................................................................................................................................... 30
Canada Country Profile ................................................................................................................................................................... 39
China Country Profile ....................................................................................................................................................................... 57
Denmark Country Profile ................................................................................................................................................................ 67
Kazakhstan Country Profile ........................................................................................................................................................... 76
Malaysia Country Profile ................................................................................................................................................................. 85
Mexico Country Profile .................................................................................................................................................................... 93
Norway Country Profile ................................................................................................................................................................. 102
Qatar Country Profile ..................................................................................................................................................................... 111
Saudi Arabia Country Profile ....................................................................................................................................................... 118
South Africa Country Profile ....................................................................................................................................................... 126
United Kingdom Country Profile ............................................................................................................................................... 134
United States of America Profile………………………………………………………………………………………...………….……….…145
DISCLAIMER located on Page 5 and Page 162
Contents
Duggan International Group 2017 3 | P a g e
Nova Scotia Department of Energy (NSDOE) is
mandated to investigate economic opportunities
for Nova Scotia technology developers and
supply chain service providers. To assist the
energy industry, NSDOE commissioned a global
market analysis of the energy sectors of World
Energy Cities Partnership (WECP) member
countries. The following cities/countries of the
WECP were included in this analysis: Cape Town
(South Africa), Luanda (Angola), Calgary
(Canada), Halifax (Canada), St. John’s (Canada),
Villahermosa (Mexico), Atyrau (Kazakhstan),
Dammam (Saudi Arabia), Daqing (China), Doha
(Qatar), Karamay (China), Kuala Lumpur
(Malaysia), Aberdeen (Scotland), Esbjerg
(Denmark), Stavanger (Norway), Perth (Australia)
and Houston (USA).
The purpose of this analysis is to prepare and
inform Nova Scotia companies of export
opportunities in these countries, and maximize
the relationships of upcoming trade events in
Halifax and abroad. These events include:
Offshore Technology Conference (OTC 2017);
May 1-4, Houston, Texas; the European Wave
and Tidal Energy Conference (EWTEC 2017), Aug.
27-Sept. 2, Cork, Ireland; and Offshore Europe
2017 – Sept. 5-8, Aberdeen, Scotland.
The final events will be held in October 2017 in
Halifax. The World Energy City Partnership
(WECP) annual general meeting will be hosted
simultaneously with the Maritime Energy
Association’s (MEA) 35th anniversary Core
Energy Conference. The WECP steering
committee will be bringing a delegation of
companies to Halifax to participate in both
events. The country profiles in this analysis will
prepare Nova Scotian companies by describing
best prospects, partnerships and technology
transfer opportunities with WECP participating
companies. WECP companies, in turn, will be
educated on opportunities, sales and foreign
direct investment in Canada.
From the market profiles, several themes are
prevalent across the globe:
Fossil fuels will continue to play a
significant role in the global energy mix.
All countries have made a commitment
to reduce greenhouse gas emissions
(GHG) by increasing their energy
production from renewable resources.
To achieve these goals, all countries will
need to invest their own money and find
private investors to advance innovation,
technology and infrastructure to cost
effectively bring renewable energy to
the grid.
International oil companies and
governments were affected financially
by the volatile oil prices. Some
countries, whose energy consumption
relies on other forms of energy such as
Australia and Qatar, were more
insulated.
International oil companies and
operators in the supply chain incurred
heavy employee layoffs.
Several international oil companies
merged and consolidated with other
companies and/or sold assets.
New exploration was delayed in favour
of life extension of existing proved
fields.
Although, all but one country is
experiencing a turnaround in oil and gas
exploration, production is still in decline.
New technology in both products and
services are desperately needed to
effectively and efficiently manage both
upstream and downstream operations.
New technologies are needed in
renewable energy for it to be more cost
effective over oil, LNG or coal power.
The information presented in this report was
sourced from the specified country’s
government and trade association websites,
trade and industry reports from the US and the
UK government, published research reports,
news articles and primary in-country contacts.
The oil and gas industry is forever changing and
best prospects for Nova Scotia companies are
based on global and local perspectives. Ranking
of countries based on opportunities for Nova
Scotia's energy services sector may be difficult
as providers are varied and the level of export
preparedness is also diverse. Much of Nova
Scotia’s strengths are in subsea technology and
services. However, if industry is to grow and
expand, companies need to acquire the latest
innovations. This could include acquiring
technology or partnering with external firms to
reach new markets. For SMEs, most often the
best way to first enter a market is to partner with
another company. The partner should have a
new set of skills and product offerings to make a
stronger co-venture. Another method is to sell
to or partner with a company that is already
doing business in the market. This is especially
true for mature and heavily competitive markets
with established companies such as Malaysia. As
well, working with a market distributor or agent
will be useful (and in most cases required) for
countries where Nova Scotian companies lack
the experience of working in foreign languages,
country regulations and working with
government officials.
Today’s political climate may also be favourable
for Nova Scotian companies. Mexico could be a
good market for Canada because of the political
tensions with the US, and potential changes to
NAFTA. Additionally, the Brazilian government is
lowering its local content rules to attract foreign
investors. South Africa is considered a frontier
market by oil and gas companies, yet Nova
Scotia companies may find niche opportunities
here and less competition from other
international companies. In renewable energy,
Saudi Arabia is issuing requests for proposals in
April 2017, with billions in financial backing.
International renewable energy companies are
closely following developments in Saudi Arabia.
Australia, however, may be the prospect with the
least potential for Nova Scotia, due not only its
proximity, but the market slow down. Australia,
nonetheless, is a leader in LNG exports, a
gateway to Asian countries. These factors all
offer opportunities for Nova Scotian companies.
Nova Scotia is emerging as a leader in the global
tidal energy industry and is home to Canada’s
leading test site for in-stream tidal energy
devices, the Fundy Ocean Research Center for
Energy (FORCE). In 2016, Cape Sharp Tidal
deployed the largest in-stream tidal turbine (2
MW) and there are future plans to deploy more
turbines in the Bay of Fundy. Nova Scotian
innovation in tidal energy will create
opportunities for investment and will advance
the technological development of related
supplies and services. Australia and Denmark are
in the infancy stages of tidal energy research.
These countries may be an attractive market for
exports for Nova Scotia companies involved in
tidal energy.
Duggan International Group 2017 5 | P a g e
In other areas of renewable energy, Nova Scotia
also has the opportunity for technology transfer
from WECP member countries. Denmark is a
leader in biomass and wind energy, and Norway
is leading the world in battery operated marine
vessels. Nova Scotia companies have a unique
opportunity to investigate these technologies to
transfer to not only this country, but to re-export
new skill sets globally.
Nova Scotia companies need to research their
market, funding programs and create an
entrance strategy before entering a new market.
Strategies may include working with the NSDOE,
Halifax Partnership, the Atlantic Canada
Opportunities Agency (ACOA), Global Affairs
Canada, Export Development Canada, and the
Maritimes Energy Association, Offshore Energy
Research Association, Marine Renewables
Canada and other relevant trade associations in
Nova Scotia and Canada.
Abbreviations:
AO Angola
AU Australia
BR Brazil
CA Canada
CN China
DK Denmark
KZ Kazakhstan
MY Malaysia
MX Mexico
NO Norway
QA Qatar
SA Saudi Arabia
ZA South Africa
UK United Kingdom
USA United States of America
EDC Export Development Canada
WECP World Energy City Partnership
Contents Clip Art: Courtesy of WECP
DISCLAIMER
This Report was prepared by the Duggan International Group. The
company does not endorse or guarantee the performance or
suitability of any introduced party or accept liability for the
accuracy or usefulness of any information contained in this Report.
Please use commercial discretion to assess the suitability of any
business introduction or goods and services offered or investment
when assessing your business needs. The information presented in
this report is drawn from secondary sources that are available to
the public. Darlene T. Duggan, Darlene Duggan International
Marketing Services and the Duggan International Group does not
accept liability for any loss associated with the use of any
information and any reliance is entirely at the user’s discretion.
The information compiled in this report took place in March
2017 with updates mostly in April 2017.
www.dugganinternational.ca
Duggan International Group 2017 6 | P a g e
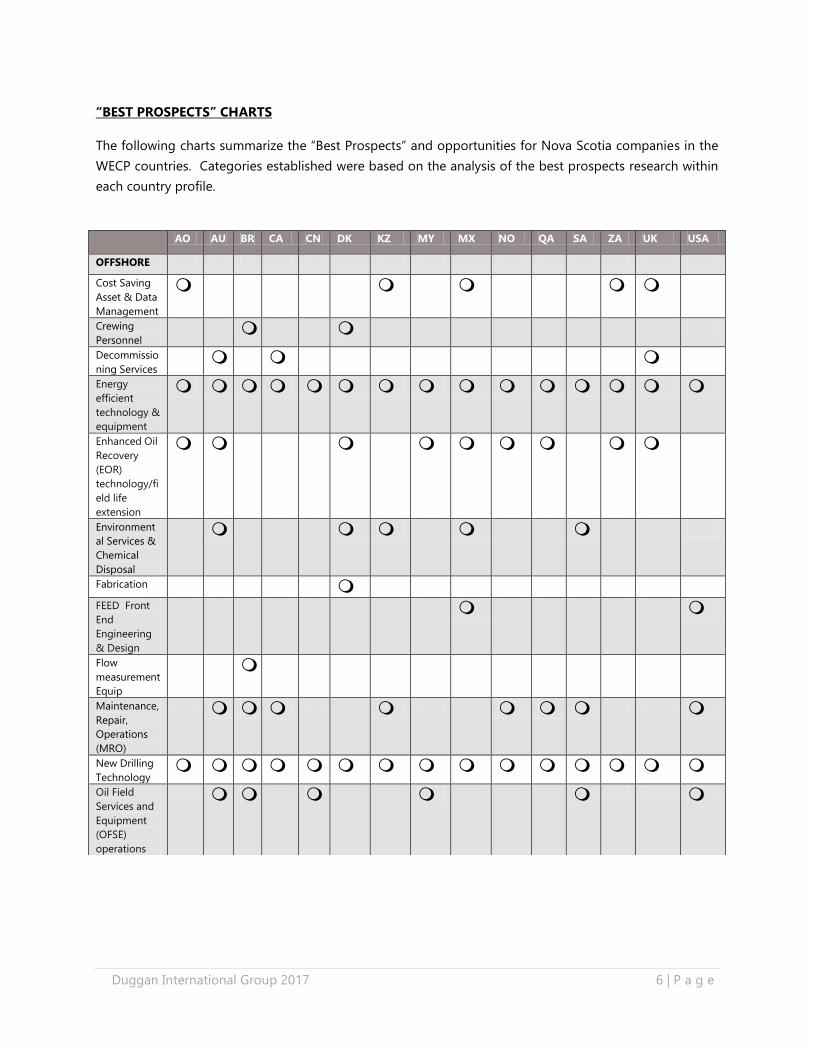
“BEST PROSPECTS” CHARTS
The following charts summarize the “Best Prospects” and opportunities for Nova Scotia companies in the
WECP countries. Categories established were based on the analysis of the best prospects research within
each country profile.
AO AU BR CA CN DK KZ MY MX NO QA SA ZA UK USA
OFFSHORE
Cost Saving
Asset & Data
Management
Crewing
Personnel
Decommissio
ning Services
Energy
efficient
technology &
equipment
Enhanced Oil
Recovery
(EOR)
technology/fi
eld life
extension
Environment
al Services &
Chemical
Disposal
Fabrication
FEED Front
End
Engineering
& Design
Flow
measurement
Equip
Maintenance,
Repair,
Operations
(MRO)
New Drilling
Technology
Oil Field
Services and
Equipment
(OFSE)
operations
Duggan International Group 2017 7 | P a g e
AO AU BR CA CN DK KZ MY MX NO QA SA ZA UK USA
OFFSHORE
Oil Spill Clean
Up
Technologies
Pipeline
Design
Process
Management
Software
Project
Management
Safety
training/ niche
education
Ship Building
Services &
Equipment
Shipping
Logistics &
Warehousing
Subsea
Engineering &
Tech
Surveys -
Seismic
Processing
and
Interpretation
Vessel
Management
Well
Abandonment
Expertise
Duggan International Group 2017 8 | P a g e
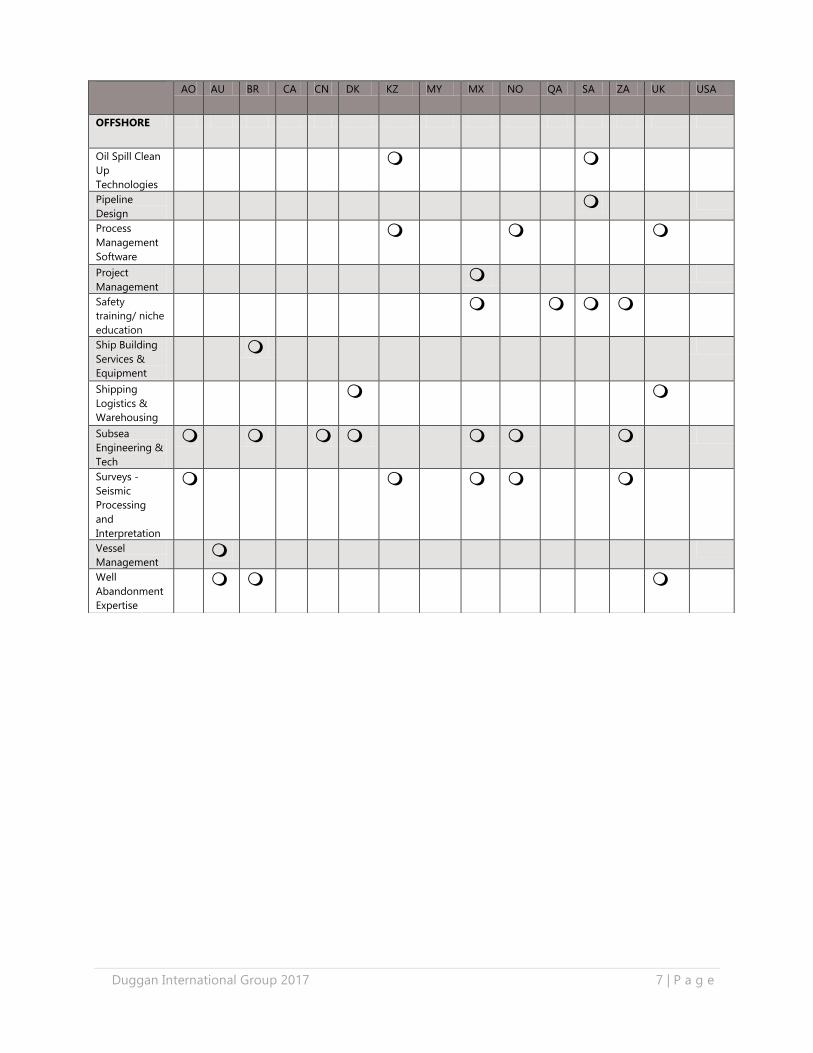
These countries are all involved with most areas of development in upstream and downstream energy.
Many of these markets are well established and have international and domestic companies dominating
the industry.
This research was conducted between March 1-18, 2017, with updates mostly in April 2017. Readers will
note that country requirements and project needs will change on a regular basis, as well as new project
announcements.
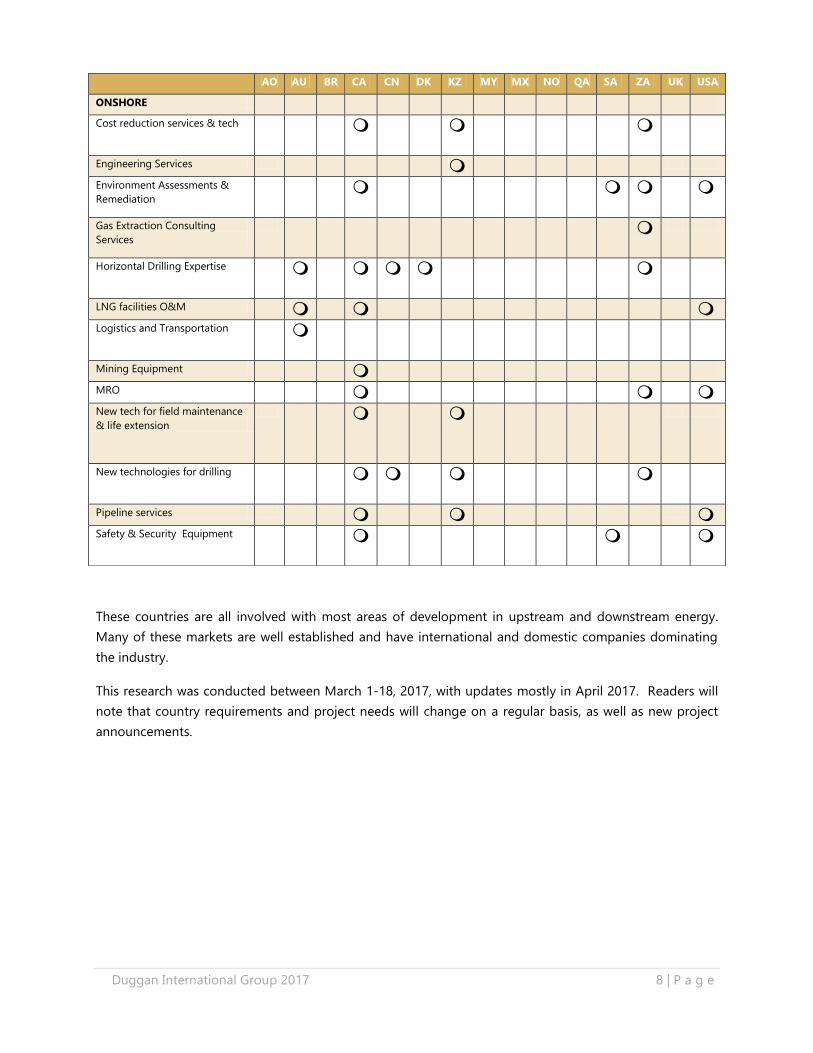
AO AU BR CA CN DK KZ MY MX NO QA SA ZA UK USA
ONSHORE
Cost reduction services & tech
Engineering Services
Environment Assessments &
Remediation
Gas Extraction Consulting
Services
Horizontal Drilling Expertise
LNG facilities O&M
Logistics and Transportation
Mining Equipment
MRO
New tech for field maintenance
& life extension
New technologies for drilling
Pipeline services
Safety & Security Equipment
Duggan International Group 2017 9 | P a g e
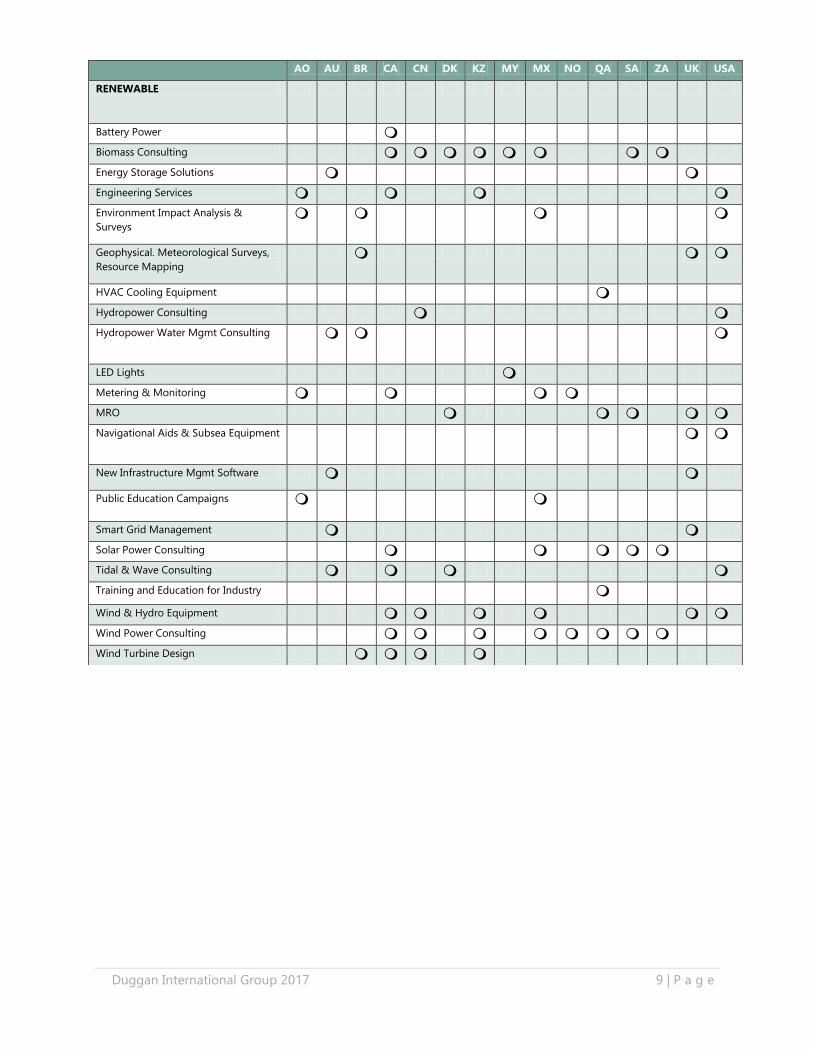
AO AU BR CA CN DK KZ MY MX NO QA SA ZA UK USA
RENEWABLE
Battery Power
Biomass Consulting
Energy Storage Solutions
Engineering Services
Environment Impact Analysis &
Surveys
Geophysical. Meteorological Surveys,
Resource Mapping
HVAC Cooling Equipment
Hydropower Consulting
Hydropower Water Mgmt Consulting
LED Lights
Metering & Monitoring
MRO
Navigational Aids & Subsea Equipment
New Infrastructure Mgmt Software
Public Education Campaigns
Smart Grid Management
Solar Power Consulting
Tidal & Wave Consulting
Training and Education for Industry
Wind & Hydro Equipment
Wind Power Consulting
Wind Turbine Design
Duggan International Group 2017 10 | P a g e
ANGOLA COUNTRY PROFILE
OVERVIEW
The economic foundation of Angola is the oil
and gas industry. The country is the second
largest oil and gas producer in the region,
making it the third largest economy in Sub-
Saharan Africa. The Angolan economy is
growing, even though resource prices have been
low and the country has halted some
development projects.
Angola’s renewable energy sector is mainly
dependent on solar power then hydropower.
The country has ambitious goals to increase
renewable energy production over the next 10
years.
Portuguese is the official language and it is
important to have this resource for doing
business. Angola achieved its independence
from Portugal in 1975, and then entered into a
civil war that ended in 2002.
COUNTRY SOURCES OF ENERGY
In 2013, the US government reported that
Angola’s energy consumption were from the
following sources: biomass 52%, oil 43%, gas 2%
and hydroelectric power 4 percent.
Angola suffers from poor infrastructure with only
20-30% of the population having access to
electricity. The system is subject to frequent
power cuts and for that reason; there is a high
dependency on oil run generators.1
The Angolan national grid currently sources 43%
of its electricity from hydropower (950 MW) and
57% from thermal (diesel) sources (1,250 MW).
Almost one-half of the country’s electric power
produced (900-1000MW) serves the capital city
Luanda.
The power framework in Angola is comprised of
three major independent grid systems. These
1 https://www.gov.uk/government/publications/exporting-
to-angola/doing-business-in-angola-angola-trade-and-
export-guide
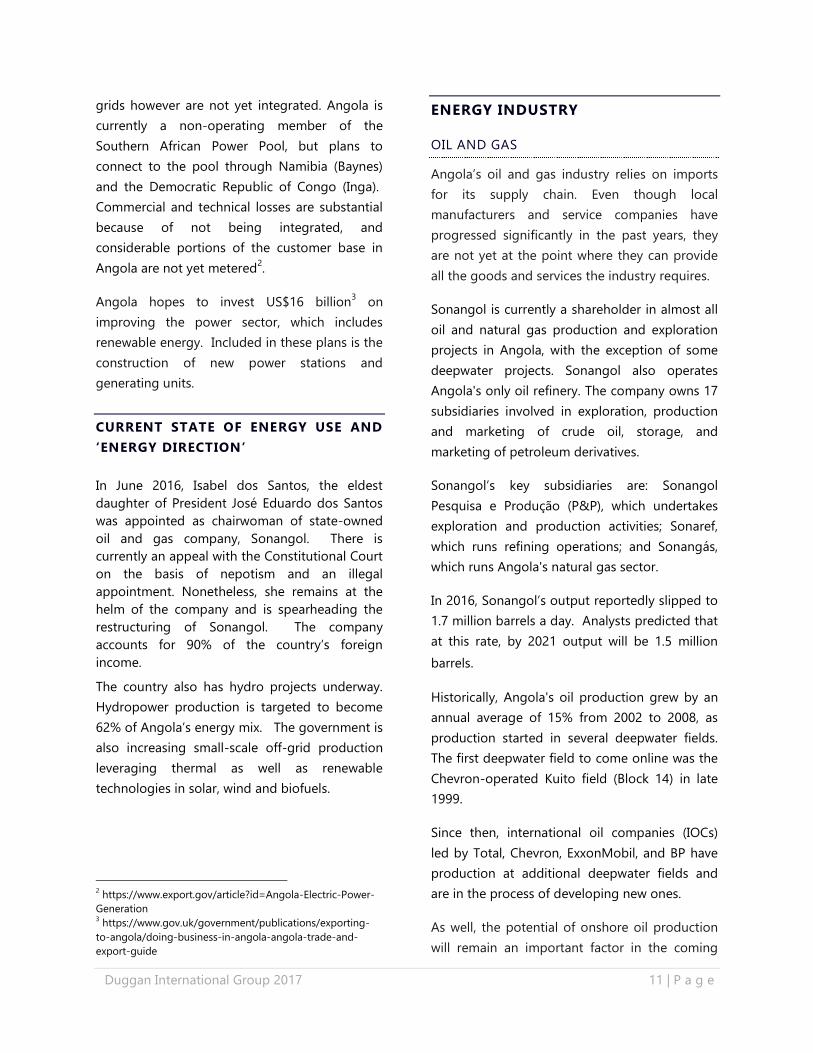
Figure 1 Source: EDC
ANGOLA
Duggan International Group 2017 11 | P a g e
grids however are not yet integrated. Angola is
currently a non-operating member of the
Southern African Power Pool, but plans to
connect to the pool through Namibia (Baynes)
and the Democratic Republic of Congo (Inga).
Commercial and technical losses are substantial
because of not being integrated, and
considerable portions of the customer base in
Angola are not yet metered2.
Angola hopes to invest US$16 billion3 on
improving the power sector, which includes
renewable energy. Included in these plans is the
construction of new power stations and
generating units.
CURRENT STATE OF ENERGY USE AND
‘ENERGY DIRECTION’
In June 2016, Isabel dos Santos, the eldest
daughter of President José Eduardo dos Santos
was appointed as chairwoman of state-owned
oil and gas company, Sonangol. There is
currently an appeal with the Constitutional Court
on the basis of nepotism and an illegal
appointment. Nonetheless, she remains at the
helm of the company and is spearheading the
restructuring of Sonangol. The company
accounts for 90% of the country’s foreign
income.
The country also has hydro projects underway.
Hydropower production is targeted to become
62% of Angola’s energy mix. The government is
also increasing small-scale off-grid production
leveraging thermal as well as renewable
technologies in solar, wind and biofuels.
2 https://www.export.gov/article?id=Angola-Electric-Power-
Generation 3 https://www.gov.uk/government/publications/exporting-
to-angola/doing-business-in-angola-angola-trade-and-
export-guide
ENERGY INDUSTRY
OIL AND GAS
Angola’s oil and gas industry relies on imports
for its supply chain. Even though local
manufacturers and service companies have
progressed significantly in the past years, they
are not yet at the point where they can provide
all the goods and services the industry requires.
Sonangol is currently a shareholder in almost all
oil and natural gas production and exploration
projects in Angola, with the exception of some
deepwater projects. Sonangol also operates
Angola's only oil refinery. The company owns 17
subsidiaries involved in exploration, production
and marketing of crude oil, storage, and
marketing of petroleum derivatives.
Sonangol’s key subsidiaries are: Sonangol
Pesquisa e Produção (P&P), which undertakes
exploration and production activities; Sonaref,
which runs refining operations; and Sonangás,
which runs Angola's natural gas sector.
In 2016, Sonangol’s output reportedly slipped to
1.7 million barrels a day. Analysts predicted that
at this rate, by 2021 output will be 1.5 million
barrels.
Historically, Angola's oil production grew by an
annual average of 15% from 2002 to 2008, as
production started in several deepwater fields.
The first deepwater field to come online was the
Chevron-operated Kuito field (Block 14) in late
1999.
Since then, international oil companies (IOCs)
led by Total, Chevron, ExxonMobil, and BP have
production at additional deepwater fields and
are in the process of developing new ones.
As well, the potential of onshore oil production
will remain an important factor in the coming
Duggan International Group 2017 12 | P a g e
years. Many local operators are in the onshore.
Ten blocks were auctioned off with seven
located in the Kwanza Basin and the remainder
in the Lower Congo Basin.
Natural Gas
Angola currently produces small quantities of
marketed natural gas, but the vast majority of
the country's gross production is flared (burned
off) or re-injected into oil wells.
In June 2013, Angola exported its first cargo of
liquefied natural gas (LNG) to Brazil from its new
LNG plant, the Combined Cycle Power Plant, in
Soyo. The plant, often referred to just as “Soyo”,
was fully fed with associated gas, a released
byproduct during oil production. Unfortunately,
due to chronic technical issues, the plant shut
down a year later. It is expected to reopen in
2017 (reports also had it opening in 2016). This
plant will include several substations and
transmission lines. It will produce 750
megawatts of electricity, giving it the ability to
supply much of the country’s energy
requirements. 4
Other recent developments:
According to consultants Rystad Energy, the gas
discovery in Angola’s offshore Kwanza basin
won’t be developed before the end of the next
decade. Sonangol had revealed the find in June
2016 and announced that the discovery in Block
20/11 held an estimated 313 million barrels of
condensate and 2.8 trillion cubic feet of gas.
The reason for the delay in the development of
this discovery is partially due to problems
surrounding the ownership of the block. Cobalt
International Energy operated stake in Blocks 20
4 http://www.macauhub.com.mo/en/2016/03/23/combined-
cycle-power-plant-project-in-soyo-angola-expected-to-cost-
us900-million/
and 21 and tried to sell the blocks to Sonangol.
The deal was eventually terminated due to the
fall in oil prices and Sonangol’s failed attempt to
restructure ownership of some other properties.
Development plans for Block 20 are also
dependent on existing sales agreements. Much
larger and developed projects in Eastern Africa,
Eastern Mediterranean and Mauritania/Senegal
have pushed the infrastructural challenged
Angola to the end of the queue for
commercialization.
Cobalt Energy International (CIE) also has
successful finds at blocks: Cameia, Mavinga and
Bicuar in Block 21 and Orca and Lontra in Block
20.
PROJECTS
Several oil projects are scheduled to start
production in Angola, but the start dates may
depend on the current oil price environment.
The latest projects to come online were the
CLOV (Cravo, Lirio, Orquidea, and Violeta), the
West Hub development, the Kizomba Satellites
Phase 2, and the Lianzi field. CLOV, operated by
Total, started commercial production in June
2014. CLOV’s production capacity is 160,000 b/d.
The West Hub development, operated
by Eni, started commercial production in
December 2014. The West Hub’s
production capacity is 100,000 b/d. The
Kizomba Satellites Phase 2, operated by
a subsidiary of ExxonMobil, started
production in May 2015. The project
included the development of the
Kakocha, Bavuca, and Mondo South
fields with a total capacity of 70,000 b/d.
The Lianzi field, operated by Chevron,
started production in November 2015
and is expected to reach 40,000 b/d. The
Lizani field is located in an offshore zone
between Angola and the Republic of
Duggan International Group 2017 13 | P a g e
Congo (Brazzaville). It is the first cross-
border development of its kind in the
region.
Angola has at least eight offshore and
deepwater oil projects projected to come online
within the next 5 to 10 years. Of those planned
projects, three have received a final investment
decision (FID) to develop the project.
GOVERNMENT REGULATIONS AND
POLICIES
The Angolan Ministry of Petroleum and the
National Oil Company (Sonangol) are the
agencies in charge of implementing the
Angolanization Plan (the employment of the
people of Angola). Each agency has a dedicated
directorate dealing with local content. The
Ministry of Petroleum is in charge of regulation
of the oil and gas industry. Sonangol acts as the
implementation agency for the Ministry. The
independence of Sonangol has been questioned
by many industry players for potential conflict of
interest since they are partners in the petroleum
agreements and congruently performing a
regulatory function.
Sonagás is tasked with the exploration,
evaluation, production, storage, and transport of
Angola's natural gas and natural gas derivatives.
Sonangás is working with Sonangol P&P to
establish a regulatory environment, including
taxation, to help spur research and development
in the natural gas sector.
Portuguese equipment and service provider
Efacec Power Solutions, manufacturer of
transformers and high tension equipment, holds
a growing role in the Angolan power market. In
2015 the Angolan Electricity Distribution
Company (ENDE) in a consortium with Angolan
company Winterfell acquired a 65% share of
Efacec Power Solutions.
The Angolization Policy for preferential
treatment was passed by the National Assembly
in 2003. Preferential treatment must be given to
national private companies in the petroleum
sector. IOCs operating in Angola are supposed
to have a 70% Angolan workforce. Logistics and
catering workers are also covered under this
policy.
Additionally, IOCs are required to use Angolan
banks for all their transactions.
MAJOR COMPANIES
Chevron
Exxon Mobil
BP
Sonangol
Leading players in Angola’s energy sector
include engineering and construction firms from:
Portugal (Mota- Engil, Empreiteiros
Casais, Edifer)
Brazil (Odebrecht and Andrade
Gutierres)
China (China Genhouba Group Corp,
China Machinery Engineering
Corporation)
Angolan companies (OPAIA, Ambergol)
To facilitate the engagement of local suppliers in
any bidding process, the Ministry of Industry
annually publishes a list of domestic suppliers of
goods used in oil activities, and the Chamber of
Commerce and Industry publishes a list of
service providers contracted by oil operators
(Ministry of Petroleum 2003).
http://www.angolachamber.org/
Some local companies include Test Angola,
Prodiaman, Paragon Angola, Grupo Mieres Oil
and Gas Consultants, and Angola LNG.
Duggan International Group 2017 14 | P a g e
Lastly, IOCs are expected to fund training
programs by providing US$200,000 per year per
block during the exploration phase of their
operations and $0.15 per barrel of oil during the
production phase. These expenses are tax
deductible.
Local content regulations are designed to
improve the technical and financial capacity of
Sonangol, its subsidiaries, and the people of
Angola. Noncompliance by IOCs could result in
cancellation of the IOC’s contract. In addition,
the Ministry of Petroleum could impose
monetary fines for every percentage point
missed from the target.
CERTIFICATION AND STANDARDS
There are no particular certifications for working
in Angola other than normal offshore and
onshore safety training and certification required
in other countries.
WORKING IN ANGOLA
Market Strengths:
The economy has had an average
double-digit growth since 1990
A growing middle class
A young population (50% under 21) who
are eager to learn
Abundant natural resources
The legal system in Angola is reputedly weak
and fragmented. It is based on the Portuguese
and Customary Law System. Understanding the
system is difficult and laws change on a regular
basis.
Market Challenges:
Poor power supply nationwide
Weak infrastructures across most
sectors
Government bureaucracy when
awarding and paying for contracts
Corruption
High unemployment
Lack of skills amongst the populace
A non-resident employee can only enter into
employment agreements with a minimum term
of three months and a maximum of 36 months.
Foreign non-resident employees (expatriates)
may only be hired when Angolan employees,
with comparable qualifications and experience,
are unavailable. Foreign non-resident
individuals who go to Angola to work under the
employment of a third party are legally required
to secure a work visa prior to the
commencement of work. Canadians must
present a passport to visit Angola, which must
be valid for at least six months beyond the date
of expected departure. Whether visiting or
working, Canadians must obtain a visa while still
in Canada. The visa requires a criminal clearance
and must be submitted in both English and
Portuguese. The Portuguese copy must be
notarized.
OPPORTUNITIES FOR NOVA SCOTIA
EXPORTERS
Angola is responsible for coordinating energy
policy for the Southern African Development
Coordination Conference (SADCC) and SADCC’s
energy secretariat is based in World Energy City
Partnership member Luanda.
Opportunities for Nova Scotia companies
include exporting in the supply chain for:
Oil and gas supplies
Generation infrastructure, mainly
based on water resources and natural
gas
Duggan International Group 2017 15 | P a g e
Renewable energy technologies
Implementing energy metering and
monitoring systems
Categories with fewer than 50% of Angolan
workers could present opportunities for Nova
Scotia.
Best Prospects:
Marine operations – downstream
Subsea Engineering
Surveying
IMPACTS DUE TO THE VOLATILITY
IN OIL PRICES
In 2014, a sharp drop in government revenues
sent Angola’s currency into a free-fall, losing
nearly 40% of its value until March 2016. In
February 2016, inflation soared to a five-year
high of just more than 20 percent.
Angola depends largely on the off-shore
petroleum industry for 50% of GDP and 75% of
government revenues. The economy is
projected to begin a recovery in 2017, according
to the IMF.
Also affected was the purchasing power of
companies. With the weakened currency,
companies were limited to what they could
afford to import and to pay salaries.5
However, despite the drop in global oil prices,
projects that are past the FID stage will not be
canceled because the procurement and
construction phase has already started.6 What
this means, is that project start times could be
delayed if global crude oil prices remain low.
Several of Angola’s deepwater fields are past
their peak production. The new capacity
5 http://www.howwemadeitinafrica.com/risk-and-reward/
6 US Energy Information Administration
additions from the upcoming projects are more
likely to sustain Angola’s crude oil production at,
or slightly above, current levels over the medium
term rather than provide a substantial boost.
On the brighter side, Angola’s hydrocarbons
industry, gas production and onshore
development remain full of potential, with room
for growth and expansion. Though current
circumstances in the oil and gas industry are not
optimal, attractive investment opportunities are
still there.7
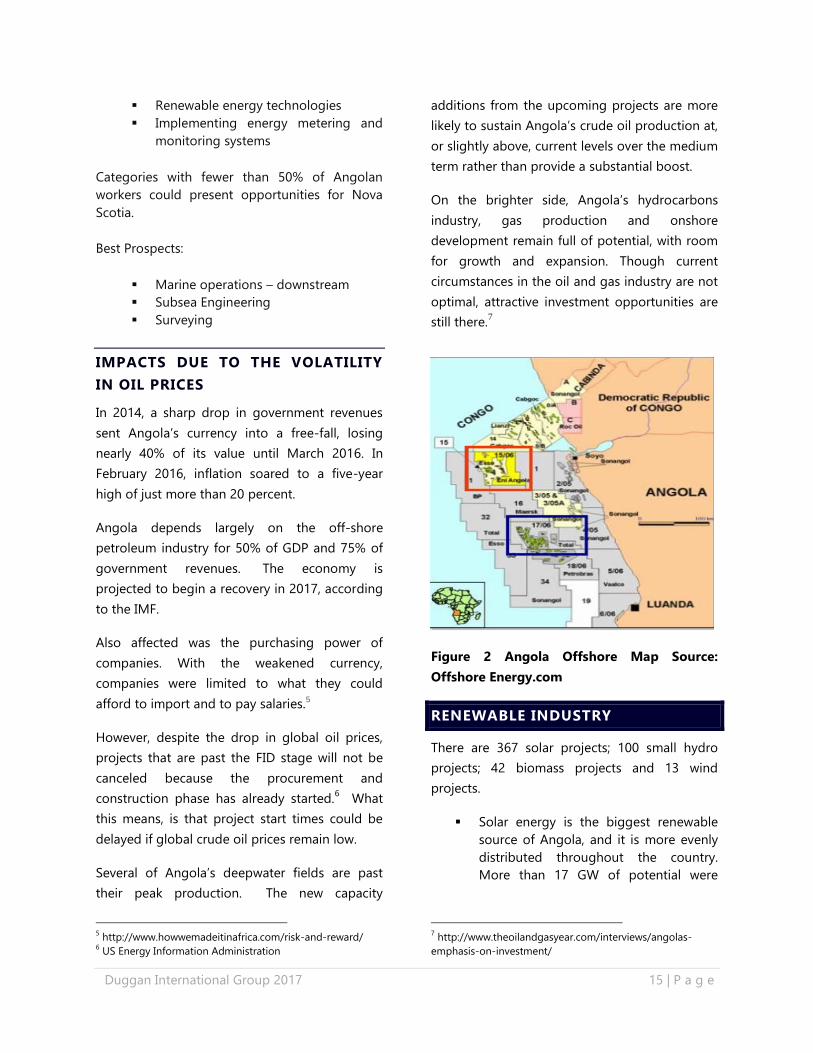
Figure 2 Angola Offshore Map Source:
Offshore Energy.com
RENEWABLE INDUSTRY
There are 367 solar projects; 100 small hydro
projects; 42 biomass projects and 13 wind
projects.
Solar energy is the biggest renewable
source of Angola, and it is more evenly
distributed throughout the country.
More than 17 GW of potential were
7 http://www.theoilandgasyear.com/interviews/angolas-
emphasis-on-investment/
Duggan International Group 2017 16 | P a g e
mapped and studied, corresponding to
more than 360 solar projects.
Hydropower is reportedly the most
competitive energy, with small hydro
projects presenting cost of energy from
20 USD/MWh. From an overall potential
of 18GW, 600MW of small hydro
studied.
Biomass projects, with total projects
potential of more than 1.5 GW, have
higher energy costs, starting at 75
USD/MWh, but biomass has high
benefits in local job creation, particularly
related to the process of extraction and
management of biomass forest.
Angola is also using municipal solid
waste to produce energy in major urban
areas.
Wind power is not as prevalent in
Angola as other WECP countries. It has
about 600 MW of projects with good
potential and competitive energy costs.
The government announced that natural
gas is targeted to meet 21% of Angola’s
energy demand by 2025. Mapping
studies completed by the Ministry of
Energy and Water in June 2014
identified potential for 55GW solar
power, 3GW wind power and 18GW in
hydropower throughout the country.
Company Involvement
Andritz, an Austrian company, was awarded a
contract to supply electromechanical equipment
for the 2.1 GW Lauca hydropower plant in
Angola.
The Chinese government financing to Angola
includes a US$980 million for the 750MW
thermal combined cycle plant under
construction in Soyo with construction led by
China Machinery Engineering Corporation
(CMEC) and a pending $4.5 billion loan to fund
the Caculo Cabaça hydropower project.
GE is also providing substantial power
production equipment for the Soyo project.
The Brazilian Development Bank (BNDES)
finances many of the Brazilian goods and
services used at the Laúca hydroelectric dam
with Brazilian construction firm Odebrecht as the
primary contractor. Meanwhile, the US$100
million rehabilitation and expansion of the
Cambambe hydroelectric dam is being financed
by a commercial banking syndicate.
Other companies include Vestas, SGS Angola
Lda., Mactech UK, EREDA, Solar Turbines
(Caterpillar).
OPPORTUNITIES FOR NOVA SCOTIA
EXPORTERS
Best Prospects:
Monitoring systems for energy efficiency
Development of awareness and
educational campaigns
Impact analysis studies
Metering systems
Engineering and research
GOVERNMENT POLICIES/REGULATIONS
THAT ENCOURAGE SUSTAINABLE
TECHNOLOGIES
NATIONAL RENEWABLE ENERGY STRATEGY
The Strategy’s objective is to achieve universal
access to electricity options that include
renewable energy source and a reduction of
production of costs. The Ministry of Energy and
Water (MINEA), is responsible for overseeing the
implementation of the strategy. The government
Duggan International Group 2017 17 | P a g e
sees universal access to sustainable energy as
key to the reduction of poverty in rural areas.
Goals include:
Increase the national electrification rate
by around 60% by 2025
Increase installed production capacity by
9.900MW by 2025 using 66% water
sources, 19% natural gas sources, 8%
renewable energies, and 7% thermal
energy
The National Development Plan and the Action
Plan8 for the sector recognized that it is critical
that priorities and key projects be defined for a
2018-2025 timeframe. The Plan aims to keep in
line with the goals and aspirations of Angola
Strategy 2025 and the Electric Sector
Transformation Process (PTSE).
The 2025 vision for the power sector is based
upon the goal of meeting the country’s needs. A
strong growth of energy consumption is
anticipated up until 2025, reaching a load of 7.2
GW, more than four times the present. This
growth will result mainly from bringing power to
60% of the population, from the increase in
residential consumption, growth of national
wealth through the services sector and from the
country’s industrialization.
FUNDING INCENTIVES
Sonangol is mandated to grant local companies
fiscal incentives including the exemption from or
reduction of industrial, income, import, and
other taxes; financial support in the form of
subsidies, loans, promotional venture capital,
access to agreed private management funds,
and financial guarantees; and technical support
and special rights privileges in awarding
8 http://www.embangola-
can.org/en/national_development_plan.html
concessions. Nova Scotia firms would have to
joint venture with a local firm to access any of
these incentives.
Angola’s investment law gives foreign and
domestic investors equal access to investment
incentives. Incentives for such high-priority
sectors as energy and water include exemption
from industrial and capital gains taxes for up to
15 years and from customs duties for up to six
years.
Many foreign companies now operating in
Angola enjoy some form of tax or duty waiver.
Companies need to apply for incentives when
submitting an investment application to the
Angolan Private National Investment Agency,
ANIP.9
Other funding could be obtained by applying to
the international banks. Development banks and
countries have loaned money to Angola for
renewable projects.
The African Development Bank’s (AfDB) US$1
billion loan to the Angolan government supports
Angola’s power sector restructuring process
while providing technical assistance and
capacity-building support. The loan focuses on
enhancing power sector efficiency, fostering
private sector investment especially in renewable
energy, and improving public financial
management transparency and procurement
reform. To assist in implementation of the
Electricity Law (June 2015) that allows for
independent power production (IPPs), AfDB is
now supporting the Ministry of Energy and
Water and IRSE in establishing a regulatory
framework to encourage private investments in
Angola. No specific power production or
9 http://www.howwemadeitinafrica.com/angola-business-
and-investment-climate-overview/
Duggan International Group 2017 18 | P a g e
transmission projects are being funded by the
AfDB.
To support power generation capacity
throughout Sub-Saharan Africa, the U.S.
Government launched the Power Africa initiative
to leverage private sector and government
resources to increase power generation in the
region by 30,000 megawatts (MW). U.S.
Government agencies including US Export-
Import Bank, Overseas Private Investment
Corporation, and US Trade and Development
Agency are active players in Power Africa and
prioritize energy-related project support in
Africa. Details are available at:
www.usaid.gov/powerafrica.
Funding is available to companies through other
sources:
The Renewable Energy Performance
Platform (REPP)
Global Climate Partnership Fund (GCPF)
Impact Assets Emerging Markets Climate
Fund
For full fund descriptions:
https://www.africa-eu-renewables.org/funding-
database-2/
Some of the funds are through European
governments and/or managed by trade
associations. Nova Scotia companies may need
to partner with a European company for a better
likelihood of success for obtaining support.
NOTES:
OTHER SOURCES OF INFORMATION
KPMG
https://assets.kpmg.com/content/dam/kpmg/pd
f/2014/09/taxes-incentives-renewable-energy-
v1.pdf
US Energy Information Administration EIA,
https://www.eia.gov/
Angolan Lawyers Appeal Ruling On President
Naming Daughter Oil CEO, January 04, 2017,
Reuteurs news service
http://in.reuters.com/article/angola-politics-
idINL5N1EU0X3
Analyst: Angolan Gas Discovery Has At Least
Decade Before it Comes Online, December 2016
http://www.rigzone.com/news/oil_gas/a/147388/
analyst_angolan_gas_discovery_has_at_least_dec
ade_before_it_comes_online
Angola Energy 2025,
http://www.angolaenergia2025.com/en/conteud
o/renewable-projects
Otavio Veras, Angola is diversifying from oil,
November 2016,
http://www.howwemadeitinafrica.com/angola-
diversifying-oil/
UK Department of International Trade
https://www.gov.uk/government/publications/ex
porting-to-angola/doing-business-in-angola-
angola-trade-and-export-guide
Duggan International Group 2017 19 | P a g e
AUSTRALIA COUNTRY PROFILE
OVERVIEW
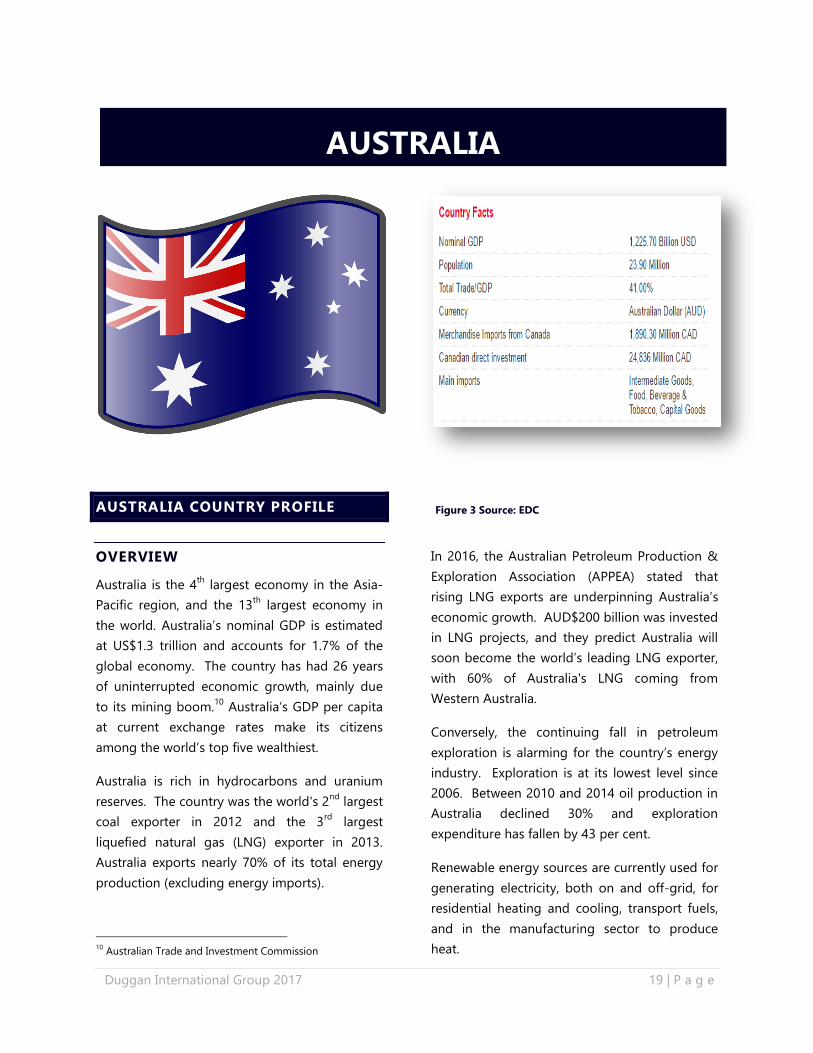
Australia is the 4th
largest economy in the Asia-
Pacific region, and the 13th
largest economy in
the world. Australia’s nominal GDP is estimated
at US$1.3 trillion and accounts for 1.7% of the
global economy. The country has had 26 years
of uninterrupted economic growth, mainly due
to its mining boom.10
Australia’s GDP per capita
at current exchange rates make its citizens
among the world’s top five wealthiest.
Australia is rich in hydrocarbons and uranium
reserves. The country was the world's 2nd
largest
coal exporter in 2012 and the 3rd
largest
liquefied natural gas (LNG) exporter in 2013.
Australia exports nearly 70% of its total energy
production (excluding energy imports).
10
Australian Trade and Investment Commission
In 2016, the Australian Petroleum Production &
Exploration Association (APPEA) stated that
rising LNG exports are underpinning Australia’s
economic growth. AUD$200 billion was invested
in LNG projects, and they predict Australia will
soon become the world’s leading LNG exporter,
with 60% of Australia's LNG coming from
Western Australia.
Conversely, the continuing fall in petroleum
exploration is alarming for the country’s energy
industry. Exploration is at its lowest level since
2006. Between 2010 and 2014 oil production in
Australia declined 30% and exploration
expenditure has fallen by 43 per cent.
Renewable energy sources are currently used for
generating electricity, both on and off-grid, for
residential heating and cooling, transport fuels,
and in the manufacturing sector to produce
heat.
AUSTRALIA
CHINA
Figure 3 Source: EDC
Duggan International Group 2017 20 | P a g e
COUNTRY SOURCES OF ENERGY
Oil remained the largest primary energy source
in Australia, at 38% in 2014–15, followed by coal
(32%) and natural gas (24%). Renewables
accounted for 6% of Australia’s energy mix.11
Total electricity generation was 252 terawatt
hours (908 petajoules) in 2014–15, below the
peak of 254 terawatt hours in 2010–11.
Renewable energy accounted for 14% of
Australia’s total electricity generation in 2014–
15, and is forecast to increase to 20% by 2034–
35.
Most of the growth in energy use was for
electricity generation, reflecting increased
demand for electricity and a switch towards coal.
CURRENT STATE OF ENERGY USE AND
‘ENERGY DIRECTION’
The growth in energy consumption in Australia
has generally remained below the rate of
economic growth over the last 30 years. This can
mainly be attributed to a shift in the economy
towards less energy-intensive sectors.
Hydropower fell by 27% because lack of
available water. Wind and solar continued to
grow, with wind now one-third of renewable
generation in Australia and one-third of total
generation in South Australia.
Coal remained the major fuel source for
electricity generation in 2014–15, with its share
in the fuel mix increasing to 63%, up from 61%
in 2013– 14. Imports of oil increased with 85%
of refinery feedstock from imports.
The Australian government published the Energy
White Paper in 2012. It outlined a policy to
11
https://industry.gov.au/Office-of-the-Chief-
Economist/Publications/Documents/aes/2015-australian-
energy-statistics.pdf
balance securing domestic energy at affordable
prices and increase exports to help supply Asia's
growing demand for fuel. Both of these paths
involve developing more energy infrastructure,
attracting greater investment, creating efficient
energy markets and pricing mechanisms for
consumers, and delivering cleaner and more
sustainable energy.
However, Australia's expanding energy industry
has encountered escalating project costs and a
labour shortage. Adding to this, many oil and
gas companies have recently suspended
offshore exploration. These factors are coupled
with a bigger push for clean energy and stricter
environmental regulations.
In 2016, industry and government met to discuss
the future of the energy industry. Industry
implored that government urgently needs to
encourage investment to address gas supply
challenges that are forecasted to occur between
2018 and 2024. The Australian Energy Market
Operator highlighted that gas-fired generation
must stay in the energy mix to protect the
country’s energy security.12
From this meeting,
gas producers agreed to make more gas
available to the domestic market as soon as
possible to keep downward pressure on prices.
Producers committed to revise their domestic
gas production forecasts, and two of the
country’s LNG exporters gave a commitment to
domestic gas contributions, as part of their
social licence. Lastly, to monitor and report on
the progress of the industry’s and government
actions, the government is establishing a multi
departmental taskforce.
12
ttps://www.appea.com.au/media_release/gas-industry-to-
ensure-supply/
Duggan International Group 2017 21 | P a g e
ENERGY INDUSTRY
OIL AND GAS
In 2017, the results from the latest rounds of
bidding for offshore petroleum exploration in
2016 confirmed a deepening problem for
Australia; there was only one bid, and that
offshore exploration is in dire straits, even if the
commodity prices are stronger. APPEA
recommended that government get rid of
unnecessary regulatory costs and time delays.
APPEA implored that it is essential to maintain a
stable, attractive policy environment in key areas
such as tax and environmental regulation.13
Australia held more than 1.2 billion barrels of
proved oil reserves as 2016. Geoscience
Australia reported economic reserves of nearly
3.8 billion barrels, composed of 0.9 billion
barrels crude oil, 1.9 billion barrels condensates,
and 0.9 billion liquid petroleum gas (LPG). Most
Australian crude oil is a light, sweet grade,
typically low in sulfur and wax, and therefore
higher in value than the heavier crudes.
The majority of reserves are located off the
coasts of the states of Western Australia,
Victoria, and the Northern Territory. Onshore
basins, mostly found in the Cooper Basin,
account for only 5% of the oil resources.
Western Australia (including the Bonaparte Basin
straddling Western Australia and Northern
Territory) has 72% of the country's proved crude
oil reserves, as well as 92% of its condensate and
79% of its LPG reserves. The two largest oil-
producing basins are the Carnarvon Basin in
Northwestern Australia and the Gippsland Basin
in Southeastern Australia.
13 https://www.appea.com.au/media_release/disturbing-
exploration-decline-continues/
International oil companies dominate the
country’s oil and natural gas exploration and
development. Chevron is the largest foreign oil
producer, supplying 96,000 barrels per day
(bbl/d) in 2013. Other international oil
companies actively investing in Australia's
upstream hydrocarbon developments include
Shell, ExxonMobil, ConocoPhillips, Inpex (Japan),
Total, BHP Billiton, and Quadrant Energy.
There are Australian companies as well, the
largest being Woodside Petroleum and Santos.
These companies focus on upstream oil and gas
developments. Other smaller domestic players in
both the upstream and downstream markets
include Origin Energy and Beach Energy.
The final round of the 2016 Offshore Petroleum
Exploration Acreage Release closed on March
23, 2017. The cash-bid auction was re-
introduced in Australia in 2014 but hasn't until
now resulted in any cash-bid permits being
awarded. This latest cash-bid auction was held in
February 2017. Two companies prequalified for
the auction. As stated, at the close of the auction
only one bid was received by Chevron Australia
New Ventures.14
The remaining cash bid
awarded to Chevron for AUD$3M.
Awarding the cash bid permit was to show that
Australia remains an attractive petroleum
exploration investment destination, outside of
the traditional acreage release process. The cash
bidding process is focused on mature areas
where only minimal further exploration may be
required.
The recent unfavorable economics have
pressured refinery operators to close several
14 http://www.oedigital.com/component/k2/item/14731-
chevron-picks-up-new-australian-exploration-permit
Duggan International Group 2017 22 | P a g e
facilities and convert some of them to oil
product import terminals. Australia has four
remaining oil refineries which are small and
dated compared to the larger and more complex
refineries being built in Asia. These refineries,
Lytton Caltex, Altone Mobil Geelong Vitol,
Kwinana BP, have a total capacity of 453,000
bbls/day.
Shell announced the closure of Sydney's Clyde
refinery in 2011, and Caltex did the same with its
Sydney's Kurnell refinery a year later. When BP
announced the closure of Queensland's Bulwer
Island refinery in April 2014, Australia had
slashed 42% of its refining capacity in the space
in three years. Shell sold its Geelong refinery to
oil trading company Vitol in 2014. Overall, these
refinery closures represent about half of the
capacity in operation a decade ago, and these
closures have lead to increases in the country's
petroleum product imports, particularly for
diesel, gasoline, and jet fuel.
Natural Gas
Australia has become a leading LNG exporter to
the Asia-Pacific region in the past decade.
Greater than expected natural gas production
and new LNG capacity in the next few years is
also likely to boost natural gas exports. Natural
gas production rose by 5% in 2014–15 to 2,607
petajoules (66 billion cubic metres). Western
Australia remained Australia’s largest producer
of natural gas, producing nearly two-thirds of
total gas production in 2014–15. Production of
coal seam gas increased by 50% in 2014–15, to
reach 462 petajoules (12 billion cubic metres), as
new wells were drilled in Queensland to support
the start of LNG exports from Gladstone.
However, the country has restrictions to onshore
gas exploration. There is currently a total ban in
Victoria, as four applications for gas production
in NSW remains under consideration since 2010.
Coal Bed Methane (CBM)
Australia has sizeable, untapped natural gas
resources in the form of coalbed methane
(CBM), known as coal seam gas in Australia.
Australian officials estimate that economically
recoverable CBM reserves in 2012 were 33 Tcf.
Coal seam gas accounted for 18% of Australian
gas production on an energy content basis, and
nearly half of east coast gas production.
Many CBM projects are still being explored, and
production is not targeted for another few years.
Investors face challenges with project delays
based on greater public resistance to potential
environmental impacts. Australia is attempting
to balance its dual interests of increasing
investment and exploitation of these resources
as well as developing them in a sustainable and
environmentally safe way.
NSW, Queensland, and the federal government
have increased environmental regulations,
particularly those related to water use and
disposal and land rights in CBM and shale gas
projects. Queensland established more austere
water safety and management policies for CBM
producers. In 2012, NSW replaced the
moratorium it imposed in 2011 on hydraulic
fracturing with a Strategic Regional Land Use
Policy that restricts CBM production near
residential areas and small industries.
Shale Gas
Shale gas reserves in Australia are vast and could
boost gas production. Australia has reportedly
437 Tcf of technically recoverable reserves,
ranking the country 6th
in the world. Shale
extraction has attracted many international oil
companies with financing and technical
Duggan International Group 2017 23 | P a g e
capacities to develop the shale reserve. The
shale gas sector is very much however in its
infancy with a series of technical and geological
challenges impacting the viability of production.
Coal
Australia is the world's 2nd
largest coal exporter,
on a weight-basis, and coal ranks as the 2nd
largest export commodity for Australia in terms
of revenues. Black coal production increased by
4% in 2014–15 to reach 12,288 petajoules (447
million tonnes). After two years of decline,
brown coal production increased in 2014–15, by
8% to 678 petajoules (65 million tonnes).
Increased demand for brown coal fired electricity
is due to the significant fall in hydropower.
The majority of Australia's coal production
comes from open pit operations, with the
remainder coming from underground mines.
International companies such as BHP Billiton,
Anglo American (UK), Rio Tinto (Australia-UK),
and Xstrata (Switzerland) play a significant role
in Australia's coal industry.
PROJECTS
Japan's biggest oil and gas explorer
Inpex Corp is moving forward with its
plan to contract a huge LNG export
plant in July-September 2017 called
Ichthys. There was trouble over the
completion of a power station and the
Ichthys project was dealt a blow as
engineering firm CIMIC - involved in
building the facility's power station -
announced it was pulling the plug. That
led to many production delays.
Senex Energy Ltd has lined up private
equity firm EIG Global Energy Partners
to provide up to AUD$300 million to
back a coal seam gas project. Australia's
eastern states face a gas crunch. And
from 2018, demand is set to triple to
feed LNG exports, while supply growth
has been curbed by states opposed to
onshore drilling.
Chevron Corp temporarily halted output
from one of the two production units at
its Gorgon LNG plant off Australia's west
coast. It marks the latest in a string of
outages to hit the AUD$54 billion
project since it started up in March 2016.
On March 28, 2017 Chevron started
production from the third Gorgon gas
train. Previously on December 9, 2016
Chevron announced an initial 150Tj/d of
domestic gas commenced with a
planned capacity of 300 Tj/d as demand
increases.
In February 2017 Chevron picked up a
new exploration permit in a gas-rich part
of the Carnarvon Basin, offshore
Western Australia. Chevron paid AUD$3
million for the cash bid permit WA-526-
P for six years.
Mitra Energy Inc. has confirmed that
Jadestone Energy (Australia) Pty Ltd, a
wholly owned subsidiary of Mitra, has
closed the acquisition of the Stag
oilfield, located offshore Western
Australia. The Stag oilfield, which is
situated in the Carnarvon Basin, has a
production rate of around 3,468 barrels
per day. This figure is expected to
increase on the completion of two
workovers planned as well as further
increases with the infill wells.
In 2016, BP Plc abandoned plans to drill
for oil and gas off the south coast of
Australia, saying it can get better value
for its exploration spending elsewhere,
although it still sees strong potential in
the Great Australian Bight.
Duggan International Group 2017 24 | P a g e
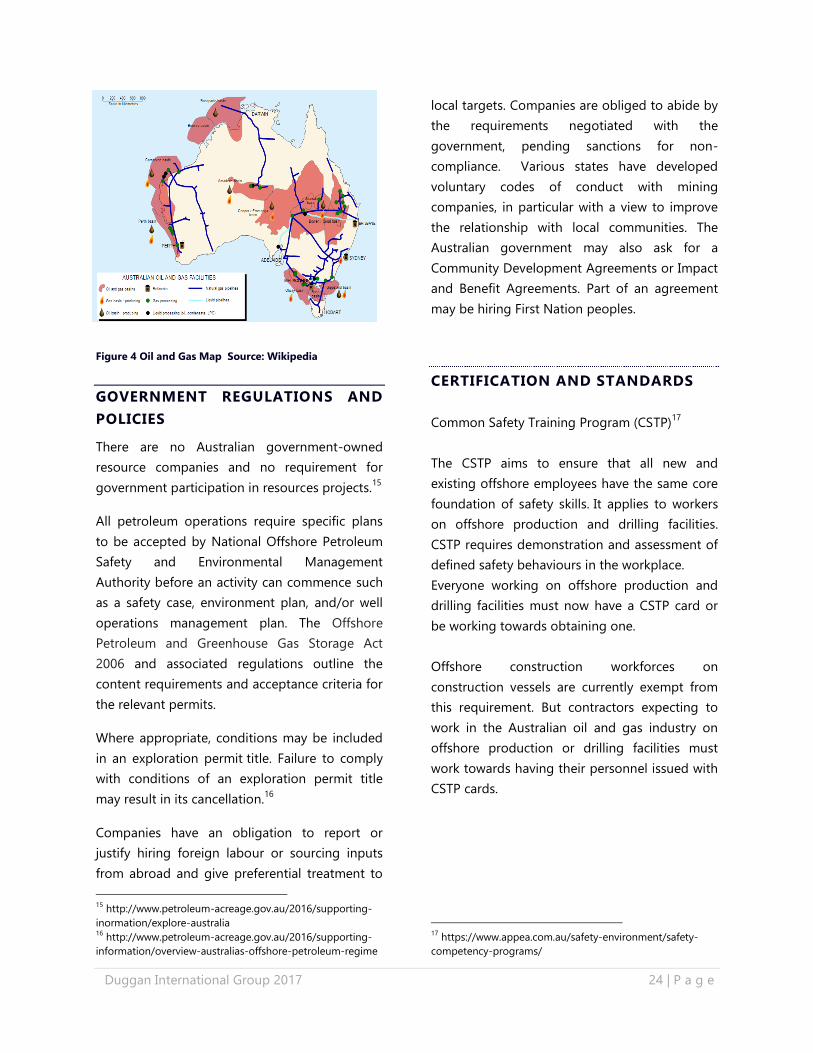
Figure 4 Oil and Gas Map Source: Wikipedia
GOVERNMENT REGULATIONS AND
POLICIES
There are no Australian government-owned
resource companies and no requirement for
government participation in resources projects.15
All petroleum operations require specific plans
to be accepted by National Offshore Petroleum
Safety and Environmental Management
Authority before an activity can commence such
as a safety case, environment plan, and/or well
operations management plan. The Offshore
Petroleum and Greenhouse Gas Storage Act
2006 and associated regulations outline the
content requirements and acceptance criteria for
the relevant permits.
Where appropriate, conditions may be included
in an exploration permit title. Failure to comply
with conditions of an exploration permit title
may result in its cancellation.16
Companies have an obligation to report or
justify hiring foreign labour or sourcing inputs
from abroad and give preferential treatment to
15
http://www.petroleum-acreage.gov.au/2016/supporting-
inormation/explore-australia 16
http://www.petroleum-acreage.gov.au/2016/supporting-
information/overview-australias-offshore-petroleum-regime
local targets. Companies are obliged to abide by
the requirements negotiated with the
government, pending sanctions for non-
compliance. Various states have developed
voluntary codes of conduct with mining
companies, in particular with a view to improve
the relationship with local communities. The
Australian government may also ask for a
Community Development Agreements or Impact
and Benefit Agreements. Part of an agreement
may be hiring First Nation peoples.
CERTIFICATION AND STANDARDS
Common Safety Training Program (CSTP)17
The CSTP aims to ensure that all new and
existing offshore employees have the same core
foundation of safety skills. It applies to workers
on offshore production and drilling facilities.
CSTP requires demonstration and assessment of
defined safety behaviours in the workplace.
Everyone working on offshore production and
drilling facilities must now have a CSTP card or
be working towards obtaining one.
Offshore construction workforces on
construction vessels are currently exempt from
this requirement. But contractors expecting to
work in the Australian oil and gas industry on
offshore production or drilling facilities must
work towards having their personnel issued with
CSTP cards.
17
https://www.appea.com.au/safety-environment/safety-
competency-programs/
Duggan International Group 2017 25 | P a g e
WORKING IN AUSTRALIA
Australia is attractive for exporters, not for its
own market, but the access to Asian countries.
Australia has free trade agreements with
Thailand, Singapore, China, Malaysia, Korea and
Japan. In light of the cancelation of the Trans
Pacific Partnership, accessing these markets
through an Australian partner may be beneficial.
Market Strengths:
Australia has a stable political
environment
Relatively transparent regulatory
structure
Has experienced an extended period of
strong economic growth
Strong business and consumer base
Strong technology sector
Similar language, culture and business
practices
High personal wealth
Strong intellectual property (IP)
protection
Market Challenges:
Australia’s remoteness, large land area,
and relatively small population have led
to market dominance by a few large
firms in certain sectors
Competitors in Australia have some
long-established brands with strong
reputations and existing supplier
relationships
Australia has ready access to Asian
and other low-cost producers. Nova
Scotia firms will have to demonstrate
sufficient added value to overcome
the costs of getting the product
to market, and to compete
Australia covers 3 time zones and the
country has provincial regulations as
well as federal
Until recently, Australia’s High Court has ruled
that foreign offshore workers, on vessels
operating in the lucrative offshore resources
industry, are required to have an Australian work
visa such as a 457 visa and must receive
minimum pay and conditions. On April 18, 2017,
the Australian government announced that the
Temporary Work (Skilled) visa (subclass 457 visa)
will be abolished and replaced with the
completely new Temporary Skill Shortage (TSS)
visa.18
Canadian travelers also must have an
Electronic Travel Authority (ETA) to visit
Australia.
https://www.eta.immi.gov.au/ETAS3/etas
18
https://www.border.gov.au/Trav/Visa-1/457-
MAJOR COMPANIES
Australian Worldwide Exploration Ltd
BHP Billiton Petroleum
Chevron Australia
ConocoPhillips Australia Pty Ltd
Eni
ExxonMobil Australia (Esso)
INPEX
Magellan Petroleum Australia
Metgasco Limited
OMV Australia Pty Ltd
Origin Energy
Quadrant Energy
ROC Oil Company
Santos Limited
Senex Energy Limited
Shell in Australia
Total in Australia
For a list of local suppliers:
https://www.appea.com.au/
Duggan International Group 2017 26 | P a g e
OPPORTUNITIES FOR NOVA SCOTIA
EXPORTERS
World Energy City Partnership member, Perth, is
the Capital City of Western Australia and
is consistently ranked by the Economic
Intelligence Unit as one of the top 10 most
liveable cities in the world.
Approximately 40% of LNG projects in Australia
have their machinery, labor and inputs imported.
With the bulk of the major LNG projects
completed, the industry is transitioning from
construction to management and operations.
Best Prospects:
Operations and maintenance services
Environmental services
Specialised hi-tech equipment
Decommissioning (in the future)
Research & Innovation including
mini/micro LNG facilities, intelligent
operations (automation), hydraulic
fracturing
Subsea & Marine such as expanded ROV
operator capacity, offshore
supply/operation/maintenance of
vessels, flexible pipe technology
Unconventional Gas incl. horizontal drill
rig expertise/maintenance, water
management
Operations & Maintenance including
specialized inspection/auditing services,
on-location support services
Logistics & Transport including rotary
aviation training & facilities
Bear Head LNG Corporation is a wholly owned
subsidiary of LNGL Australia. The company is
developing an 8 mtpa or greater LNG export
terminal in Nova Scotia. Nova Scotia companies
could leverage relationships with LNGL to gain
access to the Australian market.
IMPACTS DUE TO THE VOLATILITY
IN OIL PRICES
The drop in oil prices may have resulted in lack
of interest in IOCs in exploring Australia’s
offshore oil and gas industry. Australia’s
government plans a tax review in order to boost
revenue.
However, the Australian energy market is
predominately based on LNG exports. Before
oil prices dropped, LNG operators had already
sold most of the available capacity from
Australia’s LNG plants on long-term customer
contracts. Contract pricing formulas are typically
linked to oil prices. Fortunately, the Australian
contracts were locked in at around US$80 or
above before the oil crisis. With expansion
strategies in hand, Australia plans to become the
world's biggest exporter of LNG by 2019.
RENEWABLE INDUSTRY
Renewable energy generation is a priority at all
levels of government and the private sector in
Australia. Yet, the percentage of energy derived
from renewable sources is still relatively small.
Renewable energy production increased by 2%
in 2014-15 to reach 343 petajoules. The fall in
hydropower and biomass outweighed the
growth in wind and solar. Electricity generation
from wind power is expected to almost triple the
current rate to account for over 10% of
Australia’s total electricity generation by 2034–
35.
Tidal Power
There are a few tidal and wave projects in
Australia, one is yet to be confirmed as the
company is waiting for government
commitment.
Duggan International Group 2017 27 | P a g e
The Perth Wave Energy Project, located at
Garden Island, Western Australia was the first
demonstration of a complete grid-connected
CETO system anywhere in the world, the only
wave project to consist of more than one wave
energy unit connected together and the only
wave project to produce both power and
freshwater.19
A tidal energy turbine was installed in the Tamar
estuary in Launceston, Tasmania. Researchers at
the Australian Maritime College, a specialist
institute of the University of Tasmania, are
conducting field experiments with a 2.4 metre-
wide prototype in partnership with Sydney-
based developers MAKO Tidal Turbines.
Tasmania is seen as a location with huge
renewable energy potential, and the site near
Reid Rock was selected because of the ideal
speed of the current. The turbine is secured
beneath a floating platform and connected to a
mooring on the east side of the estuary.20
Other companies involved in tidal energy include
BPS Energy and Carnegie Clean Energy Limited.
Carnegie has currently under development
proposal to create a Wave Project and Centre of
Excellence in Albany, Western Australia. The
Project will be the first commercial scale wave
farm in Australia and will demonstrate the
potential for WA and Australia to tap into a
highly consistent renewable resource; delivering
24/7 clean power into the electrical grid. The
Project, to be delivered in stages, will involve an
initial 1MW unit followed by a 20MW wave farm
resulting in over A100mof local investment.
19
http://carnegiewave.com/galleries/perth-
wave-energy-project/ 20
http://www.amc.edu.au/about-amc/news-and-
events/news-items/tidal-energy-potential-
tested-in-tasmanias-tamar
Successful demonstration of the 20MW farm
could in turn lead to a 100MW expansion.
Outside of Australia, the country based CSG
Exploration & Production Services plans to build
a 50kW pilot wave energy power plant in
Zonguldak Province in the Black Sea region of
Turkey.21
Hydropower
Hydropower is the largest contributor to
renewable generation in Australia, with a share
of 39% in 2014–15. Nonetheless, hydropower is
down from 86% of renewable generation in
2004. Hydro’s share of total electricity
generation in 2014–15 was the lowest since the
drought of the mid-2000s. Water supply is an
issue for Australia to realize its hydropower
potential.
The Australia government announced in March
2017 an AUD$2 billion plan to expand the iconic
Snowy Hydro scheme. The government will carry
out a feasibility study into the idea of adding
“pumped hydro” storage capacity, which it could
power up to 500,000 homes.22
Wind Power
Wind was a close 2nd
behind hydro in its
contribution to renewable generation in 2014–
15, contributing 33% of renewable electricity and
5% of total electricity generation. Wind
generation rose by 12% in 2014–15. Wind
generation continues to be particularly prevalent
in South Australia, accounting for one-third of its
total energy mix.
21
http://tidalenergytoday.com/2017/04/11/australian-csg-to-
construct-wave-power-plant-in-turkey/
22 https://www.theguardian.com/australia-
news/2017/mar/17/seawater-could-provide-the-solution-to-
south-australias-power-woes
Duggan International Group 2017 28 | P a g e
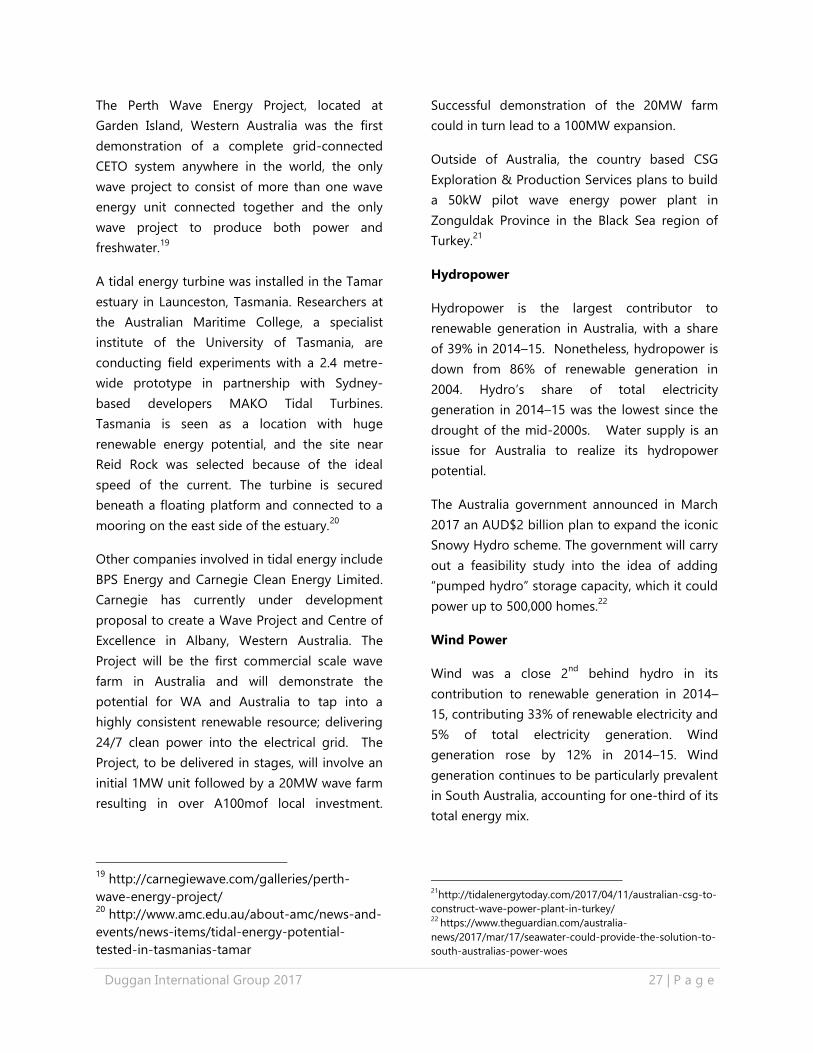
There are 62 wind farms in Australia. Wind
energy market actors are:
AGL
Caspian Technology Company
Duet Group
Infigen Energy
Origin Energy
Pacific Hydro
Roaring 40s
Stanwell Corp
Verve Energy
Solar Power
Solar generation also continued to grow strongly
in 2014–15, by 23%, and accounted for 2% of
total electricity generation. The largest growth
occurred in New South Wales, including the
Royalla Solar Farm. Solar growth in the country
is attributed to small base, and rooftop solar PV
installations.
OPPORTUNITIES FOR NOVA SCOTIA
EXPORTERS
Best Prospects:
Water management consulting for
hydropower
ICT-based solutions to manage and
maintain infrastructure assets
Smart grid management for managing
uninterrupted power supply in remote
locations for wind power
Cost effective energy storage solutions
In April 2017, South Australian
government’s received 90 responses for
an RFP for ground breaking battery
storage tender. This was the first fact-
finding round. Nova Scotia companies
could work with Australia-based
developers in tandem with international
battery storage manufacturers.
GOVERNMENT POLICIES/REGULATIONS
THAT ENCOURAGE SUSTAINABLE
TECHNOLOGIES
Australia’s target for renewable energy is 23.5%
by 2020.23
The Prime Minister established a Task
Group on Energy Efficiency; and a National
Strategy on Energy Efficiency. From this
initiative the Energy Efficiency Opportunities
Program was created to establish the Australian
Energy Market Commission, the Australian
Energy Regulator and the Australian Energy
Market Operator. These divisions are responsible
for regular reviews of the country’s energy
security and reform of the minerals taxation
regime.24
Since 2010, Australia had a surplus in generation
capacity which dampened wholesale prices. This
surplus influenced government to decide in 2014
to remove its carbon tax. However, the more
popular theory is that the tax was unpopular as
it drove up people’s energy bills.
23
http://www.environment.gov.au/climate-
change/renewable-energy-target-scheme 24
Energy Policies of IEA Countries, Australia 2012
Figure 5 Wind Farm Map Source: The Wind Power
Duggan International Group 2017 29 | P a g e
FUNDING INCENTIVES
EDC has funding with the following firms to
purchase supply and services from Canadian
companies:
Origin Energy Ltd
Santos Finance Ltd
Woodside Petroleum Ltd
The Australian Renewable Energy Agency
(ARENA) has approximately AUD$2 billion in
funding, which extends until 2022. ARENA funds
activities that are expected to advance
renewable energy technologies towards
commercial readiness, improve business models
or reduce overall industry costs. Nova Scotia
companies would need to partner with an
Australian firm as the lead.
https://arena.gov.au/funding/
OTHER SOURCES OF INFORMATION
Australian Government Trade and Investment
Commission. Why Australia, Benchmark Report
2017. www.austrade.gov.au
Trade Commissioner Service
http://international.gc.ca/global-markets-
marches-mondiaux/markets-
marches/map_australia-
pam_australie.aspx?lang=eng
Australia Department of Industry, Innovation and
Science, Office of the Chief Economist, Australian
Energy Update 2016
US Commercial Service
https://www.export.gov/article?id=Australia-Oil-
and-Gas
EIA US Energy Administration Australia 2014
Australian Petroleum Production & Exploration
Association
www.appea.com.au
Powers Financial Group
http://www.powers.net.au/2015/03/20/the-
impact-of-lower-oil-prices-on-australian-
equities/
RigZone
www.rigzone.com
European Centre for Development Policy
Management, Local content policies in mineral-
rich countries, No. 193 May 2016
NOTES:
Duggan International Group 2017 30 | P a g e
BRAZIL COUNTRY PROFILE
OVERVIEW
Brazil is the world’s seventh biggest economy,
the ninth largest oil producer and the second
largest oil producer in South America. The main
sources of offshore development are deepwater
and presalt wells. Presalt production now makes
up about a quarter of overall production.
Even though the country is one of the world’s
largest oil producers, Brazil’s energy sector is
one of the least carbon-intensive with almost
45% of Brazil’s primary energy demand met by
renewable energy.
Brazil has been facing a corruption scandal with
its oil and gas industry. This scandal has
contributed to the decline in production targets
and the country’s economic downturn. In 2017,
the country is expected to improve due to new
government policies on foreign investment.
The country’s main language is Portuguese.
Companies need to have this resource to do
business in Brazil.
COUNTRY SOURCES OF ENERGY
Sources of energy for Brazil are gas, oil, hydro,
renewable, nuclear and coal. Brazil’s energy mix
continues to evolve as biofuels take market
share from oil. However, oil remains the most
dominant fuel (35%) followed by hydro (28%).
From 2014 – 2035, natural gas consumption is
expected to grow by 1.7% p.a. and renewables
consumption (including biofuels) is expected to
grow by 4.6% p.a.
Much of Brazil’s energy comes from renewable
sources compared to an average of less than
15% for the rest of the world.25
25
http://sugarcane.org/the-brazilian-experience/brazils-
diverse-energy-matrix
BRAZIL
Figure 6 Source: EDC
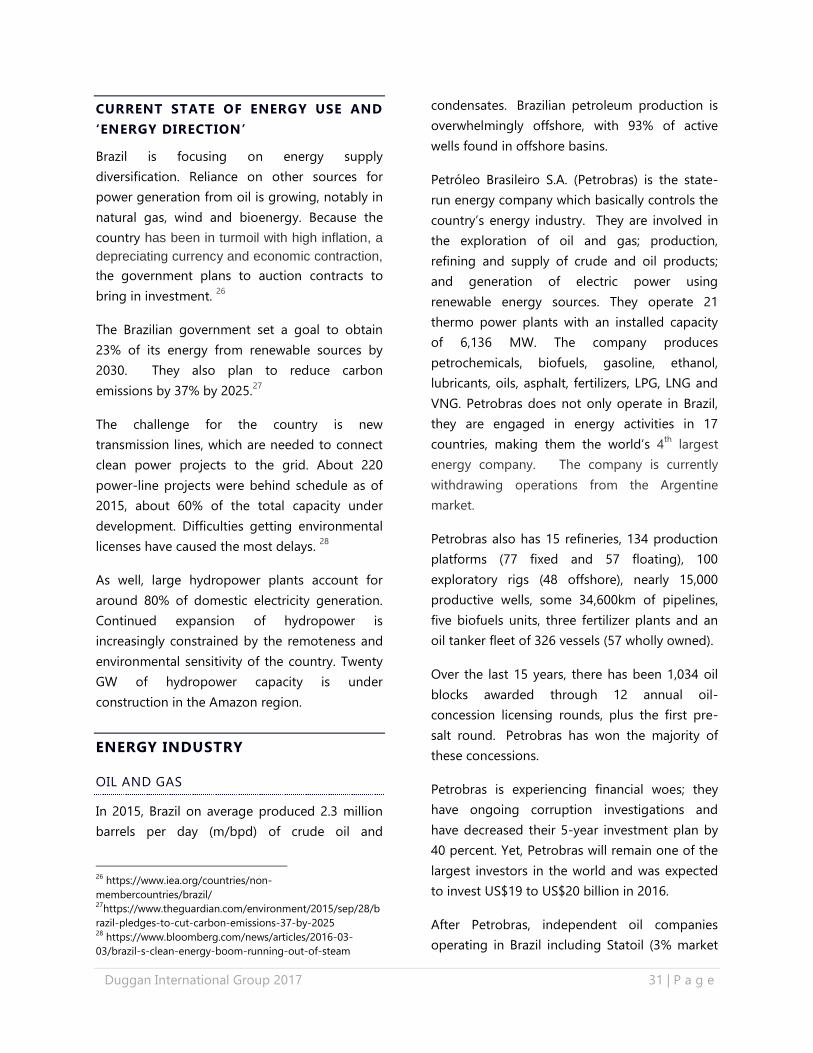
Duggan International Group 2017 31 | P a g e
CURRENT STATE OF ENERGY USE AND
‘ENERGY DIRECTION’
Brazil is focusing on energy supply
diversification. Reliance on other sources for
power generation from oil is growing, notably in
natural gas, wind and bioenergy. Because the
country has been in turmoil with high inflation, a
depreciating currency and economic contraction,
the government plans to auction contracts to
bring in investment. 26
The Brazilian government set a goal to obtain
23% of its energy from renewable sources by
2030. They also plan to reduce carbon
emissions by 37% by 2025.27
The challenge for the country is new
transmission lines, which are needed to connect
clean power projects to the grid. About 220
power-line projects were behind schedule as of
2015, about 60% of the total capacity under
development. Difficulties getting environmental
licenses have caused the most delays. 28
As well, large hydropower plants account for
around 80% of domestic electricity generation.
Continued expansion of hydropower is
increasingly constrained by the remoteness and
environmental sensitivity of the country. Twenty
GW of hydropower capacity is under
construction in the Amazon region.
ENERGY INDUSTRY
OIL AND GAS
In 2015, Brazil on average produced 2.3 million
barrels per day (m/bpd) of crude oil and
26
https://www.iea.org/countries/non-
membercountries/brazil/ 27
https://www.theguardian.com/environment/2015/sep/28/b
razil-pledges-to-cut-carbon-emissions-37-by-2025 28
https://www.bloomberg.com/news/articles/2016-03-
03/brazil-s-clean-energy-boom-running-out-of-steam
condensates. Brazilian petroleum production is
overwhelmingly offshore, with 93% of active
wells found in offshore basins.
Petróleo Brasileiro S.A. (Petrobras) is the state-
run energy company which basically controls the
country’s energy industry. They are involved in
the exploration of oil and gas; production,
refining and supply of crude and oil products;
and generation of electric power using
renewable energy sources. They operate 21
thermo power plants with an installed capacity
of 6,136 MW. The company produces
petrochemicals, biofuels, gasoline, ethanol,
lubricants, oils, asphalt, fertilizers, LPG, LNG and
VNG. Petrobras does not only operate in Brazil,
they are engaged in energy activities in 17
countries, making them the world’s 4th
largest
energy company. The company is currently
withdrawing operations from the Argentine
market.
Petrobras also has 15 refineries, 134 production
platforms (77 fixed and 57 floating), 100
exploratory rigs (48 offshore), nearly 15,000
productive wells, some 34,600km of pipelines,
five biofuels units, three fertilizer plants and an
oil tanker fleet of 326 vessels (57 wholly owned).
Over the last 15 years, there has been 1,034 oil
blocks awarded through 12 annual oil-
concession licensing rounds, plus the first pre-
salt round. Petrobras has won the majority of
these concessions.
Petrobras is experiencing financial woes; they
have ongoing corruption investigations and
have decreased their 5-year investment plan by
40 percent. Yet, Petrobras will remain one of the
largest investors in the world and was expected
to invest US$19 to US$20 billion in 2016.
After Petrobras, independent oil companies
operating in Brazil including Statoil (3% market
Duggan International Group 2017 32 | P a g e
share), Shell (2%), Chevron (1%), and others (with
less than 1% of total production) were the other
main oil producers and operators in Brazil in
2015.
In October 2015, the Brazilian government held
its 13th
licensing round for 266 blocks, most of
which were onshore but also included offshore
blocks and three blocks in the ‘pre-salt’ Campos
Basin. The round did not meet expectations as
only 37 of the blocks were awarded, most of
which were in already developed formations,
and included no deepwater blocks. Further, no
major IOCs submitted bids, a sign that the price
of oil was too low to justify the financial terms
offered. 29
On February 24, 2016, the Brazil Senate
approved Bill of Law No. 131/2015 stating that
the National Council of Energy Policy should
grant Petrobras the pre-emptive right to act as
operator in the pre-salt fields. Petrobras would
have the possibility to exercise or not such right
for each offered block within 30 days. If
Petrobras does not exercise this right, any other
Brazilian or international oil company would be
able to act as operator in the pre-salt layer. The
Bill is now pending approval in the lower house
of Congress and there is a strong chance it will
be approved. This preliminary approval of the
Bill is welcomed by the Brazil oil and gas
community to help attract investment to Brazil.
Brazil is expected to have the highest number of
planned offshore crude and natural gas projects
in production in the world in 2017. Brazil plans
38, there will 279 globally, according to a report
by Global Data. In terms of operatorship,
29
http://www.offshoreenergytoday.com/brazils-13th-
bidding-round-fails-to-attract-oil-majors/
Petrobras will lead the world with the highest
operatorship of 30 planned projects.30
PROJECTS
Royal Dutch Shell plans to invest
US$10bn in deepwater production in
Brazil over the next five years on top of
the US$30bn it has already deployed
there, making it the largest foreign
private sector investor in the nation by
far, and second only to the Brazilian
state-owned oil company Petrobras.
Japan's MODEC, Inc. announced that
Royal Dutch Shell plc's subsidiary Shell
Brasil Petroleo Ltda. has extended a
contract with the firm for operations and
maintenance of the FPSO Fluminense
now working in the Bijupira & Salema oil
fields in the Campos Basin off the coast
of Brazil. The contract for the floating
production storage and offloading
(FPSO) facility, which has been in
operation at the fields since August
2003, will be extended from
August 2016 to December 2020.
In 2016, Aker Solutions signed an
Nkr1bn (US$120m) agreement to
provide maintenance and other services
for subsea facilities at offshore oil and
gas fields operated by Petrobras in
Brazil. The three-year contract, which
can also be extended by another three
years, will cover maintenance, storage,
supply of parts, as well as technical
assistance for all subsea equipment
delivered by Aker Solutions to Petrobras.
PACC Offshore Services secured a one-
year contract to support the oil and gas
production activities of an undisclosed
client in the Campos Basin, Brazil, using
its semisubmersible accommodation
vessel, POSH Xanadu (SSAV).
30
http://www.offshore-
technology.com/researchreports/researchreportreport-
brazil-to-have-the-highest-offshore-crude-and-natural-gas-
projects-in-production-in-q1-2017-5765554/
Duggan International Group 2017 33 | P a g e
Wood Group won a contract to deliver
services to Brazil-based PetroRio's Polvo
A platform in the southern Campos
basin, 100km off the coast of Rio de
Janeiro. Under the contract, Wood
Group PSN will provide integrated
operations and maintenance services.
Karoon Petroleo & Gas, a Brazilian
subsidiary of Karoon Gas Australia Ltd.,
Melbourne, has let a multiyear contract
to Wood Group for the engineering
services for full field development of
Echidna oil field in the Santos basin
offshore Brazil. The contract will be
executed from Wood’s office in Rio de
Janeiro.
GOVERNMENT REGULATIONS AND
POLICIES
Currently, exploration phase activities require
between 37% and 85% local goods and services,
and development phase activities must use
between 55% and 80% Brazilian content.
In order to attract investments, the Brazilian
authorities have been discussing necessary
changes in the regulatory framework and
restrictive policies.
In January 2016, Brazil introduced a new
program to offer concessionaires credits that can
be applied toward satisfying local content rules
(LCRs) in exchange for stimulating the Brazilian
O&G supply. This change may make it easier for
O&G companies operating in Brazil to meet high
LCRs. Brazilian O&G supply chain would also
have greater access to lower-cost equipment
and services.
The new LCR rules are expected to come into
place September 2017. The change in content
rules is a 50% reduction in local hiring
requirements from the current standard.
Offshore field exploration will require only 18%
of staff be Brazilians.31
Additionally, yet to be worked out, Local
Content Units (“UCLs”) are proposed to
be created, which would be granted to a
company or consortium that promotes
one or more of the following:
Entering into of contracts for the
purchase of goods, services or systems
which enable the creation of new
suppliers in Brazil;
Direct investment in the expansion of
production capacity of Brazilian
suppliers;
Direct investment in the process of
technology innovation of Brazilian
suppliers;
Purchase of goods and systems in Brazil,
with local content, for use outside Brazil;
or
Acquisition of goods or systems of a
pioneering nature, developed in Brazil.
These UCLs can then be applied against local
content targets for a particular block to make up
for any shortfall on that particular project. This
should enable more flexible contracting, making
it easier for oil companies to select the most
suitable contractors for projects, with foreign
contractors not necessarily being excluded for
lack of local content.32
31
http://oilpro.com/post/30186/brazil-local-content-rules-
cut-50 32
http://www.cms-lawnow.com/ealerts/2016/02/reforms-to-
brazilian-local-content-policy
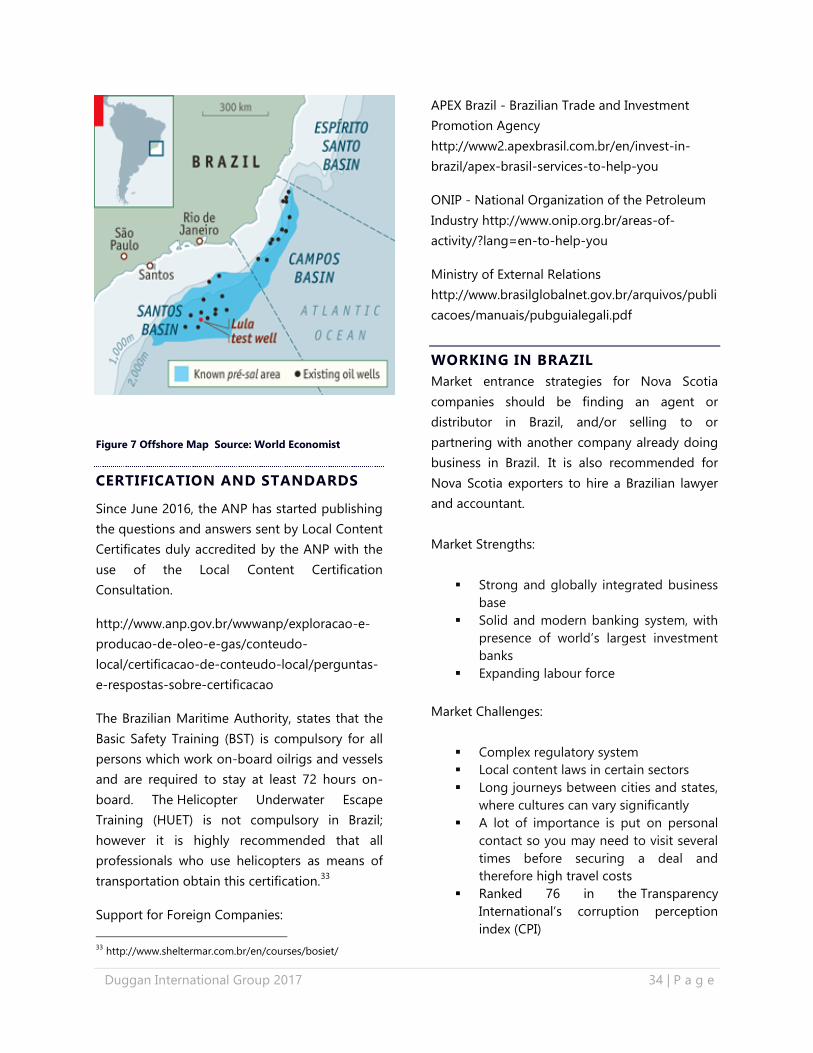
Duggan International Group 2017 34 | P a g e
Figure 7 Offshore Map Source: World Economist
CERTIFICATION AND STANDARDS
Since June 2016, the ANP has started publishing
the questions and answers sent by Local Content
Certificates duly accredited by the ANP with the
use of the Local Content Certification
Consultation.
http://www.anp.gov.br/wwwanp/exploracao-e-
producao-de-oleo-e-gas/conteudo-
local/certificacao-de-conteudo-local/perguntas-
e-respostas-sobre-certificacao
The Brazilian Maritime Authority, states that the
Basic Safety Training (BST) is compulsory for all
persons which work on-board oilrigs and vessels
and are required to stay at least 72 hours on-
board. The Helicopter Underwater Escape
Training (HUET) is not compulsory in Brazil;
however it is highly recommended that all
professionals who use helicopters as means of
transportation obtain this certification.33
Support for Foreign Companies:
33
http://www.sheltermar.com.br/en/courses/bosiet/
APEX Brazil - Brazilian Trade and Investment
Promotion Agency
http://www2.apexbrasil.com.br/en/invest-in-
brazil/apex-brasil-services-to-help-you
ONIP - National Organization of the Petroleum
Industry http://www.onip.org.br/areas-of-
activity/?lang=en-to-help-you
Ministry of External Relations
http://www.brasilglobalnet.gov.br/arquivos/publi
cacoes/manuais/pubguialegali.pdf
WORKING IN BRAZIL
Market entrance strategies for Nova Scotia
companies should be finding an agent or
distributor in Brazil, and/or selling to or
partnering with another company already doing
business in Brazil. It is also recommended for
Nova Scotia exporters to hire a Brazilian lawyer
and accountant.
Market Strengths:
Strong and globally integrated business
base
Solid and modern banking system, with
presence of world’s largest investment
banks
Expanding labour force
Market Challenges:
Complex regulatory system
Local content laws in certain sectors
Long journeys between cities and states,
where cultures can vary significantly
A lot of importance is put on personal
contact so you may need to visit several
times before securing a deal and
therefore high travel costs
Ranked 76 in the Transparency
International’s corruption perception
index (CPI)
Duggan International Group 2017 35 | P a g e
Ranked poorly in World Bank’s ease of
doing business index
Organised crime is a significant problem
in some parts of Brazil
Nova Scotians need a visa to travel to Brazil and
individual and companies need to plan
accordingly as it can take up a month to get a
visa from the Brazil Canadian Consulate.
OPPORTUNITIES FOR NOVA SCOTIA
EXPORTERS
Rio de Janeiro is the World Energy City
Partnership member. The city is headquarters of
major companies in Brazil and the capital of
major industries with a radius of 500 kms.
Petrobras has restructured its procurement
department to centralize all its purchases and
contracts under an Executive Management
Division called “Suprimentos de Bens e Serviços-
SBS” (Goods and Services Supply).
Currently, the registration process for foreign
suppliers interested in providing service
contracts to Petrobras is limited to the group of
service categories listed in the following
link: https://www.petronect.com.br/sap/bc/webd
ynpro/sap/ypcad_lista_fam_serv?sap-
language=E.
Best Prospects:
Flow measurement equipment
Mobile well test plants
Pig valves
Pig launchers
Chokes
Electrical panels
Completion tools
Well abandonment expertise
Offshore equipment and services
Personnel and crewing service (after the
LCR rules drop)
Subsea technologies
Inspection, repair and maintenance
Like Nova Scotia, Brazil has a strong shipbuilding
industry. US$100 billion is forecast to be
invested between 2012 and 2020 in Brazil’s
commercial marine industry.
Opportunities for Nova Scotia companies:
Maritime equipment
Marine construction and maintenance
Maritime navigation
IMPACTS DUE TO THE VOLATILITY
IN OIL PRICES
Since January 2016, Petrobras has been
restructuring its finances by decreasing
investments, selling assets and shutting down
wells. The company is also pursuing a more
conservative investment strategy.
The low price of oil prompted Petrobras to shut-
in some 22 of its more capital intensive wells and
announce its intention to sell US$15.1 billion
worth of its assets. Petrobras is expected to
announce reductions totaling US$16 billion per
year as part of its investment plan for 2016 to
2020. 34
Petrobras is also in the process of reviewing its
critical goods and services demand for the next
five years. Recent press announcements noted
Petrobras’ plans to sell gas pipelines, gas-fired
power plants and some LNG terminals, which
could increase planned divestments to about
US$50 billion.
34
http://trade.gov/topmarkets/pdf/Oil_and_Gas_Brazil.pdf
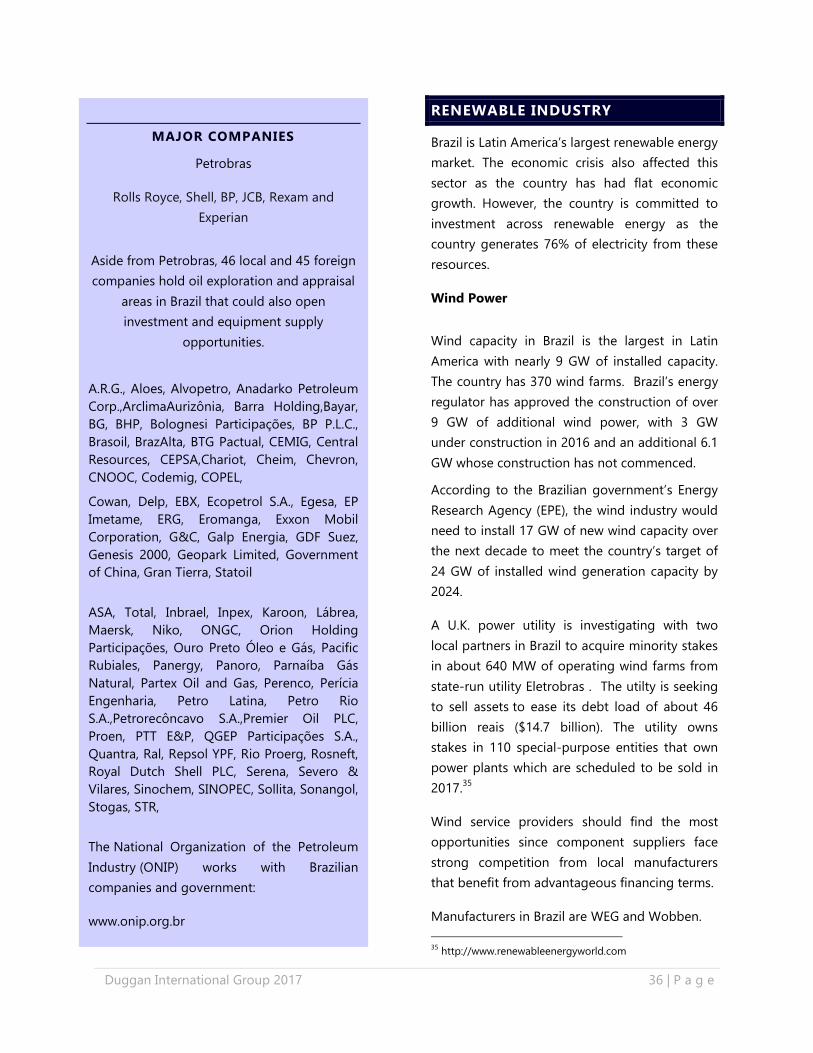
Duggan International Group 2017 36 | P a g e
RENEWABLE INDUSTRY
Brazil is Latin America’s largest renewable energy
market. The economic crisis also affected this
sector as the country has had flat economic
growth. However, the country is committed to
investment across renewable energy as the
country generates 76% of electricity from these
resources.
Wind Power
Wind capacity in Brazil is the largest in Latin
America with nearly 9 GW of installed capacity.
The country has 370 wind farms. Brazil’s energy
regulator has approved the construction of over
9 GW of additional wind power, with 3 GW
under construction in 2016 and an additional 6.1
GW whose construction has not commenced.
According to the Brazilian government’s Energy
Research Agency (EPE), the wind industry would
need to install 17 GW of new wind capacity over
the next decade to meet the country’s target of
24 GW of installed wind generation capacity by
2024.
A U.K. power utility is investigating with two
local partners in Brazil to acquire minority stakes
in about 640 MW of operating wind farms from
state-run utility Eletrobras . The utilty is seeking
to sell assets to ease its debt load of about 46
billion reais ($14.7 billion). The utility owns
stakes in 110 special-purpose entities that own
power plants which are scheduled to be sold in
2017.35
Wind service providers should find the most
opportunities since component suppliers face
strong competition from local manufacturers
that benefit from advantageous financing terms.
Manufacturers in Brazil are WEG and Wobben.
35
http://www.renewableenergyworld.com
MAJOR COMPANIES
Petrobras
Rolls Royce, Shell, BP, JCB, Rexam and
Experian
Aside from Petrobras, 46 local and 45 foreign
companies hold oil exploration and appraisal
areas in Brazil that could also open
investment and equipment supply
opportunities.
A.R.G., Aloes, Alvopetro, Anadarko Petroleum
Corp.,ArclimaAurizônia, Barra Holding,Bayar,
BG, BHP, Bolognesi Participações, BP P.L.C.,
Brasoil, BrazAlta, BTG Pactual, CEMIG, Central
Resources, CEPSA,Chariot, Cheim, Chevron,
CNOOC, Codemig, COPEL,
Cowan, Delp, EBX, Ecopetrol S.A., Egesa, EP
Imetame, ERG, Eromanga, Exxon Mobil
Corporation, G&C, Galp Energia, GDF Suez,
Genesis 2000, Geopark Limited, Government
of China, Gran Tierra, Statoil
ASA, Total, Inbrael, Inpex, Karoon, Lábrea,
Maersk, Niko, ONGC, Orion Holding
Participações, Ouro Preto Óleo e Gás, Pacific
Rubiales, Panergy, Panoro, Parnaíba Gás
Natural, Partex Oil and Gas, Perenco, Perícia
Engenharia, Petro Latina, Petro Rio
S.A.,Petrorecôncavo S.A.,Premier Oil PLC,
Proen, PTT E&P, QGEP Participações S.A.,
Quantra, Ral, Repsol YPF, Rio Proerg, Rosneft,
Royal Dutch Shell PLC, Serena, Severo &
Vilares, Sinochem, SINOPEC, Sollita, Sonangol,
Stogas, STR,
The National Organization of the Petroleum
Industry (ONIP) works with Brazilian
companies and government:
www.onip.org.br
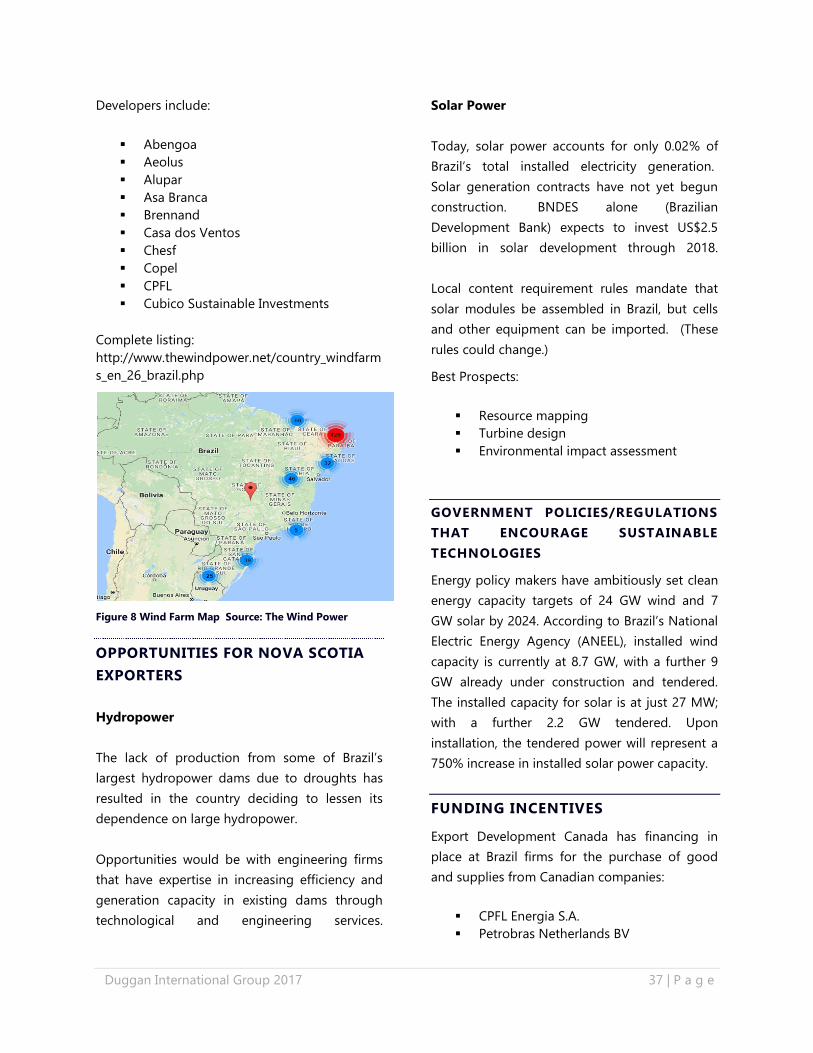
Duggan International Group 2017 37 | P a g e
Developers include:
Abengoa
Aeolus
Alupar
Asa Branca
Brennand
Casa dos Ventos
Chesf
Copel
CPFL
Cubico Sustainable Investments
Complete listing:
http://www.thewindpower.net/country_windfarm
s_en_26_brazil.php
Figure 8 Wind Farm Map Source: The Wind Power
OPPORTUNITIES FOR NOVA SCOTIA
EXPORTERS
Hydropower
The lack of production from some of Brazil’s
largest hydropower dams due to droughts has
resulted in the country deciding to lessen its
dependence on large hydropower.
Opportunities would be with engineering firms
that have expertise in increasing efficiency and
generation capacity in existing dams through
technological and engineering services.
Solar Power
Today, solar power accounts for only 0.02% of
Brazil’s total installed electricity generation.
Solar generation contracts have not yet begun
construction. BNDES alone (Brazilian
Development Bank) expects to invest US$2.5
billion in solar development through 2018.
Local content requirement rules mandate that
solar modules be assembled in Brazil, but cells
and other equipment can be imported. (These
rules could change.)
Best Prospects:
Resource mapping
Turbine design
Environmental impact assessment
GOVERNMENT POLICIES/REGULATIONS
THAT ENCOURAGE SUSTAINABLE
TECHNOLOGIES
Energy policy makers have ambitiously set clean
energy capacity targets of 24 GW wind and 7
GW solar by 2024. According to Brazil’s National
Electric Energy Agency (ANEEL), installed wind
capacity is currently at 8.7 GW, with a further 9
GW already under construction and tendered.
The installed capacity for solar is at just 27 MW;
with a further 2.2 GW tendered. Upon
installation, the tendered power will represent a
750% increase in installed solar power capacity.
FUNDING INCENTIVES
Export Development Canada has financing in
place at Brazil firms for the purchase of good
and supplies from Canadian companies:
CPFL Energia S.A.
Petrobras Netherlands BV
Duggan International Group 2017 38 | P a g e
Vale S.A.
Nova Scotia companies should contact their
local EDC representative for assistance.
OTHER SOURCES OF INFORMATION
2016 ITA Upstream Oil and Gas Equipment Top
Markets
Reporthttp://trade.gov/topmarkets/pdf/Oil_and_
Gas_Top_Markets_Report.pdf
Petrobras 2017-2021 investment plan,
procurement department restructuring, and
suppliers/service registration information
https://www.export.gov/article?id=Petrobras-
2017-2021-Investment-Plan-Procurement-
Department-Restructuring-and-Suppliers-
Service-Registration-Information
A snapshot of Brazil’s renewable energy
opportunities, Paul Dvorak, 2016
http://www.windpowerengineering.com/feature
d/business-news-projects/snapshot-brazils-
renewable-energy-opportunities/
Running Out of Steam, Vanessa Dezem, March 2,
2016https://www.bloomberg.com/news/articles/
2016-03-03/brazil-s-clean-energy-boom-
running-out-of-steam
Brazil export overview 2017
https://www.gov.uk/government/publications/ex
porting-to-brazil/exporting-to-brazil
2016 WORLD ENERGY COUNCIL | ISSUES
MONITOR
https://www.worldenergy.org/publications/2016/
world-energy-issues-monitor-2016/
US Commercial Service Industry
http://trade.gov/topmarkets/
How Does the Changing Price of Oil Affect
Economies around the World?
BP Energy Outlook
http://www.bp.com/content/dam/bp/pdf/energy
-economics/energy-outlook-2016/bp-energy-
outlook-2016-country-insights-brazil.pdf
International Energy Agency
US Commercial Service
https://www.iea.org/countries/non-
membercountries/brazil/
Reforms to Brazilian Local Content Policy
http://www.cms-
lawnow.com/ealerts/2016/02/reforms-to-
brazilian-local-content-policy
Oil & Gas Journal www.ogi.com
NOTES:
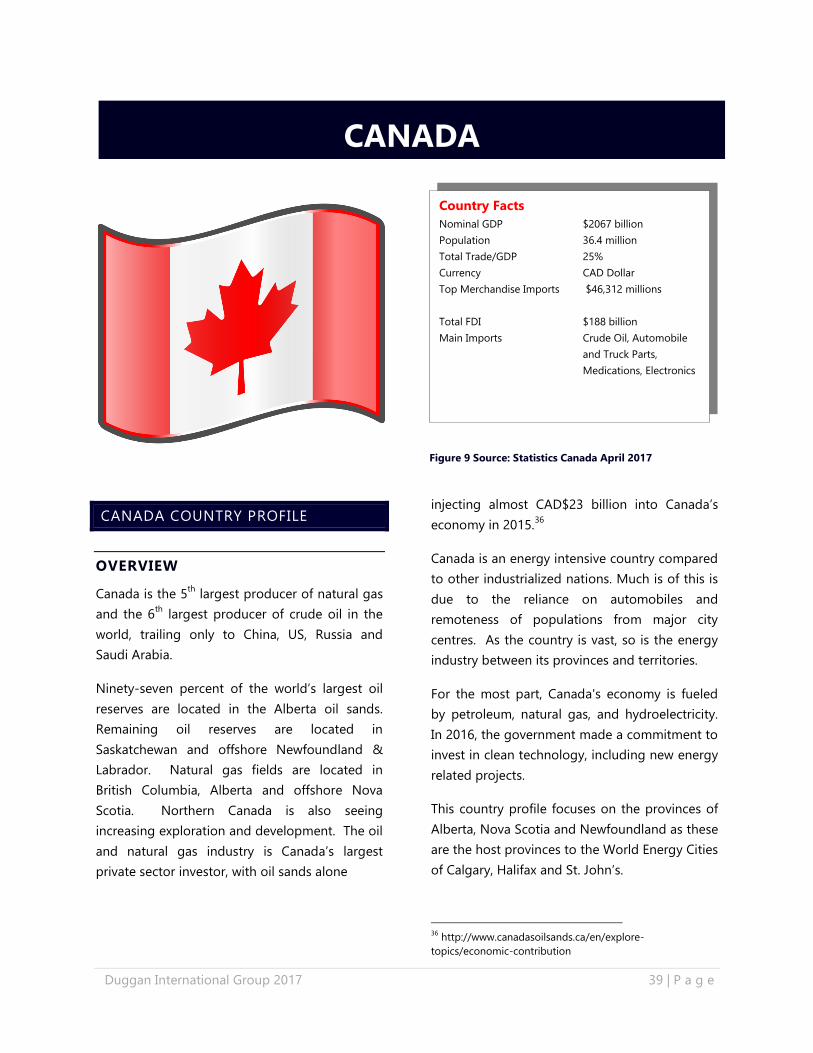
Duggan International Group 2017 39 | P a g e
Country Facts
Nominal GDP $2067 billion
Population 36.4 million
Total Trade/GDP 25%
Currency CAD Dollar
Top Merchandise Imports $46,312 millions
Total FDI $188 billion
Main Imports Crude Oil, Automobile
and Truck Parts,
Medications, Electronics
CANADA COUNTRY PROFILE
OVERVIEW
Canada is the 5th
largest producer of natural gas
and the 6th
largest producer of crude oil in the
world, trailing only to China, US, Russia and
Saudi Arabia.
Ninety-seven percent of the world’s largest oil
reserves are located in the Alberta oil sands.
Remaining oil reserves are located in
Saskatchewan and offshore Newfoundland &
Labrador. Natural gas fields are located in
British Columbia, Alberta and offshore Nova
Scotia. Northern Canada is also seeing
increasing exploration and development. The oil
and natural gas industry is Canada’s largest
private sector investor, with oil sands alone
injecting almost CAD$23 billion into Canada’s
economy in 2015.36
Canada is an energy intensive country compared
to other industrialized nations. Much is of this is
due to the reliance on automobiles and
remoteness of populations from major city
centres. As the country is vast, so is the energy
industry between its provinces and territories.
For the most part, Canada's economy is fueled
by petroleum, natural gas, and hydroelectricity.
In 2016, the government made a commitment to
invest in clean technology, including new energy
related projects.
This country profile focuses on the provinces of
Alberta, Nova Scotia and Newfoundland as these
are the host provinces to the World Energy Cities
of Calgary, Halifax and St. John’s.
36
http://www.canadasoilsands.ca/en/explore-
topics/economic-contribution
CANADA
Figure 9 Source: Statistics Canada April 2017
Duggan International Group 2017 40 | P a g e
COUNTRY SOURCES OF ENERGY
Hydroelectricity remains the primary source of
electric power in Canada accounting for 55% of
total capacity. Natural gas, coal, and nuclear
plants provide most of the remaining supply,
while non-hydro renewables such as wind, solar,
and biomass make up 9% of the capacity.37
Two-
thirds of Canada’s fossil fuel generation plants
are fueled with coal.
The electricity supply mix varies significantly
amongst the provinces and territories. Quebec,
British Columbia (BC), Manitoba, Newfoundland
& Labrador, and Yukon have significant
hydroelectric resources which are used to supply
most of their electricity needs. Saskatchewan
and Alberta rely on locally abundant coal
resources but have been expanding their natural
gas-fired resources. Nuclear power plants
represent approximately one-third of Ontario’s
capacity, with natural gas and hydro providing
much of the remaining power. Atlantic Canada
relies on a combination of hydro, various fossil
fuels, nuclear, and non-hydro renewable
resources. Diesel-fueled plants account for most
of the capacity in Nunavut and NWT.38
CURRENT STATE OF ENERGY USE AND
‘ENERGY DIRECTION’
Alberta leads the country’s demand for oil and
gas, particularly for operating the oil sands.
Energy use trends in Atlantic Canada can be
unpredictable depending on the demands of the
region’s industrial activities. Atlantic Canada uses
a much higher share of refined products than
the rest of Canada due to infrastructure
limitations. In the western provinces, natural gas
is used relatively more than other regions
37
https://www.neb-one.gc.ca/nrg/ntgrtd/ftr/2016/fslctrct-
eng.html 38
National Energy Board of Canada 2016
because it is readily available and it is price
competitive. 39
Canada’s oil sands had experienced the worst
market in decades causing company shut downs
and project delays. This resulted in the oil and
gas industry undergoing rapid transformations
in both the types of resources extracted and
extraction technologies. Continued productivity
will play an important role in the exploration and
shaping of Canada’s fossil fuel industry. Analysts
predict that the oil sands industry will grow by
800,000 barrels in 2017.
The outlook for the industry across Canada is
improving. Canada’s energy producers are
returning to growth mode. The renewed focus
on expansion is occurring as the Canadian
government in 2016 approved construction of
two expanded energy pipelines that will add
almost a million barrels a day of export capacity
to Western Canada.40
Politically, the country is trying to balance
energy development with its commitment to
reduce greenhouse gas emissions by 30% below
2005 levels by the year 2030. Canada’s
employment and economic prosperity relies
heavily on its energy sectors. Canadians want a
vibrant industry and they want the industry to
use good environmental practices.
In response, the federal government created
The Pan-Canadian Framework on Clean Growth
and Climate Change.41
The framework outlines
Canada’s strategy to reach its climate change
39
https://www.neb-one.gc.ca/nrg/ntgrtd/ftr/2016pt/prvnc-
trrtrl-cmprsn-eng.html 40
http://calgaryherald.com/business/energy/canadas-
oilpatch-moves-into-growth-mode-finally 41
https://www.canada.ca/en/services/environment/weather/cl
imatechange/pan-canadian-framework.html
Duggan International Group 2017 41 | P a g e
target and to position Canada as a leader in the
clean technology industry.
New and improved technology in the energy
sector will be key to Canada’s growth. To
address the need for alternative energy
resources, Canadian provinces are investing in
hydropower, wind power and tidal power.
Improved technologies in deep water
exploration are also helping to elevate Canada’s
productivity.
ENERGY INDUSTRY
OIL AND GAS
Canada's oil and gas reserves, including reserves
of non-conventional resources (oil sands) and
shale gas, makes Canada one of the world’s
leading exporters. Canada has 171 billion
barrels of oil that can be recovered
economically.
Companies in the country’s oil sector are both
domestic and international. Many Canadian
firms participate in upstream oil and natural gas
ventures, from large-scale active or planned
commercial projects, to smaller pilot projects
that serve as test beds for new technologies. The
largest Canadian energy companies with a
presence in the domestic upstream and
downstream sectors include Suncor (which
acquired Petro-Canada in 2009), Syncrude,
Canadian Natural Resources Limited, Imperial
Oil, Cenovus (which was spun off from Encana),
and Husky Energy. Other Canadian companies,
particularly Enbridge and TransCanada,
dominate midstream pipeline infrastructure.42
OIL SANDS
Oil sands development is expected to contribute
more than CAD$4 trillion to the Canadian
42
US Energy Information 2015
economy over the next 20 years — about
CAD$200 billion per year. Direct employment in
Canada as a result of new oil sands investments
are expected to grow from 151,000 jobs in 2014
to 225,000 jobs in 2038. When including indirect
jobs, employment numbers will more than
double across Canada.43
Within Alberta, there are three major oil sands
deposits, the largest of which is the Athabasca
deposit, followed by Cold Lake and Peace River.
Additionally, the traditional center of Canada's
oil production has been the Western Canada
Sedimentary Basin (WCSB). This field stretches
from British Columbia across Alberta and
Saskatchewan to Manitoba and part of the
Northwest Territories. The WCSB contains some
of the world's most abundant supplies of oil and
natural gas, and still remains a significant source
of conventional oil production.
OFFSHORE
The offshore oil and gas industry is important to
Atlantic Canada’s economy. Through royalties,
taxes and job creation, the highs and lows of the
energy industry has a major impact on all four
provinces.
The East Coast offshore is still considered a
frontier industry, yet many prominent oil
companies are pursuing this market. There is an
estimated 12 billion barrels of crude oil off
Newfoundland & Labrador, as well
approximately another eight billion barrels of oil
off of Nova Scotia. Only 5% of Newfoundland &
Labrador’s offshore is under license. The East
Coast offshore is categorized as deepwater and
harsh climate.
Total expenditures of CAD$39 billion have been
generated from the offshore since 1996. The
43
http://www.canadasoilsands.ca/en/explore-
topics/economic-contribution
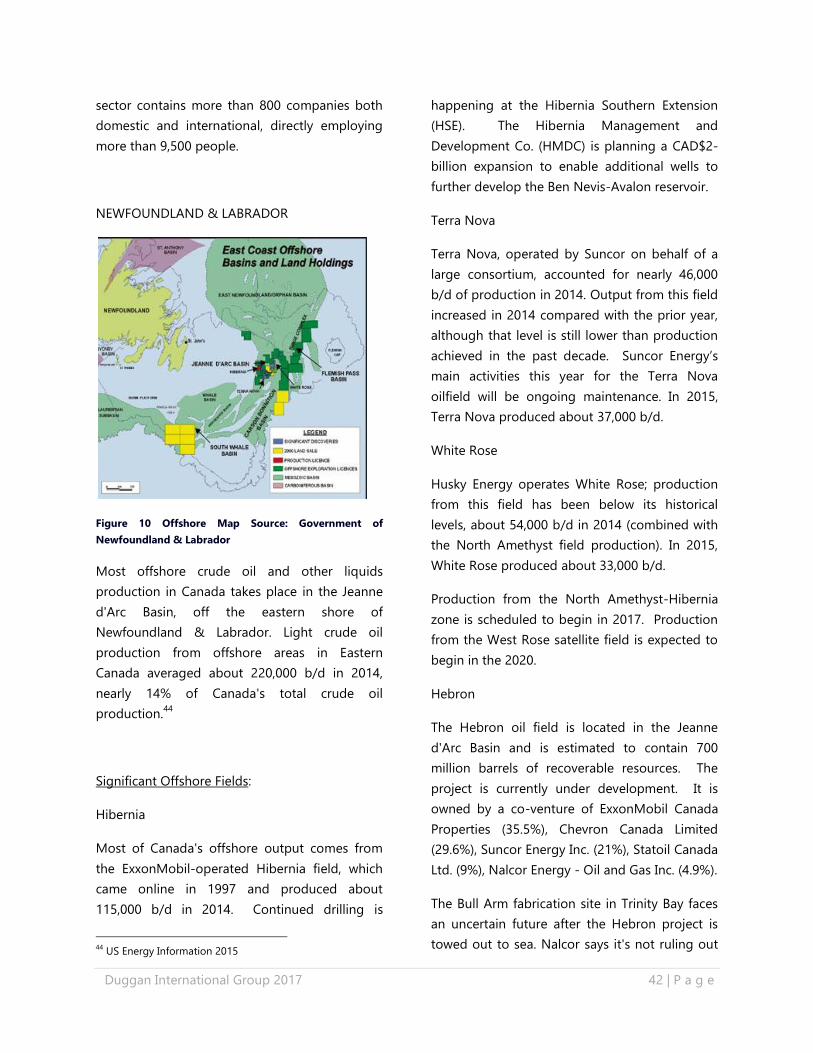
Duggan International Group 2017 42 | P a g e
sector contains more than 800 companies both
domestic and international, directly employing
more than 9,500 people.
NEWFOUNDLAND & LABRADOR
Figure 10 Offshore Map Source: Government of
Newfoundland & Labrador
Most offshore crude oil and other liquids
production in Canada takes place in the Jeanne
d'Arc Basin, off the eastern shore of
Newfoundland & Labrador. Light crude oil
production from offshore areas in Eastern
Canada averaged about 220,000 b/d in 2014,
nearly 14% of Canada's total crude oil
production.44
Significant Offshore Fields:
Hibernia
Most of Canada's offshore output comes from
the ExxonMobil-operated Hibernia field, which
came online in 1997 and produced about
115,000 b/d in 2014. Continued drilling is
44
US Energy Information 2015
happening at the Hibernia Southern Extension
(HSE). The Hibernia Management and
Development Co. (HMDC) is planning a CAD$2-
billion expansion to enable additional wells to
further develop the Ben Nevis-Avalon reservoir.
Terra Nova
Terra Nova, operated by Suncor on behalf of a
large consortium, accounted for nearly 46,000
b/d of production in 2014. Output from this field
increased in 2014 compared with the prior year,
although that level is still lower than production
achieved in the past decade. Suncor Energy’s
main activities this year for the Terra Nova
oilfield will be ongoing maintenance. In 2015,
Terra Nova produced about 37,000 b/d.
White Rose
Husky Energy operates White Rose; production
from this field has been below its historical
levels, about 54,000 b/d in 2014 (combined with
the North Amethyst field production). In 2015,
White Rose produced about 33,000 b/d.
Production from the North Amethyst-Hibernia
zone is scheduled to begin in 2017. Production
from the West Rose satellite field is expected to
begin in the 2020.
Hebron
The Hebron oil field is located in the Jeanne
d'Arc Basin and is estimated to contain 700
million barrels of recoverable resources. The
project is currently under development. It is
owned by a co-venture of ExxonMobil Canada
Properties (35.5%), Chevron Canada Limited
(29.6%), Suncor Energy Inc. (21%), Statoil Canada
Ltd. (9%), Nalcor Energy - Oil and Gas Inc. (4.9%).
The Bull Arm fabrication site in Trinity Bay faces
an uncertain future after the Hebron project is
towed out to sea. Nalcor says it's not ruling out
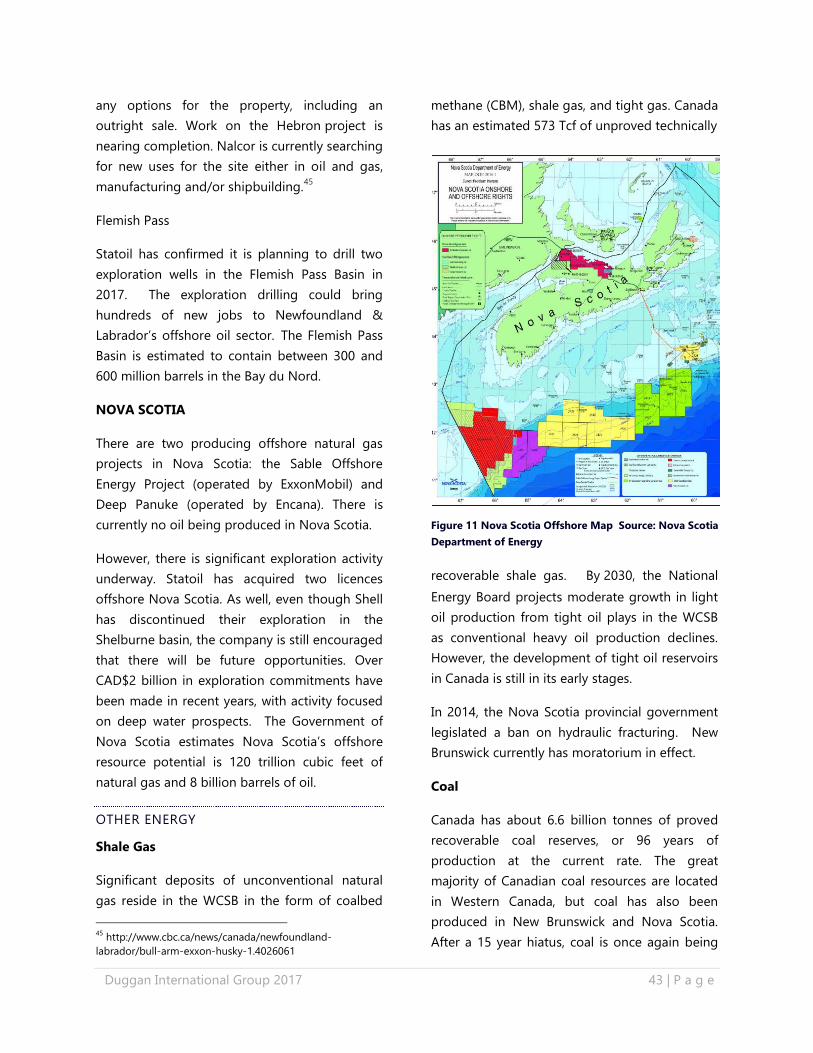
Duggan International Group 2017 43 | P a g e
any options for the property, including an
outright sale. Work on the Hebron project is
nearing completion. Nalcor is currently searching
for new uses for the site either in oil and gas,
manufacturing and/or shipbuilding.45
Flemish Pass
Statoil has confirmed it is planning to drill two
exploration wells in the Flemish Pass Basin in
2017. The exploration drilling could bring
hundreds of new jobs to Newfoundland &
Labrador’s offshore oil sector. The Flemish Pass
Basin is estimated to contain between 300 and
600 million barrels in the Bay du Nord.
NOVA SCOTIA
There are two producing offshore natural gas
projects in Nova Scotia: the Sable Offshore
Energy Project (operated by ExxonMobil) and
Deep Panuke (operated by Encana). There is
currently no oil being produced in Nova Scotia.
However, there is significant exploration activity
underway. Statoil has acquired two licences
offshore Nova Scotia. As well, even though Shell
has discontinued their exploration in the
Shelburne basin, the company is still encouraged
that there will be future opportunities. Over
CAD$2 billion in exploration commitments have
been made in recent years, with activity focused
on deep water prospects. The Government of
Nova Scotia estimates Nova Scotia’s offshore
resource potential is 120 trillion cubic feet of
natural gas and 8 billion barrels of oil.
OTHER ENERGY
Shale Gas
Significant deposits of unconventional natural
gas reside in the WCSB in the form of coalbed
45
http://www.cbc.ca/news/canada/newfoundland-
labrador/bull-arm-exxon-husky-1.4026061
methane (CBM), shale gas, and tight gas. Canada
has an estimated 573 Tcf of unproved technically
Figure 11 Nova Scotia Offshore Map Source: Nova Scotia
Department of Energy
recoverable shale gas. By 2030, the National
Energy Board projects moderate growth in light
oil production from tight oil plays in the WCSB
as conventional heavy oil production declines.
However, the development of tight oil reservoirs
in Canada is still in its early stages.
In 2014, the Nova Scotia provincial government
legislated a ban on hydraulic fracturing. New
Brunswick currently has moratorium in effect.
Coal
Canada has about 6.6 billion tonnes of proved
recoverable coal reserves, or 96 years of
production at the current rate. The great
majority of Canadian coal resources are located
in Western Canada, but coal has also been
produced in New Brunswick and Nova Scotia.
After a 15 year hiatus, coal is once again being
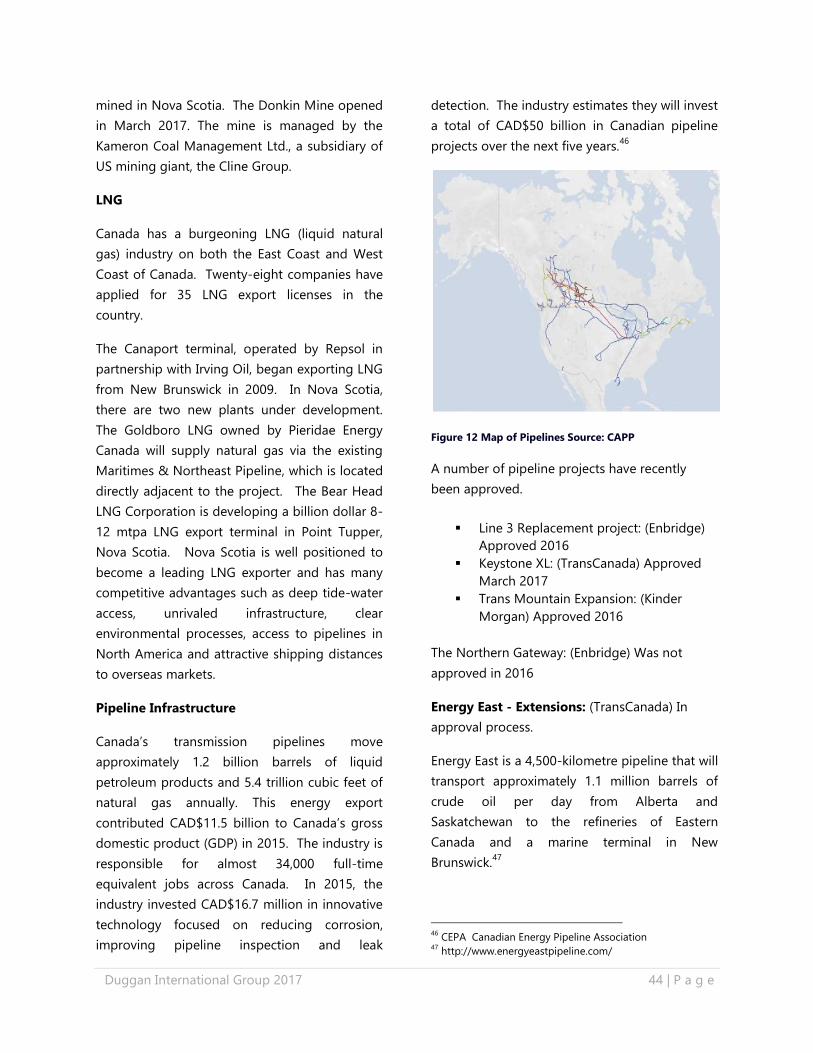
Duggan International Group 2017 44 | P a g e
mined in Nova Scotia. The Donkin Mine opened
in March 2017. The mine is managed by the
Kameron Coal Management Ltd., a subsidiary of
US mining giant, the Cline Group.
LNG
Canada has a burgeoning LNG (liquid natural
gas) industry on both the East Coast and West
Coast of Canada. Twenty-eight companies have
applied for 35 LNG export licenses in the
country.
The Canaport terminal, operated by Repsol in
partnership with Irving Oil, began exporting LNG
from New Brunswick in 2009. In Nova Scotia,
there are two new plants under development.
The Goldboro LNG owned by Pieridae Energy
Canada will supply natural gas via the existing
Maritimes & Northeast Pipeline, which is located
directly adjacent to the project. The Bear Head
LNG Corporation is developing a billion dollar 8-
12 mtpa LNG export terminal in Point Tupper,
Nova Scotia. Nova Scotia is well positioned to
become a leading LNG exporter and has many
competitive advantages such as deep tide-water
access, unrivaled infrastructure, clear
environmental processes, access to pipelines in
North America and attractive shipping distances
to overseas markets.
Pipeline Infrastructure
Canada’s transmission pipelines move
approximately 1.2 billion barrels of liquid
petroleum products and 5.4 trillion cubic feet of
natural gas annually. This energy export
contributed CAD$11.5 billion to Canada’s gross
domestic product (GDP) in 2015. The industry is
responsible for almost 34,000 full-time
equivalent jobs across Canada. In 2015, the
industry invested CAD$16.7 million in innovative
technology focused on reducing corrosion,
improving pipeline inspection and leak
detection. The industry estimates they will invest
a total of CAD$50 billion in Canadian pipeline
projects over the next five years.46
Figure 12 Map of Pipelines Source: CAPP
A number of pipeline projects have recently
been approved.
Line 3 Replacement project: (Enbridge)
Approved 2016
Keystone XL: (TransCanada) Approved
March 2017
Trans Mountain Expansion: (Kinder
Morgan) Approved 2016
The Northern Gateway: (Enbridge) Was not
approved in 2016
Energy East - Extensions: (TransCanada) In
approval process.
Energy East is a 4,500-kilometre pipeline that will
transport approximately 1.1 million barrels of
crude oil per day from Alberta and
Saskatchewan to the refineries of Eastern
Canada and a marine terminal in New
Brunswick.47
46
CEPA Canadian Energy Pipeline Association 47
http://www.energyeastpipeline.com/
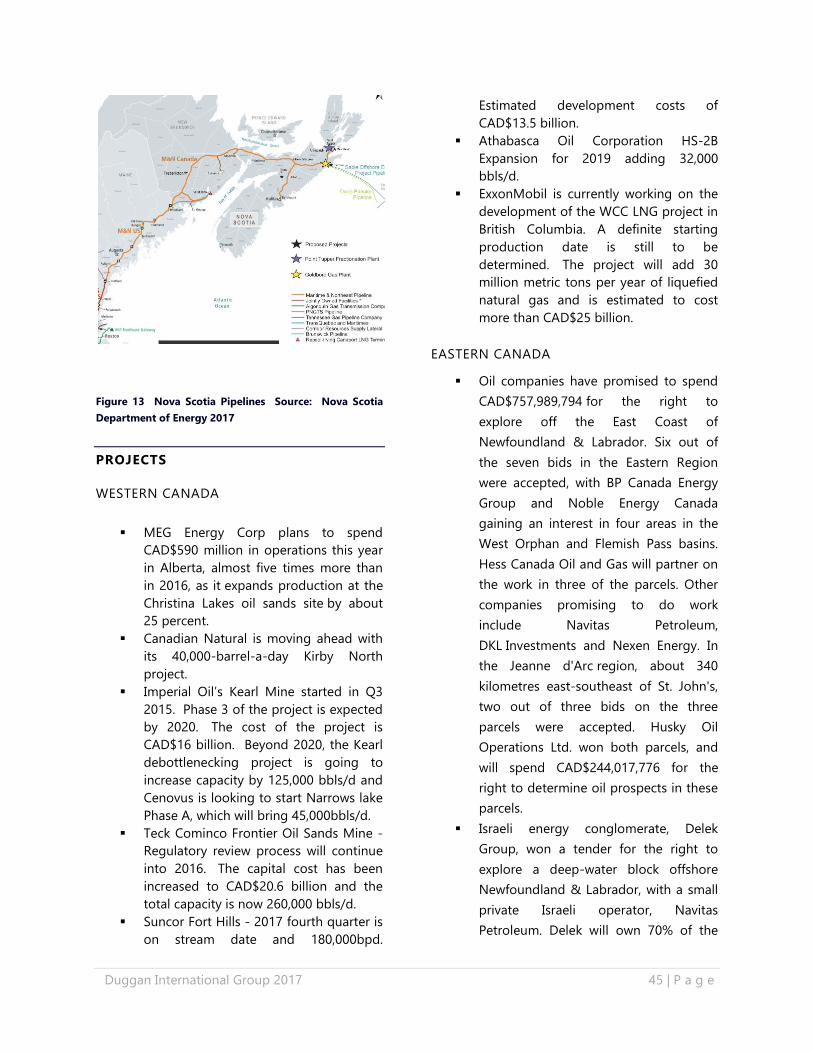
Duggan International Group 2017 45 | P a g e
Figure 13 Nova Scotia Pipelines Source: Nova Scotia
Department of Energy 2017
PROJECTS
WESTERN CANADA
MEG Energy Corp plans to spend
CAD$590 million in operations this year
in Alberta, almost five times more than
in 2016, as it expands production at the
Christina Lakes oil sands site by about
25 percent.
Canadian Natural is moving ahead with
its 40,000-barrel-a-day Kirby North
project.
Imperial Oil’s Kearl Mine started in Q3
2015. Phase 3 of the project is expected
by 2020. The cost of the project is
CAD$16 billion. Beyond 2020, the Kearl
debottlenecking project is going to
increase capacity by 125,000 bbls/d and
Cenovus is looking to start Narrows lake
Phase A, which will bring 45,000bbls/d.
Teck Cominco Frontier Oil Sands Mine -
Regulatory review process will continue
into 2016. The capital cost has been
increased to CAD$20.6 billion and the
total capacity is now 260,000 bbls/d.
Suncor Fort Hills - 2017 fourth quarter is
on stream date and 180,000bpd.
Estimated development costs of
CAD$13.5 billion.
Athabasca Oil Corporation HS-2B
Expansion for 2019 adding 32,000
bbls/d.
ExxonMobil is currently working on the
development of the WCC LNG project in
British Columbia. A definite starting
production date is still to be
determined. The project will add 30
million metric tons per year of liquefied
natural gas and is estimated to cost
more than CAD$25 billion.
EASTERN CANADA
Oil companies have promised to spend
CAD$757,989,794 for the right to
explore off the East Coast of
Newfoundland & Labrador. Six out of
the seven bids in the Eastern Region
were accepted, with BP Canada Energy
Group and Noble Energy Canada
gaining an interest in four areas in the
West Orphan and Flemish Pass basins.
Hess Canada Oil and Gas will partner on
the work in three of the parcels. Other
companies promising to do work
include Navitas Petroleum,
DKL Investments and Nexen Energy. In
the Jeanne d'Arc region, about 340
kilometres east-southeast of St. John's,
two out of three bids on the three
parcels were accepted. Husky Oil
Operations Ltd. won both parcels, and
will spend CAD$244,017,776 for the
right to determine oil prospects in these
parcels.
Israeli energy conglomerate, Delek
Group, won a tender for the right to
explore a deep-water block offshore
Newfoundland & Labrador, with a small
private Israeli operator, Navitas
Petroleum. Delek will own 70% of the
Duggan International Group 2017 46 | P a g e
venture and Navitas the rest. The
partners have committed to invest
CAD$48 million.
BP Oil plans to drill a well in 2018 in
deep waters offshore Nova Scotia. The
maximum number of BP wells would be
six under this plan.
Sable Offshore Energy Decommissioning
project will begin in 2017 in Nova
Scotia. ExxonMobil Canada (EMC) is the
proponent. Opportunities may be found
with contractors Blue Water Group, HNZ
Group, and Secunda Canada LP.
Husky Energy announced an expanded
West White Rose project. The $2.2-
billion project is to produce first oil in
2022, using a fixed wellhead platform
tied to the SeaRose floating production,
storage and offloading vessel about 350
kilometres east of St. John's, N.L. Peak
production is estimated to reach rates
of about 75,000 barrels per day by 2025.
GOVERNMENT REGULATIONS AND
POLICIES
Policies, programs, and regulations are
continually under development at federal,
provincial, territorial, and municipal levels.
WESTERN CANADA - OIL SANDS
Federal review of oil sands development
proposals is coordinated by the Canadian
Environmental Assessment Agency (CEAA). CEAA
works cooperatively with industry and it
facilitates the co-ordination of federal regulatory
reviews and provincial regulators.
Alberta’s facilities are regulated by the provincial
government’s Environment and Parks
department, which sets the policy, and
the Alberta Energy Regulator (AER) ensures the
policy is applied.
Alberta Environment and Parks sets the
thresholds to minimize the impact of oil sands
development on air, land and water and the
development of environmental frameworks. It is
also responsible for regional planning,
integrated land management and land use
policy.48
EASTERN CANADA- OFFSHORE
The primary legislation governing oil and natural
gas activities offshore Newfoundland &
Labrador and Nova Scotia is under the Canada–
Newfoundland and Labrador Atlantic Accord
Implementation Act49
and the Canada-Nova
Scotia Offshore Petroleum Resources Accord
Implementation Act.50
Offshore oil and natural
gas operations in Newfoundland & Labrador are
regulated by the Canada-Newfoundland &
Labrador Offshore Petroleum Board (C-NLOPB),
an independent administrative board jointly
appointed by the federal and provincial
government. Their mandate is to interpret and
apply the provisions of the Atlantic Accord and
the Atlantic Accord Implementation Acts to all
activities of operators in the Newfoundland &
Labrador Offshore Area, and to oversee operator
compliance with those statutory provisions.
Similarly, in Nova Scotia, the Canada-Nova
Scotia Offshore Petroleum Board (C-
NSOPB) regulates the industry. Operators are
required to submit a variety of plans and meet
specific requirements in order to receive
authorization from the C-NLOPB or C-NSOPB to
conduct work offshore: Safety Plan,
Environmental Protection Plan Contingency Plan,
and a Benefits Plan. The Benefits plan describes
a plan for the employment of Canadians and, in
particular, members of the labour force of the
48
http://www.canadasoilsands.ca/en/explore-
topics/regulation-and-monitoring 49
http://laws-lois.justice.gc.ca/eng/acts/C-7.5/ 50
http://laws-lois.justice.gc.ca/eng/acts/C-7.8/
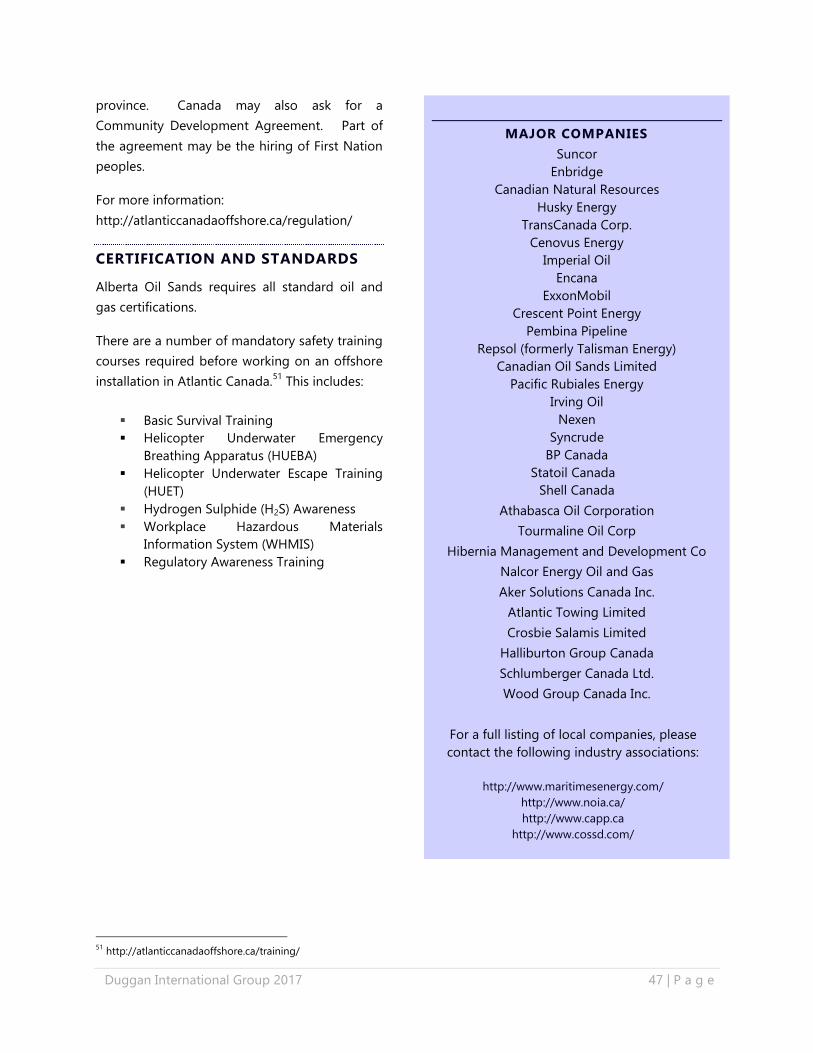
Duggan International Group 2017 47 | P a g e
province. Canada may also ask for a
Community Development Agreement. Part of
the agreement may be the hiring of First Nation
peoples.
For more information:
http://atlanticcanadaoffshore.ca/regulation/
CERTIFICATION AND STANDARDS
Alberta Oil Sands requires all standard oil and
gas certifications.
There are a number of mandatory safety training
courses required before working on an offshore
installation in Atlantic Canada.51
This includes:
Basic Survival Training
Helicopter Underwater Emergency
Breathing Apparatus (HUEBA)
Helicopter Underwater Escape Training
(HUET)
Hydrogen Sulphide (H2S) Awareness
Workplace Hazardous Materials
Information System (WHMIS)
Regulatory Awareness Training
51
http://atlanticcanadaoffshore.ca/training/
MAJOR COMPANIES
Suncor
Enbridge
Canadian Natural Resources
Husky Energy
TransCanada Corp.
Cenovus Energy
Imperial Oil
Encana
ExxonMobil
Crescent Point Energy
Pembina Pipeline
Repsol (formerly Talisman Energy)
Canadian Oil Sands Limited
Pacific Rubiales Energy
Irving Oil
Nexen
Syncrude
BP Canada
Statoil Canada
Shell Canada
Athabasca Oil Corporation
Tourmaline Oil Corp
Hibernia Management and Development Co
Nalcor Energy Oil and Gas
Aker Solutions Canada Inc.
Atlantic Towing Limited
Crosbie Salamis Limited
Halliburton Group Canada
Schlumberger Canada Ltd.
Wood Group Canada Inc.
For a full listing of local companies, please
contact the following industry associations:
http://www.maritimesenergy.com/
http://www.noia.ca/
http://www.capp.ca
http://www.cossd.com/
Duggan International Group 2017 48 | P a g e
WORKING IN CANADA
To do business in Canada, exporters have many
factors to consider. The country has six time
zones, 10 provinces, and three territories, each
which is own provincial government. As the 2nd
largest country in the world, the population is
spread out with 90% of people living within
200kms of the US border.
The country has two official languages, English
and French. Unless doing business in Quebec or
New Brunswick, English will be spoken for
businesses in the energy industry.
Market Strengths:
Strong economic growth and banking
sector
High personal wealth
Large and diverse natural resource
sectors
Strong business and consumer base
Low corruption
Proximity to the US
Incentives for foreign companies to
open branch offices
Market Challenges:
Each province has its own government
system, rule and regulations and taxes
for working in the energy industry,
provincially and municipally, plus there
is another set of rules and regulations
federally
High income and sales taxes. These too
vary by province
Remoteness for travel
The development of tight oil reservoirs
is still in early stages in Canada. The
extent to which these resources can be
produced from is largely undetermined
Future exchange rates present an
uncertainty for Canadian oil producers.
Oil exporters are paid in US dollars,
while most expenses are incurred in
Canadian dollars. A volatile exchange
rate would add further uncertainty in
predicting economic returns for
Canadian producers
As of March 2016, all visitors to Canada are
required to obtain an Electronic Travel
Authorization (eTA) before travelling to Canada.
http://www.cic.gc.ca/english/visit/eta.asp
Work permits for foreign employees are
required. The types depend on the country of
origin. Please seek advice from your nearest
Canadian Consulate or Embassy.
OPPORTUNITIES IN CANADA
Canada’s energy industry is exploring ways to
improve well economics by reducing the cost of
explorations and increasing well productivity.
This will largely be achieved through technology
and process development.
Top opportunities related to the energy sector in
Canada will be predominantly based on dealing
with large industry players working on long term
projects, both in the oil sands and offshore.
FOREIGN DIRECT INVESTMENT
By 2025, oil production is expected to rise to 4.7
million barrels. To support this growth,
investment estimated at CAD$2 trillion is
required. By having 55% of the world’s oil
reserves available for private sector investment,
Canada allows for many opportunities for
foreign companies.
NOVA SCOTIA
The Nova Scotia Department of Energy (NSDOE)
is the leading provincial government department
for the energy industry. Nova Scotia’s offshore
is rich with potential. Several world leaders in oil
and gas are investing in Nova Scotia's offshore,
including Shell Canada, BP, ConocoPhillips
Duggan International Group 2017 49 | P a g e
Canada, Suncor Energy, Woodside Petroleum
and the Hess Corporation. In renewable
energy, Nova Scotia is moving away from coal-
based electricity and towards the use of fuels
that are cleaner and lower in carbon such as
natural gas and other renewables. The province
has an abundance of natural renewable
resources including wind, marine-renewable,
hydropower, geothermal, solar, biomass and
energy storage.52
World Energy City, Halifax, is the capital city of
the province of Nova Scotia with a population of
417,847.
Key Advantages
Primary economic engine for Atlantic
Canada - 20% of the region’s GDP
Strategically located between major
North American, European and Asian
markets
Ranks 8th in International Business
Cost Competitiveness (KPMG,
Competitive Alternatives 2016)Major
North American transportation and
logistics hub
Major projects totaling CAD$31 billion
in Halifax; with CAD$125 billion
throughout Atlantic Canada
Diverse economy powered by growing
industry sectors such as financial
services, transportation and logistics
and ocean technology
One of the most highly-educated
workforces in North America - close to
70% of the working age population
have post-secondary certification
Ranked Top 10 for Business
Friendliness in FDI Magazine’s ranking
of American Cities of the Future
2015/2016
Halifax is a world leader in oceans
research and technology, a growing
sector generating CAD$4.5 billion in
GDP in Nova Scotia and employing
52
https://energy.novascotia.ca/
14% of the province's workforce. Nova
Scotia has the highest concentration
of oceans-related PhDs in the world.
Nova Scotia’s commercial aerospace
and defence sector, with locations
throughout the Province, employs
3,000 people and generates more
than CAD$850 million in revenues
each year. Add the Department of
National Defence (DND) to the mix,
with an additional workforce of 14,439
and annual expenditures of CAD $1.7
billion, and you will see why Nova
Scotia can compete with jurisdictions
worldwide.53
Best Prospects - Oil Sands:
Calgary, Alberta is the World Energy City
Partnership member in Western Canada
representing many corporate offices of
operators in the oil sands.
Maintenance, Repair and Operations
(MRO) for current projects and future
start-ups
Equipment; specialty mining and
extraction equipment/services; drilling
services, refinery equipment, pipeline
construction equipment
Environmental protection services, water
resources, land reclamation, and
reducing associated greenhouse gas
emissions
Environmental remediation technology
and services, tailings treatment, barrier
walls, off-stream water storage
Safety/security equipment and services
Pipeline construction equipment and
services
New technologies for solvent
injection/co-injection (in situ), waterless
extraction (mining), radiofrequency
heating/electrical heating (in situ), and
“field” upgrading techniques
53
Invest Canada & Halifax Partnership
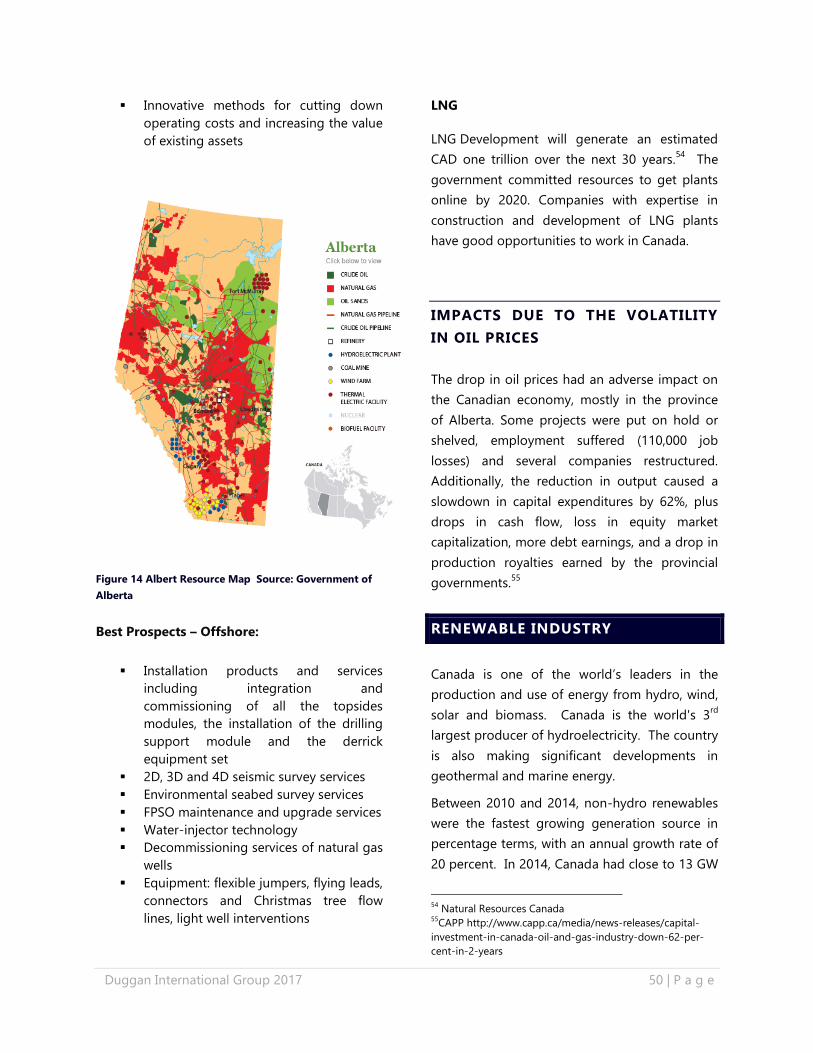
Duggan International Group 2017 50 | P a g e
Innovative methods for cutting down
operating costs and increasing the value
of existing assets
Figure 14 Albert Resource Map Source: Government of
Alberta
Best Prospects – Offshore:
Installation products and services
including integration and
commissioning of all the topsides
modules, the installation of the drilling
support module and the derrick
equipment set
2D, 3D and 4D seismic survey services
Environmental seabed survey services
FPSO maintenance and upgrade services
Water-injector technology
Decommissioning services of natural gas
wells
Equipment: flexible jumpers, flying leads,
connectors and Christmas tree flow
lines, light well interventions
LNG
LNG Development will generate an estimated
CAD one trillion over the next 30 years.54
The
government committed resources to get plants
online by 2020. Companies with expertise in
construction and development of LNG plants
have good opportunities to work in Canada.
IMPACTS DUE TO THE VOLATILITY
IN OIL PRICES
The drop in oil prices had an adverse impact on
the Canadian economy, mostly in the province
of Alberta. Some projects were put on hold or
shelved, employment suffered (110,000 job
losses) and several companies restructured.
Additionally, the reduction in output caused a
slowdown in capital expenditures by 62%, plus
drops in cash flow, loss in equity market
capitalization, more debt earnings, and a drop in
production royalties earned by the provincial
governments.55
RENEWABLE INDUSTRY
Canada is one of the world’s leaders in the
production and use of energy from hydro, wind,
solar and biomass. Canada is the world's 3rd
largest producer of hydroelectricity. The country
is also making significant developments in
geothermal and marine energy.
Between 2010 and 2014, non-hydro renewables
were the fastest growing generation source in
percentage terms, with an annual growth rate of
20 percent. In 2014, Canada had close to 13 GW
54
Natural Resources Canada 55
CAPP http://www.capp.ca/media/news-releases/capital-
investment-in-canada-oil-and-gas-industry-down-62-per-
cent-in-2-years
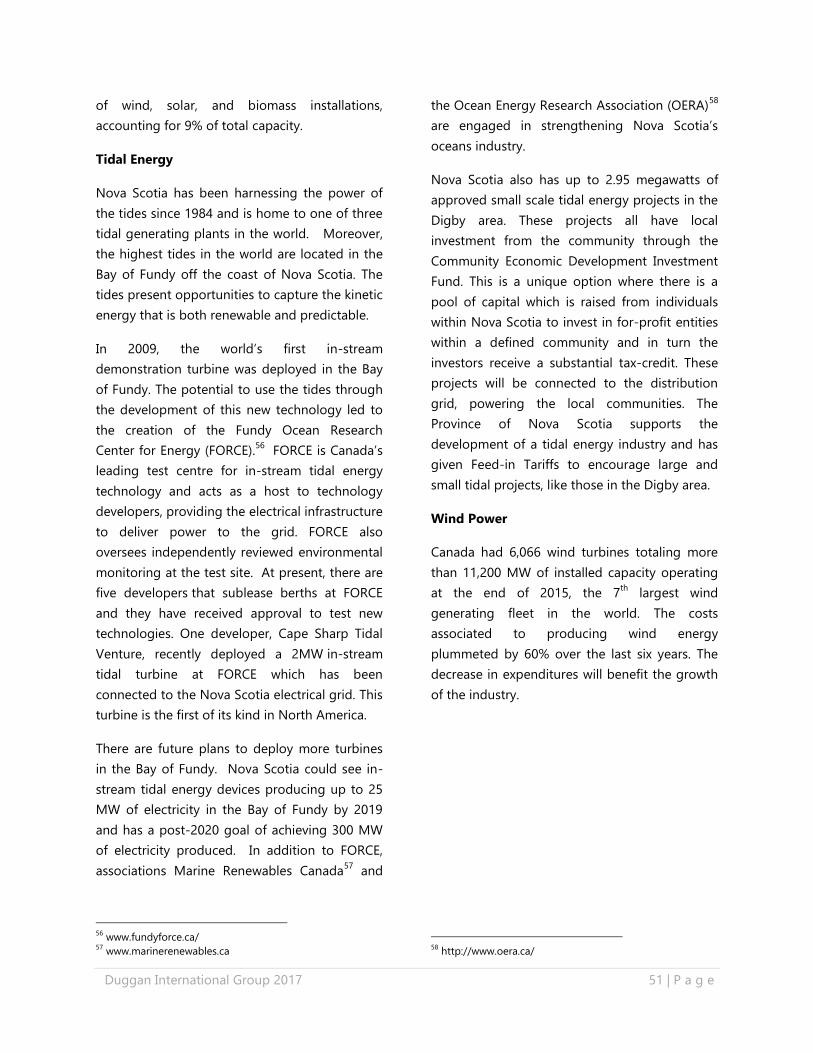
Duggan International Group 2017 51 | P a g e
of wind, solar, and biomass installations,
accounting for 9% of total capacity.
Tidal Energy
Nova Scotia has been harnessing the power of
the tides since 1984 and is home to one of three
tidal generating plants in the world. Moreover,
the highest tides in the world are located in the
Bay of Fundy off the coast of Nova Scotia. The
tides present opportunities to capture the kinetic
energy that is both renewable and predictable.
In 2009, the world’s first in-stream
demonstration turbine was deployed in the Bay
of Fundy. The potential to use the tides through
the development of this new technology led to
the creation of the Fundy Ocean Research
Center for Energy (FORCE).56
FORCE is Canada’s
leading test centre for in-stream tidal energy
technology and acts as a host to technology
developers, providing the electrical infrastructure
to deliver power to the grid. FORCE also
oversees independently reviewed environmental
monitoring at the test site. At present, there are
five developers that sublease berths at FORCE
and they have received approval to test new
technologies. One developer, Cape Sharp Tidal
Venture, recently deployed a 2MW in-stream
tidal turbine at FORCE which has been
connected to the Nova Scotia electrical grid. This
turbine is the first of its kind in North America.
There are future plans to deploy more turbines
in the Bay of Fundy. Nova Scotia could see in-
stream tidal energy devices producing up to 25
MW of electricity in the Bay of Fundy by 2019
and has a post-2020 goal of achieving 300 MW
of electricity produced. In addition to FORCE,
associations Marine Renewables Canada57
and
56
www.fundyforce.ca/ 57
www.marinerenewables.ca
the Ocean Energy Research Association (OERA)58
are engaged in strengthening Nova Scotia’s
oceans industry.
Nova Scotia also has up to 2.95 megawatts of
approved small scale tidal energy projects in the
Digby area. These projects all have local
investment from the community through the
Community Economic Development Investment
Fund. This is a unique option where there is a
pool of capital which is raised from individuals
within Nova Scotia to invest in for-profit entities
within a defined community and in turn the
investors receive a substantial tax-credit. These
projects will be connected to the distribution
grid, powering the local communities. The
Province of Nova Scotia supports the
development of a tidal energy industry and has
given Feed-in Tariffs to encourage large and
small tidal projects, like those in the Digby area.
Wind Power
Canada had 6,066 wind turbines totaling more
than 11,200 MW of installed capacity operating
at the end of 2015, the 7th
largest wind
generating fleet in the world. The costs
associated to producing wind energy
plummeted by 60% over the last six years. The
decrease in expenditures will benefit the growth
of the industry.
58
http://www.oera.ca/
Duggan International Group 2017 52 | P a g e
Figure 15 Wind Farm Map Source: Nova Scotia Power
According to the Canadian Wind Energy
Association, Canada's wind capacity was 10.4
GW as of September 2015. A record year in
terms of wind energy developments, 2014 saw
37 new wind projects added, totaling 1.9 GW of
capacity. Financially, the wind energy business is
expected to increase from about CAD$290
million a year to an estimated CAD$450 million
by 2020.59
Atlantic Canada has the country’s strongest
winds. And, because the winds also correlate
with peak demand, wind energy has become the
lowest-cost option for new electricity supply.
Nova Scotia leads the region with 597 MW of
onshore wind energy, developed through a
unique mix of ownership models that includes
independent power production, utility
partnerships, and community investment.60
According to Nova Scotia Power, wind now
provides from 13% - 17% of electricity in Nova
Scotia. Nova Scotia Power reached its target of
28% in 2016 of renewable energy to its grid and
the company estimates 40% by 2020.
59
BP Statistical Review of World Energy 2014 60
http://canwea.ca/wind-energy/atlantic-canada/
Companies operating the Nova Scotia’s wind
power industry are local, national and
international. Companies include Cape Breton
Explorations Ltd., Scotia WindFields Inc., Natural
Forces Inc., Renewable Energy Services Inc.,
Capstone Infrastructure Inc. and Shearwind.
Some wind farms are operated by the
municipality. International companies working in
the province include Enel S.p.A., GDF SUEZ
Energy North America Inc., Acciona Wind Power
and Enercon. German company, IFE Eriksen,
recently announced it was opening an office in
Halifax to spearhead its Canadian properties.
Newfoundland & Labrador has 55 MW of wind,
consisting of two utility-scale projects and one
wind-diesel installation. In 2016, Copenhagen
Infrastructure Partners announced that it has
established a partnership with the Canadian-
based developer Beothuk Energy to develop the
180MW St Georges Bay Project off the coast of
Newfoundland. Ontario remains Canada’s leader
in clean wind energy with 4,781 MW of installed
capacity, supplying approximately 5% of the
province’s electricity demand. Ontario also
added 11 installations to the province’s current
wind fleet -an additional 420 MW to current
generation capacity.61
Alberta now ranks 3rd
in
Canada with an installed wind energy capacity of
1,479 MW. Companies operating in Alberta
include ACCIONA, S.A., Carmanah Technologies
Corp., Conergy AG, Effisolar Energy Corp.,
Endurance Wind Power Inc., Hitachi Canadian
Industries Ltd, Partner Technologies Inc., Sequoia
Energy Inc., Sustainable Energy Technologies
Ltd., TransAlta Corp. and Western Wind Energy
Corp.
61
http://canwea.ca/wind-energy/ontario/

Duggan International Group 2017 53 | P a g e
Hydropower
Canada is the 3rd
largest producer of
hydropower in the world behind China and
Brazil. Canada currently has an installed capacity
of about 78,000 megawatts and has the ability to
more than double capacity to 160,000
megawatts.
The Robert-Bourassa generating station
(formerly known as La Grande-2) is the largest
hydroelectric power station in Canada, located in
James Bay, Quebec. The station can generate
5,616MW. The Churchill Falls Generating Station
in Newfoundland & Labrador is the 2nd
largest in
Canada, generating 5,428 MW. The hydropower
station is a joint venture between Churchill Falls
Labrador Corporation Ltd., Nalcor Energy and
Quebec Hydro.
Nalcor is also in the process of building a new
station on the Churchill River in Newfoundland
& Labrador, Muskrat Falls. The station will
generate an estimated 824 megawatts (MW),
and the company will be building more than
1,600km of associated transmission lines.
Construction is set to be completed by 2018 for
the underwater Maritime Link transmission line
from Newfoundland & Labrador to bring
Muskrat Falls’ hydropower to Nova Scotia.
Nova Scotia Power owns and operates 33
hydroelectric plants on 17 hydro river systems
across Nova Scotia, totaling 400 MW of
generation capacity. Many plants have been
providing clean, renewable electricity to Nova
Scotians for decades, with some established in
the early 1900s.62
62
http://www.nspower.ca/en/home/about-us/how-we-make-
electricity/renewable-electricity/hydro-station-map.aspx
Biomass
With Canada’s ample forests, the country has
great opportunities to develop its biomass
industry. Biomass is becoming an attractive
alternative for heating in the form of wood
pellets, especially in the NWT, where it is cost-
competitive with alternative heating fuels. The
total installed capacity of registered wood-pellet
boilers in the NWT has increased by 35% per
year since 2006.
Biomass energy is expected to grow from
2.2 GW in 2014 to 3.8 GW in 2040. Most new
capacity is being added in British Columbia,
Ontario, Quebec and Alberta. In Ontario, two
former coal-fired units were recently converted
to biomass.63
In Nova Scotia, large and medium-sized pulp
and paper companies use wood chips to create
electricity to run their mills. Some companies sell
excess power to Nova Scotia Power. The
provincial energy provider also operates a 60
megawatt biomass power plant in Port
Hawkesbury.64
Nuclear
Nuclear energy accounted for 15% of total
electricity generation in Canada in 2014.
Following the shut-down of the Gentilly facility
in Quebec in 2012, Ontario and New Brunswick
are the only provinces using nuclear power to
generate electricity.
Solar Power
Canada has more than 2,500 MW of cumulative
installed solar electricity generation capacity. The
63
https://www.neb-one.gc.ca/nrg/ntgrtd/ftr/2016/index-
eng.html 64
http://www.nspower.ca/en/home/about-us/how-we-make-
electricity/renewable-electricity/default.aspx
Duggan International Group 2017 54 | P a g e
country is one of the top-ten largest national
global markets. 65
Ontario is the leader for solar energy projects.
Ontario has the 3rd
largest solar capacity in
North America after California and North
Carolina. Currently, Ontario has PV capacity of
over 2 GW, enough to place Canada among the
top 20 solar countries worldwide.66
Canada also offers programs to promote use of
solar energy. In Alberta, its government has a
rebate program worth CAD $36 million over two
years to encourage rooftop solar panels on
homes and businesses.67
In Nova Scotia, the
Nova Scotia Department of Energy is running a
pilot program, “Solar for Community Buildings”.
The program works with eligible community
groups and organizations to generate solar
photovoltaic (PV) electricity on their roofs or
properties and sell it to their utility under a 20-
year contract.68
Companies working in Nova
Scotia’s solar industry are members of Solar
Nova Scotia, http://www.solarns.ca/.
OPPORTUNITIES
Canada ranks high on the list of top markets for
renewable energy exporters, despite its
comparatively small market size compared to
other countries.
Best Prospects:
Electric Motors and Generators
Boards & Panels for Breakers and Fuses
Electrical Transformers
65
http://www.cansia.ca/solar-pv.html 66
https://www.investinontario.com 67
http://www.cbc.ca/news/canada/edmonton/alberta-
announces-36m-rebate-program-for-solar-panels-on-
homes-businesses-1.4002193 68
https://novascotia.ca/solar/
Wind turbines, tower sections, rotor
blades, casting and forgings and
transformers
Gears and generators for wind turbines
Hydro energy turbines and equipment
Engineering, construction, and logistics
services
Smart Grid connection and energy
monitoring equipment
Biomass systems technology transfer
New technology for wave and tidal
power generation
Marine consulting on the environmental
effects of tidal turbines
Products and service for the Maritime
Link underwater transmission cable
between Newfoundland & Labrador and
Nova Scotia.
GOVERNMENT POLICIES/REGULATIONS
THAT ENCOURAGE SUSTAINABLE
TECHNOLOGIES
Emissions from the combustion of fossil fuels
accounted for approximately 80% of Canada’s
GHG emissions. In March 2016, the Canadian
federal government created the Vancouver
Declaration Clean Growth and Climate Change.69
This declaration built upon the 2015 Quebec
Declaration and Canadian Energy Strategy70
and
the Paris Agreement.71
The Government of
Canada plans to develop a strategy to achieve
Canada's international commitments through a
pan-Canadian framework for clean growth and
climate change.72
In December 2016, the
Government of Canada created a national
climate plan featuring a price on carbon and
significant support for Canada’s clean tech
69
http://www.scics.gc.ca/english/conferences.asp?a=viewdoc
ument&id=2401 70
http://canadaspremiers.ca/en/initiatives/130-energy-
working-group 71
http://www.climatechange.gc.ca/default.asp?lang=En&n=E
F6CE373-1 72
http://www.scics.gc.ca/english/conferences.asp?a=viewdoc
ument&id=2401
Duggan International Group 2017 55 | P a g e
sector. The plan outlines federal government
department strategies and funding programs.
The carbon tax will be a new tax for most
provinces. Provinces have two choices: (1) a
carbon tax of CAD$10 per tonne in 2018, rising
to CAD$50 by 2022; or (2) a cap-and-trade
system consistent with Canada’s emissions
target. The federal government’s plan requires
all provinces and territories to have a price on
carbon by 2018.
Provincial governments have also set carbon
reducing targets. Nova Scotia has legislated that
40% of its electricity be generated from
renewable energy sources by 2020. The Alberta
government’s target is 30% of electricity in the
Province be sourced from renewable sources.
Newfoundland & Labrador generates more than
95% of its power from renewable resources,
primarily hydro. Newfoundland & Labrador set
out a GHG reduction target of 10% below the
1990 level by 2020 and then to 75-85% below
2001 levels by year 2050.73
FUNDING INCENTIVES
Funding in Canada for SME’s derives mostly
from the federal government and may be
implemented by provincial governments,
nonprofit groups or trade associations. As well,
provincial governments offer a variety of
incentives for foreign direct investment.
Foreign companies should have a Canadian
partner as the lead to access Canadian funding
programs.
Some federal funding incentives include:
NRCan
73
https://www.neb-
one.gc.ca/nrg/sttstc/lctrct/rprt/2016cndrnwblpwr/prvnc/nl-
lb-eng.html
Clean Energy Fund (has been fully allocated)
http://www.nrcan.gc.ca/energy/funding/current-
funding-programs/cef/4949
Energy Innovation Program
http://www.nrcan.gc.ca/energy/funding/current-
funding-programs/18709
Sustainable Development Technology Canada
(SDTC) SD Tech Fund
https://www.sdtc.ca/en/apply/sd-tech-fund
Next Gen Biofuels Fund
https://www.sdtc.ca/en/funding/funds/nextgen
SD Natural Gas Fund
https://www.sdtc.ca/en/apply/sd-natural-gas-
fund
Business Development Bank of Canada
Industrial, Clean and Energy (ICE) Technology
Venture Fund https://www.bdc.ca/en/bdc-
capital/venture-capital/strategic-
approach/pages/energy-cleantech-venture-
fund.aspx
National Research Council Canada
IRAP (Industrial Research Assistance Program)
http://www.nrc-
cnrc.gc.ca/eng/irap/services/financial_assistance.
html
Natural Sciences and Engineering Council of
Canada Grants
http://www.nserc-crsng.gc.ca/Business-
Entreprise/FundingPrograms-
ProgrammeDeSubventions/index_eng.asp
Canada Revenue Agency
Scientific Research and Experimental
Development (SR&ED)
http://www.cra-arc.gc.ca/txcrdt/sred-
rsde/menu-eng.html
Duggan International Group 2017 56 | P a g e
Atlantic Canada Only:
Atlantic Canada Opportunities Agency (ACOA)
Atlantic Innovation Fund (AIF)
http://www.acoa-
apeca.gc.ca/eng/ImLookingFor/ProgramInformat
ion/AtlanticInnovationFund/Pages/AtlanticInnov
ationFund.aspx
OTHER SOURCES OF INFORMATION
US Government EIA Country Analysis Brief –
Canada
https://www.eia.gov/beta/international/
UK Government Doing Business in Canada
https://www.gov.uk/government/publications/
Offshore Technology – Canada
http://www.offshore-technology.com
Government of Canada
https://www.canada.ca/en/services/environment
/weather/climatechange/pan-canadian-
framework.html
National Energy Board
https://www.neb-
one.gc.ca/nrg/ntgrtd/ftr/2016/index-eng.html
Canadian Wind Energy Association
http://canwea.ca/wind-energy/
Statistics Canada
http://www.statcan.gc.ca/tables-tableaux/sum-
som/l01/cst01/dsbbcan-eng.htm
NOIA-Newfoundland & Labrador Oil & Gas
Industries Association
www.noia.ca
Invest in Canada 2014 Renewable Energy Wind
& Solar
Canadian Association of Petroleum Producers
www.capp.ca
Natural Resources Canada Energy Fact Book
2015-2016
NOTES:
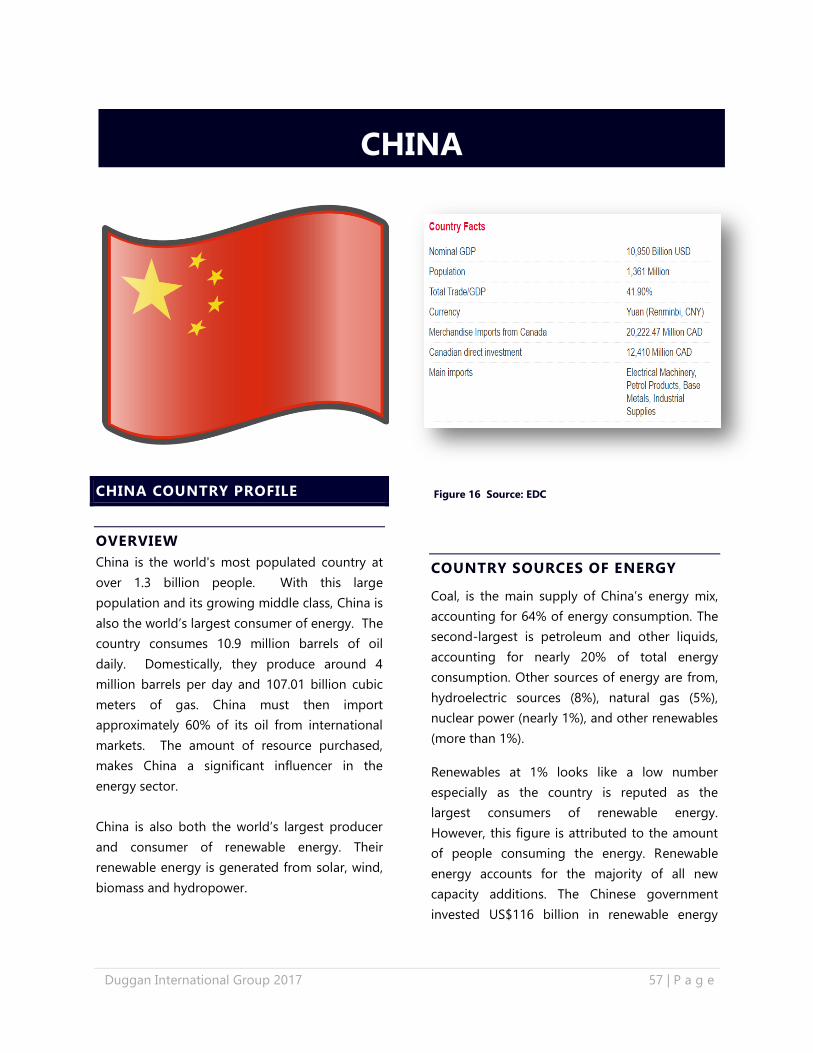
Duggan International Group 2017 57 | P a g e
CHINA COUNTRY PROFILE
OVERVIEW
China is the world's most populated country at
over 1.3 billion people. With this large
population and its growing middle class, China is
also the world’s largest consumer of energy. The
country consumes 10.9 million barrels of oil
daily. Domestically, they produce around 4
million barrels per day and 107.01 billion cubic
meters of gas. China must then import
approximately 60% of its oil from international
markets. The amount of resource purchased,
makes China a significant influencer in the
energy sector.
China is also both the world’s largest producer
and consumer of renewable energy. Their
renewable energy is generated from solar, wind,
biomass and hydropower.
COUNTRY SOURCES OF ENERGY
Coal, is the main supply of China’s energy mix,
accounting for 64% of energy consumption. The
second-largest is petroleum and other liquids,
accounting for nearly 20% of total energy
consumption. Other sources of energy are from,
hydroelectric sources (8%), natural gas (5%),
nuclear power (nearly 1%), and other renewables
(more than 1%).
Renewables at 1% looks like a low number
especially as the country is reputed as the
largest consumers of renewable energy.
However, this figure is attributed to the amount
of people consuming the energy. Renewable
energy accounts for the majority of all new
capacity additions. The Chinese government
invested US$116 billion in renewable energy
Figure 16 Source: EDC
CHINA
Duggan International Group 2017 58 | P a g e
transactions in 2015, the most of any country in
the world.
CURRENT STATE OF ENERGY USE AND
‘ENERGY DIRECTION’
In an effort to reduce heavy air pollution and the
country’s dependence on coal, China plans to
limit coal use to 62% of its total primary energy
consumption by 2020.74
This target is to raise
non-fossil fuel energy consumption to 15% of
the energy mix and again another 20% by 2030.
However, as consumption grows, so will the use
of coal, the plan is to decrease coal’s share of
the energy mix, not the amount used.
Additionally, to increase the demand for natural
gas, the government reduced the price for
commercial users to better reflect market
conditions. The government hopes to increase
the country’s use of natural gas to 10 percent.
Analysts predict that China’s consumption of
crude oil by the year 2020 will be 12 million
barrels a day. And, by 2030, 80% of China’s
crude oil supply will have to be imported.
ENERGY INDUSTRY
OIL AND GAS
China has 713 oilfields and 267 gas fields. In
2015, 11 new oilfields and 10 new gas fields
were put into production. China’s oil and gas
sector is mature and it supplies only the
domestic market.
China has three established major “National Oil
Companies” (NOCs) - China National Petroleum
Corporation (CNPC), China Petroleum and
Chemical Corporation (Sinopec), and China
National Offshore Oil Corporation (CNOOC).
74
China International Analysis U.S. Energy Information A
dministration (EIA)
CNPC is in charge of most of the country's
onshore upstream assets, and Sinopec is
responsible for the downstream activities such as
refining, distribution, and petrochemicals; and
CNOOC is responsible for the exploration and
development of China’s oil and gas assets in the
offshore areas of China.
CNPC is the leading upstream player in China
and, along with its publicly listed arm,
PetroChina, accounts for an estimated 54% and
77% of China's crude oil and natural gas output.
CNPC's current strategy is to integrate its
business sectors and capture more downstream
market share. Sinopec seeks to acquire more
upstream assets to capture more value from oil
and gas production and diversify its revenue
sources.
CNOOC is a growing competitor to CNPC and
Sinopec as the company is increasing its E&P
expenditures in the South China Sea and
extending its reach into the downstream sector,
particularly in the southern Guangdong
Province.
China also has state-owned oil firms and private
companies. Sinochem Corporation, CITIC Group,
and Yanchang Petroleum are relatively small
state-owned firms that have expanded their
presence in China's oil sector. Several
independent and private companies own
downstream oil infrastructure such as refineries,
but their scope has remained limited by
government policies that favour NOCs.
Onshore oil production in China is mostly limited
to China's NOCs, but international oil companies
(IOCs) have been granted greater access to
offshore oil prospects. This is mostly in
technically challenging onshore gas fields. IOCs
offer their technical expertise in order to partner
with a Chinese NOC and to gain entry into the
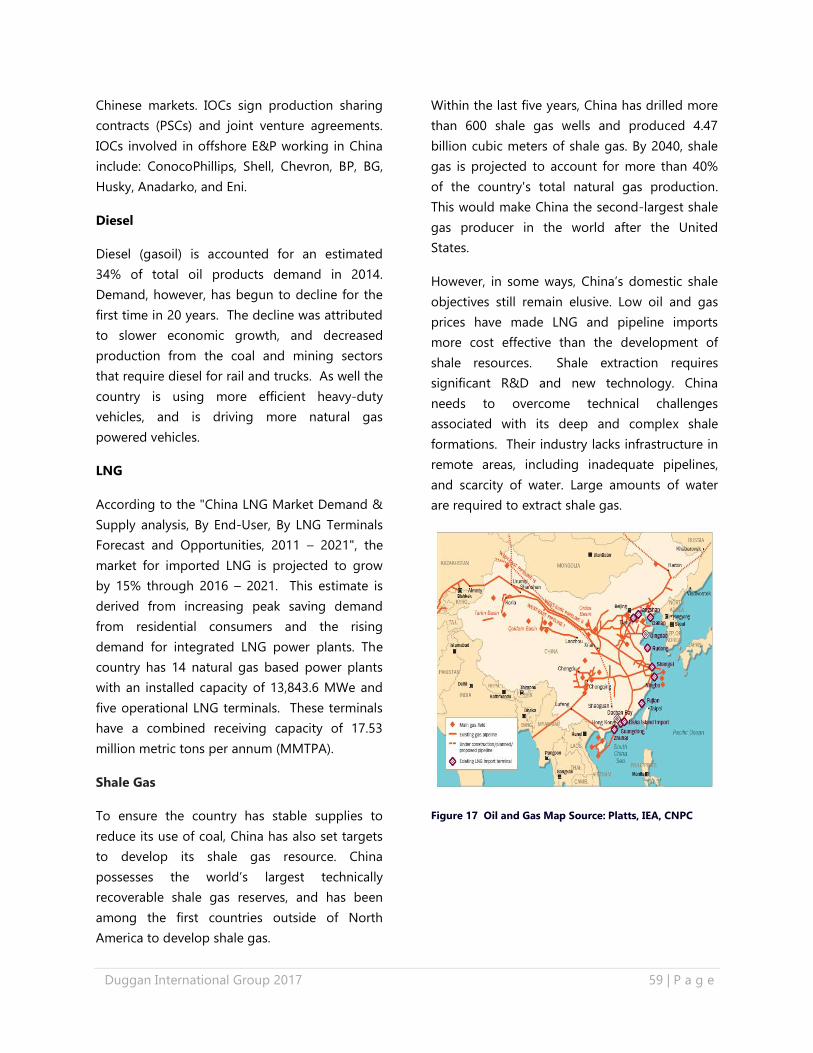
Duggan International Group 2017 59 | P a g e
Chinese markets. IOCs sign production sharing
contracts (PSCs) and joint venture agreements.
IOCs involved in offshore E&P working in China
include: ConocoPhillips, Shell, Chevron, BP, BG,
Husky, Anadarko, and Eni.
Diesel
Diesel (gasoil) is accounted for an estimated
34% of total oil products demand in 2014.
Demand, however, has begun to decline for the
first time in 20 years. The decline was attributed
to slower economic growth, and decreased
production from the coal and mining sectors
that require diesel for rail and trucks. As well the
country is using more efficient heavy-duty
vehicles, and is driving more natural gas
powered vehicles.
LNG
According to the "China LNG Market Demand &
Supply analysis, By End-User, By LNG Terminals
Forecast and Opportunities, 2011 – 2021", the
market for imported LNG is projected to grow
by 15% through 2016 – 2021. This estimate is
derived from increasing peak saving demand
from residential consumers and the rising
demand for integrated LNG power plants. The
country has 14 natural gas based power plants
with an installed capacity of 13,843.6 MWe and
five operational LNG terminals. These terminals
have a combined receiving capacity of 17.53
million metric tons per annum (MMTPA).
Shale Gas
To ensure the country has stable supplies to
reduce its use of coal, China has also set targets
to develop its shale gas resource. China
possesses the world’s largest technically
recoverable shale gas reserves, and has been
among the first countries outside of North
America to develop shale gas.
Within the last five years, China has drilled more
than 600 shale gas wells and produced 4.47
billion cubic meters of shale gas. By 2040, shale
gas is projected to account for more than 40%
of the country's total natural gas production.
This would make China the second-largest shale
gas producer in the world after the United
States.
However, in some ways, China’s domestic shale
objectives still remain elusive. Low oil and gas
prices have made LNG and pipeline imports
more cost effective than the development of
shale resources. Shale extraction requires
significant R&D and new technology. China
needs to overcome technical challenges
associated with its deep and complex shale
formations. Their industry lacks infrastructure in
remote areas, including inadequate pipelines,
and scarcity of water. Large amounts of water
are required to extract shale gas.
Figure 17 Oil and Gas Map Source: Platts, IEA, CNPC
Duggan International Group 2017 60 | P a g e
PROJECTS
Top producing oil and gas fields are Daqing,
Shengli, Changqing, Bohai, Yanchang, Xinjiang,
Liaohe, Sinopec-Northwest, Tarim and Jilin.
ConocoPhillips and CNOOC are
developing the Penglai 19-3 Oilfield, the
largest offshore oil reservoir so far in
China; CP has a commercial equity of 49
percent. In 2015, CP reported 782 MM$
revenues in China, down from 1,701 in
2014 (ConocoPhillips 2016).
Husky Energy is producing natural gas
with an interest of 49% from deepwater
Liwan gas field since 2014 (Husky 2016).
Shell is producing Changbei tight gas
field in Shaanxi with CNPC under a 49%
agreement. (CNPC-Shell2014).
Chevron is now cooperating with CNPC
in Chuandongbei natural gas field in
southwest China, which initiated
production in early 2016 (Chevron-AR
2016).
BP signed a PSC with CNPC for shale gas
exploration in Neijiang-Dazu shale
blocks (Guo and Paton 2016).
A fresh injection of investment from the China
Development Bank is financing the fourth and
final leg of the Central Asia-China gas pipeline.
Construction on the pipeline began in 2007, and
once it is finished, it will reach an annual
deliverability of 85 billion cubic metres – making
it the largest gas transportation system in Asia.
China is amongst one of the nations invested in
Uzbekistan’s oil and gas industry.
Another company, Empyrean Energy, has
received a permit for 100% of exploration
rights from China National Offshore Oil
(CNOOC)for Block 29/11 in the Pearl River
Mouth Basina, 200km south-east of Hong
Kong. During the exploration phase, Empyrean
will operate the permit, which is in seabed
depths of 340m-600m. The company will
acquire and complete processing and technical
evaluation of 500km² of 3D seismic data.
GOVERNMENT REGULATIONS AND
POLICIES
The Chinese government's energy policies are
dominated by the country's growing demand for
oil and its reliance on oil imports. The National
Energy Administration (NEA) acts as the key
energy regulator.
In 2011, China installed an ad valorem resource
tax of 5% on all oil and gas production, including
unconventional resources output, in an attempt
to increase revenues for local and regional
governments, and to encourage more-efficient
hydrocarbon production. The resource tax was
raised to 6% in late 2014, although the tax rate
was lower for projects using certain enhanced oil
recovery (EOR) techniques or containing high
sulfur or heavy oil.75
In oil and gas, China's NOCs must hold the
majority participating interest in product sharing
contracts and can become the operator once
development costs have been recovered.
Foreign developers in the offshore wind industry
are only allowed a minority share, up to 49% of
Chinese offshore projects. 76
Chinese laws and regulations for the energy
sector are noted as vague or poorly defined. It
could be difficult for foreign firms to determine
whether their activities are in accordance with
regulations. It is important for IOCs and
exporters to hire an energy consultant to help
navigate regulations.
75
https://energy.gov/sites/prod/files/2016/04/f30/China_Inter
national_Analysis_US.pdf 76
trade.gov/topmarkets/pdf/Renewable_Energy_China.pdf
Duggan International Group 2017 61 | P a g e
CERTIFICATION AND STANDARDS
Most companies operating in China have passed
ISO 9000 QMS certificates, and most of their
products are API and ASME certified.
WORKING IN CHINA
Market Strengths:
Country is seeking to rebalance the
economy away from investment-led
growth and towards consumption
Country is considering to further open
up the oil and gas exploration sector to
private-sector investment
Largest country in the world by
population with over 160 cities of more
than a million inhabitants
Fast growing consumer market resulting
from increasing number of middle
income consumers
Growth ensured by Chinese monetary
policy
Forecast to become the world’s largest
luxury goods market by 2020
There are many export barriers for doing
business in China that Nova Scotia companies
need to take into consideration.
Market Challenges:
Large parts of the economy are still
closed to full foreign participation
Strong competition from well-resourced
and positioned state-owned enterprises
Finding and retaining the right skills in
the local workforce
Complex business culture
Language barriers
Need for patience to build up trust and
networks
Significant time difference
Weather extremes across the country
and high levels of pollution in certain
urban centres
Anti-monopoly legislation in relation to
foreign firms
Patience in finding the right partners
and establishing relationships
Poor intellectual property rights
Lack of transparency of the regulatory
environment
Corruption with the tendering processes
China is not one single market, as indicated by
the oil and gas map. Exporters will need to
understand the regional economic and cultural
differences when working in China. Nova Scotia
companies should consider using export agents
or distributors in China and partner with an
international company with experience working
in China.
MAJOR COMPANIES
Chinese National Petroleum Corporation (CNPC)
Sinopec
Chinese National Offshore Oil Corporation
(CNOOC)
Yanchang Petroleum
China Shenhua Energy
China Huadian Corporation
Huaneng Power International, Inc.
Beijing Enterprises Holdings
South Sea Petroleum Holdings Limited
Offshore Oil Engineering Co., Ltd.
Mongolia Energy Corporation
Shenergy Group Company Limited
Industry trade association is China Petroleum &
Petrochemical Equipment Industry Association
(CPEIA) http://www.cpeia.org.cn/en/index.shtml
The Association has approximately 900
members.
Duggan International Group 2017 62 | P a g e
OPPORTUNITIES FOR NOVA SCOTIA
EXPORTERS
Karamay, Daqing and Dongying are the three
membership cities of the World Energy City
Partnership.
At present, IOCs mostly team up with CNOOC in
offshore oil development projects. Service
companies often work on both onshore and
offshore projects, which include complicated and
complex drillings. IOCs and international service
companies have started working with Sinopec,
PetroChina and Yanchang to develop shale gas
and tight oil and gas in Sichuan, the Erdos Basin,
and Xinjiang.
The best opportunities in China are in sectors
where domestic companies do not have the
capacity and where there is government support.
Best Prospects
Equipment:
Parts for sinking and boring machinery
Positive displacement pumps
New oil and gas exploitation technologies:
Steam-assisted gravity drainage
(onshore)
Geologic exploration equipment,
position
Navigation systems
Deep-water drill systems (offshore)
Shale Gas:
Fracturing technology
Water efficiency
Deep extraction technologies
Unconventional Gas:
Technologies and expertise in tight gas,
coal-bed methane and coal gasification
IMPACTS DUE TO THE VOLATILITY
IN OIL PRICES
As the world’s largest importers of oil and gas,
falling prices are actually good for the Chinese
economy. The Chinese government is able to fill
its strategic petroleum reserve with inexpensive
foreign crude oil. However for the producers,
lower prices have forced CNOCC and Sinopec to
decrease capital expenditures and reduce
production from high cost wells.
RENEWABLE INDUSTRY
Driving the renewable energy industry in China
is the population demand. Yet China is not
without its issues in delivery. Increased capacity
of the renewable industry has not led to
increased power generation. Some clean power
has been left idle due to transmission
bottlenecks, particularly in the northern and
western provinces. The Chinese Government
took aggressive steps to remedy this situation in
March 2016. They ordered power transmission
companies to provide grid connectivity for all
renewable power generation sources that meet
the technical standards.
China’s renewable energy industry also lacks
coordinated planning to ensure sufficient
feedstock supplies, power grid accessibility, and
efficient distribution of projects. For example,
biomass projects are often built too close
together resulting in a lack of sufficient inputs,
and lack of coordination between wind power
producers has resulted in inefficient use of high-
value land.77
77
http://www.ccbc.com/zh-hant/research-reports-2/sectoral-
research/clean-energy-sector/
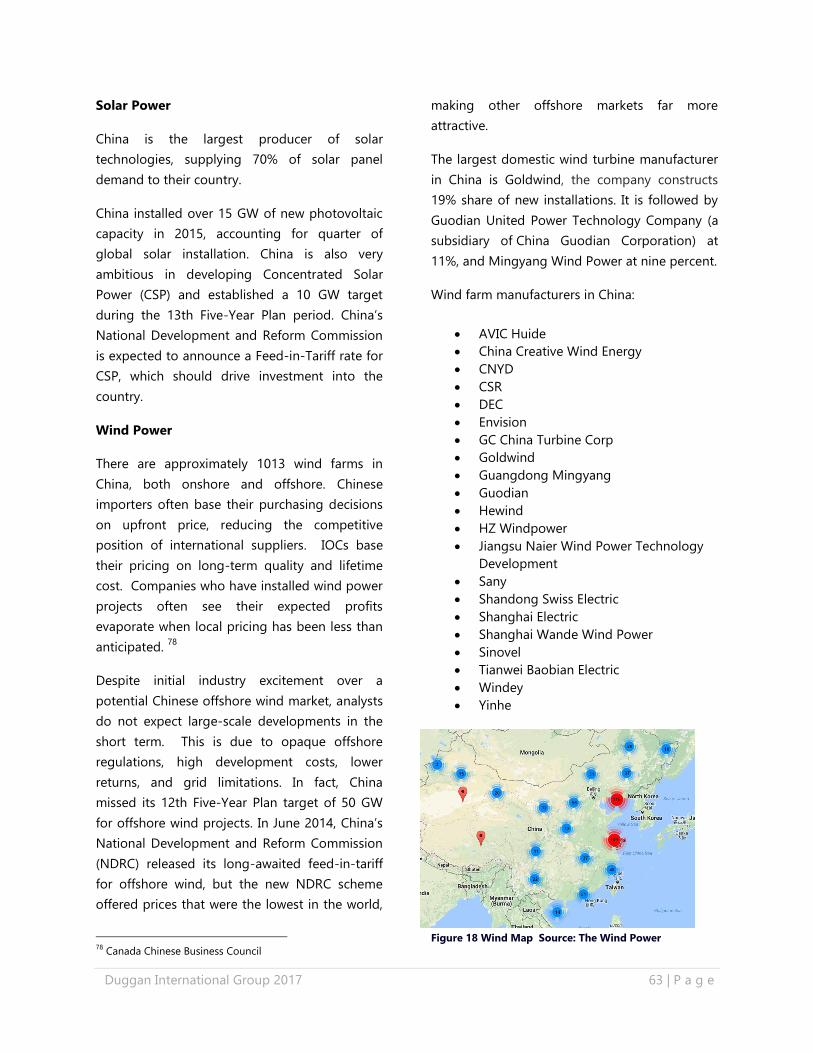
Duggan International Group 2017 63 | P a g e
Solar Power
China is the largest producer of solar
technologies, supplying 70% of solar panel
demand to their country.
China installed over 15 GW of new photovoltaic
capacity in 2015, accounting for quarter of
global solar installation. China is also very
ambitious in developing Concentrated Solar
Power (CSP) and established a 10 GW target
during the 13th Five-Year Plan period. China’s
National Development and Reform Commission
is expected to announce a Feed-in-Tariff rate for
CSP, which should drive investment into the
country.
Wind Power
There are approximately 1013 wind farms in
China, both onshore and offshore. Chinese
importers often base their purchasing decisions
on upfront price, reducing the competitive
position of international suppliers. IOCs base
their pricing on long-term quality and lifetime
cost. Companies who have installed wind power
projects often see their expected profits
evaporate when local pricing has been less than
anticipated. 78
Despite initial industry excitement over a
potential Chinese offshore wind market, analysts
do not expect large-scale developments in the
short term. This is due to opaque offshore
regulations, high development costs, lower
returns, and grid limitations. In fact, China
missed its 12th Five-Year Plan target of 50 GW
for offshore wind projects. In June 2014, China’s
National Development and Reform Commission
(NDRC) released its long-awaited feed-in-tariff
for offshore wind, but the new NDRC scheme
offered prices that were the lowest in the world,
78
Canada Chinese Business Council
making other offshore markets far more
attractive.
The largest domestic wind turbine manufacturer
in China is Goldwind, the company constructs
19% share of new installations. It is followed by
Guodian United Power Technology Company (a
subsidiary of China Guodian Corporation) at
11%, and Mingyang Wind Power at nine percent.
Wind farm manufacturers in China:
AVIC Huide
China Creative Wind Energy
CNYD
CSR
DEC
Envision
GC China Turbine Corp
Goldwind
Guangdong Mingyang
Guodian
Hewind
HZ Windpower
Jiangsu Naier Wind Power Technology
Development
Sany
Shandong Swiss Electric
Shanghai Electric
Shanghai Wande Wind Power
Sinovel
Tianwei Baobian Electric
Windey
Yinhe
Figure 18 Wind Map Source: The Wind Power
Duggan International Group 2017 64 | P a g e
Hydropower
Hydropower is a priority for China’s
infrastructure investment funds. Approval for
projects is relatively easy compared to other
markets. By the end of 2015, China's hydropower
installed capacity reached 319 GW, with an
annual generating capacity of 1.11 trillion kWh.
The volume of China’s installed capacity and
power generation rank first in the world. China’s
domestic companies dominate its main
component market.
Biofuels/Biomass
China’s biofuels and biomass capabilities are
currently in early stages of development, and
while challenges remain, it offers significant
potential. An estimated 1.5 billion tons per year
of waste agriculture and forest materials are
generated each year.
OPPORTUNITIES FOR NOVA SCOTIA
EXPORTERS
Wind Power
China often imports or licenses critical
components for its wind industry. Moreover, the
country is shifting towards small and medium-
sized wind farms. The industry will need
increased technical and safety standards, newer
technologies, innovative products and technical
components.
IOCs should consider viewing the Chinese
renewable energy market by region or province,
with each distinct location offering different
opportunities. The resource-rich west, including
Xinjiang, Qinghai, and Gansu, has been targeted
by the Chinese Government for increased
renewable energy development and will likely be
the location of many projects going forward.
The eastern and southern manufacturing
centres, while not the location of most
renewable energy projects, are often where
component manufacturers and developers can
find buyers for their products and services.
The third region, the transmission constrained
north, may be an area for distributed generation,
but at this point should not be targeted as a
region of particular potential.
Hydropower
Opportunities for exporters in this market are in
creating control systems and environmental
consultancy services.
Asian Development Bank (ADB)
To enter this market, Nova Scotia companies
should review projects with the ADB that have
been approved and proposed.
https://www.adb.org/projects/search/country/pr
c/status/proposed
GOVERNMENT POLICIES/REGULATIONS
THAT ENCOURAGE SUSTAINABLE
TECHNOLOGIES
In March 2015, China unveiled its 13th Five-Year
Plan, to reduce its dependency on coal and
increase environmental technologies and
renewable energy. The plan’s focus on energy is
centered on expansion in wind and solar power
generation, doubling wind’s level and
quintupling solar’s level from the previous Five-
Year Plan.
Wind projects approved by China’s National
Development and Reform Commission
discontinued domestic requirement in Wind
Power in 2009. However, Chinese wind turbine
manufacturers receive other forms of
government support, including cheap land, low-
interest government loans and preferential
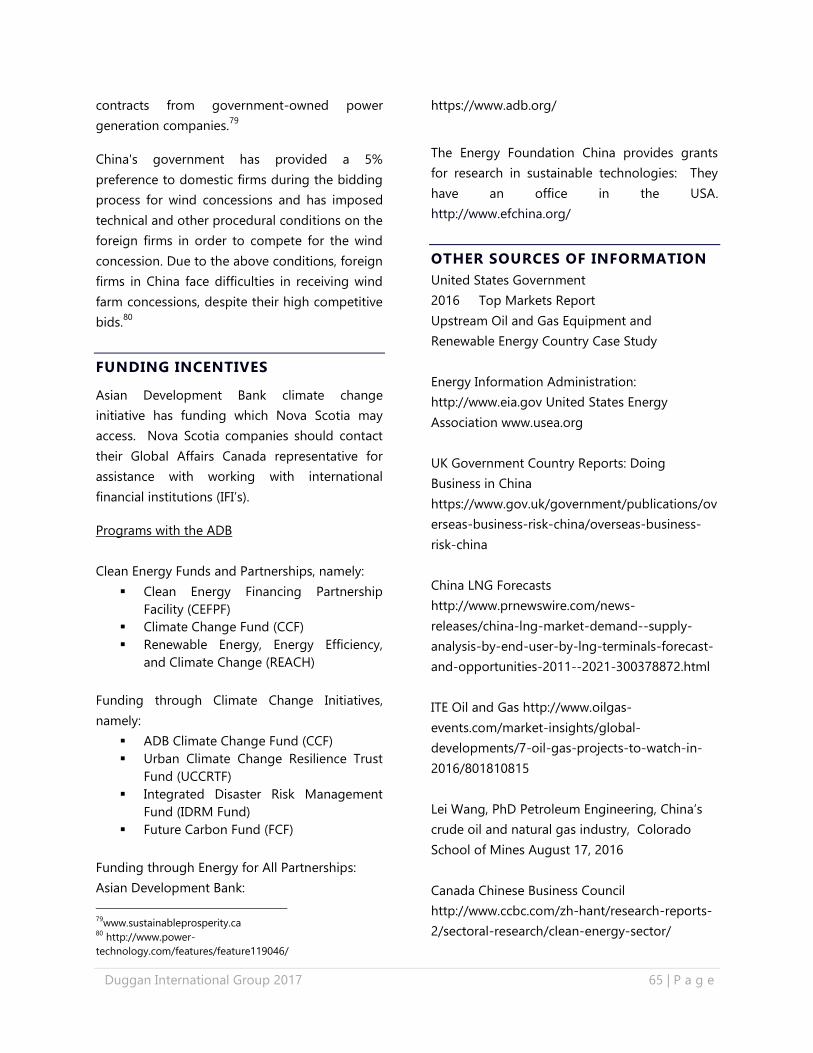
Duggan International Group 2017 65 | P a g e
contracts from government-owned power
generation companies.79
China's government has provided a 5%
preference to domestic firms during the bidding
process for wind concessions and has imposed
technical and other procedural conditions on the
foreign firms in order to compete for the wind
concession. Due to the above conditions, foreign
firms in China face difficulties in receiving wind
farm concessions, despite their high competitive
bids.80
FUNDING INCENTIVES
Asian Development Bank climate change
initiative has funding which Nova Scotia may
access. Nova Scotia companies should contact
their Global Affairs Canada representative for
assistance with working with international
financial institutions (IFI’s).
Programs with the ADB
Clean Energy Funds and Partnerships, namely:
Clean Energy Financing Partnership
Facility (CEFPF)
Climate Change Fund (CCF)
Renewable Energy, Energy Efficiency,
and Climate Change (REACH)
Funding through Climate Change Initiatives,
namely:
ADB Climate Change Fund (CCF)
Urban Climate Change Resilience Trust
Fund (UCCRTF)
Integrated Disaster Risk Management
Fund (IDRM Fund)
Future Carbon Fund (FCF)
Funding through Energy for All Partnerships:
Asian Development Bank:
79
www.sustainableprosperity.ca 80
http://www.power-
technology.com/features/feature119046/
https://www.adb.org/
The Energy Foundation China provides grants
for research in sustainable technologies: They
have an office in the USA.
http://www.efchina.org/
OTHER SOURCES OF INFORMATION
United States Government
2016 Top Markets Report
Upstream Oil and Gas Equipment and
Renewable Energy Country Case Study
Energy Information Administration:
http://www.eia.gov United States Energy
Association www.usea.org
UK Government Country Reports: Doing
Business in China
https://www.gov.uk/government/publications/ov
erseas-business-risk-china/overseas-business-
risk-china
China LNG Forecasts
http://www.prnewswire.com/news-
releases/china-lng-market-demand--supply-
analysis-by-end-user-by-lng-terminals-forecast-
and-opportunities-2011--2021-300378872.html
ITE Oil and Gas http://www.oilgas-
events.com/market-insights/global-
developments/7-oil-gas-projects-to-watch-in-
2016/801810815
Lei Wang, PhD Petroleum Engineering, China’s
crude oil and natural gas industry, Colorado
School of Mines August 17, 2016
Canada Chinese Business Council
http://www.ccbc.com/zh-hant/research-reports-
2/sectoral-research/clean-energy-sector/

Duggan International Group 2017 66 | P a g e
WIPO Green
https://www3.wipo.int/wipogreen/en/network/fu
nding.html
Notes:
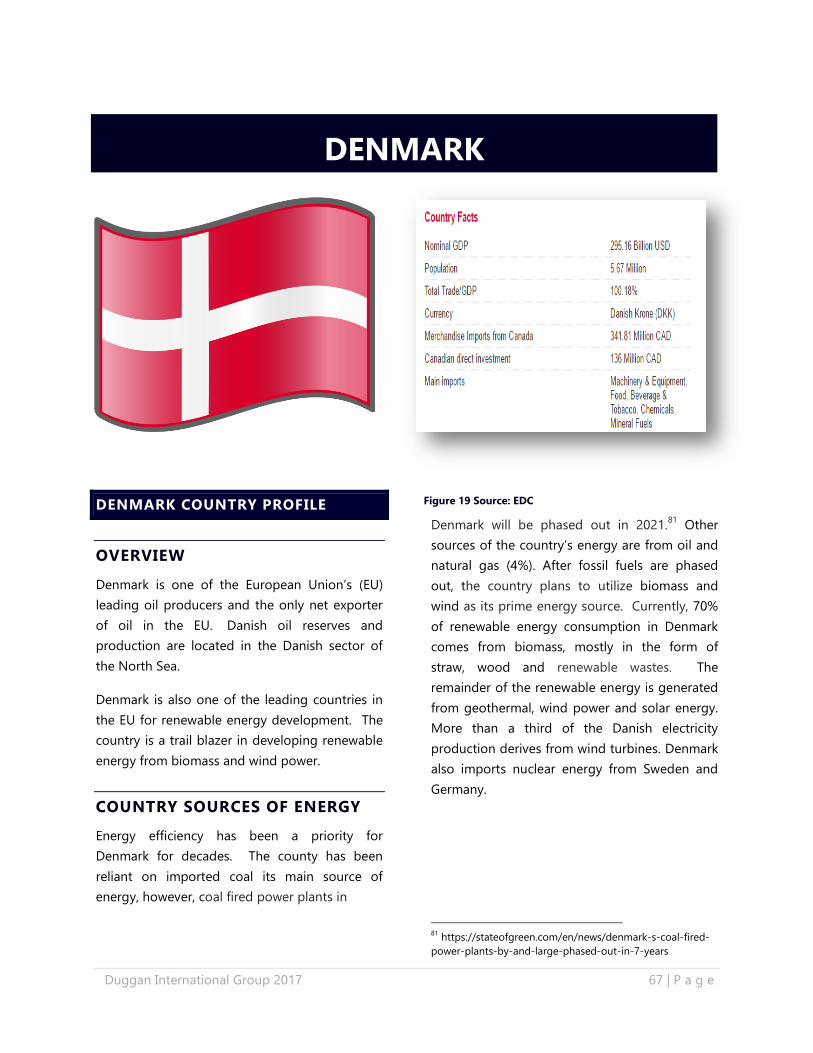
Duggan International Group 2017 67 | P a g e
DENMARK COUNTRY PROFILE
OVERVIEW
Denmark is one of the European Union’s (EU)
leading oil producers and the only net exporter
of oil in the EU. Danish oil reserves and
production are located in the Danish sector of
the North Sea.
Denmark is also one of the leading countries in
the EU for renewable energy development. The
country is a trail blazer in developing renewable
energy from biomass and wind power.
COUNTRY SOURCES OF ENERGY
Energy efficiency has been a priority for
Denmark for decades. The county has been
reliant on imported coal its main source of
energy, however, coal fired power plants in
Denmark will be phased out in 2021.81
Other
sources of the country’s energy are from oil and
natural gas (4%). After fossil fuels are phased
out, the country plans to utilize biomass and
wind as its prime energy source. Currently, 70%
of renewable energy consumption in Denmark
comes from biomass, mostly in the form of
straw, wood and renewable wastes. The
remainder of the renewable energy is generated
from geothermal, wind power and solar energy.
More than a third of the Danish electricity
production derives from wind turbines. Denmark
also imports nuclear energy from Sweden and
Germany.
81
https://stateofgreen.com/en/news/denmark-s-coal-fired-
power-plants-by-and-large-phased-out-in-7-years
DENMARK
Figure 19 Source: EDC
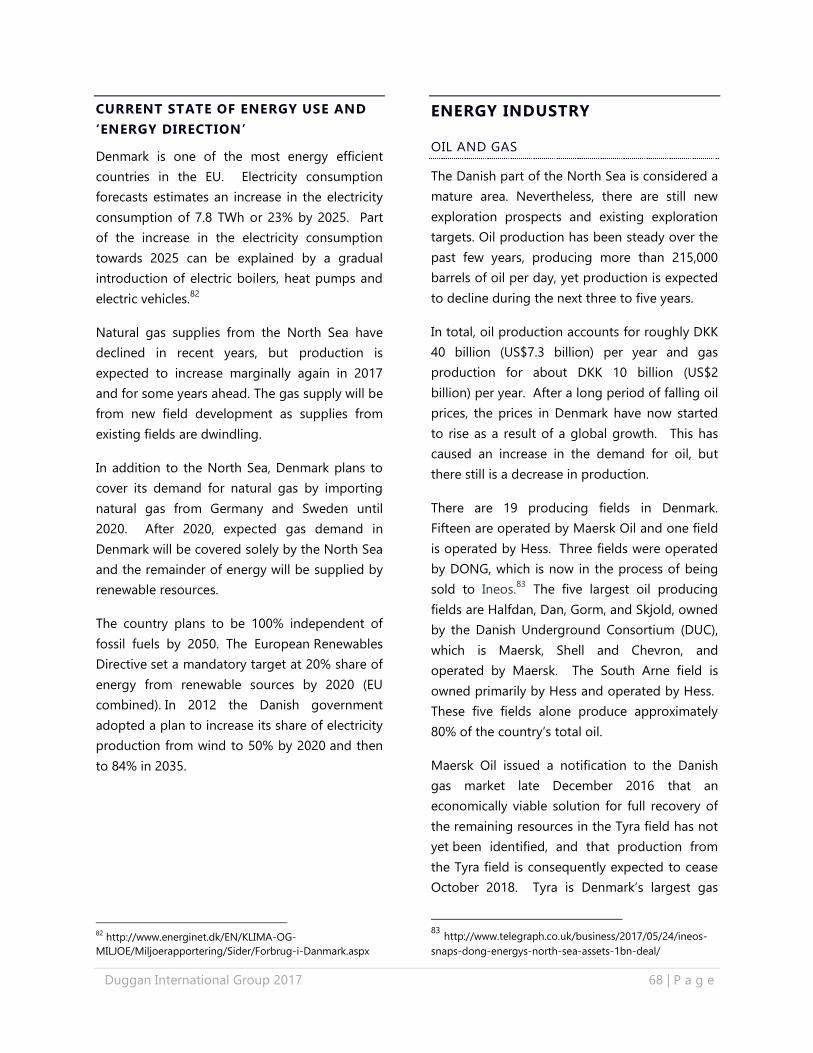
Duggan International Group 2017 68 | P a g e
CURRENT STATE OF ENERGY USE AND
‘ENERGY DIRECTION’
Denmark is one of the most energy efficient
countries in the EU. Electricity consumption
forecasts estimates an increase in the electricity
consumption of 7.8 TWh or 23% by 2025. Part
of the increase in the electricity consumption
towards 2025 can be explained by a gradual
introduction of electric boilers, heat pumps and
electric vehicles.82
Natural gas supplies from the North Sea have
declined in recent years, but production is
expected to increase marginally again in 2017
and for some years ahead. The gas supply will be
from new field development as supplies from
existing fields are dwindling.
In addition to the North Sea, Denmark plans to
cover its demand for natural gas by importing
natural gas from Germany and Sweden until
2020. After 2020, expected gas demand in
Denmark will be covered solely by the North Sea
and the remainder of energy will be supplied by
renewable resources.
The country plans to be 100% independent of
fossil fuels by 2050. The European Renewables
Directive set a mandatory target at 20% share of
energy from renewable sources by 2020 (EU
combined). In 2012 the Danish government
adopted a plan to increase its share of electricity
production from wind to 50% by 2020 and then
to 84% in 2035.
82
http://www.energinet.dk/EN/KLIMA-OG-
MILJOE/Miljoerapportering/Sider/Forbrug-i-Danmark.aspx
ENERGY INDUSTRY
OIL AND GAS
The Danish part of the North Sea is considered a
mature area. Nevertheless, there are still new
exploration prospects and existing exploration
targets. Oil production has been steady over the
past few years, producing more than 215,000
barrels of oil per day, yet production is expected
to decline during the next three to five years.
In total, oil production accounts for roughly DKK
40 billion (US$7.3 billion) per year and gas
production for about DKK 10 billion (US$2
billion) per year. After a long period of falling oil
prices, the prices in Denmark have now started
to rise as a result of a global growth. This has
caused an increase in the demand for oil, but
there still is a decrease in production.
There are 19 producing fields in Denmark.
Fifteen are operated by Maersk Oil and one field
is operated by Hess. Three fields were operated
by DONG, which is now in the process of being
sold to Ineos.83 The five largest oil producing
fields are Halfdan, Dan, Gorm, and Skjold, owned
by the Danish Underground Consortium (DUC),
which is Maersk, Shell and Chevron, and
operated by Maersk. The South Arne field is
owned primarily by Hess and operated by Hess.
These five fields alone produce approximately
80% of the country’s total oil.
Maersk Oil issued a notification to the Danish
gas market late December 2016 that an
economically viable solution for full recovery of
the remaining resources in the Tyra field has not
yet been identified, and that production from
the Tyra field is consequently expected to cease
October 2018. Tyra is Denmark’s largest gas
83
http://www.telegraph.co.uk/business/2017/05/24/ineos-
snaps-dong-energys-north-sea-assets-1bn-deal/
Duggan International Group 2017 69 | P a g e
field and the facilities are the processing and
export centre for all gas produced by DUC. More
than 90% of Denmark’s gas production is
processed through the facilities. Tyra East and
Tyra West is also the hub for a number of
smaller facilities in the Tyra field. This includes
the neighbouring unmanned facility, Tyra
Southeast, which was extended in 2015.84
Oil production from the North Sea is an
important source of financing for Denmark, but
production requires increasingly high energy-
intensive recovery methods. As the industry
peaks, the country is looking towards expanding
exploration into the northern regions of
Greenland.
PROJECTS
German upstream company DEA
Deutsche Erdoel has been offered two
licences in offshore Denmark by the
Danish Energy Agency, as part of the 7th
licensing round. DEA is now an operator
in Denmark and has a 50% interest in
each of the licences 8/16 and 9/16.
Hansa Hydrocarbons has secured two
new offshore licences under the Danish
7th
licensing round in the North Sea. The
licences 7/16 and 14/16 remain subject
to clearance by the Danish Parliament.
DONG Energy has agreed to support the
joint industry project Optimizing Oil
Production by Novel Technology
Integration (OPTION), which aims to
tackle the challenges of oil recovery
from reservoirs.
In 2015, Total abandoned work at its
exploration well Vendsyssel-1 in north-
western Denmark. The company has
stopped exploration activities saying
that the gas discovery is too thin for
commercial development.
84
http://www.maerskoil.com/media/newsroom/pages/engine
eringthefutureofthetyrafieldstartsjanuary2017.aspx
GOVERNMENT REGULATIONS AND
POLICIES
The Danish upstream oil sector, as well as
natural gas exploration and production, is
governed by the Danish Subsoil Act. Under the
Act, the state grants a licence to the licensee for
investigations, exploration and production. The
licence is regulated by the state under the
Subsoil Act, which means that all substantial
activities in all phases of investigation,
exploration and production require a separate
approval from the government.
The Danish Energy Authority’s (DEA) approval of
new development plans is conditional upon the
operators’ choosing the Best Available
Techniques (BAT), when this is financially
reasonable. This means that in each individual
case, the operators must investigate the
potential for using more energy-efficient
alternatives.85
85
https://www.export.gov/article?id=Denmark-Oil-and-Gas-
Field-Machinery
Figure 20 Oil and Map, North Sea Source: Danish Energy
Agency
Duggan International Group 2017 70 | P a g e
CERTIFICATION AND STANDARDS
BOSIET, or basic offshore safety instruction and
emergency training are required in Denmark.86
WORKING IN DENMARK
Market Strengths:
Easy access to northern Europe markets
via Copenhagen hub airport and high
quality motorway network
Well educated population with a high
proportion of university graduates
Advanced telecommunication
infrastructure
Denmark is an industrialized “value-
added” country, dependent on foreign
supplies of most raw materials and
semi-manufactured goods
Takes only 24 hours to establish a
company online
Corporate taxation is among the lowest
in the EU (22% in 2016)
Expansion opportunities to Greenland
Market Challenges:
Mature energy industry with established
companies
Danish wages are high and personal
taxes are among the highest in the
world
Danes prefer to buy products that
proven their technology and value
Danes prefer to do business with those
who they have established relationships
Employees on moveable oil rigs, drill ships,
etc.
Nova Scotians can be granted a residence and
work permit to work on an oil rig, drillship or
other comparable movable work stations
86
http://work.chron.com/certification-need-work-oil-rig-
29574.html
temporarily situated on Danish territory. It is
normally a condition that prior to working on
Danish territory, to have had similar employment
on the moveable work station or that the
employee has previously been employed in a
similar position with the foreign company.
Workers will be granted a residence and work
permit for the limited time period that the
moveable work station is situated on Danish
territory (usually one to three months). A permit
cannot be granted for longer than six months.
Canadian passport must be valid for at least
three months beyond the duration of the
residence permit.87
OPPORTUNITIES FOR NOVA SCOTIA
EXPORTERS
World Energy Partnership City member, Esbjerg,
is recognized as the Energy Metropolis of
Denmark.
Denmark estimates there will be four to six new
wells drilled in the North Sea. For current
extraction, the mature fields require water and
gas injection to maintain pressure. With the oil,
an increasing amount of water is produced that
must be treated before being discharged into
the sea or re-injected. Technologies to improve
this process will be an opportunity for exporters.
Exploration and production activities will also
require imports.
With the purchase of DONG assets by INEOS, if
the Heyron project proceeds, Heyron is a high-
pressure, high-temperature well and will
required companies experienced working in this
discipline.
87
https://www.nyidanmark.dk/en-
us/coming_to_dk/work/Employees-on-moveable-oil-rigs-
drillships.htm
Duggan International Group 2017 71 | P a g e
Best Prospects:
Engineering
Fabrication
Consulting
Crewing
Shipping
HPHT well experience
IMPACTS DUE TO THE VOLATILITY
IN OIL PRICES
In 2016, Maersk posted a net loss for the first
quarter of 2016 mainly due to low oil
prices. Maersk Oil reduced operating expenses
by 21% excluding exploration costs, to
US$570m, compared to US$724m in the
previous year. Further initiatives to address cost
reductions are being executed, including
extensive re-contracting to take advantage of
the softening market as well as strengthening of
the procurement process.
Maersk had over 1,300 job losses; the company
implemented a salary freeze in 2016, reduced
travel expenses and initiated the outsourcing of
administrative functions to a shared service
centre in India.88
RENEWABLE INDUSTRY
Denmark is the world leader in cleantech and
low carbon related industries. Danish companies
control one third of the global wind market and
are the world leaders in supply chain
technologies to the wind industry.
In general, it has been difficult for Canadian
companies to penetrate the clean technologies
market (with the exception of fuel cell/battery
technology) due to domestic Danish
competencies and strong competition from
neighbouring countries Germany and Sweden.
However, CETA tariff reductions may provide
Canadian cleantech suppliers with a competitive
edge for future Danish projects.89
Biomass
The consumption of biomass for energy
production in Denmark more than quadrupled
between 1980 and 2009. Biomass has made a
significant contribution to reducing Danish CO2
emissions. Moreover, due to the extensive use of
bioenergy, there is an abundance of expertise
available in Denmark in this field. In addition to
hosting several top-efficient, full-scale
biomass plants, Denmark is an industry hub and
testing ground for modern energy technologies
based on biofuels and biogas. Danish
88
http://www.offshoreenergytoday.com/maersk-oil-sinks-to-
red-on-low-oil-price/
89
http://tradecommissioner.gc.ca/denmark-
danemark/market-facts-faits-sur-le-
marche/0000862.aspx?lang=eng&pedisable=true
MAJOR COMPANIES
Maersk
HESS
Shell
Chevron
INEOS
There are approximately 120 Danish
suppliers in the global oil and gas
industry. They can be found with the
Danish Oil and Gas Technology Group.
http://www.dk-export.com/suppliers/
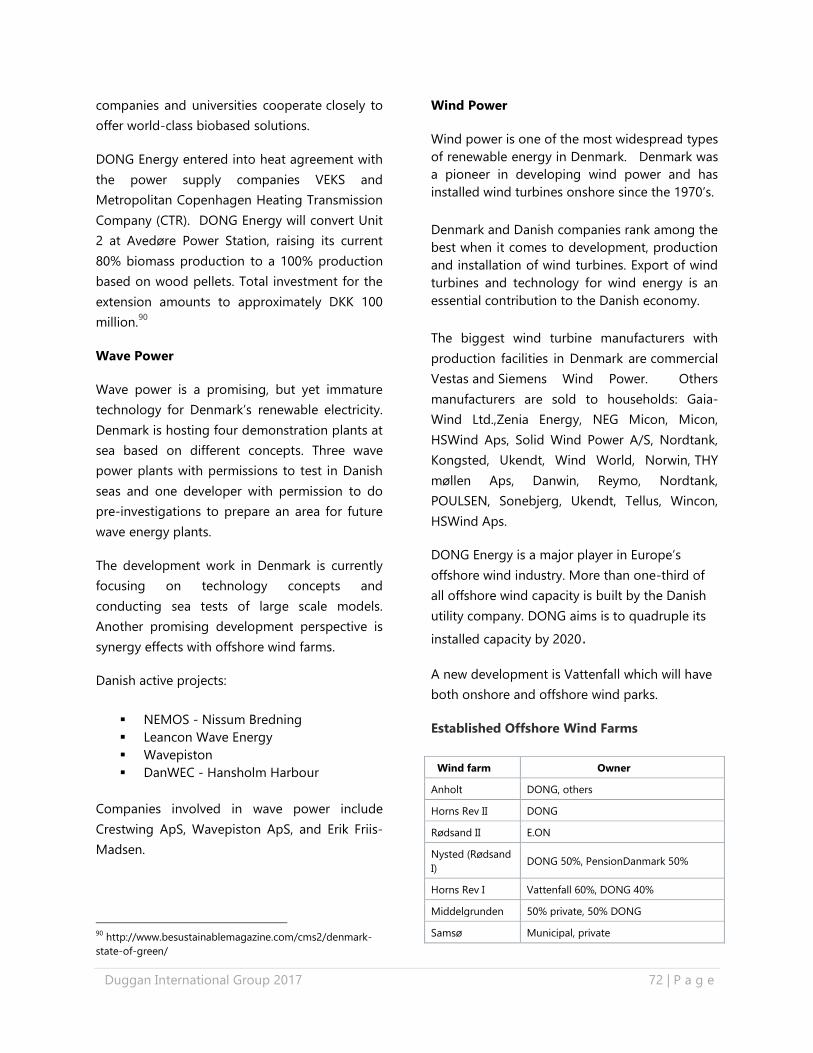
Duggan International Group 2017 72 | P a g e
companies and universities cooperate closely to
offer world-class biobased solutions.
DONG Energy entered into heat agreement with
the power supply companies VEKS and
Metropolitan Copenhagen Heating Transmission
Company (CTR). DONG Energy will convert Unit
2 at Avedøre Power Station, raising its current
80% biomass production to a 100% production
based on wood pellets. Total investment for the
extension amounts to approximately DKK 100
million.90
Wave Power
Wave power is a promising, but yet immature
technology for Denmark’s renewable electricity.
Denmark is hosting four demonstration plants at
sea based on different concepts. Three wave
power plants with permissions to test in Danish
seas and one developer with permission to do
pre-investigations to prepare an area for future
wave energy plants.
The development work in Denmark is currently
focusing on technology concepts and
conducting sea tests of large scale models.
Another promising development perspective is
synergy effects with offshore wind farms.
Danish active projects:
NEMOS - Nissum Bredning
Leancon Wave Energy
Wavepiston
DanWEC - Hansholm Harbour
Companies involved in wave power include
Crestwing ApS, Wavepiston ApS, and Erik Friis-
Madsen.
90
http://www.besustainablemagazine.com/cms2/denmark-
state-of-green/
Wind Power
Wind power is one of the most widespread types
of renewable energy in Denmark. Denmark was
a pioneer in developing wind power and has
installed wind turbines onshore since the 1970’s.
Denmark and Danish companies rank among the
best when it comes to development, production
and installation of wind turbines. Export of wind
turbines and technology for wind energy is an
essential contribution to the Danish economy.
The biggest wind turbine manufacturers with
production facilities in Denmark are commercial
Vestas and Siemens Wind Power. Others
manufacturers are sold to households: Gaia-
Wind Ltd.,Zenia Energy, NEG Micon, Micon,
HSWind Aps, Solid Wind Power A/S, Nordtank,
Kongsted, Ukendt, Wind World, Norwin, THY
møllen Aps, Danwin, Reymo, Nordtank,
POULSEN, Sonebjerg, Ukendt, Tellus, Wincon,
HSWind Aps.
DONG Energy is a major player in Europe’s
offshore wind industry. More than one-third of
all offshore wind capacity is built by the Danish
utility company. DONG aims is to quadruple its
installed capacity by 2020.
A new development is Vattenfall which will have
both onshore and offshore wind parks.
Established Offshore Wind Farms
Wind farm Owner
Anholt DONG, others
Horns Rev II DONG
Rødsand II E.ON
Nysted (Rødsand
I)
DONG 50%, PensionDanmark 50%
Horns Rev I Vattenfall 60%, DONG 40%
Middelgrunden 50% private, 50% DONG
Samsø Municipal, private
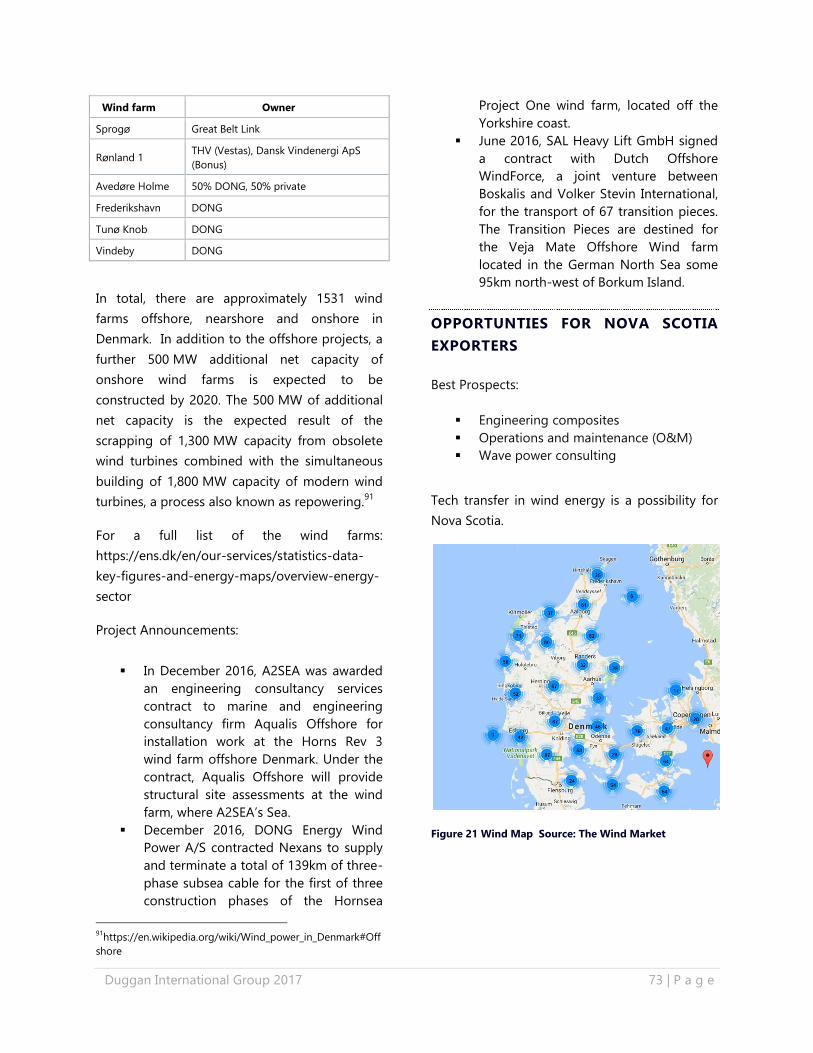
Duggan International Group 2017 73 | P a g e
Wind farm Owner
Sprogø Great Belt Link
Rønland 1 THV (Vestas), Dansk Vindenergi ApS
(Bonus)
Avedøre Holme 50% DONG, 50% private
Frederikshavn DONG
Tunø Knob DONG
Vindeby DONG
In total, there are approximately 1531 wind
farms offshore, nearshore and onshore in
Denmark. In addition to the offshore projects, a
further 500 MW additional net capacity of
onshore wind farms is expected to be
constructed by 2020. The 500 MW of additional
net capacity is the expected result of the
scrapping of 1,300 MW capacity from obsolete
wind turbines combined with the simultaneous
building of 1,800 MW capacity of modern wind
turbines, a process also known as repowering.91
For a full list of the wind farms:
https://ens.dk/en/our-services/statistics-data-
key-figures-and-energy-maps/overview-energy-
sector
Project Announcements:
In December 2016, A2SEA was awarded
an engineering consultancy services
contract to marine and engineering
consultancy firm Aqualis Offshore for
installation work at the Horns Rev 3
wind farm offshore Denmark. Under the
contract, Aqualis Offshore will provide
structural site assessments at the wind
farm, where A2SEA’s Sea.
December 2016, DONG Energy Wind
Power A/S contracted Nexans to supply
and terminate a total of 139km of three-
phase subsea cable for the first of three
construction phases of the Hornsea
91
https://en.wikipedia.org/wiki/Wind_power_in_Denmark#Off
shore
Project One wind farm, located off the
Yorkshire coast.
June 2016, SAL Heavy Lift GmbH signed
a contract with Dutch Offshore
WindForce, a joint venture between
Boskalis and Volker Stevin International,
for the transport of 67 transition pieces.
The Transition Pieces are destined for
the Veja Mate Offshore Wind farm
located in the German North Sea some
95km north-west of Borkum Island.
OPPORTUNTIES FOR NOVA SCOTIA
EXPORTERS
Best Prospects:
Engineering composites
Operations and maintenance (O&M)
Wave power consulting
Tech transfer in wind energy is a possibility for
Nova Scotia.
Figure 21 Wind Map Source: The Wind Market
Duggan International Group 2017 74 | P a g e
GOVERNMENT POLICIES/REGULATIONS
THAT ENCOURAGE SUSTAINABLE
TECHNOLOGIES
The Danish Energy Agreement 2012-202092
stipulates that half of the country’s electricity
consumption will come from wind power,
enabling a share of 35% renewable energy in
gross energy consumption in 2020. Moreover,
the energy consumption is to decrease by more
than 12% in 2020 compared to 2006.
Particulars Include:
That the increased efforts within the
energy savings area made by energy
companies are to be financed via the
tariffs on energy distribution;
That funding for expanding renewable
energy that is supplied to the
electricity and gas grids is to be
financed via PSO (Public Service
Obligation) schemes and thus via the
energy bill;
That a security of supply tax on space
heating is to be introduced to cover
government funding for biogas,
industrial CHP, energy savings
packages in privately owned rental
properties, renewable energy in
businesses, as well as the
government’s loss of taxes due to
lower consumption of fossil fuels; and
That a share of the security of supply
tax is to be offset against lower energy
taxes on electricity and fuel for
industry with a view to maintaining
Denmark’s competitiveness.
92
https://www.iea.org/policiesandmeasures/pams/denmark/n
ame-42441-en.php
FUNDING INCENTIVES
Energy Technology Development and
Demonstration Programme (EUDP) 93
EUDP provides opportunities for SMEs and large
companies as long as the company is connected
to the energy sector or have a desire to enter
into the industry. The key factor is that the
company or consortium has a project idea which
focuses on resolving an energy technological
problem. With EUDP, companies can receive co-
financing for projects encompassing the
development and/or demonstration of new and
efficient energy technologies, research projects
directly improving or supporting demonstration
activities, and development of public-private
partnerships for energy technology.
Nova Scotia companies must partner with a
Danish company or organization as the lead.
OTHER SOURCES OF INFORMATION
US Commercial Service
https://www.export.gov/article?id=Denmark-Oil-
and-Gas-Field-Machinery
International Cooperative Legal Guides
https://www.iclg.co.uk/practice-areas/oil-and-
gas-regulation/oil-and-gas-regulation-
2017/denmark
Danish Energy Agency
https://ens.dk/en
Department for International Trade UK
https://www.gov.uk/government/publications/ex
porting-to-denmark/exporting-to-denmark
93
http://www.investindk.com/~/media/Files/Sheets/Framewo
rk%20conditions/Funding_and_Financial_incentives_2016.ash
x
Duggan International Group 2017 75 | P a g e
Ministry of Foreign Affairs Denmark – Funding
Incentives 2016
The Wind Power
http://www.thewindpower.net/country_maps_en
_6_denmark.php
Wikipedia
https://en.wikipedia.org/wiki/Wind_power_in_De
nmark#Offshore
Government of Denmark – Danish Energy
Agency
https://ens.dk/ansvarsomraader/vindenergi/eksis
terende-havvindmoelleparker-og-aktuelle-
projekter
Canadian Trade Commissioner Service
http://tradecommissioner.gc.ca/denmark-
danemark/market-facts-faits-sur-le-
marche/0000862.aspx?lang=eng&pedisable=tru
NOTES:
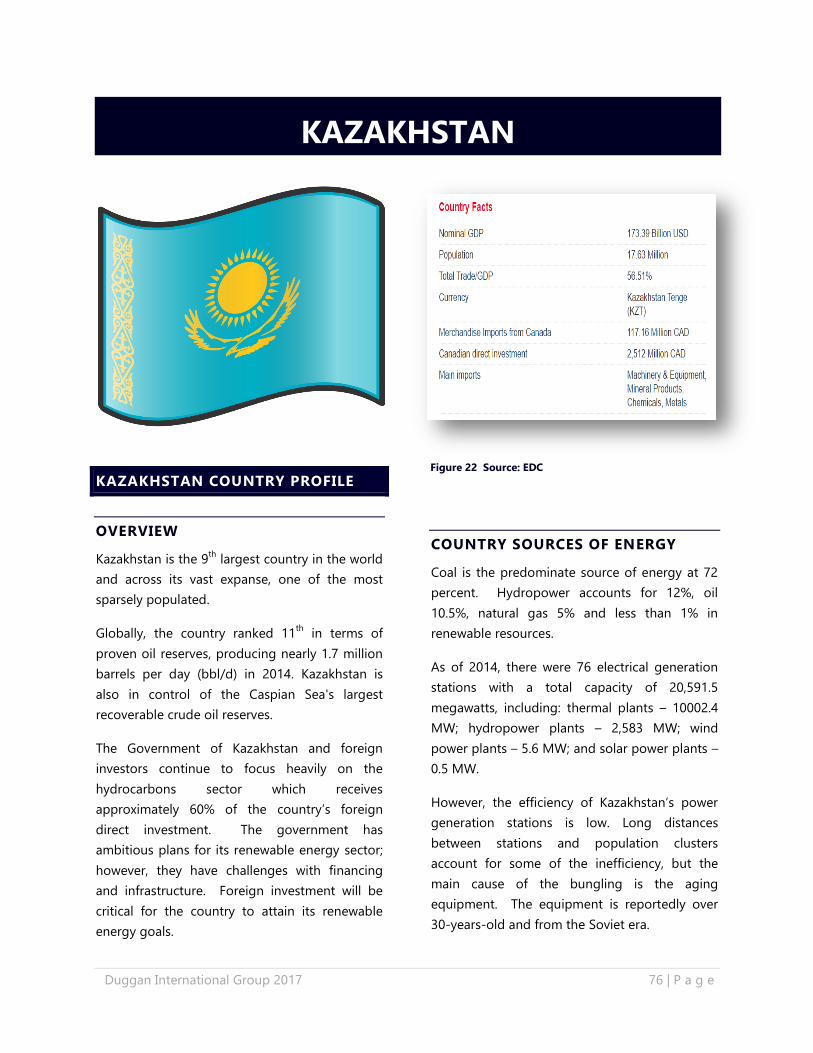
Duggan International Group 2017 76 | P a g e
KAZAKHSTAN COUNTRY PROFILE
OVERVIEW
Kazakhstan is the 9th
largest country in the world
and across its vast expanse, one of the most
sparsely populated.
Globally, the country ranked 11th
in terms of
proven oil reserves, producing nearly 1.7 million
barrels per day (bbl/d) in 2014. Kazakhstan is
also in control of the Caspian Sea's largest
recoverable crude oil reserves.
The Government of Kazakhstan and foreign
investors continue to focus heavily on the
hydrocarbons sector which receives
approximately 60% of the country’s foreign
direct investment. The government has
ambitious plans for its renewable energy sector;
however, they have challenges with financing
and infrastructure. Foreign investment will be
critical for the country to attain its renewable
energy goals.
COUNTRY SOURCES OF ENERGY
Coal is the predominate source of energy at 72
percent. Hydropower accounts for 12%, oil
10.5%, natural gas 5% and less than 1% in
renewable resources.
As of 2014, there were 76 electrical generation
stations with a total capacity of 20,591.5
megawatts, including: thermal plants – 10002.4
MW; hydropower plants – 2,583 MW; wind
power plants – 5.6 MW; and solar power plants –
0.5 MW.
However, the efficiency of Kazakhstan’s power
generation stations is low. Long distances
between stations and population clusters
account for some of the inefficiency, but the
main cause of the bungling is the aging
equipment. The equipment is reportedly over
30-years-old and from the Soviet era.
KAZAKHSTAN
Figure 22 Source: EDC
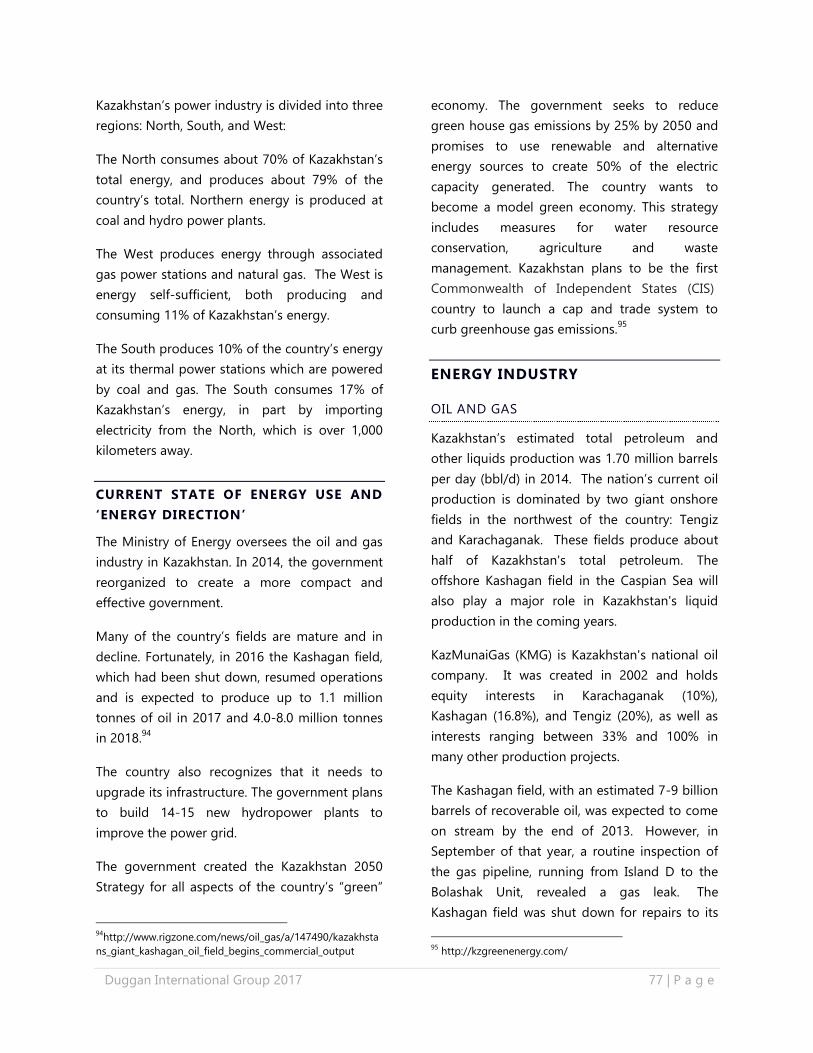
Duggan International Group 2017 77 | P a g e
Kazakhstan’s power industry is divided into three
regions: North, South, and West:
The North consumes about 70% of Kazakhstan’s
total energy, and produces about 79% of the
country’s total. Northern energy is produced at
coal and hydro power plants.
The West produces energy through associated
gas power stations and natural gas. The West is
energy self-sufficient, both producing and
consuming 11% of Kazakhstan’s energy.
The South produces 10% of the country’s energy
at its thermal power stations which are powered
by coal and gas. The South consumes 17% of
Kazakhstan’s energy, in part by importing
electricity from the North, which is over 1,000
kilometers away.
CURRENT STATE OF ENERGY USE AND
‘ENERGY DIRECTION’
The Ministry of Energy oversees the oil and gas
industry in Kazakhstan. In 2014, the government
reorganized to create a more compact and
effective government.
Many of the country’s fields are mature and in
decline. Fortunately, in 2016 the Kashagan field,
which had been shut down, resumed operations
and is expected to produce up to 1.1 million
tonnes of oil in 2017 and 4.0-8.0 million tonnes
in 2018.94
The country also recognizes that it needs to
upgrade its infrastructure. The government plans
to build 14-15 new hydropower plants to
improve the power grid.
The government created the Kazakhstan 2050
Strategy for all aspects of the country’s “green”
94
http://www.rigzone.com/news/oil_gas/a/147490/kazakhsta
ns_giant_kashagan_oil_field_begins_commercial_output
economy. The government seeks to reduce
green house gas emissions by 25% by 2050 and
promises to use renewable and alternative
energy sources to create 50% of the electric
capacity generated. The country wants to
become a model green economy. This strategy
includes measures for water resource
conservation, agriculture and waste
management. Kazakhstan plans to be the first
Commonwealth of Independent States (CIS)
country to launch a cap and trade system to
curb greenhouse gas emissions.95
ENERGY INDUSTRY
OIL AND GAS
Kazakhstan’s estimated total petroleum and
other liquids production was 1.70 million barrels
per day (bbl/d) in 2014. The nation’s current oil
production is dominated by two giant onshore
fields in the northwest of the country: Tengiz
and Karachaganak. These fields produce about
half of Kazakhstan's total petroleum. The
offshore Kashagan field in the Caspian Sea will
also play a major role in Kazakhstan's liquid
production in the coming years.
KazMunaiGas (KMG) is Kazakhstan's national oil
company. It was created in 2002 and holds
equity interests in Karachaganak (10%),
Kashagan (16.8%), and Tengiz (20%), as well as
interests ranging between 33% and 100% in
many other production projects.
The Kashagan field, with an estimated 7-9 billion
barrels of recoverable oil, was expected to come
on stream by the end of 2013. However, in
September of that year, a routine inspection of
the gas pipeline, running from Island D to the
Bolashak Unit, revealed a gas leak. The
Kashagan field was shut down for repairs to its
95
http://kzgreenenergy.com/
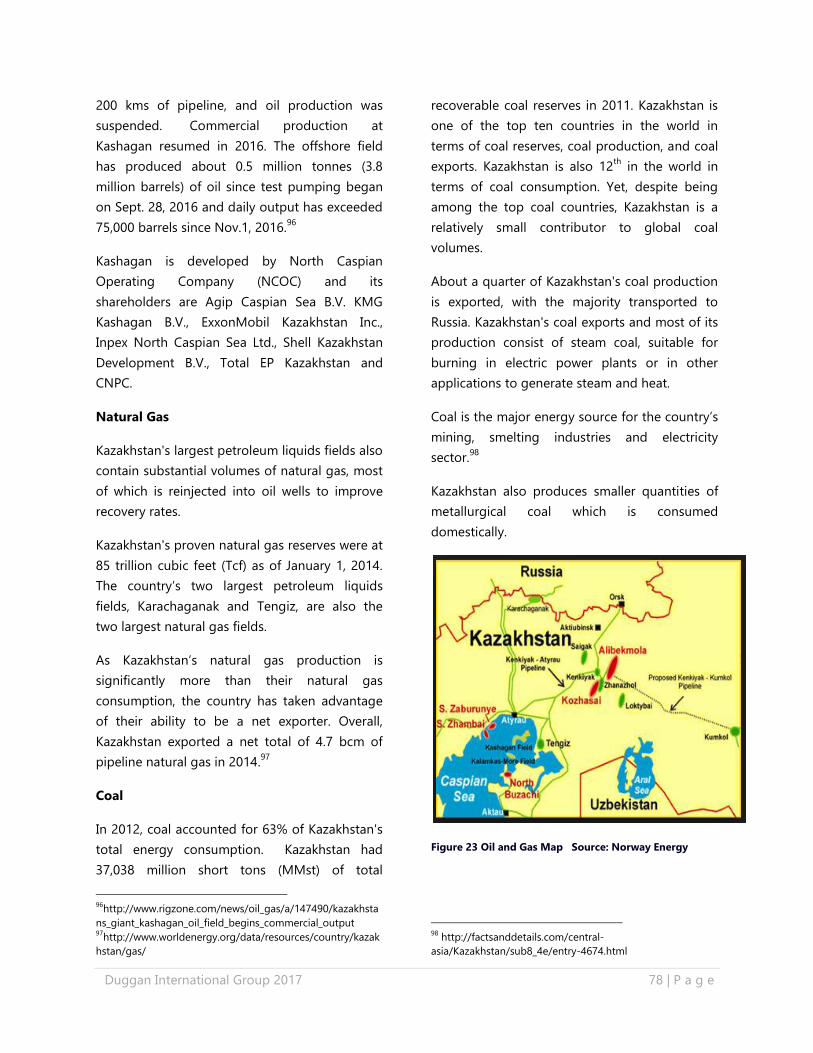
Duggan International Group 2017 78 | P a g e
200 kms of pipeline, and oil production was
suspended. Commercial production at
Kashagan resumed in 2016. The offshore field
has produced about 0.5 million tonnes (3.8
million barrels) of oil since test pumping began
on Sept. 28, 2016 and daily output has exceeded
75,000 barrels since Nov.1, 2016.96
Kashagan is developed by North Caspian
Operating Company (NCOC) and its
shareholders are Agip Caspian Sea B.V. KMG
Kashagan B.V., ExxonMobil Kazakhstan Inc.,
Inpex North Caspian Sea Ltd., Shell Kazakhstan
Development B.V., Total EP Kazakhstan and
CNPC.
Natural Gas
Kazakhstan's largest petroleum liquids fields also
contain substantial volumes of natural gas, most
of which is reinjected into oil wells to improve
recovery rates.
Kazakhstan's proven natural gas reserves were at
85 trillion cubic feet (Tcf) as of January 1, 2014.
The country’s two largest petroleum liquids
fields, Karachaganak and Tengiz, are also the
two largest natural gas fields.
As Kazakhstan’s natural gas production is
significantly more than their natural gas
consumption, the country has taken advantage
of their ability to be a net exporter. Overall,
Kazakhstan exported a net total of 4.7 bcm of
pipeline natural gas in 2014.97
Coal
In 2012, coal accounted for 63% of Kazakhstan's
total energy consumption. Kazakhstan had
37,038 million short tons (MMst) of total
96
http://www.rigzone.com/news/oil_gas/a/147490/kazakhsta
ns_giant_kashagan_oil_field_begins_commercial_output 97
http://www.worldenergy.org/data/resources/country/kazak
hstan/gas/
recoverable coal reserves in 2011. Kazakhstan is
one of the top ten countries in the world in
terms of coal reserves, coal production, and coal
exports. Kazakhstan is also 12th
in the world in
terms of coal consumption. Yet, despite being
among the top coal countries, Kazakhstan is a
relatively small contributor to global coal
volumes.
About a quarter of Kazakhstan's coal production
is exported, with the majority transported to
Russia. Kazakhstan's coal exports and most of its
production consist of steam coal, suitable for
burning in electric power plants or in other
applications to generate steam and heat.
Coal is the major energy source for the country’s
mining, smelting industries and electricity
sector.98
Kazakhstan also produces smaller quantities of
metallurgical coal which is consumed
domestically.
Figure 23 Oil and Gas Map Source: Norway Energy
98
http://factsanddetails.com/central-
asia/Kazakhstan/sub8_4e/entry-4674.html
Duggan International Group 2017 79 | P a g e
PROJECTS
Fluor Corporation has announced that
its joint venture, KPJV, has been
awarded a front-end engineering and
design (FEED) contract by Tengizchevroil
(TCO) for the Multi-Phase Pump Project
in Kazakhstan. Under the contract, KPJV
will implement multi-phase pump
technology across the gathering
network of existing oil and gas facilities
at the Tengiz and Korolev fields.
Canadian company Condor Petroleum
has announced that commercial oil
production has begun at the Taskuduk
and Shoba oilfields.
Wood Group has secured a contract
valued at approximately $700m to
provide services for Tengizchevroil’s
Future Growth Project-Wellhead
Pressure Management project at the
Tengiz field. The company will also
provide main automation contractor
(MAC) services for the project.
The Tengiz Future Growth Project (FGP)
-Wellhead Pressure Management
Project (WPMP) - is an integrated
project being developed primarily to
increase the production capacity from
the Tengiz oil field and the adjacent
Korolev field. The project is owned and
developed by the Tengizchevroil (TCO) a
joint venture (JV), consisting of Chevron
(50%), ExxonMobil (25%), KazMunayGas
(20%) and LukArco (5%). The
preconstruction works for the project
started in 2013, the front-end
engineering design (FEED) study was
completed in 2014, the final investment
decision (FID) was taken in July 2016,
and production is anticipated to begin in
2022.99
99
http://www.hydrocarbons-
technology.com/news/newsfluor-joint-venture-team-
receives-feed-contract-in-kazakhstan-5735094/
GOVERNMENT REGULATIONS AND
POLICIES
Kazakhstan has strict Local Content Rules (LCR)
under its Subsoil Use Law for IOCs to procure
goods, works and services. However, the
country also offers incentives to IOCs to hire
locals such as interest free loans and advanced
payments. Businesses must meet a 90% local
workforce for technical personnel. The
government also wants 70% Kazakhstanis hired
into managerial and executive ranks of foreign
enterprises. There are exemptions to the rules.
Companies would need to negotiate the LCR in
their contracts.
Even though Kazakhstan has LCRs, demand for
skilled labor generally exceeds local supply.
Kazakhstan has an educated workforce, but the
proportion of highly technically competent
workers is fairly small. Technical skills,
management expertise, and marketing skills are
all in short supply. Many large investors rely on
foreign workers and engineers to fill the void.
Local content regulations require a minimum of
1% of a project budget be earmarked for
training programs and workforce development,
including overseas assignments with the lead
operator. 100
LCR also applies to good and services. Local
Content in public procurement must be a
minimum of 20% for goods and 15% for
services. In private procurement, Local Content
must meet 82.5% for services and 11% for
goods. Subsoil users must file quarterly and
annual reports to the KRA Register (Kazakhstan
Contract Agency). 101
100
https://www.export.gov/article?id=Kazakhstan-Labor 101
http://www.glccouncil.org/wp-
content/uploads/2015/04/Five-Local-Content-Facts-From-
Around-the-World.pdf
Duggan International Group 2017 80 | P a g e
Contracts that fail to meet specified
requirements for local materials and labour can
be unilaterally terminated by the government,
although no such terminations are known to
have occurred. The Subsoil Use Law also
establishes the government's right to preempt
any sale of oil and gas assets, which has
occurred.
CERTIFICATION AND STANDARDS
Firms working through the supply chain in
Kazakhstan should have an international
certification, such as ISO, API, or ASME, (many
local firms and workers do not).
WORKING IN KAZAKSTAN
The most effective means of entering the
Kazakhstan market is to establish local presence
or to find a local partner or distributer. It is also
recommended to sell to a current supplier rather
than directly to an energy firm.
A good partner needs to be responsible for
handling customs clearance, dealing with
established wholesalers/retailers, marketing the
product directly to major corporations or the
government, and handling after-sales service.
Nova Scotia companies that have experience
working Eastern Europe, Ukraine or Russia may
have a better experience exporting to
Kazakhstan than those not used to the business
culture. Companies must also be willing to
invest time and money. Entering this market is a
long term commitment.
Market Strengths:
Stable economy
Easy to start a business
Strong regulatory environment for
companies
Developing a transparent and effective
business culture
Tax and other preferences for investors
Market Challenges:
Importers are affected by poorly
planned implementation customs codes
and unclear documentation
requirements
Competition is strong from Russia and
China. Investment from China remains
high while inexpensive products from
China and Russia are readily supplied
across the borders
Interpretation of laws by local officials is
often at variance with that of the central
government, especially in the
MAJOR COMPANIES
KazMunaiGas (KMG)
Tengiz, Karachaganak, CNPC-Aktobemunaigas,
Uzenmunaigas, Mangistaumunaigas, Kumkol;
North Caspian Operating Company (NCOC)
Agip Caspian Sea B.V. ,KMG Kashagan B.V. ,
ExxonMobil Kazakhstan Inc., Inpex North
Caspian Sea Ltd. , Shell Kazakhstan Development
B.V. , Total EP Kazakhstan
Parsons, Fleur, Daniel (PFD), Schlumberger,
Halliburton
Canadian Company: Condor Petroleum
Full list of Companies:
http://www.academia.edu/4693805/Companies_
Working_in_the_Oil_and_Gas_Industry_of_Kazakh
stan
Duggan International Group 2017 81 | P a g e
implementation of Kazakhstan’s system
of taxation, and collection of revenues
Corruption remains widespread despite
the government’s anti-corruption
campaigns
Foreign workers to Kazakhstan must obtain work
permits, a practice which can be difficult and
expensive. In 2015 Kazakhstan introduced
amendments to the migration and employment
law that went into effect January 1, 2017.
For more information:
http://kazembassy.ca/visa-and-consular-
information/obtaining-a-visa-to-kazakhstan/
OPPORTUNITIES FOR NOVA SCOTIA
EXPORTERS
World Energy City Partnership member city,
Atyrau, is the energy capital of Kazakhstan.
The national oil and gas company, KazMunaiGas
(KMG), is responsible for tendering. The
company also plays a role in practically all
contracts with foreign oil and gas companies.
Reportedly, the offshore development program
will call for more new offshore blocks to
eventually be privatized through open tenders.
The new exploration will present an opportunity
for logistics and pipeline projects.
Equipment providers may want to sell through
an existing supplier. About 80% of the
equipment used in the oil and gas sector and
the mining industry is imported; most of it
manufactured in Russia and China.
Best Prospects:
Research and data management
Laboratory studies
Oil spill cleanup technologies
Pipeline services
Seismic processing and interpretation
Petroleum software development
Sulfur removal & disposal technologies
Well stimulation & field abandonment
services
Underwater repair equipment
Downstream engineering services
IMPACTS DUE TO THE VOLATILITY
IN OIL PRICES
Kazakhstan’s economic growth slowed due to
the fall in oil price and demand for global oil,
and production setbacks at Kashagan.
Kazakhstan’s economy grew by 1.2% in 2015 and
is forecast to grow by about the same in 2017.
RENEWABLE INDUSTRY
Kazakhstan has huge renewable energy
potential, particularly for hydropower, solar and
wind. This sector is almost entirely untapped as
renewables currently only constitute about 1% of
Kazakhstan’s energy balance. Until recently, the
renewable energy industry in Kazakhstan was
derived solely from hydropower plants.
The target in the government’s action plan is for
renewable energy to meet 3% of the total
demand by 2020 and 25% by 2050.
Approximately 48 projects on renewable energy
production have been launched in the county to
date, with plans to implement more than 100
projects by 2020. The government has currently
committed to building 13 wind plants, 14-15
hydropower plants and four solar stations. The
largest solar power station is in the Kyzylorda
Province and will be capable of generating 65
megawatt hours of electricity a year (US$93
million).
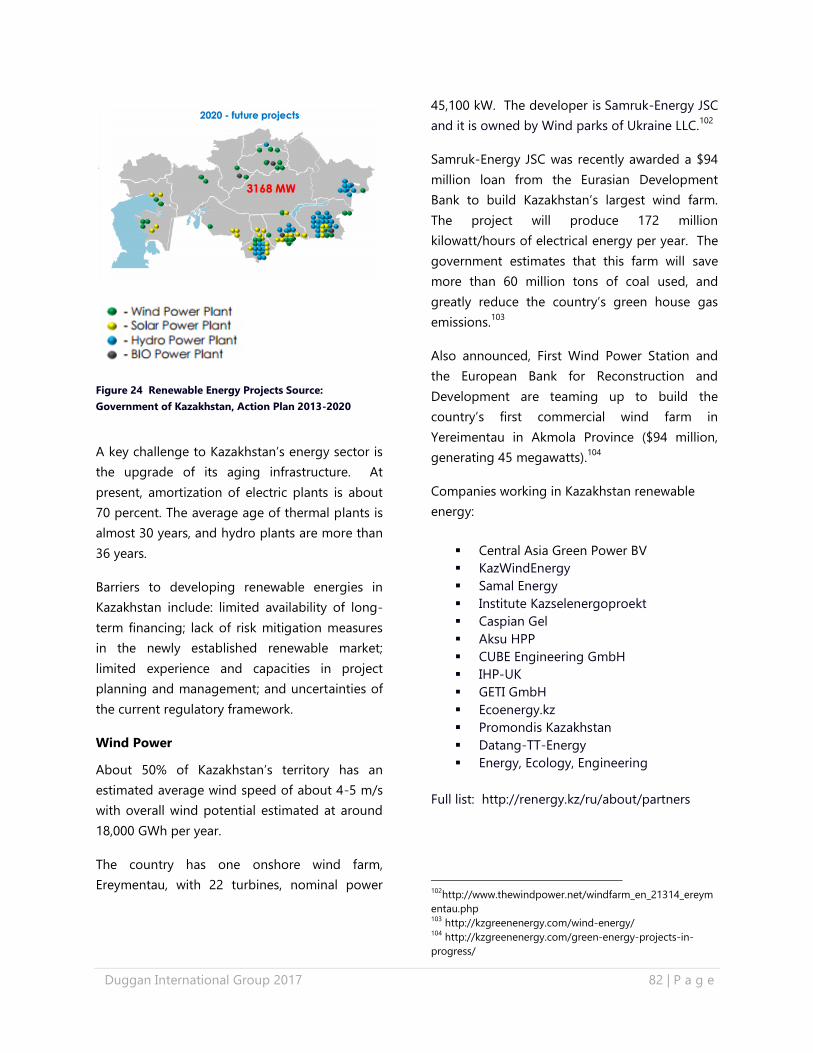
Duggan International Group 2017 82 | P a g e
Figure 24 Renewable Energy Projects Source:
Government of Kazakhstan, Action Plan 2013-2020
A key challenge to Kazakhstan’s energy sector is
the upgrade of its aging infrastructure. At
present, amortization of electric plants is about
70 percent. The average age of thermal plants is
almost 30 years, and hydro plants are more than
36 years.
Barriers to developing renewable energies in
Kazakhstan include: limited availability of long-
term financing; lack of risk mitigation measures
in the newly established renewable market;
limited experience and capacities in project
planning and management; and uncertainties of
the current regulatory framework.
Wind Power
About 50% of Kazakhstan’s territory has an
estimated average wind speed of about 4-5 m/s
with overall wind potential estimated at around
18,000 GWh per year.
The country has one onshore wind farm,
Ereymentau, with 22 turbines, nominal power
45,100 kW. The developer is Samruk-Energy JSC
and it is owned by Wind parks of Ukraine LLC.102
Samruk-Energy JSC was recently awarded a $94
million loan from the Eurasian Development
Bank to build Kazakhstan’s largest wind farm.
The project will produce 172 million
kilowatt/hours of electrical energy per year. The
government estimates that this farm will save
more than 60 million tons of coal used, and
greatly reduce the country’s green house gas
emissions.103
Also announced, First Wind Power Station and
the European Bank for Reconstruction and
Development are teaming up to build the
country’s first commercial wind farm in
Yereimentau in Akmola Province ($94 million,
generating 45 megawatts).104
Companies working in Kazakhstan renewable
energy:
Central Asia Green Power BV
KazWindEnergy
Samal Energy
Institute Kazselenergoproekt
Caspian Gel
Aksu HPP
CUBE Engineering GmbH
IHP-UK
GETI GmbH
Ecoenergy.kz
Promondis Kazakhstan
Datang-TT-Energy
Energy, Ecology, Engineering
Full list: http://renergy.kz/ru/about/partners
102
http://www.thewindpower.net/windfarm_en_21314_ereym
entau.php 103
http://kzgreenenergy.com/wind-energy/ 104
http://kzgreenenergy.com/green-energy-projects-in-
progress/
Duggan International Group 2017 83 | P a g e
OPPORTUNITIES FOR NOVA SCOTIA
EXPORTERS
Best Prospects:
Project management services
Consultancy services in green energy,
waste management, energy efficiency
Engineering and construction services
for onshore wind
GOVERNMENT POLICIES/REGULATIONS
THAT ENCOURAGE SUSTAINABLE
TECHNOLOGIES
In 2009, Kazakhstan adapted a law “On Support
of Renewable Energy”. This step was designed to
assist the country’s plan to reach a goal of
having 3% of total energy from renewables by
2020. According to Kazakhstan’s plans, the share
of renewable energy will reach 25% by 2050.
In 2015, the country signed an enhanced
partnership agreement with the EU to cooperate
in joint work to improve the legislative
framework in renewable energy. Then in May
2016, the government announced plans to use
special auctions to purchase renewable energy
from energy-producing companies. The auctions
are proposed to make the selection process for
projects and investors transparent and clear,
increasing the effectiveness of technologies and
minimizing influence on tariffs.105
FUNDING INCENTIVES
A number of projects, including wind and solar
power plants, have been supported by the
European Bank for Reconstruction Development
(EBRD)106
and the Climate Investment Funds
through its Climate Technology Fund (CTF).
Notably, the interventions by the EBRD and the
105
http://astanatimes.com/2016/05/res/ 106
http://www.ebrd.com
CTF were explicitly designed to facilitate private
sector participation in project development and
mitigate associated risks.
Climate Investment Fund
https://www-
cif.climateinvestmentfunds.org/news/prize-
bank%E2%80%99s-pioneering-renewables-
work-kazakhstan
The World Bank also funds projects in
Kazakhstan. Nova Scotia companies should
review proposed and funded projects.
http://www.worldbank.org/en/country/kazakhsta
n/projects
Nova Scotia companies should also contact their
Global Affairs Canada representative for
assistance with working with international
financial institutions (IFI’s).
OTHER SOURCES OF INFORMATION
Canadian Trade Commissioner Service
http://tradecommissioner.gc.ca/kazakhstan/inde
x.aspx?lang=eng
US Commercial Service
https://www.export.gov/article?id=Kazakhstan-
Market-Overview
US Government EIA Country Analysis Brief –
Kazakhstan
https://www.eia.gov/beta/international/analysis.c
fm?iso=KAZ
Republic of Kazakhstan Country Economic
Memorandum Getting Competitive, Staying
Competitive: The Challenge of Managing
Kazakhstan’s Oil Boom* Background Paper No.
5: The Supplier Development in the Oil and Gas
Sector of Kazakhstan April 2004
Duggan International Group 2017 84 | P a g e
http://siteresources.worldbank.org/INTKAZAKHS
TAN/Resources/Backgroundpaper5_SupplierDev
elopment_April2004.pdf
Association of Renewable Energy Kazakhstan
http://futureenergyforum.org/assets/future-
energy/pdf/3/Arman%20Kashkinbekov%20Repo
rt.pdf
GREEN ACTION PROGRAMME OCED, Financing
Climate Action in Kazakhstan GREEN ACTION
PROGRAMME COUNTRY STUDY, 2016
UK Department of International Trade
https://www.gov.uk/government/publications/ex
porting-to-kazakhstan/exporting-to-kazakhstan
NOTES:
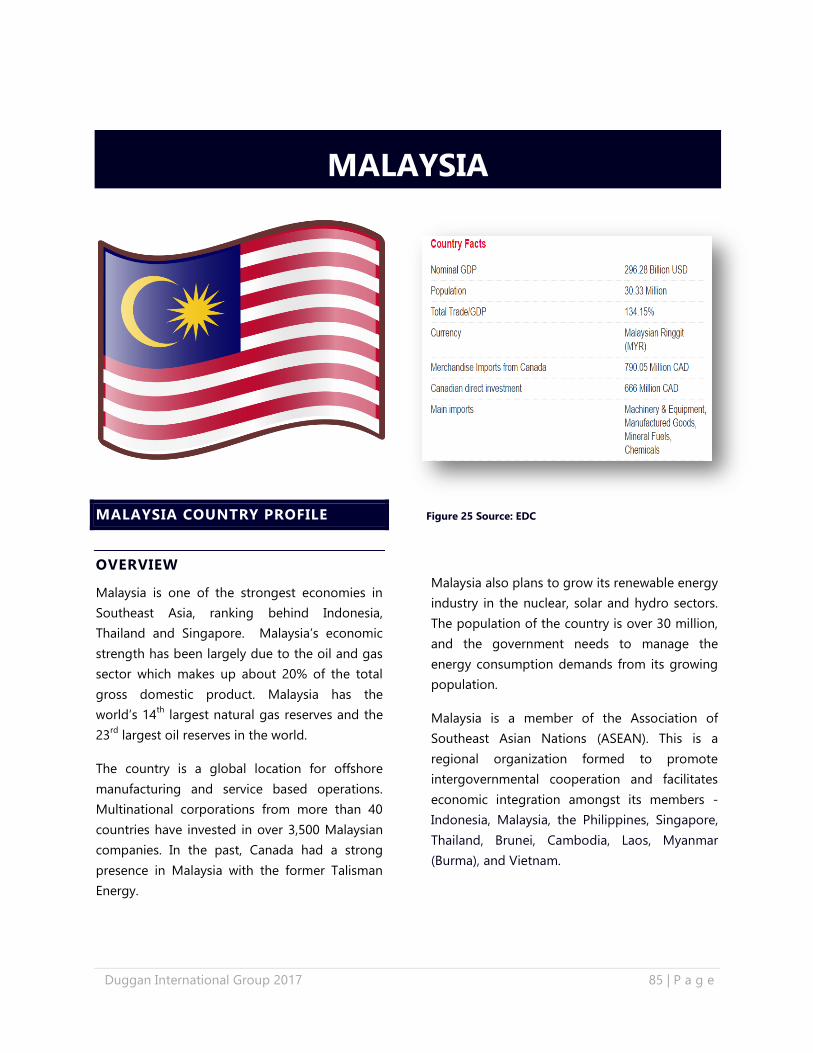
Duggan International Group 2017 85 | P a g e
MALAYSIA COUNTRY PROFILE
OVERVIEW
Malaysia is one of the strongest economies in
Southeast Asia, ranking behind Indonesia,
Thailand and Singapore. Malaysia’s economic
strength has been largely due to the oil and gas
sector which makes up about 20% of the total
gross domestic product. Malaysia has the
world’s 14th
largest natural gas reserves and the
23rd
largest oil reserves in the world.
The country is a global location for offshore
manufacturing and service based operations.
Multinational corporations from more than 40
countries have invested in over 3,500 Malaysian
companies. In the past, Canada had a strong
presence in Malaysia with the former Talisman
Energy.
Malaysia also plans to grow its renewable energy
industry in the nuclear, solar and hydro sectors.
The population of the country is over 30 million,
and the government needs to manage the
energy consumption demands from its growing
population.
Malaysia is a member of the Association of
Southeast Asian Nations (ASEAN). This is a
regional organization formed to promote
intergovernmental cooperation and facilitates
economic integration amongst its members -
Indonesia, Malaysia, the Philippines, Singapore,
Thailand, Brunei, Cambodia, Laos, Myanmar
(Burma), and Vietnam.
MALAYSIA
Figure 25 Source: EDC
Duggan International Group 2017 86 | P a g e
COUNTRY SOURCES OF ENERGY
The primary energy resources consumed in
Malaysia are petroleum and natural gas, with
estimated shares of 40% and 36%, respectively
in 2012. About 17% of the country's energy
consumption is met by coal.
Approximately 7% of the country’s energy mix is
from renewable resources. Within this
percentage, the Sustainable Energy
Development Authority (SEDA) reported in 2016,
that this figure was comprised of 68% solar PV,
17% biomass, 5% mini-hydro, 4% solid waste,
and 2% biogas.
CURRENT STATE OF ENERGY USE AND
‘ENERGY DIRECTION’
At the beginning of 2015, liquids reserves (oil
and condensate) were estimated to be over 2.5
billion barrels while remaining gas reserves were
estimated to be nearly 34 trillion cubic feet.
Malaysia expects offshore oil and gas production
to equal onshore production in the next 15 to 20
years.
The country has targeted 2017 to become Asia
Pacific’s oil and gas hub. Malaysia aims to take
full advantage of its strategic location for key
shipping lanes of petroleum in the region.
Moreover, through pro-business policies, the
country is committed to ensuring it has a
sustainable and successful oil and gas industry.
Malaysia created a vibrant market for merger-
and-acquisition activities to acquire new
technology, more capabilities, physical space
and training workers to support the growth of
the upstream and downstream industry sector.107
Malaysia's heavy reliance on oil and natural gas
to sustain its economic growth is causing the
107
http://www.mida.gov.my/home/oil-and-gas/posts/
government to emphasize fuel diversification
through coal imports and to promote
investments in renewable energy.
Malaysia’s developed a strategy for renewable
energy, the 11th
Malaysia Plan (11MP). The
strategy sets a target of 2080 MW of renewable
energy capacity by 2020. The energy mix
proposed will be comprised of 38% biomass,
17% solid waste, 12% biogas, 24% mini-hydro,
and 9% solar photovoltaic (PV). New projects
and technologies are also being investigated.108
ENERGY INDUSTRY
OIL AND GAS
As one of the major oil and gas producers in
Southeast Asia, all oil and gas rights in the
country are held by the national oil and gas
company, Petroliam Nasional Berhad
(PETRONAS). PETRONAS is the sole owner of
mineral rights and has overall responsibility and
oversight for all aspects of the petroleum
operations in Malaysia, including licensing.
More than half of Malaysian oil production
currently comes from the Tapis Oil Field in the
offshore Malay basin. Recently, Malaysia saw
marginal growth in oil production and reserves,
while gas production continued to slip
downwards. This continuing decline in
production at Malaysia's major shallow water
producing oil fields prompted government to
encourage investment in an Enhanced Oil
Recovery (EOR) program and the development
of marginal and deep water reserves. Malaysia’s
new reserves are found mostly off the coast of
Northern Borneo between 200 to 1200 metres
108
https://www.oxfordbusinessgroup.com/analysis/refresh-
and-renew-government-policy-and-market-forces-are-
driving-growth-throughout-renewables
Duggan International Group 2017 87 | P a g e
deep, making it more costly to extract these
resources.
Malaysia is also actively investing in reservoir
development. Exploration and development
activities in Malaysia focus on offshore the
Sarawak and Sabah fields.
The country’s strategy for energy security is to
export its premium Tapis sweet crude oil and
import low-grade oil to refine in its downstream
facilities. The country plans to increase its
refining capacity to become a net oil product
exporter. The Pengerang Integrated Petroleum
Complex (PIPC) in Johor, and Sipitang Oil & Gas
Industrial Park (SOGIP) in Sabah will almost
double the refining capacity nationwide from
588,000 bbl/d to 1,158,000 bbl/day.
Malaysia has invested heavily in refining
activities and now has nearly 539,000 barrels per
day (bbl/d) of refining capacity at seven facilities,
fulfilling most of its demand for petroleum
products domestically. Facilities are operated by
PETRONAS, ConocoPhillips, and Petron. The
Pengerang Johor Refinery Project at the
southern tip of Peninsular Malaysia is anticipated
to be completed in 2019.
To support the needs of the supply value chain,
there are over 3,500 oil and gas businesses in
Malaysia. The industry is comprised of
international oil companies, independents,
services and manufacturing companies. Key
strategic segments for the industry are in
marine, drilling, engineering, fabrication,
offshore installation and operations, and
maintenance (O&M). Many major global
machinery & equipment manufacturers have
bases in Malaysia, not only for the Malaysian oil
and gas industry, but to serve other markets as
well.
LNG
In 2013, Malaysia was the world's second-largest
exporter of liquefied natural gas after Qatar.
Malaysia held 83 trillion cubic feet (Tcf) of
proved natural gas reserves as of January 2014,
and it was the third-largest natural gas reserve
holder in the Asia-Pacific region. More than half
of the country's natural gas reserves are located
in its eastern areas, predominantly offshore
Sarawak. Most of Malaysia's gas reserves are
associated with oil basins, although Sarawak and
Sabah have an increasing amount of non-
associated gas reserves. These reserves have
offset some of the declines from mature oil and
gas basins offshore.
The country is currently experiencing a
geographic disparity of natural gas supply and
demand amongst its regions. The Western
Peninsular Malaysia demands more natural gas
to fuel the power and industrial sectors, while
the eastern states of Sarawak and Sabah,
produce natural gas and currently lack the local
demand for it. To meet pressing gas needs in
Peninsular Malaysia, PETRONAS is developing
various degasification terminals to secure supply
from the global gas market.
PROJECTS
In January 2017, Malaysian oilfield
solutions provider, SapuraKencana
Petroleum, received five contracts worth
a combined US$300m for engineering,
construction and installation services to
provide underwater services for
Petronas Carigali. The contract also
includes analysis, maintenance and
repair services for Petronas Carigali's
subsea facilities located offshore
Peninsular Malaysia. Work is expected to
start in April 2017.
SapuraKencana Energy has made a
significant gas discovery from its 2015
three-well drilling campaign in offshore
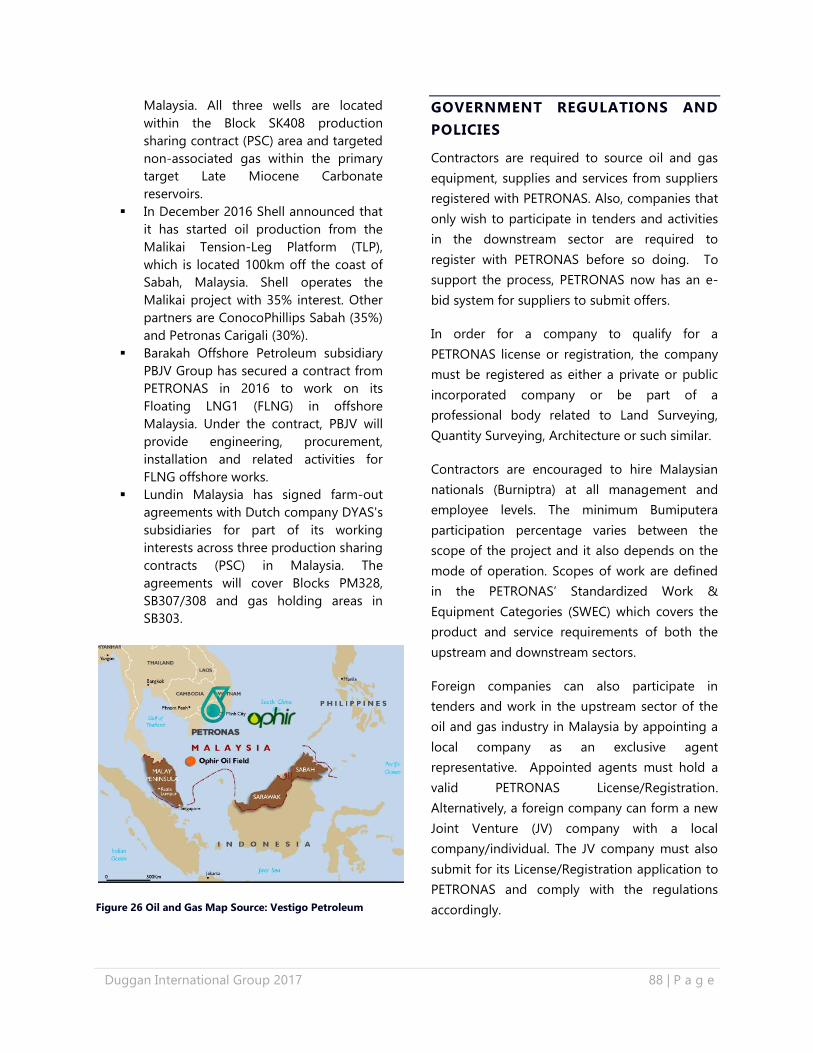
Duggan International Group 2017 88 | P a g e
Malaysia. All three wells are located
within the Block SK408 production
sharing contract (PSC) area and targeted
non-associated gas within the primary
target Late Miocene Carbonate
reservoirs.
In December 2016 Shell announced that
it has started oil production from the
Malikai Tension-Leg Platform (TLP),
which is located 100km off the coast of
Sabah, Malaysia. Shell operates the
Malikai project with 35% interest. Other
partners are ConocoPhillips Sabah (35%)
and Petronas Carigali (30%).
Barakah Offshore Petroleum subsidiary
PBJV Group has secured a contract from
PETRONAS in 2016 to work on its
Floating LNG1 (FLNG) in offshore
Malaysia. Under the contract, PBJV will
provide engineering, procurement,
installation and related activities for
FLNG offshore works.
Lundin Malaysia has signed farm-out
agreements with Dutch company DYAS's
subsidiaries for part of its working
interests across three production sharing
contracts (PSC) in Malaysia. The
agreements will cover Blocks PM328,
SB307/308 and gas holding areas in
SB303.
Figure 26 Oil and Gas Map Source: Vestigo Petroleum
GOVERNMENT REGULATIONS AND
POLICIES
Contractors are required to source oil and gas
equipment, supplies and services from suppliers
registered with PETRONAS. Also, companies that
only wish to participate in tenders and activities
in the downstream sector are required to
register with PETRONAS before so doing. To
support the process, PETRONAS now has an e-
bid system for suppliers to submit offers.
In order for a company to qualify for a
PETRONAS license or registration, the company
must be registered as either a private or public
incorporated company or be part of a
professional body related to Land Surveying,
Quantity Surveying, Architecture or such similar.
Contractors are encouraged to hire Malaysian
nationals (Burniptra) at all management and
employee levels. The minimum Bumiputera
participation percentage varies between the
scope of the project and it also depends on the
mode of operation. Scopes of work are defined
in the PETRONAS’ Standardized Work &
Equipment Categories (SWEC) which covers the
product and service requirements of both the
upstream and downstream sectors.
Foreign companies can also participate in
tenders and work in the upstream sector of the
oil and gas industry in Malaysia by appointing a
local company as an exclusive agent
representative. Appointed agents must hold a
valid PETRONAS License/Registration.
Alternatively, a foreign company can form a new
Joint Venture (JV) company with a local
company/individual. The JV company must also
submit for its License/Registration application to
PETRONAS and comply with the regulations
accordingly.
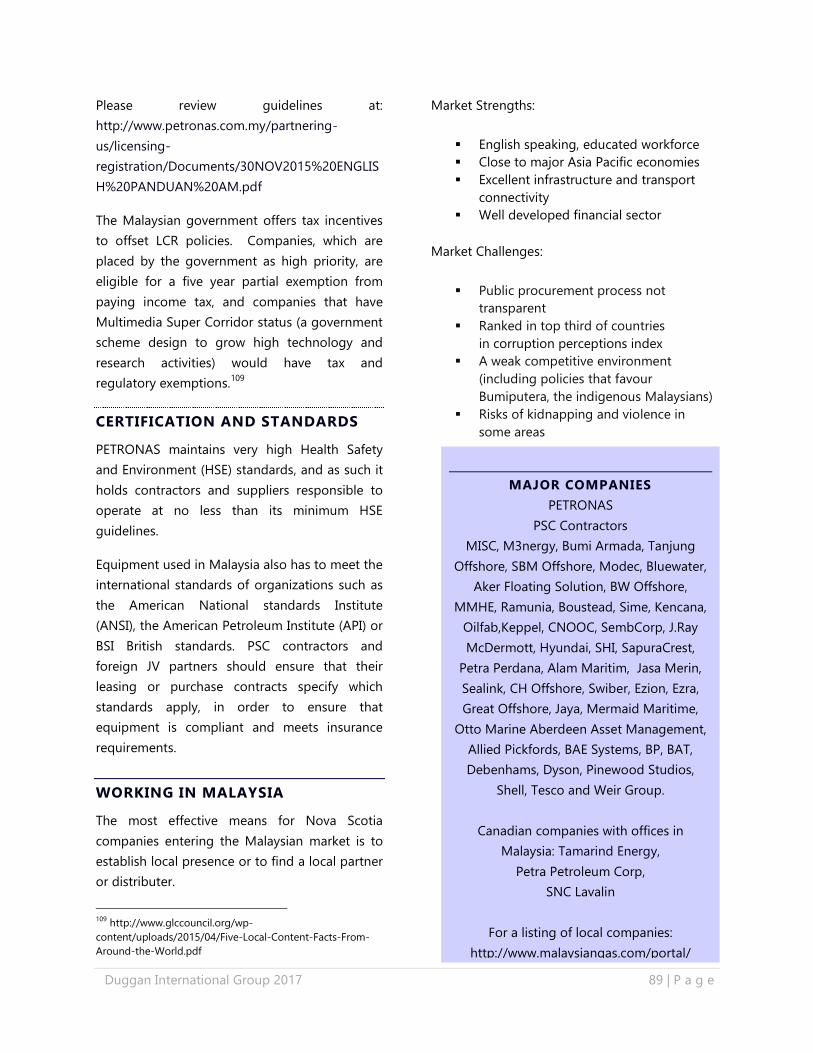
Duggan International Group 2017 89 | P a g e
Please review guidelines at:
http://www.petronas.com.my/partnering-
us/licensing-
registration/Documents/30NOV2015%20ENGLIS
H%20PANDUAN%20AM.pdf
The Malaysian government offers tax incentives
to offset LCR policies. Companies, which are
placed by the government as high priority, are
eligible for a five year partial exemption from
paying income tax, and companies that have
Multimedia Super Corridor status (a government
scheme design to grow high technology and
research activities) would have tax and
regulatory exemptions.109
CERTIFICATION AND STANDARDS
PETRONAS maintains very high Health Safety
and Environment (HSE) standards, and as such it
holds contractors and suppliers responsible to
operate at no less than its minimum HSE
guidelines.
Equipment used in Malaysia also has to meet the
international standards of organizations such as
the American National standards Institute
(ANSI), the American Petroleum Institute (API) or
BSI British standards. PSC contractors and
foreign JV partners should ensure that their
leasing or purchase contracts specify which
standards apply, in order to ensure that
equipment is compliant and meets insurance
requirements.
WORKING IN MALAYSIA
The most effective means for Nova Scotia
companies entering the Malaysian market is to
establish local presence or to find a local partner
or distributer.
109
http://www.glccouncil.org/wp-
content/uploads/2015/04/Five-Local-Content-Facts-From-
Around-the-World.pdf
Market Strengths:
English speaking, educated workforce
Close to major Asia Pacific economies
Excellent infrastructure and transport
connectivity
Well developed financial sector
Market Challenges:
Public procurement process not
transparent
Ranked in top third of countries
in corruption perceptions index
A weak competitive environment
(including policies that favour
Bumiputera, the indigenous Malaysians)
Risks of kidnapping and violence in
some areas
MAJOR COMPANIES
PETRONAS
PSC Contractors
MISC, M3nergy, Bumi Armada, Tanjung
Offshore, SBM Offshore, Modec, Bluewater,
Aker Floating Solution, BW Offshore,
MMHE, Ramunia, Boustead, Sime, Kencana,
Oilfab,Keppel, CNOOC, SembCorp, J.Ray
McDermott, Hyundai, SHI, SapuraCrest,
Petra Perdana, Alam Maritim, Jasa Merin,
Sealink, CH Offshore, Swiber, Ezion, Ezra,
Great Offshore, Jaya, Mermaid Maritime,
Otto Marine Aberdeen Asset Management,
Allied Pickfords, BAE Systems, BP, BAT,
Debenhams, Dyson, Pinewood Studios,
Shell, Tesco and Weir Group.
Canadian companies with offices in
Malaysia: Tamarind Energy,
Petra Petroleum Corp,
SNC Lavalin
For a listing of local companies:
http://www.malaysiangas.com/portal/
Duggan International Group 2017 90 | P a g e
OPPORTUNITIES FOR NOVA SCOTIA
EXPORTERS
World Energy City Partnership member, Kuala
Lumpur, is fast emerging as the leading energy
city of the Asia-Pacific region.
Opportunities in Malaysia remain in the mature
shallower-water areas for smaller players, both
domestic and foreign contractors and suppliers.
Larger companies are shifting their exploration
in to the deepwater Sarawak and Sabah basins.
Opportunities exist for companies that can
consistently deliver cost effective new
technology that reduces development and/or
provides increased production performance.
The PETRONAS University of Technology has a
goal of becoming the region’s foremost school
for the oil and gas industry science and
technology research and application.
Companies providing education and research in
HSE and ICT may also be able provide education
and training.
Best Prospects:
Deep water drilling technology
Enhanced Oil Recovery (EOR)
technology
Oil Field Services and Equipment (OFSE)
operations
Energy efficiency technology
LNG education and training
Safety training and other niche offshore
education
In Canada, the Pacific NorthWest LNG is a
proposed natural gas liquefaction and export
facility in British Columbia. The facility would
liquefy and export natural gas produced
by Progress Energy Canada Ltd. in northeast B.C.
Both Pacific NorthWest LNG and Progress
Energy are majority-owned by Malaysia’s
PETRONAS. The Government of Canada
approved its environment assessment in
September 2016; however the project is waiting
for the shareholders final investment decision.110
Nova Scotia companies could leverage this
relationship to work with PETRONAS and its
suppliers.
IMPACTS DUE TO THE VOLATILITY
IN OIL PRICES
The significant decline in oil prices forced the
Malaysian oil and gas industry to review existing
and new projects. PETRONAS reduced a sizable
portion of its capital and operational
expenditures planned for 2016. They are also
prioritizing their upstream activities with a focus
on the continuation of its deep-water
exploration and production (E&P) activities and
brownfield rejuvenation.
PETRONAS introduced the Cost Reduction
Alliance (CORAL) 2.0 and has engaged 25
petroleum contractors to collectively negotiate
supply and service contracts to realize genuine
cost savings.111
RENEWABLE INDUSTRY
There is an increasing trend in Malaysia to adopt
greener and more efficient technology for a
more sustainable energy generation and a
cleaner environment. The lead government
department in Malaysia is the Sustainable
Energy Development Authority (SEDA).
For the period Jan – Dec 2015, a total of 128
projects in renewable energy with total
investments of RM1.37 billion were approved of
110
http://www.pacificnorthwestlng.com/the-
project/the-project/ 111
https://www.export.gov/apex/article2?id=Malaysia-Oil-
and-Gas-Equipment
Duggan International Group 2017 91 | P a g e
in the area of RM1.35 billion. The country
created their strategy for renewable energy in
the 11th
Malaysia National Development Plan.
The country is incorporating a feed-in-tariff
mechanism to make renewable energy
competitive with conventional energy
sources. The country is focusing on developing:
Electric vehicle components
Solar PV modules and balance of system
LED and OLED
Biomass fuel/power using indigenous
feedstock
Methane capture and biogas power
plants
OPPORTUNITIES FOR NOVA SCOTIA
EXPORTERS
Best Prospects:
Technologies, partnerships and research
co-operation in industrial waste
recycling and wastewater treatment
systems
LED lights
GOVERNMENT POLICIES/REGULATIONS
THAT ENCOURAGE SUSTAINABLE
TECHNOLOGIES
SEDA is implementing policies to guarantee
access to the grid for producers of biomass,
biogas, solar and mini-hydro. SEDA will issue
approval certificates to generators for projects
up to 30 MW in size. These generators will then
sell their output to distributors – Tenega
Nasional Bhd (TNB) and NUR Power on the
peninsula, and Sabah Electricity Sdn Bhd (SESB)
in eastern Malaysia.
There is also a cap on the number of approved
certificates. They will be issued every six months
for each power type. This process will ensure
funds are available to make all the payments to
suppliers.
FUNDING INCENTIVS
The High Commission of Canada in Malaysia
administers an annual fund, the Canada Fund for
Local Initiatives (CFLI). The program funds small,
but visible high impact, results-oriented projects
that are proposed and implemented by local
NGOs and other grassroots organizations.
The average contribution is in the range of CAD
$15,000-$35,000 for each individual project.
Larger projects may be considered on an
exceptional basis, with appropriate justification
for use of funds (to a maximum of $50,000).
Proposals are now closed. Please check with
Global Affairs Canada (GAC) for next the round
of funding and working with a local partner.
http://www.canadainternational.gc.ca/malaysia-
malaisie/offices-
bureaux/CFLI_FCIL.aspx?lang=eng
Malaysia has incentives for renewable energy
projects however; the applicant/project must be
located in Malaysia and the company 70%
owned by a Malaysian. https://www.gtfs.my/
The Asia Development Bank (ADB) is not active
in Malaysia, as its projects, whether public or
private, must satisfy the criterion of poverty
alleviation in order to qualify for ADB financing.
The Trans-Pacific Partnership (TPP) Free trade
deal has now been cancelled since the US
government announced they are pulling out of
the deal. TPP can only be ratified if six countries,
totaling 85% of the deal’s combined GDP,
approve the deal. Only the United States and
Japan had the sole power to veto the TPP
because of the size of their economies.
Duggan International Group 2017 92 | P a g e
Funding is an issue right now in Malaysia. There
is currently an alleged multibillion-dollar
misappropriation of money in the Malaysian
state investment fund for economic
development. To date, four people have been
sent to prison, and the Malaysian Prime Minister
is under investigation.
OTHER SOURCES OF INFORMATION
UK Government Country Profile Malaysia
https://www.gov.uk/government/publications/ex
porting-to-malaysia/exporting-to-malaysia
US Commercial Service
https://www.export.gov/article?id=Malaysia-Oil-
and-Gas-Equipment
US Government EIA Country Analysis Brief –
Malaysia
https://www.eia.gov/beta/international/analysis.c
fm?iso=MYS
Oil & Gas Sector Profile Malaysia, October 2015
Canadian Trade Commissioner Service
http://tradecommissioner.gc.ca/malaysia-
malaisie/market-reports-etudes-de-
marches/index.aspx?lang=eng
Malaysia Government Policy And Market Forces
Driving Demand For Renewables
https://www.oxfordbusinessgroup.com/analysis/
refresh-and-renew-government-policy-and-
market-forces-are-driving-growth-throughout-
renewables
NOTES:
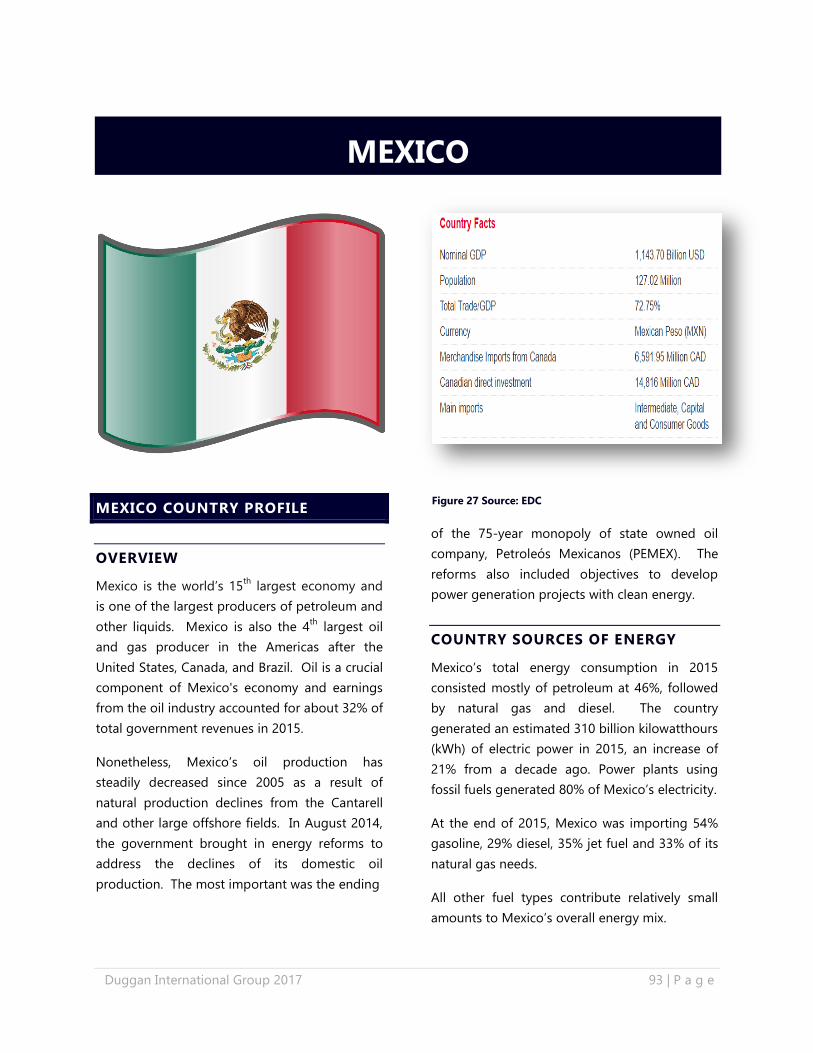
Duggan International Group 2017 93 | P a g e
MEXICO COUNTRY PROFILE
OVERVIEW
Mexico is the world’s 15th
largest economy and
is one of the largest producers of petroleum and
other liquids. Mexico is also the 4th
largest oil
and gas producer in the Americas after the
United States, Canada, and Brazil. Oil is a crucial
component of Mexico's economy and earnings
from the oil industry accounted for about 32% of
total government revenues in 2015.
Nonetheless, Mexico’s oil production has
steadily decreased since 2005 as a result of
natural production declines from the Cantarell
and other large offshore fields. In August 2014,
the government brought in energy reforms to
address the declines of its domestic oil
production. The most important was the ending
of the 75-year monopoly of state owned oil
company, Petroleós Mexicanos (PEMEX). The
reforms also included objectives to develop
power generation projects with clean energy.
COUNTRY SOURCES OF ENERGY
Mexico’s total energy consumption in 2015
consisted mostly of petroleum at 46%, followed
by natural gas and diesel. The country
generated an estimated 310 billion kilowatthours
(kWh) of electric power in 2015, an increase of
21% from a decade ago. Power plants using
fossil fuels generated 80% of Mexico’s electricity.
At the end of 2015, Mexico was importing 54%
gasoline, 29% diesel, 35% jet fuel and 33% of its
natural gas needs.
All other fuel types contribute relatively small
amounts to Mexico’s overall energy mix.
MEXICO
Figure 27 Source: EDC
Duggan International Group 2017 94 | P a g e
CURRENT STATE OF ENERGY USE AND
‘ENERGY DIRECTION’
Downstream, Mexico’s total oil consumption
remained relatively steady over the past decade,
averaging about 1.7 million b/d in 2015.
However, natural gas is increasingly replacing oil
as a feedstock in power generation. Projected
increases in natural gas consumption are
resulting in plans to build new pipelines to
import natural gas from the United States and
invest in Mexico’s power plants.
Also, a result of the energy reform, investment in
Mexico’s renewable energy sector is expected to
increase sharply in the following 15 years. The
Development Program of the National Electric
System (PRODESEN) for 2016-2030 has
committed 1,684 million pesos (approximately
US$90 million) out of which 79% will be invested
in generation from clean energy sources. The
largest share will be for wind and solar projects,
representing 23% and 20% respectively.
The country is also becoming more attractive for
foreign direction investment. The renewable
industry recently received US$13.5 billion from
the US, Germany and Spain. The Canadian
government (NRCan) announced in 2016 that it
will contribute CDN$14 million to reduce short-
lived climate pollutants (SLCPs), like methane,
through partnerships with Mexico and Chile.112
ENERGY INDUSTRY
OIL AND GAS
Mexico had 9.7 billion barrels of proved oil
reserves as of the end of 2015, consisting mostly
of heavy crude oil varieties. The largest
concentration is from the offshore southern part
112
http://www.newswire.ca/news-releases/canada-invests-in-
clean-technology-in-mexico-and-in-chile-to-reduce-
pollution-for-a-cleaner-world-601133406.html
of the country, particularly the Campeche Basin.
Because the concentration of Mexico’s oil
production is offshore, tropical storms or
hurricanes often disrupt oil operations.
There are also sizable reserves in the onshore
basins of the northern parts of Mexico. Onshore
fields account for roughly 25% of Mexico’s total
crude oil production. Most of this production is
of light or extra-light crude oil from the southern
part of the country. The largest oilfield in the
south of Mexico is Samaria-Luna, which
produced nearly 145,000 b/d in 2015. The most
notable onshore prospect in the north is the
Aceite Terciario del Golfo (ATG) project, better
known as Chicontepec, located northeast of
Mexico City.
As previously noted, Mexico’s oil production has
been in decline. The country’s production is
down approximately 32% from its peak in 2004.
Crude oil accounted for 2.3 million b/d of total
output, with the remainder attributed to lease
condensate, natural gas liquids, and refinery
processing. Mexico is a significant crude oil
exporter as well as a net importer of refined
petroleum products.
Mexico’s six refineries, all operated by PEMEX,
had a total refining capacity of 1.54 million b/d
as of the end of 2015. Mexico hopes to reduce
its imports of refined products from the United
States by improving domestic refining capacity
and the output quality. In February 2012, PEMEX
awarded a contract for the design of a new
refinery at Tula, but in December 2014 the
company cancelled this contract and opted for a
US$4.6 billion expansion of the existing facility.
Gasoline and diesel production is estimated to
increase from 140,000 b/d to 300,000 b/d at Tula
when it is completed in 2018.
Duggan International Group 2017 95 | P a g e
Working with PEMEX may not run smoothly.
The company is nearly US$90 billion in debt and
owes more than US$5.5 billion to service
providers. In April 2016, the Mexican
government gave PEMEX a US$1.5 billion tax
break, plus another US$4.2 billion, to help pay
contractors. In return for the aid, PEMEX must
slash its debt by the same amount, stick to an
austerity strategy, and develop debt
management plans. PEMEX also received a
US$822 million credit line from a consortium of
private Mexican banks, which can be put toward
debt repayments. 113
Canadian companies have done considerable
business in the past with PEMEX. Export
Development Canada support can also be
leveraged for working in Mexico. As reported by
the Canadian Manufacturers and Exporters (CME
Doing Business in Mexico), PEMEX had
previously acquired equipment and supplies
from at least 111 Canadian firms on an annual
basis, and purchases from these companies rose
from US$69 million in 2006 to US$613 million in
2009. Canadian firms have invested extensively
in Mexico in order to service the oil and gas
market more effectively, and several Canadian
drilling companies established offices in the
country in 2009 and 2010. Nova Scotia
companies may be able to capitalize on Mexico’s
new openness to foreign companies.
LNG
Mexico has considerable natural gas resources,
but its production is modest relative to other
North American countries. Natural gas used for
electricity generation has risen rapidly as price
and availability have made it a more economic
fuel source. The country currently imports most
of its gas from the United States. Until a
113
http://policyoptions.irpp.org/magazines/november-
2016/mexicos-oil-market-challenges-and-canada/
pipeline is constructed, it is cost prohibitive for
Canada to export gas to Mexico.
Coal
Coal consumption in Mexico leveled out as
natural gas consumption increased. Coal
represents only 7% of total electricity
generation. Mexico is a net importer of coal,
supplying about 80% of its coal demand
domestically.
Nuclear
Mexico has one nuclear power plant, Laguna
Verde, in Veracruz. The Laguna Verde power
plant includes two boiling water reactors with a
combined generating capacity of 1,510 MW. It
accounted for 4% of Mexico’s total electricity
generation in 2015. Current operation licenses
for the reactors expire in 2020 and 2025, but
they are expected to receive extensions. There
are plans to expand Mexico’s nuclear generation
capacity by building additional plants; three
nuclear power plants are planned and scheduled
for operation by 2026, 2027, and 2028.
Shale Gas
Mexico ranks 8th
in the world in shale oil
reserves. The country has 13.1 billion barrels of
technically recoverable resources. Shale
resources are found in the Burgos basin near the
US northern border. The development of the
shale gas industry is hindered by required
technology and the availability of water
resources.
PROJECTS
BHP Billiton has entered a contract with
PEMEX to complete development work
at Trion offshore discovery. The
agreement comprises of a commitment
to deliver a minimum work program
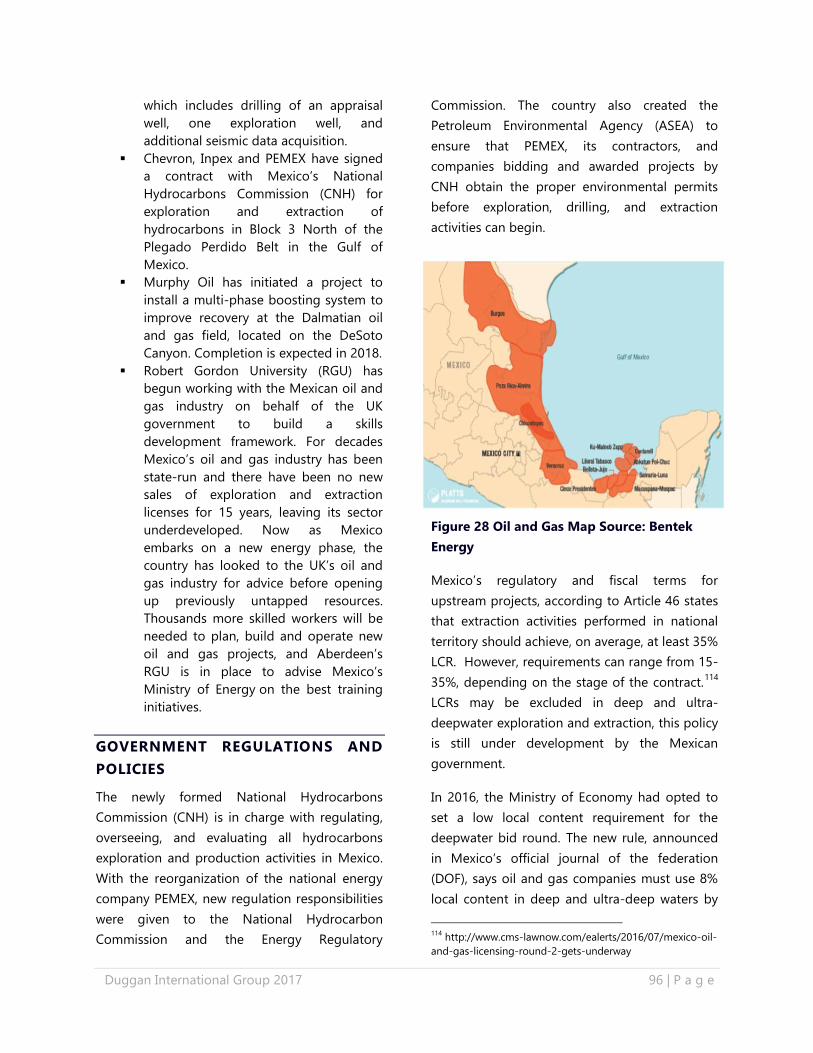
Duggan International Group 2017 96 | P a g e
which includes drilling of an appraisal
well, one exploration well, and
additional seismic data acquisition.
Chevron, Inpex and PEMEX have signed
a contract with Mexico’s National
Hydrocarbons Commission (CNH) for
exploration and extraction of
hydrocarbons in Block 3 North of the
Plegado Perdido Belt in the Gulf of
Mexico.
Murphy Oil has initiated a project to
install a multi-phase boosting system to
improve recovery at the Dalmatian oil
and gas field, located on the DeSoto
Canyon. Completion is expected in 2018.
Robert Gordon University (RGU) has
begun working with the Mexican oil and
gas industry on behalf of the UK
government to build a skills
development framework. For decades
Mexico’s oil and gas industry has been
state-run and there have been no new
sales of exploration and extraction
licenses for 15 years, leaving its sector
underdeveloped. Now as Mexico
embarks on a new energy phase, the
country has looked to the UK’s oil and
gas industry for advice before opening
up previously untapped resources.
Thousands more skilled workers will be
needed to plan, build and operate new
oil and gas projects, and Aberdeen’s
RGU is in place to advise Mexico’s
Ministry of Energy on the best training
initiatives.
GOVERNMENT REGULATIONS AND
POLICIES
The newly formed National Hydrocarbons
Commission (CNH) is in charge with regulating,
overseeing, and evaluating all hydrocarbons
exploration and production activities in Mexico.
With the reorganization of the national energy
company PEMEX, new regulation responsibilities
were given to the National Hydrocarbon
Commission and the Energy Regulatory
Commission. The country also created the
Petroleum Environmental Agency (ASEA) to
ensure that PEMEX, its contractors, and
companies bidding and awarded projects by
CNH obtain the proper environmental permits
before exploration, drilling, and extraction
activities can begin.
Figure 28 Oil and Gas Map Source: Bentek
Energy
Mexico’s regulatory and fiscal terms for
upstream projects, according to Article 46 states
that extraction activities performed in national
territory should achieve, on average, at least 35%
LCR. However, requirements can range from 15-
35%, depending on the stage of the contract.114
LCRs may be excluded in deep and ultra-
deepwater exploration and extraction, this policy
is still under development by the Mexican
government.
In 2016, the Ministry of Economy had opted to
set a low local content requirement for the
deepwater bid round. The new rule, announced
in Mexico’s official journal of the federation
(DOF), says oil and gas companies must use 8%
local content in deep and ultra-deep waters by
114
http://www.cms-lawnow.com/ealerts/2016/07/mexico-oil-
and-gas-licensing-round-2-gets-underway
Duggan International Group 2017 97 | P a g e
2025. This number is up from 3% established in
2015. LCR goals should be set in accordance to
the characteristics of the activity.115
Additionally,
PEMEX is required to have a 20% stake in all
cross-border fields, including deepwater and
onshore shale projects.
On the positive side, Mexico’s energy reform will
allow international energy companies to operate
in Mexico through competitive production
sharing contracts and licenses. The reform will
also eventually allow greater private investment
in retail fuel distribution.
PEMEX remains state-owned, but it is being
given more budgetary and administrative
autonomy. The company will have to compete
for bids with other firms on new projects.
However, PEMEX is allowed first refusal on
developing Mexican resources before private
companies can bid. This phase is known as
Round Zero and has resulted in PEMEX being
awarded the right to develop 83% of Mexico’s
proved and probable oil reserves and 21% of
total prospective resources.
To sell geological services, CNH is requiring
companies to register on its website so that
bidding companies can submit a bid with CNH
pre-authorization. CNH has created a program
called “Authorizations for Recognition and
Exploration of Upstream Oil and Gas” (ARES).
Some of the companies registered are Dolphin
Geophysical, Dowell Schlumberger, Fugro
Survey, GX Technology Corporation, and PGS
Geophysical and Spectrum.
Next, there are also plenty of opportunities in
midstream. The Federal Commission of
115http://www.oedigital.com/component/k2/item/12030-
mexico-lowers-local-content-rule-for-deepwater
Electricity is increasing pipeline infrastructure by
releasing public tenders. A particular opportunity
lies within a subsea pipeline project for
transporting natural gas from Texas to Veracruz,
Mexico.
CERTIFICATION AND STANDARDS
The oil and gas industry’s training standards
body has set new and higher standards for
Tropical Helicopter Underwater Escape Training
(THUET). The training has increased from four
hours to a one-day course which must be
repeated every four years.
WORKING IN MEXICO
Nova Scotia workers can enter Mexico through
the NAFTA agreement. Nova Scotia companies
unfamiliar with working in Mexico should
consider partnering and working with other
Canadian companies who have experience in
working the Mexican government system.
Market Strengths:
Largest economy in Latin America, after
Brazil
Established ties with Canadian
companies.
North American Free Trade Agreement
Proximity to the market
Market Challenges:
Highly competitive market from other
international suppliers. Products and
services need to have a competitive
advantage and companies need to be
able to market this advantage
It takes time to build and maintain
relationships with clients and
distributors
Language barriers mean that
interpreters may be required
Duggan International Group 2017 98 | P a g e
Corruption in police forces and issues
with kidnapping
Staying on top of any upcoming
changes to NAFTA
OPPORTUNITIES FOR NOVA SCOTIA
EXPORTERS
World Energy City Partnership member,
Villahermosa, is the hub for O&G operations in
the South of Mexico.
The Mexico government reports that the country
desperately needs technology to boost oil and
gas production in fracking and deepwater
drilling.116 Nova Scotia companies that have
experience in unconventional resources may
have potential in this subsector.
Demand for imported upstream oil and gas
equipment and services is expected to increase
with the new reforms. These reforms will also
spur investment as private companies aim to
comply with the schedules on the awards for
shallow waters, onshore, deep water, heavy oil
and unconventional oil and gas projects.
In the upstream oil and gas subsector, PEMEX as
well as large companies like ExxonMobil, BP and
Chevron and midsized private companies are
invited to bid and will be requiring suppliers to
register to sell their equipment and services.
Selling to these companies will be a market
entrance strategy for Nova Scotia companies.
Best Prospects:
Project consultancy
Front End Engineering Design (FEED)
Enhanced / improved oil recovery
Asset integrity management
Production operations
Environmental control
116
http://www.cbc.ca/news/business/mexico-oilandgas-
suncor-atco-1.3618771
Regional geological studies
(including 3D and 2D seismic)
Reservoir appraisal and exploration
techniques
Training and education
Deep water technologies
Develop heavy and extra heavy oil
recovery technology
IMPACTS DUE TO THE VOLATILITY
IN OIL PRICES
Research on the effects of the fall in oil prices
vary. Some reports state that Mexico was
severely impacted. Another report states that
Mexico was relatively well protected as the
country has a more diversified economic
structure than many other oil exporters. In spite
of this, there was a fall in production, it did affect
the Mexican economy and the government may
have to increase non-oil revenues to cover
MAJOR COMPANIES
Petroleos Mexicanos (PEMEX)
ExxonMobil, BP, Chevron, Petrofac
Schlumberger, Halliburton Weatherford,
Baker Hughes / BJ Services, Grupo R
(Industrial Perforadora de Campeche), Grupo
Carso (Swecomex and Servicios Integrales
GSM), Grupo Diavaz/DMGP Servicios de
Integridad, Grupo TRADECO, Materiales y
Equipos, Petroleros (Matyep)
Canadian companies doing business in
Mexico:
TransCanada and ATCO
For a list of local Mexican suppliers:
http://amespac.org.mx/directorio-asociados/
Duggan International Group 2017 99 | P a g e
short-term fiscal deficits and mid-term rate
reductions in oil taxes.117
RENEWABLE INDUSTRY
The Mexican government estimates that by 2028
the installed capacity of renewable energy will
increase to 19,761 MW. Mexico had invested
US$4 billion in the renewable energy sector in
2015, more than double the amount invested
from the previous year.
In August 2015, the government reported a total
of 564 private permits were registered to
generate electricity from renewable energy
sources. The largest source of renewable power
generation in Mexico is from hydroelectric
power. The largest hydroelectric plant is the
2,400 MW Manuel Moreno Torres at the
Chicoasén dam in Chiapas. In the same river
basin, the Malpaso and Angostura dams have
capacities of 1,080 MW and 900 MW of power,
respectively. Another major hydroelectric
project, the 750-megawatt La Yesca facility, was
completed in November 2012. These larger
hydroelectric projects are supplemented by
smaller hydroelectric facilities (categorized as
lower than 30 MW each) that are being
developed by both the public and the private
sector. Lastly, in 2015, there were 3,000 MW of
hydroelectric projects under development, which
demonstrates the continuing importance of
hydroelectricity in Mexico.
GeoThermal
According to Mexico Energy Secretariat (SENER),
Mexico has 926 MW of geothermal capacity,
making the country 5th
in terms of global
117
The Impact of Lower Oil Prices on the Mexican Economy
By Adrián Lajous* December 9, 2014 Columbia Center for
Global Energy Policy
geothermal capacity. The largest of these
geothermal plants is the 720 MW Phase 2 at the
Azufres III site. This plant will add another 25
MW in capacity by June 2018.
Solar Power
Solar power has received significant attention in
northern Mexico, where the first large-scale solar
power project, Aura Solar I, began operations in
2013. Its capacity is 39 MW. More solar project
proposals are being considered as the cost to
generate power using solar is now competing
with natural gas. The electric power auction held
in March 2016 awarded contracts for 12 new
solar parks in Mexico.
Wind Power
In January 2015, the Mexican Wind Power
Association, the Federation of Electricity
Commission (CFE) and SENER announced US$14
billion of investments by 2018. These
investments represent an increase of almost
7,000 MW bringing the total amount of installed
wind energy to 9,500 MW.
Mexico currently has 47 wind farms. Several
wind projects are in development in Mexico’s
Baja California and in southern Mexico. The plan
is to boost Mexico’s wind generation capacity
from 3 GW in 2015 to 15 GW by 2022.
Approximately 90% of the current wind
generation capacity is located in Oaxaca, where
the Isthmus of Tehuantepec has especially
favorable wind resources and has been a focus
of government efforts to increase wind capacity.
Continuing the momentum, the Oaxaca region
expects an additional 2.5 GW to be operational
between 2017 and 2018. In Baja California,
Sempra U.S. Gas & Power is developing the 156
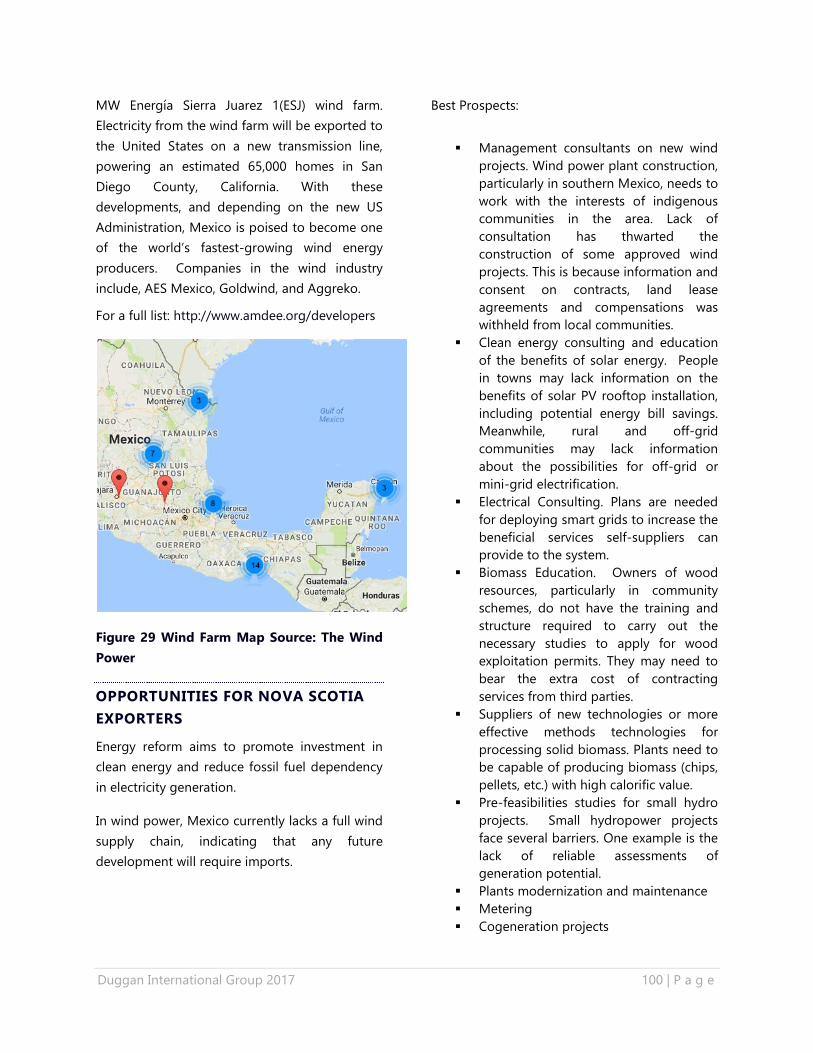
Duggan International Group 2017 100 | P a g e
MW Energía Sierra Juarez 1(ESJ) wind farm.
Electricity from the wind farm will be exported to
the United States on a new transmission line,
powering an estimated 65,000 homes in San
Diego County, California. With these
developments, and depending on the new US
Administration, Mexico is poised to become one
of the world’s fastest-growing wind energy
producers. Companies in the wind industry
include, AES Mexico, Goldwind, and Aggreko.
For a full list: http://www.amdee.org/developers
Figure 29 Wind Farm Map Source: The Wind
Power
OPPORTUNITIES FOR NOVA SCOTIA
EXPORTERS
Energy reform aims to promote investment in
clean energy and reduce fossil fuel dependency
in electricity generation.
In wind power, Mexico currently lacks a full wind
supply chain, indicating that any future
development will require imports.
Best Prospects:
Management consultants on new wind
projects. Wind power plant construction,
particularly in southern Mexico, needs to
work with the interests of indigenous
communities in the area. Lack of
consultation has thwarted the
construction of some approved wind
projects. This is because information and
consent on contracts, land lease
agreements and compensations was
withheld from local communities.
Clean energy consulting and education
of the benefits of solar energy. People
in towns may lack information on the
benefits of solar PV rooftop installation,
including potential energy bill savings.
Meanwhile, rural and off-grid
communities may lack information
about the possibilities for off-grid or
mini-grid electrification.
Electrical Consulting. Plans are needed
for deploying smart grids to increase the
beneficial services self-suppliers can
provide to the system.
Biomass Education. Owners of wood
resources, particularly in community
schemes, do not have the training and
structure required to carry out the
necessary studies to apply for wood
exploitation permits. They may need to
bear the extra cost of contracting
services from third parties.
Suppliers of new technologies or more
effective methods technologies for
processing solid biomass. Plants need to
be capable of producing biomass (chips,
pellets, etc.) with high calorific value.
Pre-feasibilities studies for small hydro
projects. Small hydropower projects
face several barriers. One example is the
lack of reliable assessments of
generation potential.
Plants modernization and maintenance
Metering
Cogeneration projects
Duggan International Group 2017 101 | P a g e
Parts/supplies for small to medium wind
farms
GOVERNMENT POLICIES/REGULATIONS
THAT ENCOURAGE SUSTAINABLE
TECHNOLOGIES
The Law for the Use of Renewable Energies and
Financing the Energy Transition was adopted to
reduce GHG emissions and promote the
country’s clean energy generation goals. The law
is meant to define and regulate the use of
renewable energy, mainly for power generation.
Targets to generate a share of total electricity
from clean energy technologies have been set
by the government at 35% by 2024, 40% by
2035 and 50% by 2050.
To help, the government is offering subsidies to
Mexican companies in gasoline and diesel. As
well, the government has created a market for
clean energy certificates (CELs). Wholesale
electricity users will be obliged to use 5% of their
total consumption from clean energy sources.
This will boost clean energy use for electricity
generation, particularly in energy intensive
industries.
FUNDING INCENTIVES
The North American Free Trade Agreement
(NAFTA) with Mexico gives Canadians a benefit
for exporting goods and services. The
uncertainty of the USA participation in NAFTA,
as well the tensions between the USA and
Mexico, could give Canadian suppliers an
advantage over their US competitors.
The following companies have access to EDC
funding to buy Canadian goods and services:
Comision Federal de Electricidad (CFE)
Cotemar S.A. de C.V.
P.M.I. Trading Limited
Petroleos Mexicanos - PEMEX
Cemex, S.A.B. de C.V.
Ternium México, S.A. de C.V.
Valores Quimicos, S.A. de C.V.
The Inter Development Bank and the Clean
Technology Fund issue green bonds to fund
clean technology projects in Mexico.
http://www.iadb.org/en/news/news-
releases/2015-05-19/energy-efficiency-in-
mexico,11161.html
Please contact your local Global Affair Canada
office for assistance with working with
international financial institutions (IFIs).
The Mexican government also created the Fund
for the Energy Transition and Sustainable Energy
to finance renewable and clean energy projects.
Nova Scotia companies would need to partner
with a local Mexican company as the lead to
access this funding.
http://inere.energia.gob.mx/publica/version3.2/
OTHER SOURCES OF INFORMATION
UK Government Country Profile Mexico
https://www.gov.uk/government/publications/
US Commercial Service
https://www.export.gov/article?series=a0pt0000
000PAuRAAW&type=Country_Commercial__kav
US Government EIA Country Analysis Brief –
Mexico https://www.eia.gov/beta/international/
Irena Renewable Energy Prospects 2015
http://www.irena.org/menu/index.aspx?mnu=Su
bcat&PriMenuID=36&CatID=141&SubcatID=59
News Announcements Offshore Technology
www.offshore-technology.com
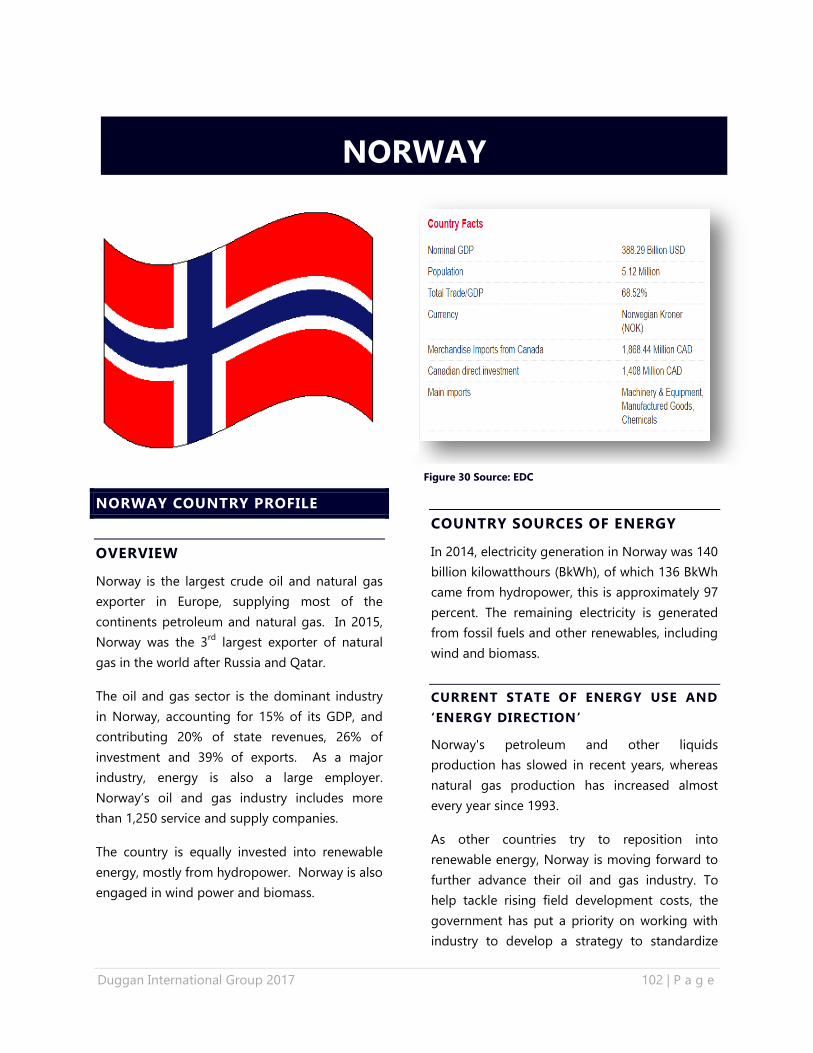
Duggan International Group 2017 102 | P a g e
NORWAY COUNTRY PROFILE
OVERVIEW
Norway is the largest crude oil and natural gas
exporter in Europe, supplying most of the
continents petroleum and natural gas. In 2015,
Norway was the 3rd
largest exporter of natural
gas in the world after Russia and Qatar.
The oil and gas sector is the dominant industry
in Norway, accounting for 15% of its GDP, and
contributing 20% of state revenues, 26% of
investment and 39% of exports. As a major
industry, energy is also a large employer.
Norway’s oil and gas industry includes more
than 1,250 service and supply companies.
The country is equally invested into renewable
energy, mostly from hydropower. Norway is also
engaged in wind power and biomass.
COUNTRY SOURCES OF ENERGY
In 2014, electricity generation in Norway was 140
billion kilowatthours (BkWh), of which 136 BkWh
came from hydropower, this is approximately 97
percent. The remaining electricity is generated
from fossil fuels and other renewables, including
wind and biomass.
CURRENT STATE OF ENERGY USE AND
‘ENERGY DIRECTION’
Norway's petroleum and other liquids
production has slowed in recent years, whereas
natural gas production has increased almost
every year since 1993.
As other countries try to reposition into
renewable energy, Norway is moving forward to
further advance their oil and gas industry. To
help tackle rising field development costs, the
government has put a priority on working with
industry to develop a strategy to standardize
NORWAY
Figure 30 Source: EDC
Duggan International Group 2017 103 | P a g e
solutions. The government is also working with
other European countries to further develop the
North Sea. A total of 38 crude and natural gas
projects are scheduled to start production in the
North Sea by 2025, Norway will be responsible
for 10 projects (UK 27 and Denmark 1).118
In June 2012, government officials from Norway,
Germany, and the United Kingdom confirmed
plans for subsea electric power connections
between their countries to strengthen the
northern European electricity grid and to
increase supply security. The Norwegian state-
owned energy system operator, Statnett, will
work with the United Kingdom’s National Grid to
construct the Norway United Kingdom cable
connection. It is expected to be completed in
2021. Statnett will then cooperate with Germany
to build the Norway-Germany cable, expected to
be completed in 2019.119
Norway also signed and ratified the Paris
Agreement in 2016. The Norwegian Government
intends to take a number of steps to reduce
greenhouse gas emissions and promote
technological advances. In doing so, the Ministry
of Climate and Environment has acknowledged
that they must make major cuts to reduce green
house gas emissions.120
To start, the
government is establishing a new climate and
energy fund, raising the CO2 tax rate for the
offshore industry, and improving public
transport.
118
http://www.offshore-
technology.com/researchreports/researchreportreport-
norway-and-uk-to-lead-in-planned-oil-and-gas-production-
in-the-north-sea-by-2025-5747465/ 119
EIA United States Government Norway Market Overview 120
http://climateactiontracker.org/countries/norway.html
ENERGY INDUSTRY
OIL AND GAS
There were 80 offshore fields in operation in
Norway at the start of 2016, producing around
1.5 MM boe per day. All oil and gas
development in Norway is offshore - the
Norwegian Continental Shelf (NCS) covers the
North Sea, Norwegian Sea and Barents Sea. The
Barents Sea and the Northern Norwegian Sea
regions are estimated to become the largest
contributor to Norway’s petroleum production
by the end of 2030.121
The most promising fields
are potential modification and satellite projects
at Aasta Hansteen, Norne, Skarv, Goliat, and
Snøhvit. As well, there are new field
developments at Johan Castberg, Wisting,
Barents Sea South East; an oil terminal at
Veidnes; and an oil spill base either in Lofoten or
Vesterålen.
State-run, Statoil, is the dominant company
operating approximately 70% of all fields on the
NCS. Statoil now ranks as the world’s largest
operator of fields in over 100m water depth. In
2015, there were 45 operators in total registered
on the NCS. The Norways direct economic
interest is managed through state-owned
company Petoro. This company is responsible
for increasing the value creation with operators.
The service and supply industry is well
represented throughout Norway. Most people
are employed in the Stavanger region. Clusters
of companies with particular sets of skills are
located throughout the country. Oslo is known
for its capabilities in engineering and seismic
companies. Trondheim has a strong position in
research and education, while the Bergen region
has become a centre for platform maintenance
and subsea equipment. In Buskerud, especially in
121
Rystad Energy report, “Petro Foresight 2030”
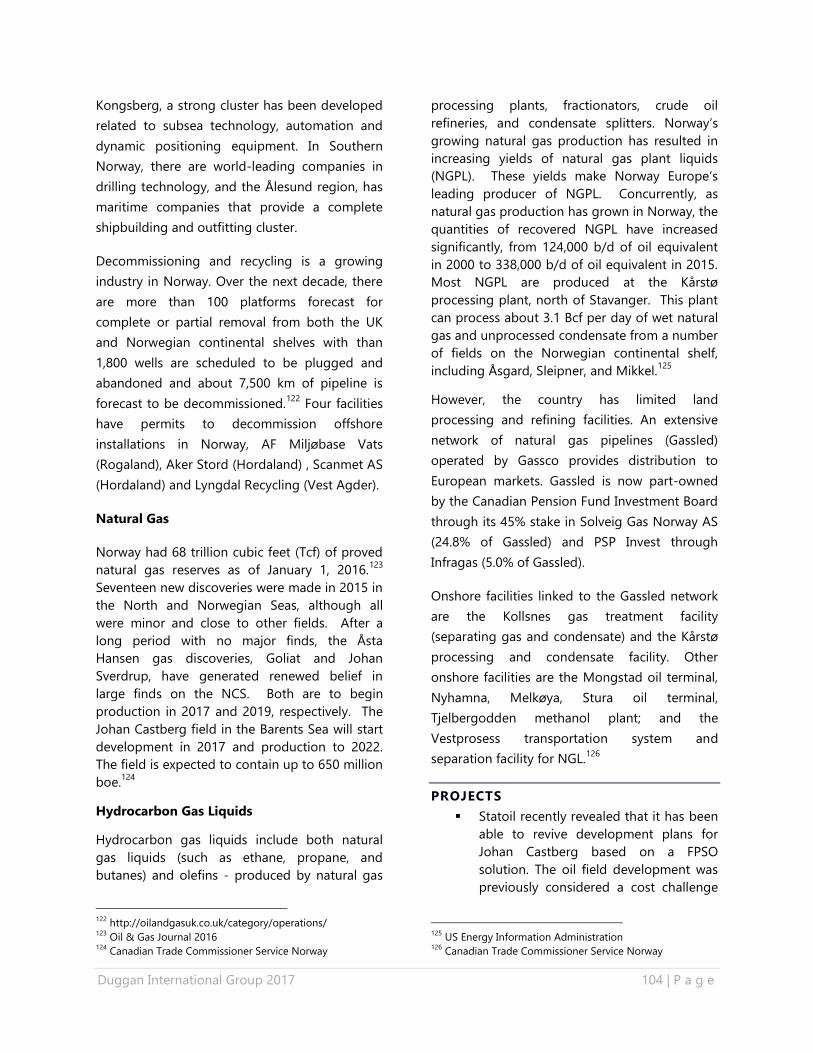
Duggan International Group 2017 104 | P a g e
Kongsberg, a strong cluster has been developed
related to subsea technology, automation and
dynamic positioning equipment. In Southern
Norway, there are world-leading companies in
drilling technology, and the Ålesund region, has
maritime companies that provide a complete
shipbuilding and outfitting cluster.
Decommissioning and recycling is a growing
industry in Norway. Over the next decade, there
are more than 100 platforms forecast for
complete or partial removal from both the UK
and Norwegian continental shelves with than
1,800 wells are scheduled to be plugged and
abandoned and about 7,500 km of pipeline is
forecast to be decommissioned.122
Four facilities
have permits to decommission offshore
installations in Norway, AF Miljøbase Vats
(Rogaland), Aker Stord (Hordaland) , Scanmet AS
(Hordaland) and Lyngdal Recycling (Vest Agder).
Natural Gas
Norway had 68 trillion cubic feet (Tcf) of proved
natural gas reserves as of January 1, 2016.123
Seventeen new discoveries were made in 2015 in
the North and Norwegian Seas, although all
were minor and close to other fields. After a
long period with no major finds, the Åsta
Hansen gas discoveries, Goliat and Johan
Sverdrup, have generated renewed belief in
large finds on the NCS. Both are to begin
production in 2017 and 2019, respectively. The
Johan Castberg field in the Barents Sea will start
development in 2017 and production to 2022.
The field is expected to contain up to 650 million
boe.124
Hydrocarbon Gas Liquids
Hydrocarbon gas liquids include both natural
gas liquids (such as ethane, propane, and
butanes) and olefins - produced by natural gas
122
http://oilandgasuk.co.uk/category/operations/ 123
Oil & Gas Journal 2016 124
Canadian Trade Commissioner Service Norway
processing plants, fractionators, crude oil
refineries, and condensate splitters. Norway’s
growing natural gas production has resulted in
increasing yields of natural gas plant liquids
(NGPL). These yields make Norway Europe’s
leading producer of NGPL. Concurrently, as
natural gas production has grown in Norway, the
quantities of recovered NGPL have increased
significantly, from 124,000 b/d of oil equivalent
in 2000 to 338,000 b/d of oil equivalent in 2015.
Most NGPL are produced at the Kårstø
processing plant, north of Stavanger. This plant
can process about 3.1 Bcf per day of wet natural
gas and unprocessed condensate from a number
of fields on the Norwegian continental shelf,
including Åsgard, Sleipner, and Mikkel.125
However, the country has limited land
processing and refining facilities. An extensive
network of natural gas pipelines (Gassled)
operated by Gassco provides distribution to
European markets. Gassled is now part-owned
by the Canadian Pension Fund Investment Board
through its 45% stake in Solveig Gas Norway AS
(24.8% of Gassled) and PSP Invest through
Infragas (5.0% of Gassled).
Onshore facilities linked to the Gassled network
are the Kollsnes gas treatment facility
(separating gas and condensate) and the Kårstø
processing and condensate facility. Other
onshore facilities are the Mongstad oil terminal,
Nyhamna, Melkøya, Stura oil terminal,
Tjelbergodden methanol plant; and the
Vestprosess transportation system and
separation facility for NGL.126
PROJECTS
Statoil recently revealed that it has been
able to revive development plans for
Johan Castberg based on a FPSO
solution. The oil field development was
previously considered a cost challenge
125
US Energy Information Administration 126
Canadian Trade Commissioner Service Norway
Duggan International Group 2017 105 | P a g e
with the oil price sinking to below $30
per barrel and a possible need for a
land-based terminal.
Lundin Norway has encountered oil and
gas in the drilling programmes of
wildcat well 7219/12-1 and appraisal
well 7219/12-1 A (Filicudi) in the Barents
Sea.
ABB has signed a project-specific
agreement to provide safety and
automation systems for Statoil at the
Johan Castberg oilfield off the coast of
Norway. Statoil has issued the first call-
off from the agreement covering front-
end engineering and design (FEED).
Wintershall Norge has submitted the
development concept of the North Sea's
Skarfjell field to Norway's Ministry of
Petroleum and Energy of in a 'decision
to continue' (BOV) report.
Project operator Wintershall, along
with other licence partners, decided that
the Skarfjell reservoir would be
connected to the nearby Gjøa platform
through a subsea tie-back. Wintershall
Norge holds 35% interest in PL 418 with
operatorship. The remaining
stakeholders are Capricorn Norge (20%),
Bayerngas Norge (20%), Edison Norge
(15%) and DEA Norge (10%).
Oil firm start-up Wellesley Petroleum
plans to secure around 40 licences in the
oil and gas fields in offshore Norway.
The company intends to take part in
around six wells every year. Through an
investment agreement with Bluewater
Energy and affiliates, Wellesley
Petroleum has access to an equity line of
up to US$250m.
Statoil has submitted a plan for
development and operation of Trestakk
discovery on the Halten Bank to the
Norwegian Ministry of Petroleum and
Energy.
April 2017, Wood Group has received a
contract from Statoil to provide a front-
end engineering and design (FEED)
study for the subsea flow-line system of
Snorre Expansion Project in the
Norwegian North Sea.
Norway’s Ministry of Petroleum and
Energy has approved the plan for
development and operation (PDO) of
the Statoil ASA-operated Trestakk
discovery on the Halten Bank in the
Norwegian Sea. Field development
comprises a subsea template and a tied-
in satellite well. Three production wells
and two gas injection wells also will be
drilled. Statoil estimates that the field
has recoverable volumes of 76 million
boe, most of which is oil. Tied in to the
Asgard A production vessel, Trestakk is
expected to come on stream in 2019.
Eni Norge AS plans to drill two subsea
wells in Goliat field to start production
from the Snadd discovery in the Barents
Sea offshore Norway. The Snadd
reservoir lies between the Realgrunnen
and Kobbe reservoirs, which already are
producing. The Norwegian Petroleum
Directorate (NPD) estimates this will
increase Goliat’s oil reserves 7.5 million
bbl to about 200 million bbl. Snadd was
mentioned in Goliat’s plan for
development and operation (PDO). NPD
has approved Eni’s application for a PDO
exemption.
On March 29, 2017 ExxonMobil agreed
to sell its operated upstream business in
Norway to private equity firm
HitecVision and oil company Point
Resources.
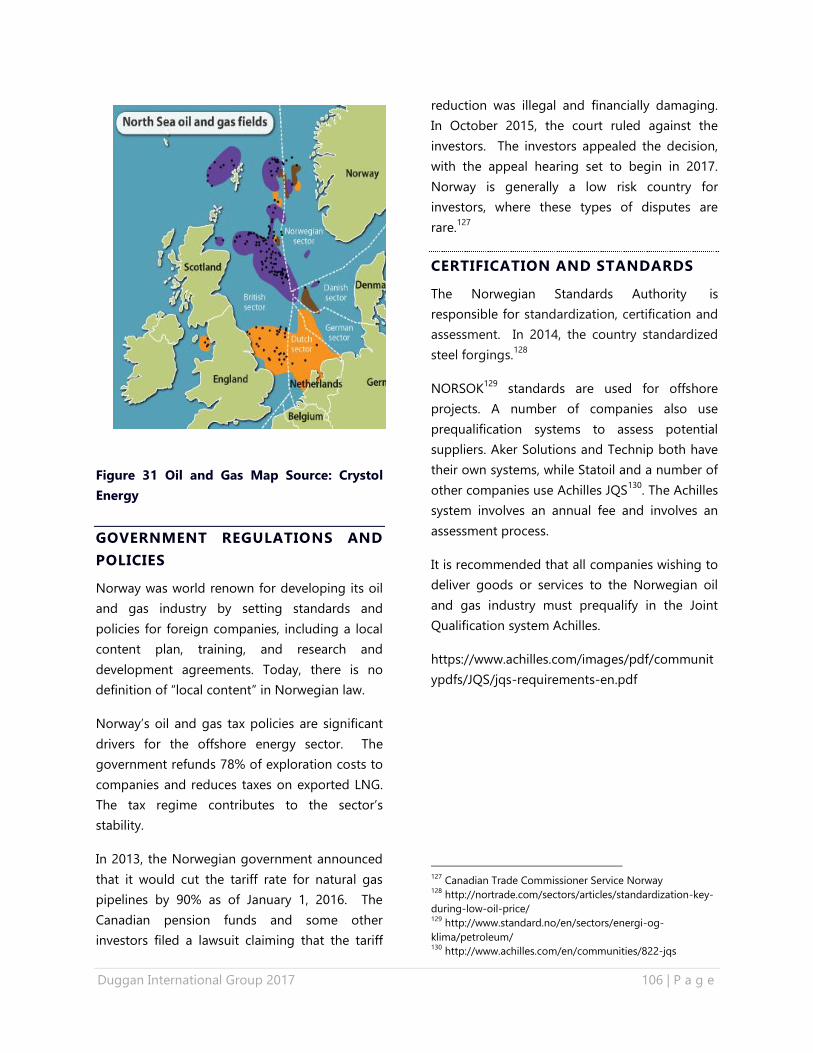
Duggan International Group 2017 106 | P a g e
Figure 31 Oil and Gas Map Source: Crystol
Energy
GOVERNMENT REGULATIONS AND
POLICIES
Norway was world renown for developing its oil
and gas industry by setting standards and
policies for foreign companies, including a local
content plan, training, and research and
development agreements. Today, there is no
definition of “local content” in Norwegian law.
Norway’s oil and gas tax policies are significant
drivers for the offshore energy sector. The
government refunds 78% of exploration costs to
companies and reduces taxes on exported LNG.
The tax regime contributes to the sector’s
stability.
In 2013, the Norwegian government announced
that it would cut the tariff rate for natural gas
pipelines by 90% as of January 1, 2016. The
Canadian pension funds and some other
investors filed a lawsuit claiming that the tariff
reduction was illegal and financially damaging.
In October 2015, the court ruled against the
investors. The investors appealed the decision,
with the appeal hearing set to begin in 2017.
Norway is generally a low risk country for
investors, where these types of disputes are
rare.127
CERTIFICATION AND STANDARDS
The Norwegian Standards Authority is
responsible for standardization, certification and
assessment. In 2014, the country standardized
steel forgings.128
NORSOK129
standards are used for offshore
projects. A number of companies also use
prequalification systems to assess potential
suppliers. Aker Solutions and Technip both have
their own systems, while Statoil and a number of
other companies use Achilles JQS130
. The Achilles
system involves an annual fee and involves an
assessment process.
It is recommended that all companies wishing to
deliver goods or services to the Norwegian oil
and gas industry must prequalify in the Joint
Qualification system Achilles.
https://www.achilles.com/images/pdf/communit
ypdfs/JQS/jqs-requirements-en.pdf
127
Canadian Trade Commissioner Service Norway 128
http://nortrade.com/sectors/articles/standardization-key-
during-low-oil-price/ 129
http://www.standard.no/en/sectors/energi-og-
klima/petroleum/ 130
http://www.achilles.com/en/communities/822-jqs
Duggan International Group 2017 107 | P a g e
WORKING IN NORWAY
The Norwegian subsea industry has built
considerable expertise in deep water operation.
It presents a challenging market for new
entrants.
Market Strengths:
Vast natural resources
Efficient business culture
Low levels of corruption
Market Challenges:
Mature market, highly competitive
The oil and gas industry had massive job
cuts, however leading indicators points
toward the employment increasing in
2017131
The Confederation of Norwegian Enterprise
(NHO the Norwegian Oil and Gas Association) is
a central party to agreements between
employers and unions. It works to ensure that
the oil and gas sector offers attractive working
conditions in line with practice in Norwegian
industry.
The Danish Embassy handles all applications for
visa and residence permits for Norway (and all of
the Scandinavian countries) for Canada.
Canadian citizens can visit Norway for up to 90
days without a visa. However, if the travel is for
work or the visitor plans to stay longer than 90
days, a Residence Permit application is required.
OPPORTUNITIES FOR NOVA SCOTIA
EXPORTERS
World Energy City Partnership member is
Stavanger, home to the Offshore Northern Seas
Conference.
New technology to support the development of
Norway’s oil and industry will be crucial for its
continued success. Companies that have
technologies to improve efficiency, reduce risk,
environmental impact, operating and
exploration costs will have an advantage
entering this market.
Norway is strong in subsea systems and working
in harsh climates; however the industry still
needs advanced goods and services.
Best Prospects:
Interpretation of seismic data
Subsea processing
Information technology and
communication technology
New drilling technologies in pressure
and temperature reservoirs
131
Dankse Bank Nordic Outlook 2017
MAJOR COMPANIES
StatOil
Production Norway AS
Storebrand Asa
Total E&P Norge AS
Conocophillips Norge
Klp Ranheimsveien 10 AS,
Orkla Asa
National Oilwell
Varco
Norway AS
Seadrill Norge AS
Eni Norge AS
Point Resources
Aker BP
For a list of local Norwegian suppliers:
https://www.norskoljeoggass.no/en/
Duggan International Group 2017 108 | P a g e
Field life extension services
Enhanced/improved oil recovery
(ior/eor) technologies
Maintenance and modification work
Consulting to standardization of
efficiency solutions
Electrifications from shore
Norway’s efforts to expand oil and gas
exploration in the Arctic Circle may also present
opportunities.
IMPACTS DUE TO THE VOLATILITY
IN OIL PRICES
With the slow down, over 15,000 workers in the
oil and gas industry lost their jobs. This
unemployment is expected to be temporary as
the country is moving forward with new
exploration projects.
Statoil had also reduced its spending. And, with
the direction of the government, the company
has been working on a number of initiatives to
help standardize petroleum field developments.
It is currently heading an improvement program
called STEP (Statoil Technical Efficiency Program)
that focuses on standardization and
industrialization as one of its six high impact
projects.
Despite the low price of oil and overall declining
production, the economy in Norway is projected
to maintain relatively stable. The lower prices
are likely to contribute to closures of small and
underperforming fields.
RENEWABLE ENERGY
Electricity production in Norway is mostly
flexible hydropower. Wind and thermal energy
are also contributors to Norway’s electricity.
Hydropower
Hydropower has been the basis of Norway’s
energy industry since the late 1800s. The largest
renewable energy power generator in Europe is
Statkraft, which is owned by the Norwegian state
and is a major supplier of hydropower.
Norway’s electric grid is owned and operated by
Statnett. Statnett is responsible for ensuring the
reliability and efficiency of the electric grid and
for balancing electricity supply and demand.
The company is owned by the Norwegian state,
and its revenues from operating the grid are
regulated by the Norwegian Water Resources
and Energy.
Wind Power
Norway has 48 onshore farms. The Ministry of
Petroleum and Energy is currently researching
the potential of offshore wind farms. The 15
potential Norwegian offshore wind fields could
produce 18 to 44 TWh.
Companies in the Norway Renewable Energy
Industry:
Statoil
Sway
Fred Olsen Renewables
METCentre
NTE FKF
Solvind
Statkraft
For a full list:
http://www.intpow.no/index.php?categoryid=3
Also, a new DNV GL joint industry project plans
to harness wind power to inject water into
mature fields and enhance oil recovery. DNV GL,
an international certification body
headquartered in Norway, has proposed a new
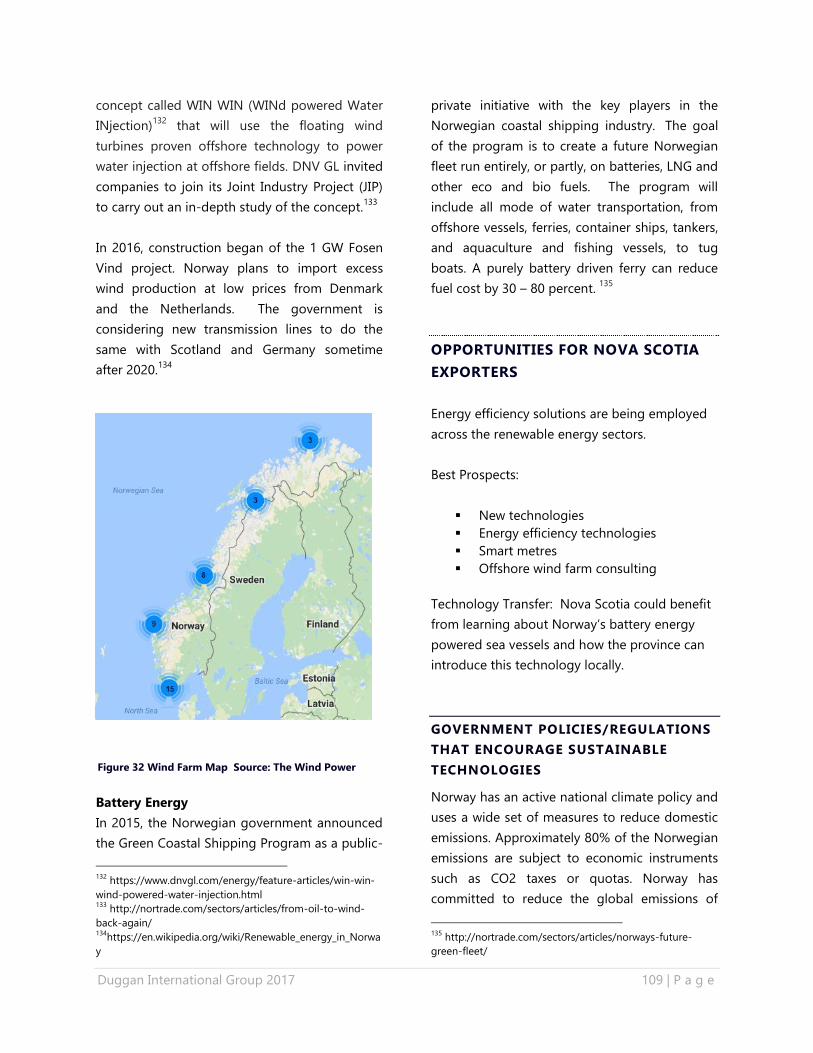
Duggan International Group 2017 109 | P a g e
concept called WIN WIN (WINd powered Water
INjection)132
that will use the floating wind
turbines proven offshore technology to power
water injection at offshore fields. DNV GL invited
companies to join its Joint Industry Project (JIP)
to carry out an in-depth study of the concept.133
In 2016, construction began of the 1 GW Fosen
Vind project. Norway plans to import excess
wind production at low prices from Denmark
and the Netherlands. The government is
considering new transmission lines to do the
same with Scotland and Germany sometime
after 2020.134
Battery Energy
In 2015, the Norwegian government announced
the Green Coastal Shipping Program as a public-
132
https://www.dnvgl.com/energy/feature-articles/win-win-
wind-powered-water-injection.html 133
http://nortrade.com/sectors/articles/from-oil-to-wind-
back-again/ 134
https://en.wikipedia.org/wiki/Renewable_energy_in_Norwa
y
private initiative with the key players in the
Norwegian coastal shipping industry. The goal
of the program is to create a future Norwegian
fleet run entirely, or partly, on batteries, LNG and
other eco and bio fuels. The program will
include all mode of water transportation, from
offshore vessels, ferries, container ships, tankers,
and aquaculture and fishing vessels, to tug
boats. A purely battery driven ferry can reduce
fuel cost by 30 – 80 percent. 135
OPPORTUNITIES FOR NOVA SCOTIA
EXPORTERS
Energy efficiency solutions are being employed
across the renewable energy sectors.
Best Prospects:
New technologies
Energy efficiency technologies
Smart metres
Offshore wind farm consulting
Technology Transfer: Nova Scotia could benefit
from learning about Norway‘s battery energy
powered sea vessels and how the province can
introduce this technology locally.
GOVERNMENT POLICIES/REGULATIONS
THAT ENCOURAGE SUSTAINABLE
TECHNOLOGIES
Norway has an active national climate policy and
uses a wide set of measures to reduce domestic
emissions. Approximately 80% of the Norwegian
emissions are subject to economic instruments
such as CO2 taxes or quotas. Norway has
committed to reduce the global emissions of
135
http://nortrade.com/sectors/articles/norways-future-
green-fleet/
Figure 32 Wind Farm Map Source: The Wind Power
Duggan International Group 2017 110 | P a g e
greenhouse gas before 2020 equivalent to 30%
of the emissions of 1990. The government is
promoting the development of new
technologies as one of several measures they are
using to reduce emissions.
The Technology Centre Mongstad (TCM) in
Norway is the world’s largest facility for testing
and improving CO2 capture. Knowledge gained
will prepare the ground for CO2 capture
initiatives to combat climate change. TCM is a
joint venture between the Norwegian state,
Statoil, Shell and Sasol.136
Enova SF promotes environmentally friendly
production and consumption of energy in
Norway. The organization explores new sources
of clean energy to reduce overall energy
consumption, and to provide educational
materials to the public promoting energy-
efficient practices. Enova SF is financed through
government funding in addition to a tariff of
one øre per kWh of electricity to consumers.
The company is owned by the Norwegian
Ministry of Petroleum and Energy and based in
Trondheim.137
FUNDING INCENTIVES
The following company has access to EDC
funding to buy Canadian good and services:
Lundin Petroleum
The Research Council of Norway is responsible
for administering most of the public funding
available for energy research. The funds are used
for basic research, industrial research and
societal research. Nova Scotia companies
136
http://www.emb-norway.ca/norway_and_canada/Political-
Priorities/Norway---an-energy-nation/ 137
Wikipedia
should partner with a Norwegian company on
funding applications.
http://www.forskningsradet.no/en/Find_calls_for_
proposals/1184150364108
OTHER SOURCES OF INFORMATION
UK Government Country Profile
Norwayhttps://www.gov.uk/government/publica
tions/
US Commercial Service
https://www.export.gov/search#/search/articles?
q=norway&_k=9lk4e9
US Government EIA Country Analysis Brief –
Norway https://www.eia.gov/beta/international/
Offshore Technology: http://www.offshore-
technology.com
Canadian Trade Commissioner Service Norway
http://tradecommissioner.gc.ca/norway-
norvege/index.aspx?lang=eng
Decommissioning of Offshore Installations.
Climate and Pollution Agency, Oslo, February
2011
Offshore Technology.com
Oil & Gas Journal ogi.com
NOTES:
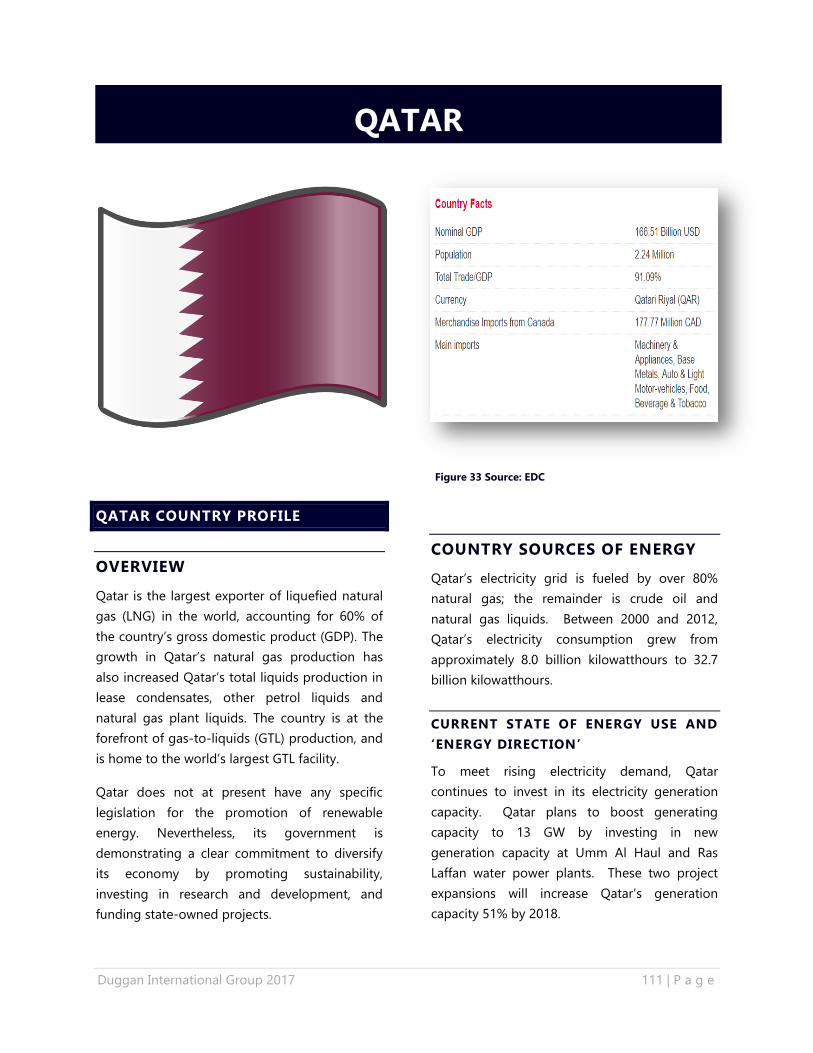
Duggan International Group 2017 111 | P a g e
QATAR COUNTRY PROFILE
OVERVIEW
Qatar is the largest exporter of liquefied natural
gas (LNG) in the world, accounting for 60% of
the country’s gross domestic product (GDP). The
growth in Qatar’s natural gas production has
also increased Qatar’s total liquids production in
lease condensates, other petrol liquids and
natural gas plant liquids. The country is at the
forefront of gas-to-liquids (GTL) production, and
is home to the world’s largest GTL facility.
Qatar does not at present have any specific
legislation for the promotion of renewable
energy. Nevertheless, its government is
demonstrating a clear commitment to diversify
its economy by promoting sustainability,
investing in research and development, and
funding state-owned projects.
COUNTRY SOURCES OF ENERGY
Qatar’s electricity grid is fueled by over 80%
natural gas; the remainder is crude oil and
natural gas liquids. Between 2000 and 2012,
Qatar’s electricity consumption grew from
approximately 8.0 billion kilowatthours to 32.7
billion kilowatthours.
CURRENT STATE OF ENERGY USE AND
‘ENERGY DIRECTION’
To meet rising electricity demand, Qatar
continues to invest in its electricity generation
capacity. Qatar plans to boost generating
capacity to 13 GW by investing in new
generation capacity at Umm Al Haul and Ras
Laffan water power plants. These two project
expansions will increase Qatar’s generation
capacity 51% by 2018.
QATAR
Figure 33 Source: EDC
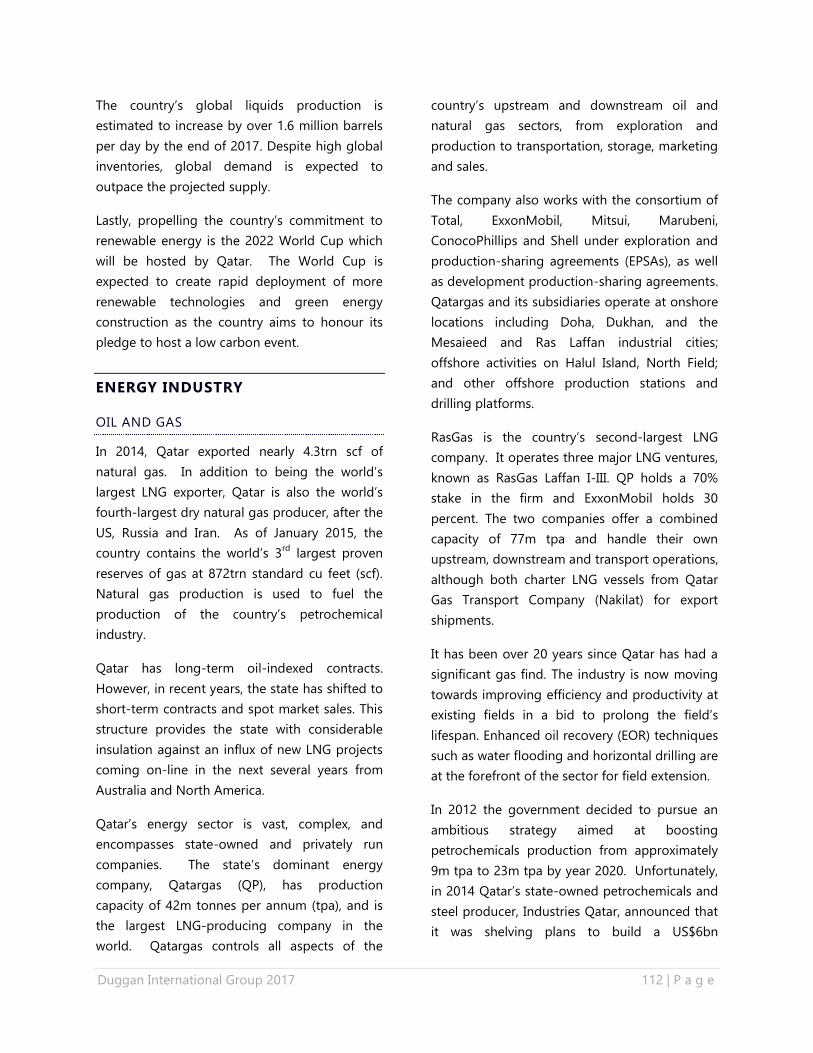
Duggan International Group 2017 112 | P a g e
The country’s global liquids production is
estimated to increase by over 1.6 million barrels
per day by the end of 2017. Despite high global
inventories, global demand is expected to
outpace the projected supply.
Lastly, propelling the country’s commitment to
renewable energy is the 2022 World Cup which
will be hosted by Qatar. The World Cup is
expected to create rapid deployment of more
renewable technologies and green energy
construction as the country aims to honour its
pledge to host a low carbon event.
ENERGY INDUSTRY
OIL AND GAS
In 2014, Qatar exported nearly 4.3trn scf of
natural gas. In addition to being the world’s
largest LNG exporter, Qatar is also the world’s
fourth-largest dry natural gas producer, after the
US, Russia and Iran. As of January 2015, the
country contains the world’s 3rd
largest proven
reserves of gas at 872trn standard cu feet (scf).
Natural gas production is used to fuel the
production of the country’s petrochemical
industry.
Qatar has long-term oil-indexed contracts.
However, in recent years, the state has shifted to
short-term contracts and spot market sales. This
structure provides the state with considerable
insulation against an influx of new LNG projects
coming on-line in the next several years from
Australia and North America.
Qatar’s energy sector is vast, complex, and
encompasses state-owned and privately run
companies. The state’s dominant energy
company, Qatargas (QP), has production
capacity of 42m tonnes per annum (tpa), and is
the largest LNG-producing company in the
world. Qatargas controls all aspects of the
country’s upstream and downstream oil and
natural gas sectors, from exploration and
production to transportation, storage, marketing
and sales.
The company also works with the consortium of
Total, ExxonMobil, Mitsui, Marubeni,
ConocoPhillips and Shell under exploration and
production-sharing agreements (EPSAs), as well
as development production-sharing agreements.
Qatargas and its subsidiaries operate at onshore
locations including Doha, Dukhan, and the
Mesaieed and Ras Laffan industrial cities;
offshore activities on Halul Island, North Field;
and other offshore production stations and
drilling platforms.
RasGas is the country’s second-largest LNG
company. It operates three major LNG ventures,
known as RasGas Laffan I-III. QP holds a 70%
stake in the firm and ExxonMobil holds 30
percent. The two companies offer a combined
capacity of 77m tpa and handle their own
upstream, downstream and transport operations,
although both charter LNG vessels from Qatar
Gas Transport Company (Nakilat) for export
shipments.
It has been over 20 years since Qatar has had a
significant gas find. The industry is now moving
towards improving efficiency and productivity at
existing fields in a bid to prolong the field’s
lifespan. Enhanced oil recovery (EOR) techniques
such as water flooding and horizontal drilling are
at the forefront of the sector for field extension.
In 2012 the government decided to pursue an
ambitious strategy aimed at boosting
petrochemicals production from approximately
9m tpa to 23m tpa by year 2020. Unfortunately,
in 2014 Qatar’s state-owned petrochemicals and
steel producer, Industries Qatar, announced that
it was shelving plans to build a US$6bn
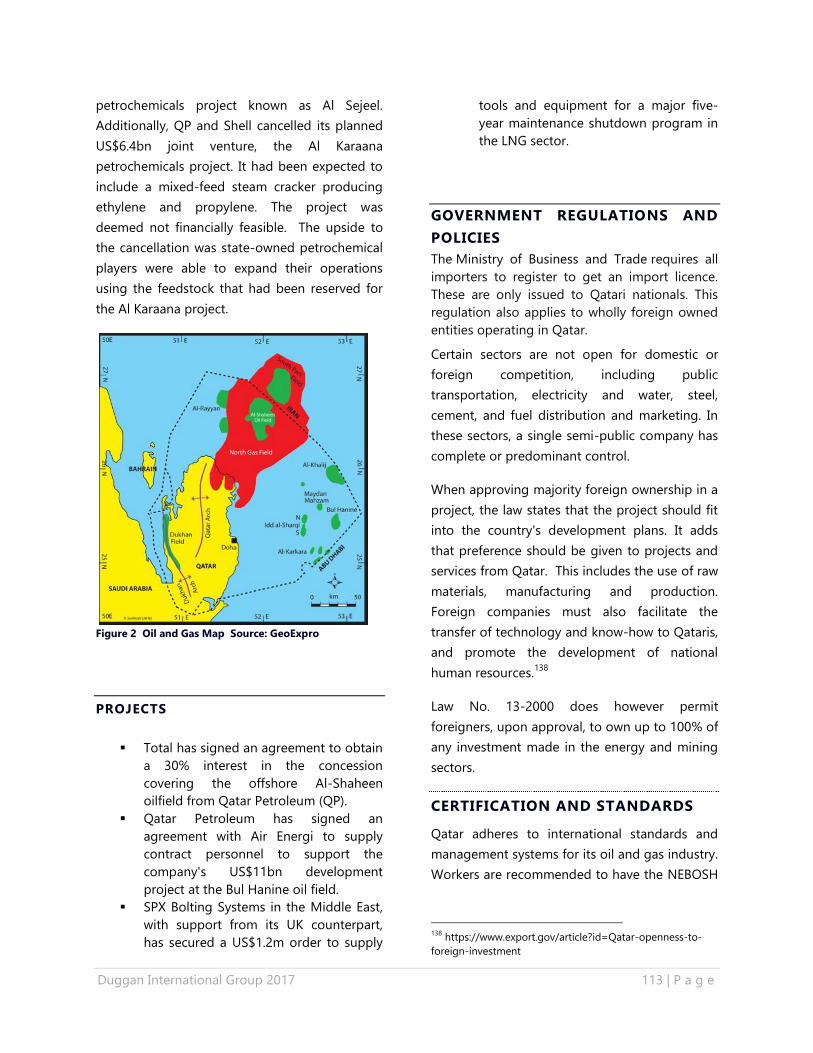
Duggan International Group 2017 113 | P a g e
petrochemicals project known as Al Sejeel.
Additionally, QP and Shell cancelled its planned
US$6.4bn joint venture, the Al Karaana
petrochemicals project. It had been expected to
include a mixed-feed steam cracker producing
ethylene and propylene. The project was
deemed not financially feasible. The upside to
the cancellation was state-owned petrochemical
players were able to expand their operations
using the feedstock that had been reserved for
the Al Karaana project.
Figure 2 Oil and Gas Map Source: GeoExpro
PROJECTS
Total has signed an agreement to obtain
a 30% interest in the concession
covering the offshore Al-Shaheen
oilfield from Qatar Petroleum (QP).
Qatar Petroleum has signed an
agreement with Air Energi to supply
contract personnel to support the
company's US$11bn development
project at the Bul Hanine oil field.
SPX Bolting Systems in the Middle East,
with support from its UK counterpart,
has secured a US$1.2m order to supply
tools and equipment for a major five-
year maintenance shutdown program in
the LNG sector.
GOVERNMENT REGULATIONS AND
POLICIES
The Ministry of Business and Trade requires all
importers to register to get an import licence.
These are only issued to Qatari nationals. This
regulation also applies to wholly foreign owned
entities operating in Qatar.
Certain sectors are not open for domestic or
foreign competition, including public
transportation, electricity and water, steel,
cement, and fuel distribution and marketing. In
these sectors, a single semi-public company has
complete or predominant control.
When approving majority foreign ownership in a
project, the law states that the project should fit
into the country's development plans. It adds
that preference should be given to projects and
services from Qatar. This includes the use of raw
materials, manufacturing and production.
Foreign companies must also facilitate the
transfer of technology and know-how to Qataris,
and promote the development of national
human resources.138
Law No. 13-2000 does however permit
foreigners, upon approval, to own up to 100% of
any investment made in the energy and mining
sectors.
CERTIFICATION AND STANDARDS
Qatar adheres to international standards and
management systems for its oil and gas industry.
Workers are recommended to have the NEBOSH
138
https://www.export.gov/article?id=Qatar-openness-to-
foreign-investment
Duggan International Group 2017 114 | P a g e
International Technical Certificate in Oil and Gas
Operational Safety.139
WORKING IN QATAR
Foreign firms are required to use a local agent
for matters related to sponsorship and residence
of employees. Most businesses setting up in
Qatar must have 51-49% split in favour of the
Qatari partner.
Market Strengths:
Economic stability
Modern, fast-growing, diversifying
economy
High personal wealth
Strong government support for
infrastructure and related projects
Market Challenges:
High levels of bureaucracy
Price, rather than quality, most
important factor in the buying decision
Market not well regulated, especially on
environmental matters
Delays in payment
Highly competitive and saturated market
in some sectors
Rents for both business and private
residences expensive and rising
Qatari riyal is tied to the US dollar, so
when the dollar exchange rate is strong,
Qatar becomes an expensive market
A business visa is required for Canadians
working in Qatar. For those who are working in
many countries, take caution as Canadians have
been denied entry into Qatar because their
passports bore an Israeli visa, an Israeli border
stamp or an Egyptian or Jordanian border stamp
139
https://www.nebosh.org.uk/
issued by an office bordering Israel. Such a
stamp would indicate the traveler entered from
Israel.140
In the industrial sector, Qatar has tax free zones
to attract direct foreign investment. These free
zones currently include the Qatar Financial
center and Qatar Science and Technology Park.
Within the free trade zone, companies have
unrestricted repatriation of capital and profits,
zero tax and duty-free imports of goods and
services and tax free zones.
Other Benefits:
An investor may operate as a branch of
a foreign company or register a local
company
Foreign ownership of 100% is permitted.
A company may exercise its business
without a sponsor or a local agent
An investor may sponsor foreign
employees
For more information:
http://www.qdb.qa/English/Investing/Pages/Qat
arTax.aspx
OPPORTUNITIES FOR NOVA SCOTIA
EXPORTERS
Doha, Qatar is member of the World Energy City
Partnership. Qatar is interested in exploring new
ways of enhancing gas extraction so it’s cleaner,
greener and more efficient.
Best Prospects:
Education and training for LNG
Field maintenance
New technologies for extraction
140
https://travel.gc.ca/destinations/qatar
Duggan International Group 2017 115 | P a g e
IMPACTS DUE TO THE VOLATILITY
IN OIL PRICES
Despite lower oil prices, real economic growth in
2016 was expected to rise to 3.9 percent. The
strength was due to the non-hydrocarbon sector
and the boost to upstream hydrocarbon
production from the Barzan gas project.
However, the gross domestic product (GDP) was
expected to contract. In 2017 and 2018,
hydrocarbon production are predicted to
plateau, but solid expansion in non-hydrocarbon
activities will sustain overall economic
development.
RENEWABLE INDUSTRY
Qatar has one of the highest carbon emissions
per capita in the world. The country is seeking
to generate 20% electricity from renewable
energy by 2030.141
Qatar Electricity and Water
Company and Qatar Petroleum are planning to
join forces to set up a US$500 million joint
venture company with the purpose of investing
in renewable energy projects, mainly in solar
energy. The country plans to set up 1,800 MW
in solar power capacity by 2020. This is expected
to contribute up to 16% of total power
generation.
Hybrid Wind and Solar Base Station
Vodafone Qatar Q.S.C. and Alcatel-Lucent
announced the development of the first hybrid
powered Base Station in Qatar, using a
combination of solar and wind energy.
Solar Powered Cooled Stadiums
Qatar, as host of the 2022 World Cup, will use
solar technology at all five stadiums, and also at
fan zones and training facilities. Generators
using biofuels will supplement electricity from
the national grid to ensure that there is enough
capacity to cool the stadium during matches.
Surplus energy will be exported back to the grid.
The amount of electricity generated is intended
to exceed the amount of electricity imported for
events over the year, making the facility carbon
neutral.
Chevron Qatar Energy Technology and
GreenGulf Inc.
A Qatar-based renewable energy and clean
technology company, has signed a
memorandum of understanding for a joint study
141
IRENA Renewable Energy Market Analysis The GCC
Region 2016
MAJOR COMPANIES
Qatargas
Ras Gas
ExxonMobil Qatar Inc
Qatar Petrochemical Company
Total E & P Qatar
Cheveron International Gas Inc.
ConocoPhillips
Encana International Qatar Ltd.
GE Oil and Gas
Maersk Oil Qatar AS
Occidental Petroleum of Qatar Ltd
Qatar Fuel (WOQOD)
Qatar International Petroleum Marketing Co. Ltd
(Tasweeq)
Qatar Petroleum (QP)
Qatar Petroleum Refinery (QPR)
Qatar Shell Services Co. WLL
Sasol
Seef Limited
Statoil
Yokogawa Middle East EC
Duggan International Group 2017 116 | P a g e
to test solar energy technologies and their
application in Qatar. The research will be
performed at Qatar Science & Technology Park
(QSTP).142
Qatar Sustainable Water and Energy
Utilization Initiative (QWE)
The QWE, based at the Texas A&M University at
Qatar, is looking at sustainable uses for water
and energy by bringing together the industrial
sectors and research and educational
institutions. The QWE currently operates
research and development projects, covering
energy efficiency by the development of energy
recovery and reuse and seawater for process
cooling projects.
Renewable Energy-Based Desalination
Faced with limited naturally renewable water
resources, countries such as Qatar have turned
to seawater desalination options, which now
provide 87% of total water in Qatar.
Desalination is an expensive and energy-
intensive process. The government is exploring
affordable and sustainable options to power
desalination. Renewable options, especially
those based on solar energy, are gaining
increasing prominence in desalination.143
OPPORTUNITIES FOR NOVA SCOTIA
EXPORTERS
There is a growing interest in the emirate in
tapping alternative and sustainable sources
using solar and wind (to a lesser extent).
Companies with experience in solar power have
the best advantage in this market.
Best Prospects:
142
http://www.qstp.org.qa/ 143
http://www.irena.org/DocumentDownloads/Publications/I
RENA_Market_GCC_2016.pdf
HVAC technologies in advance cooling
and ventilation systems that use green
energy
Training and education alternative
power
Planning engineers
Solar technicians
Project managers energy management
Consulting services wind power
Nova Scotia companies could also investigate
the desalination technology and transfer this
knowledge globally.
GOVERNMENT POLICIES/REGULATIONS
THAT ENCOURAGE SUSTAINABLE
TECHNOLOGIES
Qatar’s commitment to renewable energy was to
the United Nations through the Intended
Nationally Determined Contribution (INDC).144
Qatar does not at present have any specific
legislation to facilitate the development of
renewable energy. However, the government is
investing in renewables projects and making
investments in the development of renewables
technologies.
Qatar is established as the leader in non-
renewable energy; the emirate is now setting its
sights on becoming a leading exporter of
renewable energy. In doing so, Qatar and the
US Department of Energy (DOE) signed a
memorandum of understanding to promote
collaboration on the development and
deployment of cost-effective and sustainable
clean energy technologies.
The DOE, principally through the Advanced
Research Projects Agency - Energy (ARPA-E),
and QSTP will pursue cooperation in five key
areas:
144
https://cleantechnica.com/2016/01/01/500-million-
renewable-energy-joint-venture-planned-qatar/
Duggan International Group 2017 117 | P a g e
Advanced Cooling Technologies
Renewable Power Generation
Energy Storage
Carbon Capture and Sequestration
Water Treatment Systems, including
efficient desalination techniques and
effective water purification. 145
FUNDING INCENTIVES
SMEs in Qatar can apply for a product
development and tech venture fund through the
Qatar Science and Technology Park. Nova Scotia
companies would have to partner with a Qatari
company.
http://www.qstp.org.qa/home/funds/product-
development-fund
OTHER SOURCES OF INFORMATION
US Government EIA Country Analysis Brief –
Qatar https://www.eia.gov/beta/international/
IRENA RENEWABLE ENERGY MARKET ANALYSIS
THE GCC REGION http://www.irena.org
Qatar Economic Outlook 2016–2018
Issue Number 10 Qatar Ministry of Planning,
Development and Statistics
http://www.mdps.gov.qa/en/pages/default.aspx
UK Government
https://www.gov.uk/government/publications/ex
porting-to-qatar/doing-business-in-qatar-qatar-
trade-and-export-guide
Oxford Business Group
https://www.oxfordbusinessgroup.com/overview
/market-share-matters-despite-global-price-
145
http://www.nortonrosefulbright.com/knowledge/publicatio
ns/48660/renewable-energy-in-qatar
volatility-country-remains-leading-player-oil-
and-gas
Offshore Shore Technology – Qatar
www.offshore-technology.com
Notes:
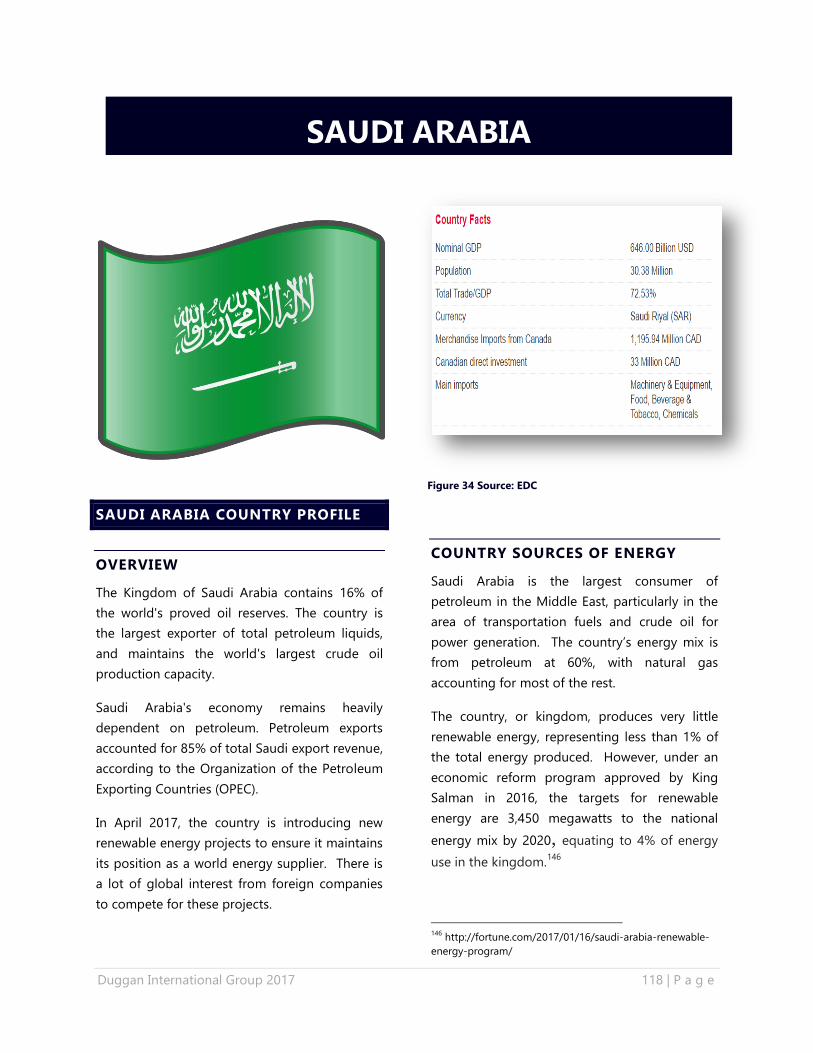
Duggan International Group 2017 118 | P a g e
SAUDI ARABIA COUNTRY PROFILE
OVERVIEW
The Kingdom of Saudi Arabia contains 16% of
the world's proved oil reserves. The country is
the largest exporter of total petroleum liquids,
and maintains the world's largest crude oil
production capacity.
Saudi Arabia's economy remains heavily
dependent on petroleum. Petroleum exports
accounted for 85% of total Saudi export revenue,
according to the Organization of the Petroleum
Exporting Countries (OPEC).
In April 2017, the country is introducing new
renewable energy projects to ensure it maintains
its position as a world energy supplier. There is
a lot of global interest from foreign companies
to compete for these projects.
COUNTRY SOURCES OF ENERGY
Saudi Arabia is the largest consumer of
petroleum in the Middle East, particularly in the
area of transportation fuels and crude oil for
power generation. The country’s energy mix is
from petroleum at 60%, with natural gas
accounting for most of the rest.
The country, or kingdom, produces very little
renewable energy, representing less than 1% of
the total energy produced. However, under an
economic reform program approved by King
Salman in 2016, the targets for renewable
energy are 3,450 megawatts to the national
energy mix by 2020, equating to 4% of energy
use in the kingdom.146
146
http://fortune.com/2017/01/16/saudi-arabia-renewable-
energy-program/
SAUDI ARABIA
Figure 34 Source: EDC
Duggan International Group 2017 119 | P a g e
CURRENT STATE OF ENERGY USE AND
‘ENERGY DIRECTION’
By 2032, anticipated demand for electricity in
Saudi Arabia is expected to exceed 120 GW. The
overall demand for fossil fuels for the power
industry, transportation and desalination is
estimated to grow from 3.4 million barrels of oil
equivalent per day in 2010 to 8.3 million barrels
per day in 2028.
To try and thwart this growth in demand, the
kingdom is embarking on new energy
conservation measures. Saudi Arabia has created
the King Abdullah City for Atomic and
Renewable Energy (K.A. CARE) program. The
program will utilize a balanced mix of
economically viable and technically feasible
atomic and renewable energy in a sustainable
manner to generate power and preserve the
kingdom’s resources of oil and gas.147
Moreover, the creation of this program is not all
about becoming a greener society. The
increased use of renewable sources will allow for
more oil and natural gas originally allocated for
domestic power, to be freed up for export. In
the interim, Saudi Arabia is participating in the
Gulf Cooperation Council's efforts to link the
power grids of member countries to reduce
shortages during peak power periods.
ENERGY INDUSTRY
OIL AND GAS
The Kingdom of Saudi Arabia maintains
conventional crude oil reserves at 260.1 billion
barrels. More than half of Saudi Arabia’s oil
reserves are contained in eight fields. The
Ghawar field is the world's largest field with
147
https://www.kacare.gov.sa/en/FutureEnergy/Pages/vision.a
spx
estimated remaining reserves of 75 billion
barrels.
Saudi Arabia's oil and natural gas operations are
dominated by the national company Saudi
Aramco (the Saudi Arabian Oil Company) or
often referred to as Aramco. It is the world's
largest oil company in terms of production.
Saudi Arabia's Ministry of Petroleum and Mineral
Resources and the Supreme Council for
Petroleum and Minerals have oversight of the oil
and natural gas sector and Saudi Aramco.
In 2015, Saudi Aramco produced 9.5 million
barrels per day of crude oil and 12.4 billion
standard cubic feet per day of natural gas. The
company exported in excess of 2.5 billion barrels
of oil and 416.3 million barrels of natural gas
liquids.
Saudi Aramco currently operates at least 16
offshore fields. In its capital investment program
for 2012-18, Saudi Aramco allocated US$8 billion
for the development of six offshore facilities out
of a total operating budget of US$60 billion.
Saudi Aramco continues to identify new fields,
expand existing fields, and enhance production.
Four new fields and a new gas field were
recently discovered with maximum sustainable
crude production capacity of 10.3 million barrels
per day.
To meet increasing global oil demand, Saudi
Aramco presently has 12 upstream and
downstream investment projects valued at
approximately US$80 billion. By 2020, Saudi
Aramco’s daily production capacity of 12.5
million b/d will increase to 15 million b/d.
Unassociated gas is also a priority for Saudi
Aramco. This type of gas presently accounts for
44% of the Kingdom’s primary energy
consumption. Saudi Aramco is targeting a 30%
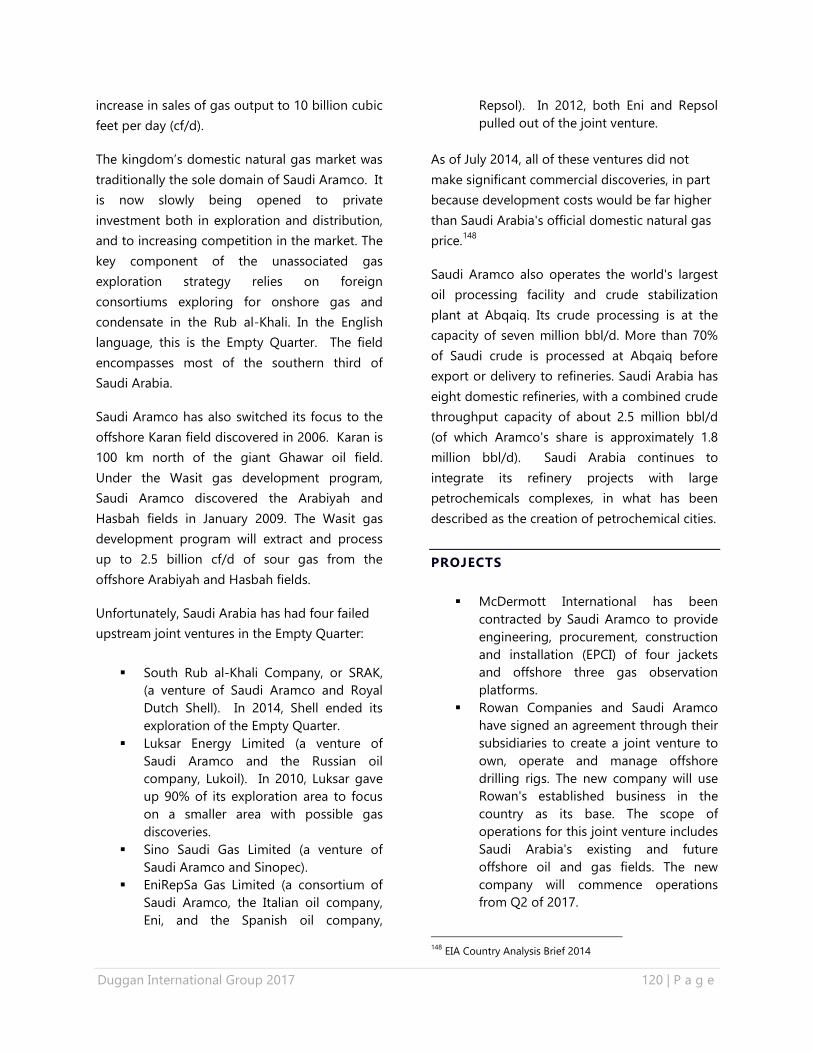
Duggan International Group 2017 120 | P a g e
increase in sales of gas output to 10 billion cubic
feet per day (cf/d).
The kingdom’s domestic natural gas market was
traditionally the sole domain of Saudi Aramco. It
is now slowly being opened to private
investment both in exploration and distribution,
and to increasing competition in the market. The
key component of the unassociated gas
exploration strategy relies on foreign
consortiums exploring for onshore gas and
condensate in the Rub al-Khali. In the English
language, this is the Empty Quarter. The field
encompasses most of the southern third of
Saudi Arabia.
Saudi Aramco has also switched its focus to the
offshore Karan field discovered in 2006. Karan is
100 km north of the giant Ghawar oil field.
Under the Wasit gas development program,
Saudi Aramco discovered the Arabiyah and
Hasbah fields in January 2009. The Wasit gas
development program will extract and process
up to 2.5 billion cf/d of sour gas from the
offshore Arabiyah and Hasbah fields.
Unfortunately, Saudi Arabia has had four failed
upstream joint ventures in the Empty Quarter:
South Rub al-Khali Company, or SRAK,
(a venture of Saudi Aramco and Royal
Dutch Shell). In 2014, Shell ended its
exploration of the Empty Quarter.
Luksar Energy Limited (a venture of
Saudi Aramco and the Russian oil
company, Lukoil). In 2010, Luksar gave
up 90% of its exploration area to focus
on a smaller area with possible gas
discoveries.
Sino Saudi Gas Limited (a venture of
Saudi Aramco and Sinopec).
EniRepSa Gas Limited (a consortium of
Saudi Aramco, the Italian oil company,
Eni, and the Spanish oil company,
Repsol). In 2012, both Eni and Repsol
pulled out of the joint venture.
As of July 2014, all of these ventures did not
make significant commercial discoveries, in part
because development costs would be far higher
than Saudi Arabia's official domestic natural gas
price.148
Saudi Aramco also operates the world's largest
oil processing facility and crude stabilization
plant at Abqaiq. Its crude processing is at the
capacity of seven million bbl/d. More than 70%
of Saudi crude is processed at Abqaiq before
export or delivery to refineries. Saudi Arabia has
eight domestic refineries, with a combined crude
throughput capacity of about 2.5 million bbl/d
(of which Aramco's share is approximately 1.8
million bbl/d). Saudi Arabia continues to
integrate its refinery projects with large
petrochemicals complexes, in what has been
described as the creation of petrochemical cities.
PROJECTS
McDermott International has been
contracted by Saudi Aramco to provide
engineering, procurement, construction
and installation (EPCI) of four jackets
and offshore three gas observation
platforms.
Rowan Companies and Saudi Aramco
have signed an agreement through their
subsidiaries to create a joint venture to
own, operate and manage offshore
drilling rigs. The new company will use
Rowan's established business in the
country as its base. The scope of
operations for this joint venture includes
Saudi Arabia's existing and future
offshore oil and gas fields. The new
company will commence operations
from Q2 of 2017.
148
EIA Country Analysis Brief 2014
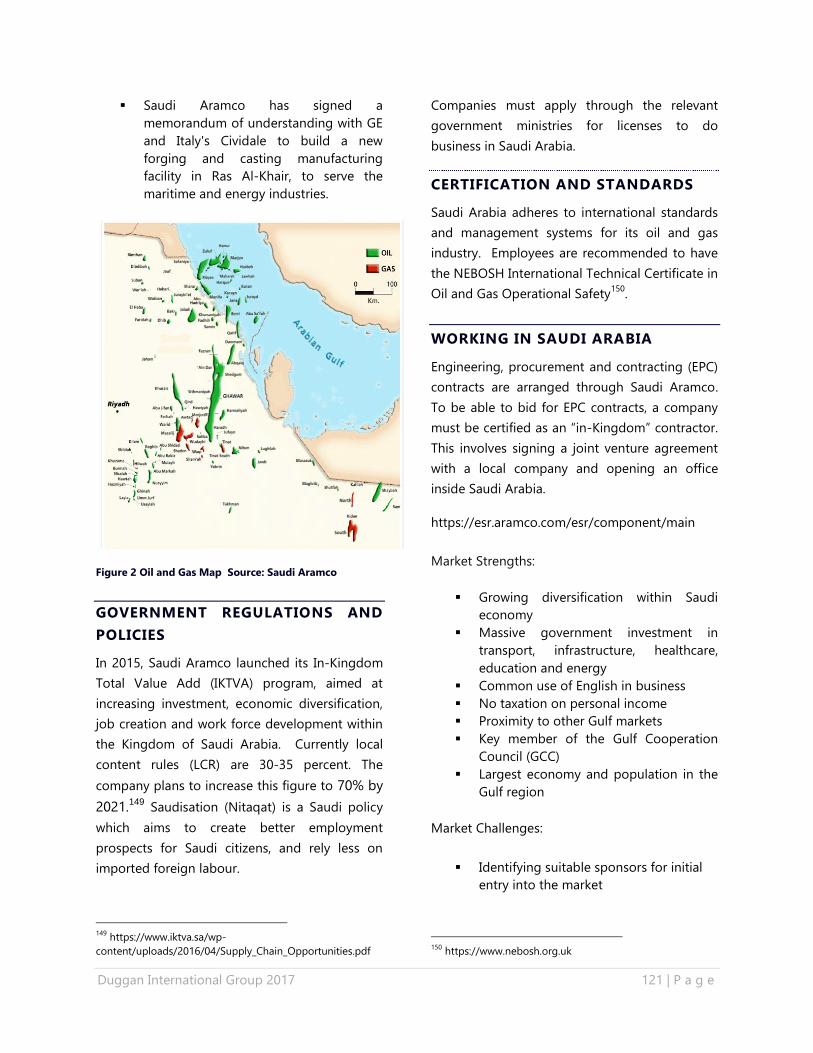
Duggan International Group 2017 121 | P a g e
Saudi Aramco has signed a
memorandum of understanding with GE
and Italy's Cividale to build a new
forging and casting manufacturing
facility in Ras Al-Khair, to serve the
maritime and energy industries.
Figure 2 Oil and Gas Map Source: Saudi Aramco
GOVERNMENT REGULATIONS AND
POLICIES
In 2015, Saudi Aramco launched its In-Kingdom
Total Value Add (IKTVA) program, aimed at
increasing investment, economic diversification,
job creation and work force development within
the Kingdom of Saudi Arabia. Currently local
content rules (LCR) are 30-35 percent. The
company plans to increase this figure to 70% by
2021.149
Saudisation (Nitaqat) is a Saudi policy
which aims to create better employment
prospects for Saudi citizens, and rely less on
imported foreign labour.
149
https://www.iktva.sa/wp-
content/uploads/2016/04/Supply_Chain_Opportunities.pdf
Companies must apply through the relevant
government ministries for licenses to do
business in Saudi Arabia.
CERTIFICATION AND STANDARDS
Saudi Arabia adheres to international standards
and management systems for its oil and gas
industry. Employees are recommended to have
the NEBOSH International Technical Certificate in
Oil and Gas Operational Safety150
.
WORKING IN SAUDI ARABIA
Engineering, procurement and contracting (EPC)
contracts are arranged through Saudi Aramco.
To be able to bid for EPC contracts, a company
must be certified as an “in-Kingdom” contractor.
This involves signing a joint venture agreement
with a local company and opening an office
inside Saudi Arabia.
https://esr.aramco.com/esr/component/main
Market Strengths:
Growing diversification within Saudi
economy
Massive government investment in
transport, infrastructure, healthcare,
education and energy
Common use of English in business
No taxation on personal income
Proximity to other Gulf markets
Key member of the Gulf Cooperation
Council (GCC)
Largest economy and population in the
Gulf region
Market Challenges:
Identifying suitable sponsors for initial
entry into the market
150
https://www.nebosh.org.uk
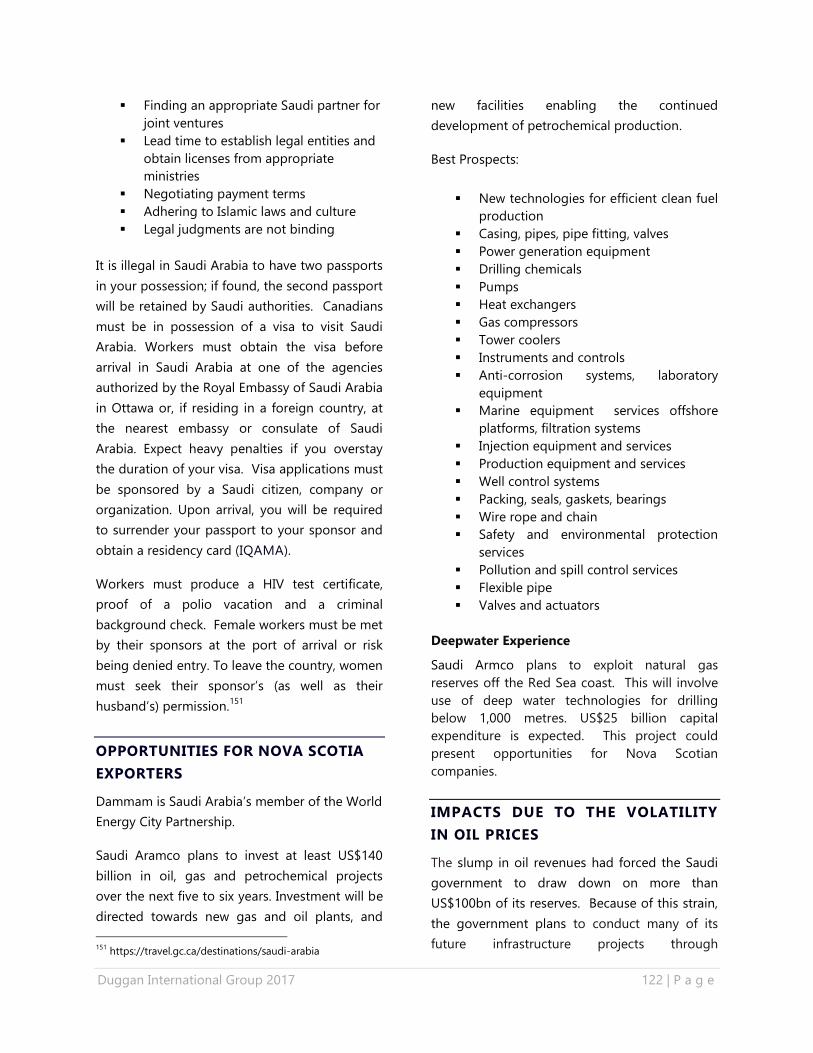
Duggan International Group 2017 122 | P a g e
Finding an appropriate Saudi partner for
joint ventures
Lead time to establish legal entities and
obtain licenses from appropriate
ministries
Negotiating payment terms
Adhering to Islamic laws and culture
Legal judgments are not binding
It is illegal in Saudi Arabia to have two passports
in your possession; if found, the second passport
will be retained by Saudi authorities. Canadians
must be in possession of a visa to visit Saudi
Arabia. Workers must obtain the visa before
arrival in Saudi Arabia at one of the agencies
authorized by the Royal Embassy of Saudi Arabia
in Ottawa or, if residing in a foreign country, at
the nearest embassy or consulate of Saudi
Arabia. Expect heavy penalties if you overstay
the duration of your visa. Visa applications must
be sponsored by a Saudi citizen, company or
organization. Upon arrival, you will be required
to surrender your passport to your sponsor and
obtain a residency card (IQAMA).
Workers must produce a HIV test certificate,
proof of a polio vacation and a criminal
background check. Female workers must be met
by their sponsors at the port of arrival or risk
being denied entry. To leave the country, women
must seek their sponsor’s (as well as their
husband’s) permission.151
OPPORTUNITIES FOR NOVA SCOTIA
EXPORTERS
Dammam is Saudi Arabia’s member of the World
Energy City Partnership.
Saudi Aramco plans to invest at least US$140
billion in oil, gas and petrochemical projects
over the next five to six years. Investment will be
directed towards new gas and oil plants, and
151
https://travel.gc.ca/destinations/saudi-arabia
new facilities enabling the continued
development of petrochemical production.
Best Prospects:
New technologies for efficient clean fuel
production
Casing, pipes, pipe fitting, valves
Power generation equipment
Drilling chemicals
Pumps
Heat exchangers
Gas compressors
Tower coolers
Instruments and controls
Anti-corrosion systems, laboratory
equipment
Marine equipment services offshore
platforms, filtration systems
Injection equipment and services
Production equipment and services
Well control systems
Packing, seals, gaskets, bearings
Wire rope and chain
Safety and environmental protection
services
Pollution and spill control services
Flexible pipe
Valves and actuators
Deepwater Experience
Saudi Armco plans to exploit natural gas
reserves off the Red Sea coast. This will involve
use of deep water technologies for drilling
below 1,000 metres. US$25 billion capital
expenditure is expected. This project could
present opportunities for Nova Scotian
companies.
IMPACTS DUE TO THE VOLATILITY
IN OIL PRICES
The slump in oil revenues had forced the Saudi
government to draw down on more than
US$100bn of its reserves. Because of this strain,
the government plans to conduct many of its
future infrastructure projects through
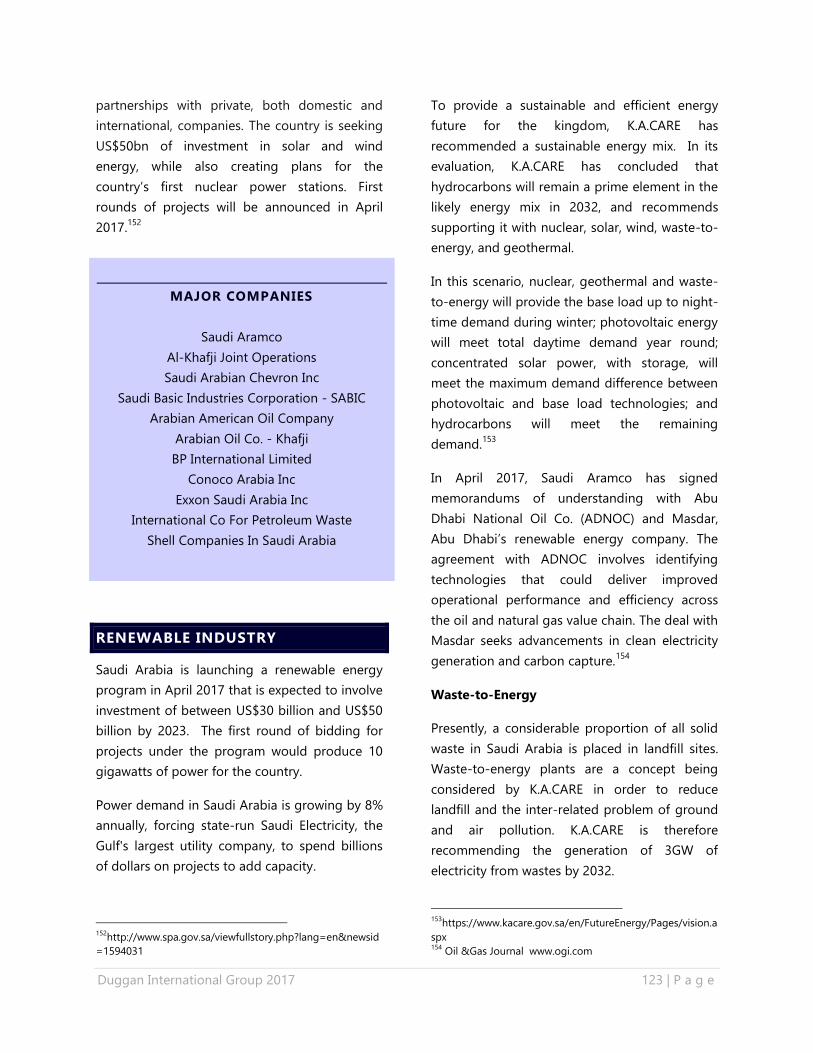
Duggan International Group 2017 123 | P a g e
partnerships with private, both domestic and
international, companies. The country is seeking
US$50bn of investment in solar and wind
energy, while also creating plans for the
country’s first nuclear power stations. First
rounds of projects will be announced in April
2017.152
RENEWABLE INDUSTRY
Saudi Arabia is launching a renewable energy
program in April 2017 that is expected to involve
investment of between US$30 billion and US$50
billion by 2023. The first round of bidding for
projects under the program would produce 10
gigawatts of power for the country.
Power demand in Saudi Arabia is growing by 8%
annually, forcing state-run Saudi Electricity, the
Gulf's largest utility company, to spend billions
of dollars on projects to add capacity.
152
http://www.spa.gov.sa/viewfullstory.php?lang=en&newsid
=1594031
To provide a sustainable and efficient energy
future for the kingdom, K.A.CARE has
recommended a sustainable energy mix. In its
evaluation, K.A.CARE has concluded that
hydrocarbons will remain a prime element in the
likely energy mix in 2032, and recommends
supporting it with nuclear, solar, wind, waste-to-
energy, and geothermal.
In this scenario, nuclear, geothermal and waste-
to-energy will provide the base load up to night-
time demand during winter; photovoltaic energy
will meet total daytime demand year round;
concentrated solar power, with storage, will
meet the maximum demand difference between
photovoltaic and base load technologies; and
hydrocarbons will meet the remaining
demand.153
In April 2017, Saudi Aramco has signed
memorandums of understanding with Abu
Dhabi National Oil Co. (ADNOC) and Masdar,
Abu Dhabi’s renewable energy company. The
agreement with ADNOC involves identifying
technologies that could deliver improved
operational performance and efficiency across
the oil and natural gas value chain. The deal with
Masdar seeks advancements in clean electricity
generation and carbon capture.154
Waste-to-Energy
Presently, a considerable proportion of all solid
waste in Saudi Arabia is placed in landfill sites.
Waste-to-energy plants are a concept being
considered by K.A.CARE in order to reduce
landfill and the inter-related problem of ground
and air pollution. K.A.CARE is therefore
recommending the generation of 3GW of
electricity from wastes by 2032.
153
https://www.kacare.gov.sa/en/FutureEnergy/Pages/vision.a
spx 154
Oil &Gas Journal www.ogi.com
MAJOR COMPANIES
Saudi Aramco
Al-Khafji Joint Operations
Saudi Arabian Chevron Inc
Saudi Basic Industries Corporation - SABIC
Arabian American Oil Company
Arabian Oil Co. - Khafji
BP International Limited
Conoco Arabia Inc
Exxon Saudi Arabia Inc
International Co For Petroleum Waste
Shell Companies In Saudi Arabia
Duggan International Group 2017 124 | P a g e
Wind Power
It is likely that wind turbines will be installed
along the coasts of the Red Sea and the Arabian
Gulf. It is recommended the turbines generate
9GW of electricity by 2032 which will be used
primarily for seawater desalination and the
conversion of brackish water to potable water.
Wind in Saudi Arabia is unpredictable; therefore
wind energy will be used in combination with
other renewable energy sources.
In January 2017, Saudi Aramco commissioned an
onshore wind farm at the Turaif oil storage
depot. The wind turbine is a GE Energy 2.75-120
(power 2 750 kW, diameter 120 m). 155
Geothermal
Volcanic activity is limited but is sufficient for
utilization of geothermal plants alongside other
energy sources.
K.A.CARE will seek to work with stakeholders in
Saudi Arabia, so other opportunities will arise
that will make the sector increasingly
economically viable. The target installed capacity
for geothermal energy is 1GW by 2032.
Solar Power
The kingdom has one of the highest insolation
rates in the world. Implementation of clean,
cost-effective solar energy technologies with the
aim of helping meet peak demands will generate
a total of 41GW by 2032. Under consideration
are two forms of solar energy – Photovoltaic (PV)
and Concentrated Solar Power (CSP).
Nuclear Energy
In addition to the renewable program,
government officials from the capital city,
Riyadh, are in the early stages of feasibility and
155
http://www.thewindpower.net/windfarm_en_24085_turaif-
oil-storage-depot.php
design studies for its first two commercial
nuclear reactors, which will total 2.8 gigawatts.
OPPORTUNITIES FOR NOVA SCOTIA
EXPORTERS
Saudi Arabia will invite international and
domestic companies to bid for renewable energy
projects in April 2017. International firms are
anxiously awaiting this opportunity. Nova Scotia
companies that miss the deadline for
submissions may have a chance by
subcontracting to one of the awarded
suppliers.156
Companies with experience in solar power have
the best advantage in this market, but it’s also
the most competitive. Emerging subsectors may
be more attractive to Nova Scotia companies.
Best Prospects:
K.A.CARE will work in partnership with
stakeholders to undertake research and
development, create inter-related
national industries, and educate and
train Saudi nationals in the technology,
skills and expertise of wind energy and
turbines.
Nova Scotia companies with geothermal
energy may have a good prospect
working in Saudi Arabia. As well, the
province could learn from the country’s
waste-to-energy program and
implement these technologies in Canada
and globally.
GOVERNMENT POLICIES/REGULATIONS
THAT ENCOURAGE SUSTAINABLE
TECHNOLOGIES
K.A.CARE states that it will pursue transparent
and open market policies to make bidders
156
http://fortune.com/2017/02/02/saudi-arabia-renewable-
energy-bid/
Duggan International Group 2017 125 | P a g e
comfortable with the process and to ensure
competitive pricing. Foreign companies should
be aware that 60% of all inputs for nuclear
energy developments and 80% of solar-related
activities will be sourced locally.157
ERCA (the body responsible for the regulation of
the electricity and water desalination industry in
Saudi Arabia) is currently working on developing
a National Renewable Energy Policy.
FUNDING INCENTIVES
EDC has financing with the Saudi Arabian Mining
Company (Ma'aden) to purchase goods and
services from Canadian suppliers.
There is no funding listed for SMEs in renewable
energy grants.
OTHER OURCES OF INFORMATION
US Government EIA Country Analysis Brief –
Saudi Arabia
https://www.eia.gov/beta/international/
US Commercial Service
https://www.export.gov/article?id=Saudi-Arabia-
oil-gas-machinery
King Abdullah City for Atomic and Renewable
Energy 2017
www.kacare.gov.sa/en/Pages/default.aspx
UK Government Doing Business in Saudi Arabia
https://www.gov.uk/government/publications/ex
porting-to-saudi-arabia/doing-business-in-
saudi-arabia-saudi-arabia-trade-and-export-
guide
157
https://www.kacare.gov.sa/en/FutureEnergy/Pages/vision.a
spx
Offshore Technology – Saudi Arabia
http://www.offshore-technology.com
NOTES:
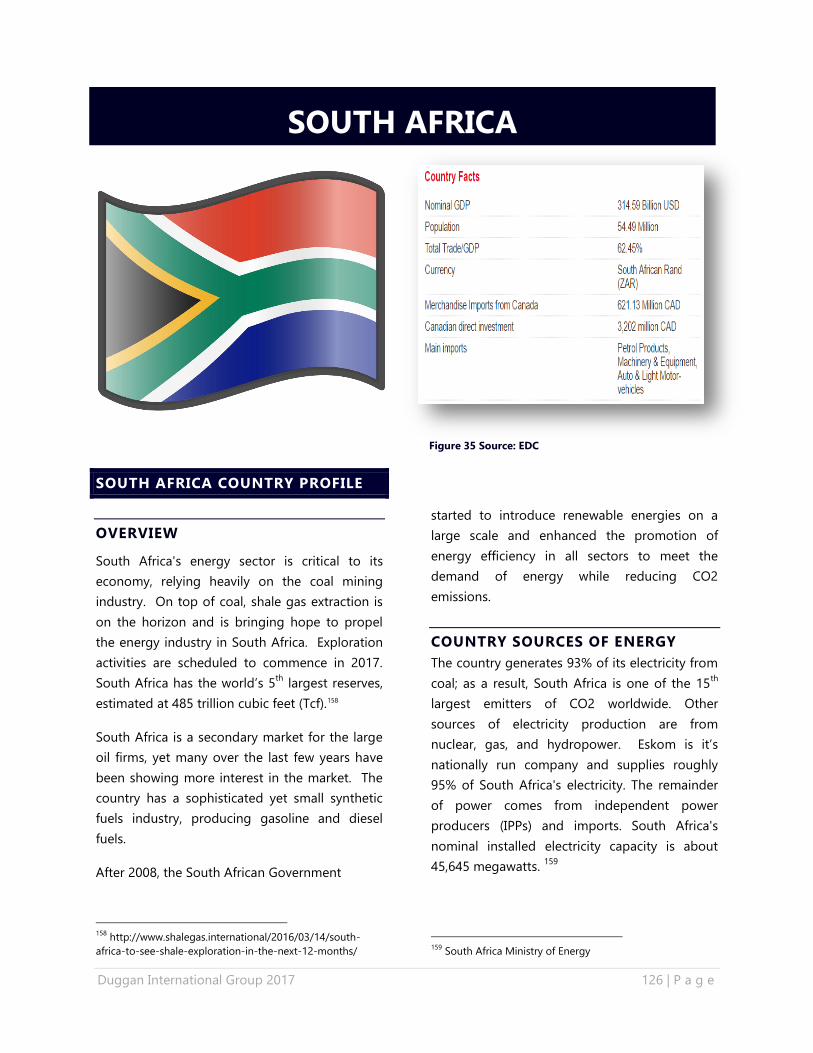
Duggan International Group 2017 126 | P a g e
SOUTH AFRICA COUNTRY PROFILE
OVERVIEW
South Africa's energy sector is critical to its
economy, relying heavily on the coal mining
industry. On top of coal, shale gas extraction is
on the horizon and is bringing hope to propel
the energy industry in South Africa. Exploration
activities are scheduled to commence in 2017.
South Africa has the world’s 5th
largest reserves,
estimated at 485 trillion cubic feet (Tcf).158
South Africa is a secondary market for the large
oil firms, yet many over the last few years have
been showing more interest in the market. The
country has a sophisticated yet small synthetic
fuels industry, producing gasoline and diesel
fuels.
After 2008, the South African Government
158
http://www.shalegas.international/2016/03/14/south-
africa-to-see-shale-exploration-in-the-next-12-months/
started to introduce renewable energies on a
large scale and enhanced the promotion of
energy efficiency in all sectors to meet the
demand of energy while reducing CO2
emissions.
COUNTRY SOURCES OF ENERGY
The country generates 93% of its electricity from
coal; as a result, South Africa is one of the 15th
largest emitters of CO2 worldwide. Other
sources of electricity production are from
nuclear, gas, and hydropower. Eskom is it’s
nationally run company and supplies roughly
95% of South Africa's electricity. The remainder
of power comes from independent power
producers (IPPs) and imports. South Africa's
nominal installed electricity capacity is about
45,645 megawatts. 159
159
South Africa Ministry of Energy
SOUTH AFRICA
Figure 35 Source: EDC
Duggan International Group 2017 127 | P a g e
CURRENT STATE OF ENERGY USE AND
‘ENERGY DIRECTION’
South Africa consumes the second-largest
amount of petroleum in Africa, behind Egypt.
The petroleum consumed in South Africa comes
mostly from its domestic refineries that import
crude oil and its CTL (coal-to-liquid) and GTL
(gas-to-liquid) plants. South Africa imports crude
oil mostly from OPEC countries in the Middle
East and West Africa.
In 2015, the country had severe shortages in
electricity which resulted in load shedding in
various parts of the country. In order to address
these challenges, the government adopted the
“Five Point Plan”. The Plan consists of supply-
side options to encourage Eskom to improve the
availability and reliability of the power stations,
while increasing power capacity through
Independent Power Producers (IPPs). Through
the IPP Program, renewable energy, coal, gas
and cogeneration has progressed significantly
against the target of 17 000 MW by the end of
2022. The government hopes to improve their
energy mix to 30% clean energy by 2025.160
ENERGY INDUSTRY
OIL AND GAS
South Africa has proved crude oil reserves of 15
million barrels. The reserves are located on the
offshore of southern South Africa in the
Bredasdorp Basin and off the west coast of the
country near the maritime border with Namibia.
South Africa's petroleum and other liquids (total
oil) production was about 160,000 bbl/d in 2014.
Synthetic fuels, derived from coal and natural
gas, accounted for more than 90% of the
country's domestic petroleum supply. Less than
160
South Africa Ministry of Energy Annual Report 2015/2016
5,000 bb/d of crude oil and lease condensate is
produced at the Oribi and Oryz fields. The
country's crude oil and lease condensate
production continues to decline as oil fields
mature and as there has not been any
commercially viable discoveries.
South Africa's offshore Orange Basin near
Namibia is believed to hold substantial oil and
gas resources, although there has been limited
exploration activity in the area. In 2009, Shell
acquired exploration rights over a large block in
the basin. However, Shell's exploration activities
are still in the early stages, and the company is
years away from potentially exploiting any
commercial reserves.
Major companies in South Africa's upstream
sector are dominated by the state-owned
company Petroleum Oil and Gas Corporation of
South Africa (PetroSA). Downstream is more
diversified and includes IOCs such as BP, Shell,
Chevron, Total, and Engen. PetroSA operates all
upstream oil and natural gas producing assets in
South Africa, along with the GTL plant at Mossel
Bay. The company also participates in oil and gas
activities internationally.
South African private company, Sasol, operates
Secunda, one of the world's largest coal-based
synthetic fuels plant. The company holds
majority interest in the 88,000 barrels per day
(bbl/d) at the Natref refinery. Sasol is also
involved in coal mining and marketing of natural
gas and oil products. Sasol has operations
around the world, including GTL projects in
Nigeria and Uzbekistan. Sasol is also
considering developing a GTL plant in Alberta,
Canada.
Coal
South Africa has the world's 9th
largest amount
of recoverable coal reserves and holds 95% of
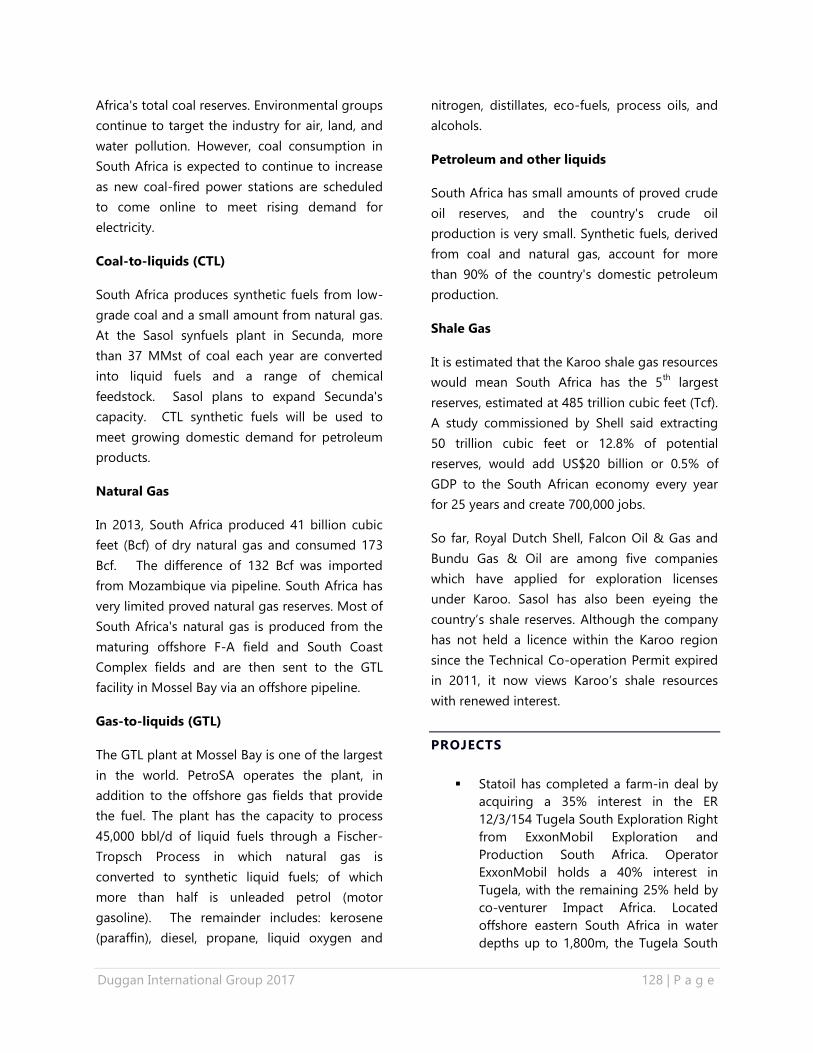
Duggan International Group 2017 128 | P a g e
Africa's total coal reserves. Environmental groups
continue to target the industry for air, land, and
water pollution. However, coal consumption in
South Africa is expected to continue to increase
as new coal-fired power stations are scheduled
to come online to meet rising demand for
electricity.
Coal-to-liquids (CTL)
South Africa produces synthetic fuels from low-
grade coal and a small amount from natural gas.
At the Sasol synfuels plant in Secunda, more
than 37 MMst of coal each year are converted
into liquid fuels and a range of chemical
feedstock. Sasol plans to expand Secunda's
capacity. CTL synthetic fuels will be used to
meet growing domestic demand for petroleum
products.
Natural Gas
In 2013, South Africa produced 41 billion cubic
feet (Bcf) of dry natural gas and consumed 173
Bcf. The difference of 132 Bcf was imported
from Mozambique via pipeline. South Africa has
very limited proved natural gas reserves. Most of
South Africa's natural gas is produced from the
maturing offshore F-A field and South Coast
Complex fields and are then sent to the GTL
facility in Mossel Bay via an offshore pipeline.
Gas-to-liquids (GTL)
The GTL plant at Mossel Bay is one of the largest
in the world. PetroSA operates the plant, in
addition to the offshore gas fields that provide
the fuel. The plant has the capacity to process
45,000 bbl/d of liquid fuels through a Fischer-
Tropsch Process in which natural gas is
converted to synthetic liquid fuels; of which
more than half is unleaded petrol (motor
gasoline). The remainder includes: kerosene
(paraffin), diesel, propane, liquid oxygen and
nitrogen, distillates, eco-fuels, process oils, and
alcohols.
Petroleum and other liquids
South Africa has small amounts of proved crude
oil reserves, and the country's crude oil
production is very small. Synthetic fuels, derived
from coal and natural gas, account for more
than 90% of the country's domestic petroleum
production.
Shale Gas
It is estimated that the Karoo shale gas resources
would mean South Africa has the 5th
largest
reserves, estimated at 485 trillion cubic feet (Tcf).
A study commissioned by Shell said extracting
50 trillion cubic feet or 12.8% of potential
reserves, would add US$20 billion or 0.5% of
GDP to the South African economy every year
for 25 years and create 700,000 jobs.
So far, Royal Dutch Shell, Falcon Oil & Gas and
Bundu Gas & Oil are among five companies
which have applied for exploration licenses
under Karoo. Sasol has also been eyeing the
country’s shale reserves. Although the company
has not held a licence within the Karoo region
since the Technical Co-operation Permit expired
in 2011, it now views Karoo’s shale resources
with renewed interest.
PROJECTS
Statoil has completed a farm-in deal by
acquiring a 35% interest in the ER
12/3/154 Tugela South Exploration Right
from ExxonMobil Exploration and
Production South Africa. Operator
ExxonMobil holds a 40% interest in
Tugela, with the remaining 25% held by
co-venturer Impact Africa. Located
offshore eastern South Africa in water
depths up to 1,800m, the Tugela South
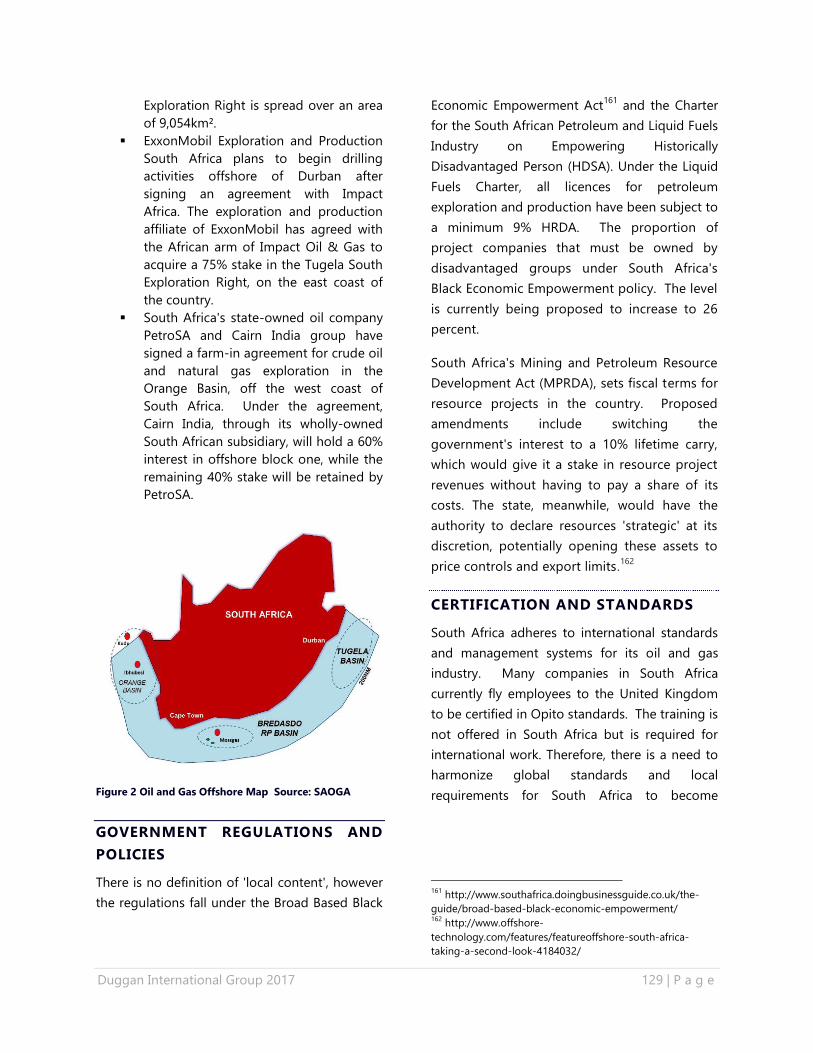
Duggan International Group 2017 129 | P a g e
Exploration Right is spread over an area
of 9,054km².
ExxonMobil Exploration and Production
South Africa plans to begin drilling
activities offshore of Durban after
signing an agreement with Impact
Africa. The exploration and production
affiliate of ExxonMobil has agreed with
the African arm of Impact Oil & Gas to
acquire a 75% stake in the Tugela South
Exploration Right, on the east coast of
the country.
South Africa's state-owned oil company
PetroSA and Cairn India group have
signed a farm-in agreement for crude oil
and natural gas exploration in the
Orange Basin, off the west coast of
South Africa. Under the agreement,
Cairn India, through its wholly-owned
South African subsidiary, will hold a 60%
interest in offshore block one, while the
remaining 40% stake will be retained by
PetroSA.
Figure 2 Oil and Gas Offshore Map Source: SAOGA
GOVERNMENT REGULATIONS AND
POLICIES
There is no definition of 'local content', however
the regulations fall under the Broad Based Black
Economic Empowerment Act161
and the Charter
for the South African Petroleum and Liquid Fuels
Industry on Empowering Historically
Disadvantaged Person (HDSA). Under the Liquid
Fuels Charter, all licences for petroleum
exploration and production have been subject to
a minimum 9% HRDA. The proportion of
project companies that must be owned by
disadvantaged groups under South Africa's
Black Economic Empowerment policy. The level
is currently being proposed to increase to 26
percent.
South Africa's Mining and Petroleum Resource
Development Act (MPRDA), sets fiscal terms for
resource projects in the country. Proposed
amendments include switching the
government's interest to a 10% lifetime carry,
which would give it a stake in resource project
revenues without having to pay a share of its
costs. The state, meanwhile, would have the
authority to declare resources 'strategic' at its
discretion, potentially opening these assets to
price controls and export limits.162
CERTIFICATION AND STANDARDS
South Africa adheres to international standards
and management systems for its oil and gas
industry. Many companies in South Africa
currently fly employees to the United Kingdom
to be certified in Opito standards. The training is
not offered in South Africa but is required for
international work. Therefore, there is a need to
harmonize global standards and local
requirements for South Africa to become
161
http://www.southafrica.doingbusinessguide.co.uk/the-
guide/broad-based-black-economic-empowerment/ 162
http://www.offshore-
technology.com/features/featureoffshore-south-africa-
taking-a-second-look-4184032/
Duggan International Group 2017 130 | P a g e
competitive in the offshore oil and gas
industry.163
WORKING IN SOUTH AFRICA
Market Strengths:
Large supply of natural resources
Established and modern infrastructure
Developed financial and legal services
Fast growing middle class
Market Challenges:
High unemployment
Skills and capacity shortages
Infrastructure improvements needed for
energy, transport and water
Adhering to the Broad-based Black
Economic Empowerment (B-BBEE)
legislation
Offshore geological data incomplete or
out of date
Deepwater inexperience
Canadian workers must apply for the relevant
visas prior to arrival; otherwise, you risk being
refused entry and may be returned to your point
of origin. You cannot change the type of visa
once in South Africa. Your passport must contain
at least two empty visa pages for the necessary
South African Temporary Residence Permit, or
you will be denied entry into the country. You
may also be denied boarding at the point of
departure if you don’t have enough blank pages
for the visa. If you plan to visit neighbouring
countries and return to South Africa, ensure that
there are sufficient visa pages in your passport
for those countries’ visas or you will be denied
re-entry into South Africa.164
163
CENTRE FOR POLICY AND REGULATION SAMSA
https://www.samsa.org.za 164
https://travel.gc.ca/destinations/south-africa
OPPORTUNITIES FOR NOVA SCOTIA
EXPORTERS
Cape Town is the newest member of the World
Energy Cities Partnership.
Over the last few years, interest from oil and gas
majors has been steadily picking up with a wave
of offshore exploration deals rising.
For shale gas, South Africa has a serious
shortage of the high-level skills that would be
required to launch the industry. Strategies need
to be set in place to develop skills to ensure
sustainable development of the shale gas
business. 165
Best Prospects:
Geophysical mapping
Offshore data collection and analysis
Deepwater consulting and services
Shale gas consulting and services
Opito certification training
IMPACTS DUE TO THE VOLATILITY
IN OIL PRICES
South Africa is embarking on diversifying its
primary energy sources to include shale gas.
Prolonged low oil prices could starve major oil
developers involved in the project of adequate
cash and consequently, affect any existing time
schedule for the project.166
165
https://www.businesslive.co.za/rdm/politics/2016-11-11-
is-south-africa-ready-for-the-shale-gas-revolution/ 166
International Association for Energy Economics Current
Drop in Oil Prices: Impact on Africa
Duggan International Group 2017 131 | P a g e
RENEWABLE INDUSTRY
South Africa’s Renewable Energy Independent
Power Producer Procurement Programme
(REIPPPP) has approved 79 renewable energy
projects by independent power producers. The
cost of wind and solar technology has decreased
by over 70% over the course of four rounds of
bidding, to the point where it is now competitive
with coal and gas.167
South Africa is garnering lots of attention in the
renewable energy industry as well. However,
there are several barriers for the country, mainly
the integration of renewable energies into the
transmission grid, the local government
acceptance towards embedded generation of
solar roof-top photovoltaic installations and a
significant need for technical skills. 168
167
IRENA 168
https://energypedia.info/wiki/South_Africa_Energy_Situatio
n
South Africa’s electricity demand has been
exceeding the available supply. The need for
affordable renewable and clean energy has
accelerated interest in the viability of Small Scale
Embedded Generation (SSEG) in the country.
SSEG refers to power generation under
1MW/1000kW and is located on residential,
commercial or industrial sites where electricity is
consumed on site, excessive power flows into
the municipal grid. Power supply is mostly
generated through solar panels. The
municipalities are promoting SSEG permits to
help boost the local economies.169
SSEG is
promoted by the non-profit association, Green
Cape.
Hydropower
In South Africa there are 1086 large dams in
operation: 846 embankments and 240 concrete
dams. The total water storage of all dams is
about 31.6 km3, which is about 65% of the mean
annual runoff of South African rivers.
Solar Energy
South Africa averages more than 2,500 hours of
sunshine per year, and average solar-radiation
levels range between 4.5 and 6.5kWh/m2 in one
day. The annual 24-hour global solar radiation
average is about 220 W/m2 for South Africa.
Solar energy projects have been funded by
African Development Bank, Agence Française de
Développement, Clean Technology Fund (CTF),
KfW and the World Bank. Teyma, SolAfrica, TSK
Electrónica y Electricidad, Acciona, Sener and
Crowie are prominent businesses operating in
South Africa’s solar industry.
169
http://www.green-cape.co.za
MAJOR COMPANIES
BP Southern Africa (Pty) Ltd
Chevron South Africa (Pty)
Ltd Engen Petroleum Ltd
PetroSA (Pty) Ltd
Sasol Oil (Pty) Ltd
Shell South Africa (Pty) Ltd
Total South Africa (Pty) Ltd
ExxonMobil
Statoil
For a full listing of companies:
https://www.saoga.org.za/directory
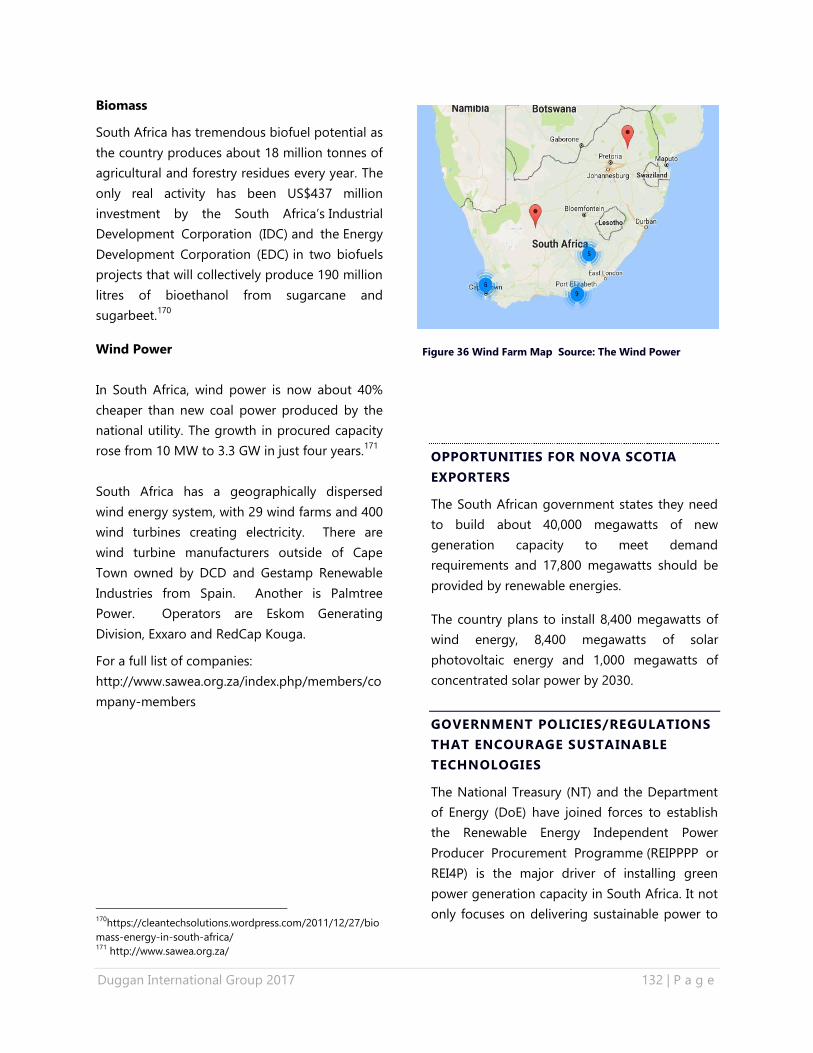
Duggan International Group 2017 132 | P a g e
Biomass
South Africa has tremendous biofuel potential as
the country produces about 18 million tonnes of
agricultural and forestry residues every year. The
only real activity has been US$437 million
investment by the South Africa’s Industrial
Development Corporation (IDC) and the Energy
Development Corporation (EDC) in two biofuels
projects that will collectively produce 190 million
litres of bioethanol from sugarcane and
sugarbeet.170
Wind Power
In South Africa, wind power is now about 40%
cheaper than new coal power produced by the
national utility. The growth in procured capacity
rose from 10 MW to 3.3 GW in just four years.171
South Africa has a geographically dispersed
wind energy system, with 29 wind farms and 400
wind turbines creating electricity. There are
wind turbine manufacturers outside of Cape
Town owned by DCD and Gestamp Renewable
Industries from Spain. Another is Palmtree
Power. Operators are Eskom Generating
Division, Exxaro and RedCap Kouga.
For a full list of companies:
http://www.sawea.org.za/index.php/members/co
mpany-members
170
https://cleantechsolutions.wordpress.com/2011/12/27/bio
mass-energy-in-south-africa/ 171
http://www.sawea.org.za/
OPPORTUNITIES FOR NOVA SCOTIA
EXPORTERS
The South African government states they need
to build about 40,000 megawatts of new
generation capacity to meet demand
requirements and 17,800 megawatts should be
provided by renewable energies.
The country plans to install 8,400 megawatts of
wind energy, 8,400 megawatts of solar
photovoltaic energy and 1,000 megawatts of
concentrated solar power by 2030.
GOVERNMENT POLICIES/REGULATIONS
THAT ENCOURAGE SUSTAINABLE
TECHNOLOGIES
The National Treasury (NT) and the Department
of Energy (DoE) have joined forces to establish
the Renewable Energy Independent Power
Producer Procurement Programme (REIPPPP or
REI4P) is the major driver of installing green
power generation capacity in South Africa. It not
only focuses on delivering sustainable power to
Figure 36 Wind Farm Map Source: The Wind Power
Duggan International Group 2017 133 | P a g e
the grid, but also at creating jobs and fostering
local development. 172
FUNDING INCENTIVES
International Financial Institutions (IFIs) play a
leading role in funding for projects in South
Africa. Funding may be available from the
African Business Development Bank, World Bank
and the Clean Technology Fund.
Nova Scotia companies should contact their
Global Affairs Canada representative for
assistance with working with international
financial institutions (IFI’s).
https://www.afdb.org/en/countries/southern-
africa/south-africa/
OTHER SOURCES OF INFORMATION
US Government EIA Country Analysis Brief –
South Africa
https://www.eia.gov/beta/international/
UK Government Doing Business in South Africa
https://www.gov.uk/government/publications/
Offshore Technology – South Africa
http://www.offshore-technology.com
Sonal Sejpal, Njeri Wagacha and Sheila
Nyayieka (Anjarwalla & Khanna, Kenya, ALN).,
A Review of Local Content Regulations in the
Upstream Oil & Gas Sector in Africa
http://www.kwm.com/en/uk/knowledge/insights
/a-review-of-local-content-regulations-in-the-
upstream-oil-and-gas-sector-in-africa-20160101
Chris Lo, Offshore South Africa: taking a second
look, 2014, http://www.offshore-
172
https://energypedia.info/wiki/South_Africa_Energy_Situatio
n
technology.com/features/featureoffshore-south-
africa-taking-a-second-look-4184032/
South African Oil and Gas Alliance
https://www.saoga.org.za/oil-gas-
hubs/upstream-oil-gas-south-africa
NOTES:
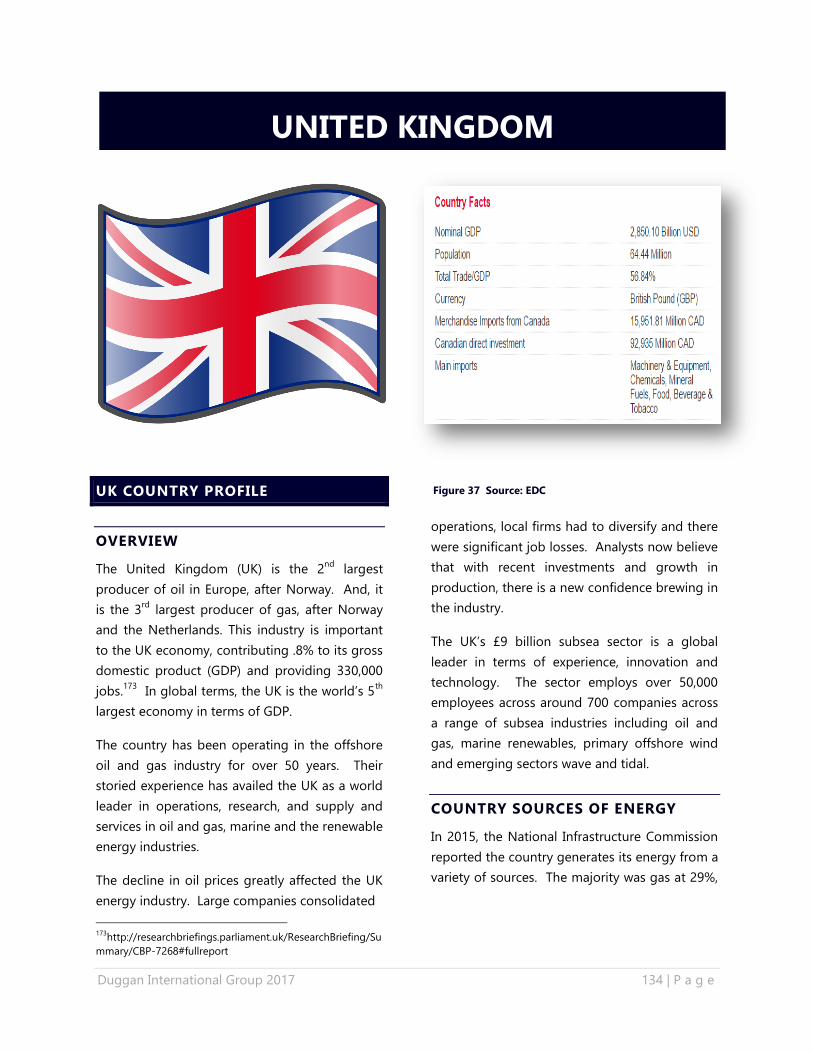
Duggan International Group 2017 134 | P a g e
UK COUNTRY PROFILE
OVERVIEW
The United Kingdom (UK) is the 2nd
largest
producer of oil in Europe, after Norway. And, it
is the 3rd
largest producer of gas, after Norway
and the Netherlands. This industry is important
to the UK economy, contributing .8% to its gross
domestic product (GDP) and providing 330,000
jobs.173
In global terms, the UK is the world’s 5th
largest economy in terms of GDP.
The country has been operating in the offshore
oil and gas industry for over 50 years. Their
storied experience has availed the UK as a world
leader in operations, research, and supply and
services in oil and gas, marine and the renewable
energy industries.
The decline in oil prices greatly affected the UK
energy industry. Large companies consolidated
173
http://researchbriefings.parliament.uk/ResearchBriefing/Su
mmary/CBP-7268#fullreport
operations, local firms had to diversify and there
were significant job losses. Analysts now believe
that with recent investments and growth in
production, there is a new confidence brewing in
the industry.
The UK’s £9 billion subsea sector is a global
leader in terms of experience, innovation and
technology. The sector employs over 50,000
employees across around 700 companies across
a range of subsea industries including oil and
gas, marine renewables, primary offshore wind
and emerging sectors wave and tidal.
COUNTRY SOURCES OF ENERGY
In 2015, the National Infrastructure Commission
reported the country generates its energy from a
variety of sources. The majority was gas at 29%,
UNITED KINGDOM
Figure 37 Source: EDC
Duggan International Group 2017 135 | P a g e
coal (18%), wind (12%), nuclear (9%) then under
6% of wind, solar and others. 174
The UK had 85 gigawatts (GW) of installed
electricity generation capacity at the end of
2014. Capacity has fallen since 2010 as several
fossil fuel-fired plants and a few nuclear reactors
have shut down.
The UK remained a net importer of electricity in
2015, with net imports contributing 5.8% of the
electricity supply.
CURRENT STATE OF ENERGY USE AND
‘ENERGY DIRECTION’
In 2014, petroleum and natural gas accounted
for 36% and 33%, respectively, of total energy
consumption. Coal also continues to be a
significant part of total energy consumption. The
UK has however seen a decline in consumption
resulting from economic contraction and
improvements in energy efficiency.
To address falling exploration activity, the UK
Government invested £40 million in 2015 and
2016. The government is working with other
European countries to further develop the North
Sea. A total of 38 crude and natural gas projects
are scheduled to start production in the North
Sea by 2025, the UK will be responsible for 27
projects (Norway 10 and Denmark 1).175
The government is aware of the country's
increasing reliance on imported fuels, and has
developed key energy policies to address the
domestic production declines. These policies
include: using enhanced recovery from current
and maturing oil and natural gas fields,
promoting energy efficiency, decreasing the use
174
National Infrastructure Commission "Smart Power" 2016 175
http://www.offshore-
technology.com/researchreports/researchreportreport-
norway-and-uk-to-lead-in-planned-oil-and-gas-production-
in-the-north-sea-by-2025-5747465/
of fossil fuels (and thus reliance on imports),
promoting and energy trade cooperation with
Norway. The government plans to grow its
renewable energy industry to reduce green
house gas emissions. To decarbonize, the UK
needs large investments in energy
infrastructure.176
ENERGY INDUSTRY
OIL AND GAS
The North Sea has become the centre of one of
the world’s most productive energy industries.
Eight of the biggest oil fields in the North Sea
are on the Norwegian continental shelf with the
remaining two perched on the UK shelf. Clair oil
field, the biggest oil field in the North Sea and
Europe, is also the biggest hydrocarbon resource
on the UK Continental Shelf (UKCS). The second
is the the Forties oil field, east of Aberdeen in
the UK license block 21/10. It was discovered in
1970 and started production in 1975.
Nexen is the largest field operator in the UK in
terms of oil production. As of the end of 2015,
Nexen operated eight fields, which combined
produced about 187,000 bpd in 2014. Nexen
operated fields accounted for about 24% of total
UK production in 2014. The UK's largest
producing field in 2014 was the Nexen operated
Buzzard oil field, which produced an average of
slightly more than 154,000 b/d. The Buzzard
field reached full capacity of 200,000 b/d in
2008, then production consistently declined.
Nexen did extensive maintenance of the field
which caused outages. Reliability at the field was
better in 2015, and production about 168,000
b/d.
176
Review of the UK oilfield services industry January 2017
Duggan International Group 2017 136 | P a g e
As with Buzzard, the UK’s petroleum and other
liquids production last peaked in 1999. The
production decline slowed in 2014 as production
fell year-over-year by only 1% to average
900,000 barrels per day (b/d). In 2015,
production increased by 10% to average one
million b/d. Much of this increase is attributable
to new fields brought online in 2014 and 2015.
There are long lead times to develop fields in the
North Sea; therefore production from a new field
occurs several years after the decision to
develop that field had been made and when
crude oil prices would have been higher. These
long term challenges could threaten future
production potential from new and smaller
fields, while the UK’s existing fields are being
maximized. Ernst and Young (EY) reports the
West of Shetland has the greatest potential to
expand production, with over one billion boe
reserves in development. In addition, the Central
North Sea (CNS) remains an active area for
exploration, not least with high pressure, high
temperature prospects, and the Hebridean basin
remains relatively.
The 2016 theme in the UK’s North Sea was
“consolidation” as companies looked to
accelerate the rate of technological innovation in
the sector. In April 2016, Schlumberger Limited
announced its merger with Cameron
International Corporation. The merger will create
technology-driven growth by integrating
Schlumberger’s reservoir and well technology
with Cameron wellhead and surface equipment,
flow control and processing technology that the
companies believe will result in the industry’s
first complete drilling and production system.
Next, in May 2016, Technip and FMC
Technologies Inc. announced they will merge to
become TechnipFMC, with the aim of creating a
global leader that will drive change by redefining
the production and transformation of oil and
gas.
Halliburton and Baker Hughes announced the
termination of the proposed $28bn merger in
May 2016, citing opposition from US and
European antitrust regulators. In March 2017 it
was announced that Wood Group were to
acquire rival Amec Foster Wheeler in a £2.2bn
all-share takeover. Aberdeen based Wood
Group aims to become the global leader in
project engineering and technical services across
a range of sectors including oil and gas and
renewables.
As stated, a number of new fields came on-
stream in 2016 including the Alder field off the
Scottish coast. Chevron advised more than 70%
of the budget was invested in subsea expertise
in new technology to develop the field.
The Scolty/Crathes development achieved first
oil in November 2016. This was the only offshore
pure oil FDP approval in the UK North Sea in
2015. Unit operating costs are expected to be
under $15/bbl in the initial peak volume years
and production is anticipated to continue until
2025.177
The Cygnus field delivered first gas in December
2016. This field is expected to support
approximately 5,000 jobs during its five-year
development period, with over 80% of the
contract work being secured by UK companies
due to the world-class capabilities of the UK OFS
supply chain.
The UK Government has pledged to fund
research and development to catapult the North
Sea in becoming leaders in global innovation. An
additional £2 billion a year has been committed
177
http://news.cision.com/enquest-plc/r/scolty-crathes-first-
oil,c2127113
Duggan International Group 2017 137 | P a g e
in research and development by 2020-21. The
Aberdeen Oil & Gas Technology Centre opened
February 2017. The Centre aims to be the ‘go to’
global centre for solving offshore mature basin,
subsea and decommissioning technology
challenges, and to make the north-east a focal
point for oil and gas technology. The Centre will
help companies develop and deploy new
products and processes to reduce costs.
The UK also has an onshore industry. There are
now 120 onshore oil and gas sites with 250
operating wells producing between 20,000 and
25,000 barrels of oil equivalent a day. 178
Decommissioning
Over the next decade, more than 100 oil and gas
platforms are earmarked for complete or partial
removal from the UK Continental Shelf (UKCS)
and the Norwegian Continental Shelf (NCS).
Offshore oil and gas decommissioning in the
UKCS will be close to US$20 billion over the next
five years.
However, many companies are delaying
decommissioning activities due to cash-flow
constraints. Others companies are deferring
ending production and are trying to improve
efficiency and extending the field life. EY reports
some of the cost of decommissioning can be
offset against previous taxes paid, yet many
operators with end-of-life assets either do not
currently have the financial capacity to
undertake decommissioning activity or are
simply choosing to focus on running as leanly as
possible, even if it is at a loss.
Natural Gas
The UK's natural gas production and
consumption have been on a long-term
declining trend; however in recent years both
178
http://www.ukogplc.com/page.php?pID=72
have been flat or have increased modestly. UK
natural gas production peaked in 2000, and
consumption peaked in 2004. Since then, natural
gas production and consumption have both
generally been declining. The UK holds an
estimated 7.3 trillion cubic feet (Tcf) of proved
natural gas reserves as of January 2016. Most of
the UK's natural gas production comes from
offshore liquids fields, accounting for 55% of
total gross natural gas production in 2014.
Natural gas from offshore dry gas fields
accounted for almost 45% of production in 2014,
and onshore fields accounted for less than 1% of
total gross natural gas production.
Shale Gas
Shale testing is still at an early phase in the UK,
and compared with North America, the shale
geology of the UK is considerably more complex.
The two formations that have received the most
attention so far are the Bowland shales, and the
Weald basin in southern England. The Bowland
shales are more likely to hold natural gas, and
the Weald is more likely to hold liquid
hydrocarbons.
Coal
Coal production in the UK is declining as a result
of falling consumption from environmental
regulations, relatively cheap natural gas that
competes with coal for power generation, and a
surge of low cost coal imports. Coal
consumption in 2014 was 53 MMst, almost 80%
of which was used in the electric sector.
In 1956 the UK enacted the Clean Air Act after
the great London smog of 1952. The Clean Air
Act prohibits the emission of dark smoke from
industrial buildings, private homes, and railroad
locomotives.
Duggan International Group 2017 138 | P a g e
Nuclear
Currently accounting for just below one-fifth of
total electricity generation, nuclear power plants
are central to the UK government plans for
future electricity generation. There were 15
operating nuclear reactors in the UK at the end
of 2014, with a current capacity of slightly less
than 9 gigawatt electric (GWe), according to the
World Nuclear Association. All 15 operating
reactors are owned and operated by EDF Energy,
a subsidiary of Électricité de France. Most of the
existing nuclear capacity started operations in
the 1970s or 1980s and are due to be shut down
by 2023.
PROJECTS
UK Oil & Gas Investments (UKOG) has
announced that its subsidiary UKOG
Solent has been granted a one-year
extension to the initial term for its
offshore P1916 licence by the Oil and
Gas Authority.
Faroe Petroleum has announced the
start the Boné exploration well 7318/12-
1 in the western part of Norwegian
Barents Sea. The company has also
decided to drill an appraisal well on the
Brasse discovery.
Total has awarded a contract to Prosafe
for the provision of the Safe Caledonia
semi-submersible accommodation
vessel at the Elgin-Franklin facility in the
UK North Sea. This contract is meant for
134 days and includes an extension
option for an additional 30 days. On-site
operation is expected to commence in
May 2017. Valued at US$10m, the
contract includes mobilisation,
demobilisation and associated services.
Veolia has been contracted to
decommission and recycle offshore oil
platforms after the end of their
operational life at Great Yarmouth, UK,
in partnership with Peterson. After
completion of their operational life, the
offshore platforms will be brought to an
area 40 miles off the coast of Great
Yarmouth for decommissioning. The
facility is scheduled to receive the first
platforms for decommissioning in the
next few months.
China National Offshore Oil
Corporation's Nexen Petroleum is
assessing the second phase of Buzzard
development in the UK offshore region.
The company has also planned to
develop two high-pressure, high-
temperature (HPHT) exploration wells in
the North Sea. CNOOC now intends to
proceed with an infill drilling campaign
and subsea scheme to exploit the
northern part of the North Sea field.
Australian-based Frogtech, Geoscience
Wales and Geop4ysics will complete
their new interpretations and products
using data acquired during last year’s
£20m seismic survey of the Rockall
Trough and Mid-North Sea High
(MNSH) areas of UK’s Continental Shelf.
Engineering firm Bilfinger has secured
210 jobs after winning a deal to carry
out maintenance work on key Scottish
oil and gas infrastructure for another
five years from BP. The contract is for
providing a range of support services at
the Forties pipeline system terminals in
Grangemouth and the Sullom Voe
terminal in Shetland. The deal replaces a
previous agreement from 2015,
according to Bilfinger, whose group
headquarters are in Germany.
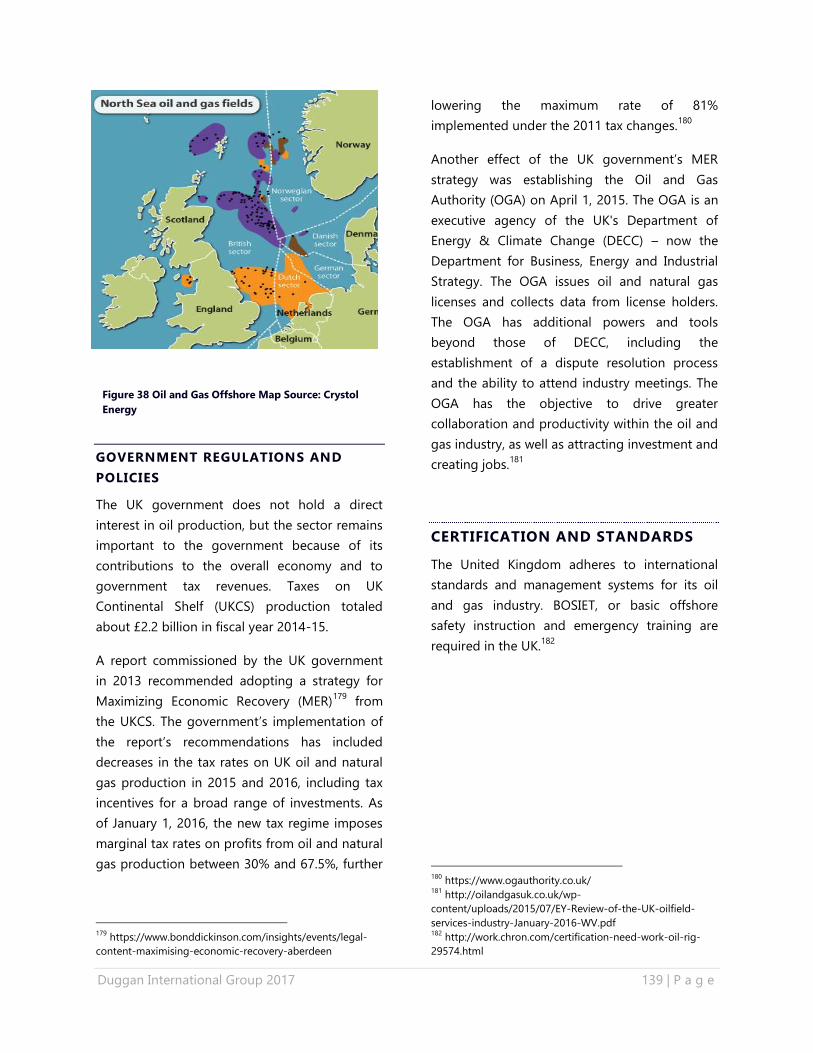
Duggan International Group 2017 139 | P a g e
GOVERNMENT REGULATIONS AND
POLICIES
The UK government does not hold a direct
interest in oil production, but the sector remains
important to the government because of its
contributions to the overall economy and to
government tax revenues. Taxes on UK
Continental Shelf (UKCS) production totaled
about £2.2 billion in fiscal year 2014-15.
A report commissioned by the UK government
in 2013 recommended adopting a strategy for
Maximizing Economic Recovery (MER)179
from
the UKCS. The government’s implementation of
the report’s recommendations has included
decreases in the tax rates on UK oil and natural
gas production in 2015 and 2016, including tax
incentives for a broad range of investments. As
of January 1, 2016, the new tax regime imposes
marginal tax rates on profits from oil and natural
gas production between 30% and 67.5%, further
179
https://www.bonddickinson.com/insights/events/legal-
content-maximising-economic-recovery-aberdeen
lowering the maximum rate of 81%
implemented under the 2011 tax changes.180
Another effect of the UK government’s MER
strategy was establishing the Oil and Gas
Authority (OGA) on April 1, 2015. The OGA is an
executive agency of the UK's Department of
Energy & Climate Change (DECC) – now the
Department for Business, Energy and Industrial
Strategy. The OGA issues oil and natural gas
licenses and collects data from license holders.
The OGA has additional powers and tools
beyond those of DECC, including the
establishment of a dispute resolution process
and the ability to attend industry meetings. The
OGA has the objective to drive greater
collaboration and productivity within the oil and
gas industry, as well as attracting investment and
creating jobs.181
CERTIFICATION AND STANDARDS
The United Kingdom adheres to international
standards and management systems for its oil
and gas industry. BOSIET, or basic offshore
safety instruction and emergency training are
required in the UK.182
180
https://www.ogauthority.co.uk/ 181
http://oilandgasuk.co.uk/wp-
content/uploads/2015/07/EY-Review-of-the-UK-oilfield-
services-industry-January-2016-WV.pdf 182
http://work.chron.com/certification-need-work-oil-rig-
29574.html
Figure 38 Oil and Gas Offshore Map Source: Crystol
Energy
Duggan International Group 2017 140 | P a g e
WORKING IN THE UK
The UK has no significant trade or investment
barriers for Nova Scotia companies and no
restrictions on the transfer of capital or
repatriation of profits.
Market Strengths:
Long business and cultural ties with
Nova Scotia
Ease of doing business
Large supply of natural resources
Well established and modern
infrastructure
Well developed financial and legal
services
Market Challenges:
Mature industries with skilled workers
and established companies
Uncertainties due to the UK leaving the
European Union (BREXIT). If the UK
leaves, they will also be out of the CETA
free trade agreement. A new agreement
with the UK will have to be ratified.
Scotland is again asking for a
referendum for independence from
England. Main reason is BREXIT.
Canadian workers must apply for the relevant
work visas. A work permit is required even if
someone is planning to do unpaid, volunteer,
part-time or temporary work.
OPPORTUNITIES FOR NOVA SCOTIA
EXPORTERS
Aberdeen, Scotland is the member of the World
Energy City Partnership and home to Offshore
Europe.
Challenges for the energy industry in the UK
offer opportunities for Nova Scotian companies.
Challenges facing the industry include asset
integrity, well construction, exploiting small
pools and decommissioning.
Changing operating models and contract
structures or the various forms of new digital
and other technologies are also challenges for
the industry. The UK recognizes the industry
needs to remain relevant and continue to
innovate, while maintaining rigorous cost
controls. The Aberdeen Oil & Gas Technology
Centre will be working with industry to address
these challenges. https://theogtc.com/
The Oil and Gas Innovation Centre is also an
excellent platform for business, connecting
individual companies to work with a university
on a specific project (smaller scale than OGTC)
and the project usually lasts between three
months and a year. http://www.ogic.co.uk/
MAJOR COMPANIES
BP
Chevron
ExxonMobil
TAQA
Marathon
Perenco UK
Nexen
Sumitomo Corporation
Rowan
Apache Corporation
Zennor Petroleum
Talisman Energy
ConocoPhilips
For a full listing of companies:
http://oilandgasuk.co.uk/members-list.cfm
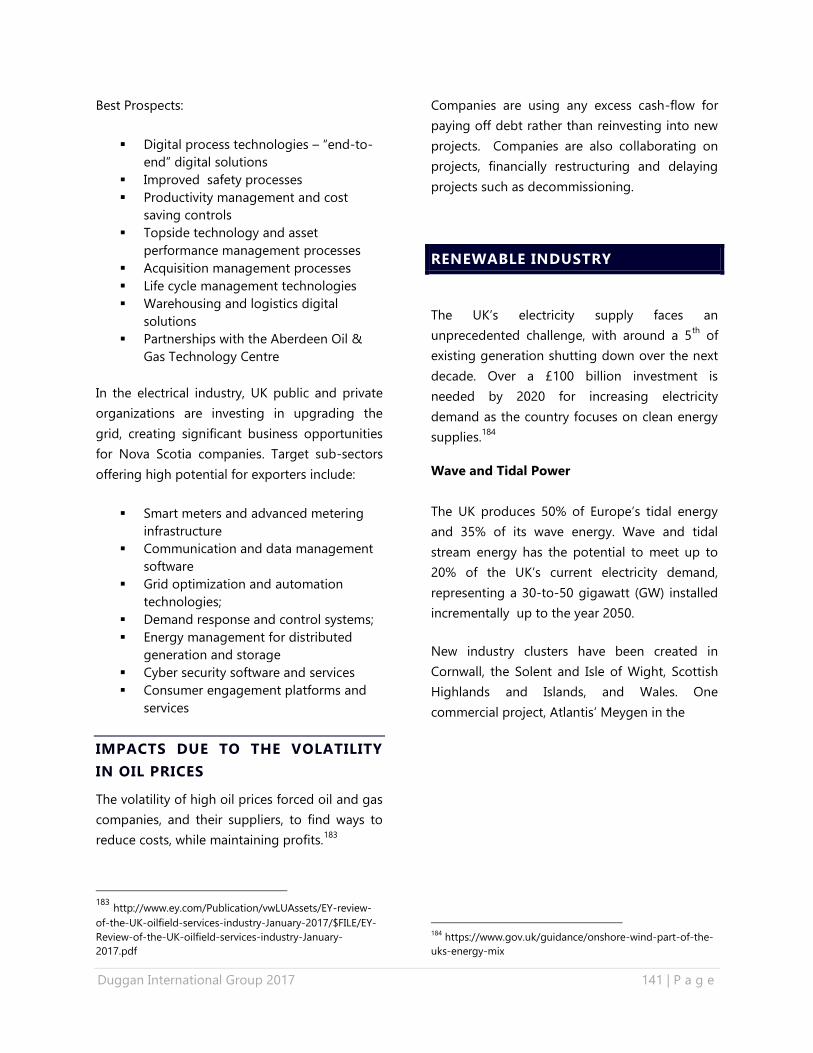
Duggan International Group 2017 141 | P a g e
Best Prospects:
Digital process technologies – “end-to-
end” digital solutions
Improved safety processes
Productivity management and cost
saving controls
Topside technology and asset
performance management processes
Acquisition management processes
Life cycle management technologies
Warehousing and logistics digital
solutions
Partnerships with the Aberdeen Oil &
Gas Technology Centre
In the electrical industry, UK public and private
organizations are investing in upgrading the
grid, creating significant business opportunities
for Nova Scotia companies. Target sub-sectors
offering high potential for exporters include:
Smart meters and advanced metering
infrastructure
Communication and data management
software
Grid optimization and automation
technologies;
Demand response and control systems;
Energy management for distributed
generation and storage
Cyber security software and services
Consumer engagement platforms and
services
IMPACTS DUE TO THE VOLATILITY
IN OIL PRICES
The volatility of high oil prices forced oil and gas
companies, and their suppliers, to find ways to
reduce costs, while maintaining profits.183
183
http://www.ey.com/Publication/vwLUAssets/EY-review-
of-the-UK-oilfield-services-industry-January-2017/$FILE/EY-
Review-of-the-UK-oilfield-services-industry-January-
2017.pdf
Companies are using any excess cash-flow for
paying off debt rather than reinvesting into new
projects. Companies are also collaborating on
projects, financially restructuring and delaying
projects such as decommissioning.
RENEWABLE INDUSTRY
The UK’s electricity supply faces an
unprecedented challenge, with around a 5th
of
existing generation shutting down over the next
decade. Over a £100 billion investment is
needed by 2020 for increasing electricity
demand as the country focuses on clean energy
supplies.184
Wave and Tidal Power
The UK produces 50% of Europe’s tidal energy
and 35% of its wave energy. Wave and tidal
stream energy has the potential to meet up to
20% of the UK’s current electricity demand,
representing a 30-to-50 gigawatt (GW) installed
incrementally up to the year 2050.
New industry clusters have been created in
Cornwall, the Solent and Isle of Wight, Scottish
Highlands and Islands, and Wales. One
commercial project, Atlantis’ Meygen in the
184
https://www.gov.uk/guidance/onshore-wind-part-of-the-
uks-energy-mix
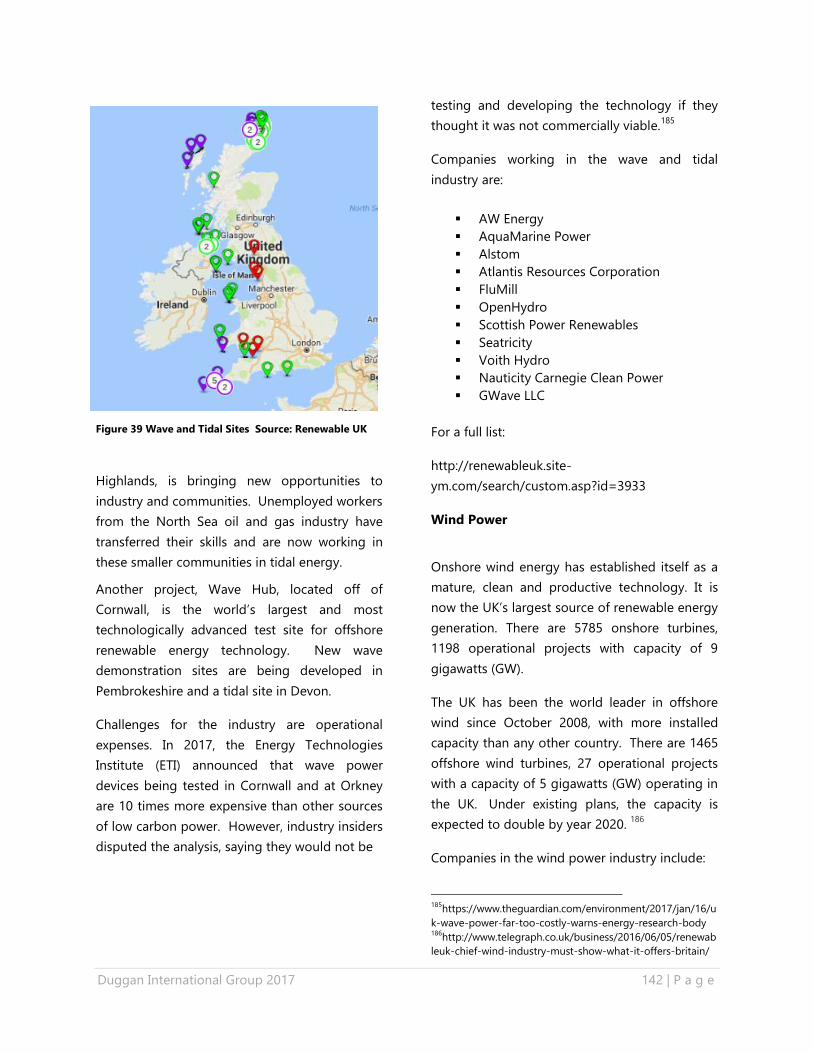
Duggan International Group 2017 142 | P a g e
Figure 39 Wave and Tidal Sites Source: Renewable UK
Highlands, is bringing new opportunities to
industry and communities. Unemployed workers
from the North Sea oil and gas industry have
transferred their skills and are now working in
these smaller communities in tidal energy.
Another project, Wave Hub, located off of
Cornwall, is the world’s largest and most
technologically advanced test site for offshore
renewable energy technology. New wave
demonstration sites are being developed in
Pembrokeshire and a tidal site in Devon.
Challenges for the industry are operational
expenses. In 2017, the Energy Technologies
Institute (ETI) announced that wave power
devices being tested in Cornwall and at Orkney
are 10 times more expensive than other sources
of low carbon power. However, industry insiders
disputed the analysis, saying they would not be
testing and developing the technology if they
thought it was not commercially viable.185
Companies working in the wave and tidal
industry are:
AW Energy
AquaMarine Power
Alstom
Atlantis Resources Corporation
FluMill
OpenHydro
Scottish Power Renewables
Seatricity
Voith Hydro
Nauticity Carnegie Clean Power
GWave LLC
For a full list:
http://renewableuk.site-
ym.com/search/custom.asp?id=3933
Wind Power
Onshore wind energy has established itself as a
mature, clean and productive technology. It is
now the UK’s largest source of renewable energy
generation. There are 5785 onshore turbines,
1198 operational projects with capacity of 9
gigawatts (GW).
The UK has been the world leader in offshore
wind since October 2008, with more installed
capacity than any other country. There are 1465
offshore wind turbines, 27 operational projects
with a capacity of 5 gigawatts (GW) operating in
the UK. Under existing plans, the capacity is
expected to double by year 2020. 186
Companies in the wind power industry include:
185
https://www.theguardian.com/environment/2017/jan/16/u
k-wave-power-far-too-costly-warns-energy-research-body 186
http://www.telegraph.co.uk/business/2016/06/05/renewab
leuk-chief-wind-industry-must-show-what-it-offers-britain/
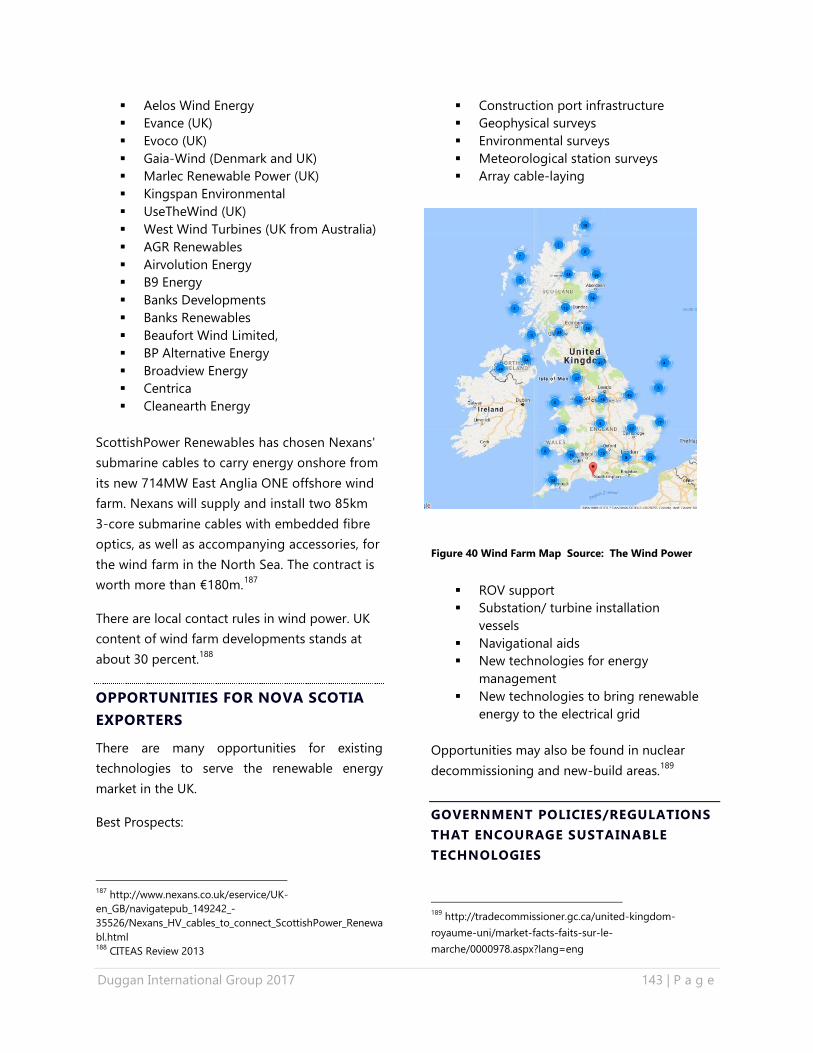
Duggan International Group 2017 143 | P a g e
Aelos Wind Energy
Evance (UK)
Evoco (UK)
Gaia-Wind (Denmark and UK)
Marlec Renewable Power (UK)
Kingspan Environmental
UseTheWind (UK)
West Wind Turbines (UK from Australia)
AGR Renewables
Airvolution Energy
B9 Energy
Banks Developments
Banks Renewables
Beaufort Wind Limited,
BP Alternative Energy
Broadview Energy
Centrica
Cleanearth Energy
ScottishPower Renewables has chosen Nexans'
submarine cables to carry energy onshore from
its new 714MW East Anglia ONE offshore wind
farm. Nexans will supply and install two 85km
3-core submarine cables with embedded fibre
optics, as well as accompanying accessories, for
the wind farm in the North Sea. The contract is
worth more than €180m.187
There are local contact rules in wind power. UK
content of wind farm developments stands at
about 30 percent.188
OPPORTUNITIES FOR NOVA SCOTIA
EXPORTERS
There are many opportunities for existing
technologies to serve the renewable energy
market in the UK.
Best Prospects:
187
http://www.nexans.co.uk/eservice/UK-
en_GB/navigatepub_149242_-
35526/Nexans_HV_cables_to_connect_ScottishPower_Renewa
bl.html 188
CITEAS Review 2013
Construction port infrastructure
Geophysical surveys
Environmental surveys
Meteorological station surveys
Array cable-laying
Figure 40 Wind Farm Map Source: The Wind Power
ROV support
Substation/ turbine installation
vessels
Navigational aids
New technologies for energy
management
New technologies to bring renewable
energy to the electrical grid
Opportunities may also be found in nuclear
decommissioning and new-build areas.189
GOVERNMENT POLICIES/REGULATIONS
THAT ENCOURAGE SUSTAINABLE
TECHNOLOGIES
189
http://tradecommissioner.gc.ca/united-kingdom-
royaume-uni/market-facts-faits-sur-le-
marche/0000978.aspx?lang=eng
Duggan International Group 2017 144 | P a g e
Under the Climate Action Plan, the UK new
carbon target is to reduce carbon emissions 57%
by 2030 based on 1990 levels. The government
has outlined various industry and consumer
mechanisms. Relevant strategies are the
investment in low-carbon technologies. The
government has pledged to reduce emissions
by:
Taking action to increase the use of low-
carbon technologies and creating an
industry for carbon capture and storage
Reducing emissions from the power
sector and encouraging investment in
low-carbon technologies by reforming
the UK’s electricity market
Providing funding incentives and
programs
The Department for Business, Energy &
Industrial Strategy works with UK industry, and
across Government, in partnership with the
Devolved Administrations to help the UK win a
greater share of offshore wind business. This
involves working closely with key wind turbine
companies, the supply chain and regional
partners such as Local Enterprise Partnerships
(LEPs) and Centres for Offshore Renewable
Engineering (COREs) to develop supply chain
opportunities for companies able to compete on
price and quality.190
FUNDING INCENTIVES
European Energy Innovation Funding - 2016
Horizon 2020 Energy Calls
There are many funding opportunities for doing
business in the renewable energy industry in the
UK and EU. Nova Scotia companies would have
to partner with a local supplier. The 2016 Calls
for Proposals for Horizon 2020 Energy are now
190
https://www.gov.uk/guidance/offshore-wind-part-of-the-
uks-energy-mix
open. Horizon 2020 Energy has a budget of
around €6bn over the period 2014 – 2020.
For more information:
https://www.gov.uk/guidance/innovation-
funding-for-low-carbon-technologies-
opportunities-for-bidders
EDC has funding available to the mining
company Anglo American plc in the UK for
purchasing goods and services from Canadian
suppliers.
OTHER SOURCES OF INFORMATION
US Government EIA Country Analysis Brief –
United Kingdom
https://www.eia.gov/beta/international/
UK Oil & Gas Activity Survey 2016
UK Oil & Gas Economic Outlook 2017
Renewables UK
http://www.renewableuk.com/page/WindEnergy
Offshore Technology – UK
http://www.offshore-technology.com
Industrial Policy: Lessons from the North Sea N.
J. Smith Civitas Review 2013
US Commercial Service
https://www.export.gov/article?id=United-
Kingdom-Smart-Grids
Ernst & Young (EY)
Review of the UK oilfield services industry
January 2017
Aberdeen City Council
NOTES:
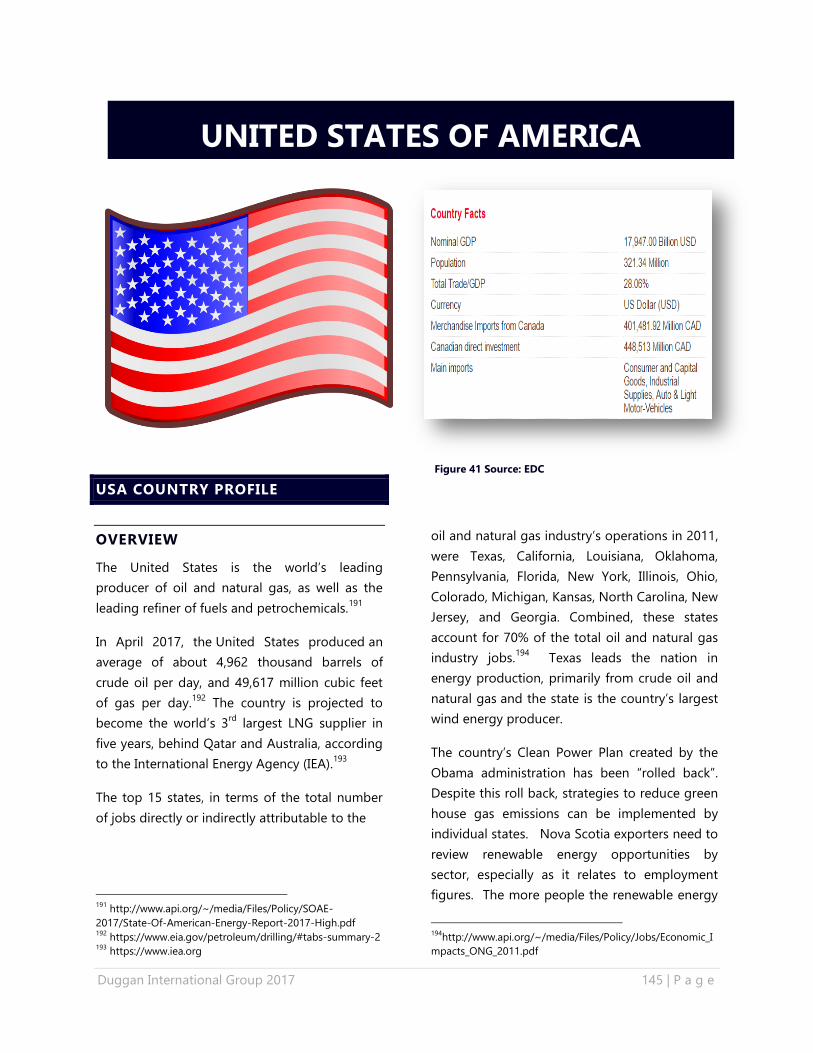
Duggan International Group 2017 145 | P a g e
USA COUNTRY PROFILE
OVERVIEW
The United States is the world’s leading
producer of oil and natural gas, as well as the
leading refiner of fuels and petrochemicals.191
In April 2017, the United States produced an
average of about 4,962 thousand barrels of
crude oil per day, and 49,617 million cubic feet
of gas per day.192
The country is projected to
become the world’s 3rd
largest LNG supplier in
five years, behind Qatar and Australia, according
to the International Energy Agency (IEA).193
The top 15 states, in terms of the total number
of jobs directly or indirectly attributable to the
191
http://www.api.org/~/media/Files/Policy/SOAE-
2017/State-Of-American-Energy-Report-2017-High.pdf 192
https://www.eia.gov/petroleum/drilling/#tabs-summary-2 193
https://www.iea.org
oil and natural gas industry’s operations in 2011,
were Texas, California, Louisiana, Oklahoma,
Pennsylvania, Florida, New York, Illinois, Ohio,
Colorado, Michigan, Kansas, North Carolina, New
Jersey, and Georgia. Combined, these states
account for 70% of the total oil and natural gas
industry jobs.194
Texas leads the nation in
energy production, primarily from crude oil and
natural gas and the state is the country’s largest
wind energy producer.
The country’s Clean Power Plan created by the
Obama administration has been “rolled back”.
Despite this roll back, strategies to reduce green
house gas emissions can be implemented by
individual states. Nova Scotia exporters need to
review renewable energy opportunities by
sector, especially as it relates to employment
figures. The more people the renewable energy
194
http://www.api.org/~/media/Files/Policy/Jobs/Economic_I
mpacts_ONG_2011.pdf
UNITED STATES OF AMERICA
Figure 41 Source: EDC
Duggan International Group 2017 146 | P a g e
industry employs, the more favourable the
industry is federally.
This report focuses on Texas as Houston is the
World Energy City.
COUNTRY SOURCES OF ENERGY
Petroleum, natural gas, coal, renewable energy,
and nuclear electric power are primary sources
of energy in the United States. The three major
fossil fuels, petroleum, natural gas, and coal
accounted for most of the nation's energy
production in 2015; natural gas (32%), petroleum
from crude oil and natural gas plant liquids
(28%), coal (21%), renewable energy (11%) and
nuclear electric power (8%).195
According to Bloomberg Financial, hydropower
provided 80 GW of renewable capacity
(excluding pumped storage), and wind and solar
capacity has increased over 600% since 2007
(from 16 GW to 123 GW). Biogas, biomass,
geothermal, and waste-to-energy represent 18
GW of capacity in the US.
CURRENT STATE OF ENERGY USE AND
‘ENERGY DIRECTION’
Primary energy consumption in the United
States in 2016 totaled 97.4 quadrillion British
thermal units (Btu), a slight increase from the
2015 level. Fossil fuels continue to account for
the bulk of US energy consumption with
petroleum and natural gas as the leading fossil
fuels consumed. In 2016, the country utilized
less coal than in previous years.196 This could
change in 2018 as the country is moving toward
expanding coal operations.
Moreover, the United States now produces more
oil domestically than it imports from foreign
195
EIA US Energy Information Administration 196
https://www.eia.gov/todayinenergy/detail.php?id=30652
sources. This achievement confirms the country
as the number one natural gas producer in the
world. The natural gas sector was resilient in
2016 with the historic emergence of the US as an
LNG exporter. With the rise of natural gas as a
power generation fuel, LNG has overtaken coal
as the leading source of electric generation for
the first time on an annual basis.197
Even though global industries experienced a
down turn from low crude prices, the United
States had still remained a major source of
growth in oil and gas exploration and
development. The growth was mainly due to
shale and ultra deep-water resources. For this
reason, US companies have developed advanced
and cost-competitive techniques for extracting
hydrocarbons from shale and hard to reach
offshore oil and gas deposits. These techniques
allow many US producers to remain competitive
in the global marketplace.
Lastly, with a growing pipeline infrastructure and
access to ports, the United States is positioning
themselves to be a leading global LNG exporter.
The oil and gas industry in the US does not
exclusively remain in the fossil fuel sector. The
industry spent $90 billion between 2000-2014 in
new technology investment to reduce
greenhouse gas emissions and meet future
energy needs. Domestic US oil and natural gas
companies are pioneers in developing
alternatives and expanding America’s use of
virtually every form of energy – from geothermal
to wind, from solar to biofuels, from hydrogen
power to the lithium ion battery for next-
generation cars.198
197
Deloitte 2017 outlook on oil and gas | My take: John
England 198
http://www.api.orgSOAE-2017/State-Of-American-
Energy-Report-2017
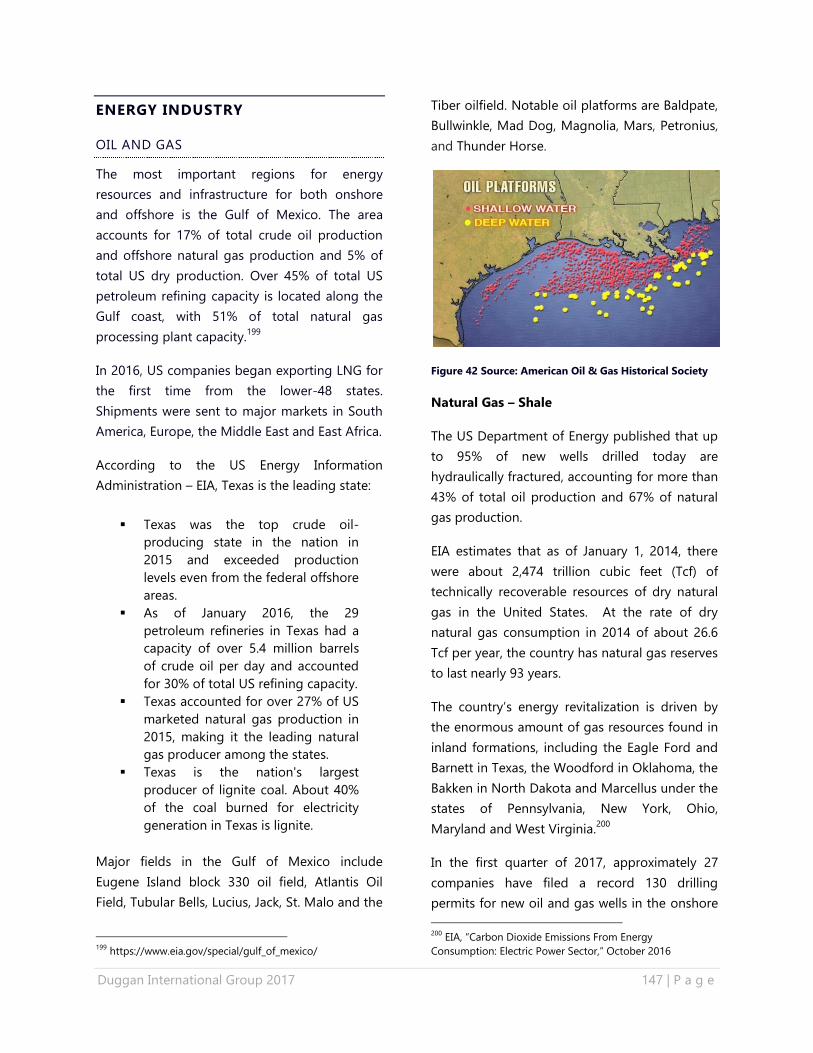
Duggan International Group 2017 147 | P a g e
ENERGY INDUSTRY
OIL AND GAS
The most important regions for energy
resources and infrastructure for both onshore
and offshore is the Gulf of Mexico. The area
accounts for 17% of total crude oil production
and offshore natural gas production and 5% of
total US dry production. Over 45% of total US
petroleum refining capacity is located along the
Gulf coast, with 51% of total natural gas
processing plant capacity.199
In 2016, US companies began exporting LNG for
the first time from the lower-48 states.
Shipments were sent to major markets in South
America, Europe, the Middle East and East Africa.
According to the US Energy Information
Administration – EIA, Texas is the leading state:
Texas was the top crude oil-
producing state in the nation in
2015 and exceeded production
levels even from the federal offshore
areas.
As of January 2016, the 29
petroleum refineries in Texas had a
capacity of over 5.4 million barrels
of crude oil per day and accounted
for 30% of total US refining capacity.
Texas accounted for over 27% of US
marketed natural gas production in
2015, making it the leading natural
gas producer among the states.
Texas is the nation's largest
producer of lignite coal. About 40%
of the coal burned for electricity
generation in Texas is lignite.
Major fields in the Gulf of Mexico include
Eugene Island block 330 oil field, Atlantis Oil
Field, Tubular Bells, Lucius, Jack, St. Malo and the
199
https://www.eia.gov/special/gulf_of_mexico/
Tiber oilfield. Notable oil platforms are Baldpate,
Bullwinkle, Mad Dog, Magnolia, Mars, Petronius,
and Thunder Horse.
Figure 42 Source: American Oil & Gas Historical Society
Natural Gas – Shale
The US Department of Energy published that up
to 95% of new wells drilled today are
hydraulically fractured, accounting for more than
43% of total oil production and 67% of natural
gas production.
EIA estimates that as of January 1, 2014, there
were about 2,474 trillion cubic feet (Tcf) of
technically recoverable resources of dry natural
gas in the United States. At the rate of dry
natural gas consumption in 2014 of about 26.6
Tcf per year, the country has natural gas reserves
to last nearly 93 years.
The country’s energy revitalization is driven by
the enormous amount of gas resources found in
inland formations, including the Eagle Ford and
Barnett in Texas, the Woodford in Oklahoma, the
Bakken in North Dakota and Marcellus under the
states of Pennsylvania, New York, Ohio,
Maryland and West Virginia.200
In the first quarter of 2017, approximately 27
companies have filed a record 130 drilling
permits for new oil and gas wells in the onshore
200
EIA, “Carbon Dioxide Emissions From Energy
Consumption: Electric Power Sector,” October 2016
Duggan International Group 2017 148 | P a g e
Eagle Ford.201
Among those making the biggest
push in the Eagle Ford are Carrizo Oil & Gas,
ConocoPhillips' subsidiary Burlington Resources,
Chesapeake Energy and Marathon Oil Corp.
The Permian Basin is also experiencing a more
expedient recovery. The West Texas shale now
has 306 active drilling sites which have been
growing every week. After combining the Eagle
Ford and Permian Basin with other drilling sites,
as of March 2017, Texas has a total of 386 active
rigs, and the US as a whole has 754 rigs
deployed.202
Employment wise, a 2013 study produced by IHS
Markit203
found that energy from shale and
other tight-rock formations supported 2.1
million jobs in 2012, and that number was
projected to increase to 3.9 million jobs by 2025,
including 500,000 manufacturing jobs.
LNG
The US is expected to become a net exporter of
natural gas on an average annual basis by 2018,
according to the recently released EIA Annual
Energy Outlook 2017. LNG exports are expected
to contribute to a growing share of natural gas
exports and to surpass pipeline exports of
natural gas by 2020.
The Sabine Pass facility in Louisiana became the
first operating LNG export facility in the Lower
48 states in 2016. Four LNG export facilities
currently under construction are expected to be
completed by 2021. Combined, these five plants
are expected to have an operational export
capacity of 9.2 Bcfgd. After 2021, projected US
exports of LNG are predicted to grow at a more
201
https://eaglefordshale.com/ 202
http://www.bizjournals.com/houston/news/2017/02/27/ea
gle-ford-permian-basinrig-counts-up.html 203
https://www.ihs.com/
modest rate as US natural gas faces growing
competition from other global LNG suppliers.
US exports of natural gas by pipeline to Mexico
are also expected to increase. Exports to Mexico
have doubled since 2009 and are projected to
continue rising through at least 2020 as pipeline
projects currently under construction are
completed.204
The US government also recently
approved the Keystone Pipeline project from
Canada.
Refineries
There were a total of 141 operable petroleum
refineries in the United States as of January 1,
2016. Some notable refineries include the
Petromax Refining Co which operates a 25,000
b/cd refinery in Houston and Buckeye Partners
LP operates a 46,250 b/cd condensate
processing facility in Corpus Christi. In 2012,
Motiva upgraded its refinery in Port Arthur,
Texas, making it the largest refinery in the US
with a capacity of 603,000 b/cd as of January 1,
2016. In 2009, Marathon upgraded its Garyville,
Louisiana refinery and as of January 1, 2016, the
capacity is more than double its original 1977
capacity.
Coal
The United States holds the world’s largest
estimated recoverable reserves of coal and is a
net exporter of coal. The country is also
developing carbon capture and sequestration
technologies with the goal of capturing 90% of
CO2 emissions from coal to help allow coal to
remain a strategic fuel for the nation while
enhancing environmental protection.205
204
http://www.worldoil.com/news/2017/2/24/eia-lng-
exports-expected-to-drive-growth-in-us-natural-gas-trade 205
https://www.selectusa.gov/energy-industry-united-states
Duggan International Group 2017 149 | P a g e
In 2015, nearly 897 million short tons of coal
were produced in 25 states. Five states produced
a total of about 639 million short tons, or about
71% of total US coal production. The five largest
coal producing states with production in million
short tons and the share of total US coal
production in 2015:
Wyoming: 375.8 (42%)
West Virginia: 95.6 (11%)
Kentucky: 61.4 (7%)
Illinois: 56.1 (6%)
Pennsylvania: 50.0 (6%)
On March 28, 2017 US President Donald Trump
signed an executive order eliminating numerous
restrictions on fossil fuel production. The
President declared an end to what he’s called
“the war on coal.” The order also lifts a 14-
month-old moratorium on new coal leases on
federal lands. Currently, coal mining accounts
for fewer than 75,000 US jobs.
PROJECTS
TransCanada and its joint venture with
Sempra Energy's subsidiary IEnova and
Infraestructura Marina del Golfo (IMG)
has secured a contract for the $2.1bn
Sur de Texas-Tuxpan offshore natural
gas pipeline in Mexico. The project will
link with TransCanada's Tamazunchale
and Tuxpan-Tula pipelines, as well as
with other transporters in the region.
Construction activities for TransCanada's
Tuxpan-Tula and the Tula-Villa de Reyes
pipelines are already in progress and are
expected to be operational in 2018.
April 2017, Marathon Petroleum Corp.
has let a contract to Fluor Corp. to
provide engineering and procurement
(EP) for a major reconfiguration project
involving works at both the 459,000-b/d
Galveston Bay and 86,000-b/d Texas City
refineries in Texas City, Texas.
April 2017, Kinder Morgan Texas
Pipeline LLC (KMTP), a subsidiary of
Kinder Morgan Inc., and DCP Midstream
LP have signed a letter of intent for DCP
to participate in the development of the
proposed Gulf Coast Express pipeline
project that will connect Permian basin
MAJOR COMPANIES
Anadarko
Chevron Corp.
Sempra Energy
Plains All American Pipeline LP
Occidental Petroleum Corp.
Noble Energy Inc.
Hess Corp.
Chesapeake Energy Corp.
Baker Hughes Inc.
Atmos Energy Corp.
Halliburton Co
Phillips 66 Co.
Sysco Corp.
Schlumberger Ltd.
ConocoPhillips
Enterprise Products Partners LP
Rowan Companies
Nabors Industries Ltd
EOG Resources
Marathon Corporation
Hilcorp Energy Co.,
Killam Oil
Occidental Petroleum Corp.
Fluor
To access more local companies: Petroleum
Equipment & Services Association
http://www.pesa.org/
Duggan International Group 2017 150 | P a g e
gas production with the Texas Gulf
Coast. The project is designed to
transport up to 1.7 million
dekatherms/day of gas through 430
miles of 42-in. pipeline from the Waha,
Tex., area to Agua Dulce, Tex. The
pipeline is expected to be in service in
second-half 2019, subject to shipper
commitments.
March 2017, offshore energy companies
paid more than $315 million in bids to
lease 913,542 acres in the Gulf of Mexico
off the coast of Louisiana, Mississippi
and Alabama. The lease sale is the final
one in the GOM under the Obama
Administration’s Five-Year Plan, which
made available all offshore areas with
the greatest resource potential from
2012 through 2017. The first 11 sales in
the program netted more than $3 billion
in bid revenue on almost 73 million
acres for development, according to
information from the Interior
Department. The top five bidders
included major oil and gas companies:
Shell Offshore – $61 million, Statoil –
$51 million, Chevron Corp. – $50 million,
Hess Corp. – $44 million and ExxonMobil
– $22 million.
February 2017, Royal Dutch Shell has
given the go-ahead to develop its
Kaikias deepwater field in the Gulf of
Mexico, the first such project the oil and
gas company has approved in 18
months.
In 2016, Australia's Otto Energy Ltd.
announced that it has been advised by
Operator, Byron Energy Inc., a subsidiary
of Byron Energy Limited (Byron), that the
SM-71 #1 well located at the South
Marsh Island Block 71 in the Gulf of
Mexico has completed drilling to the
final target measured depth at 6,843
feet (2,086 meters) or 6,477 feet (1,974
meters) True Vertical Depth.
In 2016, Royal Dutch Shell’s recent Fort
Sumter discovery provides further
indication that running room still exists
in Shell’s heartlands acreage in the
deepwater US Gulf of Mexico Fort
Sumter is estimated to hold recoverable
resources of over 125 million barrels of
oil equivalent (boe). That size could
increase following the results of further
appraisal drilling and planned wells in
adjacent structures.
Stone Energy Corp. is again producing
oil and natural gas from the Pompano
platform in the Gulf of Mexico.
Production from the platform was shut
down following a June 28 explosion at
Enterprise Products Partners LP’s gas
processing plant in Pascagoula, Miss.
Stone didn’t have a direct interest in the
plant, but the facility processed
approximately 20 million cubic feet per
day (MMcf/d) to 25 MMcf/d gross gas
from Pompano.
Enterprise Products Partners LP (EPP)
plans to build a 571-mile pipeline to
transport natural gas liquids from the
Permian basin to the firm’s NGL
fractionation and storage complex in
Mont Belvieu, Texas. The Shin Oak NGL
pipeline will originate at EPP’s Hobbs
NGL fractionation and storage facility in
Gaines County, Tex. The 24-in. OD
pipeline will have an initial design
capacity of 250,000 b/d, expandable to
600,000 b/d. The project is supported by
long-term customer commitments and
is expected to be in service in second-
quarter 2019.
Noble Energy Inc. is ramping up
production from its Gunflint oil
development in the deepwater Gulf of
Mexico. The company expects gross
production from Gunflint of at least
20,000 barrels of oil equivalent per day
(boepd); 75 % of that production is
expected to be oil. Noble expects a net
amount to its interest of at least 5,000
boepd.
BP Plc is seeking to extend the
production life of one of its biggest
operated deepwater US Gulf of Mexico
Duggan International Group 2017 151 | P a g e
fields with a major water injection
project. The company will seek to boost
oil and gas recovery from one of the
Thunder Horse field’s three main
reservoirs. The water injection project is
part of BP’s strategy of continued
investment in its existing deepwater Gulf
of Mexico production hubs.
BP PLC reached a final investment
decision on the long-delayed Mad Dog
Phase 2 offshore oil platform in the Gulf
of Mexico — the company wants to go
ahead with the project. The platform
originally was meant to start producing
in 2018, but the partners on the project
decided in 2013 to reexamine the design
after it proved to be too costly and
complex. The latest iteration of the
project now is expected to cost $9
billion and have up to 140,000 barrels
per day of production capacity.
Houston-based Enterprise Products
Partners LP announced two projects
centered around the Houston-area's
midstream ethylene infrastructure. The
first is a modification to one of its
existing storage facilities. The second
project is a new, 12-inch diameter
pipeline to carry ethylene from Mont
Belvieu to Bayport, connecting to
Enterprise's ethane export terminal at
Morgan's Point.
Chevron Phillips Chemical has
announced a $5 billion project to build
an ethane cracker at its Cedar Bayou
plant in Baytown, as well as two
polyethylene units in Old Ocean, in
Brazoria County.
Lyondell Basell Industries NV is building
a $700 million polyethylene plant n La
Porte on the south shore of the Houston
Ship Channel. Construction is scheduled
to start early next year and is slated to
wrap up around 2019. It's expected to
create up to 1,000 construction jobs and
75 permanent jobs.
A joint venture between Irving, Texas-
based Exxon Mobil Corp. and Saudi
Basic Industries Corp. has proposed a
$10 billion ethane steam cracker near
Corpus Christi, Texas.
Houston-based CenterPoint Energy, one
of Houston's biggest public companies,
wants to plug into the burgeoning
petrochemical industry around Freeport.
CenterPoint Energy has submitted a
proposal to the Electric Reliability
Council of Texas to spend $250 million
on electric transmission infrastructure
projects to feed growing power
demands in the Gulf Coast town south
of Houston. The company offers electric
transmission, natural gas distribution
and energy services operations to
multiple states around the US.
The South Texas town of Agua Dulce has
already become a major hub for natural
gas pipelines but with companies
looking to ship more shale gas to
Mexico, a new construction boom is
about to get underway. Houston-based Halliburton Co. plans to
have hired more than 2,000 US oil field
workers by the end of the first quarter
2017. The hiring is in support of a sharp
increase in demand for oil field services
as the upstream sector builds
momentum on what many assume is the
end of the persistent oil downturn.
Halliburton secured work from an
independent oil company at five
deepwater rigs, and the company's
second-quarter revenues should
increase over those of the first quarter.
Houston-base Cheniere Energy Inc. has
gathered the agreements from potential
shippers it needs to support taking the
next steps on its Midship Pipeline
project. The 200-mile-long Midship
Pipeline would draw natural gas out of
production areas in the SCOOP and
STACK plays in Oklahoma and into US
Gulf Coast markets, according to a
Cheniere press release. Right now, it’s
expected maximum capacity would be
1.4 million dekatherms per day.
Duggan International Group 2017 152 | P a g e
Irving, Texas-based ExxonMobil Corp.
will continue with a series of 11 projects
on the US Gulf Coast that it expects to
have created more than 45,000 jobs over
the life of the project. The projects
started in 2013, and will continue
through 2022. The projects stretch
across the chemical, refining, lubricant
and liquefied natural gas markets. They
will take place at existing and new
proposed facilities along the coastlines
of Texas and Louisiana, and the exports
are largely targeted at Asian markets.
France-based energy giant Total S.A. is
purchasing around 23% of Tellurian
Investments Inc. at $5.85 a share, a total
of $207 million, to develop an integrated
gas project. Tellurian has an 800-acre
site in Louisiana on the Calcasieu River
where it intends to build an LNG
liquefaction plant dubbed Driftwood
LNG to export LNG overseas. Tellurian
has contracted with Bechtel to provide
the engineering, procurement and
construction of the facilities and Chart
Industries will develop the liquefaction
technology. Construction is expected to
begin in 2018, and the project should
become operational in 2022.
Trelleborg Offshore US Inc. has added a
new team in Houston to its engineering
division, and it plans to double the size
of the team by the end of next year. The
new global riser analysis team of
mathematicians and consultants
currently has four employees, all based
in Houston, and Trelleborg Offshore will
look to double that by the end of 2017.
Houston's Rowan Companies PLC and
Saudi Arabian Oil Co., better known as
Saudi Aramco, plan to create a 50-50
joint venture to own, operate and
manage offshore drilling rigs in Saudi
Arabia. The new company is expected to
launch in the second quarter 2017.
Solaris Oilfield Infrastructure, a Houston-
based logistics company, expects to hire
as it ramps its business back up during
the tail end of the oil downturn. The
company has already started hiring
logistics support personnel in Houston.
Solaris will incrementally add three or
four more over the course of next year.
The company is also adding employees
in other functions around its Early,
Texas, manufacturing plant.
Houston-based Baker Hughes Inc. plans
to build a new hydraulic fracturing and
cementing services company in North
America. The new company is expected
to operate under the BJ Services brand
and to have its headquarters in Tomball.
Baker Hughes, along with CSL Capital
Management and Goldman Sachs fund
West Street Energy Partners, are backing
the firm.
Statoil Inc. will spend $2.5 million to
renew its agreement with the University
of Texas at Austin in support of
graduate student research on geology,
geophysics and petroleum engineering.
Citadel Casing Solutions, a new
Houston-based manufacturer, has
received its initial investment and
launched operations. Denver-based
Aspen Energy Partners provided the
multimillion-dollar equity commitment.
Citadel, which was founded in July by
former employees of Houston-based
Halliburton Co. manufactures casing
equipment and accessories that support
well construction and wellbore integrity.
Hilcorp Alaska, LLC plans to invest $31
million in 2017 on maintenance and
infrastructure on aging pipelines in Cook
Inlet.
GOVERNMENT REGULATIONS AND
POLICIES
The US Government does not have a national
energy policy. However, the oil and gas industry
can be affected by state government energy and
environmental policies. The US has both federal
and individual state agencies that regulate
certain aspects of oil and gas production.
Duggan International Group 2017 153 | P a g e
Individual states also have not established a
comprehensive energy policy to manage their
energy resources. For example, domestic
onshore oil and gas development is regulated by
the individual states under mandates to prevent
waste and protect human health and the
environment, while encouraging the greatest
ultimate use of domestic oil and gas production.
Whereas, oil and gas production occurring
offshore in the Gulf of Mexico is managed by
various US Federal Government agencies to
ensure safe and environmentally responsible
development. The federal government is
responsible for the payment of production
royalties and taxes for the public benefit. The
Department of the Interior regulates the
extraction of oil and gas from federal lands. The
Bureau of Land Management regulates oil
development, exploration and production on
federal onshore properties. The Office of Natural
Resources Revenue collects royalties owed to
the government for onshore and offshore
production.
The government's right to economic benefits is
generally similar to that of individuals; it is the
subject of contract, not law. This is a unique
feature of the US system and is unlike that of
other countries, where the government can gain
an economic benefit, for example, tariffs on
production.
In those instances where a US local, state or
federal government entity is the owner of the oil
and/or gas rights, and leases those rights for
development, the lease conveying the rights to
an operator will include a production royalty
payable to the property owner entity. Local,
state and federal government entities can
therefore derive direct economic benefits from
the ownership and development of the oil and
gas estates through specific and general taxes,
as well as royalties derived from production on
government-owned lands.206
CERTIFICATION AND STANDARDS
Offshore workers are required to have:
BOSIET (Basic Offshore Safety Induction
and Emergency Training)
STCW 95 (Standards of Training,
Certification and Watchkeeping) is
designed for anyone on vessels of over
200 tons going beyond territorial waters
HUET (Helicopter Underwater Escape
Training)
WORKING IN THE USA
Nova Scotia workers can enter USA through the
NAFTA agreement. Companies should review
that proper paperwork is in order for repair and
installation workers as well as company transfers.
Market Strengths:
Strong ties between Canada the United
States
North American Free Trade Agreement
Proximity to the market
Low regulatory barriers
No language barriers
Access to global supply chain, which can
lead to exports for other markets
A strong rule of law
Canadian dollar is attractive to importers
from the US
Market Challenges:
The US is not a single national market; it
is a federal system. You must treat each
state as a separate entity
High litigation. Nova Scotians should
employ legal firms with a US office and
206
http://ca.practicallaw.com/9-525-
1545?source=relatedcontent
Duggan International Group 2017 154 | P a g e
ensure they have insurance coverage in
the US
Highly competitive market from other
international suppliers. Products and
services need to have a competitive
advantage and companies need to be
able to market this advantage
Staying on top of any upcoming
changes to NAFTA
Buy American policies and protectionism
sentiment
The US is outpacing Canada in natural
gas and LNG development, Nova
Scotians would need to ensure they are
up-to-date in all technological
developments
OPPORTUNITIES FOR NOVA SCOTIA
EXPORTERS
Houston is the member city of the World Energy
City Partnership. Houston is the country’s main
center for the energy industry and host to many
energy conferences including the Offshore
Technology Conference.
With the growing natural gas industry, the
United States is a large importer of oil & gas
field equipment and pipes. With about $12
billion in imports in 2013, the United States was
the largest importer of oil & gas equipment,
purchasing about 9% of all global oil & gas
equipment sold worldwide.
Best Prospects:
Infrastructure construction, equipment
and supplies for oil and natural gas
pipelines, new and repair of aging
pipelines
Environmental services and remediation,
subsea pipeline inspection for leaking
pipelines in Alaska
Front End Engineering Design (FEED)
Upstream oil field services
Efficient technologies in shale gas
extraction
Environmental remediation new
technologies shale gas extraction
New technologies and services in ultra-
deep water exploration
IMPACTS DUE TO THE VOLATILITY
IN OIL PRICES
The Energy Policy and Conservation Act of 1975
banned the export of crude oil produced from
the US. Limited exceptions were granted by the
Department of Commerce, resulting in between
50,000,000 and 100,000,000 barrels being
exported annually. On December 18th
, 2015,
amid the historic downturn in global oil prices,
the US Congress lifted the crude oil ban,
allowing US oil producers to sell in global oil
markets.
Energy economically dependent states such as
Texas experienced a downturn in the economy
with bankruptcies, layoffs and company mergers.
For example, in 2015 oilfield service providers
Baker Hughes Inc and Halliburton Co cut
thousands of jobs as drilling activity slowed due
to a steep fall in crude oil prices. In April 2016,
Maersk Oil has announced plans to close its
Houston office in the US and reduce the
Luanda team due to weak market conditions for
deepwater developments. ConocoPhillips, the
largest US independent oil producer, plans to
sell up to $8 billion in natural gas assets and trim
its capital budget by 4% in 2018 to provide
funds to bolster operations.
However, other parts of the country benefited
from low oil prices. Energy prices fell faster in
the US than in other countries. With natural gas
half as expensive in the US than Europe and
Asia, low energy prices were a competitive
advantage to almost all American companies.
Additionally, low oil prices were doubly felt in
the US because the country still imports
hundreds of billions of dollars of oil a year.
Duggan International Group 2017 155 | P a g e
Currently, employment in the US is getting back
on track due to the ramp-up in onshore activity
with shale. Many E&P (exploration and
production) and oil service companies are now
searching for talent again after being left with an
almost-depleted workforce due to the industry
downturn.207
RENEWABLE INDUSTRY
The United States is home to a thriving
renewable energy industry with strengths in the
wind, solar, geothermal, hydropower, biomass,
and biofuels sectors. The country produces
more geothermal energy than any other country
(2,640MW); more biomass power than any other
country (15,407 MW); enjoys the 2nd
largest wind
industry (73,751 MW); the 3rd
largest
hydropower industry (79,298 MW); and the 4th
largest solar industry (27,810 MW).
The International Renewable Energy Agency
(IRENA) projects that by 2030, the share of
renewables in the total US energy mix could
reach 27 percent. This would mean an increase
from 134 GW of renewable energy in 2010 to
over 700 GW in just two decades. The United
States also had the 2nd
highest investment in the
world in 2015, with nearly 16GW of new
renewable energy capacity and $91 billion in
clean energy transactions, according to
Bloomberg New Energy Finance. 208
Renewable fuels also had the largest increase in
energy consumption. Considerable electric
generating capacity was added for both wind
and solar resources in 2016. Wind generation
increased by nearly 20%, making up almost half
of all renewable consumption increases.
Hydroelectric consumption increased by 7% as
207
http://www.rigzone.com/news/oil_gas/a/149141/us_jobs_r
eport_oil_gas_employment_increases_in_march 208
https://www.selectusa.gov/energy-industry-united-states
the West Coast recovered from severe drought
conditions. Together, wind, hydro, and solar
made up 91% of renewable consumption
increases. Biomass consumption, which
accounted for 47% of all renewable
consumption in 2016, remained close to its 2015
level.209
Employment wise, renewable energy including
wind, solar and biofuels as of the end of 2016
accounted for more than 650,000 US jobs.210
Smart Grid
The United States is an international leader in
the development and deployment of smart grid
technologies and services. Its subsector is
defined by the electric grid equipment and
services required for the modernization of
distribution and transmission systems, and ICT.
This sector is gaining a renewed focus on
investment due to reliability enhancement,
connecting to renewables, demand shifts, cost
increases, and market reforms that create more
options for independent generators and as such
require new connections to transmission
systems. 211
Nuclear
As of December 1, 2016, there were 99 operating
nuclear reactors at 61 nuclear power plants in
the United States. The R. E. Ginna Nuclear Power
Plant in New York is the smallest nuclear plant in
the United States, and it has one reactor with an
electricity generating capacity at 508 megawatts
(MW). The Palo Verde nuclear power plant in
Arizona has three reactors and has the largest
combined electricity generating capacity of
about 3,937 MW.
209
EIA 210
US Department of Energy 211
https://www.selectusa.gov/energy-industry-united-states
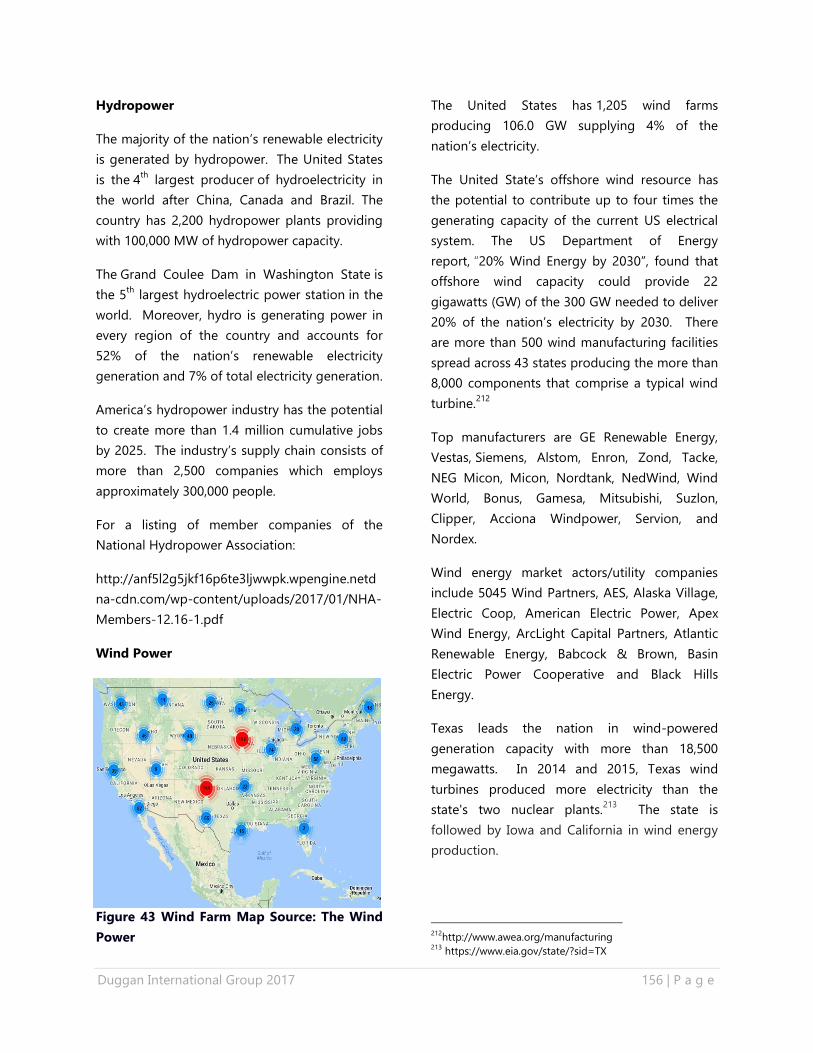
Duggan International Group 2017 156 | P a g e
Hydropower
The majority of the nation’s renewable electricity
is generated by hydropower. The United States
is the 4th
largest producer of hydroelectricity in
the world after China, Canada and Brazil. The
country has 2,200 hydropower plants providing
with 100,000 MW of hydropower capacity.
The Grand Coulee Dam in Washington State is
the 5th
largest hydroelectric power station in the
world. Moreover, hydro is generating power in
every region of the country and accounts for
52% of the nation’s renewable electricity
generation and 7% of total electricity generation.
America’s hydropower industry has the potential
to create more than 1.4 million cumulative jobs
by 2025. The industry’s supply chain consists of
more than 2,500 companies which employs
approximately 300,000 people.
For a listing of member companies of the
National Hydropower Association:
http://anf5l2g5jkf16p6te3ljwwpk.wpengine.netd
na-cdn.com/wp-content/uploads/2017/01/NHA-
Members-12.16-1.pdf
Wind Power
Figure 43 Wind Farm Map Source: The Wind
Power
The United States has 1,205 wind farms
producing 106.0 GW supplying 4% of the
nation’s electricity.
The United State’s offshore wind resource has
the potential to contribute up to four times the
generating capacity of the current US electrical
system. The US Department of Energy
report, “20% Wind Energy by 2030”, found that
offshore wind capacity could provide 22
gigawatts (GW) of the 300 GW needed to deliver
20% of the nation’s electricity by 2030. There
are more than 500 wind manufacturing facilities
spread across 43 states producing the more than
8,000 components that comprise a typical wind
turbine.212
Top manufacturers are GE Renewable Energy,
Vestas, Siemens, Alstom, Enron, Zond, Tacke,
NEG Micon, Micon, Nordtank, NedWind, Wind
World, Bonus, Gamesa, Mitsubishi, Suzlon,
Clipper, Acciona Windpower, Servion, and
Nordex.
Wind energy market actors/utility companies
include 5045 Wind Partners, AES, Alaska Village,
Electric Coop, American Electric Power, Apex
Wind Energy, ArcLight Capital Partners, Atlantic
Renewable Energy, Babcock & Brown, Basin
Electric Power Cooperative and Black Hills
Energy.
Texas leads the nation in wind-powered
generation capacity with more than 18,500
megawatts. In 2014 and 2015, Texas wind
turbines produced more electricity than the
state's two nuclear plants.213
The state is
followed by Iowa and California in wind energy
production.
212
http://www.awea.org/manufacturing 213
https://www.eia.gov/state/?sid=TX
Duggan International Group 2017 157 | P a g e
Massachusetts is creating a new offshore wind
farm; call for bids are expected in June 2017. The
first solicitation of the 1,600 MW mandated in
state legislation could be anywhere from 200
MW to 800 MW. The draft RFP will be submitted
to the Massachusetts Department of Public
Utilities (DPU) and be available as a public
document via the DPU. The state expects three
developers to compete in the solicitation —
DONG Energy, Deepwater Wind and Vineyard
Wind — with the winner entering into a power
purchase agreement by the middle of next
year.214
Maryland is also ramping up its wind energy
industry and state officials refer to offshore wind
as the ‘Space Race.’ The state is positioning
itself to become the supply chain hub for the
offshore wind sector. Maryland is strategically
located at the heart of the mid-Atlantic and its
Port of Baltimore is one of America’s busiest
international deep-water ports, now equipped
with supersized Panamax cargo cranes and 50-
foot-deep channels. The state government
recently announced two new grant programs to
help prepare Maryland’s local businesses
entering the offshore wind industry and to help
prepare Maryland’s labor force.215
Geothermal Energy
Geothermal power plants are largely
concentrated in the western states. They are the
4th
largest source of renewable electricity,
after hydroelectricity, biomass, and wind power.
A geothermal resource assessment shows that
nine western states together have the potential
214
http://www.renewableenergyworld.com 215
http://news.maryland.gov/mea/2017/04/20/maryland-
energy-administration-director-tung-declares-offshore-
wind-is-marylands-space-race/
to provide over 20% of national electricity
needs.216
The largest group of geothermal power plants in
the world is located at The Geysers, a
geothermal field in California. The United States
generates an average of 15 billion kilowatt hours
of geothermal power per year, comparable to
burning some 25 million barrels (4,000,000 m3)
of oil or 6 million short tons of coal per year.
Tidal Energy
Ocean Renewable Power Company (ORPC) is
developing power from the Bay of Fundy in
Maine. The project, the Western Passage Tidal
Energy, will feature 15 double TidGen TGU
hydrokinetic tidal devices, each consisting of a
500kW turbine-generator unit. The project is
said to produce an average annual power
generation of 2.6 to 3.5GWh.217
In another area of the country, the US
Department of Energy announced in December
2016 the award of up to $40 million (subject to
appropriations) to design, permit, and construct
an open-water, grid-connected national wave
energy testing facility. The facility will be
constructed in Newport, Oregon, by the
Northwest National Marine Renewable Energy
Center at Oregon State University and will
support innovations in wave energy
technologies capable of harnessing the
significant wave energy resources along United
States coastlines.218
216
https://en.wikipedia.org/wiki/Geothermal_energy_in_the_U
nited_States 217
http://tidalenergytoday.com/2017/01/05/orpc-shows-
progress-on-maine-tidal-project/ 218
https://energy.gov/articles/energy-department-
announces-investment-wave-energy-test-facility
Duggan International Group 2017 158 | P a g e
Biomass
In 2015, approximately 4.7 quadrillion British
thermal units of energy derived from biomass
were consumed in the United States. US biomass
energy production is expected to grow to 5.6
quadrillion British thermal units in 2040. Net
electricity generation of wood and wood-derived
fuels came to a little under 42 gigawatt hours in
2015, making it the 2nd
largest non-hydroelectric
renewable energy source after wind. 219
Biofuels
In 2015, US biofuel production grew to about 31
million metric tons of oil equivalent, up from
about three million metric tons in 2000.
The United States is the world's largest producer
of ethanol, having produced nearly 15 billion
gallons in 2015 alone.220
Most gasoline in the
US contains 10% ethanol by volume. However, if
the Renewable Fuel Standard (RFS) requirements
continue to be implemented, the US could
exceed this level of ethanol in the fuel mix.221
The US attributes ethanol to transforming the
nation from depending on imports to a refined
petroleum products net exporter.222
One new project to note is the US technology
company, D3MAX, has announced that its
cellulosic ethanol technology is helping ACE
Ethanol to produce higher yields from corn fiber.
Installed at ACE Ethanol, LLC, in Stanley,
Wisconsin, the testing of the patented D3MAX
corn fiber-to-ethanol process and technology is
219
https://www.statista.com/topics/1000/biomass-energy/ 220
http://www.afdc.energy.gov/ 221
http://www.api.org/news-policy-and-issues/fuels-and-
renewable-policy 222
http://biofuels-news.com
display_news/12164/londonbased_investment_firm_may_inve
st_E160m_in_danish_secondgeneration_bioethanol_project/
underway with testing to be complete by June of
2017.223
Solar Power
In terms of total installed capacity, by year end
2015 the USA ranked 4th
in the world behind
China, Germany, and Japan. In 2016, 39% of all
new electricity generation capacity in the
country came from solar, more than any other
source and ahead of natural gas (29%).224
As of
the end of 2016, the US had 40 gigawatts (GW)
of installed photovoltaic capacity, having almost
doubled in capacity from the previous year. In
the 12 months through January 2017, utility
scale solar power generated 35.5 terawatt-
hours (TWh), 0.92% of total US electricity.
Furthermore, the US has some of the largest
solar farms in the world. California has
traditionally dominated the US solar market with
35% market share in 2016. The state’s biggest
farm is Solar Star, a 579 megawatt farm near
Rosamond, California. Other markets are
continuing to expand, including Massachusetts,
Utah, and New York. According to the US Solar
Industry Association, future growth in the
industry will take place in Texas.
Nearly 260,000 Americans work in solar in more
than 9,000 companies throughout the country.
By 2021, employment is set to grow to more
than 360,000.225
223
http://biofuels-news.com 224
US Solar Market Grows 95% in 2016, Smashes Records,
Greentech Media, Mike Munsell, February 15, 2017 225
http://www.seia.org/research-resources/solar-industry-
data
Duggan International Group 2017 159 | P a g e
OPPORTUNITIES FOR NOVA SCOTIA
EXPORTERS
Best Prospects:
Tidal and wave energy technology
transfer with Maine and other parts of
coastal US, as the country is investing
millions in new wave energy
technologies
Collaboration projects with the
Northwest National Marine Renewable
Energy Center at Oregon State
University
Construction and design services
polyethylene plants
Subcontract opportunities in
Massachusetts wind energy project
New hydropower projects are rumored, and
President Trump has publically stated that he is a
supporter of hydropower. A legislative hearing
held the second week of April 2017 by the US
House Committee on Natural Resources'
Subcommittee on Water, Power and Oceans
could open some Bureau of Reclamation
facilities for non-federal pumped storage
development. If approved, the official House
Resolution would stimulate non-federal pumped
storage hydropower development in the 17
western states.226
Nova Scotia companies would have to follow
any new announcements to come. The
hydropower industry hires project developers,
construction companies, architecture,
engineering firms, electricians, component
manufacturers and biologists.
226
http://www.renewableenergyworld.com/articles/2017/04/p
roposal-could-open-reclamation-facilities-for-non-federal-
pumped-storage-development.html
GOVERNMENT POLICIES/REGULATIONS
THAT ENCOURAGE SUSTAINABLE
TECHNOLOGIES
The Clean Power Plan (CPP) was unveiled by
President Obama and the EPA in 2016. The
purpose of the plan was to reduce greenhouse
gas emissions by 32% from 2005 levels by 2030.
This goal would have been accomplished
through a combination of new renewable
generation and a shift away from fossil fuels,
particularly coal. Sixteen states opposed the
plan and the new Trump Administration signed
the "Energy Independence Executive Order" to
roll back the CPP and the removal of greenhouse
gas emissions from permitting review under the
National Environmental Policy Act and the
removal of a moratorium on new coal leases on
federal lands. 227
Nonetheless, federal tax credits for solar and
wind has probably been the single biggest
pieces of policy favoring renewables. The
policies have received extensions but are also
slated to be ramped down, and there is some
risk that that reduction schedule may be
accelerated under the Trump administration.228
In driving the sustainable energy transition, state
policies will be crucial. For example, the
Renewable Portfolio Standards (RPS) has been a
key tool in driving the wind and solar build.
States also use Energy Efficiency Resource
Standards (EERS) to encourage energy savings,
and determine net energy metering policies.
This policy is important for distributed solar. As
well, the 2017-Sustainable-Energy-in-America-
Factbook by Bloomberg New Energy Finance,
227
http://www.hydroworld.com/articles/2017/03/breaking-
trump-signs-executive-order-rolling-back-clean-power-
plan.html 228
http://money.usnews.com/investing/articles/2016-12-
23/solar-wind-investments-in-a-trump-presidency
Duggan International Group 2017 160 | P a g e
reported a number of states made sweeping
changes to these policies. Some of these include:
Massachusetts set a mandate for 1.6GW
of offshore wind by 2027, along with a
requirement that the state’s utilities
procure 9.45TWh of clean energy
through long-term contracts and an
authorization for the state to set a
storage target. Meanwhile, the state
Supreme Court ruled that Massachusetts
has not taken enough action on
greenhouse gas emissions. In response,
the state’s Republican governor has
proposed to raise the RPS target to 80%
by 2050 and limit emissions from the
transportation sector for the first time,
among other recommendations.
New York, where the state’s “Reforming
the Energy Vision” progressed with the
adoption of a new Clean Energy
Standard which formalizes a renewable
energy generation target of 50% by
2030, as well as a zero-emissions credit
program to support three of the state’s
struggling nuclear facilities. Additionally,
Westchester Smart Power became the
state’s first Community Choice
Aggregation (CCA) program, following
the Public Service Commission’s 2015
order authorizing CCAs, and the state
approved $40m of financing for
feasibility studies on micro-grid
resiliency projects.
California state law SB-32, which was
passed in 2016, requires statewide
greenhouse gas emissions to be 40%
below the 1990 level by 2030. This law
has cross-cutting effects in California,
particularly on electricity and
transportation emissions, and also has
national implications because of the size
of California’s energy market.
RENEWABLE ENERGY REQUIREMENTS AND
INCENTIVES
Federal, state, and local governments and
electric utilities encourage investing in and using
renewable energy, and in some cases, require it.
Many programs and incentives are currently
available. The Database of State Incentives for
Renewable Energy and Efficiency (DSIRE) is a
comprehensive source for information about the
types and status of government and utility
requirements and incentives for renewable
energy.229
http://www.dsireusa.org/
FUNDING INCENTIVES
The North American Free Trade Agreement
(NAFTA) with the USA gives Canadians a benefit
for exporting goods and services.
The following companies have access to EDC
funding to buy Canadian goods and services:
Alon Energy USA, Inc.
AT&T Inc.
Baker Hughes Incorporated
Chesapeake Oilfield Operating, L.L.C
Chevron Phillips Chemical Company LLC
ConocoPhillips
Continental Resources, Inc.
Cummins Inc.
DCP Midstream, LLC
Devon Energy Corporation
HollyFrontier Corporation
Murphy Oil Corporation
National Oilwell Varco, Inc.
Noble Energy, Inc.
Phillips 66 Company
QEP Resources
Schlumberger Holdings Corporation
Spectra Energy Corporation
229
https://www.eia.gov/energyexplained/index.cfm?page=ren
ewable_home#tab3
Duggan International Group 2017 161 | P a g e
The US Department of Energy has many funding
programs for US companies. Nova Scotia firms
would need to partner with a US firm.
Please review the EERE Funding Opportunity
Exchange. https://eere-
exchange.energy.gov/default.aspx#FoaIdec50c7
4b-254b-41f5-a6ab-6b875884f9c2
OTHER SOURCES OF INFORMATION
EIA US Energy Information Administration
www.eia.gov
Houston Business Journal
http://www.bizjournals.com/houston/news/
Irena Renewable Energy Prospects 2015
http://www.irena.org/menu/index.aspx?mnu=Su
bcat&PriMenuID=36&CatID=141&SubcatID=59
Rig Zone – News www. Rigzone.com
Oil & Gas Journal www.ogi.com
Practical Law. Oil and gas regulation in the
United States: Overview 2016,
http://ca.practicallaw.com/9-525-
1545?source=relatedcontent
Bloomberg Finance L.P., 2017 Sustainable Energy
in America.
http://www.bcse.org/sustainableenergyfactbook/
NOTES:
Duggan International Group 2017 162 | P a g e
DISCLAIMER
This Report was prepared by the Duggan International Group. The
company does not endorse or guarantee the performance or
suitability of any introduced party or accept liability for the accuracy
or usefulness of any information contained in this Report. Please use
commercial discretion to assess the suitability of any business
introduction or goods and services offered or investment when
assessing your business needs. The information presented in this
report is drawn from secondary sources that are available to the
public. Darlene T. Duggan, Darlene Duggan International Marketing
Services and the Duggan International Group does not accept
liability for any loss associated with the use of any information and
any reliance is entirely at the user’s discretion. The information
compiled in this report took place in March 2017 with updates
mostly in April 2017.
www.dugganinternational.ca