Notifiable Conditions Health Care Facilities
87
2019 Communicable Disease Report February 2022 Revision DOH 420-004 Prepared by Disease Control and Health Statistics Office of Communicable Disease Epidemiology
Transcript of Notifiable Conditions Health Care Facilities

2019 Communicable Disease Report
February 2022 Revision DOH 420-004
Prepared by Disease Control and Health Statistics Office of Communicable Disease Epidemiology

For persons with disabilities, this document is available in other formats. Please call 800-525-0127 (TTY 711) or email [email protected].
Publication Number 420-004 For more information or additional copies of this report: Disease Control and Health Statistics Office of Communicable Disease Epidemiology 1610 NE 150th Street Shoreline, WA 98155 206-418-5500 206-364-1060 (fax) [email protected]

Report Reviewers
Wayne Turnberg, PhD, MSPH Director, Office of Communicable Disease Epidemiology
Elizabeth Crutsinger-Perry, MSSW, MA Director, Office of Infectious Disease
Scott Lindquist, MD, MPH State Epidemiologist for Communicable Diseases
This report represents Washington State communicable disease surveillance, the ongoing collection, analysis and dissemination of morbidity and mortality data to prevent and control communicable disease.
Department of Health staff from the following offices and programs contributed to this report:
• Office of Communicable Disease Epidemiology • Office of Infectious Disease • Washington State Public Health Laboratories
We’d also like to acknowledge and extend our thanks and appreciation to Washington’s local health jurisdictions who contribute to surveillance, investigation, and prevention of communicable diseases in our state, and to the thousands in clinics, hospitals and clinical laboratories throughout Washington whose disease reports are the basis for this document.

1
Contents Executive Summary.............................................................................................................................. 3
Technical Notes ............................................................................................................................ 3
Reporting a Notifiable Condition........................................................................................................ 4
Disease Incidence and Mortality Rates............................................................................................ 10
Appendix I: Other Tables ................................................................................................................... 61
Foodborne Disease Outbreaks 2019 ........................................................................................ 62
Foodborne Outbreaks 1986-2019 ............................................................................................ 69
Haemophilus influenzae 2010-2019 ......................................................................................... 70
Meningococcal Disease (Invasive) 2010-2019 ........................................................................ 71
Highly Antibiotic Resistant Organism Surveillance 2012-2019 ............................................. 72
Rabid Non-Bat Animals and Rabies Strains in Washington 1987-2019................................ 73
Washington State Bats Tested for Rabies 2015-2019 ............................................................ 74
Washington State Animals Tested for Rabies 1988-2019 ...................................................... 75
Rare Diseases of Public Health Significance 2016-2019 ......................................................... 76
Waterborne Disease Outbreaks 1992-2019 ............................................................................ 77
Appendix II: Influenza Summary ...................................................................................................... 78
Appendix III: State Demographics .................................................................................................... 79
Washington State Population Estimates 1985-2019 .............................................................. 80
Washington State Population Estimates by County 2019 ..................................................... 81
Washington State Population by Age and Sex 2019 .............................................................. 82

2

3
Executive Summary This report summarizes notifiable communicable diseases reported by local health jurisdictions to the Department of Health (DOH) in 2019. The most common reports continue to be sexually transmitted conditions, chronic hepatitis, diarrheal infections, pertussis, and tuberculosis.
Technical Notes Washington Administrative Code (WAC) Chapters 246-100 and 246-101 outline disease reporting requirements: health care providers and facilities, laboratories, veterinarians, food service establishments, childcare facilities and schools must report certain communicable diseases to the local health jurisdiction or DOH. Cases of communicable notifiable conditions are included in this annual report if they met the following criteria*:
1. Resident of Washington. 2. Qualifying event dates during the 2019 CDC Year (December 30, 2018 – December 28,
2019). 3. Report entered by November 1, 2020 for common condition (>10 cases per year). 4. Reported to DOH prior to November 1, 2020 for uncommon condition (≤10 cases per
year). 5. First report of very rare conditions (zero to two cases per year) received by DOH after
the previous year’s deadline. 6. Given a valid DOH case classification by DOH (see: guidelines for each condition.)
Typically, a fraction of the actual number of cases are reported to a surveillance system. Infected persons may: be unaware of being infected, be symptomatic but have not contacted a health care provider, not be confirmed with appropriate tests, or not be reported after the diagnostic testing. Data for reported cases was finalized in the year 2020 and data completeness may have been impacted by the COVID-19 pandemic.
Summary tables with incidence and mortality rates reflect years when data are reliable. Population estimates for rate calculations are from the Washington State Office of Financial Management. Previously reported rates for 2000 through 2010 were updated using population estimates based on the 2010 decennial census. County rates are not provided for fewer than five reported cases.
This report is available online on DOH’s website. Additional information on communicable disease surveillance and case investigation in Washington is available on DOH’s website under List of Notifiable Conditions.
*The inclusion criteria for HIV, hepatitis B, hepatitis C, and sexually transmitted diseases cases in this report can be found in the footnotes underneath each individual data table.

4
Reporting a Notifiable Condition In accordance with Washington State rule, chapter 246-101 WAC, public health and health care professionals should report most notifiable conditions to the local health jurisdiction in the county of the patient’s residence. Disease reporting telephone numbers for each local health jurisdiction are provided on DOH’s website. If no one is available at the local health jurisdiction and a condition is immediately notifiable or is notifiable to DOH, please call the 24-hour reporting line: 877-539-4344 or 206-418-5500. For a complete list of notifiable conditions for health care providers, hospitals, laboratories and veterinarians, please refer to the corresponding reporting posters available on the DOH website, How to Report – Posters.
Note that the date for changes in chapter 246-101 WAC to take effect has been amended to January 1, 2023.

DOH 420-007 (Rev. 10/18)
Anthrax
Botulism (foodborne, wound, infant)
Cholera
Diphtheria
Disease of suspected bioterrorism origin
Emerging condition with outbreak potential
Influenza, novel strain
Measles (rubeola)
Paralytic shellfish poisoning
Plague
IMMEDIATELY NOTIFIABLE: (suspect or confirmed cases) Notifiable to the Office of Communicable Disease Epidemiology: 1-877-539-4344
Poliomyelitis
Rabies, human
SARS
Smallpox
Tularemia
Viral hemorrhagic fever
Yellow fever
Outbreak, or suspected outbreak, of illness due to infectious agent or toxin
Arboviral disease (Zika, West Nile virus disease, dengue, eastern and western equine encephalitis, etc.)
Brucellosis
Burkholderia mallei or pseudomallei
Campylobacteriosis
Cryptosporidiosis
Cyclosporiasis
Enterohemorrhagic E. coli (see Shiga toxin-producing E. coli)
Giardiasis
Haemophilus influenzae invasive disease
Hantavirus pulmonary syndrome
Hepatitis A, acute
Hepatitis B, acute
Hepatitis B, chronic
Hepatitis D, acute
Hepatitis D, chronic
Hepatitis E, acute
Influenza-associated death (lab-confirmed)
Legionellosis
Leptospirosis
Listeriosis
Lyme disease
Malaria
Meningococcal disease
Monkeypox
Mumps
Pertussis
Prion disease, including Creutzfeldt-Jakob disease (CJD)
Psittacosis
If bioterrorism is suspected, case must be immediately reported.
Notifiable within 7 days of case investigation completion or summary information required within 21 days of initial notification for the following:
Notifiable to Infectious Disease Assessment: 360-236-3464
Acquired immunodeficiency syndrome (AIDS) (including AIDS in persons previously reported with HIV infection)
Chancroid
Chlamydia trachomatis
Gonorrhea
Granuloma inguinale
Hepatitis C, acute
Hepatitis C, chronic
Herpes simplex
HIV infection
Lymphogranuloma venereum
Syphilis
Notifiable to TB Reporting Fax Line: 206-364-1060
Tuberculosis
Notifiable to Immunization Program CHILD Profile
Fax: 360-236-3590
Hepatitis B, surface antigen-positive pregnant women
Immunization reactions (severe, adverse)
Q Fever
Rabies, suspected human exposure
Relapsing fever
Rubella
Salmonellosis
Shiga toxin-producing E. coli infections (enterohemorrhagic E. coli including but not limited to E. coli O157:H7)
Shigellosis
Tetanus
Trichinosis
Typhoid fever
Vaccinia transmission
Vancomycin-resistant Staphylococcus aureus (does not include vancomycin-intermediate)
Varicella-associated death
Vibriosis
Yersiniosis
Other rare diseases of public health significance, including but not limited to: Amoebic meningitis Anaplasmosis Babesiosis Carbepenemase-producing carbepenem- resistant Enterobacteriaceae (CP-CRE) Chagas disease Coccidioidomycosis Cryptococcus gattii Ehrlichiosis Histoplasmosis Shellfish poisoning (diarrhetic) Tickborne rickettsioses (including Rocky Mountain spotted fever) Tick paralysis Typhus
Unexplained critical illness or death
Notifiable to the Office of Communicable Disease Epidemiology: 1-877-539-4344
Notifiable Conditions Reporting
Notifiable to the Washington State Department of Health
LOCAL HEALTH JURISDICTIONS
The conditions listed above are notifiable to the Washington State Department of Health in accordance with WAC 246-101.
The 2011 revision of WAC 246-101-010 states “‘Other rare diseases of public health significance’ means a disease or condition, of general or international public health concern, which is occasionally or not ordinarily seen in the state of Washington including, but not limited to, spotted fever rickettsiosis, babesiosis, tick paralysis, anaplasmosis, and other tick borne diseases. This also includes public health events of international concern and communicable diseases that would be of general public concern if detected in Washington.”

The conditions listed above are notifiable to public health authorities in ac-cordance with WAC 246-101.
• Report to the local health jurisdiction of the patient’s residence within the timeframe indicated (except for conditions followed by a reporting phone num-ber).
• ‘Other rare diseases of public health significance’ means a disease or condition, of
general or international public health concern, which is occasionally or not ordi-
narily seen in the state of Washington including, but not limited to, spotted fever
rickettsiosis, babesiosis, tick paralysis, anaplasmosis, and other tick borne diseas-
es. This also includes public health events of international concern and communi-
cable diseases that would be of general public concern if detected in Washington.
IMMEDIATELY NOTIFIABLE: Requires a phone call to reach a live person at the local health jurisdiction, 24/7. Must be reported as soon as clinically suspected.
Animal bites, when human exposure to rabies is suspected
Anthrax
Botulism (foodborne, wound and infant)
Burkholderia mallei (glanders) and pseudomallei (melioidosis)
Cholera
Diphtheria
Disease of suspected bioterrorism origin
Domoic acid poisoning (amnesic shellfish poisoning)
E. coli – refer to “Shiga toxin-producing E. coli infections”
Emerging condition with outbreak potential
Haemophilus influenzae (invasive disease, children <5 years)
Influenza, novel or unsubtypable strain
Measles (rubeola), acute
Meningococcal disease (invasive)
Monkeypox
Outbreaks of suspected foodborne origin
Outbreaks of suspected waterborne origin
Paralytic shellfish poisoning
Pesticide poisoning—hospitalized, fatal, or cluster: 1-800-222-1222
Plague
Poliomyelitis
Rabies, confirmed human or animal
Rabies, suspected human exposure
Rubella (include congenital rubella syndrome), acute
SARS (Severe Acute Respiratory Syndrome)
Shiga toxin-producing E. coli infections (STEC, including but not limited to E. coli O157:H7; also includes post-diarrheal hemolytic uremic syndrome)
Smallpox
Tuberculosis
Tularemia
Vaccinia transmission
Viral hemorrhagic fever
Yellow fever
Notifiable within 3 business days
Acquired immunodeficiency syndrome (AIDS), including in persons previ-ously reported with HIV infection
Arboviral disease (acute disease only, including: West Nile virus, dengue, eastern & western equine encephalitis, Zika, etc.)
Campylobacteriosis
Chancroid
Chlamydia trachomatis infection
Cryptosporidiosis
Cyclosporiasis
Giardiasis
Gonorrhea
Granuloma inguinale
Hepatitis B, surface antigen positive pregnant women
Hepatitis C, acute
Hepatitis D, acute and chronic
Herpes simplex, neonatal and genital (initial infection only)
HIV infection
Immunization reactions (severe, adverse)
Influenza-associated death, laboratory-confirmed
Lyme disease
Lymphogranuloma venereum
Malaria
Pesticide poisoning-non-hospitalized, non-fatal, non-cluster: 1-800-222-1222
Prion disease, including Creutzfeldt-Jakob disease (CJD)
Syphilis (including congenital)
Tetanus
Trichinosis
Varicella-associated death
Notifiable within 24 hours: Requires a phone call if reporting after normal public health business hours
Brucellosis
Hantavirus pulmonary syndrome
Hepatitis A, acute
Hepatitis B, acute
Hepatitis E, acute
Legionellosis
Leptospirosis
Listeriosis
Mumps, acute
Pertussis
Psittacosis
Q fever
Relapsing fever (borreliosis)
Salmonellosis
Shigellosis
Vancomycin-resistant Staphylococcus aureus (not to include Vancomycin-intermediate)
Vibriosis
Yersiniosis
Other rare diseases of public health significance, including but not limited to: Amoebic meningitis Anaplasmosis Babesiosis Carbepenemase-producing carbepenem-resistant Enterobacteriaceae (CP-CRE) Chagas disease Coccidioidomycosis Cryptococcus gattii Ehrlichiosis Histoplasmosis Shellfish poisoning (diarrhetic) Tickborne rickettsioses (including Rocky Mountain spotted fever) Tick paralysis Typhus
Unexplained critical illness and death
Notifiable on a monthly basis
Asthma, occupational (suspected or confirmed): 1-888-66-SHARP
Birth defects: 360-236-3533
(autism spectrum disorders, cerebral palsy, alcohol-related birth
defects)
Hepatitis B, chronic (initial diagnosis/previously unreported cases)
Hepatitis C, chronic
Notifiable Conditions
Notifiable to the local health jurisdiction (LHJ) of the patient’s residence Phone numbers by LHJ are listed on the other side of this poster. If unable to reach the LHJ of the patient’s residence, please call: 1-877-539-4344
HEALTH CARE PROVIDERS
For more information, see WAC 246-101 or http://www.doh.wa.gov/PublicHealthandHealthcareProviders/NotifiableConditions.aspx DOH 210-001 (Rev. 11/16)

The conditions listed above are notifiable to public health authorities in accord-ance with WAC 246-101. When a condition occurs in or is treated by the health care facility:
• Report to the local health jurisdiction of the patient’s residence within the timeframe indicated (except for conditions followed by a reporting phone number).
• ‘Other rare diseases of public health significance’ means a disease or condition, of general or international public health concern, which is occasionally or not ordinari-ly seen in the state of Washington including, but not limited to, spotted fever rick-ettsiosis, babesiosis, tick paralysis, anaplasmosis, and other tick borne diseases. This also includes public health events of international concern and communicable diseases that would be of general public concern if de-tected in Washington.
Notifiable Conditions
For more information, see WAC 246-101 or http://www.doh.wa.gov/PublicHealthandHealthcareProviders/NotifiableConditions.aspx DOH 420-027 (Rev. 11/16)
IMMEDIATELY NOTIFIABLE: Requires a phone call to reach a live per-son at the local health jurisdiction, 24/7
Must be reported as soon as clinically suspected
Animal bites, when human exposure to rabies is suspected
Anthrax
Botulism (foodborne, infant, and wound)
Burkholderia mallei (glanders) and pseudomallei (melioidosis)
Cholera
Diphtheria
Disease of suspected bioterrorism origin
Domoic acid poisoning (amnesic shellfish poisoning)
E. coli – refer to “Shiga toxin-producing E. coli infections”
Emerging condition with outbreak potential
Haemophilus influenzae (invasive disease, children < 5 years)
Influenza, novel or unsubtypable strain
Measles (rubeola), acute
Meningococcal disease (invasive)
Monkeypox
Outbreaks of suspected foodborne origin
Outbreaks of suspected waterborne origin
Paralytic shellfish poisoning
Plague
Poliomyelitis
Rabies, confirmed human or animal
Rabies, suspected human exposure
Rubella (include congenital rubella syndrome), acute
SARS (Severe Acute Respiratory Syndrome)
Shiga toxin-producing E. coli infections (STEC, including but not limited to E. coli O157:H7; also includes post-diarrheal hemolytic uremic syndrome)
Smallpox
Tuberculosis
Tularemia
Vaccinia transmission
Viral hemorrhagic fever
Yellow fever
Notifiable within 3 business days
Acquired immunodeficiency syndrome (AIDS), including in persons previ-ously reported with HIV infection
Arboviral disease (acute disease only, including: West Nile virus, dengue, eastern & western equine encephalitis, Zika, etc.)
Campylobacteriosis
Chancroid
Chlamydia trachomatis
Cryptosporidiosis
Cyclosporiasis
Giardiasis
Gonorrhea
Granuloma inguinale
Hepatitis B, surface antigen positive pregnant women
Hepatitis C, acute
Hepatitis D, acute and chronic
HIV infection
Immunization reactions (severe, adverse)
Influenza-associated death, laboratory-confirmed
Lyme disease
Lymphogranuloma venereum
Malaria
Pesticide poisoning- non-hospitalized, non-fatal, non-cluster:1-800-222-1222
Prion disease, including Creutzfeldt-Jakob disease (CJD)
Serious adverse reactions to immunizations
Syphilis, including congenital
Tetanus
Trichinosis
Varicella-associated death
Notifiable to the local health jurisdiction (LHJ) of the patient’s residence Phone numbers by LHJ are listed on the other side of this poster. If unable to reach the LHJ of the patient’s residence, please call: 1-877-539-4344
HEALTH CARE FACILITIES
Notifiable within 24 hours: Requires a phone call if reporting after normal public health business hours
Brucellosis
Hantavirus pulmonary syndrome
Hepatitis A, acute
Hepatitis B, acute
Hepatitis E, acute
Legionellosis
Leptospirosis
Listeriosis
Mumps, acute
Pertussis
Psittacosis
Q fever
Relapsing fever (borreliosis)
Salmonellosis
Shigellosis
Vancomycin-resistant Staphylococcus aureus (not to include Vancomycin-intermediate)
Vibriosis
Yersiniosis
Other rare diseases of public health significance, including but not limited to: Amoebic meningitis Anaplasmosis Babesiosis Carbepenemase-producing carbepenem-resistant Enterobacteriaceae (CP-CRE) Chagas disease Coccidioidomycosis Cryptococcus gattii Ehrlichiosis Histoplasmosis Shellfish poisoning (diarrhetic) Tickborne rickettsioses (including Rocky Mountain spotted fever) Tick paralysis Typhus
Unexplained critical illness or death
Notifiable on a monthly basis
Asthma, occupational (suspected or confirmed): 1-888-66SHARP
Birth defects: 360-236-3533 (abdominal wall defects, autism spectrum disorders, cerebral palsy, Down syndrome, alcohol-related birth defects, hypospadias, limb reductions, neural tube defects, oral clefts)
Cancer, see WAC 246-430
Gunshot wounds: Reporting form
Hepatitis B, chronic (initial diagnosis/previously unreported cases)
Hepatitis C, chronic
Hospital laboratories, refer to the Laboratories Notifiable Conditions Poster.

The laboratory results listed above (preliminary or confirmed) are notifiable to public health authorities in Washington in accordance with WAC 246-101.
Information provided with public health notifications and specimen submissions must include: specimen type; name and telephone number of laboratory; date specimen collected and received; requesting health care provider’s name and phone number; test result; and name of patient. Also required when available in the lab database are: patient sex, date of birth or age, full patient address (zip code at a minimum), and health care provider address.
Per WAC 246-101-201(3), LHJs may request laboratory reporting of additional test results pertinent to an investigation of a notifiable condition.
BACTERIA
Bacillus anthracis (anthrax)
Bordetella pertussis (pertussis)
Borrelia burgdorferi (Lyme disease)
Borrelia hermsii or B. recurrentis (Relapsing fever, tick- or louseborne)
Brucella species (brucellosis)
Burkholderia mallei and B. pseudomallei
Campylobacter species (campylobacteriosis)
Chlamydia (chlamydophila) psittaci (psittacosis)
Chlamydia trachomatis
Clostridium botulinum (botulism)
Corynebacterium diphtheriae (diphtheria)
Coxiella burnetii (Q fever)
E. coli (refer to “Shiga toxin-producing E. coli”)
Francisella tularensis (tularemia)
Haemophilus influenzae (children < 5 years)
Legionella species (legionellosis)
Leptospira species (leptospirosis)
Listeria monocytogenes (listeriosis)
Neisseria gonorrhoeae (gonorrhea)
Neisseria meningitidis (meningococcal disease)
Salmonella species (salmonellosis, typhoid fever)
Shiga toxin-producing E. coli (STEC, including but not limited to E. coli O157:H7)
Shigella species (shigellosis)
Treponema pallidum (syphilis)
Vancomycin-resistant Staphylococcus aureus
Vibrio cholerae O1 or O139 (cholera)
Vibrio species (vibriosis)
Yersinia enterocolitica or Y. pseudotuberculosis
Yersinia pestis (plague)
FUNGI Cryptococcus, non-neoformans
PARASITES Cryptosporidium (cryptosporidiosis)
Cyclospora cayetanensis (cyclosporiasis)
Giardia lamblia (giardiasis)
Plasmodium species (malaria)
Trichinella species (trichinellosis)
VIRUSES Arboviruses, acute, by viral isolation or IgM or PCR positivity (West Nile virus, eastern and western equine encephalitis, dengue, St. Louis encephalitis, La Crosse encephalitis, Japanese encephalitis, Powassan, chikungunya, Zika*) *both positive and negative results are requested for Zika
Coronavirus (SARS-associated)
Hantavirus
Hepatitis A virus, acute, by IgM positivity (include hepatocellular enzyme levels in report)
Hepatitis B virus, acute, by IgM positivity
Hepatitis B virus: HBsAg, HBeAg, and HBV DNA
Hepatitis C virus
Hepatitis D virus
Hepatitis E virus
Influenza virus, novel or unsubtypable strain
Measles virus (rubeola), acute, by IgM or PCR positivity
Mumps virus, acute, by IgM or PCR positivity
Poliovirus, acute, by IgM or PCR positivity
Rabies virus (human or animal)
Variola virus (smallpox)
Viral hemorrhagic fever Arenaviruses, bunyaviruses, filoviruses, flaviviruses
Yellow fever virus
Reportable as rare diseases of public health significance*
Coccidioides
Carbapenem-resistant Enterobacteriaceae (CRE), resistant
to ≥1 carbapenem, using M100-S25 CLSI breakpoints
Carbapenemase-producing CRE
Notifiable to the Department of Health (DOH)
Blood lead level (elevated)
Blood lead level (non-elevated)
CD4 + (T4) lymphocyte counts and/or CD4 + (T4) (patients aged 13 and older)
Human immunodeficiency virus (HIV) infection (for example, positive Western Blot, p24 antigen, or viral culture tests)
Human immunodeficiency virus (HIV) infection (all viral load detection test results—detectable and undetectable)
Mycobacterium tuberculosis (tuberculosis)
Notifiable to the DOH Lead Program Contact phone: 360-236-4280
Notifiable to the DOH Office of Infectious Disease Contact phone: 360-236-3464
Notifiable to the DOH Tuberculosis Program Fax: 206-364-1060
Antibiotic sensitivity testing (first isolates only)
Immediately notifiable—requires a phone call to reach a live person at the LHJ, 24/7
Notifiable within 24 hours: Requires phone call if reporting after normal business hours
Notifiable within 2 business days
Notifiable on a monthly basis
Specimen/culture submission to the Public Health La-boratories required (upon request for all others)
LEGEND
For more information, see WAC 246-101 or http://www.doh.wa.gov/PublicHealthandHealthcareProviders/NotifiableConditions.aspx DOH 210-002 (Rev. 11/16)
Notifiable Conditions
Notifiable to the local health jurisdiction (LHJ) of the patient’s residence
Phone numbers by LHJ are listed on the other side of this poster. If unable to reach the LHJ of the patient’s residence, please call: 1-877-539-4344
(If patient residence is unknown, notify the LHJ of the health care provider that ordered the diagnostic test)
LABORATORIES
Icons for reporting timeframes and recipients are explained in the legend.
*The 2011 revision of WAC 246-101-010 states “‘Other rare diseases of public health
significance’ means a disease or condition, of general or international public health
concern, which is occasionally or not ordinarily seen in the state of Washington including,
but not limited to, spotted fever rickettsiosis, babesiosis, tick paralysis, anaplasmosis, and
other tick borne diseases. This also includes public health events of international concern
and communicable diseases that would be of public concern if detected in Washington.”
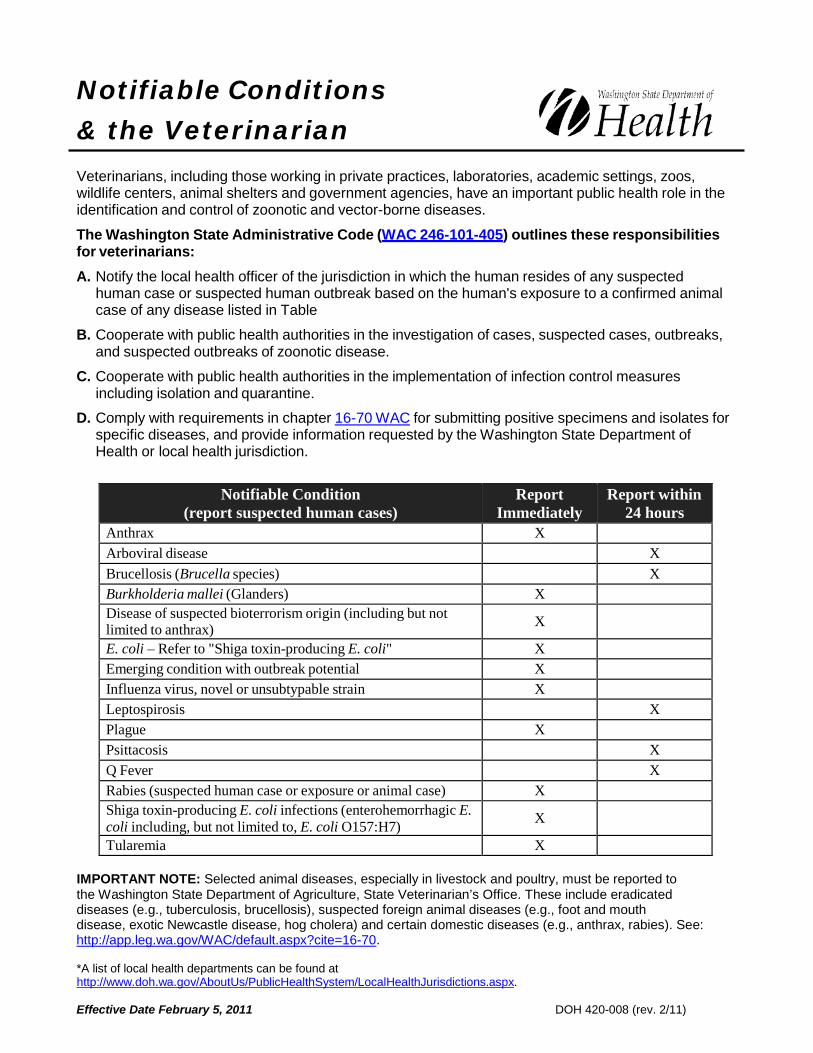
Notifiable Conditions
& the Veterinarian Veterinarians, including those working in private practices, laboratories, academic settings, zoos, wildlife centers, animal shelters and government agencies, have an important public health role in the identification and control of zoonotic and vector-borne diseases.
The Washington State Administrative Code (WAC 246-101-405) outlines these responsibilities for veterinarians:
A. Notify the local health officer of the jurisdiction in which the human resides of any suspected human case or suspected human outbreak based on the human's exposure to a confirmed animal case of any disease listed in Table
B. Cooperate with public health authorities in the investigation of cases, suspected cases, outbreaks, and suspected outbreaks of zoonotic disease.
C. Cooperate with public health authorities in the implementation of infection control measures including isolation and quarantine.
D. Comply with requirements in chapter 16-70 WAC for submitting positive specimens and isolates for specific diseases, and provide information requested by the Washington State Department of Health or local health jurisdiction.
Notifiable Condition (report suspected human cases)
Report Immediately
Report within 24 hours
Anthrax X Arboviral disease X Brucellosis (Brucella species) X Burkholderia mallei (Glanders) X Disease of suspected bioterrorism origin (including but not limited to anthrax)
X
E. coli – Refer to "Shiga toxin-producing E. coli" X Emerging condition with outbreak potential X Influenza virus, novel or unsubtypable strain X Leptospirosis X Plague X Psittacosis X Q Fever X Rabies (suspected human case or exposure or animal case) X Shiga toxin-producing E. coli infections (enterohemorrhagic E. coli including, but not limited to, E. coli O157:H7)
X
Tularemia X
IMPORTANT NOTE: Selected animal diseases, especially in livestock and poultry, must be reported to the Washington State Department of Agriculture, State Veterinarian’s Office. These include eradicated diseases (e.g., tuberculosis, brucellosis), suspected foreign animal diseases (e.g., foot and mouth disease, exotic Newcastle disease, hog cholera) and certain domestic diseases (e.g., anthrax, rabies). See: http://app.leg.wa.gov/WAC/default.aspx?cite=16-70.
*A list of local health departments can be found at http://www.doh.wa.gov/AboutUs/PublicHealthSystem/LocalHealthJurisdictions.aspx.
Effective Date February 5, 2011 DOH 420-008 (rev. 2/11)

10
Disease Incidence and Mortality Rates

Arboviral Disease Types
YearTotal Cases
ChikungunyaColorado Tick Fever
DengueJapanese
EncephalitisSt. Louis
EncephalitisWest Nile Virus
Yellow Fever
Zika Virus
Other/Unknown flavivirus
2002 1 0 0 0 0 0 0 1V 0 02003 8 0 0 0 0 0 8T 0 0 02004 3 0 0 1T 1T 0 1T 0 0 02005 6 0 0 3T 0 0 3T 0 0 02006 13 1T 0 4T 0 0 8 (5T, 3E) 0 0 02007 16 0 0 10T 0 0 5T 0 0 1T
2008 19 0 1T 14T 1T 0 3E 0 0 02009 52 0 0 11T 0 1T 38 (36E, 2U) 0 0 2 (1T, 1E)2010 24 3T 0 19T 0 0 2 (1E, 1T ) 0 0 02011 9 0 0 9T 0 0 0 0 0 02012 20 0 0 16T 0 0 4 (2E, 2T) 0 0 02013 15 0 0 14T 0 0 1T 0 0 0
2014* 36 15T 0 9T 0 0 12 (10E, 2T ) 0 0 02015 84 40T 0 19T 0 0 24 (22E, 2T) 0 0 1T
2016 113 10T 0 23T 0 0 9E 0 68T 3T
2017 55 3T 0 19T 0 0 13 (8E, 5T) 0 16T 4T
2018 14 2T 0 9T 0 0 3(1E, 2T) 0 0 0
2019 28 4T 0 19T 0 0 5(4E, 1U) 0 0 0
V Vaccine-associatedT Travel-associatedE Endemically acquiredU Unknown exposure location*2014 data updated since the 2014 annual report
11

BotulismYear Food Infant Wound Combined
Rate* Deaths
1985 5 4 0 0.2 01986 2 4 0 0.1 01987 1 1 1 0.1 01988 3 4 0 0.2 01989 10 0 0 0.2 01990 1 0 0 0 01991 0 3 0 0.1 01992 0 2 0 0 01993 4 5 0 0.2 01994 3 2 0 0.1 01995 4 2 0 0.1 01996 2 0 2 0.1 01997 0 1 2 0.1 01998 2 4 0 0.1 01999 2 4 1 0.1 02000 1 4 0 0.1 02001 1 6 0 0.1 02002 1 1 4 0.1 02003 1 3 7 0.2 02004 1 3 5 0.1 02005 0 2 4 0.1 02006 0 9 1 0.2 02007 1 1 2 0.1 12008 0 1 2 0 02009 4 2 4 0.1 12010 0 3 1 0.1 02011 0 3 4 0.1 02012 1 4 2 0.1 12013 2 4 4 0.1 02014 0 3 0 0 02015 0 6 2 0.1 02016 2 1 1 0.1 22017 0 6 4 0.1 02018 1 7 0 0.1 02019 0 4 1 0.1 0
12
*All rates are cases per 100,000 population.

BrucellosisYear Cases Rate* Deaths1986 1 0 01987 1 0 01988 1 0 01989 1 0 01990 0 0 01991 3 0.1 01992 1 0 01993 0 0 01994 0 0 01995 0 0 01996 2 0 01997 3 0.1 01998 3 0.1 01999 0 0 02000 0 0 02001 0 0 02002 2 0 02003 1 0 02004 2 0 02005 0 0 02006 0 0 02007 1 0 02008 1 0 02009 1 0 02010 0 0 02011 1 0 02012 0 0 02013 1 0 02014 4 0.1 02015 4 0.1 02016 0 0 02017 1 0 02018 1 0 02019 3 0 0
*All rates are cases per 100,000 population.
13
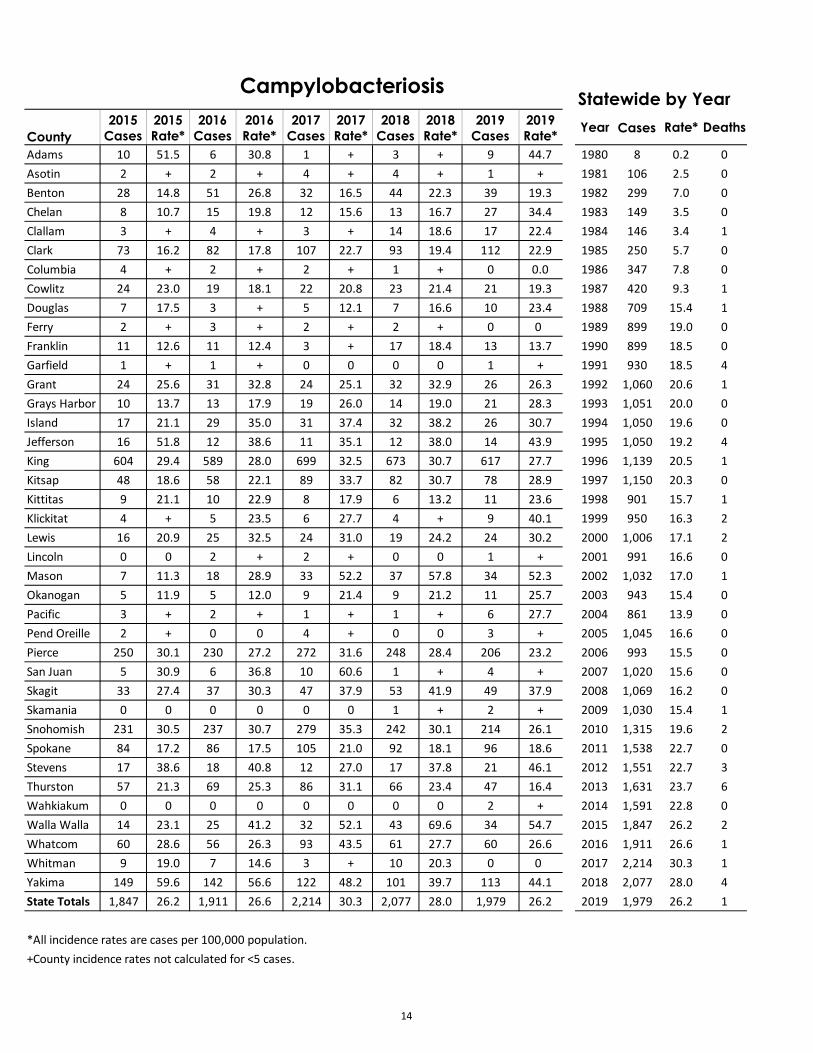
Campylobacteriosis Statewide by Year
County2015
Cases2015Rate*
2016Cases
2016Rate*
2017Cases
2017Rate*
2018Cases
2018Rate*
2019Cases
2019Rate* Year Cases Rate* Deaths
Adams 10 51.5 6 30.8 1 + 3 + 9 44.7 1980 8 0.2 0Asotin 2 + 2 + 4 + 4 + 1 + 1981 106 2.5 0Benton 28 14.8 51 26.8 32 16.5 44 22.3 39 19.3 1982 299 7.0 0Chelan 8 10.7 15 19.8 12 15.6 13 16.7 27 34.4 1983 149 3.5 0Clallam 3 + 4 + 3 + 14 18.6 17 22.4 1984 146 3.4 1Clark 73 16.2 82 17.8 107 22.7 93 19.4 112 22.9 1985 250 5.7 0Columbia 4 + 2 + 2 + 1 + 0 0.0 1986 347 7.8 0Cowlitz 24 23.0 19 18.1 22 20.8 23 21.4 21 19.3 1987 420 9.3 1Douglas 7 17.5 3 + 5 12.1 7 16.6 10 23.4 1988 709 15.4 1Ferry 2 + 3 + 2 + 2 + 0 0 1989 899 19.0 0Franklin 11 12.6 11 12.4 3 + 17 18.4 13 13.7 1990 899 18.5 0Garfield 1 + 1 + 0 0 0 0 1 + 1991 930 18.5 4Grant 24 25.6 31 32.8 24 25.1 32 32.9 26 26.3 1992 1,060 20.6 1Grays Harbor 10 13.7 13 17.9 19 26.0 14 19.0 21 28.3 1993 1,051 20.0 0Island 17 21.1 29 35.0 31 37.4 32 38.2 26 30.7 1994 1,050 19.6 0Jefferson 16 51.8 12 38.6 11 35.1 12 38.0 14 43.9 1995 1,050 19.2 4King 604 29.4 589 28.0 699 32.5 673 30.7 617 27.7 1996 1,139 20.5 1Kitsap 48 18.6 58 22.1 89 33.7 82 30.7 78 28.9 1997 1,150 20.3 0Kittitas 9 21.1 10 22.9 8 17.9 6 13.2 11 23.6 1998 901 15.7 1Klickitat 4 + 5 23.5 6 27.7 4 + 9 40.1 1999 950 16.3 2Lewis 16 20.9 25 32.5 24 31.0 19 24.2 24 30.2 2000 1,006 17.1 2Lincoln 0 0 2 + 2 + 0 0 1 + 2001 991 16.6 0Mason 7 11.3 18 28.9 33 52.2 37 57.8 34 52.3 2002 1,032 17.0 1Okanogan 5 11.9 5 12.0 9 21.4 9 21.2 11 25.7 2003 943 15.4 0Pacific 3 + 2 + 1 + 1 + 6 27.7 2004 861 13.9 0Pend Oreille 2 + 0 0 4 + 0 0 3 + 2005 1,045 16.6 0Pierce 250 30.1 230 27.2 272 31.6 248 28.4 206 23.2 2006 993 15.5 0San Juan 5 30.9 6 36.8 10 60.6 1 + 4 + 2007 1,020 15.6 0Skagit 33 27.4 37 30.3 47 37.9 53 41.9 49 37.9 2008 1,069 16.2 0Skamania 0 0 0 0 0 0 1 + 2 + 2009 1,030 15.4 1Snohomish 231 30.5 237 30.7 279 35.3 242 30.1 214 26.1 2010 1,315 19.6 2Spokane 84 17.2 86 17.5 105 21.0 92 18.1 96 18.6 2011 1,538 22.7 0Stevens 17 38.6 18 40.8 12 27.0 17 37.8 21 46.1 2012 1,551 22.7 3Thurston 57 21.3 69 25.3 86 31.1 66 23.4 47 16.4 2013 1,631 23.7 6Wahkiakum 0 0 0 0 0 0 0 0 2 + 2014 1,591 22.8 0Walla Walla 14 23.1 25 41.2 32 52.1 43 69.6 34 54.7 2015 1,847 26.2 2Whatcom 60 28.6 56 26.3 93 43.5 61 27.7 60 26.6 2016 1,911 26.6 1Whitman 9 19.0 7 14.6 3 + 10 20.3 0 0 2017 2,214 30.3 1Yakima 149 59.6 142 56.6 122 48.2 101 39.7 113 44.1 2018 2,077 28.0 4State Totals 1,847 26.2 1,911 26.6 2,214 30.3 2,077 28.0 1,979 26.2 2019 1,979 26.2 1
*All incidence rates are cases per 100,000 population.+County incidence rates not calculated for <5 cases.
14

County2015
Cases2015Rate*
2016Cases
2016Rate*
2017Cases
2017Rate*
2018Cases
2018Rate*
2019Cases
2019Rate* Year Cases Rate* Deaths
Adams 60 306 85 436 93 468.0 90 449.6 116 575.7 1989 10,865 229.8 0Asotin 92 419 86 388 77 345.5 60 267.6 65 288.6 1990 12,709 261.1 0Benton 677 358 739 388 906 468.2 906 458.9 1,019 505.0 1991 12,917 257.2 0Chelan 245 329 260 343 270 351.4 285 366.3 279 355.8 1992 11,762 228.8 0Clallam 187 257 200 272 199 268.1 190 252.9 185 243.4 1993 10,331 196.2 0Clark 1,686 380 1,912 415 1,85 393.8 1,971 411.1 2,086 427.0 1994 10,575 197.1 0Columbia 6 + 4 + 9 + 4 + 8 + 1995 9,463 173.0 0Cowlitz 475 457 481 459 478 451.4 501 466.9 558 512.2 1996 9,237 165.9 0Douglas 144 361 151 371 154 371.8 181 429.7 157 366.7 1997 9,523 168.1 0Ferry 26 338 24 312 22 284.2 12 + 13 + 1998 10,998 191.3 0Franklin 370 415 456 514 517 572.4 537 580.3 694 733.0 1999 11,964 205.2 0Garfield 5 + 3 + 1 + 1 + 0 + 2000 13,066 221.7 0Grant 382 407 404 427 345 360.8 382 392.4 466 471.9 2001 13,631 228.3 0Grays Harbor 192 261 198 272 221 302.9 289 392.6 296 399.1 2002 14,936 246.5 0Island 307 383 204 246 246 297.1 194 231.3 232 273.5 2003 16,796 274.1 0Jefferson 56 182 56 180 52 165.8 46 145.6 63 197.5 2004 17,635 284.0 0King 8,421 415 9,400 447 9,760 453.2 10,476 478.3 11,547 518.7 2005 18,617 295.6 0Kitsap 938 365 984 375 1,104 417.7 1,184 443.2 1,240 459.1 2006 17,819 277.5 0Kittitas 179 422 210 480 240 536.6 231 506.6 278 597.0 2007 19,123 293.1 0Klickitat 57 272 58 273 64 295.5 53 241.1 69 307.6 2008 21,327 322.7 0Lewis 265 346 252 328 284 366.7 279 356.0 305 383.7 2009 21,178 317.4 0Lincoln 19 177 15 + 15 + 12 + 26 237.2 2010 21,401 318.3 0Mason 230 368 234 376 221 349.7 238 371.8 247 380.1 2011 23,237 343.3 0Okanogan 76 182 114 273 103 244.6 122 287.1 142 332.3 2012 24,600 360.8 0Pacific 57 270 45 213 45 211.8 32 149.4 42 194.1 2013 25,013 363.4 0Pend Oreille 24 181 20 151 40 299.2 30 221.6 26 189.2 2014 26,246 376.7 0Pierce 4,646 563 4,976 589 5,434 632.3 5,947 681.8 6,300 709.2 2015 28,721 410.0 0San Juan 20 124 17 104 12 + 19 113.0 18 105.0 2016 31,193 434.2 0Skagit 399 333 415 339 481 387.6 470 371.5 495 383.1 2017 32,454 444.0 0Skamania 14 + 22 191 21 179.6 21 176.6 29 240.5 2018 34,754 467.9 0Snohomish 2,203 296 2,488 322 2,619 331.8 2,699 335.2 2,932 358.1 2019 37,641 498.8 0Spokane 2,194 451 2,452 498 2,337 467.6 2,644 520.5 2,655 515.3Stevens 123 298 128 290 95 213.4 107 237.6 97 212.9Thurston 988 371 1,164 427 1,139 411.3 1,200 426.0 1,202 420.6Wahkiakum 4 + 5 + 3 + 3 + 8 +Walla Walla 237 394 238 392 193 314.3 218 352.8 314 504.8Whatcom 765 366 692 326 708 327.3 838 380.3 882 391.5Whitman 355 754 412 859 446 916.9 495 1005.9 436 869.7Yakima 1,597 638 1,589 633 1,643 649.4 1,787 702.2 2,114 825.9State Totals 28,721 410 31,193 434 32,454 444.0 34,754 467.9 37,641 498.8
*All incidence rates are cases per 100,000 population.+County incidence rates based on counts ≤16 are suppressed due to statistical instability.Data source: PHIMS-STD 1/26/2021.
Chlamydia trachomatis Statewide by Year
15
Note: Cases are included in this table if they are residing in Washington based on reported address at the time of diagnosis, are a reportable case in the relevant calendar year (January 1, XXXX – December 31, XXXX), and are given a valid DOH case classification of Probable or Confirmed as determined by the current CDC case definition.
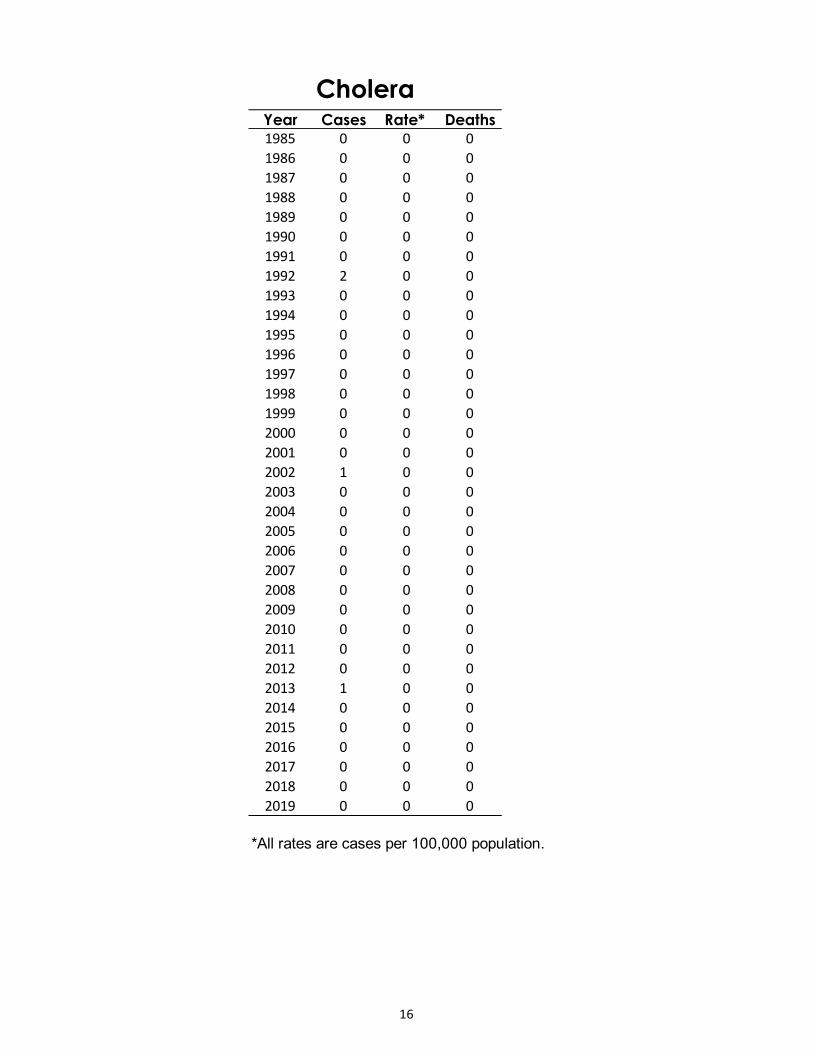
CholeraYear Cases Rate* Deaths1985 0 0 01986 0 0 01987 0 0 01988 0 0 01989 0 0 01990 0 0 01991 0 0 01992 2 0 01993 0 0 01994 0 0 01995 0 0 01996 0 0 01997 0 0 01998 0 0 01999 0 0 02000 0 0 02001 0 0 02002 1 0 02003 0 0 02004 0 0 02005 0 0 02006 0 0 02007 0 0 02008 0 0 02009 0 0 02010 0 0 02011 0 0 02012 0 0 02013 1 0 02014 0 0 02015 0 0 02016 0 0 02017 0 0 02018 0 0 02019 0 0 0
*All rates are cases per 100,000 population.
16
Cryptosporidiosis Statewide by Year
County2015
Cases2015Rate*
2016Cases
2016Rate*
2017Cases
2017Rate*
2018Cases
2018Rate*
2019Cases
2019Rate* Year Cases *Rate Deaths
Adams 0 0 0 0 1 + 0 0 0 0 2001 73 1.2 0Asotin 0 0 0 0 2 + 1 + 1 + 2002 62 1.0 0Benton 1 + 2 + 1 + 1 + 8 4.0 2003 65 1.1 0Chelan 0 0 0 0 0 0 0 0 1 + 2004 63 1.0 0Clallam 2 + 3 + 0 0 4 + 3 + 2005 94 1.5 0Clark 9 2.0 10 2.2 17 3.6 15 3.1 15 3.1 2006 95 1.5 0Columbia 0 0 0 0 0 0 0 0 0 0 2007 139 2.1 0Cowlitz 3 + 3 + 2 + 3 + 5 4.6 2008 99 1.5 0Douglas 0 0 0 0 0 0 0 0 4 + 2009 102 1.5 0Ferry 0 0 0 0 0 0 1 + 0 0 2010 102 1.5 0Franklin 1 + 4 + 0 0 0 0 0 0 2011 88 1.3 0Garfield 0 0 0 0 0 0 0 0 0 0 2012 101 1.5 0Grant 1 + 0 0 0 0 3 + 1 + 2013 84 1.2 0Grays Harbor 0 0 0 0 3 + 1 + 1 + 2014 75 1.1 0Island 0 0 4 + 1 + 0 0 0 0 2015 113 1.6 0Jefferson 3 + 2 + 3 + 2 + 0 0 2016 131 1.8 0King 25 1.2 43 2.0 65 3.0 92 4.2 114 5.1 2017 150 2.1 0Kitsap 3 + 3 + 1 + 2 + 1 + 2018 198 2.7 0Kittitas 0 0 1 + 1 + 0 0 3 + 2019 232 3.1 0Klickitat 1 + 0 0 2 + 2 + 2 +Lewis 9 11.7 2 + 2 + 2 + 1 +Lincoln 0 0 0 0 0 0 0 0 0 0Mason 0 0 0 0 2 + 2 + 1 +Okanogan 1 + 0 0 0 0 0 0 1 +Pacific 0 0 0 0 0 0 0 0 1 +Pend Oreille 0 0 0 0 0 0 0 0 0 0Pierce 24 2.9 14 1.7 19 2.2 23 2.6 27 3.0San Juan 0 0 3 + 0 0 2 + 1 +Skagit 0 0 2 + 3 + 5 4.0 3 +Skamania 0 0 0 0 0 0 0 0 1 +Snohomish 5 0.7 6 0.8 8 1.0 12 1.5 9 1.1Spokane 5 1.0 0 0 0 0 2 + 7 1.4Stevens 0 0 0 0 0 0 0 0 0 0Thurston 3 + 10 3.7 4 + 6 2.1 6 2.1Wahkiakum 0 0 0 0 0 0 0 0 0 0Walla Walla 0 0 1 + 2 + 4 + 3 +Whatcom 10 4.8 15 7.1 5 2.3 4 + 5 2.2Whitman 0 0 0 0 0 0 0 0 0 0Yakima 7 2.8 3 + 6 2.4 9 3.5 7 2.7State Totals 113 1.6 131 1.8 150 2.1 198 2.7 232 3.1
*All incidence rates are cases per 100,000 population.
+County incidence rates not calculated for <5 cases.
17

Cyclosporiasis‡
Year Cases Rate* Deaths2002 5 0.1 02003 0 0 02004 11 0.2 02005 5 0.1 02006 1 0 02007 1 0 02008 1 0 02009 0 0 02010 2 0 02011 4 0.1 02012 0 0 02013 0 0 02014 2 0 02015 5 0.1 02016 3 0 02017 9 0.1 02018 23 0.3 02019 17 0.2 0
‡Cyclosporiasis first became a notifiablecondition in Washington in 12/ 2000.*All rates are cases per 100,000 population.
18

DiphtheriaYear Cases Rate* Deaths1985 0 0 01986 0 0 01987 0 0 01988 0 0 01989 0 0 01990 0 0 01991 0 0 01992 0 0 01993 0 0 01994 0 0 01995 0 0 01996 0 0 01997 0 0 01998 0 0 01999 0 0 02000 0 0 02001 0 0 02002 0 0 02003 0 0 02004 0 0 02005 0 0 02006 0 0 02007 0 0 02008 0 0 02009 0 0 02010 0 0 02011 0 0 02012 0 0 02013 0 0 02014 0 0 02015 0 0 02016 0 0 02017 0 0 02018 0 0 02019 0 0 0
*All rates are cases per 100,000 population.
19

Giardiasis Statewide by Year
County2015
Cases2015Rate*
2016Cases
2016Rate*
2017Cases
2017Rate*
2018Cases
2018Rate*
2019Cases
2019Rate*
Year Cases Rate* Deaths
Adams 3 + 1 + 1 + 0 0 0 0 1980 840 20.3 0Asotin 1 + 1 + 1 + 4 + 2 + 1981 547 12.9 0Benton 2 + 8 4.2 11 5.7 4 + 5 2.5 1982 956 22.4 0Chelan 9 12.0 9 11.9 6 7.8 7 9.0 3 + 1983 706 16.4 0Clallam 7 9.6 6 8.2 5 6.7 7 9.3 6 7.9 1984 710 16.3 0Clark 28 6.2 39 8.5 25 5.3 22 4.6 11 2.3 1985 779 17.6 0Columbia 1 + 0 0 2 + 0 0 0 0 1986 811 18.2 0Cowlitz 3 + 2 + 3 + 6 5.6 1 + 1987 827 18.3 0Douglas 2 + 7 17.2 0 0 1 + 0 0 1988 851 18.4 0Ferry 1 + 0 0 2 + 0 0 1 + 1989 980 20.7 0Franklin 4 + 4 + 2 + 1 + 4 + 1990 792 16.3 0Garfield 0 0 0 0 0 0 2 + 0 0 1991 876 17.4 1Grant 4 + 4 + 9 9.4 3 + 1 + 1992 860 16.7 1Grays Harbor 5 6.8 6 8.2 4 + 3 + 4 + 1993 747 14.2 0Island 1 + 5 6.0 5 6.0 2 + 4 + 1994 722 13.5 0Jefferson 3 + 7 22.5 7 22.3 6 19.0 7 21.9 1995 855 15.6 0King 219 10.7 253 12.0 277 12.9 156 7.1 59 2.7 1996 668 12.0 0Kitsap 26 10.1 25 9.5 22 8.3 18 6.7 13 4.8 1997 738 13.0 0Kittitas 5 11.7 7 16.0 9 20.1 1 + 1 + 1998 740 12.9 1Klickitat 5 23.8 1 + 1 + 3 + 2 + 1999 560 9.6 1Lewis 3 + 5 6.5 3 + 1 + 3 + 2000 622 10.6 1Lincoln 0 0 2 + 1 + 1 + 0 0 2001 512 8.6 0Mason 4 + 8 12.8 5 7.9 6 9.4 3 + 2002 510 8.4 0Okanogan 6 14.3 4 + 7 16.6 4 + 2 + 2003 435 7.1 0Pacific 0 0 3 + 0 0 0 0 0 0 2004 444 7.2 0Pend Oreille 1 + 3 + 3 + 0 0 1 + 2005 437 6.9 0Pierce 42 5.1 41 4.9 46 5.4 31 3.6 43 4.8 2006 451 7.0 0San Juan 3 + 0 0 1 + 1 + 0 0 2007 590 9.0 0Skagit 9 7.5 10 8.2 10 8.1 8 6.3 10 7.7 2008 486 7.4 0Skamania 0 0 0 0 0 0 0 0 2 + 2009 467 7.0 0Snohomish 71 9.4 66 8.5 64 8.1 55 6.8 46 5.6 2010 521 7.7 0Spokane 60 12.3 72 14.6 66 13.2 32 6.3 29 5.6 2011 529 7.8 0Stevens 1 + 4 + 8 18.0 3 + 1 + 2012 512 7.5 0Thurston 17 6.4 34 12.5 25 9.0 21 7.5 12 4.2 2013 548 8.0 0Wahkiakum 1 + 0 0 0 0 1 + 0 0 2014 515 7.4 0Walla Walla 2 + 4 + 4 + 4 + 0 0 2015 604 8.6 0Whatcom 25 11.9 8 3.8 17 7.9 18 8.2 9 4.0 2016 672 9.4 0Whitman 4 + 2 + 2 + 2 + 2 + 2017 668 9.1 0Yakima 26 10.4 21 8.4 14 5.5 4 + 1 + 2018 438 5.9 0State Totals 604 8.6 672 9.4 668 9.1 438 5.9 288 3.8 2019 288 3.8 0
*All incidence rates are cases per 100,000 population. +County incidence rates not calculated for <5 cases.
20
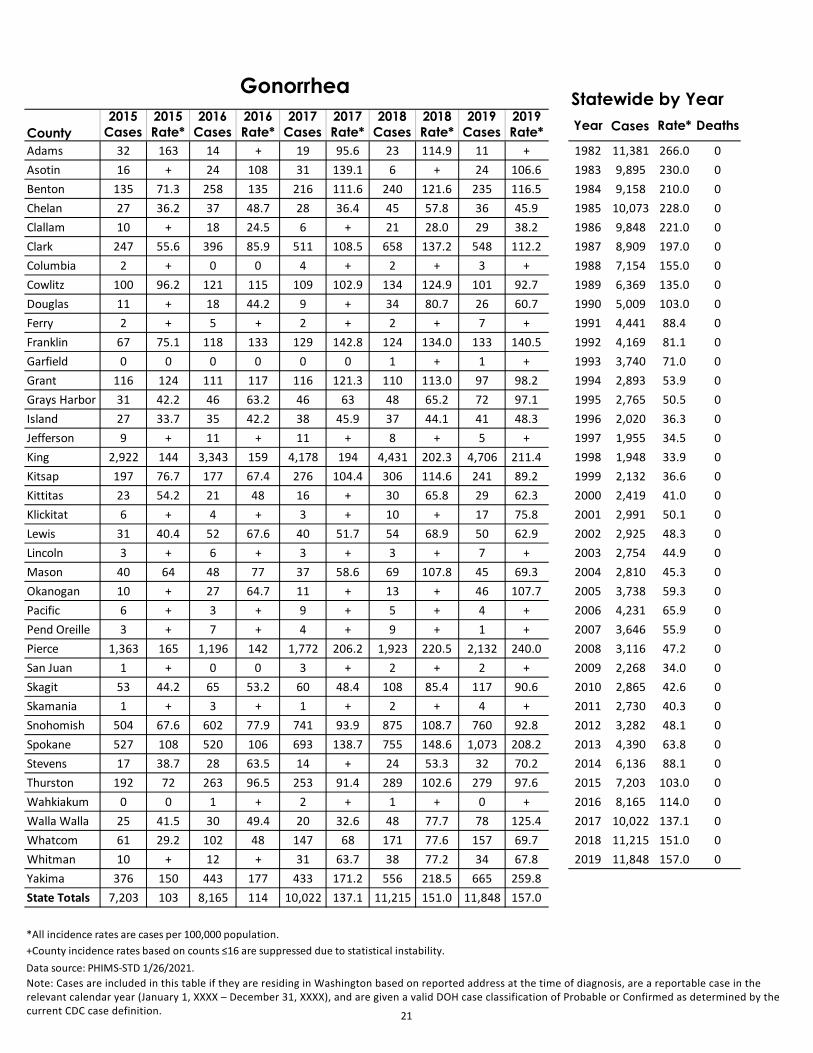
Gonorrhea Statewide by Year
County2015
Cases2015Rate*
2016Cases
2016Rate*
2017Cases
2017Rate*
2018Cases
2018Rate*
2019Cases
2019Rate* Year Cases Rate* Deaths
Adams 32 163 14 + 19 95.6 23 114.9 11 + 1982 11,381 266.0 0Asotin 16 + 24 108 31 139.1 6 + 24 106.6 1983 9,895 230.0 0Benton 135 71.3 258 135 216 111.6 240 121.6 235 116.5 1984 9,158 210.0 0Chelan 27 36.2 37 48.7 28 36.4 45 57.8 36 45.9 1985 10,073 228.0 0Clallam 10 + 18 24.5 6 + 21 28.0 29 38.2 1986 9,848 221.0 0Clark 247 55.6 396 85.9 511 108.5 658 137.2 548 112.2 1987 8,909 197.0 0Columbia 2 + 0 0 4 + 2 + 3 + 1988 7,154 155.0 0Cowlitz 100 96.2 121 115 109 102.9 134 124.9 101 92.7 1989 6,369 135.0 0Douglas 11 + 18 44.2 9 + 34 80.7 26 60.7 1990 5,009 103.0 0Ferry 2 + 5 + 2 + 2 + 7 + 1991 4,441 88.4 0Franklin 67 75.1 118 133 129 142.8 124 134.0 133 140.5 1992 4,169 81.1 0Garfield 0 0 0 0 0 0 1 + 1 + 1993 3,740 71.0 0Grant 116 124 111 117 116 121.3 110 113.0 97 98.2 1994 2,893 53.9 0Grays Harbor 31 42.2 46 63.2 46 63 48 65.2 72 97.1 1995 2,765 50.5 0Island 27 33.7 35 42.2 38 45.9 37 44.1 41 48.3 1996 2,020 36.3 0Jefferson 9 + 11 + 11 + 8 + 5 + 1997 1,955 34.5 0King 2,922 144 3,343 159 4,178 194 4,431 202.3 4,706 211.4 1998 1,948 33.9 0Kitsap 197 76.7 177 67.4 276 104.4 306 114.6 241 89.2 1999 2,132 36.6 0Kittitas 23 54.2 21 48 16 + 30 65.8 29 62.3 2000 2,419 41.0 0Klickitat 6 + 4 + 3 + 10 + 17 75.8 2001 2,991 50.1 0Lewis 31 40.4 52 67.6 40 51.7 54 68.9 50 62.9 2002 2,925 48.3 0Lincoln 3 + 6 + 3 + 3 + 7 + 2003 2,754 44.9 0Mason 40 64 48 77 37 58.6 69 107.8 45 69.3 2004 2,810 45.3 0Okanogan 10 + 27 64.7 11 + 13 + 46 107.7 2005 3,738 59.3 0Pacific 6 + 3 + 9 + 5 + 4 + 2006 4,231 65.9 0Pend Oreille 3 + 7 + 4 + 9 + 1 + 2007 3,646 55.9 0Pierce 1,363 165 1,196 142 1,772 206.2 1,923 220.5 2,132 240.0 2008 3,116 47.2 0San Juan 1 + 0 0 3 + 2 + 2 + 2009 2,268 34.0 0Skagit 53 44.2 65 53.2 60 48.4 108 85.4 117 90.6 2010 2,865 42.6 0Skamania 1 + 3 + 1 + 2 + 4 + 2011 2,730 40.3 0Snohomish 504 67.6 602 77.9 741 93.9 875 108.7 760 92.8 2012 3,282 48.1 0Spokane 527 108 520 106 693 138.7 755 148.6 1,073 208.2 2013 4,390 63.8 0Stevens 17 38.7 28 63.5 14 + 24 53.3 32 70.2 2014 6,136 88.1 0Thurston 192 72 263 96.5 253 91.4 289 102.6 279 97.6 2015 7,203 103.0 0Wahkiakum 0 0 1 + 2 + 1 + 0 + 2016 8,165 114.0 0Walla Walla 25 41.5 30 49.4 20 32.6 48 77.7 78 125.4 2017 10,022 137.1 0Whatcom 61 29.2 102 48 147 68 171 77.6 157 69.7 2018 11,215 151.0 0Whitman 10 + 12 + 31 63.7 38 77.2 34 67.8 2019 11,848 157.0 0Yakima 376 150 443 177 433 171.2 556 218.5 665 259.8State Totals 7,203 103 8,165 114 10,022 137.1 11,215 151.0 11,848 157.0
*All incidence rates are cases per 100,000 population.+County incidence rates based on counts ≤16 are suppressed due to statistical instability.Data source: PHIMS-STD 1/26/2021.
21
Note: Cases are included in this table if they are residing in Washington based on reported address at the time of diagnosis, are a reportable case in the relevant calendar year (January 1, XXXX – December 31, XXXX), and are given a valid DOH case classification of Probable or Confirmed as determined by the current CDC case definition.

Haemophilus influenzae Invasive DiseaseYear Cases Rate* Deaths1981 156 3.7 01982 149 3.5 61983 123 2.9 51984 110 2.5 51985 153 3.5 61986 319 7.1 111987 271 6.0 61988 200 4.3 01989 163 3.4 21990 123 2.5 61991 51 1.0 01992 22 0.4 11993 17 0.3 01994 10 0.2 01995 11 0.2 31996 10 0.2 01997 6 0.1 01998 11 0.2 11999 5 0.1 12000 8 0.1 0
2001* 7 1.8 02002* 5 1.2 02003* 13 3.2 12004* 4 1.0 02005* 5 1.2 02006* 5 1.2 02007* 6 1.4 02008* 2 0.5 02009* 9 2.1 02010* 10 2.3 12011* 8 1.8 12012* 4 0.9 02013* 11 2.4 02014* 9 2.0 02015* 5 1.1 02016* 9 2.0 02017* 7 1.5 02018* 13 2.9 02019* 16 3.5 0
*All rates are cases per 100,000 population. Rates for 2001-2019 are forpopulation aged 0-4 years; rates before 2001 are for the entire population.
22
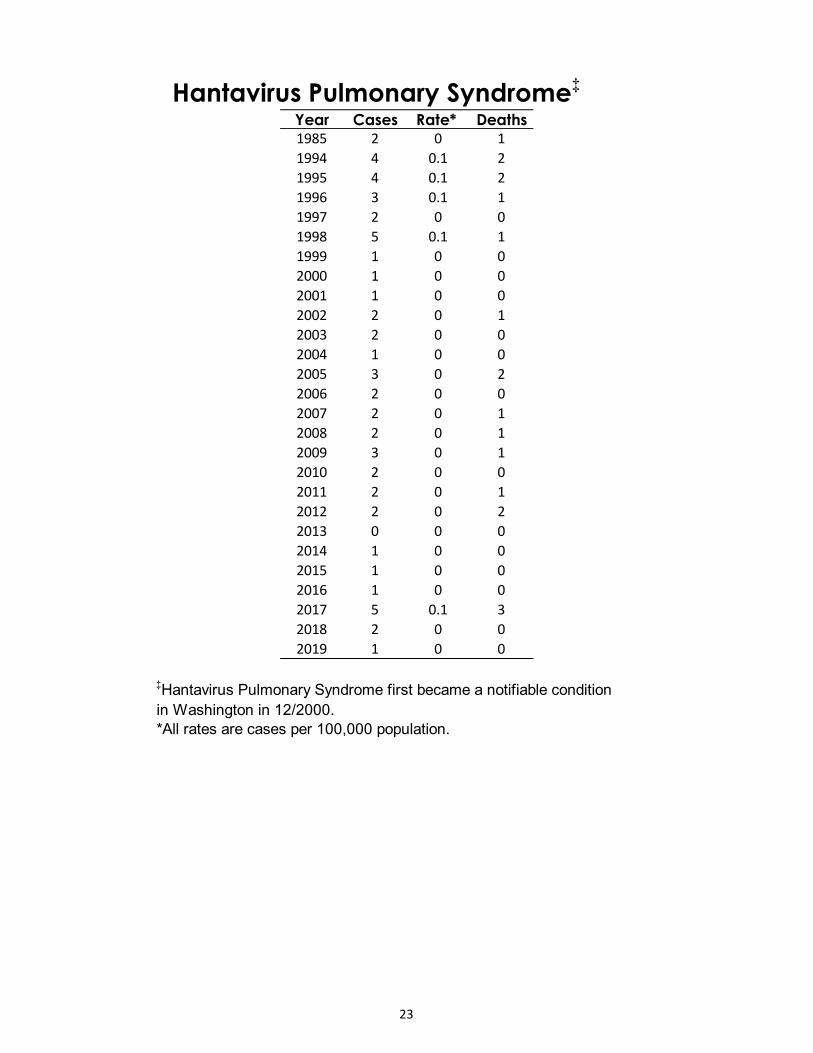
Hantavirus Pulmonary Syndrome‡
Year Cases Rate* Deaths1985 2 0 11994 4 0.1 21995 4 0.1 21996 3 0.1 11997 2 0 01998 5 0.1 11999 1 0 02000 1 0 02001 1 0 02002 2 0 12003 2 0 02004 1 0 02005 3 0 22006 2 0 02007 2 0 12008 2 0 12009 3 0 12010 2 0 02011 2 0 12012 2 0 22013 0 0 02014 1 0 02015 1 0 02016 1 0 02017 5 0.1 32018 2 0 02019 1 0 0
‡Hantavirus Pulmonary Syndrome first became a notifiable conditionin Washington in 12/2000.*All rates are cases per 100,000 population.
23

Hepatitis A, Acute Statewide by Year
County2015
Cases2015Rate*
2016Cases
2016Rate*
2017Cases
2017Rate*
2018Cases
2018Rate*
2019Cases
2019Rate* Year Cases Rate* Deaths
Adams 0 0 0 0 0 0 0 0 0 0 1980 554 13.4 2Asotin 0 0 0 0 0 0 0 0 0 0 1981 791 18.7 0Benton 1 0 0 0 0 0 1 + 0 0 1982 494 11.6 1Chelan 1 0 0 0 0 0 0 0 1 + 1983 268 6.2 1Clallam 0 0 0 0 0 0 1 + 0 0 1984 373 8.6 0Clark 3 + 2 + 3 + 3 + 4 + 1985 702 15.9 2Columbia 0 0 0 0 0 0 0 0 0 0 1986 1,385 31.0 1Cowlitz 1 + 0 0 1 + 0 0 1 + 1987 2,589 57.2 1Douglas 0 0 0 0 0 0 0 0 0 0 1988 2,669 57.8 7Ferry 0 0 0 0 0 0 0 0 0 0 1989 3,273 69.2 5Franklin 0 0 0 0 0 0 0 0 1 + 1990 1,380 28.4 1Garfield 0 0 0 0 0 0 0 0 0 0 1991 608 12.1 3Grant 1 + 0 0 0 0 0 0 0 0 1992 865 16.8 1Grays Harbor 0 0 1 + 0 0 0 0 0 0 1993 926 17.6 1Island 0 0 0 0 0 0 0 0 0 0 1994 1,119 20.9 2Jefferson 0 0 0 0 0 0 2 + 0 0 1995 937 17.1 9King 8 0.4 13 0.6 11 0.5 14 0.6 45 2.0 1996 1,001 18.0 3Kitsap 0 0 1 + 2 + 2 + 4 + 1997 1,019 18.0 1Kittitas 0 0 0 0 0 0 0 0 0 0 1998 1,037 18.0 2Klickitat 0 0 0 0 0 0 1 + 1 + 1999 505 8.7 1Lewis 0 0 1 + 0 0 0 0 0 0 2000 298 5.1 1Lincoln 0 0 0 0 0 0 0 0 0 0 2001 184 3.1 0Mason 0 0 1 + 1 + 0 0 0 0 2002 162 2.7 0Okanogan 0 0 0 0 0 0 0 0 4 + 2003 50 0.8 0Pacific 0 0 0 0 0 0 1 + 0 0 2004 69 1.1 0Pend Oreille 0 0 0 0 0 0 0 0 1 + 2005 63 1.0 1Pierce 0 0 2 + 1 + 2 + 3 + 2006 52 0.8 2San Juan 0 0 0 0 0 0 0 0 0 0 2007 60 0.9 0Skagit 1 + 1 + 3 + 1 + 2 + 2008 51 0.8 0Skamania 0 0 0 0 0 0 0 0 0 0 2009 42 0.6 1Snohomish 5 0.7 4 + 1 + 2 + 15 1.8 2010 21 0.3 0Spokane 1 + 1 + 2 + 1 + 74 14.4 2011 31 0.5 1Stevens 0 0 0 0 0 0 1 + 0 0 2012 29 0.4 1Thurston 1 + 0 0 1 + 2 + 1 + 2013 45 0.7 1Wahkiakum 0 0 0 0 0 0 0 0 0 0 2014 26 0.4 0Walla Walla 0 0 0 0 1 + 0 0 0 0 2015 26 0.4 0Whatcom 3 + 4 + 0 0 0 0 1 + 2016 31 0.4 1Whitman 0 0 0 0 0 0 0 0 0 0 2017 28 0.4 0Yakima 0 0 0 0 1 + 1 + 23 9.0 2018 35 0.5 1State Totals 26 0.4 31 0.4 28 0.4 35 0.5 181 2.4 2019 181 2.4 4
*All incidence rates are cases per 100,000 population.
+County incidence rates not calculated for <5 cases.
24

Hepatitis B, Acute Statewide by Year
County2015
Cases2015Rate*
2016Cases
2016Rate*
2017Cases
2017Rate*
2018Cases
2018Rate*
2019Cases
2019Rate* Year Cases Rate* Deaths
Adams 0 0 0 0 0 0 0 0 0 0 1980 257 6.2 6Asotin 0 0 0 0 0 0 0 0 0 0 1981 345 8.2 11Benton 0 0 0 0 0 0 0 0 0 0 1982 358 8.4 2Chelan 1 + 0 0 1 + 0 0 0 0 1983 307 7.1 3Clallam 0 0 0 0 0 0 0 0 0 0 1984 317 7.3 2Clark 3 + 1 + 2 + 0 0 2 + 1985 484 11.0 6Columbia 0 0 0 0 0 0 0 0 0 0 1986 989 22.2 8Cowlitz 2 + 6 5.7 7 6.6 2 + 1 + 1987 1,126 24.9 4Douglas 0 0 0 0 0 0 0 0 0 0 1988 979 21.2 6Ferry 0 0 0 0 0 0 0 0 0 0 1989 1,055 22.3 9Franklin 0 0 0 0 0 0 0 0 0 0 1990 616 12.7 7Garfield 0 0 0 0 0 0 0 0 0 0 1991 470 9.4 5Grant 2 + 0 0 1 + 0 0 0 0 1992 399 7.8 1Grays Harbor 1 + 3 + 2 + 3 + 3 + 1993 247 4.7 0Island 0 0 1 + 0 0 0 0 0 0 1994 255 4.8 2Jefferson 0 0 0 0 0 0 0 0 0 0 1995 226 4.1 2King 7 0.3 3 + 7 0.3 9 0.4 17 0.8 1996 158 2.8 1Kitsap 1 + 0 0 0 0 1 + 0 0 1997 114 2.0 2Kittitas 0 0 0 0 0 0 0 0 1 + 1998 136 2.4 0Klickitat 0 0 0 0 0 0 1 + 0 0 1999 111 1.9 1Lewis 0 0 1 + 3 + 0 0 1 + 2000 132 2.2 5Lincoln 0 0 0 0 0 0 1 + 0 0 2001 171 2.9 0Mason 1 + 2 + 1 + 1 + 0 0 2002 83 1.4 0Okanogan 0 0 0 0 0 0 0 0 0 0 2003 90 1.5 1Pacific 0 0 1 + 0 0 0 0 0 0 2004 64 1.0 1Pend Oreille 0 0 0 0 0 0 0 0 0 0 2005 80 1.3 0Pierce 5 0.6 6 0.7 4 + 6 0.7 4 + 2006 80 1.2 2San Juan 0 0 0 0 0 0 0 0 0 0 2007 71 1.1 1Skagit 0 0 1 + 1 + 1 + 0 0 2008 56 0.8 0Skamania 0 0 0 0 1 + 0 0 0 0 2009 48 0.7 0Snohomish 2 + 7 0.9 4 + 7 0.9 7 0.9 2010 50 0.7 1Spokane 8 1.6 10 2.0 7 1.4 13 2.6 7 1.4 2011 35 0.5 0Stevens 0 0 0 0 0 0 1 + 1 + 2012 34 0.5 1Thurston 0 0 1 + 3 + 3 + 5 1.7 2013 34 0.5 1Wahkiakum 0 0 0 0 0 0 0 0 0 0 2014 44 0.6 0Walla Walla 0 0 0 0 0 0 1 + 0 0 2015 34 0.5 0Whatcom 1 + 0 0 1 + 1 + 3 + 2016 45 0.6 0Whitman 0 0 0 0 0 0 0 0 0 0 2017 45 0.6 0Yakima 0 0 2 + 0 0 0 0 0 0 2018 51 0.7 0State Totals 34 0.5 45 0.6 45 0.6 51 0.7 52 0.7 2019 52 0.7 0
25
*All incidence rates are cases per 100,000 population.
+County incidence rates not calculated for <5 cases.Note: Cases of acute hepatitis B are included in this table if they are a resident of Washington at the time of initial diagnosis/report, are a reportable case in the relevant calendar year (January 1, XXXX – December 31, XXXX), and are given a valid DOH case classification of Confirmed as determined by the CDC case definition.

Hepatitis B, Chronic Statewide by Year
County2015
Cases2015Rate*
2016Cases
2016Rate*
2017Cases
2017Rate*
2018Cases
2018Rate*
2019Cases
2019Rate* Year Cases Rate* Deaths
Adams 0 0 0 0 1 * 2 * 3 * 2001 1,078 18.1 55Asotin 0 0 0 0 2 * 1 * 0 0 2002 979 16.2 52Benton 2 * 5 2.6 39 20.2 57 28.9 64 31.7 2003 950 15.5 48Chelan 1 * 1 * 4 * 6 7.7 9 11.5 2004 939 15.3 55Clallam 0 0 1 * 9 12.1 14 18.6 6 7.9 2005 1,034 16.4 49Clark 75 16.6 70 15.2 60 12.7 119 24.8 108 22.1 2006 1,119 17.4 39Columbia 0 0 0 0 0 0 0 0 0 0 2007 1,138 17.4 47Cowlitz 10 9.6 5 4.8 14 13.2 9 8.4 12 11.0 2008 1,464 22.2 52Douglas 2 * 0 0 0 0 4 * 3 * 2009 1,194 17.9 64Ferry 1 * 0 0 0 0 0 0 0 0 2010 1,238 18.4 47Franklin 2 * 0 0 5 5.5 21 22.7 19 20.1 2011 1,030 15.2 54Garfield 0 0 0 0 0 0 0 0 0 0 2012 1,139 16.7 47Grant 5 5.3 0 0 1 * 1 * 5 5.1 2013 901 13.1 60Grays Harbor 3 * 0 0 3 * 17 23.1 12 16.2 2014 1,119 16.1 56Island 4 * 3 * 0 0 10 11.9 6 7.1 2015 1,310 18.6 48Jefferson 4 * 1 * 1 * 2 * 0 0 2016 1,521 21.2 49King 699 34.1 888 42.2 1,074 49.9 1,076 49.1 955 42.9 2017 1,787 24.4 49Kitsap 39 15.1 33 12.6 19 7.2 55 20.6 41 15.2 2018 2,172 29.2 54Kittitas 0 0 1 * 3 * 3 * 0 0 2019 1,915 25.4 51Klickitat 2 * 0 0 4 * 1 * 3 *Lewis 5 6.5 4 * 11 14.2 10 12.8 4 *Lincoln 0 0 0 0 0 0 1 * 1 *Mason 1 * 2 * 1 * 10 15.6 11 16.9Okanogan 1 * 1 * 0 0 2 * 3 *Pacific 2 * 1 * 2 * 0 0 6 27.7Pend Oreille 0 0 0 0 1 * 0 0 1 *Pierce 119 14.3 168 19.9 150 17.5 205 23.5 193 21.7San Juan 0 * 1 * 0 * 1 * 2 *Skagit 6 5 11 9 13 10.5 12 9.5 13 10.1Skamania 0 * 0 * 0 * 0 0 1 *Snohomish 159 21 173 22.4 201 25.5 302 37.5 247 30.2Spokane 66 13.5 59 12.0 78 15.6 107 21.1 91 17.7Stevens 2 * 1 * 1 * 5 11.1 2 *Thurston 57 21.3 59 21.6 48 17.3 54 19.2 42 14.7Wahkiakum 0 0 0 0 0 0 1 * 0 0Walla Walla 0 0 1 * 1 * 8 12.9 5 8.0Whatcom 17 8.1 15 7.1 23 10.6 22 10.0 19 8.4Whitman 1 * 1 * 8 16.4 11 22.4 7 14.0Yakima 13 5.2 6 2.4 9 3.6 19 7.5 20 7.8Unspecified‡ 12 - 10 - 1 * 4 * 1 *State Totals 1,310 18.6 1,521 21.2 1,786 24.4 2,172 29.2 1,915 25.4*All incidence rates are cases per 100,000 population, county rates not calculated for <5 cases.‡Includes cases diagnosed in correctional facilities and cases entered at the state level into Washington State surveillance databases.Note: Cases of chronic hepatitis B are included in this table if they are a resident of Washington at the time of initial diagnosis/report, are a reportable case in the relevant calendar year (January 1, XXXX – December 31, XXXX), and are given a valid DOH case classification of Probable or Confirmed as determined by the CDCcase definition.Changes were made to the way data were compiled in 2016. 26

Hepatitis C, Acute Statewide by Year
County2015
Cases2015Rate*
2016Cases
2016Rate*
2017Cases
2017Rate*
2018Cases
2018Rate*
2019Cases
2019Rate*
Year Cases Rate* Deaths
Adams 0 0 0 0 0 0 0 0 0 0 1981 54 1.3 8Asotin 0 0 0 0 0 0 0 0 0 0 1982 94 2.2 0Benton 0 0 0 0 0 0 0 0 0 0 1983 151 3.5 1Chelan 0 0 0 0 0 0 0 0 0 0 1984 131 3.0 2Clallam 2 + 1 + 0 0 0 0 1 + 1985 145 3.3 1Clark 0 0 0 0 1 + 3 + 6 1.2 1986 167 3.7 7Columbia 0 0 0 0 0 0 0 0 0 0 1987 207 4.6 1Cowlitz 0 0 1 + 3 + 0 0 1 + 1988 232 5.0 2Douglas 0 0 0 0 0 0 0 0 0 0 1989 208 4.4 4Ferry 0 0 0 0 0 0 0 0 0 0 1990 141 2.9 6Franklin 0 0 0 0 0 0 0 0 0 0 1991 164 3.3 4Garfield 0 0 0 0 0 0 0 0 0 0 1992 186 3.6 1Grant 0 0 0 0 0 0 0 0 1 + 1993 219 4.2 1Grays Harbor 0 0 0 0 0 0 0 0 0 0 1994 294 5.5 0Island 0 0 0 0 0 0 0 0 0 0 1995 234 4.3 1Jefferson 0 0 2 + 1 + 2 + 0 0 1996 66 1.2 1King 20 1.0 14 0.7 13 0.6 27 1.2 33 1.5 1997 42 0.7 0Kitsap 0 0 0 0 3 + 0 0 0 0 1998 29 0.5 0Kittitas 0 0 0 0 0 0 0 0 0 0 1999 24 0.4 0Klickitat 0 0 0 0 0 0 0 0 0 0 2000 44 0.7 0Lewis 0 0 0 0 0 0 0 0 0 0 2001 31 0.5 0Lincoln 0 0 0 0 0 0 0 0 0 0 2002 27 0.4 0Mason 0 0 1 + 0 0 1 + 0 0 2003 21 0.3 0Okanogan 0 0 0 0 0 0 0 0 0 0 2004 23 0.4 1Pacific 0 0 0 0 0 0 0 0 0 0 2005 21 0.3 0Pend Oreille 0 0 0 0 0 0 0 0 0 0 2006 23 0.4 0Pierce 22 2.7 31 3.7 27 3.1 41 4.7 20 2.3 2007 18 0.3 0San Juan 0 0 0 0 0 0 0 0 0 0 2008 25 0.4 0Skagit 2 + 6 4.9 2 1.6 3 + 1 + 2009 22 0.3 0Skamania 0 0 0 0 0 0 0 0 0 0 2010 25 0.4 0Snohomish 1 + 7 0.9 8 1.0 7 0.9 10 1.2 2011 41 0.6 0Spokane 13 2.7 24 4.9 7 1.4 15 3.0 15 2.9 2012 54 0.8 0Stevens 0 0 0 0 0 0 1 + 0 0 2013 63 0.9 0Thurston 0 0 1 + 0 0 4 + 0 0 2014 83 1.2 0Wahkiakum 0 0 0 0 0 0 0 0 0 0 2015 63 0.9 0Walla Walla 0 0 0 0 1 + 0 0 0 0 2016 95 1.3 0Whatcom 2 + 3 + 6 2.8 13 5.9 9 4.0 2017 73 1.0 0Whitman 0 0 0 0 0 0 1 + 0 0 2018 118 1.6 0Yakima 1 + 4 + 1 + 0 0 0 0 2019 97 1.3 0State Totals 63 0.9 95 1.3 73 1.0 118 1.6 97 1.3
*All incidence rates are cases per 100,000 population.+County incidence rates not calculated for <5 cases.Note: Cases of acute hepatitis C are included in this table if they are a resident of Washington at the time of initial diagnosis/report, are a reportable case
27
in the relevant calendar year (January 1, XXXX – December 31, XXXX), and are given a valid DOH case classification of Probable or Confirmed as determined by the CDC case definition.
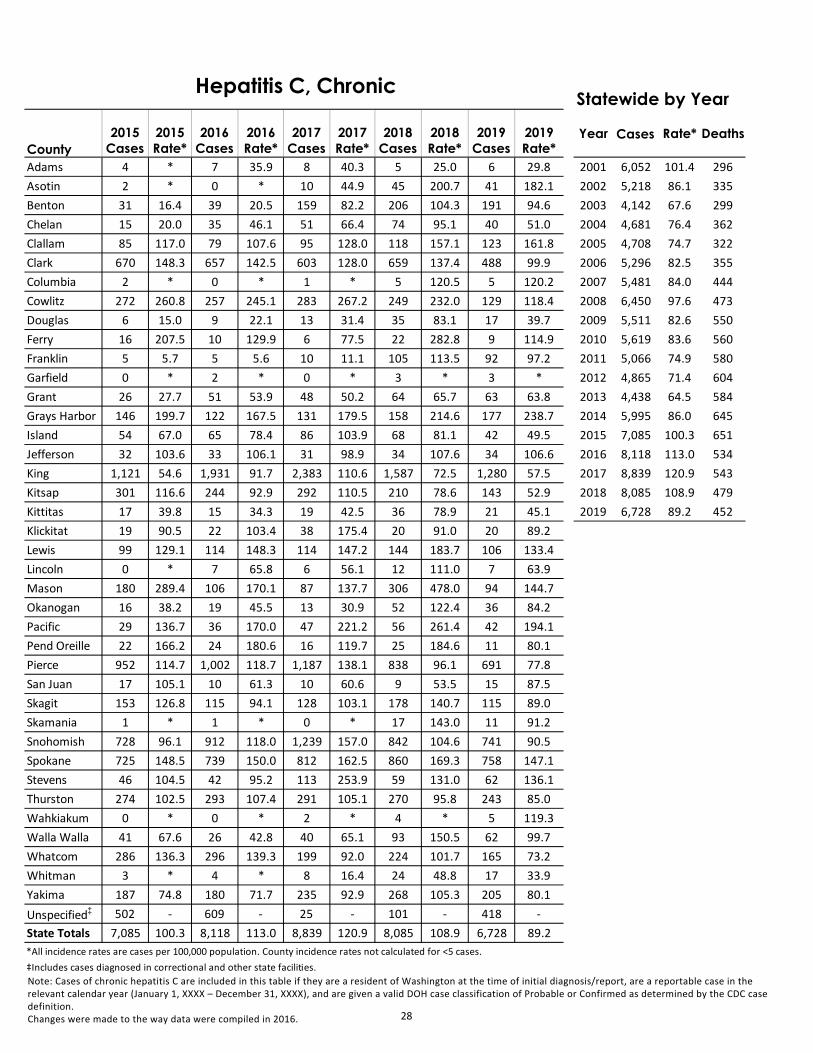
Hepatitis C, Chronic Statewide by Year
County2015
Cases2015Rate*
2016Cases
2016Rate*
2017Cases
2017Rate*
2018Cases
2018Rate*
2019Cases
2019Rate*
Year Cases Rate* Deaths
Adams 4 * 7 35.9 8 40.3 5 25.0 6 29.8 2001 6,052 101.4 296Asotin 2 * 0 * 10 44.9 45 200.7 41 182.1 2002 5,218 86.1 335Benton 31 16.4 39 20.5 159 82.2 206 104.3 191 94.6 2003 4,142 67.6 299Chelan 15 20.0 35 46.1 51 66.4 74 95.1 40 51.0 2004 4,681 76.4 362Clallam 85 117.0 79 107.6 95 128.0 118 157.1 123 161.8 2005 4,708 74.7 322Clark 670 148.3 657 142.5 603 128.0 659 137.4 488 99.9 2006 5,296 82.5 355Columbia 2 * 0 * 1 * 5 120.5 5 120.2 2007 5,481 84.0 444Cowlitz 272 260.8 257 245.1 283 267.2 249 232.0 129 118.4 2008 6,450 97.6 473Douglas 6 15.0 9 22.1 13 31.4 35 83.1 17 39.7 2009 5,511 82.6 550Ferry 16 207.5 10 129.9 6 77.5 22 282.8 9 114.9 2010 5,619 83.6 560Franklin 5 5.7 5 5.6 10 11.1 105 113.5 92 97.2 2011 5,066 74.9 580Garfield 0 * 2 * 0 * 3 * 3 * 2012 4,865 71.4 604Grant 26 27.7 51 53.9 48 50.2 64 65.7 63 63.8 2013 4,438 64.5 584Grays Harbor 146 199.7 122 167.5 131 179.5 158 214.6 177 238.7 2014 5,995 86.0 645Island 54 67.0 65 78.4 86 103.9 68 81.1 42 49.5 2015 7,085 100.3 651Jefferson 32 103.6 33 106.1 31 98.9 34 107.6 34 106.6 2016 8,118 113.0 534King 1,121 54.6 1,931 91.7 2,383 110.6 1,587 72.5 1,280 57.5 2017 8,839 120.9 543Kitsap 301 116.6 244 92.9 292 110.5 210 78.6 143 52.9 2018 8,085 108.9 479Kittitas 17 39.8 15 34.3 19 42.5 36 78.9 21 45.1 2019 6,728 89.2 452Klickitat 19 90.5 22 103.4 38 175.4 20 91.0 20 89.2Lewis 99 129.1 114 148.3 114 147.2 144 183.7 106 133.4Lincoln 0 * 7 65.8 6 56.1 12 111.0 7 63.9Mason 180 289.4 106 170.1 87 137.7 306 478.0 94 144.7Okanogan 16 38.2 19 45.5 13 30.9 52 122.4 36 84.2Pacific 29 136.7 36 170.0 47 221.2 56 261.4 42 194.1Pend Oreille 22 166.2 24 180.6 16 119.7 25 184.6 11 80.1Pierce 952 114.7 1,002 118.7 1,187 138.1 838 96.1 691 77.8San Juan 17 105.1 10 61.3 10 60.6 9 53.5 15 87.5Skagit 153 126.8 115 94.1 128 103.1 178 140.7 115 89.0Skamania 1 * 1 * 0 * 17 143.0 11 91.2Snohomish 728 96.1 912 118.0 1,239 157.0 842 104.6 741 90.5Spokane 725 148.5 739 150.0 812 162.5 860 169.3 758 147.1Stevens 46 104.5 42 95.2 113 253.9 59 131.0 62 136.1Thurston 274 102.5 293 107.4 291 105.1 270 95.8 243 85.0Wahkiakum 0 * 0 * 2 * 4 * 5 119.3Walla Walla 41 67.6 26 42.8 40 65.1 93 150.5 62 99.7Whatcom 286 136.3 296 139.3 199 92.0 224 101.7 165 73.2Whitman 3 * 4 * 8 16.4 24 48.8 17 33.9Yakima 187 74.8 180 71.7 235 92.9 268 105.3 205 80.1Unspecified‡ 502 - 609 - 25 - 101 - 418 -State Totals 7,085 100.3 8,118 113.0 8,839 120.9 8,085 108.9 6,728 89.2*All incidence rates are cases per 100,000 population. County incidence rates not calculated for <5 cases.‡Includes cases diagnosed in correctional and other state facilities.
28
Note: Cases of chronic hepatitis C are included in this table if they are a resident of Washington at the time of initial diagnosis/report, are a reportable case in the relevant calendar year (January 1, XXXX – December 31, XXXX), and are given a valid DOH case classification of Probable or Confirmed as determined by the CDC case definition. Changes were made to the way data were compiled in 2016.

Herpes Simplex Statewide by Year
County2015
Cases2015Rate*
2016Cases
2016Rate*
2017Cases
2017Rate*
2018Cases
2018Rate*
2019Cases
2019Rate*
Year Cases Rate* Deaths
Adams 2 + 3 + 3 + 5 + 1 + 2003 2,073 33.8 0Asotin 3 + 4 + 5 + 0 0 2 + 2004 2,153 34.7 0Benton 66 34.9 70 36.8 64 33.1 69 35.0 58 28.7 2005 2,331 37.0 0Chelan 4 + 9 + 15 + 9 + 8 + 2006 2,446 38.1 0Clallam 22 30.2 14 + 20 26.9 21 28.0 10 + 2007 1,952 29.9 0Clark 183 41.2 231 50.1 305 64.8 281 58.6 278 56.9 2008 2,009 30.4 0Columbia 0 0 0 0 0 0 0 0 0 0 2009 1,875 28.1 0Cowlitz 52 50.0 55 52.5 50 47.2 28 26.1 13 + 2010 2,028 30.2 0Douglas 1 + 1 + 6 + 2 + 3 + 2011 2,149 31.8 0Ferry 3 + 1 + 1 + 1 + 3 + 2012 2,197 32.2 0Franklin 36 40.4 40 45.1 27 29.9 31 33.5 27 28.5 2013 2,207 32.1 0Garfield 0 0 0 0 0 0 0 0 0 0 2014 2,082 29.9 0Grant 18 19.2 30 31.7 21 22.0 25 25.7 27 27.3 2015 2,524 36.0 0Grays Harbor 19 25.9 14 + 3 + 7 + 18 24.3 2016 2,548 35.5 0Island 22 27.4 14 + 9 + 26 31.0 19 22.4 2017 2,058 28.2 0Jefferson 5 + 3 + 4 + 2 + 2 + 2018 1,612 21.7 0King 770 38.0 739 35.1 356 16.5 15 + 17 0.8 2019 1,740 23.1 0Kitsap 91 35.5 67 25.5 108 40.9 75 28.1 86 31.8Kittitas 25 58.9 21 48.0 14 + 9 + 16 + Note: Data prior to 2009 are
Klickitat 2 + 5 + 1 + 2 + 1 + based on year reported rather
Lewis 8 + 20 26.0 9 + 10 + 1 + than year diagnosed.
Lincoln 2 + 4 + 0 0 0 0 0 0Mason 10 + 11 + 20 31.7 12 + 8 +Okanogan 7 + 14 + 1 + 3 + 13 +Pacific 3 + 6 + 0 0 5 + 0 0Pend Oreille 3 + 3 + 10 + 3 + 3 +Pierce 474 57.5 474 56.1 409 47.6 482 55.3 561 63.2San Juan 1 + 2 + 0 + 1 + 2 +Skagit 25 20.9 41 33.5 57 45.9 42 33.2 50 38.7Skamania 0 0 1 + 2 + 0 0 2 +Snohomish 217 29.1 203 26.3 127 16.1 92 11.4 137 16.7Spokane 186 38 206 41.8 163 32.6 148 29.1 138 26.8Stevens 6 + 2 + 11 + 7 + 4 +Thurston 67 25.2 99 36.3 72 26.0 77 27.3 90 31.5Wahkiakum 1 + 0 0 0 0 1 + 0 0Walla Walla 21 34.9 25 41.2 25 40.7 7 + 19 30.5Whatcom 53 25.4 45 21.2 53 24.5 61 27.7 58 25.7Whitman 6 + 8 + 11 + 7 + 8 +Yakima 110 44.0 63 25.1 76 30.0 46 18.1 57 22.3State Totals+ 2,524 36.0 2,548 35.5 2,058 28.2 1,612 21.7 1,740 23.1*All incidence rates are cases per 100,000 population.+County incidence rates based on counts ≤16 are suppressed due to statistical instability. Data source: PHIMS-STD 1/26/2021.
29
Note: Cases are included in this table if they are residing in Washington based on reported address at the time of diagnosis, are a reportable case in the relevant calendar year (January 1, XXXX – December 31, XXXX), and are given a valid DOH case classification of Probable or Confirmed as determined by the CDC case definition.
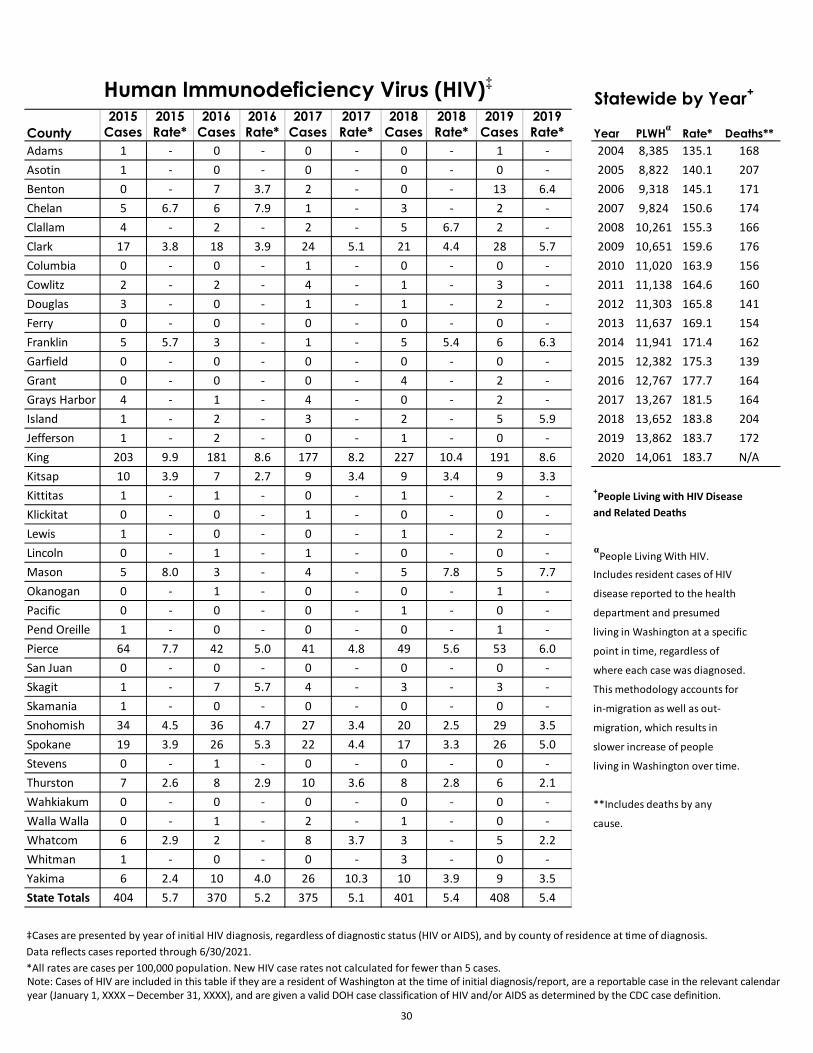
Human Immunodeficiency Virus (HIV)‡Statewide by Year+
County2015
Cases2015Rate*
2016Cases
2016Rate*
2017Cases
2017Rate*
2018Cases
2018Rate*
2019Cases
2019Rate* Year PLWHα Rate* Deaths**
Adams 1 - 0 - 0 - 0 - 1 - 2004 8,385 135.1 168Asotin 1 - 0 - 0 - 0 - 0 - 2005 8,822 140.1 207Benton 0 - 7 3.7 2 - 0 - 13 6.4 2006 9,318 145.1 171Chelan 5 6.7 6 7.9 1 - 3 - 2 - 2007 9,824 150.6 174Clallam 4 - 2 - 2 - 5 6.7 2 - 2008 10,261 155.3 166Clark 17 3.8 18 3.9 24 5.1 21 4.4 28 5.7 2009 10,651 159.6 176Columbia 0 - 0 - 1 - 0 - 0 - 2010 11,020 163.9 156Cowlitz 2 - 2 - 4 - 1 - 3 - 2011 11,138 164.6 160Douglas 3 - 0 - 1 - 1 - 2 - 2012 11,303 165.8 141Ferry 0 - 0 - 0 - 0 - 0 - 2013 11,637 169.1 154Franklin 5 5.7 3 - 1 - 5 5.4 6 6.3 2014 11,941 171.4 162Garfield 0 - 0 - 0 - 0 - 0 - 2015 12,382 175.3 139Grant 0 - 0 - 0 - 4 - 2 - 2016 12,767 177.7 164Grays Harbor 4 - 1 - 4 - 0 - 2 - 2017 13,267 181.5 164Island 1 - 2 - 3 - 2 - 5 5.9 2018 13,652 183.8 204Jefferson 1 - 2 - 0 - 1 - 0 - 2019 13,862 183.7 172King 203 9.9 181 8.6 177 8.2 227 10.4 191 8.6 2020 14,061 183.7 N/AKitsap 10 3.9 7 2.7 9 3.4 9 3.4 9 3.3Kittitas 1 - 1 - 0 - 1 - 2 - +People Living with HIV Disease
Klickitat 0 - 0 - 1 - 0 - 0 - and Related Deaths
Lewis 1 - 0 - 0 - 1 - 2 -Lincoln 0 - 1 - 1 - 0 - 0 - αPeople Living With HIV.Mason 5 8.0 3 - 4 - 5 7.8 5 7.7 Includes resident cases of HIVOkanogan 0 - 1 - 0 - 0 - 1 - disease reported to the healthPacific 0 - 0 - 0 - 1 - 0 - department and presumedPend Oreille 1 - 0 - 0 - 0 - 1 - living in Washington at a specificPierce 64 7.7 42 5.0 41 4.8 49 5.6 53 6.0 point in time, regardless of San Juan 0 - 0 - 0 - 0 - 0 - where each case was diagnosed.Skagit 1 - 7 5.7 4 - 3 - 3 - This methodology accounts forSkamania 1 - 0 - 0 - 0 - 0 - in-migration as well as out-Snohomish 34 4.5 36 4.7 27 3.4 20 2.5 29 3.5 migration, which results in Spokane 19 3.9 26 5.3 22 4.4 17 3.3 26 5.0 slower increase of people Stevens 0 - 1 - 0 - 0 - 0 - living in Washington over time.Thurston 7 2.6 8 2.9 10 3.6 8 2.8 6 2.1Wahkiakum 0 - 0 - 0 - 0 - 0 - **Includes deaths by anyWalla Walla 0 - 1 - 2 - 1 - 0 - cause.Whatcom 6 2.9 2 - 8 3.7 3 - 5 2.2Whitman 1 - 0 - 0 - 3 - 0 -Yakima 6 2.4 10 4.0 26 10.3 10 3.9 9 3.5State Totals 404 5.7 370 5.2 375 5.1 401 5.4 408 5.4
‡Cases are presented by year of initial HIV diagnosis, regardless of diagnostic status (HIV or AIDS), and by county of residence at time of diagnosis.Data reflects cases reported through 6/30/2021.*All rates are cases per 100,000 population. New HIV case rates not calculated for fewer than 5 cases.
30
Note: Cases of HIV are included in this table if they are a resident of Washington at the time of initial diagnosis/report, are a reportable case in the relevant calendar year (January 1, XXXX – December 31, XXXX), and are given a valid DOH case classification of HIV and/or AIDS as determined by the CDC case definition.

LegionellosisYear Cases Rate* Deaths1985 7 0.2 21986 15 0.3 81987 24 0.5 31988 29 0.6 41989 30 0.6 51990 18 0.4 41991 15 0.3 51992 15 0.3 51993 12 0.2 21994 13 0.2 21995 22 0.4 61996 7 0.1 21997 11 0.2 01998 15 0.3 21999 21 0.4 42000 19 0.3 12001 10 0.2 12002 8 0.1 32003 14 0.2 12004 15 0.2 42005 18 0.3 12006 20 0.3 12007 24 0.4 22008 19 0.3 12009 29 0.4 22010 35 0.5 42011 43 0.6 42012 30 0.4 52013 52 0.8 52014 63 0.9 82015 58 0.8 22016 72 1.0 102017 56 0.8 62018 54 0.7 72019 76 1.0 6
*All rates are cases per 100,000 population.
31

LeptospirosisYear Cases Rate* Deaths1986 0 0 01987 0 0 01988 0 0 01989 0 0 01990 0 0 01991 0 0 01992 0 0 01993 0 0 01994 0 0 01995 0 0 01996 2 0 01997 2 0 01998 0 0 01999 0 0 02000 0 0 02001 4 0 02002 0 0 02003 1 0 02004 0 0 02005 4 0 02006 1 0 02007 5 0 02008 1 0 02009 0 0 02010 1 0 02011 0 0 02012 2 0 02013 0 0 02014 0 0 02015 2 0 02016 2 0 02017 0 0 02018 3 0 02019 4 0 0
*All rates are cases per 100,000 population.
32

ListeriosisYear Cases Rate* Deaths1985 21 0.5 11986 37 0.8 51987 36 0.8 61988 38 0.8 41989 21 0.4 21990 22 0.5 31991 18 0.4 61992 13 0.3 01993 21 0.4 21994 13 0.2 31995 24 0.4 11996 11 0.2 31997 17 0.3 11998 12 0.2 31999 19 0.3 52000 12 0.2 22001 15 0.3 12002 11 0.2 02003 13 0.2 32004 13 0.2 32005 14 0.2 32006 18 0.3 32007 25 0.4 22008 29 0.4 32009 24 0.4 42010 24 0.4 12011 19 0.3 22012 26 0.4 52013 21 0.3 12014 24 0.3 52015 21 0.3 32016 14 0.2 22017 17 0.2 32018 15 0.2 22019 18 0.2 5
*All rates are cases per 100,000 population.
33

Lyme DiseaseYear Cases Rate* Deaths1986 1 0 01987 10 0.2 01988 12 0.3 01989 37 0.8 01990 33 0.7 01991 7 0.1 01992 14 0.3 01993 9 0.2 01994 4 0.1 01995 10 0.2 01996 18 0.3 01997 10 0.2 01998 7 0.1 01999 14 0.2 02000 9 0.2 02001 9 0.2 02002 12 0.2 02003 7 0.1 02004 14 0.2 02005 13 0.2 02006 8 0.1 02007 12 0.2 02008 23 0.3 02009 16 0.2 02010 16 0.2 02011 19 0.3 02012 15 0.2 02013 21 0.3 02014 15 0.2 02015 24 0.3 02016 31 0.4 02017 39 0.5 02018 20 0.3 02019 43 0.6 0
*All rates are cases per 100,000 population.
34

MalariaYear Cases Rate* Deaths1981 30 0.7 01982 24 0.6 01983 15 0.3 01984 20 0.5 01985 34 0.8 01986 35 0.8 01987 28 0.6 01988 24 0.5 01989 44 0.9 01990 33 0.7 01991 29 0.6 01992 21 0.4 01993 41 0.8 01994 45 0.8 01995 23 0.4 01996 41 0.7 01997 49 0.9 01998 30 0.5 01999 43 0.7 02000 43 0.7 02001 19 0.3 02002 26 0.4 02003 34 0.6 02004 24 0.4 02005 24 0.4 02006 43 0.7 12007 30 0.5 02008 32 0.5 02009 26 0.4 12010 39 0.6 02011 24 0.4 02012 26 0.4 02013 30 0.4 02014 41 0.6 02015 23 0.3 02016 46 0.6 02017 34 0.5 02018 40 0.5 02019 31 0.4 0
*All rates are cases per 100,000 population.
35

Measles Statewide by Year
County2015
Cases2015Rate*
2016Cases
2016Rate*
2017Cases
2017Rate*
2018Cases
2018Rate*
2019Cases
2019Rate* Year Cases Rate* Deaths
Adams 0 0 0 0 0 0 0 0 0 0 1980 178 4.3 0Asotin 0 0 0 0 0 0 0 0 0 0 1981 3 0.1 0Benton 0 0 0 0 0 0 0 0 0 0 1982 42 1.0 0Chelan 0 0 0 0 0 0 0 0 0 0 1983 43 1.0 0Clallam 6 8.3 0 0 0 0 0 0 0 0 1984 178 4.1 0Clark 0 0 0 0 0 0 1 + 71 14.5 1985 178 4.0 0Columbia 0 0 0 0 0 0 0 0 0 0 1986 176 3.9 0Cowlitz 0 0 0 0 0 0 0 0 0 0 1987 47 1.0 0Douglas 0 0 0 0 0 0 0 0 0 0 1988 7 0.2 0Ferry 0 0 0 0 0 0 0 0 0 0 1989 56 1.2 0Franklin 0 0 0 0 0 0 0 0 0 0 1990 357 7.3 2Garfield 0 0 0 0 0 0 0 0 0 0 1991 67 1.3 0Grant 0 0 0 0 0 0 0 0 0 0 1992 11 0.2 0Grays Harbor 1 + 0 0 0 0 0 0 0 0 1993 0 0.0 0Island 0 0 0 0 0 0 0 0 0 0 1994 5 0.1 0Jefferson 0 0 0 0 0 0 0 0 0 0 1995 17 0.3 0King 0 0 0 0 2 + 1 + 16 0.7 1996 38 0.7 0Kitsap 0 0 0 0 0 0 0 0 0 0 1997 2 0.0 0Kittitas 0 0 0 0 0 0 0 0 0 0 1998 1 0.0 0Klickitat 0 0 0 0 0 0 0 0 0 0 1999 5 0.1 0Lewis 0 0 0 0 0 0 0 0 0 0 2000 3 0.1 0Lincoln 0 0 0 0 0 0 0 0 0 0 2001 15 0.3 0Mason 0 0 0 0 0 0 0 0 0 0 2002 1 0.0 0Okanogan 0 0 0 0 0 0 0 0 0 0 2003 0 0.0 0Pacific 0 0 0 0 0 0 0 0 0 0 2004 7 0.1 0Pend Oreille 0 0 0 0 0 0 0 0 0 0 2005 1 0.0 0Pierce 0 0 0 0 0 0 0 0 2 + 2006 1 0.0 0San Juan 0 0 0 0 0 0 0 0 0 0 2007 3 0.0 0Skagit 0 0 0 0 0 0 0 0 0 0 2008 19 0.3 0Skamania 0 0 0 0 0 0 0 0 0 0 2009 1 0.0 0Snohomish 0 0 0 0 0 0 6 0.7 1 + 2010 1 0.0 0Spokane 2 + 0 0 0 0 0 0 0 0 2011 4 0.1 0Stevens 0 0 0 0 0 0 0 0 0 0 2012 0 0.0 0Thurston 0 0 0 0 0 0 0 0 0 0 2013 4 0.1 0Wahkiakum 0 0 0 0 0 0 0 0 0 0 2014 33 0.5 0Walla Walla 0 0 0 0 0 0 0 0 0 0 2015 10 0.1 1Whatcom 1 + 0 0 0 0 0 0 0 0 2016 0 0.0 0Whitman 0 0 0 0 1 + 0 0 0 0 2017 3 0.0 0Yakima 0 0 0 0 0 0 0 0 0 0 2018 8 0.1 0State Totals 10 0.1 0 0 3 0 8 0.1 90 1.2 2019 90 1.2 0
*All incidence rates are cases per 100,000 population.
+County incidence rates not calculated for <5 cases.
36

Meningococcal Disease Statewide by Year
County2015
Cases2015Rate*
2016Cases
2016Rate*
2017Cases
2017Rate*
2018Cases
2018Rate*
2019Cases
2019Rate*
Year Cases Rate* Deaths
Adams 0 0 0 0 0 0 0 0 0 0 1980 67 1.6 2Asotin 0 0 0 0 0 0 0 0 0 0 1981 78 1.8 3Benton 1 + 0 0 0 0 0 0 0 0 1982 56 1.3 2Chelan 1 + 0 0 0 0 0 0 0 0 1983 48 1.1 3Clallam 0 0 0 0 0 0 0 0 0 0 1984 56 1.3 3Clark 1 + 0 0 1 + 1 + 0 0 1985 67 1.5 6Columbia 0 0 0 0 0 0 0 0 0 0 1986 62 1.4 5Cowlitz 0 0 0 0 0 0 2 + 0 0 1987 87 1.9 4Douglas 0 0 0 0 0 0 0 0 0 0 1988 76 1.6 3Ferry 0 0 0 0 0 0 0 0 0 0 1989 96 2.0 12Franklin 0 0 0 0 0 0 0 0 1 + 1990 80 1.6 5Garfield 0 0 0 0 0 0 0 0 0 0 1991 73 1.5 8Grant 0 0 0 0 1 + 1 + 0 0 1992 92 1.8 5Grays Harbor 0 0 0 0 0 0 0 0 0 0 1993 97 1.8 6Island 0 0 0 0 0 0 0 0 1 + 1994 111 2.1 7Jefferson 0 0 0 0 0 0 0 0 0 0 1995 126 2.3 7King 3 + 3 + 2 + 5 0.2 4 + 1996 116 2.1 10Kitsap 0 0 0 0 1 + 0 0 0 0 1997 115 2.0 11Kittitas 0 0 0 0 0 0 0 0 0 0 1998 77 1.3 7Klickitat 0 0 0 0 0 0 0 0 0 0 1999 93 1.6 4Lewis 2 + 0 0 0 0 1 + 0 0 2000 71 1.2 6Lincoln 0 0 0 0 0 0 0 0 0 0 2001 71 1.2 6Mason 0 0 0 0 0 0 0 0 0 0 2002 76 1.3 8Okanogan 0 0 0 0 0 0 0 0 0 0 2003 61 1.0 7Pacific 0 0 0 0 0 0 0 0 0 0 2004 42 0.7 4Pend Oreille 0 0 0 0 0 0 0 0 0 0 2005 53 0.8 4Pierce 1 + 8 0.9 2 + 7 0.8 4 + 2006 45 0.7 1San Juan 0 0 0 0 0 0 0 0 0 0 2007 32 0.5 8Skagit 0 0 0 0 0 0 0 0 0 0 2008 40 0.6 4Skamania 0 0 0 0 0 0 0 0 0 0 2009 26 0.4 3Snohomish 0 0 1 + 1 + 0 0 1 + 2010 33 0.5 3Spokane 0 0 0 0 1 + 2 + 2 + 2011 22 0.3 0Stevens 0 0 0 0 0 0 0 0 0 0 2012 24 0.4 1Thurston 1 + 1 + 1 + 1 + 0 0 2013 20 0.3 3Wahkiakum 0 0 0 0 0 0 0 0 0 0 2014 17 0.2 2Walla Walla 0 0 0 0 0 0 0 0 0 0 2015 10 0.1 1Whatcom 0 0 0 0 1 + 0 0 1 + 2016 13 0.2 1Whitman 0 0 0 0 0 0 0 0 0 0 2017 11 0.2 1Yakima 0 0 0 0 0 0 0 0 0 0 2018 20 0.3 0State Totals 10 0.1 13 0.2 11 0.2 20 0.3 14 0.2 2019 14 0.2 0
*All incidence rates are cases per 100,000 population.
37
+County incidence rates not calculated for <5 cases.

MumpsYear Cases Rate* Deaths1980 166 4.0 01981 165 3.9 01982 102 2.4 01983 55 1.3 01984 56 1.3 01985 42 1.0 01986 30 0.7 01987 70 1.5 01988 44 1.0 01989 59 1.2 01990 66 1.4 01991 178 3.5 01992 18 0.4 01993 14 0.3 01994 23 0.4 01995 16 0.3 01996 26 0.5 01997 21 0.4 01998 11 0.2 01999 2 0 02000 10 0.2 02001 2 0 02002 0 0 02003 11 0.2 02004 2 0 02005 3 0 02006 42 0.7 02007 53 0.8 02008 14 0.2 02009 6 0.1 02010 7 0.1 02011 2 0 02012 2 0 02013 2 0 02014 9 0.1 02015 7 0.1 02016 152 2.1 02017 779 10.7 02018 58 0.8 02019 55 0.7 0
*All rates are cases per 100,000 population.
38

Pertussis Statewide by Y
County2015
Cases2015Rate*
2016Cases
2016Rate*
2017Cases
2017Rate*
2018Cases^
2018Rate*^
2019Cases
2019Rate* Year Cases Rate*
Adams 1 + 1 + 1 + 0 0 0 0 1980 77 1.9Asotin 1 + 1 + 0 0 0 0 0 0 1981 58 1.4Benton 4 + 7 3.7 5 2.6 7 3.5 2 + 1982 36 0.8Chelan 5 6.7 1 + 3 + 10 12.9 3 + 1983 20 0.5Clallam 4 + 12 16.3 0 0 0 0 5 6.6 1984 326 7.5Clark 322 71.0 64 13.9 101 21.4 106 22.1 123 25.2 1985 92 2.1Columbia 3 + 0 0 0 0 0 0 0 0 1986 163 3.7Cowlitz 24 23.0 21 20.0 12 11.3 63 58.7 36 33.0 1987 110 2.4Douglas 1 + 0 0 1 + 3 + 1 + 1988 130 2.8Ferry 0 0 0 0 0 0 0 0 7 89.4 1989 201 4.3Franklin 1 + 1 + 3 + 5 5.4 1 + 1990 227 4.7Garfield 0 0 0 0 0 0 0 0 0 0 1991 149 3.0Grant 14 14.9 4 + 64 66.9 13 13.4 2 + 1992 241 4.7Grays Harbor 10 13.7 10 13.7 1 + 4 + 1 + 1993 96 1.8Island 17 21.1 4 + 2 + 2 + 5 5.9 1994 140 2.6Jefferson 30 97.2 13 41.8 2 + 0 0 0 0 1995 491 9.0King 210 10.2 121 5.7 121 5.6 103 4.7 54 2.4 1996 830 14.9Kitsap 95 36.8 14 5.3 10 3.8 6 2.2 6 2.2 1997 481 8.5Kittitas 7 16.4 8 18.3 5 11.2 16 35.1 0 0 1998 406 7.1Klickitat 5 23.8 0 0 0 0 0 0 0 0 1999 739 12.7Lewis 16 20.9 2 + 5 6.5 7 8.9 16 20.1 2000 458 7.8Lincoln 0 0 0 0 0 0 5 46.3 1 + 2001 184 3.1Mason 4 + 2 + 5 7.9 0 0 2 + 2002 575 9.5Okanogan 0 0 0 0 0 0 18 42.4 4 + 2003 844 13.8Pacific 10 47.1 0 0 0 0 0 0 0 0 2004 842 13.6Pend Oreille 1 + 0 0 0 0 1 + 2 + 2005 1,026 16.3Pierce 157 18.9 87 10.3 119 13.8 59 6.8 66 7.4 2006 377 5.9San Juan 0 0 2 + 1 + 0 0 0 0 2007 482 7.4Skagit 5 4.1 11 9.0 17 13.7 7 5.5 2 + 2008 460 7.0Skamania 1 + 0 0 0 0 1 + 0 0 2009 291 4.4Snohomish 244 32.2 81 10.5 47 6.0 43 5.3 19 2.3 2010 607 9.0Spokane 48 9.8 67 13.6 34 6.8 62 12.2 178 34.5 2011 962 14.2Stevens 1 + 3 + 0 0 0 0 9 19.7 2012 4,916 72.1Thurston 32 12.0 24 8.8 19 6.9 24 8.5 11 3.8 2013 748 10.9Wahkiakum 0 0 0 0 0 0 0 0 1 + 2014 600 8.6Walla Walla 37 61 0 0 1 + 2 + 4 + 2015 1,383 19.6Whatcom 61 29.1 52 24.5 95 43.9 53 24.1 33 14.6 2016 618 8.6Whitman 2 + 1 + 0 0 0 0 0 0 2017 740 10.1Yakima 10 4.0 4 + 66 26.1 11 4.3 4 1.6 2018 631^ 8.5State Totals 1,383 19.6 618 8.6 740 10.1 631 8.5 598 7.9 2019 598 7.9*All incidence rates are cases per 100,000 population. +County incidence rates not calculated for <5 cases.^Previously reported as 847 cases. Has now been amended to include four cases that are not included in the CDC's 2018 count for WA state. Additionally,the previous case count erroneously included 220 suspected cases, which have now been removed. The final corrected 2018 pertussis case count for WA is 631.
39

PlagueYear Cases Rate* Deaths1986 0 0 01987 0 0 01988 0 0 01989 0 0 01990 0 0 01991 0 0 01992 0 0 01993 0 0 01994 0 0 01995 0 0 01996 0 0 01997 0 0 01998 0 0 01999 0 0 02000 0 0 02001 0 0 02002 0 0 02003 0 0 02004 0 0 02005 0 0 02006 0 0 02007 0 0 02008 0 0 02009 0 0 02010 0 0 02011 0 0 02012 0 0 02013 0 0 02014 0 0 02015 0 0 02016 0 0 02017 0 0 02018 0 0 02019 0 0 0
*All rates are cases per 100,000 population.
40

PoliomyelitisYear Cases Rate* Deaths1985 0 0 01986 0 0 01987 1‡ 0 01988 1‡ 0 01989 0 0 01990 0 0 01991 1‡ 0 01992 1‡ 0 01993 1‡ 0 01994 0 0 01995 0 0 01996 0 0 01997 0 0 01998 0 0 01999 0 0 02000 0 0 02001 0 0 02002 0 0 02003 0 0 02004 0 0 02005 0 0 02006 0 0 02007 0 0 02008 0 0 02009 0 0 02010 0 0 02011 0 0 02012 0 0 02013 0 0 02014 0 0 02015 0 0 02016 0 0 02017 0 0 02018 0 0 02019 0 0 0
*All rates are cases per 100,000 population.‡Vaccine-associated cases.
41

Prion Disease, Human
Year sCJD Familial CJD
Iatrogenic CJD VPSPr GSS
Syndrome
Total (Definate or Probable)
2008 17 0 0 0 0 172009 7 2 0 0 0 92010 7 1 0 0 0 82011 9 0 0 0 0 92012 14 1 0 1 0 162013 13 0 1 0 1 152014 11 1 0 0 0 122015 11 1 0 0 0 122016 17 1 0 0 0 182017 10 0 0 0 0 102018 15 0 0 0 0 152019 10 0 0 0 0 10
sCJD: Spontaneous CJDGSS: Gerstmann-Straussler-Scheinker diseaseVPSPr: Variably protease-sensitive prionopath
Note: RT-QuIC testing became standard in 2015 and integrated in the case definition in 2018.
42
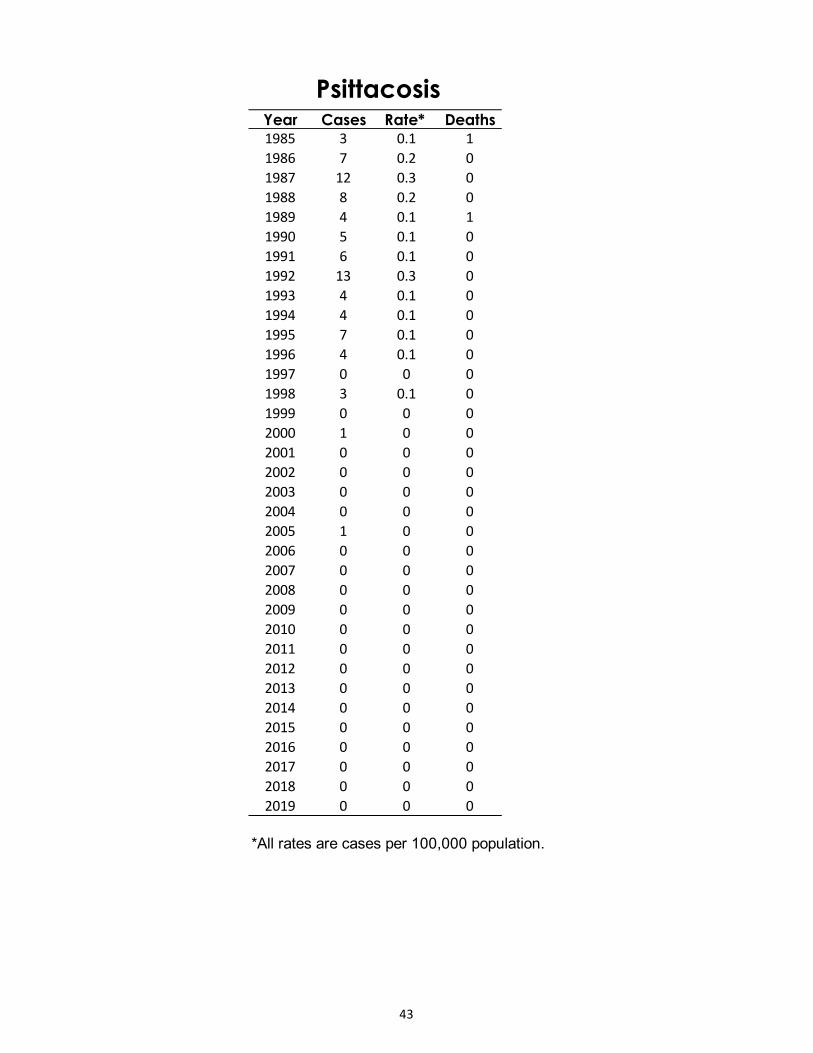
PsittacosisYear Cases Rate* Deaths1985 3 0.1 11986 7 0.2 01987 12 0.3 01988 8 0.2 01989 4 0.1 11990 5 0.1 01991 6 0.1 01992 13 0.3 01993 4 0.1 01994 4 0.1 01995 7 0.1 01996 4 0.1 01997 0 0 01998 3 0.1 01999 0 0 02000 1 0 02001 0 0 02002 0 0 02003 0 0 02004 0 0 02005 1 0 02006 0 0 02007 0 0 02008 0 0 02009 0 0 02010 0 0 02011 0 0 02012 0 0 02013 0 0 02014 0 0 02015 0 0 02016 0 0 02017 0 0 02018 0 0 02019 0 0 0
*All rates are cases per 100,000 population.
43

Q FeverYear Cases Rate* Deaths1986 2 0 01987 1 0 11988 1 0 01989 0 0 01990 2 0 01991 0 0 01992 1 0 01993 0 0 01994 0 0 01995 1 0 01996 0 0 01997 0 0 01998 0 0 01999 1 0 02000 0 0 02001 0 0 02002 0 0 02003 0 0 02004 0 0 02005 2 0 02006 0 0 02007 1 0 02008 0 0 02009 1 0 02010 3 0 12011 8 0.1 02012 3 0 22013 3 0 02014 1 0 02015 3 0 02016 7 0.1 02017 2 0 02018 3 0 02019 3 0 0
*All rates are cases per 100,000 population.
44
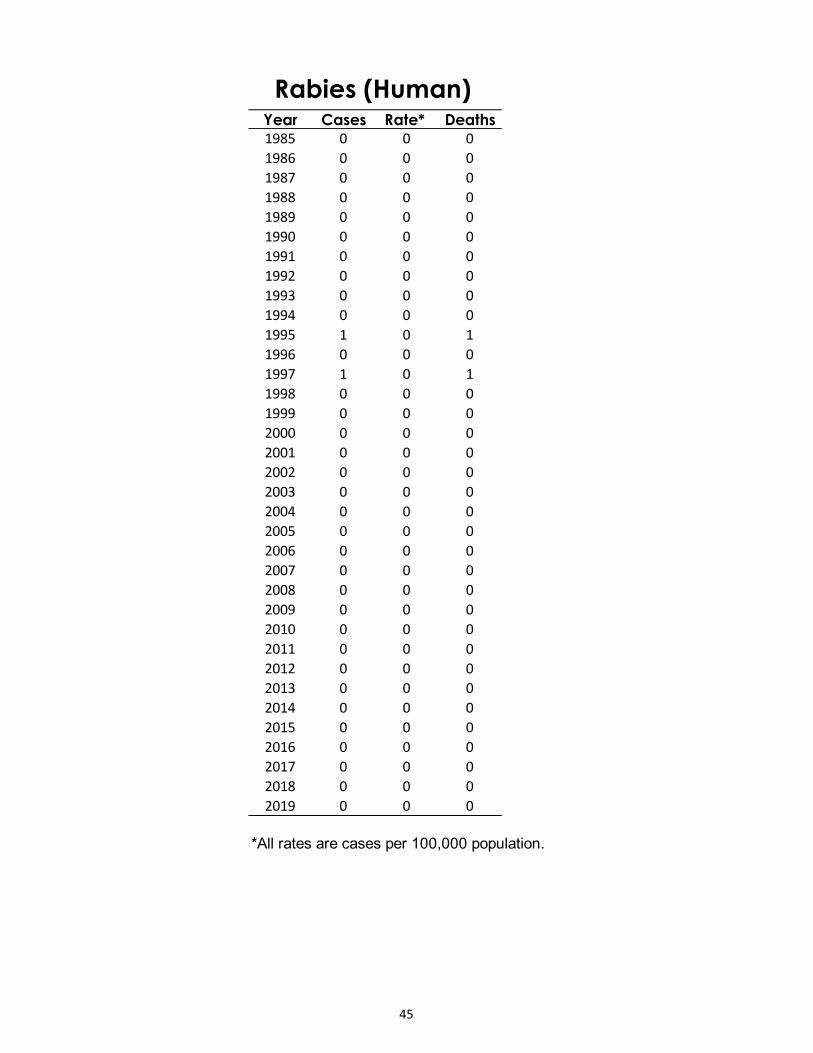
Rabies (Human)Year Cases Rate* Deaths1985 0 0 01986 0 0 01987 0 0 01988 0 0 01989 0 0 01990 0 0 01991 0 0 01992 0 0 01993 0 0 01994 0 0 01995 1 0 11996 0 0 01997 1 0 11998 0 0 01999 0 0 02000 0 0 02001 0 0 02002 0 0 02003 0 0 02004 0 0 02005 0 0 02006 0 0 02007 0 0 02008 0 0 02009 0 0 02010 0 0 02011 0 0 02012 0 0 02013 0 0 02014 0 0 02015 0 0 02016 0 0 02017 0 0 02018 0 0 02019 0 0 0
*All rates are cases per 100,000 population.
45
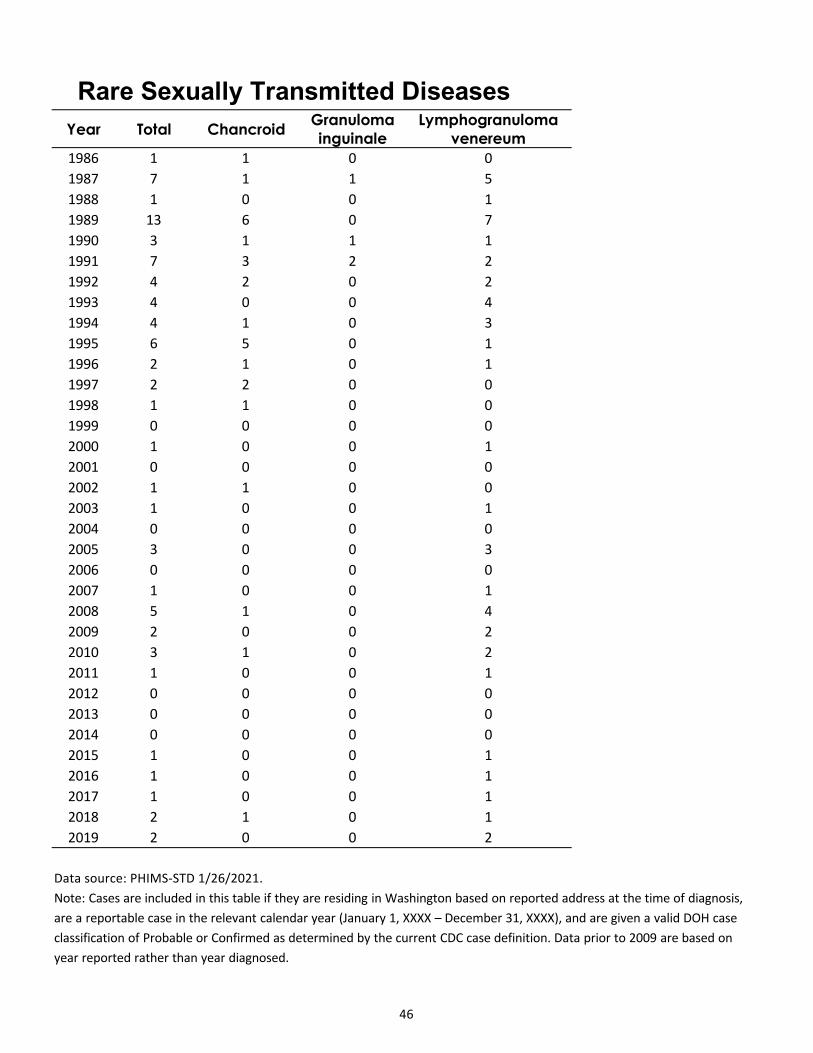
Rare Sexually Transmitted DiseasesYear Total Chancroid Granuloma
inguinaleLymphogranuloma
venereum1986 1 1 0 01987 7 1 1 51988 1 0 0 11989 13 6 0 71990 3 1 1 11991 7 3 2 21992 4 2 0 21993 4 0 0 41994 4 1 0 31995 6 5 0 11996 2 1 0 11997 2 2 0 01998 1 1 0 01999 0 0 0 02000 1 0 0 12001 0 0 0 02002 1 1 0 02003 1 0 0 12004 0 0 0 02005 3 0 0 32006 0 0 0 02007 1 0 0 12008 5 1 0 42009 2 0 0 22010 3 1 0 22011 1 0 0 12012 0 0 0 02013 0 0 0 02014 0 0 0 02015 1 0 0 12016 1 0 0 12017 1 0 0 12018 2 1 0 12019 2 0 0 2
Data source: PHIMS-STD 1/26/2021.Note: Cases are included in this table if they are residing in Washington based on reported address at the time of diagnosis, are a reportable case in the relevant calendar year (January 1, XXXX – December 31, XXXX), and are given a valid DOH case classification of Probable or Confirmed as determined by the current CDC case definition. Data prior to 2009 are based on year reported rather than year diagnosed.
46

Relapsing FeverYear Cases Rate* Deaths1986 2 0 01987 7 0.2 11988 5 0.1 01989 5 0.1 01990 4 0.1 01991 6 0.1 01992 6 0.1 01993 2 0 01994 9 0.2 01995 12 0.2 01996 8 0.1 01997 4 0.1 01998 5 0.1 01999 3 0.1 02000 5 0.1 12001 1 0 02002 7 0.1 02003 6 0.1 02004 6 0.1 02005 6 0.1 02006 2 0 02007 9 0.1 02008 4 0.1 02009 5 0.1 02010 7 0.1 02011 11 0.2 02012 6 0.1 02013 4 0.1 02014 7 0.1 02015 3 0.1 02016 1 0.1 02017 3 0 02018 9 0.1 02019 4 0.1 0
*All rates are cases per 100,000 population.
47

RubellaYear Cases Rate* Deaths1981 108 2.6 01982 58 1.4 01983 10 0.2 01984 2 0 01985 16 0.4 01986 15 0.3 01987 2 0 01988 0 0 01989 2 0 01990 6 0.1 01991 8 0.2 01992 8 0.2 01993 3 0.1 01994 0 0 01995 2 0 01996 15 0.3 01997 5 0.1 01998 5 0.1 01999 5 0.1 02000 8 0.1 02001 0 0 02002 2 0 02003 0 0 02004 0 0 02005 1 0 02006 0 0 02007 0 0 02008 0 0 02009 0 0 02010 1 0 02011 2 0 02012 0 0 02013 1 0 02014 0 0 02015 0 0 02016 0 0 02017 0 0 02018 0 0 02019 0 0 0
*All rates are cases per 100,000 population.
48

Salmonellosis Statewide by Year
County2015
Cases2015Rate*
2016Cases
2016Rate*
2017Cases
2017Rate*
2018Cases
2018Rate*
2019Cases
2019Rate*
Year Cases Rate* Deaths
Adams 2 10.3 1 + 2 + 2 + 1 + 1980 462 11.2 0Asotin 0 0 1 + 1 + 1 + 1 + 1981 574 13.6 5Benton 26 13.8 25 13.1 24 12.4 15 7.6 15 7.4 1982 749 17.5 0Chelan 6 8 4 + 3 + 9 11.6 6 7.7 1983 739 17.2 0Clallam 5 6.9 7 9.5 3 + 9 12 8 10.5 1984 515 11.8 0Clark 49 10.8 77 16.7 66 14.0 64 13.3 52 10.6 1985 565 12.8 0Columbia 0 0 0 0 1 + 0 0 0 0 1986 783 17.5 2Cowlitz 15 14.4 14 13.4 10 9.4 17 15.8 12 11.0 1987 660 14.6 1Douglas 2 + 3 + 2 + 1 + 1 + 1988 612 13.3 0Ferry 0 0 1 + 0 0 0 0 0 0 1989 630 13.3 2Franklin 11 12.6 11 12.4 5 5.5 6 6.5 7 7.4 1990 634 13.0 6Garfield 1 + 0 0 0 0 1 + 0 0 1991 791 15.8 1Grant 10 10.6 3 + 13 13.6 9 9.2 12 12.2 1992 609 11.8 1Grays Harbor 5 6.8 4 + 8 11.0 6 8.2 6 8.1 1993 830 15.8 0Island 6 7.4 3 + 7 8.5 6 7.2 9 10.6 1994 863 16.1 0Jefferson 1 + 5 16.1 2 + 2 + 3 + 1995 691 12.6 0King 435 21.2 234 11.1 242 11.2 310 14.2 248 11.1 1996 734 13.2 0Kitsap 22 8.5 23 8.8 21 8.0 19 7.1 18 6.7 1997 675 11.9 0Kittitas 6 14.1 5 11.4 9 20.1 1 + 1 + 1998 703 12.2 2Klickitat 2 + 3 + 3 + 2 + 2 + 1999 792 13.6 2Lewis 8 10.4 6 7.8 11 14.2 5 6.4 7 8.8 2000 659 11.2 1Lincoln 1 + 1 + 1 + 0 0 1 + 2001 681 11.4 2Mason 9 14.5 7 11.2 4 + 2 + 8 12.3 2002 655 10.8 0Okanogan 1 + 4 + 4 + 2 + 7 16.4 2003 699 11.4 1Pacific 2 + 3 + 2 + 0 0 3 + 2004 660 10.6 2Pend Oreille 0 0 0 0 0 0 0 0 0 0 2005 626 9.9 0Pierce 95 11.4 101 12.0 116 13.5 76 8.7 73 8.2 2006 627 9.8 3San Juan 8 49.4 1 + 0 0 2 + 1 + 2007 758 11.6 2Skagit 6 5 6 4.9 14 11.3 17 13.4 11 8.5 2008 846 12.8 3Skamania 2 + 0 0 0 0 2 + 1 + 2009 820 12.3 2Snohomish 120 15.8 78 10.1 80 10.1 94 11.7 80 9.8 2010 780 11.6 3Spokane 45 9.2 40 8.1 46 9.2 38 7.5 34 6.6 2011 589 8.7 2Stevens 5 11.4 4 + 6 13.5 2 + 5 11.0 2012 842 12.4 0Thurston 40 15.0 19 7.0 27 9.8 27 9.6 30 10.5 2013 671 9.7 1Wahkiakum 0 0 0 0 0 0 0 0 0 0 2014 741 10.6 2Walla Walla 8 13.2 7 11.5 6 9.8 5 8.1 13 20.9 2015 1,034 14.6 1Whatcom 26 12.4 23 10.8 18 8.3 27 12.3 22 9.8 2016 754 10.5 2Whitman 6 12.7 0 0 0 0 1 + 2 + 2017 810 11.1 4Yakima 48 19.2 30 12.0 53 20.9 48 18.9 34 13.3 2018 828 11.1 3State Totals 1,034 14.6 754 10.5 810 11.1 828 11.1 725 9.6 2019 725 9.6 0
*All incidence rates are cases per 100,000 population.
+County incidence rates not calculated for <5 cases.
49

Shellfish Poisoning:Paralytic, Domoic Acid, Diarrhetic
Year Cases Rate* Deaths1985 3 0.1 01986 0 0 01987 0 0 01988 7 0.2 01989 0 0 01990 0 0 01991 0 0 01992 0 0 01993 0 0 01994 0 0 01995 0 0 01996 0 0 01997 0 0 01998 5 0.1 01999 0 0 02000 7 0.1 02001 0 0 02002 0 0 02003 0 0 02004 0 0 02005 1 0 02006 1 0 02007 0 0 02008 0 0 02009 0 0 02010 0 0 02011 0 0 02012 9 0.1 02013 0 0 02014 0 0 02015 1 0 02016 0 0 02017 0 0 02018 0 0 02019 0 0 0
50
*All rates are cases per 100,000 population.

Statewide by Year
County2015
Cases2015Rate*
2016Cases
2016Rate*
2017Cases
2017Rate*
2018Cases
2018Rate*
2019Cases
2019Rate* Year Cases Rate* Deaths
Adams 3 + 0 0 0 0 1 + 0 0 1988 167 3.6 0Asotin 1 + 0 0 1 + 0 0 1 + 1989 157 3.3 1Benton 8 4.2 12 6.3 11 5.7 10 5.1 15 7.4 1990 220 4.5 0Chelan 4 + 1 + 2 + 4 + 0 0 1991 164 3.3 0Clallam 2 + 0 0 4 + 2 + 2 + 1992 300 5.8 2Clark 45 10.0 25 5.4 38 8.1 27 5.6 25 5.1 1993 741 14.1 3Columbia 0 0 0 0 0 0 0 0 2 + 1994 174 3.2 2Cowlitz 8 7.7 3 + 6 5.7 5 4.7 3 + 1995 140 2.6 1Douglas 1 + 0 0 0 0 2 + 1 + 1996 187 3.4 1Ferry 0 0 0 0 0 0 1 + 0 0 1997 149 2.6 0Franklin 2 + 4 + 0 0 6 6.5 4 + 1998 144 2.5 0Garfield 1 + 1 + 0 0 1 + 0 0 1999 186 3.2 0Grant 9 9.6 3 + 7 7.3 5 5.1 6 6.1 2000 237 4.0 0Grays Harbor 4 + 1 + 1 + 2 + 1 + 2001 150 2.5 0Island 3 + 0 0 2 + 4 + 6 7.1 2002 166 2.7 0Jefferson 2 + 0 0 3 + 5 15.8 1 + 2003 128 2.1 0King 113 5.5 121 5.7 129 6.0 198 9.0 197 8.8 2004 153 2.5 3Kitsap 3 + 5 1.9 6 2.3 11 4.1 5 1.9 2005 149 2.4 0Kittitas 4 + 4 + 9 20.1 4 + 5 10.7 2006 162 2.5 0Klickitat 0 0 0 0 2 + 1 + 2 + 2007 141 2.2 0Lewis 6 7.8 7 9.1 3 + 6 7.7 4 + 2008 189 2.9 1Lincoln 1 + 0 0 1 + 0 0 0 0 2009 206 3.1 0Mason 0 0 3 + 2 + 2 + 2 + 2010 226 3.4 1Okanogan 1 + 1 + 2 + 3 + 4 + 2011 203 3.0 1Pacific 0 0 0 0 1 + 0 0 1 + 2012 239 3.5 0Pend Oreille 0 0 2 + 0 0 1 + 0 0 2013 330 4.8 3Pierce 26 3.1 33 3.9 41 4.8 45 5.2 37 4.2 2014 229 4.3 2San Juan 0 0 4 + 1 + 4 + 3 + 2015 419 5.9 1Skagit 12 9.9 10 8.2 9 7.3 18 14.2 12 9.3 2016 340 4.7 0Skamania 0 0 0 0 0 0 0 0 0 0 2017 404 5.5 1Snohomish 35 4.6 26 3.4 32 4.1 49 6.1 53 6.5 2018 540 7.3 2Spokane 17 3.5 17 3.5 22 4.4 26 5.1 21 4.1 2019 465 6.2 2Stevens 2 + 2 + 0 0 2 + 3 +Thurston 8 3.0 13 4.8 16 5.8 31 11 21 7.3Wahkiakum 0 0 0 0 0 0 0 0 1 +Walla Walla 1 + 1 + 1 + 4 + 2 +Whatcom 75 35.8 17 8.0 24 11.1 16 7.3 10 4.4Whitman 2 + 1 + 0 0 1 + 0 0Yakima 20 8.0 23 9.2 28 11.1 43 16.9 15 5.9State Totals 419 5.9 340 4.7 404 5.5 540 7.3 465 6.2
*All incidence rates are cases per 100,000 population.
+County incidence rates not calculated for <5 cases.
Shiga Toxin-Producing Escherichia Coli (STEC)
51

Shigellosis Statewide by Year
County2015
Cases2015Rate*
2016Cases
2016Rate*
2017Cases
2017Rate*
2018Cases
2018Rate*
2019Cases
2019Rate*
Year Cases Rate* Deaths
Adams 5 25.8 19 97.4 4 + 3 + 2 + 1980 287 6.9 0Asotin 0 0 0 0 1 + 0 0 0 0 1981 426 10.1 1Benton 2 + 1 + 5 2.6 6 3 10 5.0 1982 284 6.6 0Chelan 1 + 2 + 2 + 3 + 1 + 1983 370 8.6 0Clallam 0 0 1 + 2 + 2 + 6 7.9 1984 224 5.1 0Clark 10 2.2 11 2.4 14 3.0 13 2.7 12 2.5 1985 144 3.3 0Columbia 0 0 0 0 0 0 0 0 0 0 1986 321 7.2 0Cowlitz 2 + 2 + 0 0 2 + 0 0 1987 318 7.0 0Douglas 1 + 0 0 1 + 1 + 0 0 1988 306 6.6 0Ferry 0 0 0 0 0 0 0 0 0 0 1989 232 4.9 0Franklin 1 + 3 + 0 0 2 + 2 + 1990 278 5.7 0Garfield 0 0 0 0 0 0 0 0 0 0 1991 405 8.1 0Grant 7 7.5 1 + 1 + 3 + 2 + 1992 439 8.5 0Grays Harbor 0 0 0 0 6 8.2 3 + 0 0 1993 797 15.1 0Island 2 + 0 0 1 + 1 + 1 + 1994 478 8.9 0Jefferson 0 0 0 0 1 + 2 + 1 + 1995 426 7.8 0King 78 3.8 82 3.9 160 7.4 268 12.2 178 8.0 1996 333 6.0 1Kitsap 6 2.3 1 + 5 1.9 7 2.6 6 2.2 1997 318 5.6 0Kittitas 2 + 0 0 0 0 1 + 1 + 1998 277 4.8 0Klickitat 0 0 0 0 0 0 0 0 1 + 1999 172 2.9 0Lewis 0 0 1 + 0 0 0 0 2 + 2000 501 8.5 0Lincoln 0 0 0 0 0 0 0 0 0 0 2001 236 4.0 0Mason 0 0 1 + 0 0 1 + 2 + 2002 230 3.8 0Okanogan 0 0 0 0 2 + 0 0 1 + 2003 188 3.1 0Pacific 0 0 0 0 0 0 0 0 1 + 2004 133 2.1 0Pend Oreille 0 0 1 + 0 0 0 0 0 0 2005 185 2.9 0Pierce 14 1.7 9 1.1 22 2.6 20 2.3 27 3.0 2006 170 2.6 0San Juan 0 0 1 + 0 0 0 0 1 + 2007 159 2.4 0Skagit 0 0 1 + 9 7.3 7 5.5 3 + 2008 116 1.8 0Skamania 0 0 0 0 0 0 0 0 1 + 2009 153 2.3 0Snohomish 15 2 18 2.3 19 2.4 35 4.3 21 2.6 2010 112 1.7 0Spokane 2 + 10 2.0 8 1.6 7 1.4 7 1.4 2011 104 1.5 0Stevens 0 0 0 0 0 0 2 + 0 0 2012 133 2.0 0Thurston 1 + 3 + 3 + 9 3.2 8 2.8 2013 122 1.8 0Wahkiakum 0 0 0 0 0 0 0 0 0 0 2014 157 2.3 0Walla Walla 0 0 0 0 1 + 0 0 6 9.6 2015 152 2.2 0Whatcom 1 + 6 2.8 5 2.3 2 + 3 + 2016 191 2.7 0Whitman 1 + 0 0 0 0 1 + 1 + 2017 285 3.9 0Yakima 1 + 17 6.8 13 5.1 18 7.1 7 2.7 2018 419 5.6 0State Totals 152 2.2 191 2.7 285 3.9 419 5.6 314 4.2 2019 314 4.2 1
*All incidence rates are cases per 100,000 population.
+County incidence rates not calculated for <5 cases.
52

Syphilis (Primary and Secondary) Statewide by Year
County2015
Cases2015Rate*
2016Cases
2016Rate*
2017Cases
2017Rate*
2018Cases
2018Rate*
2019Cases
2019Rate*
Year Cases Rate* Deaths
Adams 0 + 0 + 1 + 0 + 2 + 1982 172 4.0 0Asotin 0 + 0 + 1 + 0 + 0 + 1983 196 4.6 0Benton 13 + 4 + 6 + 9 + 24 11.9 1984 158 3.6 2Chelan 1 + 1 + 3 + 2 + 3 + 1985 115 2.6 2Clallam 1 + 2 + 5 + 2 + 2 + 1986 194 4.3 0Clark 21 4.7 21 4.6 33 7 33 6.9 37 7.6 1987 176 3.9 0Columbia 0 + 0 + 0 + 1 + 0 + 1988 265 5.7 0Cowlitz 4 + 3 + 21 19.8 27 25.2 20 18.4 1989 461 9.8 0Douglas 0 + 1 + 0 + 1 + 1 + 1990 354 7.3 0Ferry 0 + 0 + 0 + 0 + 0 + 1991 178 3.5 0Franklin 6 + 3 + 2 + 4 + 11 + 1992 85 1.7 0Garfield 0 + 0 + 0 + 0 + 0 + 1993 67 1.3 0Grant 9 + 9 + 4 + 2 + 7 + 1994 36 0.7 0Grays Harbor 0 + 1 + 3 + 13 + 8 + 1995 17 0.3 0Island 0 + 0 + 2 + 1 + 1 + 1996 9 0.2 0Jefferson 0 + 0 + 1 + 1 + 0 + 1997 17 0.3 0King 250 12.3 292 13.9 323 15 397 18.1 346 15.5 1998 44 0.8 0Kitsap 6 + 14 + 18 6.8 24 9.0 22 8.1 1999 77 1.3 0Kittitas 3 + 0 + 3 + 0 + 2 + 2000 66 1.1 0Klickitat 0 + 1 + 1 + 2 + 0 + 2001 57 1.0 0Lewis 1 + 0 + 5 + 6 + 10 + 2002 70 1.2 0Lincoln 0 + 0 + 0 + 0 + 0 + 2003 82 1.3 0Mason 4 + 6 + 5 + 10 + 8 + 2004 150 2.4 0Okanogan 1 + 1 + 2 + 4 + 0 + 2005 152 2.4 0Pacific 0 + 2 + 1 + 1 + 0 + 2006 182 2.8 0Pend Oreille 0 + 1 + 1 + 2 + 0 + 2007 168 2.6 0Pierce 41 5 58 6.9 63 7.3 66 7.6 92 10.4 2008 181 2.7 0San Juan 0 + 0 + 1 + 0 + 1 + 2009 135 2.0 0Skagit 5 + 4 + 2 + 3 + 6 + 2010 261 3.9 0Skamania 1 + 1 + 0 + 0 + 1 + 2011 329 4.9 0Snohomish 25 3.4 48 6.2 53 6.7 43 5.3 47 5.7 2012 300 4.4 0Spokane 28 5.7 60 12.2 78 15.6 104 20.5 129 25.0 2013 285 4.1 0Stevens 1 + 1 + 0 + 4 + 2 + 2014 337 4.8 0Thurston 9 + 6 + 8 + 18 6.4 26 9.1 2015 452 6.5 0Wahkiakum 0 + 1 + 1 + 0 + 0 + 2016 566 7.9 0Walla Walla 3 + 3 + 5 + 6 + 0 + 2017 674 9.2 0Whatcom 6 + 8 + 6 + 9 + 11 + 2018 809 10.9 0Whitman 1 + 3 + 2 + 2 + 3 + 2019 830 11.0 0Yakima 7 + 11 + 14 + 12 + 8 +State Totals 452 6.5 566 7.9 674 9.2 809 10.9 830 11.0 Note: Data prior to 2009 are
based on year reported not year diagnosed.
*All incidence rates are cases per 100,000 population.+County incidence rates based on counts ≤16 are suppressed due to statistical instability.
53
Data source: PHIMS-STD 1/26/2021.Note: Cases are included in this table if they are residing in Washington based on reported address at the time of diagnosis, are a reportable case in the relevant calendar year (January 1, XXXX – December 31, XXXX), and are given a valid DOH case classification of Probable or Confirmed as determined by the current CDC case definition.

TetanusYear Cases Rate* Deaths1985 0 0 01986 0 0 01987 1 0 01988 1 0 01989 1 0 01990 1 0 01991 1 0 01992 3 0.1 01993 1 0 01994 1 0 01995 0 0 01996 1 0 01997 1 0 01998 0 0 01999 0 0 02000 1 0 02001 0 0 02002 0 0 02003 0 0 02004 0 0 02005 1 0 02006 0 0 02007 0 0 02008 0 0 02009 0 0 02010 0 0 02011 0 0 02012 1 0 02013 0 0 02014 3 0 12015 0 0 02016 0 0 02017 0 0 02018 1 0 02019 2 0 0
*All rates are cases per 100,000 population.
54

TrichinosisYear Cases Rate* Deaths1986 0 0 01987 0 0 01988 0 0 01989 2 0 01990 1 0 01991 0 0 01992 1 0 01993 1 0 01994 0 0 01995 0 0 01996 0 0 01997 0 0 01998 0 0 01999 0 0 02000 1 0 02001 0 0 02002 0 0 02003 0 0 02004 0 0 02005 0 0 02006 1 0 02007 0 0 02008 0 0 02009 0 0 02010 0 0 02011 0 0 02012 0 0 02013 0 0 02014 2 0 02015 1 0 02016 0 0 02017 1 0 02018 0 0 02019 0 0 0
*All rates are cases per 100,000 population.
55

Tuberculosis (TB) Statewide by Year
County2015
Cases2015Rate*
2016Cases
2016Rate*
2017Cases
2017Rate*
2018Cases
2018Rate*
2019Cases
2019Rate* Year Cases Rate* Deaths
Adams 0 0 1 + 0 0 1 + 0 0 1980 424 10.3 13Asotin 0 0 0 0 0 0 0 0 0 0 1981 401 9.5 15Benton 3 + 2 + 4 + 2 + 2 + 1982 301 7.0 6Chelan 3 + 2 + 0 0 2 + 0 0 1983 239 5.5 10Clallam 0 0 1 + 1 + 0 0 0 0 1984 207 4.8 6Clark 6 1.3 8 1.7 10 2.1 7 1.5 8 1.6 1985 220 5.0 5Columbia 0 0 0 0 0 0 0 0 0 0 1986 218 4.9 3Cowlitz 2 + 0 0 0 0 1 + 2 + 1987 255 5.6 10Douglas 2 + 1 + 1 + 0 0 0 0 1988 236 5.1 9Ferry 0 0 0 0 0 0 0 0 0 0 1989 248 5.2 4Franklin 3 + 3 + 1 + 3 + 2 + 1990 284 5.8 12Garfield 0 0 0 0 0 0 0 0 0 0 1991 309 6.2 7Grant 0 0 1 + 1 + 0 0 0 0 1992 306 6.0 7Grays Harbor 0 0 1 + 1 + 0 0 2 + 1993 283 5.5 7Island 0 0 0 0 0 0 2 + 0 0 1994 260 4.9 6Jefferson 0 0 0 0 0 0 0 0 0 0 1995 277 5.1 2King 95 4.6 102 4.8 97 4.5 94 4.3 132 5.9 1996 283 5.2 3Kitsap 5 1.9 1 + 5 1.9 1 + 3 + 1997 304 5.4 6Kittitas 1 + 0 0 0 0 1 + 0 0 1998 265 4.7 5Klickitat 0 0 1 + 0 0 0 0 0 0 1999 258 4.5 5Lewis 1 + 2 + 2 + 2 + 0 0 2000 258 4.4 2Lincoln 0 0 0 0 0 0 0 0 0 0 2001 261 4.4 6Mason 1 + 1 + 2 + 0 0 0 0 2002 252 4.2 4Okanogan 1 + 2 + 3 + 0 0 0 0 2003 250 4.1 11Pacific 2 + 0 0 0 0 1 + 0 0 2004 245 3.9 9Pend Oreille 0 0 0 0 0 0 0 0 0 0 2005 255 4.0 14Pierce 14 1.7 21 2.5 17 2.0 19 2.2 23 2.6 2006 262 4.1 18San Juan 0 0 0 0 0 0 0 0 0 0 2007 291 4.5 12Skagit 5 4.1 0 0 2 + 1 + 0 0 2008 228 3.5 2Skamania 0 0 0 0 0 0 0 0 0 0 2009 255 3.8 5Snohomish 31 4.1 30 3.9 29 3.7 21 2.6 24 2.9 2010 233 3.5 8Spokane 2 + 2 + 2 + 11 2.2 9 1.7 2011 197 2.9 6Stevens 0 0 0 0 0 0 0 0 0 0 2012 185 2.7 6Thurston 6 2.2 7 2.6 3 + 5 1.8 1 + 2013 210 3.1 6Wahkiakum 0 0 0 0 0 0 0 0 0 0 2014 194 2.8 4Walla Walla 1 + 0 0 0 0 0 0 1 + 2015 207 2.9 5Whatcom 7 3.3 2 + 6 2.8 5 2.3 4 + 2016 204 2.8 9Whitman 1 + 0 0 0 0 0 0 0 0 2017 207 2.8 4Yakima 12 4.8 7 2.8 7 2.8 5 2.0 5 2.0 2018 190 2.6 10State Totals‡ 207 2.9 204 2.8 207 2.8 190 2.6 221 2.9 2019 221 2.9 6
*All incidence rates are cases per 100,000 population. +County incidence are suppressed for <5 cases due to inherent instability of resulting estimate.‡Includes cases entered at the state level into the Washington Disease Reporting System (WDRS).
Note: TB-related deaths prior to 2009 are reported here as per year of death in the TB surveillance record. TB-related deaths 2009 and later are reported here as per year case was counted.
56

TularemiaYear Cases Rate* Deaths1986 1 0 01987 4 0.1 01988 1 0 01989 2 0 01990 4 0.1 01991 2 0 01992 2 0 01993 2 0 01994 1 0 01995 4 0.1 01996 2 0 01997 2 0 01998 8 0.1 01999 2 0 02000 2 0 02001 5 0.1 02002 3 0 02003 2 0 02004 4 0.1 02005 10 0.2 02006 1 0 02007 1 0 02008 4 0.1 02009 5 0.1 12010 3 0 02011 5 0.1 02012 5 0.1 02013 5 0.1 02014 4 0.1 02015 4 0.1 02016 1 0 02017 6 0.1 02018 4 0.1 02019 4 0.1 0
*All rates are cases per 100,000 population.
57

Typhoid FeverYear Cases Rate* Deaths1985 3 0.1 01986 3 0.1 01987 9 0.2 01988 13 0.3 01989 11 0.2 01990 22 0.5 01991 10 0.2 01992 11 0.2 01993 8 0.2 01994 12 0.2 01995 4 0.1 01996 4 0.1 01997 7 0.1 01998 8 0.1 01999 8 0.1 02000 6 0.1 02001 7 0.1 02002 7 0.1 02003 4 0.1 02004 6 0.1 02005 11 0.2 02006 7 0.1 02007 7 0.1 02008 15 0.2 02009 4 0.1 02010 22 0.3 02011 9 0.1 02012 11 0.2 02013 11 0.2 02014 15 0.2 02015 10 0.1 02016 13 0.2 02017 14 0.2 02018 12 0.2 02019 26 0.3 0
*All rates are cases per 100,000 population.
58

VibriosisYear Cases Rate* Deaths1985 4 0.1 01986 7 0.2 01987 18 0.4 01988 11 0.2 01989 4 0.1 01990 30 0.6 01991 4 0.1 01992 7 0.1 01993 33 0.6 01994 9 0.2 01995 6 0.1 01996 3 0.1 01997 58 1.0 01998 41 0.7 01999 21 0.4 02000 20 0.3 02001 9 0.2 02002 25 0.4 02003 18 0.3 02004 28 0.5 02005 20 0.3 02006 80 1.2 02007 25 0.4 02008 29 0.4 02009 48 0.7 02010 59 0.9 02011 45 0.7 02012 67 1.0 02013 90 1.3 02014 92 1.3 02015 68 1.0 02016 63 0.9 12017 95 1.3 02018 217 2.9 12019 159 2.1 0
*All rates are cases per 100,000 population.
59
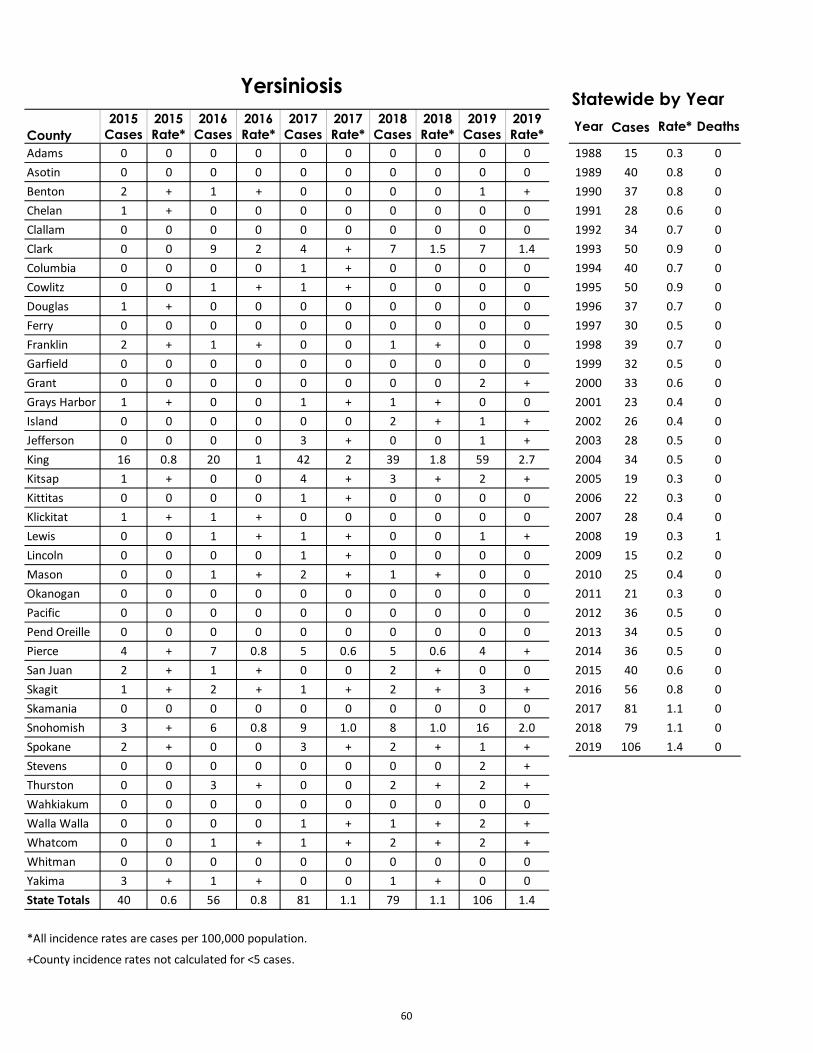
Yersiniosis Statewide by Year
County2015
Cases2015Rate*
2016Cases
2016Rate*
2017Cases
2017Rate*
2018Cases
2018Rate*
2019Cases
2019Rate* Year Cases Rate* Deaths
Adams 0 0 0 0 0 0 0 0 0 0 1988 15 0.3 0Asotin 0 0 0 0 0 0 0 0 0 0 1989 40 0.8 0Benton 2 + 1 + 0 0 0 0 1 + 1990 37 0.8 0Chelan 1 + 0 0 0 0 0 0 0 0 1991 28 0.6 0Clallam 0 0 0 0 0 0 0 0 0 0 1992 34 0.7 0Clark 0 0 9 2 4 + 7 1.5 7 1.4 1993 50 0.9 0Columbia 0 0 0 0 1 + 0 0 0 0 1994 40 0.7 0Cowlitz 0 0 1 + 1 + 0 0 0 0 1995 50 0.9 0Douglas 1 + 0 0 0 0 0 0 0 0 1996 37 0.7 0Ferry 0 0 0 0 0 0 0 0 0 0 1997 30 0.5 0Franklin 2 + 1 + 0 0 1 + 0 0 1998 39 0.7 0Garfield 0 0 0 0 0 0 0 0 0 0 1999 32 0.5 0Grant 0 0 0 0 0 0 0 0 2 + 2000 33 0.6 0Grays Harbor 1 + 0 0 1 + 1 + 0 0 2001 23 0.4 0Island 0 0 0 0 0 0 2 + 1 + 2002 26 0.4 0Jefferson 0 0 0 0 3 + 0 0 1 + 2003 28 0.5 0King 16 0.8 20 1 42 2 39 1.8 59 2.7 2004 34 0.5 0Kitsap 1 + 0 0 4 + 3 + 2 + 2005 19 0.3 0Kittitas 0 0 0 0 1 + 0 0 0 0 2006 22 0.3 0Klickitat 1 + 1 + 0 0 0 0 0 0 2007 28 0.4 0Lewis 0 0 1 + 1 + 0 0 1 + 2008 19 0.3 1Lincoln 0 0 0 0 1 + 0 0 0 0 2009 15 0.2 0Mason 0 0 1 + 2 + 1 + 0 0 2010 25 0.4 0Okanogan 0 0 0 0 0 0 0 0 0 0 2011 21 0.3 0Pacific 0 0 0 0 0 0 0 0 0 0 2012 36 0.5 0Pend Oreille 0 0 0 0 0 0 0 0 0 0 2013 34 0.5 0Pierce 4 + 7 0.8 5 0.6 5 0.6 4 + 2014 36 0.5 0San Juan 2 + 1 + 0 0 2 + 0 0 2015 40 0.6 0Skagit 1 + 2 + 1 + 2 + 3 + 2016 56 0.8 0Skamania 0 0 0 0 0 0 0 0 0 0 2017 81 1.1 0Snohomish 3 + 6 0.8 9 1.0 8 1.0 16 2.0 2018 79 1.1 0Spokane 2 + 0 0 3 + 2 + 1 + 2019 106 1.4 0Stevens 0 0 0 0 0 0 0 0 2 +Thurston 0 0 3 + 0 0 2 + 2 +Wahkiakum 0 0 0 0 0 0 0 0 0 0Walla Walla 0 0 0 0 1 + 1 + 2 +Whatcom 0 0 1 + 1 + 2 + 2 +Whitman 0 0 0 0 0 0 0 0 0 0Yakima 3 + 1 + 0 0 1 + 0 0State Totals 40 0.6 56 0.8 81 1.1 79 1.1 106 1.4
*All incidence rates are cases per 100,000 population.
+County incidence rates not calculated for <5 cases.
60

61
Appendix I: Other Tables

*In prior years, this column was labeled “Total # Cases.” ^Includes cases from other states that are part of the outbreak.
62
Foodborne Disease Outbreaks 2019
#
Local Health
Jurisdiction
Month of 1st Illness
Onset Illness Agent
# Washington State Cases*
Total # Outbreak
Cases^ Implicated
Food Contributing Factors Setting 1 King January Bacillus cereus 4 4 Rice C-N/A-Contributing Factors- not applicable, P2-No
attempt was made to control the temperature of implicated food or the length of time food was out of temperature control (during food service or display of food), P7-Improper hot holding due to improper procedure or protocol, P8-Improper/slow cooling
Restaurant - Sit-down dining
2 King January Grimontia hollisae 2 2 Crab C6-Contaminated raw product- food was intended to be consumed after a kill step, C7-Contaminated raw product-food was intended to be consumed raw or undercooked/under-processed
Private home/residence
3 Multistate January Salmonella Newport
4 15
Tuna Unknown Restaurant - other or unknown type
4 King January Unknown 28 28
Undetermined C10- Bare-hand contact by a food handler/worker/preparer who is suspected to be infectious, C15-Other source of contamination
Restaurant - Sit-down dining
5 Benton February Norovirus 26 26
Multiple C10- Bare-hand contact by a food handler/worker/preparer who is suspected to be infectious
Restaurant - Sit-down dining
6 Pierce February Norovirus 23 23
Undetermined C11-Glove-hand contact by a food handler/worker/preparer who is suspected to be infectious, C15-Other source of contamination
Restaurant - Sit-down dining

*In prior years, this column was labeled “Total # Cases.” ^Includes cases from other states that are part of the outbreak.
63
#
Local Health
Jurisdiction
Month of 1st Illness
Onset Illness Agent
# Washington State Cases*
Total # Outbreak
Cases^ Implicated
Food Contributing Factors Setting 7 Pierce February Norovirus 74 74 Undetermined C10- Bare-hand contact by a food
handler/worker/preparer who is suspected to be infectious, C11-Glove-hand contact by a food handler/worker/preparer who is suspected to be infectious, C15-Other source of contamination
Restaurant - Sit-down dining
8 Pierce March Norovirus 4 4 Raw oysters C7-Contaminated raw product-food was intended to be consumed raw or undercooked/under-processed
Restaurant - Sit-down dining
9 Grays Harbor
March Norovirus 17 17 Cupcakes C10- Bare-hand contact by a food handler/worker/preparer who is suspected to be infectious, C11-Glove-hand contact by a food handler/worker/preparer who is suspected to be infectious
Prison/jail
10 Multistate March Vibrio parahaemolyticus
15 15 Raw oysters C7-Contaminated raw product-food was intended to be consumed raw or undercooked/under-processed
Restaurant - other or unknown type
11 King April Norovirus 31 31 Undetermined C10- Bare-hand contact by a food handler/worker/preparer who is suspected to be infectious, C15-Other source of contamination, S5-Other process failures that permit pathogen survival
Restaurant - other or unknown type
12 King April Norovirus 7 7 Undetermined C11-Glove-hand contact by a food handler/worker/preparer who is suspected to be infectious, C15-Other source of contamination
Restaurant - Sit-down dining
13 King April Salmonella Reading
1 107 Turkey C6-Contaminated raw product- food was intended to be consumed after a kill step, P5-Improper cold holding due to an improper procedure or protocol, S1-Insufficient time and/or temperature control during initial cooking/heat processing
Other

*In prior years, this column was labeled “Total # Cases.” ^Includes cases from other states that are part of the outbreak.
64
#
Local Health
Jurisdiction
Month of 1st Illness
Onset Illness Agent
# Washington State Cases*
Total # Outbreak
Cases^ Implicated
Food Contributing Factors Setting 14 Multistate May E. coli O157:H7 4 4 Ground beef Unknown Private
home/residence
15 Multistate May Salmonella Bovismorbificans
9 9 Undetermined Unknown Unknown
16 Pierce May Unknown 1 44 Undetermined C4-Addition of excessive quantities of ingredients that are toxic in large amounts, P4-Improper cold holding due to malfunctioning refrigeration equipment, P7-Improper hot holding due to improper procedure or protocol
Restaurant - "Fast-food"
17 Pierce May Unknown 39 39 Undetermined C3-Poisonous substance accidentally/inadvertently added, P5-Improper cold holding due to an improper procedure or protocol, P7-Improper hot holding due to improper procedure or protocol, P8-Improper/slow cooling
Restaurant - Buffet
18 Multistate May Vibrio parahaemolyticus
43 43 Raw oysters C7-Contaminated raw product-food was intended to be consumed raw or undercooked/under-processed
Restaurant - Sit-down dining
19 Benton June Norovirus 13 13 Undetermined C11-Glove-hand contact by a food handler/worker/preparer who is suspected to be infectious
Restaurant - Sit-down dining

*In prior years, this column was labeled “Total # Cases.” ^Includes cases from other states that are part of the outbreak.
65
#
Local Health
Jurisdiction
Month of 1st Illness
Onset Illness Agent
# Washington State Cases*
Total # Outbreak
Cases^ Implicated
Food Contributing Factors Setting 20 Clark July Multiple non-
Shiga toxin-producing E. coli
1 30 Pulled pork C6-Contaminated raw product- food was intended to be consumed after a kill step, C9-Cross-contamination of ingredients (cross-contamination does not include ill food workers), P2-No attempt was made to control the temperature of implicated food or the length of time food was out of temperature control (during food service or display of food), P8-Improper/slow cooling, S1-Insufficient time and/or temperature control during initial cooking/heat processing, S2-Insufficient time and/or temperature during reheating
Caterer
21 Spokane July Norovirus 14 14 Multiple C11-Glove-hand contact by a food handler/worker/preparer who is suspected to be infectious, C12-Other mode of contamination (excluding cross-contamination) by a food handler/worker/preparer who is suspected to be infectious, C15-Other source of contamination, S4-Insufficient or improper use of chemical processes designed for pathogen destruction
Restaurant - Sit-down dining
22 Multistate July Salmonella Berta 3 10 Pork Unknown Restaurant - Sit-down dining
23 Multistate August E. coli O26:H11 9 9 Spinach Unknown Restaurant - other or unknown type

*In prior years, this column was labeled “Total # Cases.” ^Includes cases from other states that are part of the outbreak.
66
#
Local Health
Jurisdiction
Month of 1st Illness
Onset Illness Agent
# Washington State Cases*
Total # Outbreak
Cases^ Implicated
Food Contributing Factors Setting 24 Benton August Norovirus 7 7 Undetermined C10- Bare-hand contact by a food
handler/worker/preparer who is suspected to be infectious, C11-Glove-hand contact by a food handler/worker/preparer who is suspected to be infectious, C13- Foods contaminated by non-food handler/worker/preparer who is suspected to be infectious, C15-Other source of contamination, S4-Insufficient or improper use of chemical processes designed for pathogen destruction
Long-term care facility
25 Multistate August Salmonella Dublin 42 42 Ground beef C6-Contaminated raw product- food was intended to be consumed after a kill step
Private home/residence
26 Multistate August Salmonella Enteritidis
2 2 Undetermined C9-Cross-contamination of ingredients (cross-contamination does not include ill food workers)
Restaurant - Sit-down dining
27 Multistate September E. coli O157:H7 16 16 Romaine lettuce
Unknown Restaurant - "Fast-food"
28 King September Norovirus 3 3 Undetermined C11-Glove-hand contact by a food handler/worker/preparer who is suspected to be infectious
Restaurant - Sit-down dining
29 King October Norovirus 52 52 Undetermined Unknown Restaurant - Sit-down dining
30 Pierce October Norovirus 1 9 Undetermined C10- Bare-hand contact by a food handler/worker/preparer who is suspected to be infectious, C15-Other source of contamination
Restaurant - "Fast-food"
31 Stevens November Campylobacter spp.
3 3 Raw Milk C7-Contaminated raw product-food was intended to be consumed raw or undercooked/under-processed
Farm/dairy

*In prior years, this column was labeled “Total # Cases.” ^Includes cases from other states that are part of the outbreak.
67
#
Local Health
Jurisdiction
Month of 1st Illness
Onset Illness Agent
# Washington State Cases*
Total # Outbreak
Cases^ Implicated
Food Contributing Factors Setting 32 King November E. coli O157:H7 12 12 Romaine
lettuce C7-Contaminated raw product-food was intended to be consumed raw or undercooked/under-processed, C8-Foods originating from sources shown to be contaminated or polluted (such as a growing field or harvest area)
Restaurant - "Fast-food"
33 King November Norovirus 21 21 Undetermined Unknown
Restaurant - Sit-down dining
34 King November Norovirus 7 7 Undetermined C11-Glove-hand contact by a food handler/worker/preparer who is suspected to be infectious, C12-Other mode of contamination (excluding cross-contamination) by a food handler/worker/preparer who is suspected to be infectious
Restaurant - Sit-down dining
35 Multistate November Salmonella Javiana
4 4 Mixed cut fruit C-N/A-Contributing Factors- not applicable, P1-Food preparation practices that support proliferation of pathogens (during food preparation), P5-Improper cold holding due to an improper procedure or protocol
Distributed product
36 King November Scombroid toxin 2 2 Albacore Tuna C1-Toxic substance part of tissue
Restaurant - Sit-down dining
37 Kitsap December Giardia spp. 11 59 Raw oysters C7-Contaminated raw product-food was intended to be consumed raw or undercooked/under-processed, C8-Foods originating from sources shown to be contaminated or polluted (such as a growing field or harvest area), C14- Storage in contaminated environment
Restaurant - Sit-down dining

*In prior years, this column was labeled “Total # Cases.” ^Includes cases from other states that are part of the outbreak.
68
#
Local Health
Jurisdiction
Month of 1st Illness
Onset Illness Agent
# Washington State Cases*
Total # Outbreak
Cases^ Implicated
Food Contributing Factors Setting 38 Snohomish December Norovirus 1 13 Undetermined C11-Glove-hand contact by a food
handler/worker/preparer who is suspected to be infectious, C13- Foods contaminated by non-food handler/worker/preparer who is suspected to be infectious, C15-Other source of contamination, S4-Insufficient or improper use of chemical processes designed for pathogen destruction,
Restaurant - Sit-down dining
39 King December Norovirus 1 23 Multiple C7-Contaminated raw product-food was intended to be consumed raw or undercooked/under-processed, C9-Cross-contamination of ingredients (cross-contamination does not include ill food workers), C15-Other source of contamination, S4-Insufficient or improper use of chemical processes designed for pathogen destruction
Restaurant - Sit-down dining
40 Skagit December Norovirus 6 172 Undetermined C11-Glove-hand contact by a food handler/worker/preparer who is suspected to be infectious, C15-Other source of contamination, S4-Insufficient or improper use of chemical processes designed for pathogen destruction
Restaurant - Sit-down dining
41 Franklin December Unknown 1 165 Undetermined C11-Glove-hand contact by a food handler/worker/preparer who is suspected to be infectious, C15-Other source of contamination
Restaurant - "Fast-food"

69
Foodborne Outbreaks 1986-2019 Year Cases Outbreaks
1986 346 58 1987 311 51
1988 545 55
1989 531 51
1990 665 34
1991 1,154 47
1992 740 53
1993 1,301 130
1994 1,462 151
1995 909 138
1996 695 124
1997 810 108
1998 706 60
1999 1,164 93
2000 938 66
2001 574 69
2002 704 56
2003 620 55
2004 679 58
2005 390 42
2006 677 51
2007 722 43
2008 564 46
2009 307 27
2010 344 37
2011 371 30
2012 552 27
2013 437 37
2014 432 45
2015 505 36
2016 543 49
2017 1,016 66
2018 549 62
2019 564 41

70
Haemophilus influenzae 2010-2019 H. influenzae Cases Among Children <5 Years Old by Serotype, Washington State, 2010-2019
Year Number of cases
No specimen available
(n)
Case was serotyped
(n)
Serotyping results
Serotype b
(n)
Other serotypes
(n)
Not typeable
(n)
Vaccine-preventable (Serotype b)
(%)
2010 10 0 10 0 3 7 0 2011 8 0 8 1 3 4 13 2012 4 0 4 1 1 2 25 2013 11 0 11 2 2 7 18 2014 9 0 9 4 2 3 45 2015 5 0 5 1 2 2 20 2016 9 1 8 1 2 5 13 2017 7 0 7 1 3 3 14 2018 13 0 13 4 7 2 31 2019 16 0 16 0 4 12 0
Total 92 1 91 15 29 47 16

71
Meningococcal Disease (Invasive) Meningococcal Disease Cases by Serogroup, Washington State, 2010-2019
* Data updated since the 2012 Annual Report
Year Number of cases
No specimen available
(n)
Case was serogrouped
(n)
Serogrouping results
Group B
(n)
Group C
(n)
Group Y
(n)
Group W135
(n)
Other/Non-Groupable
(n)
Vaccine-preventable
MenACWY (%)
MenB (%)
2010 29 2 27 7 7 12 1 0 74 26 2011 22 0 22 12 2 7 1 0 45 55 2012 24 0 24 9 4 8 0 3 50 38* 2013 20 3 17 9 2 3 2 1 41 53 2014 17 0 17 6 5 4 1 1 59 35 2015 10 0 10 3 4 1 2 0 70 30 2016 13 1 12 3 6 1 1 1 67 25 2017 11 0 11 3 6 0 0 2 55 27 2018 21 0 21 5 13 1 0 2 67 24 2019 14 0 14 1 6 3 2 2 79 7
Total 181 6 175 58 55 40 10 12 60 33

72
Highly Antibiotic Resistant Organism Surveillance 2012-2019 Carbapenemase-producing Carbapenem-resistant Enterobacterales (CRE) Cases by Genus, Washington State, 2012-2019
Genus Carbapenamase^ 2012 2013 2014 2015 2016 2017 2018 2019
Enterobacter spp.*
IMP 0 1 0 0 0 0 0 0 KPC 0 0 1 1 2 1 2 5 NDM 0 0 0 0 2 4 0 3
Escherichia spp.
KPC 0 1 0 1 1 1 0 2 NDM 0 2 2 3 5 5 7 5 OXA-48 0 0 1 2 4 1 3 2
Klebsiella spp.
IMP 0 1 0 0 0 0 0 0 KPC 1 3 13 5 3 10 9 10 NDM 0 1 2 0 2 1 4 2 OXA-48 0 0 2 4 1 1 5 1 VIM 0 0 0 0 0 0 1 0
Year total 1 9 21 16 20 24 31 30 *spp.: species ^KPC: Klebsiella pneumoniae carbapenemase NDM: New Delhi metallo-β-lactamase OXA-48: Oxacillin-hydrolyzing β-lactamase-48 VIM: Verona integron-encoded metallo-β-lactamase IMP: Imipenem-hydrolyzing β-lactamase

73
Rabid Non-Bat Animals and Rabies Strains in Washington 1987-2019
Year Animal type (County) Rabies strain
2015 Cat (Jefferson) Bat-variant
2002 Cat (Walla Walla) Bat-variant
1994 Llama (King) Bat-variant
1992 Horse (Franklin) Unknown
1987 Dog (Pierce)* Unknown, but history of bat exposure
*Infection was not confirmed at Centers for Disease Control and Prevention.

74
Washington State Bats Tested for Rabies 2015-2019 2015 2016 2017 2018 2019 Total
County Positive Total Positive Total Positive Total Positive Total Positive Total Positive Tested
Adams 0 0 0 6 0 1 0 0 0 2 0 9 Asotin 0 0 0 0 0 0 0 0 0 0 0 0 Benton 0 2 0 3 0 0 2 2 0 3 2 10 Chelan 0 8 3 17 1 11 9 75 0 3 13 114 Clallam 0 4 0 0 0 7 0 6 0 5 0 22 Clark 1 16 1 15 1 10 0 16 0 11 3 68 Columbia 0 0 0 0 0 0 0 0 0 0 0 0 Cowlitz 0 7 0 16 0 10 0 8 2 10 2 51 Douglas 0 0 0 0 0 1 2 25 0 0 2 26 Ferry 0 0 1 1 0 0 0 0 0 0 1 1 Franklin 0 1 0 0 0 0 0 1 0 0 0 2 Garfield 0 0 0 0 0 0 0 0 0 0 0 0 Grant 0 2 1 4 0 2 0 7 0 1 1 16 Grays
0 5 0 3 0 3 0 2 0 4 0 17
Island 0 12 0 5 0 18 0 12 0 7 0 54 Jefferson 0 8 0 6 0 7 1 11 0 2 1 34 King 2 65 3 52 8 78 10 102 1 73 24 370 Kitsap 0 20 1 23 0 27 2 37 0 18 3 125 Kittitas 0 3 0 0 0 3 0 4 0 0 0 10 Klickitat 0 3 0 0 1 5 1 3 0 1 2 12 Lewis 0 7 2 16 1 18 2 26 1 11 6 78 Lincoln 0 0 0 0 0 0 0 0 0 0 0 0 Mason 2 8 1 8 0 5 0 7 0 5 3 33 Okanogan 0 1 0 0 0 1 0 0 0 1 0 3 Pacific 1 4 0 4 0 7 0 5 0 7 1 27 Pend Oreille 0 0 0 0 0 0 0 2 0 0 0 2 Pierce 0 8 1 16 2 25 0 23 0 12 3 84 San Juan 0 3 0 2 0 1 0 2 0 4 0 12 Skagit 0 7 0 5 0 9 0 10 0 4 0 35 Skamania 0 2 0 0 0 0 0 0 0 0 0 2 Snohomish 1 25 0 15 3 37 1 44 2 16 7 137 Spokane 1 34 3 44 5 31 3 27 0 16 12 152 Stevens 0 7 0 4 0 3 2 5 0 9 2 28 Thurston 1 17 1 16 0 33 2 28 1 15 5 109 Wahkiakum 0 2 0 0 0 0 0 0 0 1 0 3 Walla Walla 0 1 0 1 0 0 1 3 0 1 1 6 Whatcom 0 15 2 14 0 21 2 35 1 10 5 95 Whitman 0 5 0 2 0 1 0 1 0 1 0 10 Yakima 0 3 0 0 0 1 0 2 1 2 1 8
Total 9 305 20 298 22 376 40 531 9 255 100 1,765

75
Washington State Animals Tested for Rabies 1988-2019 Year Bat Cat Dog Ferret Raccoon Skunk Rodent Lagomorph Other Wild Other Domestic Total 1988 69 (4) 165 110 15 16 3 12 2 5 3 400 (4) 1989 102 (9) 124 91 20 9 4 8 1 9 4 372 (9) 1990 63 (4) 104 82 5 7 5 5 1 14 4 290 (4) 1991 90 (9) 105 96 13 8 3 13 0 19 2 349 (9) 1992 73 (6) 132 90 16 14 2 12 0 14 6 (1)* 359 (7) 1993 68 (1) 122 95 8 4 8 16 2 10 13 346 (1) 1994 58 (14) 105 90 7 4 3 15 0 16 14 (1) ̂ 312 (15) 1995 263 (15) 140 114 12 8 1 23 3 15 18 597 (15) 1996 257 (13) 104 101 8 9 2 14 3 20 12 530 (13) 1997 780 (51) 155 118 7 17 4 15 2 18 11 1,127 (51) 1998 447 (27) 126 109 8 11 1 6 0 19 16 743 (27) 1999 334 (25) 103 71 3 11 3 8 1 14 13 561 (25) 2000 330 (23) 105 60 1 2 4 6 1 9 4 522 (23) 2001 263 (22) 111 93 2 3 1 8 0 4 5 490 (22) 2002 186 (12) 99 (1) 53 7 2 2 9 1 8 9 376 (13) 2003 229 (23) 137 72 0 11 1 4 1 9 10 474 (23) 2004 311 (20) 141 70 3 13 6 11 0 6 10 571 (20) 2005 245 (15) 132 66 3 12 2 5 1 10 4 480 (15) 2006 273 (15) 105 70 4 13 1 2 1 8 5 482 (15) 2007 315 (22) 132 97 1 16 3 5 0 9 3 581 (22) 2008 337 (17) 143 76 1 10 2 5 1 9 11 595 (17) 2009 311 (14) 133 90 1 12 5 4 1 7 9 573 (14) 2010 200 (14) 103 63 0 14 1 6 1 9 10 407 (14) 2011 204 (11) 87 51 1 9 1 2 0 8 5 368 (11) 2012 221 (9) 98 54 2 7 0 4 0 7 9 402 (9) 2013 284 (12) 80 65 0 13 0 3 0 5 9 459 (12) 2014 276 (15) 75 53 0 12 0 1 1 6 11 435 (15) 2015 305 (9) 95 (1) 49 0 8 2 8 0 11 7 485 (10) 2016 298 (20) 108 44 0 5 0 4 1 3 3 466 (20) 2017 376 (22) 81 48 0 8 1 4 0 2 5 525 (22) 2018 531 (40) 84 44 0 4 0 2 0 2 8 675 (40) 2019 255 (9) 65 23 0 2 0 2 0 3 7 357 (9) Total 8,354 (522) 3,599 (2) 2,408 148 294 71 242 25 308 260 (2) 15,709 (526) *Horse ^ Llama Lagomorphs include: rabbit, hare, and pika. Rodents include: beaver, chinchilla, chipmunk, degu, gerbil, gopher, hamster, marmot, mouse, muskrat, nutria, porcupine, prairie dog, rat, squirrel, vole, and woodchuck. Skunks include: all species of the Mephitidae family and are not identified to species level. Other domestic include: alpaca, burro, cattle, goat, horse, llama, mule, pig, sheep, and (captive) zebra.
Other wild include: badger, bear, bison, bobcat, cougar, coyote, deer, fox, kinkajou, lynx, marten, mink, mole, nonhuman primate, ocelot, opossum, otter, seal, shrew, sugar glider, weasel, wolf, wolf-hybrid, zorilla (striped polecat). Species identification: bats are identified to species level using morphological identification keys; all other species are not formally identified unless rabies virus positive. Numbers reported through 2007 were inclusive of positive and negative test results; beginning in 2008 all specimens submitted (i.e., including unsatisfactory results) are included in counts.

76
Rare Diseases of Public Health Significance 2016-2019 All cases acquired through travel, unless otherwise noted. Case counts are subject to change since cases are often reported late.
Rare Disease 2016 2017 2018 2019
Amoebic meningitis 0 1E 0 0 Anaplasmosis 0 1 0 1 Babesiosis 0 1 0 1 Burkholderia infection 0 2 0 0 Chagas 1 0 0 3 Coccidioidomycosis 40 (2E) 69 (2E, 9U) 63 (3E, 14U) 62 (7U) Cryptococcosis (by Cryptococcus gattii) 5 (2E, 3U) 1E 4 (1E, 3U) 2 (1E, 1U) Histoplasmosis 2 (1U) 1 0 1U Spotted fever rickettsiosis 0 5 3 (1U) 4 (1E) Tick paralysis 1E 0 2E 2E Typhus 0 1 0 0
E Endemically acquired U Unknown exposure location
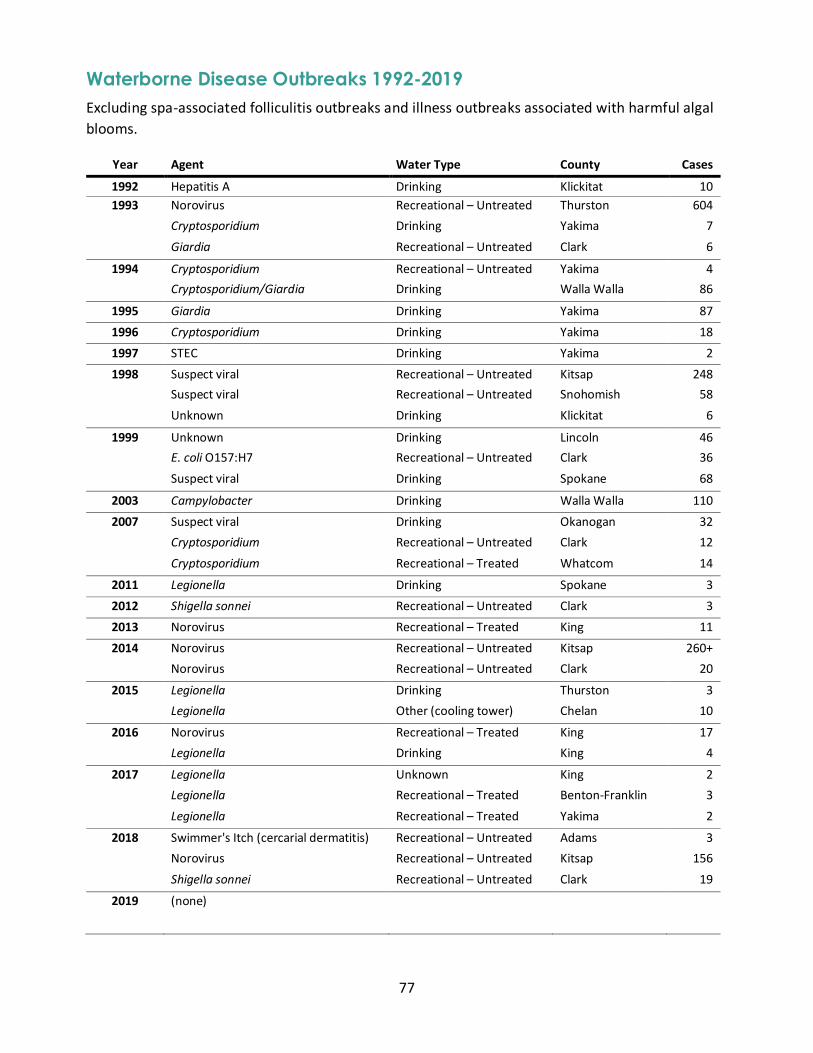
77
Waterborne Disease Outbreaks 1992-2019 Excluding spa-associated folliculitis outbreaks and illness outbreaks associated with harmful algal blooms.
Year Agent Water Type County Cases
1992 Hepatitis A Drinking Klickitat 10 1993 Norovirus Recreational – Untreated Thurston 604
Cryptosporidium Drinking Yakima 7 Giardia Recreational – Untreated Clark 6
1994 Cryptosporidium Recreational – Untreated Yakima 4 Cryptosporidium/Giardia Drinking Walla Walla 86
1995 Giardia Drinking Yakima 87 1996 Cryptosporidium Drinking Yakima 18 1997 STEC Drinking Yakima 2 1998 Suspect viral Recreational – Untreated Kitsap 248
Suspect viral Recreational – Untreated Snohomish 58 Unknown Drinking Klickitat 6
1999 Unknown Drinking Lincoln 46 E. coli O157:H7 Recreational – Untreated Clark 36 Suspect viral Drinking Spokane 68
2003 Campylobacter Drinking Walla Walla 110 2007 Suspect viral Drinking Okanogan 32
Cryptosporidium Recreational – Untreated Clark 12 Cryptosporidium Recreational – Treated Whatcom 14
2011 Legionella Drinking Spokane 3 2012 Shigella sonnei Recreational – Untreated Clark 3 2013 Norovirus Recreational – Treated King 11 2014 Norovirus Recreational – Untreated Kitsap 260+
Norovirus Recreational – Untreated Clark 20
2015 Legionella Drinking Thurston 3 Legionella Other (cooling tower) Chelan 10
2016 Norovirus Recreational – Treated King 17 Legionella Drinking King 4
2017 Legionella Unknown King 2 Legionella Recreational – Treated Benton-Franklin 3 Legionella Recreational – Treated Yakima 2
2018 Swimmer's Itch (cercarial dermatitis) Recreational – Untreated Adams 3 Norovirus Recreational – Untreated Kitsap 156 Shigella sonnei Recreational – Untreated Clark 19
2019 (none)

78
Appendix II: Influenza Summary The Department of Health (DOH), in collaboration with health care providers, laboratories, local health jurisdictions, and the Centers for Disease Control and Prevention (CDC), performs surveillance for influenza using several different systems. Laboratory-confirmed influenza-associated deaths and suspected and confirmed influenza outbreaks are reportable to the local health jurisdiction and in turn reportable to DOH. Novel or unsubtypable influenza is immediately notifiable to DOH.
The purpose of influenza surveillance and reporting is to assist health care providers with treatment decisions by tracking the geographic spread of influenza activity, estimating influenza-related mortality, monitoring the epidemiology of severe influenza infection, and detecting emerging threats such as avian and other novel influenza strains.
Current and historic summaries of influenza activity in Washington State can be found on the DOH Influenza Surveillance Data page.

79
Appendix III: State Demographics

80
Washington State Population Estimates 1985-2019
Year Estimate Year Estimate
1985 4,415,785 1986 4,462,212
1987 4,527,098 1988 4,616,886
1989 4,728,077 1990 4,866,692
1991 5,021,335 1992 5,141,177
1993 5,265,688 1994 5,364,338
1995 5,470,104 1996 5,567,764
1997 5,663,763 1998 5,750,033
1999 5,830,835 2000 5,894,143
2001 5,970,330 2002 6,059,316
2003 6,126,885 2004 6,208,515
2005 6,298,816 2006 6,420,258
2007 6,525,086 2008 6,608,245
2009 6,672,159 2010 6,724,540
2011 6,767,900 2012 6,817,770
2013 6,882,400 2014 6,968,170
2015 7,061,410 2016 7,183,700
2017 7,310,300 2018 7,427,570
2019 7,546,410
State of Washington Office of Financial Management April 1, 2019 Population Trends.
Accessed 11/18/2020

81
Washington State Population Estimates by County 2019
County Estimate County Estimate County Estimate
Adams 20,150 Asotin 22,520 Benton 201,800
Chelan 78,420 Clallam 76,010 Clark 488,500
Columbia 4,160 Cowlitz 108,950 Douglas 42,820
Ferry 7,830 Franklin 94,680 Garfield 2,220
Grant 98,740 Grays Harbor 74,160 Island 84,820
Jefferson 31,900 King 2,226,300 Kitsap 270,100
Kittitas 46,570 Klickitat 22,430 Lewis 79,480
Lincoln 10,960 Mason 64,980 Okanogan 42,730
Pacific 21,640 Pend Oreille 13,740 Pierce 888,300
San Juan 17,150 Skagit 129,200 Skamania 12,060
Snohomish 818,700 Spokane 515,250 Stevens 45,570
Thurston 285,800 Wahkiakum 4,190 Walla Walla 62,200
Whatcom 225,300 Whitman 50,130 Yakima 255,950
State Total: 7,546,410
State of Washington Office of Financial Management April 1, 2019 Population Trends.
Accessed 11/18/2020

82
Washington State Population by Age and Sex 2019
Age (years) Male Female Total
0-4 232,006 221,545 453,551
5-9 243,194 232,386 475,580
10-14 245,453 233,443 478,896
15-19 237,183 226,898 464,081
20-24 251,872 240,789 492,661
25-29 276,066 263,549 539,615
30-34 267,559 254,920 522,479
35-39 265,528 255,965 521,493
40-44 234,902 230,158 465,060
45-49 237,462 233,103 470,565
50-54 231,583 229,655 461,238
55-59 245,140 250,514 495,654
60-64 233,274 245,861 479,135
65-69 200,223 218,890 419,113
70-74 155,859 171,858 327,717
75-79 99,156 112,910 212,066
80-84 58,245 72,451 130,696
85+ 51,450 85,360 136,810
Total 3,766,155 3,780,255 7,546,410
State of Washington Office of Financial Management April 1, 2019 Population Trends.
Accessed 11/18/2020

83

84