NOTICE OF REGULAR ANNUAL STOCKHOLDERS’ MEETING … · NOTICE OF REGULAR ANNUAL STOCKHOLDERS’...
120
Ayala Land, Inc. Disclosure – 05 April 2006 Page -2- ----------------------------------------------------------------------------------------------- NOTICE OF REGULAR ANNUAL STOCKHOLDERS’ MEETING NOTICE IS HEREBY GIVEN that the regular annual meeting of stockholders of AYALA LAND, INC. will be held at the Grand Ballroom, InterContinental Manila, Ayala Center, Makati City, on Wednesday, 02 April 2008 at 9:00 a.m. with the following A G E N D A 1. Proof of Notice and Determination of Quorum 2. Approval of Minutes of Previous Meetings 3. Annual Report 4. New Business 4.1 Ratification of all Acts and Resolutions of the Board of Directors and of the Executive Committee adopted in the ordinary course of business during the preceding year. 4.2 Ratification of the Resolutions of the Board of Directors adopted on 12 February 2008: 4.2.1 approving the allotment and subsequent issuance of up to 1 Billion common shares of stock of the Corporation with an aggregate par value of One Billion Pesos (P 1,000,000,000.00) (the “Shares”) for the purpose of exchanging such Shares for properties or assets and/or to raise funds to acquire properties or assets needed for the business of the Corporation via issuance of equity or equity-linked instruments the price and the terms and conditions of which shall be determined by the Board of Directors based on prevailing market conditions or on agreements negotiated; and 4.2.2 amendment of the Amended Articles of Incorporation of the Corporation to exclude the issuance of the Shares from the preemptive rights of the stockholders. 5. Election of Directors (including the Independent Directors) 6. Election of Auditors and Fixing of their Remuneration 7. Consideration of such other business as may properly come before the meeting 8. Adjournment Only stockholders of record at the close of business on 21 February 2008 are entitled to notice of, and to vote at, this meeting. As per By-Laws, the Stock and Transfer Books of the Corporation will be closed from 21 to 28 February 2008, inclusive. Makati City, 12 February 2008. FOR THE BOARD OF DIRECTORS MERCEDITA S. NOLLEDO Corporate Secretary
Transcript of NOTICE OF REGULAR ANNUAL STOCKHOLDERS’ MEETING … · NOTICE OF REGULAR ANNUAL STOCKHOLDERS’...

Ayala Land, Inc. Disclosure – 05 April 2006 Page -2- -----------------------------------------------------------------------------------------------
NOTICE OF REGULAR ANNUAL STOCKHOLDERS’ MEETING
NOTICE IS HEREBY GIVEN that the regular annual meeting of stockholders of AYALA LAND, INC. will be held at the Grand Ballroom, InterContinental Manila, Ayala Center, Makati City, on Wednesday, 02 April 2008 at 9:00 a.m. with the following
A G E N D A 1. Proof of Notice and Determination of Quorum 2. Approval of Minutes of Previous Meetings 3. Annual Report 4. New Business
4.1 Ratification of all Acts and Resolutions of the Board of Directors and of the Executive Committee adopted in the ordinary course of business during the preceding year.
4.2 Ratification of the Resolutions of the Board of Directors adopted on 12 February 2008: 4.2.1 approving the allotment and subsequent issuance of up to 1 Billion common shares
of stock of the Corporation with an aggregate par value of One Billion Pesos (P1,000,000,000.00) (the “Shares”) for the purpose of exchanging such Shares for properties or assets and/or to raise funds to acquire properties or assets needed for the business of the Corporation via issuance of equity or equity-linked instruments the price and the terms and conditions of which shall be determined by the Board of Directors based on prevailing market conditions or on agreements negotiated; and
4.2.2 amendment of the Amended Articles of Incorporation of the Corporation to exclude the issuance of the Shares from the preemptive rights of the stockholders.
5. Election of Directors (including the Independent Directors) 6. Election of Auditors and Fixing of their Remuneration 7. Consideration of such other business as may properly come before the meeting 8. Adjournment
Only stockholders of record at the close of business on 21 February 2008 are entitled to notice of, and to vote at, this meeting. As per By-Laws, the Stock and Transfer Books of the Corporation will be closed from 21 to 28 February 2008, inclusive. Makati City, 12 February 2008.
FOR THE BOARD OF DIRECTORS
MERCEDITA S. NOLLEDO Corporate Secretary

__________________________________________________________________________ 1
SECURITIES AND EXCHANGE COMMISSION
SEC FORM 20-IS
Information Statement of
AYALA LAND, INC. Pursuant to Section 20 of the Securities Regulation Code
1. Check the appropriate box: Preliminary Information Sheet a Definitive Information Sheet 2. Name of Registrant as specified in its charter: AYALA LAND, INC. 3. Province, country or other jurisdiction of incorporation or organization: MAKATI CITY, PHILIPPINES 4. SEC Identification Number: 152747 5. BIR Tax Identification Code: 000-000-153-790 6. Address of Principal Office: 31st Floor, Tower One and Exchange Plaza
Ayala Triangle, Ayala Avenue Makati City 1226 7. Registrant’s telephone number, including area code: (632) 848-5772 / 841-5675 8. Date, time and place of the meeting of security holders: Date - 02 April 2008 Time - 9:00 A.M. Place - Grand Ballroom InterContinental Manila Ayala Center, Makati City 9. Approximate date on which the Information Statement is first to be sent or given to security holders:
07 March 2008
10. Securities registered pursuant to Sections 8 and 12 of the Code or Sections 4 and 8 of the RSA:
a. Authorized Capital Stock P 21,500,000,000.00
Common Shares 20,000,000,000 (P1.00 par value) Preferred Shares 15,000,000,000 (P0.10 par value)

__________________________________________________________________________ 2
b. Number of Shares Outstanding as of 31 December 2007
Class Number of Shares
Common Shares 13,034,603,880 (net of 28,229 Treasury Shares) Preferred Shares 13,034,603,880
c. Amount of Debt Outstanding as of 31 December 2007
(interest-bearing payables; current and long-term; including bonds and commercial papers) P 10.1 b illion
11. Are any or all of registrant’s securities listed in a Stock Exchange? a Yes _____ No
12,996,103,287 Common shares have been listed with the Philippine Stock Exchange as of 31 December 2007, excluding the 38,528,822 shares which have been approved for listing for the ESOWN Plan of the Company.
#

__________________________________________________________________________ 3
INFORMATION REQUIRED IN INFORMATION STATEMENT
A. GENERAL INFORMATION
Item 1. Date, time and place of meeting of security holders
a. Date - 02 April 2008 Time - 9:00 A.M.
Place - Grand Ballroom InterContinental Manila Ayala Center, Makati City
Principal - 31st Floor, Tower One and Exchange Plaza
Office Ayala Triangle, Ayala Avenue Makati City 1226
b. Approximate date when the Information Statement is first to be sent or given to security holders: 07 March 2008
WE ARE NOT ASKING YOU FOR A PROXY AND YOU
ARE REQUESTED NOT TO SEND US A PROXY Item 2. Dissenter’s Right of Appraisal
The ratification of the Resolutions of the Board of Directors approving the allotment and subsequent issuance of up to 1 Billion common shares of stock of the Corporation with an aggregate par value of One Billion Pesos (P1,000,000,000.00) (the “Shares”) for the purpose of exchanging such Shares for properties or assets and/or to raise funds to acquire properties or assets needed for the business of the Corporation via issuance of equity or equity-linked instruments, the price and the terms and conditions of which shall be determined by the Board of Directors based on prevailing market conditions or on agreements negotiated, and the amendment of the Amended Articles of Incorporation of the Corporation to exclude the issuance of the Shares from the preemptive rights of the stockholders, may give rise to a possible exercise by security holders of their appraisal right under Title X of the Corporation Code of the Philippines. A stockholder who shall have voted against the aforesaid proposed action (the “dissenting stockholder”) may exercise his appraisal right by making a written demand on the Company within 30 days after the Stockholders’ Meeting date. Failure to make the demand within the prescribed period shall be deemed a waiver of the appraisal right. If the proposed corporate action is implemented, the Company shall pay the dissenting stockholder upon surrender of the stock certificates representing his shareholdings in the Company based on the fair value thereof as of the day prior to the date of the Stockholders’ Meeting, excluding any appreciation or depreciation in anticipation of such corporate action, provided that no payment shall be made to the dissenting stockholder unless the Company has unrestricted retained earnings to cause such payment.
Item 3. Interest of Certain Persons in or Opposition to Matters to be Acted Upon
a. No current director or officer of the Corporation, or nominee for election as director of the Corporation nor
any associate thereof, has any substantial interest, direct or indirect, by security holdings or otherwise, in any matter to be acted upon other than election to office.
b. No director has informed the Corporation in writing that he intends to oppose any action to be taken by the
registrant at the meeting.
__________________________________________________________________________ 4
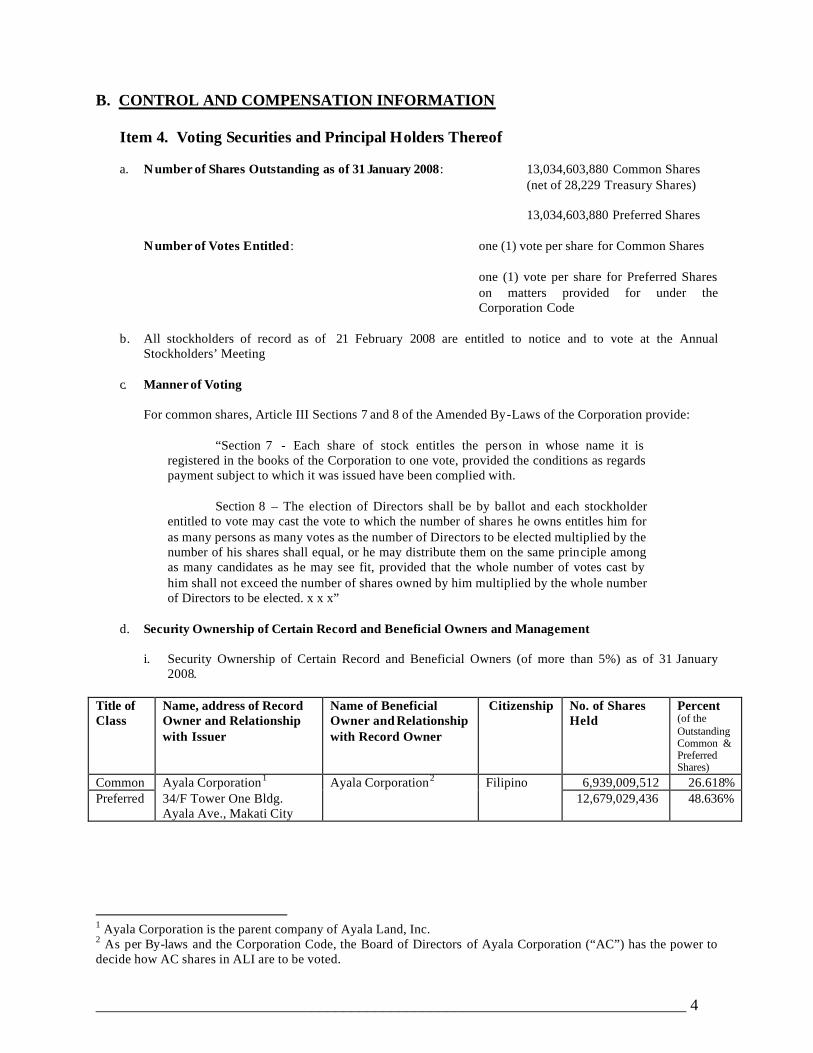
B. CONTROL AND COMPENSATION INFORMATION Item 4. Voting Securities and Principal Holders Thereof
a. Number of Shares Outstanding as of 31 January 2008 : 13,034,603,880 Common Shares (net of 28,229 Treasury Shares) 13,034,603,880 Preferred Shares Number of Votes Entitled : one (1) vote per share for Common Shares
one (1) vote per share for Preferred Shares on matters provided for under the Corporation Code
b. All stockholders of record as of 21 February 2008 are entitled to notice and to vote at the Annual
Stockholders’ Meeting
c. Manner of Voting
For common shares, Article III Sections 7 and 8 of the Amended By-Laws of the Corporation provide:
“Section 7 - Each share of stock entitles the person in whose name it is registered in the books of the Corporation to one vote, provided the conditions as regards payment subject to which it was issued have been complied with.
Section 8 – The election of Directors shall be by ballot and each stockholder
entitled to vote may cast the vote to which the number of shares he owns entitles him for as many persons as many votes as the number of Directors to be elected multiplied by the number of his shares shall equal, or he may distribute them on the same principle among as many candidates as he may see fit, provided that the whole number of votes cast by him shall not exceed the number of shares owned by him multiplied by the whole number of Directors to be elected. x x x”
d. Security Ownership of Certain Record and Beneficial Owners and Management
i. Security Ownership of Certain Record and Beneficial Owners (of more than 5%) as of 31 January
2008.
Title of Class
Name, address of Record Owner and Relationship with Issuer
Name of Beneficial Owner and Relationship with Record Owner
Citizenship No. of Shares Held
Percent (of the Outstanding Common & Preferred Shares)
Common 6,939,009,512 26.618% Preferred
Ayala Corporation1 34/F Tower One Bldg. Ayala Ave., Makati City
Ayala Corporation2 Filipino 12,679,029,436 48.636%
1 Ayala Corporation is the parent company of Ayala Land, Inc. 2 As per By-laws and the Corporation Code, the Board of Directors of Ayala Corporation (“AC”) has the power to decide how AC shares in ALI are to be voted.
__________________________________________________________________________ 5
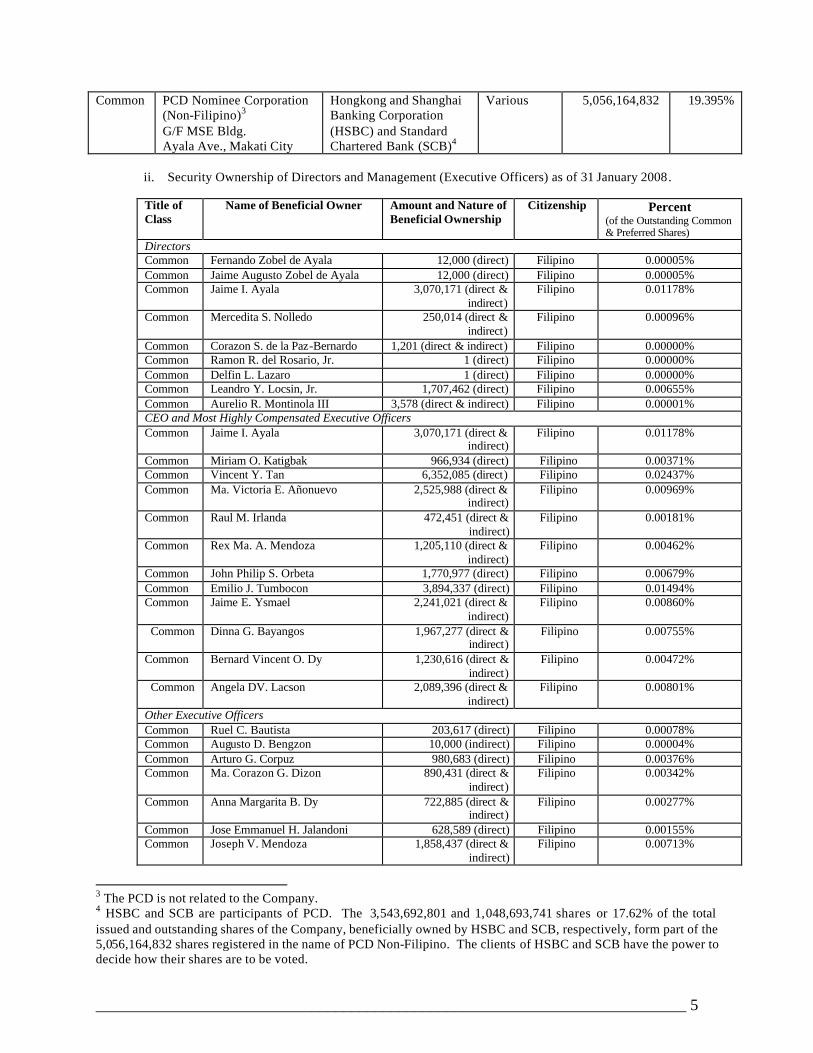
Common PCD Nominee Corporation
(Non-Filipino)3 G/F MSE Bldg. Ayala Ave., Makati City
Hongkong and Shanghai Banking Corporation (HSBC) and Standard Chartered Bank (SCB)4
Various 5,056,164,832 19.395%
ii. Security Ownership of Directors and Management (Executive Officers) as of 31 January 2008.
Title of Class
Name of Beneficial Owner Amount and Nature of Beneficial Ownership
Citizenship Percent (of the Outstanding Common & Preferred Shares)
Directors Common Fernando Zobel de Ayala 12,000 (direct) Filipino 0.00005% Common Jaime Augusto Zobel de Ayala 12,000 (direct) Filipino 0.00005% Common Jaime I. Ayala 3,070,171 (direct &
indirect) Filipino 0.01178%
Common Mercedita S. Nolledo 250,014 (direct & indirect)
Filipino 0.00096%
Common Corazon S. de la Paz-Bernardo 1,201 (direct & indirect) Filipino 0.00000% Common Ramon R. del Rosario, Jr. 1 (direct) Filipino 0.00000% Common Delfin L. Lazaro 1 (direct) Filipino 0.00000% Common Leandro Y. Locsin, Jr. 1,707,462 (direct) Filipino 0.00655% Common Aurelio R. Montinola III 3,578 (direct & indirect) Filipino 0.00001% CEO and Most Highly Compensated Executive Officers Common Jaime I. Ayala 3,070,171 (direct &
indirect) Filipino 0.01178%
Common Miriam O. Katigbak 966,934 (direct) Filipino 0.00371% Common Vincent Y. Tan 6,352,085 (direct) Filipino 0.02437% Common Ma. Victoria E. Añonuevo 2,525,988 (direct &
indirect) Filipino 0.00969%
Common Raul M. Irlanda 472,451 (direct & indirect)
Filipino 0.00181%
Common Rex Ma. A. Mendoza 1,205,110 (direct & indirect)
Filipino 0.00462%
Common John Philip S. Orbeta 1,770,977 (direct) Filipino 0.00679% Common Emilio J. Tumbocon 3,894,337 (direct) Filipino 0.01494% Common Jaime E. Ysmael 2,241,021 (direct &
indirect) Filipino 0.00860%
Common Dinna G. Bayangos 1,967,277 (direct & indirect)
Filipino 0.00755%
Common Bernard Vincent O. Dy 1,230,616 (direct & indirect)
Filipino 0.00472%
Common Angela DV. Lacson 2,089,396 (direct & indirect)
Filipino 0.00801%
Other Executive Officers Common Ruel C. Bautista 203,617 (direct) Filipino 0.00078% Common Augusto D. Bengzon 10,000 (indirect) Filipino 0.00004% Common Arturo G. Corpuz 980,683 (direct) Filipino 0.00376% Common Ma. Corazon G. Dizon 890,431 (direct &
indirect) Filipino 0.00342%
Common Anna Margarita B. Dy 722,885 (direct & indirect)
Filipino 0.00277%
Common Jose Emmanuel H. Jalandoni 628,589 (direct) Filipino 0.00155% Common Joseph V. Mendoza 1,858,437 (direct &
indirect) Filipino 0.00713%
3 The PCD is not related to the Company. 4 HSBC and SCB are participants of PCD. The 3,543,692,801 and 1,048,693,741 shares or 17.62% of the total issued and outstanding shares of the Company, beneficially owned by HSBC and SCB, respectively, form part of the 5,056,164,832 shares registered in the name of PCD Non-Filipino. The clients of HSBC and SCB have the power to decide how their shares are to be voted.

__________________________________________________________________________ 6
Common Francis O. Monera 906,939 (direct & indirect)
Filipino 0.00348%
Common Ma. Teresa S. Palma 948,184 direct & indirect)
Filipino 0.00364%
Common Juanito P. Rosales 405,622 (direct) Filipino 0.00156% Common Eliezer C. Tanlapco 0 Filipino n/a Common Rowena M. Tomeldan 1,259,508 (direct &
indirect) Filipino 0.00483%
All Directors and Officers as a group 38,587,515 0.14802%
None of the members of the Company’s directors and management owns 2.0% or more of the outstanding capital stock of the Company.
iii. Voting Trust Holders of 5% or More
The Corporation knows of no persons holding more than 5% of common shares under a voting trust or similar agreement.
iv. Changes in Control
No change of control in the Corporation has occurred since the beginning of its last fiscal year. Item 5. Directors and Executive Officers Article IV Section 1 of the Company’s By-Laws provides in part:
“Section 1. x x x The Board of Directors shall have nine (9) members who shall be elected by the Corporation’s stockholders entitled to vote at the annual meeting, and shall hold office for one year until their successors are elected and qualified in accordance with these By-laws.”
The record of attendance of the Company’s directors during the board meetings and stockholders’ meetings held for the year 2007 is indicated below as follows:
Regular Meetings Special Meetings
Annual Stockholders’
Meeting & Organizational
Meeting
Special Stockholders’
Meeting Director
Feb. 13 May 8 Aug. 9 Nov. 20 Feb. 1 July 5 March 28 Aug. 28
Percentage
Fernando Zobel de Ayala P P P P P P P P 100.00% Jaime Augusto Zobel de Ayala P P P A P A P P 75.00% Jaime I. Ayala P P P P P P P P 100.00% Delfin L. Lazaro P P P P P P P P 100.00% Mercedita S. Nolledo P P P P P P P A 87.50% Leandro Y. Locsin, Jr. P A P P P P P P 87.50% Aurelio R. Montinola III P P P A P P P P 87.50% Corazon S. de la Paz-Bernardo P P P P P A P P 87.50% Ramon R. del Rosario, Jr. P P P P P P A P 87.50%
Legend: P – Present A – Absent
The Management Committee members and other Officers of the Company, unless removed by the Board of Directors, shall serve as such until their successors are elected or appointed.

__________________________________________________________________________ 7
a. Information required of Directors and Executive Officers
i. Directors and Executive Officers – Please refer to Annex “A”
The following have been nominated to the Board of Directors of the Company for the ensuing year:
FERNANDO ZOBEL DE AYALA JAIME AUGUSTO ZOBEL DE AYALA JAIME I. AYALA MERCEDITA S. NOLLEDO CORAZON S. DE LA PAZ-BERNARDO RAMON R. DEL ROSARIO, JR. DELFIN L. LAZARO FRANCIS G. ESTRADA AURELIO R. MONTINOLA III
The aforementioned nominees were formally nominated to the Nominations Committee of Ayala Land, Inc. (composed of Fernando Zobel de Ayala, Jaime I. Ayala and Ramon R. del Rosario, Jr.) by a shareholder of the Company, Mr. Julius N. Blanco. In addition, Mr. Ramon R. del Rosario, Jr. and Ms. Corazon S. de la Paz-Bernardo, incumbent directors, and Mr. Francis G. Estrada, are being nominated as independent directors. Mr. Blanco is not related to any of the nominees for independent directors. The nominees have served as directors of the Corporation for more than five years except for Messrs. Jaime I. Ayala, Aurelio R. Montinola III, and Ms. Corazon S. de la Paz-Bernardo, who have served as directors for four, three and two years, respectively. Mr. Francis G. Estrada has been nominated for the first time to the Board of the Company.
The Company has adopted the SRC Rule 38 (Requirements on Nomination and Election of Independent Directors) and compliance therewith has been made.
ii. Significant Employees
The Corporation considers its entire work force as significant employees. Everyone is expected to work together as a team to achieve the Corporation’s goals and objectives.
iii. Family Relationships
Fernando Zobel de Ayala and Jaime Augusto Zobel de Ayala, Chairman and Vice Chairman of the Board of Directors respectively, are brothers.
iv. Involvement in Certain Legal Proceedings
None of the Directors or Executive Officers is involved in any material pending legal proceedings in any court or administrative agency of the Government. As of end-2007, Ayala Land is not involved in any litigation it considers material. However, certain individuals and entities have claimed an interest in Ayala Land's properties located in Las Piñas, Metro Manila, which are adjacent to its development in Ayala Southvale. Prior to purchasing the aforesaid properties, Ayala Land conducted an investigation of the titles to the properties and had no notice of any title or claim that was superior to the titles purchased by Ayala Land. Ayala Land traced its titles to their original certificates of title and Ayala Land believes that it has established its superior ownership position over said parcels of land. Ayala Land has assessed these adverse claims and believes that its tit les are in general superior to the purported titles or other evidence of alleged ownership of these claimants. On this basis, beginning in October 1993, Ayala Land filed petitions in local regional trial courts of Makati and Las Piñas for quieting of title to nullify the purported titles or claims of these adverse claimants. A number of these cases are at various stages of trial and appeal. Some of these cases have been finally decided by the Supreme Court in Ayala Land's favor. These include decisions affirming the title of Ayala Land to some of these properties, which have been developed and offered for sale to the public as Sonera, Ayala Southvale. The controversy involves the remaining area of approximately 129 hectares.

__________________________________________________________________________ 8
Ayala Land does not intend to develop and sell the rest of the Las Piñas properties until the litigation is resolved. Ayala Land has made no provision in respect of such actual or threatened litigations. In December 1999, plaintiffs Edgardo Vazquez and Vazquez Building Systems Corporation filed a patent infringement case against Avida Land, Inc. (“Avida”), a wholly-owned subsidiary of Ayala Land. Avida has raised a number of defenses, including the following: (i) Avida is utilizing the Tex system, a British technology patented in the Philippines of which Avida is a licensee, and not the Vasquez modular housing unit patent; (b) patent claim is overbroad; and (iii) the H-shaped column and the wall panel installation system being claimed as the infringed component cannot be covered by the Vazquez patent, because these are not patentable as they do not qualify as "novelty." In a decision dated 18 December 2007, the Regional Trial Court of Quezon City ruled in favor of plaintiffs, requiring Avida to compensate the plaintiffs in the amount of Php90,000,000.00 as temperate damages or reasonable royalty with interest at the rate of six percent (6%) per annum from the date of filing of the complaint as well as moral and exemplary damages and reasonable attorneys’ fees and cost of suit. Avida filed a notice of appeal to contest this decision with the Court of Appeals. As a result of the explosion which occurred on 19 October 2007 at the basement of the Makati Supermarket Building, the Philippine National Police (“PNP”) has recommended to the Department of Justice (“DOJ”) the prosecution of certain officers/employees of Makati Supermarket Corporation, the owner of the building, as well as some officers/employees of the Company’s subsidiary, Ayala Property Management Corp. (“APMC”), among other individuals, for criminal negligence. No criminal case has been filed by the DOJ at this time. No civil case has likewise been filed by any of the victims. In the event that the DOJ decides to file a criminal case against certain officers/emp loyees of APMC as recommended by the PNP, the accused, if convicted after final judgment, can be held not only criminally but also civilly liable. In the event the accused will not be able to pay for the civil award, APMC will be held subsidiarily liable for such sums (the amount of which cannot be estimated). The Company and APMC believe, however, that the facts surrounding the incident do not show any negligence.
b. Certain Relationships and Related Transactions
The Company and its subsidiaries, in their regular conduct of business, has entered into transactions with associates and other related parties principally consisting of advances and reimbursement of expenses, purchase and sale of real estate properties, construction contracts, and development, management, underwriting, marketing, leasing and administrative service agreements. Sales and purchases of goods and services to and from related parties are made on an arms length basis and at current market prices at the time of the transactions. However, no other transaction, without proper disclosure, was undertaken by the Company in which any Director or Executive Officer, any nominee for election as director, any beneficial owner (direct or indirect) or any member of their immediate families was involved or had a direct or indirect material interest. ALI employees are required to promptly disclose any business and family-related transactions with the company to ensure that potential conflicts of interest are surfaced and brought to the attention of management.
c. Ownership Structure and Parent Company
Ayala Corporation owns 75.25% of the total common and preferred voting shares of the Company as of 31 January 2008.
d. Resignation of Directors
To date, no director has resigned or declined to stand for re-election for the Board of Directors due to any disagreement with the Corporation relative to the Corporation’s operations, policies and practices.

__________________________________________________________________________ 9
Item 6. Compensation of Directors and Executive Officers
a. Executive Compensation
The Company adopts a performance-based compensation scheme. The total annual compensation of the President and Management Committee members of the Company amounted to P199.21 million in 2006 and P173.76 million in 2007. The projected total annual compensation for the current year is P125.59 million. Total compensation paid to all senior personnel from Manager and up amounted to P582.10 million in 2006 and P633.73 million in 2007. The projected total annual compensation for the current year is P501.72 million.
Name and Principal Position Year Salary Other Variable Pay
Jaime I. Ayala President & CEO
Miriam O. Katigbak Executive Vice President
Vincent Y. Tan Executive Vice President
Ma. Victoria E. Añonuevo Senior Vice President
Raul M. Irlanda Senior Vice President
Rex Ma. A. Mendoza Senior Vice President
John Philip S. Orbeta * Senior Vice President
Emilio J. Tumbocon Senior Vice President
Jaime E. Ysmael Senior Vice President
Jose Rene D. Almendras ** Vice President
Dinna G. Bayangos Vice President
Bernard Vincent O. Dy Vice President
Angela DV. Lacson Consultant
Actual 2006 P103.60 M P95.61 M Actual 2007 P105.27 M P68.49 M
CEO & 12 Most Highly Compensated Executive Officers
Projected 2008 P115.80 M P9.79 M***
Actual 2006 P368.07 M P214.03 M Actual 2007 P425.94 M P207.79 M
All other officers**** as a group unnamed
Projected 2008 P 468.54 M P33.18 M*** * Compensation reported by Ayala Corporation ** Transferred to Ayala Corporation effective 01 January 2007 *** Exclusive of Stock Option exercise **** Managers and up
The total annual compensation paid to all senior personnel from Manager and up was all paid in cash. The total annual compensation includes the basic salary and other variable pay (performance bonus and exercise of Stock Option Plan).

__________________________________________________________________________ 10
b. Compensation of Directors
Article IV Section 17 of the Company’s By-Laws provides:
“Section 17 – Each member of the Board of Directors who is neither an officer nor consultant of the Corporation shall be entitled to receive a reasonable per diem in an amount to be determined by the Board of Directors for his attendance in Board meetings. Any additional compensation, other than per diems, to be given to members of the Board of Directors shall be subject to stockholders' approval.”
i. Standard Arrangement (Current Compensation)
During the 2003 Annual Stockholders’ Meeting, the stockholders ratified the resolution fixing the remuneration of non-executive directors at P1,000,000.00 consisting of the following components:
Retainer Fee: P500,000.00 Per diem per Board meeting attended: P100,000.00
In addition, a non-executive director is entitled to a per diem of P20,000.00 per board committee meeting actually attended.
ii. Other Arrangement
None of the directors, in their personal capacity, has been contracted and compensated by the Company for services other than those provided as a director. The Company has no other arrangement with regard to the remuneration of its existing directors and officers aside from the compensation received as herein stated.
c. Employment Contracts and Termination of Employment and Change-in-Control
Arrangements
The above named executive officers are covered by Letters of Appointment with the Company stating therein their respective job functionalities, among others.
d. Warrants and Options Outstanding: Repricing
i. The Company has offered its Executive Stock Option Plan (ESOP) to the Company’s officers since 1998. Of the above named officers, there were 5 million common shares exercised for the year 2007 by the following officers, to wit:
Name No. of
Shares Date of Grant
Exercise Price
Market Price at Date of Grant
Jaime I. Ayala Various Various Various Ma. Victoria E. Añonuevo Various Various Various Dinna G. Bayangos Various Various Various Bernard Vincent O. Dy Various Various Various Raul M. Irlanda Various Various Various Miriam O. Katigbak Various Various Various Emilio J. Tumbocon Various Various Various All above-named Officers as a group
5,001,488 4.13 5.58 *
* Average prices on the dates of grant.
ii. The Company has adjusted the exercise price of the options awarded to the above named officers due to the stock dividend paid by the Company in June 2007.
__________________________________________________________________________ 11
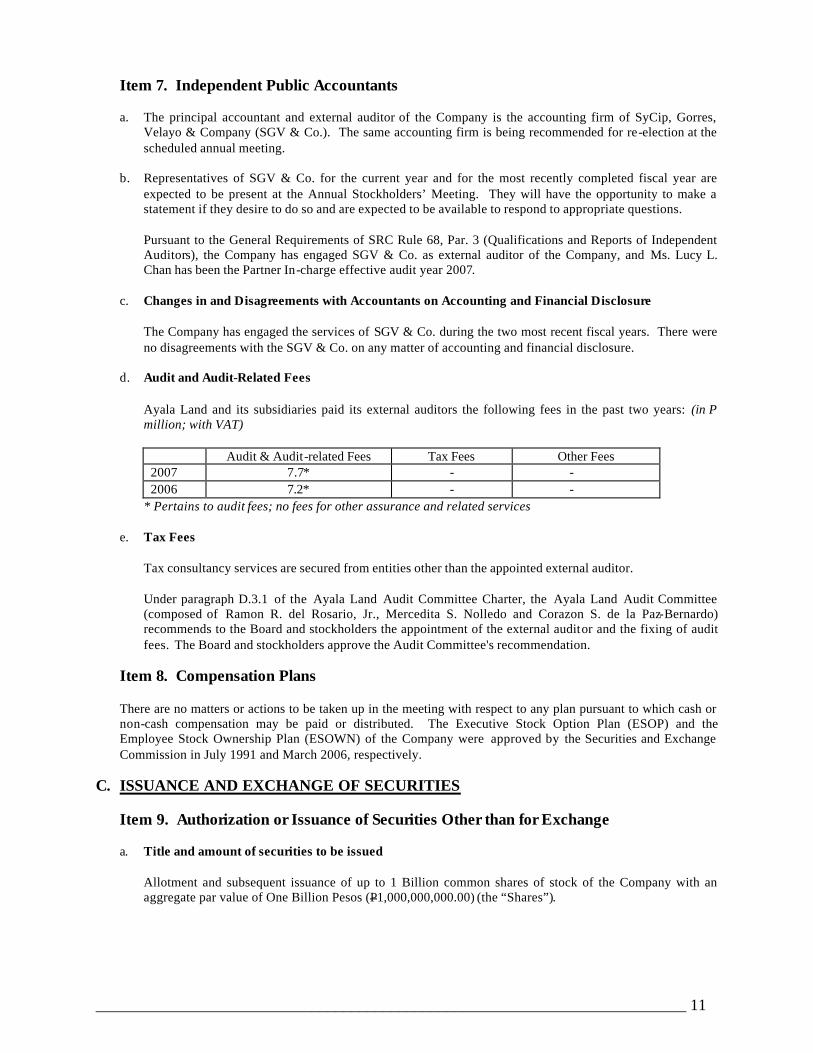
Item 7. Independent Public Accountants
a. The principal accountant and external auditor of the Company is the accounting firm of SyCip, Gorres, Velayo & Company (SGV & Co.). The same accounting firm is being recommended for re-election at the scheduled annual meeting.
b. Representatives of SGV & Co. for the current year and for the most recently completed fiscal year are
expected to be present at the Annual Stockholders’ Meeting. They will have the opportunity to make a statement if they desire to do so and are expected to be available to respond to appropriate questions. Pursuant to the General Requirements of SRC Rule 68, Par. 3 (Qualifications and Reports of Independent Auditors), the Company has engaged SGV & Co. as external auditor of the Company, and Ms. Lucy L. Chan has been the Partner In-charge effective audit year 2007.
c. Changes in and Disagreements with Accountants on Accounting and Financial Disclosure The Company has engaged the services of SGV & Co. during the two most recent fiscal years. There were
no disagreements with the SGV & Co. on any matter of accounting and financial disclosure. d. Audit and Audit-Related Fees
Ayala Land and its subsidiaries paid its external auditors the following fees in the past two years: (in P million; with VAT)
Audit & Audit-related Fees Tax Fees Other Fees 2007 7.7* - - 2006 7.2* - -
* Pertains to audit fees; no fees for other assurance and related services
e. Tax Fees Tax consultancy services are secured from entities other than the appointed external auditor. Under paragraph D.3.1 of the Ayala Land Audit Committee Charter, the Ayala Land Audit Committee (composed of Ramon R. del Rosario, Jr., Mercedita S. Nolledo and Corazon S. de la Paz-Bernardo) recommends to the Board and stockholders the appointment of the external auditor and the fixing of audit fees. The Board and stockholders approve the Audit Committee's recommendation.
Item 8. Compensation Plans There are no matters or actions to be taken up in the meeting with respect to any plan pursuant to which cash or
non-cash compensation may be paid or distributed. The Executive Stock Option Plan (ESOP) and the Employee Stock Ownership Plan (ESOWN) of the Company were approved by the Securities and Exchange Commission in July 1991 and March 2006, respectively.
C. ISSUANCE AND EXCHANGE OF SECURITIES
Item 9. Authorization or Issuance of Securities Other than for Exchange a. Title and amount of securities to be issued
Allotment and subsequent issuance of up to 1 Billion common shares of stock of the Company with an aggregate par value of One Billion Pesos (P1,000,000,000.00) (the “Shares”).
__________________________________________________________________________ 12
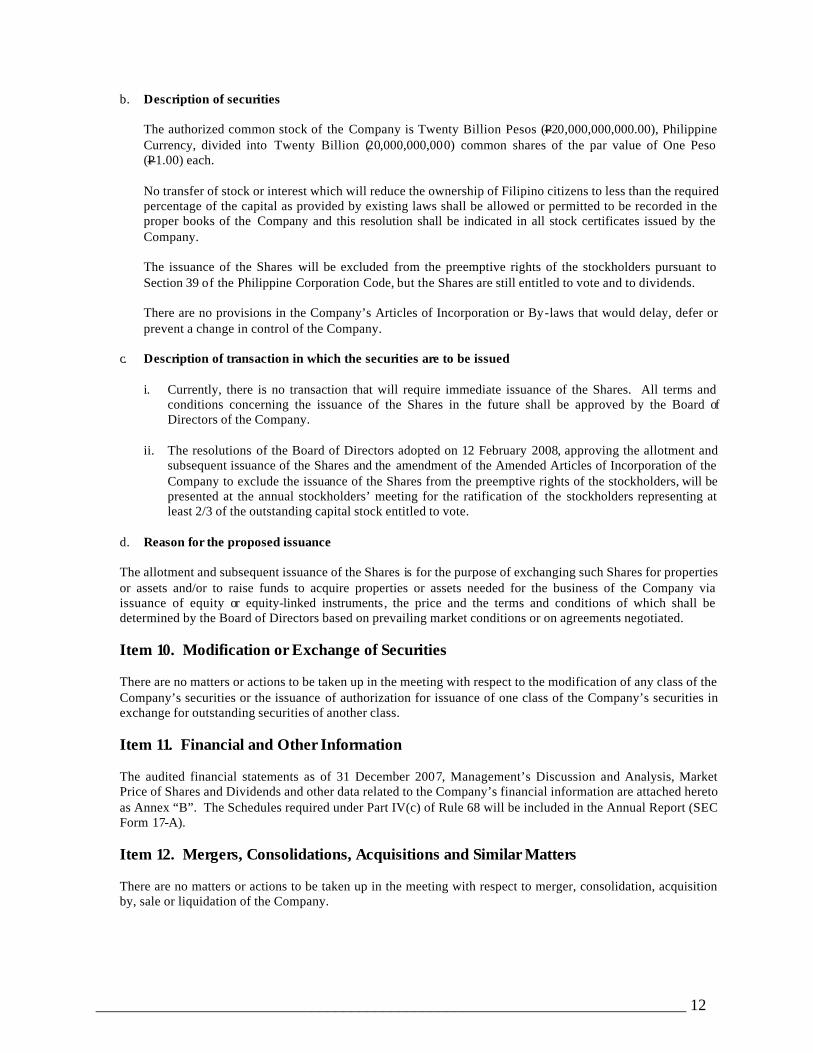
b. Description of securities
The authorized common stock of the Company is Twenty Billion Pesos (P20,000,000,000.00), Philippine Currency, divided into Twenty Billion (20,000,000,000) common shares of the par value of One Peso (P1.00) each. No transfer of stock or interest which will reduce the ownership of Filipino citizens to less than the required percentage of the capital as provided by existing laws shall be allowed or permitted to be recorded in the proper books of the Company and this resolution shall be indicated in all stock certificates issued by the Company. The issuance of the Shares will be excluded from the preemptive rights of the stockholders pursuant to Section 39 of the Philippine Corporation Code, but the Shares are still entitled to vote and to dividends. There are no provisions in the Company’s Articles of Incorporation or By-laws that would delay, defer or prevent a change in control of the Company.
c. Description of transaction in which the securities are to be issued
i. Currently, there is no transaction that will require immediate issuance of the Shares. All terms and conditions concerning the issuance of the Shares in the future shall be approved by the Board of Directors of the Company.
ii. The resolutions of the Board of Directors adopted on 12 February 2008, approving the allotment and
subsequent issuance of the Shares and the amendment of the Amended Articles of Incorporation of the Company to exclude the issuance of the Shares from the preemptive rights of the stockholders, will be presented at the annual stockholders’ meeting for the ratification of the stockholders representing at least 2/3 of the outstanding capital stock entitled to vote.
d. Reason for the proposed issuance
The allotment and subsequent issuance of the Shares is for the purpose of exchanging such Shares for properties or assets and/or to raise funds to acquire properties or assets needed for the business of the Company via issuance of equity or equity-linked instruments, the price and the terms and conditions of which shall be determined by the Board of Directors based on prevailing market conditions or on agreements negotiated.
Item 10. Modification or Exchange of Securities
There are no matters or actions to be taken up in the meeting with respect to the modification of any class of the
Company’s securities or the issuance of authorization for issuance of one class of the Company’s securities in exchange for outstanding securities of another class.
Item 11. Financial and Other Information
The audited financial statements as of 31 December 2007, Management’s Discussion and Analysis, Market Price of Shares and Dividends and other data related to the Company’s financial information are attached hereto as Annex “B”. The Schedules required under Part IV(c) of Rule 68 will be included in the Annual Report (SEC Form 17-A).
Item 12. Mergers, Consolidations, Acquisitions and Similar Matters There are no matters or actions to be taken up in the meeting with respect to merger, consolidation, acquisition
by, sale or liquidation of the Company.

__________________________________________________________________________ 13
Item 13. Acquisition or Disposition of Property There are no matters or actions to be taken up in the meeting with respect to acquisition or disposition of any
property by the Company. Item 14. Restatement of Accounts
Changes in Accounting Policies
The accounting policies adopted are consistent with those of the previous financial year except as follows: • PFRS 7, Financial Instruments: Disclosures, and the complementary amendment to PAS 1,
Presentation of Financial Statements: Capital Disclosures (effective for annual periods beginning on or after January 1, 2007) PFRS 7 introduces new disclosures to improve the information about financial instruments. It requires the disclosure of qualitative information about exposure to risks arising from financial instruments, including specified minimum disclosures about credit risk, liquidity risk and market risk, including sensitivity analysis to market risk. It replaces the disclosure requirements in PAS 32, Financial Instruments: Disclosure and Presentation and PAS 30, Disclosure in the Financial Statements of Banks and Similar Financial Institutions. It is applicable to all entities that report under PFRS. The amendment to PAS 1 introduces disclosures about the level of an entity’s capital and how it manages capital. The Group adopted the amendment to the transition provisions of PFRS 7, as approved by the Financial Reporting Standards Council, which gives transitory relief with respect to the presentation of comparative information for the new risk disclosures about the nature and extent of risks arising from financial instruments. Accordingly, the Group does not need to present comparative information for the disclosures required by paragraphs 31-42 of PFRS 7, unless the disclosure was previously required under PAS 30 or PAS 32. Adoption of PFRS 7 and the amendment to PAS 1 resulted in additional disclosures, which are included throughout the consolidated financial statements.
• Philippine Interpretation IFRIC 10, Interim Financial Reporting and Impairment IFRIC 10 provides that the frequency of financial reporting does affect the amount of impairment charge to be recognized in the annual financial reporting with respect to goodwill and AFS investments. It prohibits the reversal of impairment losses on goodwill and AFS equity investments recognized in the interim financial reports even if impairment is no longer present at the annual balance sheet date. Adoption of this Interpretation did not have any significant impact on the consolidated financial statements.
Future Changes in Accounting Policies
The Group has not applied the following PFRS and Philippine Interpretations which are not yet effective for the year ended December 31, 2007:
• PAS 23, Borrowing Costs (effective for annual periods beginning on or after January 1, 2009)
The standard has been revised to require capitalization of borrowing costs when such costs relate to a qualifying asset. A qualifying asset is an asset that necessarily takes a substantial period of time to get ready for its intended use or sale. In accordance with the transitional requirements in the Standard, this change in accounting for borrowing costs shall be accounted for prospectively. Accordingly, borrowing costs will be capitalized on qualifying assets with a commencement date
__________________________________________________________________________ 14
after 1 January 2009. No changes will be made for borrowing costs incurred to this date that have been expensed. The Group does not expect that the adoption of this standard will have a significant impact on the consolidated financial statements.
• PFRS 8, Operating Segments (effective for annual periods beginning on or after January 1, 2009) This PFRS adopts a management approach to reporting segment information. PFRS 8, will replace PAS 14, Segment Reporting, and is required to be adopted only by entities whose debt or equity instruments are publicly traded, or are in the process of filing with the SEC for purposes of issuing any class of instruments in a public market. The Group will apply PFRS 8 in 2009 and will assess the impact of this Standard on its current manner of reporting segment information.
• Amendment to PAS 1, Amendment on Statement of Comprehensive Income This Amendment will become effective January 1, 2008. In accordance with the amendment to PAS 1, the statement of changes in equity shall include only transactions with owners, while all non-owner changes will be presented in equity as a single line with details included in a separate statement. Owners are defined as holders of instruments classified as equity. In addition, the amendment to PAS 1 provides for the introduction of a new statement of comprehensive income that combines all items of income and expense recognized in the statement of income together with ‘other comprehensive income’. The revisions specify what is included in other comprehensive income, such as gains and losses on available -for-sale assets, actuarial gains and losses on defined benefit pension plans and changes in the asset revaluation reserve. Entities can choose to present all items in one statement, or to present two linked statements, a separate statement of income and a statement of comprehensive income. The Group will assess the impact of the standard on its current manner of reporting all items of income and expenses.
• Philippine Interpretation IFRIC-11, PFRS 2, Group and Treasury Share Transactions This Interpretation requires arrangements whereby an employee is granted rights to an entity's equity instruments to be accounted for as an equity-settled scheme, even if the entity buys the instruments from another party, or the shareholders provide the equity instruments needed. It also provides guidance on how subsidiaries, in their separate financial statements, account for such schemes when their employees receive rights to the equity instruments of the parent. The Group does not expect this interpretation to have a significant impact on its financial statements.
• Philippine Interpretation IFRIC 12, Service Concession Arrangement This Interpretation will become effective January 1, 2008. This Interpretation covers contractual arrangements arising from public -to-private service concession arrangements if control of the assets remain in public hands but the private sector operator is responsible for construction activities as well as for operating and maintaining the public sector infrastructure. This Interpretation will have no impact on the consolidated financial statements as this is not relevant to the Group’s current operations.
• Philippine Interpretation IFRIC 13, Customer Loyalty Programmes This Interpretation will become effective January 1, 2009. The Interpretation addresses accounting by the entity that grants award credits to its customers. This Interpretation applies to customer loyalty award credits that: (a) an entity grants to its customers as part of a sales transaction, i.e. a sale of goods, rendering of services or use by a customer of entity assets; and (b) subject to meeting any further qualifying conditions, the customers can redeem in the future for free or discounted goods or services. This Interpretation will have no impact on the consolidated financial statements as this is not relevant to the Group’s current operations.

__________________________________________________________________________ 15
• Philippine Interpretation IFRIC-14, IAS 19, Limit on Defined Benefit Asset, Minimum Funding Requirement and Other Interaction. IFRIC Interpretation 14 was issued in July 2007 and becomes effective for annual periods beginning on or after January 1, 2008. This Interpretation provides guidance on how to assess the limit on the amount of surplus in a defined benefit scheme that can be recognized as an asset under IAS 19 Employee Benefits. The Group expects that this Interpretation will have no impact on the financial pos ition or performance of the Group as all its defined benefit schemes are currently in deficit.
D. OTHER MATTERS Item 15. Action with Respect to Reports
a. Approval of the Minutes of the 2007 Annual Meeting of the Stockholders held on 28 March 2007 covering the following matters:
i) Annual Report of Officers; ii) Ratification and approval of all acts and resolutions of the Board of Directors and the Executive
Committee for the fiscal year 2006 which include among others the approval of projects and investments, treasury matters including borrowings and bank transactions and appointment of officers and signatories;
iii) Ratification of the resolutions of the Board of Directors declaring a 20% Stock Dividend and approving the increase in authorized capital stock from P12B to P20B and the amendment of Article Seventh of the Amended Articles of Incorporation to reflect the capital increase;
iv) Election of the Members of the Board of Directors, including Independent Directors, and v) Election of External Auditors and Fixing their Remuneration.
b. Approval of the Minutes of the Special Meeting of the Stockholders held on 28 August 2007 ratifying the
resolutions of the Board of Directors covering the following matters:
i) Increase in authorized capital stock of the Corporation from P20B to P21.5B; ii) Amendment of Article Seventh of the Amended Articles of Incorporation to reflect the capital
increase; and iii) Offering of 13.034 Billion Preferred Shares to all common shareholders of the Corporation including
the terms thereof. c. Approval of the Annual Report of Management for the year ending 31 December 2007.
Item 16. Matters not required to be Submitted All matters or actions to be taken up in the meeting will require the vote of the security holders. Item 17. Amendment of Charter, Bylaws or Other Documents
Upon ratification by the stockholders, the Amended Articles of Incorporation of the Company will be further amended to exclude the issuance of the 1 Billion common shares from the preemptive rights of the stockholders. The Company undertakes to amend its By-laws to incorporate by reference SRC Rule 38 on the nomination and election of independent directors as required by the SEC.

__________________________________________________________________________ 16
Item 18. Other Proposed Action
a. Ratification of all acts of the Board of Directors, Executive Committee and Management for the period covering 01 January 2007 through 31 December 2007.
These acts are covered by Resolutions of the Board of Directors duly adopted in the normal course of trade or business involving: i) Approval of projects and investments; ii) Treasury matters including borrowings, opening of accounts and bank transactions; and iii) Appointment of signatories and amendments thereof.
b. Ratification of the resolutions of the Board of Directors adopted on 12 February 2008:
i) approving the allotment and subsequent issuance of up to 1 Billion common shares of stock of the Corporation with an aggregate par value of One Billion Pesos (P1,000,000,000.00) (the “Shares”) for the purpose of exchanging such Shares for properties or assets and/or to raise funds to acquire properties or assets needed for the business of the Corporation via issuance of equity or equity-linked instruments the price and the terms and conditions of which shall be determined by the Board of Directors based on prevailing market conditions or on agreements negotiated; and
ii) amendment of the Amended Articles of Incorporation of the Corporation to exclude the issuance of the Shares from the preemptive rights of the stockholders.
c. Election of the Members of the Board of Directors, including the independent directors, for the ensuing
calendar year.
d. Election of External Auditors and fixing their remuneration. Item 19. Voting Procedures
a. Vote required : The vote of stockholders representing at least two-thirds (2/3) of the issued and outstanding capital stock entitled to vote is required to pass the resolutions on the 1 Billion common shares allotment and its subsequent issuance and the amendment to the Amended Articles of Incorporation to exclude the issuance of these Shares from the preemptive rights of the stockholders. All the other items in the agenda require the majority vote of the stockholders.
b. Method of Voting : Straight and Cumulative Voting
In all items for approval except election of directors, each share of stock entitles its registered owner to one vote. In case of election of directors, each common stockholder may vote such number of shares for as many persons as there are directors to be elected or he may cumulate said shares and give one nominee as many votes as the number of directors to be elected multiplied by the number of his shares shall equal, or he may distribute them on the same principle among as many nominees as he shall see fit, provided that the whole number of votes cast by him shall not exceed the number of shares owned by him multiplied by the total number of directors to be elected. If there are more than nine nominees for the 9-member Board of Directors, voting shall be done by secret ballot. If there are only nine nominees, voting will be done by show of hands. The external auditor of the Company, SGV & Co., will validate the ballots when voting is done by secret ballot. Likewise, SGV will count the number of hands raised when voting by show of hands is done.
__________________________________________________________________________ 17
After reasonable inquiry and to the best of my knowledge and belief, I certify that the information set forth in this report is true, complete and correct. This report is signed in the City of Makati on the 21st day of February 2008.
AYALA LAND, INC.
by: MERCEDITA S. NOLLEDO Corporate Secretary
__________________________________________________________________________ 18
ANNEX “A” DIRECTORS AND KEY OFFICERS
(as of 31 December 2007)
The write-ups below include positions currently held by the directors and executive officers, as well as positions held during the past five years.
Board of Directors
Fernando Zobel de Ayala Delfin L. Lazaro Jaime Augusto Zobel de Ayala Leandro Y. Locsin, Jr. Jaime I. Ayala Aurelio R. Montinola III Corazon S. de la Paz-Bernardo Mercedita S. Nolledo Ramon R. del Rosario, Jr.
Fernando Zobel de Ayala, 47, Filipino, has served as Chairman of the Board of Directors of ALI since 1999. He is also the President and Chief Operating Officer of Ayala Corporation. His other significant positions include: Chairman of Manila Water Company, Inc., AC International Finance Ltd., Ayala International Pte. Ltd., Ayala Automotive Holdings Corp., Ayala Hotels, Inc., Alabang Commercial Corp., and Anvaya Cove Beach and Nature Club, Inc.; Co-Vice Chairman and Trustee of Ayala Foundation, Inc.; Director of the Bank of the Philippine Islands, Globe Telecom, Inc., Integrated Micro-electronics Inc., AI North America and Habitat for Humanity International; and Member of the East Asia Council of INSEAD. He graduated with B.A. Liberal Arts at Harvard College in 1982.
Jaime Augusto Zobel de Ayala, 48, Filipino, has served as Director and member of the Executive
Committee of ALI since 1988. He also serves as the Chairman and Chief Executive Officer of Ayala Corporation. He is also Chairman of the Board of Directors of Globe Telecom, Inc., Bank of the Philippine Islands and Integrated Micro-electronics, Inc. He is a member of various international and local business and socio-civic organizations including the JP Morgan International Council, Mitsubishi Corporation International Advisory Committee, Toshiba International Advisory Group, Harvard University Asia Center Advisory Committee, Board of Trustees of the Asian Institute of Management and a national council member of the World Wildlife Fund (US). He was a TOYM (Ten Outstanding Young Men) Awardee in 1999 and was named Management Man of the Year in 2006 by the Management Association of the Philippines for his important role in the transformation of Ayala Corporation into a highly diversified forward -looking conglomorate. He was also awarded the prestigious Harvard Business School Alumni Achievement Award in 2007. He graduated with B.A. in Economics (Cum Laude) at Harvard College in 1981 and took his MBA (with Distinction) at the Harvard Graduate School of Business Administration in 1987.
Jaime I. Ayala, 45, Filipino, became President of Ayala Land, Inc. on July I, 2004. He joined ALI in January 2004 as Executive Vice President and member of the Management Committee. Concurrently, he is Senior Managing Director of Ayala Corporation. His other significant positions include: Chairman of the Board of Directors and President of Makati Property Ventures, Inc.; Chairman of the Board of Directors of Ayala Property Management Corp., Cebu Holdings, Inc., Cebu Insular Hotel Co., Inc., Cebu Property Ventures & Development Corp., Community Innovations, Inc., Avida Land Corp., Laguna Technopark, Inc., Makati Development Corp., and Station Square East Commercial Corp; Member of the Board of Directors and President of Aurora Properties, Inc, Ayala Hotels, Inc., Ceci Realty Inc., Enjay Hotels, Inc., Roxas Land Corp., Vesta Property Holdings, Inc. and Anvaya Cove Beach and Nature Club, Inc.; Member of the Board of Directors of Alabang Commercial Corp., Ayala Greenfield Development Corp., Ayala Infrastructure Ventures, Inc., Ayala Land Sales, Inc., Berkshire Holdings, Inc., Bonifacio Arts Foundation, Inc., Bonifacio Land Corp., Emerging City Holdings, Inc., Fort Bonifacio Development Corp., myAyala.com, Inc., Ayala Center Association and Makati Parking Authority. Prior to joining ALI, he spent 19 years with McKinsey & Company in the US, Mexico, Tokyo and Hong Kong. At McKinsey, he was a Director (senior partner) and played a number of global and regional leadership roles, including that of President of McKinsey's Manila office. He earned his M.B.A. from Harvard School, graduating with honors in 1988. He completed his undergraduate work in 1984 at Princeton University, where he graduated Magna Cum Laude in Economics, with a minor in Engineering.

__________________________________________________________________________ 19
Corazon S. de la Paz-Bernardo, 66, Filipino, has served as an Independent Director of ALI since April 2006. She is currently the President and Chief Executive Officer of Social Security System. She was re-elected on Septemb er 2007 as the President of the International Social Security Association, for the triennium 2008-2010, the first non-European to occupy this position. She served as Chairman of Equitable PCI Bank, Inc. (EPCIB) from February 21, 2006 up to June 2007. She was elected/appointed on July 2007 as Vice-Chairperson of the newly merged bank now known as Banco de Oro – EPCI, Inc. However, the bank is using BDO Unibank as its trade name. She is als o a Director of San Miguel Corporation, Philippine Long Distance Telephone Company, Ionics, Inc., Equitable Card Network, Inc., PCI Leasing & Finance, Inc., Philex Mining Corp., Philex Gold, Inc., Republic Glass Holdings and Philippine Health Insurance Corporation. She is also a member of the Board of Trustees of: Jaime V. Ongpin Foundation, Inc., Laura Vicuña Foundation for Street Children, Makati Business Club (Treasurer), MFI Foundation, Inc. (Treasurer), Miriam College, Philippine Business for the Environment and University of the East. Other memberships include those in: the Management Association of the Philippines, the Financial Executive Institute of the Philippines, the Asia Society, (Philippine Chapter), and Member of the Board of Advisors of Ramon V. del Rosario, Sr. – AIM Center for Corporate Social Responsibility. She was the Chairman and Senior Partner of Joaquin Cunanan & Co. (PricewaterhouseCoopers, Philippines) from 1981 to 2001 and served in the Price Waterhouse World Board from 1992 to 1995. She received a Fulbright Achievement Award for Business Administration in 1988 and was one of The Outstanding Women in the Nation’s Service Awardee for Management in 1983. She has a Masters in Business Administration degree from Cornell University, as a Fulbrighter and a University of the East scholar. She studied Business Administration at the University of the East, graduating magna cum laude. She placed first in the 1960 Philippine board examination for certified public accountants.
Ramon R. del Rosario, Jr., 63, Filipino, has served as an Independent Director of ALI since 1994. He is
President and Chief Executive Officer of Philippine Investment Management (PHINMA), Inc., President of Bacnotan Consolidated Industries, Inc. and Microtel Development Corp., Chairman and CEO of AB Capital and Investment Corporation, Chairman of United Pulp and Paper Co., Inc., Microtel Inns and Suites (Pilipinas), Inc., CIP II Power Corp., Trans-Asia Gold and Minerals Development Corp., Stock Transfer Services, Inc., Araullo University and Cagayan de Oro College. He is Director of Trans-Asia Oil & Energy Development Corporation, Trans-Asia Power Generation Corp., Phinma Property Holdings Corp., Roxas Holdings, Inc., Holcim (Phils.), Inc., and Union Galvasteel Corp. He served as the Philippines’ Secretary of Finance in 1992-1993. He is the current chairman of the Makati Business Club. He graduated with degrees in BSC-Accounting and AB-Social Sciences (Magna cum Laude) at De La Salle College, Manila in 1967 and earned his Masters in Business Administration at Harvard Business School in 1969.
Delfin L. Lazaro, 61, Filipino, has served as member of the Board of Directors of ALI since 1996. He is a member of the Management Committee of Ayala Corporation; Director and Chairman of the Executive Committee of Globe Telecom, Inc.; Director of Integrated Micro-electronics, Inc., Manila Water Co., Inc. and Ayala Automotive Holdings Corp.; and President of Azalea Technology Investments. Formerly, Mr. Lazaro was the President and CEO of Benguet Corporation and Secretary of the Department of Energy of the Philippine government. He was named Management Man of the Year 1999 by the Management Association of the Philippines for his contribution to the conceptualization and implementation of the Philippine Energy Development Plan and to the passage of the law creating the Department of Energy. He was also cited for stabilizing the power situation that helped the country achieve successively high growth levels up to the Asian crisis in 1997. He graduated with BS Metallurgical Engineering at the University of the Philippines in 1967 and took his MBA (with Distinction) at Harvard Graduate School of Business in 1971.
Leandro Y. Locsin, Jr., 45, Filipino, has served as an Independent Director of ALI since 1994. He also serves as Administrator and Design Consultant of Leandro V. Locsin Partners Architects; Senior Vice President of C-J Yulo & Sons and Canlubang Sugar Estate. He is the Founding Chairman/Director of The Beacon School and is a Director of World Wildlife Fund, Phils., E-Media Inc., and Museo Pambata ng Maynila. He is Chairman of Vesta Property Holdings, Inc., and a member of the Ayala Museum Board of Advisers. He graduated with a Bachelor of Arts, Double Major in Architecture and Eastern Art History at Wesleyan University in Connecticut in 1984, and earned his Master of Architecture degree at the Harvard University Graduate School of Design in 1989.

__________________________________________________________________________ 20
Aurelio R. Montinola, III, 56, Filipino, has served as member of the Board of Directors of ALI since
February 2005. He is the President and CEO of Bank of the Philippine Islands. His other affiliations, among others, include: Vice Chairman of the Board of Directors of Republic Cement Corporation; Vice Chairman of the Board of Trustees of Far Eastern University; Chairman of East Asia Educational Foundation, Inc.; Chairman of the Board of Directors of Amon Trading Corporation; Regional Board of Advisers of MasterCard Incorporated; Director of Manila Water Company; President of BPI Foundation, Inc.; Director of Makati Business Club; and Member of the Management Association of the Philippines. He graduated with BS Management Engineering at Ateneo de Manila University in 1973 and received his MBA at Harvard Business School in 1977.
Mercedita S. Nolledo, 66, Filipino, has served as Director and Corporate Secretary of ALI since 1994. She
also serves as Board member, Senior Managing Director and Corporate Secretary of Ayala Corporation and Senior Counsel of the Ayala Group of Companies. Her other significant positions include: Director of Honda Cars Cebu, Inc., Honda Cars Makati, Inc., Isuzu Automotive Dealership, Inc., Isuzu Cebu, Inc., Ayala Automotive Holdings Corp., Bank of the Philippine Islands, BPI Family Bank, BPI Capital Corp. and Anvaya Cove Beach and Nature Club, Inc.; Corporate Secretary and Member of the Board of Trustees of Ayala Foundation, Inc.; Director and Treasurer of Phil. Tuberculosis Society, Inc. She had her education at the University of the Philippines and graduated Magna Cum Laude and Class Valedictorian in Bachelor of Science in Business Administration and Cum Laude and Class Valedictorian in Bachelor of Laws. Nominee to the Board of Directors for the ensuing year:
Francis G. Estrada, 58, Filipino, is the President of Asian Institute of Management since May 2007. Prior to his assumption of the Presidency of AIM, he served as Chairman, General Partner and co-founder of Equity Managers Asia, Inc. (Philippines). His other significant positions include: Founder, President and Chief Executive Officer of Odyssey Capital Ventures (SPV-AMC), Inc. and Chairman, Partner and co-founder of Equity Managers Asia, Inc. He is a Fellow of the Institute for Solidarity in Asia (ISA), an organization that seeks to improve public governance through active citizen participation. He is also a Fellow and Trustee of the Institute of Corporate Directors and a Trustee and Chairman of the Finance and Investment Committee of the Board of De La Salle University in the Philippines. He was named “Most Outstanding Alumnus” of the Asian Institute of Management in 1989. He holds a Bachelor of Arts (Literature) and Bachelor of Science (Business Administration) degrees from De La Salle University (Philippines), and a Master in Business Management, “with Distinction” from the Asian Institute of Management. He also completed the Advanced Management Program at the Harvard Business School. Management Committee Members / Key Executive Officers Jaime I. Ayala * President and Chief Executive Officer Mercedita S. Nolledo* Corporate Secretary Miriam O. Katigbak ** Executive Vice President Vincent Y. Tan Executive Vice President Ma. Victoria E. Añonuevo Senior Vice President Raul M. Irlanda Senior Vice President Rex. Ma. A. Mendoza Senior Vice President John Philip S. Orbeta Senior Vice President Emilio J. Tumbocon Senior Vice President Jaime E. Ysmael Senior Vice President & Chief Finance Officer Dinna G. Bayangos Vice President Augusto D. Bengzon Vice President & Treasurer Bernard Vincent O. Dy Vice President Angela DV. Lacson Consultant * Member of the Board ** Retired effective December 31, 2007
__________________________________________________________________________ 21
Miriam O. Katigbak, 53, Filipino, is Executive Vice-President, member of the Management Committee.
Until 2006, she was head of the Ayala Malls Group of Ayala Land, Inc. (ALl). She is now assigned to Strategic Landbank Management Group, handling signature projects. Her other significant positions include: Director and President of Alabang Commercial Corp., ALl-CII Development Corp., North Triangle Depot Commercial Corp., Station Square East Commercial Corp., Studio Ventures Inc.; Director of Cebu Holdings, Inc.; Director of MRT Development Corp. and MZM Retail Holdings Corp.; Chairman of Five-Star Cinema, Inc., Ayala Theaters Management Inc., and NorthBeacon Commercial Corp.; Chairman and President of South Innovative Theatres Management, Inc.; Vice-Chairman of Lagoon Development Corporation. She graduated with Bachelor of Science in Education, Major in Mathematics, at St. Scholastica's College. She took the Management Development Program at the Asian Institute of Management in 1993 and at the University of Michigan in 1997.
Vincent Y. Tan, 57, Filipino, is Executive Vice-President, memb er of the Management Committee and
Head of the Planning Group and Strategic Landbank Management Group of ALL His other positions include: Chairman and President of Bonifacio Cable One Corp., Bonifacio Construction Management Corp., Bonifacio Global City Es tate Services Corp., Bonifacio Transport Corporation, Bonifacio Trees & Greens Corporation, Capital Consortium, Inc., Crescent West Development Corporation, North Bonifacio Development Corporation; Chairman of the Board of Laguna Technopark, Inc., CMPI Holdings, Inc. and CMPI Land, Inc., Bonifacio Estate Services Corp., Fort Bonifacio Development Foundation, Inc.; President of ALlnet.com, Inc.; and Member of the Board of Directors of Ayala Greenfield Development Corporation, Community Innovations, Inc., Station Square East Commercial Corporation, Aurora Properties, Inc., Vesta Property Holdings, Inc., myAyala.com, Inc., Metro Rail Transit Corporation, Metro Rail Transit Dev. Corp., Metro Rail Transit Holdings II, Inc., MRT Holdings, Inc., North Triangle Development Corporation, Berkshires Holdings, Inc., Bonifacio Land Corp., Columbus Holdings, Inc., Emerging City Holdings, Inc., Fort Bonifacio Development Corporation and Anvaya Cove Beach and Nature Club, Inc.; Treasurer of Bonifacio Art Foundation. He graduated with a degree of B.S. Management Engineering (Cum Laude) at the Ateneo de Manila University in 1971 and earned his M.B.A. (Concentration in Management Science and Finance) at the University of Chicago in 1973.
Ma. Victoria E. Añonuevo, 57, Filipino, is Senior Vice-President and Member of the Management
Committee of ALI. She also serves as Head of the Corporate Business Group, President of Laguna Technopark, Inc., President & Chief Executive Officer of Ayala Hotels, Inc., President of Enjay Hotels, President of Cebu Insular Hotel Co., Inc., Chairman & President of ALI Property Partners Corp. (APPCo), Director of Anvaya Cove Beach and Nature Club, Inc., Director of Tower One Condominium Corp. and Director of Madrigal Business Park. She graduated with a degree of Bachelor of Science in Business Administration, Major in Marketing (Cum Laude) at the University of the Philippines in 1971 and had her Masters in Business Administration at the University of the Philippines in 1975. She was sent by Ayala Land, Inc. in 1997 as a scholar to the Program for Management Development, Harvard Business School.
Raul M. Irlanda, CFM, 52, Filipino, is Senior Vice-President, member of the Management Committee. He is also the President and director of Makati Development Corporation and a Director of Anvaya Cove Beach and Nature Club, Inc. He is the first and only Filipino Certified Facility Manager (CFM) by the International Facility Management Association (IFMA). He is also Board Adviser of the College of Technology Management of the University of Makati. He graduated with a degree of Bachelor of Science in Management/Finance from San Sebastian College and obtained his Master of Business Administration major in Financial Management from De La Salle University. He also completed in 2005 the Executive Development Program at the Aresty Institute of Executive Education at Wharton, University of Pennsylvania.
Rex Ma. A. Mendoza , 45, Filipino, is Senior Vice-President and head of Corporate Sales and Marketing Group. He is a member of the Management Committee of Ayala Land, Inc. Concurrently, he is the Chairman of Ayala Land International Sales, Inc.; President of Ayala Land Sales, Inc.; Head of Sales & Marketing for the Residential Business Group; Chairman and President of Rampver, Inc.; Marketing and Training Consultant for IMPACT and Mindbroker, Inc.; and Professor of De La Salle University, Graduate School of Business. Prior to joining Ayala Land, Inc., he was Executive Vice President and head of Sales, Marketing and Training at the Philippine American Life & General Insurance Company; Vice Chairman and CEO of Philam Asset Management; Vice Chairman and CEO of Philam Financials; Director of Philam Insurance Co., Security Philam, Philam Call Center and Philam Foundation. He graduated with a degree of Bachelor of Science in Business Administration, major in Marketing and Finance from the University of the Philippines, Diliman, Q.C., and took his Masters in Business Management, with distinction at the Asian Institute of Management.

__________________________________________________________________________ 22
John Philip S. Orbeta, 46, Filipino, is Senior Vice President and Head of Human Resources. He is a
member of the Management Committee of Ayala Land, Inc. Concurrently, he is a Managing Director and Head of Strategic Human Resources and Organization Development of Ayala Corporation and Chairman of the Ayala Group Human Resources Council. Prior to joining the Ayala group, he spent 19 years at Watson Wyatt Worldwide (NYSE:WW), global management consulting firm where he was the Vice President and Global Practice Director for the firm's Human Capital Group, overseeing the firm's practices in executive compensation, strategic rewards, data services and organization effectiveness around the world. He was also a member of Watson Wyatt's Board of Directors. He received his undergraduate degree in Economics from the Ateneo de Manila University where he also attended graduate studies in Industrial Psychology. He has also completed a Leadership Development Program at the Harvard Business School.
Emilio J. Tumbocon, 51, Filipino, is a Senior Vice-President, member of the Management Committee of
Ayala Land, Inc. and concurrently, serves as President of Ayala Property Management Corporation, a wholly owned subsidiary of ALI. He is also a certified Project Management Professional (PMP’06) of the Project Management Institute, Past President of the Philippine Constructors Association, Inc. (PCA), a Trustee of the Construction Safety Foundation, Inc. and a Director of the Anvaya Cove Beach and Nature Club, Inc. He graduated from the University of the Philippines with a degree of Bachelor of Science in Civil Engineering (C.E. '79) and graduated in Masters in Business Administration (MBA '85) at the same university. He also took the Construction Executive Program (CEPS '87) at Stanford University, Palo Alto, California, U.S.A., the Senior Business Executive Program (SBEP ‘91) at the University of Asia and the Pacific, and The Executive Program (TEP ‘97) at Darden Graduate School of Business Administration, University of Virginia.
Jaime E. Ysmael, 47, is Senior Vice President, Chief Finance Officer and member of the Management Committee of Ayala Land, Inc. Concurrently, he is Managing Director of Ayala Corporation. His other significant positions include: Director and Treasurer of Alinet.com, Ayala Hotels, Inc., Ayala Land International Sales, Inc., Ayala Land Sales, Inc., Community Innovations, Inc., Enjay Hotels, Inc., Laguna Technopark, Inc., Makati Property Ventures, Inc. and Serendra, Inc.; Director, Treasurer & Chief Finance Officer of Anvaya Cove Beach & Nature Club, Inc., Glensworth Development, Inc., Hillsford Property Corporation and Gisborne Property, Inc.; Director of Alabang Commercial Corp., Allysonia International, Inc., Aurora Properties, Inc., Avida Land Corporation, Batangas Asset Corporation, Bridgebury Realty Corp., Cebu Insular Hotel Company, Inc., Ceci Realty, Inc., CMPI Holdings, Inc., CMPI Land, Inc., Crans Montana Property Holdings Corp., Gammon Philippines, Inc., Laguna Phenix Structures Corp., Makati Theatres, Inc., North Triangle Depot Commercial Corp., Oxbury Realty Corp., Piedmont Property Ventures, Inc., Regent Time International Ltd., Station Square East Commercial Corp., Stonehaven Land, Inc., Streamwood Properties, Inc., and Vesta Properties Holdings, Inc.; and Chief Finance Officer of Roxas Land Corp. He graduated Summa Cum Laude at the University of the East with a degree of Bachelor of Science in Business Administration, Major in Accounting. He holds an M.B.A. degree (Major in Finance) from The Wharton School and an M.A. degree in International Studies from the School of Arts and Sciences of the University of Pennsylvania under The Joseph H. Lauder Institute of Management and International Studies.
Dinna G. Bayangos, 43 Filipino, is Vice President and member of the Management Committee of ALI effective January 1, 2005. She is also the President of Ayala Land International Sales, Inc. (ALISI). Her other significant positions include: Director of Community Innovations, Inc., Makati Development Corp. and Cebu Holdings, Inc. Before she became President of Ayala Land International Sales, Inc. she was the President of Avida Land Corp. (formerly Laguna Properties Holdings, Inc.) and its subsidiary, Avida Sales Corp. She graduated with a degree of A.B. Major in Economics and B.S.C. Major in Management of Financial Institutions (Cum Laude) at De La Salle University and took her Masteral in Business Management at the Asian Institute of Management and an Advanced Management Program at Wharton School of Business.
Augusto D. Bengzon, 44, Filipino, joined ALI in December 2004 as Vice President and Treasurer. His
other significant positions include: Treasurer of Avida Land Inc. (formerly Laguna Properties Holdings, Inc.), Makati Development Corp., Aurora Properties, Inc., Vesta Properties Holdings, Inc., and CECI Realty, Inc. Prior to joining ALI, he was Vice President and Credit Officer in Global Relationship Banking at Citibank N.A. where he spent sixt een years in various line management roles covering Treasury, Portfolio Management, Structuring, Debt Syndication and Relationship Management. He received his Bachelor of Science degree in Business Management from the Ateneo de Manila University and is a graduate of the Philippine Trust Institute. He was granted a full scholarship by the Asian Institute of Management where he received his Masters in Business Management degree.

__________________________________________________________________________ 23
Bernard Vincent O. Dy , 44, Filipino, is Vice President & member of the Management Committee of Ayala Land, Inc. since 2005. Currently, he is the Head of the Residential Business Group of ALI His other significant positions include: Director of Fort Bonifacio Development Group, Serendra, Inc. and Anvaya Cove Beach & Nature Club, Inc. He graduated with a degree of Bachelor of Science in Business Administration from the University of Notre Dame and took up his MBA and Masters in International Relations at the University of Chicago.
Angela de Villa-Lacson, 61, Filipino, joined Ayala Land, Inc. (ALI) in July 1999. Until the end of 2007, she was Senior Vice-President and Management Committee member of ALI and Group Head of ALI's Innovation and Design Group. Until October 15, 2006, she was Group Head of the Integrated ALI High End SBUs: Land and Community Development Group, Residential Business Group and Sales and Marketing Group. Her other significant positions while connected with ALI included: Director and President of Ayala Land Sales, Inc. and Serendra, Inc.; Director and General Manager of Roxas Land Corporation; Director of Avida Land Corporation, Ayala Property Management Corporation, Aurora Properties, Inc., Community Innovations, Inc., Ceci Realty, Inc., Makati Development Corporation, and Vesta Property Holdings, Inc. Prior to joining ALI, she was Vice President and Marketing Director of San Miguel Brewery Philippines and San Miguel Brewery International (1998-1999), Marketing Director of the San Miguel Food Group (1996-1997), Vice President and Division Head of J Walter Thompson (1995). Before this, she was connected with Unilever Philippines, UK and Italy. She graduated with a degree of Bachelor of Liberal Arts, Major in Mathematics and English Literature (Magna Cum Laude) at the Assumption College.
__________________________________________________________________________ 24
ANNEX “B”
I. MANAGEMENT’S DISCUSSION AND ANALYSIS (MD&A) OF FINANCIAL CONDITION AND RESULTS OF OPERATION
2007 vs. 2006 Results of Operations Ayala Land, Inc. ("the Company") posted a healthy 13% growth in consolidated net income, reaching Php 4.4 billion from Php 3.9 billion last year, on the back of significant margin expansion in the Company's key business lines. Consolidated revenues meanwhile increased 1% to P 25.7 billion from Php 25.6 b illion in 2006. Revenue growth was tempered by the accelerated residential revenue bookings in 2006 following the adoption of a standardized revenue recognition policy and the absence of BPO leasing revenues from the sale of PeopleSupport Building in the fourth quarter of 2006. As a result, operating revenues contributed by the Company's five core and three support businesses amounted to only Php 22.9 billion last year, down by 3% from Php 23.6 billion in 2006. The impact of the decline in operating revenues was offset by robust growth in Interest and Other Income which grew by 25% to Php 2.1 billion. This was driven by the gain on the sale of 16,758 preferred shares in KHI-ALI Manila, Inc. (KAMI) to Kingdom Manila B.V. in connection with the development of a luxury hotel complex within Ayala Center. Also boosting revenues were higher equity earnings from Ayala Land's corporate investment vehicles for Bonifacio Global City, as well as the improved earnings performance of affiliates Cebu Holdings, Inc. (CHI) and Alabang Commercial Corporation (ACC), which accounted for Php 787 million, compared to Php 306 million in 2006. Meanwhile, the Company booked a net gain after tax of Php 599 million from the sale of shares in Makati Property Venture, Inc (MPVI) to the Ascott Residence Trust. Driving the company's profitability was increased pricing power, particularly in the company's residential projects, as well as tight control of operating expenses. As a result, overall net operating income (NOI) margin increased to 34% from 31% in 2006, with residential development and corporate business contributing most of the improvement. General and administrative expenses grew modestly by 4% to Php 2.7 billion due to the initiatives undertaken to further build up the organization for the current aggressive expansion programs. However, interest and other charges increased to Php 1.8 billion or by 64% due to expenses related to the Glorietta 2 explosion and incurred as a result of KAMI transaction. Business Segments The Residential Development business accounted for the bulk of revenues at Php 13.0 billion or 50% of total revenues. This was followed by Shopping Centers at Php 4.2 billion or 16% of total and Corporate Business at Php 993 million or 4% of total. Strategic Landbank Management generated Php 373 million and Visayas -Mindano added Php 176 million for a combined 2% share of total revenues. Collectively, the Support Businesses, comprised of Hotels, Construction and Property Management, reported revenues of Php 4.2 billion, or 16% of total revenues. The balance of Php 2.9 billion or 11% of total revenues was from Equity in Net Earnings, Interest and Other Income. Residential Development Residential Development revenues amounted to Php 13.0 billion in 2007, 7% lower than the Php 14.0 billion posted in 2006. Avida Land reported a significant 54% increase in revenues but Ayala Land Premier (ALP) and Community Innovations (Cll) pulled down Avida's gains. Despite the increase in unit bookings in 2007, ALP and CII's revenues declined due to the acceleration of revenues in 2006 as a result of the standardization of the revenue recognition policy implemented in the second quarter of 2006. Revenue recognition for all brands should normalize by 2008.

__________________________________________________________________________ 25
Overall demand for residential projects remained strong with 4,404 units booked during the year, 39% more than 2006. The value of these units was 25% higher at Php 16.0 billion versus the Php 12.8 billion last year. A total of 5,182 units were launched in 2007, 12% more than the previous year. Ayala Land Premier. Revenues of ALP stood at Php 7.3 billion in 2007, 15% less than what was posted last year. 1,358 units were booked in 2007, compared to 1,352 units in 2006. High-end lots contributed Php 2.0 billion or 25% less year-on-year (y-o-y) due to less lots sold in Sonera, which is nearly sold-out (5 lot sales in 2007 versus 103 in 2006), and Ayala Greenfield (113 lots in 2007 versus 135 in 2006). Abrio, the high-end residential development in Nuvali launched in October 2007, was a large success with 84% take-up of the 267 units launched in just two months and with bookings of 87 lots. Revenue impact was muted though since average completion was only at 28% by year-end. Revenues from high-end units were lower by 16% at Php 4.4 billion, despite the increase in units booked at The Residences at Greenbelt (TRaG), which ended at 357 from 224 the previous year. Meanwhile, revenues from leisure project Anvaya Cove reached Php 840 million, 42% more than the Php 593 million in 2006 as an additional 350 beach club shares, 74 lots and 9 villas were booked. Community Innovations, Inc. Cll reported a 19% drop in revenues to Php 3.0 billion despite the 53% jump in booked units to 1,198 from 785 last year. The standardization of the revenue recognition policy last year effectively pulled forward the booking of revenues for completed projects in 2006. The higher sales bookings are largely due to brisk sales at newly-launched projects such as Marquee Place in Pampanga and The Aston, the first of four high-rises at Two Serendra.. 290 units were booked at Marquee Place which was launched only in June, and achieved 44% completion by year-end. Similarly, 174 units were booked at The Aston, which registered 17% completion. With construction completion only at 6%, revenue contribution from the 208 booked units at The Columns Legaspi Village Tower Two was marginal. Likewise, Treveia in Nuvali booked 71 units but had 0% completion and therefore no revenue recognition by year-end. Avida Land. Avida's revenues grew by 54% to Php 2.7 billion in 2007. This was due to the 2007 bookings of 1,848 units compared to only 1,033 units in 2006. Bulk of the revenues came from the newly-launched Avida Towers Makati West (231 bookings at 27% completion), Avida Towers San Lazaro (285 bookings at 57% completion), Avida Settings in Nuvali (99 bookings at 10% completion). Overall Net Operating Income (NOl). NOI for the residential business reached Php 3.5 billion, 15% more than the previous year despite the drop in revenues. This is attributed to the five percentage point improvement in NOI margin to 27% from 22%, with all three brands enjoying healthy pricing power and contributing to the increase. In 2008, about 5,600 units from new projects and additional phases of existing projects will be launched and added to inventory, 8% more than what was brought into the market in 2007. Some projects will be in new locations such as Pasig, Marikina and the northern part of Quezon City. Shopping Centers Shopping Centers reported a 5% rise in revenues to Php 4.2 billion in 2007. This is attributed to the higher occupancy rate of consolidated malls (which averaged 95% compared with 93% in 2006), the 4% increase in average building rental rates, and a higher gross leasable area (GLA). The opening of the 195,000-square meter TriNoma in May brought total GLA to 960,000 square meters from 760,000 square meters at end-2006. As of end-2007, 87% of the 72,000 square meters building leasable area (excluding the area occupied by anchor tenant Landmark) of TriNoma had been occupied. Phase 1 of Greenbelt 5, which soft-opened in October, was 100% leased out/committed as of year-end. The NOI of Shopping Centers dropped slightly by 1% to Php 2.4 billion following the absence of one quarter’s earnings from the high-margin Glorietta 2 mall, as a result of the unfortunate explosion last October 19. Because of this, the resulting NOI margin likewise declined by three percentage points and stood at 58% from 61% the previous year. Equity in Net Earnings from equitized malls, namely, Alabang Town Center, Pavilion Mall and TriNoma was higher at Php 124 million from Php 85 million last year. It is notable however that TriNoma already reached a positive NOI margin contribution in its initial year of operations.

__________________________________________________________________________ 26
In 2008, an additional 18,000 square meters of GLA will come on stream from the opening of Phase 2 of Greenbelt 5 in October. About 9,500 square meters of Glorietta 5 will also be operational later in the year. Construction of the 70,000-square meter Q Shopping in Angeles, Pampanga is ongoing, with a target opening of May 2009. Meanwhile, planning is underway for a retail-BPO development on a nine-hectare property in Davao City. Corporate Business Revenues from Corporate Business amounted to Php 993 million in 2007, lower than last year by 25% as 2006 included the revenues from the sale of the PeopleSupport building to the Goldman-Capmark-ALI consortium. Excluding the revenues from this sale, revenues in 2007 would have grown 14% due to the sale of an additional 9 hectares at Laguna Technopark's expansion phase (at a premium to competition), higher office occupancy rates, rent increases and higher fee income from managed buildings. Accordingly, NOI settled at Php 487 million, a decline of 8% compared to Php 528 million in 2006. However, NOI margin improved by nine percentage points to 49% following price increases of lot sales, higher rents and lower utilities costs. Significant progress was made towards the objective of increasing the Company's BPO portfolio to approximately 500,000 GLA by 2010, with six projects commencing construction in 2007. As of end-December, the first two buildings of the UP North Science and Technology Park were in turnover condition for fit-out purposes with completion slated for the first quarter of 2008. The remaining four buildings are for completion by the third quarter. The first three buildings have already been fully leased out. For the Dela Rosa E-Services building, construction accomplishment was at 50% by year-end, with a target completion of fourth quarter of 2008. More than half of the GLA had been pre-leased. Construction of the Nuvali Technopod Building 1 in Nuvali commenced in September, with completion slated within the third quarter of 2008. Other BPO buildings targeted for completion in 2008 are the San Lazaro Building 1 (October 2008) and Glorietta 5 (December 2008). The Company also commenced construction of a new 30,300-square meter BPO building within Bonifacio Global City in December 2007. Strategic Landbank Management Revenues of Strategic Landbank Management stood at Php 373 million in 2007, 47% lower than the Php 707 million in 2006. This was due to the decline in sales of override units in Sta. Catalina and Avida Towers Sucat. The drop was partly offset by overrides from booked sales of 79 lots in Nuvali. NOI declined by 87% and ended at Php 43 million from Php 325 million last year. NOI margin declined to 12% from 46% previously as the override units at the higher-margin The Columns at Ayala Avenue were fully sold and completed in 2006. Equity in net earnings from ALl's 20% effective stake in Fort Bonifacio Development Corporation (FBDC) amounted to Php 439 million, from Php 109 million in 2006. This was due to the sale of 18 lots at Bonifacio Global City (BGC) in 2007 against 6 lots the previous year. Selling prices in 2007 ranged from Php 52,250 to Php 210,975 per square meter compared to only Php 47,025 to Php 143,560 last year. The Company continues to make significant progress in driving the growth in land values of its three strategic landholdings. The components of the Ayala Center redevelopment plans are in place and on schedule. The lot for the hotel complex project was cleared and turned over to Kingdom Hotel in December. The project will begin construction in 2008 and is estimated to be completed within three years. The retail and parking building between Shangri-la and Landmark, called The Link, was completed with retail spaces opened in October. Meanwhile, construction of Glorietta 5, consis ting of three levels of retail, five levels of BPO and two levels of basement parking, commenced in April 2007 and will be completed by December 2008. Development activities in Bonifacio Global City were in high gear and all of the key components of a Central Business District will be in place in the next few years. Planning is ongoing for a traditional headquarter office building that will house the Philippine Stock Exchange with a target completion date of 2012. FBDC also broke ground in November 2007 for a 29-storey BGC E-Services Building for completion in 2010. A major agreement was signed with the Shangri-La Hotels Group for their planned 6-star de luxe hotel and residential project. This brings a total of four hotel projects for BGC, inclusive of the 5-star Grand Hyatt hotel and other two business hotels.
__________________________________________________________________________ 27
The development plans for the various components of Phase 1 of Nuvali have been completed and construction is in full swing to gear up for the grand launch in June 2008. The BPO and residential lot parcels, specifically for Abrio, Treveia and Avida Settings, have been turned over to the Residential and Corporate Business Groups for development. Construction of two lanes of the North-South Road, extending from the Sta Rosa-Tagaytay road all the way to Montecito, has been completed. Visayas-Mindanao The revenue contribution of Visayas-Mindanao amounted to Php 176 million, a 5% improvement from Php 168 million last year. A total of 21 units were booked in Ayala Northpoint (Phase 2), with a completion rate of 98%. Additional eight lots were sold in Phase 3, with a completion rate of 18%. Plantazionne registered the sale of six lots (Phases 1 and 2) in 2007, while the newly-launched Phase 3 registered 86 lot sales at a 49% completion. In addition, Alegria sold 14 lots at 25% completion. Affiliate CHI, 47% -owned by ALl, posted a 27% growth in revenues to Php 1.1 billion, with net income up by 22% to Php 252 million in 2007. Meanwhile, 8 lot sales in Cebu Property Ventures & Development Corporation's (CPVDC) Asiatown IT Park led to a revenue growth of 49% to Php 336 million and net income growth of 108% to Php 173 million. As a result, equity in net earnings from CHI and CPVDC amounted to Php 138 million, 41% more than the Php 98 million registered last year. Serving as the unit that brings the Company's businesses to the Southern part of the country, Visayas -Mindanao unit will continue to secure its future growth in 2008. The construction of the Lagoon Development at the Ayala Center Cebu is underway and slated for completion by year-end. The eBloc, a project of Cebu Property Ventures Development Corporation (CPVDC) and the Company, began construction in the third quarter and will be the biggest facilities provider, consisting of 20,000 sqms. of gross leaseable space upon completion in November 2008. Support Business The Hotels, Construction and Property Management businesses generated revenues, net of inter-company eliminations, of Php 4.2 billion or a 21% growth y-o-y. Of this amount, the Hotels generated Php 1.4 billion, showing an improvement of 24% from previous year. The increase was largely due to the higher occupancy rate of Hotel InterContinental Manila at 82% last year compared to only 61% in 2006. The refurbishment work done in 2006 also led to a higher revenue per average room (REVPAR) of Php 3,987 vs. Php 2,547 the previous year. On the other hand, Cebu City Marriott Hotel's occupancy rate declined to 75% from 82% but was still higher than the Cebu average of 61%. REVPAR was also above industry at Php 2,402 versus Php 2,532 in 2006. Combined, the Hotels contributed Php 444 million to ALl's NOI. Makati Development Corporation (MDC), ALl's wholly-owned construction arm, reported revenues of Php 1.8 billion (net of inter-company eliminations), representing a 24% growth over the previous year's revenues. As of end-2007, MDC had an outstanding orderbook worth Php 18.8 billion from 38 projects. About 41% of the outstanding contracts were for third parties. The construction business contributed Php 395 million to ALl's NOI. Ayala Property Management Corporation (APMC), a 100%-owned subsidiary, reported revenues of Php 698 million (net of inter-company eliminations) for 2007, 16% more than the previous year's level. The additional revenues came from the operation of new carparks in Bonifacio Global City, the full operation of Carparks in Paseo de Magallanes and Madrigal Business Park, and the increase in occupancy of commercial spaces in CBD carparks. APMC's NOI amounted to Php 263 million, a 15% growth y-o-y. Equity in Net Earnings of Investees, Interest, Fees, Investment and Other Income In 2007, Interest, Fees, Investment and Other Income rose by 25% to Php 2.1 billion from Php 1.7 billion the previous year. This was mainly due to the gain on sale of preferred shares in KAMI to Kingdom Manila BV. Additionally, Php 599 million in net income after tax was recognized from the sale of MPVI shares, our investment vehicle for the Oakwood Serviced Apartments in Ayala Center.

__________________________________________________________________________ 28
Equity in Net Earnings from Investees more than doubled to Php 787 million from Php 306 million, largely due to the substantially higher contribution from ALl's corporate investment vehicles in BGC, as well as higher earnings of CHI and ACC. The contribution of FBDC reached Php 439 million from Php 109 million last year. Sales accelerated at Bonifacio Global City with a total of 18 lot sales in 2007 from only 6 lots in 2006. Selling prices were also higher at Php 52,250 to Php 210,975 in 2007 from Php 47,025 to Php 143,560 last year. Meanwhile, Equity Earnings from CHI/CPVDC were 41% higher at Php 138 million from Php 98 million. The growth was due to robust sale of commercial lots at CPVDC's Asiatown IT Park as well as increased retail revenues at the Ayala Center Cebu as the public warmly received the opening of its new Expansion Building during the first half of the year. Alabang Commercial Center (ACC), through Alabang Town Center, contributed Php 110 million, 33% more than the previous year because of a higher occupancy rate, while TriNoma, which opened in May, contributed Php 13 million on its first year of operation. Expenses Total Expenses were flat for 2007 at Php 21.2 billion, compared with Php 21.5 billion in 2006. Direct Costs and Operating Expenses for the real estate and hotels business dropped by 6% to Php 15.1 billion as various cost management initiatives started in previous years began to bear fruit. Meanwhile, General and Administrative Expenses increased by 4% to Php 2.7 billion following a continuing organizational build-up to address the aggressive expansion plans for the future. Interest and other charges of Php 1.8 billion grew by 64% despite a drop in average debt levels and borrowing costs as a result mainly of the additional costs arising from the Glorietta 2 explosion and expenses related to sale of KAMI shares. Provision for income tax of Php 1.6 billion was flat as the Company's effective tax rate in 2007 was significantly lower following higher income subjected to capital gains tax. Project and Capital Expenditures ALl spent Php 15.2 billion for project and capital expenditures in 2007, 11% more than the Php 13.7 billion spent in the previous year. Residential Development projects accounted for almost half of the capex at Php 7.3 billion. This was followed by Shopping Centers which used 25% or Php 3.9 billion, while around 12% or Php 1.8 billion was used for Corporate Business projects. For 2008, ALl has earmarked an unprecedented Php 24.3 billion for capital and project expenditures, underscoring the continued high levels of activity across all business lines. Bulk of the budget will go to Residential Development and Corporate Business with a 42% and 30% share, respectively. Shopping Centers will get 14% while Strategic Landbank is expected to have a 10% allocation. Financial Condition The company's balance sheet continues to be healthy with a Current Ratio of 1.65: 1. As of end-2007, Cash and Equivalents stood at Php 13.6 billion, 43% higher than the end-2006 level of Php 9.5 billion with the collection of full payments from completed Serendra units and deposits from Preferred Shares subscriptions. Total Borrowings were at Php 10.1 billion, from Php 12.8 billion as of December last year, translating to a Debt-to-Equity Ratio of 0.22: 1.

__________________________________________________________________________ 29
Key Financial Performance Indicators The table below sets forth the comparative key performance indicators of the Company and its majority-owned subsidiaries: End-2007 End-2006 Current ratio 1 1.65:1 1.64:1 Debt-to-equity ratio 2 0.22:1 0.32:1 Net debt/(cash)-to-equity ratio 3 (0.08):1 0.08:1 FY 2007 FY 2006 Return on assets 4 5.4% 5.2% Return on equity 5 10.2% 9.8% 1 Current assets / current liabilities 2 Total interest-bearing debt (inclusive of bonds and CPs) / stockholders' equity 3 Interest-bearing debt less cash, cash equivalents & investment in government securities / stockholders' equity 4 Net income / total assets (average) 5 Net income / stockholders' equity (average) There are no events that will trigger direct or contingent financial obligation that is material to the company, including any default or acceleration of an obligation. There are no material off-balance sheet transactions, arrangements, obligations (including contingent obligations), and other relationships of the company with unconsolidated entities or other persons created in 2007. For 2008, ALI has earmarked a total of P24.3 billion for project and capital expenditures, the bulk of which will be used to fund ongoing and planned projects of Residential Development and Corporate Business. Throughout the year, ALI examines the appropriate timing and allocated amounts for these projects, and adjusts the budget accordingly to reflect changes in plans. These projects will be funded through cash generated from operations and additional borrowings. Material changes (+/ - 5% or more) in the financial statements Income Statement items – 2007 versus 2006 24% increase in hotel operations revenues Mainly due to higher occupancy rate and revenue per available room (REVPAR) at Hotel InterContinental Manila. 157% increase in equity in net earnings of investees Largely due to higher income from ALI’s corporate vehicles for its investment in Bonifacio Global City, as well as improved performance of Cebu Holdings Inc. and Alabang Commercial Corporation. 10% decline in interest income Primarily due to lower average interest rate. 47% increase in other income Primarily due to the gain on sale of preferred shares in KHI-ALI Manila, Inc. (KAMI) to Kingdom Manila B.V. in connection with the development of a luxury hotel complex within Ayala Center. 8% decrease in real estate costs and expenses Mainly due to lower real estate revenues and improvement in margins of residential development business. 27% improvement in hotel operations costs and expenses Largely due to the higher occupancy rate of Hotel InterContinental Manila.

__________________________________________________________________________ 30
10% increase in interest expense and other financing charges Mainly due to the higher average bank loans. 222% increase in other charges Principally due to the related costs on the sale of preferred shares in KAMI and other expenses related to the Glorietta 2 explosion. 286% increase in income associated with non-current assets held for sale Primarily due to the gain on sale of shares in Makati Property Ventures, Inc. (Oakwood) in 1Q07. 162% increase in net income attributable to minority interests Largely due to higher income of Ayala Hotels, Inc. following the sale of Oakwood. Balance Sheet items – 2007 versus 2006 13% increase in cash and cash equivalents Primarily due to deposits received from Preferred Shares subscriptions and sale of Oakwood. 65% increase in other current assets Mainly due to higher prepaid expenses such as commissions and taxes, and increase in Makati Development Corporation’s deferred charges representing costs on future projects. 30% decline in short-term investments Largely due to lower investment of ALI (parent company) in government securities. 84% decline in fair value through profit and loss financial assets Primarily due to maturity and sale of government securities. 9% increase in accounts and notes receivable Mainly due to higher receivables from sales at new and existing projects. 13% decrease in real estate inventories Mainly due to costs of sold units at residential building and subdivision projects. 100% decline in non-current assets held for sale Due to sale of Oakwood. 63% increase in non-current accounts and notes receivable Largely due to additional sales at new and existing projects, and availment of longer payment terms. 8% increase in property and equipment Primarily due to disbursements for the Ayala Center redevelopment, construction of Glorietta 5 BPO building and Greenbelt 5, as well as additional communication and transportation equipment. 14% decline in deferred tax assets Primarily due to an increase in the realization of Serendra’s financial gross profit. 7% increase in other non-current assets Mainly due to higher Meralco deposits. 30% increase in accounts and other payables Mainly due to higher trade payables from real estate sales and increase in liabilities to buyers for the cost of uncompleted projects. 13% increase in income tax payable Primarily due to a higher taxable income.

__________________________________________________________________________ 31
33% decrease in current portion of long-term debt Largely due to payment of bonds and loan settlement made by Avida. 41% increase in other current liabilities Mainly due to deposits from the high-end residential project, Abrio, which was launched in October 2007. 100% decline in liabilities directly associated with non-current assets held for sale Due to sale of Oakwood. 20% decrease in long-term debt – net of current portion Primarily due to reclassification of Php 2 billion bonds to current portion. 6% increase in pension liabilities Mainly due to actuarial adjustment due to retirement plan amendment. 72% decline in deferred tax liabilities Primarily due to decrease in excess financial realized gross profit over taxable realized gross profit of Avida. 16% increase in deposits and non-current liabilities Mainly due to increase in buyers’ deposits for new residential projects and tenants’ deposits for shopping center spaces. 26% increase in deferred credits Largely due to higher deferred interest income. 25% increase in paid-up capital Largely due to the 20% stock dividend and deposit for Preferred Shares subscription. 11% decline in stock options outstanding Primarily due to ESOP availments. 119% decline in unrealized gain on available-for-sale financial assets Due to restatement of Avida’s Meralco shares in 2006. 6% increase in retained earnings Largely due to the higher income generated in 2007 vis -à-vis dividend payments. 8% decrease in minority interest – net of interest attributable to non-current assets held for sale Largely due to dividends paid by Ayala Hotels, Inc. 100% decline in minority interest attributable to non-current assets held for sale Due to sale of Oakwood. Risks Ayala Land is subject to significant competition in each of its principal businesses. Ayala Land competes with other developers and developments to attract purchasers of land and condominiums, retail and office tenants, and customers for the retail outlets, restaurants and hotels in its malls/retail centers.
However, Ayala Land believes that, at present, there is no single property company that has a significant presence in all sectors of the property market.
__________________________________________________________________________ 32
High-End, Middle-Income and Affordable Residential Developments
With respect to high-end land and condominium sales, Ayala Land competes for purchasers primarily on the basis of reputation, reliability, price and the quality and location of the community in which the relevant site is located. For the middle-income and affordable housing markets, Ayala Land competes for buyers based on quality of projects, affordability of units, and availability of in-house financing. Ayala Land is also actively tapping the growing OFW market.
Office Space, Retail and Land Rental
For its office rental properties, Ayala Land competes for tenants primarily based upon the quality and location of the relevant building, the reputation of the building's owner, the quality of support services provided by the property manager, and rental and other charges. The Company is addressing the growing demand from BPOs and call centers by providing fully integrated, well maintained developments (high rise or campus facility) in key locations in the country.
With respect to its retail properties, Ayala Land competes for tenants primarily based upon the ability of the relevant retail center to attract customers - which generally depends on the quality and location of, and mix of tenants in, the relevant retail center and the reputation of the owner of the retail center- and rental and other charges. The market for shopping centers has become especially competitive and the number of competing properties is growing. Some competing shopping centers are located within relatively close proximity of each of Ayala Land's commercial centers. Industrial Property Business
The industrial property business is affected by an oversupply which limits industrial expansion. The entry of China into the World Trade Organization in 2003 poses strong competition for foreign direct investment. Overall, the industrial property segment is not likely to show significant demand improvement in the near term.
Hotel Operations
The local hotel sector experienced growth in occupancy, rental rates and revenues per available room. The Company's hotels, known for their premium value and service, performed strongly in each of their respective markets. Any slowdown in tourism could potentially limit growth of the Company's hotels.
Construction
Ayala Land's construction business is benefiting from the improved performance of the construction industry, particularly from an uptick in development activities mostly from the residential and retail sectors. Any slowdown in the construction business could potentially cap growth of the Company's construction arm.
Other risks that the company may be exposed to are the following:
- Changes in Philippine and international interest rates - Changes in the value of the Peso - Changes in construction material and labor costs, power rates and other costs - Changes in laws and regulations that apply to the Philippine real estate industry - Changes in the country's political and economic conditions
To mitigate the above mentioned risks, Ayala Land shall continue to adopt appropriate risk management tools as well as conservative financial and operational controls and policies to manage the various business risks it faces.

__________________________________________________________________________ 33
2006 vs. 2005 Results of Operations Ayala Land’s consolidated revenues in 2006 hit a new high of Php 25.5 billion, 20% higher than the previous year’s Php 21.4 billion, notwithstanding the absence of extraordinary gains generated from the sale of the company’s MRT investment in 2005. Operating revenues, excluding interest and other investment income, totaled Php 23.6 billion and grew at an even higher rate of 37%. Heightened activity across all business lines drove operating revenues, with residential development and leasing businesses contributing the bulk. With controlled operating costs, net operating income (NOI) margins on a per business line basis held steady. Overall NOI margin, however, was slightly lower due to the shift in revenue mix given the faster growth in residential development compared to the higher-margin leasing business. Meanwhile, total overhead costs declined, as the moderate increase in general and administrative expenses of 12%, was more than offset by the significant decrease in interest and other charges, given last year’s provisions for decline in value of assets intended to be sold or written off. As a result, income before tax grew by 29% to Php 5.7 bill ion in 2006, even with lower investment income from sale of shares. Income growth, however, was tempered by the 188% increase in tax provision to Php 1.6 billion, following the 3-percentage point increase in corporate income tax rate and higher operating income subjected to the 35% income tax rate versus the capital gain from the sale of shares in 2005 that was taxed at a lower rate. Ayala Land ended 2006 with a net income of Php 3.9 billion, 7% higher than the Php 3.6 billion registered in 2005. Netting out extraordinary items (i.e. after tax gain from the MRT transaction and provisions), net income for 2006 would have been 27% higher than the previous year’s Php 3.2 billion. “The year 2006 proved to be a successful year for Ayala Land as it benefited from positive economic developments which ushered in improved buyer confidence. The company also continued to capitalize on the significant growth in the OFW and BPO markets which buoyed demand for residential and commercial real estate products. Through deliberate expansion of product offerings, diversification into new growth areas, and venture into strategic investments, the company, backed by its strong financials, is in an even better position to tap the opportunities arising from favorable structural changes that drive growth in the property sector.” said Ayala Land President and Chief Executive Officer Jaime I. Ayala. Business Segments The Residential Development business accounted for the bulk of revenues at Php 14.0 billion or 55% of total revenues. This was followed by Shopping Centers at Php 4.0 billion or 15% of total and Corporate Business at Php 1.3 billion or 5% of total. Strategic Landbank Management contributed 3% or Php 707 billion, while Visayas-Mindano generated Php 168 million or 1%. Collectively, the Support Businesses, comprised of Hotels, Construction and Property Management, reported revenues of Php 3.4 billion or 13% of total revenues. Equity in Net Earnings of Investees, Interest, Fees, Investment and Other Income accounted for the balance of 8% or Php 2.0 billion. Residential Development There was a 47% year-on-year (y-o-y) growth in Residential Development revenues to Php 14.0 billion as high double digit growth rates were reported by Ayala Land Premier and Community Innovations, Inc. Revenues of Ayala Land Premier (ALP) reached Php 8.5 billion, 65% more than the previous year. Revenues booked from the sale of 430 condominium units reached Php 5.3 billion, more than double 2005’s Php 2.6 billion, while the sale of 456 lots generated Php 2.7 billion in revenues. Lots booked included 216 lots in Ayala Westgrove Heights and 135 lots in Ayala Greenfield Estates. ALI’s first leisure community project, Anvaya Cove, contributed Php 593 million in revenues. This is a 242% increase from last year’s revenues as an additional 402 beach club shares, 57 lots and 7 villas were booked.
__________________________________________________________________________ 34
The bulk of ALP’s condominium sales was accounted for by The Residences at Greenbelt at 224 units. At the end of the year, 72% of the 1,003-unit, three tower project, had been taken-up. One Serendra in Bonifacio Global City booked sales of 152 units while One Roxas Triangle sold 22 units. Community Innovations reported revenues of Php 3.7 billion, 71% higher than 2005’s Php 2.2 billion. A total of 785 units were booked, 37% higher y-o-y, mainly coming from high-rise projects. The Columns at Ayala Avenue and its Legazpi Village sequel accounted for 74 and 302 units, respectively, while Two Serendra contributed 163 units. Meanwhile, Avida Land’s revenues amounted to Php 1.8 billion. This translates to an 18% decline from last year’s revenues mainly due to the standardization of the revenue recognition policy in 2Q06. This also affected the number of units booked which stood at 1,033, a 33% decline from 2005. Without the change, revenues would have grown 11% y-o-y to Php 2.4 billion while booked units would have reached 1,632 representing a 6% growth. Affordable condominiums accounted for the bulk of booked units at 792. NOI of Residential Development settled at Php 3.1 billion in 2006, 30% more than last year and accounted for 41% of total NOI. There was a sight decline in NOI margins to 22% from 25%, largely due to losses booked from the sale of One Roxas Triangle units in 2Q06. Over 7,000 units from new projects and additional phases of existing projects will be added to inventory in 2007. This is over 50% more than the 4,600 units of additional inventory brought into the market in 2006. Some of the new residential projects will be in new locations north of Metro Manila, as well as in the 1,700 hectare Canlubang landbank. Shopping Centers Shopping Centers reported a 12% rise in revenues to Php 4.0 billion in 2006. This is attributed to the higher occupancy rate across all ma lls which averaged at 92% from 91% in 2005, as well as higher average rent and the increase in gross leasable area (GLA) from 754,000 square meters to 760,000 square meters. The increase in GLA is mainly from the 6,400-square meter Shops at Serendra which soft opened in July. Its occupancy rate averaged at 31% in 2006 and at the end of the year, spaces were nearly fully leased/committed. There was a slight improvement in NOI margin to 62% from 60%, resulting in a 16% growth in NOI to Php 2.4 billion. This accounted for 33% of total NOI. In 2007, an additional 195,000 square meters of GLA will come on stream from the opening of TriNoma in Quezon City in May. About 13,000 square meters of Greenbelt 5 will also be operational later in the year. Construction will start soon on the 70,000-square meter mall in Pampanga. Corporate Business Revenues from Corporate Business reached Php1.3 billion in 2006, a 111% growth y-o-y. The high growth was due to the sale of 1,407 square meters at Ayala Life-FGU, full year contribution of the three BPO buildings (started 3Q05) and the 8 percentage point rise in 6750’s occupancy rate to 98%. On the average, ALI’s traditional office buildings enjoyed an occupancy rate of 98%, an improvement from 2005’s 93%. Consequently, NOI margin improved to 40% from 38% with NOI settling at Php 528 million, compared to Php 240 million in 2005. This represents 7% of total NOI. In December, the company announced the sale of the PeopleSupport BPO building to a partnership between ALI, MLT Investments (Goldman Sachs) and Filipinas Investments (Capmark). ALI’s effective economic interest in the partnership is 36%. This partnership provides a new platform to raise capital that will help accelerate growth of ALI’s BPO portfolio. Very recently, the partnership broke ground for a 47,000-square meter office building along Dela Rosa Street in Makati.
__________________________________________________________________________ 35
Further tapping the growing BPO market, ALI will start development on two BPO campus projects within 2007. Additional 28,000 sqms of GLA will be added by the first two buildings in the 38-hectare UP Science and Technology Park project as they get completed in 4Q2008. In addition, the company will launch its 20-hectare BPO campus project in Canlubang within the second half of the year. Strategic Landbank Management Strategic Landbank Management’s revenues are generated mainly from override units from The Columns at Ayala Avenue and Legazpi Village, as well as Avida Towers Sucat, Avida Residences Catalina and Sampaguita Village. Additional bookings only reached 96 units from 176 in 2005, but additional revenues from construction accomplishment of previous bookings boosted revenues. Revenues amounted to Php 707 million in 2006, 46% higher than the previous year. Bonifacio High Street, a 40-meter wide, 500-meter long retail/office promenade in the City Center of Bonifacio Global City soft opened in November 2006, with the grand launch scheduled for March 2007. At the end of 2006, 86% of the 14,000-square meter retail component was committed while 100% of the 6,400 square meters of office space have been reserved. NOI of Strategic Landbank Management stood at Php 325 million in 2006, 94% more than the year-ago figure as NOI margin accelerated to 46% from 35% during the same period. Contribution amounted to 4% of total NOI. During the latter part of 2007, there will be an integrated launch of the Canlubang project which will include residential, office and retail components. Moreover, the masterplan of Ayala Center is currently being revie wed and plans for redevelopment should be ready within the year. Visayas-Mindanao The revenue contribution of Visayas-Mindanao amounted to Php 168 million or 1% of total revenues. With the 8% decline in revenues and the drop in NOI margin to 7% from 11% y-o-y, NOI was lower at Php 12 million from Php 21 million in 2005. A total of 136 units were booked in Ayala Northpoint and Plantazionne Verdana Homes in Talisay, Negros Occidental, lower than the 148 units booked in the previous year. Revenue adjustments at Ayala Heights Cebu pulled down Visayas-Mindanao’s revenues and NOI margin. In 2007, ALI will launch residential projects in new areas in Western Visayas and Northern Mindanao, which should enhance revenues going forward. Support Business The Hotels, Construction and Property Management businesses generated revenues, net of inter-company eliminations, of Php 3.4 billion, a 20% growth y-o-y. Of this amount, the Hotels generated Php 1.1 billion, improving by 3% from previous year. The minimal increase in Hotel revenues is attributed to the partial closure of Hotel InterContinental Manila as refurbishment work was done from April to November. As a result, the hotel’s average occupancy rate in 2006 dropped to 61% from 76% in the previous year. However, the hotel has been close to being fully occupied since its re-launch in November. On the other hand, Cebu City Marriott Hotel continued to enjoy higher-than-average occupancy rates at 81% (versus the Cebu average of 61%). Revenue per available room (REVPAR) is also above industry average at Php 2,532. Oakwood Premier Ayala Center also registered above-average occupancy rates at 91% (versus the Makati CBD average of 77%) and REVPAR at Php 5,100. The Hotels, excluding Oakwood whose operating results are shown as a separate item in the income statement, contributed Php 370 million to ALI’s NOI. Makati Development Corporation (MDC), ALI’s wholly -owned construction arm, reported revenues of Php 1.4 billion (net of inter-company eliminations), representing a 37% growth over the previous year’s revenues. As of end-2006, MDC had an outstanding orderbook worth Php 8.9 billion from 25 projects. About 38% of the outstanding contracts were for third parties. The construction business contributed Php 349 million to ALI’s NOI.
__________________________________________________________________________ 36
Ayala Property Management Corporation (APMC), a 100%-owned subsidiary, reported revenues of Php 604 million (net of inter-company eliminations) for 2006, 24% more than the previous year’s level. The additional revenues came from new management contracts obtained during the year including three buildings and 36 branches of Citibank, and seven carparks at Bonifacio Global City. APMC’s NOI amounted to Php 229 million, a 37% growth y-o-y. Equity in Net Earnings of Investees, Interest, Fees, Investment and Other Income In 2006, Interest, Fees, Investment and Other Income declined 58% from the 2005 level of Php 4.0 billion to Php 1.7 billion, as the former included the Php 2.6 billion gain (before tax) from the MRT -3 transaction. Equity in net earnings from Investees amounted to Php 306 million, 35% more than the amount earned in 2005, primarily due to higher equity earnings from Cebu Holdings, Inc. and Alabang Commercial Corporation, as well as recognition of goodwill arising from addit ional investment in Boniacio Land Corporation. Cebu Holdings reported a 51% y-o-y increase in revenues to Php 1.0 billion in 2006 with the full year contribution of the highly successful seaside residential project, Amara, coming in, as well as the sale of two lots at Cebu Business Park and the remaining two units at Park Tower. Net Income grew 76% y-o-y to Php 207 million. Expenses Total Expenses for 2006 reached Php 19.9 billion, 17% more than 2005’s Php 17 billion. Direct Costs and Operating Expenses for the real estate and hotels business reached Php 16.2 billion, representing a 43% increase from the previous year’s Php 11.3 billion. The faster growth in direct costs versus the 37% growth in corresponding revenues was due to the larger share of the Residential Development business to total revenues at 55% from 44% last year. Moreover, losses from the sale of One Roxas Triangle units were also booked in 2006. General and Administrative Expenses amounted to Php 2.6 billion in 2006, 12% higher y-o-y mainly due to higher payroll and employee benefits given additional hiring to support expansion. Interest and other charges totaled Php 1.1 billion, 67% lower than previous year’s Php 3.3 billion, as the latter included significant provisions for the decline in value of assets intended to be sold or written off. Additionally, interest expense declined in 2006 as the company’s average cost of debt declined to 9.0% from 9.7% in 2005. Project and Capital Expenditures For 2006, ALI spent Php 13.7 billion for project and capital expenditures, double the Php 6.8 billion spent in the previous year. About half or Php 6.8 billion was used for Residential Development projects while Shopping Centers accounted for 30% or Php 4.1 billion. Around 10% or Php 1.3 billion was used for ALI’s international investment which is being undertaken jointly with Ayala Corporation. This investment will allow ALI to leverage on its expertise and capture growth opportunities in Asia. Financial Condition Net cash provided by operating activities amounted to Php 6.1 billion in 2006, with Php 1.9 billion generated from the sale of installment contracts receivables. As a result of better operating results, ALI was able to pay cash dividends of Php 1.8 billion during the year, representing Php 0.06 per share in regular dividends and Php 0.11 per share in special dividends. The company’s balance sheet remained strong with Current Ratio at 1.64:1. Cash and Equivalents (including short term investments) was at Php 9.5 billion, 41% higher than the end-2005 level of Php 6.8 billion, with the increase attributed to additional cash from operations and the issuance of Php 3.0 billion Fixed Rate Corporate Notes (FXCN) in September, at a blended cost of 7.4%. As a result of the FXCN, total borrowings increased by 22% to Php 13.1 billion from Php 10.7 billion in December 2005, and Debt-to-Equity Ratio slightly increased to 0.32:1 from the previous year’s 0.28:1. Nonetheless, Net Debt-to-Equity improved to 0.09:1 from 0.10:1 with Cash and Equivalents increasing faster than total borrowings.

__________________________________________________________________________ 37
Material changes (+/ - 5% or more) in the financial statements Income Statement items – 2006 versus 2005 40% increase in real estate revenues Primarily due to higher revenues from residential developments, shopping centers, office rentals and sales, as well as support businesses. 35% increase in equity in net earnings of investees Mainly due to higher earnings of Cebu Holdings, Inc. and Alabang Commercial Corporation, as well as recognition of goodwill arising from the additional investment in Bonifacio Land Corporation. 58% decline in interest, fees, investment and other income Largely due to the gain on sale of Astoria Investment Ventures, Inc. (AIVI) preferred shares in 2005. 45% increase in real estate costs and expenses Mainly due to higher real estate revenues. 12% increase in general and administrative expenses Primarily due to higher payroll costs given additional hiring to support expansion. 67% decrease in interest and other charges Principally due to the provisions for decline in value of assets intended to be sold and write-off of deferred charges in 2005. 188% increase in provision for income tax Mainly due to capital gains in AIVI transaction subjected to final tax at lower rate in 2005 and higher corporate income tax rate in 2006. 19% increase in income associated with non-current assets held for sale Primarily due to higher earnings of Makati Property Ventures, Inc. (MPVI), owner of Oakwood Premier Ayala Center. Ayala Hotels executed a purchase agreement to sell MPVI to Ascott and the sale will be consummated on March 2007. Balance Sheet items – End-2006 versus End-2005 23% increase in cash and cash equivalent Mainly due to issuance of FXCNs and increased collections from customers. 228% increase in short-term investments Mainly due to higher investment of ALI (parent company) in government securities. 65% increase in accounts and notes receivable Primarily due to receivables from Mercator Securities for the sale of Bridgebury Realty Corporation shares, as well as additional sales at new and existing projects, and higher corporate withholding tax in 2006. 15% increase in real estate inventories Primarily due to construction accomplishment at residential building projects and continued development of residential subdivision projects. 5% increase in other current assets Mainly due to advances on land and higher input VAT. 100% increase in noncurrent assets held for sale Represents total assets of MPVI classified as noncurrent assets held for sale. 62% decline in non-current accounts and notes receivable Largely due to Avida’s bulk sale of receivables and offsetting of estimated liability against receivable.

__________________________________________________________________________ 38
29% increase in investments in associates and jointly controlled entities Mainly due to ALI’s investment in an Asian private equity real estate fund and fund management company. 6% decrease in available-for-sale financial assets Primarily due to decline in value of APMC’s PLDT shares and various clubshares owned by the company. 27% decline in property and equipment Mainly due to reclass to nocurrent assets held for sale. 9% decline in other noncurrent assets Largely due to liquidation of advances made to a landowner. 8% increase in accounts and other payables Primarily due to higher payables to contractors and suppliers for various projects and higher VAT and expanded withholding tax payable. 9% increase in short-term debt Largely due to short-term loan availments by Station Square East Commercial Corporation and Ayala Greenfield Development Corporation. 31% increase in income tax payable Mainly due to increase in corporate income tax rate to 35%, and higher income that is subject to corporate income tax. 339% increase in current portion of long-term debt Primarily due to the reclassification of the P3.0B bonds maturing in April 2007. 143% increase in other current liabilities Largely due to higher buyer deposits for various residential projects. 100% increase in liabilities directly associated with noncurrent assets held for sale Mainly represents MPVI’s liabilities classified as liabilities directly associated with noncurrent assets held for sale. 9% decline in long-term debt (net of current portion) Largely due to payment of long-term loans and the reclassification of P3.0B bonds to current portion, partially offset by the P3.0B issuance of long-term FXCNs. 7% decline in pension liabilities Mainly due to higher 2005 base following set up in ALI (parent company) and subsidiaries of transitional liability representing benefit obligation and funding of retirement fund deficiency. 52% increase in deferred tax liabilities Largely due to shift in revenue recognition to percentage of completion resulting to higher tax liability on prior years’ installment sales previously booked based on collection. 9% increase in deposits and noncurrent liabilities Mainly due to higher retention payable. 64% increase in deferred credits Largely due to higher deferred interest income and marketing fees. 10% decline in stock options outstanding Primarily due to additional options exercised. 754% decrease in unrealized gain on available-for-sale financial assets Primarily due to decline in value of APMC’s PLDT shares and various clubshares owned by the company.

__________________________________________________________________________ 39
8% increase in retained earnings Mainly due to income generated in 2006. 21% decline in minority interest – net of interest attributable to noncurrent assets held for sale Largely due to reclassification of MPVI to noncurrent assets held for sale in 2006. 100% increase in minority interest attributable to noncurrent assets held for sale Mainly represents the partner’s stake at MPVI.

__________________________________________________________________________ 40
II. MARKET PRICE OF AND DIVIDENDS ON THE REGISTRANT’S COMMON EQUITY
A) Principal Market where the registrant’s Common equity is traded.
Philippine Stock Exchange Prices (in PhP/share)
High Low Close 2007 2006 2007 2006 2007 2006
First Quarter 13.75 9.38 13.54 8.96 13.75 9.38 Second Quarter 17.75 9.38 17.25 9.17 17.50 9.17 Third Quarter 16.75 12.29 16.00 11.88 16.25 11.88 Fourth Quarter 14.75 12.92 14.25 12.50 14.25 12.92
The market capitalization of ALI as of end-2007, based on the closing price of P14.25/share, was approximately P185.8 billion.
The price information as of the close of the latest practicable trading date, 20 February 2008, is P12.25.
B) Holders
There are approximately 11,539 holders of common equity security of the Company as of 31 December 2007 (based on number of accounts registered with the Stock Transfer Agent). The following are the top 20 holders of the common equity securities of the Company:
Stockholder Name No. of Common Shares Percentage (of Common Shares)
1. Ayala Corporation 6,939,009,512 53.24% 2. PCD Nominee Corp. (Non-Filipino) 5,056,164,832 38.79% 3. PCD Nominee Corp. (Filipino) 743,868,093 5.71% 4. The Insular Life Assurance Company, Ltd. 17,027,852 0.13% 5. ESOWN Administrator 2006 16,049,829 0.12% 6. ESOWN Administrator 2005 15,220,688 0.12% 7. Jose Luis Gerardo Yulo 12,882,458 0.10% 8. Elvira L. Yulo 6,024,000 0.05% 9. BPI T/A #14016724 5,928,408 0.05% 10. Estrellita B. Yulo 5,732,823 0.04% 11. Xavier P. Loinaz 5,621,590 0.04% 12. ESOWN Administrator 2007 5,034,400 0.04% 13. ALI ESOP/ESOWN Account 4,936,723 0.04% 14. Maria Alexandra Q. Caniza 4,531,026 0.03% 15. Pan Malayan Management and Investment Corp. 4,002,748 0.03% 16. Ma. Angela Y. La o’ 3,728,620 0.03% 17. The Insular Life Assurance Co., Ltd. 3,598,160 0.03% 18. Lucio W. Yan 3,483,871 0.03% 19. Telengtan Brothers & Sons, Inc. 3,480,000 0.03% 20. BPI T/A# 14016759 3,182,286 0.02%
C) Dividends
STOCK DIVIDEND (Per Share) PERCENT DECLARATION DATE RECORD DATE PAYMENT DATE
20% April 26, 2000 May 16, 2000 June 26, 2000 20% February 1, 2007 May 22, 2007 June 18, 2007
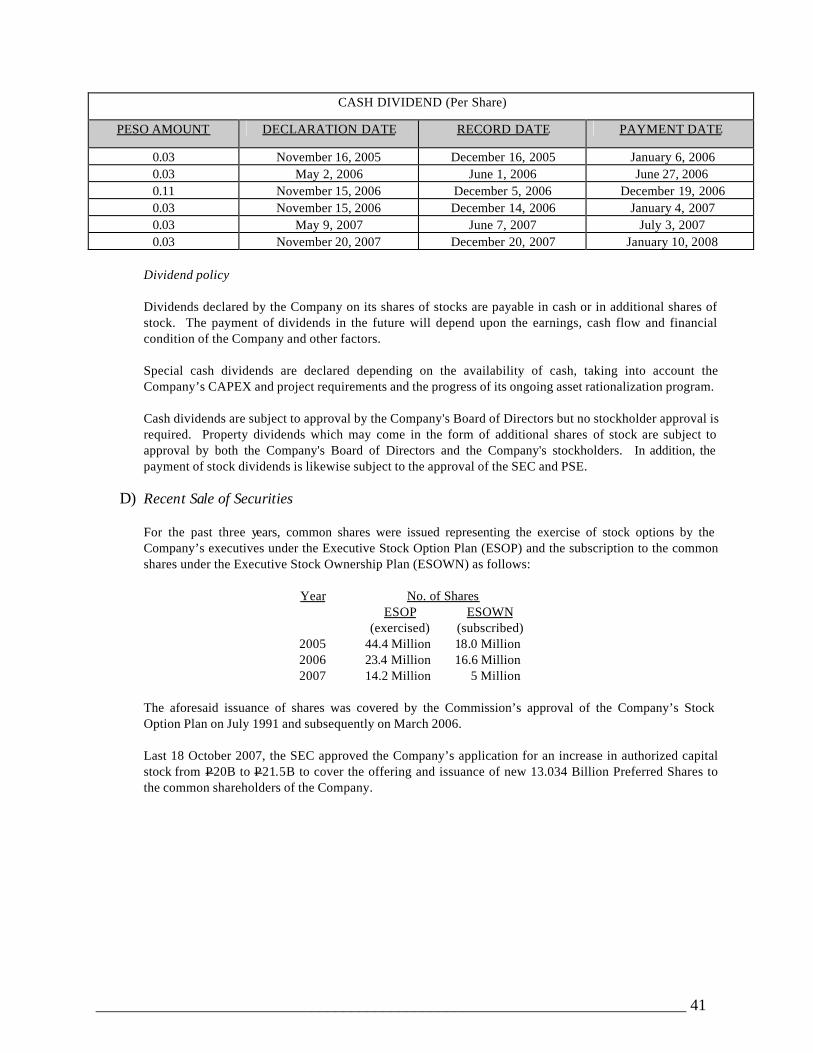
__________________________________________________________________________ 41
CASH DIVIDEND (Per Share)
PESO AMOUNT DECLARATION DATE RECORD DATE PAYMENT DATE
0.03 November 16, 2005 December 16, 2005 January 6, 2006 0.03 May 2, 2006 June 1, 2006 June 27, 2006 0.11 November 15, 2006 December 5, 2006 December 19, 2006 0.03 November 15, 2006 December 14, 2006 January 4, 2007 0.03 May 9, 2007 June 7, 2007 July 3, 2007 0.03 November 20, 2007 December 20, 2007 January 10, 2008
Dividend policy
Dividends declared by the Company on its shares of stocks are payable in cash or in additional shares of stock. The payment of dividends in the future will depend upon the earnings, cash flow and financial condition of the Company and other factors. Special cash dividends are declared depending on the availability of cash, taking into account the Company’s CAPEX and project requirements and the progress of its ongoing asset rationalization program. Cash dividends are subject to approval by the Company's Board of Directors but no stockholder approval is required. Property dividends which may come in the form of additional shares of stock are subject to approval by both the Company's Board of Directors and the Company's stockholders. In addition, the payment of stock dividends is likewise subject to the approval of the SEC and PSE.
D) Recent Sale of Securities
For the past three years, common shares were issued representing the exercise of stock options by the Company’s executives under the Executive Stock Option Plan (ESOP) and the subscription to the common shares under the Executive Stock Ownership Plan (ESOWN) as follows:
Year No. of Shares ESOP ESOWN (exercised) (subscribed)
2005 44.4 Million 18.0 Million 2006 23.4 Million 16.6 Million 2007 14.2 Million 5 Million
The aforesaid issuance of shares was covered by the Commission’s approval of the Company’s Stock Option Plan on July 1991 and subsequently on March 2006. Last 18 October 2007, the SEC approved the Company’s application for an increase in authorized capital stock from P20B to P21.5B to cover the offering and issuance of new 13.034 Billion Preferred Shares to the common shareholders of the Company.

__________________________________________________________________________ 42
E) Corporate Governance
a. The evaluation system which was established to measure or determine the level of compliance of the
Board of Directors and top level management with its Manual of Corporate Governance consists of a Customer Satisfaction Survey which is filled up by the various functional groups indicating the compliance rating of certain institutional units and their activities. The evaluation process also includes a Board Performance Assessment which is accomplished by the Board of Directors indicating the compliance ratings. The above are submitted to the Compliance Officer who issues the required certificate of compliance with the Company’s Corporate Governance Manual to the Securities and Exchange Co mmission.
b. To ensure good governance, the Board establishes the vision, strategic objectives, key policies, and
procedures for the management of the company, as well as the mechanism for monitoring and evaluating Management’s performance. The Board also ensures the presence and adequacy of internal control mechanisms for good governance.
c. There were no deviations from the Company’s Manual of Corporate Governance. The Company has
adopted in the Manual of Corporate Governance the leading practices and principles of good corporate governance, and full compliance therewith has been made since the adoption of the Manual.
d. The Company is taking further steps to enhance adherence to principles and practices of good
corporate governance.
Upon the written request of the stockholders, the Corporation undertakes to furnish said stockholder with a copy of SEC Form 17-A free of charge. Any written request for a copy of SEC Form 17-A shall be addressed to the following: Ayala Land, Inc. 30/F Tower One and Exchange Plaza Ayala Triangle Ayala Avenue, Makati City 1226 Attention: Mr. Jaime E. Ysmael Senior Vice President & Chief Finance Officer

__________________________________________________________________________ 43
ANNEX “C” NATURE AND SCOPE OF BUSINESS
Ayala Land is the largest and most diversified real estate company in the Philippines. It has organized its operations into several core businesses and support businesses. Core Businesses · Residential Business - sale of high-end residential lots and units (including leisure community developments),
middle-income residential lots and units, and affordable housing units and lots; lease of residential units; marketing of residential developments;
· Ayala Malls - development of commercial centers and lease to third parties of retail space and land therein;
operation of movie theaters, food courts, entertainment facilities and carparks in these commercial centers; management and operations of malls which are co-owned with partners;
· Corporate Business - development and lease or sale of office buildings; sale of industrial lots and lease of
factory buildings; · Strategic Landbank Management - acquisition, development and sale of large, mixed-use, masterplanned
communities; sale of override units or Ayala Land's share in properties made available to subsidiaries for development; lease of gas station sites and carparks outside Ayala Center;
· Geographic Businesses:
Visayas-Mindanao – development, sale and lease of the Company and subsidiaries' product offerings in key cities in the Visayas and Mindanao regions Ayala International – investment in an Asian real estate private equity fund and a fund management company
Support Businesses
· Construction – land development and construction of ALI and third-party projects · Hotels – development and management of hotels; lease of land to hotel tenants · Property management – facilities management of ALI and third-party projects · Waterworks operations – operation of water and sewage treatment facilities in some ALI projects
In addition to above business lines, Ayala Land also derives other income from its investment activities and sale of non-core assets.

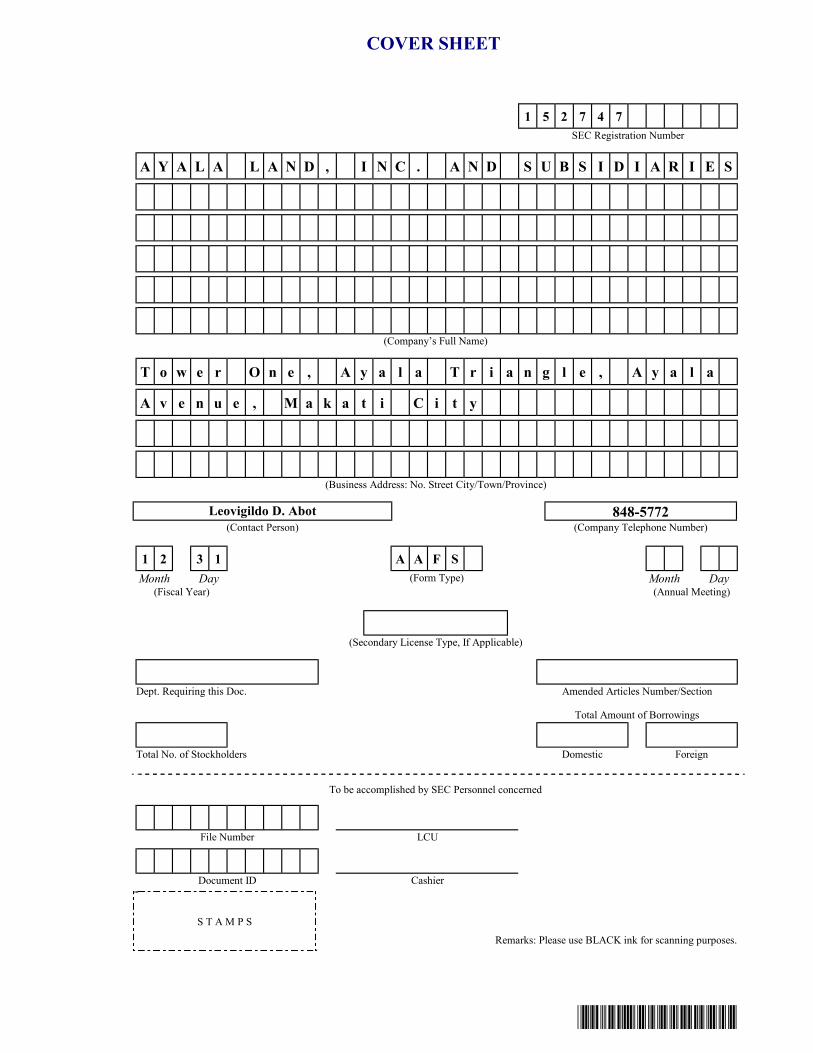
*SGVMC110511*
1 5 2 7 4 7 SEC Registration Number
A Y A L A L A N D , I N C . A N D S U B S I D I A R I E S
(Company’s Full Name)
T o w e r O n e , A y a l a T r i a n g l e , A y a l a
A v e n u e , M a k a t i C i t y
(Business Address: No. Street City/Town/Province)
Leovigildo D. Abot 848-5772 (Contact Person) (Company Telephone Number)
1 2 3 1 A A F S Month Day (Form Type) Month Day
(Fiscal Year) (Annual Meeting)
(Secondary License Type, If Applicable)
Dept. Requiring this Doc. Amended Articles Number/Section
Total Amount of Borrowings
Total No. of Stockholders Domestic Foreign
To be accomplished by SEC Personnel concerned
File Number LCU
Document ID Cashier
S T A M P S
Remarks: Please use BLACK ink for scanning purposes.
COVER SHEET

*SGVMC110511*
INDEPENDENT AUDITORS’ REPORT The Stockholders and the Board of Directors Ayala Land, Inc. Tower One, Ayala Triangle Ayala Avenue, Makati City We have audited the accompanying consolidated financial statements of Ayala Land, Inc. and Subsidiaries, which comprise the consolidated balance sheets as at December 31, 2007 and 2006, and the consolidated statements of income, consolidated statements of changes in equity and consolidated statements of cash flows for each of the three years in the period ended December 31, 2007, and a summary of significant accounting policies and other explanatory notes. Management’s Responsibility for the Consolidated Financial Statements Management is responsible for the preparation and fair presentation of these consolidated financial statements in accordance with Philippine Financial Reporting Standards. This responsibility includes: designing, implementing and maintaining internal control relevant to the preparation and fair presentation of financial statements that are free from material misstatement, whether due to fraud or error; selecting and applying appropriate accounting policies; and making accounting estimates that are reasonable in the circumstances. Auditors’ Responsibility Our responsibility is to express an opinion on these consolidated financial statements based on our audits. We conducted our audits in accordance with Philippine Standards on Auditing. Those standards require that we comply with ethical requirements and plan and perform the audit to obtain reasonable assurance whether the financial statements are free from material misstatement. An audit involves performing procedures to obtain audit evidence about the amounts and disclosures in the financial statements. The procedures selected depend on the auditor’s judgment, including the assessment of the risks of material misstatement of the financial statements, whether due to fraud or error. In making those risk assessments, the auditor considers internal control relevant to the entity’s preparation and fair presentation of the financial statements in order to design audit procedures that are appropriate in the circumstances, but not for the purpose of expressing an opinion on the effectiveness of the entity’s internal control. An audit also includes evaluating the appropriateness of accounting policies used and the reasonableness of accounting estimates made by management, as well as evaluating the overall presentation of the financial statements. We believe that the audit evidence we have obtained is sufficient and appropriate to provide a basis for our audit opinion.
SGV & CO SyCip Gorres Velayo & Co.6760 Ayala Avenue 1226 Makati City Philippines
Phone: (632) 891-0307 Fax: (632) 819-0872 www.sgv.com.ph
BOA/PRC Reg. No. 0001 SEC Accreditation No. 0012-FR-1
SGV & Co is a member practice of Ernst & Young Global
*SGVMC110511*
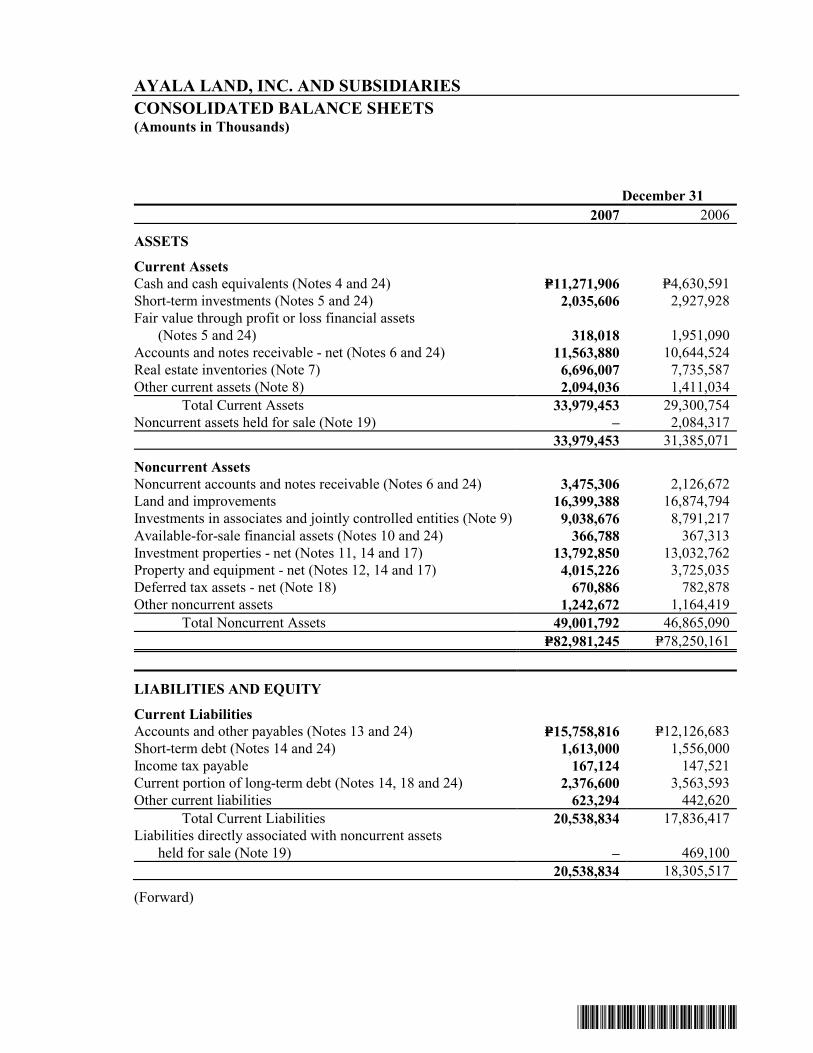
*SGVMC110511*
AYALA LAND, INC. AND SUBSIDIARIES CONSOLIDATED BALANCE SHEETS (Amounts in Thousands)
December 31 2007 2006
ASSETS
Current Assets Cash and cash equivalents (Notes 4 and 24) P=11,271,906 P=4,630,591 Short-term investments (Notes 5 and 24) 2,035,606 2,927,928 Fair value through profit or loss financial assets (Notes 5 and 24) 318,018 1,951,090 Accounts and notes receivable - net (Notes 6 and 24) 11,563,880 10,644,524 Real estate inventories (Note 7) 6,696,007 7,735,587 Other current assets (Note 8) 2,094,036 1,411,034 Total Current Assets 33,979,453 29,300,754 Noncurrent assets held for sale (Note 19) – 2,084,317 33,979,453 31,385,071
Noncurrent Assets Noncurrent accounts and notes receivable (Notes 6 and 24) 3,475,306 2,126,672 Land and improvements 16,399,388 16,874,794 Investments in associates and jointly controlled entities (Note 9) 9,038,676 8,791,217 Available-for-sale financial assets (Notes 10 and 24) 366,788 367,313 Investment properties - net (Notes 11, 14 and 17) 13,792,850 13,032,762 Property and equipment - net (Notes 12, 14 and 17) 4,015,226 3,725,035 Deferred tax assets - net (Note 18) 670,886 782,878 Other noncurrent assets 1,242,672 1,164,419 Total Noncurrent Assets 49,001,792 46,865,090
P=82,981,245 P=78,250,161
LIABILITIES AND EQUITY
Current Liabilities Accounts and other payables (Notes 13 and 24) P=15,758,816 P=12,126,683 Short-term debt (Notes 14 and 24) 1,613,000 1,556,000 Income tax payable 167,124 147,521 Current portion of long-term debt (Notes 14, 18 and 24) 2,376,600 3,563,593 Other current liabilities 623,294 442,620 Total Current Liabilities 20,538,834 17,836,417 Liabilities directly associated with noncurrent assets
held for sale (Note 19) – 469,100 20,538,834 18,305,517
(Forward)
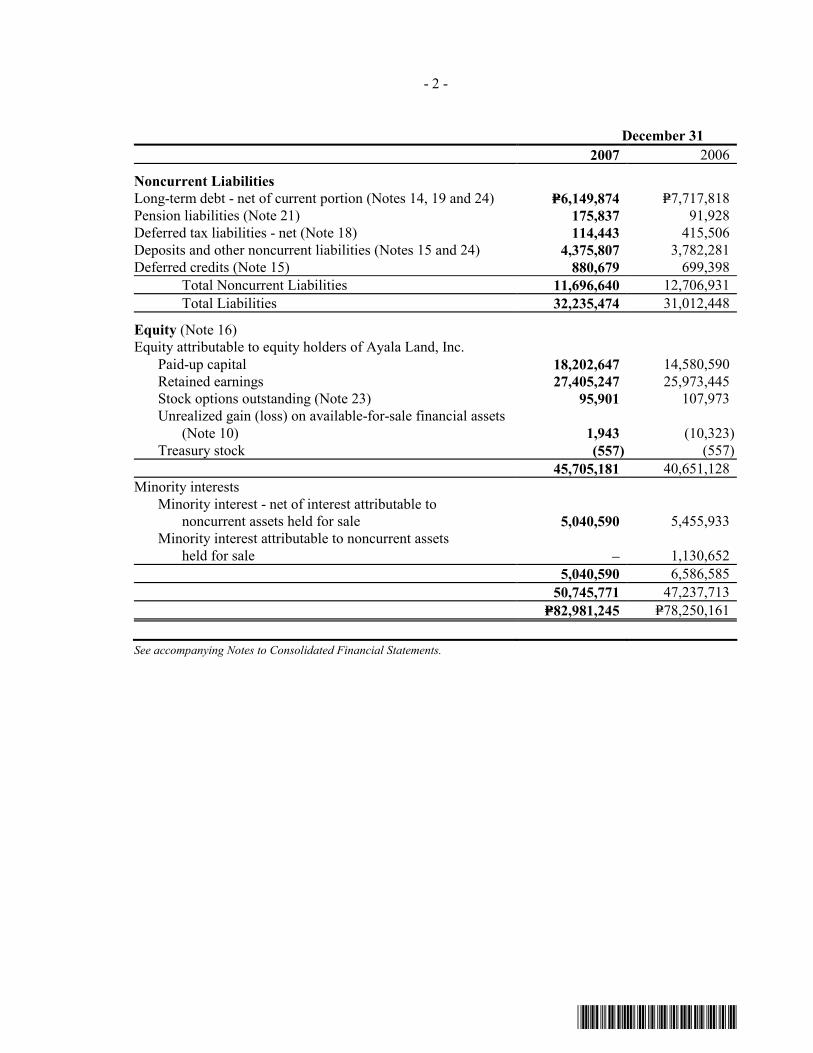
*SGVMC110511*
- 2 - December 31 2007 2006
Noncurrent Liabilities Long-term debt - net of current portion (Notes 14, 19 and 24) P=6,149,874 P=7,717,818 Pension liabilities (Note 21) 175,837 91,928 Deferred tax liabilities - net (Note 18) 114,443 415,506 Deposits and other noncurrent liabilities (Notes 15 and 24) 4,375,807 3,782,281 Deferred credits (Note 15) 880,679 699,398 Total Noncurrent Liabilities 11,696,640 12,706,931 Total Liabilities 32,235,474 31,012,448
Equity (Note 16) Equity attributable to equity holders of Ayala Land, Inc. Paid-up capital 18,202,647 14,580,590 Retained earnings 27,405,247 25,973,445 Stock options outstanding (Note 23) 95,901 107,973 Unrealized gain (loss) on available-for-sale financial assets
(Note 10) 1,943 (10,323) Treasury stock (557) (557)
45,705,181 40,651,128 Minority interests
Minority interest - net of interest attributable to noncurrent assets held for sale 5,040,590 5,455,933
Minority interest attributable to noncurrent assets held for sale – 1,130,652
5,040,590 6,586,585 50,745,771 47,237,713
P=82,981,245 P=78,250,161
See accompanying Notes to Consolidated Financial Statements.
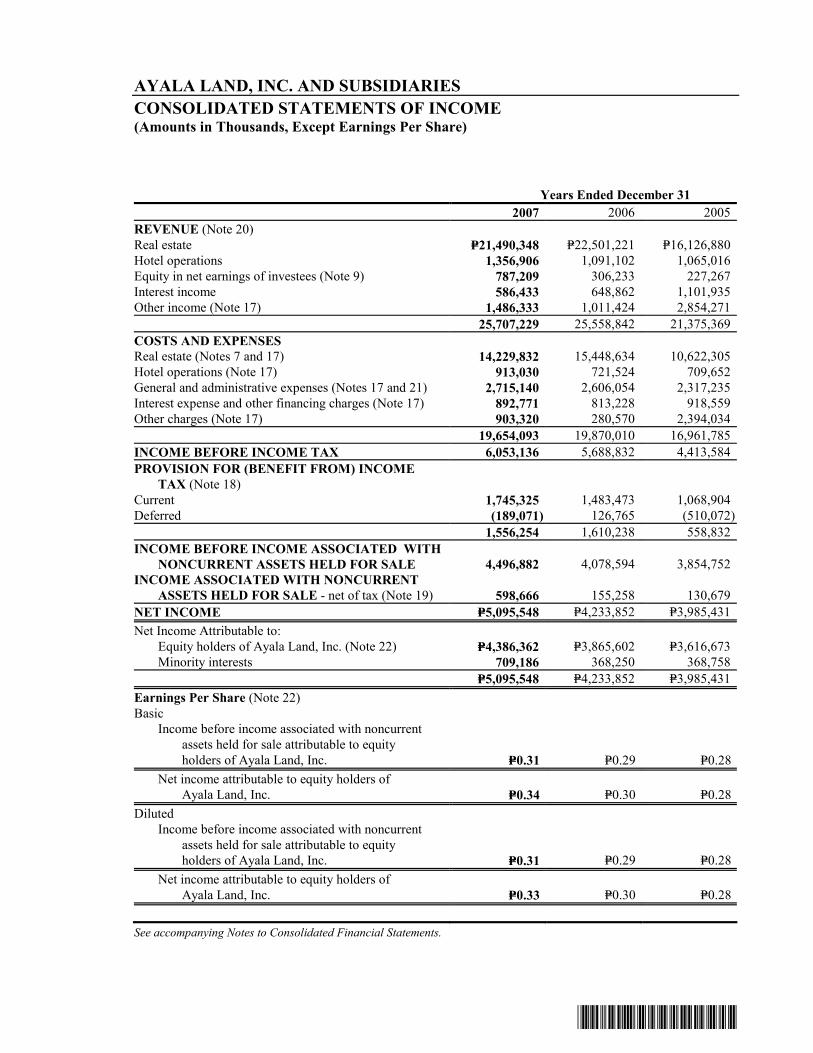
*SGVMC110511*
AYALA LAND, INC. AND SUBSIDIARIES CONSOLIDATED STATEMENTS OF INCOME (Amounts in Thousands, Except Earnings Per Share)
Years Ended December 31 2007 2006 2005 REVENUE (Note 20) Real estate P=21,490,348 P=22,501,221 P=16,126,880 Hotel operations 1,356,906 1,091,102 1,065,016 Equity in net earnings of investees (Note 9) 787,209 306,233 227,267 Interest income 586,433 648,862 1,101,935 Other income (Note 17) 1,486,333 1,011,424 2,854,271 25,707,229 25,558,842 21,375,369 COSTS AND EXPENSES Real estate (Notes 7 and 17) 14,229,832 15,448,634 10,622,305 Hotel operations (Note 17) 913,030 721,524 709,652 General and administrative expenses (Notes 17 and 21) 2,715,140 2,606,054 2,317,235 Interest expense and other financing charges (Note 17) 892,771 813,228 918,559 Other charges (Note 17) 903,320 280,570 2,394,034 19,654,093 19,870,010 16,961,785 INCOME BEFORE INCOME TAX 6,053,136 5,688,832 4,413,584 PROVISION FOR (BENEFIT FROM) INCOME
TAX (Note 18) Current 1,745,325 1,483,473 1,068,904 Deferred (189,071) 126,765 (510,072)
1,556,254 1,610,238 558,832 INCOME BEFORE INCOME ASSOCIATED WITH
NONCURRENT ASSETS HELD FOR SALE 4,496,882 4,078,594 3,854,752 INCOME ASSOCIATED WITH NONCURRENT
ASSETS HELD FOR SALE - net of tax (Note 19) 598,666 155,258 130,679 NET INCOME P=5,095,548 P=4,233,852 P=3,985,431 Net Income Attributable to:
Equity holders of Ayala Land, Inc. (Note 22) P=4,386,362 P=3,865,602 P=3,616,673 Minority interests 709,186 368,250 368,758 P=5,095,548 P=4,233,852 P=3,985,431 Earnings Per Share (Note 22) Basic Income before income associated with noncurrent
assets held for sale attributable to equity holders of Ayala Land, Inc. P=0.31 P=0.29 P=0.28
Net income attributable to equity holders of Ayala Land, Inc. P=0.34 P=0.30 P=0.28
Diluted Income before income associated with noncurrent
assets held for sale attributable to equity holders of Ayala Land, Inc. P=0.31 P=0.29 P=0.28
Net income attributable to equity holders of Ayala Land, Inc. P=0.33 P=0.30 P=0.28
See accompanying Notes to Consolidated Financial Statements.

*SGVMC110511*
AYALA LAND, INC. AND SUBSIDIARIES CONSOLIDATED STATEMENTS OF CHANGES IN EQUITY (Amounts in Thousands, Except Par Value and Cash Dividends Per Share
Years Ended December 31 2007 2006 2005
EQUITY ATTRIBUTABLE TO EQUITY HOLDERS OF AYALA LAND, INC.
Common Shares - P=1 par value (Note 16) Issued Balance at beginning of year P=10,809,675 P=10,794,539 P=10,774,189 Issuance of shares 2,776 1,071 65 Stock options exercised 17,972 14,065 20,285 Stock dividends 2,172,398 – – Balance at end of year 13,002,821 10,809,675 10,794,539 Subscribed
Balance at beginning of year 34,587 1,116 1,181 Additions – 34,542 – Issuance of shares (2,776) (1,071) (65)
Balance at end of year 31,811 34,587 1,116 Preferred Shares - P0.10 par value (Note 16) Balance at beginning of year – – – Issued during the year 1,303,460 – – Balance at end of year 1,303,460 – –
ADDITIONAL PAID-IN CAPITAL Balance at beginning of year 3,863,431 3,593,157 3,549,922 Additions 131,514 270,274 43,235 Balance at end of year 3,994,945 3,863,431 3,593,157
SUBSCRIPTIONS RECEIVABLE Balance at beginning of year (127,103) (3,721) (4,519) Additions (60,413) (158,897) – Collections 57,126 35,515 798 Balance at end of year (130,390) (127,103) (3,721)
TOTAL PAID-UP CAPITAL 18,202,647 14,580,590 14,385,091
RETAINED EARNINGS Appropriated for future expansion (Note 16) 6,000,000 6,000,000 6,000,000 Unappropriated:
Balance at beginning of year 19,973,445 17,950,660 17,570,508 Cash dividends - P=0.06 per share in 2007, P=0.17 per
share in 2006, and P=0.30 per share in 2005 (Note 16) (782,162) (1,842,817) (3,236,521)
Stock dividends (2,172,398) – – Net income 4,386,362 3,865,602 3,616,673 Balance at end of year 21,405,247 19,973,445 17,950,660
27,405,247 25,973,445 23,950,660
(Forward)
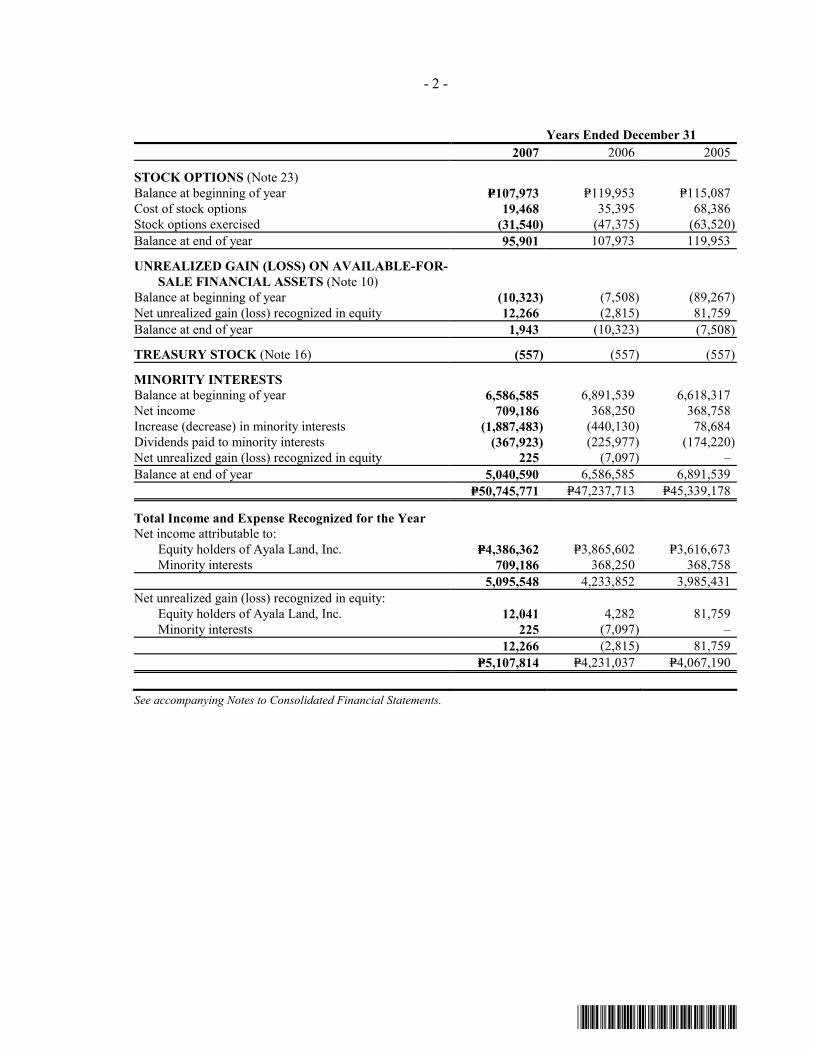
*SGVMC110511*
- 2 - Years Ended December 31 2007 2006 2005
STOCK OPTIONS (Note 23) Balance at beginning of year P=107,973 P=119,953 P=115,087 Cost of stock options 19,468 35,395 68,386 Stock options exercised (31,540) (47,375) (63,520) Balance at end of year 95,901 107,973 119,953
UNREALIZED GAIN (LOSS) ON AVAILABLE-FOR-SALE FINANCIAL ASSETS (Note 10)
Balance at beginning of year (10,323) (7,508) (89,267) Net unrealized gain (loss) recognized in equity 12,266 (2,815) 81,759 Balance at end of year 1,943 (10,323) (7,508)
TREASURY STOCK (Note 16) (557) (557) (557)
MINORITY INTERESTS Balance at beginning of year 6,586,585 6,891,539 6,618,317 Net income 709,186 368,250 368,758 Increase (decrease) in minority interests (1,887,483) (440,130) 78,684 Dividends paid to minority interests (367,923) (225,977) (174,220) Net unrealized gain (loss) recognized in equity 225 (7,097) – Balance at end of year 5,040,590 6,586,585 6,891,539
P=50,745,771 P=47,237,713 P=45,339,178
Total Income and Expense Recognized for the Year Net income attributable to: Equity holders of Ayala Land, Inc. P=4,386,362 P=3,865,602 P=3,616,673 Minority interests 709,186 368,250 368,758 5,095,548 4,233,852 3,985,431 Net unrealized gain (loss) recognized in equity:
Equity holders of Ayala Land, Inc. 12,041 4,282 81,759 Minority interests 225 (7,097) – 12,266 (2,815) 81,759
P=5,107,814 P=4,231,037 P=4,067,190
See accompanying Notes to Consolidated Financial Statements.

*SGVMC110511*
AYALA LAND, INC. AND SUBSIDIARIES CONSOLIDATED STATEMENTS OF CASH FLOWS (Amounts in Thousands)
Years Ended December 31 2007 2006 2005
CASH FLOWS FROM OPERATING ACTIVITIES Income before income tax P=6,053,136 P=5,688,832 P=4,413,584 Adjustments for: Depreciation and amortization (Notes 11, 12 and 17) 1,310,457 1,067,280 917,875 Interest expense - net of amount capitalized 870,513 795,089 780,547 Other charges 302,996 230,947 2,174,130 Dividends received from investees (Note 9) 84,376 72,779 94,275 Cost of share-based payments 104,704 148,004 68,386 Equity in net earnings of investees (Note 9) (787,209) (306,233) (227,267)
Gain on sale of investments (Note 17) (1,003,976) (608,865) (3,047,578) Interest income (337,818) (443,777) (625,912) Other income (Note 17) (129,680) (43,841) –
Operating income before changes in working capital 6,467,499 6,600,215 4,548,040 Decrease (increase) in:
Accounts and notes receivable - trade (2,009,164) 54,925 (3,490,652) Real estate inventories 2,207,429 (779,221) (637,662) Other current assets (624,571) (80,282) (298,341)
Increase (decrease) in: Accounts and other payables 3,821,922 1,214,997 5,731,232 Pension liabilities 83,909 (17,117) (364,765) Other current liabilities 180,674 260,475 (11,855) Cash generated from operations 10,127,698 7,253,992 5,475,997 Interest received 346,712 431,603 610,191 Income tax paid (1,725,723) (1,461,760) (1,124,417) Interest paid (817,536) (947,258) (1,057,733) Net cash provided by operating activities before cash
items associated with noncurrent assets held for sale 7,931,151 5,276,577 3,904,038 Net cash provided by operating activities associated
with noncurrent assets held for sale 598,666 291,672 241,186 Total cash provided by operating activities 8,529,817 5,568,249 4,145,224
CASH FLOWS FROM INVESTING ACTIVITIES Proceeds from: Sale of investments 1,389,974 460,000 3,752,298 Sale of available-for-sale financial assets 12,791 4,980 16,712 Disposal of property and equipment – 263,236 – Disposals of (additions to): Short term investments 2,596,048 (3,711,834) (1,123,343)
Available-for-sale financial assets – (26,840) – Land and improvements (548,392) 237,606 (5,295)
Investments in associates and jointly controlled entities 175,944 (1,528,059) – Investment properties (699,180) (343,689) (339,007)
Property and equipment (Note 12) (2,018,156) (1,696,764) (1,150,827)
(Forward)

*SGVMC110511*
- 2 - Years Ended December 31 2007 2006 2005 Decrease (increase) in:
Accounts and notes receivable - non-trade (P=360,202) (P=297,439) (P=18,292) Other noncurrent assets 31,124 113,220 (633,629)
Net cash provided by (used in) investing activities before cash items associated with noncurrent assets held for sale 579,951 (6,525,583) 498,617
Net cash provided by (used in) investing activities associated with noncurrent assets held for sale, including cash balance – (361,691) 2,071
Total cash provided by (used in) investing activities 579,951 (6,887,274) 500,688 CASH FLOWS FROM FINANCING ACTIVITIES Proceeds from short and long-term debt 956,961 3,584,424 870,000 Payment of short and long-term debt (3,654,899) (1,017,342) (3,302,844) Increase (decrease) in: Deposits and other noncurrent liabilities 774,807 614,393 740,350 Minority interest in consolidated subsidiaries (821,535) (645,617) – Proceeds from issuance of preferred shares 1,303,460 – – Proceeds from capital stock subscriptions 57,126 35,515 798 Dividends paid to minority (367,923) (225,977) (174,220) Dividends paid to equity holders of Ayala Land, Inc. (716,450) (1,841,355) (3,235,916) Net cash provided by (used in) financing activities
before cash items associated with noncurrent assets held for sale (2,468,453) 504,041 (5,101,832)
Net cash used in financing activities associated with noncurrent assets held for sale – (187,120) (271,572)
Total cash provided by (used in) financing activities (2,468,453) 316,921 (5,373,404) NET INCREASE (DECREASE) IN CASH AND
CASH EQUIVALENTS 6,641,315 (1,002,104) (727,492) CASH AND CASH EQUIVALENTS AT
BEGINNING OF YEAR (Note 4) 4,630,591 5,632,695 6,360,187 CASH AND CASH EQUIVALENTS AT
END OF YEAR (Note 4) P=11,271,906 P=4,630,591 P=5,632,695
See accompanying Notes to Consolidated Financial Statements.

*SGVMC110511*
AYALA LAND, INC. AND SUBSIDIARIES NOTES TO CONSOLIDATED FINANCIAL STATEMENTS
1. Corporate Information
Ayala Land, Inc. (the Company) is incorporated in the Republic of the Philippines. The Company’s registered office and principal place of business is at Tower One, Ayala Triangle, Ayala Avenue, Makati City. The Company’s parent is Ayala Corporation (AC). AC is a publicly-listed company, 50.90%-owned by Mermac, Inc., 10.57%-owned by Mitsubishi Corporation and the rest by the public.
The Company and its Subsidiaries (the Group) is incorporated to hold, develop, manage, administer, sell, convey, encumber, purchase, acquire, rent or otherwise deal in and dispose of, for itself or for others, residential including, but not limited to, all kinds of housing projects, commercial, industrial, urban or other kinds of real property; to acquire, purchase, hold, manage, develop and sell subdivision lots, with or without buildings or improvements; to erect, construct, alter, manage, operate, lease, in whole or in part, buildings and tenements of the Company or of other persons; and to engage or act as real estate broker. The Group is also involved in hotel operations.
The consolidated financial statements of Ayala Land, Inc. and Subsidiaries as of December 31, 2007 and 2006 and for each of the three years in the period ended December 31, 2007 were endorsed for approval by the Audit Committee on February 7, 2008 and were authorized for issue by the Board of Directors (BOD) on February 12, 2008.
2. Summary of Significant Accounting Policies
Basis of Preparation The consolidated financial statements of the Group have been prepared using the historical cost basis, except for financial assets at fair value through profit or loss (FVPL), available-for-sale (AFS) financial assets and derivative asset that have been measured at fair value. The consolidated financial statements are presented in Philippine Peso (P=) and all values are rounded to the nearest thousand (P=000) except when otherwise indicated. The Group’s functional currency is Philippine Peso.
Statement of Compliance The consolidated financial statements of the Group have been prepared in compliance with Philippine Financial Reporting Standards (PFRS).
Basis of Consolidation The consolidated financial statements comprise the financial statements of the Group as of December 31, 2007 and 2006 and for each of the three years in the period ended December 31, 2007. The financial statements of the subsidiaries are prepared for the same reporting year as the Company, using consistent accounting policies.
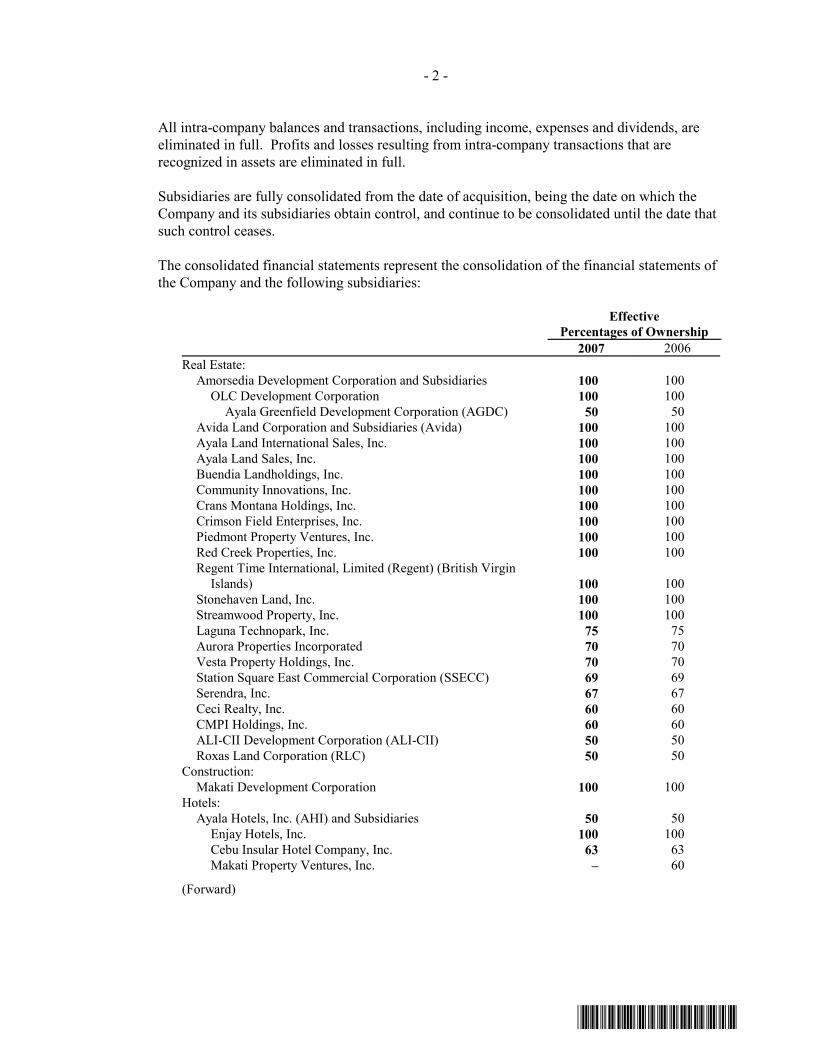
- 2 -
*SGVMC110511*
All intra-company balances and transactions, including income, expenses and dividends, are eliminated in full. Profits and losses resulting from intra-company transactions that are recognized in assets are eliminated in full.
Subsidiaries are fully consolidated from the date of acquisition, being the date on which the
Company and its subsidiaries obtain control, and continue to be consolidated until the date that such control ceases.
The consolidated financial statements represent the consolidation of the financial statements of the Company and the following subsidiaries:
Effective
Percentages of Ownership 2007 2006
Real Estate: Amorsedia Development Corporation and Subsidiaries 100 100
OLC Development Corporation 100 100 Ayala Greenfield Development Corporation (AGDC) 50 50 Avida Land Corporation and Subsidiaries (Avida) 100 100 Ayala Land International Sales, Inc. 100 100 Ayala Land Sales, Inc. 100 100 Buendia Landholdings, Inc. 100 100 Community Innovations, Inc. 100 100 Crans Montana Holdings, Inc. 100 100 Crimson Field Enterprises, Inc. 100 100 Piedmont Property Ventures, Inc. 100 100 Red Creek Properties, Inc. 100 100 Regent Time International, Limited (Regent) (British Virgin
Islands) 100 100 Stonehaven Land, Inc. 100 100 Streamwood Property, Inc. 100 100 Laguna Technopark, Inc. 75 75 Aurora Properties Incorporated 70 70 Vesta Property Holdings, Inc. 70 70 Station Square East Commercial Corporation (SSECC) 69 69 Serendra, Inc. 67 67 Ceci Realty, Inc. 60 60 CMPI Holdings, Inc. 60 60 ALI-CII Development Corporation (ALI-CII) 50 50 Roxas Land Corporation (RLC) 50 50 Construction: Makati Development Corporation 100 100 Hotels: Ayala Hotels, Inc. (AHI) and Subsidiaries 50 50 Enjay Hotels, Inc. 100 100 Cebu Insular Hotel Company, Inc. 63 63 Makati Property Ventures, Inc. – 60
(Forward)

- 3 -
*SGVMC110511*
Effective
Percentages of Ownership 2007 2006
Property Management: Ayala Property Management Corporation (APMC) 100 100
Ayala Theatres Management, Inc. and Subsidiaries 100 100 Entertainment: Five Star Cinema, Inc. 100 100 Leisure and Allied Industries Philippines, Inc. (LAI) 50 50 Others: ALInet.com, Inc. (ALInet) 100 100 Food Court Company, Inc. 100 100 Northbeacon Commercial Corporation (formerly Alabang
Theatres Management Corporation) 100 100 First Longfield Investments Limited (First Longfield)
(Hongkong Company) 100 100
AC owns the other 50% of AHI and subsidiaries. The Company exercises control over AHI and subsidiaries. Likewise, the Company, through its 50% effective ownership and by virtue of a management contract or shareholders’ agreement, exercises control over the operations and management of RLC, AGDC, ALI-CII and LAI. Accordingly, the accounts of AHI, RLC, AGDC, ALI-CII and LAI are consolidated to the accounts of the Company.
Minority interests represent the portion of profit or loss and net assets in subsidiaries not wholly owned and are presented separately in the consolidated statement of income and consolidated statement of changes in equity and within equity in the consolidated balance sheet, separately from the Company’s equity.
Changes in Accounting PoliciesThe accounting policies adopted are consistent with those of the previous financial year except as follows:
PFRS 7, Financial Instruments: Disclosures, and the complementary amendment to PAS 1, Presentation of Financial Statements: Capital Disclosures (effective for annual periods beginning on or after January 1, 2007) PFRS 7 introduces new disclosures to improve the information about financial instruments. It requires the disclosure of qualitative information about exposure to risks arising from financial instruments, including specified minimum disclosures about credit risk, liquidity risk and market risk, including sensitivity analysis to market risk. It replaces the disclosure requirements in PAS 32, Financial Instruments: Disclosure and Presentation and PAS 30, Disclosure in the Financial Statements of Banks and Similar Financial Institutions. It is applicable to all entities that report under PFRS. The amendment to PAS 1 introduces disclosures about the level of an entity’s capital and how it manages capital.
The Group adopted the amendment to the transition provisions of PFRS 7, as approved by the Financial Reporting Standards Council, which gives transitory relief with respect to the presentation of comparative information for the new risk disclosures about the nature and extent of risks arising from financial instruments. Accordingly, the Group does not need to present comparative information for the disclosures required by paragraphs 31 - 42 of PFRS 7, unless the

- 4 -
*SGVMC110511*
disclosure was previously required under PAS 30 or PAS 32. Adoption of PFRS 7 and the amendment to PAS 1 resulted in additional disclosures, which are included throughout the consolidated financial statements. These disclosures include presenting the different classes of loans and receivables (see Note 6), rollforward of allowance for impairment losses (see Note 6), Company’s capital management (see Note 16), credit quality of financial assets (see Note 24), aging of past due but not impaired financial assets (see Note 24), and sensitivity analyses as to changes in interest and foreign exchange rates (see Note 24).
Philippine Interpretation IFRIC-10, Interim Financial Reporting and Impairment This Interpretation provides that the frequency of financial reporting does affect the amount of impairment charge to be recognized in the annual financial reporting with respect to goodwill and AFS financial assets. It prohibits the reversal of impairment losses on goodwill and AFS equity investments recognized in the interim financial reports even if impairment is no longer present at the annual balance sheet date. Adoption of this Interpretation did not have any significant impact on the consolidated financial statements.
Future Changes in Accounting Policies The Group has not applied the following PFRS and Philippine Interpretations which are not yet effective for the year ended December 31, 2007:
PAS 23, Borrowing Costs (effective for annual periods beginning on or after January 1, 2009) The Standard has been revised to require capitalization of borrowing costs when such costs relate to a qualifying asset. A qualifying asset is an asset that necessarily takes a substantial period of time to get ready for its intended use or sale. In accordance with the transitional requirements in the Standard, this change in accounting for borrowing costs shall be accounted for prospectively. Accordingly, borrowing costs will be capitalized on qualifying assets with a commencement date after January 1, 2009. No changes will be made for borrowing costs incurred to this date that have been expensed. The Group does not expect that the adoption of this Standard will have a significant impact on the consolidated financial statements.
PFRS 8, Operating Segments (effective for annual periods beginning on or after January 1, 2009) This PFRS adopts a management approach to reporting segment information. PFRS 8, will replace PAS 14, Segment Reporting, and is required to be adopted only by entities whose debt or equity instruments are publicly traded, or are in the process of filing with the SEC for purposes of issuing any class of instruments in a public market. The Group will apply PFRS 8 in 2009 and will assess the impact of this Standard on its current manner of reporting segment information.
Amendment to PAS 1, Amendment on Statement of Comprehensive Income This Amendment will become effective January 1, 2008. In accordance with the amendment to PAS 1, the statement of changes in equity shall include only transactions with owners, while all non-owner changes will be presented in equity as a single line with details included in a separate statement. Owners are defined as holders of instruments classified as equity.
In addition, the amendment to PAS 1 provides for the introduction of a new statement of comprehensive income that combines all items of income and expense recognized in the statement of income together with ‘other comprehensive income’. The revisions specify what is included in other comprehensive income, such as gains and losses on AFS financial assets, actuarial gains and losses on defined benefit pension plans and changes in the asset revaluation reserve. Entities can
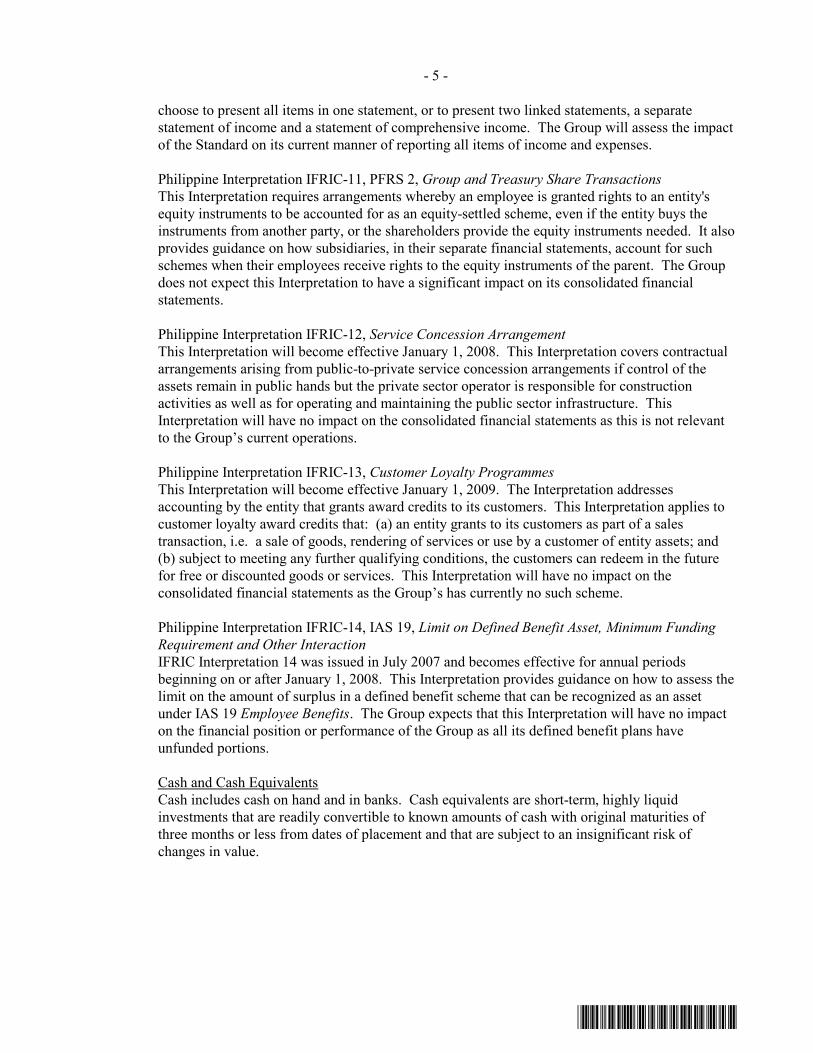
- 5 -
*SGVMC110511*
choose to present all items in one statement, or to present two linked statements, a separate statement of income and a statement of comprehensive income. The Group will assess the impact of the Standard on its current manner of reporting all items of income and expenses.
Philippine Interpretation IFRIC-11, PFRS 2, Group and Treasury Share Transactions This Interpretation requires arrangements whereby an employee is granted rights to an entity's equity instruments to be accounted for as an equity-settled scheme, even if the entity buys the instruments from another party, or the shareholders provide the equity instruments needed. It also provides guidance on how subsidiaries, in their separate financial statements, account for such schemes when their employees receive rights to the equity instruments of the parent. The Group does not expect this Interpretation to have a significant impact on its consolidated financial statements.
Philippine Interpretation IFRIC-12, Service Concession Arrangement
This Interpretation will become effective January 1, 2008. This Interpretation covers contractual arrangements arising from public-to-private service concession arrangements if control of the assets remain in public hands but the private sector operator is responsible for construction activities as well as for operating and maintaining the public sector infrastructure. This Interpretation will have no impact on the consolidated financial statements as this is not relevant to the Group’s current operations.
Philippine Interpretation IFRIC-13, Customer Loyalty Programmes
This Interpretation will become effective January 1, 2009. The Interpretation addresses accounting by the entity that grants award credits to its customers. This Interpretation applies to customer loyalty award credits that: (a) an entity grants to its customers as part of a sales transaction, i.e. a sale of goods, rendering of services or use by a customer of entity assets; and (b) subject to meeting any further qualifying conditions, the customers can redeem in the future for free or discounted goods or services. This Interpretation will have no impact on the consolidated financial statements as the Group’s has currently no such scheme.
Philippine Interpretation IFRIC-14, IAS 19, Limit on Defined Benefit Asset, Minimum Funding Requirement and Other InteractionIFRIC Interpretation 14 was issued in July 2007 and becomes effective for annual periods beginning on or after January 1, 2008. This Interpretation provides guidance on how to assess the limit on the amount of surplus in a defined benefit scheme that can be recognized as an asset under IAS 19 Employee Benefits. The Group expects that this Interpretation will have no impact on the financial position or performance of the Group as all its defined benefit plans have unfunded portions.
Cash and Cash Equivalents Cash includes cash on hand and in banks. Cash equivalents are short-term, highly liquid investments that are readily convertible to known amounts of cash with original maturities of three months or less from dates of placement and that are subject to an insignificant risk of changes in value.
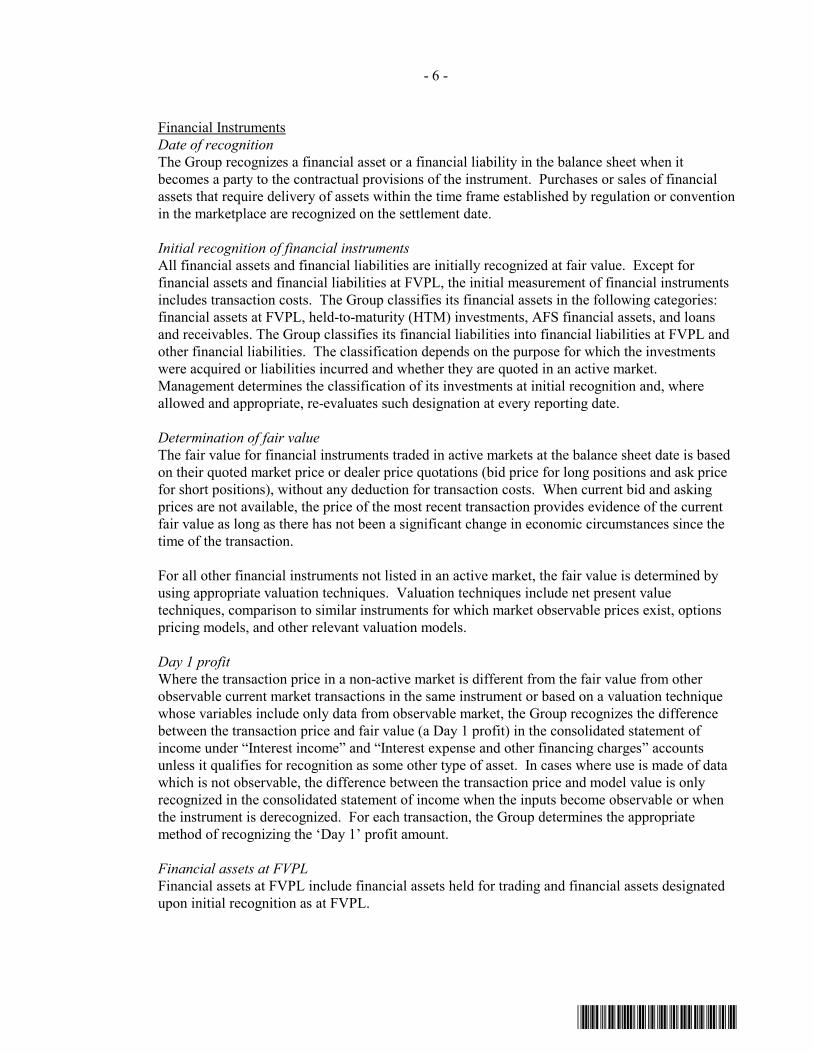
- 6 -
*SGVMC110511*
Financial InstrumentsDate of recognition The Group recognizes a financial asset or a financial liability in the balance sheet when it becomes a party to the contractual provisions of the instrument. Purchases or sales of financial assets that require delivery of assets within the time frame established by regulation or convention in the marketplace are recognized on the settlement date.
Initial recognition of financial instruments All financial assets and financial liabilities are initially recognized at fair value. Except for financial assets and financial liabilities at FVPL, the initial measurement of financial instruments includes transaction costs. The Group classifies its financial assets in the following categories: financial assets at FVPL, held-to-maturity (HTM) investments, AFS financial assets, and loans and receivables. The Group classifies its financial liabilities into financial liabilities at FVPL and other financial liabilities. The classification depends on the purpose for which the investments were acquired or liabilities incurred and whether they are quoted in an active market. Management determines the classification of its investments at initial recognition and, where allowed and appropriate, re-evaluates such designation at every reporting date.
Determination of fair value The fair value for financial instruments traded in active markets at the balance sheet date is based on their quoted market price or dealer price quotations (bid price for long positions and ask price for short positions), without any deduction for transaction costs. When current bid and asking prices are not available, the price of the most recent transaction provides evidence of the current fair value as long as there has not been a significant change in economic circumstances since the time of the transaction.
For all other financial instruments not listed in an active market, the fair value is determined by using appropriate valuation techniques. Valuation techniques include net present value techniques, comparison to similar instruments for which market observable prices exist, options pricing models, and other relevant valuation models.
Day 1 profit Where the transaction price in a non-active market is different from the fair value from other observable current market transactions in the same instrument or based on a valuation technique whose variables include only data from observable market, the Group recognizes the difference between the transaction price and fair value (a Day 1 profit) in the consolidated statement of income under “Interest income” and “Interest expense and other financing charges” accounts unless it qualifies for recognition as some other type of asset. In cases where use is made of data which is not observable, the difference between the transaction price and model value is only recognized in the consolidated statement of income when the inputs become observable or when the instrument is derecognized. For each transaction, the Group determines the appropriate method of recognizing the ‘Day 1’ profit amount.
Financial assets at FVPL Financial assets at FVPL include financial assets held for trading and financial assets designated upon initial recognition as at FVPL.

- 7 -
*SGVMC110511*
Financial assets are classified as held for trading if they are acquired for the purpose of selling in the near term. Derivatives, including separated embedded derivatives are also classified as held for trading unless they are designated as effective hedging instruments or a financial guarantee contract. Gains or losses on investments held for trading are recognized in the consolidated statement of income under “Other income” account or “Other charges” account.
Where a contract contains one or more embedded derivatives, the entire hybrid contract may be designated as a financial asset at FVPL, except where the embedded derivative does not significantly modify the cash flows or it is clear that separation of the embedded derivative is prohibited.
Financial assets may be designated at initial recognition as at FVPL if any of the following criteria are met: The designation eliminates or significantly reduces the inconsistent treatment that would
otherwise arise from measuring the assets or liabilities or recognizing gains or losses on them on a different basis; or
The assets are part of a group of financial assets which are managed and their performance evaluated on a fair value basis, in accordance with a documented risk management or investment strategy, or
The financial instrument contains an embedded derivative that would need to be separately recorded.
As of December 31, 2007 and 2006 the Group holds its “Treasury bills” and “Treasury bonds” for trading purposes and classifies them as financial assets at FVPL and has not designated any financial liability at FVPL.
The Company enters into short-term nondeliverable currency forward contracts to manage its exchange exposure. This is accounted for as non-hedge derivative.
HTM investments HTM investments are quoted non-derivative financial assets with fixed or determinable payments and fixed maturities for which management has the positive intention and ability to hold to maturity. Where the Group sells other than an insignificant amount of HTM investments, the entire category would be tainted and reclassified as AFS financial assets. After initial measurement, these investments are measured at amortized cost using the effective interest rate method, less impairment in value. Amortized cost is calculated by taking into account any discount or premium on acquisition and fees that are an integral part of the effective interest rate. The amortization is included in interest income in the consolidated statement of income. Gains and losses are recognized in the consolidated statement of income under “Other income” or “Other charges” when the HTM investments are derecognized and impaired, as well as through the amortization process. As of December 31, 2007 and 2006, the Group has no HTM investments.
Loans and receivables Loans and receivables are financial assets with fixed or determinable payments and fixed maturities that are not quoted in an active market. They are not entered into with the intention of immediate or short-term resale and are not designated as AFS or financial assets at FVPL. This accounting policy relates to the consolidated balance sheet captions “Short-term investments” and “Accounts and notes receivable” except for “Advances to contractors”.

- 8 -
*SGVMC110511*
After initial measurement, the loans and receivables are subsequently measured at amortized cost using the effective interest rate method, less allowance for impairment. Amortized cost is calculated by taking into account any discount or premium on acquisition and fees that are an integral part of the effective interest rate. The amortization is included in the interest income in the consolidated statement of income. The losses arising from impairment of such loans and receivables are recognized in the consolidated statement of income under “Other charges” account.
AFS financial assets AFS financial assets are those which are designated as such or do not qualify to be classified as designated as at FVPL, HTM, or loans and receivables.
Financial assets may be designated at initial recognition as AFS if they are purchased and held indefinitely, and may be sold in response to liquidity requirements or changes in market conditions. AFS financial assets include equity investments.
After initial measurement, AFS financial assets are measured at fair value. The unrealized gains and losses arising from the fair valuation of AFS financial assets are excluded from reported earnings and are reported as “Unrealized gain (loss) on available-for-sale financial assets” in the consolidated statement of changes in equity.
When the security is disposed of, the cumulative gain or loss previously recognized in equity is recognized in the consolidated statement of income under “Other income” account or “Other charges” account. Where the Group holds more than one investment in the same security, these are deemed to be disposed of on a first-in first-out basis. Interest earned on holding AFS financial assets are reported as interest income using the effective interest rate. Dividends earned on holding AFS financial assets are recognized in the statement of income as “Other income” when the right of payment has been established. The losses arising from impairment of such investments are recognized in the consolidated statement of income under the “Other charges” account.
Other financial liabilities Other financial liabilities include short-term and long-term debts. All loans and borrowings are initially recognized at the fair value of the consideration received less directly attributable transaction costs.
After initial recognition, short-term and long-term debts are subsequently measured at amortized cost using the effective interest method.
Gains and losses are recognized under the “Other income” and “Other charges” accounts in the consolidated statement of income when the liabilities are derecognized or impaired, as well as through the amortization process under the “Interest expense and other financing charges” account.
Deposits and Retention Payable Deposits and retention payable are measured initially at fair value. After initial recognition, deposits and retention payable are subsequently measured at amortized cost using effective interest method.
- 9 -
*SGVMC110511*
For deposits, the difference between the cash received and its fair value is deferred (included in the “Deferred credits” in the consolidated balance sheet and amortized using the straight-line method under the “Real estate revenue” account in the consolidated statement of income.
Derecognition of Financial Assets and Liabilities
Financial asset A financial asset (or, where applicable a part of a financial asset or part of a group of financial assets) is derecognized where: a. the rights to receive cash flows from the asset have expired; b. the Group retains the right to receive cash flows from the asset, but has assumed as obligation
to pay them in full without material delay to a third party under a “pass-through” arrangement; or
c. the Group has transferred its right to receive cash flows from the asset and either (a) has transferred substantially all the risks and rewards of the asset, or (b) has neither transferred nor retained the risk and rewards of the asset but has transferred the control of the asset.
Where the Group has transferred its rights to receive cash flows from an asset or has entered into a pass-through arrangement, and has neither transferred nor retained substantially all the risks and rewards of the asset nor transferred control of the asset, the asset is recognized to the extent of the Group’s continuing involvement in the asset. Continuing involvement that takes the form of a guarantee over the transferred asset is measured at the lower of original carrying amount of the asset and the maximum amount of consideration that the Group could be required to repay.
Financial liability A financial liability is derecognized when the obligation under the liability is discharged, cancelled, or has expired. Where an existing financial liability is replaced by another from the same lender on substantially different terms, or the terms of an existing liability are substantially modified, such an exchange or modification is treated as a derecognition of the original liability and the recognition of a new liability, and the difference in the respective carrying amounts is recognized in the consolidated statement of income.
Impairment of Financial AssetsThe Group assesses at each consolidated balance sheet date whether there is objective evidence that a financial asset or group of financial assets is impaired. A financial asset or a group of financial assets is deemed to be impaired if, and only if, there is objective evidence of impairment as a result of one or more events that has occurred after the initial recognition of the asset (an incurred ‘loss event’) and that loss event (or events) has an impact on the estimated future cash flows of the financial asset or the group of financial assets that can be reliably estimated.
Evidence of impairment may include indications that the borrower or a group of borrowers is experiencing significant financial difficulty, default or delinquency in interest or principal payments, the probability that they will enter bankruptcy or other financial reorganization and where observable data indicate that there is measurable decrease in the estimated future cash flows, such as changes in arrears or economic conditions that correlate with defaults.
- 10 -
*SGVMC110511*
Loans and receivables For loans and receivables carried at amortized cost, the Group first assesses whether objective evidence of impairment exists individually for financial assets that are individually significant, or collectively for financial assets that are not individually significant. If the Group determines that no objective evidence of impairment exists for individually assessed financial asset, whether significant or not, it includes the asset in a group of financial assets with similar credit risk characteristics and collectively assesses for impairment. Those characteristics are relevant to the estimation of future cash flows for groups of such assets by being indicative of the debtors’ ability to pay all amounts due according to the contractual terms of the assets being evaluated. Assets that are individually assessed for impairment and for which an impairment loss is, or continues to be recognized are not included in a collective assessment for impairment.
If there is objective evidence that an impairment loss has been incurred, the amount of the loss is measured as the difference between the asset’s carrying amount and the present value of the estimated future cash flows (excluding future credit losses that have not been incurred). The carrying amount of the asset is reduced through use of an allowance account and the amount of loss is charged to the consolidated statement of income under “Other charges” account. Interest income continues to be recognized based on the original effective interest rate of the asset. Loans, together with the associated allowance accounts, are written off when there is no realistic prospect of future recovery and all collateral has been realized. If, in a subsequent year, the amount of the estimated impairment loss decreases because of an event occurring after the impairment was recognized, the previously recognized impairment loss is reversed. Any subsequent reversal of an impairment loss is recognized in the consolidated statement of income, to the extent that the carrying value of the asset does not exceed its amortized cost at the reversal date.
For the purpose of a collective evaluation of impairment, financial assets are grouped on the basis of such credit risk characteristics such as customer type, payment history, past-due status and term.
Future cash flows in a group of financial assets that are collectively evaluated for impairment are estimated on the basis of historical loss experience for assets with credit risk characteristics similar to those in the group. Historical loss experience is adjusted on the basis of current observable data to reflect the effects of current conditions that did not affect the period on which the historical loss experience is based and to remove the effects of conditions in the historical period that do not exist currently. The methodology and assumptions used for estimating future cash flows are reviewed regularly by the Group to reduce any differences between loss estimates and actual loss experience.
AFS financial assets For AFS financial assets, the Group assesses at each balance sheet date whether there is objective evidence that a financial asset or group of financial assets is impaired.
In case of equity investments classified as AFS, this would include a significant or prolonged decline in the fair value of the investments below its cost. Where there is evidence of impairment, the cumulative loss - measured as the difference between the acquisition cost and the current fair value, less any impairment loss on that financial asset previously recognized in the consolidated statement of income - is removed from the consolidated statement of changes in equity and
- 11 -
*SGVMC110511*
recognized in the consolidated statement of income in the “Other charges” account. Impairment losses on equity investments are not reversed through the consolidated statement of income.
Increases in fair value after impairment are recognized directly in the consolidated statement of changes in equity.
In the case of debt instruments classified as AFS, impairment is assessed based on the same criteria as financial assets carried at amortized cost. Interest continues to be accrued at the original effective interest rate on the reduced carrying amount of the asset and is recorded as part of Interest income in the consolidated statement of income. If, in subsequent year, the fair value of a debt instrument increased and the increase can be objectively related to an event occurring after the impairment loss was recognized in the consolidated statement of income, the impairment loss is reversed through the consolidated statement of income.
Offsetting Financial InstrumentsFinancial assets and financial liabilities are offset and the net amount reported in the consolidated balance sheets if, and only if, there is a currently enforceable legal right to offset the recognized amounts and there is an intention to settle on a net basis, or to realize the asset and settle the liability simultaneously. This is not generally the case with master netting agreements, and the related assets and liabilities are presented gross in the consolidated balance sheets.
Real Estate Inventories Real estate inventories are carried at the lower of cost or net realizable value (NRV). NRV is the estimated selling price in the ordinary course of business, less estimated costs of completion and estimated costs necessary to make the sale. Cost includes those costs incurred for development and improvement of the properties, including capitalized borrowing costs.
Noncurrent Assets Held for Sale The Group classifies assets as held for sale (disposal group) when their carrying amount will be recovered principally through a sale transaction rather than through continuing use. For this to be the case, the asset must be available for immediate sale in its present condition subject only to terms that are usual and customary for sales of such assets and its sale must be highly probable. For the sale to be highly probable, the appropriate level of management must be committed to a plan to sell the asset and an active programme to locate a buyer and complete the plan must have been initiated. Further, the asset must be actively marketed for sale at a price that is reasonable in relation to its current fair value. In addition, the sale should be expected to qualify for recognition as a completed sale within one year from the date of classification.
The related results of operations and cash flows of the disposal group that qualified as discontinued operation are separated from the results of those that would be recovered principally through continuing use, and prior years’ consolidated statement of income and cash flows are re-presented. Results of operations and cashflows of the disposal group that qualified as discontinued operation are presented in the statement of income and cashflows as items associated with noncurrent assets held for sale.
Land and Improvements Land and improvements consist of properties for future development and are carried at the lower of cost or NRV. NRV is the estimated selling price in the ordinary course of business, less estimated cost of completion and estimated costs necessary to make the sale. Cost includes those costs incurred for development and improvement of the properties.

- 12 -
*SGVMC110511*
Investments in Associates and Jointly Controlled Entities Investments in associates and jointly controlled entities (investee companies) are accounted for under the equity method of accounting. An associate is an entity in which the Group has significant influence and which is neither a subsidiary nor a joint venture. A joint venture is a contractual arrangement whereby two or more parties undertake an economic activity that is subject to joint control, and a jointly controlled entity is a joint venture that involves the establishment of a separate entity in which each venturer has an interest.
Under the equity method, the investments in the investee companies are carried in the consolidated balance sheets at cost plus post-acquisition changes in the Group’s share in the net assets of the investee companies. The consolidated statement of income reflects the share of the results of the operations of the investee companies. Profit and losses resulting from transactions between the Group and the investee companies are eliminated to the extent of the interest in the investee companies. If the Group’s interest in the net fair value of the identifiable assets, liabilities and contingent liabilities of the acquired company exceeds the cost of the business combination, the excess shall be recognized immediately in the consolidated statement of income.
The Group discontinues applying the equity method when their investments in investee companies are reduced to zero. Accordingly, additional losses are not recognized unless the Group has guaranteed certain obligations of the investee companies. When the investee companies subsequently report net income, the Group will resume applying the equity method but only after its share of that net income equals the share of net losses not recognized during the period the equity method was suspended.
The reporting dates of the investee companies and the Group are identical and the investee companies’ accounting policies conform to those used by the Group for like transactions and events in similar circumstances.
Investment Properties Investment properties consist of properties that are held to earn rentals and that are not occupied by the companies in the Group. Investment properties, except for land, are carried at cost less accumulated depreciation and amortization and any impairment in residual value. Land is carried at cost less any impairment in value.
Depreciation and amortization of investment properties are computed using the straight-line method over the estimated useful lives of the assets. The estimated useful lives of investments properties are as follows: land improvements - 5 years; and buildings - 20 to 40 years.
Investment properties are derecognized when either they have been disposed of, or when the investment property is permanently withdrawn from use and no future economic benefit is expected from its disposal. Any gains or losses on the retirement or disposal of an investment property are recognized in the consolidated statement of income in the year of retirement or disposal.

- 13 -
*SGVMC110511*
Transfers are made to investment property when there is a change in use, evidenced by ending of owner-occupation, commencement of an operating lease to another party or ending of construction or development. Transfers are made from investment property when and only when there is a change in use, evidenced by commencement of owner-occupation or commencement of development with a view to sale. Transfers between investment property, owner-occupied property and inventories do not change the carrying amount of the property transferred and they do not change the cost of that property for measurement or disclosure purposes.
Property and Equipment Property and equipment, except for land, are carried at cost less accumulated depreciation and amortization and any impairment in value. Land is carried at cost less any impairment in value. The initial cost of property and equipment comprises its construction cost or purchase price and any directly attributable costs of bringing the asset to its working condition and location for its intended use, including borrowing costs.
Construction-in-progress is stated at cost less any impairment in value. This includes cost of construction, plant and equipment and other direct costs. Construction-in-progress is not depreciated until such time that the relevant assets are completed and put into operational use.
Major repairs are capitalized as part of property and equipment only when it is probable that future economic benefits associated with the item will flow to the Group and the cost of the items can be measured reliably. All other repairs and maintenance are charged against current operations as incurred.
Depreciation and amortization of property and equipment commences once the property and equipment are available for use and is computed on a straight-line basis over the estimated useful lives of the property and equipment as follows:
Years Buildings and improvements 20-40 Machinery and construction equipment 5 Furniture, fixtures and equipment 3-10 Transportation equipment 3-5 Hotel property and equipment 5-50
Hotel property and equipment includes the following type of assets and their corresponding estimated useful lives:
Years Hotel buildings and improvements 30-50 Land improvements 30 Leasehold improvements 5-20 Furniture, furnishing and equipment 5 Machinery and equipment 5 Transportation equipment 5
The asset’s residual values, useful life and depreciation and amortization methods are reviewed periodically to ensure that the amounts, period and methods of depreciation and amortization are consistent with the expected pattern of economic benefits from items of property and equipment.

- 14 -
*SGVMC110511*
When property and equipment are retired or otherwise disposed of, the cost of the related accumulated depreciation and amortization and accumulated provision for impairment losses, if any, are removed from the accounts and any resulting gain or loss is credited to or charged against current operations.
Impairment of Non-financial Assets The Group assesses at each reporting date whether there is an indication that an asset may be impaired. If any such indication exists, or when annual impairment testing for an asset is required, the Group makes an estimate of the asset’s recoverable amount. An asset’s recoverable amount is the higher of an asset’s or cash-generating unit’s fair value less costs to sell and its value in use and is determined for an individual asset, unless the asset does not generate cash inflows that are largely independent of those from other assets or groups of assets. Where the carrying amount of an asset exceeds its recoverable amount, the asset is considered impaired and is written down to its recoverable amount. In assessing value in use, the estimated future cash flows are discounted to their present value using a pre-tax discount rate that reflects current market assessments of the time value of money and the risks specific to the asset. Impairment losses of continuing operations are recognized in the consolidated statement of income in those expense categories consistent with the function of the impaired asset.
An assessment is made at each reporting date as to whether there is any indication that previously recognized impairment losses may no longer exist or may have decreased. If such indication exists, the recoverable amount is estimated. A previously recognized impairment loss is reversed only if there has been a change in the estimates used to determine the asset’s recoverable amount since the last impairment loss was recognized. If that is the case the carrying amount of the asset is increased to its recoverable amount. That increased amount cannot exceed the carrying amount that would have been determined, net of depreciation, had no impairment loss been recognized for the asset in prior years. Such reversal is recognized in the consolidated statement of income unless the asset is carried at revalued amount, in which case, the reversal is treated as a revaluation increase. After such reversal the depreciation charge is adjusted in future periods to allocate the asset’s revised carrying amount, less any residual value, on a systematic basis over its remaining useful life.
The following criteria are also applied in assessing impairment of specific assets:
Investments in associates and jointly controlled entities After application of the equity method, the Group determines whether it is necessary to recognize any additional impairment loss with respect to the Group’s net investment in the investee companies. The Group determines at each balance sheet date whether there is any objective evidence that the investment in associates and joint ventures is impaired. If this is the case, the Group calculates the amount of impairment as being the difference between the fair value of the investee company and the carrying value and recognizes the amount in the consolidated statement of income.
Provisions Provisions are recognized when the Group has a present obligation (legal or constructive) as a result of a past event, it is probable that an outflow of resources embodying economic benefits will be required to settle the obligation and a reliable estimate can be made of the amount of the obligation. Where the Group expects a provision to be reimbursed, the reimbursement is

- 15 -
*SGVMC110511*
recognized as a separate asset but only when the reimbursement is virtually certain. If the effect of the time value of money is material, provisions are determined by discounting the expected future cash flows at a pre-tax rate that reflects current market assessments of the time value of money and, where appropriate, the risks specific to the liability. Where discounting is used, the increase in the provision due to the passage of time is recognized as interest expense. Provisions are reviewed at each consolidated balance sheet date and adjusted to reflect the current best estimate.
Revenue and Cost Recognition Real estate revenue and cost from completed projects is accounted for using the full accrual method. The percentage of completion method is used to recognize income from sales of projects where the Group has material obligations under the sales contract to complete the project after the property is sold. Under this method, revenue is recognized as the related obligations are fulfilled, measured principally on the basis of the estimated completion of a physical proportion of the contract work.
Any excess of collections over the recognized receivables are included in the “Accounts and other
payables” account in the liabilities section of the consolidated balance sheet.
Revenue from construction contracts included in the “Real estate” account in the consolidated statement of income are recognized using the percentage of completion method, measured principally on the basis of the estimated physical completion of the contract work.
Contract costs include all direct materials and labor costs and those indirect costs related to contract performance. Expected losses on contracts are recognized immediately when it is probable that the total contract costs will exceed total contract revenue. Changes in contract performance, contract conditions and estimated profitability, including those arising from contract penalty provisions, and final contract settlements which may result in revisions to estimated costs and gross margins are recognized in the year in which the changes are determined.
Rental income under noncancellable and cancellable leases on investment properties is recognized in the consolidated statement of income on a straight-line basis over the lease term and the terms of the lease, respectively, or based on a certain percentage of the gross revenue of the tenants, as provided under the terms of the lease contract.
Revenue from hotel operations of a subsidiary is recognized when services are rendered.
Revenue from banquets and other special events are recognized when the events take place.
Management fees from administration and property management and other fees are recognized when services are rendered.
Interest is recognized as it accrues (using the effective interest method that is the rate that exactly discounts estimated future cash receipts through the expected life of the financial instrument to the net carrying amount of the financial asset).
Dividend income is recognized when the Group’s right to receive the payment is established.

- 16 -
*SGVMC110511*
Share-based Payments The Company has equity-settled, share-based compensation plans with its employees.
PFRS 2 Options For options granted after November 7, 2002 that have not vested on or before January 1, 2005, the cost of equity-settled transactions with employees is measured by reference to the fair value at the date on which they are granted. The fair value is determined by using the Black-Scholes model, further details of which are given in Note 23.
The cost of equity-settled transactions is recognized, together with a corresponding increase in equity, over the period in which the performance conditions are fulfilled, ending on the date on which the relevant employees become fully entitled to the award (vesting date). The cumulative expense recognized for equity-settled transactions at each reporting date until the vesting date reflects the extent to which the vesting period has expired and the Group’s best estimate of the number of equity instrument that will ultimately vest. The income or expense for a period represents the movement in cumulative expense recognized as at the beginning and end of that period.
No expense is recognized for awards that do not ultimately vest, except for awards where vesting is conditional upon a market condition, which are treated as vesting irrespective of whether or not the market condition is satisfied, provided that all other performance conditions are satisfied.
Where the terms of an equity-settled award are modified, as a minimum, an expense is recognized as if the terms had not been modified. In addition, an expense is recognized for any increase in the value of the transaction as a result of the modification, as measured at the date of modification.
Where an equity-settled award is cancelled, it is treated as if it had vested on the date of cancellation, and any expense not yet recognized for the award is recognized immediately. However, if a new award is substituted for the cancelled award, and designated as a replacement award on the date that it is granted, the cancelled and new awards are treated as if they were a modification of the original award, as described in the previous paragraph.
Pre-PFRS 2 Options For options granted before November 7, 2002 that have vested before January 1, 2005, the intrinsic value of stock options determined as of grant date is recognized as expense over the vesting period.
The dilutive effect of outstanding options is reflected as additional share dilution in the computation of diluted earnings per share (see Note 22).
Employee Share Purchase Plans The Company has employee share purchase plan (ESOWN) which allows the grantees to purchase the Company’s shares at a discounted price. The Company recognizes the difference between the market price at the time of subscription and the subscription price as stock compensation expense over the holding period. Where the subscription receivable is payable over more than one year, the subscription price is adjusted for the time value and treated as additional stock compensation expense. For the unsubscribed share where the employees still have the option to subscribe in the future, these are accounted for as options.
- 17 -
*SGVMC110511*
Pension Cost Pension cost is actuarially determined using the projected unit credit method. This method reflects services rendered by employees up to the date of valuation and incorporates assumptions concerning employees’ projected salaries. Actuarial valuations are conducted with sufficient regularity, with option to accelerate when significant changes to underlying assumptions occur. Pension cost includes current service cost, interest cost, expected return on any plan assets, actuarial gains and losses and the effect of any curtailment or settlement.
The liability recognized in the consolidated balance sheet in respect of the defined benefit pension plans is the present value of the defined benefit obligation at the balance sheet date less the fair value of the plan assets. The defined benefit obligation is calculated annually by independent actuaries using the projected unit credit method. The present value of the defined benefit obligation is determined by discounting the estimated future cash outflows using risk-free interest rates that have terms to maturity approximating the terms of the related pension liability.
Actuarial gains and losses is recognized as income or expense if the cumulative unrecognized actuarial gains and losses at the end of the previous reporting period exceeded the greater of 10% of the present value of defined benefit obligation or 10% of the fair value of plan assets. These gains and losses are recognized over the expected average remaining working lives of the employees participating in the plans.
Commission Expense Commissions paid to sales or marketing agents on the sale of pre-completed real estate units are deferred when recovery is reasonably expected and are charged to expense in the period in which the related revenue is recognized as earned. Accordingly, when the percentage of completion method is used, commissions are likewise charged to expense in the period the related revenue is recognized. Commission expense is included in the “Real estate costs” account in the consolidated statement of income.
Borrowing Costs Borrowing costs are generally expensed as incurred. Interest and other financing costs incurred during the construction period on borrowings used to finance property development are capitalized as part of development costs (included in “Real estate inventories”, “Investment properties” and “Property and equipment” accounts in the consolidated balance sheet). Capitalization of borrowing costs commences when the activities to prepare the asset are in progress and expenditures and borrowing costs are being incurred. Capitalization of borrowing costs ceases when substantially all the activities necessary to prepare the asset for its intended use or sale are complete. If the carrying amount of the asset exceeds its recoverable amount, an impairment loss is recorded. Capitalized borrowing cost is based on applicable weighted average borrowing rate for those coming from general borrowings and the actual borrowing costs eligible for capitalization for funds borrowed specifically.
Deferred Income Taxes Deferred income tax is provided, using the balance sheet liability method, on all temporary differences, with certain exceptions, at the balance sheet date between the tax bases of assets and liabilities and their carrying amounts for financial reporting purposes.
- 18 -
*SGVMC110511*
Deferred tax liabilities are recognized for all taxable temporary differences, with certain exceptions. Deferred tax assets are recognized for all deductible temporary differences, carryforward benefits of unused tax credits from excess of minimum corporate income tax (MCIT) over the regular corporate income tax and unused net operating loss carryover (NOLCO), to the extent that it is probable that taxable profit will be available against which the deductible temporary differences and carryforward benefits of unused tax credits and NOLCO can be utilized.
Deferred tax liabilities are not provided on non-taxable temporary differences associated with investments in domestic subsidiaries, associates and interests in joint ventures.
The carrying amount of deferred tax assets is reviewed at each balance sheet date and reduced to the extent that it is no longer probable that sufficient taxable profit will be available to allow the deferred tax assets to be utilized. Unrecognized deferred tax assets are reassessed at each balance sheet date and are recognized to the extent that it has become probable that future taxable profit will allow the deferred tax asset to be recovered.
Deferred tax assets and liabilities are measured at the tax rates that are expected to apply to the period when the asset is realized or the liability is settled based on tax rates and tax laws that have been enacted or substantively enacted at the consolidated balance sheet date.
Deferred tax assets and liabilities are offset, if a legally enforceable right exists to set off current tax assets against current tax liabilities and the deferred income taxes relate to the same taxable entity and the same taxation authority.
Foreign Currency Transactions Each entity in the Group determines its own functional currency and items included in the financial statements of each entity are measured using that functional currency. Transactions in foreign currencies are initially recorded using the exchange rate at the date of the transactions. Monetary assets and liabilities denominated in foreign currencies are restated using the closing exchange rates prevailing at balance sheet dates. Exchange gains or losses arising from foreign exchange transactions are credited to or charged against operations for the year.
Operating Leases Leases where the lessor retains substantially all the risks and benefits of the ownership of the asset are classified as operating leases. Fixed lease payments under noncancellable leases are recognized on a straight-line basis over the lease term. Fixed and variable lease payments under cancellable leases are recognized based on the terms of the lease contract.
Earnings Per Share (EPS) Basic EPS is computed by dividing net income for the year attributable to common stockholders by the weighted average number of common shares issued and outstanding during the year adjusted for any subsequent stock dividends declared. Diluted EPS is computed by dividing net income for the year by the weighted average number of common shares issued and outstanding during the year after giving effect to assumed conversion of potential common shares.

- 19 -
*SGVMC110511*
Segment Reporting The Group’s operating businesses are organized and managed separately according to the nature of the products and services provided, with each segment representing a strategic business unit that offers different products and serves different markets. Financial information on business segments is presented in Note 25.
Contingencies Contingent liabilities are not recognized in the consolidated financial statements. They are disclosed unless the possibility of an outflow of resources embodying economic benefits is remote. Contingent assets are not recognized in the consolidated financial statements but disclosed when an inflow of economic benefits is probable.
Subsequent Events Post year-end events that provide additional information about the Group’s position at the balance sheet date (adjusting events) are reflected in the consolidated financial statements. Post year-end events that are not adjusting events are disclosed in the notes to the consolidated financial statements when material.
3. Significant Accounting Judgments and Estimates
The preparation of the accompanying financial statements in conformity with PFRS requires management to make estimates and assumptions that affect the amounts reported in the financial statements and accompanying notes. The estimates and assumptions used in the accompanying financial statements are based upon management’s evaluation of relevant facts and circumstances as of the date of the financial statements. Actual results could differ from such estimates.
Judgments In the process of applying the Group’s accounting policies, management has made the following judgments, apart from those involving estimations, which have the most significant effect on the amounts recognized in the consolidated financial statements:
Operating lease commitments - group as lessor The Group has entered into commercial property leases on its investment property portfolio. The Group has determined that it retains all significant risks and rewards of ownership of these properties which are leased out on operating leases.
Distinction between investment properties and owner-occupied properties The Group determines whether a property qualifies as investment property. In making its judgment, the Group considers whether the property generates cash flows largely independent of the other assets held by an entity. Owner-occupied properties generate cash flows that are attributable not only to property but also to the other assets used in the production or supply process.
- 20 -
*SGVMC110511*
Some properties comprise a portion that is held to earn rentals or for capital appreciation and another portion that is held for use in the production or supply of goods or services or for administrative purposes. If these portions cannot be sold separately as of balance sheet date, the property is accounted for as investment property only if an insignificant portion is held for use in the production or supply of goods or services or for administrative purposes. Judgment is applied in determining whether ancillary services are so significant that a property does not qualify as investment property. The Group considers each property separately in making its judgment.
Distinction between real estate inventories and land and improvements The Group determines whether a property will be classified as Real estate inventories or Land and improvements. In making this judgment, the Group considers whether the property will be sold in the normal operating cycle (Real estate inventories) or whether it will be retained as part of the Group’s strategic landbanking activities for development or sale in the medium or long-term (Land and improvements).
Impairment of AFS equity investments The Group treats AFS equity investments as impaired when there has been a significant or prolonged decline in the fair value below its cost or where other objective evidence of impairment exists. The determination of what is ‘significant’ or ‘prolonged’ requires judgment. The Group treats ‘significant’ generally as 20% or more and ‘prolonged’ as greater than 6 months for quoted equity securities. In addition, the Group evaluates other factors, including normal volatility in share price for quoted equities and the future cash flows and the discount factors for unquoted equities (see Note 10).
Contingencies The Group is currently involved in various legal proceedings. The estimate of the probable costs for the resolution of these claims has been developed in consultation with outside counsel handling the defense in these matters and is based upon an analysis of potential results. The Group currently does not believe that these proceedings will have a material effect on the Group’s financial position. It is possible, however, that future results of operations could be materially affected by changes in the estimates or in the effectiveness of the strategies relating to these proceedings (see Note 28).
Management’s Use of Estimates The key assumptions concerning the future and other key sources of estimation uncertainty at the balance sheet date, that have a significant risk of causing a material adjustment to the carrying amounts of assets and liabilities within the next financial year are discussed below.
Revenue and cost recognition The Group’s revenue recognition policies require management to make use of estimates and assumptions that may affect the reported amounts of revenues and costs. The Group’s revenue from real estate and construction contracts recognized based on the percentage of completion are measured principally on the basis of the estimated completion of a physical proportion of the contract work, and by reference to the actual costs incurred to date over the estimated total costs of the project.

- 21 -
*SGVMC110511*
Estimating allowance for doubtful accounts
The Group maintains allowance for doubtful accounts based on the result of the individual and collective assessment under PAS 39. Under the individual assessment, the Group is required to obtain the present value of estimated cash flows using the receivable’s original effective interest rate. Impairment loss is determined as the difference between the receivables, carrying balance and the computed present value. Factors considered in individual assessment are payment history, past due status and term. The collective assessment would require the Group to classify its receivables based on the credit risk characteristics (customer type, payment history, past-due status and term) of the customers. Impairment loss is then determined based on historical loss experience of the receivables grouped per credit risk profile. Historical loss experience is adjusted on the basis of current observable data to reflect the effects of current conditions that did not affect the period on which the historical loss experience is based and to remove the effects of conditions in the historical period that do not exist currently. The methodology and assumptions used for the individual and collective assessments are based on management’s judgment and estimate. Therefore, the amount and timing of recorded expense for any period would differ depending on the judgments and estimates made for the year. See Note 6 for the related balances.
Evaluation of asset impairment The Group reviews investments in associates and jointly controlled entities, investment properties, property and equipment and other noncurrent assets for impairment of value. This includes considering certain indications of impairment such as significant changes in asset usage, significant decline in assets’ market value, obsolescence or physical damage of an asset, plans in the real estate projects, significant underperformance relative to expected historical or projected future operating results and significant negative industry or economic trends.
As described in the accounting policy, the Group estimates the recoverable amount as the higher of the net selling price and value in use. In determining the present value of estimated future cash flows expected to be generated from the continued use of the assets, the Group is required to make estimates and assumptions that may affect investments in associates and jointly controlled entities, investment properties, property and equipment, and other noncurrent assets. See Notes 9, 11 and 12 for the related balances.
Estimating useful lives of property and equipment and investment properties The Group estimates the useful lives of its property and equipment and investment properties based on the period over which these assets are expected to be available for use. The estimated useful lives of property and equipment and investment properties are reviewed at least annually and are updated if expectations differ from previous estimates due to physical wear and tear and technical or commercial obsolescence on the use of these assets. It is possible that future results of operations could be materially affected by changes in estimates brought about by changes in factors mentioned above. See Notes 11 and 12 for the related balances.
Deferred tax assets The Group reviews the carrying amounts of deferred taxes at each balance sheet date and reduces deferred tax assets to the extent that it is no longer probable that sufficient taxable profit will be available to allow all or part of the deferred tax assets to be utilized. However, there is no assurance that the Group will generate sufficient taxable profit to allow all or part of deferred tax assets to be utilized. The Group looks at its projected performance in assessing the sufficiency of future taxable income. See Note 18 for the related balances.

- 22 -
*SGVMC110511*
Share-based payments
The expected life of the options is based on the expected exercise behavior of the stock option holders and is not necessarily indicative of the exercise patterns that may occur. The volatility is based on the average historical price volatility which may be different from the expected volatility of the shares of stock of the Group. See Note 23 for the related balances.
Estimating pension obligation and other retirement benefits The determination of the Group’s obligation and cost for pension and other retirement benefits is dependent on selection of certain assumptions used by actuaries in calculating such amounts. Those assumptions are described in Note 21 and include among others, discount rates, expected returns on plan assets and rates of salary increase. While the Group believes that the assumptions are reasonable and appropriate, significant differences in actual experience or significant changes in assumptions materially affect retirement obligations. See Note 21 for the related balances.
Fair value of financial instruments Where the fair values of financial assets and financial liabilities recorded in the consolidated balance sheet cannot be derived from active markets, they are determined using internal valuation techniques using generally accepted market valuation models. The inputs to these models are taken from observable markets where possible, but where this is not feasible, estimates are used in establishing fair values. These estimates may include considerations of liquidity, volatility, and correlation. Certain financial assets and liabilities were initially recorded at its fair value by using the discounted cash flow methodology (see Notes 6, 15 and 24).
4. Cash and Cash Equivalents
This account consists of:
2007 2006 (In Thousands) Cash on hand and in banks P=2,799,775 P=946,541 Cash equivalents 8,472,131 3,684,050 P=11,271,906 P=4,630,591
Cash in banks earns interest at the respective bank deposit rates. Cash equivalents are short-term investments that are made for varying periods of up to three months depending on the immediate cash requirements of the Group, and earn interest at the respective short-term investment rates.
5. Short-term Investments and FVPL Financial Assets
Short-term investments consist of:
2007 2006 (In Thousands) Investment Management Account (IMA) P=1,400,000 P=– Money market placements 635,606 2,927,928 P=2,035,606 P=2,927,928

- 23 -
*SGVMC110511*
The IMA is a six-month investment made through a Directional IMA with a local bank where funds are invested in special depository accounts with the Bangko Sentral ng Pilipinas.
Money market placements are short-term investments made for varying periods of more than three months and up to six months and earn interest at the respective short-term investment rates.
FVPL financial assets consist of:
2007 2006 (In Thousands) Treasury bonds P=318,018 P=134,224 Treasury bills – 1,816,866 P=318,018 P=1,951,090
Treasury bonds and treasury bills have yields to maturity of 5.7% and 5.1% to 5.6% in 2007 and 2006, respectively. The Group recognized unrealized gain on these FVPL financial assets amounting to P=18.0 million and P=43.8 million in 2007 and 2006, respectively (see Note 17).
6. Accounts and Notes Receivable
Accounts and notes receivable are summarized as follows:
2007 2006 (In Thousands) Trade Residential development P=7,374,149 P=5,273,262 Shopping centers 974,771 1,089,744 Construction contracts 820,485 385,539 Management fees 189,381 140,487 Corporate business 159,007 445,020 Others 156,014 582,927 Related parties (see Note 20) 1,691,706 1,331,504 Advances to other companies 478,213 652,431 Advances to contractors 1,382,401 659,842 Accrued receivable 88,952 109,471 Receivable from employees 268,121 200,071 Others 1,630,095 2,008,675 15,213,295 12,878,973 Less allowance for doubtful accounts 174,109 107,777 15,039,186 12,771,196 Less noncurrent portion 3,475,306 2,126,672 P=11,563,880 P=10,644,524
The classes of trade receivables of the Group are as follows:
• Residential development - pertains to receivables from the sale of high-end, upper middle-
income and affordable residential lots and units and leisure community developments • Shopping centers - pertains to lease receivables of retail space and land

- 24 -
*SGVMC110511*
• Construction contracts - pertains to receivables from third-party construction projects • Management fees - pertains to facility management fees receivables • Corporate business - pertains to lease receivables of office and factory buildings and
receivables from the sale of office buildings and industrial lots
The sales contract receivables, included under residential receivables, are collectible in monthly installments over a period of one to ten years and bear annual interest rates ranging from 2.5% to 18.0% computed on the diminishing balance of the principal. Titles to real estate properties are not transferred to the buyers until full payment has been made.
Corporate business receivables are collectible on a monthly or quarterly basis depending on the terms of the lease contracts.
Receivables from construction contracts, shopping centers and management fees are due within 30 days upon billing.
Receivable from related parties, advances and accrued receivables are due and demandable.
Advances to contractors are recouped upon every progress billing payment depending on the
percentage of accomplishment.
Receivables amounting to P=32.3 million as of December 31, 2007 were impaired and fully provided for. Movements in the allowance for doubtful accounts are as follows:
2007
Shopping
centers Residential Construction
Contracts Management
Fees Trade-Others Others Total Balance at beginning of year P=84,629 P=13,008 P=2,301 P=3,166 P=3,872 P=801 P=107,777 Provisions during the period 27,995 – – 715 7,355 53,800 89,865 Reversals – – – (715) – – (715) Accounts written off (22,684) – – – (134) – (22,818) Balance at end of year P=89,940 P=13,008 P=2,301 P=3,166 P=11,093 P=54,601 P=174,109 Individually impaired P=9,801 P=9,555 P=2,301 P=3,166 P=7,355 P=53,875 P=86,053 Collectively impaired 80,139 3,453 – – 3,738 726 88,056 Total P=89,940 P=13,008 P=2,301 P=3,166 P=11,093 P=54,601 P=174,109 Gross amounts of loans, individually
determined to be impaired, before deducting any individually assessed impairment allowance P=9,801 P=9,555 P=2,301 P=3,166 P=7,355 P=101,395 P=133,573
2006
Shopping centers Residential
Construction Contracts
Management Fees Trade-Others Others Total
Balance at beginning of year P=84,629 P=13,008 P=2,301 P=3,166 P=4,869 P=801 P=108,774 Provisions during the period – – – – – 13,367 13,367 Accounts written off – – – – (997) (13,367) (14,364) Balance at end of year P=84,629 P=13,008 P=2,301 P=3,166 P=3,872 P=801 P=107,777 Individually impaired P=4,490 P=9,555 P=2,301 P=3,166 P=– P=75 P=19,587 Collectively impaired 80,139 3,453 – – 3,872 726 88,190 Total P=84,629 P=13,008 P=2,301 P=3,166 P=3,872 P=801 P=107,777 Gross amounts of loans, individually
determined to be impaired, before deducting any individual assessed impairment allowance P=4,490 P=9,555 P=2,301 P=3,166 P=– P=75 P=19,587

- 25 -
*SGVMC110511*
As of December 31, 2007 and 2006, receivables with a nominal amount of P=5.7 billion and P=4.7 billion, respectively, were recorded initially at fair value. The fair value of the receivables was obtained by discounting future cash flows using the applicable rates of similar types of instruments. The unamortized discount amounted to P=768.7 million and P=695.9 million as of December 31, 2007 and 2006, respectively.
7. Real Estate Inventories
This account consists of:
2007 2006 (In Thousands) Subdivision land for sale At cost P=3,429,873 P=3,758,013 At NRV 867,126 867,126 Condominium, residential and commercial units
for sale - at cost 2,341,030 3,070,123 Club shares - at cost 57,978 40,325 P=6,696,007 P=7,735,587
Inventories recognized as cost of sales amounted to P=8.5 billion and P=9.2 billion in 2007 and 2006, respectively, and were included under “Real estate costs” in the consolidated statements of income.
8. Other Current Assets
This account consists of:
2007 2006 (In Thousands) Prepaid expenses P=1,269,662 P=430,579 Value-added input tax 520,498 452,966 Materials and supplies 95,959 64,748 Derivative asset 59,026 – Others 148,891 462,741 P=2,094,036 P=1,411,034
As of December 31, 2007, the Company has an outstanding nondeliverable forward contract with notional amount of US$25.0 million and a forward rate of P=44.48 which will mature on October 30, 2008. Fair value gain amounted to P=59.0 million, which is recognized as derivative asset (see Note 17).

- 26 -
*SGVMC110511*
9. Investments in Associates and Jointly Controlled Entities
2007 2006 (In Thousands) Acquisition cost P=6,626,635 P=7,082,008 Accumulated equity in net earnings: Balance at beginning of year 1,709,209 1,477,287 Equity in net earnings during the year 787,209 306,233 Disposal of equity investment – (1,532) Dividends received during the year (84,377) (72,779) Balance at end of year 2,412,041 1,709,209 P=9,038,676 P=8,791,217
The Group’s equity in the net assets of associates and jointly controlled entities and the related
percentages of ownership are shown below.
Percentages of Ownership Carrying Amounts 2007 2006 2007 2006 (In Thousands) Emerging City Holdings, Inc. (ECHI)* 50% 50% P=2,485,455 P=2,233,447 Cebu Holdings, Inc. (CHI) and subsidiaries 47 47 1,809,631 1,724,036 North Triangle Depot Commercial
Corporation (NTDCC) 49 49 1,541,375 1,044,047 Berkshires Holdings, Inc. (BHI)* 50 50 1,065,161 957,161 Bonifacio Land Corp. (BLC) 8 8 933,591 854,801 Alabang Commercial Corporation (ACC)* 50 50 573,052 490,502 ARCH Asian Partners L.P. 8 – 316,078 – ALI Property Partners Holdings Corporation
(APPHC)* 60 60 237,828 129,771 Lagoon Development Corporation 30 30 61,450 60,702 KHI-ALI Manila, Inc. (KAMI) 82 – 11,144 – ARCH Capital Management Co. Ltd.
(ARCH Capital)* 17 22 2,108 1,296,750 KHI Manila Property, Inc. 20 – 1,803 – P=9,038,676 P=8,791,217
*Jointly controlled entities
The Group’s investments accounted for under joint venture amounted to P=4,363.6 million and P=3,810.9 million as of December 31, 2007 and 2006, respectively.
The fair value of investment in CHI for which there is a published price quotation amounted to P=3,266.5 million and P=2,903.5 million as of December 31, 2007 and 2006, respectively.
- 27 -
*SGVMC110511*
Financial information on the Company’s proportionate share in its jointly controlled entities
(amounts in thousands) follows:
ECHI and Subsidiaries 2007 2006 Current assets P=12,840,915 P=12,535,787 Noncurrent assets 8,863,005 8,338,641 Total assets 21,703,920 20,874,428 Current liabilities 2,331,978 1,719,027 Noncurrent liabilities 1,171,967 1,117,296 Total liabilities 3,503,945 2,836,323 Net operating revenue 3,218,021 1,024,590 Costs and expenses 2,760,760 964,450 Net income 457,261 60,140
BHI 2007 2006 Current assets P=263 P=259 Noncurrent assets 1,631,803 1,417,290 Total assets 1,632,066 1,417,549 Current liabilities 885 816 Noncurrent liabilities – – Total liabilities 885 816 Net operating revenue 7,022,140 2,056,304 Costs and expenses 5,644,642 1,866,953 Net income 1,377,498 189,351
ACC 2007 2006 Current assets P=196,111 P=126,146 Noncurrent assets 651,257 673,778 Total assets 847,368 799,924 Current liabilities 257,496 305,699 Noncurrent liabilities 128,171 115,074 Total liabilities 385,667 420,773 Net operating revenue 323,757 292,590 Costs and expenses 213,553 209,626 Net income 110,204 82,964
Financial information on the Company’s significant associates (amounts in thousands, except earnings per share) follows:
CHI and subsidiaries 2007 2006 Total assets P=5,318,765 P=4,717,217 Total liabilities 1,335,582 908,456 Net operating revenue 1,277,481 1,035,690 Costs and expenses 984,731 809,083 Net income 292,750 226,607 Earnings per share 0.13 0.18
- 28 -
*SGVMC110511*
NTDCC 2007 2006 Total assets P=7,373,178 P=5,567,313 Total liabilities 4,398,176 3,640,403 Net operating revenue 789,542 – Costs and expenses 764,134 – Net income 25,408 –
BLC and Subsidiaries 2007 2006 Total assets P=43,677,672 P=41,513,107 Total liabilities 6,998,162 5,693,892 Net operating revenue 6,436,042 1,959,189 Costs and expenses 5,521,276 1,488,603 Net income 914,766 470,586
Investment in ECHI and BHI On April 17, 2003, the following transactions have been consummated pursuant to the terms and conditions of the Assignment Agreement (Agreement), dated February 8, 2003, among the Company, Evergreen Holdings, Inc. (EHI), Greenfield Development Corporation and Larouge, B.V. (Larouge), as amended, and the Agreement, dated November 23, 2002, among the Company, EHI and Metro Pacific Corporation (MPC) as amended:
(a) The assignment to the Company and EHI of the rights and obligations of Larouge under the
loan agreement between Larouge and MPC, pursuant to which, Larouge extended MPC a loan in the principal amount of US$90.0 million, together with all the rights, title and interests of Larouge in the pledge constituted on 50.38% of the outstanding shares in BLC. The consideration paid by the Company and EHI for such assignment was approximately US$90 million, subject in part to foreign exchange adjustment.
(b) The assignment to the Company and EHI (acting in this instance through the joint venture
corporation, Columbus Holdings, Inc. (Columbus) of the controlling interest in BLC representing 50.38% of BLC’s outstanding capital stock. This assignment was effected by MPC under a dacion en pago arrangement, and included an assignment of payables of BLC in the principal amount of P=655.0 million together with its underlying security in the form of shares in Fort Bonifacio Development Corporation (FBDC) representing 5.55% of its outstanding capital stock.
The Agreement, as amended, also provides for the constitution of a pledge over 5% of BLC’s unencumbered shares as security for contingent liabilities and breach of representation and warranties. The pledge lien over the 5% BLC shares shall continue to subsist until the third anniversary of the closing date.
The Company and EHI jointly hold the 50.38% (56.19% beneficial interest) equity interest in BLC through ECHI and BHI. The Company and EHI assigned the notes receivable from MPC to ECHI and BHI, which acquired the shares of stock of Columbus. Columbus directly owns the 50.38% interest in BLC. BLC owns 55% interest in FBDC, the primary developer of certain areas in Fort Bonifacio Global City for residential, commercial and business development.

- 29 -
*SGVMC110511*
Columbus accounted for the acquisition of the 50.38% interest in BLC using the purchase method. The fair value of the identifiable consolidated assets and liabilities of BLC as at April 17, 2003, the date of acquisition, amounted to about P=5.6 billion resulting in a negative goodwill of P=1.4 billion.
The Company has 4.32% direct investment in BLC and 4.33% through Regent which are accounted for using the equity method because the Company has significant influence over BLC.
Investment in NTDCC In 2004, the Company acquired additional 30.89% interest in NTDCC in exchange for the Company’s interest in two companies valued at P=320.1 million and cash amounting to P=280.0 million. The Company infused additional cash to NTDCC amounting to P=112.0 million for an additional 1.85% equity interest in the latter.
A series of capital calls was made by NTDCC amounting to P=484.8 million in 2007.
NTDCC was granted development rights by MRT Development Co. to construct and operate a shopping center under certain terms and conditions until the end of a 50-year lease term renewable for another 25 years. NTDCC officially started the construction of the shopping center in 2005. The shopping center became operational on May 16, 2007.
Investment in ARCH Capital In 2006, the Company and AC entered into a Shareholders’ Agreement with ARCH Capital and Great ARCH Co. Limited, wherein the Company and AC committed to invest a total of US$75.0 million in a private equity fund that will explore property markets in Asia, excluding Japan and Philippines. On the same year, an Amendment and Adherence Agreement was entered into by the same parties, together with Fine State Group Limited (Fine State) and Green Horizons Holdings Limited (Green Horizons), a wholly-owned subsidiary of First Longfield, transferring the interests of AC and the Company in ARCH Capital into Fine State and Green Horizons, respectively. Fine State and Green Horizons are 100% owned Hong Kong subsidiaries of AC and the Company, respectively.
The Company (through Green Horizons) and AC (through Fine State) both have interests in the fund management company, ARCH Capital, which is tasked to raise third party capital and pursue investments for the Fund. As of December 31, 2007, the Company (through Green Horizon) and AC (through Fine State) owned a combined interest in ARCH Capital of 50%.
In 2007, the private equity fund, called ARCH Asian Partners, L.P. (Fund) was established. As at December 31, 2007, the Fund achieved its final closing, resulting in a total investor commitment of US$330.0 million. As a result, portion of the funds disbursed by the Company and AC and invested into the Fund have been returned in 2007, reducing the Company’s overall capital invested to P=214.5 million as of December 31, 2007.
The Company and AC exercise significant influence over the Fund by virtue of their interest in the general partner and in ARCH Capital. Accordingly, the Company and AC account for their investments in the Fund using the equity method of accounting.
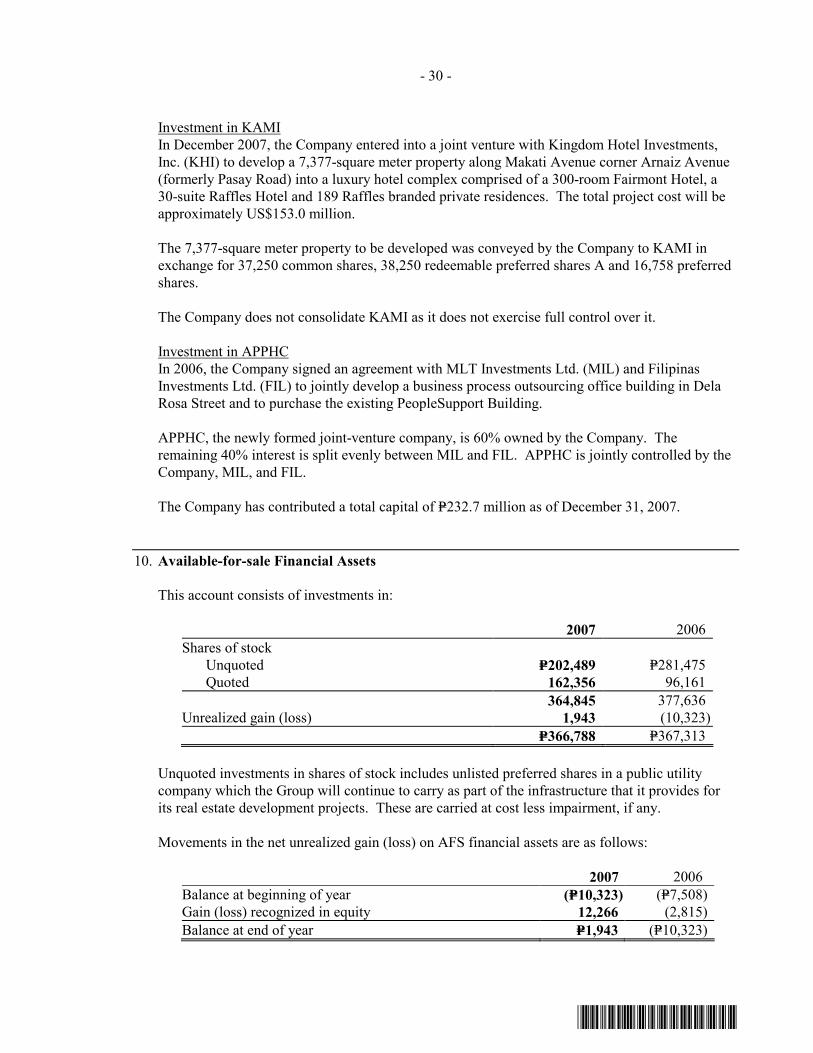
- 30 -
*SGVMC110511*
Investment in KAMI In December 2007, the Company entered into a joint venture with Kingdom Hotel Investments, Inc. (KHI) to develop a 7,377-square meter property along Makati Avenue corner Arnaiz Avenue (formerly Pasay Road) into a luxury hotel complex comprised of a 300-room Fairmont Hotel, a 30-suite Raffles Hotel and 189 Raffles branded private residences. The total project cost will be approximately US$153.0 million.
The 7,377-square meter property to be developed was conveyed by the Company to KAMI in exchange for 37,250 common shares, 38,250 redeemable preferred shares A and 16,758 preferred shares.
The Company does not consolidate KAMI as it does not exercise full control over it.
Investment in APPHC In 2006, the Company signed an agreement with MLT Investments Ltd. (MIL) and Filipinas Investments Ltd. (FIL) to jointly develop a business process outsourcing office building in Dela Rosa Street and to purchase the existing PeopleSupport Building.
APPHC, the newly formed joint-venture company, is 60% owned by the Company. The remaining 40% interest is split evenly between MIL and FIL. APPHC is jointly controlled by the Company, MIL, and FIL.
The Company has contributed a total capital of P=232.7 million as of December 31, 2007.
10. Available-for-sale Financial Assets This account consists of investments in:
2007 2006 Shares of stock Unquoted P=202,489 P=281,475 Quoted 162,356 96,161 364,845 377,636 Unrealized gain (loss) 1,943 (10,323) P=366,788 P=367,313
Unquoted investments in shares of stock includes unlisted preferred shares in a public utility
company which the Group will continue to carry as part of the infrastructure that it provides for its real estate development projects. These are carried at cost less impairment, if any.
Movements in the net unrealized gain (loss) on AFS financial assets are as follows:
2007 2006 Balance at beginning of year (P=10,323) (P=7,508) Gain (loss) recognized in equity 12,266 (2,815) Balance at end of year P=1,943 (P=10,323)

- 31 -
*SGVMC110511*
11. Investment Properties
The movements in this account are:
2007 2006 (In Thousands) Cost January 1 P=17,274,275 P=16,836,444 Additions 844,576 534,367 Transfers 1,133,034 649,594 Disposals (577,676) (746,130) December 31 18,674,209 17,274,275 Accumulated Depreciation and Amortization January 1 4,241,513 3,627,732 Depreciation and amortization 858,280 677,191 Disposals (218,434) (63,410) December 31 4,881,359 4,241,513 Net Book Value P=13,792,850 P=13,032,762
Certain parcels of land are leased to several individuals and corporations. Some of the lease contracts provide, among others, that within a certain period from the expiration of the contracts, the lessee will have to demolish and remove any and all improvements (like buildings) introduced or built within the leased properties. Otherwise, the lessor will cause the demolition and removal thereof and charge the cost to the lessee unless the lessor occupies and appropriates the same for its use and benefit.
The aggregate fair value of the Group’s investment properties amounted to P=121.4 billion and P=122.0 billion as of December 31, 2007 and 2006, respectively.
The fair value of the investment properties were determined by independent professionally qualified appraisers. The fair value represents the amount at which the assets could be exchanged between a knowledgeable, willing buyer and knowledgeable, willing seller in an arm’s length transaction at the date of valuation.
The value of the land and condominium units was arrived at by the Market Data Approach. In this approach, the value of the land and condominium units is based on sales and listings of comparable property registered within the vicinity. The technique of this approach requires the establishing of comparable property by reducing reasonable comparative sales and listings to a common denominator. This is done by adjusting the differences between the subject property and those actual sales and listings regarded as comparable. The properties used as basis of comparison are situated within the immediate vicinity of the subject property.
Consolidated rental income from investment properties amounted to P=5.5 billion in 2007, P=5.3 billion in 2006 and P=4.2 billion in 2005. Consolidated direct operating expenses arising from the investment properties amounted to P=2.4 billion in 2007, P=2.1 billion in 2006 and P=2.0 billion in 2005.
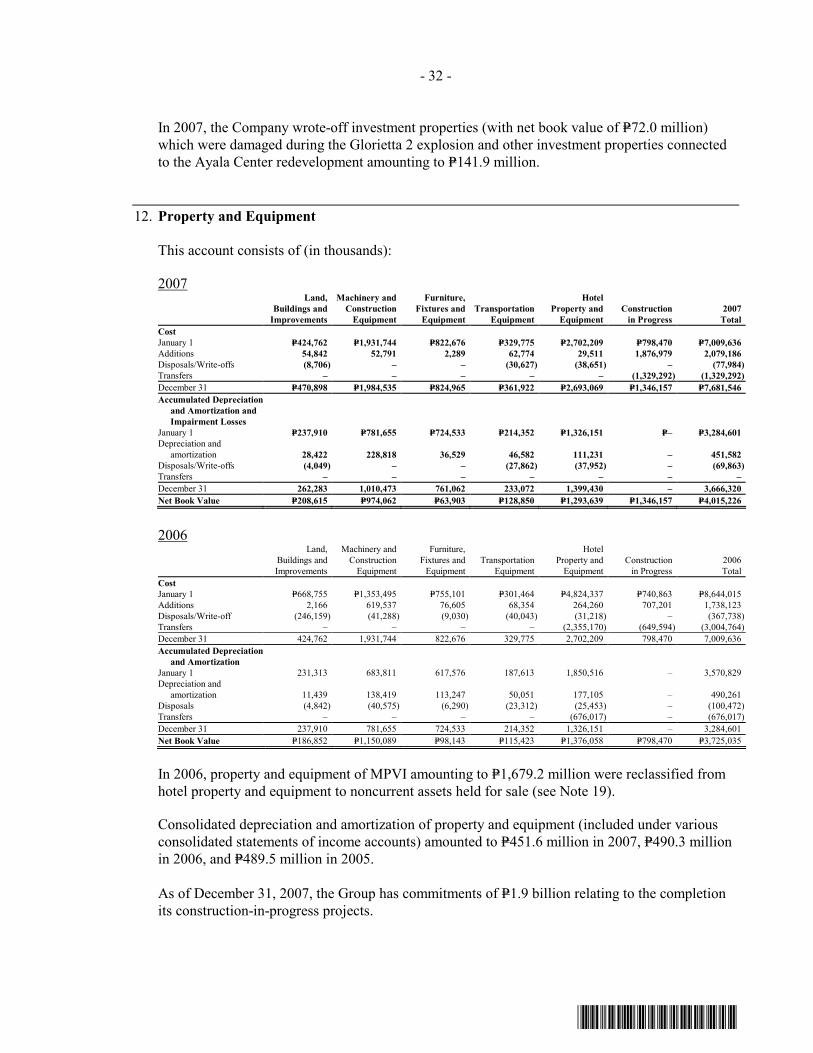
- 32 -
*SGVMC110511*
In 2007, the Company wrote-off investment properties (with net book value of P=72.0 million) which were damaged during the Glorietta 2 explosion and other investment properties connected to the Ayala Center redevelopment amounting to P=141.9 million.
12. Property and Equipment
This account consists of (in thousands):
2007
Land, Buildings and
Improvements
Machinery and Construction
Equipment
Furniture, Fixtures and
Equipment Transportation
Equipment
Hotel Property and
Equipment Construction
in Progress 2007
Total Cost January 1 P=424,762 P=1,931,744 P=822,676 P=329,775 P=2,702,209 P=798,470 P=7,009,636 Additions 54,842 52,791 2,289 62,774 29,511 1,876,979 2,079,186 Disposals/Write-offs (8,706) – – (30,627) (38,651) – (77,984) Transfers – – – – – (1,329,292) (1,329,292) December 31 P=470,898 P=1,984,535 P=824,965 P=361,922 P=2,693,069 P=1,346,157 P=7,681,546 Accumulated Depreciation
and Amortization and Impairment Losses
January 1 P=237,910 P=781,655 P=724,533 P=214,352 P=1,326,151 P=– P=3,284,601 Depreciation and
amortization 28,422 228,818 36,529 46,582 111,231 – 451,582 Disposals/Write-offs (4,049) – – (27,862) (37,952) – (69,863) Transfers – – – – – – – December 31 262,283 1,010,473 761,062 233,072 1,399,430 – 3,666,320 Net Book Value P=208,615 P=974,062 P=63,903 P=128,850 P=1,293,639 P=1,346,157 P=4,015,226
2006
Land, Buildings and Improvements
Machinery and Construction
Equipment
Furniture, Fixtures and
Equipment Transportation
Equipment
Hotel Property and
Equipment Construction
in Progress 2006 Total
Cost January 1 P=668,755 P=1,353,495 P=755,101 P=301,464 P=4,824,337 P=740,863 P=8,644,015 Additions 2,166 619,537 76,605 68,354 264,260 707,201 1,738,123 Disposals/Write-off (246,159) (41,288) (9,030) (40,043) (31,218) – (367,738) Transfers – – – – (2,355,170) (649,594) (3,004,764) December 31 424,762 1,931,744 822,676 329,775 2,702,209 798,470 7,009,636 Accumulated Depreciation
and Amortization January 1 231,313 683,811 617,576 187,613 1,850,516 – 3,570,829 Depreciation and
amortization 11,439 138,419 113,247 50,051 177,105 – 490,261 Disposals (4,842) (40,575) (6,290) (23,312) (25,453) – (100,472) Transfers – – – – (676,017) – (676,017) December 31 237,910 781,655 724,533 214,352 1,326,151 – 3,284,601 Net Book Value P=186,852 P=1,150,089 P=98,143 P=115,423 P=1,376,058 P=798,470 P=3,725,035
In 2006, property and equipment of MPVI amounting to P=1,679.2 million were reclassified from hotel property and equipment to noncurrent assets held for sale (see Note 19).
Consolidated depreciation and amortization of property and equipment (included under various consolidated statements of income accounts) amounted to P=451.6 million in 2007, P=490.3 million in 2006, and P=489.5 million in 2005.
As of December 31, 2007, the Group has commitments of P=1.9 billion relating to the completion its construction-in-progress projects.
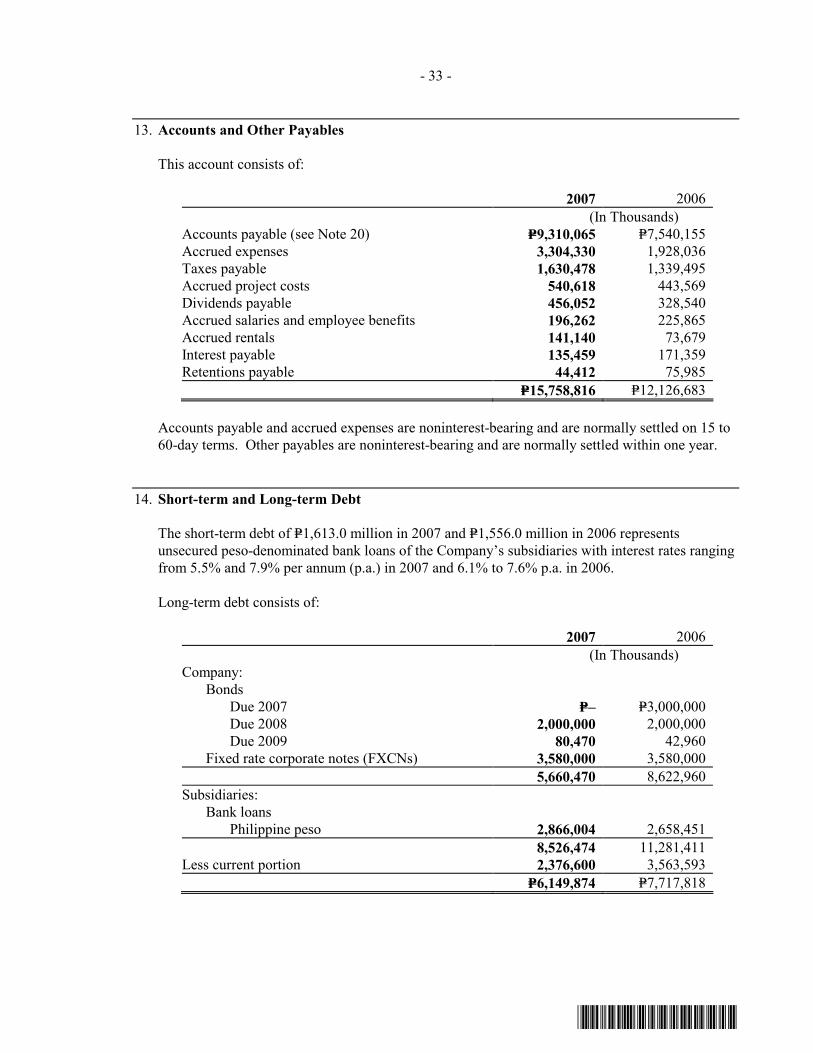
- 33 -
*SGVMC110511*
13. Accounts and Other Payables This account consists of:
2007 2006 (In Thousands) Accounts payable (see Note 20) P=9,310,065 P=7,540,155 Accrued expenses 3,304,330 1,928,036 Taxes payable 1,630,478 1,339,495 Accrued project costs 540,618 443,569 Dividends payable 456,052 328,540 Accrued salaries and employee benefits 196,262 225,865 Accrued rentals 141,140 73,679 Interest payable 135,459 171,359 Retentions payable 44,412 75,985 P=15,758,816 P=12,126,683
Accounts payable and accrued expenses are noninterest-bearing and are normally settled on 15 to
60-day terms. Other payables are noninterest-bearing and are normally settled within one year. 14. Short-term and Long-term Debt
The short-term debt of P=1,613.0 million in 2007 and P=1,556.0 million in 2006 represents unsecured peso-denominated bank loans of the Company’s subsidiaries with interest rates ranging from 5.5% and 7.9% per annum (p.a.) in 2007 and 6.1% to 7.6% p.a. in 2006.
Long-term debt consists of:
2007 2006 (In Thousands) Company: Bonds Due 2007 P=– P=3,000,000 Due 2008 2,000,000 2,000,000 Due 2009 80,470 42,960 Fixed rate corporate notes (FXCNs) 3,580,000 3,580,000 5,660,470 8,622,960 Subsidiaries: Bank loans Philippine peso 2,866,004 2,658,451 8,526,474 11,281,411 Less current portion 2,376,600 3,563,593 P=6,149,874 P=7,717,818

- 34 -
*SGVMC110511*
The Company
Philippine Peso 5-Year Bonds due 2007 The Company issued in 2002 P=3.0 billion bonds due 2007 with interest at 200 bps over benchmark 91-day T-Bills based on secondary market bids (PDST-F). The bonds were fully paid when it matured in April 2007.
Philippine Peso 5-Year Bonds due 2008 In 2003, the Company issued P=2.0 billion bonds due 2008 with fixed and floating rate tranches. The fixed-rate bonds carry a coupon of 10.75% p.a. and have a nominal principal amount of P=1.0 billion. The floating rate bonds, also worth P=1.0 billion, bear a margin of 125 bps over benchmark 91-day PDST-F and is re-priced quarterly.
The Philippine Rating Services Corporation (PhilRatings) assigned a PRS Aaa rating on the bonds due 2007 and 2008 indicating that the issues have the smallest degree of investment risk. Interest payments are protected by a large or by an exceptionally stable margin and principal is assured. While the various protective elements are likely to change, such changes as can be visualized are most unlikely to impair the fundamentally strong position of such issues. PRS Aaa is the highest credit rating possible on PhilRatings’ rating scales for long-term issuances.
Philippine Peso Homestarter Bonds due 2009 The Company launched in March 2006 its Homestarter Bonds of up to P=169.2 million with fixed interest rate of 5% p.a.. The Homestarter Bonds are being issued monthly in a series for a period of thirty-six (36) months with final maturity in March 2009. On maturity date, the principal amount of the bond is redeemable with the accrued interest. Should the bondholder decide to purchase an Ayala Land property, he is entitled to an additional 10% of the aggregate face value of the bond as bonus credit which together with the principal and accrued interest can be applied as downpayment. As of end 2007 and 2006, outstanding Homestarter Bonds amounted to P=80.5 million and P=43.0 million, respectively.
Philippine Peso 5-, 7- and 10-Year FXCNs due 2011, 2013 and 2016 In 2006, the Company issued P=3.0 billion FXCNs consisting of 5-, 7- and 10-year notes issued to various financial institutions and will mature on various dates up to 2016. The FXCNs bear fixed interest rates ranging from 7.25% to 7.75% p.a. depending on the term of the notes.
Philippine Peso 10-Year FXCNs due 2012 The Company also has an outstanding P=580.0 million 10-year FXCNs with fixed interest rate of 14.875% p.a. issued in 2002 and due 2012. The Company may redeem all (but not part only) of the FXCNs on the 7th anniversary.
Subsidiaries The subsidiaries’ loans will mature on various dates up to 2014 with floating interest rates at 100 bps to 150 bps spread over benchmark 91-day PDST-F or PDST-R1 and fixed interest rates of 7.75% to 12.69% p.a.. Certain subsidiaries’ loans are secured by mortgages on real estate properties, hotel properties and equipment and leasehold rights with a total carrying value of P=612.2 million and P=653.0 million as of 2007 and 2006, respectively.
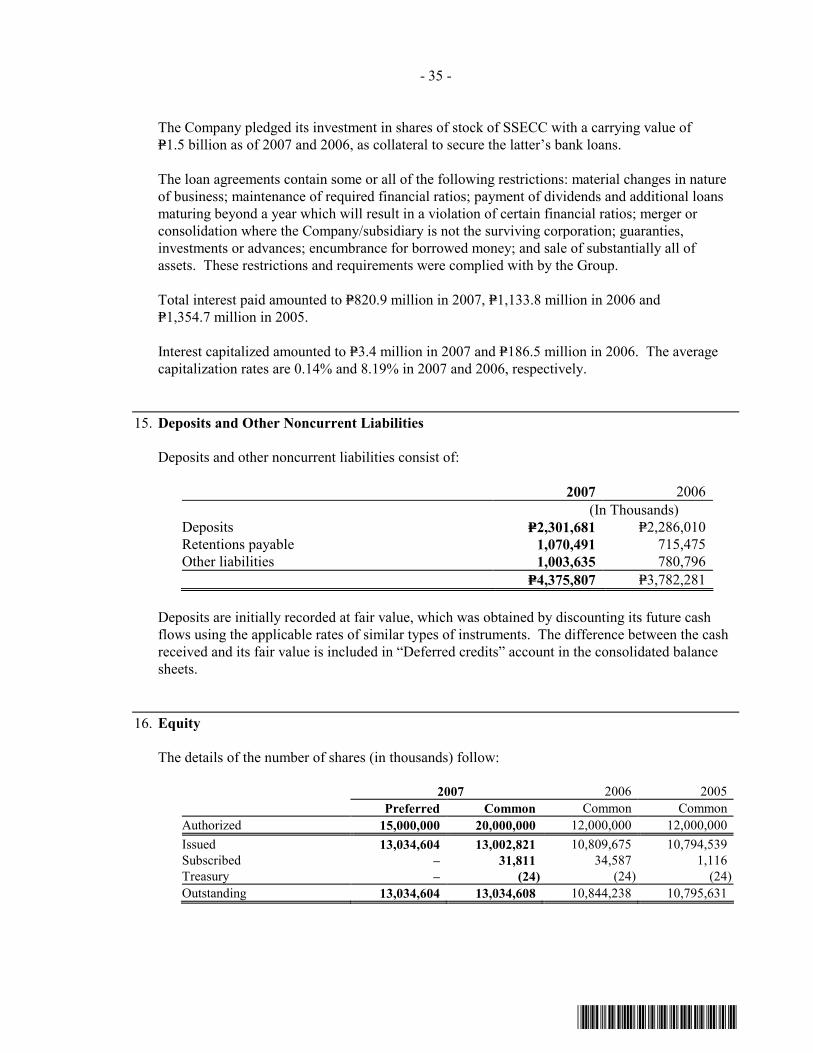
- 35 -
*SGVMC110511*
The Company pledged its investment in shares of stock of SSECC with a carrying value of P=1.5 billion as of 2007 and 2006, as collateral to secure the latter’s bank loans.
The loan agreements contain some or all of the following restrictions: material changes in nature of business; maintenance of required financial ratios; payment of dividends and additional loans maturing beyond a year which will result in a violation of certain financial ratios; merger or consolidation where the Company/subsidiary is not the surviving corporation; guaranties, investments or advances; encumbrance for borrowed money; and sale of substantially all of assets. These restrictions and requirements were complied with by the Group.
Total interest paid amounted to P=820.9 million in 2007, P=1,133.8 million in 2006 and P=1,354.7 million in 2005.
Interest capitalized amounted to P=3.4 million in 2007 and P=186.5 million in 2006. The average capitalization rates are 0.14% and 8.19% in 2007 and 2006, respectively.
15. Deposits and Other Noncurrent Liabilities
Deposits and other noncurrent liabilities consist of:
2007 2006 (In Thousands) Deposits P=2,301,681 P=2,286,010 Retentions payable 1,070,491 715,475 Other liabilities 1,003,635 780,796 P=4,375,807 P=3,782,281
Deposits are initially recorded at fair value, which was obtained by discounting its future cash flows using the applicable rates of similar types of instruments. The difference between the cash received and its fair value is included in “Deferred credits” account in the consolidated balance sheets.
16. Equity
The details of the number of shares (in thousands) follow:
2007 2006 2005 Preferred Common Common Common Authorized 15,000,000 20,000,000 12,000,000 12,000,000 Issued 13,034,604 13,002,821 10,809,675 10,794,539 Subscribed – 31,811 34,587 1,116 Treasury – (24) (24) (24) Outstanding 13,034,604 13,034,608 10,844,238 10,795,631
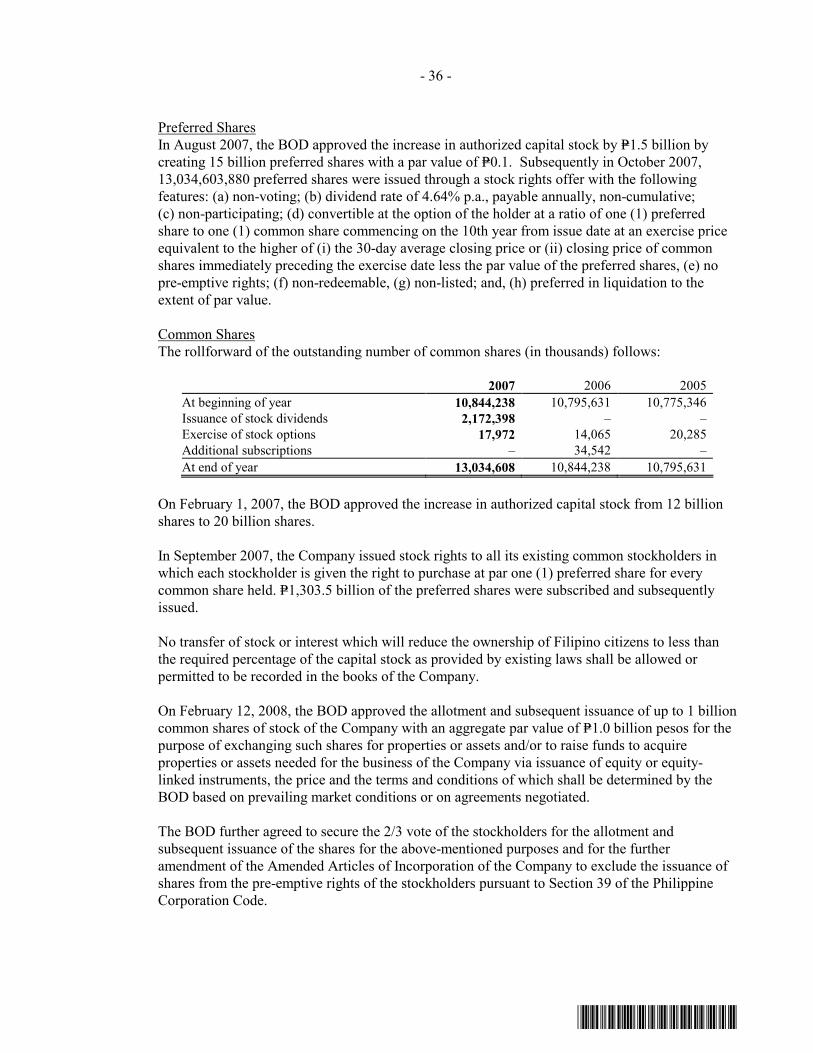
- 36 -
*SGVMC110511*
Preferred Shares In August 2007, the BOD approved the increase in authorized capital stock by P=1.5 billion by creating 15 billion preferred shares with a par value of P=0.1. Subsequently in October 2007, 13,034,603,880 preferred shares were issued through a stock rights offer with the following features: (a) non-voting; (b) dividend rate of 4.64% p.a., payable annually, non-cumulative; (c) non-participating; (d) convertible at the option of the holder at a ratio of one (1) preferred share to one (1) common share commencing on the 10th year from issue date at an exercise price equivalent to the higher of (i) the 30-day average closing price or (ii) closing price of common shares immediately preceding the exercise date less the par value of the preferred shares, (e) no pre-emptive rights; (f) non-redeemable, (g) non-listed; and, (h) preferred in liquidation to the extent of par value.
Common Shares The rollforward of the outstanding number of common shares (in thousands) follows:
2007 2006 2005 At beginning of year 10,844,238 10,795,631 10,775,346 Issuance of stock dividends 2,172,398 – – Exercise of stock options 17,972 14,065 20,285 Additional subscriptions – 34,542 – At end of year 13,034,608 10,844,238 10,795,631
On February 1, 2007, the BOD approved the increase in authorized capital stock from 12 billion shares to 20 billion shares.
In September 2007, the Company issued stock rights to all its existing common stockholders in which each stockholder is given the right to purchase at par one (1) preferred share for every common share held. P=1,303.5 billion of the preferred shares were subscribed and subsequently issued.
No transfer of stock or interest which will reduce the ownership of Filipino citizens to less than the required percentage of the capital stock as provided by existing laws shall be allowed or permitted to be recorded in the books of the Company.
On February 12, 2008, the BOD approved the allotment and subsequent issuance of up to 1 billion common shares of stock of the Company with an aggregate par value of P=1.0 billion pesos for the purpose of exchanging such shares for properties or assets and/or to raise funds to acquire properties or assets needed for the business of the Company via issuance of equity or equity-linked instruments, the price and the terms and conditions of which shall be determined by the BOD based on prevailing market conditions or on agreements negotiated.
The BOD further agreed to secure the 2/3 vote of the stockholders for the allotment and subsequent issuance of the shares for the above-mentioned purposes and for the further amendment of the Amended Articles of Incorporation of the Company to exclude the issuance of shares from the pre-emptive rights of the stockholders pursuant to Section 39 of the Philippine Corporation Code.

- 37 -
*SGVMC110511*
Retained Earnings The BOD approved the declaration of 20 percent stock dividends in 2007 which is equivalent to 2.1 bi1llion shares based on 10.8 billion shares as of December 31, 2006.
The BOD approved the declaration and payment from unappropriated retained earnings of cash dividend of P=0.06 per share in 2007, P=0.17 per share in 2006 and P=0.30 per share in 2005.
Retained earnings of P=6.0 billion are appropriated for future expansion. Retained earnings also
include undistributed net earnings amounting to P=6,166.2 million, P=5,612.4 million and P=5,411.4 million as of December 31, 2007, 2006 and 2005, respectively, representing accumulated equity in the net earnings of subsidiaries, associates and joint ventures, which are not available for dividend declaration until received in the form of dividends from the investees.
Retained earnings are further restricted for the payment of dividends to the extent of the cost of the shares held in treasury.
Capital Management
The primary objective of the Group’s capital management policy is to ensure that debt and equity capital are mobilized efficiently to support business objectives and maximize shareholder value. The Group establishes the appropriate capital structure for each business line that properly reflects its premier credit rating and allows it the financial flexibility, while providing it sufficient cushion to absorb cyclical industry risks.
The Group manages its capital structure and makes adjustments to it, in the light of changes in economic conditions. It monitors capital using leverage ratios on both a gross debt and net debt basis. As of December 31, 2007 and 2006, the Group had the following ratios:
2007 2006 Debt to equity 22.0% 31.6% Net debt to equity (8.0%) 8.0%
Debt consists of short-term and long-term debt. Net debt includes short-term and long-term debt less cash and cash equivalents, short-term investments and FVPL financial assets. The Group considers as capital the equity attributable to equity holders of the Company less unrealized gain (loss) on available-for-sale financial assets.
17. Other Income and Costs and Expenses
Other income consists of:
2007 2006 2005 (In Thousands) Gain on sale of investments and others - net P=1,212,022 P=739,330 P=2,706,318 Fair value gain on derivative asset (see Note 8) 59,026 – – Management and marketing fees 215,285 272,094 147,953 P=1,486,333 P=1,011,424 P=2,854,271

- 38 -
*SGVMC110511*
On December 13, 2007, the Company sold 16,758 of its preferred shares in KAMI to Kingdom Manila B.V., which resulted in a gain of P=1,004.0 million. Gain on disposal of investments amounted to P=758.6 million in 2006 and P=2,354.6 million in 2005.
Manpower costs included in consolidated statements of income are as follows:
2007 2006 2005 (In Thousands) Included in: Cost of: Real estate P=720,217 P=596,866 P=488,337 Hotel operations 199,664 237,833 232,131 General and administrative expenses 1,459,474 1,512,769 1,237,720 P=2,379,355 P=2,347,468 P=1,958,188
Depreciation and amortization expense included in consolidated statements of income are as follows:
2007 2006 2005 (In Thousands) Included in: Cost of: Real estate P=1,040,753 P=844,976 P=711,555 Hotel operations 111,231 74,659 65,945 General and administrative expenses 158,473 147,645 140,375 P=1,310,457 P=1,067,280 P=917,875
Hotel operations expenses consist of:
2007 2006 2005 (In Thousands) Food and beverage P=245,912 P=206,866 P=204,201 Property operations, maintenance and
energy costs 147,667 84,203 83,593 Depreciation and amortization 111,231 74,659 65,945 Rooms 79,480 104,525 90,469 Telephone and other department costs 14,518 16,781 18,752 Entertainment, amusement and recreation 6,335 5,150 2,461 Others 307,887 229,340 244,231 P=913,030 P=721,524 P=709,652
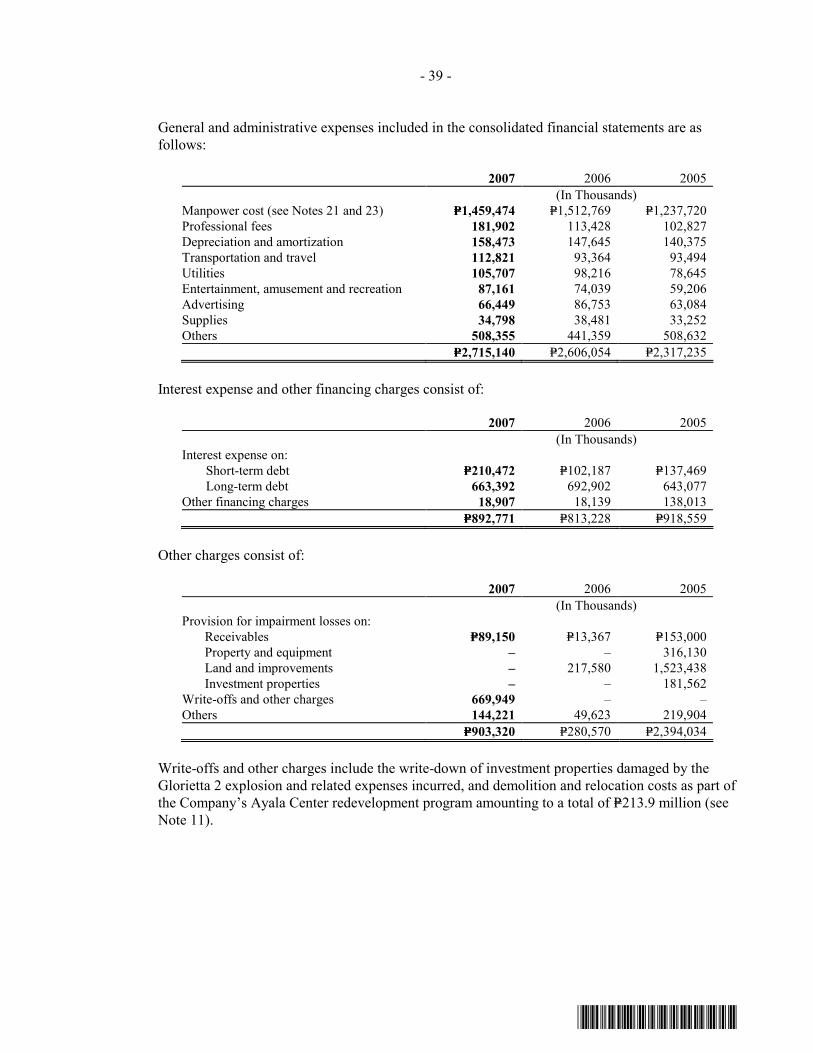
- 39 -
*SGVMC110511*
General and administrative expenses included in the consolidated financial statements are as follows:
2007 2006 2005 (In Thousands) Manpower cost (see Notes 21 and 23) P=1,459,474 P=1,512,769 P=1,237,720 Professional fees 181,902 113,428 102,827 Depreciation and amortization 158,473 147,645 140,375 Transportation and travel 112,821 93,364 93,494 Utilities 105,707 98,216 78,645 Entertainment, amusement and recreation 87,161 74,039 59,206 Advertising 66,449 86,753 63,084 Supplies 34,798 38,481 33,252 Others 508,355 441,359 508,632 P=2,715,140 P=2,606,054 P=2,317,235
Interest expense and other financing charges consist of:
2007 2006 2005 (In Thousands) Interest expense on: Short-term debt P=210,472 P=102,187 P=137,469 Long-term debt 663,392 692,902 643,077 Other financing charges 18,907 18,139 138,013 P=892,771 P=813,228 P=918,559
Other charges consist of:
2007 2006 2005 (In Thousands) Provision for impairment losses on:
Receivables P=89,150 P=13,367 P=153,000 Property and equipment – – 316,130 Land and improvements – 217,580 1,523,438 Investment properties – – 181,562
Write-offs and other charges 669,949 – – Others 144,221 49,623 219,904 P=903,320 P=280,570 P=2,394,034
Write-offs and other charges include the write-down of investment properties damaged by the
Glorietta 2 explosion and related expenses incurred, and demolition and relocation costs as part of the Company’s Ayala Center redevelopment program amounting to a total of P=213.9 million (see Note 11).

- 40 -
*SGVMC110511*
18. Income Taxes
The components of deferred taxes as of December 31, 2007 and 2006 are as follows: Net deferred tax assets:
2007 2006 (In Thousands) Deferred tax assets on: Allowance for probable losses P=662,727 P=660,985 Difference between tax and book basis of
accounting for real estate transactions 391,709 248,256 Retirement benefits 184,483 187,983 Outstanding share-based payments 47,541 104,679 NOLCO 59,016 34,759 MCIT 12,403 1,946 Others 57,070 230,886 1,414,949 1,469,494 Deferred tax liabilities on: Capitalized customs duties, interest and
other expenses (723,404) (686,616) Unrealized gain on forward contracts (20,659) – (744,063) (686,616) Net deferred tax assets P=670,886 P=782,878
Net deferred tax liabilities:
2007 2006 (In Thousands) Deferred tax assets on: Difference between tax and book basis of
accounting for real estate transactions P=59,352 P=58,070 NOLCO 49,026 47,967 Retirement benefits 7,591 6,416 Allowance for probable losses 1,236 4,977 MCIT – 1,904 117,205 119,334 Deferred tax liabilities on: Capitalized customs duties, interest and
other expenses (122,576) (290,728) Excess of financial realized gross profit
over taxable realized gross profit (109,072) (244,112) (231,648) (534,840) Net deferred tax liabilities (P=114,443) (P=415,506)
Certain subsidiaries of the Company have NOLCO amounting to P=431.8 million and P=752.8 million as of December 31, 2007 and 2006, respectively, which were not recognized. Further, a subsidiary also has deductible temporary differences arising from unrealized gain on real estate sales amounting to P=4.8 million and P=143.3 million as of December 31, 2007 and 2006,

- 41 -
*SGVMC110511*
respectively, which were also not recognized. Deferred tax assets are recognized only to the extent that taxable income will be available against which the deferred tax assets can be used. The subsidiaries will recognize a previously unrecognized deferred tax assets to the extent that it has become probable that future taxable income will allow the deferred tax asset to be recovered.
As of December 31, 2007, carryover NOLCO and MCIT that can be claimed as deduction from future taxable income or used as deductions against income tax liabilities are as follows:
NOLCO:
Year Incurred Amount Used/Expired Balance Expiry Year (In Thousands) 2004 P=536,322 P=536,322 P=– 2007 2005 304,867 – 304,867 2008 2006 333,493 – 333,493 2009 2007 102,083 – 102,083 2010 P=1,276,765 P=536,322 P=740,443
MCIT:
Year Incurred Amount Used/Expired Balance Expiry Year (In Thousands) 2004 P=5,023 P=5,023 P=– 2007 2005 9,886 7,709 2,177 2008 2006 1,363 – 1,363 2009 2007 8,863 – 8,863 2010 P=25,135 P=12,732 P=12,403
At December 31, 2007 and 2006, deferred income tax liabilities have not been recognized on the undistributed earnings of certain subsidiaries, associates or joint ventures since such amounts are not taxable.
There are no income tax consequences attaching the payment of dividends by the Company and its subsidiaries to the shareholders of the Company.
A reconciliation between the statutory and the effective income tax rates follows:
2007 2006 2005 Statutory income tax rate 35.00% 35.00% 32.50% Tax effect of: Interest income and capital gains taxed at
lower rates (8.39) (6.44) (15.64) Income subjected to lower income
tax rates (see Note 26) (1.86) (1.91) (0.68) Equity in net earnings of investees (3.52) (1.81) (1.60) Effect of change in statutory income
tax rate – – (1.99) Others - net 4.48 3.47 0.07 Effective income tax rate 25.71% 28.31% 12.66%
Republic Act (RA) No. 9337

- 42 -
*SGVMC110511*
RA No. 9337 was enacted into law amending various provisions in the existing 1997 National Internal Revenue Code. Among the reforms introduced by the said RA, which became effective on November 1, 2005, are as follows:
• Increase in the corporate income tax rate from 32% to 35% with a reduction thereof to 30%
beginning January 1, 2009; • Increases in value-added tax (VAT) rate from 10% to 12% effective February 1, 2006 as
authorized by the Philippine President pursuant to the recommendation of the Secretary of Finance;
• Revised invoicing and reporting requirements for VAT; • Expanded scope of transactions subject to VAT; and • Provide thresholds and limitations on the amounts of VAT credits that can be claimed.
19. Noncurrent Assets Held for Sale Ayala Hotels, Inc., together with Ocmador Philippines B. V., agreed to sell Makati Property
Ventures, Inc. (MPVI), to DBS Trustee Ltd. (Trustee of Ascott Residence Trust) on March 22, 2007 (Closing date). In 2007, total cash received from the sale amounted to P=983.2 million. The Company recognized a net gain amounting to P=598.7 million as a result of the consummation of the sale.
The results of MPVI for 2006 and 2005 are presented below:
2006 2005 (In Thousands) Revenue from hotel operations P=733,261 P=673,147 Interest, fees and other investment income 12,871 12,177 746,132 685,324 Hotel cost and expenses 339,457 304,054 Depreciation 102,446 102,673 General administrative expenses 23,475 42,661 Interest and other financing charges 39,527 47,283 Provision for income tax 85,969 57,974 590,874 554,645 Income associated with assets held for sale P=155,258 P=130,679
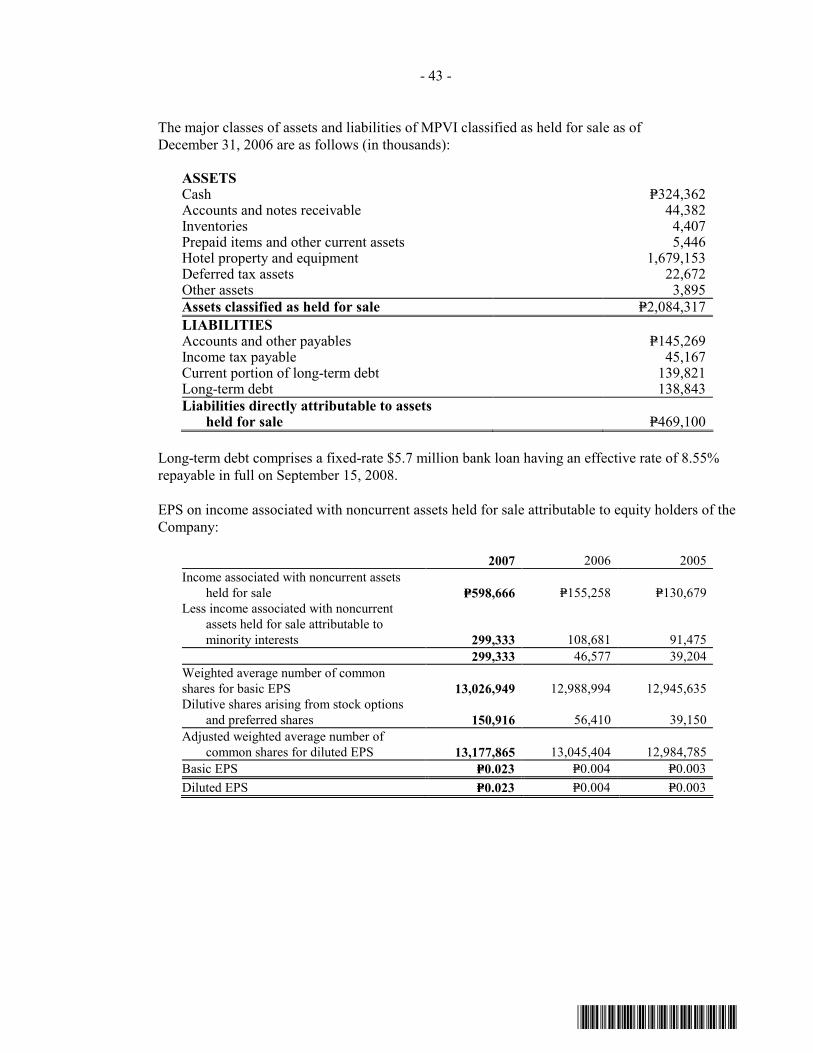
- 43 -
*SGVMC110511*
The major classes of assets and liabilities of MPVI classified as held for sale as of December 31, 2006 are as follows (in thousands):
ASSETS Cash P=324,362 Accounts and notes receivable 44,382 Inventories 4,407 Prepaid items and other current assets 5,446 Hotel property and equipment 1,679,153 Deferred tax assets 22,672 Other assets 3,895 Assets classified as held for sale P=2,084,317 LIABILITIES Accounts and other payables P=145,269 Income tax payable 45,167 Current portion of long-term debt 139,821 Long-term debt 138,843 Liabilities directly attributable to assets
held for sale P=469,100 Long-term debt comprises a fixed-rate $5.7 million bank loan having an effective rate of 8.55%
repayable in full on September 15, 2008.
EPS on income associated with noncurrent assets held for sale attributable to equity holders of the Company:
2007 2006 2005 Income associated with noncurrent assets
held for sale P=598,666 P=155,258 P=130,679 Less income associated with noncurrent
assets held for sale attributable to minority interests 299,333 108,681 91,475
299,333 46,577 39,204 Weighted average number of common shares for basic EPS 13,026,949 12,988,994 12,945,635 Dilutive shares arising from stock options and preferred shares 150,916 56,410 39,150 Adjusted weighted average number of
common shares for diluted EPS 13,177,865 13,045,404 12,984,785 Basic EPS P=0.023 P=0.004 P=0.003 Diluted EPS P=0.023 P=0.004 P=0.003

- 44 -
*SGVMC110511*
20. Related Party Transactions In its regular conduct of business, the Group has entered into transactions with associates and
other related parties principally consisting of advances and reimbursement of expenses, purchase and sale of real estate properties, construction contracts, and development, management, underwriting, marketing, leasing and administrative service agreements. Sales and purchases of goods and services to and from related parties are made at normal market prices.
The effects of the foregoing are shown under the appropriate accounts in the consolidated
financial statements as follows:
2007 2006 2005 (In Thousands) Revenue Associates and jointly controlled entities P=944,073 P=426,005 P=212,323 Other related parties 12,968 38,245 203,500 P=957,041 P=464,250 P=415,823
2007 2006 (In Thousands) Receivable from Related Parties Parent Company P=29,171 P=16,744 Associates and jointly controlled entities 1,575,531 1,290,413 Other related parties 87,004 24,347 P=1,691,706 P=1,331,504
2007 2006 (In Thousands) Payable to Related Parties Parent Company P=945 P=3,019 Associates and jointly controlled entities 360,660 534,391 Other related parties 688 1,101 P=362,293 P=538,511
Amounts owed by related parties consist of promissory notes issued by BLC, which were
assigned by MPC to the Company and EHI; and the advances subsequently made by the Company to FBDC to fund the completion of the Bonifacio Ridge project and to BLC to finance the costs to be incurred in relation to its restructuring program. These notes and advances are due and demandable and bear interest at the rate of 12% to 14% p.a..
Compensation of key management personnel by benefit type follows:
2007 2006 2005 (In Thousands) Short-term employee benefits P=114,379 P=113,427 P=94,132 Share-based payments (see Note 23) 59,586 85,963 31,577 Post-employment benefits (see Note 21) 3,308 3,587 3,413 P=177,273 P=202,977 P=129,122

- 45 -
*SGVMC110511*
21. Retirement Plan The Group has funded, noncontributory tax-qualified defined benefit type of retirement plans
covering substantially all of their employees. In 2007, the benefits are based on a defined benefit formula, while previously, the benefits are generally based on defined contribution formula with minimum lump-sum guarantee of 1.5 months’ basic salary per year of service.
The Group’s annual contributions to their respective plans consist principally of payments
covering the current service cost for the year and the required funding relative to the guaranteed minimum benefits as applicable.
The components of pension expense (included in manpower costs under “General and administrative expenses”) in the consolidated statements of income are as follows:
2007 2006 2005 (In Thousands) Current service cost P=120,836 P=129,798 P=170,744 Interest cost on benefit obligation 41,704 82,231 61,143 Expected return on plan assets (53,210) (53,356) (7,175) Net actuarial losses (gains) (346) 9,775 (1,134) Past service cost 98,539 – 2,706 Total pension expense P=207,523 P=168,448 P=226,284 Actual return on plan assets P=104,177 P=50,045 P=11,025
The funded status and amounts recognized in the consolidated balance sheets for the pension plan as of December 31, 2007 and 2006 are as follows:
2007 2006 (In Thousands) Benefit obligations P=1,574,083 P=1,389,916 Plan assets (1,428,976) (1,382,179) 145,107 7,737 Unrecognized net actuarial gains 69,051 84,191 Unrecognized past service cost (38,321) – Liability recognized in the consolidated
balance sheets P=175,837 P=91,928
Changes in the present value of the defined benefit obligation are as follows:
2007 2006 2005 (In Thousands) Balance at January 1 P=1,389,916 P=1,489,168 P=1,213,067 Interest cost 41,704 82,231 61,143 Current service cost 120,836 129,798 170,744 Past service cost 136,860 – 2,706 Curtailments 1,369 – – Benefits paid (180,994) (111,454) (75,277) Actuarial losses (gains) 64,392 (199,827) 116,785 Balance at December 31 P=1,574,083 P=1,389,916 P=1,489,168
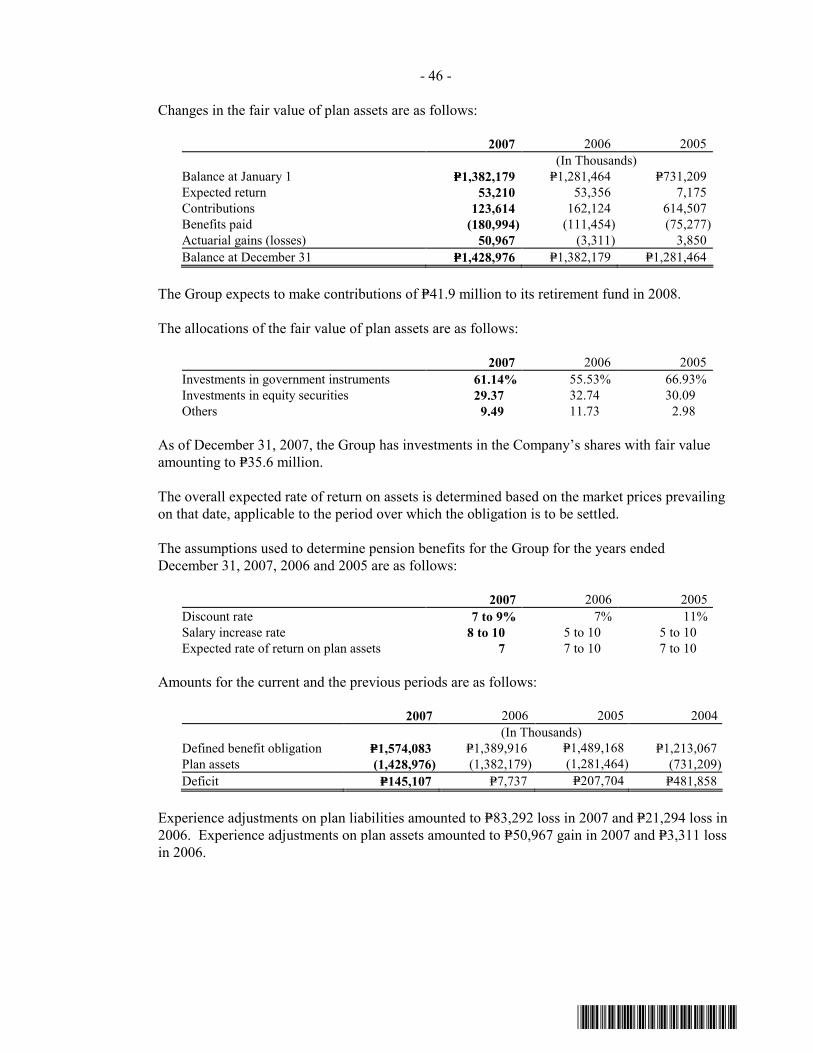
- 46 -
*SGVMC110511*
Changes in the fair value of plan assets are as follows:
2007 2006 2005 (In Thousands) Balance at January 1 P=1,382,179 P=1,281,464 P=731,209 Expected return 53,210 53,356 7,175 Contributions 123,614 162,124 614,507 Benefits paid (180,994) (111,454) (75,277) Actuarial gains (losses) 50,967 (3,311) 3,850 Balance at December 31 P=1,428,976 P=1,382,179 P=1,281,464
The Group expects to make contributions of P=41.9 million to its retirement fund in 2008.
The allocations of the fair value of plan assets are as follows:
2007 2006 2005 Investments in government instruments 61.14% 55.53% 66.93% Investments in equity securities 29.37 32.74 30.09 Others 9.49 11.73 2.98
As of December 31, 2007, the Group has investments in the Company’s shares with fair value amounting to P=35.6 million.
The overall expected rate of return on assets is determined based on the market prices prevailing on that date, applicable to the period over which the obligation is to be settled.
The assumptions used to determine pension benefits for the Group for the years ended December 31, 2007, 2006 and 2005 are as follows:
2007 2006 2005 Discount rate 7 to 9% 7% 11% Salary increase rate 8 to 10 5 to 10 5 to 10 Expected rate of return on plan assets 7 7 to 10 7 to 10
Amounts for the current and the previous periods are as follows:
2007 2006 2005 2004 (In Thousands) Defined benefit obligation P=1,574,083 P=1,389,916 P=1,489,168 P=1,213,067 Plan assets (1,428,976) (1,382,179) (1,281,464) (731,209) Deficit P=145,107 P=7,737 P=207,704 P=481,858
Experience adjustments on plan liabilities amounted to P=83,292 loss in 2007 and P=21,294 loss in
2006. Experience adjustments on plan assets amounted to P=50,967 gain in 2007 and P=3,311 loss in 2006.

- 47 -
*SGVMC110511*
22. Earnings Per Share
The following tables present information necessary to compute EPS (in thousands except EPS):
EPS on net income attributable to equity holders of the Company:
2007 2006 2005 Net income P=4,386,362 P=3,865,602 P=3,616,673 Weighted average number of common shares
for basic EPS 13,026,949 12,988,994 12,945,635 Dilutive shares arising from stock options and preferred shares 150,916 56,410 39,150 Adjusted weighted average number of
common shares for diluted EPS 13,177,865 13,045,404 12,984,785 Basic EPS P=0.34 P=0.30 P=0.28 Diluted EPS P=0.33 P=0.30 P=0.28
EPS on income before income associated with noncurrent assets held for sale attributable to equity holders of the Company:
2007 2006 2005 Income before income associated with
noncurrent assets held for sale P=4,496,882 P=4,078,594 P=3,854,752 Less income before income associated
with noncurrent assets held for sale associated to minority interests 409,853 259,569 277,283
P=4,087,029 P=3,819,025 P=3,577,469 Weighted average number of common shares
for basic EPS 13,026,949 12,988,994 12,945,635 Dilutive shares arising from stock options and preferred shares 150,916 56,410 39,150 Adjusted weighted average number of
common shares for diluted EPS 13,177,865 13,045,404 12,984,785 Basic EPS P=0.31 P=0.29 P=0.28 Diluted EPS P=0.31 P=0.29 P=0.28
23. Stock Option and Ownership Plans
The Company has stock option plans for key officers (Executive Stock Option Plan - ESOP) and employees ESOWN covering 2.5% of the Company’s authorized capital stock. The grantee is selected based on certain criteria like outstanding performance over a three-year period.
The ESOP grantees may exercise in whole or in part the vested allocation in accordance with the vesting percentage and vesting schedule stated in the ESOP. Also, the grantee must be an employee of the Company or any of its subsidiaries during the 10-year option period. In case the grantee retires, he is given 3 years to exercise his vested and unvested options. In case the grantee resigns, he is given 90 days to exercise his vested options.
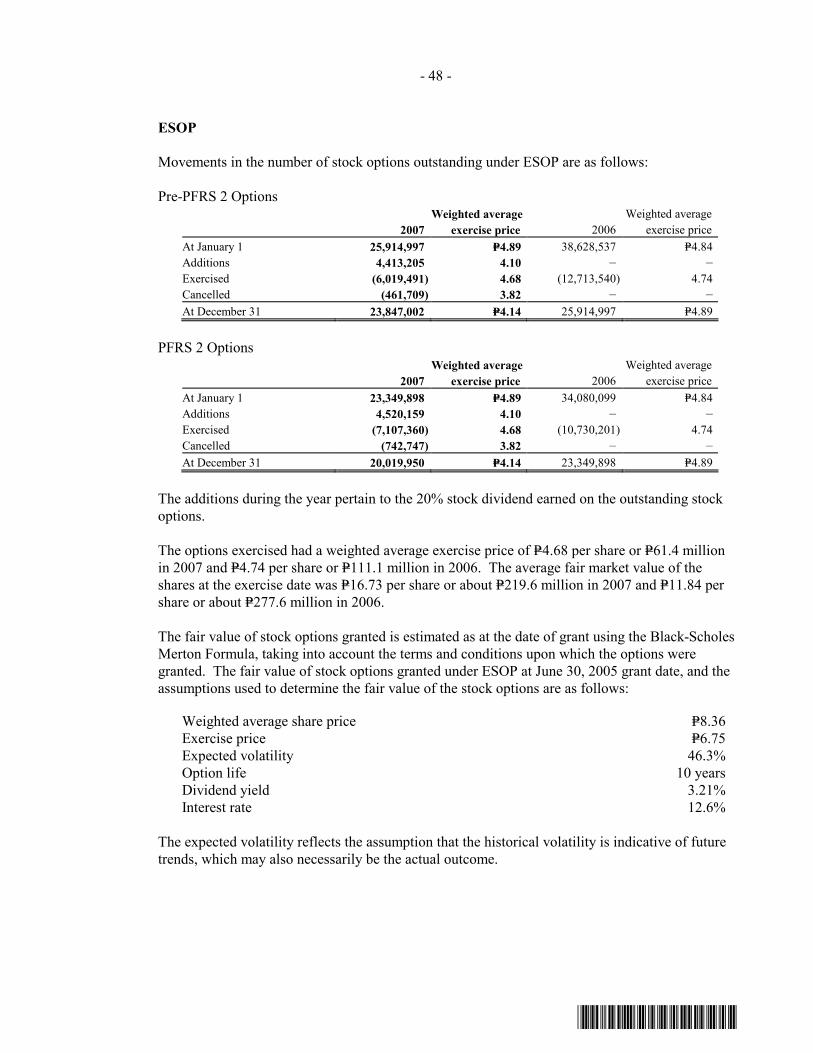
- 48 -
*SGVMC110511*
ESOP
Movements in the number of stock options outstanding under ESOP are as follows:
Pre-PFRS 2 Options
2007 Weighted average
exercise price 2006 Weighted average
exercise price At January 1 25,914,997 P=4.89 38,628,537 P=4.84 Additions 4,413,205 4.10 – – Exercised (6,019,491) 4.68 (12,713,540) 4.74 Cancelled (461,709) 3.82 – – At December 31 23,847,002 P=4.14 25,914,997 P=4.89
PFRS 2 Options
2007 Weighted average
exercise price 2006 Weighted average
exercise price At January 1 23,349,898 P=4.89 34,080,099 P=4.84 Additions 4,520,159 4.10 – – Exercised (7,107,360) 4.68 (10,730,201) 4.74 Cancelled (742,747) 3.82 – – At December 31 20,019,950 P=4.14 23,349,898 P=4.89
The additions during the year pertain to the 20% stock dividend earned on the outstanding stock
options.
The options exercised had a weighted average exercise price of P=4.68 per share or P=61.4 million in 2007 and P=4.74 per share or P=111.1 million in 2006. The average fair market value of the shares at the exercise date was P=16.73 per share or about P=219.6 million in 2007 and P=11.84 per share or about P=277.6 million in 2006.
The fair value of stock options granted is estimated as at the date of grant using the Black-Scholes Merton Formula, taking into account the terms and conditions upon which the options were granted. The fair value of stock options granted under ESOP at June 30, 2005 grant date, and the assumptions used to determine the fair value of the stock options are as follows:
Weighted average share price P=8.36 Exercise price P=6.75 Expected volatility 46.3% Option life 10 years Dividend yield 3.21% Interest rate 12.6%
The expected volatility reflects the assumption that the historical volatility is indicative of future trends, which may also necessarily be the actual outcome.

- 49 -
*SGVMC110511*
ESOWN
In November 2001, the Company offered all its ESOWN subscribers with outstanding ESOWN subscriptions the option to cancel the subscriptions within the 5-year holding period. In December 2001, the program for ESOWN was indefinitely suspended.
In 2005, the Company introduced a revised ESOWN and granted to qualified officers wherein
grantees may subscribe in whole or in part to the shares awarded to them based on a discounted market price that was determined by the Compensation Committee as the offer price set at grant date. The grantees paid for the shares subscribed through installments over a maximum period of 10 years. The subscription is subject to a holding period stated in the plan. To subscribe, the grantee must be an employee of the Company or any of its subsidiaries during the 10-year payment period. In case the grantee resigns, unsubscribed shares are cancelled, while the subscription may be paid up to the percent of holding period completed and payments may be converted into the equivalent number of shares. In case the grantee is separated, not for cause, but through retrenchment and redundancy, subscribed shares may be paid in full, unsubscribed shares may be subscribed, or payments may be converted into the equivalent number of shares. In case the grantee retires, the grantee may subscribe to the unsubscribed shares anytime within the 10-year period. The plan does not allow sale or assignment of the shares. All shares acquired through the plan are subject to the Company’s Right to Repurchase.
For the unsubscribed shares, the employee still has the option to subscribe within seven years. Movements in the number of options outstanding under ESOWN are as follows:
2007 Weighted average
exercise price 2006 Weighted average
exercise price At January 1 8,290,674 P=9.11 3,094,213 P=7.03 Granted 494,400 12.00 5,196,461 10.35 Cancelled (284,039) 7.89 – – At December 31 8,501,035 9.34 8,290,674 P=9.11
The fair value of stock options granted is estimated on the date of grant using the Black-Scholes
Merton Formula, taking into account the terms and conditions upon which the options were granted. The fair value of stock options granted under ESOWN at grant date and the assumptions used to determine the fair value of the stock options are as follows:
Grant Dates
September 20,
2007 June 5,
2006 November 16,
2005 Weighted average share price P=14.24 P=12.83 P=8.36 Exercise price P=12.00 P=10.35 P=7.03 Expected volatility 34.67% 46.03% 46.32% Dividend yield 0.41% 1.56% 0.77% Interest rate 6.93% 10.55% 11.30%
Total expense recognized in 2007, 2006 and 2005 in the consolidated statements of income arising from share-based payments amounted to P=104.7 million, P=148.0 million and P=68.4 million.

- 50 -
*SGVMC110511*
24. Financial Assets and Liabilities
Fair value information The following tables set forth the carrying values and estimated fair values of the Group’s financial assets and liabilities recognized as of December 31, 2007 and 2006:
2007 2006 Carrying Value Fair Value Carrying Value Fair Value FVPL Financial Assets Financial assets through profit and loss P=318,018 P=318,018 P=1,951,090 P=1,951,090 Derivative asset 59,026 59,026 – – Total FVPL financial assets 377,044 377,044 1,951,090 1,951,090 Loans and Receivables Cash and cash equivalents 11,271,906 11,271,906 4,630,591 4,630,591 Short-term investments 2,035,606 2,035,606 2,927,928 2,927,928 Accounts and notes receivable
Trade Residential development 7,374,149 7,613,864 5,273,262 5,960,168 Shopping centers 974,771 974,771 1,089,744 1,089,744 Construction contracts 820,485 820,485 385,539 385,539 Management fees 189,381 189,381 140,487 140,487 Corporate business 159,007 159,007 445,020 445,020 Others 156,014 156,014 582,927 582,927
9,673,807 9,913,522 7,916,979 8,603,885 Related parties 1,691,706 1,691,706 1,331,504 1,331,504 Advances to other companies 478,213 463,583 652,431 652,431 Accrued receivable 88,952 88,952 109,471 109,471 Receivable from employees 268,121 236,035 200,071 200,071 Others 1,630,095 1,607,152 2,008,675 2,008,675
4,157,087 4,087,428 4,302,152 4,302,152 Total loans and receivables 27,138,406 27,308,462 19,777,650 20,464,556 Available-for-sale financial assets
Unquoted shares of stocks 202,489 202,489 281,475 281,475 Quoted shares of stocks 162,356 162,356 96,161 96,161
Total available-for-sale financial assets 364,845 364,845 377,636 377,636 Total financial assets P=27,880,295 P=28,050,351 P=22,106,376 P=22,793,282 Other Financial Liabilities Current
Accounts payable P=9,310,065 P=9,310,065 P=7,540,155 P=7,540,155 Accrued expenses 3,304,330 3,304,330 1,703,136 1,928,036 Accrued project cost 540,618 540,618 443,569 443,569 Dividends payable 456,052 456,052 328,540 328,540 Accrued salaries and employee
benefits 196,262 196,262 450,765 225,865 Accrued rentals 141,140 141,140 73,679 73,679 Intrerest payable 135,459 135,459 171,359 171,359 Retentions payable 44,412 44,412 75,985 75,985
Short-term debt 1,613,000 1,613,000 1,556,000 1,556,000 Current portion of long-term debt 2,376,600 2,376,600 3,563,593 3,563,593 Noncurrent Long-term debt 6,149,874 6,952,606 7,717,818 8,549,132 Deposits and other noncurrent
liabilities 4,375,807 4,381,898 3,782,281 3,776,605 Total other financial liabilities P=28,643,619 P=29,452,442 P=27,406,880 P=28,232,518

- 51 -
*SGVMC110511*
The methods and assumptions used by the Company in estimating the fair value of the financial instruments are as follows:
Cash and cash equivalents, short-term investments and current receivables - Carrying amounts approximate fair values due to the relatively short-term maturities of these investments.
FVPL financial assets - These are investments in government securities. Fair value is based on quoted prices as of balance sheet dates.
Noncurrent accounts and notes receivables - The fair values of residential accounts and notes receivable, advances to other companies, receivable from employees and other accounts receivable, are based on the discounted value of future cash flows using the applicable rates for similar types of instruments. The discount rates used ranged from 4.19% to 6.04% and 5.0% to 6.7% as of December 31, 2007 and 2006, respectively.
AFS quoted equity securities - Fair values are based on quoted prices published in markets.
AFS unquoted equity securities - These are carried at cost less allowance for impairment losses because fair value cannot be measured reliably because of lack of reliable estimates of future cash flows and discount rates necessary to calculate the fair value.
Liabilities - The fair value of noncurrent unquoted instruments (long-term debt and deposits) are estimated using the discounted cash flow methodology using the Group’s current incremental borrowing rates for similar borrowings with maturities consistent with those remaining for the liability being valued. The discount rates used ranged from 4.19% to 6.04% and 5.0% to 6.7% as of December 31, 2007 and 2006, respectively. The fair value of noncurrent unquoted instruments with floating rates approximate their carrying amounts due to the regular repricing of the instruments. The fair values of accounts and other payables and short-term debt approximate the carrying amounts due to the short-term nature of these transactions.
Financial Risk Management and Objectives
The Group’s principal financial instruments comprise of AFS financial assets, bank loans, corporate notes and bonds. The financial debt instruments were issued primarily to raise financing for the Group’s operations. The Group has various financial assets such as cash and cash equivalents, short-term investments, AFS financial assets, trade receivables and payables which arise directly from the conduct of its operations.
Exposure to liquidity, credit, interest rate, currency and equity risks arise in the normal course of the Group’s business activities. The main objectives of the Group’s financial risk management are as follows:
• to identify and monitor such risks on an ongoing basis; • to minimize and mitigate such risks; and • to provide a degree of certainty about costs.
The use of financial derivative instruments (if any) is solely for management of the Group’s financial risk exposures. It is the Group’s policy not to enter into derivative transactions for speculative purposes.

- 52 -
*SGVMC110511*
The Group’s financing and treasury function operates as a centralized service for managing financial risks and activities as well as providing optimum investment yield and cost-efficient funding for the Group.
Liquidity Risk The Group actively manages its liquidity position so as to ensure that all operating, investing and financing needs are met. In mitigating liquidity risk, management measures and forecasts its cash commitments, matches debt maturities with the assets being financed, maintains a diversity of funding sources with its unhampered access to bank financing and the capital markets, develops viable funding alternatives through its sale of receivables, non-core assets and adoption of joint development agreements for property acquisitions and developments, and holds a sufficient level of cash reserves and marketable securities.
Through scenario analysis and contingency planning, the Group also assesses its ability to withstand both temporary and longer-term disruptions relative to its capacity to finance its activities and commitments in a timely manner and at reasonable cost, and ensures the availability of ample unused credit facilities as back-up liquidity.
The table summarizes the maturity profile of the Group’s financial liabilities at December 31,
2007 based on contractual undiscounted payments: Year ended December 31, 2007
< 1 year >1 to < 5 years > 5 years Total Interest payable P=672,114 P=1,369,180 P=295,190 P=2,336,484
Credit Risk The Group’s credit risks are primarily attributable to installment receivables, rental receivables and other financial assets. To manage credit risks, the Group maintains defined credit policies and monitor on a continuous basis its exposure to credit risks.
Other financial assets are comprised of cash and cash equivalents, short-term investments, FVPL financial assets and AFS financial assets. The Group adheres to fixed limits and guidelines in its dealings with counterparty banks and its investment in financial instruments. Bank limits are established on the basis of an internal rating system that principally covers the areas of liquidity, capital adequacy and financial stability. The rating system likewise makes use of available international credit ratings. Given the high credit standing of its accredited counterparty banks, management does not expect any of these financial institutions to fail in meeting their obligations.
< 1 year >1 to < 5 years > 5 years Total Accounts and other payables P=15,758,816 P= P= P=15,758,816 Other current liabilities 623,294 – – 623,294 Short-term debt 1,613,000 – – 1,613,000 Long-term debt 2,376,600 4,778,507 1,371,367 8,526,474 Deposits and other noncurrent
liabilities 3,031,680 1,214,741 129,386 4,375,807 P=23,403,390 P=5,993,248 P=1,500,753 P=30,897,391

- 53 -
*SGVMC110511*
In respect of installment receivables from the sale of properties, credit risk is managed primarily through credit reviews and an analysis of receivables on a continuous basis. The Group also undertakes supplemental credit review procedures for certain installment payment structures. Customer payments are facilitated through various collection modes including the use of post dated checks and auto-debit arrangements. Exposure to bad debts is not significant and the requirement for remedial procedures is minimal given the profile of buyers.
Credit risk arising from rental income from leasing properties is primarily managed through a tenant selection process. Prospective tenants are evaluated on the basis of payment track record and other credit information. In accordance with the provisions of the lease contracts, the lessees are required to deposit with the Group security deposits and advance rentals which helps reduce the Group’s credit risk exposure in case of defaults by the tenants. For existing tenants, the Group has put in place a monitoring and follow-up system. Receivables are aged and analyzed on a continuous basis to minimize credit risk associated with these receivables. Regular meetings with tenants are also undertaken to provide opportunities for counseling and further assessment of paying capacity.
The table below shows the maximum exposure to credit risk for the components of the balance sheet as of December 31, 2007.
Balance sheet items 2007 2006 Cash and cash equivalents P=11,271,906 P=4,630,591 Short-term investments 2,035,606 2,927,928 FVPL financial assets 318,018 1,951,090 Accounts and notes receivable
Trade Shopping centers 974,771 1,089,744 Corporate business 159,007 445,020 Residential 7,374,149 5,273,262 Construction contracts 820,485 385,539 Management fees 189,381 140,487 Others 156,014 582,927
Advances to related parties 1,691,706 1,331,504 Advances to other companies 478,213 652,431 Accrued receivable 88,952 109,471 Receivables from employees 268,121 200,071 Others 1,630,095 2,008,675
P=27,456,424 P=21,728,740

- 54 -
*SGVMC110511*
Given the Group’s diverse base of counterparties, it is not exposed to large concentrations of credit risk. As of December 31, 2007, the aging analysis of past due but not impaired trade receivables presented per class, is as follows:
2007
Neither Past Due nor Past Due but not Impaired Impaired <30 days 30-60 days 60-90 days 90-120 days >120 days Total Impaired Total (In Thousands) Trade
Shopping centers P=589,173 P=240,484 P=4,774 P=4,250 P=103,062 P=23,227 P=375,797 P=9,801 P=974,771 Corporate business 50,009 107,600 127 143 23 1,105 108,998 – 159,007 Residential 7,076,363 53,829 118,251 60,198 14,400 41,553 288,231 9,555 7,374,149 Construction contracts 201,676 344,769 80,040 38,280 93,432 59,987 616,508 2,301 820,485 Management fees 78,128 36,476 22,820 10,632 8,911 29,248 108,087 3,166 189,381 Others 36,734 78,866 14,151 6,456 5,310 7,142 111,925 7,355 156,014
Related parties 1,453,342 8,062 15,765 22,033 28,952 163,552 238,364 – 1,691,706 Advances to other
companies 264,089 36,618 35,504 52,276 69,669 19,982 214,049 75 478,213 Accrued receivable 70,965 14,485 399 363 248 2,492 17,987 – 88,952 Receivable from
employees 223,179 12,118 15,045 6,286 8,402 3,091 44,942 – 268,121 Others 1,309,442 10,831 18,501 27,150 36,200 126,651 219,333 101,320 1,630,095 Total P=11,353,100 P=944,138 P=325,377 P=228,067 P=368,609 P=478,030 P=2,344,221 P=133,573 P=13,830,894
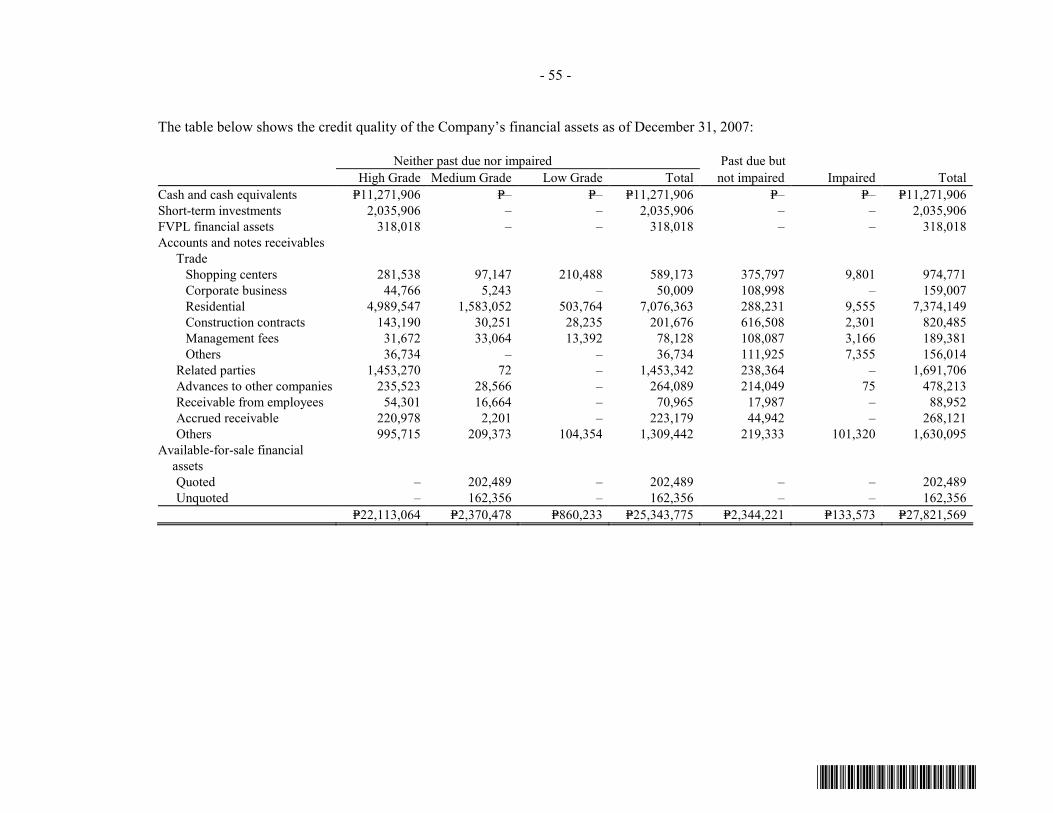
- 55 -
*SGVMC110511*
The table below shows the credit quality of the Company’s financial assets as of December 31, 2007:
Neither past due nor impaired Past due but High Grade Medium Grade Low Grade Total not impaired Impaired Total Cash and cash equivalents P=11,271,906 P=– P=– P=11,271,906 P=– P=– P=11,271,906 Short-term investments 2,035,906 – – 2,035,906 – – 2,035,906 FVPL financial assets 318,018 – – 318,018 – – 318,018 Accounts and notes receivables
Trade Shopping centers 281,538 97,147 210,488 589,173 375,797 9,801 974,771 Corporate business 44,766 5,243 – 50,009 108,998 – 159,007 Residential 4,989,547 1,583,052 503,764 7,076,363 288,231 9,555 7,374,149 Construction contracts 143,190 30,251 28,235 201,676 616,508 2,301 820,485 Management fees 31,672 33,064 13,392 78,128 108,087 3,166 189,381 Others 36,734 – – 36,734 111,925 7,355 156,014
Related parties 1,453,270 72 – 1,453,342 238,364 – 1,691,706 Advances to other companies 235,523 28,566 – 264,089 214,049 75 478,213 Receivable from employees 54,301 16,664 – 70,965 17,987 – 88,952 Accrued receivable 220,978 2,201 – 223,179 44,942 – 268,121 Others 995,715 209,373 104,354 1,309,442 219,333 101,320 1,630,095
Available-for-sale financial assets Quoted – 202,489 – 202,489 – – 202,489 Unquoted – 162,356 – 162,356 – – 162,356
P=22,113,064 P=2,370,478 P=860,233 P=25,343,775 P=2,344,221 P=133,573 P=27,821,569
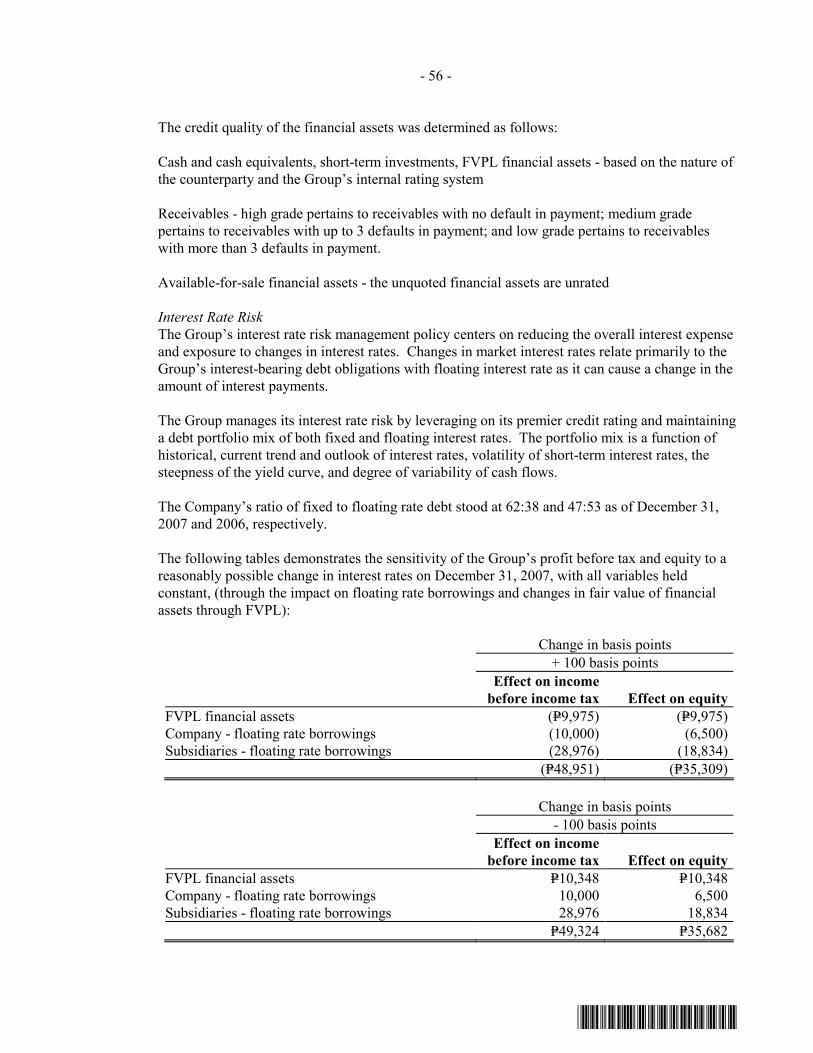
- 56 -
*SGVMC110511*
The credit quality of the financial assets was determined as follows:
Cash and cash equivalents, short-term investments, FVPL financial assets - based on the nature of the counterparty and the Group’s internal rating system
Receivables - high grade pertains to receivables with no default in payment; medium grade pertains to receivables with up to 3 defaults in payment; and low grade pertains to receivables with more than 3 defaults in payment.
Available-for-sale financial assets - the unquoted financial assets are unrated
Interest Rate Risk The Group’s interest rate risk management policy centers on reducing the overall interest expense and exposure to changes in interest rates. Changes in market interest rates relate primarily to the Group’s interest-bearing debt obligations with floating interest rate as it can cause a change in the amount of interest payments.
The Group manages its interest rate risk by leveraging on its premier credit rating and maintaining a debt portfolio mix of both fixed and floating interest rates. The portfolio mix is a function of historical, current trend and outlook of interest rates, volatility of short-term interest rates, the steepness of the yield curve, and degree of variability of cash flows.
The Company’s ratio of fixed to floating rate debt stood at 62:38 and 47:53 as of December 31, 2007 and 2006, respectively.
The following tables demonstrates the sensitivity of the Group’s profit before tax and equity to a reasonably possible change in interest rates on December 31, 2007, with all variables held constant, (through the impact on floating rate borrowings and changes in fair value of financial assets through FVPL):
Change in basis points + 100 basis points
Effect on income
before income tax Effect on equity FVPL financial assets (P=9,975) (P=9,975) Company - floating rate borrowings (10,000) (6,500) Subsidiaries - floating rate borrowings (28,976) (18,834) (P=48,951) (P=35,309)
Change in basis points - 100 basis points
Effect on income
before income tax Effect on equity FVPL financial assets P=10,348 P=10,348 Company - floating rate borrowings 10,000 6,500 Subsidiaries - floating rate borrowings 28,976 18,834 P=49,324 P=35,682

- 57 -
*SGVMC110511*
The terms and maturity profile of the interest-bearing financial assets and liabilities, together with its corresponding nominal amounts and carrying values (in thousands) are shown in the following table:
2007
Interest terms (p.a.) Rate
Fixing Period Nominal Amount < 1 year 1 to 5 years > 5 years
Carrying Value
Group Cash and cash equivalents Fixed at the date of investment Various P=11,271,906 P=11,271,906 – – P=11,271,906 Short-term investments Fixed at the date of investment or
revaluation cut-off Balance
date 2,035,606 2,035,606 – – 2,035,606 FVPL financial assets Fixed at the date of investment or
revaluation cut-off Balance
date 318,018 318,018 – 318,018 Accounts and notes
receivables Fixed at the date of sale Date of sale 13,656,785 10,181,479 3,475,306 13,656,785 Company Long-term debt Fixed Peso Fixed at 7.25% to 7.75% 5, 7 and
10 years 3,000,000 - 1,830,000 1,170,000 3,000,000 Peso Fixed at 10.75% 5 years 1,000,000 1,000,000 – – 1,000,000 Peso Fixed at 14.88% 10 years 580,000 - 580,000 – 580,000 Peso Fixed at 5% 3 years 80,470 - 80,470 – 80,470 Floating Peso Variable at 1.25% over 91-day
PDST-F 3 months 1,000,000 1,000,000 – – 1,000,000 Subsidiaries Short-term debt Variable ranging from 5.5% to
7.9% Monthly 1,613,000 1,613,000 – – 1,613,000 Long-term debt Fixed Peso
Fixed at 7.75% to 12.69% 5 to 7 years 1,585,760 167,460 1,408,625 5,295 1,581,380
Floating Peso Variable at 1.00% to 1.50% over
91-day PDST-F or PDST-R1 3 months 1,288,840 209,140 879,412 196,072 1,284,624
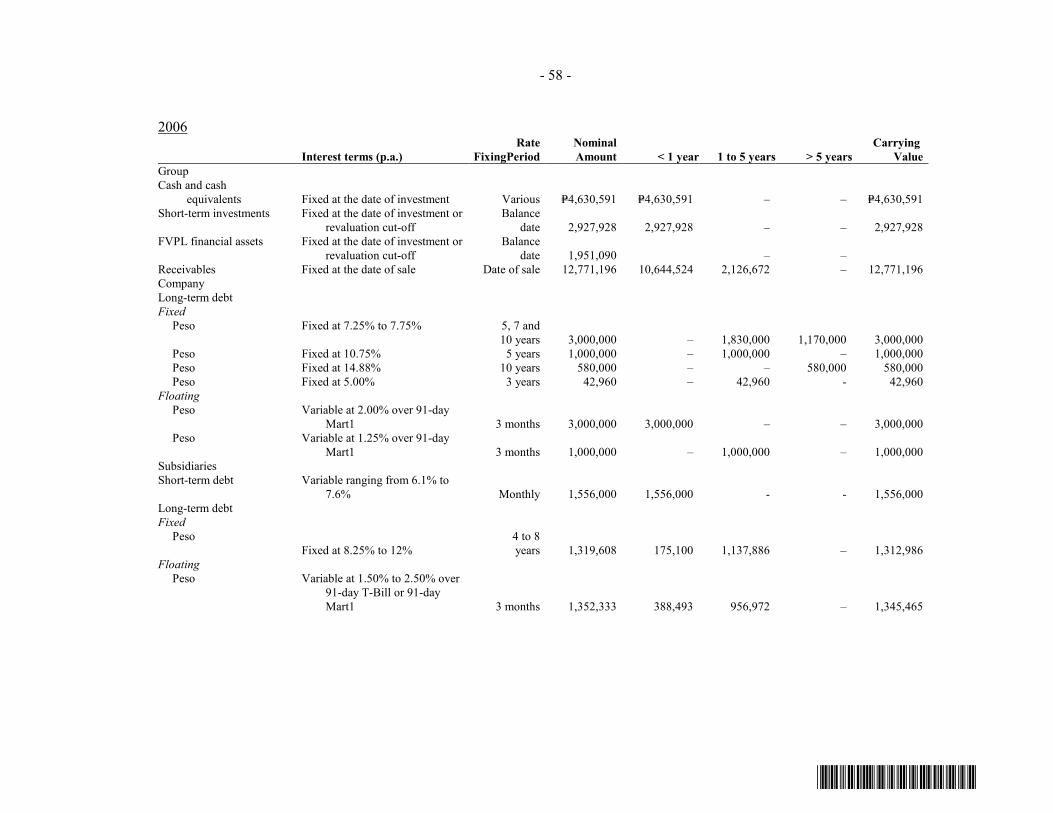
- 58 -
*SGVMC110511*
2006
Interest terms (p.a.) Rate
FixingPeriod Nominal Amount < 1 year 1 to 5 years > 5 years
Carrying Value
Group Cash and cash
equivalents Fixed at the date of investment Various P=4,630,591 P=4,630,591 – – P=4,630,591 Short-term investments Fixed at the date of investment or
revaluation cut-off Balance
date 2,927,928 2,927,928 – – 2,927,928 FVPL financial assets Fixed at the date of investment or
revaluation cut-off Balance
date 1,951,090 – – Receivables Fixed at the date of sale Date of sale 12,771,196 10,644,524 2,126,672 – 12,771,196 Company Long-term debt Fixed Peso Fixed at 7.25% to 7.75% 5, 7 and
10 years 3,000,000 – 1,830,000 1,170,000 3,000,000 Peso Fixed at 10.75% 5 years 1,000,000 – 1,000,000 – 1,000,000 Peso Fixed at 14.88% 10 years 580,000 – – 580,000 580,000 Peso Fixed at 5.00% 3 years 42,960 – 42,960 - 42,960 Floating Peso Variable at 2.00% over 91-day
Mart1 3 months 3,000,000 3,000,000 – – 3,000,000 Peso Variable at 1.25% over 91-day
Mart1 3 months 1,000,000 – 1,000,000 – 1,000,000 Subsidiaries Short-term debt Variable ranging from 6.1% to
7.6% Monthly 1,556,000 1,556,000 - - 1,556,000 Long-term debt Fixed Peso
Fixed at 8.25% to 12% 4 to 8 years 1,319,608 175,100 1,137,886 – 1,312,986
Floating Peso Variable at 1.50% to 2.50% over
91-day T-Bill or 91-day Mart1 3 months 1,352,333 388,493 956,972 – 1,345,465

- 59 -
*SGVMC110511*
Foreign Currency Risk Financial assets and credit facilities of the Group are mainly denominated in Philippine Peso. Any foreign exchange holdings are matched with foreign currency requirements to fund equity commitments and new projects. As such, the Group’s foreign currency risk is minimal.
The following table shows the Group’s consolidated foreign currency-denominated monetary assets and liabilities and their peso equivalents as of December 31, 2007 and 2006:
In Thousands 2007 2006 US Dollar Php Equivalent US Dollar Php Equivalent Financial Assets Cash and cash equivalents $13,291 P=555,210 $15,771 P=770,882 Financial Liabilities Current portion of long-term debt – – 2,852 139,821 Long-term debt, net of current portion 47 1,961 2,879 141,154 Total 47 1,961 5,731 280,975 Net foreign currency denominated assets $13,244 P=553,249 $10,040 P=489,907
The following table demonstrates the sensitivity to a reasonably possible change in the Philippine
peso-US dollar exchange rate, with all variables held constant, of the Group’s profit before tax (due to changes in the fair value of monetary assets and liabilities) and the Group’s equity on December 31, 2007.
Increase (decrease)
in exchange rate Effect on profit
before tax Effect on
equity P=1.00 P=13,244 P=8,609
(P=1.00) (13,244) (8,609) 25. Segment Information
The industry segments where the Group and its associates and joint ventures operate are as follows:
Core business: • Shopping centers - development of shopping centers and lease to third parties of retail space
and land therein; operation of movie theaters, food courts, entertainment facilities and carparks in these shopping centers; management and operation of malls which are co-owned with partners
• Corporate business - development and lease or sale of office buildings; sale of industrial lots and lease of factory building
• Residential developments - sale of high-end and upper middle-income residential lots and units, affordable housing units and lots, and leisure community developments; lease of residential developments under joint venture
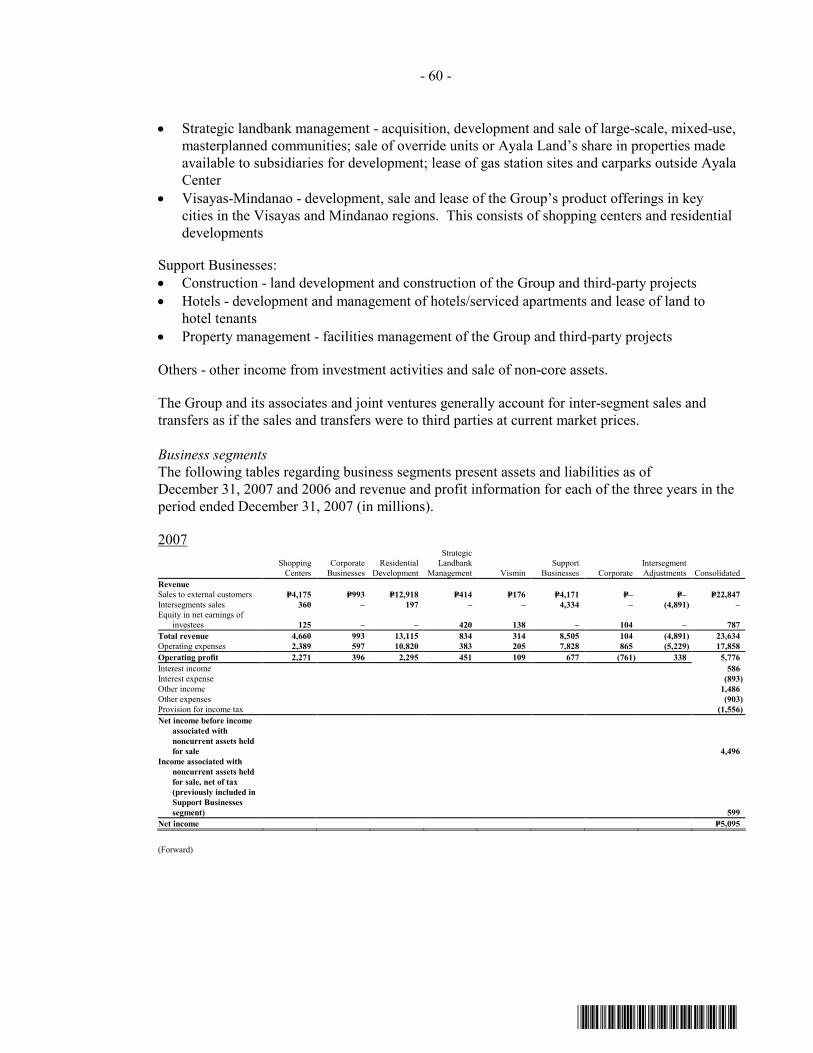
- 60 -
*SGVMC110511*
• Strategic landbank management - acquisition, development and sale of large-scale, mixed-use,
masterplanned communities; sale of override units or Ayala Land’s share in properties made available to subsidiaries for development; lease of gas station sites and carparks outside Ayala Center
• Visayas-Mindanao - development, sale and lease of the Group’s product offerings in key cities in the Visayas and Mindanao regions. This consists of shopping centers and residential developments
Support Businesses:
• Construction - land development and construction of the Group and third-party projects • Hotels - development and management of hotels/serviced apartments and lease of land to
hotel tenants • Property management - facilities management of the Group and third-party projects
Others - other income from investment activities and sale of non-core assets.
The Group and its associates and joint ventures generally account for inter-segment sales and
transfers as if the sales and transfers were to third parties at current market prices.
Business segments The following tables regarding business segments present assets and liabilities as of December 31, 2007 and 2006 and revenue and profit information for each of the three years in the period ended December 31, 2007 (in millions).
2007
Shopping
Centers Corporate
Businesses Residential
Development
Strategic Landbank
Management Vismin Support
Businesses Corporate Intersegment Adjustments Consolidated
Revenue Sales to external customers P=4,175 P=993 P=12,918 P=414 P=176 P=4,171 P=– P=– P=22,847 Intersegments sales 360 – 197 – – 4,334 – (4,891) – Equity in net earnings of
investees 125 – – 420 138 – 104 – 787 Total revenue 4,660 993 13,115 834 314 8,505 104 (4,891) 23,634 Operating expenses 2,389 597 10,820 383 205 7,828 865 (5,229) 17,858 Operating profit 2,271 396 2,295 451 109 677 (761) 338 5,776 Interest income 586 Interest expense (893) Other income 1,486 Other expenses (903) Provision for income tax (1,556) Net income before income
associated with noncurrent assets held for sale 4,496
Income associated with noncurrent assets held for sale, net of tax (previously included in Support Businesses segment) 599
Net income P=5,095
(Forward)
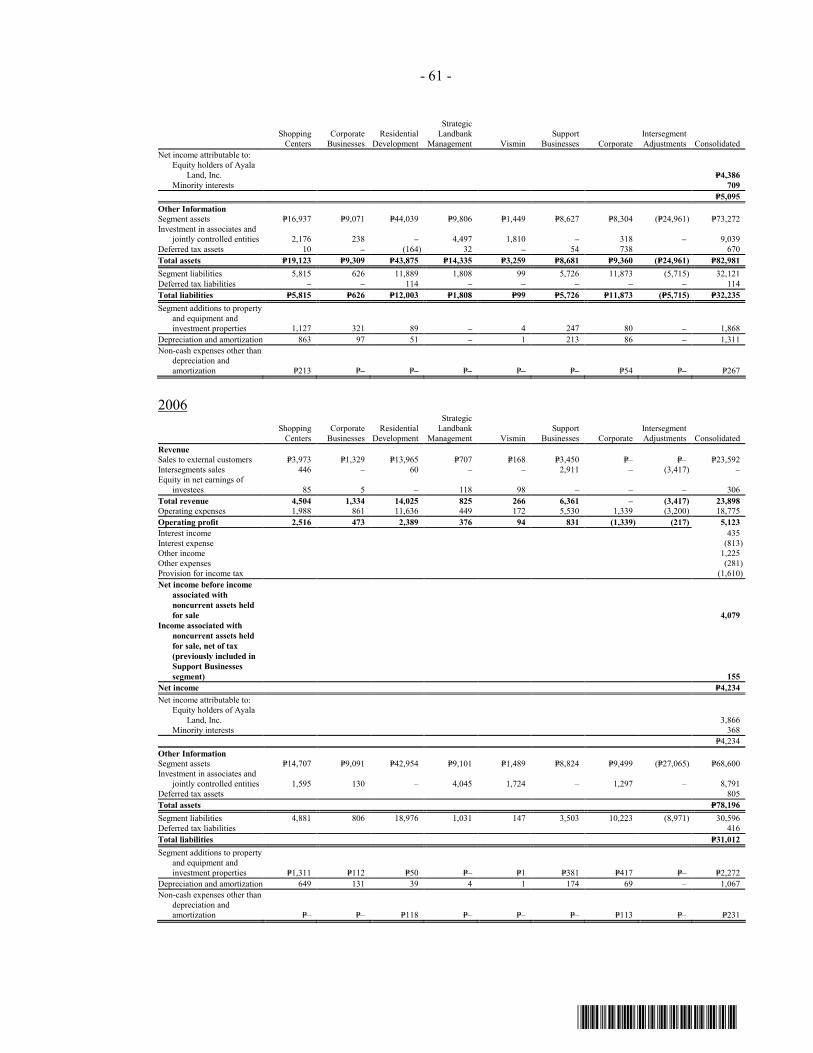
- 61 -
*SGVMC110511*
Shopping
Centers Corporate
Businesses Residential
Development
Strategic Landbank
Management Vismin Support
Businesses Corporate Intersegment Adjustments Consolidated
Net income attributable to: Equity holders of Ayala
Land, Inc. P=4,386 Minority interests 709 P=5,095 Other Information Segment assets P=16,937 P=9,071 P=44,039 P=9,806 P=1,449 P=8,627 P=8,304 (P=24,961) P=73,272 Investment in associates and
jointly controlled entities 2,176 238 – 4,497 1,810 – 318 – 9,039 Deferred tax assets 10 – (164) 32 – 54 738 670 Total assets P=19,123 P=9,309 P=43,875 P=14,335 P=3,259 P=8,681 P=9,360 (P=24,961) P=82,981 Segment liabilities 5,815 626 11,889 1,808 99 5,726 11,873 (5,715) 32,121 Deferred tax liabilities – – 114 – – – – – 114 Total liabilities P=5,815 P=626 P=12,003 P=1,808 P=99 P=5,726 P=11,873 (P=5,715) P=32,235 Segment additions to property
and equipment and investment properties 1,127 321 89 – 4 247 80 – 1,868
Depreciation and amortization 863 97 51 – 1 213 86 – 1,311 Non-cash expenses other than
depreciation and amortization P=213 P=– P=– P=– P=– P=– P=54 P=– P=267
2006
Shopping
Centers Corporate
Businesses Residential
Development
Strategic Landbank
Management Vismin Support
Businesses Corporate Intersegment Adjustments Consolidated
Revenue Sales to external customers P=3,973 P=1,329 P=13,965 P=707 P=168 P=3,450 P=– P=– P=23,592 Intersegments sales 446 – 60 – – 2,911 – (3,417) – Equity in net earnings of
investees 85 5 – 118 98 – – – 306 Total revenue 4,504 1,334 14,025 825 266 6,361 – (3,417) 23,898 Operating expenses 1,988 861 11,636 449 172 5,530 1,339 (3,200) 18,775 Operating profit 2,516 473 2,389 376 94 831 (1,339) (217) 5,123 Interest income 435 Interest expense (813) Other income 1,225 Other expenses (281) Provision for income tax (1,610) Net income before income
associated with noncurrent assets held for sale 4,079
Income associated with noncurrent assets held for sale, net of tax (previously included in Support Businesses segment) 155
Net income P=4,234 Net income attributable to: Equity holders of Ayala
Land, Inc. 3,866 Minority interests 368 P=4,234 Other Information Segment assets P=14,707 P=9,091 P=42,954 P=9,101 P=1,489 P=8,824 P=9,499 (P=27,065) P=68,600 Investment in associates and
jointly controlled entities 1,595 130 – 4,045 1,724 – 1,297 – 8,791 Deferred tax assets 805 Total assets P=78,196 Segment liabilities 4,881 806 18,976 1,031 147 3,503 10,223 (8,971) 30,596 Deferred tax liabilities 416 Total liabilities P=31,012 Segment additions to property
and equipment and investment properties P=1,311 P=112 P=50 P=– P=1 P=381 P=417 P=– P=2,272
Depreciation and amortization 649 131 39 4 1 174 69 – 1,067 Non-cash expenses other than
depreciation and amortization P=– P=– P=118 P=– P=– P=– P=113 P=– P=231

- 62 -
*SGVMC110511*
2005
Shopping
Centers Corporate
Businesses Residential
Development
Strategic Landbank
Management Vismin Support
Businesses Corporate Intersegment Adjustments Consolidated
Revenue Sales to external customers P=3,557 P=632 P=9,654 P=499 P=183 P=2,667 P=– P=– P=17,192 Intersegments sales 342 – 118 – – 3,036 – (3,496) – Equity in net earnings of
investees 75 – 2 100 52 – (2) – 227 TTotal revenue 3,974 632 9,774 599 235 5,703 (2) (3,496) 17,419 Operating expenses 1,962 422 7,922 354 178 4,879 1,206 (3,274) 13,649 Operating profit 2,012 210 1,852 245 57 824 (1,208) (222) 3,770 Interest income 662 Interest expense (918) Other income 3,294 Other expenses (2,394) Provision for income tax (559) Net income before income
associated with noncurrent assets held for sale 3,855
Income associated with noncurrent assets held for sale, net of tax (previously included in Support Businesses segment) 131
Net income P=3,986 Net income attributable to: Equity holders of Ayala
Land, Inc. 3,617 Minority interests 369 P=3,986 Other Information Segment assets P=13,382 P=10,792 P=41,979 P=8,772 P=1,383 P=7,504 P=7,258 (P=26,839) P=64,231 Investment in associates and
jointly controlled entities 1,550 – – 3,559 1,703 – – – 6,812 Deferred tax assets 767 Total assets P=71,810 Segment liabilities 4,806 888 20,496 2,387 82 4,462 8,421 (15,344) 26,198 Deferred tax liabilities 273 Total liabilities P=26,471 Segment additions to property
and equipment and investment properties 1,324 326 8 – – 176 86 – 1,920
Depreciation and amortization 547 80 59 – 2 168 62 – 918 Non-cash expenses other than
depreciation and amortization P=– P=182 P=1,523 P=– P=– P=– P=469 P=– P=2,174
26. Registration with Philippine Economic Zone Authority (PEZA) A subsidiary is registered with PEZA on October 27, 1999 as a non-pioneer “ecozone
developer/operator.” The PEZA registration entitled the subsidiary to a four-year income tax holiday from the start of its commercial operations. At the expiration of its four-year tax holiday, the subsidiary pays income tax at the special tax rate of 5% on its gross income earned from sources within the PEZA economic zone in lieu of paying all national and local income taxes.

- 63 -
*SGVMC110511*
27. Leases
Operating leases - as lessor The Group entered into lease agreements with third parties covering its investment property
portfolio. These leases generally provide for either (a) fixed monthly rent, or (b) minimum rent or a certain percentage of gross revenue, whichever is higher.
Future minimum rental receivables under non-cancellable operating leases of the Group are as follows:
2007 2006 (In Thousands) Within one year P=653,150 P=586,617 After one year but not more than five years 1,485,316 2,083,551 More than five years 245,132 300,048 P=2,383,598 P=2,970,216
28. Long-term Commitments and Contingencies
Commitments The Company has an existing contract with the Bases Conversion Development Authority (BCDA) to develop, under a lease agreement a mall with an estimated gross leasable area of 152,000 square meters on a 9.8-hectare lot inside Fort Bonifacio. The lease agreement covers 25 years, renewable for another 25 years subject to reappraisal of the lot at market value. The annual fixed lease rental amounts to P=106.5 million while the variable rent ranges from 5% to 20% of gross revenues. Subsequently, the Company transferred its rights and obligations granted to or imposed under the lease agreement to SSECC, a subsidiary, in exchange for equity.
As part of the bid requirement, the Company procured a performance bond in 2003 from the
Government Service Insurance System in favor of BCDA amounting to P=3.9 billion to guarantee the committed capital to BCDA. Moreover, the Company obtained surety bonds to guarantee the payment of the fixed and variable rent as prescribed in the lease agreement. The surety bonds are secured by a mortgage on a property of certain subsidiary with a carrying value of P=48.6 million in 2004.
On April 15, 2003, the Company entered into a Joint Development Agreement (JDA) with BCDA
for development of another lot inside Fort Bonifacio with a gross area of 11.6 hectares for residential purposes. Pursuant to the agreement, BCDA shall contribute all its title and interest to the lot and the Company in turn shall provide the necessary cash and expertise to undertake and complete the implementation of the residential development. The Company commits to invest sufficient capital to complete the residential development.
The Company procured a surety bond with a face value of P=122.9 million issued by an insurance
company in favor and for the benefit of BCDA as beneficiary. The surety bond shall be continuing in nature and shall secure the obligation of the Company to pay BCDA annual minimum revenue share for each of the first 8 selling periods of the residential project.

- 64 -
*SGVMC110511*
In 2002, the Company agreed to underwrite the subscription to North Triangle Depot Commercial
Corporation (NTDCC) additional shares amounting to P=1.4 billion over a 4-year equity schedule up to 2007 in exchange for a 5% underwriting fee (net of a 1.5% rebate to existing shareholders who subscribed).
Contingencies
The Group has various contingent liabilities arising in the ordinary conduct of business which are either pending decision by the courts or being contested, the outcome of which are not presently determinable.
One of the court cases pending against the Group is the Avida case which involves a patent infringement suit brought by plaintiffs Edgardo Vasquez and Vasquez Building Systems Corporation against Avida. The plaintiffs allege that Avida infringed on Vasquez’s modular housing unit patent. Avida had raised a number of defenses, including (a) it makes use of patented technology licensed from United Kingdom and French Companies, and not Vasquez’s modular housing unit patent; (b) the Vasquez patent claim is overboard, since the patent does not protect the H-shaped column and the wall panel installation system; and (c) the H-shaped column and the wall panel installation system cannot be covered by the Vasquez patent, because these are not patentable as they do not qualify on “novelty.”
In a decision dated December 18, 2007, the Regional Trial Court of Quezon City found in favor of the plaintiffs and rendered the following awards against Avida: (a) P=90.0 million as temperate damages or reasonable royalty with interest at the rate of six percent (6%) per annum reckoned from the date of filing of the verified Complaint, December 19, 1999, until the same is fully paid: (b) P=5.0 million as moral damages; (c) P=1.0 million as exemplary damages; (d) P=0.5 million as reasonable attorney’s fees and expenses of litigation; (e) costs of suit.
Although the decision was against the Company, the overwhelming strength of the Company’s defenses which were arbitrarily disregarded by the Trial Court has prompted the Company’s management to seek relief from a higher court. Hence, on 4 January 2008, the Company filed an appeal to contest this Decision, intending to elevate this case to the Court of Appeals.
In the opinion of management and its legal counsel, the eventual liability under these lawsuits or claims, if any, will not have a material or adverse effect on the Group’s financial position and results of operations. No provisions were made during the year. The information usually required by PAS 37/IAS 37, Provisions, Contingent Liabilities and Contingent Assets, is not disclosed on the grounds that it can be expected to prejudice the outcome of these lawsuits, claims and assessments.
- 65 -
*SGVMC110511*
29. Subsequent Events
As a result of the explosion which occurred on October 19, 2007 at the basement of the Makati Supermarket Building, the Philippine National Police (PNP) has recommended to the Department of Justice (DOJ), in its report dated January 11, 2008, the prosecution of certain officers/employees of Makati Supermarket Corporation, the owner of the building, as well as some officers/employees of the Company’s subsidiary, APMC, among other individuals, for criminal negligence. No criminal case has been filed by the Department of Justice at this time. No civil case has likewise been filed by any of the victims. In the event that the DOJ decides to file a criminal case against certain officers/employees of APMC as recommended by the PNP, the accused, if convicted after final judgment, can be held not only criminally but also civilly liable. In the event the accused will not be able to pay for the civil award, APMC will be held subsidiarily liable for such sums (the amount of which cannot be estimated). The Company and APMC believe, however, that the facts surrounding the incident do not show any negligence.