NOTES TO CONSOLIDATED FINANCIAL STATEMENTS€¦ · · 2018-03-15NOTES TO CONSOLIDATED FINANCIAL...
82
FINANCIAL STATEMENTS PRESENTATION & POLICIES NOTES TO CONSOLIDATED FINANCIAL STATEMENTS NOTE 1. BASIS OF PRESENTATION AND SUMMARY OF SIGNIFICANT ACCOUNTING POLICIES CONSOLIDATION Our financial statements consolidate all of our affiliates – entities in which we have a controlling financial interest, most often because we hold a majority voting interest. To determine if we hold a controlling financial interest in an entity, we first evaluate if we are required to apply the variable interest entity (VIE) model to the entity, otherwise, the entity is evaluated under the voting interest model. Where we hold current or potential rights that give us the power to direct the activities of a VIE that most significantly impact the VIE’s economic performance, combined with a variable interest that gives us the right to receive potentially significant benefits or the obligation to absorb potentially significant losses, we have a controlling financial interest in that VIE. Rights held by others to remove the party with power over the VIE are not considered unless one party can exercise those rights unilaterally. When changes occur to the design of an entity, we reconsider whether it is subject to the VIE model. We continuously evaluate whether we have a controlling financial interest in a VIE. We hold a controlling financial interest in other entities where we currently hold, directly or indirectly, more than 50% of the voting rights or where we exercise control through substantive participating rights or as a general partner. Where we are a general partner, we consider substantive removal rights held by other partners in determining if we hold a controlling financial interest. We reevaluate whether we have a controlling financial interest in these entities when our voting or substantive participating rights change. Associated companies are unconsolidated VIEs and other entities in which we do not have a controlling financial interest, but over which we have significant influence, most often because we hold a voting interest of 20% to 50%. Associated companies are accounted for as equity method investments. Our share of the results of associated companies are presented on a one-line basis. Investments in, and advances to, associated companies are presented on a one-line basis in the caption “All other assets” in our Statement of Financial Position, net of allowance for losses, which represents our best estimate of probable losses inherent in such assets. FINANCIAL STATEMENT PRESENTATION We have reclassified certain prior-year amounts to conform to the current-year’s presentation. Certain columns and rows may not add due to the use of rounded numbers. Percentages presented are calculated from the underlying numbers in millions. Upon closing an acquisition, we consolidate the acquired business as soon as practicable. The size, scope and complexity of an acquisition can affect the time necessary to adjust the acquired company’s accounting policies, procedures, and books and records to our standards. Accordingly, it is possible that changes will be necessary to the carrying amounts and presentation of assets and liabilities in our financial statements as the acquired company is fully assimilated. Financial data and related measurements are presented in the following categories: GE. This represents the adding together of all affiliates except GE Capital, whose continuing operations are presented on a one-line basis, giving effect to the elimination of transactions among such affiliates. GE Capital. This refers to GE Capital Global Holdings, LLC (GECGH), or its predecessor General Electric Capital Corporation (GECC), and is the adding together of all affiliates of GE Capital giving effect to the elimination of transactions among such affiliates. Consolidated. This represents the adding together of GE and GE Capital, giving effect to the elimination of transactions between GE and GE Capital. Operating Segments. These comprise our eight businesses, focused on the broad markets they serve: Power, Renewable Energy, Oil & Gas, Aviation, Healthcare, Transportation, Energy Connections & Lighting and Capital. 140 GE 2016 FORM 10-K
Transcript of NOTES TO CONSOLIDATED FINANCIAL STATEMENTS€¦ · · 2018-03-15NOTES TO CONSOLIDATED FINANCIAL...
FINANCIAL STATEMENTS PRESENTATION & POLICIES
140 GE 2016 FORM 10-K
NOTES TO CONSOLIDATED FINANCIAL STATEMENTS
NOTE 1. BASIS OF PRESENTATION AND SUMMARY OF SIGNIFICANT ACCOUNTING POLICIES
CONSOLIDATION Our financial statements consolidate all of our affiliates – entities in which we have a controlling financial interest, most often because we hold a majority voting interest. To determine if we hold a controlling financial interest in an entity, we first evaluate if we are required to apply the variable interest entity (VIE) model to the entity, otherwise, the entity is evaluated under the voting interest model. Where we hold current or potential rights that give us the power to direct the activities of a VIE that most significantly impact the VIE’s economic performance, combined with a variable interest that gives us the right to receive potentially significant benefits or the obligation to absorb potentially significant losses, we have a controlling financial interest in that VIE. Rights held by others to remove the party with power over the VIE are not considered unless one party can exercise those rights unilaterally. When changes occur to the design of an entity, we reconsider whether it is subject to the VIE model. We continuously evaluate whether we have a controlling financial interest in a VIE. We hold a controlling financial interest in other entities where we currently hold, directly or indirectly, more than 50% of the voting rights or where we exercise control through substantive participating rights or as a general partner. Where we are a general partner, we consider substantive removal rights held by other partners in determining if we hold a controlling financial interest. We reevaluate whether we have a controlling financial interest in these entities when our voting or substantive participating rights change. Associated companies are unconsolidated VIEs and other entities in which we do not have a controlling financial interest, but over which we have significant influence, most often because we hold a voting interest of 20% to 50%. Associated companies are accounted for as equity method investments. Our share of the results of associated companies are presented on a one-line basis. Investments in, and advances to, associated companies are presented on a one-line basis in the caption “All other assets” in our Statement of Financial Position, net of allowance for losses, which represents our best estimate of probable losses inherent in such assets. FINANCIAL STATEMENT PRESENTATION We have reclassified certain prior-year amounts to conform to the current-year’s presentation. Certain columns and rows may not add due to the use of rounded numbers. Percentages presented are calculated from the underlying numbers in millions. Upon closing an acquisition, we consolidate the acquired business as soon as practicable. The size, scope and complexity of an acquisition can affect the time necessary to adjust the acquired company’s accounting policies, procedures, and books and records to our standards. Accordingly, it is possible that changes will be necessary to the carrying amounts and presentation of assets and liabilities in our financial statements as the acquired company is fully assimilated. Financial data and related measurements are presented in the following categories: GE. This represents the adding together of all affiliates except GE Capital, whose continuing operations are presented on a one-line basis, giving effect to the elimination of transactions among such affiliates. GE Capital. This refers to GE Capital Global Holdings, LLC (GECGH), or its predecessor General Electric Capital Corporation (GECC), and is the adding together of all affiliates of GE Capital giving effect to the elimination of transactions among such affiliates. Consolidated. This represents the adding together of GE and GE Capital, giving effect to the elimination of transactions between GE and GE Capital. Operating Segments. These comprise our eight businesses, focused on the broad markets they serve: Power, Renewable Energy, Oil & Gas, Aviation, Healthcare, Transportation, Energy Connections & Lighting and Capital.
140 GE 2016 FORM 10-K

FINANCIAL STATEMENTS PRESENTATION & POLICIES
GE 2016 FORM 10-K 141
Unless otherwise indicated, information in these notes to consolidated financial statements relates to continuing operations. Certain of our operations have been presented as discontinued. See Note 2. The effects of translating to U.S. dollars the financial statements of non-U.S. affiliates whose functional currency is other than the U.S. dollar are included in shareowners’ equity. Asset and liability accounts are translated at year-end exchange rates, while revenues and expenses are translated at average rates for the respective periods. Preparing financial statements in conformity with U.S. generally accepted accounting principles (GAAP) requires us to make estimates based on assumptions about current, and for some estimates future, economic and market conditions which affect reported amounts and related disclosures in our financial statements. Although our current estimates contemplate current conditions and how we expect them to change in the future, as appropriate, it is reasonably possible that actual conditions could be worse than anticipated in those estimates, which could materially affect our results of operations and financial position. Among other effects, such changes could result in future impairments of investment securities, goodwill, intangibles and long-lived assets, incremental losses on financing receivables, establishment of valuation allowances on deferred tax assets, incremental fair value marks on businesses and assets held for sale carried at lower of cost or market, and increased tax liabilities and insurance reserves. ACCOUNTING PRINCIPLES AND POLICIES Our financial statements are prepared in conformity with GAAP. SALES OF GOODS AND SERVICES We record all sales of goods and services only when a firm sales agreement is in place, delivery has occurred or services have been rendered and collectability of the fixed or determinable sales price is reasonably assured. Arrangements for the sale of goods and services sometimes include multiple components. Most of our multiple component arrangements involve the sale of goods and services in the Healthcare segment. Our arrangements with multiple components usually involve an upfront deliverable of large machinery or equipment and future service deliverables such as installation, commissioning, training or the future delivery of ancillary products. In most cases, the relative values of the undelivered components are not significant to the overall arrangement and are typically delivered within three to six months after the core product has been delivered. In such agreements, selling price is determined for each component and any difference between the total of the separate selling prices and total contract consideration (i.e., discount) is allocated pro rata across each of the components in the arrangement. The value assigned to each component is objectively determined and obtained primarily from sources such as the separate selling price for that or a similar item or from competitor prices for similar items. If such evidence is not available, we use our best estimate of selling price, which is established consistent with the pricing strategy of the business and considers product configuration, geography, customer type, and other market specific factors. Except for goods sold under long-term agreements, we recognize sales of goods under the provisions of U.S. Securities and Exchange Commission (SEC) Staff Accounting Bulletin (SAB) 104, Revenue Recognition. In arrangements where we sell products that provide the customer with a right of return, we use our accumulated experience to estimate and provide for such returns when we record the sale. In situations where arrangements include customer acceptance provisions based on seller or customer-specified objective criteria, we recognize revenue when we have reliably demonstrated that all specified acceptance criteria have been met or when formal acceptance occurs, respectively. In arrangements where we provide goods for trial and evaluation purposes, we only recognize revenue after customer acceptance occurs. Unless otherwise noted, we do not provide for anticipated losses before we record sales.
GE 2016 FORM 10-K 141

FINANCIAL STATEMENTS PRESENTATION & POLICIES
142 GE 2016 FORM 10-K
We recognize revenue on agreements for sales of goods and services under power generation unit and uprate contracts, nuclear fuel assemblies, larger oil drilling equipment projects, aeroderivative unit contracts, military development contracts, locomotive production contracts, and long-term construction projects, using long-term construction and production contract accounting. We estimate total long-term contract revenue net of price concessions as well as total contract costs. For goods sold under power generation unit and uprate contracts, nuclear fuel assemblies, aeroderivative unit contracts, military development contracts and locomotive production contracts, we recognize sales as we complete major contract-specified deliverables, most often when customers receive title to the goods or accept the services as performed. For larger oil drilling equipment projects and long-term construction projects, we recognize sales based on our progress toward contract completion measured by actual costs incurred in relation to our estimate of total expected costs. We measure long-term contract revenues by applying our contract-specific estimated margin rates to incurred costs. We routinely update our estimates of future costs for agreements in process and report any cumulative effects of such adjustments in current operations. We provide for any loss that we expect to incur on these agreements when that loss is probable. We recognize revenue upon delivery for sales of aircraft engines and military propulsion equipment. Delivery of commercial engines and non-U.S. military equipment occurs on shipment; delivery of military propulsion equipment sold to the U.S. government or agencies thereof occurs upon receipt of a Material Inspection and Receiving Report, DD Form 250 or Memorandum of Shipment. Commercial aircraft engines are complex equipment manufactured to customer order under a variety of sometimes complex, long-term agreements. We measure sales of commercial aircraft engines by applying our contract-specific estimated margin rates to incurred costs. We routinely update our estimates of future revenues and costs for commercial aircraft engine agreements in process and report any cumulative effects of such adjustments in current operations. Significant components of our revenue and cost estimates include price concessions and performance-related guarantees as well as material, labor and overhead costs. We measure revenue for military propulsion equipment and spare parts not subject to long-term product services agreements based on the specific contract on a specifically measured output basis. We provide for any loss that we expect to incur on these agreements when that loss is probable; consistent with industry practice, for commercial aircraft engines, we make such provision only if such losses are not recoverable from future highly probable sales of spare parts and services for those engines. We sell product services under long-term product maintenance or extended warranty agreements in our Aviation, Power, Oil & Gas and Transportation segments, where costs of performing services are incurred on other than a straight-line basis. We also sell similar long-term product services in our Healthcare and Renewable Energy segments, where such costs generally are expected to be incurred on a straight-line basis. For the Aviation, Power, Oil & Gas and Transportation agreements, we recognize related sales based on the extent of our progress toward completion measured by actual costs incurred in relation to total expected costs. We routinely update our estimates of future costs for agreements in process and report any cumulative effects of such adjustments in current operations. For the Healthcare and Renewable Energy agreements, we recognize revenues on a straight-line basis and expense related costs as incurred. We provide for any loss that we expect to incur on any of these agreements when that loss is probable. GE CAPITAL REVENUES FROM SERVICES (EARNED INCOME) We use the interest method to recognize income on loans. Interest on loans includes origination, commitment and other non-refundable fees related to funding (recorded in earned income on the interest method). We stop accruing interest at the earlier of the time at which collection of an account becomes doubtful or the account becomes 90 days past due. Previously recognized interest income that was accrued but not collected from the borrower is reversed, unless the terms of the loan agreement permit capitalization of accrued interest to the principal balance. Payments received on nonaccrual loans are applied to reduce the principal balance of the loan. We resume accruing interest on nonaccrual, non-restructured commercial loans only when (a) payments are brought current according to the loan’s original terms and (b) future payments are reasonably assured. When we agree to restructured terms with the borrower, we resume accruing interest only when it is reasonably assured that we will recover full contractual payments, and such loans pass underwriting reviews equivalent to those applied to new loans. We recognize financing lease income on the interest method to produce a level yield on funds not yet recovered. Estimated unguaranteed residual values are based upon management's best estimates of the value of the leased asset at the end of the lease term. We use various sources of data in determining these estimates, including information obtained from third parties, which is adjusted for the attributes of the specific asset under lease. Guarantees of residual values by unrelated third parties are included within minimum lease payments. Significant assumptions we use in estimating residual values include estimated net cash flows over the remaining lease term, anticipated results of future remarketing, and estimated future component part and scrap metal prices, discounted at an appropriate rate.
142 GE 2016 FORM 10-K

FINANCIAL STATEMENTS PRESENTATION & POLICIES
GE 2016 FORM 10-K 143
We recognize operating lease income on a straight-line basis over the terms of underlying leases. BUSINESSES AND ASSETS HELD FOR SALE Businesses and assets held for sale represent components that meet accounting requirements to be classified as held for sale and are presented as single asset and liability amounts in our financial statements with a valuation allowance, if necessary, to recognize the net carrying amount at the lower of cost or fair value, less cost to sell. Financing receivables that no longer qualify to be presented as held for investment must be classified as assets held for sale and recognized in our financial statements at the lower of cost or fair value, less cost to sell, with that amount representing a new cost basis at the date of transfer. The determination of fair value for businesses and assets held for sale involves significant judgments and assumptions. Development of estimates of fair values in this circumstance is complex and is dependent upon, among other factors, the nature of the potential sales transaction (for example, asset sale versus sale of legal entity), composition of assets and/or businesses in the disposal group, the comparability of the disposal group to market transactions, negotiations with third party purchasers etc. Such factors bear directly on the range of potential fair values and the selection of the best estimates. Key assumptions were developed based on market observable data and, in the absence of such data, internal information that is consistent with what market participants would use in a hypothetical transaction. We review all businesses and assets held for sale each reporting period to determine whether the existing carrying amounts are fully recoverable in comparison to estimated fair values. DEPRECIATION AND AMORTIZATION The cost of GE manufacturing plant and equipment is generally depreciated on a straight-line basis over its estimated economic life. The cost of GE Capital equipment leased to others on operating leases is depreciated on a straight-line basis to estimated residual value over the lease term or over the estimated economic life of the equipment. LOSSES ON FINANCING RECEIVABLES Our financing receivables portfolio consists of a variety of loans and leases, including both larger-balance, non-homogeneous loans and leases and smaller-balance homogeneous loans and leases. We routinely evaluate our entire portfolio for potential specific credit or collection issues that might indicate an impairment. Losses on financing receivables are recognized when they are incurred, which requires us to make our best estimate of probable losses inherent in the portfolio. The method for calculating the best estimate of losses depends on the size, type and risk characteristics of the related financing receivable. Such an estimate requires consideration of historical loss experience, adjusted for current conditions, and judgments about the probable effects of relevant observable data, including present economic conditions such as delinquency rates, financial health of specific customers and market sectors, collateral values, and the present and expected future levels of interest rates. The underlying assumptions, estimates and assessments we use to provide for losses are updated periodically to reflect our view of current conditions. Changes in such estimates can significantly affect the allowance and provision for losses. It is possible that we will experience credit losses that are different from our current estimates. Write-offs are deducted from the allowance for losses when we judge the principal to be uncollectible and subsequent recoveries are added to the allowance at the time cash is received on a written-off account. PARTIAL SALES OF BUSINESS INTERESTS Gains or losses on sales of affiliate shares where we retain a controlling financial interest are recorded in equity. Gains or losses on sales that result in our loss of a controlling financial interest are recorded in earnings along with remeasurement gains or losses on any investments in the entity that we retained.
GE 2016 FORM 10-K 143
FINANCIAL STATEMENTS PRESENTATION & POLICIES
144 GE 2016 FORM 10-K
CASH AND EQUIVALENTS Debt securities and money market instruments with original maturities of three months or less are included in cash equivalents unless designated as available-for-sale and classified as investment securities. INVESTMENT SECURITIES We report investments in debt and marketable equity securities, and certain other equity securities, at fair value. See Note 19 for further information on fair value. Unrealized gains and losses on available-for-sale investment securities are included in shareowners’ equity, net of applicable taxes and other adjustments. We regularly review investment securities for impairment using both quantitative and qualitative criteria. For debt securities, if we do not intend to sell the security or it is not more likely than not that we will be required to sell the security before recovery of our amortized cost, we evaluate other qualitative criteria to determine whether we do not expect to recover the amortized cost basis of the security, such as the financial health of and specific prospects for the issuer, including whether the issuer is in compliance with the terms and covenants of the security. We also evaluate quantitative criteria including determining whether there has been an adverse change in expected future cash flows. If we do not expect to recover the entire amortized cost basis of the security, we consider the security to be other-than-temporarily impaired (OTTI), and we record the difference between the security’s amortized cost basis and its recoverable amount in earnings and the difference between the security’s recoverable amount and fair value in other comprehensive income. If we intend to sell the security or it is more likely than not we will be required to sell the security before recovery of its amortized cost basis, the security is also considered OTTI and we recognize the entire difference between the security’s amortized cost basis and its fair value in earnings. For equity securities, we consider the length of time and magnitude of the amount that each security is in an unrealized loss position. If we do not expect to recover the entire amortized cost basis of the security, we consider the security to be other-than-temporarily impaired, and we record the difference between the security’s amortized cost basis and its fair value in earnings. Realized gains and losses are accounted for on the specific identification method. Unrealized gains and losses on investment securities classified as trading and certain retained interests are included in earnings. INVENTORIES All inventories are stated at the lower of cost or realizable values. Cost for a portion of GE U.S. inventories is determined on a last-in, first-out (LIFO) basis. Cost of other GE inventories is determined on a first-in, first-out (FIFO) basis. LIFO was used for 34% of GE inventories in both 2016 and 2015. GOODWILL AND OTHER INTANGIBLE ASSETS We do not amortize goodwill, but test it at least annually for impairment at the reporting unit level. A reporting unit is the operating segment, or one level below that operating segment (the component level) if discrete financial information is prepared and regularly reviewed by segment management. However, components are aggregated as a single reporting unit if they have similar economic characteristics. We recognize an impairment charge if the carrying amount of a reporting unit exceeds its fair value and the carrying amount of the reporting unit’s goodwill exceeds the implied fair value of that goodwill. We use a market approach, when available and appropriate, or the income approach, or a combination of both to establish fair values. When a portion of a reporting unit is disposed, goodwill is allocated to the gain or loss on disposition based on the relative fair values of the business or businesses disposed and the portion of the reporting unit that will be retained. We amortize the cost of other intangibles over their estimated useful lives unless such lives are deemed indefinite. The cost of intangible assets is generally amortized on a straight-line basis over the asset’s estimated economic life, except that individually significant customer-related intangible assets are amortized in relation to total related sales. Amortizable intangible assets are reviewed for impairment whenever events or changes in circumstances indicate that the related carrying amounts may not be recoverable. In these circumstances, they are tested for impairment based on undiscounted cash flows and, if impaired, written down to fair value based on either discounted cash flows or appraised values. Intangible assets with indefinite lives are tested annually for impairment and written down to fair value as required.
144 GE 2016 FORM 10-K

FINANCIAL STATEMENTS PRESENTATION & POLICIES
GE 2016 FORM 10-K 145
INVESTMENT CONTRACTS, INSURANCE LIABILITIES AND INSURANCE ANNUITY BENEFITS Our run-off insurance activities include providing insurance and reinsurance for life and health risks and providing certain annuity products. Two primary product types are provided: traditional insurance contracts and investment contracts. Insurance contracts are contracts with significant mortality and/or morbidity risks, while investment contracts are contracts without such risks. For short-duration insurance contracts, including accident and health insurance, we report premiums as earned income over the terms of the related agreements, generally on a pro-rata basis. For traditional long-duration insurance contracts, including long-term care, term, whole life and annuities payable for the life of the annuitant, we report premiums as earned income when due. Premiums received on investment contracts (including annuities without significant mortality risk) are not reported as revenues but rather as deposit liabilities. We recognize revenues for charges and assessments on these contracts, mostly for mortality, contract initiation, administration and surrender. Amounts credited to policyholder accounts are charged to expense. Liabilities for traditional long-duration insurance contracts represent the present value of such benefits less the present value of future net premiums based on mortality, morbidity, interest and other assumptions at the time the policies were issued or acquired. Liabilities for investment contracts equal the account value, that is, the amount that accrues to the benefit of the contract or policyholder including credited interest and assessments through the financial statement date. Liabilities for unpaid claims and estimated claim settlement expenses represent our best estimate of the ultimate obligations for reported and incurred-but-not-reported claims and the related estimated claim settlement expenses. Liabilities for unpaid claims and estimated claim settlement expenses are continually reviewed and adjusted through current operations. FAIR VALUE MEASUREMENTS The following sections describe the valuation methodologies we use to measure financial and non-financial instruments accounted for at fair value including certain assets within our pension plans and retiree benefit plans. For financial assets and liabilities measured at fair value on a recurring basis, fair value is the price we would receive to sell an asset or pay to transfer a liability in an orderly transaction with a market participant at the measurement date. In the absence of active markets for the identical assets or liabilities, such measurements involve developing assumptions based on market observable data and, in the absence of such data, internal information that is consistent with what market participants would use in a hypothetical transaction that occurs at the measurement date. Observable inputs reflect market data obtained from independent sources, while unobservable inputs reflect our market assumptions. Preference is given to observable inputs. These two types of inputs create the following fair value hierarchy: Level 1 – Quoted prices for identical instruments in active markets.
Level 2 – Quoted prices for similar instruments in active markets; quoted prices for identical or similar instruments in markets that are not active; and model-derived valuations whose inputs are observable or whose significant value drivers are observable.
Level 3 – Significant inputs to the valuation model are unobservable.
We maintain policies and procedures to value instruments using the best and most relevant data available. In addition, we have risk management teams that review valuation, including independent price validation for certain instruments. With regard to Level 3 valuations (including instruments valued by third parties), we perform a variety of procedures to assess the reasonableness of the valuations. Such reviews include an evaluation of instruments whose fair value change exceeds predefined thresholds (and/or does not change) and consider the current interest rate, currency and credit environment, as well as other published data, such as rating agency market reports and current appraisals. These reviews are performed within each business by the asset and risk managers. A detailed review of methodologies and assumptions is performed by individuals independent of the business for individual measurements with a fair value exceeding predefined thresholds. This detailed review may include the use of a third-party valuation firm.
GE 2016 FORM 10-K 145

FINANCIAL STATEMENTS PRESENTATION & POLICIES
146 GE 2016 FORM 10-K
RECURRING FAIR VALUE MEASUREMENTS The following sections describe the valuation methodologies we use to measure different financial instruments at fair value on a recurring basis. Investments in Debt and Equity Securities. When available, we use quoted market prices to determine the fair value of investment securities, and they are included in Level 1. Level 1 securities primarily include publicly traded equity securities. For large numbers of investment securities for which market prices are observable for identical or similar investment securities but not readily accessible for each of those investments individually (that is, it is difficult to obtain pricing information for each individual investment security at the measurement date), we obtain pricing information from an independent pricing vendor. The pricing vendor uses various pricing models for each asset class that are consistent with what other market participants would use. The inputs and assumptions to the model of the pricing vendor are derived from market observable sources including: benchmark yields, reported trades, broker/dealer quotes, issuer spreads, benchmark securities, bids, offers, and other market-related data. Since many fixed income securities do not trade on a daily basis, the methodology of the pricing vendor uses available information as applicable such as benchmark curves, benchmarking of like securities, sector groupings, and matrix pricing. The pricing vendor considers available market observable inputs in determining the evaluation for a security. Thus, certain securities may not be priced using quoted prices, but rather determined from market observable information. These investments are included in Level 2 and primarily comprise our portfolio of corporate fixed income, and government, mortgage and asset-backed securities. In infrequent circumstances, our pricing vendors may provide us with valuations that are based on significant unobservable inputs, and in those circumstances we classify the investment securities in Level 3. Annually, we conduct reviews of our primary pricing vendor to validate that the inputs used in that vendor’s pricing process are deemed to be market observable as defined in the standard. While we are not provided access to proprietary models of the vendor, our reviews have included on-site walk-throughs of the pricing process, methodologies and control procedures for each asset class and level for which prices are provided. Our reviews also include an examination of the underlying inputs and assumptions for a sample of individual securities across asset classes, credit rating levels and various durations. In addition, the pricing vendor has an established challenge process in place for all security valuations, which facilitates identification and resolution of potentially erroneous prices. We believe that the prices received from our pricing vendor are representative of prices that would be received to sell the assets at the measurement date (exit prices) and are classified appropriately in the hierarchy. We use non-binding broker quotes and other third-party pricing services as our primary basis for valuation when there is limited, or no, relevant market activity for a specific instrument or for other instruments that share similar characteristics. We have not adjusted the prices we have obtained. Investment securities priced using non-binding broker quotes and other third-party pricing services are included in Level 3. As is the case with our primary pricing vendor, third-party brokers and other third-party pricing services do not provide access to their proprietary valuation models, inputs and assumptions. Accordingly, our risk management personnel conduct reviews of vendors, as applicable, similar to the reviews performed of our primary pricing vendor. In addition, we conduct internal reviews of pricing for all such investment securities quarterly to ensure reasonableness of valuations used in our financial statements. These reviews are designed to identify prices that appear stale, those that have changed significantly from prior valuations, and other anomalies that may indicate that a price may not be accurate. Based on the information available, we believe that the fair values provided by the brokers and other third-party pricing services are representative of prices that would be received to sell the assets at the measurement date (exit prices). Derivatives. We use closing prices for derivatives included in Level 1, which are traded either on exchanges or liquid over-the-counter markets. The majority of our derivatives are valued using internal models. The models maximize the use of market observable inputs including interest rate curves and both forward and spot prices for currencies and commodities. Derivative assets and liabilities included in Level 2 primarily represent interest rate swaps, cross-currency swaps and foreign currency and commodity forward and option contracts. Derivative assets and liabilities included in Level 3 primarily represent equity derivatives and interest rate products that contain embedded optionality or prepayment features.
146 GE 2016 FORM 10-K

FINANCIAL STATEMENTS PRESENTATION & POLICIES
GE 2016 FORM 10-K 147
NON-RECURRING FAIR VALUE MEASUREMENTS Certain assets are measured at fair value on a non-recurring basis. These assets are not measured at fair value on an ongoing basis, but are subject to fair value adjustments only in certain circumstances. These assets can include loans and long-lived assets that have been reduced to fair value when they are held for sale, impaired loans that have been reduced based on the fair value of the underlying collateral, cost and equity method investments and long-lived assets that are written down to fair value when they are impaired and the remeasurement of retained investments in formerly consolidated subsidiaries upon a change in control that results in deconsolidation of a subsidiary, if we sell a controlling interest and retain a noncontrolling stake in the entity. Assets that are written down to fair value when impaired and retained investments are not subsequently adjusted to fair value unless further impairment occurs. The following sections describe the valuation methodologies we use to measure financial and non-financial instruments accounted for at fair value on a non-recurring basis and for certain assets within our pension plans and retiree benefit plans at each reporting period, as applicable. Financing Receivables and Loans Held for Sale. When available, we use observable market data, including pricing on recent closed market transactions, to value loans that are included in Level 2. When this data is unobservable, we use valuation methodologies using current market interest rate data adjusted for inherent credit risk, and such loans are included in Level 3. When appropriate, loans may be valued using collateral values (see Long-Lived Assets below). Cost and Equity Method Investments. Cost and equity method investments are valued using market observable data such as quoted prices when available. When market observable data is unavailable, investments are valued using a discounted cash flow model, comparative market multiples or a combination of both approaches as appropriate and other third-party pricing sources. These investments are generally included in Level 3. Investments in private equity, real estate and collective funds held within our pension plans, are generally valued using the net asset value (NAV) per share as a practical expedient for fair value provided certain criteria are met. The NAVs are determined based on the fair values of the underlying investments in the funds. On January 1, 2016, we adopted guidance whereby investments that are measured at fair value using the NAV practical expedient are no longer classified in the fair value hierarchy. Long-lived Assets. Fair values of long-lived assets, including aircraft, are primarily derived internally and are based on observed sales transactions for similar assets. In other instances, for example, collateral types for which we do not have comparable observed sales transaction data, collateral values are developed internally and corroborated by external appraisal information. Adjustments to third-party valuations may be performed in circumstances where market comparables are not specific to the attributes of the specific collateral or appraisal information may not be reflective of current market conditions due to the passage of time and the occurrence of market events since receipt of the information. Retained Investments in Formerly Consolidated Subsidiaries. Upon a change in control that results in deconsolidation of a subsidiary, the fair value measurement of our retained noncontrolling stake is valued using market observable data such as quoted prices when available, or if not available, an income approach, a market approach, or a combination of both approaches as appropriate. In applying these methodologies, we rely on a number of factors, including actual operating results, future business plans, economic projections, market observable pricing multiples of similar businesses and comparable transactions, and possible control premium. These investments are generally included in Level 1 or Level 3, as appropriate, determined at the time of the transaction. ACCOUNTING CHANGES On September 30, 2016, we adopted ASU 2016-09, Improvements to Employee Share-Based Payment Accounting, which was intended to simplify several aspects of the accounting for employee share-based payment transactions including the accounting for income taxes, forfeitures, and statutory tax withholding requirements, as well as classification in the statement of cash flows. We adopted the standard on a prospective basis with the effect of adoption reflected for the interim periods after the year beginning January 1, 2016 as required by the standard. The primary effects of adoption were the recognition of excess tax benefits in our provision for income taxes rather than paid-in capital and the reclassification of cash flows related to excess tax benefits from a financing activity to an operating activity for the periods beginning January 1, 2016. We will continue to estimate the number of awards that are expected to vest in our determination of the related periodic compensation cost.
GE 2016 FORM 10-K 147
FINANCIAL STATEMENTS PRESENTATION & POLICIES
148 GE 2016 FORM 10-K
As a result of the adoption, our provision for income taxes decreased by $97 million for the nine months ended September 30, 2016, for the excess tax benefits related to share-based payments in its provision for income taxes. Application of the cash flow presentation requirements from January 1, 2016, resulted in an increase to cash from operating activities and a decrease to cash from financing activities of $137 million for the nine months ended September 30, 2016. On January 1, 2016, we adopted ASU 2015-16, Simplifying the Accounting for Measurement-Period Adjustments, which eliminated the requirement for an acquirer in a business combination to account for measurement-period adjustments retrospectively. See Note 8 for further discussion of the purchase accounting effects of recent acquisitions. On January 1, 2016, we adopted ASU 2015-03, Simplifying the Presentation of Debt Issuance Costs, which requires that debt issuance costs related to a recognized debt liability to be presented on the balance sheet as a direct deduction from the debt liability, similar to the presentation of debt premiums and discounts. ASU 2015-03 applies retrospectively and does not change the recognition and measurement requirements for debt issuance costs. The adoption of ASU 2015-03 resulted in the reclassification of $674 million of unamortized debt issuance costs related to the Company's borrowings from all other assets to short-term and long-term borrowings within our consolidated balance sheet as of December 31, 2015. On January 1, 2016, we adopted ASU 2015-02, Amendments to the Consolidation Analysis. The ASU amended the consolidation guidance for VIEs and general partners' investment in limited partnerships and modified the evaluation of whether limited partnerships and similar legal entities are VIEs or voting interest entities. Upon adoption, we deconsolidated three investment funds managed by GE Asset Management (GEAM) that had been accounted for under the guidance prior to the issuance of ASU 2009-17, Improvements to Financial Reporting by Enterprises Involved with Variable Interest Entities, by virtue of the deferral provided by ASU 2010-10, Amendments for Certain Investment Funds. We concluded that GEAM’s management contracts were no longer variable interests in the three investment funds and therefore continued consolidation was not appropriate. We deconsolidated net assets and noncontrolling interests of $123 million, respectively. In addition, many of the limited partnerships in which Energy Financial Services invests became VIEs because the limited partners have no participating rights or substantive removal rights over the general partners. The general partners continue to control these limited partnerships, however, our disclosed exposure to unconsolidated VIEs in Note 21 increased by $6,110 million as a result. On January 1, 2014, we adopted ASU 2013-11, Presentation of an Unrecognized Tax Benefit When a Net Operating Loss Carryforward, a Similar Tax Loss, or a Tax Credit Carryforward Exists. Under the new guidance, an unrecognized tax benefit is required to be presented as a reduction to a deferred tax asset if the disallowance of the tax position would reduce the available tax loss or tax credit carryforward instead of resulting in a cash tax liability. The ASU applies prospectively to all unrecognized tax benefits that exist as of the adoption date and reduced both deferred tax assets and income tax liabilities (including amounts reported in assets and liabilities of discontinued operations) by $1,224 million as of January 1, 2014. ACCELERATED SHARE REPURCHASE AGREEMENTS During 2016, we entered into accelerated share repurchase (ASR) agreements to repurchase shares of GE common stock. Under an ASR agreement, the Company pays a specified amount to a financial institution and receives an initial delivery of shares based on the terms of the agreement. Upon settlement of the agreement, the financial institution delivers additional shares, or the Company returns shares, with the final net number of shares calculated based on the volume-weighted average price of GE common stock over the term of the agreement, less an agreed upon discount. When certain conditions are met, the transaction is accounted for as an equity transaction and the shares are included in treasury stock when received, at which time there is an immediate reduction in the weighted- average number of common shares used in calculating earnings per share. See Note 15 for additional information.
148 GE 2016 FORM 10-K

FINANCIAL STATEMENTS HELD FOR SALE & DISCONTINUED OPERATIONS
GE 2016 FORM 10-K 149
NOTE 2. BUSINESSES HELD FOR SALE AND DISCONTINUED OPERATIONS ASSETS AND LIABILITIES OF BUSINESSES HELD FOR SALE In the fourth quarter of 2016, we classified our Water business within our Power segment with assets of $1,617 million and liabilities of $656 million, as held for sale. We expect to complete a sale of the business within the next twelve months. In the third quarter of 2016, we classified a business at Aviation with assets of $601 million and liabilities of $58 million, as held for sale and adjusted the carrying value of the business to fair value, which resulted in a $145 million after-tax loss (including a $120 million loss on the planned disposal). In the fourth quarter of 2016, we ceased negotiations with the potential buyer due to economic and strategic reasons, and concluded that a sale of the business within the next twelve months was no longer probable. As a result, we reclassified the business to held and used and reversed through income approximately $50 million of the after-tax loss recorded in the third quarter of 2016 primarily related to allocated goodwill that is not impaired and retained customer contracts. On March 30, 2016, we announced an agreement to sell GE Asset Management (GEAM), GE’s asset management arm with assets under management of approximately $100 billion, to State Street Corporation. On July 1, 2016, we completed the sale for proceeds of $437 million and recognized an after-tax gain of $260 million. During the fourth quarter of 2016, net sale proceeds associated with U.S. pension plans of $330 million were deposited into the GE Pension Trust, increasing trust assets used to pay GE Pension Plan benefits. On January 15, 2016, we announced the signing of an agreement to sell our Appliances business to Qingdao Haier Co., Ltd. (Haier). On June 6, 2016, we completed the sale for proceeds of $5,568 million (including $773 million from sale of receivables originated in our Appliances business and sold from GE Capital to Haier) and recognized an after-tax gain of approximately $1,825 million in 2016. FINANCIAL INFORMATION FOR ASSETS AND LIABILITIES OF BUSINESSES HELD FOR SALE December 31 (In millions) 2016 2015
Assets Current receivables $ 366 $ 79 Inventories 211 583 Property, plant, and equipment – net 632 1,208 Goodwill 212 370 Other intangible assets – net 123 162 Contract assets 125 - Other 76 416 Assets of businesses held for sale $ 1,745 $ 2,818
Liabilities Accounts payable(a) $ 190 $ 503 Progress collections and price adjustments accrued 141 - Other current liabilities 133 325 Other 192 33 Liabilities of businesses held for sale $ 656 $ 861 (a) Included transactions in our industrial businesses that were made on an arms-length basis with GE Capital, consisting primarily of GE Capital
services for material procurement. These intercompany balances included within our held for sale businesses are reported in the GE and GE Capital columns of our financial statements, but are eliminated in deriving our consolidated financial statements.
NBCU As previously disclosed, Comcast Corporation was obligated to share with us potential tax savings associated with its purchase of our interest in NBCU LLC. During the second quarter of 2015, we recognized $450 million of pre-tax income related to the settlement of this obligation.
GE 2016 FORM 10-K 149

FINANCIAL STATEMENTS HELD FOR SALE & DISCONTINUED OPERATIONS
150 GE 2016 FORM 10-K
DISCONTINUED OPERATIONS Discontinued operations primarily relate to our financial services businesses as a result of the GE Capital Exit Plan and include our Consumer business, most of our CLL business, our Real Estate business and our U.S. mortgage business (WMC). All of these operations were previously reported in the Capital segment. Results of operations, financial position and cash flows for these businesses are separately reported as discontinued operations for all periods presented. We have entered into Transitional Service Agreements (TSA) with and provided certain indemnifications to buyers of GE Capital’s assets. Under the TSAs, GE Capital provides various services for terms generally between 12 and 24 months and receives a level of cost reimbursement from the buyers. See Note 23 for further information about indemnifications. FINANCIAL INFORMATION FOR DISCONTINUED OPERATIONS
(In millions) 2016 2015 2014
Operations Total revenues and other income $ 2,968 $ 23,003 $ 31,136
Earnings (loss) from discontinued operations before income taxes $ (162) $ 887 $ 6,615 Benefit (provision) for income taxes(a) 460 (791) (776) Earnings (loss) from discontinued operations, net of taxes $ 298 $ 96 $ 5,839
Disposals Gain (loss) on disposals before income taxes $ (750) $ (6,612) $ 14 Benefit (provision) for income taxes(a) (502) (979) 1 Gain (loss) on disposals, net of taxes $ (1,252) $ (7,591) $ 15
Earnings (loss) from discontinued operations, net of taxes(b)(c) $ (954) $ (7,495) $ 5,855
(a) GE Capital’s total tax benefit (provision) for discontinued operations and disposals included current tax benefit (provision) of $945 million, $(6,834) million and $(925) million for the years ended December 31, 2016, 2015 and 2014, respectively, including current U.S. Federal tax benefit (provision) of $1,224 million, $(6,245) million and $80 million for the years ended December 31, 2016, 2015 and 2014, respectively, and deferred tax benefit (provision) of $(988) million, $5,073 million and $154 million for the years ended December 31, 2016, 2015 and 2014, respectively.
(b) The sum of GE industrial earnings (loss) from discontinued operations, net of taxes, and GE Capital earnings (loss) from discontinued operations, net of taxes, after adjusting for earnings (loss) attributable to noncontrolling interests related to discontinued operations, is reported within GE industrial earnings (loss) from discontinued operations, net of taxes, on the Consolidated Statement of Earnings (Loss).
(c) Earnings (loss) from discontinued operations attributable to the Company, before income taxes, was $(911) million, $(6,038) million, and $6,472 million for the years ended December 31, 2016, 2015, and 2014, respectively.
December 31 (In millions) 2016 2015
Assets Cash and equivalents $ 1,429 $ 20,395 Investment securities 2,626 8,478 Financing receivables – net - 3,205 Other receivables 310 1,221 Property, plant and equipment – net 274 7,537 Goodwill 67 7,764 Other intangible assets - net 5 80 Deferred income taxes 487 2,447 Financing receivables held for sale 8,547 69,847 Valuation allowance on disposal group classified as discontinued operations (726) (6,374) Other 1,797 6,350 Assets of discontinued operations $ 14,815 $ 120,951
Liabilities Short-term borrowings $ 3 $ 739 Accounts payable 164 2,870 Non-recourse borrowings 1,519 3,994 Bank deposits 529 25,613 Long-term borrowings 25 730 All other liabilities 1,652 11,053 Deferred income taxes 221 1,437 Other 45 52 Liabilities of discontinued operations $ 4,158 $ 46,487
150 GE 2016 FORM 10-K
FINANCIAL STATEMENTS HELD FOR SALE & DISCONTINUED OPERATIONS
GE 2016 FORM 10-K 151
CONSUMER In connection with the GE Capital Exit Plan, we announced the planned disposition of our Consumer business (including Synchrony Financial) and classified the business as discontinued operations. We closed a vast majority of our Consumer business dispositions (including the split-off of Synchrony Financial) in 2015 and 2016. FINANCIAL INFORMATION FOR CONSUMER
(In millions) 2016 2015 2014
Operations Total revenues and other income $ 1,168 $ 11,690 $ 15,023 Interest $ (180) $ (2,081) $ (2,611) Selling, general, and administrative expenses (522) (3,940) (4,572) Cost of services sold - (1) - Provision for losses on financing receivables 1 (5,029) (3,544) Investment contracts, insurance losses and insurance annuity benefits (3) (12) (18) Other costs and expenses (89) (392) (388) Earnings (loss) from discontinued operations, before income taxes 375 236 3,891 Benefit (provision) for income taxes (171) (878) (736) Earnings (loss) from discontinued operations, net of taxes $ 204 $ (642) $ 3,155 Disposals Gain (loss) on disposals before income taxes $ 273 $ 2,739 $ - Benefit (provision) for income taxes (607) 363 - Gain (loss) on disposals, net of taxes $ (334) $ 3,102 $ - Earnings (loss) from discontinued operations, net of taxes(a) $ (130) $ 2,460 $ 3,155 (a) Earnings (loss) from discontinued operations attributable to the Company, before income taxes, was $652 million, $2,670 million, and $3,752
million for the years ended December 31, 2016, 2015, and 2014, respectively.
COMMERCIAL LENDING AND LEASING In connection with the GE Capital Exit Plan, we announced the planned disposition of most of our CLL business and classified this portion of the business as discontinued operations. We closed substantially all of our CLL business dispositions in 2015 and 2016. FINANCIAL INFORMATION FOR COMMERCIAL LENDING AND LEASING
(In millions) 2016 2015 2014
Operations Total revenues and other income $ 1,732 $ 10,580 $ 13,413
Interest $ (518) $ (2,365) $ (3,069) Selling, general and administrative expenses (1,585) (3,576) (3,598) Cost of services sold - (1,735) (3,859) Provision for losses on financing receivables (2) (1,753) (456) Other costs and expenses (89) (127) (135) Earnings (loss) from discontinued operations, before income taxes (463) 1,024 2,296 Benefit (provision) for income taxes 319 (186) (487) Earnings (loss) from discontinued operations, net of taxes $ (144) $ 838 $ 1,808
Disposals Gain (loss) on disposals before income taxes $ (971) $ (8,013) $ - Benefit (provision) for income taxes 43 (698) - Gain (loss) on disposals, net of taxes $ (928) $ (8,711) $ -
Earnings (loss) from discontinued operations, net of taxes(a) $ (1,072) $ (7,873) $ 1,808
(a) Earnings (loss) from discontinued operations attributable to the Company, before income taxes, was $(1,436) million, $(6,996) million, and $2,279 million for the years ended December 31, 2016, 2015, and 2014, respectively.
GE 2016 FORM 10-K 151

FINANCIAL STATEMENTS HELD FOR SALE & DISCONTINUED OPERATIONS
152 GE 2016 FORM 10-K
REAL ESTATE In connection with the GE Capital Exit Plan, we announced the planned disposition of our Real Estate business and classified the business as discontinued operations. We closed substantially all of our Real Estate business dispositions in 2015 and 2016. FINANCIAL INFORMATION FOR REAL ESTATE
(In millions) 2016 2015 2014
Operations Total revenues and other income $ 79 $ 911 $ 2,969
Interest $ (42) $ (457) $ (1,079) Selling, general and administrative (112) (444) (484) Cost of services sold - (5) - Provision for losses on financing receivables - 5 86 Other costs and expenses (3) (158) (712) Earnings (loss) from discontinued operations, before income taxes (78) (149) 780 Benefit (provision) for income taxes 70 168 224 Earnings (loss) from discontinued operations, net of taxes $ (8) $ 19 $ 1,003
Disposals Gain (loss) on disposals before income taxes $ (52) $ (1,338) $ - Benefit (provision) for income taxes 62 (639) - Gain (loss) on disposals, net of taxes $ 10 $ (1,977) $ -
Earnings (loss) from discontinued operations, net of taxes(a) $ 2 $ (1,958) $ 1,003
(a) Earnings (loss) from discontinued operations attributable to the Company, before income taxes, was $(130) million, $(1,486) million, and $778 million for the years ended December 31, 2016, 2015, and 2014, respectively.
152 GE 2016 FORM 10-K
FINANCIAL STATEMENTS INVESTMENT SECURITIES
GE 2016 FORM 10-K 153
NOTE 3. INVESTMENT SECURITIES
Substantially all of our investment securities are classified as available-for-sale and comprise mainly investment-grade debt securities supporting obligations to annuitants and policyholders in our run-off insurance operations. We do not have any securities classified as held-to-maturity.
2016 2015 Gross Gross Gross Gross Amortized unrealized unrealized Estimated Amortized unrealized unrealized Estimated December 31 (In millions) cost gains losses fair value cost gains losses fair value
GE Debt U.S. corporate $ 1 $ - $ - $ 2 $ 2 $ - $ - $ 3 Corporate – non-U.S. - - - - 1 - - 1 U.S. government and federal agency 49 - - 49 49 - - 49 Equity 54 34 (1) 86 87 13 (2) 98 104 34 (1) 137 139 14 (2) 151
GE Capital Debt U.S. corporate 20,048 3,081 (85) 23,044 19,971 2,669 (285) 22,355 State and municipal 3,916 412 (92) 4,236 3,910 407 (73) 4,245 Mortgage and asset-backed 2,787 111 (37) 2,861 2,995 157 (35) 3,116 Corporate – non-U.S. 11,917 98 (27) 11,987 759 96 (9) 846 Government – non-U.S. 1,137 127 (2) 1,262 279 136 - 415 U.S. government and federal agency 656 33 (25) 664 623 104 - 727 Equity 105 22 (1) 126 112 16 (4) 123 40,565 3,883 (268) 44,180 28,648 3,585 (407) 31,827
Eliminations (4) - - (4) (4) - - (4) Total $ 40,665 $ 3,917 $ (269) $ 44,313 $ 28,783 $ 3,599 $ (409) $ 31,973 Our corporate debt portfolio comprises securities issued by public and private corporations in various industries, mainly in the U.S. Substantially all of our corporate debt securities are rated investment grade by the major rating agencies. Mortgage and asset-backed securities substantially comprises commercial and residential mortgage-backed securities. Substantially all of these securities have investment-grade credit ratings. Our commercial mortgage-backed securities (CMBS) portfolio is collateralized by both diversified pools of mortgages that were originated for securitization (conduit CMBS) and pools of large loans backed by high-quality properties (large loan CMBS). Our residential mortgage-backed securities (RMBS) portfolio is collateralized primarily by pools of individual, direct mortgage loans, of which substantially all are in a senior position in the capital structure of the deals, not by other structured products such as collateralized debt obligations.
The fair value of investment securities increased to $44,313 million at December 31, 2016, from $31,973 million at December 31, 2015, primarily due to higher net purchases of Corporate – non-U.S. debt securities and higher net unrealized gains in U.S. Corporate.
GE 2016 FORM 10-K 153
FINANCIAL STATEMENTS INVESTMENT SECURITIES
154 GE 2016 FORM 10-K
ESTIMATED FAIR VALUE AND GROSS UNREALIZED LOSSES OF AVAILABLE-FOR-SALE INVESTMENT SECURITIES
In loss position for Less than 12 months 12 months or more Gross Gross Estimated unrealized Estimated unrealized (In millions) fair value(a) losses(a) fair value losses December 31, 2016 Debt U.S. corporate $ 1,692 $ (55) $ 359 $ (30) State and municipal 674 (27) 158 (64) Mortgage and asset-backed 822 (21) 132 (16) Corporate – non-U.S. 5,352 (26) 14 (1) Government - non-U.S. 313 (2) - - U.S. government and federal agency 236 (25) - - Equity 9 (1) - -
Total $ 9,098 $ (157) $ 663 $ (111) December 31, 2015 Debt U.S. corporate $ 2,966 $ (218) $ 433 $ (67) State and municipal 494 (20) 155 (53) Mortgage and asset-backed 719 (20) 84 (16) Corporate – non-U.S. 56 (4) 14 (4) Equity 36 (6) - -
Total $ 4,273 $ (269) $ 686 $ (140) (a) Includes the estimated fair value of and gross unrealized losses on equity securities held by GE.
Unrealized losses are not indicative of the amount of credit loss that would be recognized and at December 31, 2016 are primarily due to increases in market yields subsequent to our purchase of the securities. We presently do not intend to sell the vast majority of our debt securities that are in unrealized loss positions and believe that it is not more likely than not that we will be required to sell the vast majority of these securities before anticipated recovery of our amortized cost. The methodologies and significant inputs used to measure the amount of credit loss for our investment securities during 2016 have not changed. PRE-TAX, OTHER-THAN-TEMPORARY IMPAIRMENTS ON INVESTMENT SECURITIES (In millions) 2016 2015 2014
Total recognized $ 31 $ 64 $ 316 Recognized in AOCI - - (4)Recognized in earnings(a) $ 31 $ 64 $ 312 (a) Included equity securities of $11 million, $5 million and $219 million in 2016, 2015 and 2014, respectively. CONTRACTUAL MATURITIES OF INVESTMENT IN AVAILABLE-FOR-SALE DEBT SECURITIES (EXCLUDING MORTGAGE AND ASSET-BACKED SECURITIES) Amortized Estimated(In millions) cost fair value
Due Within one year $ 7,139 $ 7,148 After one year through five years 7,947 8,124 After five years through ten years 4,996 5,410 After ten years 17,641 20,562 We expect actual maturities to differ from contractual maturities because borrowers have the right to call or prepay certain obligations.
154 GE 2016 FORM 10-K

FINANCIAL STATEMENTS CURRENT RECEIVABLES
GE 2016 FORM 10-K 155
GROSS REALIZED GAINS AND LOSSES ON AVAILABLE-FOR-SALE INVESTMENT SECURITIES
(In millions) 2016 2015 2014
GE Gains $ 11 $ 7 $ 3 Losses, including impairments (12) (36) (218)Net (2) (29) (215)
GE Capital Gains 50 121 87 Losses, including impairments (43) (51) (104)Net 7 70 (16)Total $ 6 $ 41 $ (231) Although we generally do not have the intent to sell any specific securities at the end of the period, in the ordinary course of managing our investment securities portfolio, we may sell securities prior to their maturities for a variety of reasons, including diversification, credit quality, yield and liquidity requirements and the funding of claims and obligations to policyholders. Proceeds from investment securities sales and early redemptions by issuers totaled $1,718 million, $5,746 million, and $1,898 million for the years ended December 31, 2016, 2015, and 2014, respectively. In 2016 and 2015, investment securities sales were principally of U.S. government and federal agency and mortgage and asset-backed securities. NOTE 4. CURRENT RECEIVABLES Consolidated(a)(b) GE(c) December 31 (In millions) 2016 2015 2016 2015 Power $ 7,688 $ 6,675 $ 3,632 $ 4,377 Renewable Energy 1,903 2,336 1,293 1,418 Oil & Gas 4,259 4,958 2,478 2,764 Energy Connections & Lighting 2,716 4,432 1,675 2,173 Aviation 3,542 4,133 1,731 1,876 Healthcare 3,996 4,022 2,068 1,943 Transportation 377 609 186 193 Corporate items and eliminations 454 372 499 464 24,935 27,538 13,562 15,209 Less Allowance for Losses(d) (858) (515) (847) (502) Total $ 24,076 $ 27,022 $ 12,715 $ 14,707
(a) Included GE industrial customer receivables sold to a GE Capital affiliate and reported as financing receivables by GE Capital of $12,304 million and $13,041 million at December 31, 2016 and 2015, respectively. The December 31, 2016 total included a deferred purchase price receivable of $483 million from the refinancing of our Receivables Facility described in Note 22.
(b) In order to manage credit exposure, the Company sells additional current receivables to third parties outside the Receivables Facility described in Note 22. In connection with certain of these sales, we provide servicing activities and limited recourse to the purchasers. At December 31, 2016 and 2015, GE serviced $2,962 million and $2,167 million, respectively, of these receivables that remain outstanding. Of these balances, $458 million and $378 million at December 31, 2016 and 2015, respectively, were current receivables serviced by GE Capital that GE sold directly to third-parties. At December 31, 2016 and 2015, our maximum exposure to loss under the limited recourse arrangements is $215 million and $154 million, respectively.
(c) GE current receivables of $299 million and $251 million at December 31, 2016 and 2015, respectively, arose from sales, principally of Aviation goods and services, on open account to various agencies of the U.S. government. As a percentage of GE revenues, approximately 3% of GE sales of goods and services were to the U.S. government in 2016, compared with 4% in 2015 and 3% in 2014.
(d) The 2016 increase in allowance for losses is primarily due to Alstom purchase price adjustments of $263 million.
GE current receivables balances at December 31, 2016 and 2015, before allowance for losses, included $8,927 million and $10,535 million, respectively, from sales of goods and services to customers. The remainder of the balances primarily relates to supplier advances, revenue sharing programs and other non-income based tax receivables.
GE 2016 FORM 10-K 155
FINANCIAL STATEMENTS INVENTORIES & FINANCING RECEIVABLES
156 GE 2016 FORM 10-K
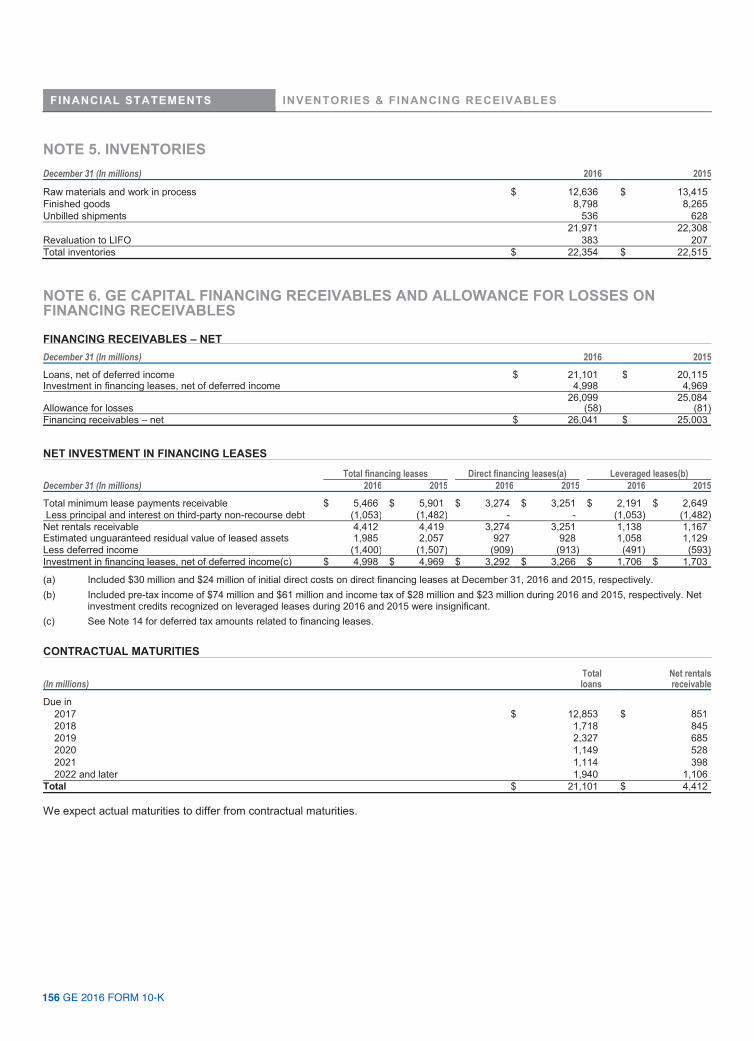
NOTE 5. INVENTORIES December 31 (In millions) 2016 2015
Raw materials and work in process $ 12,636 $ 13,415 Finished goods 8,798 8,265 Unbilled shipments 536 628 21,971 22,308 Revaluation to LIFO 383 207 Total inventories $ 22,354 $ 22,515 NOTE 6. GE CAPITAL FINANCING RECEIVABLES AND ALLOWANCE FOR LOSSES ON FINANCING RECEIVABLES FINANCING RECEIVABLES – NET
December 31 (In millions) 2016 2015
Loans, net of deferred income $ 21,101 $ 20,115 Investment in financing leases, net of deferred income 4,998 4,969 26,099 25,084 Allowance for losses (58) (81)Financing receivables – net $ 26,041 $ 25,003
NET INVESTMENT IN FINANCING LEASES
Total financing leases Direct financing leases(a) Leveraged leases(b) December 31 (In millions) 2016 2015 2016 2015 2016 2015
Total minimum lease payments receivable $ 5,466 $ 5,901 $ 3,274 $ 3,251 $ 2,191 $ 2,649 Less principal and interest on third-party non-recourse debt (1,053) (1,482) - - (1,053) (1,482) Net rentals receivable 4,412 4,419 3,274 3,251 1,138 1,167 Estimated unguaranteed residual value of leased assets 1,985 2,057 927 928 1,058 1,129 Less deferred income (1,400) (1,507) (909) (913) (491) (593) Investment in financing leases, net of deferred income(c) $ 4,998 $ 4,969 $ 3,292 $ 3,266 $ 1,706 $ 1,703
(a) Included $30 million and $24 million of initial direct costs on direct financing leases at December 31, 2016 and 2015, respectively. (b) Included pre-tax income of $74 million and $61 million and income tax of $28 million and $23 million during 2016 and 2015, respectively. Net
investment credits recognized on leveraged leases during 2016 and 2015 were insignificant. (c) See Note 14 for deferred tax amounts related to financing leases.
CONTRACTUAL MATURITIES Total Net rentals (In millions) loans receivable
Due in 2017 $ 12,853 $ 851 2018 1,718 845 2019 2,327 685 2020 1,149 528 2021 1,114 398 2022 and later 1,940 1,106
Total $ 21,101 $ 4,412 We expect actual maturities to differ from contractual maturities.
156 GE 2016 FORM 10-K

FINANCIAL STATEMENTS PROPERTY, PLANT AND EQUIPMENT
GE 2016 FORM 10-K 157
We manage our financing receivables portfolio using delinquency and nonaccrual data as key performance indicators. At December 31, 2016, $811 million (3.1%), $407 million (1.6%) and $322 million (1.2%) of financing receivables were over 30 days past due, over 90 days past due and on nonaccrual, respectively. Of the $322 million of nonaccrual financing receivables at December 31, 2016, the vast majority are secured by collateral and $68 million are currently paying in accordance with the contractual terms. At December 31, 2015, $622 million (2.5%), $201 million (0.8%) and $256 million (1.0%) of financing receivables were over 30 days past due, over 90 days past due and on nonaccrual, respectively. The recorded investment in impaired loans at December 31, 2016 and December 31, 2015 was $262 million and $175 million, respectively. The method used to measure impairment for these loans is primarily based on collateral value. At December 31, 2016, troubled debt restructurings included in impaired loans were $176 million. NOTE 7. PROPERTY, PLANT AND EQUIPMENT Depreciable lives-new Original Cost Net Carrying Value December 31 (Dollars in millions) (in years) 2016 2015 2016 2015 GE Land and improvements 8 (a) $ 932 $ 888 $ 910 $ 870 Buildings, structures and related equipment 8-40 9,680 10,050 6,016 5,440 Machinery and equipment 4-20 24,596 24,515 9,369 9,986 Leasehold costs and manufacturing plant under construction 1-10 3,407 4,359 2,809 3,849 38,615 39,812 19,103 20,145 GE Capital(b)
Land and improvements, buildings, structures and related equipment
1-10 (a) 238 267 68 101
Equipment leased to others Aircraft(c) 15-20 47,360 50,339 31,786 34,316 All other 3-35 587 543 371 364 48,185 51,149 32,225 34,781 Eliminations (925) (939) (809) (831) Total $ 85,875 $ 90,022 $ 50,518 $ 54,095
(a) Depreciable lives exclude land. (b) Included $1,457 million and $1,024 million of original cost of assets leased to GE with accumulated amortization of $147 million and $83
million at December 31, 2016 and 2015, respectively. (c) The GECAS business of GE Capital recognized impairment losses of $99 million and $168 million in 2016 and 2015, respectively. These
losses are recorded in the caption “Cost of services sold” in the Statement of Earnings to reflect adjustments to fair value based on management’s best estimates, which are benchmarked against third-party appraiser current market values for aircraft of similar type and age.
Consolidated depreciation and amortization related to property, plant and equipment was $4,997 million, $4,847 million and $4,953 million in 2016, 2015 and 2014, respectively. Amortization of GE Capital equipment leased to others was $2,231 million, $2,266 million and $2,386 million in 2016, 2015 and 2014, respectively. Noncancellable future rentals due from customers for equipment on operating leases at December 31, 2016, are as follows: (In millions) Due in 2017 $ 3,684 2018 3,307 2019 2,912 2020 2,575 2021 2,144 2022 and later 6,338 Total $ 20,961
GE 2016 FORM 10-K 157

FINANCIAL STATEMENTS ACQUISITIONS & INTANGIBLE ASSETS
158 GE 2016 FORM 10-K
NOTE 8. ACQUISITIONS, GOODWILL AND OTHER INTANGIBLE ASSETS
ACQUISITIONS In the fourth quarter of 2016, we acquired two European 3-D printing companies in our Aviation segment. On November 17, 2016, we acquired an additional 61.9% of the shares of Arcam AB, a Swedish company specializing in electron beam melting systems, for $422 million to bring our total ownership stake to 76.2%. Upon gaining control, we fair valued the business including our previously held 14.3% equity interest. The preliminary purchase price allocation resulted in goodwill of approximately of $495 million and amortizable intangible assets of approximately $95 million. On December 8, 2016, we acquired 75% of Concept Laser GmbH, a German company specializing in powder-bed based laser metal printing, for $573 million. GE holds a call option on the 25% noncontrolling interest that is exercisable for a one-year period beginning on the third anniversary of the acquisition date. The non-controlling interest holds a put option that is exercisable for a one-year period beginning on the fifth anniversary of the closing date. The preliminary purchase price allocation resulted in goodwill of approximately of $550 million and amortizable intangible assets of approximately $170 million. The allocation of purchase prices will be finalized upon completion of post-closing procedures. On November 9, 2016, we acquired the remaining 89% of Bit Stew, a software company specializing in gathering data from connected devices in complex industrial systems to help companies plan predictive maintenance and optimize productivity, for $129 million. Upon gaining control, we fair valued the business including our previously held 11% equity interest. The preliminary purchase price allocation resulted in goodwill of approximately $110 million and amortizable intangible assets of approximately $50 million. The allocation of the purchase price will be finalized upon completion of post-closing procedures. On October 31, 2016, we announced an agreement with Baker Hughes Incorporated (Baker Hughes) to combine GE’s Oil & Gas business and Baker Hughes to create a new company. The transaction will be executed using a partnership structure, pursuant to which GE Oil & Gas and Baker Hughes will each contribute their operating assets to a newly formed partnership. GE will have a 62.5% interest in this partnership and existing Baker Hughes shareholders will have a 37.5% interest through a newly NYSE listed corporation. Baker Hughes shareholders will also receive a special one-time cash dividend of $17.50 per share at closing. GE will contribute $7.4 billon to the new partnership to fund the cash dividend to existing Baker Hughes shareholders. The transaction is subject to the approval of Baker Hughes shareholders, regulatory approvals and other customary closing conditions. On September 14, 2016, we acquired the remaining 74% of the software developer Meridium Inc. for $370 million. Upon gaining control, we fair valued the business including our previously held 26% equity interest. The preliminary purchase price allocation resulted in goodwill of approximately $350 million and amortizable intangible assets of approximately $165 million. The allocation of the purchase price will be finalized upon completion of post-closing procedures. On May 10, 2016, we announced the pending acquisition of the heat recovery steam generator (HRSG) business from Doosan Engineering & Construction (Doosan) for $250 million. On August 16, 2016, we acquired 80% of the HRSG business for approximately $220 million. The remaining 20% of the HRSG business continues to be subject to local regulatory requirements and we expect a staggered close beginning in the first quarter of 2017 through the first half of 2017. The preliminary purchase price allocation resulted in goodwill of approximately $170 million and amortizable intangible assets of approximately $35 million. The allocation of the purchase price will be finalized upon completion of post-closing procedures. On January 30, 2015, we acquired Milestone Aviation Group (Milestone Aviation), a helicopter leasing business, for approximately $1,750 million, which is included in our Capital segment. The purchase price allocation resulted in goodwill of approximately $730 million and amortizable intangible assets of approximately $345 million. On November 2, 2015, we acquired the Thermal, Renewables and Grid businesses from Alstom. The purchase price was €9,200 million ($10,124 million), net of cash acquired of approximately €1,600 million ($1,765 million). In order to obtain approval by the European Commission and the Department of Justice, GE pledged to sell certain of Alstom's gas-turbine assets and its Power Systems Manufacturing subsidiary to Ansaldo Energia SpA (Ansaldo) after the close of the transaction for approximately €120 million. The purchase price will be paid by Ansaldo over a period of five years. The transaction closed on February 25, 2016. We formed three consolidated joint ventures with Alstom in grid technology, renewable energy, and global nuclear and French steam power. In addition, GE contributed its Digital Energy business to the grid technology joint venture.
158 GE 2016 FORM 10-K

FINANCIAL STATEMENTS ACQUISITIONS & INTANGIBLE ASSETS
GE 2016 FORM 10-K 159
Alstom holds redemption rights with respect to its interest in the grid technology and renewable energy joint ventures, which, if exercised, would require us to purchase all of their interest during September 2018 or September 2019. Alstom also holds similar redemption rights for the global nuclear and French steam power joint venture that are exercisable during the first full calendar quarter immediately following the fifth or sixth anniversary of the acquisition date. The redemption price would generally be equal to Alstom's initial investment plus annual accretion of 3% for the grid technology and renewable energy joint ventures and plus annual accretion of 2% for the nuclear and French steam power joint venture, with potential upside sharing based on an EBITDA multiple. Alstom also holds additional redemption rights in other limited circumstances as well as a call option to require GE to sell all of its interests in the renewable energy joint venture at the higher of fair value or Alstom's initial investment plus annual accretion of 3% during the month of May in the years 2016 through 2019 and also upon a decision to IPO the joint venture. GE holds a call option on Alstom's interest in the global nuclear and French steam power joint venture at the same amount as Alstom's redemption price in the event that Alstom exercises its put option in the grid technology or renewable energy joint ventures. GE also has call options on Alstom's interest in the three joint ventures in other limited circumstances. In addition, the French Government holds a preferred interest in the global nuclear and French steam power joint venture, giving it certain protective rights. The acquisition and alliances with Alstom will have a significant effect on our Power, Energy Connections and Renewable Energy segments, and to a lesser extent our Oil & Gas segment. The financial impact of acquired businesses on individual segments will be affected by a number of variables, including operating performance, purchase accounting effects and realized synergies. In addition, due to the amount of time that elapsed between signing and closing, the commercial operations of the businesses were negatively affected primarily as a result of uncertainty among Alstom customers regarding the execution of the transaction. This affected the overall valuation of the acquired businesses at the time of close and, accordingly, is reflected among the initial and adjusted amounts assigned to the assets and liabilities recorded in purchase accounting. ALSTOM ACQUISITION ACCOUNTING UPDATE The total consideration for the acquired businesses, at the time of close in November 2015 included our purchase price of $10,124 million (net of cash acquired) and a preliminary valuation of noncontrolling interests, of approximately $3,600 million for a total of approximately $13,700 million. In the fourth quarter of 2015, the preliminary allocation of purchase price resulted in goodwill, intangible assets and unfavorable customer contract liabilities of approximately $13,500 million, $5,200 million, and $1,100 million respectively. The amount of goodwill recognized compared with identifiable intangible assets is affected by estimated GE-specific synergies, which are not permitted to be included in the measurement of identifiable intangibles. Such synergies include additional revenue from cross-selling complementary product lines. The preliminary fair value of the associated noncontrolling interests consisted of approximately $2,900 million for Alstom's redeemable noncontrolling interests in the three joint ventures (presented separately from total equity in the consolidated statement of financial position) and $700 million for all other noncontrolling interests. Through the fourth quarter of 2016, we adjusted the preliminary allocation of purchase price, which has now resulted in goodwill, intangible assets, and unfavorable customer contract liabilities, of $17,304 million, $4,370 million, and $2,720 million, respectively as of the acquisition date. These adjustments, which are necessary to reflect acquired assets and liabilities of the acquired businesses at fair value, reflected revisions in 2016, primarily related to cash flow and other valuation assumptions for customer contracts, increases to legal reserves, and other fair value adjustments related to acquired assets and liabilities. The approximate amounts of significant purchase accounting adjustments recorded since the date of acquisition include a reduction in the book value of assets sold to Ansaldo of $405 million, adjustments to the fair value of derivative contracts of $335 million, decreases in inventory balances of $130 million, increases to legal reserves of $990 million, a reduction in the book value of aged accounts receivable of $175 million and other project related costs such as warranty provisions and liquidating damages of $665 million. In addition, the fair value of all other noncontrolling interests decreased by $55 million. See Note 23 for further information about legal reserves for Alstom legacy matters. In addition to purchase price allocation based on the fair value of acquired assets and liabilities, other adjustments were necessary to reflect differences between IFRS and GAAP, as applied to differences in facts and circumstances between those businesses as part of Alstom and as part of GE post acquisition. The table below presents consideration paid, amounts of assets acquired and liabilities assumed as of the acquisition date, inclusive of the purchase accounting adjustments and IFRS to GAAP adjustments recorded as of December 31, 2016, and the fair value of the non-controlling interest.
GE 2016 FORM 10-K 159

FINANCIAL STATEMENTS ACQUISITIONS & INTANGIBLE ASSETS
160 GE 2016 FORM 10-K
ASSETS ACQUIRED AND LIABILITIES ASSUMED AT THE ACQUISITION DATE Balance at (In millions) December 31, 2016 Assets Cash and equivalents $ 1,766 Current receivables 4,064 Inventories 4,663 Property, plant and equipment 2,782 Goodwill 17,304 Other intangible assets 4,370 All other assets, net(a) 3,673 Total Assets $ 38,622 Liabilities Accounts payable $ 1,908 Progress collections 2,919 Accrued contract liabilities 10,714 All other liabilities(b) 7,658 Total Liabilities $ 23,199 Redeemable noncontrolling interests 2,921 Noncontrolling interest 612 Total purchase price 11,890 Less cash acquired 1,766 Total purchase price, net of cash acquired $ 10,124 (a) Included approximately $156 million of net deferred tax assets, including approximately $52 million of non-U.S. loss carry forwards net of
valuation allowances and offsetting liabilities for unrecognized benefits. Also included approximately $76 million of indemnification receivables for liabilities for unrecognized income tax benefits and other tax uncertainties.
(b) Included approximately $859 million of liabilities for unrecognized income tax benefits and other uncertain taxes and approximately $772 million of pension and other employee related costs.
GOODWILL CHANGES IN GOODWILL BALANCES 2016 2015 Dispositions, Dispositions, currency currency Balance at exchange Balance at Balance at exchange Balance at (In millions) January 1 Acquisitions and other December 31 January 1 Acquisitions and other December 31 Power $ 16,736 $ 3,347 $ (268) $ 19,816 $ 7,769 $ 9,582 $ (615) $ 16,736 Renewable Energy 2,580 (46) (27) 2,507 984 1,631 (35) 2,580 Oil & Gas 10,594 - (231) 10,363 10,572 22 - 10,594 Aviation 8,567 1,045 (158) 9,455 8,952 - (385) 8,567 Healthcare 17,353 191 (120) 17,424 17,532 11 (190) 17,353 Transportation 851 41 6 899 887 - (36) 851 Energy Connections & Lighting 6,441 846 (420) 6,868 4,796 2,314 (669) 6,441 Capital 2,370 - (1) 2,368 1,680 728 (37) 2,370 Corporate 34 487 218 739 34 - - 34 Total $ 65,526 $ 5,911 $ (1,000) $ 70,438 $ 53,207 $ 14,287 $ (1,968) $ 65,526 Goodwill balances increased by $4,912 million in 2016, primarily as a result of the Alstom acquisition purchase accounting adjustments and other acquisitions, partially offset by currency exchange effects of a stronger U.S. dollar against other major currencies. Goodwill balances increased $12,319 million in 2015, primarily as a result of the Alstom and Milestone Aviation acquisitions, partially offset by currency exchange effects of the stronger U.S. dollar and disposals.
160 GE 2016 FORM 10-K

FINANCIAL STATEMENTS ACQUISITIONS & INTANGIBLE ASSETS
GE 2016 FORM 10-K 161
We test goodwill for impairment annually in the third quarter of each year using data as of July 1 of that year. The impairment test consists of two steps: in step one, the carrying value of the reporting unit is compared with its fair value; in step two, which is applied when the carrying value is more than its fair value, the amount of goodwill impairment, if any, is derived by deducting the fair value of the reporting unit’s assets and liabilities from the fair value of its equity, and comparing that amount with the carrying amount of goodwill. We determined fair values for each of the reporting units using the market approach, when available and appropriate, or the income approach, or a combination of both. We assess the valuation methodology based upon the relevance and availability of the data at the time we perform the valuation. If multiple valuation methodologies are used, the results are weighted appropriately. Valuations using the market approach are derived from metrics of publicly traded companies or historically completed transactions of comparable businesses. The selection of comparable businesses is based on the markets in which the reporting units operate giving consideration to risk profiles, size, geography, and diversity of products and services. A market approach is limited to reporting units for which there are publicly traded companies that have the characteristics similar to our businesses. Under the income approach, fair value is determined based on the present value of estimated future cash flows, discounted at an appropriate risk-adjusted rate. We use our internal forecasts to estimate future cash flows and include an estimate of long-term future growth rates based on our most recent views of the long-term outlook for each business. Actual results may differ from those assumed in our forecasts. We derive our discount rates using a capital asset pricing model and analyzing published rates for industries relevant to our reporting units to estimate the cost of equity financing. We use discount rates that are commensurate with the risks and uncertainty inherent in the respective businesses and in our internally developed forecasts. Discount rates used in our reporting unit valuations ranged from 9.5% to 16.5%. During the third quarter of 2016, we performed our annual impairment test of goodwill for all of our reporting units. Based on the results of our step one testing, the fair values of each of the GE reporting units exceeded their carrying values; therefore, the second step of the impairment test was not required to be performed for any of our reporting units and no goodwill impairment was recognized. While all of our reporting units passed step one of our annual impairment testing in 2016, we identified four reporting units for which the fair value was not substantially in excess of its carrying value. Due to the continuation of depressed oil and natural gas prices, the fair value of our Energy Financial Services reporting unit, within our Capital operating segment, continues to be impacted and was in excess of its carrying value by approximately 2%. Based on the results of the step one testing, we further substantiated our Energy Financial Services goodwill balance by performing the second step analysis in which the implied fair value of goodwill exceeded its carrying value by approximately $670 million. We continued to monitor the volatility in the oil and gas environment during the fourth quarter and updated our analysis using data as of October 1, 2016. This analysis indicated that the fair value of our Energy Financial Services reporting unit was significantly in excess of its carrying value. The improvement in fair value over its carrying value was driven by higher forecasted investment and return performance, reflecting stabilization in the commodities markets. The estimated fair value of the Energy Financial Services reporting unit is based on a number of assumptions about future business performance and investment, including the performance of our renewable investment portfolio and the expected proceeds and timing of non-strategic investment divestitures. While all reporting units within our Oil & Gas operating segment are significantly in excess of their carrying value, the business continues to experience declines in orders, project commencement delays and pricing pressures, which affect their fair value. While the goodwill of the Energy Financial Services and Oil & Gas reporting units are not currently impaired, we will continue to monitor the oil & gas industry and the impact it may have on these businesses. In addition, due to a decline in order growth and an increase in the order-to-cash cycle, the fair value of the Power Conversion reporting unit, within our Energy Connections operating segment, was impacted and was in excess of its carrying value by approximately 9%. Due to continued decline in order growth and increase to the order-to-cash cycle, we performed an impairment test in the fourth quarter using data as of December 1, 2016, which resulted in the fair value of our Power Conversion reporting unit to be in excess of its carrying value by approximately 8%. The goodwill associated with our Power Conversion reporting unit was $987 million at December 31, 2016, representing approximately 1% of our total goodwill. While the goodwill of the reporting unit is not currently impaired, there could be an impairment in the future as a result of changes in certain assumptions. For example, the reporting unit’s fair value could be adversely affected and result in an impairment of goodwill if actual cash flows are below estimated cash flows, the estimated cash flows are discounted at a higher risk-adjusted rate or market multiples decrease.
GE 2016 FORM 10-K 161

FINANCIAL STATEMENTS ACQUISITIONS & INTANGIBLE ASSETS
162 GE 2016 FORM 10-K
Finally, two reporting unit fair values were impacted as a result of the Alstom transaction. Subsequent to the close of the acquisition of Alstom, we formed two new reporting units, Grid Solutions and Hydro. The Alstom Grid business was combined with our Digital Energy business, within our Energy Connections operating segment, to create the new Grid Solutions reporting unit and the Alstom Hydro business is a newly created reporting unit within our Renewable Energy operating segment. Since fair values equaled carrying value at the time of acquisition, this caused the fair values of these reporting units not to be significantly in excess of their carrying values. As the fair values of these reporting units are not significantly in excess of their carrying values, we performed impairment tests in the fourth quarter using data as of December 1, 2016, which resulted in the fair value of the Hydro reporting unit approximating its carrying value and the excess of fair value over carrying value of the Grid Solutions reporting unit being approximately 3%. The goodwill associated with our Hydro and Grid Solutions reporting units was $899 million and $4,405 million, respectively, representing approximately 1% and 6% of our total goodwill at December 31, 2016. While the goodwill of these reporting units are not currently impaired, there could be an impairment in the future as a result of changes in certain assumptions. For example, the fair value of these reporting units could be adversely affected and result in impairments of goodwill if expected synergies of the acquisition with Alstom are not realized or if the reporting units were not able to execute on customer opportunities, the estimated cash flows are discounted at a higher risk-adjusted rate or market multiples decrease. As of December 31, 2016, we believe that the goodwill is recoverable for all of the reporting units; however, there can be no assurances that the goodwill will not be impaired in future periods. In 2015, we identified one reporting unit for which the fair value was not substantially in excess of its carrying value. Due to the sharp decline experienced in oil prices and the prospect of a continuation of prevailing oil prices, the fair value of our Energy Financial Services reporting unit, within our Capital operating segment, had been affected and was in excess of its carrying value by approximately 13%. Due to the continued decline in oil prices, we performed an impairment test in the fourth quarter using data as of December 31, 2015, which resulted in the fair value of our Energy Financial Services reporting unit being in excess of its carrying value by approximately 12%. In the current year, the fair value of the Energy Financial Services reporting unit continues to be impacted by the market conditions within the oil & gas industry as discussed above. In 2015, although not impaired, our Oil & Gas business had also experienced declines in orders, project commencement delays and pricing pressures, which affected the fair value of our Oil & Gas reporting units. Our Oil & Gas business continues to be affected by the overall market conditions as discussed above. Estimating the fair value of reporting units requires the use of estimates and significant judgments that are based on a number of factors including actual operating results. It is reasonably possible that the judgments and estimates described above could change in future periods. OTHER INTANGIBLE ASSETS OTHER INTANGIBLE ASSETS - NET December 31 (In millions) 2016 2015
Intangible assets subject to amortization $ 16,336 $ 17,688 Indefinite-lived intangible assets(a) 100 109 Total $ 16,436 $ 17,797 (a) Indefinite-lived intangible assets principally comprise trademarks and in-process research and development.
162 GE 2016 FORM 10-K

FINANCIAL STATEMENTS ACQUISITIONS & INTANGIBLE ASSETS
GE 2016 FORM 10-K 163
INTANGIBLE ASSETS SUBJECT TO AMORTIZATION
2016 2015 Gross Gross carrying Accumulated carrying Accumulated December 31 (In millions) amount amortization Net amount amortization Net
Customer-related $ 9,172 $ (2,408) $ 6,764 $ 9,758 $ (2,113) $ 7,645 Patents and technology 8,693 (3,325) 5,368 8,543 (3,096) 5,447 Capitalized software 7,652 (4,538) 3,114 7,375 (4,136) 3,239 Trademarks 1,165 (307) 858 1,337 (282) 1,055 Lease valuations 143 (59) 84 167 (22) 145 Present value of future profits(a) 684 (684) - 651 (651) - All other 273 (124) 149 267 (108) 159 Total $ 27,781 $ (11,444) $ 16,336 $ 28,098 $ (10,408) $ 17,688
(a) Balances at December 31, 2016 and 2015 reflect adjustments of $241 million and $266 million, respectively, to the present value of future profits in our run-off insurance operation to reflect the effects that would have been recognized had the related unrealized investment securities holding gains and losses actually been realized.
GE amortization expense related to intangible assets subject to amortization was $1,704 million, $1,505 million and $1,386 million in 2016, 2015 and 2014, respectively. GE Capital amortization expense related to intangible assets subject to amortization was $131 million, $148 million and $84 million in 2016, 2015 and 2014, respectively. Estimated GE Consolidated annual pre-tax amortization for intangible assets over the next five calendar years follows. ESTIMATED 5 YEAR CONSOLIDATED AMORTIZATION (In millions) 2017 2018 2019 2020 2021 Estimated annual pre-tax amortization $ 2,058 $ 1,947 $ 1,846 $ 1,666 $ 1,519 During 2016 we recorded additions to intangible assets subject to amortization of $2,313 million. The components of finite-lived intangible assets acquired during 2016 and their respective weighted-average amortizable periods follow. COMPONENTS OF FINITE-LIVED INTANGIBLE ASSETS ACQUIRED DURING 2016
Weighted-average Gross amortizable period(In millions) carrying value (in years)
Customer-related $ 387 15.3 Patents and technology 804 12.4 Capitalized software 1,107 5.0 Trademarks 11 7.2 All other 3 3.0
GE 2016 FORM 10-K 163

FINANCIAL STATEMENTS CONTRACT ASSETS AND ALL OTHER ASSETS
164 GE 2016 FORM 10-K
NOTE 9. CONTRACT ASSETS AND ALL OTHER ASSETS December 31 (In millions) 2016 2015 GE Revenue in excess of billings Long-term product service agreements(a) $ 12,752 $ 10,346 Long-term equipment contract revenue(b) 5,859 5,645 Total revenue in excess of billings 18,611 15,991 Deferred inventory costs(c) 3,349 2,328 Non-recurring engineering costs(d) 2,185 1,790 Other 1,018 1,048 Contract assets $ 25,162 $ 21,156 (a) Long-term product service agreement balances are presented net of related billings in excess of revenues of $3,750 million and $2,602 million
at December 31, 2016 and 2015, respectively. (b) Reflects revenues earned in excess of billings on our long-term contracts to construct technically complex equipment (such as gas power
systems). (c) Represents cost deferral for shipped goods (such as components for wind turbine assembly within our Renewable Energy segment) and other
costs for which the criteria for revenue recognition has not yet been met. (d) Included costs incurred prior to production (e.g., requisition engineering) for long-term equipment production contracts, primarily within our
Aviation segment, which are allocated ratably to each unit produced. Contract assets increased $4,006 million in 2016, which was primarily driven by a change in estimated profitability within our long-term product service agreements resulting in an adjustment of $2,216 million, as well as an increase in deferred inventory costs. December 31 (In millions) 2016 2015 GE Investments Associated companies $ 3,574 $ 3,582 Other 631 644 4,205 4,226 Long-term receivables, including notes 2,433 2,310 Derivative instruments 313 733 Other(a) 5,055 5,544 12,007 12,813 GE Capital Investments Associated companies 8,124 8,373 Assets held for sale(b) 2,361 857 Time deposits(c) - 10,386 Other 122 97 10,607 19,713 Derivative instruments 32 549 Advances to suppliers 1,632 1,809 Other(d) 2,337 3,010 14,608 25,081 Eliminations 561 (1,097)All Other Assets $ 27,176 $ 36,797
(a) Primarily included $3,320 million and $3,494 million of prepaid insurance, taxes and other expenses and $789 million and $1,030 million of deferred charges at December 31, 2016 and 2015, respectively.
(b) Assets were classified as held for sale on the date a decision was made to dispose of them through sale or other means. At December 31, 2016 and 2015, such assets consisted primarily of loans, aircraft and equipment, and were accounted for at the lower of carrying amount or estimated fair value less costs to sell.
(c) Balances at December 31, 2015 included $10,386 million of high quality interest bearing deposits with European branches of global banks, predominantly in the U.K., that matured in April 2016.
(d) Balances at December 31, 2016 and 2015 included deferred acquisition cost adjustments of $558 million and $544 million, respectively, in our run-off insurance operations to reflect the effects that would have been recognized had the related unrealized investment securities holding gains and losses actually been realized.
164 GE 2016 FORM 10-K

FINANCIAL STATEMENTS BORROWINGS
GE 2016 FORM 10-K 165
NOTE 10. BORROWINGS December 31 (Dollars in millions) 2016 2015
Short-term borrowings Amount Average
Rate(a) Amount Average
Rate(a) GE Commercial paper $ 1,500 0.60 % $ 500 0.15 % Current portion of long-term borrowings 17,109 3.16 17,770 2.10 Other 1,874 1,522 Total GE short-term borrowings(b) 20,482 19,792
GE Capital Commercial paper U.S. 5,002 0.59 650 0.46 Non-U.S. - - 4,351 0.01 Current portion of long-term borrowings(c) 6,517 1.64 24,969 4.28 Intercompany payable to GE(d) 11,696 17,642 Other 229 1,005 Total GE Capital short-term borrowings 23,443 48,617 Eliminations(d) (13,212) (18,549) Total short-term borrowings $ 30,714 $ 49,860
Long-term borrowings Maturities Amount Average
Rate(a) Amount Average
Rate(a) GE Senior notes 2018-2054 $ 54,396 3.35 % $ 72,471 3.23 % Subordinated notes 2021-2037 2,768 3.73 2,940 3.68 Subordinated debentures(e) 2067 719 6.12 6,600 6.14 Other 928 1,298 Total GE long-term borrowings(b) 58,810 83,309
GE Capital Senior notes 2018-2039 44,131 2.45 59,107 2.54 Subordinated notes 236 251 - Intercompany payable to GE(d) 47,084 67,062 Other(c) 1,992 2,058 Total GE Capital long-term borrowings 93,443 128,478 Eliminations(d) (47,173) (67,128) Total long-term borrowings $ 105,080 $ 144,659 Non-recourse borrowings of consolidated securitization entities(f) 2017-2018 $ 417 2.23 % $ 3,083 1.00 % Total borrowings $ 136,210 $ 197,602
(a) Based on year-end balances and year-end local currency effective interest rates, including the effects from hedging. (b) Excluding assumed debt of GE Capital, the total amount of GE borrowings was $20,512 million at December 31, 2016. (c) Included $2,665 million and $2,679 million of funding secured by aircraft and other collateral at December 31, 2016 and December 31, 2015,
respectively, of which $1,419 million and $1,534 million is non-recourse to GE Capital at December 31, 2016 and December 31, 2015, respectively.
(d) The amount of the intercompany payable to GE was $58,780 million as of December 31, 2016, which includes a reduction in the short-term intercompany payable to GE for a $(1,329) million loan which bears the right of offset against amounts owed under the assumed debt agreement. The remaining short-term loan balance was paid in January 2017.
(e) Included $719 million and $2,587 million of subordinated debentures at December 31, 2016 and December 31, 2015, respectively, which constitute the sole assets of trusts that have issued trust preferred securities and where GE owns 100% of the common securities of the trusts. Obligations associated with these trusts are unconditionally guaranteed by GE.
(f) Included $320 million and $918 million of current portion of long-term borrowings at December 31, 2016 and December 31, 2015, respectively. See Note 21.
GE 2016 FORM 10-K 165

FINANCIAL STATEMENTS BORROWINGS
166 GE 2016 FORM 10-K
On June 3, 2016, GE commenced an offering to exchange $19.6 billion of all the outstanding, unregistered senior notes that were issued by GE Capital International Funding Company Unlimited Company in a private offering on October 26, 2015, for identical, registered 2.342% Senior Notes due 2020, 3.373% Senior Notes due 2025 and 4.418% Senior Notes due 2035. The exchange offer was completed on July 8, 2016.
As discussed in Note 1, the adoption of ASU 2015-03 resulted in the reclassification of $674 million of unamortized debt issuance costs related to the Company’s borrowings, of which $641 million was reclassified in long-term borrowings and $33 million was reclassified in short-term borrowings, within our consolidated balance sheet as of December 31, 2015.
On April 10, 2015, GE provided a full and unconditional guarantee on the payment of the principal and interest on all tradable senior and subordinated outstanding long-term debt securities and all commercial paper issued or guaranteed by GE Capital. $92,537 million of such debt was assumed by GE on December 2, 2015 upon its merger with GE Capital resulting in an intercompany payable to GE. At December 31, 2016, the amount of the intercompany payable to GE was $58,780 million, which includes a reduction in the short-term intercompany payable to GE for a $(1,329) million loan to GE which bears the right of offset against amounts owed under the assumed debt agreement. The remaining short-term loan balance was paid in January 2017. The Guarantee applies to approximately $47,476 million of GE Capital debt. Prior to the merger $35,999 million (representing $31,154 million of outstanding principal and $4,846 million of premium) of GE Capital debt was exchanged into a new GE Capital international entity, including $16,372 million, which matured on April 15, 2016.
See Notes 20 and 29 for additional information about borrowings and associated swaps.
Liquidity is affected by debt maturities and our ability to repay or refinance such debt. Long-term debt maturities over the next five years follow. (In millions) 2017 2018 2019 2020 2021 GE(a) $ 17,109 $ 7,899 $ 3,787 $ 6,996 $ 4,708 GE Capital 6,517 (b) 5,578 4,111 11,107 2,131
(a) Included borrowings assumed by GE as part of the merger, for which GE has an offsetting amount due from GE Capital, of $13,024 million, $7,709 million, $3,729 million, $6,223 million and $4,672 million in 2017, 2018, 2019, 2020 and 2021, respectively.
(b) Fixed and floating rate notes of $498 million contain put options with exercise dates in 2017, and which have final maturity beyond 2021.
166 GE 2016 FORM 10-K
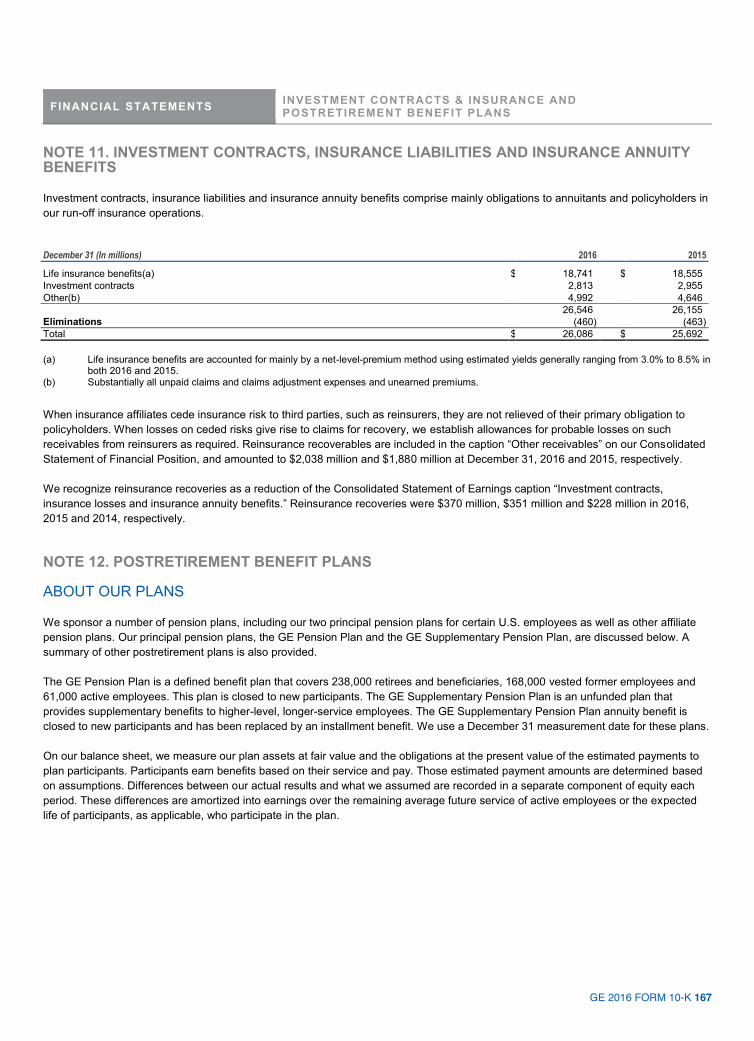
GE 2016 FORM 10-K 167
NOTE 11. INVESTMENT CONTRACTS, INSURANCE LIABILITIES AND INSURANCE ANNUITY BENEFITS Investment contracts, insurance liabilities and insurance annuity benefits comprise mainly obligations to annuitants and policyholders in our run-off insurance operations. December 31 (In millions) 2016 2015 Life insurance benefits(a) $ 18,741 $ 18,555 Investment contracts 2,813 2,955 Other(b) 4,992 4,646 26,546 26,155 Eliminations (460) (463) Total $ 26,086 $ 25,692 (a) Life insurance benefits are accounted for mainly by a net-level-premium method using estimated yields generally ranging from 3.0% to 8.5% in
both 2016 and 2015. (b) Substantially all unpaid claims and claims adjustment expenses and unearned premiums.
When insurance affiliates cede insurance risk to third parties, such as reinsurers, they are not relieved of their primary obligation to policyholders. When losses on ceded risks give rise to claims for recovery, we establish allowances for probable losses on such receivables from reinsurers as required. Reinsurance recoverables are included in the caption “Other receivables” on our Consolidated Statement of Financial Position, and amounted to $2,038 million and $1,880 million at December 31, 2016 and 2015, respectively. We recognize reinsurance recoveries as a reduction of the Consolidated Statement of Earnings caption “Investment contracts, insurance losses and insurance annuity benefits.” Reinsurance recoveries were $370 million, $351 million and $228 million in 2016, 2015 and 2014, respectively. NOTE 12. POSTRETIREMENT BENEFIT PLANS ABOUT OUR PLANS We sponsor a number of pension plans, including our two principal pension plans for certain U.S. employees as well as other affiliate pension plans. Our principal pension plans, the GE Pension Plan and the GE Supplementary Pension Plan, are discussed below. A summary of other postretirement plans is also provided. The GE Pension Plan is a defined benefit plan that covers 238,000 retirees and beneficiaries, 168,000 vested former employees and 61,000 active employees. This plan is closed to new participants. The GE Supplementary Pension Plan is an unfunded plan that provides supplementary benefits to higher-level, longer-service employees. The GE Supplementary Pension Plan annuity benefit is closed to new participants and has been replaced by an installment benefit. We use a December 31 measurement date for these plans. On our balance sheet, we measure our plan assets at fair value and the obligations at the present value of the estimated payments to plan participants. Participants earn benefits based on their service and pay. Those estimated payment amounts are determined based on assumptions. Differences between our actual results and what we assumed are recorded in a separate component of equity each period. These differences are amortized into earnings over the remaining average future service of active employees or the expected life of participants, as applicable, who participate in the plan.
FINANCIAL STATEMENTS INVESTMENT CONTRACTS & INSURANCE AND POSTRETIREMENT BENEFIT PLANS
GE 2016 FORM 10-K 167

FINANCIAL STATEMENTS POSTRETIREMENT BENEFIT PLANS
168 GE 2016 FORM 10-K
THE COST OF OUR PLANS The amount we report in our earnings as pension cost consists of the following components:
Service cost – the cost of benefits earned by active employees who participate in the plan. Prior service cost amortization – the cost of changes to our benefits plans (plan amendments) related to prior service
performed. Expected return on plan assets – the return we expect to earn on plan investments used to pay future benefits. Interest cost – the accrual of interest on the pension obligations due to the passage of time. Net actuarial loss (gain) amortization – differences between our estimates, (for example, discount rate, expected return on
plan assets) and our actual experience which are initially recorded in equity and amortized into earnings. Curtailment loss – earnings effects of amounts previously deferred which have been accelerated because of an event that
shortens future service or eliminates benefits (for example, a sale of a business). Pension cost components follow. COST OF PENSION PLANS
Principal pension plans (In millions) 2016 2015 2014
Service cost for benefits earned $ 1,237 $ 1,424 $ 1,205 Prior service cost amortization 303 205 214 Expected return on plan assets (3,336) (3,302) (3,190)Interest cost on benefit obligations 2,939 2,778 2,745 Net actuarial loss amortization 2,449 3,288 2,565 Curtailment loss 31 105 65 Pension cost $ 3,623 $ 4,498 $ 3,604 ASSUMPTIONS USED IN PENSION CALCULATIONS Accounting requirements necessitate the use of assumptions to reflect the uncertainties and the length of time over which the pension obligations will be paid. The actual amount of future benefit payments will depend upon when participants retire, the amount of their benefit at retirement and how long they live. To reflect the obligations in today’s dollars, we discount the future payments using a rate that matches the time frame over which the payments will be made. We also need to assume a long-term rate of return that will be earned on investments used to fund these payments. The assumptions used to measure our pension benefit obligations follow. ASSUMPTIONS USED TO MEASURE PENSION BENEFIT OBLIGATIONS Principal pension plans December 31 2016 2015 2014
Discount rate 4.11 % 4.38 % 4.02 % Compensation increases 3.80 3.80 4.10
The discount rate used to measure the pension obligations at the end of the year is also used to measure pension cost in the following year. The assumptions used to measure pension cost follow. ASSUMPTIONS USED TO MEASURE PENSION COST Principal pension plans December 31 2016 2015 2014
Discount rate 4.38 % 4.02 % 4.85 % Expected return on assets 7.50 7.50 7.50
168 GE 2016 FORM 10-K

FINANCIAL STATEMENTS POSTRETIREMENT BENEFIT PLANS
GE 2016 FORM 10-K 169
We evaluate these assumptions annually. We evaluate other assumptions periodically, such as retirement age, mortality and turnover, and update them as necessary to reflect our actual experience and expectations for the future. We determine the discount rate using the weighted-average yields on high-quality fixed-income securities that have maturities consistent with the timing of benefit payments. Lower discount rates increase the size of the benefit obligation and pension expense in the following year; higher discount rates reduce the size of the benefit obligation and subsequent-year pension expense. The expected return on plan assets is the estimated long-term rate of return that will be earned on the investments used to fund the pension obligations. To determine this rate, we consider the current and target composition of plan investments, our historical returns earned, and our expectations about the future. The compensation assumption is used to estimate the annual rate at which pay of plan participants will grow. If the rate of growth assumed increases, the size of the pension obligations will increase, as will the amount recorded in shareowners’ equity and amortized to earnings in subsequent periods. Further information about our pension assumptions, including a sensitivity analysis of certain assumptions, can be found in the Critical Accounting Estimates – Pension Assumptions within Management’s Discussion and Analysis of Financial Condition and Results of Operations (MD&A). FUNDED STATUS
Principal pension plans December 31 (in millions) 2016 2015
Projected benefit obligations $ 71,501 $ 68,722 Fair value of plan assets 45,893 45,720 Underfunded $ 25,608 $ 23,002 PROJECTED BENEFIT OBLIGATIONS (PBO)
Principal pension plans (In millions) 2016 2015 Balance at January 1 $ 68,722 $ 70,735 Service cost for benefits earned 1,237 1,424 Interest cost on benefit obligations 2,939 2,778 Participant contributions 115 155 Plan amendments - 902 Actuarial loss (gain) 1,874 (a) (4,017)(b) Benefits paid (3,386) (3,255) Balance at December 31(c) $ 71,501 $ 68,722 (a) Principally associated with discount rate and mortality assumption changes. (b) Principally associated with discount rate changes. (c) The PBO for the GE Supplementary Pension Plan, which is an unfunded plan, was $6,531 million and $6,099 million at year-end 2016 and
2015, respectively.
GE 2016 FORM 10-K 169

FINANCIAL STATEMENTS POSTRETIREMENT BENEFIT PLANS
170 GE 2016 FORM 10-K
THE COMPOSITION OF OUR PLAN ASSETS The fair value of our pension plans' investments is presented below. The inputs and valuation techniques used to measure the fair value of these assets are described in Note 1 and have been applied consistently. Principal pension plans December 31 (in millions) 2016 2015
Equity securities U.S. equity securities(a) $ 12,130 $ 12,447 Non-U.S. equity securities(a) 9,029 9,088 Debt securities Fixed income and cash investment funds 4,897 3,252 U.S. corporate(b) 5,252 5,529 Other debt securities(c) 5,066 5,131 Private equities(a) 4,492 4,885 Real estate(a) 3,244 3,186 Other investments(d) 1,783 2,202 Total plan assets $ 45,893 $ 45,720 (a) Included direct investments and investment funds. (b) Primarily represented investment-grade bonds of U.S. issuers from diverse industries. (c) Primarily represented investments in residential and commercial mortgage-backed securities, non-U.S. corporate and government bonds and
U.S. government, federal agency, state and municipal debt. (d) Substantially all represented hedge fund investments and net unsettled transaction-related investment activity.
Plan assets valued using NAV as a practical expedient amounted to $16,894 million and $15,430 million as of December 31, 2016 and 2015, respectively. The percentages of plan assets valued using NAV by investment fund type for equity securities, fixed income and cash, and alternative investments were 12%, 8% and 17% as of December 31, 2016, respectively, and 10%, 7% and 17% as of December 31, 2015, respectively. Those investments that were measured at fair value using practical expedient were excluded from the fair value hierarchy. The practical expedient was not applied for investments with a fair value of $2,504 million and $2,492 million in 2016 and 2015, respectively and those investments were classified within Level 3. The remaining investments were substantially all considered Level 1 and 2. FAIR VALUE OF PLAN ASSETS
Principal pension plans (In millions) 2016 2015 Balance at January 1 $ 45,720 $ 48,280 Actual gain on plan assets 2,892 307 Employer contributions 552 233 Participant contributions 115 155 Benefits paid (3,386) (3,255)Balance at December 31 $ 45,893 $ 45,720
AMOUNTS INCLUDED IN SHAREOWNERS’ EQUITY Amounts included in shareowners’ equity that will be amortized in future reporting periods follow. Principal pension plans December 31 (in millions) 2016 2015
Prior service cost $ 1,138 $ 1,473 Net actuarial loss 16,664 16,795 Total $ 17,802 $ 18,268 In 2017, we estimate that we will amortize $295 million of prior service cost and $2,840 million of net actuarial loss from shareowners’ equity into pension cost. Comparable amounts amortized in 2016 were $303 million and $2,449 million, respectively.
170 GE 2016 FORM 10-K

FINANCIAL STATEMENTS POSTRETIREMENT BENEFIT PLANS
GE 2016 FORM 10-K 171
OTHER PENSION AND POSTRETIREMENT PLANS We also administer other pension plans, including legacy plans that were part of acquisitions. Other pension plans in 2016 included 49 U.S. and non-U.S. pension plans with assets or obligations greater than $50 million. These other pension plans cover 60,000 retirees and beneficiaries, 59,000 vested former employees and 33,000 active employees. We also sponsor a number of postretirement health and life insurance benefit plans (retiree benefit plans). Principal retiree benefit plans cover approximately 187,000 retirees and dependents. Summarized information about these plans follows. COST OF BENEFIT PLANS
Other pension plans Principal retiree benefit plans (In millions) 2016 2015 2014 2016 2015 2014
Benefit plan cost $ 374 $ 373 $ 412 $ 115 $ 174 $ 789 FUNDED STATUS
Principal retiree
Other pension plans benefit plans December 31 (In millions) 2016 2015 2016 2015
Benefit obligations $ 22,543 $ 21,618 $ 6,289 $ 6,757 Fair value of plan assets 17,091 17,368 575 695 Underfunded $ 5,452 $ 4,250 $ 5,714 $ 6,062
AMOUNTS INCLUDED IN SHAREOWNERS’ EQUITY Amounts included in shareowners’ equity that will be amortized in future reporting periods follow. Principal retiree Other pension plans benefit plans December 31 (In millions) 2016 2015 2016 2015
Prior service credit $ (88) $ (29) $ (2,975) $ (3,132)Net actuarial loss (gain) 4,800 3,080 (682) (464)Total $ 4,712 $ 3,051 $ (3,657) $ (3,596) In 2017, we estimate that we will amortize $5 million of prior service credit and $520 million of net actuarial loss for the other pension plans from shareowners’ equity into pension cost. For principal retiree benefit plans, the estimated prior service credit and net actuarial gain to be amortized in 2017 will be $170 million and $80 million, respectively. Comparable amounts amortized in 2016, respectively, were $1 million of prior service credit and $256 million of net actuarial loss for the other pension plans and $164 million of prior service credit and $50 million of net actuarial gain for the principal retiree benefit plans. OUR FUNDING POLICY Our policy for funding the GE Pension Plan is to contribute amounts sufficient to meet minimum funding requirements under employee benefit and tax laws. We may decide to contribute additional amounts beyond this level. We made a contribution of $330 million to the GE Pension Plan in 2016. We did not make any contributions to the GE Pension Plan in 2015. We expect to contribute approximately $1,720 million to the GE Pension Plan in 2017. We expect to pay approximately $250 million for benefit payments under our GE Supplementary Pension Plan and administrative expenses of our principal pension plans and expect to contribute approximately $910 million to other pension plans in 2017. In 2016, comparative amounts were $222 million and $795 million, respectively. We fund retiree health benefits on a pay-as-you-go basis and the retiree life insurance trust at our discretion. We expect to contribute approximately $460 million in 2017 to fund such benefits. In 2016, we contributed $410 million for these plans. See Note 29 for further information about our pension plans and principal retiree benefit plans.
GE 2016 FORM 10-K 171
FINANCIAL STATEMENTS ALL OTHER LIABILITIES AND INCOME TAXES
172 GE 2016 FORM 10-K
NOTE 13. ALL OTHER LIABILITIES This caption includes liabilities for various items including deferred income, interest on tax liabilities, unrecognized tax benefits, environmental remediation, legal reserves, asset retirement obligations, derivative instruments, product warranties and a variety of sundry items. See Note 14 for further information on interest on tax liabilities and unrecognized tax benefits. See Notes 20 and 29 for further information on derivative instruments. See Note 23 for further information on environmental matters, legal reserves and product warranties. NOTE 14. INCOME TAXES GE and GE Capital file a consolidated U.S. federal income tax return. This enables GE and GE Capital to use tax deductions and credits of one member of the group to reduce the tax that otherwise would have been payable by another member of the group. The effective tax rate reflects the benefit of these tax reductions in the consolidated return. GE makes cash payments to GE Capital for tax reductions and GE Capital pays for tax increases at the time GE’s tax payments are due. Our businesses are subject to regulation under a wide variety of U.S. federal, state and foreign tax laws, regulations and policies. Changes to these laws or regulations may affect our tax liability, return on investments and business operations. THE GE CAPITAL EXIT PLAN In conjunction with the GE Capital Exit Plan, GE Capital significantly reduced its non-U.S. assets while continuing to operate appropriately capitalized non-U.S. businesses with substantial assets related to GE Capital’s vertical financing businesses, including Energy Financial Services, GECAS and Healthcare Equipment Finance. As a result of the GE Capital Exit Plan, GE Capital recognized a tax expense of $6,327 million in continuing operations during 2015. This primarily consisted of $3,548 million of tax expense related to the repatriation of excess foreign cash and the write-off of deferred tax assets of $2,779 million that will no longer be supported under this plan. The repatriation of cash included approximately $10 billion of foreign earnings that, prior to the approval of the GE Capital Exit Plan, were indefinitely reinvested in GE Capital’s international operations. GE Capital’s indefinitely reinvested earnings were also reduced by charges recognized in connection with the disposition of international assets. The remainder of the indefinitely reinvested earnings will continue to be reinvested in the significant international base of assets that will remain after the GE Capital Exit Plan is fully executed. The write-off of deferred tax assets largely related to our Treasury operations in Ireland where it was no longer apparent that the tax benefits would be realized upon implementation of the GE Capital Exit Plan. These charges, which increased the 2015 Consolidated effective tax rate by 77.3 percentage points, are reported in the lines “Tax on global activities including exports”, and “All other-net” in the Reconciliation of U.S. federal statutory income tax rate to actual income tax rate.” (BENEFIT) PROVISION FOR INCOME TAXES
(In millions) 2016 2015 2014
GE Current tax expense (benefit) $ (140) $ 3,307 $ 2,110 Deferred tax expense (benefit) from temporary differences 1,107 (1,800) (476) 967 1,506 1,634 GE Capital Current tax expense (benefit) (1,138) 2,796 (455) Deferred tax expense (benefit) from temporary differences (293) 2,183 (406) (1,431) 4,979 (861) Consolidated Current tax expense (benefit) (1,278) 6,103 1,655 Deferred tax expense (benefit) from temporary differences 814 383 (882) Total $ (464) $ 6,485 $ 773
172 GE 2016 FORM 10-K
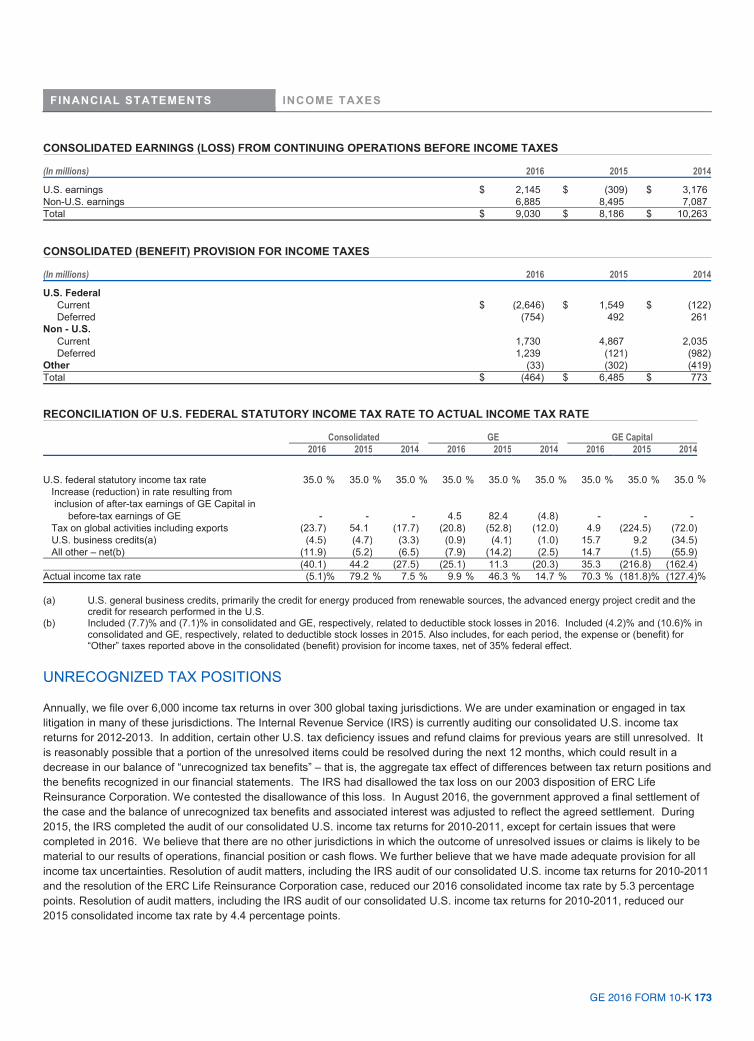
FINANCIAL STATEMENTS INCOME TAXES
GE 2016 FORM 10-K 173
CONSOLIDATED EARNINGS (LOSS) FROM CONTINUING OPERATIONS BEFORE INCOME TAXES
(In millions) 2016 2015 2014
U.S. earnings $ 2,145 $ (309) $ 3,176 Non-U.S. earnings 6,885 8,495 7,087 Total $ 9,030 $ 8,186 $ 10,263 CONSOLIDATED (BENEFIT) PROVISION FOR INCOME TAXES
(In millions) 2016 2015 2014
U.S. Federal Current $ (2,646) $ 1,549 $ (122) Deferred (754) 492 261 Non - U.S. Current 1,730 4,867 2,035 Deferred 1,239 (121) (982) Other (33) (302) (419) Total $ (464) $ 6,485 $ 773 RECONCILIATION OF U.S. FEDERAL STATUTORY INCOME TAX RATE TO ACTUAL INCOME TAX RATE
Consolidated GE GE Capital 2016 2015 2014 2016 2015 2014 2016 2015 2014
U.S. federal statutory income tax rate 35.0 % 35.0 % 35.0 % 35.0 % 35.0 % 35.0 % 35.0 % 35.0 % 35.0 % Increase (reduction) in rate resulting from inclusion of after-tax earnings of GE Capital in before-tax earnings of GE - - - 4.5 82.4 (4.8) - - - Tax on global activities including exports (23.7) 54.1 (17.7) (20.8) (52.8) (12.0) 4.9 (224.5) (72.0) U.S. business credits(a) (4.5) (4.7) (3.3) (0.9) (4.1) (1.0) 15.7 9.2 (34.5) All other – net(b) (11.9) (5.2) (6.5) (7.9) (14.2) (2.5) 14.7 (1.5) (55.9) (40.1) 44.2 (27.5) (25.1) 11.3 (20.3) 35.3 (216.8) (162.4) Actual income tax rate (5.1) % 79.2 % 7.5 % 9.9 % 46.3 % 14.7 % 70.3 % (181.8) % (127.4) % (a) U.S. general business credits, primarily the credit for energy produced from renewable sources, the advanced energy project credit and the
credit for research performed in the U.S. (b) Included (7.7)% and (7.1)% in consolidated and GE, respectively, related to deductible stock losses in 2016. Included (4.2)% and (10.6)% in
consolidated and GE, respectively, related to deductible stock losses in 2015. Also includes, for each period, the expense or (benefit) for “Other” taxes reported above in the consolidated (benefit) provision for income taxes, net of 35% federal effect.
UNRECOGNIZED TAX POSITIONS Annually, we file over 6,000 income tax returns in over 300 global taxing jurisdictions. We are under examination or engaged in tax litigation in many of these jurisdictions. The Internal Revenue Service (IRS) is currently auditing our consolidated U.S. income tax returns for 2012-2013. In addition, certain other U.S. tax deficiency issues and refund claims for previous years are still unresolved. It is reasonably possible that a portion of the unresolved items could be resolved during the next 12 months, which could result in a decrease in our balance of “unrecognized tax benefits” – that is, the aggregate tax effect of differences between tax return positions and the benefits recognized in our financial statements. The IRS had disallowed the tax loss on our 2003 disposition of ERC Life Reinsurance Corporation. We contested the disallowance of this loss. In August 2016, the government approved a final settlement of the case and the balance of unrecognized tax benefits and associated interest was adjusted to reflect the agreed settlement. During 2015, the IRS completed the audit of our consolidated U.S. income tax returns for 2010-2011, except for certain issues that were completed in 2016. We believe that there are no other jurisdictions in which the outcome of unresolved issues or claims is likely to be material to our results of operations, financial position or cash flows. We further believe that we have made adequate provision for all income tax uncertainties. Resolution of audit matters, including the IRS audit of our consolidated U.S. income tax returns for 2010-2011 and the resolution of the ERC Life Reinsurance Corporation case, reduced our 2016 consolidated income tax rate by 5.3 percentage points. Resolution of audit matters, including the IRS audit of our consolidated U.S. income tax returns for 2010-2011, reduced our 2015 consolidated income tax rate by 4.4 percentage points.
GE 2016 FORM 10-K 173

FINANCIAL STATEMENTS INCOME TAXES
174 GE 2016 FORM 10-K
The balance of unrecognized tax benefits, the amount of related interest and penalties we have provided and what we believe to be the range of reasonably possible changes in the next 12 months were: UNRECOGNIZED TAX BENEFITS
December 31, (In millions) 2016 2015
Unrecognized tax benefits $ 4,692 $ 6,778 Portion that, if recognized, would reduce tax expense and effective tax rate(a) 2,886 4,723 Accrued interest on unrecognized tax benefits 615 805 Accrued penalties on unrecognized tax benefits 118 98 Reasonably possible reduction to the balance of unrecognized tax benefits in succeeding 12 months 0-600 0-700 Portion that, if recognized, would reduce tax expense and effective tax rate(a) 0-500 0-200
(a) Some portion of such reduction may be reported as discontinued operations.
UNRECOGNIZED TAX BENEFITS RECONCILIATION (In millions) 2016 2015
Balance at January 1 $ 6,778 $ 5,619 Additions for tax positions of the current year 248 720 Additions for tax positions of prior years(a) 521 1,296 Reductions for tax positions of prior years (2,016) (754) Settlements with tax authorities (823) (70) Expiration of the statute of limitations (16) (33) Balance at December 31 $ 4,692 $ 6,778 (a) For 2015, the amount shown as “additions for tax positions of prior years” relates primarily ($1,054 million) to the preliminary estimate of
uncertain tax liabilities for acquired Alstom businesses. Of the total 2015 additions for tax positions of prior years, $445 million relates to amounts that would not affect tax expense if recognized.
We classify interest on tax deficiencies as interest expense; we classify income tax penalties as provision for income taxes. For the years ended December 31, 2016, 2015 and 2014, $(105) million, $48 million and $(68) million of interest expense (income), respectively, and $(4) million, $(4) million and (45) of tax expense (income) related to penalties, respectively, were recognized in the Statement of Earnings. DEFERRED INCOME TAXES Deferred income tax balances reflect the effects of temporary differences between the carrying amounts of assets and liabilities and their tax bases, as well as from net operating loss and tax credit carryforwards, and are stated at enacted tax rates expected to be in effect when taxes are actually paid or recovered. Deferred income tax assets represent amounts available to reduce income taxes payable on taxable income in future years. We evaluate the recoverability of these future tax deductions and credits by assessing the adequacy of future expected taxable income from all sources, including reversal of taxable temporary differences, forecasted operating earnings and available tax planning strategies. To the extent we do not consider it more likely than not that a deferred tax asset will be recovered, a valuation allowance is established. We have not provided U.S. deferred taxes on cumulative earnings of non-U.S. affiliates and associated companies that have been reinvested indefinitely. These earnings relate to ongoing operations and, at December 31, 2016 and 2015, were approximately $82 billion and $104 billion, respectively. Most of these earnings have been reinvested in active non-U.S. business operations and we do not intend to repatriate these earnings to fund U.S. operations. Because of the availability of U.S. foreign tax credits, it is not practicable to determine the U.S. federal income tax liability that would be payable if such earnings were not reinvested indefinitely. Deferred taxes are provided for earnings of non-U.S. affiliates and associated companies when we plan to remit those earnings.
174 GE 2016 FORM 10-K

FINANCIAL STATEMENTS INCOME TAXES
GE 2016 FORM 10-K 175
Aggregated deferred income tax amounts are summarized below. December 31 (In millions) 2016 2015
Assets GE $ 21,106 $ 20,539 GE Capital 5,093 4,643 26,199 25,182 Liabilities GE (14,440) (12,873) GE Capital (9,926) (9,204) (24,366) (22,077) Net deferred income tax asset (liability) $ 1,833 $ 3,105
COMPONENTS OF THE NET DEFERRED INCOME TAX ASSET (LIABILITY) December 31 (In millions) 2016 2015
GE Principal pension plans $ 8,963 $ 8,051 Other non-current compensation and benefits 4,230 4,133 Provision for expenses 2,633 2,827 Retiree insurance plans 2,000 2,122 Non-U.S. loss carryforwards(a) 1,444 1,940 Contract assets (6,677) (5,143)Intangible assets (2,962) (3,192)Depreciation (1,755) (1,688)Investment in global subsidiaries (899) (915)Other – net (311) (469) 6,666 7,666 GE Capital Operating leases (3,582) (3,863)Financing leases (1,632) (1,665)Energy investments (1,410) (1,276)Investment in global subsidiaries (343) 5 Intangible assets (125) (103)Non-U.S. loss carryforwards(a) 1,323 2,262 Other – net 936 79 (4,833) (4,561)Net deferred income tax asset (liability) $ 1,833 $ 3,105 (a) Net of valuation allowances of $2,450 million and $2,184 million for GE and $391 million and $109 million for GE Capital, for 2016 and 2015,
respectively. Of the net deferred tax asset as of December 31, 2016, of $2,767 million, $6 million relates to net operating loss carryforwards that expire in various years ending from December 31, 2016 through December 31, 2018; $472 million relates to net operating losses that expire in various years ending from December 31, 2020 through December 31, 2036 and $2,289 million relates to net operating loss carryforwards that may be carried forward indefinitely.
GE 2016 FORM 10-K 175

FINANCIAL STATEMENTS SHAREOWNERS’ EQUITY
176 GE 2016 FORM 10-K
NOTE 15. SHAREOWNERS’ EQUITY (In millions) 2016 2015 2014 Preferred stock issued $ 6 $ 6 $ - Common stock issued $ 702 $ 702 $ 702 Accumulated other comprehensive income (loss) Balance at January 1 $ (16,529) $ (18,172) $ (9,119)Other comprehensive income (loss) before reclassifications (4,602) (3,312) (12,088)Reclassifications from other comprehensive income 2,533 4,956 3,035 Other comprehensive income (loss), net, attributable to GE (2,069) 1,644 (9,053)Balance at December 31 $ (18,598) $ (16,529) $ (18,172)Other capital Balance at January 1 $ 37,613 $ 32,889 $ 32,494 Gains (losses) on treasury stock dispositions and other(a)(b) (389) 4,724 396 Balance at December 31 $ 37,224 $ 37,613 $ 32,889 Retained earnings Balance at January 1 $ 140,020 $ 155,333 $ 149,051 Net earnings (loss) attributable to the Company 8,831 (6,126) 15,233 Dividends and other transactions with shareowners (9,054) (9,161) (8,948)Redemption value adjustment on redeemable noncontrolling interests (266) (25) (2)Balance at December 31 $ 139,532 $ 140,020 $ 155,333 Common stock held in treasury Balance at January 1 $ (63,539) $ (42,593) $ (42,561)Purchases(c)(d) (22,073) (23,762) (1,950)Dispositions 2,574 2,816 1,917 Balance at December 31 $ (83,038) $ (63,539) $ (42,593)Total equity GE shareowners' equity balance at December 31 $ 75,828 $ 98,274 $ 128,159 Noncontrolling interests balance at December 31 1,663 1,864 8,674 Total equity balance at December 31 $ 77,491 $ 100,138 $ 136,833 (a) Included $440 million related to the excess of the net proceeds from the Synchrony Financial IPO over the carrying value of the interest sold in
2014. (b) Included $4,949 million related to issuance of new preferred stock in exchange for existing GE Capital preferred stock in 2015. (c) Included $(20,383) million related to the split-off of Synchrony Financial from GE, where GE shares were exchanged for shares of Synchrony
Financial in 2015. (d) Included $(11,370) million of GE shares purchased under accelerated share repurchase (ASR) agreements in 2016.
176 GE 2016 FORM 10-K

FINANCIAL STATEMENTS SHAREOWNERS’ EQUITY
GE 2016 FORM 10-K 177
SHARES OF GE PREFERRED STOCK At December 31, 2014, GECC had outstanding 50,000 shares of non-cumulative A, B and C Series perpetual preferred stock at an average dividend rate of 6.44% with a face value of $5,000 million. In connection with the GE Capital Exit Plan, on December 3, 2015, these shares were converted into a corresponding Series A, B, and C of fixed-to-floating rate non-cumulative perpetual preferred stock issued by GE with face value of $2,778 million, $2,073 million, and $1,094 million, respectively, for a cumulative face value of $5,944 million and an initial average fixed dividend rate of 4.07%. The incremental shares were issued in order to compensate preferred holders for the lower dividend rate. Subsequent to the issuance of the preferred stock on December 3, 2015, in response to investor feedback, GE launched an exchange offer on December 18, 2015 that allowed GE preferred stock investors to exchange their existing Series A, B and C preferred stock into a Series D GE preferred stock. These Series D instruments bear an initial fixed interest rate of 5.00% through January 21, 2021, will bear a floating rate equal to three-month LIBOR plus 3.33% thereafter and are callable on January 21, 2021. On January 20, 2016, $2,687 million of Series A, $2,008 million of Series B and $999 million of Series C were exchanged into $5,694 million Series D GE preferred stock. In addition to interim dividends and accretion of $129 million, a deemed dividend of $232 million was recorded in the year ended December 31, 2016. The deemed dividend included $195 million for the amount by which the fair value of the Series D GE preferred stock exceeded the fair value of the original GECC Series A, B and C preferred stock, and a cash payment of $37 million to the GE Series A and B preferred stockholders who exchanged into the Series D GE preferred stock. Post exchange, $91 million of Series A, $64 million of Series B and $95 million of Series C GE preferred stock remain outstanding. The carrying value of the GE preferred stock at December 31, 2016 was $5,283 million and will increase to $5,944 million through periodic accretion to the respective call dates of each series. Principal and accretion for the preferred stock is recorded in other capital in the consolidated Statement of Financial Position and dividends and accretion are presented under the caption “Preferred stock dividends” in the Statement of Earnings (Loss). Dividends on GE preferred stock are payable semi-annually, in June and December and accretion is recorded on a quarterly basis. In conjunction with the exchange of the GE Capital preferred stock into GE preferred stock and the exchange of Series A, B and C preferred stock into Series D preferred stock, GE Capital issued preferred stock to GE for which the amount and terms mirror the GE preferred stock held by external investors ($5,283 million carrying value at December 31, 2016). GE has 50.0 million authorized shares of preferred stock ($1.00 par value). 5,944,250 shares were issued and outstanding as of December 31, 2016 and 2015, respectively. No shares were issued and outstanding as of December 31, 2014.
SHARES OF GE COMMON STOCK On April 10, 2015, the GE Board has authorized a new repurchase program of up to $50.0 billion in common stock, excluding the Synchrony Financial exchange we completed in 2015. Under our share purchase programs, on a book basis, we repurchased shares of 725.8 million, 109.8 million and 73.6 million for a total of $22,005 million, $3,320 million and $1,901 million for the years ended 2016, 2015, and 2014, respectively. During 2016, we repurchased $11,370 million of our common stock under the accelerated share repurchase (ASR) agreements. In December 2016, we entered into an ASR agreement with a financial institution which allowed us to repurchase GE common stock at a price below its volume weighted-average price during a given period. During the fourth quarter, we paid $2,200 million and received and classified as treasury shares an initial delivery of 59,177,215 shares based on then-current market prices. The payment was recorded as a reduction to shareowners’ equity, consisting of a $1,870 million increase in treasury stock, which reflects the value of the shares received upon initial delivery, and a $330 million decrease in other capital, which reflects the value of the stock held back pending final delivery. We accounted for the ASR as two separate transactions: (i) 59,177,215 shares of common stock initially delivered to GE and $1,870 million was accounted for as a treasury stock transaction and (ii) the unsettled contract of $330 million was determined to be a forward contract indexed to GE’s own common stock. The initial delivery of 59,177,215 shares resulted in an immediate reduction of the outstanding shares used to calculate the weighted-average common shares outstanding for basic and diluted earnings per share. GE has determined that the forward contract, indexed to its own common stock, met all the criteria for equity classification. In the first quarter of 2017, we received the remaining 10,773,050 shares based on the final volume weighted-average price less the negotiated discount.
GE 2016 FORM 10-K 177
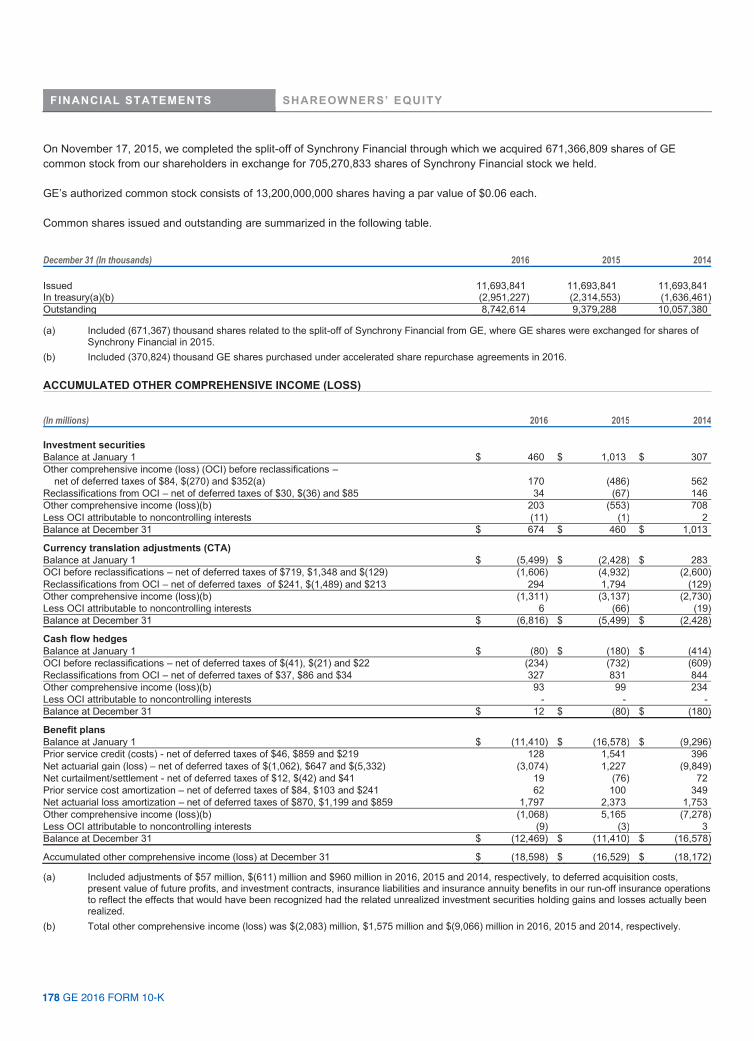
FINANCIAL STATEMENTS SHAREOWNERS’ EQUITY
178 GE 2016 FORM 10-K
On November 17, 2015, we completed the split-off of Synchrony Financial through which we acquired 671,366,809 shares of GE common stock from our shareholders in exchange for 705,270,833 shares of Synchrony Financial stock we held. GE’s authorized common stock consists of 13,200,000,000 shares having a par value of $0.06 each. Common shares issued and outstanding are summarized in the following table. December 31 (In thousands) 2016 2015 2014 Issued 11,693,841 11,693,841 11,693,841 In treasury(a)(b) (2,951,227) (2,314,553) (1,636,461)Outstanding 8,742,614 9,379,288 10,057,380 (a) Included (671,367) thousand shares related to the split-off of Synchrony Financial from GE, where GE shares were exchanged for shares of
Synchrony Financial in 2015. (b) Included (370,824) thousand GE shares purchased under accelerated share repurchase agreements in 2016. ACCUMULATED OTHER COMPREHENSIVE INCOME (LOSS)
(In millions) 2016 2015 2014 Investment securities Balance at January 1 $ 460 $ 1,013 $ 307 Other comprehensive income (loss) (OCI) before reclassifications – net of deferred taxes of $84, $(270) and $352(a) 170 (486) 562 Reclassifications from OCI – net of deferred taxes of $30, $(36) and $85 34 (67) 146 Other comprehensive income (loss)(b) 203 (553) 708 Less OCI attributable to noncontrolling interests (11) (1) 2 Balance at December 31 $ 674 $ 460 $ 1,013
Currency translation adjustments (CTA) Balance at January 1 $ (5,499) $ (2,428) $ 283 OCI before reclassifications – net of deferred taxes of $719, $1,348 and $(129) (1,606) (4,932) (2,600)Reclassifications from OCI – net of deferred taxes of $241, $(1,489) and $213 294 1,794 (129)Other comprehensive income (loss)(b) (1,311) (3,137) (2,730)Less OCI attributable to noncontrolling interests 6 (66) (19)Balance at December 31 $ (6,816) $ (5,499) $ (2,428)
Cash flow hedges Balance at January 1 $ (80) $ (180) $ (414)OCI before reclassifications – net of deferred taxes of $(41), $(21) and $22 (234) (732) (609)Reclassifications from OCI – net of deferred taxes of $37, $86 and $34 327 831 844 Other comprehensive income (loss)(b) 93 99 234 Less OCI attributable to noncontrolling interests - - - Balance at December 31 $ 12 $ (80) $ (180)
Benefit plans Balance at January 1 $ (11,410) $ (16,578) $ (9,296)Prior service credit (costs) - net of deferred taxes of $46, $859 and $219 128 1,541 396 Net actuarial gain (loss) – net of deferred taxes of $(1,062), $647 and $(5,332) (3,074) 1,227 (9,849)Net curtailment/settlement - net of deferred taxes of $12, $(42) and $41 19 (76) 72 Prior service cost amortization – net of deferred taxes of $84, $103 and $241 62 100 349 Net actuarial loss amortization – net of deferred taxes of $870, $1,199 and $859 1,797 2,373 1,753 Other comprehensive income (loss)(b) (1,068) 5,165 (7,278)Less OCI attributable to noncontrolling interests (9) (3) 3 Balance at December 31 $ (12,469) $ (11,410) $ (16,578)
Accumulated other comprehensive income (loss) at December 31 $ (18,598) $ (16,529) $ (18,172)
(a) Included adjustments of $57 million, $(611) million and $960 million in 2016, 2015 and 2014, respectively, to deferred acquisition costs, present value of future profits, and investment contracts, insurance liabilities and insurance annuity benefits in our run-off insurance operations to reflect the effects that would have been recognized had the related unrealized investment securities holding gains and losses actually been realized.
(b) Total other comprehensive income (loss) was $(2,083) million, $1,575 million and $(9,066) million in 2016, 2015 and 2014, respectively.
178 GE 2016 FORM 10-K
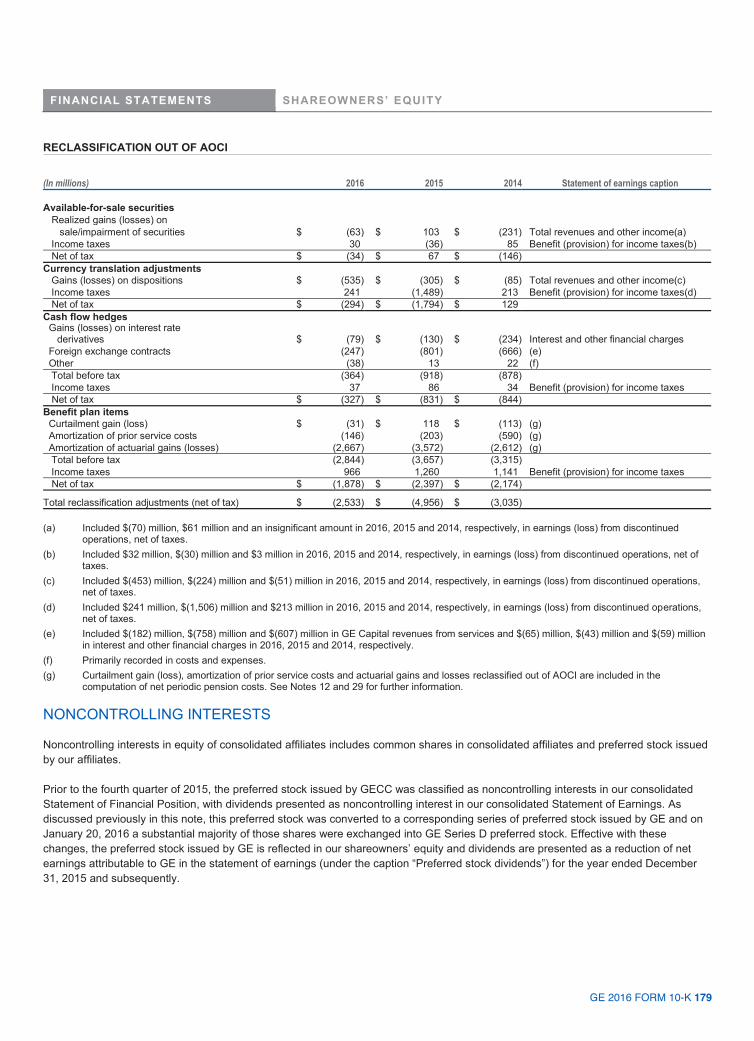
FINANCIAL STATEMENTS SHAREOWNERS’ EQUITY
GE 2016 FORM 10-K 179
RECLASSIFICATION OUT OF AOCI
(In millions) 2016 2015 2014 Statement of earnings caption Available-for-sale securities Realized gains (losses) on sale/impairment of securities $ (63) $ 103 $ (231) Total revenues and other income(a) Income taxes 30 (36) 85 Benefit (provision) for income taxes(b) Net of tax $ (34) $ 67 $ (146) Currency translation adjustments Gains (losses) on dispositions $ (535) $ (305) $ (85) Total revenues and other income(c) Income taxes 241 (1,489) 213 Benefit (provision) for income taxes(d) Net of tax $ (294) $ (1,794) $ 129 Cash flow hedges Gains (losses) on interest rate derivatives $ (79) $ (130) $ (234) Interest and other financial charges Foreign exchange contracts (247) (801) (666) (e) Other (38) 13 22 (f) Total before tax (364) (918) (878) Income taxes 37 86 34 Benefit (provision) for income taxes Net of tax $ (327) $ (831) $ (844) Benefit plan items Curtailment gain (loss) $ (31) $ 118 $ (113) (g) Amortization of prior service costs (146) (203) (590) (g) Amortization of actuarial gains (losses) (2,667) (3,572) (2,612) (g) Total before tax (2,844) (3,657) (3,315) Income taxes 966 1,260 1,141 Benefit (provision) for income taxes Net of tax $ (1,878) $ (2,397) $ (2,174)
Total reclassification adjustments (net of tax) $ (2,533) $ (4,956) $ (3,035) (a) Included $(70) million, $61 million and an insignificant amount in 2016, 2015 and 2014, respectively, in earnings (loss) from discontinued
operations, net of taxes. (b) Included $32 million, $(30) million and $3 million in 2016, 2015 and 2014, respectively, in earnings (loss) from discontinued operations, net of
taxes. (c) Included $(453) million, $(224) million and $(51) million in 2016, 2015 and 2014, respectively, in earnings (loss) from discontinued operations,
net of taxes. (d) Included $241 million, $(1,506) million and $213 million in 2016, 2015 and 2014, respectively, in earnings (loss) from discontinued operations,
net of taxes. (e) Included $(182) million, $(758) million and $(607) million in GE Capital revenues from services and $(65) million, $(43) million and $(59) million
in interest and other financial charges in 2016, 2015 and 2014, respectively. (f) Primarily recorded in costs and expenses. (g) Curtailment gain (loss), amortization of prior service costs and actuarial gains and losses reclassified out of AOCI are included in the
computation of net periodic pension costs. See Notes 12 and 29 for further information. NONCONTROLLING INTERESTS Noncontrolling interests in equity of consolidated affiliates includes common shares in consolidated affiliates and preferred stock issued by our affiliates. Prior to the fourth quarter of 2015, the preferred stock issued by GECC was classified as noncontrolling interests in our consolidated Statement of Financial Position, with dividends presented as noncontrolling interest in our consolidated Statement of Earnings. As discussed previously in this note, this preferred stock was converted to a corresponding series of preferred stock issued by GE and on January 20, 2016 a substantial majority of those shares were exchanged into GE Series D preferred stock. Effective with these changes, the preferred stock issued by GE is reflected in our shareowners’ equity and dividends are presented as a reduction of net earnings attributable to GE in the statement of earnings (under the caption “Preferred stock dividends”) for the year ended December 31, 2015 and subsequently.
GE 2016 FORM 10-K 179

FINANCIAL STATEMENTS SHAREOWNERS’ EQUITY
180 GE 2016 FORM 10-K
CHANGES TO NONCONTROLLING INTERESTS (In millions) 2016 2015 2014
Balance at January 1 $ 1,864 $ 8,674 $ 6,217 Net earnings (loss) (46) 377 183 GECC preferred stock(a) - (4,949) - GECC preferred stock dividend - (311) (322)Dividends (72) (43) (74)Dispositions (232) 189 (81)Synchrony Financial(b) - (2,840) 2,393 Other (including AOCI)(c)(d)(e)(f) 150 767 358 Balance at December 31 $ 1,663 $ 1,864 $ 8,674 (a) Included $(4,949) million related to the issuance of GE preferred stock in exchange for existing GECC preferred stock in 2015. GE preferred
stock is reflected in shareowners’ equity in the consolidated Statement of Financial Position. (b) Related to the split-off of Synchrony Financial from GE in 2015, where GE shares were exchanged for shares of Synchrony Financial; related
to the Synchrony Financial IPO in 2014. (c) Included $695 million related to the Alstom acquisition in 2015. (d) Included $155 million related to Arcam AB acquisition in our Aviation segment in 2016. (e) Included $(123) million for deconsolidation of investment funds managed by GE Asset Management (GEAM) upon the adoption of ASU 2015-
2, Amendments to the Consolidation Analysis in 2016. See Note 1. (f) Includes research & development partner funding arrangements, acquisitions and eliminations.
REDEEMABLE NONCONTROLLING INTERESTS Redeemable noncontrolling interest presented in our Statement of Financial Position includes common shares issued by our affiliates that are redeemable at the option of the holder of those interests. As part of the Alstom acquisition, we formed three joint ventures in which the noncontrolling interests hold certain redemption rights. These joint ventures and the associated redemption rights are discussed in Note 8. Our retained earnings will be adjusted for subsequent changes in the redemption value of the noncontrolling interest in these entities to the extent that the redemption value exceeds the carrying amount of the noncontrolling interest. CHANGES TO REDEEMABLE NONCONTROLLING INTERESTS (In millions) 2016 2015 2014
Balance at January 1 $ 2,972 $ 98 $ 178 Net (loss) (244) (46) (71)Dividends (17) (11) (12)Redemption value adjustment 266 25 2 Other(a)(b) 49 2,906 1 Balance at December 31 $ 3,025 $ 2,972 $ 98
(a) Included $2,875 million related to joint ventures formed by GE and Alstom as part of the Alstom acquisition in 2015. (b) Included $204 million related to the Concept Laser GmbH acquisition in our Aviation segment in 2016.
OTHER Common dividends from GE Capital to GE totaled $20,118 million, $4,311 million and $3,000 million for the years ended 2016, 2015 and 2014, respectively. Dividends on GE preferred stock totaled $656 million and $18 million, including cash dividends of $332 million and $8 million for the years ended 2016 and 2015, respectively. There were no dividends on GE preferred stock in 2014.
180 GE 2016 FORM 10-K

FINANCIAL STATEMENTS OTHER STOCK-RELATED INFORMATION
GE 2016 FORM 10-K 181
NOTE 16. OTHER STOCK-RELATED INFORMATION SHARE-BASED COMPENSATION We grant stock options, restricted stock units and performance share units to employees under the 2007 Long-Term Incentive Plan. Grants made under all plans must be approved by the Management Development and Compensation Committee of GE’s Board of Directors, which is composed entirely of independent directors. STOCK OPTIONS Under our stock option program, an employee receives an award that provides the opportunity in the future to purchase GE shares at the market price of our stock on the date the award is granted (the strike price). The options become exercisable in equal amounts over a five-year vesting period and expire 10 years from the grant date if they are not exercised. Stock options have no financial statement effect on the date they are granted but rather are reflected over time through recording compensation expense and increasing shareowners’ equity. We record compensation expense based on the estimated fair value of the awards expected to vest, and that amount is amortized as compensation expense on a straight-line basis over the five-year vesting period. Accordingly, total expense related to the award is reduced by the fair value of options that are expected to be forfeited by employees that leave GE prior to vesting. We estimate forfeitures based on our experience and adjust the expense to reflect actual forfeitures over the vesting period. The offset to the expense we record is reflected as an increase in the “Other capital” component of shareowners’ equity. (In millions, after tax) 2016 2015 2014 Compensation expense $ 207 $ 234 $ 215 We estimate the fair value of each stock option award on the date of grant using a Black-Scholes option pricing model. The table below provides the weighted-average grant-date fair values, key assumptions and other inputs into the pricing model. With the exception of the dividend yield assumption, an increase in any individual assumption will increase the estimated fair value of the option, all other things being equal. 2016 2015 2014 Weighted-average grant-date fair value of stock options $ 3.61 $ 4.64 $ 5.26 Stock Option Valuation Assumptions: Risk-free interest rate 1.4% 2.0 % 2.3% Dividend yield 3.4% 3.4 % 3.1% Expected volatility 20.0% 25.0 % 26.0% Expected option life (in years) 6.5 6.8 7.3 Other pricing model inputs: Weighted-average grant-date market price of GE stock (strike price) $ 29.63 $ 25.79 $ 26.11
GE 2016 FORM 10-K 181

FINANCIAL STATEMENTS OTHER STOCK-RELATED INFORMATION
182 GE 2016 FORM 10-K
The table below shows the amount and weighted-average strike price of options granted during 2016, as well as those outstanding and exercisable at year-end 2016. As of December 31, 2016 unless, otherwise stated (in thousands, except per-share data) Stock options granted during 2016 30,948 Weighted-average strike price of awards granted in 2016 $ 29.63 Stock options outstanding 420,303 Weighted-average strike price of stock options outstanding $ 22.29 Stock options exercisable 301,952 Weighted-average strike price of stock options exercisable $ 20.73 When an employee exercises an option, we issue treasury shares to satisfy the requirements of the option. 2016 2015 2014 Stock options exercised (in thousands) 56,973 65,764 30,433 Cash received from stock options exercised (in millions) $ 1,037 $ 1,098 $ 439 Outstanding stock option awards may be dilutive to earnings per share when they are in the money (the market price of GE stock is greater than the strike price of the option). When an option is dilutive, it increases the number of shares used in the diluted earnings per share calculation, which will decrease earnings per share. However, the effect stock options have on the number of shares added to the diluted earnings per share calculation is not one-for-one. The average amount of unrecognized compensation expense (the portion of the fair value of these option awards not yet amortized) and the market price of GE stock during the reporting period affect how many of these potential shares are included in the calculation. The calculation assumes that the proceeds received from the exercise and the unrecognized compensation expense are used to buy back shares, which reduces the dilutive impact. As of December 31, 2016, there was $427 million of unrecognized compensation expense related to unvested options, which will be amortized over the remaining vesting period (the weighted-average period is approximately 2 years). Of that total, approximately $118 million, after tax, is estimated to be recorded as compensation expense in 2017. The dilutive effect of in-the-money options on our earnings per share from continuing operations has been $0.01 or less per share (1% or less) for the last three years. See Note 18 for additional information about earnings per share. RESTRICTED STOCK A restricted stock award provides an employee with the right to receive shares of GE stock when the restrictions lapse, which occurs in equal amounts over the vesting period. Upon vesting, each unit of restricted stock is converted into GE common stock on a one-for-one basis using treasury stock shares. The expense to be recognized on a restricted stock unit is based upon the market price on the grant date (which is its fair value) multiplied by the number of units expected to vest. Accordingly, total expense related to the award is reduced by the fair value of restricted stock units that are expected to be forfeited by employees that leave GE prior to lapse of the restrictions. That amount is amortized as compensation expense on a straight-line basis over a five-year vesting period. We estimate forfeitures based on our experience and adjust the expense to reflect actual forfeitures over the vesting period. The offset to compensation expense is an increase in the “Other capital” component of shareowners’ equity. (In millions, after tax) 2016 2015 2014 Compensation expense(a) $ 90 $ 72 $ 56(a) Included $11 million of compensation expense related to performance share units in 2016.
182 GE 2016 FORM 10-K

FINANCIAL STATEMENTS OTHER STOCK-RELATED INFORMATION
GE 2016 FORM 10-K 183
The fair value of a restricted stock unit at the grant date is equal to the market price of our stock on the grant date. 2016 2015 2014 Weighted-average grant-date fair value of restricted stock awards $ 30.20 $ 26.74 $ 26.08 As of December 31, 2016, unless otherwise stated (in thousands, except per-share data) Restricted stock units granted during 2016 8,933 Non-vested restricted stock units outstanding 17,859 Weighted-average fair value at grant date of non-vested stock $ 27.72 The table below provides information about the units of restricted stock that vested for each of the years presented. (In thousands) 2016 2015 2014 Restricted stock units vested during the year ended 4,427 3,899 3,305 As of December 31, 2016, there was $346 million of total unrecognized compensation expense related to unvested restricted stock units, which will be amortized over the remaining vesting period (the weighted-average period is approximately 2 years). Of that total, approximately $75 million, after tax, is estimated to be recorded as compensation expense in 2017. OTHER INFORMATION When options are exercised and restricted stock units vest, we issue shares from treasury stock, which increases shares outstanding. The “Other capital” component of shareowners’ equity is adjusted for differences between the strike price of GE stock and the average cost of our treasury stock. We also record the difference between the tax benefits assumed (based on the fair value of the award on the grant date) and the actual tax benefit in our provision for income taxes. Any excess tax benefit is recorded as cash flows from operating activities in our Statement of Cash Flows. The table below provides information about tax benefits related to all share-based compensation arrangements. (In millions) 2016 2015 2014 Income tax benefit recognized in earnings $ 274 $ 148 $ 147 Excess of actual tax deductions over amounts assumed recognized in equity(a) - 167 86 (a) We adopted ASU 2016-09 in September 2016. The primary effects of adoption were the recognition of excess tax benefits in our provision for
income taxes rather than paid-in capital and the reclassification of cash flows related to excess tax benefits from a financing activity to an operating activity for the periods beginning January 1, 2016. See Note 1 for further information.
Share-based compensation programs serve as a means to attract and retain talented employees and are an important element of their total compensation. The intrinsic value of a stock option award is the amount by which the award is in the money and represents the potential value to the employee upon exercise of the option. The intrinsic value of restricted stock units is the value of the shares awarded at the current market price. The table below provides information about the intrinsic value of option and restricted stock awards. Aggregate intrinsic As of December 31, 2016, unless otherwise stated (in millions) value Stock options outstanding $ 3,984 Stock options exercised in 2016 723 Non-vested restricted stock units outstanding 564 Restricted stock units vested in 2016 137
GE 2016 FORM 10-K 183
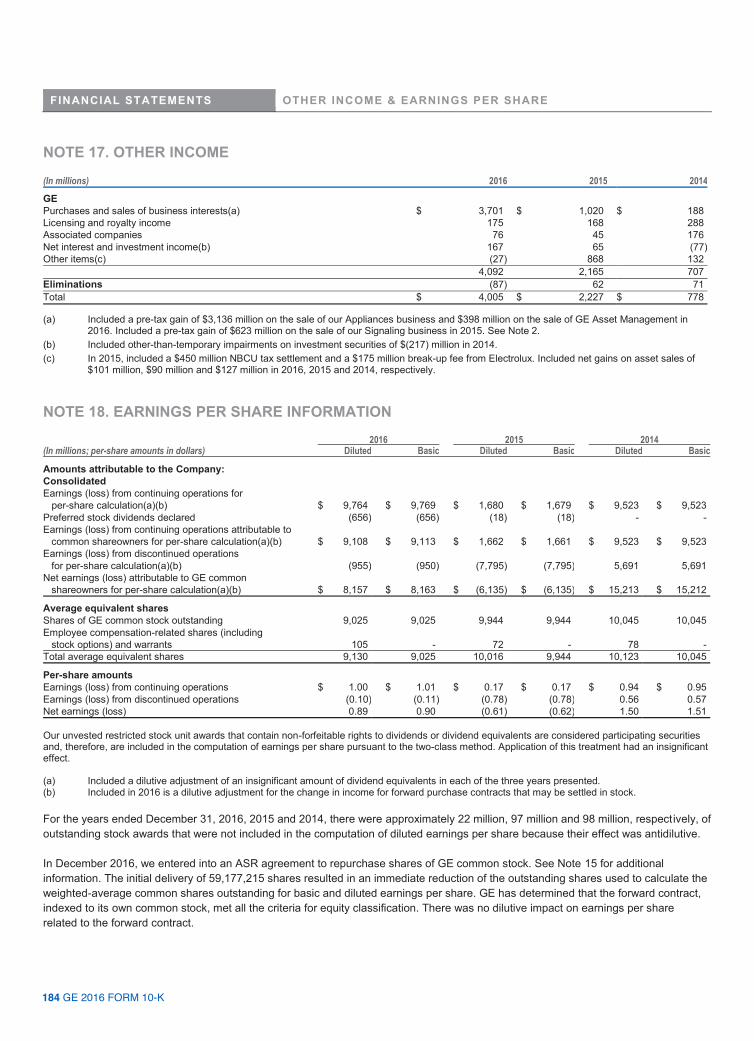
FINANCIAL STATEMENTS OTHER INCOME & EARNINGS PER SHARE
184 GE 2016 FORM 10-K
NOTE 17. OTHER INCOME (In millions) 2016 2015 2014
GE Purchases and sales of business interests(a) $ 3,701 $ 1,020 $ 188 Licensing and royalty income 175 168 288 Associated companies 76 45 176 Net interest and investment income(b) 167 65 (77)Other items(c) (27) 868 132 4,092 2,165 707 Eliminations (87) 62 71 Total $ 4,005 $ 2,227 $ 778
(a) Included a pre-tax gain of $3,136 million on the sale of our Appliances business and $398 million on the sale of GE Asset Management in 2016. Included a pre-tax gain of $623 million on the sale of our Signaling business in 2015. See Note 2.
(b) Included other-than-temporary impairments on investment securities of $(217) million in 2014. (c) In 2015, included a $450 million NBCU tax settlement and a $175 million break-up fee from Electrolux. Included net gains on asset sales of
$101 million, $90 million and $127 million in 2016, 2015 and 2014, respectively. NOTE 18. EARNINGS PER SHARE INFORMATION
2016 2015 2014 (In millions; per-share amounts in dollars) Diluted Basic Diluted Basic Diluted Basic
Amounts attributable to the Company: Consolidated Earnings (loss) from continuing operations for per-share calculation(a)(b) $ 9,764 $ 9,769 $ 1,680 $ 1,679 $ 9,523 $ 9,523 Preferred stock dividends declared (656) (656) (18) (18) - - Earnings (loss) from continuing operations attributable to common shareowners for per-share calculation(a)(b) $ 9,108 $ 9,113 $ 1,662 $ 1,661 $ 9,523 $ 9,523 Earnings (loss) from discontinued operations for per-share calculation(a)(b) (955) (950) (7,795) (7,795) 5,691 5,691 Net earnings (loss) attributable to GE common shareowners for per-share calculation(a)(b) $ 8,157 $ 8,163 $ (6,135) $ (6,135) $ 15,213 $ 15,212
Average equivalent shares Shares of GE common stock outstanding 9,025 9,025 9,944 9,944 10,045 10,045 Employee compensation-related shares (including stock options) and warrants 105 - 72 - 78 - Total average equivalent shares 9,130 9,025 10,016 9,944 10,123 10,045
Per-share amounts Earnings (loss) from continuing operations $ 1.00 $ 1.01 $ 0.17 $ 0.17 $ 0.94 $ 0.95 Earnings (loss) from discontinued operations (0.10) (0.11) (0.78) (0.78) 0.56 0.57 Net earnings (loss) 0.89 0.90 (0.61) (0.62) 1.50 1.51 Our unvested restricted stock unit awards that contain non-forfeitable rights to dividends or dividend equivalents are considered participating securities and, therefore, are included in the computation of earnings per share pursuant to the two-class method. Application of this treatment had an insignificant effect. (a) Included a dilutive adjustment of an insignificant amount of dividend equivalents in each of the three years presented. (b) Included in 2016 is a dilutive adjustment for the change in income for forward purchase contracts that may be settled in stock. For the years ended December 31, 2016, 2015 and 2014, there were approximately 22 million, 97 million and 98 million, respectively, of outstanding stock awards that were not included in the computation of diluted earnings per share because their effect was antidilutive. In December 2016, we entered into an ASR agreement to repurchase shares of GE common stock. See Note 15 for additional information. The initial delivery of 59,177,215 shares resulted in an immediate reduction of the outstanding shares used to calculate the weighted-average common shares outstanding for basic and diluted earnings per share. GE has determined that the forward contract, indexed to its own common stock, met all the criteria for equity classification. There was no dilutive impact on earnings per share related to the forward contract.
184 GE 2016 FORM 10-K

FINANCIAL STATEMENTS FAIR VALUE MEASUREMENTS
GE 2016 FORM 10-K 185
Earnings-per-share amounts are computed independently for earnings (loss) from continuing operations, earnings (loss) from discontinued operations and net earnings (loss). As a result, the sum of per-share amounts from continuing operations and discontinued operations may not equal the total per-share amounts for net earnings. NOTE 19. FAIR VALUE MEASUREMENTS RECURRING FAIR VALUE MEASUREMENTS Our assets and liabilities measured at fair value on a recurring basis include investment securities mainly supporting obligations to annuitants and policyholders in our run-off insurance operations and derivatives. ASSETS AND LIABILITIES MEASURED AT FAIR VALUE ON A RECURRING BASIS
Netting (In millions) Level 1(a) Level 2 (a) Level 3 adjustment (b) Net balanceDecember 31, 2016 Assets Investment securities Debt U.S. corporate $ - $ 19,647 $ 3,399 $ - $ 23,046 State and municipal - 4,163 73 - 4,236 Mortgage and asset-backed - 2,852 9 - 2,861 Corporate – non-U.S. - 11,299 688 - 11,987 Government – non-U.S. - 1,262 - - 1,262 U.S. government and federal agency - 482 232 - 714 Equity 188 14 6 - 208 Derivatives(c) - 5,444 23 (5,121) 345 Total $ 188 $ 45,163 $ 4,429 $ (5,121) $ 44,658 Liabilities Derivatives $ - $ 4,880 $ 2 $ (4,449) $ 434 Other(e) - 1,143 - - 1,143 Total $ - $ 6,024 $ 2 $ (4,449) $ 1,577 December 31, 2015 Assets Investment securities Debt U.S. corporate $ - $ 19,351 $ 3,006 $ - $ 22,358 State and municipal - 4,215 30 - 4,245 Mortgage and asset-backed - 3,084 32 - 3,116 Corporate – non-U.S. 12 544 290 - 847 Government – non-U.S. 5 410 - - 415 U.S. government and federal agency 49 404 323 - 776 Equity 194 9 13 - 216 Derivatives(c) - 7,312 79 (6,110) 1,281 Other(d) - - 259 - 259 Total $ 260 $ 35,331 $ 4,033 $ (6,110) $ 33,512 Liabilities Derivatives $ - $ 5,677 $ 4 $ (4,968) $ 713 Other(e) - 1,182 - - 1,182 Total $ - $ 6,860 $ 4 $ (4,968) $ 1,895
(a) There were $12 million of Corporate – non-U.S. securities and $50 million of U.S. government and federal agency securities transferred from
Level 1 to Level 2 in the twelve months ended December 31, 2016 primarily attributable to changes in valuation approach. There were no securities transferred between Level 1 and Level 2 in the year ended December 31, 2015.
(b) The netting of derivative receivables and payables (including the effects of any collateral posted or received) is permitted when a legally enforceable master netting agreement exists.
(c) The fair value of derivatives includes an adjustment for non-performance risk. At December 31, 2016 and December 31, 2015, the cumulative adjustment for non-performance risk was $(3) million and insignificant, respectively. See Notes 20 and 29 for additional information on the composition of our derivative portfolio.
(d) Includes private equity investments. (e) Primarily represents the liabilities associated with certain of our deferred incentive compensation plans.
GE 2016 FORM 10-K 185

FINANCIAL STATEMENTS FAIR VALUE MEASUREMENTS
186 GE 2016 FORM 10-K
LEVEL 3 INSTRUMENTS The majority of our Level 3 balances consist of investment securities classified as available-for-sale with changes in fair value recorded in shareowners’ equity. CHANGES IN LEVEL 3 INSTRUMENTS FOR THE YEARS ENDED DECEMBER 31
Net change in Net Net unrealized realized/ realized/ gains unrealized unrealized (losses) gains gains relating to (losses) (losses) Transfers Transfers instruments Balance at included in included into out of Balance at still held at (In millions) January 1 earnings(a) in AOCI Purchases Sales Settlements Level 3(b) Level 3(b) December 31 December 31(c) 2016 Investment securities Debt U.S. corporate $ 3,006 $ 9 $ 137 $ 468 $ (70) $ (155) $ 32 $ (29) $ 3,399 $ - State and municipal 30 - 1 43 - (1) - - 73 - Mortgage and asset-backed 32 (19) 1 - - (6) - - 9 - Corporate – non-U.S. 290 28 - 461 (82) (1) 2 (10) 688 - U.S. government and federal agency 323 - (90) - - (1) - - 232 - Equity 13 (7) 2 - (1) (2) - - 6 - Derivatives(d)(e) 88 (18) - 1 - (59) - 8 21 (21) Other 259 - - - - - - (259) - - Total $ 4,042 $ (7) $ 51 $ 974 $ (152) $ (226) $ 35 $ (290) $ 4,427 $ (21) 2015 Investment securities Debt U.S. corporate $ 3,053 $ 3 $ (165) $ 362 $ (80) $ (137) $ - $ (30) $ 3,006 $ - State and municipal 58 - (2) - - (9) - (17) 30 - Mortgage and asset-backed 146 (19) (9) - (32) (4) - (49) 32 - Corporate – non-U.S. 337 - (6) 9 (49) (1) - - 290 - Government – non-U.S. 2 - - - - - - (2) - - U.S. government and federal agency 266 - 58 - - (1) - - 323 - Equity 9 2 (5) - - (4) 10 - 13 - Derivatives(d)(e) 29 25 - - - (6) 40 - 88 22 Other 277 8 - - (26) - - - 259 5 Total $ 4,175 $ 19 $ (128) $ 370 $ (187) $ (161) $ 51 $ (98) $ 4,042 $ 27
(a) Earnings effects are primarily included in the “GE Capital revenues from services” and “Interest and other financial charges” captions in the Statement of Earnings.
(b) Transfers in and out of Level 3 are considered to occur at the beginning of the period. Transfers out of Level 3 for the twelve months ended December 31, 2016 were primarily a result of the adoption of ASU 2015-02, Amendments to the Consolidation Analysis. See Note 1.
(c) Represents the amount of unrealized gains or losses for the period included in earnings. (d) Represents derivative assets net of derivative liabilities and includes cash accruals of none and $13 million not reflected in the fair value
hierarchy table for the twelve months ended December 31, 2016 and 2015, respectively. (e) Gains (losses) included in net realized/unrealized gains (losses) included in earnings were offset by the earnings effects from the underlying
items that were economically hedged. See Notes 20 and 29.
186 GE 2016 FORM 10-K
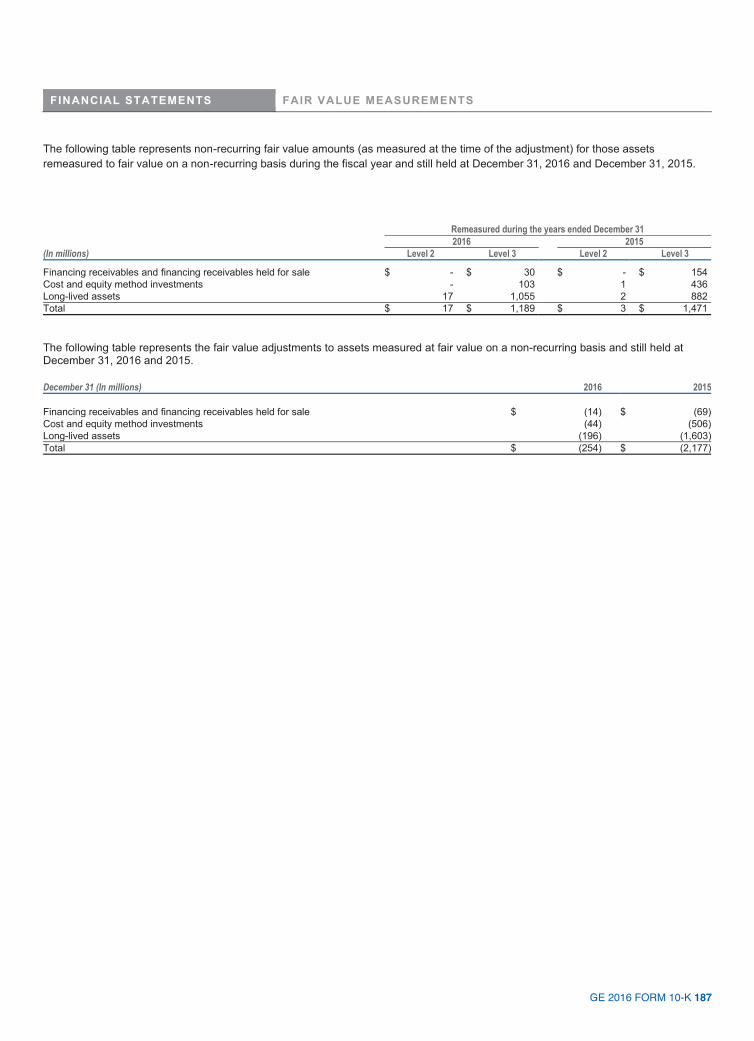
FINANCIAL STATEMENTS FAIR VALUE MEASUREMENTS
GE 2016 FORM 10-K 187
The following table represents non-recurring fair value amounts (as measured at the time of the adjustment) for those assets remeasured to fair value on a non-recurring basis during the fiscal year and still held at December 31, 2016 and December 31, 2015. Remeasured during the years ended December 31 2016 2015 (In millions) Level 2 Level 3 Level 2 Level 3
Financing receivables and financing receivables held for sale $ - $ 30 $ - $ 154 Cost and equity method investments - 103 1 436 Long-lived assets 17 1,055 2 882 Total $ 17 $ 1,189 $ 3 $ 1,471 The following table represents the fair value adjustments to assets measured at fair value on a non-recurring basis and still held at December 31, 2016 and 2015. December 31 (In millions) 2016 2015 Financing receivables and financing receivables held for sale $ (14) $ (69)Cost and equity method investments (44) (506)Long-lived assets (196) (1,603)Total $ (254) $ (2,177)
GE 2016 FORM 10-K 187

FINANCIAL STATEMENTS FAIR VALUE MEASUREMENTS
188 GE 2016 FORM 10-K
LEVEL 3 MEASUREMENTS - SIGNIFICANT UNOBSERVABLE INPUTS
Range (Dollars in millions) Fair value Valuation technique Unobservable inputs (weighted-average) December 31, 2016 Recurring fair value measurements Investment securities – Debt U.S. corporate $ 809 Income approach Discount rate(a) 1.4%-17.4% (8.1%) State and municipal 20 Income approach Discount rate(a) 3.7%-3.7% (3.7%) Mortgage and asset-backed 1 Income approach Discount rate(a) 2.7%-6.9% (4.3%) Non-recurring fair value measurements Financing receivables and financing receivables held for sale $ 30 Income approach Discount rate(a) 2.5%-30.0% (20.3%) Cost and equity method investments 94 Income approach Discount rate(a) 9.0%-30.0% (11.8%) Long-lived assets 683 Income approach Discount rate(a) 2.5%-20.0% (10.4%)
December 31, 2015 Recurring fair value measurements Investment securities – Debt U.S. corporate $ 834 Income approach Discount rate(a) 1.7%-14.1% (8.6%) Mortgage and asset-backed 31 Income approach Discount rate(a) 5.0%-12.0% (10.5%) Corporate – non-U.S. 236 Income approach Discount rate(a) 6.5%-14.0% (7.5%) Other financial assets 259 Income approach, EBITDA multiple 6.1X-15.0X (9.9X) Market comparables Capitalization rate 7.8%-7.8% (7.8%) Non-recurring fair value measurements Financing receivables and financing receivables held for sale $ 146 Income approach Discount rate(a) 6.5%-30.0% (10.7%) Cost and equity method investments 293 Income approach Discount rate(a) 9.5%-35.0% (14.4%) Long-lived assets 830 Income approach Discount rate(a) 1.8%-11.7% (10.5%) (a) Discount rates are determined based on inputs that market participants would use when pricing investments, including credit and liquidity risk.
An increase in the discount rate would result in a decrease in the fair value. At December 31, 2016 and December 31, 2015, other Level 3 recurring fair value measurements of $3,598 million and $2,637 million, respectively, and non-recurring measurements of $379 million and $122 million, respectively, are valued using non-binding broker quotes or other third-party sources. At December 31, 2016 and December 31, 2015, other recurring fair value measurements of an insignificant amount and $32 million, respectively, and non-recurring fair value measurements of $2 million and $80 million, respectively, were individually insignificant and utilize a number of different unobservable inputs not subject to meaningful aggregation.
188 GE 2016 FORM 10-K

FINANCIAL STATEMENTS FINANCIAL INSTRUMENTS
GE 2016 FORM 10-K 189
NOTE 20. FINANCIAL INSTRUMENTS
The following table provides information about assets and liabilities not carried at fair value. The table excludes finance leases and non-financial assets and liabilities. Substantially all of the assets discussed below are considered to be Level 3. The vast majority of our liabilities’ fair values can be determined based on significant observable inputs and thus considered Level 2. Few of the instruments are actively traded and their fair values must often be determined using financial models. Realization of the fair value of these instruments depends upon market forces beyond our control, including marketplace liquidity. 2016 2015 Carrying Carrying amount Estimated amount EstimatedDecember 31 (In millions) (net) fair value (net) fair value
GE Assets Investments and notes receivable $ 1,526 $ 1,595 $ 1,104 $ 1,174 Liabilities Borrowings(a)(b) 19,184 19,923 18,397 18,954 Borrowings (debt assumed)(a)(c) 60,109 66,998 84,704 92,231
GE Capital Assets Loans 21,060 20,830 20,061 19,774 Time deposits(d) - - 10,386 10,386 Other commercial mortgages 1,410 1,472 1,381 1,447 Loans held for sale 473 473 342 342 Other financial instruments(e) 121 150 94 110 Liabilities Borrowings(a)(f)(g)(h) 58,523 62,024 95,474 99,396 Investment contracts 2,813 3,277 2,955 3,441 (a) See Note 10. (b) Included $115 million and $116 million of accrued interest in estimated fair value at December 31, 2016 and December 31, 2015, respectively. (c) Included $803 million and $1,006 million of accrued interest in estimated fair value at December 31, 2016 and December 31, 2015,
respectively. (d) Balances at December 31, 2015 comprised high quality interest bearing deposits with European branches of global banks, predominantly in
the U.K., that matured in April 2016. (e) Principally comprises cost method investments. (f) Fair values exclude interest rate and currency derivatives designated as hedges of borrowings. Had they been included, the fair value of
borrowings at December 31, 2016 and December 31, 2015 would have been reduced by $2,397 million and $3,001 million, respectively. (g) Included $775 million and $1,103 million of accrued interest in estimated fair value at December 31, 2016 and December 31, 2015,
respectively. (h) Excluded $58,780 million and $84,704 million of intercompany payable to GE at December 31, 2016 and December 31, 2015 respectively,
which includes a reduction in the short-term intercompany payable to GE for a $(1,329) million loan to GE, which bears the right of offset against amounts owed under the assumed debt agreement. The remaining short-term loan balance was paid in January 2017.
A description of how we estimate fair values follows: Loans. Based on a discounted future cash flows methodology, using current market interest rate data adjusted for inherent credit risk or quoted market prices and recent transactions, if available. Borrowings. Based on valuation methodologies using current market interest rate data that are comparable to market quotes adjusted for our non-performance risk. Investment contracts. Based on expected future cash flows, discounted at currently offered rates for immediate annuity contracts or the income approach for single premium deferred annuities. Time deposits. Carrying value approximates fair value as these financial instruments have limited credit risk, short-term maturities and interest rates that approximate market.
GE 2016 FORM 10-K 189
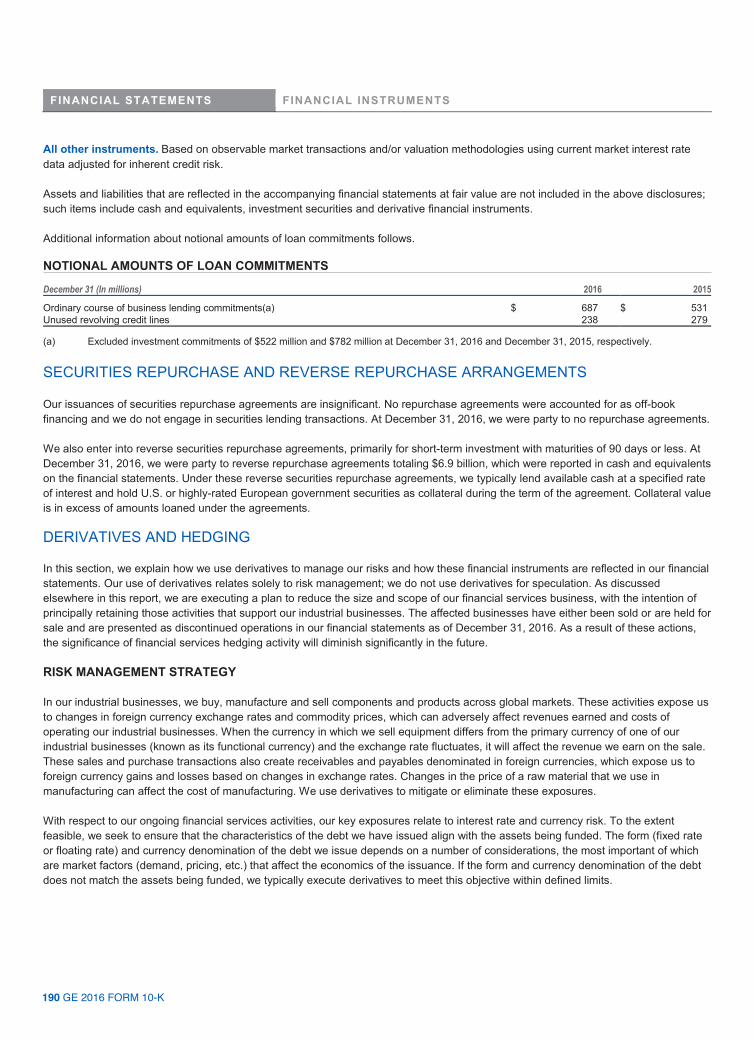
FINANCIAL STATEMENTS FINANCIAL INSTRUMENTS
190 GE 2016 FORM 10-K
All other instruments. Based on observable market transactions and/or valuation methodologies using current market interest rate data adjusted for inherent credit risk. Assets and liabilities that are reflected in the accompanying financial statements at fair value are not included in the above disclosures; such items include cash and equivalents, investment securities and derivative financial instruments. Additional information about notional amounts of loan commitments follows. NOTIONAL AMOUNTS OF LOAN COMMITMENTS
December 31 (In millions) 2016 2015
Ordinary course of business lending commitments(a) $ 687 $ 531 Unused revolving credit lines 238 279
(a) Excluded investment commitments of $522 million and $782 million at December 31, 2016 and December 31, 2015, respectively.
SECURITIES REPURCHASE AND REVERSE REPURCHASE ARRANGEMENTS Our issuances of securities repurchase agreements are insignificant. No repurchase agreements were accounted for as off-book financing and we do not engage in securities lending transactions. At December 31, 2016, we were party to no repurchase agreements. We also enter into reverse securities repurchase agreements, primarily for short-term investment with maturities of 90 days or less. At December 31, 2016, we were party to reverse repurchase agreements totaling $6.9 billion, which were reported in cash and equivalents on the financial statements. Under these reverse securities repurchase agreements, we typically lend available cash at a specified rate of interest and hold U.S. or highly-rated European government securities as collateral during the term of the agreement. Collateral value is in excess of amounts loaned under the agreements. DERIVATIVES AND HEDGING In this section, we explain how we use derivatives to manage our risks and how these financial instruments are reflected in our financial statements. Our use of derivatives relates solely to risk management; we do not use derivatives for speculation. As discussed elsewhere in this report, we are executing a plan to reduce the size and scope of our financial services business, with the intention of principally retaining those activities that support our industrial businesses. The affected businesses have either been sold or are held for sale and are presented as discontinued operations in our financial statements as of December 31, 2016. As a result of these actions, the significance of financial services hedging activity will diminish significantly in the future. RISK MANAGEMENT STRATEGY In our industrial businesses, we buy, manufacture and sell components and products across global markets. These activities expose us to changes in foreign currency exchange rates and commodity prices, which can adversely affect revenues earned and costs of operating our industrial businesses. When the currency in which we sell equipment differs from the primary currency of one of our industrial businesses (known as its functional currency) and the exchange rate fluctuates, it will affect the revenue we earn on the sale. These sales and purchase transactions also create receivables and payables denominated in foreign currencies, which expose us to foreign currency gains and losses based on changes in exchange rates. Changes in the price of a raw material that we use in manufacturing can affect the cost of manufacturing. We use derivatives to mitigate or eliminate these exposures. With respect to our ongoing financial services activities, our key exposures relate to interest rate and currency risk. To the extent feasible, we seek to ensure that the characteristics of the debt we have issued align with the assets being funded. The form (fixed rate or floating rate) and currency denomination of the debt we issue depends on a number of considerations, the most important of which are market factors (demand, pricing, etc.) that affect the economics of the issuance. If the form and currency denomination of the debt does not match the assets being funded, we typically execute derivatives to meet this objective within defined limits.
190 GE 2016 FORM 10-K
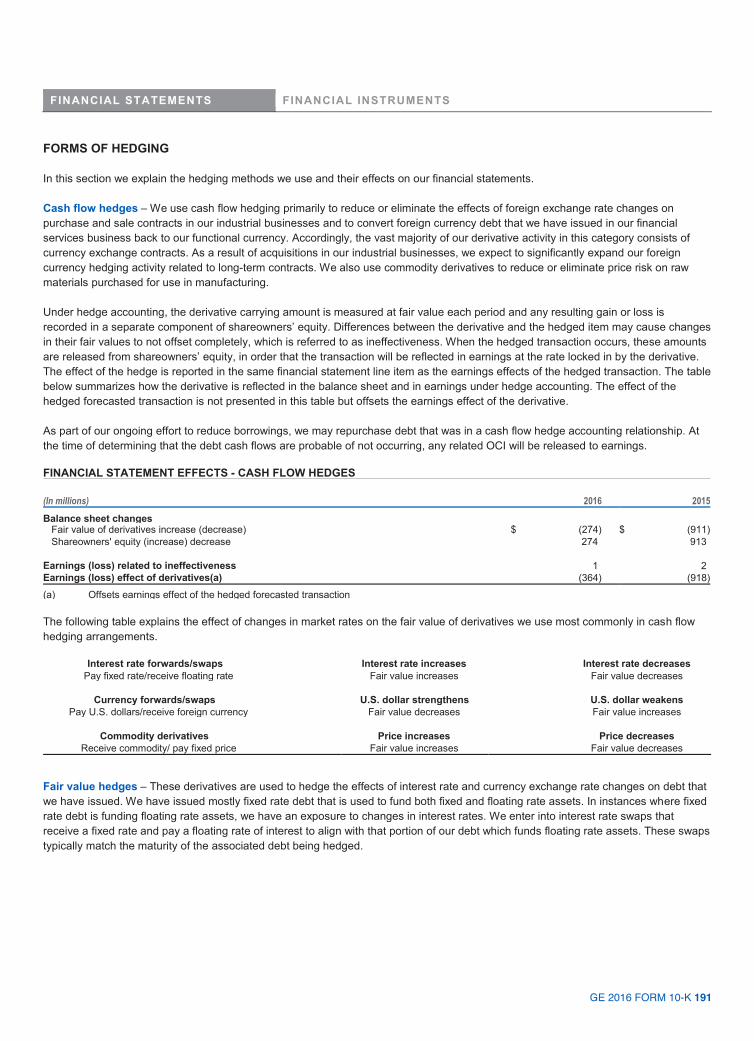
FINANCIAL STATEMENTS FINANCIAL INSTRUMENTS
GE 2016 FORM 10-K 191
FORMS OF HEDGING In this section we explain the hedging methods we use and their effects on our financial statements. Cash flow hedges – We use cash flow hedging primarily to reduce or eliminate the effects of foreign exchange rate changes on purchase and sale contracts in our industrial businesses and to convert foreign currency debt that we have issued in our financial services business back to our functional currency. Accordingly, the vast majority of our derivative activity in this category consists of currency exchange contracts. As a result of acquisitions in our industrial businesses, we expect to significantly expand our foreign currency hedging activity related to long-term contracts. We also use commodity derivatives to reduce or eliminate price risk on raw materials purchased for use in manufacturing. Under hedge accounting, the derivative carrying amount is measured at fair value each period and any resulting gain or loss is recorded in a separate component of shareowners’ equity. Differences between the derivative and the hedged item may cause changes in their fair values to not offset completely, which is referred to as ineffectiveness. When the hedged transaction occurs, these amounts are released from shareowners’ equity, in order that the transaction will be reflected in earnings at the rate locked in by the derivative. The effect of the hedge is reported in the same financial statement line item as the earnings effects of the hedged transaction. The table below summarizes how the derivative is reflected in the balance sheet and in earnings under hedge accounting. The effect of the hedged forecasted transaction is not presented in this table but offsets the earnings effect of the derivative. As part of our ongoing effort to reduce borrowings, we may repurchase debt that was in a cash flow hedge accounting relationship. At the time of determining that the debt cash flows are probable of not occurring, any related OCI will be released to earnings. FINANCIAL STATEMENT EFFECTS - CASH FLOW HEDGES
(In millions) 2016 2015
Balance sheet changes Fair value of derivatives increase (decrease) $ (274) $ (911) Shareowners' equity (increase) decrease 274 913 Earnings (loss) related to ineffectiveness 1 2 Earnings (loss) effect of derivatives(a) (364) (918)
(a) Offsets earnings effect of the hedged forecasted transaction The following table explains the effect of changes in market rates on the fair value of derivatives we use most commonly in cash flow hedging arrangements.
Interest rate forwards/swaps Interest rate increases Interest rate decreases Pay fixed rate/receive floating rate Fair value increases Fair value decreases
Currency forwards/swaps U.S. dollar strengthens U.S. dollar weakens
Pay U.S. dollars/receive foreign currency Fair value decreases Fair value increases
Commodity derivatives Price increases Price decreases Receive commodity/ pay fixed price Fair value increases Fair value decreases
Fair value hedges – These derivatives are used to hedge the effects of interest rate and currency exchange rate changes on debt that we have issued. We have issued mostly fixed rate debt that is used to fund both fixed and floating rate assets. In instances where fixed rate debt is funding floating rate assets, we have an exposure to changes in interest rates. We enter into interest rate swaps that receive a fixed rate and pay a floating rate of interest to align with that portion of our debt which funds floating rate assets. These swaps typically match the maturity of the associated debt being hedged.
GE 2016 FORM 10-K 191
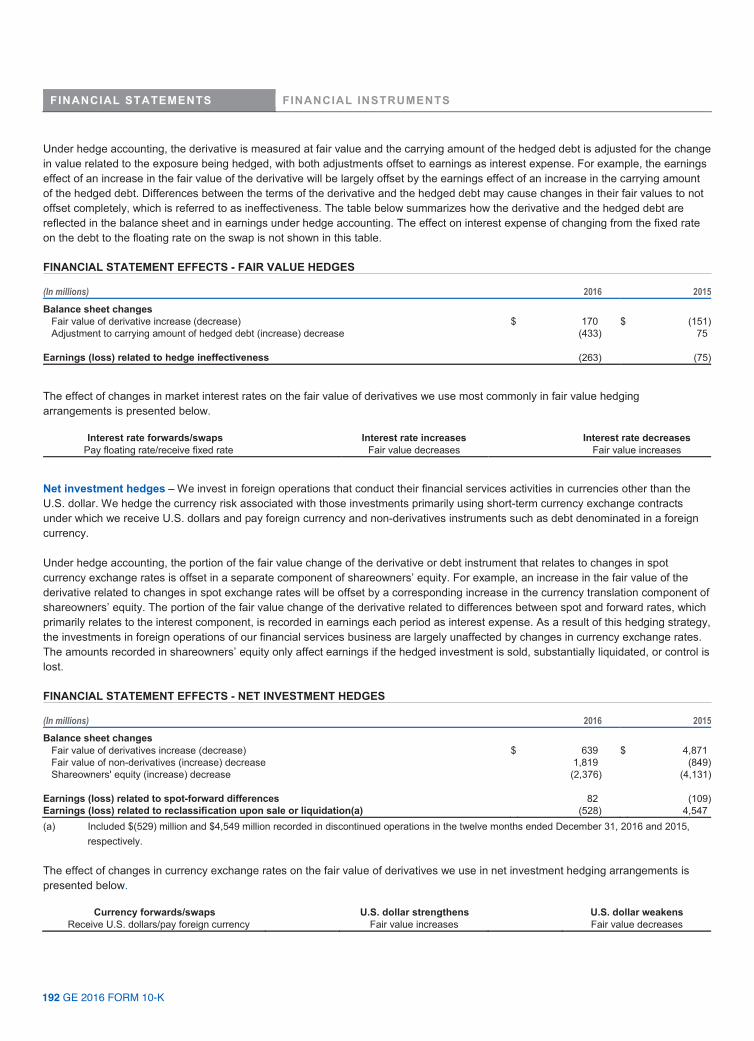
FINANCIAL STATEMENTS FINANCIAL INSTRUMENTS
192 GE 2016 FORM 10-K
Under hedge accounting, the derivative is measured at fair value and the carrying amount of the hedged debt is adjusted for the change in value related to the exposure being hedged, with both adjustments offset to earnings as interest expense. For example, the earnings effect of an increase in the fair value of the derivative will be largely offset by the earnings effect of an increase in the carrying amount of the hedged debt. Differences between the terms of the derivative and the hedged debt may cause changes in their fair values to not offset completely, which is referred to as ineffectiveness. The table below summarizes how the derivative and the hedged debt are reflected in the balance sheet and in earnings under hedge accounting. The effect on interest expense of changing from the fixed rate on the debt to the floating rate on the swap is not shown in this table. FINANCIAL STATEMENT EFFECTS - FAIR VALUE HEDGES (In millions) 2016 2015Balance sheet changes Fair value of derivative increase (decrease) $ 170 $ (151) Adjustment to carrying amount of hedged debt (increase) decrease (433) 75 Earnings (loss) related to hedge ineffectiveness (263) (75)
The effect of changes in market interest rates on the fair value of derivatives we use most commonly in fair value hedging arrangements is presented below.
Interest rate forwards/swaps Interest rate increases Interest rate decreases Pay floating rate/receive fixed rate Fair value decreases Fair value increases
Net investment hedges – We invest in foreign operations that conduct their financial services activities in currencies other than the U.S. dollar. We hedge the currency risk associated with those investments primarily using short-term currency exchange contracts under which we receive U.S. dollars and pay foreign currency and non-derivatives instruments such as debt denominated in a foreign currency. Under hedge accounting, the portion of the fair value change of the derivative or debt instrument that relates to changes in spot currency exchange rates is offset in a separate component of shareowners’ equity. For example, an increase in the fair value of the derivative related to changes in spot exchange rates will be offset by a corresponding increase in the currency translation component of shareowners’ equity. The portion of the fair value change of the derivative related to differences between spot and forward rates, which primarily relates to the interest component, is recorded in earnings each period as interest expense. As a result of this hedging strategy, the investments in foreign operations of our financial services business are largely unaffected by changes in currency exchange rates. The amounts recorded in shareowners’ equity only affect earnings if the hedged investment is sold, substantially liquidated, or control is lost. FINANCIAL STATEMENT EFFECTS - NET INVESTMENT HEDGES (In millions) 2016 2015Balance sheet changes Fair value of derivatives increase (decrease) $ 639 $ 4,871 Fair value of non-derivatives (increase) decrease 1,819 (849) Shareowners' equity (increase) decrease (2,376) (4,131) Earnings (loss) related to spot-forward differences 82 (109)Earnings (loss) related to reclassification upon sale or liquidation(a) (528) 4,547 (a) Included $(529) million and $4,549 million recorded in discontinued operations in the twelve months ended December 31, 2016 and 2015,
respectively. The effect of changes in currency exchange rates on the fair value of derivatives we use in net investment hedging arrangements is presented below.
Currency forwards/swaps U.S. dollar strengthens U.S. dollar weakens Receive U.S. dollars/pay foreign currency Fair value increases Fair value decreases
192 GE 2016 FORM 10-K

FINANCIAL STATEMENTS FINANCIAL INSTRUMENTS
GE 2016 FORM 10-K 193
Economic Hedges - These derivatives are not designated as hedges from an accounting standpoint (and therefore we do not apply hedge accounting to the relationship) but otherwise serve the same economic purpose as other hedging arrangements. Economic hedges are used when changes in the carrying amount of the hedged item are already recorded in earnings in the same period as the derivative, making hedge accounting unnecessary. For example, in our industrial businesses we record the effects of spot exchange rate changes on our foreign currency payables and receivables in earnings each period along with the fair value changes on the foreign currency forward contracts used as economic hedges. In these cases, the earnings effects of the derivative and hedged item largely offset. We also use economic hedges when we have exposures to currency exchange risk for which we are unable to meet the requirements for hedge accounting. For example, we use currency forwards as an economic hedge of forecasted foreign currency cash flows under long-term contracts. In this case, the forecast period is so long that it is difficult to meet the hedge accounting requirement that the occurrence of the hedged transactions is probable. For these types of economic hedges, changes in the fair value of the derivative are recorded in earnings currently but changes in the value of the forecasted foreign currency cash flows are only recognized in earnings when they occur. As a result, even though the derivative is an effective economic hedge, there is a net effect on earnings in each period due to differences in the timing of earnings recognition between the derivative and the hedged item. The table below provides information about the earnings effects of all derivatives that serve as economic hedges. These derivatives are marked to fair value through earnings each period. For our financial services business, these gains and losses are reported in “GE Capital revenues from services.” For our industrial businesses, the effects are reported in “Other income” or “Other costs and expenses.” The offsetting earnings effects associated with hedged assets and liabilities are also displayed in the table below. In general, the earnings effects of the hedged item are recorded in the same financial statement line as the derivative. The earnings effect of economic hedges, after considering offsets related to earnings effects of hedged assets and liabilities, is substantially offset by changes in the fair value of forecasted transactions that have not yet affected earnings. FINANCIAL STATEMENT EFFECTS - ECONOMIC HEDGES (In millions) 2016 2015 Balance sheet changes Change in fair value of economic hedge increase (decrease) $ (2,456) $ (2,720) Change in carrying amount of item being hedged increase (decrease) 2,107 2,543 Earnings (loss) effect of economic hedges(a) (348) (177) (a) Offset by the future earnings effects of economically hedged item. The table below explains the effects of market rate changes on the fair value of derivatives we use most commonly as economic hedges.
Interest rate forwards/swaps interest rate Interest rate increases Interest rate decreases Pay floating rate/receive fixed rate Fair value decreases Fair value increases
Currency forwards/swaps U.S. dollar strengthens U.S. dollar weakens
Pay U.S. dollars/receive foreign currency Fair value decreases Fair value increases Receive U.S. dollars/pay foreign currency Fair value increases Fair value decreases
Commodity derivatives Price increases Price decreases
Receive commodity/pay fixed price Fair value increases Fair value decreases NOTIONAL AMOUNT OF DERIVATIVES The notional amount of a derivative is the number of units of the underlying (for example, the notional principal amount of the debt in an interest rate swap). The notional amount is used to compute interest or other payment streams to be made under the contract and is a measure of our level of activity. We generally disclose derivative notional amounts on a gross basis. A substantial majority of the outstanding notional amount of $181 billion at December 31, 2016 is related to managing interest rate and currency risk between financial assets and liabilities in our financial services business. The remaining derivative notional amount primarily relates to hedges of anticipated sales and purchases in foreign currency, commodity purchases and contractual terms in contracts that are considered embedded derivatives.
GE 2016 FORM 10-K 193

FINANCIAL STATEMENTS FINANCIAL INSTRUMENTS
194 GE 2016 FORM 10-K
The table below provides additional information about how derivatives are reflected in our financial statements. Derivative assets and liabilities are recorded at fair value exclusive of interest earned or owed on interest rate derivatives, which is presented separately on our Statement of Financial Position. Cash collateral and securities held as collateral represent assets that have been provided by our derivative counterparties as security for amounts they owe us (derivatives that are in an asset position). CARRYING AMOUNTS RELATED TO DERIVATIVES December 31 (In millions) 2016 2015Derivative assets $ 5,467 $ 7,391 Derivative liabilities (4,883) (5,681)Accrued interest 792 1,014 Cash collateral & credit valuation adjustment (672) (1,141)Net Derivatives 703 1,583 Securities held as collateral (442) (1,277)Net amount $ 262 $ 306
EFFECTS OF DERIVATIVES ON EARNINGS All derivatives are marked to fair value on our balance sheet, whether they are designated in a hedging relationship for accounting purposes or are used as economic hedges. As discussed in the previous sections, each type of hedge affects the financial statements differently. In fair value and economic hedges, both the hedged item and the hedging derivative largely offset in earnings each period. In cash flow and net investment hedges, the effective portion of the hedging derivative is offset in separate components of shareowners’ equity and ineffectiveness is recognized in earnings. The table below summarizes these offsets and the net effect on pre-tax earnings. (In millions) Effect on hedging instrument Effect on underlying Effect on earnings2016 Cash flow hedges $ (274) $ 274 $ 1 Fair value hedges 170 (433) (263)Net investment hedges(a) 2,458 (2,376) 82 Economic hedges(b) (2,456) 2,107 (348)Total $ (528)
2015 Cash flow hedges $ (911) $ 913 $ 2 Fair value hedges (151) 75 (75)Net investment hedges(a) 4,022 (4,131) (109)Economic hedges(b) (2,720) 2,543 (177)Total $ (359)
The amounts in the table above generally do not include associated derivative accruals in income or expense. (a) Both derivatives and non-derivatives hedging instruments are included. (b) Net effect is substantially offset by the change in fair value of the hedged item that will affect earnings in future periods.
See Note 15 for additional information about changes in shareowners’ equity related to hedging and amounts released to earnings. See Note 29 for other supplemental information about derivatives and hedging.
194 GE 2016 FORM 10-K

FINANCIAL STATEMENTS VARIABLE INTEREST ENTITIES
GE 2016 FORM 10-K 195
NOTE 21. VARIABLE INTEREST ENTITIES (VIE) A VIE is an entity that has one of three characteristics: (1) it is controlled by someone other than its shareowners or partners, (2) its shareowners or partners are not economically exposed to the entity’s earnings (for example, they are protected against losses), or (3) it was thinly capitalized when it was formed. In the normal course of our business we become involved with VIEs either because we help create them or we invest in them. Our VIEs either provide goods and services to customers or provide financing to third parties for the purchase of GE goods and services. If we control the VIE, we consolidate it and provide disclosures below. However, if the VIE is a business and use of its assets is not limited to settling its liabilities, ongoing disclosures are not required. CONSOLIDATED VARIABLE INTEREST ENTITIES Our most significant consolidated VIEs are the three joint ventures that were formed as part of the Alstom acquisition. These joint ventures include grid technology, renewable energy, and global nuclear and French steam power and have combined assets, liabilities and redeemable noncontrolling interest as of December 31, 2016 and 2015 of $14,460 million, $9,922 million and $2,709 million and $11,536 million, $8,739 million and $2,859 million, respectively. These joint ventures are considered VIEs because the equity held by Alstom does not participate fully in the earnings of the ventures due to the contractual features allowing Alstom to sell their interests back to GE. We consolidate these ventures because we control all their significant activities. These joint ventures are in all other respects regular businesses and are therefore exempt from ongoing disclosure requirements for VIEs provided below. The table below provides information about VIEs that are subject to ongoing disclosure requirements. Substantially all of these entities were created to help our customers finance the purchase of GE goods and services or to purchase GE current and customer notes receivable originating from sales of goods and services. These entities have no features that could expose us to losses that would significantly exceed the difference between the consolidated assets and liabilities.
GE 2016 FORM 10-K 195

FINANCIAL STATEMENTS VARIABLE INTEREST ENTITIES
196 GE 2016 FORM 10-K
ASSETS AND LIABILITIES OF CONSOLIDATED VIEs GE Capital Current Customer (In millions) GE receivables(a) Notes receivables(b) Other Total December 31, 2016 Assets Financing receivables, net $ - $ - $ - $ 1,035 $ 1,035 Current receivables 57 - 670 - 727 Investment securities - - - 982 982 Other assets 492 (c) - 1,122 1,747 3,361 Total $ 549 $ - $ 1,792 $ 3,764 $ 6,105 Liabilities Borrowings $ 1 $ - $ - $ 818 $ 819 Non-recourse borrowings - - 401 16 417 Other liabilities 457 (c) - 1,378 1,482 3,317 Total $ 458 $ - $ 1,779 $ 2,316 $ 4,553 December 31, 2015 Assets Financing receivables, net $ - $ - $ - $ 882 $ 882 Current receivables 385 3,506 - - 3,891 Investment securities - - - 1,404 1,404 Other assets 2,482 24 - 1,068 3,574 Total $ 2,867 $ 3,530 $ - $ 3,354 $ 9,751 Liabilities Borrowings $ 221 $ - $ - $ 960 $ 1,181 Non-recourse borrowings - 3,022 - 61 3,083 Other liabilities 2,289 34 - 1,234 3,557 Total $ 2,510 $ 3,056 $ - $ 2,255 $ 7,821 (a) In the second quarter of 2016, we completed the sale of our Appliances business to Haier and sold all of the Appliances current receivables
purchased by the securitization trust to Haier for $773 million. At December 31, 2015, the current receivables securitization included $737 million of current receivables purchased from Appliances. In the fourth quarter of 2016, we completed the restructure of our Receivables Facility described in Note 22. The restructured facility does not use a consolidated VIE.
(b) In the first quarter of 2016, two funding vehicles were established to purchase customer notes receivable from GE, one of which is partially funded by third-party debt.
(c) In the first quarter of 2016, we purchased the minority interest in an Oil & Gas joint venture, and as a result, the entity is no longer a VIE. Consolidated VIE assets and liabilities were reduced by $1,240 million and $1,284 million, respectively.
Total revenues from our consolidated VIEs were $1,141 million, $1,638 million and $1,457 million for the years ended December 31, 2016, 2015 and 2014, respectively. Related expenses consisted primarily of cost of goods and services of $692 million, $1,232 million and $823 million for the years ended December 31, 2016, 2015 and 2014, respectively. Where we provide servicing for third-party investors, we are contractually permitted to commingle cash collected from customers on financing receivables sold to third-party investors with our own cash prior to payment to third-party investors, provided our short-term credit rating does not fall below A-1/P1. These third-party investors also owe us amounts for purchased financial assets and scheduled interest and principal payments. At December 31, 2016 and 2015, the amounts of commingled cash owed to the third-party investors were $1,117 million and $1,093 million, respectively, and the amounts owed to us by third-party investors were $5 million and $7 million, respectively. UNCONSOLIDATED VARIABLE INTEREST ENTITIES We become involved with unconsolidated VIEs primarily through assisting in the formation and financing of the entity. We do not consolidate these entities because we do not have power over decisions that significantly affect their economic performance. Our investments in unconsolidated VIEs at December 31, 2016 and 2015 were $6,346 million and $787 million, respectively. Obligations to make additional investments in these entities are not significant.
196 GE 2016 FORM 10-K

FINANCIAL STATEMENTS RECEIVABLES FACILITY
GE 2016 FORM 10-K 197
Our investments in long-lived, capital-intensive energy limited partnerships through Energy Financial Services became non-consolidated VIEs in accordance with our January 2016 adoption of ASU 2015-2, Amendments to the Consolidated Analysis (see Note 1). In these partnerships we are the sole limited partner and had no participating rights or substantive removal rights over the general partners. The general partners of these entities, who possess the technical and industry expertise necessary to operate and manage their activities, continue to control these limited partnerships. As a result of this accounting change, our disclosed investments in unconsolidated VIEs increased by $6,077 million, without additional funds being advanced to these entities. NOTE 22. RECEIVABLES FACILITY Since 2002, the Company, as part of its working capital management, has sold current receivables to trusts in which third-party investors invest (the Receivables Facility). We use the cash generated from those sales to fund GE working capital earlier than we would otherwise receive payment from our customers and to manage credit exposures. In 2010, we consolidated the trust that existed at that time pursuant to a change in the accounting guidance and subsequently reported both current receivables owned by the trust and the associated non-recourse third-party debt of the trust as assets and liabilities of a consolidated VIE on the Statement of Financial Position. Our economic exposure to the sold receivables remained the same before and after we consolidated the trust. In the fourth quarter of 2016, we completed a refinancing of the Receivables Facility. The total facility size remained at $3,000 million. As a result of this refinancing, the current receivables are now purchased directly by third-party investors, who make their own arrangements to fund the purchase, and we no longer use the trust we used prior to the refinancing. Upon sale of the receivables, we receive proceeds of cash and a deferred purchase price (DPP). The DPP is an interest in specified assets of the purchasers (the receivables sold by GE Capital) that entitles GE Capital to the residual cash flows of those specified assets. The third-party purchasers have no recourse to other assets of GE Capital in the event of non-payment by the debtors. Where the purchasing entity is a bank multi-seller commercial paper conduit, assets transferred by other parties to that entity form a majority of the entity’s assets. The amount of customer receivables sold and outstanding under the Receivables Facility at December 31, 2016 was $2,575 million, and the consolidated customer receivables financed by third-party investors at December 31, 2015 was $3,506 million. The amount of DPP due to GE Capital was $483 million at December 31, 2016, and is classified as “Current receivables” in the consolidated column of the Statement of Financial Position and as “Financing receivables” in the GE Capital column of the Statement of Financial Position. Because of the refinancing, GE Capital’s financing receivables decreased by approximately $2,092 million as of December 31, 2016 when compared to December 31, 2015. The Company’s economic exposure under the Receivables Facility, represented by the DPP, remained the same before and after we completed the refinancing of the Receivables Facility. Given the short-term nature of the underlying receivables, discount rates and prepayments are not factors in determining the value of the DPP. Collections on the DPP are presented within Cash flows from operating activities in the consolidated column in the Statement of Cash Flows. As the performance of the transferred current receivables is similar to the performance of our other current receivables, delinquencies are not expected to be significant.
GE 2016 FORM 10-K 197
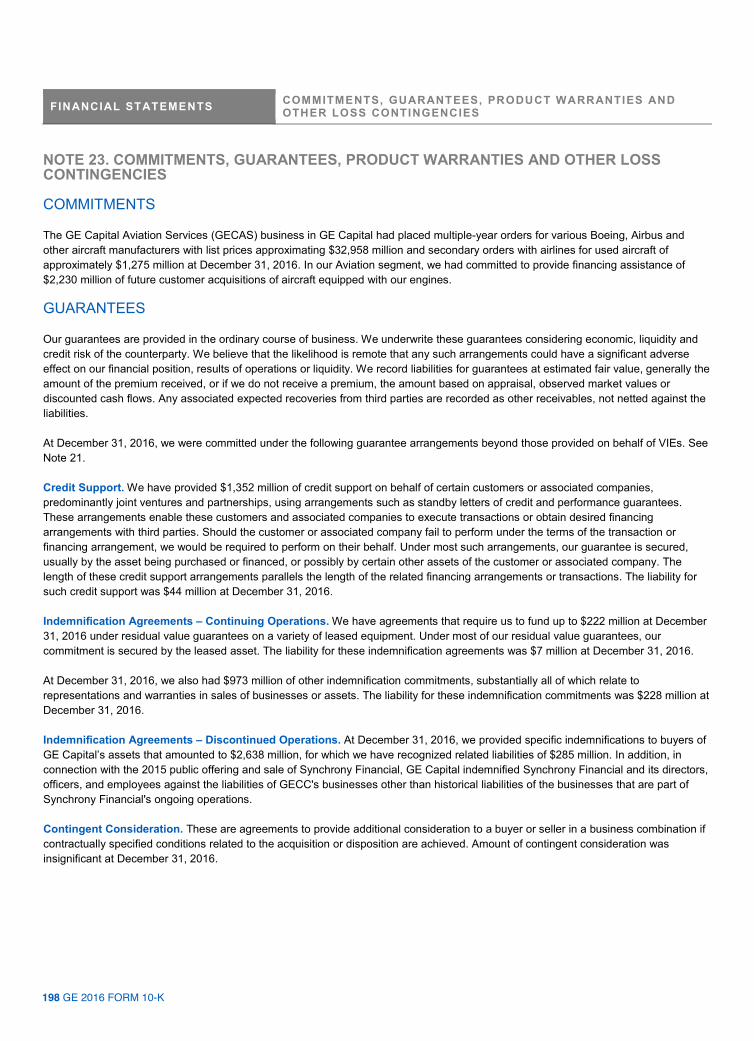
FINANCIAL STATEMENTS COMMITMENTS, GUARANTEES, PRODUCT WARRANTIES AND OTHER LOSS CONTINGENCIES
198 GE 2016 FORM 10-K
NOTE 23. COMMITMENTS, GUARANTEES, PRODUCT WARRANTIES AND OTHER LOSS CONTINGENCIES COMMITMENTS The GE Capital Aviation Services (GECAS) business in GE Capital had placed multiple-year orders for various Boeing, Airbus and other aircraft manufacturers with list prices approximating $32,958 million and secondary orders with airlines for used aircraft of approximately $1,275 million at December 31, 2016. In our Aviation segment, we had committed to provide financing assistance of $2,230 million of future customer acquisitions of aircraft equipped with our engines. GUARANTEES Our guarantees are provided in the ordinary course of business. We underwrite these guarantees considering economic, liquidity and credit risk of the counterparty. We believe that the likelihood is remote that any such arrangements could have a significant adverse effect on our financial position, results of operations or liquidity. We record liabilities for guarantees at estimated fair value, generally the amount of the premium received, or if we do not receive a premium, the amount based on appraisal, observed market values or discounted cash flows. Any associated expected recoveries from third parties are recorded as other receivables, not netted against the liabilities. At December 31, 2016, we were committed under the following guarantee arrangements beyond those provided on behalf of VIEs. See Note 21. Credit Support. We have provided $1,352 million of credit support on behalf of certain customers or associated companies, predominantly joint ventures and partnerships, using arrangements such as standby letters of credit and performance guarantees. These arrangements enable these customers and associated companies to execute transactions or obtain desired financing arrangements with third parties. Should the customer or associated company fail to perform under the terms of the transaction or financing arrangement, we would be required to perform on their behalf. Under most such arrangements, our guarantee is secured, usually by the asset being purchased or financed, or possibly by certain other assets of the customer or associated company. The length of these credit support arrangements parallels the length of the related financing arrangements or transactions. The liability for such credit support was $44 million at December 31, 2016. Indemnification Agreements – Continuing Operations. We have agreements that require us to fund up to $222 million at December 31, 2016 under residual value guarantees on a variety of leased equipment. Under most of our residual value guarantees, our commitment is secured by the leased asset. The liability for these indemnification agreements was $7 million at December 31, 2016. At December 31, 2016, we also had $973 million of other indemnification commitments, substantially all of which relate to representations and warranties in sales of businesses or assets. The liability for these indemnification commitments was $228 million at December 31, 2016. Indemnification Agreements – Discontinued Operations. At December 31, 2016, we provided specific indemnifications to buyers of GE Capital’s assets that amounted to $2,638 million, for which we have recognized related liabilities of $285 million. In addition, in connection with the 2015 public offering and sale of Synchrony Financial, GE Capital indemnified Synchrony Financial and its directors, officers, and employees against the liabilities of GECC's businesses other than historical liabilities of the businesses that are part of Synchrony Financial's ongoing operations. Contingent Consideration. These are agreements to provide additional consideration to a buyer or seller in a business combination if contractually specified conditions related to the acquisition or disposition are achieved. Amount of contingent consideration was insignificant at December 31, 2016.
198 GE 2016 FORM 10-K

FINANCIAL STATEMENTS COMMITMENTS, GUARANTEES, PRODUCT WARRANTIES AND OTHER LOSS CONTINGENCIES
GE 2016 FORM 10-K 199
PRODUCT WARRANTIES We provide for estimated product warranty expenses when we sell the related products. Because warranty estimates are forecasts that are based on the best available information – mostly historical claims experience – claims costs may differ from amounts provided. An analysis of changes in the liability for product warranties follows. (In millions) 2016 2015 2014
Balance at January 1 $ 1,723 $ 1,199 $ 1,370 Current-year provisions 791 649 593 Expenditures (729) (718) (714) Other changes(a) 135 593 (50) Balance at December 31 $ 1,920 $ 1,723 $ 1,199
(a) Included $634 million related to Alstom acquisition in 2015. OTHER LOSS CONTINGENCIES
LEGAL MATTERS WMC. During the fourth quarter of 2007, we completed the sale of WMC, our U.S. mortgage business. WMC substantially discontinued all new loan originations by the second quarter of 2007, and is not a loan servicer. In connection with the sale, WMC retained certain representation and warranty obligations related to loans sold to third parties prior to the disposal of the business and contractual obligations to repurchase previously sold loans that had an early payment default. All claims received by WMC for early payment default have either been resolved or are no longer being pursued. The remaining active claims have been brought by securitization trustees or administrators seeking recovery from WMC for alleged breaches of representations and warranties on mortgage loans that serve as collateral for residential mortgage-backed securities (RMBS). At December 31, 2016, such claims consisted of $1,060 million of individual claims generally submitted before the filing of a lawsuit (compared to $2,887 million at December 31, 2015) and $5,456 million of additional claims asserted against WMC in litigation without making a prior claim (Litigation Claims) (compared to $8,047 million at December 31, 2015). The total amount of these claims, $6,516 million, reflects the purchase price or unpaid principal balances of the loans at the time of purchase and does not give effect to pay downs or potential recoveries based upon the underlying collateral, which in many cases are substantial, nor to accrued interest or fees. WMC believes that repurchase claims brought based upon representations and warranties made more than six years before WMC was notified of the claim would be disallowed in legal proceedings under applicable law and the June 11, 2015 decision of the New York Court of Appeals in ACE Securities Corp. v. DB Structured Products, Inc., on the statute of limitations period governing such claims. Reserves related to repurchase claims made against WMC were $626 million at December 31, 2016, reflecting a net decrease to reserves in the year ended December 31, 2016 of $249 million due to settlements partially offset by incremental provisions. The reserve estimate takes into account recent settlement activity and is based upon WMC’s evaluation of the remaining exposures as a percentage of estimated lifetime mortgage loan losses within the pool of loans supporting each securitization for which timely claims have been asserted in litigation against WMC. Settlements in prior periods reduced WMC’s exposure on claims asserted in certain securitizations and the claim amounts reported above give effect to these settlements. ROLLFORWARD OF THE RESERVE (In millions) 2016 2015 Balance at January 1 $ 875 $ 809 Provision 91 212 Claim resolutions / rescissions (340) (146)Balance at December 31 $ 626 $ 875
GE 2016 FORM 10-K 199

FINANCIAL STATEMENTS COMMITMENTS, GUARANTEES, PRODUCT WARRANTIES AND OTHER LOSS CONTINGENCIES
200 GE 2016 FORM 10-K
Given the significant litigation activity and WMC’s continuing efforts to resolve the lawsuits involving claims made against WMC, it is difficult to assess whether future losses will be consistent with WMC’s past experience. Adverse changes to WMC’s assumptions supporting the reserve may result in an increase to these reserves. WMC estimates a range of reasonably possible loss from $0 to approximately $500 million over its recorded reserve at December 31, 2016. This estimate involves significant judgment and may not reflect the range of uncertainties and unpredictable outcomes inherent in litigation, including the matters discussed in Legal Proceedings and potential changes in WMC’s legal strategy. This estimate excludes any possible loss associated with an adverse court decision on the applicable statute of limitations or an adverse outcome in the Financial Institutions Reform, Recovery, and Enforcement Act of 1989 (FIRREA) investigation discussed in Legal Proceedings, as WMC is unable at this time to develop such a meaningful estimate. At December 31, 2016, there were 10 lawsuits involving claims made against WMC arising from alleged breaches of representations and warranties on mortgage loans included in 11 securitizations. The adverse parties in these cases are securitization trustees or parties claiming to act on their behalf. On January 23, 2017, the ResCap Liquidating Trust, as successor to Residential Funding Company, LLC (RFC), filed a lawsuit against WMC in the United States District Court for the District of Minnesota arising from alleged breaches in representations and warranties made by WMC in connection with the sale of approximately $840 million in loans to RFC over a period of time preceding RFC’s filing for bankruptcy protection in May 2012. Although the alleged claims for relief vary from case to case, the complaints and counterclaims in these actions generally assert claims for breach of contract, indemnification, and/or declaratory judgment, and seek specific performance (repurchase of defective mortgage loan) and/or money damages. Adverse court decisions, including in cases not involving WMC, could result in new claims and lawsuits on additional loans. However, WMC continues to believe that it has defenses to the claims asserted in litigation, including, for example, based on causation and materiality requirements and applicable statutes of limitations. It is not possible to predict the outcome or impact of these defenses and other factors, any of which could materially affect the amount of any loss ultimately incurred by WMC on these claims. WMC has also received indemnification demands, nearly all of which are unspecified, from depositors/underwriters/sponsors of RMBS in connection with lawsuits brought by RMBS investors concerning alleged misrepresentations in the securitization offering documents to which WMC is not a party or, in two cases, involving mortgage loan repurchase claims made against RMBS sponsors. WMC believes that it has defenses to these demands. To the extent WMC is required to repurchase loans, WMC’s loss also would be affected by several factors, including pay downs, accrued interest and fees, and the value of the underlying collateral. The reserve and estimate of possible loss reflect judgment, based on currently available information, and a number of assumptions, including economic conditions, claim and settlement activity, pending and threatened litigation, court decisions regarding WMC’s legal defenses, indemnification demands, government activity, and other variables in the mortgage industry. Actual losses arising from claims against WMC could exceed these amounts and additional claims and lawsuits could result if actual claim rates, governmental actions, litigation and indemnification activity, adverse court decisions, actual settlement rates or losses WMC incurs on repurchased loans differ from its assumptions. FINANCIAL INFORMATION FOR WMC
(In millions) 2016 2015 2014
Total revenues and other income (loss) $ (8) $ (184) $ (291)
Earnings (loss) from discontinued operations, net of taxes $ (52) $ (146) $ (199) Alstom legacy matters. On November 2, 2015, we acquired the Thermal, Renewables and Grid businesses from Alstom. Prior to the acquisition, the seller was the subject of two significant cases involving anti-competitive activities and improper payments: (1) in January 2007, Alstom was fined €65 million by the European Commission for participating in a gas insulated switchgear cartel that operated from 1988 to 2004 (that fine was later reduced to €59 million), and (2) in December 2014, Alstom pled guilty in the United States to multiple violations of the Foreign Corrupt Practices Act and paid a criminal penalty of $772 million. As part of GE’s accounting for the acquisition, we established a reserve amounting to $858 million for legal and compliance matters related to the legacy business practices that were the subject of these and related cases in various jurisdictions.
200 GE 2016 FORM 10-K

FINANCIAL STATEMENTS COMMITMENTS, GUARANTEES, PRODUCT WARRANTIES AND OTHER LOSS CONTINGENCIES
GE 2016 FORM 10-K 201
Regardless of jurisdiction, the allegations relate to claimed anti-competitive conduct or improper payments in the pre-acquisition period as the source of legal violations and/or damages. Given the significant litigation and compliance activity related to these matters and our ongoing efforts to resolve them, it is difficult to assess whether the disbursements will ultimately be consistent with the reserve established. The estimation of this reserve involved significant judgment and may not reflect the full range of uncertainties and unpredictable outcomes inherent in litigation and investigations of this nature. Damages sought may include disgorgement of profits on the underlying business transactions, fines and/or penalties, interest, or other forms of resolution. Factors that can affect the ultimate amount of losses associated with these matters include the way cooperation is assessed and valued, prosecutorial discretion in the determination of damages, formulas for determining fines and penalties, the duration and amount of legal and investigative resources applied, and political and social influences within each jurisdiction, among other considerations. Actual losses arising from claims in these matters could exceed the amount provided. At this time, we are unable to develop a meaningful estimate of the range of reasonably possible additional losses for this exposure. ENVIRONMENTAL MATTERS Our operations, like operations of other companies engaged in similar businesses, involve the use, disposal and cleanup of substances regulated under environmental protection laws. We are involved in numerous remediation actions to clean up hazardous wastes as required by federal and state laws. Liabilities for remediation costs exclude possible insurance recoveries and, when dates and amounts of such costs are not known, are not discounted. When there appears to be a range of possible costs with equal likelihood, liabilities are based on the low end of such range. It is reasonably possible that our environmental remediation exposure will exceed amounts accrued. However, due to uncertainties about the status of laws, regulations, technology and information related to individual sites, such amounts are not reasonably estimable. Total reserves related to environmental remediation and asbestos claims were $1,767 million at December 31, 2016.
GE 2016 FORM 10-K 201

FINANCIAL STATEMENTS INTERCOMPANY TRANSACTIONS
202 GE 2016 FORM 10-K
NOTE 24. INTERCOMPANY TRANSACTIONS
Transactions between related companies are made on an arms-length basis and are reported in the GE and GE Capital columns of our financial statements, but are eliminated in deriving our consolidated financial statements. These transactions include, but are not limited to, the following:
GE Capital dividends to GE, GE Capital working capital solutions to optimize GE cash management, GE Capital enabled GE industrial orders, and Aircraft engines, power equipment and healthcare equipment manufactured by GE that are installed on GE Capital
investments, including leased equipment. In addition to the above transactions that primarily enable growth for the GE businesses, there are routine related party transactions, which include, but are not limited to, the following:
Expenses related to parent-subsidiary pension plans, Buildings and equipment leased between GE and GE Capital, including sale-leaseback transactions, Information technology (IT) and other services sold to GE Capital by GE, and Various investments, loans and allocations of GE corporate overhead costs.
Presented below is a walk of intercompany eliminations from the unconsolidated GE and GE Capital totals to the consolidated cash flows. (In millions) 2016 2015 2014
Cash from (used for) operating activities-continuing operations Combined $ 28,408 $ 17,891 $ 21,434 GE current receivables sold to GE Capital 697 (856) (1,882) GE Capital dividends to GE (20,095) (4,300) (3,000) Other reclassifications and eliminations(a) (2,911) (879) (519)Total cash from (used for) operating activities-continuing operations $ 6,099 $ 11,856 $ 16,033 Cash from (used for) investing activities-continuing operations Combined $ 58,134 $ 59,516 $ 17,252 GE current receivables sold to GE Capital (230) 1,261 1,730 GE Capital short-term loan to GE 1,329 - - Other reclassifications and eliminations(a) 3,380 836 247 Total cash from (used for) investing activities-continuing operations $ 62,613 $ 61,613 $ 19,229 Cash from (used for) financing activities-continuing operations Combined $ (107,750) $ (73,484) $ (44,340) GE current receivables sold to GE Capital (467) (405) 152 GE Capital dividends to GE 20,095 4,300 3,000 GE Capital short-term loan to GE (1,329) - - Other reclassifications and eliminations(a) (469) 42 276 Total cash from (used for) financing activities-continuing operations $ (89,920) $ (69,547) $ (40,912)
(a) Includes eliminations of other cash flows activities including those related to GE Capital enabled GE industrial orders, various investments, loans and allocations of GE corporate overhead costs.
202 GE 2016 FORM 10-K

FINANCIAL STATEMENTS OPERATING SEGMENTS
GE 2016 FORM 10-K 203
NOTE 25. OPERATING SEGMENTS BASIS FOR PRESENTATION Our operating businesses are organized based on the nature of markets and customers. Segment accounting policies are the same as described and referenced in Note 1. Segment results for our financial services businesses reflect the discrete tax effect of transactions. A description of our operating segments as of December 31, 2016, can be found below, and details of segment profit by operating segment can be found in the Summary of Operating Segments table in “Management’s Discussion and Analysis of Financial Condition and Results of Operations” section in this Form 10-K Report. POWER Power plant products and services, including design, installation, operation and maintenance services are sold into global markets. Gas, steam and aeroderivative turbines, nuclear reactors, generators, combined cycle systems, controls and related services, including total asset optimization solutions, equipment upgrades and long-term maintenance service agreements are sold to power generation and other industrial customers. Water treatment services and equipment include specialty chemical treatment programs, water purification equipment, mobile treatment systems and desalination processes. RENEWABLE ENERGY Renewable Energy makes power from renewable sources affordable, accessible, and reliable for the benefit of people everywhere. With one of the broadest technology portfolios in the industry, Renewable Energy creates value for customers by providing technology and services in the Onshore Wind Power industry, high-yield offshore wind turbines as well as a full range of solutions, products and services to serve the hydropower industry, from initial design to final commissioning. OIL & GAS Oil & Gas supplies mission critical equipment for the global oil and gas industry, used in applications spanning the entire value chain from drilling and completion through production, liquefied natural gas (LNG) and pipeline compression, pipeline inspection, and including downstream processing in refineries and petrochemical plants. The business designs and manufactures surface and subsea drilling and production systems, equipment for floating production platforms, compressors, turbines, turboexpanders, high pressure reactors, industrial power generation and a broad portfolio of auxiliary equipment. AVIATION Aviation products and services include jet engines, aerospace systems and equipment, replacement parts and repair and maintenance services for all categories of commercial aircraft; for a wide variety of military aircraft, including fighters, bombers, tankers and helicopters; for marine applications; and for executive and regional aircraft. Products and services are sold worldwide to airframe manufacturers, airlines and government agencies. HEALTHCARE Healthcare products include diagnostic imaging systems such as magnetic resonance (MR), computed tomography (CT) and positron emission tomography (PET) scanners, X-ray, surgical & interventional imaging, nuclear imaging, digital mammography and molecular imaging technologies. Healthcare-manufactured technologies include patient and resident monitoring, diagnostic cardiology, ultrasound, bone densitometry, anesthesiology and oxygen therapy, and neonatal and critical care devices. Related services include equipment monitoring and repair, digital technologies and customer productivity services. Products also include diagnostic imaging agents used in medical scanning procedures, drug discovery, biopharmaceutical manufacturing and purification, and tools for protein and cellular analysis for pharmaceutical and academic research, including a pipeline of precision molecular diagnostics in development for neurology, cardiology and oncology applications. Products and services are sold worldwide to hospitals, medical facilities, pharmaceutical and biotechnology companies, and to the life science research market.
GE 2016 FORM 10-K 203

FINANCIAL STATEMENTS OPERATING SEGMENTS
204 GE 2016 FORM 10-K
TRANSPORTATION Transportation is a global technology leader and supplier to the railroad, mining, marine and drilling industries. GE provides freight and passenger locomotives, diesel engines for rail, marine and stationary power applications, railway signaling and communications systems, underground mining equipment, motorized drive systems for mining trucks, information technology solutions, high-quality replacement parts and value added services. ENERGY CONNECTIONS & LIGHTING Energy Connections is GE’s electrification business. Global teams design leading technology solutions for the delivery, management, conversion and optimization of electrical power for customers across multiple energy-intensive industries. GE has invested in our Energy Connections capabilities, with strategic acquisitions and joint ventures that enable GE to increase its offerings to the utility, industrial, renewable energy, oil and gas, marine, metals and mining industries. Plant automation hardware, software and embedded computing systems including controllers, embedded systems, advanced software, motion control, operator interfaces and industrial computers are also provided by Energy Connections. Lighting includes the GE Lighting and Current, powered by GE (Current) businesses. GE Lighting is focused on driving innovation and growth in light emitting diode (LED) and connected home technology in the U.S. Lighting offers LEDs in a variety of shapes, sizes, wattages and color temperatures. It’s also investing in the growing smart home category, building a suite of connected lighting products with simple connection points that offer new opportunities to do more at home. Current delivers energy efficiency and productivity solutions for commercial and industrial customers. We combine infrastructure technology like LED and solar with new sensor-enabled data networks and Predix-based digital applications to help our customers reduce energy costs, better predict spend and gain business productivity insights. We partner with a wide variety of digital companies to help expand our app catalog, and we offer flexible financing solutions that help our customers achieve faster payback periods and better long-term value. CAPITAL Capital is the financial services division of GE focused on customers and markets aligned with GE’s industrial businesses, whether in developed economies or emerging markets. We provide financial products and services around the globe, that are geared to utilize GE’s industry specific expertise in aviation, energy, infrastructure, and healthcare to capitalize on market-specific opportunities. In addition, we continue to operate our run-off insurance activities as part of our continuing operations. REVENUES
Total revenues(a) Intersegment revenues(b) External revenues (In millions) 2016 2015 2014 2016 2015 2014 2016 2015 2014
Power $ 26,827 $ 21,490 $ 20,580 $ 640 $ 762 $ 778 $ 26,187 $ 20,728 $ 19,802Renewable Energy 9,033 6,273 6,399 11 12 14 9,022 6,261 6,386Oil & Gas 12,898 16,450 19,085 383 387 402 12,515 16,063 18,683Aviation 26,261 24,660 23,990 730 418 692 25,530 24,242 23,298Healthcare 18,291 17,639 18,299 15 7 6 18,276 17,633 18,293Transportation 4,713 5,933 5,650 1 1 (2) 4,713 5,932 5,652Energy Connections & Lighting 15,133 16,351 15,724 1,059 1,021 912 14,074 15,329 14,812 Total industrial 113,156 108,796 109,727 2,839 2,608 2,801 110,316 106,188 106,926Capital 10,905 10,801 11,320 1,288 1,151 1,037 9,617 9,650 10,283Corporate items and eliminations (368) (2,211) (3,863) (4,127) (3,759) (3,838) 3,760 1,548 (25)Total $ 123,693 $ 117,386 $ 117,184 $ - $ - $ - $ 123,693 $ 117,386 $ 117,184
(a) Revenues of GE businesses include income from sales of goods and services to customers and other income. (b) Sales from one component to another generally are priced at equivalent commercial selling prices. Revenues from customers located in the United States were $53,317 million, $53,238 million and $51,147 million in 2016, 2015 and 2014, respectively. Revenues from customers located outside the United States were $70,376 million, $64,148 million and $66,038 million in 2016, 2015 and 2014, respectively.
204 GE 2016 FORM 10-K

FINANCIAL STATEMENTS
GE 2016 FORM 10-K 205
Property, plant and Assets(a) equipment additions(b) Depreciation and amortization At December 31 For the years ended December 31 For the years ended December 31 (In millions) 2016 2015 2014 2016 2015 2014 2016 2015 2014 Power $ 55,474 $ 51,908 $ 26,698 $ 769 $ 2,122 $ 578 $ 1,130 $ 712 $ 563 Renewable Energy 8,794 9,468 3,572 166 999 41 37 116 113 Oil & Gas 24,615 26,126 27,329 284 422 656 529 596 585 Aviation 38,899 34,524 33,716 1,328 1,260 1,197 900 855 824 Healthcare 28,639 28,162 29,227 432 284 405 785 799 843 Transportation 4,288 4,368 4,449 108 202 128 159 179 169 Energy Connections & Lighting 17,858 21,587 15,536 354 1,348 535 441 426 548 Capital(c) 187,804 316,069 502,204 3,769 7,570 3,818 2,515 2,584 2,612 Corporate items and eliminations(d) (1,187) 858 11,201 94 (297) (111) 341 231 164 Total $ 365,183 $ 493,071 $ 653,931 $ 7,305 $ 13,911 $ 7,247 $ 6,836 $ 6,499 $ 6,421 (a) Total assets of Power, Renewable Energy, Oil & Gas, Aviation, Healthcare, Transportation, Energy Connections & Lighting and Capital
operating segments at December 31, 2016, include investments in and advances to associated companies of $405 million, $9 million, $88 million, $1,779 million, $366 million, $6 million, $752 million and $7,673 million, respectively. Investments in and advances to associated companies contributed approximately $(17) million, $(4) million, $4 million, $75 million, $19 million, $46 million and $363 million to segment pre-tax income of Power, Renewable Energy, Oil & Gas, Aviation, Healthcare, Energy Connections & Lighting and Capital operating segments, respectively, and Transportation an insignificant amount, for the year ended December 31, 2016.
(b) Additions to property, plant and equipment include amounts relating to principal businesses purchased. (c) Includes Capital discontinued operations. (d) Includes deferred income taxes that are presented as assets for purposes of our consolidating balance sheet presentation.
Interest and other financial charges Provision (benefit) for income taxes (In millions) 2016 2015 2014 2016 2015 2014 Capital $ 3,790 $ 2,301 $ 1,638 $ (1,431) $ 4,979 $ (861) Corporate items and eliminations(a) 1,234 1,162 1,085 967 1,506 1,634 Total $ 5,025 $ 3,463 $ 2,723 $ (464) $ 6,485 $ 773 (a) Included amounts for Power, Renewable Energy, Oil & Gas, Aviation, Healthcare, Transportation and Energy Connections & Lighting for
which our measure of segment profit excludes interest and other financial charges and income taxes. Property, plant and equipment – net associated with operations based in the United States were $14,987 million, $14,273 million and $9,868 million at December 31, 2016, 2015 and 2014, respectively. Property, plant and equipment – net associated with operations based outside the United States were $35,531 million, $39,822 million and $38,201 million at December 31, 2016, 2015 and 2014, respectively. NOTE 26. CASH FLOWS INFORMATION Changes in operating assets and liabilities are net of acquisitions and dispositions of principal businesses. Amounts reported in the “Proceeds from sales of discontinued operations” and “Proceeds from principal business dispositions” lines in the Statement of Cash Flows are net of cash disposed and include certain deal-related costs. Amounts reported in the “Net cash from (payments for) principal businesses purchased” line are net of cash acquired and include certain deal-related costs and debt assumed and immediately repaid in acquisitions.
CASH FLOWS INFORMATION
GE 2016 FORM 10-K 205

FINANCIAL STATEMENTS CASH FLOWS INFORMATION
206 GE 2016 FORM 10-K
Amounts reported in the “All other operating activities” line in the Statement of Cash Flows consist primarily of adjustments to current and noncurrent accruals, deferrals of costs and expenses and adjustments to assets. Certain supplemental information related to our cash flows is shown below. For the years ended December 31 (In millions) 2016 2015 2014
GE All other operating activities (Gains) losses on purchases and sales of business interests(a) $ (3,701) $ (1,020) $ (188) Contract assets (net)(b) (3,929) (1,919) (1,572) Income taxes(c) (2,752) 1,671 773 Interest charges 275 380 332 Principal pension plans(d) 3,071 4,265 3,368 Other (402) (1,294) 260 $ (7,438) $ 2,083 $ 2,973 Net dispositions (purchases) of GE shares for treasury Open market purchases under share repurchase program(e) $ (22,581) $ (2,709) $ (2,211) Other purchases (399) (58) (49) Dispositions 1,550 1,668 1,042 $ (21,429) $ (1,099) $ (1,218)GE Capital All other operating activities Cash collateral on derivative contracts (428) (1,936) 738 Increase (decrease) in other liabilities (2,616) 4,860 (3,331) Other (10) 2,163 5,073 $ (3,054) $ 5,087 $ 2,480 Net decrease (increase) in GE Capital financing receivables Increase in loans to customers $ (65,055) $ (65,306) $ (64,843) Principal collections from customers - loans 60,375 60,292 60,764 Investment in equipment for financing leases (690) (417) (535) Principal collections from customers - financing leases 856 734 841 Sales of financing receivables 3,235 4,923 3,612 $ (1,279) $ 226 $ (161)All other investing activities Purchases of investment securities $ (18,588) $ (7,790) $ (2,008) Dispositions and maturities of investment securities 7,343 9,587 2,723 Decrease (increase) in other assets - investments 9,202 (1,439) (287) Other(f) 3,682 (5,048) 24,146 $ 1,639 $ (4,690) $ 24,574 Repayments and other reductions (maturities longer than 90 days) Short-term (91 to 365 days) $ (44,519) $ (42,110) $ (36,919) Long-term (longer than one year) (13,418) (2,455) (864) Principal payments - non-recourse, leveraged leases (348) (283) (304) $ (58,285) $ (44,848) $ (38,087)All other financing activities Proceeds from sales of investment contracts $ 19 $ 163 $ 322 Redemption of investment contracts (346) (1,235) (1,113) Other (800) (290) 112 $ (1,127) $ (1,362) $ (679)
(a) Included pre-tax gains on sales of businesses reclassified to Proceeds from principal business dispositions within Cash flows from investing activities of $(3,136) million for Appliances and $(398) million for GE Asset Management in 2016 and $(623) million for Signaling in 2015. See Note 17.
(b) Contract assets are presented net of related billings in excess of revenues on our long-term product service agreements. See Note 9. (c) Reflected the effects of current tax expense (benefit) of $(140) million, $3,307 million and $2,110 million and net cash paid during the year for
income taxes of $(2,612) million, $(1,636) million and $(1,337) million for the years ended December 31, 2016, 2015 and 2014, respectively. Cash flows effects of deferred tax provisions (benefits) are shown separately within cash flows from operating activities. See Note 14.
(d) Reflected the effects of pension costs of $3,623 million, $4,498 million and $3,604 million and employer contributions of $(552) million, $(233) million and $(236) million for the years ended December 31, 2016, 2015 and 2014, respectively. 2016 employer contributions included GE Pension Trust funding of $(330) million representing net sale proceeds associated with the sale of GE Asset Management. See Notes 2 and 12.
(e) Included $(11,370) million paid under ASR agreements in 2016. (f) Other primarily included net activity related to settlements between our continuing operations (primarily our treasury operations) and
businesses in discontinued operations.
206 GE 2016 FORM 10-K

FINANCIAL STATEMENTS COST INFORMATION
GE 2016 FORM 10-K 207
NOTE 27. COST INFORMATION RESEARCH & DEVELOPMENT We conduct research and development (R&D) activities to continually enhance our existing products and services, develop new product and services to meet our customers’ changing needs and requirements, and address new market opportunities. Research and development expenses are classified in cost of goods and services sold in the Statement of Earnings. In addition, research and development funding from customers, principally the U.S. government, is recorded as an offset to such costs. We also enter into research and development arrangements with unrelated investors, which are generally formed through partnerships and consolidated within GE’s financial statements. Research and development funded through consolidated partnerships is classified within net earnings/loss attributable to noncontrolling interests. (In millions) 2016 2015 2014 Total R&D $ 5,466 $ 5,278 $ 5,273 Less customer funded R&D (principally the U.S. Government) (611) (803) (721) Less partner funded R&D (73) (226) (319) GE funded R&D $ 4,782 $ 4,249 $ 4,233 Of total Research and Development, the segments with the most significant expenditures for the years ended December 31, 2016, 2015 and 2014 were: Aviation $1,595 million, $1,893 million and $1,965 million, respectively; Healthcare $938 million, $905 million, and $817 million, respectively; and Power $695 million, $721 million and $641 million, respectively. The remaining segments and Corporate, including Global Research Center, had combined expenditures of $2,238 million, $1,759 million and $1,850 million, for the years ended December 31, 2016, 2015 and 2014, respectively. COLLABORATIVE ARRANGEMENTS Our businesses enter into collaborative arrangements primarily with manufacturers and suppliers of components used to build and maintain certain engines, under which GE and these participants share in the risks and rewards of these product programs. GE’s payments to participants are recorded as cost of services sold ($1,080 million, $788 million and $873 million for the years 2016, 2015 and 2014, respectively) or as cost of goods sold ($2,482 million, $2,736 million and $2,660 million for the years 2016, 2015 and 2014, respectively). RENTAL EXPENSE Rental expense under operating leases is shown below. (In millions) 2016 2015 2014 GE $ 1,528 $ 1,258 $ 1,356 GE Capital 91 107 123 1,619 1,365 1,479 Eliminations (126) (169) (223) Total $ 1,493 $ 1,196 $ 1,256 At December 31, 2016, minimum rental commitments under noncancellable operating leases aggregated $5,172 million and $302 million for GE and GE Capital, respectively. Amounts payable over the next five years follow. (In millions) 2017 2018 2019 2020 2021
GE $ 942 $ 854 $ 742 $ 640 $ 537 GE Capital 27 23 22 21 20 969 877 763 661 557 Eliminations (171) (155) (143) (138) (130) Total $ 798 $ 722 $ 621 $ 524 $ 427
GE 2016 FORM 10-K 207

FINANCIAL STATEMENTS GUARANTOR FINANCIAL INFORMATION
208 GE 2016 FORM 10-K
NOTE 28. GUARANTOR FINANCIAL INFORMATION GUARANTOR AND NON-GUARANTOR CONDENSED CONSOLIDATING FINANCIAL INFORMATION On October 26, 2015, GE Capital International Funding Company Unlimited Company, formerly GE Capital International Funding Company (the Issuer), then a finance subsidiary of General Electric Capital Corporation, settled its previously announced private offers to exchange (the Exchange Offers) the Issuer’s new senior unsecured notes for certain outstanding debt securities of General Electric Capital Corporation. The new notes that were issued were composed of $15.3 billion of 0.964% six month notes due April 2016 (which have subsequently been repaid upon maturity), £0.8 billion of 1.363% six month notes due April 2016 (which have subsequently been repaid upon maturity), $6.1 billion of 2.342% notes due 2020, $2.0 billion of 3.373% notes due 2025 and $11.5 billion of 4.418% notes due 2035. These notes were fully and unconditionally, jointly and severally guaranteed by both the Company and GE Capital International Holdings Limited (GECIHL) (each a Guarantor, and together, the Guarantors). Under the terms of a registration rights agreement entered into in connection with the Exchange Offers, the Issuer and the Company agreed to file a registration statement with the U.S. Securities and Exchange Commission (SEC) for an offer to exchange new senior notes of the Issuer registered with the SEC and guaranteed by the Guarantors for certain of the Issuer’s outstanding unregistered senior notes. This exchange was completed in July 2016. PRESENTATION In connection with the registration of the senior notes, the Company is required to provide certain financial information regarding the Issuer and the Guarantors of the registered securities. Included are the Condensed Consolidating Statements of Earnings and Comprehensive Income for the years ended December 31, 2016, 2015 and 2014, Condensed Consolidating Statements of Financial Position as of December 31, 2016 and December 31, 2015 and Condensed Consolidating Statements of Cash Flows for the years ended December 31, 2016, 2015 and 2014 for:
General Electric Company (the Parent Company Guarantor) - prepared with investments in subsidiaries accounted for under the equity method of accounting and excluding any inter-segment eliminations. The equity basis earnings (losses) of subsidiaries are reflected in the captions “Equity in earnings (losses) of affiliates” and “Earnings (loss) from discontinued operations, net of taxes”;
GE Capital International Funding Company Unlimited Company (the Subsidiary Issuer) – incorporated in May 2015 as a finance subsidiary for debt and reflects activity subsequent to the issuance of new notes on October 26, 2015;
GE Capital International Holdings Limited (GECIHL) (the Subsidiary Guarantor) - prepared with investments in non-guarantor subsidiaries accounted for under the equity method of accounting and reflects activity subsequent to the GE Capital Reorganization on December 3, 2015. The equity basis earnings (losses) of subsidiaries are reflected in the captions “Equity in earnings (losses) of affiliates” and “Earnings (loss) from discontinued operations, net of taxes”;
Non-Guarantor Subsidiaries - prepared on an aggregated basis excluding any elimination or consolidation adjustments and includes predominantly all non-cash adjustments for cash flows;
Consolidating Adjustments - adjusting entries necessary to consolidate the Parent Company Guarantor with the Subsidiary Issuer, the Subsidiary Guarantor and Non-Guarantor Subsidiaries; and
Consolidated - prepared on a consolidated basis.
208 GE 2016 FORM 10-K
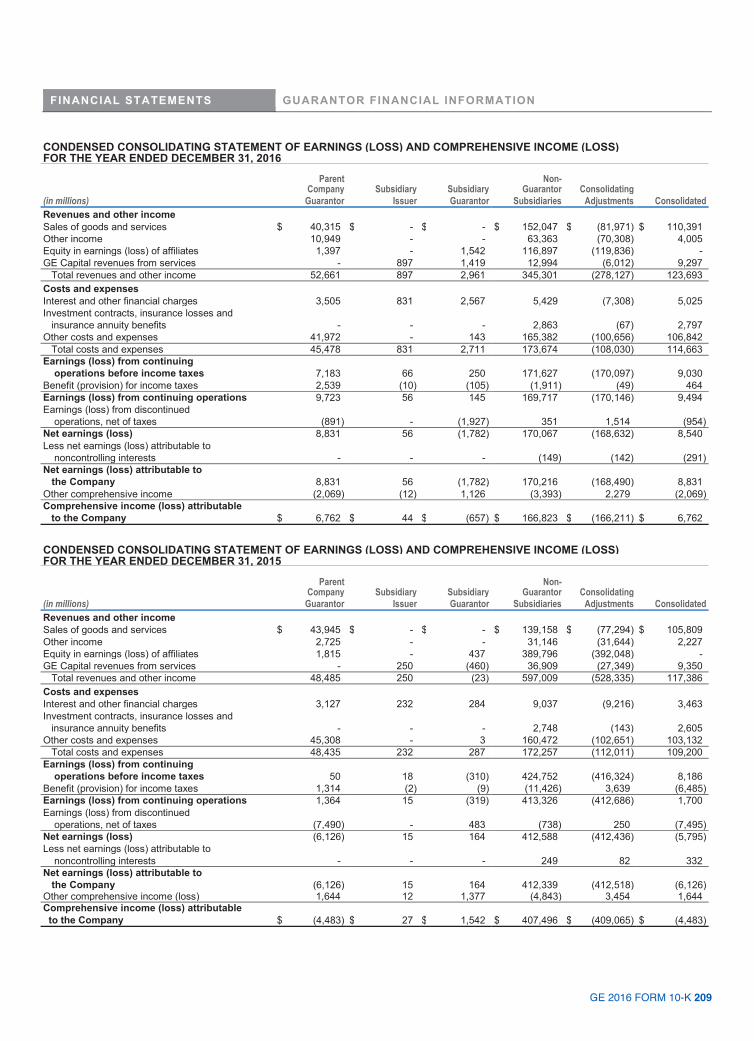
FINANCIAL STATEMENTS GUARANTOR FINANCIAL INFORMATION
GE 2016 FORM 10-K 209
CONDENSED CONSOLIDATING STATEMENT OF EARNINGS (LOSS) AND COMPREHENSIVE INCOME (LOSS) FOR THE YEAR ENDED DECEMBER 31, 2016 Parent Non-
Company Subsidiary Subsidiary Guarantor Consolidating (in millions) Guarantor Issuer Guarantor Subsidiaries Adjustments Consolidated Revenues and other income Sales of goods and services $ 40,315 $ - $ - $ 152,047 $ (81,971) $ 110,391 Other income 10,949 - - 63,363 (70,308) 4,005 Equity in earnings (loss) of affiliates 1,397 - 1,542 116,897 (119,836) - GE Capital revenues from services - 897 1,419 12,994 (6,012) 9,297 Total revenues and other income 52,661 897 2,961 345,301 (278,127) 123,693 Costs and expenses Interest and other financial charges 3,505 831 2,567 5,429 (7,308) 5,025 Investment contracts, insurance losses and insurance annuity benefits - - - 2,863 (67) 2,797 Other costs and expenses 41,972 - 143 165,382 (100,656) 106,842 Total costs and expenses 45,478 831 2,711 173,674 (108,030) 114,663 Earnings (loss) from continuing operations before income taxes 7,183 66 250 171,627 (170,097) 9,030 Benefit (provision) for income taxes 2,539 (10) (105) (1,911) (49) 464 Earnings (loss) from continuing operations 9,723 56 145 169,717 (170,146) 9,494 Earnings (loss) from discontinued operations, net of taxes (891) - (1,927) 351 1,514 (954) Net earnings (loss) 8,831 56 (1,782) 170,067 (168,632) 8,540 Less net earnings (loss) attributable to noncontrolling interests - - - (149) (142) (291) Net earnings (loss) attributable to the Company 8,831 56 (1,782) 170,216 (168,490) 8,831 Other comprehensive income (2,069) (12) 1,126 (3,393) 2,279 (2,069) Comprehensive income (loss) attributable to the Company $ 6,762 $ 44 $ (657) $ 166,823 $ (166,211) $ 6,762
CONDENSED CONSOLIDATING STATEMENT OF EARNINGS (LOSS) AND COMPREHENSIVE INCOME (LOSS) FOR THE YEAR ENDED DECEMBER 31, 2015 Parent Non-
Company Subsidiary Subsidiary Guarantor Consolidating (in millions) Guarantor Issuer Guarantor Subsidiaries Adjustments Consolidated Revenues and other income Sales of goods and services $ 43,945 $ - $ - $ 139,158 $ (77,294) $ 105,809 Other income 2,725 - - 31,146 (31,644) 2,227 Equity in earnings (loss) of affiliates 1,815 - 437 389,796 (392,048) - GE Capital revenues from services - 250 (460) 36,909 (27,349) 9,350 Total revenues and other income 48,485 250 (23) 597,009 (528,335) 117,386 Costs and expenses Interest and other financial charges 3,127 232 284 9,037 (9,216) 3,463 Investment contracts, insurance losses and insurance annuity benefits - - - 2,748 (143) 2,605 Other costs and expenses 45,308 - 3 160,472 (102,651) 103,132 Total costs and expenses 48,435 232 287 172,257 (112,011) 109,200 Earnings (loss) from continuing operations before income taxes 50 18 (310) 424,752 (416,324) 8,186 Benefit (provision) for income taxes 1,314 (2) (9) (11,426) 3,639 (6,485) Earnings (loss) from continuing operations 1,364 15 (319) 413,326 (412,686) 1,700 Earnings (loss) from discontinued operations, net of taxes (7,490) - 483 (738) 250 (7,495) Net earnings (loss) (6,126) 15 164 412,588 (412,436) (5,795) Less net earnings (loss) attributable to noncontrolling interests - - - 249 82 332 Net earnings (loss) attributable to the Company (6,126) 15 164 412,339 (412,518) (6,126) Other comprehensive income (loss) 1,644 12 1,377 (4,843) 3,454 1,644 Comprehensive income (loss) attributable to the Company $ (4,483) $ 27 $ 1,542 $ 407,496 $ (409,065) $ (4,483)
GE 2016 FORM 10-K 209
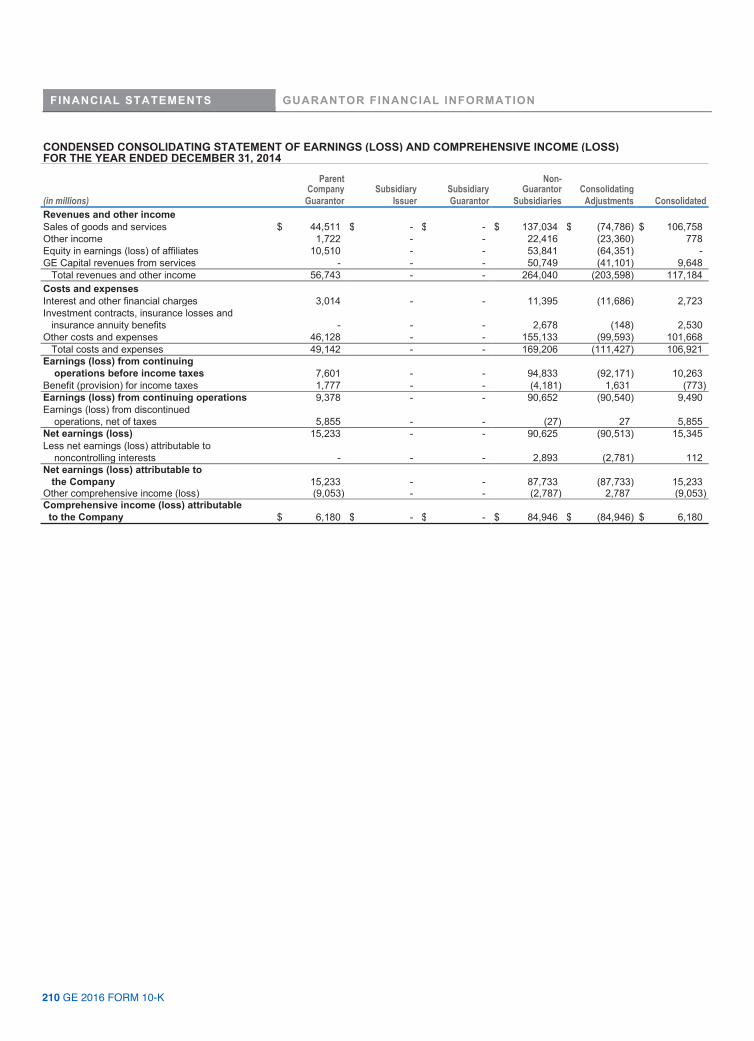
FINANCIAL STATEMENTS GUARANTOR FINANCIAL INFORMATION
210 GE 2016 FORM 10-K
CONDENSED CONSOLIDATING STATEMENT OF EARNINGS (LOSS) AND COMPREHENSIVE INCOME (LOSS) FOR THE YEAR ENDED DECEMBER 31, 2014 Parent Non-
Company Subsidiary Subsidiary Guarantor Consolidating (in millions) Guarantor Issuer Guarantor Subsidiaries Adjustments Consolidated Revenues and other income Sales of goods and services $ 44,511 $ - $ - $ 137,034 $ (74,786) $ 106,758 Other income 1,722 - - 22,416 (23,360) 778 Equity in earnings (loss) of affiliates 10,510 - - 53,841 (64,351) - GE Capital revenues from services - - - 50,749 (41,101) 9,648 Total revenues and other income 56,743 - - 264,040 (203,598) 117,184 Costs and expenses Interest and other financial charges 3,014 - - 11,395 (11,686) 2,723 Investment contracts, insurance losses and insurance annuity benefits - - - 2,678 (148) 2,530 Other costs and expenses 46,128 - - 155,133 (99,593) 101,668 Total costs and expenses 49,142 - - 169,206 (111,427) 106,921 Earnings (loss) from continuing operations before income taxes 7,601 - - 94,833 (92,171) 10,263 Benefit (provision) for income taxes 1,777 - - (4,181) 1,631 (773) Earnings (loss) from continuing operations 9,378 - - 90,652 (90,540) 9,490 Earnings (loss) from discontinued operations, net of taxes 5,855 - - (27) 27 5,855 Net earnings (loss) 15,233 - - 90,625 (90,513) 15,345 Less net earnings (loss) attributable to noncontrolling interests - - - 2,893 (2,781) 112 Net earnings (loss) attributable to the Company 15,233 - - 87,733 (87,733) 15,233 Other comprehensive income (loss) (9,053) - - (2,787) 2,787 (9,053) Comprehensive income (loss) attributable to the Company $ 6,180 $ - $ - $ 84,946 $ (84,946) $ 6,180
210 GE 2016 FORM 10-K

FINANCIAL STATEMENTS GUARANTOR FINANCIAL INFORMATION
GE 2016 FORM 10-K 211
CONDENSED CONSOLIDATING STATEMENT OF FINANCIAL POSITION DECEMBER 31, 2016
Parent Non- Company Subsidiary Subsidiary Guarantor Consolidating
(In millions) Guarantor Issuer Guarantor Subsidiaries Adjustments Consolidated Assets Cash and equivalents $ 2,558 $ - $ 3 $ 46,994 $ (1,426)$ 48,129 Investment securities 1 - - 47,394 (3,082) 44,313 Receivables - net 63,620 17,157 30,470 79,401 (148,385) 42,263 Inventories 4,654 - - 21,076 (3,377) 22,354 Property, plant and equipment - net 5,768 - - 46,366 (1,615) 50,518 Investment in subsidiaries(a) 272,685 - 80,481 492,674 (845,840) - Goodwill and intangible assets 8,128 - - 42,074 36,673 86,875 All other assets 14,692 44 39 201,276 (160,134) 55,917 Assets of discontinued operations - - - - 14,815 14,815 Total assets $ 372,107 $ 17,202 $ 110,992 $ 977,255 $ (1,112,372)$ 365,183 Liabilities and equity Short-term borrowings $ 167,089 $ 1 $ 46,432 $ 25,919 $ (208,727)$ 30,714 Accounts payable 5,412 - - 47,366 (38,343) 14,435 Other current liabilities 11,072 33 117 25,095 114 36,431 Long-term and non-recourse borrowings 68,983 16,486 34,389 68,912 (83,273) 105,496 All other liabilities 43,722 511 481 58,376 (9,656) 93,434 Liabilities of discontinued operations - - - - 4,158 4,158 Total Liabilities 296,279 17,030 81,419 225,667 (335,727) 284,668
Redeemable noncontrolling interests - - - 2,223 802 3,025
GE shareowners' equity 75,828 171 29,573 747,719 (777,463) 75,828 Noncontrolling interests - - - 1,647 16 1,663 Total equity 75,828 171 29,573 749,366 (777,447) 77,491 Total liabilities, redeemable noncontrolling interests and equity $ 372,107 $ 17,202 $ 110,992 $ 977,255 $ (1,112,372)$ 365,183
(a) Included within the subsidiaries of the Subsidiary Guarantor are cash and cash equivalent balances of $28.5 billion and net assets of discontinued operations of $6.0 billion.
GE 2016 FORM 10-K 211
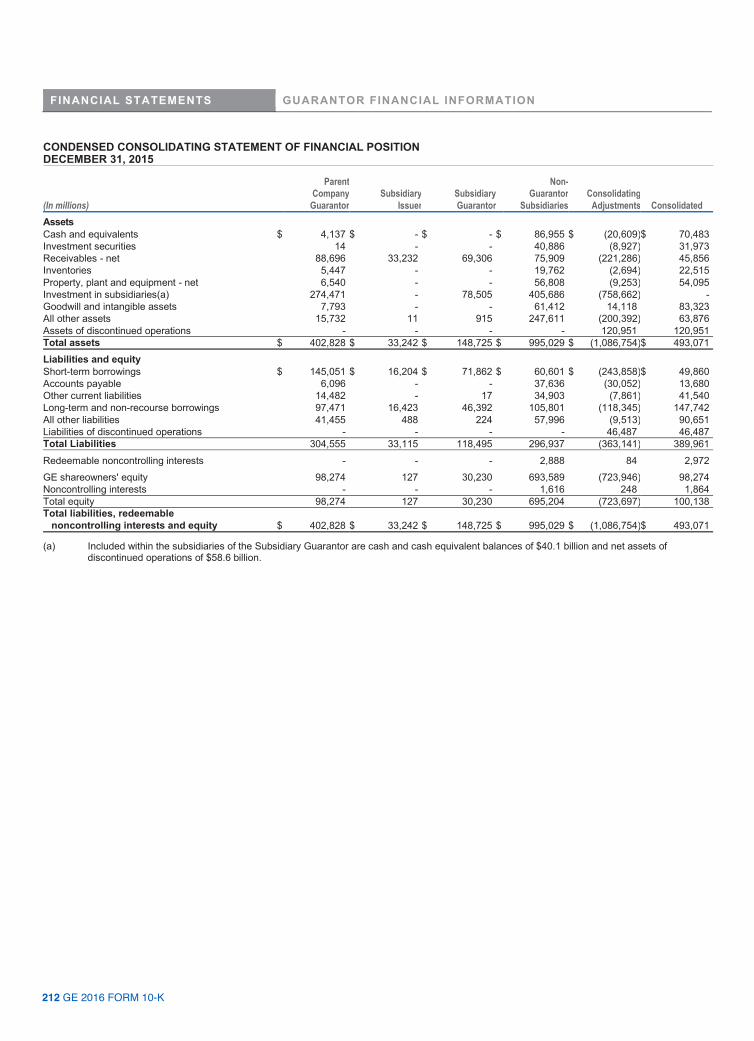
FINANCIAL STATEMENTS GUARANTOR FINANCIAL INFORMATION
212 GE 2016 FORM 10-K
CONDENSED CONSOLIDATING STATEMENT OF FINANCIAL POSITION DECEMBER 31, 2015
Parent Non- Company Subsidiary Subsidiary Guarantor Consolidating
(In millions) Guarantor Issuer Guarantor Subsidiaries Adjustments Consolidated Assets Cash and equivalents $ 4,137 $ - $ - $ 86,955 $ (20,609)$ 70,483 Investment securities 14 - - 40,886 (8,927) 31,973 Receivables - net 88,696 33,232 69,306 75,909 (221,286) 45,856 Inventories 5,447 - - 19,762 (2,694) 22,515 Property, plant and equipment - net 6,540 - - 56,808 (9,253) 54,095 Investment in subsidiaries(a) 274,471 - 78,505 405,686 (758,662) - Goodwill and intangible assets 7,793 - - 61,412 14,118 83,323 All other assets 15,732 11 915 247,611 (200,392) 63,876 Assets of discontinued operations - - - - 120,951 120,951 Total assets $ 402,828 $ 33,242 $ 148,725 $ 995,029 $ (1,086,754)$ 493,071 Liabilities and equity Short-term borrowings $ 145,051 $ 16,204 $ 71,862 $ 60,601 $ (243,858)$ 49,860 Accounts payable 6,096 - - 37,636 (30,052) 13,680 Other current liabilities 14,482 - 17 34,903 (7,861) 41,540 Long-term and non-recourse borrowings 97,471 16,423 46,392 105,801 (118,345) 147,742 All other liabilities 41,455 488 224 57,996 (9,513) 90,651 Liabilities of discontinued operations - - - - 46,487 46,487 Total Liabilities 304,555 33,115 118,495 296,937 (363,141) 389,961
Redeemable noncontrolling interests - - - 2,888 84 2,972
GE shareowners' equity 98,274 127 30,230 693,589 (723,946) 98,274 Noncontrolling interests - - - 1,616 248 1,864 Total equity 98,274 127 30,230 695,204 (723,697) 100,138 Total liabilities, redeemable noncontrolling interests and equity $ 402,828 $ 33,242 $ 148,725 $ 995,029 $ (1,086,754)$ 493,071
(a) Included within the subsidiaries of the Subsidiary Guarantor are cash and cash equivalent balances of $40.1 billion and net assets of discontinued operations of $58.6 billion.
212 GE 2016 FORM 10-K
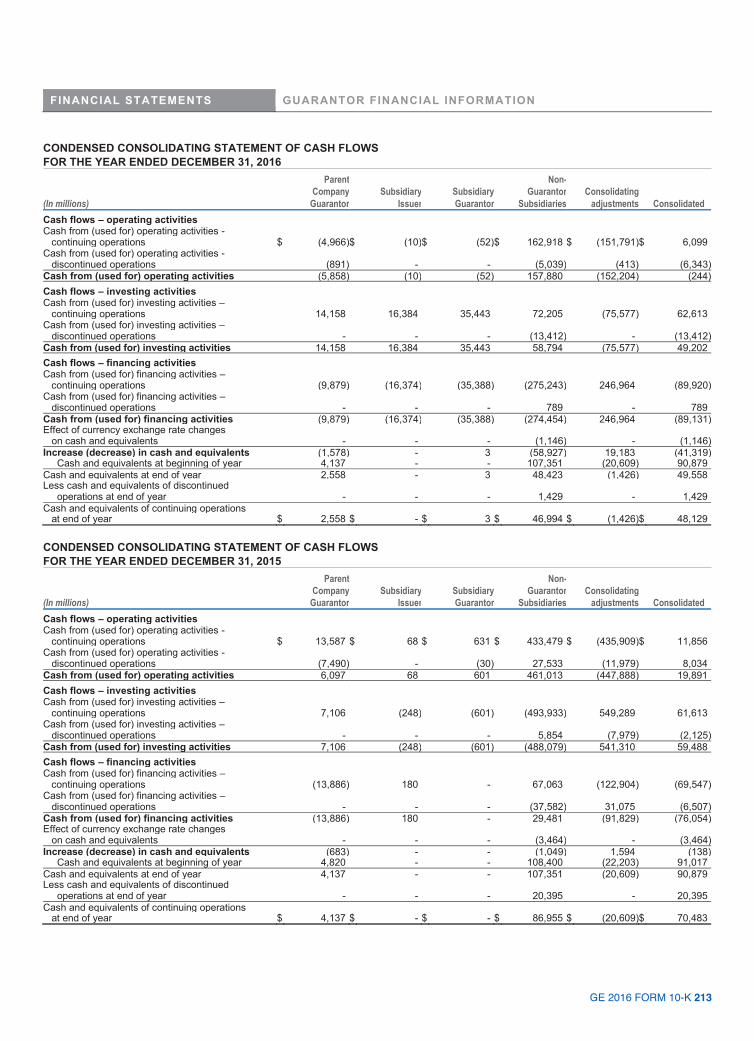
FINANCIAL STATEMENTS GUARANTOR FINANCIAL INFORMATION
GE 2016 FORM 10-K 213
CONDENSED CONSOLIDATING STATEMENT OF CASH FLOWS FOR THE YEAR ENDED DECEMBER 31, 2016
Parent Non- Company Subsidiary Subsidiary Guarantor Consolidating (In millions) Guarantor Issuer Guarantor Subsidiaries adjustments Consolidated Cash flows – operating activities Cash from (used for) operating activities - continuing operations $ (4,966) $ (10)$ (52) $ 162,918 $ (151,791) $ 6,099 Cash from (used for) operating activities - discontinued operations (891) - - (5,039) (413) (6,343)Cash from (used for) operating activities (5,858) (10) (52) 157,880 (152,204) (244)Cash flows – investing activities Cash from (used for) investing activities – continuing operations 14,158 16,384 35,443 72,205 (75,577) 62,613 Cash from (used for) investing activities – discontinued operations - - - (13,412) - (13,412)Cash from (used for) investing activities 14,158 16,384 35,443 58,794 (75,577) 49,202 Cash flows – financing activities Cash from (used for) financing activities – continuing operations (9,879) (16,374) (35,388) (275,243) 246,964 (89,920)Cash from (used for) financing activities – discontinued operations - - - 789 - 789 Cash from (used for) financing activities (9,879) (16,374) (35,388) (274,454) 246,964 (89,131)Effect of currency exchange rate changes on cash and equivalents - - - (1,146) - (1,146)Increase (decrease) in cash and equivalents (1,578) - 3 (58,927) 19,183 (41,319) Cash and equivalents at beginning of year 4,137 - - 107,351 (20,609) 90,879 Cash and equivalents at end of year 2,558 - 3 48,423 (1,426) 49,558 Less cash and equivalents of discontinued operations at end of year - - - 1,429 - 1,429 Cash and equivalents of continuing operations at end of year $ 2,558 $ - $ 3 $ 46,994 $ (1,426) $ 48,129 CONDENSED CONSOLIDATING STATEMENT OF CASH FLOWS FOR THE YEAR ENDED DECEMBER 31, 2015
Parent Non- Company Subsidiary Subsidiary Guarantor Consolidating (In millions) Guarantor Issuer Guarantor Subsidiaries adjustments Consolidated Cash flows – operating activities Cash from (used for) operating activities - continuing operations $ 13,587 $ 68 $ 631 $ 433,479 $ (435,909) $ 11,856 Cash from (used for) operating activities - discontinued operations (7,490) - (30) 27,533 (11,979) 8,034 Cash from (used for) operating activities 6,097 68 601 461,013 (447,888) 19,891 Cash flows – investing activities Cash from (used for) investing activities – continuing operations 7,106 (248) (601) (493,933) 549,289 61,613 Cash from (used for) investing activities – discontinued operations - - - 5,854 (7,979) (2,125)Cash from (used for) investing activities 7,106 (248) (601) (488,079) 541,310 59,488 Cash flows – financing activities Cash from (used for) financing activities – continuing operations (13,886) 180 - 67,063 (122,904) (69,547)Cash from (used for) financing activities – discontinued operations - - - (37,582) 31,075 (6,507)Cash from (used for) financing activities (13,886) 180 - 29,481 (91,829) (76,054)Effect of currency exchange rate changes on cash and equivalents - - - (3,464) - (3,464)Increase (decrease) in cash and equivalents (683) - - (1,049) 1,594 (138) Cash and equivalents at beginning of year 4,820 - - 108,400 (22,203) 91,017 Cash and equivalents at end of year 4,137 - - 107,351 (20,609) 90,879 Less cash and equivalents of discontinued operations at end of year - - - 20,395 - 20,395 Cash and equivalents of continuing operations at end of year $ 4,137 $ - $ - $ 86,955 $ (20,609) $ 70,483
GE 2016 FORM 10-K 213
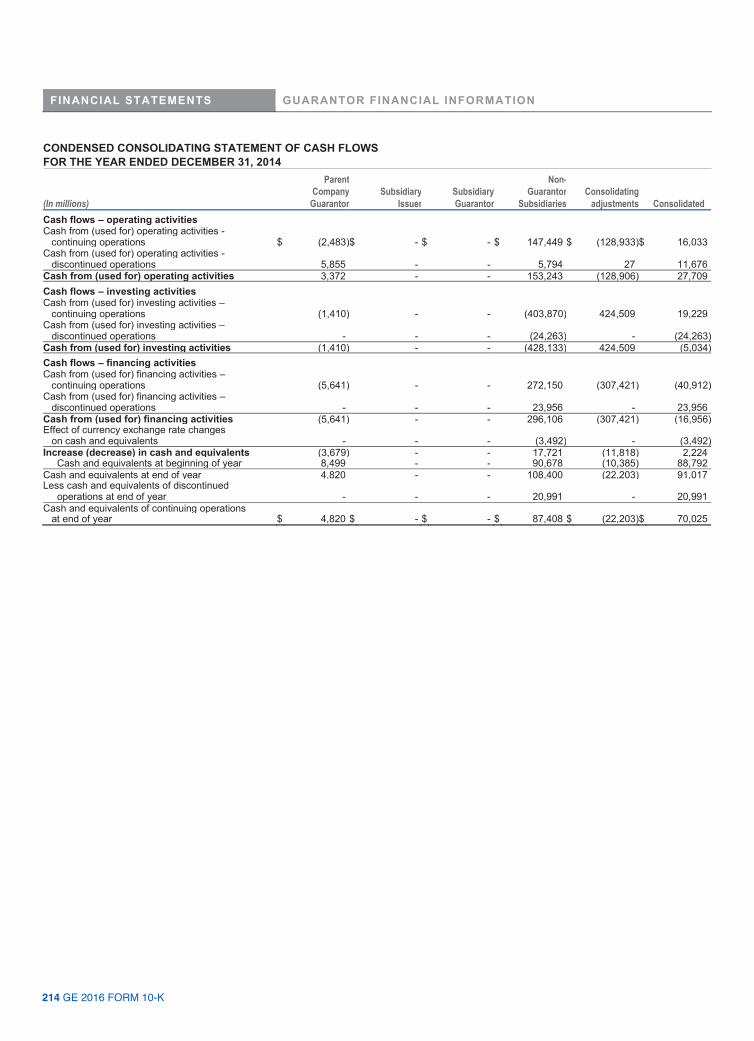
FINANCIAL STATEMENTS GUARANTOR FINANCIAL INFORMATION
214 GE 2016 FORM 10-K
CONDENSED CONSOLIDATING STATEMENT OF CASH FLOWS FOR THE YEAR ENDED DECEMBER 31, 2014
Parent Non- Company Subsidiary Subsidiary Guarantor Consolidating (In millions) Guarantor Issuer Guarantor Subsidiaries adjustments Consolidated Cash flows – operating activities Cash from (used for) operating activities - continuing operations $ (2,483) $ - $ - $ 147,449 $ (128,933) $ 16,033 Cash from (used for) operating activities - discontinued operations 5,855 - - 5,794 27 11,676 Cash from (used for) operating activities 3,372 - - 153,243 (128,906) 27,709 Cash flows – investing activities Cash from (used for) investing activities – continuing operations (1,410) - - (403,870) 424,509 19,229 Cash from (used for) investing activities – discontinued operations - - - (24,263) - (24,263)Cash from (used for) investing activities (1,410) - - (428,133) 424,509 (5,034)Cash flows – financing activities Cash from (used for) financing activities – continuing operations (5,641) - - 272,150 (307,421) (40,912)Cash from (used for) financing activities – discontinued operations - - - 23,956 - 23,956 Cash from (used for) financing activities (5,641) - - 296,106 (307,421) (16,956)Effect of currency exchange rate changes on cash and equivalents - - - (3,492) - (3,492)Increase (decrease) in cash and equivalents (3,679) - - 17,721 (11,818) 2,224 Cash and equivalents at beginning of year 8,499 - - 90,678 (10,385) 88,792 Cash and equivalents at end of year 4,820 - - 108,400 (22,203) 91,017 Less cash and equivalents of discontinued operations at end of year - - - 20,991 - 20,991 Cash and equivalents of continuing operations at end of year $ 4,820 $ - $ - $ 87,408 $ (22,203) $ 70,025
214 GE 2016 FORM 10-K

FINANCIAL STATEMENTS SUPPLEMENTAL INFORMATION
GE 2016 FORM 10-K 215
NOTE 29. SUPPLEMENTAL INFORMATION POSTRETIREMENT BENEFIT PLANS As discussed in Note 12, we sponsor a number of pension plans which consist of the two principal pension plans for certain U.S. employees as well as other affiliate pension plans. In addition, we sponsor a number of postretirement health and life insurance benefit plans (retiree benefit plans). The accounting requirements and concepts discussed in Note 12 Postretirement Benefit Plans are the same for other pension plans and principal retiree benefit plans and are consistently applied. The following disclosures provide additional information with respect to our pension plans and principal retiree benefit plans. Other pension plans in 2016 included 49 U.S. and non-U.S. pension plans with pension assets or obligations greater than $50 million. Principal Retiree Benefit Plans provide health and life insurance benefits to eligible participants and these participants share in the cost of healthcare benefits. COST OF BENEFIT PLANS
Other pension plans Principal retiree benefit plans (In millions) 2016 2015 2014 2016 2015 2014
Service cost for benefits earned $ 462 $ 416 $ 403 $ 123 $ 145 $ 164 Prior service cost (credit) amortization 1 - 6 (164) (8) 353 Expected return on plan assets (1,034) (881) (789) (43) (48) (50) Interest cost on benefit obligations 670 555 587 249 335 424 Net actuarial loss (gain) amortization 256 289 205 (50) (25) (150) Curtailment loss (gain) 19 (6) - - (225) (a) 48 Benefit plans cost $ 374 $ 373 $ 412 $ 115 $ 174 $ 789
(a) Gain principally resulting from life insurance amendment. ASSUMPTIONS USED IN BENEFIT CALCULATIONS The accounting assumptions in the table below are those that are significant to the measurement of our benefit obligations. ASSUMPTIONS USED TO MEASURE BENEFIT OBLIGATIONS
Other pension plans (weighted average) Principal retiree benefit plans December 31 2016 2015 2014 2016 2015 2014
Discount rate 2.58 % 3.33 % 3.53 % 3.75 % 3.93 % 3.89 % Compensation increases 3.48 3.32 3.60 3.80 3.80 4.10 Initial healthcare trend rate N/A N/A N/A 6.00 (a) 6.00 6.00 (a) For 2016, ultimately declining to 5% for 2030 and thereafter. The healthcare trend assumptions for 2015 and 2016 apply to our pre-65 retiree medical plans. Our post-65 retiree plan has a fixed subsidy and therefore is not subject to healthcare inflation. The discount rate used to measure the benefit obligation at the end of the year is also used to measure benefit cost in the following year. The assumptions used to measure benefit cost follow.
GE 2016 FORM 10-K 215

FINANCIAL STATEMENTS SUPPLEMENTAL INFORMATION
216 GE 2016 FORM 10-K
ASSUMPTIONS USED TO MEASURE BENEFIT COST
Other pension plans (weighted average) Principal retiree benefit plans December 31 2016 2015 2014 2016 2015 2014
Discount rate 3.33 % 3.53% 4.39 % 3.93% (a) 3.89 % (a) 4.61% (a) Expected return on assets 6.36 6.95 6.92 7.00 7.00 7.00
(a) Weighted average discount rates of 3.86%, 3.92% and 4.47% were used for determination of costs in 2016, 2015 and 2014, respectively. BENEFIT OBLIGATIONS
Other pension plans Principal retiree benefit plans (In millions) 2016 2015 2016 2015 Balance at January 1 $ 21,618 $ 15,589 $ 6,757 $ 10,703 Service cost for benefits earned 462 416 123 145 Interest cost on benefit obligations 670 555 249 335 Participant contributions 43 15 51 50 Plan amendments (54) (12) (7) (3,291) (a) Actuarial loss (gain) 2,993 (b) (406) (b) (291) (c) (444) (b) Benefits paid (842) (576) (603) (691) Acquisitions (dispositions)/ other - net (98) 6,859 (d) 10 (50) Exchange rate adjustments (2,249) (822) - - Balance at December 31(e) $ 22,543 $ 21,618 $ 6,289 $ 6,757 (a) Principally related to plan amendments affecting post-65 retiree health and retiree life insurance for certain production participants. (b) Primarily associated with discount rate changes. (c) Primarily associated with lower costs from new healthcare supplier contracts. (d) Substantially all related to Alstom acquisition. (e) The benefit obligation for retiree health plans was $4,366 million and $4,838 million at December 31, 2016 and 2015, respectively.
THE COMPOSITION OF OUR PLAN ASSETS The fair value of other pension plans' and principal retiree benefit plans’ investments is presented below. The inputs and valuation techniques used to measure the fair value of the assets are consistently applied and described in Note 1. Other pension plans Principal retiree benefit plans December 31 (in millions) 2016 2015 2016 2015
Equity securities U.S. equity securities $ 666 $ 667 $ 187 $ 203 Non-U.S. equity securities 6,337 6,323 152 162 Debt securities Fixed income and cash investment funds 6,049 6,258 30 84 U.S. corporate 319 242 38 52 Other debt securities 577 551 82 93 Private equities 627 703 61 75 Real estate 1,449 1,358 4 6 Other investments 1,067 1,266 21 20 Total plan assets $ 17,091 $ 17,368 $ 575 $ 695 Other Pension Plans assets valued using NAV for practical expedient amounted to $4,669 million and $4,213 million as of December 31, 2016 and 2015, respectively. The percentages of other pension plans assets valued using NAV by investment fund type for equity securities, fixed income and cash, and alternative investments were 7%, 4% and 16% as of December 31, 2016, respectively, and 6%, 3% and 15% as of December 31, 2015, respectively. The practical expedient was not applied for investments with a fair value of $135 million and $169 million in 2016 and 2015, respectively and those investments were classified within Level 3. The remaining investments were substantially all considered Level 1 and 2.
216 GE 2016 FORM 10-K

FINANCIAL STATEMENTS SUPPLEMENTAL INFORMATION
GE 2016 FORM 10-K 217
Principal retiree benefit plan assets valued using NAV for practical expedient amounted to $133 million and $160 million as of December 31, 2016 and 2015. There were no Level 3 investments held in 2016 and 2015. The remaining investments were considered Level 1 or Level 2. FAIR VALUE OF PLAN ASSETS
Other pension plans Principal retiree benefit plans (In millions) 2016 2015 2016 2015 Balance at January 1 $ 17,368 $ 12,386 $ 695 $ 813 Actual gain on plan assets 1,743 381 22 22 Employer contributions 795 549 410 501 Participant contributions 43 15 51 50 Benefits paid (842) (576) (603) (691)Acquisitions (dispositions) / other - net (81) 5,207 (a) - - Exchange rate adjustments (1,935) (594) - - Balance at December 31 $ 17,091 $ 17,368 $ 575 $ 695 (a) Substantially all related to Alstom acquisition. ASSET ALLOCATION
Other pension plans Principal retiree Principal pension plans (weighted average) benefit plans
2016 2016 2016 2016 2016 2016 Target Actual Target Actual Target Actual December 31 allocation allocation allocation allocation allocation allocation Equity securities 18 - 58 % 46 % 39 % 41 % 35 - 75 % 59 % Debt securities (including cash equivalents) 11 - 61 33 30 41 11 - 46 26 Private equities 6 - 16 10 3 4 0 - 25 11 Real estate 3 - 13 7 9 8 0 - 12 1 Other investments 3 - 13 4 19 6 0 - 10 3 Plan fiduciaries of the GE Pension Plan set investment policies and strategies for the GE Pension Trust and oversee its investment allocation, which includes selecting investment managers and setting long-term strategic targets. The primary strategic investment objectives are balancing investment risk and return and monitoring the plan’s liquidity position in order to meet the near-term benefit payment and other cash needs. Target allocation percentages are established at an asset class level by plan fiduciaries. Target allocation ranges are guidelines, not limitations, and occasionally plan fiduciaries will approve allocations above or below a target range. According to statute, the aggregate holdings of all qualifying employer securities (e.g., GE common stock) and qualifying employer real property may not exceed 10% of the fair value of trust assets at the time of purchase. GE securities represented 2.1% and 3.7% of the GE Pension Trust assets at year end 2016 and 2015, respectively. The GE Pension Plan has a broadly diversified portfolio of investments in equities, fixed income, private equities, real estate and hedge funds; these investments are both U.S. and non-U.S. in nature. As of December 31, 2016, no sector concentration of assets exceeded 15% of total GE Pension Plan assets. ESTIMATED FUTURE BENEFIT PAYMENTS 2022 - (In millions) 2017 2018 2019 2020 2021 2026
Principal pension plans $ 3,450 $ 3,595 $ 3,695 $ 3,790 $ 3,865 $ 20,455 Other pension plans 785 795 805 815 830 4,400 Principal retiree benefit plans 600 580 560 535 520 2,245
GE 2016 FORM 10-K 217

FINANCIAL STATEMENTS SUPPLEMENTAL INFORMATION
218 GE 2016 FORM 10-K
2016 COST OF POSTRETIREMENT BENEFIT PLANS AND CHANGES IN OTHER COMPREHENSIVE INCOME Principal Total Principal Other retiree postretirement pension pension benefit (In millions) benefit plans plans plans plans
Cost of postretirement benefit plans $ 4,112 $ 3,623 $ 374 $ 115 Changes in other comprehensive income Prior service cost (credit) – current year (61) - (54) (7) Net actuarial loss (gain) – current year 4,038 2,317 1,989 (268) Net curtailment/gain (loss) (50) (31) (19) - Prior service credit (cost) amortization (140) (303) (1) 164 Net actuarial gain (loss) amortization (2,655) (2,449) (256) 50 Total changes in other comprehensive income 1,132 (466) 1,659 (61) Cost of postretirement benefit plans and changes in other comprehensive income $ 5,244 $ 3,157 $ 2,033 $ 54 DERIVATIVES AND HEDGING See Note 20 for the primary information related to our derivatives and hedging activity. This section provides certain supplemental information about this topic. Changes in the fair value of derivatives are recorded in a separate component of equity (referred to below as Accumulated Other Comprehensive Income, or AOCI) and are recorded in earnings in the period in which the hedged transaction occurs. The table below summarizes this activity by hedging instrument.
218 GE 2016 FORM 10-K

FINANCIAL STATEMENTS SUPPLEMENTAL INFORMATION
GE 2016 FORM 10-K 219
FAIR VALUE OF DERIVATIVES
2016 2015 December 31 (in millions) Assets Liabilities Assets Liabilities
Derivatives accounted for as hedges Interest rate contracts $ 3,106 $ 210 $ 4,132 $ 158 Currency exchange contracts 402 624 1,109 1,383 Other contracts - - - - 3,508 834 5,241 1,541
Derivatives not accounted for as hedges Interest rate contracts 62 20 119 44 Currency exchange contracts 1,778 4,011 1,715 4,048 Other contracts 119 17 315 49 1,958 4,048 2,149 4,141
Gross derivatives recognized in statement of financial position Gross derivatives 5,467 4,883 7,391 5,681 Gross accrued interest 768 (24) 1,001 (13) 6,234 4,859 8,392 5,668
Amounts offset in statement of financial position Netting adjustments(a) (3,097) (3,094) (4,326) (4,326) Cash collateral(b) (2,025) (1,355) (1,784) (642) (5,121) (4,449) (6,110) (4,968)
Net derivatives recognized in statement of financial position Net derivatives 1,113 410 2,282 700
Amounts not offset in statement of financial position Securities held as collateral(c) (442) - (1,277) -
Net amount $ 671 $ 410 $ 1,005 $ 700
Derivatives are classified in the captions “All other assets” and “All other liabilities” and the related accrued interest is classified in “Other GE Capital receivables” and “All other liabilities” in our Statement of Financial Position.
(a) The netting of derivative receivables and payables is permitted when a legally enforceable master netting agreement exists. Amounts include fair value adjustments related to our own and counterparty non-performance risk. At December 31, 2016 and December 31, 2015, the cumulative adjustment for non-performance risk was $(3) million and insignificant, respectively.
(b) Excluded excess cash collateral received and posted of $6 million and $177 million at December 31, 2016, respectively, and $48 million and $379 million at December 31, 2015, respectively.
(c) Excluded excess securities collateral received of zero and $107 million at December 31, 2016 and December 31, 2015, respectively.
CASH FLOW HEDGE ACTIVITY Gain (loss) reclassified Gain (loss) recognized in AOCI from AOCI into earnings (In millions) 2016 2015 2016 2015Interest rate contracts $ 6 $ (1) $ (79) $ (130)Currency exchange contracts (281) (907) (282) (784)Commodity contracts - (5) (2) (4)Total(a) $ (274) $ (913) $ (364) $ (918)
(a) Gain (loss) is recorded in “GE Capital revenues from services”, “Interest and other financial charges”, and “Other costs and expenses” in our Statement of Earnings when reclassified.
The total pre-tax amount in AOCI related to cash flow hedges of forecasted transactions was a $40 million gain at December 31, 2016. We expect to transfer $83 million loss to earnings as an expense in the next 12 months contemporaneously with the earnings effects of the related forecasted transactions. In both the twelve months ended 2016 and 2015, we recognized insignificant gains and losses related to hedged forecasted transactions and firm commitments that did not occur by the end of the originally specified period. At December 31, 2016 and 2015, the maximum term of derivative instruments that hedge forecasted transactions was 16 years and 17 years, respectively. See Note 15 for additional information about reclassifications out of AOCI.
GE 2016 FORM 10-K 219

FINANCIAL STATEMENTS SUPPLEMENTAL INFORMATION
220 GE 2016 FORM 10-K
For cash flow hedges, the amount of ineffectiveness in the hedging relationship and amount of the changes in fair value of the derivatives that are not included in the measurement of ineffectiveness were insignificant for each reporting period. COUNTERPARTY CREDIT RISK Fair values of our derivatives can change significantly from period to period based on, among other factors, market movements and changes in our positions. We manage counterparty credit risk (the risk that counterparties will default and not make payments to us according to the terms of our agreements) on an individual counterparty basis. Where we have agreed to netting of derivative exposures with a counterparty, we net our exposures with that counterparty and apply the value of collateral posted to us to determine the exposure. We actively monitor these net exposures against defined limits and take appropriate actions in response, including requiring additional collateral. As discussed above, we have provisions in certain of our master agreements that require counterparties to post collateral (typically, cash or U.S. Treasury securities) when our receivables due from the counterparties, measured at current market value, exceeds specified limits. The fair value of such collateral was $2,466 million at December 31, 2016, of which $2,025 million was cash and $442 million was in the form of securities held by a custodian for our benefit. Under certain of these same agreements, we post collateral to our counterparties for our derivative obligations, the fair value of which was $1,355 million at December 31, 2016. At December 31, 2016, our exposure to counterparties (including accrued interest), net of collateral we hold, was $496 million. This excludes exposures related to embedded derivatives. Additionally, our master agreements typically contain mutual downgrade provisions that provide the ability of each party to require termination if the long-term credit rating of the counterparty were to fall below A-/A3 or other ratings levels agreed upon with the counterparty. In certain of these master agreements, each party also has the ability to require termination if the short-term rating of the counterparty were to fall below A-1/P-1. Our master agreements also typically contain provisions that provide termination rights upon the occurrence of certain other events, such as a bankruptcy or events of default by one of the parties. If an agreement was terminated under any of these circumstances, the termination amount payable would be determined on a net basis and could also take into account any collateral posted. The net amount of our derivative liability, after consideration of collateral posted by us and outstanding interest payments was $385 million at December 31, 2016. This excludes exposure related to embedded derivatives.
220 GE 2016 FORM 10-K
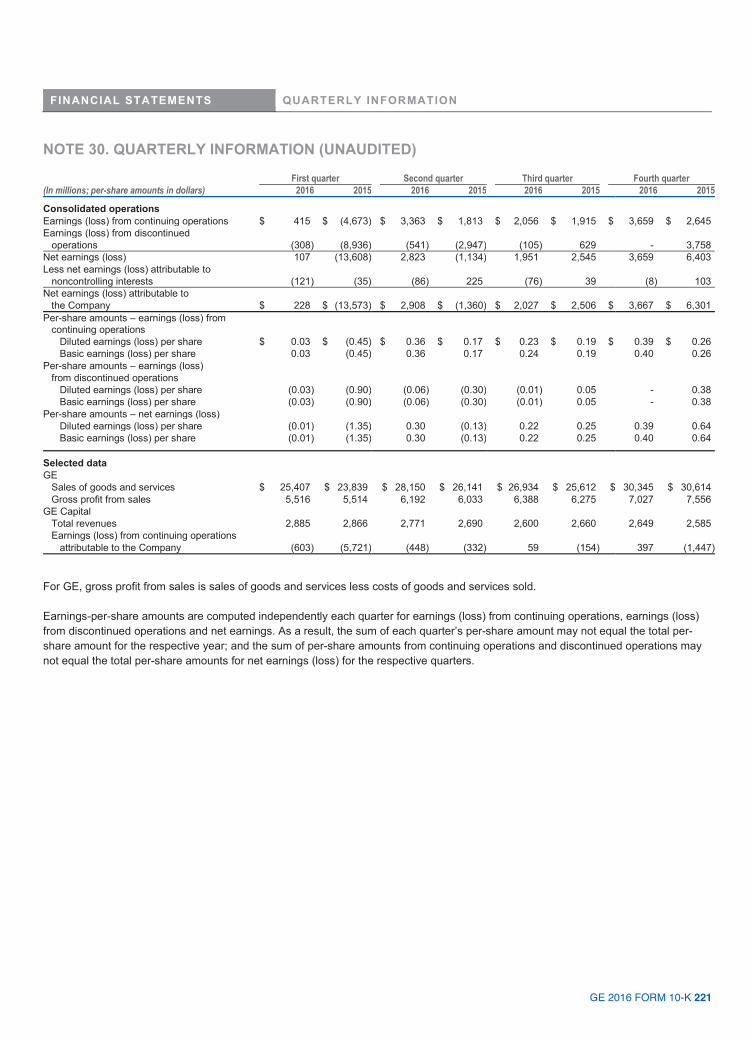
FINANCIAL STATEMENTS QUARTERLY INFORMATION
GE 2016 FORM 10-K 221
NOTE 30. QUARTERLY INFORMATION (UNAUDITED) First quarter Second quarter Third quarter Fourth quarter (In millions; per-share amounts in dollars) 2016 2015 2016 2015 2016 2015 2016 2015
Consolidated operations Earnings (loss) from continuing operations $ 415 $ (4,673) $ 3,363 $ 1,813 $ 2,056 $ 1,915 $ 3,659 $ 2,645 Earnings (loss) from discontinued operations (308) (8,936) (541) (2,947) (105) 629 - 3,758 Net earnings (loss) 107 (13,608) 2,823 (1,134) 1,951 2,545 3,659 6,403 Less net earnings (loss) attributable to noncontrolling interests (121) (35) (86) 225 (76) 39 (8) 103 Net earnings (loss) attributable to the Company $ 228 $ (13,573) $ 2,908 $ (1,360) $ 2,027 $ 2,506 $ 3,667 $ 6,301 Per-share amounts – earnings (loss) from continuing operations Diluted earnings (loss) per share $ 0.03 $ (0.45) $ 0.36 $ 0.17 $ 0.23 $ 0.19 $ 0.39 $ 0.26 Basic earnings (loss) per share 0.03 (0.45) 0.36 0.17 0.24 0.19 0.40 0.26 Per-share amounts – earnings (loss) from discontinued operations Diluted earnings (loss) per share (0.03) (0.90) (0.06) (0.30) (0.01) 0.05 - 0.38 Basic earnings (loss) per share (0.03) (0.90) (0.06) (0.30) (0.01) 0.05 - 0.38 Per-share amounts – net earnings (loss) Diluted earnings (loss) per share (0.01) (1.35) 0.30 (0.13) 0.22 0.25 0.39 0.64 Basic earnings (loss) per share (0.01) (1.35) 0.30 (0.13) 0.22 0.25 0.40 0.64
Selected data GE Sales of goods and services $ 25,407 $ 23,839 $ 28,150 $ 26,141 $ 26,934 $ 25,612 $ 30,345 $ 30,614 Gross profit from sales 5,516 5,514 6,192 6,033 6,388 6,275 7,027 7,556 GE Capital Total revenues 2,885 2,866 2,771 2,690 2,600 2,660 2,649 2,585 Earnings (loss) from continuing operations attributable to the Company (603) (5,721) (448) (332) 59 (154) 397 (1,447)
For GE, gross profit from sales is sales of goods and services less costs of goods and services sold. Earnings-per-share amounts are computed independently each quarter for earnings (loss) from continuing operations, earnings (loss) from discontinued operations and net earnings. As a result, the sum of each quarter’s per-share amount may not equal the total per-share amount for the respective year; and the sum of per-share amounts from continuing operations and discontinued operations may not equal the total per-share amounts for net earnings (loss) for the respective quarters.
GE 2016 FORM 10-K 221