Consolidated Balance Sheets Consolidated Statements of Income

Hundred and sixth annual report 2012-13
172
1. PRINCIPLES OF CONSOLIdAtION: The Consolidated Financial Statements consist of Tata Steel Limited (“the Company”) and its subsidiary companies (collectively
referred to as "the Group"). The Consolidated Financial Statements have been prepared on the following basis: — The financial statements of the Company and its subsidiary companies have been combined on a line-by-line basis by
adding together the book values of like items of assets, liabilities, income and expenses, after fully eliminating intra-group balances and intra-group transactions resulting in unrealised profits or losses as per Accounting Standard 21 – "Consolidated Financial Statements" notified by Companies (Accounting Standards) Rules, 2006.
— In case of foreign subsidiaries, being non-integral operations, revenue items are consolidated at the average rate prevailing during the year. All assets and liabilities are converted at the rates prevailing at the end of the year. Any exchange difference arising on consolidation is recognised in the "Foreign Currency Translation Reserve".
— The difference between the cost of investment in the subsidiaries and joint ventures, and the Company's share of net assets at the time of acquisition of shares in the subsidiaries and joint ventures is recognised in the financial statements as Goodwill or Capital Reserve as the case may be.
— Minority Interest in the net assets of consolidated subsidiaries is identified and presented in the consolidated Balance Sheet separately from liabilities and equity of the Company's shareholders.
Minority interest in the net assets of consolidated subsidiaries consists of: a) The amount of equity attributable to minority at the date on which investment in a subsidiary is made; and b) The minority share of movements in equity since the date the parent subsidiary relationship came into existence. — Minority's share of net profit for the year of consolidated subsidiaries is identified and adjusted against the Profit After Tax of
the Group. — Investment in associates where the Company directly or indirectly through subsidiaries holds more than 20% of equity, are
accounted for using equity method as per Accounting Standard 23 – "Accounting for Investments in Associates in Consolidated Financial Statements" notified by Companies (Accounting Standards) Rules, 2006.
— The Company accounts for its share of post acquisition changes in net assets of associates, after eliminating unrealised profits and losses resulting from transactions between the Company and its associates to the extent of its share, through its Statement of Profit and Loss, to the extent such change is attributable to the associates' Statement of Profit and Loss and through its reserves for the balance based on available information.
— The difference between the cost of investment in the associates and the Company's share of net assets at the time of acquisition of share in the associates is identified in the financial statements as Goodwill or Capital Reserve as the case may be.
— Interests in Joint Ventures have been accounted by using the proportionate consolidation method as per Accounting Standard 27 – "Financial Reporting of Interests in Joint Ventures" notified by Companies (Accounting Standards) Rules, 2006.
— The financial statements of the subsidiaries, associates and joint ventures used in the consolidation are drawn up to the same reporting date as that of the Company i.e. 31st March, 2013, except for certain associates (indicated as $ below) for which financial statements as on reporting date are not available. These have been consolidated based on latest available financial statements.
— In the absence of financial statements as on the reporting date for certain associates (indicated as # below), no adjustment has been made in the consolidated financial statements. These investments are carried at ` 1 in the financial statements.
— unaudited financial statement of Orchid Netherlands (No. 1) B.V., Tata korf Engineering Services Ltd. and Sila Eastern Limited being subsidiaries and TRF Ltd., being an associate, have been considered for consolidation.
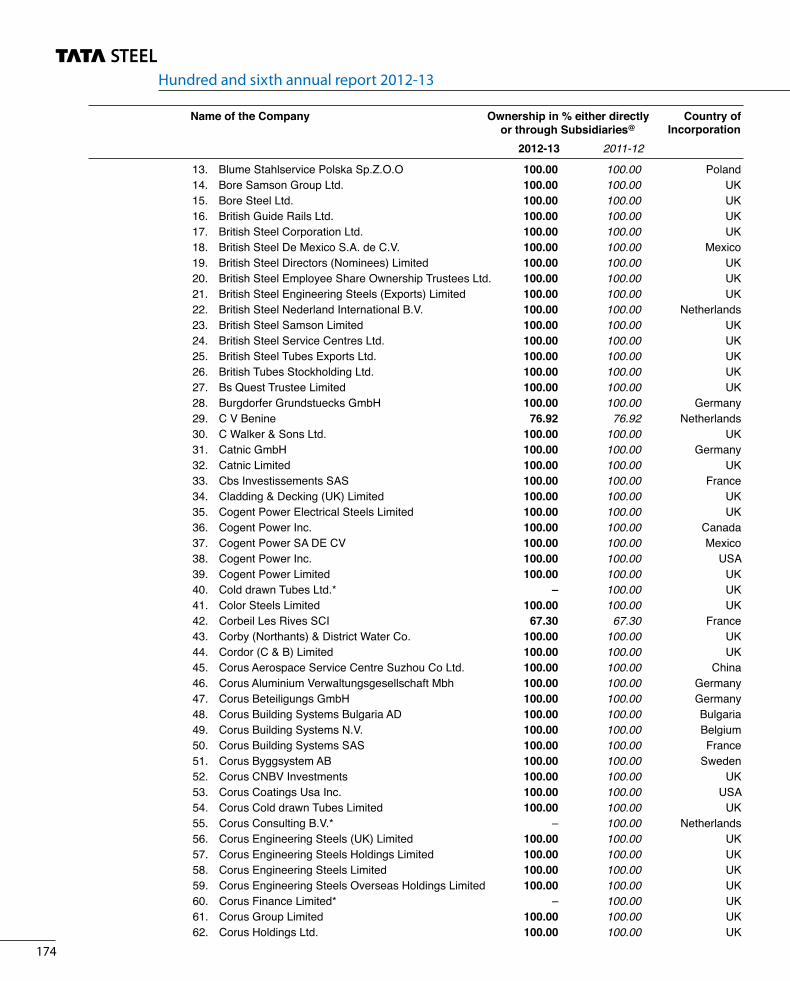
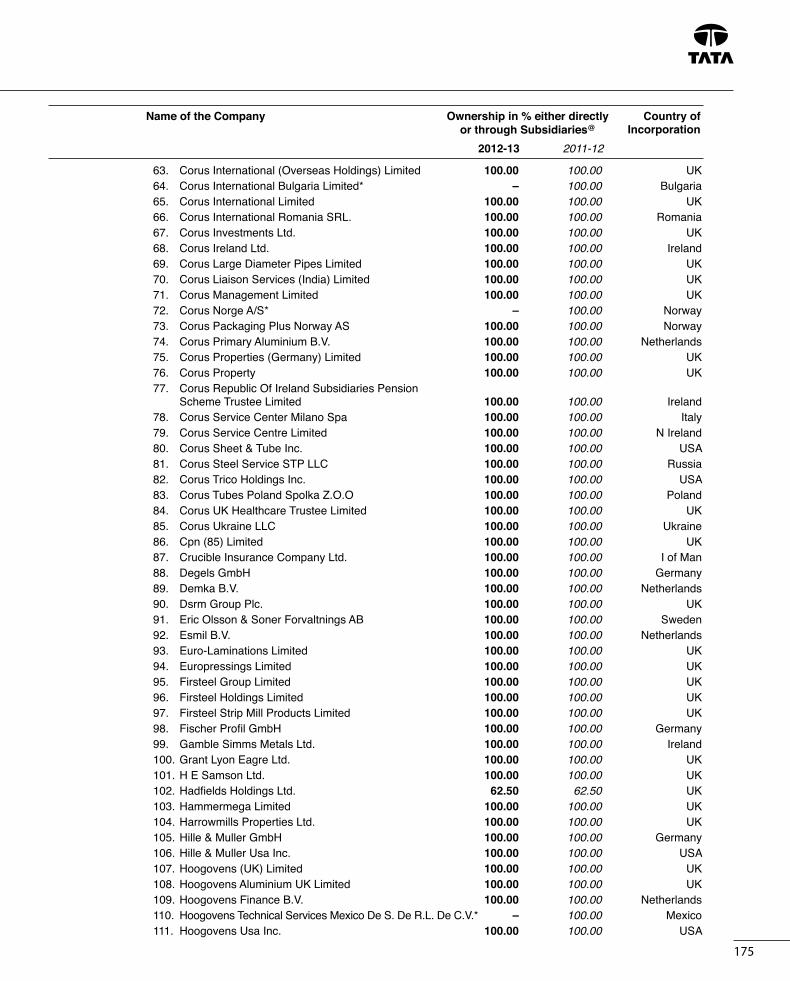
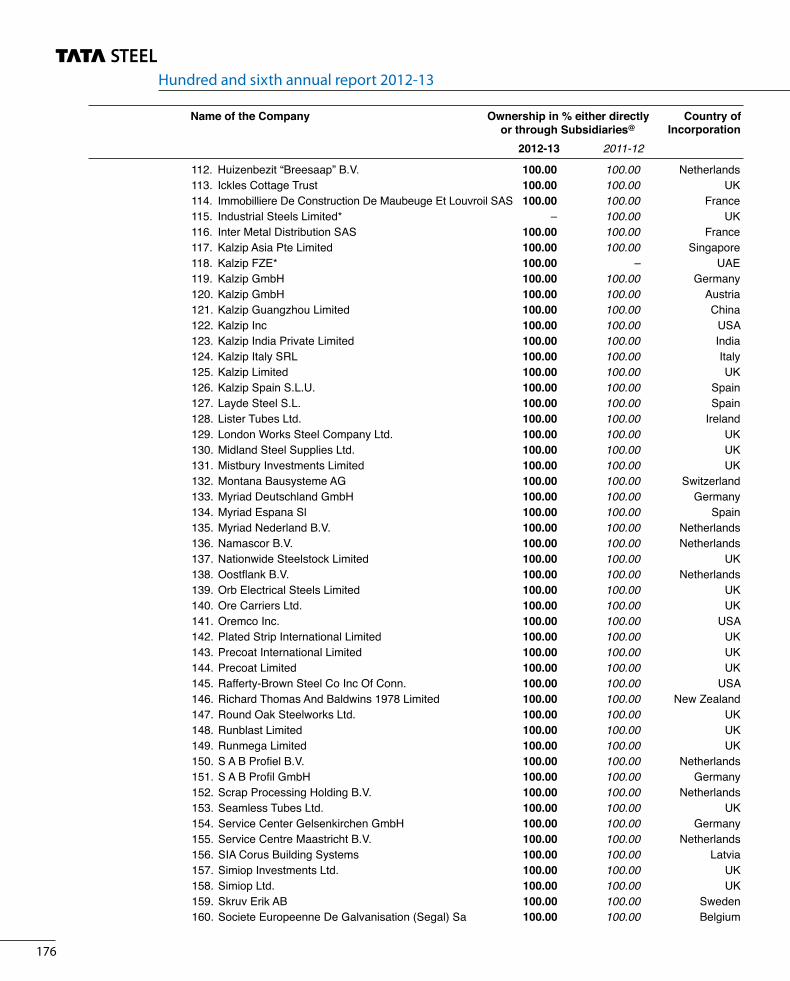
The list of subsidiary companies, joint ventures and associates which are included in the consolidation and the Company’s holdings therein are as under:
Name of the Company Ownership in % either directly Country of or through Subsidiaries@ Incorporation 2012-13 2011-12
A. Subsidiaries: i) Adityapur toll Bridge Company Limited 73.63 73.63 India ii) gopalpur Special Economic Zone Limited 100.00 100.00 India iii) Jamshedpur Utilities & Services Company Limited 100.00 100.00 India 1. Haldia Water Management Limited 60.00 60.00 India 2. Naba Diganta Water Management Limited 74.00 74.00 India 3. SEZ Adityapur Limited 51.00 51.00 India iv) Kalimati Investment Company Ltd. 100.00 100.00 India 1. Bangla Steel & Mining Co. Ltd. 100.00 100.00 Bangladesh
Notes to CoNsolidated BalaNCe sheet aNd statemeNt of Profit aNd loss

173
Name of the Company Ownership in % either directly Country of or through Subsidiaries@ Incorporation 2012-13 2011-12
v) Lanka Special Steels Ltd. 100.00 100.00 Sri Lanka vi) NatSteel Asia Pte. Ltd. 100.00 100.00 Singapore 1. Tata Steel Asia (Hong kong) Ltd. 100.00 100.00 Hongkong S.A.R. 2. Tata Steel Resources Australia Pty. Ltd. 100.00 100.00 Australia vii) Sila Eastern Ltd. * – 49.00 Thailand viii) t S Alloys Limited 100.00 100.00 India ix) Tata Incorporated 100.00 100.00 uSA x) tata Korf Engineering Services Ltd. 100.00 100.00 India xi) tata Metaliks Ltd. 50.09 50.09 India 1. Tata Metaliks kubota Pipes Limited 51.17 51.17 India xii) tayo Rolls Limited 54.45 54.45 India xiii) tata Steel (KZN) (Pty) Ltd. 90.00 90.00 South Africa xiv) Tata Steel holdings Pte. Ltd. 100.00 100.00 Singapore 1. tata Steel Global Holdings Pte. Ltd. 100.00 100.00 Singapore I. Orchid Netherlands (No.1) b.v. 100.00 100.00 Netherlands II. NatSteel holdings Pte. Ltd. 100.00 100.00 Singapore 1. Best Bar Pty. Ltd. 71.00 71.00 Australia 2. Best Bar (VIC) Pte. Ltd. 71.00 71.00 Australia 3. Burwill Trading Pte. Ltd. 100.00 100.00 Singapore 4. Easteel Construction Services Pte. Ltd. 100.00 100.00 Singapore 5. Easteel Services (M) Sdn. Bhd. 100.00 100.00 Malaysia 6. Eastern Steel Fabricators Philippines, Inc. 67.00 67.00 Philippines 7. Eastern Steel Services Pte. Ltd. 100.00 100.00 Singapore 8. Eastern Wire Pte. Ltd. 100.00 100.00 Singapore 9. NatSteel (Xiamen) Ltd. 100.00 100.00 China 10. NatSteel Asia (S) Pte. Ltd. 100.00 100.00 Singapore 11. NatSteel Australia Pty. Ltd. 100.00 100.00 Australia 12. NatSteel Equity IV Pte. Ltd. 100.00 100.00 Singapore 13. NatSteel Recycling Pte Ltd. 100.00 100.00 Singapore 14. NatSteel Trade International (Shanghai) Company Ltd. 100.00 100.00 China 15. NatSteel Trade International Pte. Ltd. 100.00 100.00 Singapore 16. NatSteel Vina Co. Ltd. 56.50 56.50 Vietnam 17. PT Material Recycling Indonesia 100.00 100.00 Indonesia 18. The Siam Industrial Wire Company Ltd. 100.00 100.00 Thailand 19. TSN Wires Co. Ltd.* 60.00 – Thailand 20. Wuxi Jinyang Metal Products Co. Ltd.* – 95.00 China III. Tata Steel Europe Limited 100.00 100.00 uk 1. Almana Steel Dubai (Jersey) Limited 100.00 100.00 Jersey 2. Apollo Metals Ltd. 100.00 100.00 uSA 3. Ashorne Hill Management College 100.00 100.00 uk 4. Augusta Grundstucks GmbH 100.00 100.00 Germany 5. Automotive Laser Technologies Limited 100.00 100.00 uk 6. B S Pension Fund Trustee Ltd. 100.00 100.00 uk 7. Bailey Steels Limited 100.00 100.00 uk 8. Beheermaatschappij Industriele Produkten B.V. 100.00 100.00 Netherlands 9. Belfin Beheermaatschappij B.V. 100.00 100.00 Netherlands 10. Bell & Harwood Limited 100.00 100.00 uk 11. Blastmega Limited 100.00 100.00 uk 12. Blume Stahlservice GmbH 100.00 100.00 Germany
Hundred and sixth annual report 2012-13
174
13. Blume Stahlservice Polska Sp.Z.O.O 100.00 100.00 Poland 14. Bore Samson Group Ltd. 100.00 100.00 uk 15. Bore Steel Ltd. 100.00 100.00 uk 16. British Guide Rails Ltd. 100.00 100.00 uk 17. British Steel Corporation Ltd. 100.00 100.00 uk 18. British Steel De Mexico S.A. de C.V. 100.00 100.00 Mexico 19. British Steel Directors (Nominees) Limited 100.00 100.00 uk 20. British Steel Employee Share Ownership Trustees Ltd. 100.00 100.00 uk 21. British Steel Engineering Steels (Exports) Limited 100.00 100.00 uk 22. British Steel Nederland International B.V. 100.00 100.00 Netherlands 23. British Steel Samson Limited 100.00 100.00 uk 24. British Steel Service Centres Ltd. 100.00 100.00 uk 25. British Steel Tubes Exports Ltd. 100.00 100.00 uk 26. British Tubes Stockholding Ltd. 100.00 100.00 uk 27. Bs Quest Trustee Limited 100.00 100.00 uk 28. Burgdorfer Grundstuecks GmbH 100.00 100.00 Germany 29. C V Benine 76.92 76.92 Netherlands 30. C Walker & Sons Ltd. 100.00 100.00 uk 31. Catnic GmbH 100.00 100.00 Germany 32. Catnic Limited 100.00 100.00 uk 33. Cbs Investissements SAS 100.00 100.00 France 34. Cladding & Decking (uk) Limited 100.00 100.00 uk 35. Cogent Power Electrical Steels Limited 100.00 100.00 uk 36. Cogent Power Inc. 100.00 100.00 Canada 37. Cogent Power SA DE CV 100.00 100.00 Mexico 38. Cogent Power Inc. 100.00 100.00 uSA 39. Cogent Power Limited 100.00 100.00 uk 40. Cold drawn Tubes Ltd.* – 100.00 uk 41. Color Steels Limited 100.00 100.00 uk 42. Corbeil Les Rives SCI 67.30 67.30 France 43. Corby (Northants) & District Water Co. 100.00 100.00 uk 44. Cordor (C & B) Limited 100.00 100.00 uk 45. Corus Aerospace Service Centre Suzhou Co Ltd. 100.00 100.00 China 46. Corus Aluminium Verwaltungsgesellschaft Mbh 100.00 100.00 Germany 47. Corus Beteiligungs GmbH 100.00 100.00 Germany 48. Corus Building Systems Bulgaria AD 100.00 100.00 Bulgaria 49. Corus Building Systems N.V. 100.00 100.00 Belgium 50. Corus Building Systems SAS 100.00 100.00 France 51. Corus Byggsystem AB 100.00 100.00 Sweden 52. Corus CNBV Investments 100.00 100.00 uk 53. Corus Coatings usa Inc. 100.00 100.00 uSA 54. Corus Cold drawn Tubes Limited 100.00 100.00 uk 55. Corus Consulting B.V.* – 100.00 Netherlands 56. Corus Engineering Steels (uk) Limited 100.00 100.00 uk 57. Corus Engineering Steels Holdings Limited 100.00 100.00 uk 58. Corus Engineering Steels Limited 100.00 100.00 uk 59. Corus Engineering Steels Overseas Holdings Limited 100.00 100.00 uk 60. Corus Finance Limited* – 100.00 uk 61. Corus Group Limited 100.00 100.00 uk 62. Corus Holdings Ltd. 100.00 100.00 uk
Name of the Company Ownership in % either directly Country of or through Subsidiaries@ Incorporation 2012-13 2011-12
175
63. Corus International (Overseas Holdings) Limited 100.00 100.00 uk 64. Corus International Bulgaria Limited* – 100.00 Bulgaria 65. Corus International Limited 100.00 100.00 uk 66. Corus International Romania SRL. 100.00 100.00 Romania 67. Corus Investments Ltd. 100.00 100.00 uk 68. Corus Ireland Ltd. 100.00 100.00 Ireland 69. Corus Large Diameter Pipes Limited 100.00 100.00 uk 70. Corus Liaison Services (India) Limited 100.00 100.00 uk 71. Corus Management Limited 100.00 100.00 uk 72. Corus Norge A/S* – 100.00 Norway 73. Corus Packaging Plus Norway AS 100.00 100.00 Norway 74. Corus Primary Aluminium B.V. 100.00 100.00 Netherlands 75. Corus Properties (Germany) Limited 100.00 100.00 uk 76. Corus Property 100.00 100.00 uk 77. Corus Republic Of Ireland Subsidiaries Pension Scheme Trustee Limited 100.00 100.00 Ireland 78. Corus Service Center Milano Spa 100.00 100.00 Italy 79. Corus Service Centre Limited 100.00 100.00 N Ireland 80. Corus Sheet & Tube Inc. 100.00 100.00 uSA 81. Corus Steel Service STP LLC 100.00 100.00 Russia 82. Corus Trico Holdings Inc. 100.00 100.00 uSA 83. Corus Tubes Poland Spolka Z.O.O 100.00 100.00 Poland 84. Corus uk Healthcare Trustee Limited 100.00 100.00 uk 85. Corus ukraine LLC 100.00 100.00 ukraine 86. Cpn (85) Limited 100.00 100.00 uk 87. Crucible Insurance Company Ltd. 100.00 100.00 I of Man 88. Degels GmbH 100.00 100.00 Germany 89. Demka B.V. 100.00 100.00 Netherlands 90. Dsrm Group Plc. 100.00 100.00 uk 91. Eric Olsson & Soner Forvaltnings AB 100.00 100.00 Sweden 92. Esmil B.V. 100.00 100.00 Netherlands 93. Euro-Laminations Limited 100.00 100.00 uk 94. Europressings Limited 100.00 100.00 uk 95. Firsteel Group Limited 100.00 100.00 uk 96. Firsteel Holdings Limited 100.00 100.00 uk 97. Firsteel Strip Mill Products Limited 100.00 100.00 uk 98. Fischer Profil GmbH 100.00 100.00 Germany 99. Gamble Simms Metals Ltd. 100.00 100.00 Ireland 100. Grant Lyon Eagre Ltd. 100.00 100.00 uk 101. H E Samson Ltd. 100.00 100.00 uk 102. Hadfields Holdings Ltd. 62.50 62.50 uk 103. Hammermega Limited 100.00 100.00 uk 104. Harrowmills Properties Ltd. 100.00 100.00 uk 105. Hille & Muller GmbH 100.00 100.00 Germany 106. Hille & Muller usa Inc. 100.00 100.00 uSA 107. Hoogovens (uk) Limited 100.00 100.00 uk 108. Hoogovens Aluminium uk Limited 100.00 100.00 uk 109. Hoogovens Finance B.V. 100.00 100.00 Netherlands 110. Hoogovens Technical Services Mexico De S. De R.L. De C.V.* – 100.00 Mexico 111. Hoogovens usa Inc. 100.00 100.00 uSA
Name of the Company Ownership in % either directly Country of or through Subsidiaries@ Incorporation 2012-13 2011-12
Hundred and sixth annual report 2012-13
176
112. Huizenbezit “Breesaap” B.V. 100.00 100.00 Netherlands 113. Ickles Cottage Trust 100.00 100.00 uk 114. Immobilliere De Construction De Maubeuge Et Louvroil SAS 100.00 100.00 France 115. Industrial Steels Limited* – 100.00 uk 116. Inter Metal Distribution SAS 100.00 100.00 France 117. kalzip Asia Pte Limited 100.00 100.00 Singapore 118. kalzip FZE* 100.00 – uAE 119. kalzip GmbH 100.00 100.00 Germany 120. kalzip GmbH 100.00 100.00 Austria 121. kalzip Guangzhou Limited 100.00 100.00 China 122. kalzip Inc 100.00 100.00 uSA 123. kalzip India Private Limited 100.00 100.00 India 124. kalzip Italy SRL 100.00 100.00 Italy 125. kalzip Limited 100.00 100.00 uk 126. kalzip Spain S.L.u. 100.00 100.00 Spain 127. Layde Steel S.L. 100.00 100.00 Spain 128. Lister Tubes Ltd. 100.00 100.00 Ireland 129. London Works Steel Company Ltd. 100.00 100.00 uk 130. Midland Steel Supplies Ltd. 100.00 100.00 uk 131. Mistbury Investments Limited 100.00 100.00 uk 132. Montana Bausysteme AG 100.00 100.00 Switzerland 133. Myriad Deutschland GmbH 100.00 100.00 Germany 134. Myriad Espana Sl 100.00 100.00 Spain 135. Myriad Nederland B.V. 100.00 100.00 Netherlands 136. Namascor B.V. 100.00 100.00 Netherlands 137. Nationwide Steelstock Limited 100.00 100.00 uk 138. Oostflank B.V. 100.00 100.00 Netherlands 139. Orb Electrical Steels Limited 100.00 100.00 uk 140. Ore Carriers Ltd. 100.00 100.00 uk 141. Oremco Inc. 100.00 100.00 uSA 142. Plated Strip International Limited 100.00 100.00 uk 143. Precoat International Limited 100.00 100.00 uk 144. Precoat Limited 100.00 100.00 uk 145. Rafferty-Brown Steel Co Inc Of Conn. 100.00 100.00 uSA 146. Richard Thomas And Baldwins 1978 Limited 100.00 100.00 New Zealand 147. Round Oak Steelworks Ltd. 100.00 100.00 uk 148. Runblast Limited 100.00 100.00 uk 149. Runmega Limited 100.00 100.00 uk 150. S A B Profiel B.V. 100.00 100.00 Netherlands 151. S A B Profil GmbH 100.00 100.00 Germany 152. Scrap Processing Holding B.V. 100.00 100.00 Netherlands 153. Seamless Tubes Ltd. 100.00 100.00 uk 154. Service Center Gelsenkirchen GmbH 100.00 100.00 Germany 155. Service Centre Maastricht B.V. 100.00 100.00 Netherlands 156. SIA Corus Building Systems 100.00 100.00 Latvia 157. Simiop Investments Ltd. 100.00 100.00 uk 158. Simiop Ltd. 100.00 100.00 uk 159. Skruv Erik AB 100.00 100.00 Sweden 160. Societe Europeenne De Galvanisation (Segal) Sa 100.00 100.00 Belgium
Name of the Company Ownership in % either directly Country of or through Subsidiaries@ Incorporation 2012-13 2011-12

177
161. Staalverwerking En Handel B.V. 100.00 100.00 Netherlands 162. Stainless Velsen-Noord BV 100.00 100.00 Netherlands 163. Steel StockHoldings Ltd. 100.00 100.00 uk 164. Steelstock Ltd. 100.00 100.00 uk 165. Stewarts & Lloyds Of Ireland Ltd. 100.00 100.00 Ireland 166. Stewarts And Lloyds (Overseas) Ltd. 100.00 100.00 uk 167. Stocksbridge Works Cottage Trust Limited 100.00 100.00 uk 168. Stuwadoorsbedrijf Velserkom B.V. 100.00 100.00 Netherlands 169. Surahammar Bruks AB 100.00 100.00 Sweden 170. Swinden Housing Association 100.00 100.00 uk 171. Tata Steel Belgium Packaging Steels N.V. 100.00 100.00 Belgium 172. Tata Steel Belgium Services N.V. 100.00 100.00 Belgium 173. Tata Steel Denmark Byggsystemer A/S 100.00 100.00 Denmark 174. Tata Steel Europe Distribution BV 100.00 100.00 Netherlands 175. Tata Steel Europe Metals Trading BV 100.00 100.00 Netherlands 176. Tata Steel France Batiment et Systemes SAS 100.00 100.00 France 177. Tata Steel France Holdings SAS 100.00 100.00 France 178. Tata Steel France Rail SA 100.00 100.00 France 179. Tata Steel Germany GmbH 100.00 100.00 Germany 180. Tata Steel Hungary LLC 100.00 100.00 Hungary 181. Tata Steel Ijmuiden BV 100.00 100.00 Netherlands 182. Tata Steel International (Americas) Holdings Inc 100.00 100.00 uSA 183. Tata Steel International (Americas) Inc 100.00 100.00 uSA 184. Tata Steel International (Australasia) Limited 100.00 100.00 New Zealand 185. Tata Steel International (Benelux) BV 100.00 100.00 Netherlands 186. Tata Steel International (Canada) Holdings Inc 100.00 100.00 Canada 187. Tata Steel International (Czech Republic) S.R.O 100.00 100.00 Czech Republic 188. Tata Steel International (Denmark) A/S 100.00 100.00 Denmark 189. Tata Steel International (Finland) Oy 100.00 100.00 Finland 190. Tata Steel International (France) SAS 100.00 100.00 France 191. Tata Steel International (Germany) GmbH 100.00 100.00 Germany 192. Tata Steel International (South America) Representações LTDA 100.00 100.00 Brazil 193. Tata Steel International Hellas SA 100.00 100.00 Greece 194. Tata Steel International (Italia) SRL 100.00 100.00 Italy 195. Tata Steel International (Middle East) FZE 100.00 100.00 uAE 196. Tata Steel International (Nigeria) Ltd. 100.00 100.00 Nigeria 197. Tata Steel International (North America) Ltd.* – 100.00 uSA 198. Tata Steel International (Poland) sp Z.O.O. 100.00 100.00 Poland 199. Tata Steel International (Schweiz) AG 100.00 100.00 Switzerland 200. Tata Steel International (Sweden) AB 100.00 100.00 Sweden 201. Tata Steel International (uk) Ltd.* – 100.00 uk 202. Tata Steel International (India) Limited 100.00 100.00 India 203. Tata Steel International Iberica SA 100.00 100.00 Spain 204. Tata Steel Istanbul Metal Sanayi ve Ticaret AS 88.00 88.00 Turkey 205. Tata Steel Logistics and Shipping BV 100.00 100.00 Netherlands 206. Tata Steel Maubeuge SAS 100.00 100.00 France 207. Tata Steel Nederland BV 100.00 100.00 Netherlands 208. Tata Steel Nederland Consulting & Technical Services BV 100.00 100.00 Netherlands
Name of the Company Ownership in % either directly Country of or through Subsidiaries@ Incorporation 2012-13 2011-12

Hundred and sixth annual report 2012-13
178
209. Tata Steel Nederland Investment BV 100.00 100.00 Netherlands 210. Tata Steel Nederland Perfo BV 100.00 100.00 Netherlands 211. Tata Steel Nederland Services BV 100.00 100.00 Netherlands 212. Tata Steel Nederland Star-Frame BV 100.00 100.00 Netherlands 213. Tata Steel Nederland Technology BV 100.00 100.00 Netherlands 214. Tata Steel Nederland Tubes BV 100.00 100.00 Netherlands 215. Tata Steel Netherlands Holdings B.V. 100.00 100.00 Netherlands 216. Tata Steel Norway Byggsystemer A/S 100.00 100.00 Norway 217. Tata Steel Speciality Service Centre Xian Co. Ltd.* 100.00 – China 218. Tata Steel uk Consulting Limited 100.00 100.00 uk 219. Tata Steel uk Holdings Limited 100.00 100.00 uk 220. Tata Steel uk Limited 100.00 100.00 uk 221. Tata Steel uk Rail Consultancy Limited 100.00 100.00 uk 222. Tata Steel usa Inc. 100.00 100.00 uSA 223. The Newport And South Wales Tube Company Ltd. 100.00 100.00 uk 224. The Stanton Housing Company Ltd. 100.00 100.00 uk 225. The Steel Company Of Ireland Limited 100.00 100.00 Ireland 226. The Templeborough Rolling Mills Ltd. 100.00 100.00 uk 227. Thomas Processing Company 100.00 100.00 uSA 228. Thomas Steel Strip Corp. 100.00 100.00 uSA 229. Tinsley Trailers Limited 100.00 100.00 uk 230. Toronto Industrial Fabrications Ltd. 100.00 100.00 uk 231. Trierer Walzwerk GmbH 100.00 100.00 Germany 232. Tulip uk Holdings (No.2) Ltd. 100.00 100.00 uk 233. Tulip uk Holdings (No.3) Ltd. 100.00 100.00 uk 234. Tuscaloosa Steel Corporation 100.00 100.00 uSA 235. u.E.S. Bright Bar Limited 100.00 100.00 uk 236. uk Steel Enterprise Ltd. 100.00 100.00 uk 237. ukse Fund Managers (General Partner) Limited 100.00 100.00 uk 238. ukse Fund Managers Limited 100.00 100.00 uk 239. unitol SAS 100.00 100.00 France 240. Vlietjonge BV* – 100.00 Netherlands 241. Walker Manufacturing And Investments Ltd. 100.00 100.00 uk 242. Walkersteelstock Ireland Limited 100.00 100.00 Ireland 243. Walkersteelstock Ltd. 100.00 100.00 uk 244. Westwood Steel Services Ltd. 100.00 100.00 uk 245. Whitehead (Narrow Strip) Ltd. 100.00 100.00 uk IV. tata Steel Global Minerals Holdings Pte Ltd. 100.00 100.00 Singapore 1. Al Rimal Mining LLC 70.00 70.00 Oman 2. Black Ginger 461 (Proprietary) Ltd 100.00 100.00 South Africa 3. kalimati Coal Company Pty. Ltd. 100.00 100.00 Australia 4. Sedibeng Iron Ore Pty. Ltd. 64.00 64.00 South Africa 5. Tata Steel Cote D’ Ivoire S.A 85.00 85.00 Ivory Coast 6. Tata Steel Minerals uk Limited 100.00 100.00 uk 7. Tata Steel Minerals Canada Limited 80.00 80.00 Canada 8. T S Canada Capital Ltd* 100.00 – Canada V. Tata Steel International (Singapore) holdings Pte. Ltd. 100.00 100.00 Singapore 1. TSIA Holdings (Thailand) Limited 100.00 100.00 Thailand 2. Tata Steel International (Guangzhou) Ltd.* – 100.00 China
Name of the Company Ownership in % either directly Country of or through Subsidiaries@ Incorporation 2012-13 2011-12

179
3. Tata Steel International (Shanghai) Ltd. 100.00 100.00 China 4. Tata Steel International (Malaysia) Sdn. Bhd. 100.00 100.00 Malaysia 5. Tata Steel International (Thailand) Limited 100.00 100.00 Thailand 6. Tata Steel International (Singapore) Pte. Ltd. 100.00 100.00 Singapore 7. Tata Steel International (Asia) Limited 100.00 100.00 Hong kong S.A.R 8. Tata Steel International (Hongkong) Limited* – 100.00 Hong kong S.A.R VI. tata Steel (thailand) Public Company Ltd. 67.90 67.90 Thailand 1. N.T.S Steel Group Plc. 99.76 99.66 Thailand 2. The Siam Construction Steel Co. Ltd. 99.99 99.99 Thailand 3. The Siam Iron And Steel (2001) Co. Ltd. 99.99 99.99 Thailand VII. tata Steel Global Procurement Company Pte. Ltd. 100.00 100.00 Singapore 1. ProCo Issuer Pte. Ltd. 100.00 100.00 Singapore xv) tata Steel Processing and distribution Limited 100.00 100.00 India xvi) TM International Logistics Limited 51.00 51.00 India 1. International Shipping Logistics FZE 100.00 100.00 uAE 2. TkM Global China Ltd 100.00 100.00 China 3. TkM Global GmbH 100.00 100.00 Germany 4. TkM Global Logistics Limited 100.00 100.00 India 5. TM Harbour Services Private Limited 100.00 100.00 India xvii) Indian Steel & Wire Products Ltd. 92.50 91.36 India xviii) The Tata Pigments Limited 100.00 100.00 India xix) t M Mining Company Limited 74.00 74.00 India xx) Jamshedpur Continuous Annealing & Processing Company Private Limited 51.00 100.00 India xxi) the tinplate Company of India Ltd. 74.96 60.96 India xxii) Tata Sponge Iron Limited 54.50 – India 1. TSIL Energy Limited* 100.00 – India xxiii) Tata Steel Odisha Limited * 100.00 – India
B. Joint Ventures of: i) Tata Steel Limited 1. Bhubaneshwar Power Private Limited 26.00 26.00 India 2. Himalaya Steel Mill Services Private Limited 26.00 26.00 India 3. mjunction services limited 50.00 50.00 India 4. S & T Mining Company Private Limited 50.00 50.00 India 5. Tata BlueScope Steel Limited 50.00 50.00 India 6. Tata Nyk Shipping Pte Ltd. 50.00 50.00 Singapore 7. The Dhamra Port Company Limited 50.00 50.00 India ii) Tata Steel holdings Pte. Ltd. a) tata Steel Global Holdings Pte Ltd. I. Tata Steel Europe Limited 1. Afon Tinplate Company Limited 64.00 64.00 uk 2. Air Products Llanwern Limited 50.00 50.00 uk 3. B V Ijzerleew* – 50.00 Netherlands 4. Bsr Pipeline Services Limited 50.00 50.00 uk 5. Caparo Merchant Bar Plc 25.00 25.00 uk 6. Corus Cogifer Switches And Crossings Limited* – 50.00 uk 7. Corus kalpinis Simos Cladding Industry SA 50.00 50.00 Greece 8. Danieli Corus Technical Services B.V. 50.00 50.00 Netherlands
Name of the Company Ownership in % either directly Country of or through Subsidiaries@ Incorporation 2012-13 2011-12
Hundred and sixth annual report 2012-13
180
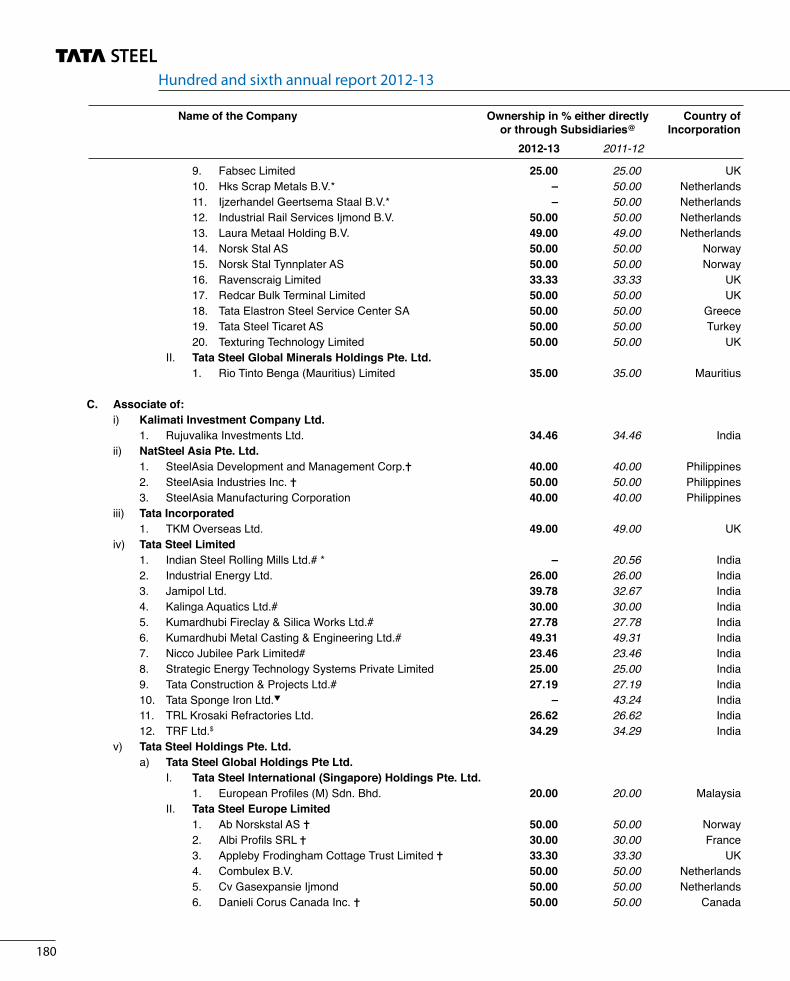
9. Fabsec Limited 25.00 25.00 uk 10. Hks Scrap Metals B.V.* – 50.00 Netherlands 11. Ijzerhandel Geertsema Staal B.V.* – 50.00 Netherlands 12. Industrial Rail Services Ijmond B.V. 50.00 50.00 Netherlands 13. Laura Metaal Holding B.V. 49.00 49.00 Netherlands 14. Norsk Stal AS 50.00 50.00 Norway 15. Norsk Stal Tynnplater AS 50.00 50.00 Norway 16. Ravenscraig Limited 33.33 33.33 uk 17. Redcar Bulk Terminal Limited 50.00 50.00 uk 18. Tata Elastron Steel Service Center SA 50.00 50.00 Greece 19. Tata Steel Ticaret AS 50.00 50.00 Turkey 20. Texturing Technology Limited 50.00 50.00 uk II. tata Steel Global Minerals Holdings Pte. Ltd. 1. Rio Tinto Benga (Mauritius) Limited 35.00 35.00 Mauritius
C. Associate of: i) Kalimati Investment Company Ltd. 1. Rujuvalika Investments Ltd. 34.46 34.46 India ii) NatSteel Asia Pte. Ltd. 1. SteelAsia Development and Management Corp. 40.00 40.00 Philippines 2. SteelAsia Industries Inc. 50.00 50.00 Philippines 3. SteelAsia Manufacturing Corporation 40.00 40.00 Philippines iii) Tata Incorporated 1. TkM Overseas Ltd. 49.00 49.00 uk iv) Tata Steel Limited 1. Indian Steel Rolling Mills Ltd.# * – 20.56 India 2. Industrial Energy Ltd. 26.00 26.00 India 3. Jamipol Ltd. 39.78 32.67 India 4. kalinga Aquatics Ltd.# 30.00 30.00 India 5. kumardhubi Fireclay & Silica Works Ltd.# 27.78 27.78 India 6. kumardhubi Metal Casting & Engineering Ltd.# 49.31 49.31 India 7. Nicco Jubilee Park Limited# 23.46 23.46 India 8. Strategic Energy Technology Systems Private Limited 25.00 25.00 India 9. Tata Construction & Projects Ltd.# 27.19 27.19 India 10. Tata Sponge Iron Ltd. – 43.24 India 11. TRL krosaki Refractories Ltd. 26.62 26.62 India 12. TRF Ltd.$ 34.29 34.29 India v) Tata Steel holdings Pte. Ltd. a) tata Steel Global Holdings Pte Ltd. I. Tata Steel International (Singapore) holdings Pte. Ltd. 1. European Profiles (M) Sdn. Bhd. 20.00 20.00 Malaysia II. Tata Steel Europe Limited 1. Ab Norskstal AS 50.00 50.00 Norway 2. Albi Profils SRL 30.00 30.00 France 3. Appleby Frodingham Cottage Trust Limited 33.30 33.30 uk 4. Combulex B.V. 50.00 50.00 Netherlands 5. Cv Gasexpansie Ijmond 50.00 50.00 Netherlands 6. Danieli Corus Canada Inc. 50.00 50.00 Canada
Name of the Company Ownership in % either directly Country of or through Subsidiaries@ Incorporation 2012-13 2011-12

181
Name of the Company Ownership in % either directly Country of or through Subsidiaries@ Incorporation 2012-13 2011-12
7. Danieli Corus Asia B.V. 50.00 50.00 Netherlands 8. Danieli Corus B.V. 50.00 50.00 Netherlands 9. Danieli Corus Braseq Ltda. 50.00 50.00 Brazil 10. Danieli Corus Construction Services B.V. 50.00 50.00 Netherlands 11. Danieli Corus Construction Services usa Inc. 50.00 50.00 uSA 12. Danieli Corus Do Brasil Ltda. 50.00 50.00 Brazil 13. Danieli Corus Inc. 50.00 50.00 uSA 14. Danieli Corus Services usa Inc. 50.00 50.00 uSA 15. Danieli Corus India Private Limited 50.00 50.00 India 16. European Profiles (Marketing) Sdn.Bhd. 10.20 10.20 Malaysia 17. Galvpro LP. 45.50 45.50 uSA 18. Gietwalsonderhoudcombinatie B.V. 50.00 50.00 Netherlands 19. Hoogovens Court Roll Service Technologies Vof: 50.00 50.00 Netherlands 20. Hoogovens Gan Multimedia S.A. De C.V. 50.00 50.00 Mexico 21. Isolation Du Sud SA 0.33 0.33 France 22. Issb Limited 50.00 50.00 uk 23. MDC Sublance Probe Technology 50.00 50.00 Shanghai 24. Richard Lees Steel Decking Asia Snd. Bhd. 10.00 10.00 Malaysia 25. Rsp Holding B.V.* – 13.19 Netherlands 26. Schreiner Fleischer AS 50.00 50.00 Norway 27. Shanghai Bao yi Beverage Can Making Co. Ltd.* – 12.50 China 28. Thoresen & Thorvaldsen AS 50.00 50.00 Norway 29. Trico LLC 25.00 25.00 uSA 30. Weirton/Hoogovens GP 50.00 50.00 uSA 31. Wupperman Staal Nederland B.V. 30.00 30.00 Netherlands III. tata Steel Global Minerals Holdings Pte Ltd. 1. New Millennium Iron Corp.$ 26.31 26.62 Canada vi) Indian Steel & Wire Products Ltd. 1. Metal Corporation of India Limited# 42.05 42.05 India
@ Represents the holding percentage of the respective companies and does not indicate the effective percentage holding of the Group.
* Part of the year. Earlier an associate became subsidiary during the year. By virtue of management control. Investments in these associates are reported at nil value in the consolidated financial statements.

Hundred and sixth annual report 2012-13
182
2. ACCounTing PoLiCieS(a) Basis for Accounting The financial statements are prepared under the historical cost convention on an accrual basis of accounting in accordance with
the Generally Accepted Accounting Principles, Accounting Standards notified under Section 211(3C) of the Companies Act, 1956 and the relevant provisions thereof.
(b) Revenue Recognition (i) Revenue from sale of goods is recognised net of rebates and discounts on transfer of significant risks and rewards of
ownership to the buyer. Sale of goods is recognised gross of excise duty but net of sales tax and value added tax. (ii) Revenue from services rendered is recognised on pro-rata basis in proportion to the stage of completion of the related
transaction. (iii) Export incentive under various schemes notified by the Government has been recognised on the basis of credits afforded
in the pass book/amount received. (iv) In one of the subsidiaries, income from services are recognised upon completion of the relevant shipping activities and
related services. Income and expenses relating to incomplete voyages are carried forward as voyages-in-progress. Despatch earnings are accounted for on receipt basis.
(c) Employee Benefits (i) Short-term employee benefits are recognised as an expense at the undiscounted amount in the Statement of Profit and
Loss of the year in which the employee has rendered services. (ii) For defined-benefit plans, the amount recognised in the balance sheet is the present value of the defined-benefit
obligation less the fair value of any plan assets and any past service costs not yet recognised. The present value of the defined-benefit obligation is the present value of expected future payments required to settle the obligation resulting from employee service in the current and prior periods. The discount rate used is the market yields on government bonds at the balance sheet date with remaining terms to maturity approximating those of the Group’s obligations. In some of the foreign subsidiaries, the present value is determined using the AA rated corporate bonds.
(iii) Other long-term employee benefits are recognised as an expense in the Statement of Profit and Loss for the year in which the employee has rendered services. Estimated liability on account of long-term benefits is discounted to the present value, using the market yield on Government Bonds, as on the date of balance sheet, as the discounting rate. In some of the foreign subsidiaries, the present value is determined using the AA rated corporate bonds.
(iv) Actuarial gains and losses in respect of post employment and other long-term benefits are charged in the Statement of Profit and Loss. However, in one of the subsidiaries (Tata Steel Europe Limited) because of volatility caused by periodic changes in the assumptions underlying the computation of the pension and other post retirement benefit liabilities, it is not considered practicable to adopt a common accounting policy for accounting for these liabilities of the Company and Tata Steel Europe Limited. The actuarial gains and losses for these liabilities of Tata Steel Europe Limited have been accounted in Reserves and Surplus.
(v) In respect of the Employee Separation Scheme, the increase in the net present value of the future liability for pension payable to employees, who have opted for retirement under the Employee Separation Scheme of the Company, is charged to the Statement of Profit and Loss.
(d) tangible Assets Tangible assets are stated at cost less accumulated depreciation and net of impairments, if any. Pre-operation expenses
including trial run expenses (net of revenue) are capitalised. Borrowing costs during the period of construction is added to the cost of eligible assets.
Blast Furnace relining is capitalised. The written down value of the asset consisting of lining/relining expenditure embedded in the cost of the furnace is written off in the year of fresh relining.
(e) Intangible Assets Intangible assets are stated at cost less accumulated amortisation and net of impairments, if any. An intangible asset is
recognised if it is probable that the expected future economic benefits that are attributable to the asset will flow to the Company and its cost can be measured reliably. Intangible assets having finite useful lives are amortised on a straight-line basis over their estimated useful lives.
(f) depreciation and Amortisation (i) Capital assets whose ownership does not vest with the Company are depreciated over their estimated useful life or five
years, whichever is less.

183
(ii) In respect of other assets, depreciation is provided on a straight line basis applying the rates specified in Schedule XIV to the Companies Act, 1956 or rates based on estimated useful life whichever is higher. The details of estimated life for each category of asset are as under:
(a) Buildings and Roads — 30 to 62 years (b) Plant and Machinery — 3 to 30 years (c) Railway Sidings/Lines — 21 years (d) Vehicles and Aircraft — 5 to 18 years (e) Furniture, Fixtures and Office Equipments — 5 years (f) Intangibles (Computer Software) — 5 to 10 years (g) Development of property for development of mines and collieries are amortised over the useful life of the mine or
lease period whichever is less, subject to maximum of 10 years. (h) Blast Furnace relining is depreciated over a period of 10 years (average expected life). (i) Freehold land is not depreciated. (j) Leasehold land and other leasehold assets are amortised over the life of the lease. In some of the subsidiaries, joint ventures and associates depreciation is calculated on written down value basis and intangible
assets are amortised over the period for which the rights are obtained. The depreciation charge in respect of these entities is not significant in the context of the consolidated financial statements.
(g) Impairment For the purpose of impairment testing, goodwill is allocated to each of the Group’s cash-generating units that are expected
to benefit from the synergies of the combination. Cash-generating units to which goodwill has been allocated are tested for impairment annually, or more frequently when there
is an indication that the unit’s value may be impaired. If the recoverable amount of the cash-generating unit is less than the carrying amount of the unit, the impairment loss is allocated first to reduce the carrying amount of any goodwill allocated to the unit and then to the other assets of the unit in proportion to the carrying amount of each asset in the unit. An impairment loss recognised for goodwill is not reversed in a subsequent period.
Fixed assets are reviewed for impairment whenever events or changes in circumstances indicate that their carrying amount may not be recoverable.
An impairment loss is recognised in the Statement of Profit and Loss if the carrying amount of an asset exceeds its recoverable amount.
(h) Foreign Currency transactions Foreign Currency Transactions (FCT) and forward exchange contracts entered into to hedge FCT are initially recognised
at the spot rate on the date of the transaction/contract. Monetary assets and liabilities denominated in foreign currency and forward exchange contracts remaining unsettled at the end of the year are translated at year end rates.
The Company and some of its Indian subsidiaries have elected to account for exchange differences arising on reporting of long-term foreign currency monetary items in accordance with Companies (Accounting Standards) Amendment Rules, 2009 pertaining to Accounting Standard 11 (AS-11) notified by Government of India on 31st March, 2009 (as amended on 29th December, 2011). Accordingly, the effect of exchange differences on foreign currency loans of the Company is accounted by addition or deduction to the cost of the assets so far it relates to depreciable capital assets and in other cases by transfer to “Foreign Currency Monetary Item Translation Difference Account” to be amortised over the balance period of the long-term monetary items.
The differences in translation and settlement of FCT and forward exchange contracts used to hedge FCT [excluding the long-term foreign currency monetary items accounted in accordance with Companies (Accounting Standards) Amendment Rules 2009 on Accounting Standard 11 notified by Government of India on 31st March, 2009 as amended on 29th December, 2011] are recognised in the Statement of Profit and Loss. The outstanding derivative contracts at the balance sheet date other than forward exchange contracts used to hedge FCT are valued by marking them to market and losses, if any, are recognised in the Statement of Profit and Loss.
Exchange differences relating to monetary items that are in substance forming part of the Company’s net investment in non integral foreign operations are accumulated in Foreign Exchange Fluctuation Reserve Account.
Hedging instruments are initially measured at fair value, and are remeasured at subsequent reporting dates. Changes in the fair value of these derivatives that are designated and effective as hedges of future cash flows are recognised directly in shareholders’ funds and the ineffective portion is recognised immediately in the Statement of Profit and Loss.
Changes in the fair value of derivative financial instruments that do not qualify for hedge accounting are recognised in Statement of Profit and Loss as they arise.
Hedge accounting is discontinued when the hedging instrument expires or is sold, terminated, or exercised, or no longer qualifies for hedge accounting.
(i) Investments Long-term investments are carried at cost less provision for diminution other than temporary, if any, in value of such investments.
Current investments are carried at lower of cost and fair value. Stock-in-trade in case of one of the subsidiaries, being an investment company, has been valued at cost or at market quotation whichever is lower scrip wise.
(j) Inventories Finished and semi-finished products produced and purchased by the Company are carried at lower of cost and net realisable
value.

Hundred and sixth annual report 2012-13
184
3. ShARE CAPITAL[Item No. 1(a), Page 168] ` crores As at 31.03.2012Authorised: 1,75,00,00,000 Ordinary Shares of ` 10 each 1,750.00 1,750.00 (31.03.2012: 1,75,00,00,000 Ordinary Shares of ` 10 each) 35,00,00,000 “A” Ordinary Shares of ` 10 each 350.00 350.00 (31.03.2012: 35,00,00,000 “A” Ordinary Shares of ` 10 each) 2,50,00,000 Cumulative Redeemable Preference Shares of ` 100 each 250.00 250.00 (31.03.2012: 2,50,00,000 Shares of ` 100 each) 60,00,00,000 Cumulative Convertible Preference Shares of ` 100 each 6,000.00 6,000.00 (31.03.2012: 60,00,00,000 Shares of ` 100 each) 8,350.00 8,350.00Issued: 97,21,26,020 Ordinary Shares of ` 10 each 972.13 972.13 (31.03.2012: 97,21,26,020 Ordinary Shares of ` 10 each)Subscribed and Paid-up: 97,12,15,229 Ordinary Shares of ` 10 each fully paid up 971.21 971.21 (31.03.2012: 97,12,14,450 Ordinary Shares of ` 10 each) Add: Amount paid-up on 3,89,516 Ordinary Shares forfeited 0.20 0.20 (31.03.2012: 3,89,516 Ordinary Shares of ` 10 each) 971.41 971.41
Work-in-progress is carried at lower of cost and net realisable value. Coal, iron ore and other raw materials produced and purchased by the Company are carried at lower of cost and net realisable
value. Stores and spare parts are carried at cost. Necessary provision is made and expensed in case of identified obsolete and non-
moving items. Cost of inventories is generally ascertained on the ‘weighted average’ basis. Work-in-progress and finished and semi-finished
products are valued on full absorption cost basis.(k) Relining Expenses Relining expenses other than expenses on blast furnace relining are charged as an expense in the Statement of Profit and Loss
in the year in which they are incurred.(l) Research and development Research and development costs (other than cost of fixed assets acquired) are charged as an expense in the Statement of
Profit and Loss in the year in which they are incurred.(m) deferred tax Deferred tax is accounted for by computing the tax effect of timing differences which arise during the year and reverse in
subsequent periods.(n) tax on Income Tax on income is determined on the basis of taxable income and tax credits computed in accordance with the provisions of
applicable tax laws of the respective countries. Foreign Companies recognise tax liabilities and assets in accordance with the applicable local laws.

185
4. RESERvES AND SuRPLuS[Item No. 1(b), Page 168] ` crores As at 31.03.2012(a) Capital Reserve Balance as per last account 31.88 22.31 Equity accounting of associates 5.50 9.45 Share warrants expired during the year 11.86 – Received during the year 0.02 0.12 49.26 31.88 (b) Capital Redemption Reserve Balance as per last account 27.33 20.78 Amount transferred from Statement of Profit and Loss 9.86 6.55 37.19 27.33(c) Securities Premium Reserve Balance as per last account 18,876.40 18,210.42 Premium on issue of Ordinary Shares 0.02 – Discount/Premium on non-convertible debenture (990.44) – Expenses related to CARS/NCD/GDR/Hybrid Securities/ preferential and public issue of equity shares (7.99) (9.39) Premium on conversion of warrants – 700.80 Effect of change in cross holdings – (0.21) Exchange difference on redemption premium of CARS (41.01) (25.22) 17,836.98 18,876.40 (d) Debenture Redemption Reserve Balance as per last account 2,053.26 2,053.26 (e) Amalgamation Reserve Balance as per last account 0.43 0.43 (f) Export Profits Reserve Balance as per last account 1.25 1.25(g) Foreign Exchange Fluctuation Reserve Balance as per last account 14.00 14.00(h) Contributions for Capital Expenditure Balance as per last account 94.63 80.00 Received/capitalised during the year 23.85 16.97 Released to Statement of Profit and Loss (2.70) (2.34) 115.78 94.63(i) Contingency Reserve Balance as per last account 100.00 100.00(j) Debenture Forfeiture Reserve Balance as per last account 0.04 0.04(k) Capital Reserve on Consolidation Balance as per last account 17.71 19.30 Effect of changes in the Group's interest – (1.59) 17.71 17.71 (l) Investment Allowance/(utilised) Reserve Balance as per last account 0.23 0.23
(m) Foreign Currency Translation Reserve Balance as per last account 386.42 (4,658.80) Adjustment for translation of Non Integral Foreign Operations 1,184.36 5,045.22 1,570.78 386.42
Carried forward 21,796.91 21,603.58

Hundred and sixth annual report 2012-13
186
(n) Special Reserve Balance as per last account 99.79 88.02 Amount transferred from Statement of Profit and Loss 161.28 11.77 261.07 99.79 (o) Statutory Reserve Balance as per last account 179.52 179.52 Amount transferred from Statement of Profit and Loss 8.29 –
187.81 179.52
(p) Actuarial Gain/(Loss) Reserve Balance as per last account (5,906.04) (3,533.78) Actuarial loss (net of tax) recognised during the year (317.26) (2,372.26) (6,223.30) (5,906.04)(q) Cash Flow Hedge Reserve Balance as per last account 140.81 (224.53) Fair value changes recognised (net of tax) (115.69) 365.34 25.12 140.81
(r) General Reserve Balance as per last account 9,806.63 9,095.36 Effect of change in cross holdings – 30.76 Amount transferred from Statement of Profit and Loss 665.56 680.51 10,472.19 9,806.63(s) Foreign Currency Monetary Item Translation Difference Account(1)
Balance as per last account (404.90) – Exchange gain/(loss) during the year (459.62) (685.44) Amortisation during the year 506.17 280.54 (358.35) (404.90)
(t) Surplus in the Statement of Profit and Loss Balance as per last account 16,125.42 12,959.16 Profit/(Loss) for the year (7,057.62) 5,389.77 Distribution on Hybrid Perpetual Securities [net of tax of (179.84) (173.30) ` 86.37 crores (2011-12: ` 83.24 crores)] Dividend on Preference Shares (0.21) (0.21) Proposed dividend on Ordinary Shares (776.97) (1,165.46) Tax on dividend (226.41) (185.71) Transfers to Reserves General Reserve (665.56) (680.51) Special Reserve (161.28) (11.77) Capital Redemption Reserve (9.86) (6.55) Statutory Reserve (8.29) – 7,039.38 16,125.42
33,200.83 41,644.81
4. RESERvES AND SuRPLuS (continued)[Item No. 1(b), Page 168] ` crores As at 31.03.2012Brought forward 21,796.91 21,603.58
187
Additional information:(1) The Company and some of its Indian subsidiaries have elected to account for exchange differences arising on reporting of long-
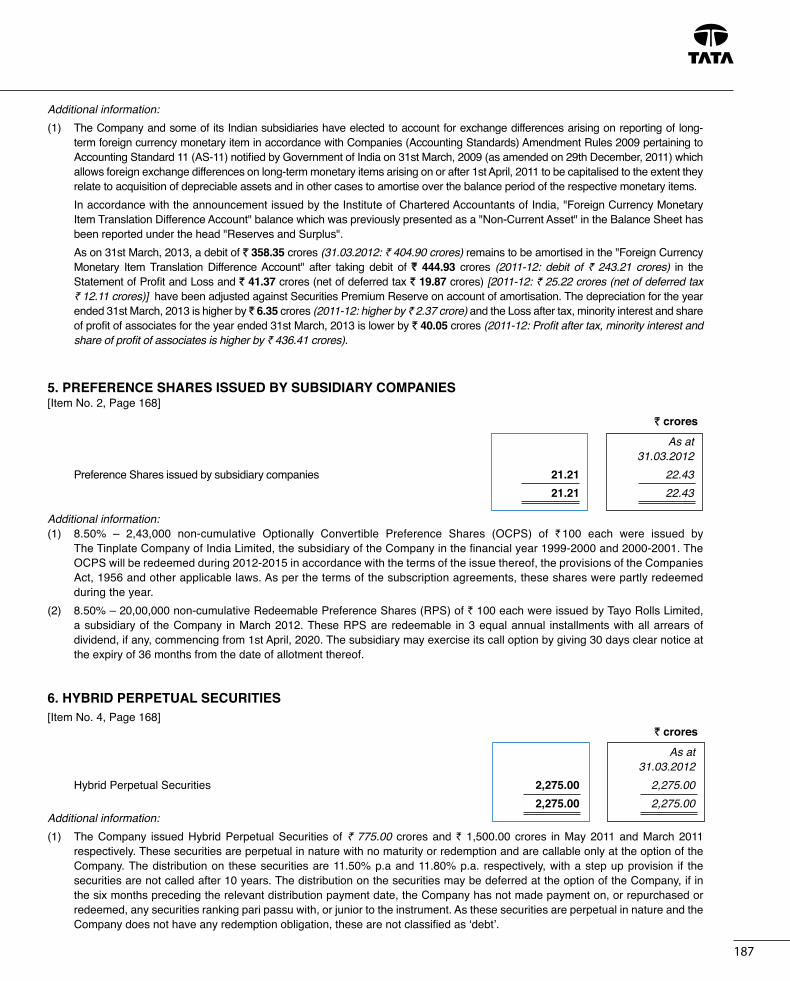
term foreign currency monetary item in accordance with Companies (Accounting Standards) Amendment Rules 2009 pertaining to Accounting Standard 11 (AS-11) notified by Government of India on 31st March, 2009 (as amended on 29th December, 2011) which allows foreign exchange differences on long-term monetary items arising on or after 1st April, 2011 to be capitalised to the extent they relate to acquisition of depreciable assets and in other cases to amortise over the balance period of the respective monetary items.
In accordance with the announcement issued by the Institute of Chartered Accountants of India, "Foreign Currency Monetary Item Translation Difference Account" balance which was previously presented as a "Non-Current Asset" in the Balance Sheet has been reported under the head "Reserves and Surplus".
As on 31st March, 2013, a debit of ` 358.35 crores (31.03.2012: ` 404.90 crores) remains to be amortised in the "Foreign Currency Monetary Item Translation Difference Account" after taking debit of ` 444.93 crores (2011-12: debit of ` 243.21 crores) in the Statement of Profit and Loss and ` 41.37 crores (net of deferred tax ` 19.87 crores) [2011-12: ` 25.22 crores (net of deferred tax ` 12.11 crores)] have been adjusted against Securities Premium Reserve on account of amortisation. The depreciation for the year ended 31st March, 2013 is higher by ̀ 6.35 crores (2011-12: higher by ̀ 2.37 crore) and the Loss after tax, minority interest and share of profit of associates for the year ended 31st March, 2013 is lower by ` 40.05 crores (2011-12: Profit after tax, minority interest and share of profit of associates is higher by ` 436.41 crores).
5. PREFERENCE ShARES ISSuED by SubSIDIARy COMPANIES[Item No. 2, Page 168] ` crores As at 31.03.2012 Preference Shares issued by subsidiary companies 21.21 22.43 21.21 22.43
Additional information:(1) 8.50% – 2,43,000 non-cumulative Optionally Convertible Preference Shares (OCPS) of ` 100 each were issued by
The Tinplate Company of India Limited, the subsidiary of the Company in the financial year 1999-2000 and 2000-2001. The OCPS will be redeemed during 2012-2015 in accordance with the terms of the issue thereof, the provisions of the Companies Act, 1956 and other applicable laws. As per the terms of the subscription agreements, these shares were partly redeemed during the year.
(2) 8.50% – 20,00,000 non-cumulative Redeemable Preference Shares (RPS) of ` 100 each were issued by Tayo Rolls Limited, a subsidiary of the Company in March 2012. These RPS are redeemable in 3 equal annual installments with all arrears of dividend, if any, commencing from 1st April, 2020. The subsidiary may exercise its call option by giving 30 days clear notice at the expiry of 36 months from the date of allotment thereof.
6. hybRID PERPETuAL SECuRITIES[Item No. 4, Page 168] ` crores As at 31.03.2012 Hybrid Perpetual Securities 2,275.00 2,275.00 2,275.00 2,275.00Additional information:(1) The Company issued Hybrid Perpetual Securities of ` 775.00 crores and ` 1,500.00 crores in May 2011 and March 2011
respectively. These securities are perpetual in nature with no maturity or redemption and are callable only at the option of the Company. The distribution on these securities are 11.50% p.a and 11.80% p.a. respectively, with a step up provision if the securities are not called after 10 years. The distribution on the securities may be deferred at the option of the Company, if in the six months preceding the relevant distribution payment date, the Company has not made payment on, or repurchased or redeemed, any securities ranking pari passu with, or junior to the instrument. As these securities are perpetual in nature and the Company does not have any redemption obligation, these are not classified as ‘debt’.

Hundred and sixth annual report 2012-13
188
7. BORROWINGS[Item No. 6(a) and 7(a), Page 168] ` crores As at 31.03.2012 Long- Short- Long- Short- Term Term Total Term Term Total A. Secured borrowings (a) Bonds/Debentures (i) Non-convertible bonds/debentures 250.00 – 250.00 268.00 – 268.00 (b) Term loans (i) From banks 21,706.26 11.63 21,717.89 22,311.08 38.16 22,349.24 (ii) From financial institutions and others(1) 2,079.04 – 2,079.04 1,928.80 – 1,928.80 (c) Repayable on demand (i) From banks – 352.94 352.94 – 336.18 336.18 (d) Finance lease obligations 298.37 – 298.37 321.64 – 321.64 (e) Other loans 3.57 – 3.57 3.88 – 3.88
24,337.24 364.57 24,701.81 24,833.40 374.34 25,207.74
b. unsecured borrowings (a) Bonds/Debentures (i) Non-convertible bonds/debentures 11,442.87 – 11,442.87 7,328.40 – 7,328.40 (ii) 4.5% Foreign Currency Convertible Bonds 2,969.04 – 2,969.04 2,782.81 – 2,782.81 (b) Term loans (i) From banks 6,460.66 5,850.38 12,311.04 8,657.29 4,246.25 12,903.54 (ii) From financial institutions and others 854.36 1,718.81 2,573.17 856.56 – 856.56 (c) Deferred payment liabilities – – – 3.80 – 3.80 (d) Fixed deposits 1.00 – 1.00 1.91 – 1.91 (e) Finance lease obligations 476.78 – 476.78 545.41 – 545.41 (f) Other loans 315.67 180.80 496.47 228.66 78.49 307.15
22,520.38 7,749.99 30,270.37 20,404.84 4,324.74 24,729.58
46,857.62 8,114.56 54,972.18 45,238.24 4,699.08 49,937.32
Additional information:(1) Includes loan from Joint Plant Committee – Steel Development Fund of ` 2,036.02 crores (31.03.2012: ` 1,915.47 crores) which also
includes funded interest ` 406.45 crores (31.03.2012: ` 316.13 crores).

189
8. DEFERRED TAx LIAbILITIES/(ASSETS)[Item No. 6(b) and 8(d), Page 168] ` crores As at 31.03.2012 deferred tax liabilities (a) Differences in depreciation and amortisation for accounting and income tax purposes 4,210.54 3,262.75 (b) Prepaid expenses 64.30 77.62 (c) Actuarial gain/(loss) 429.65 308.19 (d) Others 707.31 1,316.80
5,411.80 4,965.36 deferred tax assets (a) unabsorbed losses (518.16) (1,324.45) (b) Employee separation compensation (381.68) (399.45) (c) Provision for doubtful debts and advances (80.91) (47.88) (d) Disallowance under Section 43B of Income Tax Act, 1961 (247.54) (184.78) (e) Provision for employee benefits (389.45) (247.84) (f) Redemption premium on CARS – (141.12) (g) Redemption premium on issue of non-convertible debenture (392.79) – (h) Discount on issue of non-convertible debenture (69.29) – (i) Other provisions (213.49) (177.43) (2,293.31) (2,522.95) Deferred tax liabilities/(assets) 3,118.49 2,442.41
Amount recognised in balance Sheet Deferred tax liabilities [Item No. 6(b), Page 168] 3,154.98 2,503.85 Deferred tax assets [Item No. 8(d), Page 168] (36.49) (61.44) 3,118.49 2,442.41
9. OThER LONg-TERM LIAbILITIES[Item No. 6(c), Page 168] ` crores As at 31.03.2012
(a) Creditors for capital supplies/services 387.97 228.98 (b) Deferred income 162.22 181.33 (c) Creditors for other liabilities 570.33 479.55 1,120.52 889.86

Hundred and sixth annual report 2012-13
190
10. PROvISIONS[Item No. 6(d) and 7(d), Page 168] ` crores As at 31.03.2012 Long- Short- Long- Short- Term Term Total Term Term Total (a) Provision for employee benefits 3,437.93 179.38 3,617.31 2,855.67 184.32 3,039.99 (b) Provision for employee separation compensation (1) 547.78 156.78 704.56 603.03 169.65 772.68 (c) Provision for taxation – 1,129.06 1,129.06 – 1,319.81 1,319.81 (d) Provision for fringe benefits tax – 5.03 5.03 – 7.84 7.84 (e) Proposed dividend – 777.18 777.18 – 1,165.67 1,165.67 (f) Other provisions 1,370.73 695.86 2,066.59 1,256.35 628.90 1,885.25 5,356.44 2,943.29 8,299.73 4,715.05 3,476.19 8,191.24
Additional information:(1) Provision for employee separation compensation has been calculated on the basis of net present value of the future monthly
payments of pension and lump sum benefits under the scheme including ` 23.68 crores (2011-12: ` 18.23 crores) in respect of schemes introduced during the year.
11. TRADE PAyAbLES[Item No. 7(b), Page 168] ` crores As at 31.03.2012 (a) Creditors for supplies/services 16,448.83 15,411.04 (b) Creditors for accrued wages and salaries 3,328.58 2,908.91 (c) Acceptances 2,001.43 2,208.60 21,778.84 20,528.55
12. OThER CuRRENT LIAbILITIES[Item No. 7(c), Page 168] ` crores As at 31.03.2012 (a) Current maturities of long-term borrowings 11,000.89 9,859.55 (b) Current maturities of finance lease obligations 101.25 99.90 (c) Interest accrued but not due on borrowings 694.51 703.63 (d) unpaid dividend 66.54 58.22 (e) Advances received from customers 556.43 511.91 (f) Creditors for capital supplies/services 3,864.92 3,449.41 (g) Creditors for other liabilities 3,157.82 4,096.39 19,442.36 18,779.01

191
13. TANgIbLE ASSETS[Item No. 8(a)(i), Page 168] ` crores
Tangible Assets Freehold Leasehold Buildings(3) Leasehold Plant and Leased Furniture Office Vehicles Leased Railway Total Land Land Buildings Machinery Plant and and Fixtures Equipments FFOE and Sidings/ and Roads Machinery Vehicles Lines
Gross block as at 01.04.2012 1,590.08 903.25 10,380.91 610.78 91,156.41 1,601.76 878.36 303.56 271.57 9.90 1,013.20 1,08,719.78 1,418.55 315.49 8,741.29 508.11 80,360.53 1,509.40 1,062.50 229.52 259.29 3.31 651.69 95,059.68 Assets of new companies 1.22 0.43 36.51 – 310.38 – 2.58 0.35 3.10 0.18 3.64 358.39 0.90 – 132.09 – 645.15 6.21 1.51 2.16 2.31 – 0.37 790.70
Additions during the year (1) 98.28 1.20 1,967.51 3.82 18,988.63 6.91 22.12 41.38 52.64 0.07 208.38 21,390.94 98.02 572.57 819.26 32.97 4,345.69 23.18 (7.97) 64.09 22.15 7.85 326.58 6,304.39
Deductions during the year (2) (0.72) (0.02) (32.08) (6.18) (1,496.16) (11.00) (15.01) (13.26) (17.96) (0.35) (0.47) (1,593.21) (9.03) – (21.55) (0.07) (730.12) (109.95) (244.10) (7.33) (13.72) (1.40) (3.33) (1,140.60)
Disposal of group undertakings (120.44) (8.92) (87.74) (31.39) (411.61) – (13.94) (6.60) (3.61) – – (684.25) (8.08) (4.68) (83.66) – (351.44) – (9.50) (0.30) (4.83) – (2.47) (464.96) Exchange fluctuations capitalised – – 0.88 – 81.38 – – – – – – 82.26during the year – – 2.22 – 40.95 – – – – – – 43.17
Exchange difference on 43.11 5.24 194.83 21.81 1,146.02 21.52 22.47 9.98 2.18 0.04 9.17 1,476.37consolidation 89.72 19.87 791.26 69.77 6,845.65 172.92 75.92 15.42 6.37 0.14 40.36 8,127.40
Gross block as at 31.03.2013 1,611.53 901.18 12,460.82 598.84 1,09,775.05 1,619.19 896.58 335.41 307.92 9.84 1,233.92 1,29,750.28 1,590.08 903.25 10,380.91 610.78 91,156.41 1,601.76 878.36 303.56 271.57 9.90 1,013.20 1,08,719.78
Impairment as at 01.04.2012 206.69 0.59 68.23 25.10 3,143.10 86.33 – – – – – 3,530.04 194.33 0.52 60.40 14.73 2,753.62 75.96 – – – – – 3,099.56
Impairment during the year 4.01 – 224.73 7.27 3,292.95 – – – – – 1.05 3,530.01 6.90 – 0.14 7.88 24.44 – – – – – – 39.36
Reversal during the year – – – – – – – – – – – – (1.66) – – – – – – – – – – (1.66)
Deduction on disposals(1) (2.33) – – – (30.03) – – – – – – (32.36) – – – – (8.54) – – – – – – (8.54)Disposal of group undertaking (7.24) – (0.15) – (3.69) – – – – – – (11.08) – – – – – – – – – – – –Exchange difference on 1.65 0.01 9.79 (0.07) (58.38) 0.75 – – – – – (46.25)consolidation 7.12 0.07 7.69 2.49 373.58 10.37 – – – – – 401.32
Impairment as at 31.03.2013 202.78 0.60 302.60 32.30 6,343.95 87.08 – – – – 1.05 6,970.36 206.69 0.59 68.23 25.10 3,143.10 86.33 – – – – – 3,530.04
Accumulated depreciation 233.69 91.96 6,161.13 299.44 56,670.90 982.67 804.37 191.22 142.85 2.10 528.48 66,108.81as at 01.04.2012 210.84 62.84 5,291.68 231.50 48,753.12 902.37 977.32 152.66 129.51 3.03 467.12 57,181.99
Depreciation of new companies – 0.13 9.79 – 172.10 – 2.31 0.14 1.58 0.18 3.64 189.87 – – 36.86 – 284.94 0.57 1.06 1.65 1.34 – 0.36 326.78
Depreciation during the year 14.13 25.21 368.70 31.06 4,571.71 88.09 30.10 46.85 26.51 0.66 41.34 5,244.36 12.70 22.08 301.35 29.15 3,727.98 94.56 25.93 36.05 22.60 0.33 31.48 4,304.21
Depreciation on assets written off during the year (1) (0.68) – (27.38) (3.44) (1,124.57) (11.06) (14.42) (12.50) (16.29) (0.30) (0.40) (1,211.04) (8.71) – (17.50) – (585.06) (116.00) (261.86) (7.06) (11.55) (1.38) (3.32) (1,012.44)
Disposal of group undertakings (66.27) (2.55) (68.24) (18.87) (314.74) – (12.60) (5.43) (3.04) – – (491.74) – (0.49) (16.49) – (204.60) – (6.68) (0.18) (2.92) – (0.97) (232.33)Exchange difference on 9.51 2.57 119.71 11.41 771.69 11.95 20.28 5.77 1.48 0.04 7.71 962.12consolidation 18.86 7.53 565.23 38.79 4,694.52 101.17 68.60 8.10 3.87 0.12 33.81 5,540.60
Accumulated depreciation 190.38 117.32 6,563.71 319.60 60,747.09 1,071.65 830.04 226.05 153.09 2.68 580.77 70,802.38as at 31.03.2013 233.69 91.96 6,161.13 299.44 56,670.90 982.67 804.37 191.22 142.85 2.10 528.48 66,108.81
Total accumulated depreciation 393.16 117.92 6,866.31 351.90 67,091.04 1,158.73 830.04 226.05 153.09 2.68 581.82 77,772.74and impairment as at 31.03.2013 440.38 92.55 6,229.36 324.54 59,814.00 1,069.00 804.37 191.22 142.85 2.10 528.48 69,638.85
Net book value as at 31.03.2013 1,218.37 783.26 5,594.51 246.94 42,684.01 460.46 66.54 109.36 154.83 7.16 652.10 51,977.54 1,149.70 810.70 4,151.55 286.24 31,342.41 532.76 73.99 112.34 128.72 7.80 484.72 39,080.93
Additional information:(1) Additions, deduction on disposals and depreciation on assets written off during the year includes adjustments for inter se transfers.(2) Deductions include cost of assets scrapped/surrendered during the year.(3) Buildings include ` 2.32 crores (31.03.2012: ` 2.32 crores) being cost of shares in Co-operative Housing Societies and Limited Companies.(4) Rupee liability has increased by a net amount of ` 82.26 crores (2011-12: ` 43.17 crores) arising out of realignment of the value of long-term foreign currency loans
for procurement of tangible assets. This increase has been adjusted in the carrying cost of respective tangible assets and has been depreciated over their remaining depreciable life. The depreciation for the current year has increased by ` 3.72 crores (2011-12: ` 2.28 crores) arising on account of this adjustment.
Hundred and sixth annual report 2012-13
192
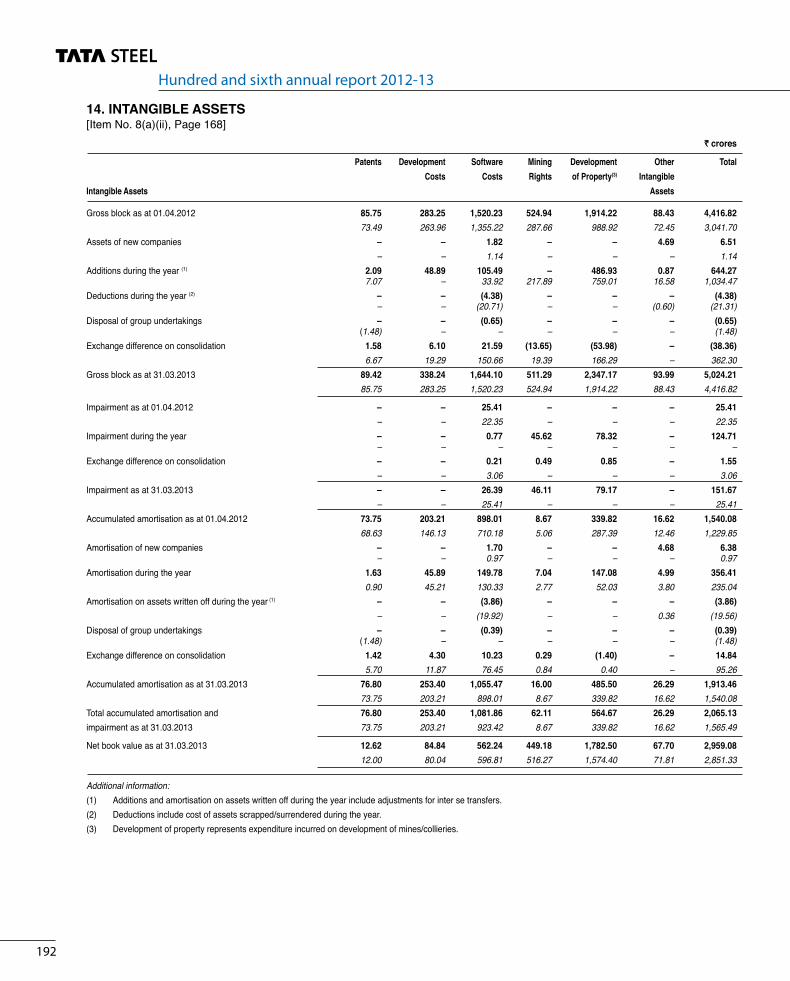
14. INTANgIbLE ASSETS[Item No. 8(a)(ii), Page 168] ` crores
Patents development Software Mining development Other total Costs Costs Rights of Property(3) IntangibleIntangible Assets Assets
Gross block as at 01.04.2012 85.75 283.25 1,520.23 524.94 1,914.22 88.43 4,416.82 73.49 263.96 1,355.22 287.66 988.92 72.45 3,041.70Assets of new companies – – 1.82 – – 4.69 6.51 – – 1.14 – – – 1.14Additions during the year (1) 2.09 48.89 105.49 – 486.93 0.87 644.27 7.07 – 33.92 217.89 759.01 16.58 1,034.47 Deductions during the year (2) – – (4.38) – – – (4.38) – – (20.71) – – (0.60) (21.31)Disposal of group undertakings – – (0.65) – – – (0.65) (1.48) – – – – – (1.48)Exchange difference on consolidation 1.58 6.10 21.59 (13.65) (53.98) – (38.36) 6.67 19.29 150.66 19.39 166.29 – 362.30Gross block as at 31.03.2013 89.42 338.24 1,644.10 511.29 2,347.17 93.99 5,024.21 85.75 283.25 1,520.23 524.94 1,914.22 88.43 4,416.82
Impairment as at 01.04.2012 – – 25.41 – – – 25.41 – – 22.35 – – – 22.35 Impairment during the year – – 0.77 45.62 78.32 – 124.71 – – – – – – –Exchange difference on consolidation – – 0.21 0.49 0.85 – 1.55 – – 3.06 – – – 3.06 Impairment as at 31.03.2013 – – 26.39 46.11 79.17 – 151.67 – – 25.41 – – – 25.41 Accumulated amortisation as at 01.04.2012 73.75 203.21 898.01 8.67 339.82 16.62 1,540.08 68.63 146.13 710.18 5.06 287.39 12.46 1,229.85 Amortisation of new companies – – 1.70 – – 4.68 6.38 – – 0.97 – – – 0.97Amortisation during the year 1.63 45.89 149.78 7.04 147.08 4.99 356.41 0.90 45.21 130.33 2.77 52.03 3.80 235.04Amortisation on assets written off during the year (1) – – (3.86) – – – (3.86) – – (19.92) – – 0.36 (19.56)Disposal of group undertakings – – (0.39) – – – (0.39) (1.48) – – – – – (1.48)Exchange difference on consolidation 1.42 4.30 10.23 0.29 (1.40) – 14.84 5.70 11.87 76.45 0.84 0.40 – 95.26 Accumulated amortisation as at 31.03.2013 76.80 253.40 1,055.47 16.00 485.50 26.29 1,913.46 73.75 203.21 898.01 8.67 339.82 16.62 1,540.08Total accumulated amortisation and 76.80 253.40 1,081.86 62.11 564.67 26.29 2,065.13impairment as at 31.03.2013 73.75 203.21 923.42 8.67 339.82 16.62 1,565.49
Net book value as at 31.03.2013 12.62 84.84 562.24 449.18 1,782.50 67.70 2,959.08 12.00 80.04 596.81 516.27 1,574.40 71.81 2,851.33
Additional information:(1) Additions and amortisation on assets written off during the year include adjustments for inter se transfers.(2) Deductions include cost of assets scrapped/surrendered during the year.(3) Development of property represents expenditure incurred on development of mines/collieries.

193
15. INvESTMENTS[Item No. 8(c) and 9(a), Page 168] ` crores As at 31.03.2012 Non-current Current Total Non-current Current Total (a) Investments in equity instruments 1,969.55 1.40 1,970.95 2,073.64 1.42 2,075.06 (b) Investments in government or trust securities 0.02 – 0.02 0.02 – 0.02 (c) Investments in debentures and bonds 378.39 – 378.39 395.93 – 395.93 (d) Investments in partnership firms 17.27 – 17.27 16.36 – 16.36 (e) Investment properties 130.13 – 130.13 128.18 – 128.18 (f) Investments in mutual funds 2.01 758.89 760.90 8.75 1,396.95 1,405.70 2,497.37 760.29 3,257.66 2,622.88 1,398.37 4,021.25
Additional information: ` crores As at 31.03.2012 Non-current Current Total Non-current Current Total (1) Aggregate amount of quoted investments 1,401.20 12.14 1,413.34 1,520.73 4.96 1,525.69 (2) Aggregate amount of unquoted investments 966.04 748.15 1,714.19 973.97 1,393.41 2,367.38 2,367.24 760.29 3,127.53 2,494.70 1,398.37 3,893.07 (3) Equity accounted associates (i) Cost of investment 654.99 658.50 [including ` 117.90 crores (31.03.2012: ` 123.34 crores) of goodwill (net of capital reserve) arising on consolidation] (ii) Share of post acquisition profit (net of losses) 258.24 520.19 913.23 1,178.69
` crores Name of the Company Original Goodwill/ Accumulated Carrying cost of (Capital profit/(loss) amount of investment Reserve) as at investments (a) (a) 31.03.2013 as at 31.03.2013 (a) (b) (a) (b)
(4) Details of equity accounted associates are as follows:
Combulex B.V. 10.58 – (2.04) 8.54 10.49 – 1.50 11.99
Cv Gasexpansie Ijmond 0.25 – 0.07 0.32 0.25 – 0.06 0.31
European Profiles (M) Sdn. Bhd. 7.12 – 0.46 7.58 7.06 – (0.21) 6.85
Gietwalsonderhoudcombinatie B.V. 9.31 – 8.07 17.38 9.23 – 8.38 17.61Hoogovens Court Roll Service Technologies Vof: 9.50 – 6.39 15.89 9.42 – 7.08 16.50

Hundred and sixth annual report 2012-13
194
Industrial Energy Ltd. 86.58 – 47.28 133.86 86.58 – 29.22 115.80 Jamipol Ltd. 10.40 0.32 20.56 30.96 5.29 0.32 17.08 22.37 Nicco Jubilee Park Limited (` 1/-) 0.38 – (0.38) – 0.38 – (0.38) – New Millennium Iron Corp. 355.45 115.63 8.00 363.45 333.15 109.65 19.88 353.03 Rujuvalika Investments Ltd. 3.25 (0.29) 5.08 8.33 3.25 (0.29) 4.00 7.25 Shanghai Bao yi Beverage Can Making Co. Ltd.* – – – – 12.30 – 0.02 12.32 SteelAsia Manufacturing Corporation – – 125.70 125.70 – – 123.34 123.34 Strategic Energy Technology Systems Private Limited 24.71 – (23.04) 1.67 23.41 – (20.22) 3.19Tata Sponge Iron Limited ▲ – – – – 20.74 11.42 240.07 260.81 TkM Overseas Ltd. 1.13 – (1.13) – 1.13 – (1.13) – TRF Ltd. 5.82 1.43 41.35 47.17 5.82 1.43 53.00 58.82 TRL krosaki Refractories Ltd. 70.24 0.81 1.37 71.61 70.24 0.81 2.20 72.44 Wupperman Staal Nederland B.V. 60.27 – 20.50 80.77 59.76 – 36.30 96.06 654.99 117.90 258.24 913.23 658.50 123.34 520.19 1,178.69
(a) Includes impact of exchange rate changes on translation.(b) Includes other adjustments to carrying value accounted through reserves.* Part of the year.▲ Earlier an associate, became a subsidiary during the year. Carrying value of investment on the date of becoming a subsidiary
` 276.95 crores.
` crores Name of the Company Original Goodwill/ Accumulated Carrying cost of (Capital profit/(loss) amount of investment Reserve) as at investments (a) (a) 31.03.2013 as at 31.03.2013 (a) (b) (a) (b)
195
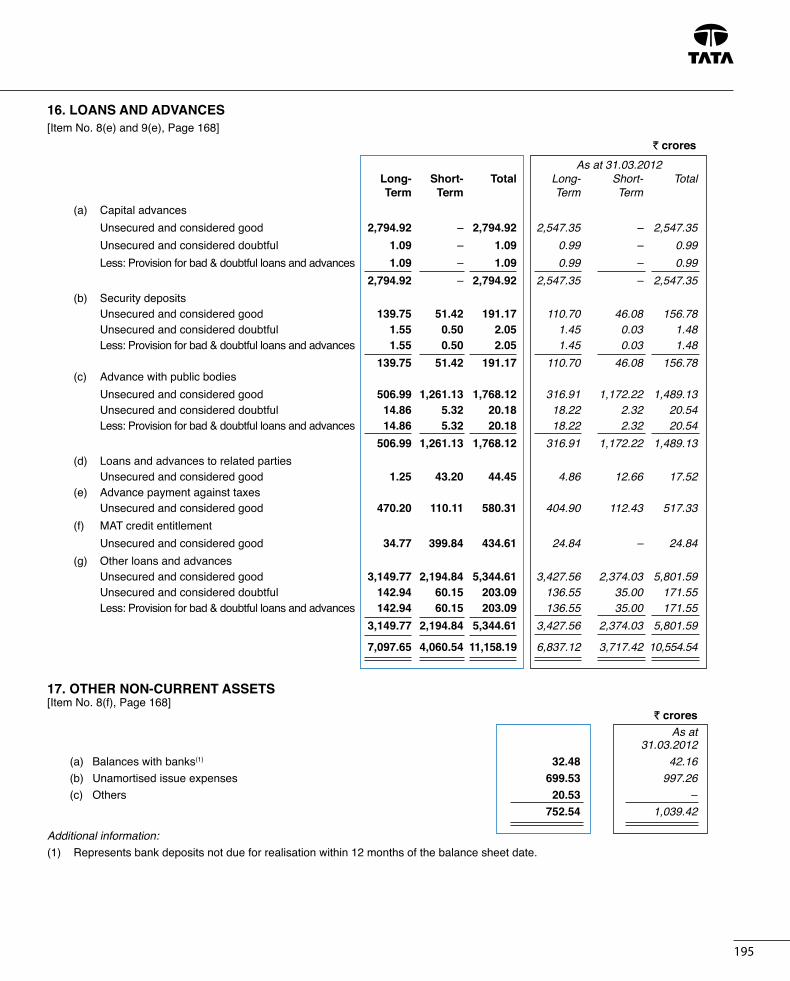
16. LOANS AND ADvANCES[Item No. 8(e) and 9(e), Page 168] ` crores As at 31.03.2012 Long- Short- Total Long- Short- Total Term Term Term Term (a) Capital advances unsecured and considered good 2,794.92 – 2,794.92 2,547.35 – 2,547.35 unsecured and considered doubtful 1.09 – 1.09 0.99 – 0.99 Less: Provision for bad & doubtful loans and advances 1.09 – 1.09 0.99 – 0.99 2,794.92 – 2,794.92 2,547.35 – 2,547.35 (b) Security deposits unsecured and considered good 139.75 51.42 191.17 110.70 46.08 156.78 unsecured and considered doubtful 1.55 0.50 2.05 1.45 0.03 1.48 Less: Provision for bad & doubtful loans and advances 1.55 0.50 2.05 1.45 0.03 1.48 139.75 51.42 191.17 110.70 46.08 156.78 (c) Advance with public bodies unsecured and considered good 506.99 1,261.13 1,768.12 316.91 1,172.22 1,489.13 unsecured and considered doubtful 14.86 5.32 20.18 18.22 2.32 20.54 Less: Provision for bad & doubtful loans and advances 14.86 5.32 20.18 18.22 2.32 20.54 506.99 1,261.13 1,768.12 316.91 1,172.22 1,489.13 (d) Loans and advances to related parties unsecured and considered good 1.25 43.20 44.45 4.86 12.66 17.52 (e) Advance payment against taxes unsecured and considered good 470.20 110.11 580.31 404.90 112.43 517.33 (f) MAT credit entitlement unsecured and considered good 34.77 399.84 434.61 24.84 – 24.84 (g) Other loans and advances unsecured and considered good 3,149.77 2,194.84 5,344.61 3,427.56 2,374.03 5,801.59 unsecured and considered doubtful 142.94 60.15 203.09 136.55 35.00 171.55 Less: Provision for bad & doubtful loans and advances 142.94 60.15 203.09 136.55 35.00 171.55 3,149.77 2,194.84 5,344.61 3,427.56 2,374.03 5,801.59
7,097.65 4,060.54 11,158.19 6,837.12 3,717.42 10,554.54
17. OThER NON-CuRRENT ASSETS[Item No. 8(f), Page 168] ` crores As at 31.03.2012 (a) Balances with banks(1) 32.48 42.16 (b) unamortised issue expenses 699.53 997.26 (c) Others 20.53 – 752.54 1,039.42
Additional information:(1) Represents bank deposits not due for realisation within 12 months of the balance sheet date.

Hundred and sixth annual report 2012-13
196
18. INvENTORIES(At lower of cost and net realisable value)[Item No. 9(b), Page 168] ` crores As at 31.03.2012 (a) Raw materials 7,889.40 8,995.63 (b) Work-in-progress 4,945.84 5,679.12 (c) Finished and semi-finished goods 7,999.17 8,262.84 (d) Stock-in-trade of goods acquired for trading 292.13 394.32 (e) Stores and spares 2,964.65 2,266.09 24,091.19 25,598.00 Included above, goods-in-transit: (i) Raw materials 1,269.40 1,092.71 (ii) Finished and semi-finished goods 180.60 167.15 (iii) Stores and spares 122.41 113.73 1,572.41 1,373.59
19. TRADE RECEIvAbLES[Item No. 9(c), Page 168] ` crores As at 31.03.2012 (a) More than six months 614.73 684.05 (b) Others 13,747.02 14,778.72 14,361.75 15,462.77 Less: Provision for bad and doubtful debts (i) More than six months 346.54 584.29 (ii) Others 21.25 – 13,993.96 14,878.48
unsecured and considered good 13,993.96 14,878.48 Doubtful 367.79 584.29 14,361.75 15,462.77
20. CASh AND bANK bALANCES[Item No. 9(d), Page 168] ` crores As at 31.03.2012 (a) Cash in hand 1.26 1.22 (b) Cheques, drafts on hand 154.08 28.19 (c) Remittances in-transit 235.02 14.83 (d) Balances with banks 9,304.49 10,612.90 total cash and cash equivalents 9,694.85 10,657.14 (e) Earmarked balances with banks 164.82 141.67 9,859.67 10,798.81

197
21. OThER CuRRENT ASSETS[Item No. 9(f), Page 168] ` crores As at 31.03.2012 (a) Interest accrued on investments 5.68 4.71 (b) Interest accrued on deposits, loans and advances 16.84 26.24 (c) Others 1,455.98 386.30 1,478.50 417.25
22. REvENuE FROM OPERATIONS[Item No. 1(a), Page 169] ` crores Previous Year (a) Sale of products 1,35,083.47 1,33,024.72 (b) Sale of power and water 1,010.21 1,127.23 (c) Income from town, medical and other services 1,432.52 1,181.27 (d) Other operating income 1,294.94 642.34 1,38,821.14 1,35,975.56
23. OThER INCOME[Item No. 1(b), Page 169] ` crores Previous Year (a) Dividend income (i) Non-current investments 95.24 90.89 (ii) Current investments 14.82 10.36 (b) Interest income 203.87 455.27 (c) Net gain/(loss) on sale of (i) Other non-current investments 1.49 6.52 (ii) Current investments 232.70 432.47 (d) Profit on sale of capital assets (net of loss on assets sold/written off) 74.52 (7.41) (e) Gain/(Loss) on cancellation of forwards, swaps and options (net) (143.49) (43.06) (f) Other miscellaneous income – 627.99 479.15 1,573.03
24. EMPLOyEE bENEFITS ExPENSE[Item No. 2(d), Page 169] ` crores Previous Year (a) Salaries and wages, including bonus 15,600.23 14,453.38 (b) Contribution to provident and other funds 2,757.07 2,372.44 (c) Staff welfare expenses 560.95 402.82 18,918.25 17,228.64

Hundred and sixth annual report 2012-13
198
25. DEPRECIATION AND AMORTISATION ExPENSE[Item No. 2(e), Page 169] ` crores Previous Year
(a) Depreciation on tangible assets 5,244.36 4,304.21 (b) Amortisation of intangible assets 356.41 235.04 5,600.77 4,539.25 Less: Amount released from specific grants 25.45 22.60 5,575.32 4,516.65
26. FINANCE COSTS[Item No. 2(f), Page 169] ` crores Previous Year (a) Interest expense (i) Debentures/bonds and fixed loans 3,513.54 3,975.10 (ii) Others 229.21 181.35 (b) Finance charges on finance leases 65.66 64.37 (c) Other borrowing costs 391.51 365.51 4,199.92 4,586.33 Less: Interest capitalised 231.81 336.22 3,968.11 4,250.11
27. OThER ExPENSES[Item No. 2(g), Page 169] ` crores Previous Year (a) Consumption of stores and spares 9,837.98 8,024.05 (b) Repairs to buildings 512.38 486.03 (c) Repairs to machinery 5,152.01 5,244.06 (d) Relining expenses 130.89 116.44 (e) Fuel oil consumed 990.37 1,020.03 (f) Purchase of power 5,554.01 4,915.45 (g) Conversion charges 1,930.92 1,168.36 (h) Freight and handling charges 7,434.27 6,659.54 (i) Rent 3,386.36 3,377.08 (j) Royalty 1,198.86 927.74 (k) Rates and taxes 980.03 830.11 (l) Insurance 332.36 248.73 (m) Commission, discounts and rebates 271.17 257.12 (n) Provision for wealth tax 2.19 1.80 (o) Provision for doubtful debts and advances 115.60 81.63 (p) Excise duty 142.10 94.70 (q) Others(1) 6,281.32 4,913.99
44,252.82 38,366.86
Additional information:(1) Includes provision for impairment losses on fixed assets ` 253.16 crores (2011-12: ` 104.95 crores).
199
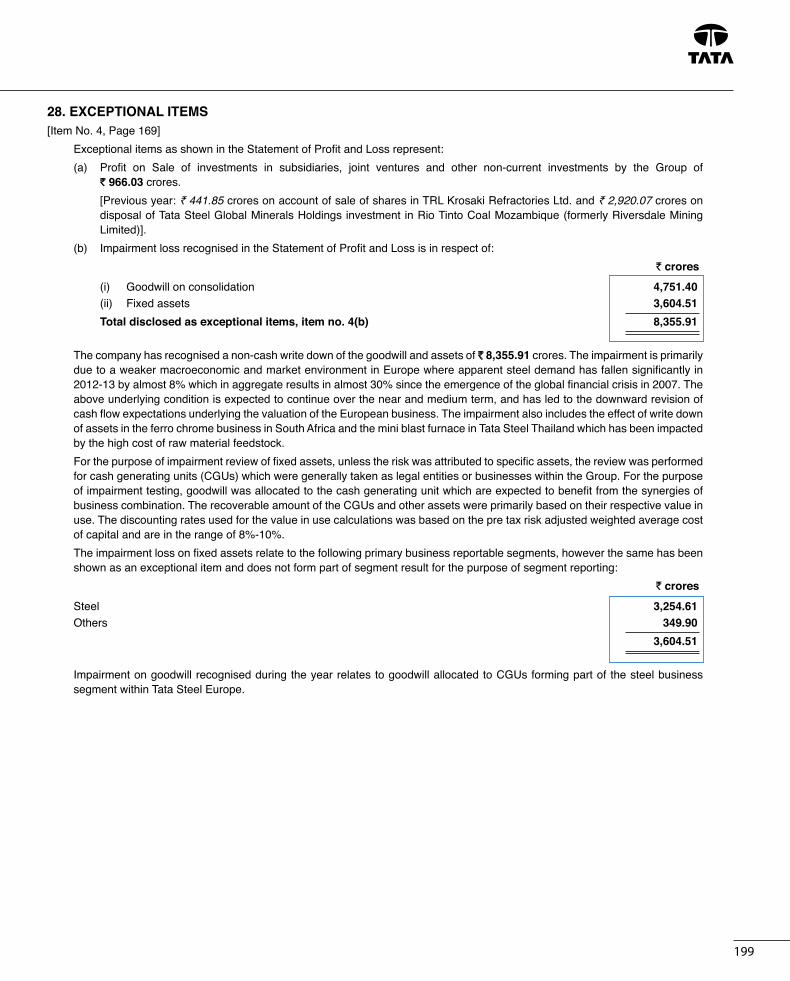
28. ExCEPTIONAL ITEMS[Item No. 4, Page 169] Exceptional items as shown in the Statement of Profit and Loss represent: (a) Profit on Sale of investments in subsidiaries, joint ventures and other non-current investments by the Group of
` 966.03 crores. [Previous year: ` 441.85 crores on account of sale of shares in TRL krosaki Refractories Ltd. and ` 2,920.07 crores on
disposal of Tata Steel Global Minerals Holdings investment in Rio Tinto Coal Mozambique (formerly Riversdale Mining Limited)].
(b) Impairment loss recognised in the Statement of Profit and Loss is in respect of: ` crores (i) Goodwill on consolidation 4,751.40 (ii) Fixed assets 3,604.51 total disclosed as exceptional items, item no. 4(b) 8,355.91
The company has recognised a non-cash write down of the goodwill and assets of ̀ 8,355.91 crores. The impairment is primarily due to a weaker macroeconomic and market environment in Europe where apparent steel demand has fallen significantly in 2012-13 by almost 8% which in aggregate results in almost 30% since the emergence of the global financial crisis in 2007. The above underlying condition is expected to continue over the near and medium term, and has led to the downward revision of cash flow expectations underlying the valuation of the European business. The impairment also includes the effect of write down of assets in the ferro chrome business in South Africa and the mini blast furnace in Tata Steel Thailand which has been impacted by the high cost of raw material feedstock.
For the purpose of impairment review of fixed assets, unless the risk was attributed to specific assets, the review was performed for cash generating units (CGus) which were generally taken as legal entities or businesses within the Group. For the purpose of impairment testing, goodwill was allocated to the cash generating unit which are expected to benefit from the synergies of business combination. The recoverable amount of the CGus and other assets were primarily based on their respective value in use. The discounting rates used for the value in use calculations was based on the pre tax risk adjusted weighted average cost of capital and are in the range of 8%-10%.
The impairment loss on fixed assets relate to the following primary business reportable segments, however the same has been shown as an exceptional item and does not form part of segment result for the purpose of segment reporting:
` crores Steel 3,254.61 Others 349.90 3,604.51
Impairment on goodwill recognised during the year relates to goodwill allocated to CGus forming part of the steel business segment within Tata Steel Europe.
Hundred and sixth annual report 2012-13
200
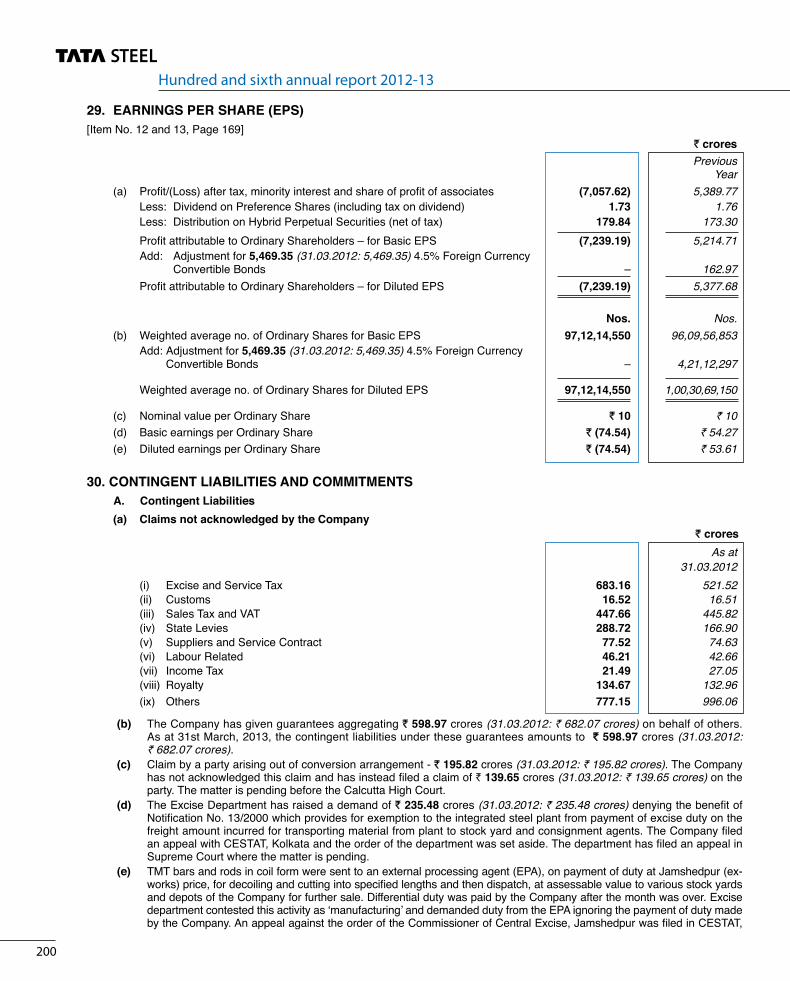
29. EARNINgS PER ShARE (EPS)[Item No. 12 and 13, Page 169] ` crores Previous Year (a) Profit/(Loss) after tax, minority interest and share of profit of associates (7,057.62) 5,389.77 Less: Dividend on Preference Shares (including tax on dividend) 1.73 1.76 Less: Distribution on Hybrid Perpetual Securities (net of tax) 179.84 173.30 Profit attributable to Ordinary Shareholders – for Basic EPS (7,239.19) 5,214.71 Add: Adjustment for 5,469.35 (31.03.2012: 5,469.35) 4.5% Foreign Currency Convertible Bonds – 162.97 Profit attributable to Ordinary Shareholders – for Diluted EPS (7,239.19) 5,377.68
Nos. Nos. (b) Weighted average no. of Ordinary Shares for Basic EPS 97,12,14,550 96,09,56,853 Add: Adjustment for 5,469.35 (31.03.2012: 5,469.35) 4.5% Foreign Currency Convertible Bonds – 4,21,12,297
Weighted average no. of Ordinary Shares for Diluted EPS 97,12,14,550 1,00,30,69,150
(c) Nominal value per Ordinary Share ` 10 ` 10 (d) Basic earnings per Ordinary Share ` (74.54) ` 54.27 (e) Diluted earnings per Ordinary Share ` (74.54) ` 53.61
30. CONTINgENT LIAbILITIES AND COMMITMENTS A. Contingent Liabilities (a) Claims not acknowledged by the Company ` crores As at 31.03.2012 (i) Excise and Service Tax 683.16 521.52 (ii) Customs 16.52 16.51 (iii) Sales Tax and VAT 447.66 445.82 (iv) State Levies 288.72 166.90 (v) Suppliers and Service Contract 77.52 74.63 (vi) Labour Related 46.21 42.66 (vii) Income Tax 21.49 27.05 (viii) Royalty 134.67 132.96 (ix) Others 777.15 996.06
(b) The Company has given guarantees aggregating ` 598.97 crores (31.03.2012: ` 682.07 crores) on behalf of others. As at 31st March, 2013, the contingent liabilities under these guarantees amounts to ` 598.97 crores (31.03.2012: ` 682.07 crores).
(c) Claim by a party arising out of conversion arrangement - ` 195.82 crores (31.03.2012: ` 195.82 crores). The Company has not acknowledged this claim and has instead filed a claim of ` 139.65 crores (31.03.2012: ` 139.65 crores) on the party. The matter is pending before the Calcutta High Court.
(d) The Excise Department has raised a demand of ` 235.48 crores (31.03.2012: ` 235.48 crores) denying the benefit of Notification No. 13/2000 which provides for exemption to the integrated steel plant from payment of excise duty on the freight amount incurred for transporting material from plant to stock yard and consignment agents. The Company filed an appeal with CESTAT, kolkata and the order of the department was set aside. The department has filed an appeal in Supreme Court where the matter is pending.
(e) TMT bars and rods in coil form were sent to an external processing agent (EPA), on payment of duty at Jamshedpur (ex-works) price, for decoiling and cutting into specified lengths and then dispatch, at assessable value to various stock yards and depots of the Company for further sale. Differential duty was paid by the Company after the month was over. Excise department contested this activity as ‘manufacturing’ and demanded duty from the EPA ignoring the payment of duty made by the Company. An appeal against the order of the Commissioner of Central Excise, Jamshedpur was filed in CESTAT,
201
kolkata and was allowed in favour of the EPA. Subsequently, the department challenged the same in Jharkhand High Court, Ranchi, which is still pending for hearing. Subsequent demand in this regard has not been adjudicated. Meanwhile, since September 2010, the decoiling and cutting activity with the EPA has been discontinued. The potential liability as of 31st March, 2013, will be approximately ̀ 298.88 crores (31.03.2012: ̀ 298.88 crores). However, the Company has already paid duty amounting to ` 196.48 crores (31.03.2012: ` 196.48 crores) till date based on the final sale price of the material.
(f) The State Government of Odisha introduced "Orissa Rural Infrastructure and Socio Economic Development Act, 2004" with effect from February 2005 levying tax on mineral bearing land computed on the basis of value of minerals produced from the mineral bearing land. The Company had filed a Writ Petition in the High Court of Orissa challenging the validity of the Act. Orissa High Court held in November 2005 that State does not have authority to levy tax on minerals. The State Government of Odisha moved to the Supreme Court against the order of Orissa High Court and the case is pending with Supreme Court. The potential liability, as of 31st March, 2013 would be approximately ` 3,006.46 crores (31.03.2012: ` 2,085.88 crores).
(g) In terms of the agreements entered into between Tata Teleservices Ltd. (TTSL), Tata Sons Ltd. (TSL) and NTT DoCoMo, Inc. of Japan (Strategic Partner-SP), the Company was given by Tata Sons an option to sell 52,46,590 equity shares in TTSL to the SP.
Pursuant to the Rights Issue made in 2010-11, SP’s shareholding in TTSL has increased from 1,17,26,17,866 equity shares of ` 10 each to 1,24,89,74,378 equity shares of ` 10 each as on 31st March, 2013. The shareholding of SP represents 26.50% of the paid up equity share capital of TTSL on a fully diluted basis as against 26.27% prior to the issuance and allotment of Rights Shares to them.
If certain performance parameters and other conditions are not met by TTSL by 31st March, 2014 and should the SP decide to divest its entire shareholding in TTSL, acquired under the primary issue and the secondary sale, and should TSL be unable to find a buyer for such shares, the Company is obligated to acquire the shareholding of the SP, at the higher of fair value or 50 percent of the subscription purchase price subject to compliance with applicable exchange control regulations, in proportion of the number of shares sold by the company to the aggregate of the secondary shares sold to the SP, or if the SP divests the shares at a lower price pay a compensation representing the difference between such lower sale price and the price referred to above.
Further, in the event of breach of the representations and warranties (other than title and tax) and covenants not capable of specific performance, the Company is liable to reimburse TSL, on a pro rata basis, upto a maximum sum of ` 6.00 crores.
(h) The Company has been paying royalty on coal extracted from its quarries pursuant to the judgment and order dated 23rd July, 2002 passed by the Jharkhand High Court. However, the State Government demanded royalty at rates applicable to processed coal. Though the Company has contested the above demand, it has started paying, under protest, royalty on processed coal from November 2008. The incremental amount (including interest), if payable, for the period till October 2008 works out to ` 413.46 crores (31.03.2012: ` 384.64 crores) and has been considered as a contingent liability.
(i) The Company availed CENVAT credit on the invoices issued by Input Service Distributors (ISD) i.e. by Head office and Sales offices during the period 2006-07 to 2011-12. The Excise department issued show cause cum demand notices disallowing ` 215.59 crores (31.03.2012: Nil) including penalty alleging that CENVAT credit can be distributed by an office of the manufacturer only. Accordingly, the head office can only distribute the CENVAT credit of input services and sales offices are not authorized to issue ISD invoices. The Company believes that as per rule any office of the manufacturer can issue ISD invoices for availment of CENVAT credit. The Company has filed appeals before CESTAT.
(j) Billets are being sent to Stockyard for onward transfer to external processing agents (EPA) for further manufacture on behalf of the Company. Since this transfer is for subsequent manufacture and not for sale, excise duty is paid on 110% of cost which is applicable for transfer of materials directly for manufacture. Excise department, Jamshedpur issued show cause notices demanding differential duty of ` 109.52 crores (31.03.2012: Nil) including penalty for the period June 2007 to March 2012. Excise department has considered the price of the billets sold by Steel Authority of India (SAIL) as the price at which the duty should have been paid by the Company. The Company is in the process of filing an appeal before CESTAT.
(k) Commercial taxes department has issued demand of ` 138.34 crores by treating 30% of the stock transfers as interstate sales to unregistered dealer and imposed tax @ 8%. The Company has filed a revision petition before the Commissioner Commercial Taxes, Ranchi (Jharkhand) and the hearing on merit is pending before the Commissioner Commercial Taxes, Ranchi (Jharkhand). The potential liability, as of 31st March, 2013, is ` 137.70 crores (31.03.2012: ` 137.70 crores).
(l) Bills discounted ` 578.76 crores (31.03.2012: ` 225.29 crores).
b. Commitments (a) Estimated amount of contracts remaining to be executed on Capital Account and not provided for: ` 14,497.29 crores
(31.03.2012: ` 16,257.61 crores). (b) uncalled liability on partly paid shares and debentures ` 0.01 crore (31.03.2012: ` 0.01 crore).31. The Company has given undertakings to: (a) IDBI not to dispose of its investment in Wellman Incandescent India Ltd.,
(b) IDBI and ICICI Bank Ltd. (formerly ICICI) not to dispose of its investment in Standard Chrome Ltd., (c) Standard Chartered Bank, Hongkong and Shanghai Banking Corporation Limited not to dispose of majority stake in Tata Steel (kZN) (Pty) Ltd., (d) Mizuho Corporate Bank Limited and Japan Bank of International Co-operation, not to dispose of its investments in
Hundred and sixth annual report 2012-13
202
Tata Nyk Shipping Pte. Limited, (minimal stake required to be able to provide a corporate guarantee towards long-term debt), (e) State Bank of India not to dispose of the management control (indirectly held) in Tata Steel uk Holdings Ltd. and Tata Steel Netherlands Holding B V and other companies (the borrower group), (f) Standard Chartered Bank, Singapore not to dispose of the management control (directly held) in NatSteel Asia Pte. Limited, (g) Sumitomo Mitsui Banking Corporation not to dispose of the management control (indirectly held) in Tata Steel Global Procurement Company Pte. Limited, (h) ICICI Bank Limited not to dispose of its investment in the Jamshedpur Continuous Annealing & Processing Company Private Limited, (i) IL&FS Trust Company Limited, not to transfer, dispose off, assign, charge or lien or in any way encumber its holding in Taj Air Limited, without the prior consent of the respective financial institutions/banks so long as any part of the loans/facilities sanctioned by the institutions/banks to these companies remains outstanding.
The Company has furnished a security bond in respect of its immovable property to the extent of ` 20 crores in favour of the Registrar of the Delhi High Court and has given an undertaking not to sell or otherwise dispose of the said property.
The Promoters of Tata BlueScope Limited (TBSL) (i.e. BlueScope Steel Asia Holdings Pty Limited, Australia and Tata Steel Limited) have given an undertaking to IDBI Trusteeship Services Ltd., Debenture Trustees, not to reduce collective shareholding in TBSL, below 51%.
In addition to the above undertakings, the Promoters of The Dhamra Port Company Limited (DPCL) i.e. Tata Steel Limited and L&T Infrastructure Development Projects Limited (L&TIDPL) have given an undertaking to a consortium of lenders of DPCL not to reduce collective shareholding in DPCL, held directly or indirectly, below 51%, to retain majority representation on the board of directors and to remain the Promoters of DPCL until the loans are fully repaid.
The Promoters’ (i.e. The Tata Power Company Limited and Tata Steel Limited) combined investments in Industrial Energy Limited (IEL) representing 51% of IEL’s paid-up equity share capital are pledged with Infrastructure Development Finance Corporation Limited (IDFC).
Tata Steel Global Minerals Holdings Pte Ltd. (TSGMH), a subsidiary and Rio Tinto Coal Mozambique (formerly Riversdale Mining Limited), have executed a deed of cross charge in favour of each other to secure the performance of obligation under Joint Venture agreement and funding requirements of the Joint Venture Rio Tinto Benga (Mauritius) Ltd. (RTBML) (Formerly Riversdale Energy (Mauritius) Limited) upto a maximum amount of uS$ 100 mn on the shares of RTBML and all of its present and future benefits and rights under the Joint Venture agreement.
32. The Company had, on 20th August, 2005, signed an agreement with the Government of Jharkhand to participate in a special health insurance scheme to be formulated by the Government of Jharkhand for the purpose of providing medical facilities to the families of the people below poverty line. The State Government would develop a suitable scheme and the Company has agreed to contribute to such scheme, when operational, a sum of ̀ 25 crores annually for a period of 30 years or upto the year of operation of the scheme whichever is lower. The matter is still under discussion and no contribution has been made till 31st March, 2013.
33. Indian Steel & Wire Products Ltd. (ISWPL), a subsidiary, was declared a Sick Industrial Company within the meaning of section 3(i)(o) of the Sick Industrial Companies (Special provisions) Act, 1985. The Board for Industrial and Financial Reconstruction (BIFR) sanctioned a scheme vide its Orders dated 22nd October, 2003, 21st November, 2003 and 18th December, 2003 for rehabilitation of ISWPL by takeover of its management by Tata Steel Limited. As per the Rehabilitation scheme approved by the Board for Industrial and Financial Reconstruction (BIFR), it was envisaged that ISWPL’s net worth would become positive by the end of financial year 2012-13. By enhancing its capabilities in the production of TMT Bars and Galvanised Wires, the net worth of ISWPL has already become positive, much before the target set in the said scheme. As at 31st March, 2013 ISWPL has wiped out its entire accumulated losses.
The significant notes appearing in the accounts of Indian Steel & Wire Products Ltd. are given below: As per clause 6.12(xiii) of BIFR Order dated 21st November, 2003, for all liabilities not disclosed in the audited balance sheet
for the year ended 31st March, 2002 including notes on accounts as then would be the personal responsibility of the erstwhile promoters to discharge. In view of the above, the following liabilities, which were not disclosed in the said balance sheet including the notes on accounts, have not been provided for or recognised in the accounts for financial year 2003-04, 2004-05, 2005-06, 2006-07, 2007-08, 2008-09, 2009-10, 2010-11, 2011-12 and 2012-13.
Particulars ` crores Show cause notices/Demand raised by Central Excise Authorities (under Appeal)* 0.29 Demands raised by Sales Tax Authorities (under Appeal) 4.72 Employee State Insurance demand (under Appeal) 1.49 Leave liability for ex-employees 0.33 Labour court cases 0.01 Railway dues 0.04 Power dues 6.21 Liability for loan for Learjet Aircraft purchase 1.49 Wealth tax 3.90 Liability for security services** –
* Demand amounting to ` 0.13 crore had been dropped as per order of CEGAT and amounting to ` 0.29 crore had been dropped as per order of Additional Commissioner Appeal during March, 2009.
Demand amounting to ` 2.69 crores had been dropped as per order of Central Excise Authorities during March, 2010. ** This demand has been dropped during Financial year 2012-13.
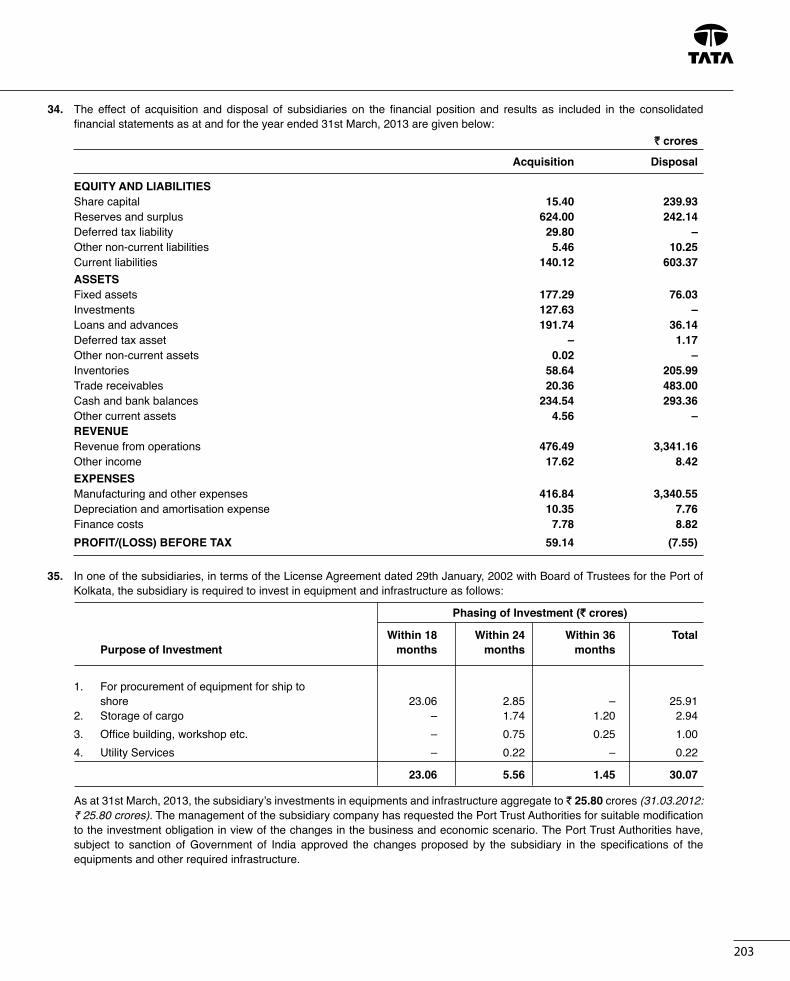
203
34. The effect of acquisition and disposal of subsidiaries on the financial position and results as included in the consolidated financial statements as at and for the year ended 31st March, 2013 are given below:
` crores
Acquisition Disposal
EquITy AND LIAbILITIES Share capital 15.40 239.93 Reserves and surplus 624.00 242.14 Deferred tax liability 29.80 – Other non-current liabilities 5.46 10.25 Current liabilities 140.12 603.37 ASSETS Fixed assets 177.29 76.03 Investments 127.63 – Loans and advances 191.74 36.14 Deferred tax asset – 1.17 Other non-current assets 0.02 – Inventories 58.64 205.99 Trade receivables 20.36 483.00 Cash and bank balances 234.54 293.36 Other current assets 4.56 – REvENuE Revenue from operations 476.49 3,341.16 Other income 17.62 8.42 ExPENSES Manufacturing and other expenses 416.84 3,340.55 Depreciation and amortisation expense 10.35 7.76 Finance costs 7.78 8.82 PROFIT/(LOSS) bEFORE TAx 59.14 (7.55)
35. In one of the subsidiaries, in terms of the License Agreement dated 29th January, 2002 with Board of Trustees for the Port of kolkata, the subsidiary is required to invest in equipment and infrastructure as follows:
Phasing of Investment (` crores)
Within 18 Within 24 Within 36 total Purpose of Investment months months months
1. For procurement of equipment for ship to shore 23.06 2.85 – 25.91 2. Storage of cargo – 1.74 1.20 2.94 3. Office building, workshop etc. – 0.75 0.25 1.00 4. utility Services – 0.22 – 0.22
23.06 5.56 1.45 30.07
As at 31st March, 2013, the subsidiary’s investments in equipments and infrastructure aggregate to ` 25.80 crores (31.03.2012: ` 25.80 crores). The management of the subsidiary company has requested the Port Trust Authorities for suitable modification to the investment obligation in view of the changes in the business and economic scenario. The Port Trust Authorities have, subject to sanction of Government of India approved the changes proposed by the subsidiary in the specifications of the equipments and other required infrastructure.
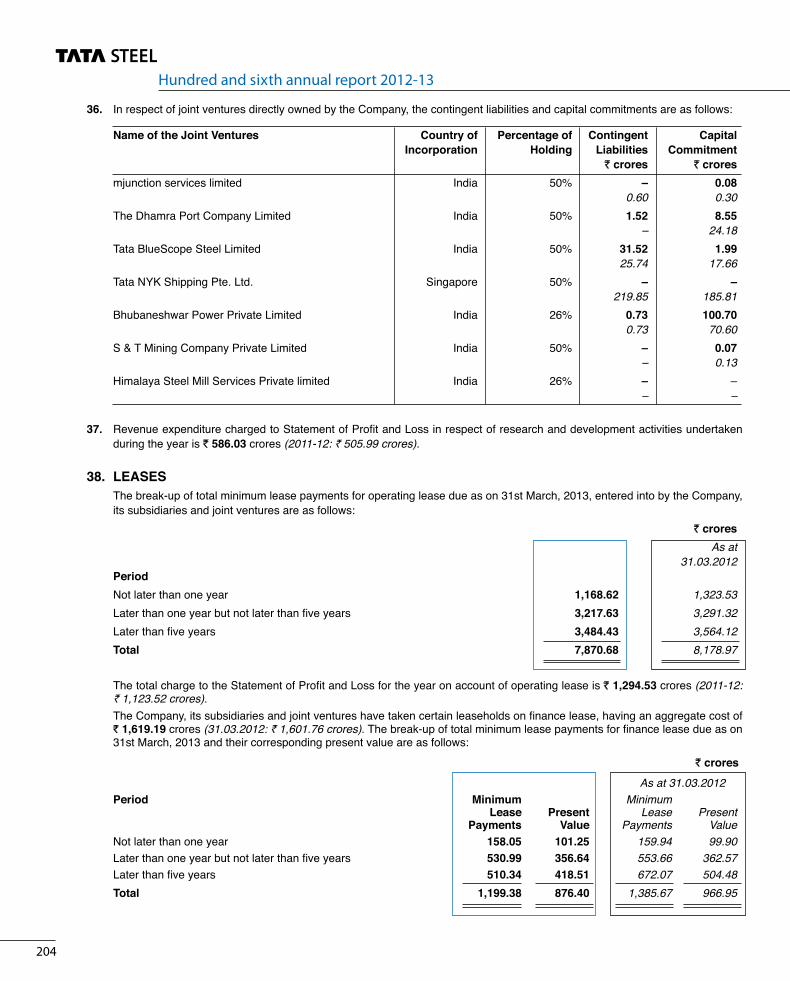
Hundred and sixth annual report 2012-13
204
36. In respect of joint ventures directly owned by the Company, the contingent liabilities and capital commitments are as follows:
Name of the Joint Ventures Country of Percentage of Contingent Capital Incorporation Holding Liabilities Commitment ` crores ` crores mjunction services limited India 50% – 0.08 0.60 0.30 The Dhamra Port Company Limited India 50% 1.52 8.55 – 24.18 Tata BlueScope Steel Limited India 50% 31.52 1.99 25.74 17.66 Tata Nyk Shipping Pte. Ltd. Singapore 50% – – 219.85 185.81 Bhubaneshwar Power Private Limited India 26% 0.73 100.70 0.73 70.60 S & T Mining Company Private Limited India 50% – 0.07 – 0.13 Himalaya Steel Mill Services Private limited India 26% – – – –
37. Revenue expenditure charged to Statement of Profit and Loss in respect of research and development activities undertaken during the year is ` 586.03 crores (2011-12: ` 505.99 crores).
38. LEASES The break-up of total minimum lease payments for operating lease due as on 31st March, 2013, entered into by the Company,
its subsidiaries and joint ventures are as follows: ` crores As at 31.03.2012 Period Not later than one year 1,168.62 1,323.53 Later than one year but not later than five years 3,217.63 3,291.32 Later than five years 3,484.43 3,564.12 Total 7,870.68 8,178.97
The total charge to the Statement of Profit and Loss for the year on account of operating lease is ` 1,294.53 crores (2011-12: ` 1,123.52 crores).
The Company, its subsidiaries and joint ventures have taken certain leaseholds on finance lease, having an aggregate cost of ` 1,619.19 crores (31.03.2012: ` 1,601.76 crores). The break-up of total minimum lease payments for finance lease due as on 31st March, 2013 and their corresponding present value are as follows:
` crores As at 31.03.2012 Period Minimum Minimum Lease Present Lease Present Payments Value Payments Value Not later than one year 158.05 101.25 159.94 99.90 Later than one year but not later than five years 530.99 356.64 553.66 362.57 Later than five years 510.34 418.51 672.07 504.48 Total 1,199.38 876.40 1,385.67 966.95

205
39. EMPLOyEE bENEFITS (a) The Company has recognised, in the Statement of Profit and Loss for the current year, an amount of ` 355.48 crores
(2011-12: ` 345.81 crores) as expenses under the following defined contribution plans:
` crores
Benefit (Contribution to) 2011-12
Provident Fund 227.95 201.66 Superannuation Fund 51.11 55.75 Employees Pension Scheme/Coal Mines Pension Scheme 59.77 72.71 TISCO Employees Pension Scheme 16.29 15.27 Employees State Insurance 0.36 0.42 355.48 345.81
(b) The Company operates post retirement defined benefit plans as follows: Funded - Post Retirement Gratuity - Post Retirement Pension Plan unfunded - Post Retirement Medical Benefits - Pensions to Directors - Farewell Gifts - Packing and Transportation Expenses (c) Details of the post retirement gratuity plan are as follows: ` crores
Description 2011-12 (i) Reconciliation of opening and closing balances of obligation Obligation as at the beginning of the year 1,762.64 1,642.74 Current service cost 87.74 84.84 Interest cost 143.54 125.96 Plan Amendments (0.04) 0.08 Settlement and curtailment 0.46 – Obligation of new companies 8.55 23.74 Actuarial (gain)/loss 177.51 24.45 Exchange rate difference 3.56 3.60 Obligation of companies sold – (17.06) Benefits paid (131.81) (125.71) Obligation as at the end of the year 2,052.15 1,762.64
The defined benefit obligation as at 31.03.2013 is funded except in the case of Tata BlueScope Steel Limited, Bhubaneshwar Power Private Limited, S & T Mining Company Private Limited, NatSteel Holdings Pte. Ltd., Himalaya Steel Mill Services Private Limited, Jamshedpur Continuous Annealing & Processing Company Private Limited, Tata Steel (Thailand) Public Company Ltd. and Lanka Special Steels Ltd.

Hundred and sixth annual report 2012-13
206
(ii) Reconciliation of opening and closing balances of plan assets Fair value of plan assets as at the beginning of the year 1,634.56 1,228.95 Expected return on plan assets 130.82 109.63 Assets of new companies 8.64 22.46 Actuarial gain/(loss) 60.90 20.78 Employers’ Contributions 100.89 385.52 Plan assets of companies sold – (16.12) Benefits paid (126.57) (116.66) Fair value of plan assets as at the end of the year 1,809.24 1,634.56 (iii) Reconciliation of fair value of assets and obligations Fair value of plan assets as at the end of the year 1,809.24 1,634.56 Present value of obligation as at the end of the year 2,052.15 1,762.64 unrecognised past service cost – 0.07 Amount recognised in the balance sheet 242.91 128.01 - Provisions 244.14 128.67 - Loans and advances (1.23) (0.66) (iv) Expenses recognised in the year Current service cost 87.74 84.84 Interest cost 143.54 125.96 Expected return on plan assets (130.82) (109.63) Actuarial (gain)/loss 116.61 3.67 Past Service Cost 0.07 – Expense recognised during the year 217.14 104.84
31.03.2013 31.03.2012 (v) Investment details % % GOI securities 13 15 Public Sector unit bonds 12 16 Central/State Government Guaranteed securities 5 6 Private sector unit bonds 8 10 Others (including funds with LIC and bank balances) 62 53 100 100 (vi) Assumptions Discount rate (per annum) 0.30-8.20% 0.45-8.90% Expected Return on Plan Assets (per annum) 7.50-9.40% 7.50-9.25% Rate of escalation in salary (per annum) 4.00-10.00% 4.00-10.00%
(vii) Other disclosures Experience adjustment on plan liabilities - gain/(loss) (102.33) (89.95) Experience adjustment on plan assets - gain/(loss) 60.90 20.78
The basis used to determine overall expected rate of return on assets and the effect on major categories of plan assets is as follows:
The major portions of the assets are funded with LIC, invested in PSu bonds and GOI securities. Based on the asset allocation and prevailing yield rates on these asset classes, the long-term estimate of the expected rate of return on the fund assets have been arrived at. Assumed rate of return on assets is expected to vary from year to year reflecting the returns on matching Government bonds.
` crores
Description 2011-12

207
(d) Details of post retirement pension plans are as follows:
` crores
Description 2011-12 (i) Reconciliation of opening and closing balances of obligation Obligation as at the beginning of the year 1,39,508.78 1,13,762.22 Current service cost 1,264.02 1,309.58 Interest cost 6,634.84 6,310.50 Obligation of companies sold (68.49) – Actuarial (gain)/loss 10,594.78 10,081.29 Exchange rate difference 1,503.81 13,911.50 Settlements and curtailments (154.10) (76.58) Benefits paid (7,020.09) (6,279.87) Employee contribution 573.59 490.14 Obligation as at the end of the year 1,52,837.14 1,39,508.78 (ii) Reconciliation of opening and closing balances of plan assets Fair value of plan assets as at the beginning of the year 1,40,688.16 1,16,048.78 Expected return on plan assets 7,080.01 6,962.61 Actuarial gain/(loss) 10,281.87 7,849.84 Plan assets of companies sold (59.93) – Employees’ Contributions 573.59 490.14 Employers’ Contributions 1,326.97 1,508.70 Benefits paid (7,020.09) (6,279.87) Exchange rate difference 1,499.71 14,107.96 Net fair value of plan assets as at the end of the year 1,54,370.29 1,40,688.16 (iii) Reconciliation of fair value of assets and obligations Fair value of plan assets as at the end of the year 1,54,370.29 1,40,688.16 Present value of obligation as at the end of the year 1,52,837.14 1,39,508.78 Amount recognised in the balance sheet - asset 1,533.15 1,179.38 - Provisions (466.95) (418.44) - Loans and advances 2,000.10 1,597.82 (iv) Expenses recognised in the year Current service cost 1,264.02 1,309.58 Interest cost 6,634.84 6,310.50 Expected return on plan assets (7,080.01) (6,962.61) Actuarial (gain)/loss(1) 312.91 2,231.45 Settlements and curtailments (154.10) (76.58) Expense recognised during the year 977.66 2,812.34 Description 31.03.2013 31.03.2012 % % (v) Investment details Equities 27 27 Bonds 62 63 Property 7 7 Others (including bank balances) 4 3 100 100 (vi) Assumptions Discount rate (per annum) 2.00-4.30% 2.50-4.80% Expected Return on Plan Assets (per annum) 2.00-8.90% 2.00-9.60% Rate of escalation in salary (per annum) 1.00-3.85% 1.00-4.20% (vii) Other disclosures Experience adjustment on plan liabilities - gain/(loss) 702.01 206.78 Experience adjustment on plan assets - gain/(loss) 10,281.87 7,849.84

Hundred and sixth annual report 2012-13
208
(e) Details of the unfunded post retirement defined benefit obligation are as follows:
` crores 2011-12 Description Medical Others Medical Others (i) Reconciliation of opening and closing balances of obligation Obligation as at the beginning of the year 717.55 731.67 731.62 599.54 Current/Employer service cost 10.64 20.30 8.41 17.30 Interest cost 59.41 22.51 57.78 27.60 Obligation of new companies 0.32 2.03 11.42 1.27 Actuarial (gain)/loss 107.90 107.10 (52.61) 63.06 Exchange rate difference – 26.34 – 53.82 Obligation of companies sold – – (5.83) (3.68) Benefits paid (38.03) (30.39) (33.24) (27.24) Obligation as at the end of the year 857.79 879.56 717.55 731.67 (ii) Expenses recognised in the year Current/Employer service cost 10.64 20.30 8.41 17.30 Interest cost 59.41 22.51 57.78 27.60 Actuarial (gain)/loss 107.90 107.10(1) (52.61) 63.06 (1)
Expense recognised during the year 177.95 149.91 13.58 107.96 (iii) Assumptions Discount rate (per annum) as at the beginning of the year 8.00-8.70% 4.20-8.70% 8.00-8.40% 3.30-8.00% Discount rate (per annum) as at the end of the year 8.00-8.20% 4.30-8.20% 8.00-8.70% 4.20-8.70% Medical costs inflation rate 5.00-8.00% 5.00-8.00% Average medical cost (`/person) at the beginning of the year 6,257.00 3,230.00 Average medical cost (`/person) at the end of the year 7,118.00 6,257.00 Effect of a 1% change in health care cost on Increase - aggregate current service and interest cost 13.40 8.72 - closing balance of obligation 139.39 115.51 Decrease - aggregate current service and interest cost (9.05) (0.35) - closing balance of obligation (102.07) (83.48) (iv) Other disclosures Experience adjustment on plan liabilities - gain/(loss) (46.14) (32.58) (106.26) (65.80)
(1) The consolidated Statement of Profit and Loss includes the consolidated results of Tata Steel Europe Limited and its subsidiaries whose income contributes 57% of the consolidated total revenue. The pension and other post retirement defined benefit liability of Tata Steel Europe Limited is computed and accounted for in accordance with International Financial Reporting Standards (IFRS). IFRS permits the impact of changes in the assets and liabilities, inter alia, due to assumption of variables like bond yield rates, inflation and demographic assumptions to be accounted for in “Reserves and Surplus”. This practice is consistently followed by Tata Steel Europe Limited. The Accounting Standard (AS-15) – "Employee Benefits" is different from the above and requires such changes to be accounted for in the Statement of Profit and Loss. Given the large share of Tata Steel Europe Limited in the consolidated Statement of Profit and Loss of the Company, and the potential volatility caused by periodic changes in the assumptions underlying the computation of the liabilities, it is not considered practicable to adopt a common accounting policy for accounting of the actuarial gains/losses in respect of the pension and other post retirement defined benefit liability of the Company and Tata Steel Europe Limited. Accordingly the actuarial loss of ` 317.26 crores (2011-12: ` 2,372.26 crores) (net of tax) recognised in Tata Steel Europe Limited has been accounted in "Reserves and Surplus" in the consolidated financial statements in accordance with IFRS principles and as permitted by Accounting Standard 21 – "Consolidated Financial Statements". Had the Company followed the practice of recognising changes in actuarial valuations in respect of the pension and other post retirement benefit plans of Tata Steel Europe Limited, in the Statement of Profit and Loss, the Loss after tax, minority interest and share of profit of associates would have been higher by ` 317.26 crores (2011-12: the Profit after tax, minority interest and share of profit of associates would have been lower by ` 2,372.26 crores).

209
40. SEgMENT REPORTINg Primary Segment Information (Business Segment)
` crores
Particulars business Segments Unallocable Eliminations Total Steel Others Segment revenue External revenue 1,23,104.72 11,149.62 457.20 – 1,34,711.54 1,22,018.20 10,534.92 346.58 – 1,32,899.70 Inter segment revenue 4,516.11 3,391.45 535.89 (8,443.45) – 5,248.30 2,961.66 1,317.24 (9,527.20) – Total revenue 1,27,620.83 14,541.07 993.09 (8,443.45) 1,34,711.54 1,27,266.50 13,496.58 1,663.82 (9,527.20) 1,32,899.70 Segment results before finance costs, exceptional items and tax 8,225.68 578.15 2,201.44 (3,780.23) 7,225.04 9,575.83 102.21 4,431.65 (4,636.52) 9,473.17 Less: Finance costs 3,968.11 4,250.11 Profit before tax and exceptional items 3,256.93 5,223.06 Exceptional Items (a) Profit on sale of non-current investments 966.03 3,361.92 (b) Provision for impairment of non-current assets (8,355.91) –
Profit before tax (4,132.95) 8,584.98 Tax expense 3,229.44 3,636.46 Profit after tax (7,362.39) 4,948.52 Segment assets 1,37,237.50 9,229.96 20,962.61 (36,492.52) 1,30,937.55 1,28,354.92 8,070.28 20,595.48 (31,227.23) 1,25,793.45 Segment liabilities 53,680.65 4,106.31 17,520.37 (36,472.58) 38,834.75 50,722.60 3,806.72 13,912.95 (30,785.74) 37,656.53 Capital expenditure 15,850.81 433.67 25.68 – 16,310.16 12,741.67 270.89 159.42 (2.15) 13,169.83 Segment depreciation 5,100.88 306.76 167.68 – 5,575.32 4,067.72 287.61 161.32 – 4,516.65 Non-cash expenditure other than depreciation 356.99 20.29 7.14 – 384.42 128.76 76.90 2.50 – 208.16
Secondary Segment Information (Geographical Segment) ` crores 2011-12 Segment Revenue – Within India 38,804.47 35,156.08 – Outside India 95,907.07 97,743.62 1,34,711.54 1,32,899.70 Capital Expenditure – Within India 9,680.75 7,915.33 – Outside India 6,629.41 5,254.50 16,310.16 13,169.83 31.03.2012 ` crore Segment Assets – Within India 58,297.06 50,143.09 – Outside India 72,640.49 75,650.36 1,30,937.55 1,25,793.45

Hundred and sixth annual report 2012-13
210
Additional information:(1) The Company has disclosed Business Segment as the primary segment. Segments have been identified taking into account the
nature of the products, the differing risks and returns, the organisational structure and internal reporting system. The Company’s operations predominantly relate to manufacture of Steel. Other business segments comprise of Tubes, Bearings, Refractories, Pigments, Port operations, Town services and Investment activities.
(2) Segment Revenue, Segment Results, Segment Assets and Segment Liabilities include the respective amounts identifiable to each of the segments as also amounts allocated on a reasonable basis. The expenses, which are not directly relatable to the business segment, are shown as unallocated corporate cost. Assets and liabilities that cannot be allocated between the segments are shown as unallocated corporate assets and liabilities respectively.
(3) unallocable assets and liabilities exclude. ` crores As at 31.03.2012 Assets: Non-current investments 2,137.51 2,259.98 Current investments 729.89 1,381.76 Advance against equity – 0.85 Goodwill on consolidation 13,064.98 17,354.61 Deferred tax assets 36.49 61.44 15,968.87 21,058.64 Liabilities: Long-term borrowings 46,857.62 45,238.24 Short-term borrowings 8,114.56 4,699.08 Current maturities of long-term borrowings 11,102.14 9,959.45 Hybrid perpetual securities 2,275.00 2,275.00 Provision for employee separation compensation 704.56 772.68 Deferred tax liabilities 3,154.98 2,503.85 Preference shares issued by subsidiary companies 21.21 22.43 Share warrants issued by a subsidiary company – 17.46 Minority interest 1,669.36 1,091.15 73,899.43 66,579.34
(4) Transactions between segments are primarily for materials which are transferred at market determined prices and common costs are apportioned on a reasonable basis.
41. RELATED PARTy DISCLOSuRESList of Related Parties and Relationships
Associates of:i) Kalimati Investment Company Ltd. 1. Rujuvalika Investments Ltd.ii) NatSteel Asia Pte. Ltd. 1. SteelAsia Development and Management Corp. 2. SteelAsia Industries Inc. 3. SteelAsia Manufacturing Corporationiii) Tata Incorporated 1. TkM Overseas Ltd.iv) tata Steel Limited 1. Indian Steel Rolling Mills Ltd.* 2. Industrial Energy Ltd. 3. Jamipol Ltd.
4. kalinga Aquatics Ltd. 5. kumardhubi Fireclay & Silica Works Ltd. 6. kumardhubi Metal Casting & Engineering Ltd. 7. Nicco Jubilee Park Limited 8. Strategic Energy Technology Systems Private Limited 9. Tata Construction & Projects Ltd. 10. Tata Sponge Iron Ltd.@
11. TRL krosaki Refractories Ltd. 12. TRF Ltd.v) tata Steel Holdings Pte. Ltd. a) tata Steel Global Holdings Pte Ltd. I. Tata Steel International (Singapore) holdings
Pte. Ltd. 1. European Profiles (M) Sdn. Bhd.
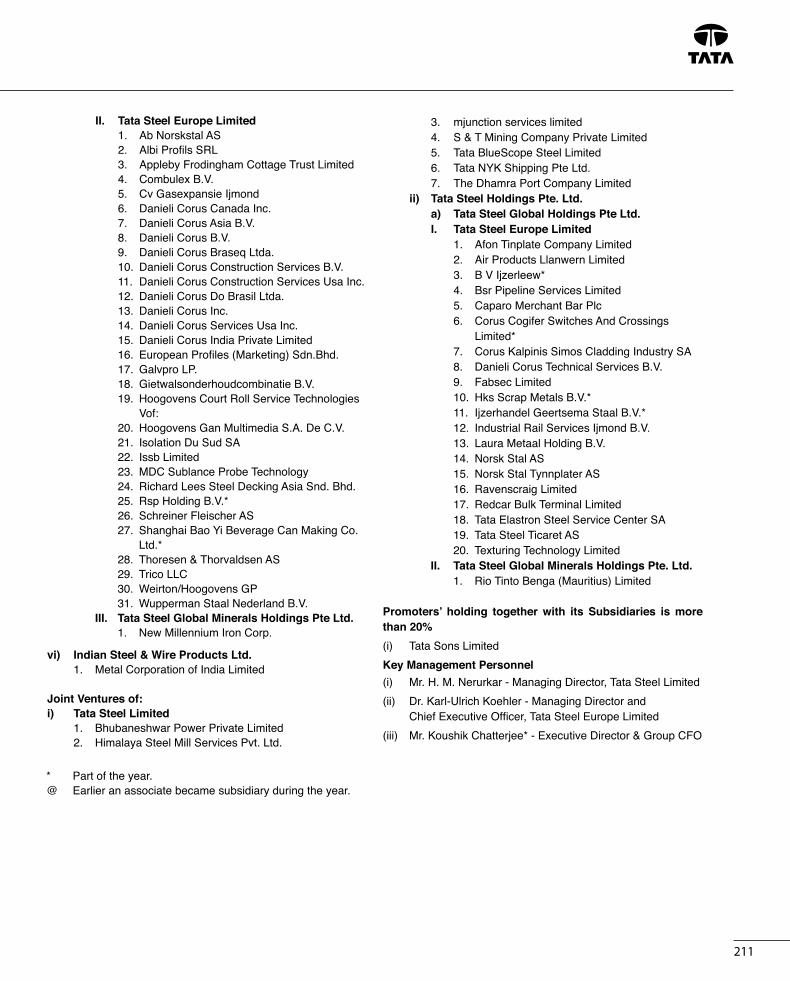
211
II. Tata Steel Europe Limited 1. Ab Norskstal AS 2. Albi Profils SRL 3. Appleby Frodingham Cottage Trust Limited 4. Combulex B.V. 5. Cv Gasexpansie Ijmond 6. Danieli Corus Canada Inc. 7. Danieli Corus Asia B.V. 8. Danieli Corus B.V. 9. Danieli Corus Braseq Ltda. 10. Danieli Corus Construction Services B.V. 11. Danieli Corus Construction Services usa Inc. 12. Danieli Corus Do Brasil Ltda. 13. Danieli Corus Inc. 14. Danieli Corus Services usa Inc. 15. Danieli Corus India Private Limited 16. European Profiles (Marketing) Sdn.Bhd. 17. Galvpro LP. 18. Gietwalsonderhoudcombinatie B.V. 19. Hoogovens Court Roll Service Technologies
Vof: 20. Hoogovens Gan Multimedia S.A. De C.V. 21. Isolation Du Sud SA 22. Issb Limited 23. MDC Sublance Probe Technology 24. Richard Lees Steel Decking Asia Snd. Bhd. 25. Rsp Holding B.V.* 26. Schreiner Fleischer AS 27. Shanghai Bao yi Beverage Can Making Co.
Ltd.* 28. Thoresen & Thorvaldsen AS 29. Trico LLC 30. Weirton/Hoogovens GP 31. Wupperman Staal Nederland B.V. III. tata Steel Global Minerals Holdings Pte Ltd. 1. New Millennium Iron Corp.
vi) Indian Steel & Wire Products Ltd. 1. Metal Corporation of India Limited
Joint Ventures of:i) Tata Steel Limited 1. Bhubaneshwar Power Private Limited 2. Himalaya Steel Mill Services Pvt. Ltd.
3. mjunction services limited 4. S & T Mining Company Private Limited 5. Tata BlueScope Steel Limited 6. Tata Nyk Shipping Pte Ltd. 7. The Dhamra Port Company Limited ii) Tata Steel holdings Pte. Ltd. a) tata Steel Global Holdings Pte Ltd. I. Tata Steel Europe Limited 1. Afon Tinplate Company Limited 2. Air Products Llanwern Limited 3. B V Ijzerleew* 4. Bsr Pipeline Services Limited 5. Caparo Merchant Bar Plc 6. Corus Cogifer Switches And Crossings
Limited* 7. Corus kalpinis Simos Cladding Industry SA 8. Danieli Corus Technical Services B.V. 9. Fabsec Limited 10. Hks Scrap Metals B.V.* 11. Ijzerhandel Geertsema Staal B.V.* 12. Industrial Rail Services Ijmond B.V. 13. Laura Metaal Holding B.V. 14. Norsk Stal AS 15. Norsk Stal Tynnplater AS 16. Ravenscraig Limited 17. Redcar Bulk Terminal Limited 18. Tata Elastron Steel Service Center SA 19. Tata Steel Ticaret AS 20. Texturing Technology Limited II. tata Steel Global Minerals Holdings Pte. Ltd. 1. Rio Tinto Benga (Mauritius) Limited
Promoters’ holding together with its Subsidiaries is more than 20%(i) Tata Sons Limited Key Management Personnel (i) Mr. H. M. Nerurkar - Managing Director, Tata Steel Limited(ii) Dr. karl-ulrich koehler - Managing Director and
Chief Executive Officer, Tata Steel Europe Limited(iii) Mr. koushik Chatterjee* - Executive Director & Group CFO
* Part of the year.@ Earlier an associate became subsidiary during the year.
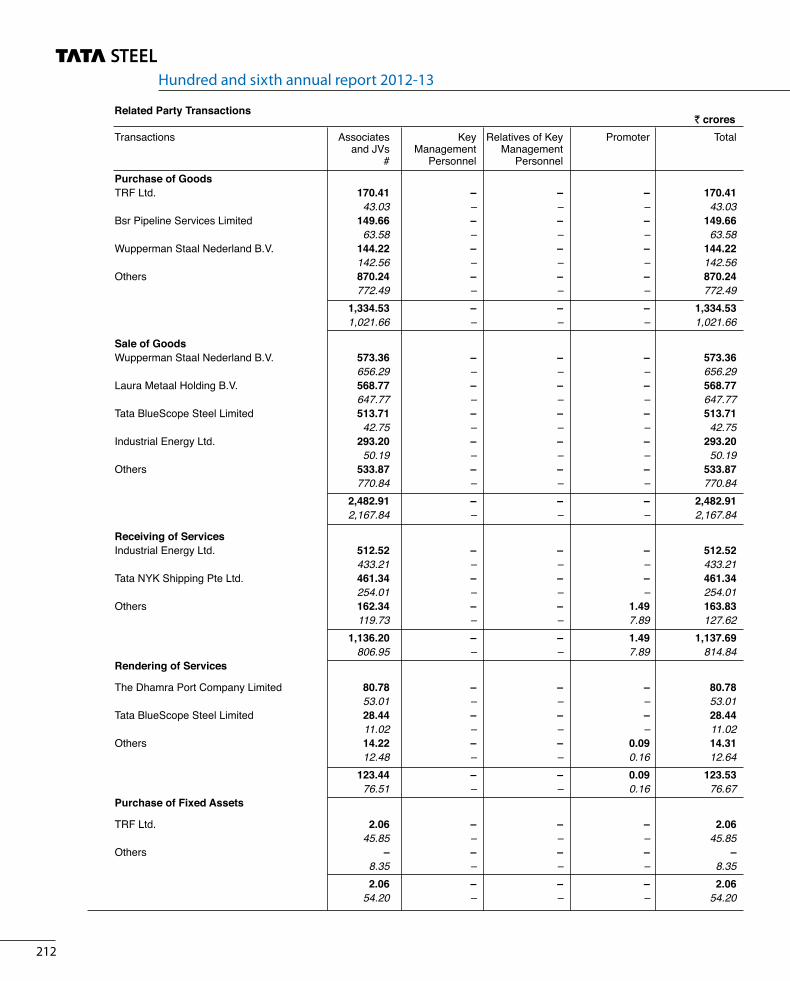
Hundred and sixth annual report 2012-13
212
Related Party transactions ` crores
Transactions Associates key Relatives of key Promoter Total and JVs Management Management # Personnel Personnel
Purchase of GoodsTRF Ltd. 170.41 – – – 170.41 43.03 – – – 43.03 Bsr Pipeline Services Limited 149.66 – – – 149.66 63.58 – – – 63.58 Wupperman Staal Nederland B.V. 144.22 – – – 144.22 142.56 – – – 142.56 Others 870.24 – – – 870.24 772.49 – – – 772.49 1,334.53 – – – 1,334.53 1,021.66 – – – 1,021.66
Sale of Goods Wupperman Staal Nederland B.V. 573.36 – – – 573.36 656.29 – – – 656.29 Laura Metaal Holding B.V. 568.77 – – – 568.77 647.77 – – – 647.77 Tata BlueScope Steel Limited 513.71 – – – 513.71 42.75 – – – 42.75 Industrial Energy Ltd. 293.20 – – – 293.20 50.19 – – – 50.19 Others 533.87 – – – 533.87 770.84 – – – 770.84 2,482.91 – – – 2,482.91 2,167.84 – – – 2,167.84
Receiving of Services Industrial Energy Ltd. 512.52 – – – 512.52 433.21 – – – 433.21 Tata Nyk Shipping Pte Ltd. 461.34 – – – 461.34 254.01 – – – 254.01 Others 162.34 – – 1.49 163.83 119.73 – – 7.89 127.62 1,136.20 – – 1.49 1,137.69 806.95 – – 7.89 814.84 Rendering of Services
The Dhamra Port Company Limited 80.78 – – – 80.78 53.01 – – – 53.01 Tata BlueScope Steel Limited 28.44 – – – 28.44 11.02 – – – 11.02 Others 14.22 – – 0.09 14.31 12.48 – – 0.16 12.64 123.44 – – 0.09 123.53 76.51 – – 0.16 76.67 Purchase of Fixed Assets
TRF Ltd. 2.06 – – – 2.06 45.85 – – – 45.85 Others – – – – – 8.35 – – – 8.35 2.06 – – – 2.06 54.20 – – – 54.20
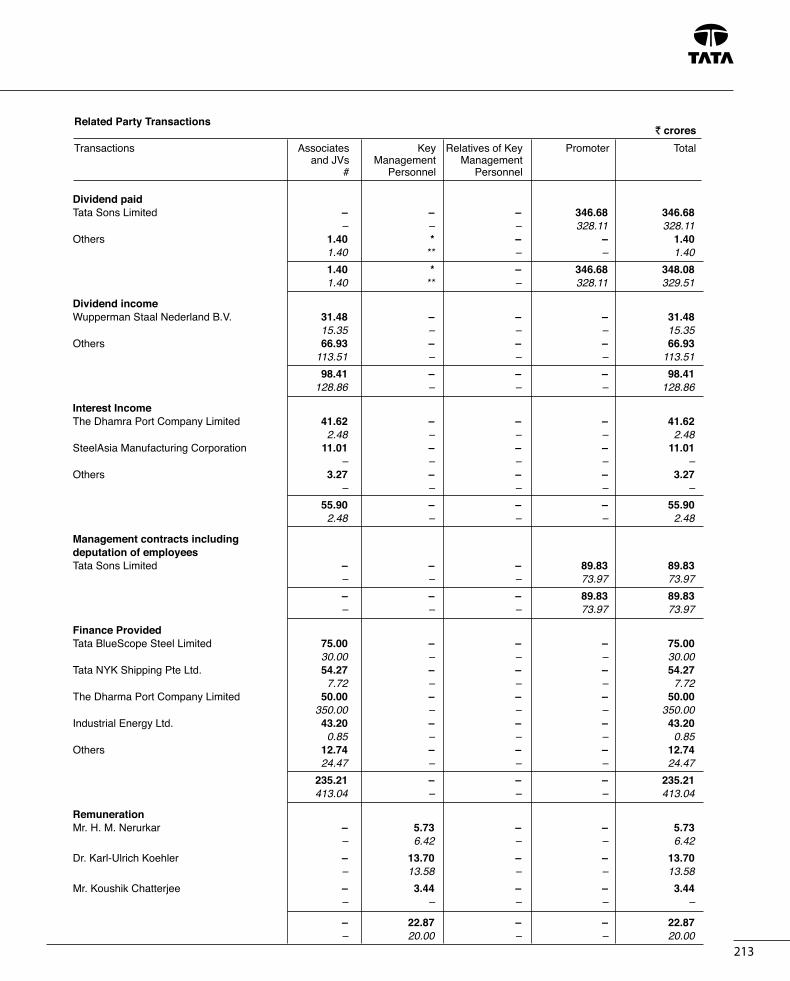
213
dividend paid Tata Sons Limited – – – 346.68 346.68 – – – 328.11 328.11 Others 1.40 * – – 1.40 1.40 ** – – 1.40 1.40 * – 346.68 348.08 1.40 ** – 328.11 329.51
dividend income Wupperman Staal Nederland B.V. 31.48 – – – 31.48 15.35 – – – 15.35 Others 66.93 – – – 66.93 113.51 – – – 113.51 98.41 – – – 98.41 128.86 – – – 128.86
Interest Income The Dhamra Port Company Limited 41.62 – – – 41.62 2.48 – – – 2.48 SteelAsia Manufacturing Corporation 11.01 – – – 11.01 – – – – – Others 3.27 – – – 3.27 – – – – – 55.90 – – – 55.90 2.48 – – – 2.48
Management contracts including deputation of employees Tata Sons Limited – – – 89.83 89.83 – – – 73.97 73.97 – – – 89.83 89.83 – – – 73.97 73.97
Finance Provided Tata BlueScope Steel Limited 75.00 – – – 75.00 30.00 – – – 30.00 Tata Nyk Shipping Pte Ltd. 54.27 – – – 54.27 7.72 – – – 7.72 The Dharma Port Company Limited 50.00 – – – 50.00 350.00 – – – 350.00 Industrial Energy Ltd. 43.20 – – – 43.20 0.85 – – – 0.85 Others 12.74 – – – 12.74 24.47 – – – 24.47 235.21 – – – 235.21 413.04 – – – 413.04
RemunerationMr. H. M. Nerurkar – 5.73 – – 5.73 – 6.42 – – 6.42Dr. karl-ulrich koehler – 13.70 – – 13.70 – 13.58 – – 13.58Mr. koushik Chatterjee – 3.44 – – 3.44 – – – – –
– 22.87 – – 22.87 – 20.00 – – 20.00
Related Party transactions ` crores
Transactions Associates key Relatives of key Promoter Total and JVs Management Management # Personnel Personnel

Hundred and sixth annual report 2012-13
214
Related Party transactions ` crores
Transactions Associates key Relatives of key Promoter Total and JVs Management Management # Personnel Personnel
guarantees outstanding Tata Nyk Shipping Pte Ltd. 162.86 – – – 162.86 152.64 – – – 152.64 162.86 – – – 162.86 152.64 – – – 152.64
Outstanding Receivables The Dhamra Port Company Limited 475.63 – – – 475.63 366.88 – – – 366.88 Caparo Merchant Bar Plc 99.81 – – – 99.81 4.55 – – – 4.55 Others 295.95 – – 14.43 310.38 246.66 – – 4.01 250.67 871.39 – – 14.43 885.82 618.09 – – 4.01 622.10
Outstanding Payables Bsr Pipeline Services Limited 100.31 – – – 100.31 49.99 – – – 49.99 Tata Sons Limited – – – 95.73 95.73 – – – 92.49 92.49 Industrial Energy Ltd. 63.60 – – – 63.60 66.27 – – – 66.27 Others 138.16 – – – 138.16 160.96 – – – 160.96 302.07 – – 95.73 397.80 277.22 – – 92.49 369.71
* ` 8,844.00** ` 8,844.00# Transactions with Joint Ventures have been disclosed at full value.
42. Figures pertaining to the subsidiaries and joint ventures have been reclassified where necessary to bring them in line with the Company’s financial statements.
43. Previous year’s figures have been recast/restated where necessary.44. Figures in italics are in respect of the previous year.
A ANJENEyANCompany SecretaryMumbai, 23rd May, 2013
For and on behalf of the BoardCyRuS P MISTRy ChairmanB MuTHuRAMAN Vice ChairmanNuSLI N WADIA ISHAAT HuSSAINSuBODH BHARGAVA DirectorsANDREW ROBBD K MEHROTRAkARL-uLRICH kOEHLER
H M NERuRkAR Managing DirectorkOuSHIk CHATTERJEE Executive Director & Group CFO
}
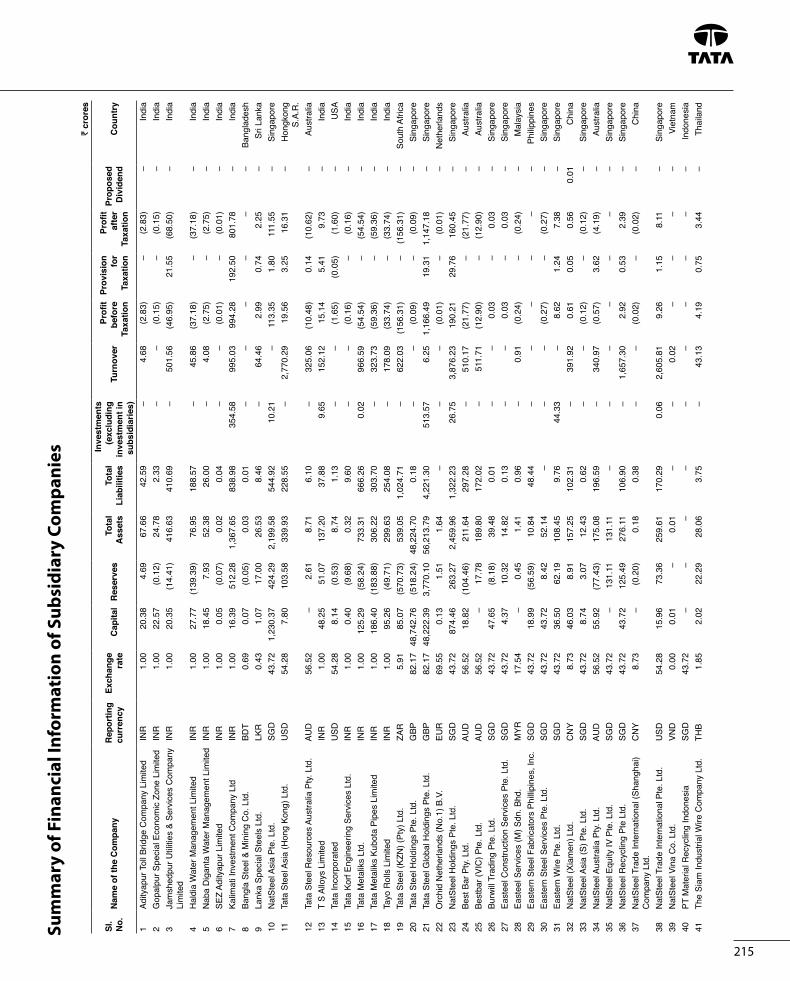
215
Sum
mar
y o
f Fin
anci
al in
form
atio
n o
f Su
bsi
dia
ry C
om
pan
ies
` c
rore
s
Sl.
No.
Nam
e of
the
Com
pany
Rep
ortin
g cu
rren
cyEx
chan
ge
rate
Cap
ital
Res
erve
sTo
tal
Ass
ets
Tota
l Li
abili
ties
Inve
stm
ents
(e
xclu
ding
in
vest
men
t in
subs
idia
ries)
turn
over
Profi
t be
fore
ta
xatio
n
Prov
isio
n fo
r ta
xatio
n
Profi
t af
ter
taxa
tion
Prop
osed
d
ivid
end
Cou
ntry
1Ad
ityap
ur T
oll B
ridge
Com
pany
Lim
ited
INR
1
.00
20.
38
4.6
9 6
7.66
4
2.59
–
4
.68
(2.8
3) –
(2
.83)
–
Indi
a 2
Gop
alpu
r Spe
cial
Eco
nom
ic Z
one
Lim
ited
INR
1
.00
22.
57
(0.1
2) 2
4.78
2
.33
–
–
(0.1
5) –
(0
.15)
–
Indi
a 3
Jam
shed
pur u
tiliti
es &
Ser
vice
s C
ompa
ny
Lim
ited
INR
1
.00
20.
35
(14.
41)
416
.63
410
.69
–
501
.56
(46.
95)
21.
55
(68.
50)
–
Indi
a
4H
aldi
a W
ater
Man
agem
ent L
imite
d IN
R
1.0
0 2
7.77
(1
39.3
9) 7
6.95
1
88.5
7 –
4
5.86
(3
7.18
) –
(3
7.18
) –
In
dia
5N
aba
Dig
anta
Wat
er M
anag
emen
t Lim
ited
INR
1
.00
18.
45
7.9
3 5
2.38
2
6.00
–
4
.08
(2.7
5) –
(2
.75)
–
Indi
a 6
SEZ
Adity
apur
Lim
ited
INR
1
.00
0.0
5 (0
.07)
0.0
2 0
.04
–
–
(0.0
1) –
(0
.01)
–
Indi
a 7
Kalim
ati I
nves
tmen
t Com
pany
Ltd
INR
1
.00
16.
39
512
.28
1,3
67.6
5 8
38.9
8 3
54.5
8 9
95.0
3 9
94.2
8 1
92.5
0 8
01.7
8 –
In
dia
8Ba
ngla
Ste
el &
Min
ing
Co.
Ltd
. B
DT
0.6
9 0
.07
(0.0
5) 0
.03
0.0
1 –
–
–
–
–
–
B
angl
ades
h 9
Lank
a Sp
ecia
l Ste
els
Ltd.
LKR
0
.43
1.0
7 1
7.00
2
6.53
8
.46
–
64.
46
2.9
9 0
.74
2.2
5 –
S
ri La
nka
10N
atSt
eel A
sia
Pte.
Ltd
. S
GD
4
3.72
1
,230
.37
424
.29
2,1
99.5
8 5
44.9
2 1
0.21
–
1
13.3
5 1
.80
111
.55
–
Sin
gapo
re
11Ta
ta S
teel
Asi
a (H
ong
kong
) Ltd
. u
SD
54.
28
7.8
0 1
03.5
8 3
39.9
3 2
28.5
5 –
2
,770
.29
19.
56
3.2
5 1
6.31
–
H
ongk
ong
S.A.
R.
12Ta
ta S
teel
Res
ourc
es A
ustra
lia P
ty. L
td.
Au
D
56.
52
–
2.6
1 8
.71
6.1
0 –
3
25.0
6 (1
0.48
) 0
.14
(10.
62)
–
Aus
tralia
13
T S
Allo
ys L
imite
d IN
R
1.0
0 4
8.25
5
1.07
1
37.2
0 3
7.88
9
.65
152
.12
15.
14
5.4
1 9
.73
–
Indi
a 14
Tata
Inco
rpor
ated
uSD
5
4.28
8
.14
(0.5
3) 8
.74
1.1
3 –
–
(1
.65)
(0.0
5) (1
.60)
–
uSA
15
Tata
kor
f Eng
inee
ring
Serv
ices
Ltd
. IN
R
1.0
0 0
.40
(9.6
8) 0
.32
9.6
0 –
–
(0
.16)
–
(0.1
6) –
In
dia
16Ta
ta M
etal
iks
Ltd.
INR
1
.00
125
.29
(58.
24)
733
.31
666
.26
0.0
2 9
66.5
9 (5
4.54
) –
(5
4.54
) –
In
dia
17Ta
ta M
etal
iks
kubo
ta P
ipes
Lim
ited
INR
1
.00
186
.40
(183
.88)
306
.22
303
.70
–
323
.73
(59.
36)
–
(59.
36)
–
Indi
a 18
Tayo
Rol
ls L
imite
d IN
R
1.0
0 9
5.26
(4
9.71
) 2
99.6
3 2
54.0
8 –
1
78.0
9 (3
3.74
) –
(3
3.74
) –
In
dia
19Ta
ta S
teel
(kZN
) (Pt
y) L
td.
ZAR
5
.91
85.
07
(570
.73)
539
.05
1,0
24.7
1 –
6
22.0
3 (1
56.3
1) –
(1
56.3
1) –
S
outh
Afri
ca
20Ta
ta S
teel
Hol
ding
s Pt
e. L
td.
GBP
8
2.17
48
,742
.76
(518
.24)
48,
224.
70
0.1
8 –
–
(0
.09)
–
(0.0
9) –
S
inga
pore
21
Tata
Ste
el G
loba
l Hol
ding
s Pt
e. L
td.
GBP
8
2.17
48
,222
.39
3,7
70.1
0 5
6,21
3.79
4
,221
.30
513
.57
6.2
5 1
,166
.49
19.
31
1,1
47.1
8 –
S
inga
pore
22
Orc
hid
Net
herla
nds
(No.
1) B
.V.
Eu
R
69.
55
0.1
3 1
.51
1.6
4 –
–
–
(0.0
1) –
(0
.01)
–
Net
herla
nds
23N
atSt
eel H
oldi
ngs
Pte.
Ltd
. S
GD
4
3.72
8
74.4
6 2
63.2
7 2
,459
.96
1,3
22.2
3 2
6.75
3
,876
.23
190
.21
29.
76
160
.45
–
Sin
gapo
re
24Be
st B
ar P
ty. L
td.
Au
D
56.
52
18.
82
(104
.46)
211
.64
297
.28
–
510
.17
(21.
77)
–
(21.
77)
–
Aus
tralia
25
Best
bar (
VIC
) Pte
. Ltd
. A
uD
5
6.52
–
1
7.78
1
89.8
0 1
72.0
2 –
5
11.7
1 (1
2.90
) –
(1
2.90
) –
A
ustra
lia
26Bu
rwill
Trad
ing
Pte.
Ltd
. S
GD
4
3.72
4
7.65
(8
.18)
39.
48
0.0
1 –
–
0
.03
–
0.0
3 –
S
inga
pore
27
East
eel C
onst
ruct
ion
Serv
ices
Pte
. Ltd
. S
GD
4
3.72
4
.37
10.
32
14.
82
0.1
3 –
–
0
.03
–
0.0
3 –
S
inga
pore
28
East
eel S
ervi
ces
(M) S
dn. B
hd.
MyR
1
7.54
–
0
.45
1.4
1 0
.96
–
0.9
1 (0
.24)
–
(0.2
4) –
M
alay
sia
29Ea
ster
n St
eel F
abric
ator
s Ph
illipi
nes,
Inc.
SG
D
43.
72
18.
99
(56.
59)
10.
84
48.
44
–
–
–
–
–
–
Phi
lippi
nes
30Ea
ster
n St
eel S
ervi
ces
Pte.
Ltd
. S
GD
4
3.72
4
3.72
8
.42
52.
14
–
–
–
(0.2
7) –
(0
.27)
–
Sin
gapo
re
31Ea
ster
n W
ire P
te. L
td.
SG
D
43.
72
36.
50
62.
19
108
.45
9.7
6 4
4.33
–
8
.62
1.2
4 7
.38
–
Sin
gapo
re
32N
atSt
eel (
Xiam
en) L
td.
CN
y 8
.73
46.
03
8.9
1 1
57.2
5 1
02.3
1 –
3
91.9
2 0
.61
0.0
5 0
.56
0.0
1 C
hina
33
Nat
Stee
l Asi
a (S
) Pte
. Ltd
. S
GD
4
3.72
8
.74
3.0
7 1
2.43
0
.62
–
–
(0.1
2) –
(0
.12)
–
Sin
gapo
re
34N
atSt
eel A
ustra
lia P
ty. L
td.
Au
D
56.
52
55.
92
(77.
43)
175
.08
196
.59
–
340
.97
(0.5
7) 3
.62
(4.1
9) –
A
ustra
lia
35N
atSt
eel E
quity
IV P
te. L
td.
SG
D
43.
72
–
131
.11
131
.11
–
–
–
–
–
–
–
Sin
gapo
re
36N
atSt
eel R
ecyc
ling
Pte
Ltd.
SG
D
43.
72
43.
72
125
.49
276
.11
106
.90
–
1,6
57.3
0 2
.92
0.5
3 2
.39
–
Sin
gapo
re
37N
atSt
eel T
rade
Inte
rnat
iona
l (Sh
angh
ai)
Com
pany
Ltd
. C
Ny
8.7
3 –
(0
.20)
0.1
8 0
.38
–
–
(0.0
2) –
(0
.02)
–
Chi
na
38N
atSt
eel T
rade
Inte
rnat
iona
l Pte
. Ltd
. u
SD
54.
28
15.
96
73.
36
259
.61
170
.29
0.0
6 2
,605
.81
9.2
6 1
.15
8.1
1 –
S
inga
pore
39
Nat
Stee
l Vin
a C
o. L
td.
VN
D
0.00
0.0
1 –
0
.01
–
–
0.0
2 –
–
–
–
V
ietn
am
40PT
Mat
eria
l Rec
yclin
g In
done
sia
SG
D
43.
72
–
–
–
–
–
–
–
–
–
–
Indo
nesi
a 41
The
Siam
Indu
stria
l Wire
Com
pany
Ltd
. T
HB
1.8
5 2
.02
22.
29
28.
06
3.7
5 –
4
3.13
4
.19
0.7
5 3
.44
–
Tha
iland

Hundred and sixth annual report 2012-13
216
` c
rore
s
Sl.
No.
Nam
e of
the
Com
pany
Rep
ortin
g cu
rren
cyEx
chan
ge
rate
Cap
ital
Res
erve
sTo
tal
Ass
ets
Tota
l Li
abili
ties
Inve
stm
ents
(e
xclu
ding
in
vest
men
t in
subs
idia
ries)
turn
over
Profi
t be
fore
ta
xatio
n
Prov
isio
n fo
r ta
xatio
n
Profi
t af
ter
taxa
tion
Prop
osed
d
ivid
end
Cou
ntry
42TS
N W
ires
Co.
Ltd
. T
HB
1.8
5 2
.61
(0.1
0) 4
.51
2.0
0 –
–
(0
.22)
–
(0.2
2) –
T
haila
nd
43Ta
ta S
teel
Eur
ope
Lim
ited
GBP
82.
17
33,3
81.6
7 (1
,193
.90)
34,
428.
13
2,2
40.3
6 –
–
(6
36.2
8) –
(6
36.2
8) –
u
k 44
Alm
ana
Stee
l Dub
ai (J
erse
y) L
imite
dAE
D14
.78
3.6
9 4
6.47
5
0.84
0
.68
–
0.0
9 (0
.54)
–
(0.5
4) –
Je
rsey
45Ap
ollo
Met
als
Ltd.
uSD
54.
28
111
.78
(141
.54)
65.
66
95.
42
–
128
.37
10.
24
–
10.
24
–
uSA
46As
horn
e H
ill M
anag
emen
t Col
lege
GBP
82.
17
–
68.
69
74.
37
5.6
8 –
2
9.43
(1
.86)
–
(1
.86)
–
u
k47
Augu
sta
Gru
ndst
ucks
Gm
bHEu
R 6
9.55
3
7.35
(3
8.98
) 1
3.06
1
4.69
–
–
1
.50
–
1.5
0 –
G
erm
any
48Au
tom
otiv
e La
ser T
echn
olog
ies
Lim
ited
GBP
82.
17
–
–
–
–
–
–
–
–
–
–
uk
49B
S Pe
nsio
n Fu
nd T
rust
ee L
td.
GBP
82.
17
17.
64
0.5
6 1
8.20
–
–
–
–
–
–
–
uk
50Ba
iley
Stee
ls L
imite
dG
BP 8
2.17
–
–
–
–
–
–
–
–
–
3
.67
uk
51Be
heer
maa
tsch
appi
j Ind
ustri
ele
Prod
ukte
n B.
V.Eu
R 6
9.55
0
.13
(47.
36)
48.
74
95.
97
–
–
(1.2
3) (0
.31)
(0.9
2) –
N
ethe
rland
s
52Be
lfin
Behe
erm
aats
chap
pij B
.V.
EuR
69.
55
0.4
7 –
0
.47
–
–
–
–
–
–
–
Net
herla
nds
53Be
ll &
Har
woo
d Li
mite
dG
BP 8
2.17
–
(1
0.38
) –
1
0.38
–
–
–
–
–
–
u
k54
Blas
tmeg
a Li
mite
dG
BP 8
2.17
7
64.2
0 0
.08
764
.30
0.0
2 –
–
–
–
–
–
u
k55
Blum
e St
ahls
ervi
ce G
mbH
EuR
69.
55
35.
61
(0.9
5)26
2.47
227
.81
–
1,1
05.0
4 (3
2.91
) 0
.66
(33.
57)
–
Ger
man
y56
Blum
e St
ahls
ervi
ce P
olsk
a Sp
.Z.O
.OPL
Z16
.67
0.0
9 (1
3.27
) 1
0.52
2
3.70
–
2
8.74
(1
.77)
–
(1.7
7) –
Po
land
57Bo
re S
amso
n G
roup
Ltd
GBP
82.
17
172
.56
(49.
24)
185
.07
61.
75
–
–
–
–
–
–
uk
58Bo
re S
teel
Ltd
.G
BP 8
2.17
1
31.4
8 8
.62
140
.10
–
–
–
–
–
–
–
uk
59Br
itish
Gui
de R
ails
Ltd
.G
BP 8
2.17
2
.47
37.
46
39.
93
– –
–
–
–
–
–
u
k60
Briti
sh S
teel
Cor
pora
tion
Ltd
GBP
82.
17
148
.54
102
.12
250
.66
–
–
–
–
–
–
–
uk
61Br
itish
Ste
el D
e M
exic
o S.
A. d
e C
.V.
uSD
54.
28
–
–
–
–
–
–
–
–
–
–
Mex
ico
62Br
itish
Ste
el D
irect
ors
(Nom
inee
s) L
imite
dG
BP 8
2.17
–
–
–
–
–
–
–
–
–
–
u
k63
Briti
sh S
teel
Em
ploy
ee S
hare
Ow
ners
hip
Trus
tees
Ltd
.G
BP 8
2.17
–
–
–
–
–
–
–
–
–
–
u
k
64Br
itish
Ste
el E
ngin
eerin
g St
eels
(Exp
orts
) Li
mite
dG
BP 8
2.17
–
–
0
.10
0.1
0 –
–
–
–
–
–
u
k
65Br
itish
Ste
el N
eder
land
Inte
rnat
iona
l B.V
.Eu
R 6
9.55
3
67.0
4 21
3.01
581.
12 1
.07
92.
49
–
25.2
2 (0
.33)
25.5
5 6
6.77
N
ethe
rland
s66
Briti
sh S
teel
Sam
son
Lim
ited
GBP
82.
17
8.2
2 –
8
.22
–
–
–
–
–
–
–
uk
67Br
itish
Ste
el S
ervi
ce C
entre
s Lt
d.G
BP 8
2.17
1
64.3
4 2
75.0
6 6
43.8
0 2
04.4
0 –
–
–
–
–
–
u
k68
Briti
sh S
teel
Tub
es E
xpor
ts L
td.
GBP
82.
17
–
–
–
–
–
–
(0.2
1) –
(0
.21)
0.2
1 u
k69
Briti
sh T
ubes
Sto
ckho
ldin
g Lt
d.G
BP 8
2.17
8
2.17
4
.36
86.
54
0.0
1 –
–
–
–
–
–
u
k70
Bs Q
uest
Tru
stee
Lim
ited
GBP
82.
17
–
–
–
–
–
–
–
–
–
–
uk
71Bu
rgdo
rfer G
rund
stue
cks
Gm
bHEu
R 6
9.55
0
.56
14.
28
16.
89
2.0
5 –
–
(0
.34)
(0.0
9) (0
.25)
–
Ger
man
y72
C V
Ben
ine
EuR
69.
55
31.
59
(0.1
5) 1
26.3
7 9
4.93
–
–
(0
.06)
–
(0.0
6) –
N
ethe
rland
s73
C W
alke
r & S
ons
Ltd.
GBP
82.
17
28.
76
104
.75
572
.31
438
.80
–
–
–
–
–
–
uk
74C
atni
c G
mbH
EuR
69.
55
0.1
8 2
6.39
3
4.85
8
.28
–
74.
86
7.3
1 1
.91
5.4
0 –
G
erm
any
75C
atni
c Li
mite
dG
BP 8
2.17
2
.65
(3.1
5) 0
.16
0.6
6 –
–
–
–
–
–
u
k76
Cbs
Inve
stis
sem
ents
SAS
EuR
69.
55
0.5
6 0
.56
3.9
8 2
.86
–
–
0.3
0 –
0
.30
–
Fran
ce77
Cla
ddin
g &
Dec
king
(uk)
Lim
ited
GBP
82.
17
38.
21
(34.
07)
14.
87
10.
73
–
–
–
–
–
–
uk
78C
ogen
t Pow
er E
lect
rical
Ste
els
Lim
ited
GBP
82.
17
–
–
–
–
–
–
(0.0
1) –
(0
.01)
–
uk
79C
ogen
t Pow
er In
c.C
AD 5
3.43
1
.60
160
.94
247
.94
85.
40
–
529
.17
20.
83
6.9
5 1
3.88
–
C
anad
a80
Cog
ent P
ower
SA
DE
CV
uSD
54.
28
0.0
5 (5
.94)
8.0
9 1
3.98
–
–
–
–
–
–
M
exic
o81
Cog
ent P
ower
Inc.
uSD
5
4.28
1
.63
21.
78
27.
75
4.3
4 –
–
–
–
–
–
u
SA
82C
ogen
t Pow
er L
imite
dG
BP 8
2.17
5
97.1
2 (2
40.5
7) 3
72.1
9 1
5.64
–
0
.04
0.8
4 0
.37
0.4
7 –
u
k83
Col
or S
teel
s Li
mite
dG
BP 8
2.17
0
.37
47.
81
48.
18
–
–
–
–
–
–
–
uk
84C
orbe
il Le
s R
ives
SC
IEu
R 6
9.55
4
.47
4.0
8 8
.57
0.0
2 –
–
–
–
–
–
Fr
ance

217
` c
rore
s
Sl.
No.
Nam
e of
the
Com
pany
Rep
ortin
g cu
rren
cyEx
chan
ge
rate
Cap
ital
Res
erve
sTo
tal
Ass
ets
Tota
l Li
abili
ties
Inve
stm
ents
(e
xclu
ding
in
vest
men
t in
subs
idia
ries)
turn
over
Profi
t be
fore
ta
xatio
n
Prov
isio
n fo
r ta
xatio
n
Profi
t af
ter
taxa
tion
Prop
osed
d
ivid
end
Cou
ntry
85C
orby
(Nor
than
ts) &
Dis
trict
Wat
er C
o.G
BP 8
2.17
2
.14
2.3
2 6
.75
2.2
9 –
3
.30
(0.4
9) –
(0
.49)
–
uk
86C
ordo
r (C
& B)
Lim
ited
GBP
82.
17
2.6
7 –
2
.67
–
–
–
–
–
–
–
uk
87C
orus
Aer
ospa
ce S
ervi
ce C
entre
Suz
hou
Co
Ltd.
uSD
54.
28
2.9
9 0
.14
33.
80
30.
67
–
46.
40
1.8
0 –
1
.80
–
Chi
na
88C
orus
Alu
min
ium
Ver
wal
tung
sges
ells
chaf
t M
bhEu
R 6
9.55
3
.62
(16.
14)
71.
30
83.
82
–
–
0.6
7 (3
.39)
4.0
6 –
G
erm
any
89C
orus
Bet
eilig
ungs
Gm
bHEu
R 6
9.55
8
.90
11.
55
20.
45
–
–
–
(0.0
7) –
(0
.07)
–
Ger
man
y90
Cor
us B
uild
ing
Syst
ems
Bulg
aria
AD
LEV
35.5
9 4
.16
(21.
02)
42.
14
59.
00
–
17.
63
(4.1
3) –
(4
.13)
–
Bulg
aria
91C
orus
Bui
ldin
g Sy
stem
s N
.V.
EuR
69.
55
0.9
5 6
.35
9.0
6 1
.76
–
–
(0.1
1) –
(0
.11)
–
Belg
ium
92C
orus
Bui
ldin
g Sy
stem
s SA
SEu
R 6
9.55
2
0.87
(1
3.63
) 7
.33
0.0
9 0
.19
–
–
–
–
–
Fran
ce93
Cor
us B
yggs
yste
m A
BSE
K 8
.33
0.8
3 4
4.62
6
3.28
1
7.83
–
1
24.2
2 0
.19
0.1
4 0
.05
–
Swed
en94
Cor
us C
NBV
Inve
stm
ents
GBP
82.
17
–
–
–
–
–
–
–
–
–
–
uk
95C
orus
Coa
tings
usa
Inc.
uSD
54.
28
–
3.7
9 4
.30
0.5
1 –
–
(0
.08)
–
(0.0
8) –
u
SA96
Cor
us C
old
draw
n Tu
bes
Lim
ited
GBP
82.
17
41.
09
(58.
98)
–
17.
89
–
–
–
–
–
–
uk
97C
orus
Eng
inee
ring
Stee
ls (u
k) L
imite
dG
BP 8
2.17
8
2.17
2
94.2
3 3
76.4
1 0
.01
–
–
–
–
–
–
uk
98C
orus
Eng
inee
ring
Stee
ls H
oldi
ngs
Lim
ited
GBP
82.
17
3,4
17.4
1 2
65.0
7 4
,671
.24
988
.76
–
–
–
–
–
–
uk
99C
orus
Eng
inee
ring
Stee
ls L
imite
dG
BP 8
2.17
3
,797
.12
109
.29
3,9
06.4
1 –
–
–
–
–
–
–
u
k10
0C
orus
Eng
inee
ring
Stee
ls O
vers
eas
Hol
ding
s Li
mite
dG
BP 8
2.17
4
.11
4.0
6 1
6.07
7
.90
–
–
–
–
–
–
uk
101
Cor
us G
roup
Lim
ited
GBP
82.
17
18,1
10.8
0 1,
298.
3224
,996
.84
5,5
87.7
2 –
–
(2,
947.
98)
– (
2,94
7.98
) –
u
k10
2C
orus
Hol
ding
s Lt
d.G
BP 8
2.17
2
.05
0.8
2 2
.88
0.0
1 –
–
–
–
–
–
u
k10
3C
orus
Inte
rnat
iona
l (O
vers
eas
Hol
ding
s)
Lim
ited
GBP
82.
17
2,4
44.6
0 1
,326
.92
3,7
74.1
2 2
.60
–
–
72.
24
–
72.
24
–
uk
104
Cor
us In
tern
atio
nal L
imite
dG
BP 8
2.17
4
,226
.63
(1,7
80.3
3) 2
,834
.46
388
.16
0.1
9 –
3
7.36
–
3
7.36
–
u
k10
5C
orus
Inte
rnat
iona
l Rom
ania
SR
L.R
ON
15.7
7 0
.01
0.7
1 0
.81
0.0
9 –
–
0
.16
0.0
3 0
.13
–
Rom
ania
106
Cor
us In
vest
men
ts L
td.
GBP
82.
17
180
.78
5.5
9 1
86.3
7 –
–
–
–
–
–
–
u
k10
7C
orus
Irel
and
Ltd.
EuR
69.
55
–
4.4
6 4
.51
0.0
5 –
–
(0
.44)
–
(0.4
4) –
Ire
land
108
Cor
us L
arge
Dia
met
er P
ipes
Lim
ited
GBP
82.
17
653
.29
(55.
55)
597
.74
–
–
–
–
–
–
–
uk
109
Cor
us L
iais
on S
ervi
ces
(Indi
a) L
imite
dG
BP 8
2.17
8
.22
(8.1
9) 1
.55
1.5
2 –
–
–
–
–
–
u
k11
0C
orus
Man
agem
ent L
imite
dG
BP 8
2.17
–
(3
72.5
9) 2
,019
.94
2,3
92.5
3 –
–
–
–
–
–
u
k11
1C
orus
Pac
kagi
ng P
lus
Nor
way
AS
NO
K9.
27 0
.11
(255
.89)
8.0
8 2
63.8
6 –
–
(1
5.74
) –
(1
5.74
) –
N
orw
ay11
2C
orus
Prim
ary
Alum
iniu
m B
.V.
EuR
69.
55
273
.85
(385
.65)
266
.41
378
.21
–
–
(5.1
9) (1
.30)
(3.8
9) –
N
ethe
rland
s11
3C
orus
Pro
perti
es (G
erm
any)
Lim
ited
GBP
82.
17
–
(0.3
0) –
0
.30
–
–
–
–
–
–
uk
114
Cor
us P
rope
rtyG
BP 8
2.17
–
–
0
.01
0.0
1 –
–
–
–
–
–
u
k11
5C
orus
Rep
ublic
Of I
rela
nd S
ubsi
diar
ies
Pens
ion
Sche
me
Trus
tee
Lim
ited
EuR
69.
55
–
–
–
–
–
–
–
–
–
–
Irela
nd
116
Cor
us S
ervi
ce C
ente
r Mila
no S
paEu
R 6
9.55
1
0.85
(1
2.94
) 3
.51
5.6
0 –
–
3
5.07
–
3
5.07
–
Ita
ly11
7C
orus
Ser
vice
Cen
tre L
imite
dG
BP 8
2.17
2
8.60
1
02.5
5 1
31.1
5 –
–
–
–
–
–
–
N Ir
elan
d11
8C
orus
She
et &
Tub
e In
c.u
SD 5
4.28
–
–
–
–
–
–
–
–
–
–
u
SA11
9C
orus
Ste
el S
ervi
ce S
TP L
LCR
uB
1.75
0.2
0 (1
.94)
4.6
0 6
.34
–
–
(0.6
4) (0
.15)
(0.4
9) –
R
ussi
a12
0C
orus
Tric
o H
oldi
ngs
Inc.
uSD
54.
28
778
.68
(778
.68)
–
–
–
–
–
–
–
–
uSA
121
Cor
us T
ubes
Pol
and
Spol
ka Z
.O.O
PLZ
16.6
7 0
.08
(1.3
7) 0
.42
1.7
1 –
–
(0
.04)
–
(0.0
4) –
Po
land
122
Cor
us u
k H
ealth
care
Tru
stee
Lim
ited
GBP
82.
17
–
–
–
–
–
–
–
–
–
–
uk
123
Cor
us u
krai
ne L
LCu
AH 6
.67
0.0
3 0
.03
0.0
6 –
–
–
–
–
–
–
u
krai
ne12
4C
pn (8
5) L
imite
dG
BP 8
2.17
–
(0
.69)
–
0.6
9 –
–
–
–
–
–
u
k

Hundred and sixth annual report 2012-13
218
` c
rore
s
Sl.
No.
Nam
e of
the
Com
pany
Rep
ortin
g cu
rren
cyEx
chan
ge
rate
Cap
ital
Res
erve
sTo
tal
Ass
ets
Tota
l Li
abili
ties
Inve
stm
ents
(e
xclu
ding
in
vest
men
t in
subs
idia
ries)
turn
over
Profi
t be
fore
ta
xatio
n
Prov
isio
n fo
r ta
xatio
n
Profi
t af
ter
taxa
tion
Prop
osed
d
ivid
end
Cou
ntry
125
Cru
cibl
e In
sura
nce
Com
pany
Ltd
.G
BP 8
2.17
8
2.17
3
07.5
9 7
59.3
1 3
69.5
5 3
78.1
7 –
4
9.80
–
4
9.80
1
6.43
I o
f Man
126
Deg
els
Gm
bHEu
R 6
9.55
0
.21
(1.2
0) 2
37.2
4 2
38.2
3 –
1
,119
.21
6.2
8 (0
.26)
6.5
4 7
.12
Ger
man
y12
7D
emka
B.V
.Eu
R 6
9.55
5
8.10
3
.40
61.
73
0.2
3 –
–
0
.90
0.2
2 0
.68
–
Net
herla
nds
128
Dsr
m G
roup
Plc
.G
BP 8
2.17
4
1.09
1
06.6
1 1
47.7
0 –
–
–
–
–
–
–
u
k12
9Er
ic O
lsso
n &
Sone
r For
valtn
ings
AB
SEK
8.3
3 0
.08
3.7
6 3
.89
0.0
5 –
–
0
.06
–
0.0
6 –
Sw
eden
130
Esm
il B.
V.Eu
R 6
9.55
1
00.9
7 (8
2.74
) 1
8.29
0
.06
–
–
0.2
4 0
.06
0.1
8 –
N
ethe
rland
s13
1Eu
ro–L
amin
atio
ns L
imite
dG
BP 8
2.17
0
.01
(0.0
1) –
–
–
–
–
–
–
–
u
k13
2Eu
ropr
essi
ngs
Lim
ited
GBP
82.
17
4.9
3 0
.32
5.2
5 –
–
–
–
–
–
–
u
k13
3Fi
rste
el G
roup
Lim
ited
GBP
82.
17
147
.30
0.0
2 2
90.8
9 1
43.5
7 –
–
–
–
–
–
u
k13
4Fi
rste
el H
oldi
ngs
Lim
ited
GBP
82.
17
27.
84
35.
75
142
.40
78.
81
–
–
–
–
–
–
uk
135
Firs
teel
Stri
p M
ill Pr
oduc
ts L
imite
dG
BP 8
2.17
7
1.49
1
2.51
8
4.00
–
–
–
–
–
–
–
u
k13
6Fi
sche
r Pro
fil G
mbH
EuR
69.
55
71.
13
(26.
32)
218
.49
173
.68
–
741
.22
3.6
1 0
.91
2.7
0 3
.71
Ger
man
y13
7G
ambl
e Si
mm
s M
etal
s Lt
d.Eu
R 6
9.55
4
.42
94.
46
100
.84
1.9
6 –
–
–
–
–
–
Ire
land
138
Gra
nt L
yon
Eagr
e Lt
d.G
BP 8
2.17
3
.08
45.
32
48.
40
–
–
–
–
–
–
–
uk
139
H E
Sam
son
Ltd.
GBP
82.
17
30.
81
12.
10
42.
92
0.0
1 –
–
–
–
–
–
u
k14
0H
adfie
lds
Hol
ding
s Lt
d.G
BP 8
2.17
0
.82
(66.
85)
4.3
5 7
0.38
–
–
–
–
–
–
u
k14
1H
amm
erm
ega
Lim
ited
GBP
82.
17
18.
49
–
18.
49
–
–
–
–
–
–
–
uk
142
Har
row
mills
Pro
perti
es L
td.
GBP
82.
17
0.0
1 1
56.4
9 1
56.5
0 –
–
–
–
–
–
–
u
k14
3H
ille &
Mul
ler G
mbH
EuR
69.
55
35.
60
102
.64
385
.83
247
.59
–
520
.90
(17.
14)
(9.8
6) (7
.28)
19.
43
Ger
man
y14
4H
ille &
Mul
ler u
sa In
c.u
SD 5
4.28
0
.02
88.
06
94.
33
6.2
5 –
2
1.27
1
.64
(1.3
8) 3
.02
–
uSA
145
Hoo
gove
ns (u
k) L
imite
dG
BP 8
2.17
1
64.3
4 (1
60.5
2) 6
7.54
6
3.72
–
–
–
–
–
–
u
k14
6H
oogo
vens
Alu
min
ium
uk
Lim
ited
GBP
82.
17
12.
20
(10.
21)
1.9
9 –
–
–
–
–
–
–
u
k14
7H
oogo
vens
Fin
ance
B.V
.Eu
R 6
9.55
1
,029
.06
375
.98
1,4
17.3
3 1
2.29
–
–
7
.93
1.9
8 5
.95
–
Net
herla
nds
148
Hoo
gove
ns u
sa In
c.u
SD 5
4.28
3
30.2
4 5
5.86
3
94.2
8 8
.18
–
–
(0.0
5) 1
.06
(1.1
1) –
u
SA14
9H
uize
nbez
it “B
rees
aap”
B.V
.Eu
R 6
9.55
0
.32
(7.8
2) 2
.08
9.5
8 –
0
.12
(0.0
6) (0
.02)
(0.0
4) –
N
ethe
rland
s15
0Ic
kles
Cot
tage
Tru
stG
BP 8
2.17
–
0
.57
0.9
9 0
.42
–
0.8
0 0
.30
0.0
6 0
.24
–
uk
151
Imm
obilli
ere
De
Con
stru
ctio
n D
e M
aube
uge
Et L
ouvr
oil S
ASEu
R 6
9.55
0
.27
1.2
8 1
.93
0.3
8 –
1
.32
0.6
0 0
.20
0.4
0 –
Fr
ance
152
Inte
r Met
al D
istri
butio
n SA
SEu
R 6
9.55
0
.53
22.
93
76.
68
53.
22
–
333
.04
5.3
5 0
.99
4.3
6 –
Fr
ance
153
kalz
ip A
sia
Pte
Lim
ited
SGD
43.
72
59.
02
(80.
90)
77.
97
99.
85
–
91.
75
(8.9
2) (1
.14)
(7.7
8) –
Si
ngap
ore
154
kalz
ip F
ZEAE
D
14.7
81.
48–
1.48
–
–
–
–
–
–
–
uAE
15
5ka
lzip
Gm
bHEu
R 6
9.55
0
.24
0.6
8 1
.06
0.1
4 –
1
.25
0.0
6 0
.01
0.0
5 –
Au
stria
156
kalz
ip G
mbH
Eu
R
69.
55
44.
47
(21.
08)
214
.23
190
.84
–
349
.15
0.7
6 0
.12
0.6
4 0
.19
Ger
man
y 15
7ka
lzip
Gua
ngzh
ou L
imite
dC
Ny
8.7
3 2
2.04
3
6.87
1
50.5
6 9
1.65
–
1
32.3
1 1
.54
0.2
3 1
.31
–
Chi
na15
8ka
lzip
Inc
uSD
54.
28
–
(33.
15)
8.6
1 4
1.76
–
1
6.89
(8
.73)
–
(8.7
3) –
u
SA15
9ka
lzip
Indi
a Pr
ivat
e Li
mite
dIN
R 1
.00
5.4
6 2
.34
24.
75
16.
95
–
33.
56
1.1
5 0
.40
0.7
5 –
In
dia
160
kalz
ip It
aly
SRL
EuR
69.
55
0.0
7 0
.07
1.2
3 1
.09
–
3.0
3 0
.15
0.1
0 0
.05
–
Italy
161
kalz
ip L
imite
dG
BP 8
2.17
3
0.40
(1
.06)
93.
02
63.
68
–
179
.28
(19.
35)
–
(19.
35)
–
uk
162
kalz
ip S
pain
S.L
.u.
EuR
69.
55
6.2
6 3
.56
10.
87
1.0
5 –
4
.96
0.3
5 0
.08
0.2
7 –
Sp
ain
163
Layd
e St
eel S
.L.
EuR
69.
55
42.
74
(167
.11)
277
.66
402
.03
0.0
2 6
81.8
6 (6
1.47
) 0
.68
(62.
15)
–
Spai
n16
4Li
ster
Tub
es L
td.
EuR
69.
55
–
11.
25
11.
25
–
–
–
–
–
–
–
Irela
nd16
5Lo
ndon
Wor
ks S
teel
Com
pany
Ltd
.G
BP 8
2.17
–
(8
4.69
) 4
6.01
1
30.7
0 –
–
–
–
–
–
u
k16
6M
idla
nd S
teel
Sup
plie
s Lt
d.G
BP 8
2.17
–
–
–
–
–
–
–
–
–
–
u
k16
7M
istb
ury
Inve
stm
ents
Lim
ited
GBP
82.
17
–
0.6
2 1
1.54
1
0.92
–
–
–
–
–
–
u
k16
8M
onta
na B
ausy
stem
e AG
CH
F 5
7.01
4
5.61
8
4.91
2
06.1
2 7
5.60
–
4
08.9
8 3
0.73
5
.72
25.
01
23.
43
Switz
erla
nd
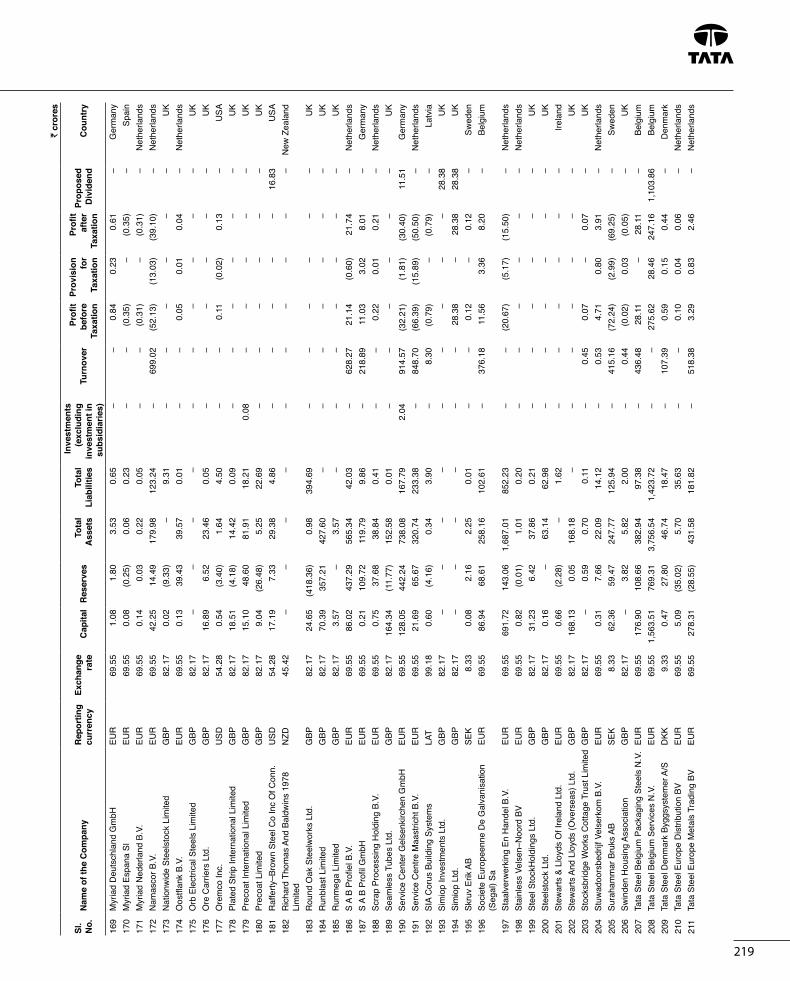
219
` c
rore
s
Sl.
No.
Nam
e of
the
Com
pany
Rep
ortin
g cu
rren
cyEx
chan
ge
rate
Cap
ital
Res
erve
sTo
tal
Ass
ets
Tota
l Li
abili
ties
Inve
stm
ents
(e
xclu
ding
in
vest
men
t in
subs
idia
ries)
turn
over
Profi
t be
fore
ta
xatio
n
Prov
isio
n fo
r ta
xatio
n
Profi
t af
ter
taxa
tion
Prop
osed
d
ivid
end
Cou
ntry
169
Myr
iad
Deu
tsch
land
Gm
bHEu
R 6
9.55
1
.08
1.8
0 3
.53
0.6
5 –
–
0
.84
0.2
3 0
.61
–
Ger
man
y17
0M
yria
d Es
pana
Sl
EuR
69.
55
0.0
8 (0
.25)
0.0
6 0
.23
–
–
(0.3
5) –
(0
.35)
–
Spai
n17
1M
yria
d N
eder
land
B.V
.Eu
R 6
9.55
0
.14
0.0
3 0
.22
0.0
5 –
–
(0
.31)
–
(0.3
1) –
N
ethe
rland
s17
2N
amas
cor B
.V.
EuR
69.
55
42.
25
14.
49
179
.98
123
.24
–
699
.02
(52.
13)
(13.
03)
(39.
10)
–
Net
herla
nds
173
Nat
ionw
ide
Stee
lsto
ck L
imite
dG
BP 8
2.17
0
.02
(9.3
3) –
9
.31
–
–
–
–
–
–
uk
174
Oos
tflan
k B.
V.Eu
R 6
9.55
0
.13
39.
43
39.
57
0.0
1 –
–
0
.05
0.0
1 0
.04
–
Net
herla
nds
175
Orb
Ele
ctric
al S
teel
s Li
mite
dG
BP 8
2.17
–
–
–
–
–
–
–
–
–
–
u
k17
6O
re C
arrie
rs L
td.
GBP
82.
17
16.
89
6.5
2 2
3.46
0
.05
–
–
–
–
–
–
uk
177
Ore
mco
Inc.
uSD
54.
28
0.5
4 (3
.40)
1.6
4 4
.50
–
–
0.1
1 (0
.02)
0.1
3 –
u
SA17
8Pl
ated
Stri
p In
tern
atio
nal L
imite
dG
BP 8
2.17
1
8.51
(4
.18)
14.
42
0.0
9 –
–
–
–
–
–
u
k17
9Pr
ecoa
t Int
erna
tiona
l Lim
ited
GBP
82.
17
15.
10
48.
60
81.
91
18.
21
0.0
8 –
–
–
–
–
u
k18
0Pr
ecoa
t Lim
ited
GBP
82.
17
9.0
4 (2
6.48
) 5
.25
22.
69
–
–
–
–
–
–
uk
181
Raf
ferty
–Bro
wn
Stee
l Co
Inc
Of C
onn.
uSD
54.
28
17.
19
7.3
3 2
9.38
4
.86
–
–
–
–
–
16.
83
uSA
182
Ric
hard
Tho
mas
And
Bal
dwin
s 19
78
Lim
ited
NZD
45.4
2 –
–
–
–
–
–
–
–
–
–
N
ew Z
eala
nd
183
Rou
nd O
ak S
teel
wor
ks L
td.
GBP
82.
17
24.
65
(418
.36)
0.9
8 3
94.6
9 –
–
–
–
–
–
u
k18
4R
unbl
ast L
imite
dG
BP 8
2.17
7
0.39
3
57.2
1 4
27.6
0 –
–
–
–
–
–
–
u
k18
5R
unm
ega
Lim
ited
GBP
82.
17
3.5
7 –
3
.57
–
–
–
–
–
–
–
uk
186
S A
B Pr
ofiel
B.V
.Eu
R 6
9.55
8
6.02
4
37.2
9 5
65.3
4 4
2.03
–
6
28.2
7 2
1.14
(0
.60)
21.
74
–
Net
herla
nds
187
S A
B Pr
ofil G
mbH
EuR
69.
55
0.2
1 1
09.7
2 1
19.7
9 9
.86
–
218
.89
11.
03
3.0
2 8
.01
–
Ger
man
y18
8Sc
rap
Proc
essi
ng H
oldi
ng B
.V.
EuR
69.
55
0.7
5 3
7.68
3
8.84
0
.41
–
–
0.2
2 0
.01
0.2
1 –
N
ethe
rland
s18
9Se
amle
ss T
ubes
Ltd
.G
BP 8
2.17
1
64.3
4 (1
1.77
) 1
52.5
8 0
.01
–
–
–
–
–
–
uk
190
Serv
ice
Cen
ter G
else
nkirc
hen
Gm
bHEu
R 6
9.55
1
28.0
5 44
2.24
738.
08 1
67.7
9 2
.04
914
.57
(32.
21)
(1.8
1)(3
0.40
) 1
1.51
G
erm
any
191
Serv
ice
Cen
tre M
aast
richt
B.V
.Eu
R 6
9.55
2
1.69
6
5.67
3
20.7
4 2
33.3
8 –
8
48.7
0 (6
6.39
) (1
5.89
) (5
0.50
) –
N
ethe
rland
s19
2SI
A C
orus
Bui
ldin
g Sy
stem
sLA
T 9
9.18
0
.60
(4.1
6) 0
.34
3.9
0 –
8
.30
(0.7
9) –
(0
.79)
–
Latv
ia19
3Si
mio
p In
vest
men
ts L
td.
GBP
82.
17
–
–
–
–
–
–
–
–
–
28.
38
uk
194
Sim
iop
Ltd.
GBP
82.
17
–
–
–
–
–
–
28.
38
–
28.
38
28.
38
uk
195
Skru
v Er
ik A
BSE
K 8
.33
0.0
8 2
.16
2.2
5 0
.01
–
–
0.1
2 –
0
.12
–
Swed
en19
6So
ciet
e Eu
rope
enne
De
Gal
vani
satio
n (S
egal
) Sa
EuR
69.
55
86.
94
68.
61
258
.16
102
.61
–
376
.18
11.
56
3.3
6 8
.20
–
Belg
ium
197
Staa
lver
wer
king
En
Han
del B
.V.
EuR
69.
55
691
.72
143
.06
1,6
87.0
1 8
52.2
3 –
–
(2
0.67
) (5
.17)
(15.
50)
–
Net
herla
nds
198
Stai
nles
s Ve
lsen
–Noo
rd B
VEu
R 6
9.55
0
.82
(0.0
1) 1
.01
0.2
0 –
–
–
–
–
–
N
ethe
rland
s19
9St
eel S
tock
Hol
ding
s Lt
d.G
BP 8
2.17
3
1.23
6
.42
37.
86
0.2
1 –
–
–
–
–
–
u
k20
0St
eels
tock
Ltd
.G
BP 8
2.17
0
.16
–
63.
14
62.
98
–
–
–
–
–
–
uk
201
Stew
arts
& L
loyd
s O
f Ire
land
Ltd
.Eu
R 6
9.55
0
.66
(2.2
8) –
1
.62
–
–
–
–
–
–
Irela
nd20
2St
ewar
ts A
nd L
loyd
s (O
vers
eas)
Ltd
.G
BP 8
2.17
1
68.1
3 0
.05
168
.18
– –
–
–
–
–
–
u
k20
3St
ocks
brid
ge W
orks
Cot
tage
Tru
st L
imite
dG
BP 8
2.17
–
0
.59
0.7
0 0
.11
–
0.4
5 0
.07
–
0.0
7 –
u
k20
4St
uwad
oors
bedr
ijf V
else
rkom
B.V
.Eu
R 6
9.55
0.
317.
6622
.09
14.1
2 –
0
.53
4.7
1 0
.80
3.9
1 –
N
ethe
rland
s20
5Su
raha
mm
ar B
ruks
AB
SEK
8.3
3 6
2.36
5
9.47
2
47.7
7 1
25.9
4 –
4
15.1
6 (7
2.24
) (2
.99)
(69.
25)
–
Swed
en20
6Sw
inde
n H
ousi
ng A
ssoc
iatio
nG
BP 8
2.17
–
3
.82
5.8
2 2
.00
–
0.4
4 (0
.02)
0.0
3 (0
.05)
–
uk
207
Tata
Ste
el B
elgi
um P
acka
ging
Ste
els
N.V
.Eu
R 6
9.55
1
76.9
0 1
08.6
6 3
82.9
4 9
7.38
–
4
36.4
8 2
8.11
–
2
8.11
–
Be
lgiu
m20
8Ta
ta S
teel
Bel
gium
Ser
vice
s N
.V.
EuR
69.
55
1,5
63.5
1 7
69.3
1 3
,756
.54
1,4
23.7
2 –
–
2
75.6
2 2
8.46
2
47.1
6 1
,103
.86
Belg
ium
209
Tata
Ste
el D
enm
ark
Bygg
syst
emer
A/S
DKK
9.3
3 0
.47
27.
80
46.
74
18.
47
–
107
.39
0.5
9 0
.15
0.4
4 –
D
enm
ark
210
Tata
Ste
el E
urop
e D
istri
butio
n BV
EuR
69.
55
5.0
9 (3
5.02
) 5
.70
35.
63
–
–
0.1
0 0
.04
0.0
6 –
N
ethe
rland
s21
1Ta
ta S
teel
Eur
ope
Met
als
Trad
ing
BVEu
R 6
9.55
2
78.3
1 (2
8.55
) 4
31.5
8 1
81.8
2 –
5
18.3
8 3
.29
0.8
3 2
.46
–
Net
herla
nds
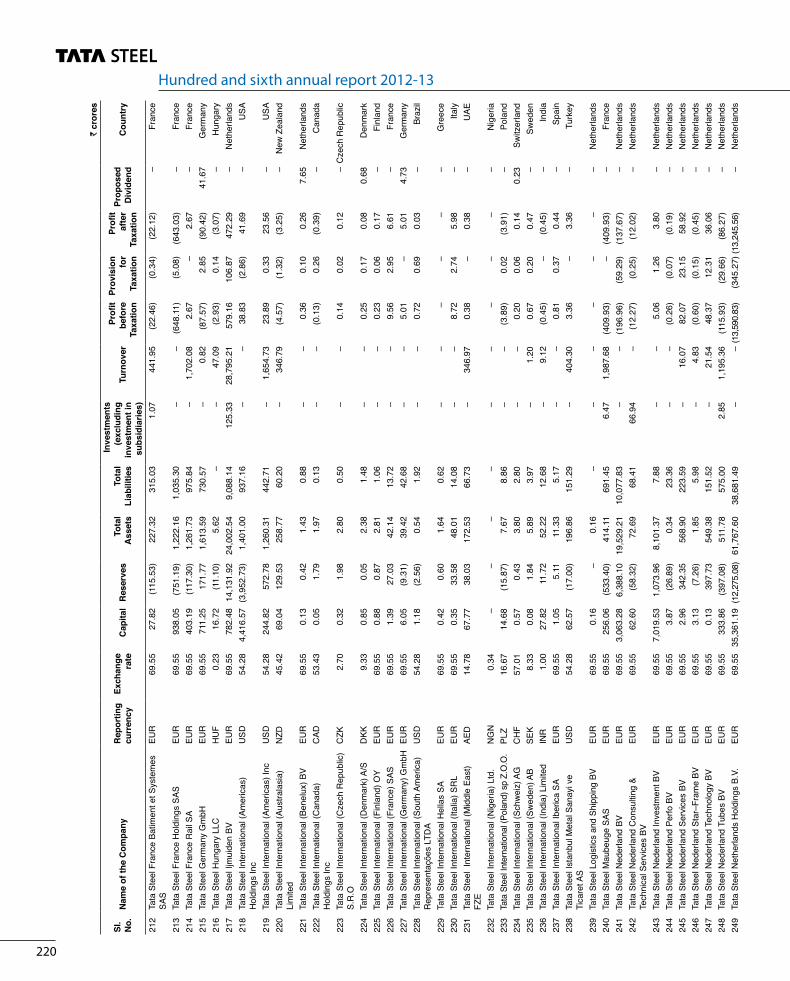
Hundred and sixth annual report 2012-13
220
` c
rore
s
Sl.
No.
Nam
e of
the
Com
pany
Rep
ortin
g cu
rren
cyEx
chan
ge
rate
Cap
ital
Res
erve
sTo
tal
Ass
ets
Tota
l Li
abili
ties
Inve
stm
ents
(e
xclu
ding
in
vest
men
t in
subs
idia
ries)
turn
over
Profi
t be
fore
ta
xatio
n
Prov
isio
n fo
r ta
xatio
n
Profi
t af
ter
taxa
tion
Prop
osed
d
ivid
end
Cou
ntry
212
Tata
Ste
el F
ranc
e Ba
timen
t et S
yste
mes
SA
SEu
R 6
9.55
2
7.82
(1
15.5
3) 2
27.3
2 3
15.0
3 1
.07
441
.95
(22.
46)
(0.3
4) (2
2.12
) –
Fr
ance
213
Tata
Ste
el F
ranc
e H
oldi
ngs
SAS
EuR
69.
55
938
.05
(751
.19)
1,22
2.16
1,0
35.3
0 –
–
(6
48.1
1) (5
.08)
(643
.03)
–
Fran
ce21
4Ta
ta S
teel
Fra
nce
Rai
l SA
EuR
69.
55
403
.19
(117
.30)
1,2
61.7
3 9
75.8
4 –
1
,702
.08
2.6
7 –
2
.67
–
Fran
ce21
5Ta
ta S
teel
Ger
man
y G
mbH
EuR
69.
55
711
.25
171.
771,
613.
59 7
30.5
7 –
0
.82
(87.
57)
2.8
5 (9
0.42
) 4
1.67
G
erm
any
216
Tata
Ste
el H
unga
ry L
LCH
uF
0.23
16.
72
(11.
10)
5.6
2 –
–
4
7.09
(2
.93)
0.1
4 (3
.07)
–
Hun
gary
217
Tata
Ste
el Ij
mui
den
BVEu
R 6
9.55
7
82.4
8 14
,131
.92
24,0
02.5
4 9
,088
.14
125.
33 2
8,79
5.21
57
9.16
106
.87
472.
29 –
N
ethe
rland
s21
8Ta
ta S
teel
Inte
rnat
iona
l (Am
eric
as)
Hol
ding
s In
cu
SD 5
4.28
4
,416
.57
(3,9
52.7
3) 1
,401
.00
937
.16
–
–
38.
83
(2.8
6) 4
1.69
–
u
SA
219
Tata
Ste
el In
tern
atio
nal (
Amer
icas
) Inc
uSD
54.
28
244
.82
572
.78
1,2
60.3
1 4
42.7
1 –
1
,654
.73
23.
89
0.3
3 2
3.56
–
u
SA22
0Ta
ta S
teel
Inte
rnat
iona
l (Au
stra
lasi
a)
Lim
ited
NZD
45.4
2 6
9.04
1
29.5
3 2
58.7
7 6
0.20
–
3
46.7
9 (4
.57)
(1.3
2) (3
.25)
–
New
Zea
land
221
Tata
Ste
el In
tern
atio
nal (
Bene
lux)
BV
EuR
69.
55
0.1
3 0
.42
1.4
3 0
.88
–
–
0.3
6 0
.10
0.2
6 7
.65
Net
herla
nds
222
Tata
Ste
el In
tern
atio
nal (
Can
ada)
H
oldi
ngs
Inc
CAD
53.
43
0.0
5 1
.79
1.9
7 0
.13
–
–
(0.1
3) 0
.26
(0.3
9) –
C
anad
a
223
Tata
Ste
el In
tern
atio
nal (
Cze
ch R
epub
lic)
S.R
.O
CZk
2.70
0.3
2 1
.98
2.8
0 0
.50
–
–
0.1
4 0
.02
0.1
2 –
Cze
ch R
epub
lic
224
Tata
Ste
el In
tern
atio
nal (
Den
mar
k) A
/SD
KK 9
.33
0.8
5 0
.05
2.3
8 1
.48
–
–
0.2
5 0
.17
0.0
8 0
.68
Den
mar
k22
5Ta
ta S
teel
Inte
rnat
iona
l (Fi
nlan
d) O
yEu
R 6
9.55
0
.88
0.8
7 2
.81
1.0
6 –
–
0
.23
0.0
6 0
.17
–
Finl
and
226
Tata
Ste
el In
tern
atio
nal (
Fran
ce) S
ASEu
R 6
9.55
1
.39
27.
03
42.
14
13.
72
–
–
9.5
6 2
.95
6.6
1 –
Fr
ance
227
Tata
Ste
el In
tern
atio
nal (
Ger
man
y) G
mbH
EuR
69.
55
6.0
5 (9
.31)
39.
42
42.
68
–
–
5.0
1 –
5
.01
4.7
3 G
erm
any
228
Tata
Ste
el In
tern
atio
nal (
Sout
h Am
eric
a)
Rep
rese
ntaç
ões
LTD
Au
SD 5
4.28
1
.18
(2.5
6) 0
.54
1.9
2 –
–
0
.72
0.6
9 0
.03
–
Braz
il
229
Tata
Ste
el In
tern
atio
nal H
ella
s SA
EuR
69.
55
0.4
2 0
.60
1.6
4 0
.62
–
–
–
–
–
–
Gre
ece
230
Tata
Ste
el In
tern
atio
nal (
Italia
) SR
LEu
R 6
9.55
0
.35
33.
58
48.
01
14.
08
–
–
8.7
2 2
.74
5.9
8 –
Ita
ly23
1Ta
ta S
teel
Int
erna
tiona
l (M
iddl
e Ea
st)
FZE
AED
14.
78
67.
77
38.
03
172
.53
66.
73
–
346
.97
0.3
8 –
0
.38
–
uAE
232
Tata
Ste
el In
tern
atio
nal (
Nig
eria
) Ltd
.N
GN
0.34
–
–
–
–
–
–
–
–
–
–
Nig
eria
233
Tata
Ste
el In
tern
atio
nal (
Pola
nd) s
p Z.
O.O
.PL
Z 1
6.67
1
4.68
(1
5.87
) 7
.67
8.8
6 –
–
(3
.89)
0.0
2 (3
.91)
–
Pola
nd23
4Ta
ta S
teel
Inte
rnat
iona
l (Sc
hwei
z) A
GC
HF
57.
01
0.5
7 0
.43
3.8
0 2
.80
–
–
0.2
0 0
.06
0.1
4 0
.23
Switz
erla
nd23
5Ta
ta S
teel
Inte
rnat
iona
l (Sw
eden
) AB
SEK
8.3
3 0
.08
1.8
4 5
.89
3.9
7 –
1
.20
0.6
7 0
.20
0.4
7 –
Sw
eden
236
Tata
Ste
el In
tern
atio
nal (
Indi
a) L
imite
dIN
R 1
.00
27.
82
11.
72
52.
22
12.
68
–
9.1
2 (0
.45)
–
(0.4
5) –
In
dia
237
Tata
Ste
el In
tern
atio
nal I
beric
a SA
EuR
69.
55
1.0
5 5
.11
11.
33
5.1
7 –
–
0
.81
0.3
7 0
.44
–
Spai
n23
8Ta
ta S
teel
Ista
nbul
Met
al S
anay
i ve
Tica
ret A
Su
SD 5
4.28
6
2.57
(1
7.00
) 1
96.8
6 1
51.2
9 –
4
04.3
0 3
.36
–
3.3
6 –
Tu
rkey
239
Tata
Ste
el L
ogis
tics
and
Ship
ping
BV
EuR
69.
55
0.1
6 –
0
.16
–
–
–
–
–
–
–
Net
herla
nds
240
Tata
Ste
el M
aube
uge
SAS
EuR
69.
55
256
.06
(533
.40)
414.
11 6
91.4
5 6
.47
1,9
87.6
8 (4
09.9
3) –
(4
09.9
3) –
Fr
ance
241
Tata
Ste
el N
eder
land
BV
EuR
69.
55
3,0
63.2
8 6,
388.
1019
,529
.21
10,
077.
83
–
–
(196
.96)
(59.
29)
(137
.67)
–
Net
herla
nds
242
Tata
Ste
el N
eder
land
Con
sulti
ng &
Te
chni
cal S
ervi
ces
BVEu
R 6
9.55
6
2.60
(5
8.32
) 7
2.69
6
8.41
6
6.94
–
(1
2.27
) (0
.25)
(12.
02)
–
Net
herla
nds
243
Tata
Ste
el N
eder
land
Inve
stm
ent B
VEu
R 6
9.55
7
,019
.53
1,0
73.9
6 8
,101
.37
7.8
8 –
–
5
.06
1.2
6 3
.80
–
Net
herla
nds
244
Tata
Ste
el N
eder
land
Per
fo B
VEu
R 6
9.55
3
.87
(26.
89)
0.3
4 2
3.36
–
–
(0
.26)
(0.0
7) (0
.19)
–
Net
herla
nds
245
Tata
Ste
el N
eder
land
Ser
vice
s BV
EuR
69.
55
2.9
6 3
42.3
5 5
68.9
0 2
23.5
9 –
1
6.07
8
2.07
2
3.15
5
8.92
–
N
ethe
rland
s24
6Ta
ta S
teel
Ned
erla
nd S
tar–
Fram
e BV
EuR
69.
55
3.1
3 (7
.26)
1.8
5 5
.98
–
4.8
3 (0
.60)
(0.1
5) (0
.45)
–
Net
herla
nds
247
Tata
Ste
el N
eder
land
Tec
hnol
ogy
BVEu
R 6
9.55
0
.13
397
.73
549
.38
151
.52
–
21.
54
48.
37
12.
31
36.
06
–
Net
herla
nds
248
Tata
Ste
el N
eder
land
Tub
es B
VEu
R 6
9.55
3
33.8
6 (3
97.0
8)51
1.78
575.
00 2
.85
1,1
95.3
6 (1
15.9
3) (2
9.66
) (8
6.27
) –
N
ethe
rland
s24
9Ta
ta S
teel
Net
herla
nds
Hol
ding
s B.
V.Eu
R 6
9.55
35
,361
.19
(12,
275.
08)
61,7
67.6
0 3
8,68
1.49
–
–
(13,
590.
83)
(345
.27)
(13,
245.
56)
–
Net
herla
nds

221
` c
rore
s
Sl.
No.
Nam
e of
the
Com
pany
Rep
ortin
g cu
rren
cyEx
chan
ge
rate
Cap
ital
Res
erve
sTo
tal
Ass
ets
Tota
l Li
abili
ties
Inve
stm
ents
(e
xclu
ding
in
vest
men
t in
subs
idia
ries)
turn
over
Profi
t be
fore
ta
xatio
n
Prov
isio
n fo
r ta
xatio
n
Profi
t af
ter
taxa
tion
Prop
osed
d
ivid
end
Cou
ntry
250
Tata
Ste
el N
orw
ay B
yggs
yste
mer
A/S
NO
K9.
27 1
.13
30.
82
67.
52
35.
57
–
172
.69
8.0
7 1
.94
6.1
3 –
N
orw
ay25
1Ta
ta S
teel
Spe
cial
ity S
ervi
ce C
entre
Xia
n C
o. L
td.
uSD
54.
28
4.3
0 (0
.39)
10.
68
6.7
7 –
2
.47
(0.3
9) –
(0
.39)
–
Chi
na
252
Tata
Ste
el u
k C
onsu
lting
Lim
ited
GBP
82.
17
14.
26
(15.
21)
14.
45
15.
40
–
18.
59
2.5
4 –
2
.54
–
uk
253
Tata
Ste
el u
k H
oldi
ngs
Lim
ited
GBP
82.
17
32,4
37.3
8 (2
,824
.12)
37,4
79.8
9 7
,866
.63
–
– (
2,11
4.88
) –
(2,
114.
88)
–
uk
254
Tata
Ste
el u
k Li
mite
dG
BP 8
2.17
18
,844
.39
(11,
260.
08)
36,6
76.7
1 2
9,09
2.40
5
.16
37,
132.
46 (
5,36
8.72
) 6
5.22
(5,
433.
94)
–
uk
255
Tata
Ste
el u
k R
ail C
onsu
ltanc
y Li
mite
dG
BP 8
2.17
2
46.5
2 (3
2.98
) 3
64.8
0 1
51.2
6 –
2
78.5
1 2
4.57
–
2
4.57
–
u
k25
6Ta
ta S
teel
usa
Inc.
uSD
54.
28
46.
27
14.
67
67.
18
6.2
4 –
–
1
7.43
0
.62
16.
81
78.
70
uSA
257
The
New
port
And
Sout
h W
ales
Tub
e C
ompa
ny L
td.
GBP
82.
17
4.3
7 0
.12
4.4
9 0
.00
–
–
–
–
–
–
uk
258
The
Stan
ton
Hou
sing
Com
pany
Ltd
.G
BP 8
2.17
0
.49
7.4
2 7
.91
–
–
–
–
–
–
–
uk
259
The
Stee
l Com
pany
Of I
rela
nd L
imite
dEu
R 6
9.55
1
04.4
4 (8
0.49
) 8
9.59
6
5.64
–
9
1.88
(5
.89)
(0.0
2) (5
.87)
–
Irela
nd26
0Th
e Te
mpl
ebor
ough
Rol
ling
Mills
Ltd
.G
BP 8
2.17
2
4.65
1
05.7
8 1
30.4
3 –
–
–
–
–
–
–
u
k26
1Th
omas
Pro
cess
ing
Com
pany
uSD
54.
28
–
116
.47
116
.86
0.3
9 –
2
1.20
3
.68
–
3.6
8 –
u
SA26
2Th
omas
Ste
el S
trip
Cor
p.u
SD 5
4.28
8
1.41
(3
37.3
0) 2
63.2
3 5
19.1
2 0
.55
619
.48
26.
21
0.3
5 2
5.86
–
u
SA26
3Ti
nsle
y Tr
aile
rs L
imite
dG
BP 8
2.17
1
4.79
–
1
4.79
–
–
–
–
–
–
–
u
k26
4To
ront
o In
dust
rial F
abric
atio
ns L
td.
GBP
82.
17
0.1
3 (4
.21)
–
4.0
8 –
–
–
–
–
–
u
k26
5Tr
iere
r Wal
zwer
k G
mbH
EuR
69.
55
17.
81
(9.8
7)62
.75
54.
81
–
145
.89
(33.
35)
(0.3
4)(3
3.01
) –
G
erm
any
266
Tulip
uk
Hol
ding
s (N
o.2)
Ltd
.G
BP 8
2.17
28
,787
.75
(432
.80)
28,3
55.2
9 0
.34
–
–
(435
.51)
–
(435
.51)
–
uk
267
Tulip
uk
Hol
ding
s (N
o.3)
Ltd
.G
BP 8
2.17
28
,790
.80
(1,0
79.1
6) 3
6,64
2.34
8
,930
.70
–
–
(280
.13)
–
(280
.13)
–
uk
268
Tusc
aloo
sa S
teel
Cor
pora
tion
GBP
82.
17
3,2
60.2
3 (3
,259
.74)
0.5
8 0
.09
–
–
(0.0
7) –
(0
.07)
–
uSA
269
u.E
.S. B
right
Bar
Lim
ited
GBP
82.
17
12.
33
–
12.
33
–
–
–
–
–
–
–
uk
270
uk
Stee
l Ent
erpr
ise
Ltd.
GBP
82.
17
82.
17
51.
60
238
.63
104
.86
5.1
4 2
2.55
(9
.10)
–
(9.1
0) –
u
k27
1u
kse
Fund
Man
ager
s (G
ener
al P
artn
er)
Lim
ited
GBP
82.
17
–
–
–
–
–
–
–
–
–
–
uk
272
uks
e Fu
nd M
anag
ers
Lim
ited
GBP
82.
17
0.2
9 0
.09
0.6
0 0
.22
–
–
–
–
–
–
uk
273
uni
tol S
ASEu
R 6
9.55
6
9.55
(9
9.41
)34
5.36
375
.22
0.1
3 1
,012
.31
(181
.60)
–
(181
.60)
–
Fran
ce27
4W
alke
r Man
ufac
turin
g An
d In
vest
men
ts
Ltd.
GBP
82.
17
4.3
7 1
22.5
8 1
26.9
6 0
.01
–
–
–
–
–
–
uk
275
Wal
kers
teel
stoc
k Ire
land
Lim
ited
EuR
69.
55
67.
88
39.
95
119
.09
11.
26
–
–
–
–
–
–
Irela
nd27
6W
alke
rste
elst
ock
Ltd.
GBP
82.
17
8.2
2 –
8
.22
–
–
–
–
–
–
–
uk
277
Wes
twoo
d St
eel S
ervi
ces
Ltd.
GBP
82.
17
193
.11
–
193
.11
–
–
–
–
–
–
–
uk
278
Whi
tehe
ad (N
arro
w S
trip)
Ltd
.G
BP 8
2.17
7
3.96
2
0.29
9
4.24
(0
.01)
–
–
–
–
–
–
uk
279
Tata
Ste
el G
loba
l Min
eral
s H
oldi
ngs
Pte
Ltd.
uSD
5
4.28
6
,261
.43
210
.72
6,9
84.3
2 5
12.1
7 2
,235
.09
–
(12.
45)
31.
68
(44.
13)
–
Sin
gapo
re
280
Al R
imal
Min
ing
LLC
OM
R
140
.79
14.
08
(6.6
5) 9
.84
2.4
1 –
–
(0
.11)
–
(0.1
1) –
O
man
28
1Bl
ack
Gin
ger 4
61 (P
ropr
ieta
ry) L
td Z
AR
5.9
1 6
5.04
(1
5.87
) 2
04.2
2 1
55.0
5 –
5
.20
(5.7
5) –
(5
.75)
–
Sou
th A
frica
28
2ka
limat
i Coa
l Com
pany
Pty.
Ltd
. A
uD
5
6.52
7
4.65
(1
90.7
7) 2
04.4
3 3
20.5
5 –
5
7.13
(1
84.0
8) 2
.73
(186
.81)
–
Aus
tralia
28
3Se
dibe
ng Ir
on O
re P
ty. L
td.
ZAR
5
.91
13.
93
23.
22
381
.79
344
.64
–
128
.01
47.
92
13.
42
34.
50
–
Sou
th A
frica
28
4Ta
ta S
teel
Cot
e D
’ Ivo
ire S
.A F
CFA
0
.11
117
.74
(52.
97)
74.
32
9.5
5 –
–
(1
9.28
) 0
.02
(19.
30)
–
Ivor
y C
oast
28
5Ta
ta S
teel
Min
eral
s u
k Li
mite
d C
AD
53.
43
1,0
57.2
2 (0
.59)
1,0
56.7
6 0
.13
–
–
(0.5
0) –
(0
.50)
–
uk
286
Tata
Ste
el M
iner
als
Can
ada
Lim
ited
CAD
5
3.43
1
,225
.36
(54.
49)
2,5
48.3
1 1
,377
.44
–
–
(29.
88)
–
(29.
88)
–
Can
ada
287
T S
Can
ada
Cap
ital L
td*
CAD
5
3.43
–
1
.81
546
.14
544
.33
–
–
2.4
5 0
.64
1.8
1 –
C
anad
a 28
8Ta
ta S
teel
Inte
rnat
iona
l (Si
ngap
ore)
H
oldi
ngs
Pte.
Ltd
. S
GD
4
3.72
1
54.6
4 –
1
54.6
4 –
–
–
–
–
–
–
S
inga
pore
289
TSIA
Hol
ding
s (T
haila
nd) L
imite
d T
HB
1.8
5 0
.02
(0.0
6) 0
.01
0.0
5 –
–
0
.06
–
0.0
6 –
T
haila
nd

Hundred and sixth annual report 2012-13
222
` c
rore
s
Sl.
No.
Nam
e of
the
Com
pany
Rep
ortin
g cu
rren
cyEx
chan
ge
rate
Cap
ital
Res
erve
sTo
tal
Ass
ets
Tota
l Li
abili
ties
Inve
stm
ents
(e
xclu
ding
in
vest
men
t in
subs
idia
ries)
turn
over
Profi
t be
fore
ta
xatio
n
Prov
isio
n fo
r ta
xatio
n
Profi
t af
ter
taxa
tion
Prop
osed
d
ivid
end
Cou
ntry
290
Tata
Ste
el In
tern
atio
nal (
Shan
ghai
) Ltd
. C
Ny
8.7
3 4
.26
2.0
4 6
.64
0.3
4 –
2
.10
0.3
6 0
.13
0.2
3 –
C
hina
29
1Ta
ta S
teel
Inte
rnat
iona
l (M
alay
sia)
Sdn
. Bh
d. M
yR
17.
54
–
0.2
4 0
.32
0.0
8 –
–
0
.01
0.0
1 –
–
M
alay
sia
292
Tata
Ste
el In
tern
atio
nal (
Thai
land
) Lim
ited
TH
B 1
.85
0.3
7 1
.20
1.7
5 0
.18
–
–
(2.3
2) 0
.25
(2.5
7) –
T
haila
nd
293
Tata
Ste
el In
tern
atio
nal (
Sing
apor
e) P
te.
Ltd.
SG
D
43.
72
7.4
3 3
9.09
8
3.14
3
6.62
7
.87
267
.40
(8.5
5) 0
.47
(9.0
2) –
S
inga
pore
294
Tata
Ste
el In
tern
atio
nal (
Asia
) Lim
ited
HKD
6
.99
–
467
.23
580
.14
112
.91
–
752
.13
10.
31
1.5
3 8
.78
–
Hon
gkon
g S.
A.R
. 29
5Ta
ta S
teel
(Tha
iland
) Pub
lic C
ompa
ny
Ltd.
TH
B 1
.85
1,5
58.4
1 7
55.9
2 3
,522
.88
1,2
08.5
5 –
5
8.94
(6
27.8
8) 0
.13
(628
.01)
–
Tha
iland
296
N.T
.S S
teel
Gro
up P
lc.
TH
B 1
.85
856
.40
(553
.97)
1,8
18.8
9 1
,516
.46
–
5,9
50.9
3 (6
69.8
7) 5
2.97
(7
22.8
4) –
T
haila
nd
297
The
Siam
Con
stru
ctio
n St
eel C
o. L
td.
TH
B 1
.85
323
.84
43.
03
593
.65
226
.78
–
1,6
74.4
1 1
8.82
4
.29
14.
53
–
Tha
iland
29
8Th
e Si
am Ir
on A
nd S
teel
(200
1) C
o. L
td.
TH
B 1
.85
22.
21
190
.71
390
.14
177
.22
–
1,2
51.1
6 2
0.82
4
.78
16.
04
–
Tha
iland
29
9Ta
ta S
teel
Glo
bal P
rocu
rem
ent C
ompa
ny
Pte.
Ltd
. u
SD
54.
28
540
.77
370
.17
17,
561.
47
16,
650.
53
–
14,
006.
52
223
.58
28.
31
195
.27
–
Sin
gapo
re
300
ProC
o Is
suer
Pte
. Ltd
. G
BP
82.
17
–
1,3
33.1
1 8
,611
.07
7,2
77.9
6 –
9
73.8
4 6
36.0
6 8
4.93
5
51.1
3 –
S
inga
pore
30
1Ta
ta S
teel
Pro
cess
ing
and
Dis
tribu
tion
Lim
ited
INR
1
.00
68.
25
334
.35
636
.34
233
.74
54.
12
1,6
42.6
1 6
0.40
1
9.29
4
1.11
–
In
dia
302
TM In
tern
atio
nal L
ogis
tics
Lim
ited
INR
1
.00
18.
00
101
.28
262
.72
143
.44
37.
02
181
.74
18.
94
6.0
5 1
2.89
3
.16
Indi
a 30
3In
tern
atio
nal S
hipp
ing
Logi
stic
s FZ
E u
SD
54.
28
1.4
9 1
73.8
8 2
67.9
2 9
2.55
–
5
82.4
0 1
9.59
–
1
9.59
–
u
AE
304
TKM
Glo
bal C
hina
Ltd
CN
y 8
.73
5.9
7 (2
.83)
8.2
4 5
.10
–
30.
05
(0.1
0) –
(0
.10)
–
Chi
na
305
TKM
Glo
bal G
mbH
Eu
R
69.
55
0.3
6 9
3.46
1
48.1
9 5
4.37
–
1
37.3
1 2
1.13
6
.52
14.
61
–
Ger
man
y 30
6TK
M G
loba
l Log
istic
s Li
mite
d IN
R
1.0
0 1
.80
19.
39
39.
12
17.
93
–
130
.66
0.1
3 0
.02
0.1
1 –
In
dia
307
TM H
arbo
ur S
ervi
ces
Priv
ate
Lim
ited
INR
1
.00
34.
62
13.
31
106
.81
58.
88
5.8
2 2
6.22
5
.20
0.1
1 5
.09
–
Indi
a 30
8In
dian
Ste
el a
nd W
ire P
rodu
cts
Ltd.
INR
1
.00
5.9
9 2
5.07
1
16.9
7 8
5.91
–
2
00.2
6 2
5.16
8
.18
16.
98
–
Indi
a 30
9Th
e Ta
ta P
igm
ents
Lim
ited
INR
1
.00
0.7
5 2
7.68
4
6.52
1
8.09
–
6
3.92
5
.53
1.8
4 3
.69
0.4
5 In
dia
310
T M
Min
ing
Com
pany
Lim
ited
INR
1
.00
0.1
0 (0
.13)
–
0.0
3 –
–
(0
.05)
–
(0.0
5) –
In
dia
311
Jam
shed
pur C
ontin
uous
Ann
ealin
g &
Proc
essi
ng C
ompa
ny P
rivat
e Li
mite
d IN
R
1.0
0 8
74.0
0 1
.64
1,4
16.2
3 5
40.5
9 9
.49
–
4.5
6 0
.89
3.6
7 –
In
dia
312
The
Tinp
late
Com
pany
of I
ndia
Ltd
. IN
R
1.0
0 2
07.2
7 3
94.9
2 9
97.5
4 3
95.3
5 0
.23
877
.16
49.
53
21.
30
28.
23
12.
25
Indi
a 31
3Ta
ta S
pong
e Iro
n Li
mite
d IN
R
1.0
0 1
5.40
6
24.0
7 8
14.8
4 1
75.3
7 1
27.6
3 7
97.5
1 1
25.9
0 4
0.47
8
5.43
1
2.32
In
dia
314
TSIL
Ene
rgy
Lim
ited
INR
1
.00
0.0
6 (0
.07)
0.0
6 0
.07
–
–
(0.0
7) –
(0
.07)
–
Indi
a 31
5Ta
ta S
teel
Odi
sha
Lim
ited
INR
1
.00
0.0
5 (2
.51)
0.0
6 2
.52
–
–
(2.5
1) –
(2
.51)
–
Indi
a