NOTES AND CORRESPONDENCE Conditional Probabilities of ...ability to simulate storms that were...
15
AUGUST 2000 461 NOTES AND CORRESPONDENCE q 2000 American Meteorological Society NOTES AND CORRESPONDENCE Conditional Probabilities of Significant Tornadoes from RUC-2 Forecasts THOMAS M. HAMILL National Center for Atmospheric Research,* Boulder, Colorado ANDREW T. CHURCH University of New Mexico, Albuquerque, New Mexico 29 September 1999 and 25 February 2000 ABSTRACT Several previous studies have established statistical relationships between the severity of convection and environmental conditions determined from rawinsonde observations. Here, the authors seek 1) to determine whether similar relationships are observed when severe weather reports are associated with gridded short-term numerical forecasts, and 2) to develop and demonstrate a prototypal probabilistic model to forecast the likelihood a thunderstorm will be tornadic. Severe weather reports and lightning network data from 1 January 1999 through 30 June 1999 were used to classify the weather at a set of Rapid Update Cycle (RUC-2) grid points into four weather categories. These were no thunderstorms, nonsupercellular thunderstorms, supercellular thunderstorms without significant tornadoes, and thunderstorms with significant tornadoes (F2 or greater). RUC-2 forecast convective available potential energy (CAPE), helicity, and 0–4-km mean wind shear from the same period were associated with this gridded classification of the weather. In general similar relationships were found between environmental parameters and storm categorization as others have previously documented. The Bayesian prob- abilistic model used here forecasts the likelihood that a thunderstorm will produce a strong or violent tornado, given a certain value of CAPE and helicity (or CAPE and wind shear). For two selected cases when significant tornadoes occurred, this model reasonably located the high-threat areas many hours in advance of the severe weather. An enhanced version of this prototypal tool may be of use to operational severe weather forecasters. 1. Introduction Forecasts of severe weather have improved substan- tially over the past few decades. Forecasters are using improved numerical weather prediction models and im- proved real-time data from sources such as Doppler ra- dars, wind profilers, geostationary satellites, and the lightning detection network. As well, they now more thoroughly understand the dynamics of thunderstorms. Consequently, since 1973, the percentage of tornadoes occurring in a region within a tornado watch has in- creased from 30% to nearly 60% (McCarthy et al. 1998; Grice et al. 1999). Nonetheless, predicting severe thun- derstorms other than by extrapolating the motion of ex- isting severe storms is still quite difficult, and the in- terval where extrapolation is useful is quite short. * The National Center for Atmospheric Research is sponsored by the National Science Foundation. Corresponding author address: Dr. Thomas M. Hamill, NCAR/ MMM/ASP, P.O. Box 3000, Boulder, CO 80307-3000. E-mail: [email protected] Many expect this trend toward more accurate tornado forecasts will continue as a result of improvements in numerical weather prediction models and assimilation schemes. Operational models continue to be upgraded and computed with smaller grid spacings (e.g., Rogers et al. 1996; Smirnova et al. 1997; Benjamin et al. 1998; Yucel et al. 1998). Within a few years we may have small enough grid spacings to resolve convective storms in our operational weather prediction model simulations. Despite this, chaos theory (Lorenz 1963, 1969) strongly suggests that it will always be difficult or impossible to predict the precise timing and location of these storms beyond a few hours (Islam et al. 1993), regardless of model resolution. Further, the smaller the scale of the phenomenon, then generally, the shorter the range of predictability. Given that precise numerical forecasts of severe weather are likely to remain problematic (Brooks et al. 1992), a realistic alternative goal is to relate the probability of mesoscale or microscale severe weather events to environmental conditions at the larger, more predictable scales. Just what are the environmental parameters at larger scales that are related to severe weather and tornado
Transcript of NOTES AND CORRESPONDENCE Conditional Probabilities of ...ability to simulate storms that were...
AUGUST 2000 461N O T E S A N D C O R R E S P O N D E N C E
q 2000 American Meteorological Society
NOTES AND CORRESPONDENCE
Conditional Probabilities of Significant Tornadoes from RUC-2 Forecasts
THOMAS M. HAMILL
National Center for Atmospheric Research,* Boulder, Colorado
ANDREW T. CHURCH
University of New Mexico, Albuquerque, New Mexico
29 September 1999 and 25 February 2000
ABSTRACT
Several previous studies have established statistical relationships between the severity of convection andenvironmental conditions determined from rawinsonde observations. Here, the authors seek 1) to determinewhether similar relationships are observed when severe weather reports are associated with gridded short-termnumerical forecasts, and 2) to develop and demonstrate a prototypal probabilistic model to forecast the likelihooda thunderstorm will be tornadic. Severe weather reports and lightning network data from 1 January 1999 through30 June 1999 were used to classify the weather at a set of Rapid Update Cycle (RUC-2) grid points into fourweather categories. These were no thunderstorms, nonsupercellular thunderstorms, supercellular thunderstormswithout significant tornadoes, and thunderstorms with significant tornadoes (F2 or greater). RUC-2 forecastconvective available potential energy (CAPE), helicity, and 0–4-km mean wind shear from the same period wereassociated with this gridded classification of the weather. In general similar relationships were found betweenenvironmental parameters and storm categorization as others have previously documented. The Bayesian prob-abilistic model used here forecasts the likelihood that a thunderstorm will produce a strong or violent tornado,given a certain value of CAPE and helicity (or CAPE and wind shear). For two selected cases when significanttornadoes occurred, this model reasonably located the high-threat areas many hours in advance of the severeweather. An enhanced version of this prototypal tool may be of use to operational severe weather forecasters.
1. Introduction
Forecasts of severe weather have improved substan-tially over the past few decades. Forecasters are usingimproved numerical weather prediction models and im-proved real-time data from sources such as Doppler ra-dars, wind profilers, geostationary satellites, and thelightning detection network. As well, they now morethoroughly understand the dynamics of thunderstorms.Consequently, since 1973, the percentage of tornadoesoccurring in a region within a tornado watch has in-creased from 30% to nearly 60% (McCarthy et al. 1998;Grice et al. 1999). Nonetheless, predicting severe thun-derstorms other than by extrapolating the motion of ex-isting severe storms is still quite difficult, and the in-terval where extrapolation is useful is quite short.
* The National Center for Atmospheric Research is sponsored bythe National Science Foundation.
Corresponding author address: Dr. Thomas M. Hamill, NCAR/MMM/ASP, P.O. Box 3000, Boulder, CO 80307-3000.E-mail: [email protected]
Many expect this trend toward more accurate tornadoforecasts will continue as a result of improvements innumerical weather prediction models and assimilationschemes. Operational models continue to be upgradedand computed with smaller grid spacings (e.g., Rogerset al. 1996; Smirnova et al. 1997; Benjamin et al. 1998;Yucel et al. 1998). Within a few years we may havesmall enough grid spacings to resolve convective stormsin our operational weather prediction model simulations.Despite this, chaos theory (Lorenz 1963, 1969) stronglysuggests that it will always be difficult or impossible topredict the precise timing and location of these stormsbeyond a few hours (Islam et al. 1993), regardless ofmodel resolution. Further, the smaller the scale of thephenomenon, then generally, the shorter the range ofpredictability. Given that precise numerical forecasts ofsevere weather are likely to remain problematic (Brookset al. 1992), a realistic alternative goal is to relate theprobability of mesoscale or microscale severe weatherevents to environmental conditions at the larger, morepredictable scales.
Just what are the environmental parameters at largerscales that are related to severe weather and tornado
462 VOLUME 15W E A T H E R A N D F O R E C A S T I N G
potential? Miller (1972) and others have suggested theimportance of buoyancy parameters; the most widelyused now is convective available potential energy(CAPE; Moncrieff and Miller 1976). Chisholm and Ren-ick (1972) and Fankhauser and Mohr (1977) discussedsounding characteristics typical of single-cell, multicell,and supercell thunderstorms, finding among other thingsthat strong vertical wind shear was typical of supercells.Numerical simulations by Klemp and Wilhelmson(1978), Schlesinger (1980), Rotunno and Klemp (1982,1985), Weisman and Klemp (1982, 1984, 1986), andKlemp (1987) examined the dependence of storm struc-ture on wind shear and buoyancy through the use of anumerical cloud model. Using judiciously chosen ther-modynamic and wind profiles, they demonstrated anability to simulate storms that were qualitatively similarto those observed and to understand better the dynamicsof storm-splitting and the deviate motion of supercells.Further, these latter findings suggest what environmentalconditions are suitable for the development of particulartypes of severe storms (e.g., short-lived storms wereassociated with low shear and supercell storms associ-ated with high shear).
Storm-relative helicity (SRH), which is related tostreamwise vorticity, has also been suggested as an im-portant predictor of supercells and/or tornadic activity(Lilly 1986; Davies-Jones 1984; Davies-Jones et al.1990). Pictorially, helicity is proportional to the areaswept out on a hodograph relative to the storm motionvector. Dynamically, helicity in the region of storm in-flow indicates that vertical rotation will develop whenhorizontal shear is ingested into the storm and tilted intothe updraft. Davies-Jones et al. (1990), Davies (1993),and Droegemeier et al. (1993) discussed the use of he-licity as a forecast parameter for supercell thunder-storms. Recently, a number of authors have pointed outpotential problems with using helicity, including a sen-sitivity to the estimated storm motion vector (Droege-meier et al. 1993; Weisman 1996; Weisman and Rotunno2000) and the strong mesoscale variability that helicitycan exhibit (Markowski et al. 1998b).
Several studies have attempted to establish statisticalrelationships between environmental conditions and se-vere weather. Davies and Johns (1993) discussed therelationship of wind shear and helicity to strong andviolent tornadoes. Johns et al. (1993) similarly discussedthe relationship between the severity of tornadoes andcombinations of wind and buoyancy parameters. Brookset al. (1994a) found useful information in column max-imum specific humidity, helicity, and midtroposphericwind speed. Rasmussen and Blanchard (1998, hereafterRB98) developed statistical relationships between thun-derstorm severity and environmental parameters. Whenconvection occurred (as determined from lightning net-work data), the convection was classified as nonsuper-cellular, supercellular without signficant tornadoes, orsupercellular producing significant tornadoes, depend-ing on the severe weather report (since the classification
was not performed with radar data, the authors ac-knowledged that there may have been significant errorsin the assignment to these categories). RB98 determinedthe associated environmental parameters using a rela-tively nearby 0000 UTC sounding, presumably locatedin the inflow sector of the event. Parameters such asmean shear, helicity, CAPE, and combinations thereofwere examined. Individual parameters were generallyshown to discriminate less effectively between the threethunderstorm classifications than combinations of pa-rameters such as CAPE and 0–4-km mean shear orCAPE and helicity.
RB98’s study used observed sounding data. However,if tornado likelihood is to be forecast many hours priorto tornado occurrence, environmental conditions fromnumerical model forecasts will be required instead (e.g.,Reap and Foster 1979; Stensrud et al. 1997). To thisend, we have collected half a year’s worth of RapidUpdate Cycle (RUC-2) analyses and 12-h forecasts andsevere weather observations. Our aims are 1) to deter-mine whether some previously documented relation-ships between severe weather and environmental pa-rameters are similar when these parameters are diag-nosed from model analyses or 12-h forecasts rather thanfrom rawinsonde data, and 2) to develop a probabilisticforecast model for the conditional probability of sig-nificant tornadoes (F2 or greater) using RUC-2 12-hforecast parameters. This probabilistic model will bebased exclusively on combinations of CAPE and0–4-km mean shear or CAPE and helicity. These pa-rameters (and many others) are considered when theNational Weather Service’s Storm Prediction Center(SPC) generates their severe weather outlooks (Johnsand Doswell 1992; Doswell et al. 1993).
The probabilistic model we will describe here shouldbe considered a prototype, a simple, test version of anautomated prediction algorithm that uses widely ac-cepted measures of basic environmental conditions as-sociated with severe weather. We acknowledge that thereare many other potentially crucial factors relating tosevere storm development, including the amount of con-vective inhibition, specific triggering mechanisms suchas outflow boundaries or drylines (e.g., Markowski etal. 1998a; Rasmussen et al. 1999), and mechanisms forgenerating low-level mesocyclogenesis (Rotunno andKlemp 1985; Brooks et al. 1994b; Gilmore and Wicker1998). We will not consider such additional effects herebut acknowledge the wisdom of considering them inlater studies, as well as the wisdom of collecting andanalyzing many years’ worth of data and revising theclassification scheme.
The note is organized as follows. Section 2 describesthe data and methodology. The method for categorizingstorms as tornadic, supercellular, or nonsupercellularwill be described, as well as our methods for calculatingshear and helicity parameters. Section 3 compares therelationships between storm types and environmentalconditions to those found in RB98. Section 4 then de-

AUGUST 2000 463N O T E S A N D C O R R E S P O N D E N C E
FIG. 1. Area where RUC-2 forecasts and the categorization of se-vere weather are associated in this study (shaded region).
FIG. 2. Severe weather reports (using classification described intext) for the 4-h period centered on 0000 UTC 22 Jan 1999.
scribes the probabilistic forecast model we developed.Section 5 presents some prototypal tornado probabilityforecasts using this model and discusses these forecasts.Section 6 concludes.
2. Data and methodology
a. Classification of observed weather at model gridpoints
In order to match severe weather events with griddedforecast data, we developed an algorithm to classify theobserved weather at RUC-2 model grid points. Becauseof the paucity of reported data in the west, the devel-opmental data was based only on a ‘‘masked’’ subsetof points in the central and eastern United States (shadedpoints in Fig. 1). The severe reports analyzed here orig-inated from the Storm Data final log of quality con-trolled severe reports from 1 January 1999 through 30June 1999. The log provides the timing, location, andintensity of tornadoes, hail (and its size), and nontor-nadic damaging wind reports. Only reports from 2200to 0200 UTC were used in this study; it was assumedthat this time window could be associated reasonablywith numerically forecast or analyzed conditions at 0000UTC. Approximately half of the tornadoes in a 24-hperiod occurred within this 4-h window. The NationalLightning Detection Network, operated by Geomet DataServices, Inc., provided the cloud-to-ground (CG) light-ning strike data.
The composited severe report and lightning databaseswere used to classify the weather at each RUC-2 gridpoint within the masked area into one of four mutuallyexclusive and collectively exhaustive categories, rough-ly following the classification methodology outlined inRB98. The reader is referred to that article for a rationaleof this classification. The categories were 1) no thun-derstorm, 2) nonsupercellular thunderstorm, 3) super-cellular thunderstorm without significant tornado, or 4)supercellular with significant tornado. The grid point
was classified as supercellular with significant tornado,or simply ‘‘tornado’’ if there was an observation of anF2 or greater tornado in that (40 km)2 grid box duringthat interval. The grid point was classified as supercel-lular without significant tornado, or ‘‘supercellular,’’ ifno F2 or greater tornado occurred within the grid boxbetween 2200 and 0200 UTC, but hail of 2.0 in. (5.3cm) or greater occurred. The grid point was classifiedas a nonsupercellular thunderstorm, or simply ‘‘non-supercellular,’’ if more than two CG lightning strikesoccurred in the grid box between 2200 and 0200 UTCand/or an F1 or F0 tornado, hail ,5.3 cm, or damagingwinds were reported. No thunderstorm took place in thegrid box surrounding the grid point if no severe reports,no tornado reports, and two or fewer CG lightningstrikes occurred (the choice of two is admittedly some-what arbitrary). This scheme differs slightly from theRB98 scheme; we include smaller hail, damaging winds,and F0 and F1 tornadoes in the nonsupercellular thun-derstorm category to ensure our classification was col-lectively exhaustive. Illustrations of the classificationprocess are provided in Figs. 2 and 3.
As do RB98, we acknowledge this classification isfar from perfect; for example, radar data should havebeen used to determine which storms were or were notsupercells rather than inferring this from hail and tor-nado reports. Also, we have used only half a year’s datahere, excluding much summertime convection, so the

464 VOLUME 15W E A T H E R A N D F O R E C A S T I N G
FIG. 3. Gridded analysis of thunderstorm type at RUC-2 gridpoints for the same 4-h period as in Fig. 2.
FIG. 4. Illustration of the method used for selecting an appropriateproxy grid point for a proximity sounding if it is raining at the originalgrid point. Shaded areas represent grid points where rain has accu-mulated during the past hour. Arrow indicates the direction of thesurface wind. Boxed point denotes the center of search region. Solidline encompasses all grid points in search region. Filled circle in-dicates grid point selected as the nearest rain-free grid point upstreamof the original grid point.
effects of small sample size should be also consideredwhen interpreting our results.
Severe weather forecasters may find a different, moreelaborate classification scheme more useful to their fore-casting purposes. We chose to closely follow the RB98classification here to permit us to compare results andbecause with our limited data, a refinement of the clas-sification was not appropriate. Should we undertake sub-sequent work with larger datasets, we intend to revisethe classification to make it more elaborate and usefulto severe storm forecasters.
b. Defining CAPE, shear, and helicity from RUC-2data
Environmental parameters were determined from theRUC-2 data as follows. RUC-2 0000 UTC analyses and12-h forecasts from 1200 UTC conditions were used todefine CAPE, wind shear, and helicity at model gridpoints inside the mask. Define
EL u(z) 2 u(z)CAPE 5 g dz, (1)E u(z)LFC
where LFC is the level of free convection, EL is theequilibrium level, u(z) is the virtual potential temper-ature at height z of an air parcel ascending moist adi-abatically from the LFC, u(z) is the virtual potentialtemperature of the environment, and g is the accelerationdue to gravity. Prior to 6 May 1999, the air parcel was
calculated from the parcel with the maximum 40-hPaaverage wet-bulb potential temperature in the lowest180 hPa; after 6 May, this was extended to maximumin the lowest 300 hPa. Mean wind shear (Sh) refers tohodograph length between 0 and 4 km above groundlevel (AGL). We shall hereafter refer to this as the0–4-km mean shear, or simply shear. Note that unlikethe definition of this in RB98, we do not divide by thevertical depth of the shear layer. Helicity is calculatedusing 0–3 km AGL winds and following the Galilean-invariant methodology for calculating the storm motionvector described in Bunkers et al. (2000). Helicity(SRH) is defined here as
3 km ]V(z)SRH 5 2 k · (V 2 c) 3 dz, (2)E ]z0
where k is the vertical unit vector, c is the storm motionvector, and V(z) is the horizontal velocity vector.
If model-generated convection is occurring at a fore-cast grid point at 0000 UTC, its forecast sounding maybe unrepresentative of the preconvective environmentalcondition. In this case, the forecast sounding at that gridpoint is considered to be ‘‘contaminated’’ by model con-vection, and another sounding point may need to be

AUGUST 2000 465N O T E S A N D C O R R E S P O N D E N C E
chosen. To address this, we have developed our ownproximity sounding method, as illustrated in Fig. 4. Ifthere is rain occurring at a model grid point, a set ofadjacent grid points is examined to determine if any ofthem are rain free. This set of adjacent grid points isdetermined by first finding the grid point that is 160 kmupstream of the rainy grid point, with the upstream di-rection defined using model-forecast surface winds. A9 3 9 array of grid points centered on this upstreamgrid point is considered, and the nearest rain-free gridpoint to the original rainy grid point is located. If theCAPE at this rain-free grid point is greater than theCAPE at the rainy grid point, then the CAPE, shear,and helicity values from the rain-free grid point replacethe values at the rainy point. If the rainy point’s CAPEvalue is higher or if all boxes in the 9 3 9 array wererainy, this point retains its original CAPE, shear, andhelicity. If we had RUC-2 data available at very hightemporal resolution, then ideally we would simply usethe RUC-2 conditions at the grid point for the forecasthour immediately preceding the onset of convection.However, since we lacked this high temporal resolutiondata, this approximate algorithm was chosen to addresssome of the issues of rain-contaminated model forecastsoundings.
3. Relationships between weather andenvironmental parameters
Here, we analyze the relationship between the clas-sified weather and the environmental parameters usingstatistics similar to those used in RB98. This permitsready comparison to see if the relationships are robustdespite our use of model-analyzed and forecast data (asopposed to RB98’s use of raob’s), and given our slightlydifferent analysis methods. We will examine the rela-tionships between the weather classification and CAPE,helicity, 0–4-km mean shear, the energy–helicity index(Hart and Korotky 1991; Davies 1993), and the so-calledvorticity generation parameter (VGP; RB98). The en-ergy–helicity index (EHI) is defined as
CAPE · SRHEHI 5 . (3)
51.6 3 10
Previously, EHI . 2.0 was suggested as indicating alarger probability of supercells (RB98). The VGP pa-rameterizes the rate of conversion of horizontal to ver-tical vorticity through tilting. It is defined as
ShÏCAPEVGP 5 . (4)
4000 m
Consider first the scatterplots of weather as a functionof RUC-2 12-h forecast CAPE and shear (Figs. 5a–d)and CAPE and helicity (Figs. 6a–d). There are drasti-cally many more points with no thunderstorms or non-supercellular thunderstorms than with tornadic or su-percellular thunderstorms, emphasizing the rarity of
these events. However, the ratio of the frequency oftornadoes relative to nonsupercellular thunderstorms ismuch larger at higher CAPE and shear values than it isat lower CAPE and shear values. That is, at lower CAPEand shear, ordinary thunderstorm counts overwhelm tor-nado counts, but at higher CAPE and shear, the relativeproportions of tornadic, supercellular, and nonsupercel-lular thunderstorms are much more similar.
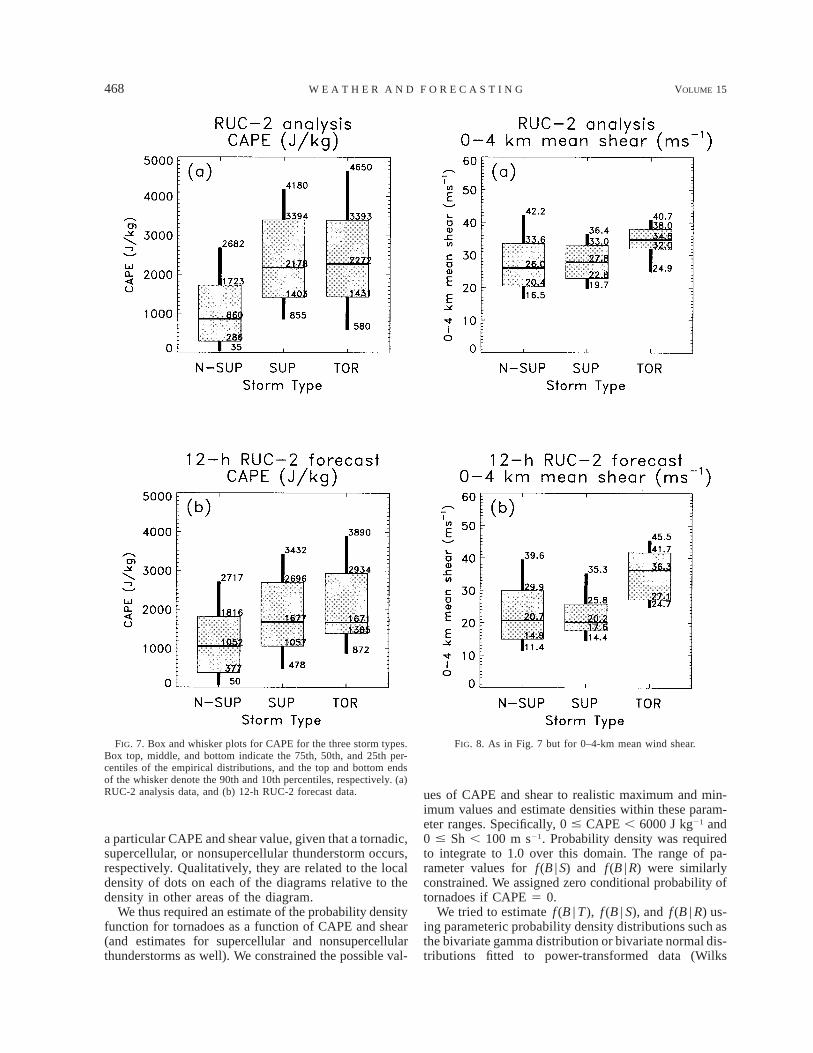
These relationships can be better visualized with boxand whisker plots, as in RB98. For CAPE (Fig. 7), noticethe RUC-2 data distributions have higher CAPEs rel-ative to RB98 values, perhaps because of RUC-2 modelbias or a difference in the method of calculating thewet-bulb potential temperature of the parcel (section2b). Also, recall that our definition of nonsupercellularconvection is slightly different from the definition usedin RB98; we include F0 and F1 tornadoes and reportsof hail ,5.3 cm; they do not. This may tend to bias ournonsupercellular CAPE, shear, and helicity values to-ward slightly higher values than in RB98. Despite this,the ability to discriminate between the three thunder-storm types from RUC-2 CAPE is quite similar to theability demonstrated with sounding data in RB98.
Box and whisker plots for 0–4-km mean shear areshown in Fig. 8. The ability of shear to discriminatebetween thunderstorm types is somewhat different forthe analysis and forecast data. For example, notice thatfor supercells, the mean shear changes from 27.8 m s21
in the RUC-2 analysis to 20.2 m s21 in the forecast.Whether this is a result of the relatively small samplesize owing to using 6 months of data or due to RUC-2model biases or smoothing effects is unclear. However,as in RB98, significant tornadic thunderstorms generallyare associated with higher shears. Also there does appearto be a shear threshold for tornadoes more noticeablethan that found in RB98; here, 90% of the significanttornadoes occurred when shear was ;25 m s21 or great-er. No such threshold at a relatively high shear existedfor the nonsupercellular thunderstorms. This result isgenerally consistent with previous modeling studies(e.g., Weisman and Klemp 1986) and observationalstudies (e.g., Davies and Johns 1993).
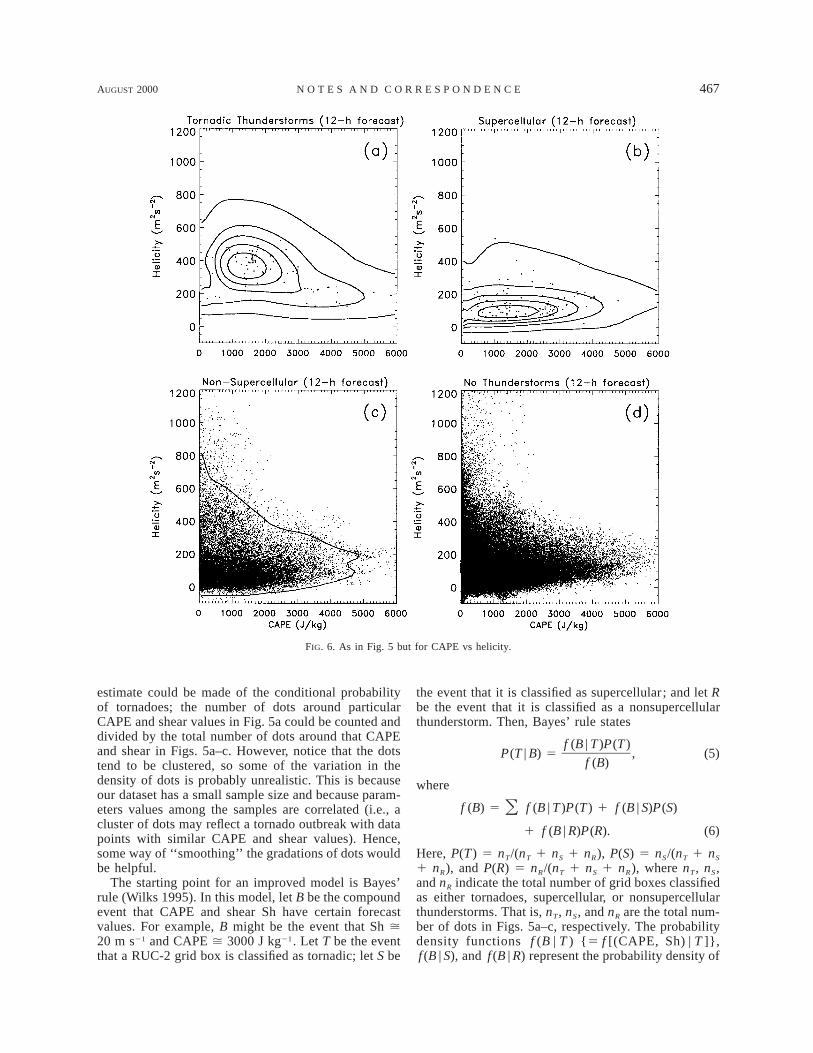
Helicity (Fig. 9) appears to discriminate rather wellbetween tornadic thunderstorms and the other two clas-sifications, better than in RB98. There also appears tobe a lower limit to helicity below which significant tor-nadoes are extremely unlikely (e.g., Davies-Jones et al.1990; Stensrud et al. 1997). Note that our classificationmethodology uses a different, presumably improvedmethod for calculating storm motion (Bunkers et al.2000) than was used in RB98.
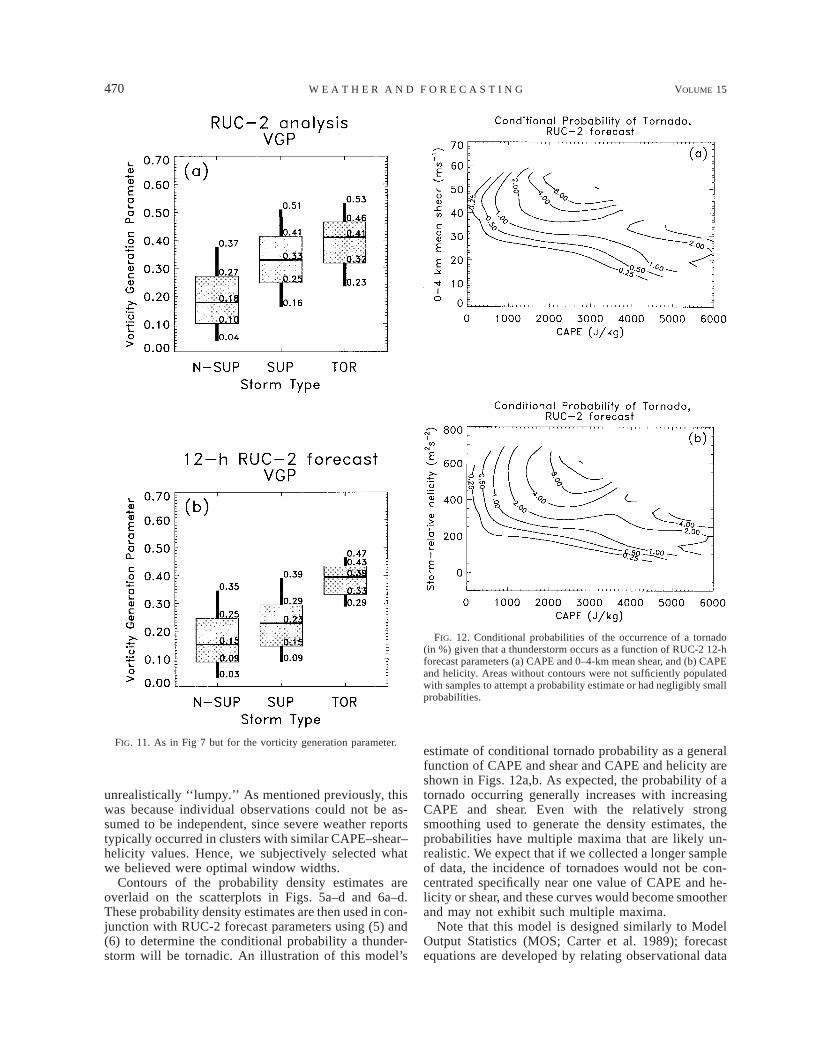
As in RB98, we examined combinations of parame-ters, namely, the EHI (Fig. 10) and VGP (Fig. 11). Aswith RB98, the EHI discriminated relatively well be-tween the three storm severities. EHI values were gen-erally higher than in RB98 because the input CAPEvalues were larger, but there is a similar ability to dis-criminate among the three storm types. The VGP is

466 VOLUME 15W E A T H E R A N D F O R E C A S T I N G
FIG. 5. Scatterplots of weather types as a function of CAPE and 0–4-km 12-h forecast mean wind shear from theRUC-2 model. Contours of fitted probability density functions are overplotted (10th, 30th, 50th, 70th, and 90th per-centiles). (a) Tornadic thunderstorm, (b) supercellular thunderstorm, (c) nonsupercellular thunderstorm, and (d) nothunderstorm.
slightly less effective as a discriminator than the EHI,but this is qualitatively consistent with the results inRB98.
Overall, the relationships demonstrated in this sectionsuggest that RUC-2 forecast data do have enough abilityto discriminate between nonsupercellular, supercellular,and tornadic storms to suggest the potential usefulnessof these data in a probabilistic model.
4. Model for conditional probabilities of significanttornadoes
We now turn our attention to how RUC-2 forecastCAPE and shear (or helicity) information can be usedto model the likelihood of significant tornado occur-
rence, given that a thunderstorm occurs. Such a modelcould be used as a forecast tool to quickly determineareas with an enhanced risk of tornadoes. Note that wewill demonstrate only a model for the conditional prob-ability a thunderstorm being tornadic, but no model ofunconditional probabilities or the probability of thun-derstorms. We believe the development of these modelswould be useful, though in developing them it may beespecially important to consider other potentially im-portant parameters such as convective inhibition and theeffects of low-level boundaries as triggering mecha-nisms (Markowski et al. 1998a; Rasmussen et al. 2000).
How might conditional tornado probabilities be fore-cast using the CAPE and shear information in Fig. 5?Given a RUC-2 forecast of CAPE and shear, a crude
AUGUST 2000 467N O T E S A N D C O R R E S P O N D E N C E
FIG. 6. As in Fig. 5 but for CAPE vs helicity.
estimate could be made of the conditional probabilityof tornadoes; the number of dots around particularCAPE and shear values in Fig. 5a could be counted anddivided by the total number of dots around that CAPEand shear in Figs. 5a–c. However, notice that the dotstend to be clustered, so some of the variation in thedensity of dots is probably unrealistic. This is becauseour dataset has a small sample size and because param-eters values among the samples are correlated (i.e., acluster of dots may reflect a tornado outbreak with datapoints with similar CAPE and shear values). Hence,some way of ‘‘smoothing’’ the gradations of dots wouldbe helpful.
The starting point for an improved model is Bayes’rule (Wilks 1995). In this model, let B be the compoundevent that CAPE and shear Sh have certain forecastvalues. For example, B might be the event that Sh ù20 m s21 and CAPE ù 3000 J kg21. Let T be the eventthat a RUC-2 grid box is classified as tornadic; let S be
the event that it is classified as supercellular; and let Rbe the event that it is classified as a nonsupercellularthunderstorm. Then, Bayes’ rule states
f (B | T )P(T )P(T | B) 5 , (5)
f (B)
where
f (B) 5 f (B | T )P(T ) 1 f (B | S)P(S)O1 f (B | R)P(R). (6)
Here, P(T) 5 nT/(nT 1 nS 1 nR), P(S) 5 nS/(nT 1 nS
1 nR), and P(R) 5 nR/(nT 1 nS 1 nR), where nT, nS,and nR indicate the total number of grid boxes classifiedas either tornadoes, supercellular, or nonsupercellularthunderstorms. That is, nT, nS, and nR are the total num-ber of dots in Figs. 5a–c, respectively. The probabilitydensity functions f (B | T ) {5 f [(CAPE, Sh) | T ]},f (B | S), and f (B | R) represent the probability density of
468 VOLUME 15W E A T H E R A N D F O R E C A S T I N G
FIG. 7. Box and whisker plots for CAPE for the three storm types.Box top, middle, and bottom indicate the 75th, 50th, and 25th per-centiles of the empirical distributions, and the top and bottom endsof the whisker denote the 90th and 10th percentiles, respectively. (a)RUC-2 analysis data, and (b) 12-h RUC-2 forecast data.
FIG. 8. As in Fig. 7 but for 0–4-km mean wind shear.
a particular CAPE and shear value, given that a tornadic,supercellular, or nonsupercellular thunderstorm occurs,respectively. Qualitatively, they are related to the localdensity of dots on each of the diagrams relative to thedensity in other areas of the diagram.
We thus required an estimate of the probability densityfunction for tornadoes as a function of CAPE and shear(and estimates for supercellular and nonsupercellularthunderstorms as well). We constrained the possible val-
ues of CAPE and shear to realistic maximum and min-imum values and estimate densities within these param-eter ranges. Specifically, 0 # CAPE , 6000 J kg21 and0 # Sh , 100 m s21. Probability density was requiredto integrate to 1.0 over this domain. The range of pa-rameter values for f(B | S) and f (B | R) were similarlyconstrained. We assigned zero conditional probability oftornadoes if CAPE 5 0.
We tried to estimate f (B | T), f (B | S), and f (B | R) us-ing parameteric probability density distributions such asthe bivariate gamma distribution or bivariate normal dis-tributions fitted to power-transformed data (Wilks

AUGUST 2000 469N O T E S A N D C O R R E S P O N D E N C E
FIG. 9. As in Fig. 7 but for helicity. FIG. 10. As in Fig. 7 but for the energy–helicity index.
1995). However, these methods produced unsatisfactoryfits (not shown). Hence, we resorted to estimatingf (B | T), f (B | S), and f (B | R) using nonparametric den-sity estimation techniques (Silverman 1986). The readeris referred to this very readable text for details on theapplication of this technique.
For our purposes, some unconventional extensions tostandard nonparametric kernel techniques were requiredto produce reasonable density estimates. For example,we found that a transformation of coordinate systemsto make the data more normally distributed was nec-essary before generating density estimates; application
of the kernel technique when the data were stronglynonnormal resulted in erroneously low density estimatesnear zero CAPE. After density estimates were producedin the transformed coordinate system, the density esti-mates were transformed back to provide an estimate inthe original, untransformed coordinate system.
We also found that larger window widths than onemight expect were required to generate appropriatelysmooth density estimates, especially for the tornadic andsupercellular categories. When conventional methodsfor estimating optimal window widths were used, suchas cross validation, the resulting density estimates were
470 VOLUME 15W E A T H E R A N D F O R E C A S T I N G
FIG. 11. As in Fig 7 but for the vorticity generation parameter.
FIG. 12. Conditional probabilities of the occurrence of a tornado(in %) given that a thunderstorm occurs as a function of RUC-2 12-hforecast parameters (a) CAPE and 0–4-km mean shear, and (b) CAPEand helicity. Areas without contours were not sufficiently populatedwith samples to attempt a probability estimate or had negligibly smallprobabilities.
unrealistically ‘‘lumpy.’’ As mentioned previously, thiswas because individual observations could not be as-sumed to be independent, since severe weather reportstypically occurred in clusters with similar CAPE–shear–helicity values. Hence, we subjectively selected whatwe believed were optimal window widths.
Contours of the probability density estimates areoverlaid on the scatterplots in Figs. 5a–d and 6a–d.These probability density estimates are then used in con-junction with RUC-2 forecast parameters using (5) and(6) to determine the conditional probability a thunder-storm will be tornadic. An illustration of this model’s
estimate of conditional tornado probability as a generalfunction of CAPE and shear and CAPE and helicity areshown in Figs. 12a,b. As expected, the probability of atornado occurring generally increases with increasingCAPE and shear. Even with the relatively strongsmoothing used to generate the density estimates, theprobabilities have multiple maxima that are likely un-realistic. We expect that if we collected a longer sampleof data, the incidence of tornadoes would not be con-centrated specifically near one value of CAPE and he-licity or shear, and these curves would become smootherand may not exhibit such multiple maxima.
Note that this model is designed similarly to ModelOutput Statistics (MOS; Carter et al. 1989); forecastequations are developed by relating observational data

AUGUST 2000 471N O T E S A N D C O R R E S P O N D E N C E
FIG. 13. As in Fig. 3 but for the 4-h period centered on 0000 UTC4 May 1999.
FIG. 14. Forecast conditional probabilities of the occurrence of atornado given that a thunderstorm happens, for the forecast valid at0000 UTC 22 Jan 1999. Compare to observations in Fig. 2. (a) Prob-abilities using CAPE and shear, and (b) using CAPE and helicity.Dotted areas indicate regions where probabilities should be regardedwith suspicion because parameter values were outside the range ofvalues used to develop the equations.
to forecast model output. Hence, it has many of the samestrengths and drawbacks of MOS. Most notably, if themodel physics are stable, then this scheme can accountfor model biases. However, if model physics arechanged, and new forecasts have substantially differentbiases than the old forecasts used as developmental data,then the accuracy and reliability of probability estimateswill be degraded. Also, as with MOS, this approachcannot be expected to correct for random errors in po-sition or magnitude of input fields. For example, if theaxis of maximum CAPE is misforecast by the RUC-2,the axis of maximum tornado probability can be ex-pected to be misforecast as well.
5. Results from probabilities model
We now provide some simple illustrations of condi-tional tornado probability forecasts generated from thismodel. We shall examine tornado forecasts valid at 0000UTC on two days: 22 January 1999 and 4 May 1999.These dates are days with significant tornado outbreaksin Arkansas (Fig. 3) and Oklahoma (Fig. 13).
It is important to develop the probabilistic model witha different dataset than is used to evaluate it. To thisend, when producing forecasts for 22 January 1999, forexample, this day’s data points were excluded from thedataset used to develop probability estimates, with sim-ilar exclusion when producing 4 May 1999 forecasts.
Because the model was developed using only 6 monthsof severe weather data, excluding any one case day witha major tornado outbreak can cause a substantial changein the probabilities, as will be demonstrated.
Tornado probability forecasts valid at 0000 UTC 22January 1999 are shown in Figs. 14a,b. The model hasa maximum of probability in northern Louisiana andoverlapping the area of the tornado outbreak. These

472 VOLUME 15W E A T H E R A N D F O R E C A S T I N G
FIG. 15. As in Fig. 12b but excluding the observations in the 4-hperiod centered on 0000 UTC 22 Jan 1999.
FIG. 16. As in Fig. 14 but for the date 0000 UTC 4 May 1999.Compare to gridded classification in Fig. 13.
probabilities would have been much higher had thecross-validation technique not been used and the 0000UTC 22 January 1999 data not been included in thedevelopmental data (Fig. 15). Comparing this figureagainst Fig. 12b, note that the probabilities at moderateCAPE and shear are dramatically lower when this caseday is excluded. Hence, the longer the developmentalperiod, the more reliable the tornado probabilitiesshould be.
The forecasts for the Oklahoma City tornado outbreakat 0000 UTC 4 May 1999 are shown in Figs. 16a,b. Thetornado probability maximum was forecast in south-central Texas, but there was also a relative maximathrough Oklahoma and Kansas, overlapping the areastruck by tornadoes. There was some convection as-sociated with very large CAPE values in south-centralTexas that day (Fig. 13).
Much of the region with high probabilities did nothave convection, however. Since the maps display con-ditional probabilities given that a thunderstorm occurs,this does not necessarily indicate a problem with themodel. It does highlight the need for additional guidanceon the likelihood of thunderstorms of any type occur-ring. However, forecasting convective initiation is a tre-mendously complex problem, and a model for thun-derstorm likelihood probably would require other in-formation, such as the strength of low-level convergenceand the amount of convective inhibition. We have someevidence that RUC-2 forecast convective inhibition maybe useful as an additional predictor of thunderstorm like-lihood. Using data points from Fig. 5, we examined thedistribution of convective inhibition for data pointswhere CAPE was greater that 2000 J kg21 (Fig. 17).Distributions were plotted for both no thunderstormsand a composite of the three thunderstorm categories.Note that all other things being equal, the likelihood ofconvection occurring at high CAPE is reduced whenthere is a large amount of convective inhibition, as onemight expect.
6. Conclusions
This note described results from associating a clas-sification of thunderstorm severity based on severeweather reports and lightning observations with RUC-2analyses and forecasts. The purpose was both to com-pare and contrast these model-based results with theraob-based results such as in RB98 and to develop aprobabilistic forecast model for conditional tornadolikelihood. This model specifies the conditional prob-ability that a significant tornado will occur given that athunderstorm occurs and given that certain RUC-2

AUGUST 2000 473N O T E S A N D C O R R E S P O N D E N C E
FIG. 17. Histogram of RUC-2 12-h forecast convective inhibition for subset of data points withCAPE . 2000 J kg21. Histograms are plotted for both a composite of the tornadic–supercellular–nonsupercellular categories and for the no thunderstorm category.
CAPE and shear (or CAPE and helicity) values are fore-cast.
RUC-2 analysis and forecast data provided a rathersimilar ability to distinguish between storm types as wasobserved by RB98 using raob data. This suggested suchmodel data should be useful in a probabilistic forecastmodel of tornado likelihood.
Our probabilistic model was MOS-like in characterbut forecast conditional probabilities of significant tor-nadoes given a thunderstorm occurred. A few selectcases demonstrated that the model does a reasonable jobof predicting areas of enhanced risk for tornadoes. LikeMOS, this model should perform best when the modelphysics are unchanged, and like MOS, it cannot correctfor random model errors. Still, a probabilistic modellike this one may be of use as a supplemental guidancetool for severe storms forecasters.
Many improvements to this prototype are envisionedonce more data are available. First, a more robust clas-sification methodology could be used, one that is tai-lored to the specific needs of severe weather forecasters.Ideally, the classification scheme and probabilistic mod-els would be tailored to generate products to help fore-casters with their sequential decision process: an im-proved model might thus forecast the likelihood of thun-derstorms, the probability these thunderstorms will con-tain severe weather, and the conditional probability of
various types of severe weather given that some severeweather occurs.
Beyond improving the classification and using moredata, other changes may prove useful. For example, per-haps regional model biases in CAPE and shear can becorrected before a scheme such as this is applied. Also,it may be useful to develop forecasts for different leadtimes such as 3 or 6 h, for synoptic times other than0000 UTC, and to use a wider variety of informationin model development than just CAPE, shear, and he-licity.
We hope to be able to do more extensive testing anddevelopment in the future in collaboration with opera-tional forecasters.
Acknowledgments. The authors would like to thankGreg Thompson (NCAR/RAP) and Tracy Smith(NOAA/FSL) for their help in obtaining RUC-2 data.Tressa Kane and Randy Bullock (NCAR/RAP) providedassistance in obtaining and decoding the lightning net-work data. Mike Kay (NOAA/SPC) and Paul Polger(NWS/OM) kindly supplied the severe weather reports.Doug Nychka (NCAR/GSP) is thanked for his expertisein the development of nonparametric density estimates.Morris Weisman (NCAR/MMM) and Jeff Trapp(NOAA/NSSL) are thanked for substantive advice andfor their informal reviews of this manuscript. Chuck
474 VOLUME 15W E A T H E R A N D F O R E C A S T I N G
Doswell (NOAA/NSSL) and Steve Weiss (NOAA/SPC)are thanked for very thoughtful formal reviews.
REFERENCES
Benjamin, S. G., J. M. Brown, K. J. Brundage, B. Schwartz, T. Smir-nova, T. L. Smith, L. L. Morone, and G. J. DiMego, 1998: Theoperational RUC-2. Preprints, 16th Conf. on Weather Analysisand Forecasting, Phoenix, AZ, Amer. Meteor. Soc., 249–252.
Brooks, H. E., C. A. Doswell III, and R. A. Maddox, 1992: On theuse of mesoscale and cloud-scale models in operational fore-casting. Wea. Forecasting, 7, 120–132., , and J. Cooper, 1994a: On the environments of tornadicand nontornadic mesocyclones. Wea. Forecasting, 9, 606–618., , and R. B. Wilhelmson, 1994b: The role of midtropo-spheric winds in the evolution and maintenance of low-levelmesocyclones. Mon. Wea. Rev., 122, 126–136.
Bunkers, H. J., B. A. Klimowski, J. W. Zeitler, R. L. Thompson, andM. L. Weisman, 2000: Predicting supercell motion using ho-dograph techniques. Wea. Forecasting, 15, 61–79.
Carter, G. M., J. P. Dallavalle, and H. R. Glahn, 1989: Statisticalforecasts based on the National Meteorological Center’s nu-merical weather prediction system. Wea. Forecasting, 4, 401–412.
Chisholm, A. J., and J. H. Renick, 1972: The kinematics of multicelland supercell Alberta hailstorms. Alberta Hail Studies, ResearchCouncil of Alberta Hail Studies Rep. 72-2, Edmonton, AB, Can-ada, 6 pp.
Davies, J. M., 1993: Hourly helicity, instability, and EHI in fore-casting supercell tornadoes. Preprints, 17th Conf. on Severe Lo-cal Storms, St. Louis, MO, Amer. Meteor. Soc., 107–111., and R. H. Johns, 1993: Some wind and instability parametersassociated with strong and violent tornadoes. 1. Wind shear andhelicity. The Tornado: Its Structure, Dynamics, Prediction, andHazards, Geophys. Monogr., No. 79, Amer. Geophys. Union,573–582.
Davies-Jones, R. P., 1984: Streamwise vorticity: The origin of updraftrotation in supercell storms. J. Atmos. Sci., 41, 2991–3006., D. Burgess, and M. Foster, 1990: Test of helicity as a tornadoforecast parameter. Preprints, 16th Conf. Severe Local Storms,Kananaskis, AB, Canada, Amer. Meteor. Soc., 588–592
Doswell, C. A. III, S. J. Weiss, and R. H. Johns, 1993: Tornadoforecasting—A review. The Tornado: Its Structure, Dynamics,Prediction, and Hazards, Geophys. Monogr., No. 79, Amer. Geo-phys. Union, 557–572.
Droegemeier, K. K., S. M. Lazarus, and R. Davies-Jones, 1993: Theinfluence of helicity on numerically simulated convective storms.Mon. Wea. Rev., 121, 2005–2029.
Fankhauser, J. C., and C. G. Mohr, 1977: Some correlations betweenvarious sounding parameters and hailstorm characteristics innortheast Colorado. Preprints, 10th Conf. on Severe LocalStorms, Omaha, NE, Amer. Meteor. Soc., 218–225.
Gilmore, M. S., and L. J. Wicker, 1998: The influence of midtro-pospheric dryness on supercell morphology and evolution. Mon.Wea. Rev., 126, 943–958.
Grice, G. K., and Coauthors, 1999: The golden anniversary celebra-tion of the first tornado forecast. Bull. Amer. Meteor. Soc., 80,1341–1348.
Hart, J. A., and W. Korotky, 1991: The SHARP workstation vl.50users guide. National Weather Service, 30 pp. [Available fromNWS Eastern Region Headquarters, 630 Johnson Ave., Bohemia,NY 11716.]
Islam, S., R. L. Bras, and K. A. Emanuel, 1993: Predictability ofmesoscale rainfall in the tropics. J. Appl. Meteor., 32, 297–310.
Johns, R. H., and C. A., Doswell III, 1992: Severe local stormsforecasting. Wea. Forecasting, 7, 588–612., J. M. Davies, and P. W. Leftwich, 1993: Some wind and in-stability parameters associated with strong and violent tornadoes.2. Variations in the combination of wind and instability param-
eters. The Tornado: Its Structure, Dynamics, Prediction, andHazards, Geophys. Monogr., No. 79, Amer. Geophys. Union,583–590.
Klemp, J. B., 1987: Dynamics of tornadic thunderstorms. Annu. Rev.Fluid. Mech., 19, 369–402., and R. B. Wilhelmson, 1978: Simulations of right- and left-moving storms produced through storm splitting. J. Atmos. Sci.,35, 1097–1110.
Lilly, D. K., 1986: The structure, energetics and propagation of ro-tating convective storms. Part II: Helicity and storm stabilization.J. Atmos. Sci., 43, 126–140.
Lorenz, E. N., 1963: Deterministic non-periodic flow. J. Atmos. Sci.,20, 130–141., 1969: The predictability of a flow which possesses many scalesof motion. Tellus, 21, 289–307.
Markowski, P. M., E. N. Rasmussen, and J. M. Straka, 1998a: Theoccurrence of tornadoes in supercells interacting with boundariesduring VORTEX-95. Wea. Forecasting, 13, 852–859., J. M. Straka, E. N. Rasmussen, and D. O. Blanchard, 1998b:Variability of storm-relative helicity during VORTEX. Mon.Wea. Rev., 126, 2959–2971.
McCarthy, D., J. Schafer, and M. Kay, 1998: Watch verification atthe Storm Prediction Center 1970–1997. Preprints, 19th Conf.on Severe Local Storms, Minneapolis, MN, Amer. Meteor. Soc.,603–606.
Miller, R. C., 1972: Notes on the analysis and severe storms fore-casting procedures of the Air Force Global Weather Central. AirWeather Service Tech Rep. 200 (rev.), 183 pp. [Available fromLibrary, AFWA, Offutt AFB, NE 68113-5000; NTIS AD-744042/XAB.]
Moncrieff, M. W., and M. J. Miller, 1976: The dynamics and sim-ulation of tropical cumulonimbus and squall lines. Quart. J. Roy.Meteor. Soc., 102, 373–394.
Rasmussen, E. N., and D. O. Blanchard, 1998: A baseline climatologyof sounding-derived supercell and tornado forecast parameters.Wea. Forecasting, 13, 1148–1164., S. Richardson, J. M. Straka, P. M. Markowski, and D. O. Blan-chard, 2000: The association of significant tornadoes with a bar-oclinic boundary on 2 June 1995. Mon. Wea. Rev., 128, 174–191.
Reap, R. M., and D. S. Foster, 1979: Automated 12–36 hour prob-ability forecasts of thunderstorms and severe local storms. J.Appl. Meteor., 18, 1304–1315.
Rogers, E., T. L. Black, D. G. Deaven, G. J. DiMego, Q. Zhao, M.Baldwin, N. W. Junker, and Y. Lin, 1996: Changes to the op-erational early eta analysis/forecast system at the National Cen-ters for Environmental Prediction. Wea. Forecasting, 11, 391–413.
Rotunno, R., and J. B. Klemp, 1982: The influence of the shear-induced pressure gradient on thunderstorm motion. Mon. Wea.Rev., 110, 136–151., and , 1985: On the rotation and propagation of simulatedsupercell thunderstorms. J. Atmos. Sci., 42, 271–292.
Schlesinger, R. E., 1980: A three-dimensional numerical model of anisolated thunderstorm. Part II: Dynamics of updraft splitting andmesovortex couplet evolution. J. Atmos. Sci., 37, 395–420.
Silverman, B. W., 1986: Density Estimation for Statistics and DataAnalysis. Chapman and Hall, 175 pp.
Smirnova, T. G., J. M. Brown, and S. G. Benjamin, 1997: Performanceof different soil model configurations in simulating ground sur-face temperatures and surface fluxes. Mon. Wea. Rev., 125,1870–1884.
Stensrud, D. J., J. V. Cortinas Jr., and H. E. Brooks, 1997: Discrim-inating between tornadic and nontornadic thunderstorms usingmesoscale model output. Wea. Forecasting, 12, 613–632.
Weisman, M. L., 1996: On the use of vertical wind shear vs. helicityin interpreting supercell dynamics. Preprints, 18th Conf. on Se-vere Local Storms, San Francisco, CA, Amer. Meteor. Soc., 200–203., and J. B. Klemp, 1982: The dependence of numerically sim-ulated convective storms on vertical wind shear and buoyancy.Mon. Wea. Rev., 110, 504–520.

AUGUST 2000 475N O T E S A N D C O R R E S P O N D E N C E
, and , 1984: The structure and classification of numericallysimulated convective systems in directionally varying windshears. Mon. Wea. Rev., 112, 2479–2498., and , 1986: Characteristics of isolated convective storms.Mesoscale Meteorology and Forecasting, P. S. Ray, Ed., Amer.Meteor. Soc., 331–358., and R. Rotunno, 2000: On the use of vertical wind shear versus
helicity in interpreting supercell dynamics. J. Atmos. Sci., 57,1452–1472.
Wilks, D. S., 1995: Statistical Methods in the Atmospheric Sciences:An Introduction. Academic Press, 467 pp.
Yucel, I., J. W. Shuttleworth, J. Washborne, and F. Chen, 1998: Eval-uating NCEP Eta Model–derived data against observations. Mon.Wea. Rev., 126, 1977–1991.