NOTE - Carpenter & Companycarpentercompany.com/uploads/files/30177533_2013... · Carpenter &...
32
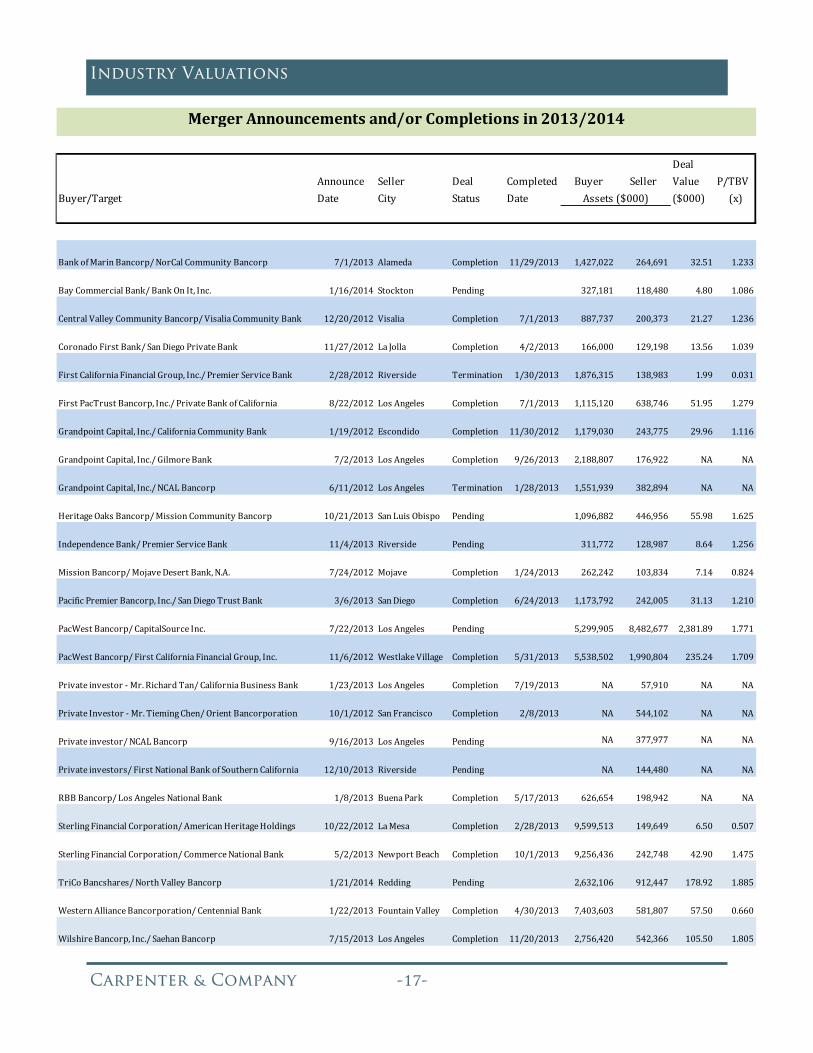
Carpenter & Company -- 2013 INDUSTRY VALUATION The number of bank merger announcements in 2013 was essentially unchanged from the number of mergers announced in 2012. There were a total of 244 merger announcements involving U.S. ϐinancial institutions made in 2012, according to SNL Financial. In 2013, the total number of ϐinancial institution merger announcements equaled 242. Of the 2012 merger announcements, 218 were completed by year‐end 2013, ϐive were still pending, and 21 had been terminated. Through the ϐirst 17 days of 2014, 143 of the mergers announced in 2013 had been completed, 85 were still pending, and 14 had been terminated. For the merger transactions with reported deal ratios, the average price to tangible book value (P/TBV) ratio for the 2013 announcements at 1.28x was slightly higher than the average P/TBV ratio of 1.20x for the 2012 merger announcements. Assets to be acquired under the 2012 non‐terminated merger announcements totaled $137.1 billion, compared with $111.6 billion for the non‐terminated merger announcements made in 2013. The largest merger by target size for the 2013 announcements was the pending acquisition by Umpqua of the $9.9 billion Sterling Financial. The largest merger from the 2012 announcements was M&T Bancorp’s planned acquisition of the $43.6 billion Hudson City Bancorp. The M&T deal, which was announced on August 27, 2012, is currently scheduled to close by the end of 2014. According to company ϐilings, regulatory approval had been held up by BSA issues at M&T. INDUSTRY VALUATIONS: BANK MERGER AND ACQUISITION ACTIVITY CONTENTS Bank Merger activity ..................................................... 1 National bank stock prices ......................................... 2 California bank stock prices ....................................... 3 CA banks under $125 million ..................................... 4 CA banks $125‐$250 million....................................... 6 CA banks $250‐$500 million....................................... 8 CA banks $500 million‐$1 billion.............................. 9 CA banks $1‐$5 billion ................................................ 11 CA banks $5‐$10 billion ............................................. 12 CA banks $10‐$100 billion........................................ 13 CA thrifts ........................................................................... 14 California mergers ........................................................ 16 LTM P/E ratios ............................................................... 18 Price/Book ratios.......................................................... 19 Ratio comparisons ........................................................ 20 Stock performance under $125 million .............. 21 Stock performance $125‐$250 million ............... 22 Stock performance $250‐$500 million ............... 23 Stock performance $500 mln‐$1 bln.................... 24 Stock performance $1‐$5 billion............................ 25 Stock performance $5‐$10 billion ......................... 25 Stock performance $10‐$100 billion.................... 26 Stock performance thrifts ......................................... 26 Return rankings ............................................................. 27 The number of banks continued to dwindle in 2013, yet bank stocks recorded an exceptional year. At the end of 2013, there were 6,813 FDIC‐insured ϐinancial institutions, a decline of 279 institutions over the year. That 3.9% drop essentially matched the percentage decline in 2012 and brought the number of banks to an historic low in the annuls of FDIC history. By the end of 2013, there were 17 fewer ϐinancial institutions headquartered in California than at the start of the year. The number of publicly‐traded California banks declined, with 2013 ending with seven fewer banks in the Carpenter & Company tracking report. Scarcity may be a contributing factor for the exceptional stock performance of the California banking industry. Over 83% of the companies tracked in the Carpenter & company stock report recorded higher stock prices, and more than 85% of the companies with rising stock prices experienced price gains well in excess of 10%. Largely due to the run‐up in stock prices, the market capitalization of California’s publicly‐traded banks and thrifts was 67% higher than at the end of 2012. NOTE: This analysis utilized data for bank assets, earnings, and share counts, as of September 30, 2013.
Transcript of NOTE - Carpenter & Companycarpentercompany.com/uploads/files/30177533_2013... · Carpenter &...

Carpenter & Company --
2013 INDUSTRY VALUATION
Thenumberofbankmergerannouncementsin2013wasessentially unchanged from the number of mergersannounced in 2012. There were a total of 244 mergerannouncementsinvolvingU.S. inancialinstitutionsmadein 2012, according to SNL Financial. In 2013, the totalnumber of inancial institution merger announcementsequaled 242. Of the 2012 merger announcements, 218were completed by year‐end 2013, ive were stillpending,and21hadbeen terminated.Throughthe irst17daysof2014,143ofthemergersannouncedin2013had been completed, 85were still pending, and 14 hadbeenterminated.For the merger transactions with reported deal ratios,the average price to tangible book value (P/TBV) ratioforthe2013announcementsat1.28xwasslightlyhigherthan the average P/TBV ratio of 1.20x for the 2012mergerannouncements.Assets to be acquired under the 2012 non‐terminatedmergerannouncementstotaled$137.1billion,comparedwith $111.6 billion for the non‐terminated mergerannouncements made in 2013. The largest merger bytargetsizeforthe2013announcementswasthependingacquisition by Umpqua of the $9.9 billion SterlingFinancial. The largest merger from the 2012announcementswasM&TBancorp’splannedacquisitionofthe$43.6billionHudsonCityBancorp.TheM&Tdeal,whichwas announced on August 27, 2012, is currentlyscheduled to close by the end of 2014. According tocompany ilings,regulatoryapprovalhadbeenheldupbyBSAissuesatM&T.
INDUSTRY VALUATIONS: BANK MERGER AND ACQUISITION ACTIVITY
CONTENTS BankMergeractivity.....................................................1Nationalbankstockprices.........................................2Californiabankstockprices.......................................3CAbanksunder$125million.....................................4CAbanks$125‐$250million.......................................6CAbanks$250‐$500million.......................................8CAbanks$500million‐$1billion..............................9CAbanks$1‐$5billion................................................11CAbanks$5‐$10billion.............................................12CAbanks$10‐$100billion........................................13CAthrifts...........................................................................14Californiamergers........................................................16LTMP/Eratios...............................................................18Price/Bookratios..........................................................19Ratiocomparisons........................................................20Stockperformanceunder$125million..............21Stockperformance$125‐$250million...............22Stockperformance$250‐$500million...............23Stockperformance$500mln‐$1bln....................24Stockperformance$1‐$5billion............................25Stockperformance$5‐$10billion.........................25Stockperformance$10‐$100billion....................26Stockperformancethrifts.........................................26Returnrankings.............................................................27
Thenumberofbankscontinuedtodwindlein2013,yetbankstocksrecordedanexceptionalyear.Attheendof2013, therewere6,813FDIC‐insured inancial institutions,adeclineof279 institutionsover theyear. That 3.9% drop essentially matched the percentage decline in 2012 and brought the number ofbankstoanhistoriclowintheannulsofFDIChistory.Bytheendof2013,therewere17fewer inancialinstitutions headquartered in California than at the start of the year. The number of publicly‐tradedCaliforniabanksdeclined,with2013endingwithsevenfewerbanksintheCarpenter&Companytrackingreport. Scarcity may be a contributing factor for the exceptional stock performance of the Californiabankingindustry.Over83%ofthecompaniestrackedintheCarpenter&companystockreportrecordedhigherstockprices,andmorethan85%ofthecompanieswithrisingstockpricesexperiencedpricegainswellinexcessof10%.Largelyduetotherun‐upinstockprices,themarketcapitalizationofCalifornia’spublicly‐tradedbanksandthriftswas67%higherthanattheendof2012.NOTE:Thisanalysisutilizeddataforbankassets,earnings,andsharecounts,asofSeptember30,2013.
Carpenter & Company --
Industry Valuations
Forthemergerannouncementsmadein2013,Texaswasthestatewiththemostmergertargetsat29.ThestateinthedistantsecondpositionformostmergerswasIllinoisat14,andCaliforniawasthirdwith13.Thetargetassetsizeforthe2013classofmergerannouncementsrangedfrom$4.2million(OakwoodStateBank)to $9.9 billion (Sterling Financial). The average asset size of the targets equaled $492 million, while themedian sizewas $168million. In 2012, the acquisition target size ranged between $7.4million and $43.6billion.Theaveragetargetsizeforthe2012mergerannouncementsequaled$615million,whilethemedianmergersizewas$126million.A total of 13 merger announcements in 2013 involved California institutions, compared with 14announcements in2012.All14of the2012Californiamergerannouncementswerecompletedbyyear‐end2013,while eight of the13announcements from2013were closed in2013.Of the ivependingCaliforniaacquisitions, two transactions involved the recapitalization of institutions by private investors, while theotherthreetransactionswillresultinthefurtherreductioninthenumberofbankingchartersinthestate.Forthe irst27daysof2014,therehadbeen15bankmergerannouncementsmadeandinvolved$9.1billionintargetassets.Threeoftheannouncedacquisitionstargetedinstitutionswithmorethan$1billioninassets.Reported deal ratios for the 2014 mergers announced through January 27 indicated a step‐up in pricingrelative totangiblebookvalue.Dealratioswerereported for13of the15mergerannouncements,withanaveragepricetotangiblebookvalueof1.45x.Twooftheearly2014announcementsinvolvedtheacquisitionsofpublicly‐tradedCaliforniabanks,speci icallyBankonIt,Inc.andNorthValleyBancorp.
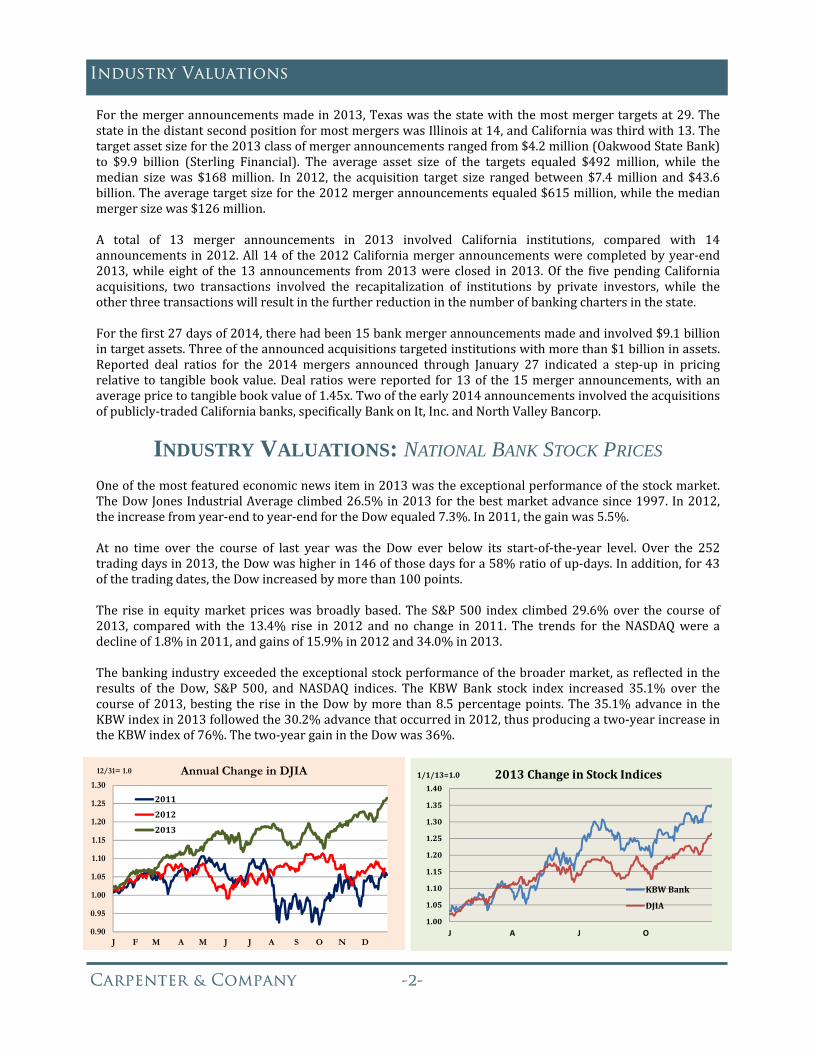
INDUSTRY VALUATIONS: NATIONAL BANK STOCK PRICES Oneofthemostfeaturedeconomicnewsitemin2013wastheexceptionalperformanceofthestockmarket.TheDowJonesIndustrialAverageclimbed26.5%in2013forthebestmarketadvancesince1997.In2012,theincreasefromyear‐endtoyear‐endfortheDowequaled7.3%.In2011,thegainwas5.5%.At no time over the course of last year was the Dow ever below its start‐of‐the‐year level. Over the 252tradingdaysin2013,theDowwashigherin146ofthosedaysfora58%ratioofup‐days.Inaddition,for43ofthetradingdates,theDowincreasedbymorethan100points.The rise inequitymarketpriceswasbroadlybased.TheS&P500 index climbed29.6%over the courseof2013, comparedwith the 13.4% rise in 2012 and no change in 2011. The trends for theNASDAQwere adeclineof1.8%in2011,andgainsof15.9%in2012and34.0%in2013.Thebankingindustryexceededtheexceptionalstockperformanceofthebroadermarket,asre lectedintheresults of the Dow, S&P 500, and NASDAQ indices. The KBW Bank stock index increased 35.1% over thecourseof2013,besting therise in theDowbymorethan8.5percentagepoints.The35.1%advance in theKBWindexin2013followedthe30.2%advancethatoccurredin2012,thusproducingatwo‐yearincreaseintheKBWindexof76%.Thetwo‐yeargainintheDowwas36%.
0.90
0.95
1.00
1.05
1.10
1.15
1.20
1.25
1.30
J F M A M J J A S O N D
Annual Change in DJIA
2011
2012
2013
12/31= 1.0
1.00
1.05
1.10
1.15
1.20
1.25
1.30
1.35
1.40
J A J O
2013ChangeinStockIndices
KBWBank
DJIA
1/1/13=1.0
Carpenter & Company --
Industry Valuations
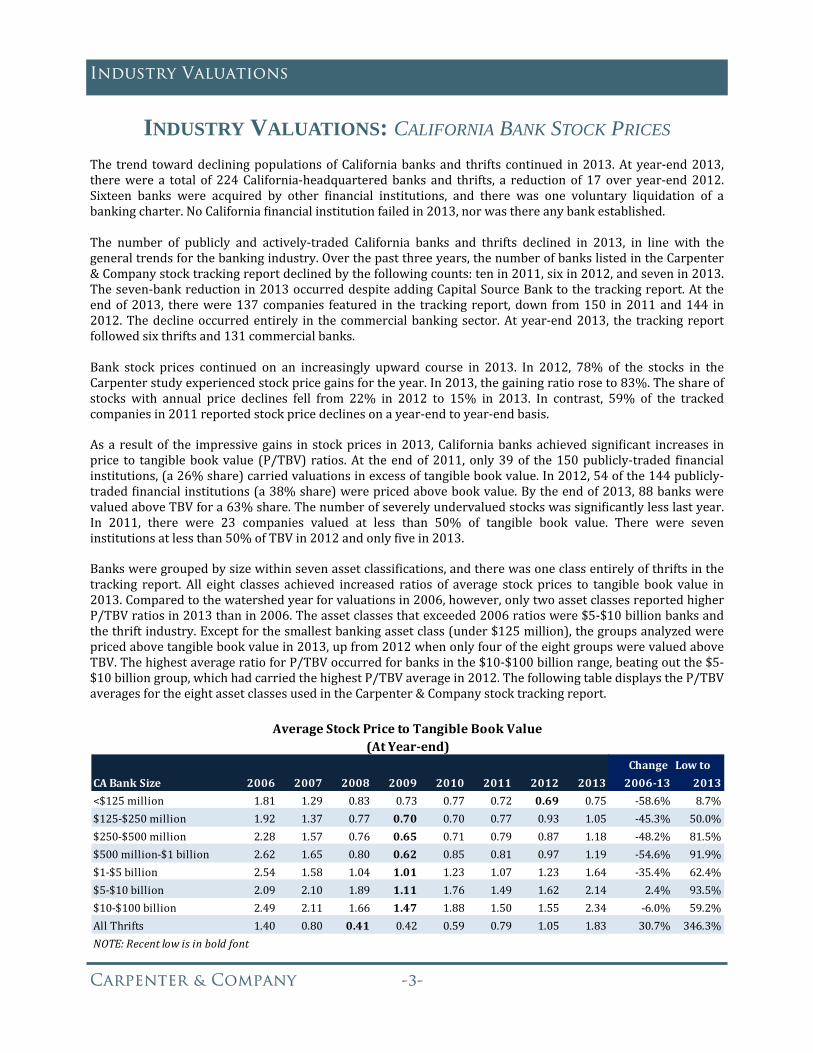
INDUSTRY VALUATIONS: CALIFORNIA BANK STOCK PRICES The trend towarddecliningpopulationsofCaliforniabanksand thrifts continued in2013.Atyear‐end2013,therewere a total of 224California‐headquarteredbanks and thrifts, a reductionof 17 over year‐end2012.Sixteen banks were acquired by other inancial institutions, and there was one voluntary liquidation of abankingcharter.NoCalifornia inancialinstitutionfailedin2013,norwasthereanybankestablished.The number of publicly and actively‐traded California banks and thrifts declined in 2013, in line with thegeneraltrendsforthebankingindustry.Overthepastthreeyears,thenumberofbankslistedintheCarpenter&Companystocktrackingreportdeclinedbythefollowingcounts:tenin2011,sixin2012,andsevenin2013.Theseven‐bankreductionin2013occurreddespiteaddingCapitalSourceBanktothetrackingreport.Attheendof2013, therewere137companies featured in the tracking report,down from150 in2011and144 in2012.Thedeclineoccurredentirely in thecommercialbankingsector.Atyear‐end2013, the tracking reportfollowedsixthriftsand131commercialbanks.Bank stock prices continued on an increasingly upward course in 2013. In 2012, 78% of the stocks in theCarpenterstudyexperiencedstockpricegainsfortheyear.In2013,thegainingratioroseto83%.Theshareofstocks with annual price declines fell from 22% in 2012 to 15% in 2013. In contrast, 59% of the trackedcompaniesin2011reportedstockpricedeclinesonayear‐endtoyear‐endbasis. Asa resultof the impressivegains in stockprices in2013,Californiabanksachievedsigni icant increases inprice to tangiblebookvalue (P/TBV) ratios.At theendof2011,only39of the150publicly‐traded inancialinstitutions,(a26%share)carriedvaluationsinexcessoftangiblebookvalue.In2012,54ofthe144publicly‐traded inancialinstitutions(a38%share)werepricedabovebookvalue.Bytheendof2013,88bankswerevaluedaboveTBVfora63%share.Thenumberofseverelyundervaluedstockswassigni icantlylesslastyear.In 2011, there were 23 companies valued at less than 50% of tangible book value. There were seveninstitutionsatlessthan50%ofTBVin2012andonly ivein2013. Banksweregroupedbysizewithinsevenassetclassi ications,andtherewasoneclassentirelyofthriftsinthetracking report. All eight classes achieved increased ratios of average stock prices to tangible book value in2013.Comparedtothewatershedyearforvaluationsin2006,however,onlytwoassetclassesreportedhigherP/TBVratiosin2013thanin2006.Theassetclassesthatexceeded2006ratioswere$5‐$10billionbanksandthethriftindustry.Exceptforthesmallestbankingassetclass(under$125million),thegroupsanalyzedwerepricedabovetangiblebookvaluein2013,upfrom2012whenonlyfouroftheeightgroupswerevaluedaboveTBV.ThehighestaverageratioforP/TBVoccurredforbanksinthe$10‐$100billionrange,beatingoutthe$5‐$10billiongroup,whichhadcarriedthehighestP/TBVaveragein2012.ThefollowingtabledisplaystheP/TBVaveragesfortheeightassetclassesusedintheCarpenter&Companystocktrackingreport.
Change Lowto
CABankSize 2006 2007 2008 2009 2010 2011 2012 2013 2006‐13 2013
<$125million 1.81 1.29 0.83 0.73 0.77 0.72 0.69 0.75 ‐58.6% 8.7%
$125‐$250million 1.92 1.37 0.77 0.70 0.70 0.77 0.93 1.05 ‐45.3% 50.0%
$250‐$500million 2.28 1.57 0.76 0.65 0.71 0.79 0.87 1.18 ‐48.2% 81.5%
$500million‐$1billion 2.62 1.65 0.80 0.62 0.85 0.81 0.97 1.19 ‐54.6% 91.9%
$1‐$5billion 2.54 1.58 1.04 1.01 1.23 1.07 1.23 1.64 ‐35.4% 62.4%
$5‐$10billion 2.09 2.10 1.89 1.11 1.76 1.49 1.62 2.14 2.4% 93.5%
$10‐$100billion 2.49 2.11 1.66 1.47 1.88 1.50 1.55 2.34 ‐6.0% 59.2%
AllThrifts 1.40 0.80 0.41 0.42 0.59 0.79 1.05 1.83 30.7% 346.3%
NOTE:Recentlowisinboldfont
AverageStockPricetoTangibleBookValue(AtYear‐end)
Carpenter & Company --
Industry Valuations
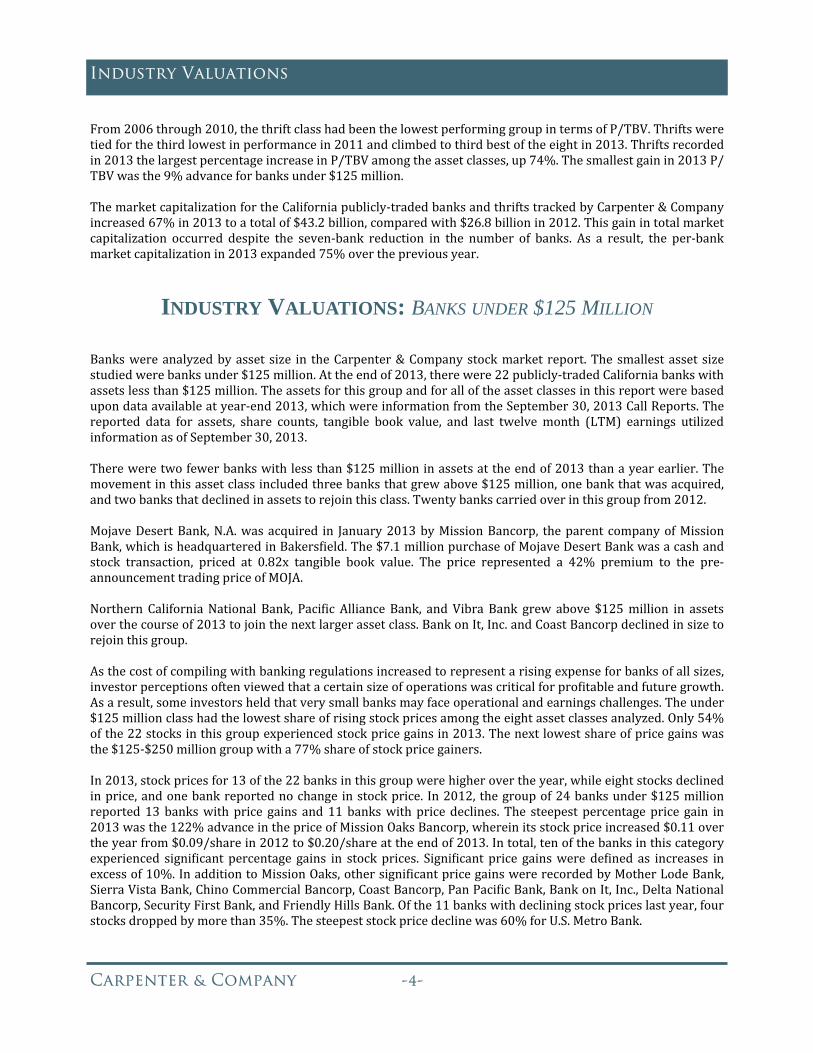
From2006through2010,thethriftclasshadbeenthelowestperforminggroupintermsofP/TBV.Thriftsweretiedforthethirdlowestinperformancein2011andclimbedtothirdbestoftheeightin2013.Thriftsrecordedin2013thelargestpercentageincreaseinP/TBVamongtheassetclasses,up74%.Thesmallestgainin2013P/TBVwasthe9%advanceforbanksunder$125million.ThemarketcapitalizationfortheCaliforniapublicly‐tradedbanksandthriftstrackedbyCarpenter&Companyincreased67%in2013toatotalof$43.2billion,comparedwith$26.8billionin2012.Thisgainintotalmarketcapitalization occurred despite the seven‐bank reduction in the number of banks. As a result, the per‐bankmarketcapitalizationin2013expanded75%overthepreviousyear.
INDUSTRY VALUATIONS: BANKS UNDER $125 MILLION Bankswereanalyzedbyassetsize in theCarpenter&Companystockmarket report.Thesmallestassetsizestudiedwerebanksunder$125million.Attheendof2013,therewere22publicly‐tradedCaliforniabankswithassetslessthan$125million.Theassetsforthisgroupandforalloftheassetclassesinthisreportwerebasedupondataavailableatyear‐end2013,whichwereinformationfromtheSeptember30,2013CallReports.Thereported data for assets, share counts, tangible book value, and last twelve month (LTM) earnings utilizedinformationasofSeptember30,2013.Thereweretwofewerbankswithlessthan$125millioninassetsattheendof2013thanayearearlier.Themovementinthisassetclassincludedthreebanksthatgrewabove$125million,onebankthatwasacquired,andtwobanksthatdeclinedinassetstorejointhisclass.Twentybankscarriedoverinthisgroupfrom2012.MojaveDesertBank,N.A.wasacquired in January2013byMissionBancorp, theparentcompanyofMissionBank,whichisheadquarteredinBakers ield.The$7.1millionpurchaseofMojaveDesertBankwasacashandstock transaction, priced at 0.82x tangible book value. The price represented a 42% premium to the pre‐announcementtradingpriceofMOJA.Northern CaliforniaNational Bank, Paci ic Alliance Bank, andVibra Bank grew above $125million in assetsoverthecourseof2013tojointhenextlargerassetclass.BankonIt,Inc.andCoastBancorpdeclinedinsizetorejointhisgroup.Asthecostofcompilingwithbankingregulationsincreasedtorepresentarisingexpenseforbanksofallsizes,investorperceptionsoftenviewedthatacertainsizeofoperationswascriticalforpro itableandfuturegrowth.Asaresult,someinvestorsheldthatverysmallbanksmayfaceoperationalandearningschallenges.Theunder$125millionclasshadthelowestshareofrisingstockpricesamongtheeightassetclassesanalyzed.Only54%ofthe22stocksinthisgroupexperiencedstockpricegainsin2013.Thenextlowestshareofpricegainswasthe$125‐$250milliongroupwitha77%shareofstockpricegainers.In2013,stockpricesfor13ofthe22banksinthisgroupwerehigherovertheyear,whileeightstocksdeclinedinprice,andonebankreportednochange instockprice. In2012, thegroupof24banksunder$125millionreported13bankswithprice gains and11bankswithpricedeclines. The steepestpercentageprice gain in2013wasthe122%advanceinthepriceofMissionOaksBancorp,whereinitsstockpriceincreased$0.11overtheyearfrom$0.09/sharein2012to$0.20/shareattheendof2013.Intotal,tenofthebanksinthiscategoryexperienced signi icant percentage gains in stockprices. Signi icant price gainswere de ined as increases inexcessof10%.InadditiontoMissionOaks,othersigni icantpricegainswererecordedbyMotherLodeBank,SierraVistaBank,ChinoCommercialBancorp,CoastBancorp,PanPaci icBank,BankonIt,Inc.,DeltaNationalBancorp,SecurityFirstBank,andFriendlyHillsBank.Ofthe11bankswithdecliningstockpriceslastyear,fourstocksdroppedbymorethan35%.Thesteepeststockpricedeclinewas60%forU.S.MetroBank.

Carpenter & Company --
Industry Valuations
Theunder$125millionassetclasswastheonlygroupwithanaverageprice/tangiblebookvalueratiothatwasless than 1.0x, that is, valued under tangible book. Only three banks in this class traded above book value,notablyChinoCommercialBancorp,MotherLodeBank,andTri‐ValleyBank.ChinoCommercialBankhadthehighestP/TBVof1.57x.Therewerethreebanksthattradedatlessthan50%ofbookvalue.ThelowestP/TBVforthisgroupandforallpublicly‐tradedinstitutionswas0.08xforGoldenStateBank.Theotherbankspricedunder50%ofbookvaluewereCaliforniaBusinessBankandDeltaNationalBancorp.Four companies,CoastBancorp,MissionOaksBancorp,PanAmericanBank,andSaigonNationalBank,didnothavemeaningfulP/TBVratiosandwerenotincludedintheaverage.TheaverageP/TBVforthegroupwithmeaningfulP/TBVequaled0.75x,upfromthe0.69xin2012.Asarule,whenaP/Eratioexceeded50x,itwasdeterminedthatpro itsweretoolowrelativetopricingtoyieldameaningfulratio.Hence,P/Eratios inexcessof50xwerecitedasNMornotmeaningful. Inaddition, if thebank sustained losses, theP/E ratiowas shownasNM.Twelve of the22banks reportedpro its for the lasttwelve months (LTM) ending September 30, 2013. Of these 12 pro itable banks, ten of the banks hadmeaningfulpriceearningsratios,thatis,aratiobelow50x.ThemeaningfulpricetoLTMearningsratiosforthisasset class ranged from 9.55x for Cornerstone Community Bank to 33.52x for Sutter Community Bank. TheaverageP/Eforthisclassequaled16.6xin2013,upslightlyfromthe16.3xaveragefor2012.Thetradingvolumeforthesebankswasgenerallyquitesmall.Thevolumeofoutstandingshares,notablythosesharesnotheldby insiders,alsotendedbequite limitedforthisassetclass.Asaresult, theper‐banktradingvolumeforthisassetclasswasthesmallestofanyoftheclasses.Nonetheless,allofthebankstradedoverthecourseof theyear,andonlytwobanksdidnottradeduringDecember.Onebankhad its lastpostedtrade inMay.Thecombinedvolumeofsharestradedoverthecourseof theyearequaled4.1million,anapproximateannual volume of 187,500 shares per bank. This average trading volume in 2013was 23% lower than theaveragevolume for the$125‐$250millionassetclass.Thestockwith thehighestannualvolumeof trades in2013wasAmericas United Bankwith over 1million shares traded. The lowest volumewas the 324 sharestradedforDeltaNationalBancorp.Thebankwiththelargestmarketcapitalizationattheendof2013wasAmericasUnitedBankat$16.5million.Twobankscarriedmarketcapitalizationoflessthan$1million,notablyCaliforniaBusinessBankat$784,426andGoldenStateBankat$341,251.Thetotalmarketcapitalizationofthisgroupequaled$151million,downfromthe$172millionin2012marketcapitalization.Attheendof2013,thereweretwofewerbanksthanintheprioryear.Marketcapitalizationonaper‐bankbasis,however,edgedlowerin2013to$6.8millionfrom$7.1millionattheendof2012.Ofthe22companiesinthisgroup, ifteenreportedyear‐over‐year(YoY)increasesinmarketcapitalization,sixweredownovertheyear,andonewasessentiallyunchanged.Recapitalizationbyaprivate investorbrought$7.9millionofnewcapital toCaliforniaBusinessBank.SierraVistaBankgenerated$1.5millioninnewcapitaloverthelasttwelvemonthsendingSeptember30,2013.
LargestPriceGainsMissionOaksBancorp +122.2%MotherLodeBank +119.3%SierraVistaBank +63.2%SteepestPriceDeclineUSMetroBank ‐59.7%
BANKS UNDER $125 MILLION (continued)
0.0
0.5
1.0
1.5
2.0
2.5
02 03 04 05 06 07 08 09 10 11 12 13
1.51.7
2.1 2.01.8
1.3
0.80.7 0.8 0.7 0.7 0.8
PricetoBook‐‐CABanks<$125Million

Carpenter & Company --
Industry Valuations
INDUSTRY VALUATIONS: BANKS BETWEEN $125 AND $250 MILLION Theassetcategorywiththelargestnumberofbankswasintherangeof$125and$250millionbanksbaseduponSeptember30,2013data.AttheendofDecember2012,therewere47banksinthisclass.Overthecourseofthepastyear,thisgroupdeclinedbyeightto39banks.Within this class, 36banks remained in the groupover the year.Oneof these carry‐over banks changed itsnamefromOjaiCommunityBanktoOCBBancorp.Elevenbanksexitedthisclass.Twobanksdeclinedinsizetorejointhesmallestassetclass.Threebankswereacquiredbyotherbanks.Sixbanksgrewinassetstojointhe$250‐$500millionclass.Threebanksgrewintothisclassfromtheunder$125milliongroup.Threepublicly‐tradedbanksfromthe$125to$250milliongroupwereacquiredin2013.VisaliaCommunityBankwasacquiredon July1,2013byCentralValleyCommunityBancorp ina50/50cash/stocktransaction.The$21.3milliondeal forVisaliaCommunityBankwasvaluedat1.24x tangiblebookvalue.Paci icPremierBancorpclosedonitsacquisitionofSanDiegoTrustBankonJune24,2013.TheacquisitionofSanDiegoTrustBank was through a cash/stock transaction valued at $31.1 million or 1.21x tangible book value. SterlingFinancialCorporationacquiredCommerceNationalBankonOctober1,2013inacashpurchasevaluedat$42.9million or 1.43x tangible book value. Subsequently, Sterling Financial Corp. of Washington became theacquisitiontargetofUmpquaHoldingsCorp.ofOregon.Growing into this asset class from the under $125 million group were Northern California National Bank,Paci icAllianceBank,andVibraBank.Leavingthisassetclasstorejointheunder$125milliongroupwereBankon It, Inc.andCoastBancorp.Growing into the$250‐$500milliongroupwereFocusBusinessBank,MissionValley Bancorp, Open Bank, Redwood Capital Bancorp, and Seacoast Commerce Bank. Coronado First Bankacquired privately‐held SanDiego Private Bank onApril 2, 2013 in an all‐stock transaction valued at $13.6millionor1.04xtangiblebookvalue.CoronadoFirstBankchangeditsnametoSanDiegoPrivateBankanditstickersymbolSDPBandgrewintothe$250‐$500millionclass.In addition to the completed transactions involving banks in this group, Independence Bank announced onNovember 4, 2013 its intention to acquire Premier Service Bank. This pending 55% cash/45% stocktransactionwasvaluedat$8.6millionforapricetotangiblebookvalueratioof1.26x.Atthebeginningof2013,Premier Service Bank had been under a merger agreement with First California Financial Group, Inc.; thisagreementwasterminatedonJanuary30,2013.Ofthe39banksinthe$125‐$250milliongroupattheendofDecember2013,31banksreportedYoYgainsinstockprices. Sevenbanks reported lower stockprices, andonebankwasunchanged in stockpriceover theyear.Twenty‐threebanksreportedstockpricegainsinexcessof10%.Onlyoneofthepricedeclinesexceeded10%, notably OCB Bancorp at ‐14%. AltaPaci ic Bank ended 2013 with no change in stock price, despitereportingstocktradingactivity.Acquisition‐target Premier Service Bank experienced the steepest price increase last year, up 583%. Othertriple‐digitpricegainswererealizedforCalWestBancorp(278%),ValleyCommunityBank(221%),NorthernCalifornia Bancorp, Inc. (200%), and Uniti Financial Corp (149%). Other signi icant stock price gains wererecorded for American California Bank, American Riviera Bank, Bank of Napa, N.A., Bank of Santa Clarita,CommunityBusinessBank,CommunityBankoftheBay,Community1stBank,BankofSouthernCalifornia,N.A.,First Mountain Bank, Golden Valley Bancorp, Liberty Bancorp, Inc., MNB Holdings Corp., Orange CountyBusinessBank, PinnacleBank, Paci ic AllianceBank, Paci ic CommerceBank, ProAmericaBank,RiverValleyCommunityBank,andSummitBancshares,Inc.
Carpenter & Company --
Industry Valuations
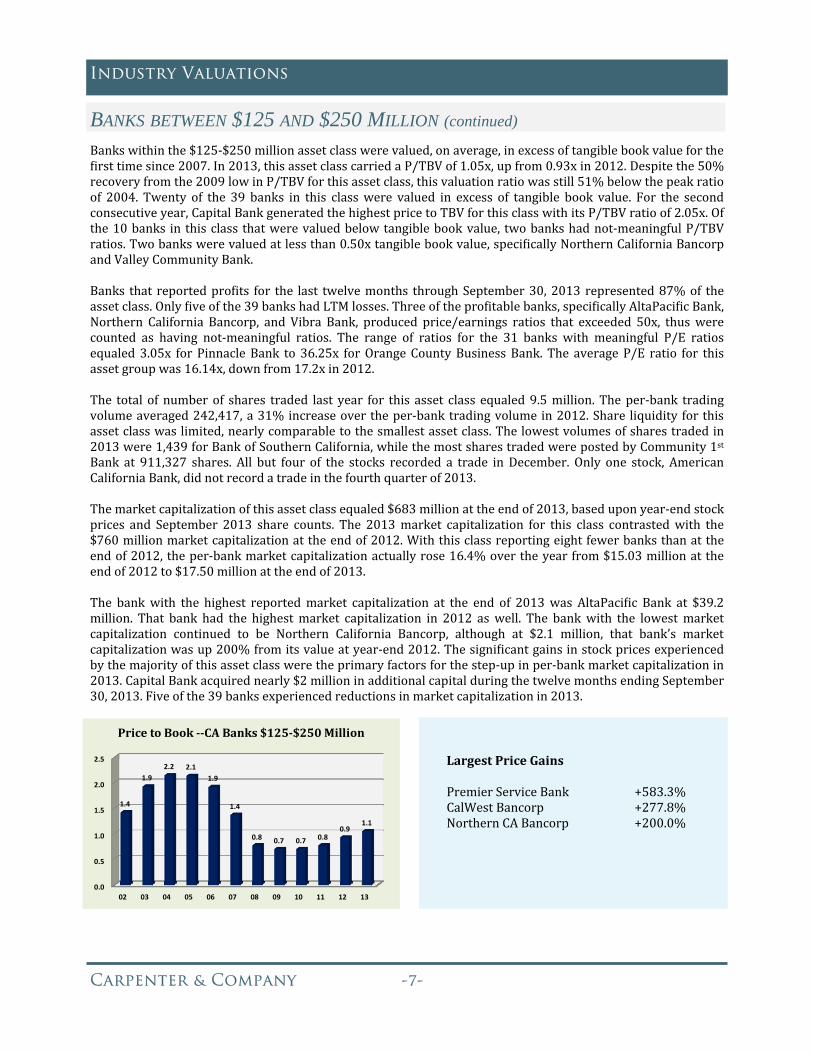
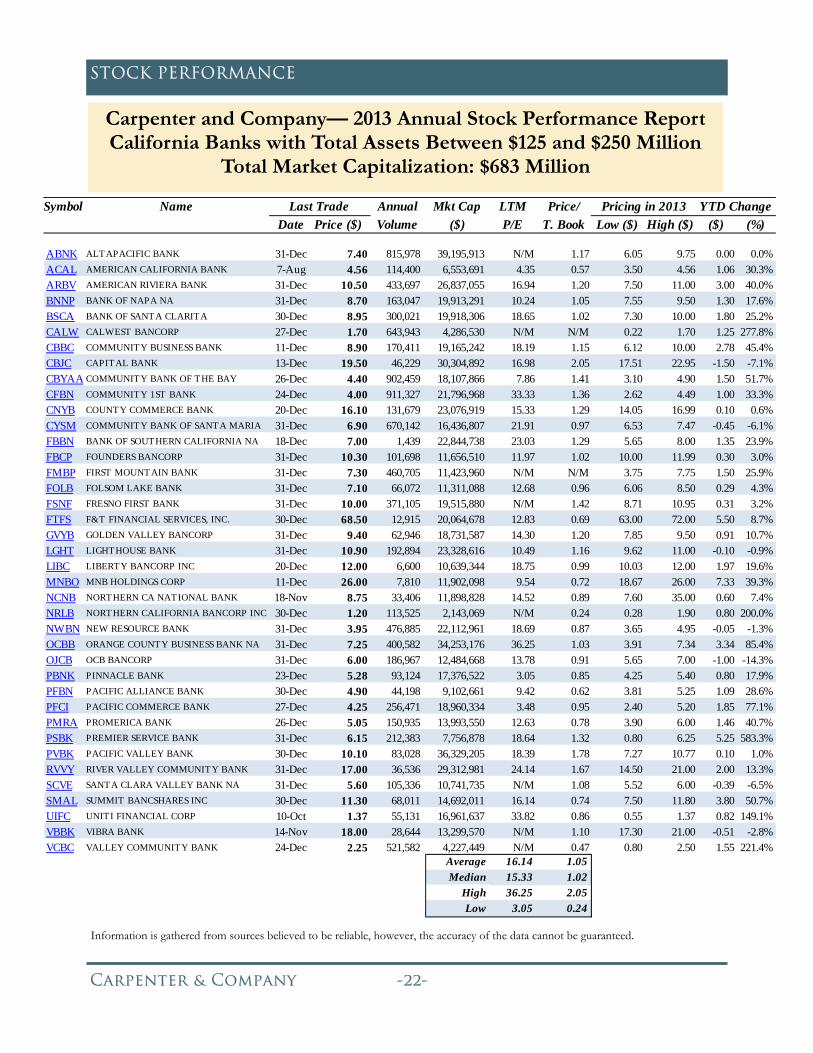
Bankswithinthe$125‐$250millionassetclasswerevalued,onaverage,inexcessoftangiblebookvaluefortheirsttimesince2007.In2013,thisassetclasscarriedaP/TBVof1.05x,upfrom0.93xin2012.Despitethe50%recoveryfromthe2009lowinP/TBVforthisassetclass,thisvaluationratiowasstill51%belowthepeakratioof 2004. Twenty of the 39 banks in this classwere valued in excess of tangible book value. For the secondconsecutiveyear,CapitalBankgeneratedthehighestpricetoTBVforthisclasswithitsP/TBVratioof2.05x.Ofthe10banks in thisclass thatwerevaluedbelowtangiblebookvalue, twobankshadnot‐meaningfulP/TBVratios.Twobankswerevaluedatlessthan0.50xtangiblebookvalue,speci icallyNorthernCaliforniaBancorpandValleyCommunityBank.Banks that reportedpro its for the last twelvemonths throughSeptember30,2013 represented87%of theassetclass.Only iveofthe39bankshadLTMlosses.Threeofthepro itablebanks,speci icallyAltaPaci icBank,Northern California Bancorp, and Vibra Bank, produced price/earnings ratios that exceeded 50x, thuswerecounted as having not‐meaningful ratios. The range of ratios for the 31 banks with meaningful P/E ratiosequaled3.05x forPinnacleBank to 36.25x forOrangeCountyBusinessBank. The averageP/E ratio for thisassetgroupwas16.14x,downfrom17.2xin2012.The total of numberof shares traded last year for this asset class equaled9.5million.Theper‐bank tradingvolumeaveraged242,417,a31%increaseovertheper‐banktradingvolumein2012.Share liquidity forthisassetclasswaslimited,nearlycomparabletothesmallestassetclass.Thelowestvolumesofsharestradedin2013were1,439forBankofSouthernCalifornia,whilethemostsharestradedwerepostedbyCommunity1stBank at 911,327 shares. All but four of the stocks recorded a trade inDecember. Only one stock, AmericanCaliforniaBank,didnotrecordatradeinthefourthquarterof2013.Themarketcapitalizationofthisassetclassequaled$683millionattheendof2013,baseduponyear‐endstockprices and September 2013 share counts. The 2013market capitalization for this class contrastedwith the$760millionmarketcapitalizationattheendof2012.Withthisclassreportingeightfewerbanksthanattheendof2012,theper‐bankmarketcapitalizationactuallyrose16.4%overtheyearfrom$15.03millionattheendof2012to$17.50millionattheendof2013.The bankwith the highest reportedmarket capitalization at the end of 2013was AltaPaci ic Bank at $39.2million. That bank had the highestmarket capitalization in 2012 aswell. The bankwith the lowestmarketcapitalization continued to be Northern California Bancorp, although at $2.1 million, that bank’s marketcapitalizationwasup200%fromitsvalueatyear‐end2012.Thesigni icantgainsinstockpricesexperiencedbythemajorityofthisassetclassweretheprimaryfactorsforthestep‐upinper‐bankmarketcapitalizationin2013.CapitalBankacquirednearly$2millioninadditionalcapitalduringthetwelvemonthsendingSeptember30,2013.Fiveofthe39banksexperiencedreductionsinmarketcapitalizationin2013.
LargestPriceGainsPremierServiceBank +583.3%CalWestBancorp +277.8%NorthernCABancorp +200.0%
BANKS BETWEEN $125 AND $250 MILLION (continued)
0.0
0.5
1.0
1.5
2.0
2.5
02 03 04 05 06 07 08 09 10 11 12 13
1.4
1.9
2.2 2.1
1.9
1.4
0.8 0.7 0.7 0.80.9
1.1
PricetoBook‐‐CABanks$125‐$250Million
Carpenter & Company --
Industry Valuations
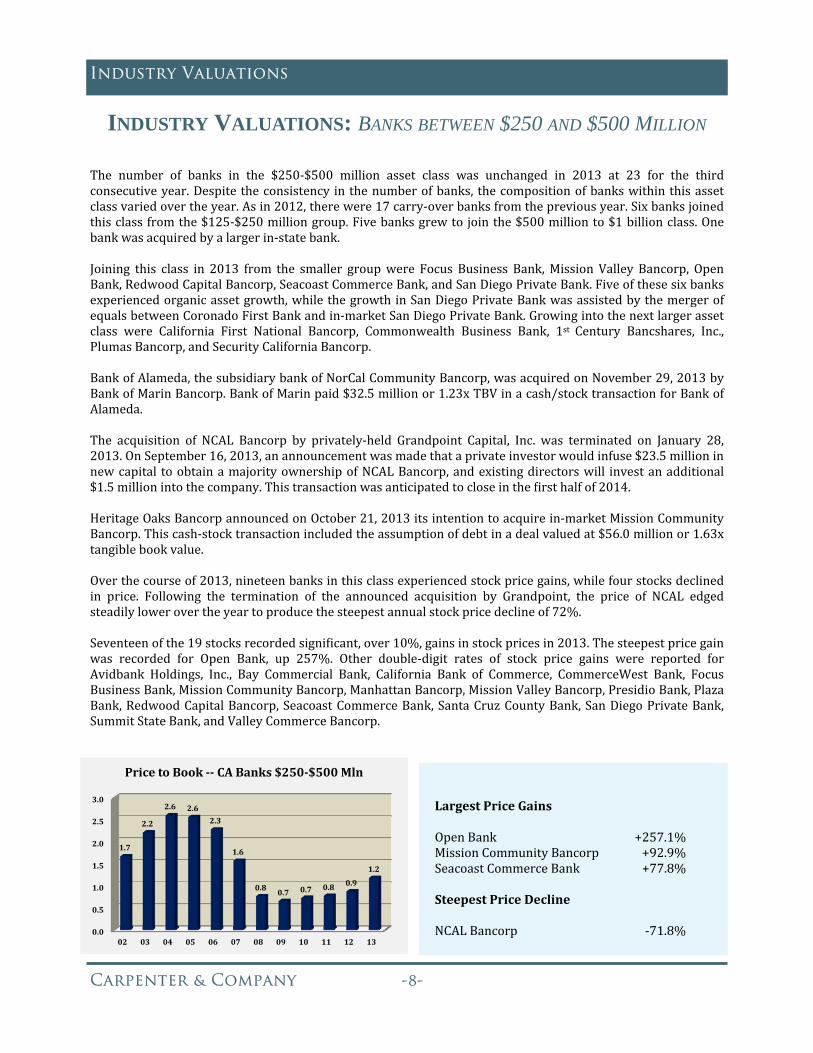
INDUSTRY VALUATIONS: BANKS BETWEEN $250 AND $500 MILLION The number of banks in the $250‐$500 million asset class was unchanged in 2013 at 23 for the thirdconsecutiveyear.Despitetheconsistency inthenumberofbanks, thecompositionofbankswithinthisassetclassvariedovertheyear.Asin2012,therewere17carry‐overbanksfromthepreviousyear.Sixbanksjoinedthisclassfromthe$125‐$250milliongroup.Fivebanksgrewto jointhe$500millionto$1billionclass.Onebankwasacquiredbyalargerin‐statebank.Joining this class in 2013 from the smaller groupwere Focus Business Bank,Mission Valley Bancorp, OpenBank,RedwoodCapitalBancorp,SeacoastCommerceBank,andSanDiegoPrivateBank.Fiveofthesesixbanksexperiencedorganicassetgrowth,whilethegrowthinSanDiegoPrivateBankwasassistedbythemergerofequalsbetweenCoronadoFirstBankandin‐marketSanDiegoPrivateBank.Growingintothenextlargerassetclass were California First National Bancorp, Commonwealth Business Bank, 1st Century Bancshares, Inc.,PlumasBancorp,andSecurityCaliforniaBancorp.BankofAlameda,thesubsidiarybankofNorCalCommunityBancorp,wasacquiredonNovember29,2013byBankofMarinBancorp.BankofMarinpaid$32.5millionor1.23xTBVinacash/stocktransactionforBankofAlameda.The acquisition of NCAL Bancorp by privately‐held Grandpoint Capital, Inc. was terminated on January 28,2013.OnSeptember16,2013,anannouncementwasmadethataprivateinvestorwouldinfuse$23.5millioninnewcapital toobtainamajorityownershipofNCALBancorp,andexistingdirectorswill investanadditional$1.5millionintothecompany.Thistransactionwasanticipatedtocloseinthe irsthalfof2014.HeritageOaksBancorpannouncedonOctober21,2013itsintentiontoacquirein‐marketMissionCommunityBancorp.Thiscash‐stocktransactionincludedtheassumptionofdebtinadealvaluedat$56.0millionor1.63xtangiblebookvalue.Overthecourseof2013,nineteenbanksinthisclassexperiencedstockpricegains,whilefourstocksdeclinedin price. Following the termination of the announced acquisition by Grandpoint, the price of NCAL edgedsteadilylowerovertheyeartoproducethesteepestannualstockpricedeclineof72%.Seventeenofthe19stocksrecordedsigni icant,over10%,gainsinstockpricesin2013.Thesteepestpricegainwas recorded for Open Bank, up 257%. Other double‐digit rates of stock price gains were reported forAvidbank Holdings, Inc., Bay Commercial Bank, California Bank of Commerce, CommerceWest Bank, FocusBusinessBank,MissionCommunityBancorp,ManhattanBancorp,MissionValleyBancorp,PresidioBank,PlazaBank,RedwoodCapitalBancorp,SeacoastCommerceBank,SantaCruzCountyBank,SanDiegoPrivateBank,SummitStateBank,andValleyCommerceBancorp.
LargestPriceGainsOpenBank +257.1%MissionCommunityBancorp +92.9%SeacoastCommerceBank +77.8%SteepestPriceDeclineNCALBancorp ‐71.8%0.0
0.5
1.0
1.5
2.0
2.5
3.0
02 03 04 05 06 07 08 09 10 11 12 13
1.7
2.2
2.6 2.6
2.3
1.6
0.80.7 0.7 0.8 0.9
1.2
PricetoBook‐‐ CABanks$250‐$500Mln
Carpenter & Company --
Industry Valuations
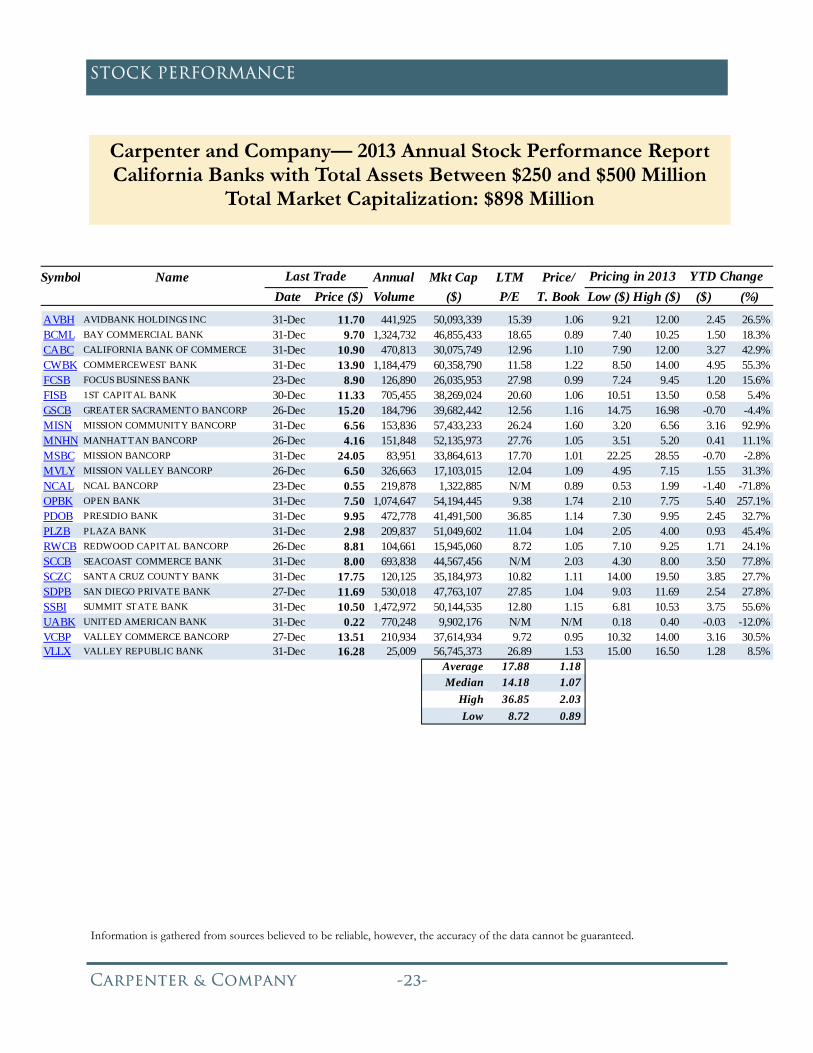
Theaveragepricetotangiblebookvalueforthisassetclassequaled1.18xin2013,upsigni icantlyfromthe0.87xaveragein2012.Eighteenofthe23bankswerepricedabovetangiblebookvalue.Fouroftheremainingivebankswerevaluedwithin11basispointsoftangiblebookvalue.ThevaluationforUnitedAmericanBankwasdeemedtobenotmeaningful.ThehighestvaluationwascarriedbySeacoastCommerceBankat2.03x,while thebankswith the lowestmeaningful P/TBVwere tied at 0.89x forBayCommercialBankandNCALBancorp.TheP/TBVratioforthisassetclassralliedgreatlyfromits2009cyclicallow,increasing82%throughtheendof2013.Despitethisrecovery,theP/TBVratioattheendof2013wasstill55%belowthepeakratiothathadoccurredin2004.Onlytwobanksinthisgroupof23 inancial institutionssustainedlossesforthelasttwelvemonthsthroughSeptember30,2013,notablyNCALBancorpandUnitedAmericanBank.LTMpro itsat SeacoastCommerceBankproducedaP/Eratioinexcessof50xand,therefore,theratioforthatcompanywasdeemedtobenotmeaningful. The average P/E ratio for the remaining 30 companies averaged 17.88x at the end of 2013,compared to the 15.31x ratio in 2012. The P/E ratios ranged from 8.72x for Redwood Capital Bancorp to36.85xforPresidioBank.Trading activity for banks in the $250‐$500million class wasmore robust than for the two smaller assetclasses.All23bankstockstradedinDecember,andallbuttwobankspostedtradesduringthe inalweekoftheyear.Thesumofalltradesin2013forthisclassequaled11.1millionsharesforaper‐bankaveragetradingvolume of 480,884 shares or 156%more than the under $125 million bank group. The volume of tradesrangedfrom25,009sharesforValleyRepublicBankto1.47millionsharesforSummitStateBank.Themarketcapitalization for thisclassequaled$898million,upmarginally from$830million in2012.Theaverageper‐bankmarketcapitalizationequaled$39.0millioncomparedto$36.1millionin2012.Therelativestabilityoftheyear‐over‐yearmarketcapitalizationcomparisoncouldbeslightlymisleading.Thebanksthatgrewoutofthisgroupreportedaggregatemarketcapitalizationof$334million,whilethebankscomingintothisclasshadatotalmarketcapitalizationof$196million,or$138millionlessthantheexitinggroup.Therangeinmarketcapitalizationattheendof2013equaledalowof$1.3millionforNCALBancorptoahighof$60.3millionforCommerceWestBank.Withinthisassetgroup,increasesinmarketcapitalizationoccurredforallofthebanks,exceptGreaterSacramentoBancorp.Theannualriseinmarketcapitalizationresultedfromthesteepincreasesstockpricesthatwereexperiencedbythemajorityofthesecompanies.In addition to the price‐driven increase in market capitalization, two banks generated merger‐relatedincreasesinsharecountandcapital.SanDiegoPrivateBankrecognizedmerger‐relatedincreasesincapitalof$16.2million.MissionBank reported a $3.5million increase in capital as a result of itsmerger. Twootherbanksreportedstockofferingorconversionsthataddedmorethan$1millionincapital,speci icallythe$1.5millioncapitalincreasefor1stCapitalandthe$7.9millionofferingbyAvidbank.
INDUSTRY VALUATIONS: BANKS BETWEEN $500 MILLION AND $1 BILLION
ThenumberofCaliforniabankswithassets intherangeof$500millionand$1billiongrewbythree intheyearendingDecember2013.Thethree‐bankgainwasachievedthroughtheadditionofsixbankstothisclassandtheeliminationofthreebanks.Fivebanksjoinedthisclassfromthe$250to$500millionclass.Onebankdeclinedinassetstorejointhegroupfromtheover$1billionclass.Astheresultofanacquisition,onebankgrewabove$1billioninassets.Twobanksfromthisclasswereacquiredbylargerbanks.Therewasacarry‐overof13banksfromthepreviousyear.
BANKS BETWEEN $250 AND $500 MILLION (continued)
Carpenter & Company --
Industry Valuations
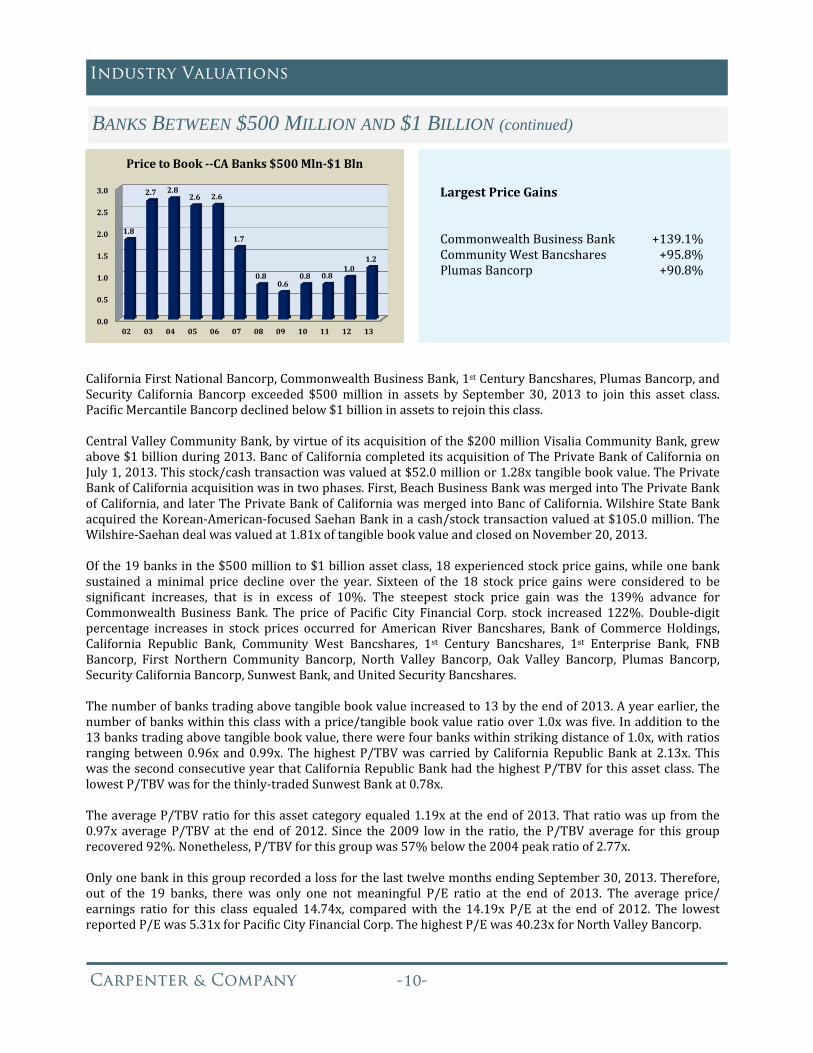
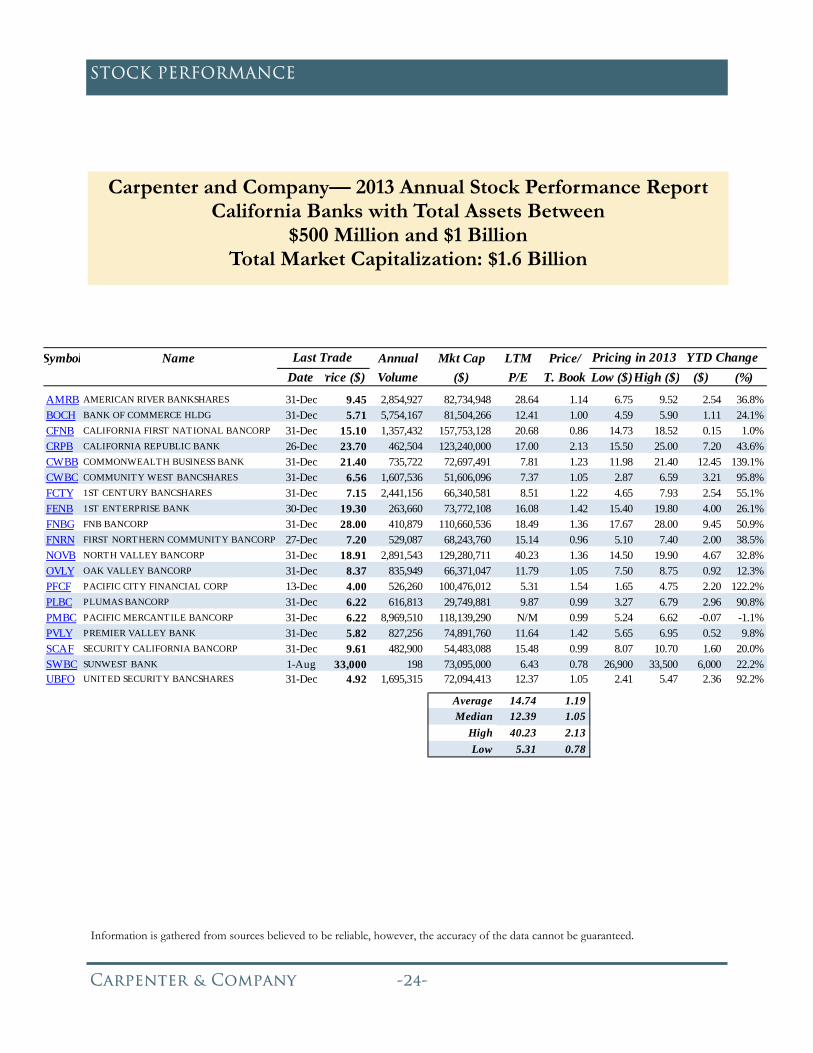
CaliforniaFirstNationalBancorp,CommonwealthBusinessBank,1stCenturyBancshares,PlumasBancorp,andSecurity California Bancorp exceeded $500million in assets by September 30, 2013 to join this asset class.Paci icMercantileBancorpdeclinedbelow$1billioninassetstorejointhisclass.CentralValleyCommunityBank,byvirtueofitsacquisitionofthe$200millionVisaliaCommunityBank,grewabove$1billionduring2013.BancofCaliforniacompleteditsacquisitionofThePrivateBankofCaliforniaonJuly1,2013.Thisstock/cashtransactionwasvaluedat$52.0millionor1.28xtangiblebookvalue.ThePrivateBankofCaliforniaacquisitionwasintwophases.First,BeachBusinessBankwasmergedintoThePrivateBankofCalifornia,andlaterThePrivateBankofCaliforniawasmergedintoBancofCalifornia.WilshireStateBankacquiredtheKorean‐American‐focusedSaehanBankinacash/stocktransactionvaluedat$105.0million.TheWilshire‐Saehandealwasvaluedat1.81xoftangiblebookvalueandclosedonNovember20,2013.Ofthe19banksinthe$500millionto$1billionassetclass,18experiencedstockpricegains,whileonebanksustained aminimal price decline over the year. Sixteen of the 18 stock price gainswere considered to besigni icant increases, that is in excess of 10%. The steepest stock price gain was the 139% advance forCommonwealth Business Bank. The price of Paci ic City Financial Corp. stock increased 122%. Double‐digitpercentage increases in stock prices occurred for American River Bancshares, Bank of Commerce Holdings,California Republic Bank, Community West Bancshares, 1st Century Bancshares, 1st Enterprise Bank, FNBBancorp, First Northern Community Bancorp, North Valley Bancorp, Oak Valley Bancorp, Plumas Bancorp,SecurityCaliforniaBancorp,SunwestBank,andUnitedSecurityBancshares.Thenumberofbankstradingabovetangiblebookvalueincreasedto13bytheendof2013.Ayearearlier,thenumberofbankswithinthisclasswithaprice/tangiblebookvalueratioover1.0xwas ive.Inadditiontothe13bankstradingabovetangiblebookvalue,therewerefourbankswithinstrikingdistanceof1.0x,withratiosrangingbetween0.96xand0.99x.ThehighestP/TBVwas carriedbyCaliforniaRepublicBankat2.13x.ThiswasthesecondconsecutiveyearthatCaliforniaRepublicBankhadthehighestP/TBVforthisassetclass.ThelowestP/TBVwasforthethinly‐tradedSunwestBankat0.78x.TheaverageP/TBVratioforthisassetcategoryequaled1.19xattheendof2013.Thatratiowasupfromthe0.97x average P/TBV at the endof 2012. Since the 2009 low in the ratio, theP/TBVaverage for this grouprecovered92%.Nonetheless,P/TBVforthisgroupwas57%belowthe2004peakratioof2.77x.OnlyonebankinthisgrouprecordedalossforthelasttwelvemonthsendingSeptember30,2013.Therefore,out of the 19 banks, there was only one not meaningful P/E ratio at the end of 2013. The average price/earnings ratio for this class equaled 14.74x, comparedwith the 14.19x P/E at the end of 2012. The lowestreportedP/Ewas5.31xforPaci icCityFinancialCorp.ThehighestP/Ewas40.23xforNorthValleyBancorp.
LargestPriceGainsCommonwealthBusinessBank +139.1%CommunityWestBancshares +95.8%PlumasBancorp +90.8%
BANKS BETWEEN $500 MILLION AND $1 BILLION (continued)
0.0
0.5
1.0
1.5
2.0
2.5
3.0
02 03 04 05 06 07 08 09 10 11 12 13
1.8
2.7 2.82.6 2.6
1.7
0.80.6
0.8 0.81.0
1.2
PricetoBook‐‐CABanks$500Mln‐$1Bln

Carpenter & Company --
Industry Valuations
Thetotalnumberofsharestradedin2013forthe$500millionto$1billionassetgroupequaled33.3millionforanaveragevolumeperbankof1.75millionshares.Thisaveragetradingactivityrepresenteda35%increaseoverthevolumein2012.SunwestBank,withits$33,000averagesharepriceanditsclosely‐heldownership,reportedthefewestnumberofsharestradedat198sharesfortheentireyear.Incontrast,thelargestnumberofsharestradedoccurredforPaci icMercantileBancorpat9.0millionshares.Withinthisassetclass,eightofthe19bankshadtradingvolumesinexcessof1millionsharesin2013.Themarketcapitalizationof thisclass in2013 totaled$1.6billion,up from$988million in2012.Partof the63% increase in total market capitalization was the addition over the year of three banks to this group.Nonetheless, theper‐bankmarket capitalization increased37% to$84.6million from$61.7million in 2012.Thelowestmarketcapitalizationwas$29.7millionforPlumasBancorp.ThelargestmarketcapitalizationwasheldbyCaliforniaFirstNationalBancorpat$157.8million,whichwasmorethan4timesgreaterthanPlumasBancorp.OnlyOakValleyBancorpsustainedaYoYreductioninmarketcapitalization.
INDUSTRY VALUATIONS: BANKS BETWEEN $1 AND $5 BILLION Thenumberofbanksinthe$1‐$5billionassetclassdecreasedbytwoin2013to18.Thetwo‐bankreductionmatchedthereductioninthesizeofthisclassthathadoccurredin2012.Therewasconsiderablemovementinthisassetclass.CentralValleyCommunityBank,throughitsacquisitionofVisaliaCommunityBank,grewabove$1billion inassets.Farmers&MerchantsBankgrewabove$5billionto jointhenext largerassetclass.FirstCaliforniaFinancialGroupwasacquiredbyPacWestBancorp.Paci icMercantileBankdroppedbelow$1billioninassetstorejointhesmallerassetclass.Seventeenbankscarriedoverinthisclassfromtheprioryear.All18banksinthisclassreportedannualgainsinstockprices.Allbutonebankreporteddouble‐digitratesofincreaseinstockprices.TheFarmers&MerchantBancorpofLongBeachstockpriceincreaseof3.0%wasthesmallestgainofthegroup.WilshireBancorp,Inc.experiencedthesteepestincreaseof86%.Otherstockpricegainsinexcessof50%wererecordedbyHanmiFinancialCorp.,Paci icPremierBancorp,andTricoBancshares.Only three banks in this groupwere valued below 1.0x price/tangible book value, notablyMechanics Bank,ExchangeBank,andRiverCityBank.MechanicsBankwithits0.85xP/TBVcarriedthelowestratioofthegroup.WestamericaBancorpat3.75xP/TBVhadthehighestvaluationofthegroupandhadthesecondhighestratioofallthepublicly‐tradedcompaniesanalyzed.BridgeCapitalHoldingsandWilshireBancorp,Inc.tradedabove2.0xP/TBV.
LargestPriceGainsWilshireBancorp +86.2%TricoBancshares +69.4%HanmiFinancialCorp +61.1%
BANKS BETWEEN $500 MILLION AND $1 BILLION (continued)
0.0
0.5
1.0
1.5
2.0
2.5
3.0
02 03 04 05 06 07 08 09 10 11 12 13
2.0
2.5
3.0
2.42.5
1.6
1.0 1.01.3
1.11.2
1.6
PricetoBook‐‐ CABanks$1‐$5Billion

Carpenter & Company --
Industry Valuations
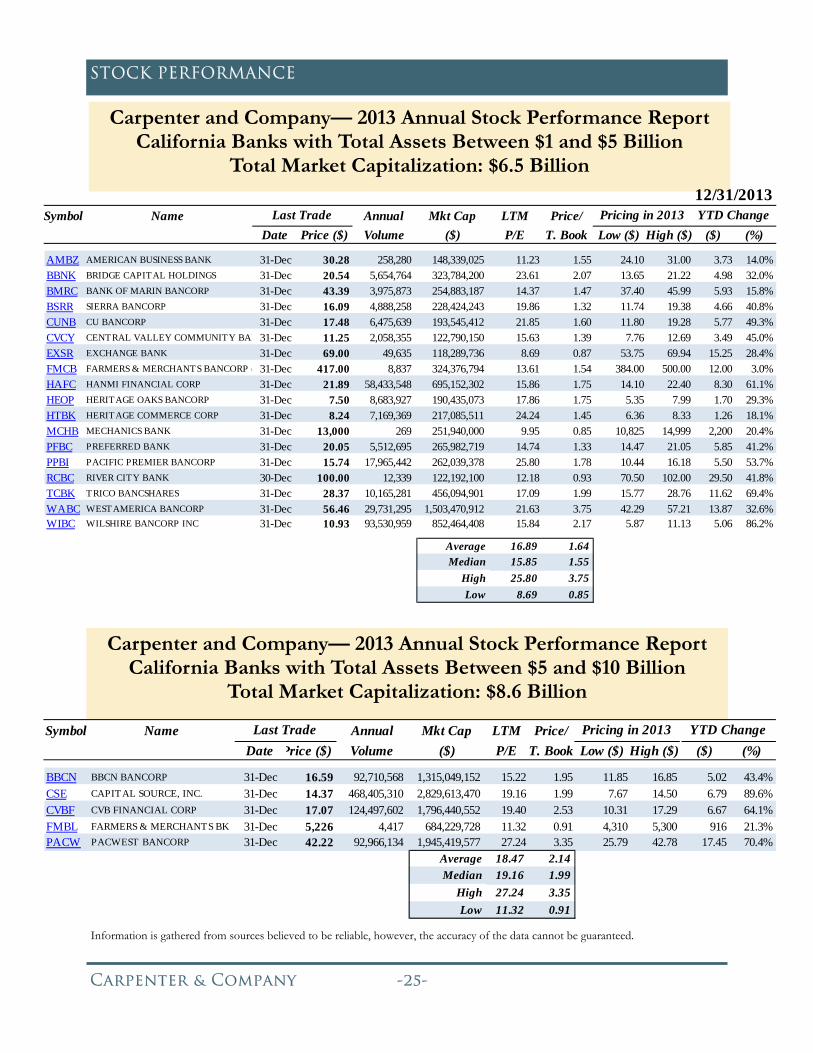
Theaverageratioofpricetotangiblebookvaluefortheentireclassequaled1.64xin2013,upfrom1.23xin2012.Theaveragepricetotangiblebookvalueforthisclassrankedfourthhighestoftheeightassetclassesanalyzed.FromitslowinP/TBVin2009,theratioexpanded62%throughyear‐end2013.Allbanks inthisgroupreportedpro its forthetwelve‐monthsendingSeptember2013.Allof theP/Eratioswere meaningful statistics. The range in the price/earnings ratios for this class varied between 8.69x forExchangeBank to 25.80x for Paci ic Premier Bancorp. The average ratiowas 16.89x, a steep rise from the12.21xratioin2012.Thetotalvolumeofsharestradedforthisassetclassequaled254.6millionshares,representinganaverageper‐company trading volume of 14.1 million shares. The 14.1 million shares per‐company trading volumematched the comparable statistic for 2012. Three stocks in the class, speci ically Farmers & MerchantsBancorpofLongBeach,MechanicsBank,andRiverCityBank,werepricedatorabove$100pershare.Forthatreason,therewasconsiderablevariationintradingvolumesbetweenthecompaniesinthisgroup.MechanicsBank,whichclosed2013atapriceof$13,000pershare,hadthelowestannualtradingvolumeat269shares.Incontrast,WilshireBancorp,Inc.recorded93.5millionsharestradedduring2013.This classofbankswasactive in theacquisitionof inancial institutions.Sevenof the18banks in thisclassannounced and/or completed bank acquisitions, including the late January 2014 announcement by TricoBancsharesofitsintentiontoacquireNorthValleyBancorp.BankofMarinBancorpacquiredthe$243millionBankofAlamedaonNovember29,2013.CentralValleyCommunityBancorpacquiredthe$200millionVisaliaCommunityBankon July 1, 2013.Hanmi Financial Corp. announcedonDecember16, 2013 its intention toacquire the $1.6 billion Central Bank of Garland, Texas. Heritage Oaks Bancorp entered into a mergeragreement on October 21, 2013 with the $447million Mission Community Bank. Paci ic Premier Bancorpcompletedtwoacquisitionsin2013,speci icallytheacquisitionsofthe$375millionFirstAssociatesBankofDallas,Texas,andthe$242millionSanDiegoTrustBank.WilshireBancorp,Inc.closedonitsacquisitionofthe$542millionSaehanBancorponNovember20,2013.The market capitalization for the entire class equaled $6.5 billion, a 22% increase over 2012’s marketcapitalizationof$5.4billion.Withtwofewerbanksthanin2012,theper‐bankmarketcapitalizationexpanded36%to$362.9million,up from2012’saverageof$267.7million.Allof thebanks in thiscategory reportedincreasesinmarketcapitalizationlastyear.Marketcapitalizationforthisgrouprangedfromalowof$118.3millionforExchangeBankto$1.5billionforWestamericaBancorp.The following banks reported stock conversion and/or capital acquisition in lows in excess of $1 millionduringtheyearendingSeptember30,2013:AmericanBusinessBank,BridgeCapitalHoldings,BankofMarinBancorp, CU Bancorp, and Preferred Bank. In addition, Central Valley Community Bancorp realized a $24millionincreasetocapitalasaresultofitsacquisitionofVisaliaCommunityBank.
INDUSTRY VALUATIONS: BANKS BETWEEN $5 AND $10 BILLION At the end of 2013, the number of banks with assets, as of September 2013, between $5 and $10 billionequaled ive,atwo‐bankincreaseoveryear‐end2012.Farmers&MerchantsBankgrewintothisclassfromtheunder $5 billion group. The tracking report initiated coverage in 2013 of Capital Source, Inc. BBCN, CVBFinancialCorp.,andPacWestBancorpwerecarry‐oversfromthepreviousyear.On July 22, 2013, PacWestBancorp announced its intention to acquire $8.9 billion Capital Source, Inc. in amixed transaction valued at $2.4 billion or 1.71x tangible book value. Additionally, PacWest closed on itsacquisitionofFirstCaliforniaFinancialGrouponMay31,2013.
BANKS BETWEEN $1 AND $5 BILLION (continued)
Carpenter & Company --
Industry Valuations
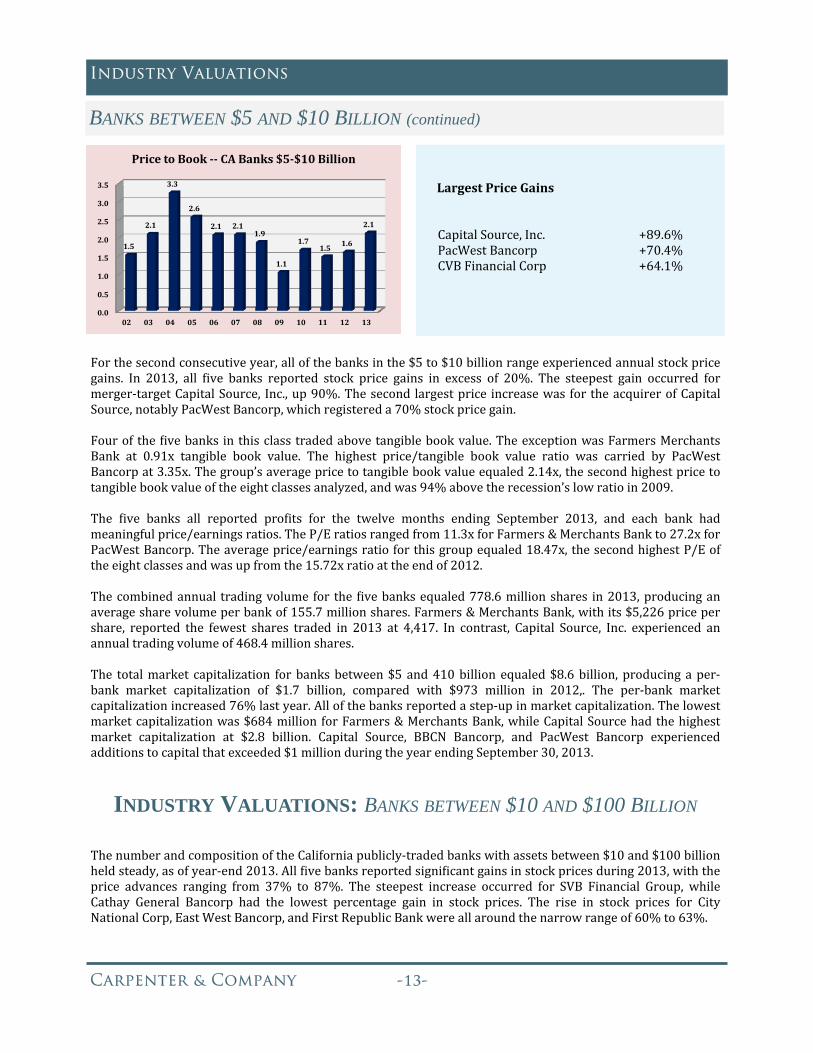
LargestPriceGainsCapitalSource,Inc. +89.6%PacWestBancorp +70.4%CVBFinancialCorp +64.1%
Forthesecondconsecutiveyear,allofthebanksinthe$5to$10billionrangeexperiencedannualstockpricegains. In 2013, all ive banks reported stock price gains in excess of 20%. The steepest gain occurred formerger‐targetCapitalSource, Inc.,up90%.Thesecondlargestprice increasewasfortheacquirerofCapitalSource,notablyPacWestBancorp,whichregistereda70%stockpricegain.Fourof the ivebanks inthisclasstradedabovetangiblebookvalue.TheexceptionwasFarmersMerchantsBank at 0.91x tangible book value. The highest price/tangible book value ratio was carried by PacWestBancorpat3.35x.Thegroup’saveragepricetotangiblebookvalueequaled2.14x,thesecondhighestpricetotangiblebookvalueoftheeightclassesanalyzed,andwas94%abovetherecession’slowratioin2009.The ive banks all reported pro its for the twelve months ending September 2013, and each bank hadmeaningfulprice/earningsratios.TheP/Eratiosrangedfrom11.3xforFarmers&MerchantsBankto27.2xforPacWestBancorp.Theaverageprice/earningsratioforthisgroupequaled18.47x,thesecondhighestP/Eoftheeightclassesandwasupfromthe15.72xratioattheendof2012.Thecombinedannual tradingvolumefor the ivebanksequaled778.6millionshares in2013,producinganaveragesharevolumeperbankof155.7millionshares.Farmers&MerchantsBank,withits$5,226pricepershare, reported the fewest shares traded in 2013 at 4,417. In contrast, Capital Source, Inc. experienced anannualtradingvolumeof468.4millionshares.The totalmarket capitalization forbanksbetween$5 and410billion equaled$8.6billion, producing aper‐bank market capitalization of $1.7 billion, compared with $973 million in 2012,. The per‐bank marketcapitalizationincreased76%lastyear.Allofthebanksreportedastep‐upinmarketcapitalization.Thelowestmarketcapitalizationwas$684millionforFarmers&MerchantsBank,whileCapitalSourcehadthehighestmarket capitalization at $2.8 billion. Capital Source, BBCN Bancorp, and PacWest Bancorp experiencedadditionstocapitalthatexceeded$1millionduringtheyearendingSeptember30,2013.
INDUSTRY VALUATIONS: BANKS BETWEEN $10 AND $100 BILLION ThenumberandcompositionoftheCaliforniapublicly‐tradedbankswithassetsbetween$10and$100billionheldsteady,asofyear‐end2013.All ivebanksreportedsigni icantgainsinstockpricesduring2013,withtheprice advances ranging from 37% to 87%. The steepest increase occurred for SVB Financial Group, whileCathay General Bancorp had the lowest percentage gain in stock prices. The rise in stock prices for CityNationalCorp,EastWestBancorp,andFirstRepublicBankwereallaroundthenarrowrangeof60%to63%.
BANKS BETWEEN $5 AND $10 BILLION (continued)
0.0
0.5
1.0
1.5
2.0
2.5
3.0
3.5
02 03 04 05 06 07 08 09 10 11 12 13
1.5
2.1
3.3
2.6
2.1 2.11.9
1.1
1.71.5
1.6
2.1
PricetoBook‐‐ CABanks$5‐$10Billion
Carpenter & Company --
Industry Valuations
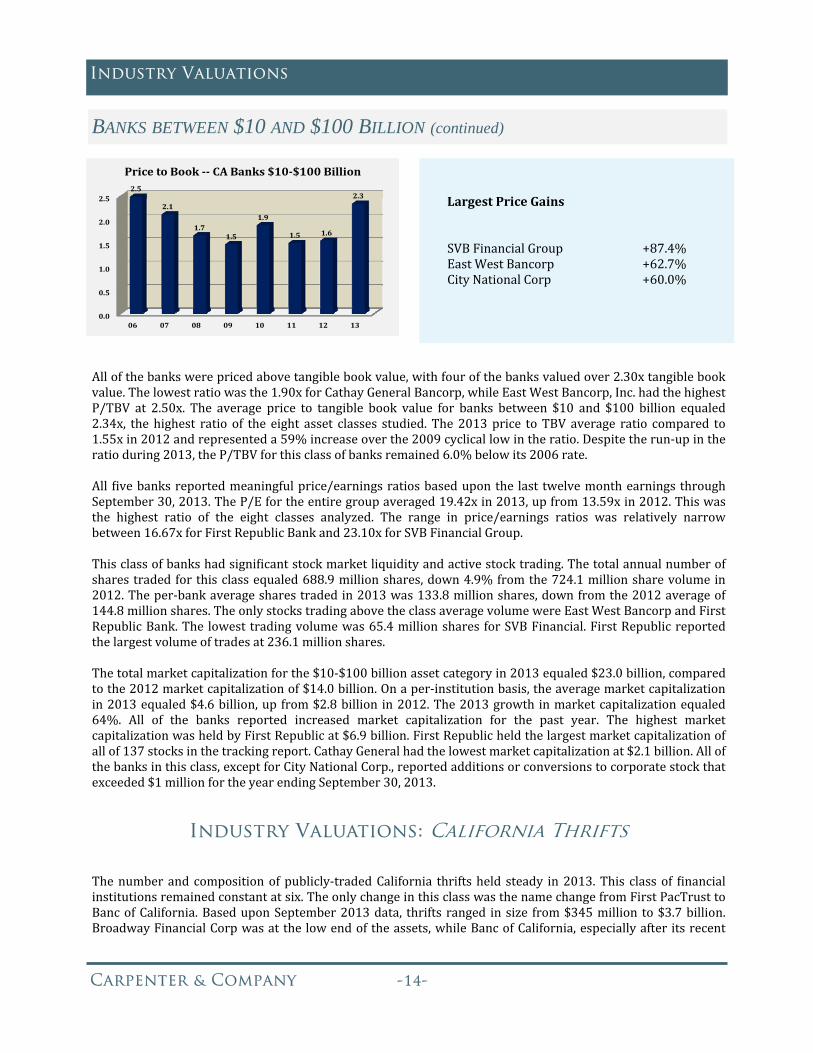
LargestPriceGainsSVBFinancialGroup +87.4%EastWestBancorp +62.7%CityNationalCorp +60.0%
BANKS BETWEEN $10 AND $100 BILLION (continued)
0.0
0.5
1.0
1.5
2.0
2.5
06 07 08 09 10 11 12 13
2.5
2.1
1.71.5
1.9
1.5 1.6
2.3
PricetoBook‐‐ CABanks$10‐$100Billion
Allofthebankswerepricedabovetangiblebookvalue,withfourofthebanksvaluedover2.30xtangiblebookvalue.Thelowestratiowasthe1.90xforCathayGeneralBancorp,whileEastWestBancorp,Inc.hadthehighestP/TBV at 2.50x. The average price to tangible book value for banks between $10 and $100 billion equaled2.34x, thehighest ratio of the eight asset classes studied. The2013price toTBV average ratio compared to1.55xin2012andrepresenteda59%increaseoverthe2009cyclicallowintheratio.Despitetherun‐upintheratioduring2013,theP/TBVforthisclassofbanksremained6.0%belowits2006rate.All ivebanksreportedmeaningfulprice/earningsratiosbaseduponthe last twelvemonthearningsthroughSeptember30,2013.TheP/Efortheentiregroupaveraged19.42xin2013,upfrom13.59xin2012.Thiswasthe highest ratio of the eight classes analyzed. The range in price/earnings ratios was relatively narrowbetween16.67xforFirstRepublicBankand23.10xforSVBFinancialGroup.Thisclassofbankshadsigni icantstockmarketliquidityandactivestocktrading.Thetotalannualnumberofsharestradedforthisclassequaled688.9millionshares,down4.9%fromthe724.1millionsharevolumein2012.Theper‐bankaveragesharestradedin2013was133.8millionshares,downfromthe2012averageof144.8millionshares.TheonlystockstradingabovetheclassaveragevolumewereEastWestBancorpandFirstRepublicBank.The lowesttradingvolumewas65.4millionshares forSVBFinancial.FirstRepublicreportedthelargestvolumeoftradesat236.1millionshares.Thetotalmarketcapitalizationforthe$10‐$100billionassetcategoryin2013equaled$23.0billion,comparedtothe2012marketcapitalizationof$14.0billion.Onaper‐institutionbasis,theaveragemarketcapitalizationin2013equaled$4.6billion,upfrom$2.8billion in2012.The2013growth inmarketcapitalizationequaled64%. All of the banks reported increased market capitalization for the past year. The highest marketcapitalizationwasheldbyFirstRepublicat$6.9billion.FirstRepublicheldthelargestmarketcapitalizationofallof137stocksinthetrackingreport.CathayGeneralhadthelowestmarketcapitalizationat$2.1billion.Allofthebanksinthisclass,exceptforCityNationalCorp.,reportedadditionsorconversionstocorporatestockthatexceeded$1millionfortheyearendingSeptember30,2013.
Industry Valuations: California Thrifts
Thenumberandcompositionofpublicly‐tradedCalifornia thriftsheld steady in2013.This classof inancialinstitutionsremainedconstantatsix.TheonlychangeinthisclasswasthenamechangefromFirstPacTrusttoBancofCalifornia.BaseduponSeptember2013data, thrifts ranged insize from$345million to$3.7billion.BroadwayFinancialCorpwasatthelowendoftheassets,whileBancofCalifornia,especiallyafter itsrecent
Carpenter & Company --
Industry Valuations
0.0
0.5
1.0
1.5
2.0
2.5
02 03 04 05 06 07 08 09 10 11 12 13
1.4
2.11.9
1.61.4
0.8
0.4 0.4
0.8 0.8
1.1
1.8
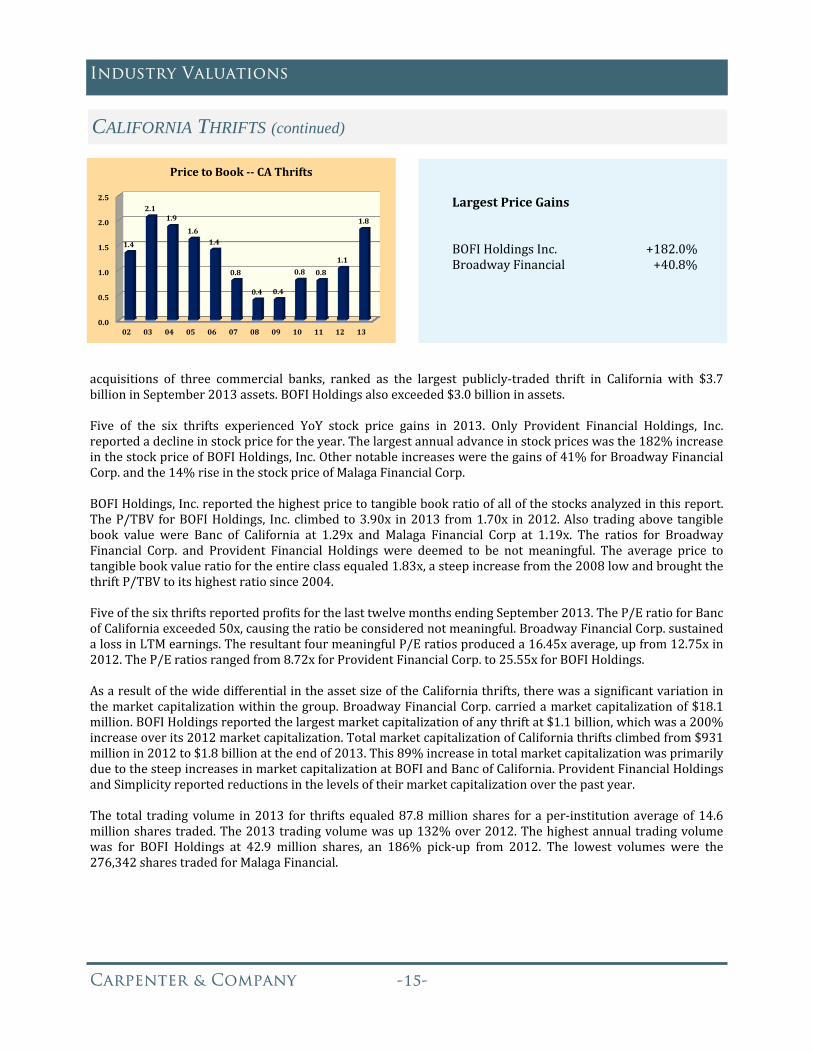
PricetoBook‐‐ CAThrifts LargestPriceGainsBOFIHoldingsInc. +182.0%BroadwayFinancial +40.8%
acquisitions of three commercial banks, ranked as the largest publicly‐traded thrift in California with $3.7billioninSeptember2013assets.BOFIHoldingsalsoexceeded$3.0billioninassets.Five of the six thrifts experienced YoY stock price gains in 2013. Only Provident Financial Holdings, Inc.reportedadeclineinstockpricefortheyear.Thelargestannualadvanceinstockpriceswasthe182%increaseinthestockpriceofBOFIHoldings,Inc.Othernotableincreaseswerethegainsof41%forBroadwayFinancialCorp.andthe14%riseinthestockpriceofMalagaFinancialCorp.BOFIHoldings,Inc.reportedthehighestpricetotangiblebookratioofallofthestocksanalyzedinthisreport.TheP/TBV forBOFIHoldings, Inc. climbedto3.90x in2013 from1.70x in2012.Also tradingabove tangiblebook value were Banc of California at 1.29x and Malaga Financial Corp at 1.19x. The ratios for BroadwayFinancial Corp. and Provident Financial Holdings were deemed to be not meaningful. The average price totangiblebookvalueratiofortheentireclassequaled1.83x,asteepincreasefromthe2008lowandbroughtthethriftP/TBVtoitshighestratiosince2004.Fiveofthesixthriftsreportedpro itsforthelasttwelvemonthsendingSeptember2013.TheP/EratioforBancofCaliforniaexceeded50x,causingtheratiobeconsiderednotmeaningful.BroadwayFinancialCorp.sustainedalossinLTMearnings.TheresultantfourmeaningfulP/Eratiosproduceda16.45xaverage,upfrom12.75xin2012.TheP/Eratiosrangedfrom8.72xforProvidentFinancialCorp.to25.55xforBOFIHoldings.AsaresultofthewidedifferentialintheassetsizeoftheCaliforniathrifts,therewasasigni icantvariationinthemarketcapitalizationwithinthegroup.BroadwayFinancialCorp.carriedamarketcapitalizationof$18.1million.BOFIHoldingsreportedthelargestmarketcapitalizationofanythriftat$1.1billion,whichwasa200%increaseoverits2012marketcapitalization.TotalmarketcapitalizationofCaliforniathriftsclimbedfrom$931millionin2012to$1.8billionattheendof2013.This89%increaseintotalmarketcapitalizationwasprimarilyduetothesteepincreasesinmarketcapitalizationatBOFIandBancofCalifornia.ProvidentFinancialHoldingsandSimplicityreportedreductionsinthelevelsoftheirmarketcapitalizationoverthepastyear.The total tradingvolume in2013 for thriftsequaled87.8millionshares foraper‐institutionaverageof14.6millionsharestraded.The2013tradingvolumewasup132%over2012.Thehighestannualtradingvolumewas for BOFI Holdings at 42.9 million shares, an 186% pick‐up from 2012. The lowest volumes were the276,342sharestradedforMalagaFinancial.
CALIFORNIA THRIFTS (continued)

Carpenter & Company --
Industry Valuations
InstitutionName CityInactiveDate
TotalAssets($000)
Traded* Outcome
FirstCaliforniaBank WestlakeVillage 1‐Jun‐13 1,741,192 yesAcquiredbyPacWestBancorpat1.709xTBV
ThePrivateBankofCalifornia LosAngeles 11‐Oct‐13 1,065,164 no MergedintoBancofCalifornia
ThePrivateBankofCalifornia LosAngeles 1‐Jul‐13 656,622 yes
AcquiredbyFirstPacTrustBancorpat1.279xTBVandmergedwithBeachBusinessBank
SaehanBank LosAngeles 21‐Nov‐13 591,998 yesAcquiredbyWilshireBancorpat1.805xTBV
RegentsBank,N.A. LaJolla 20‐Sep‐13 587,550 no MergedintoGrandpointCapital,Inc.
CentennialBank FountainValley 1‐May‐13 529,292 no
AcquiredoutofbankruptcybyWesternAllianceBancorpat0.66xTBV
BankofAlameda Alameda 30‐Nov‐13 271,640 yesAcquiredbyBankofMarinBancorpat1.233xTBV
CommerceNationalBank NewportBeach 1‐Oct‐13 244,834 yesAcquiredbySterlingFinancialCorp.at1.425xTBV
SanDiegoTrustBank SanDiego 26‐Jun‐13 210,898 yesAcquiredbyPacificPremierBancorpat1.210xTBV
VisaliaCommunityBank Visalia 1‐Jul‐13 197,465 yesAcquiredbyCentralValleyCommunityBancorpat1.236xTBV
LosAngelesNationalBank BuenaPark 17‐May‐13 192,793 no AcquiredbyRBBBancorp
GilmoreBank LosAngeles 26‐Sep‐13 171,102 no AcquiredbyGrandpointCapital,Inc.
BorregoSpringsBank,N.A. LaMesa 1‐Mar‐13 141,708 noAcquiredbySterlingFinancialCorp.at0.507xTBV
SanDiegoPrivateBank LaJolla 3‐Apr‐13 132,262 no MergedwithCoronadoFirstBank
MojaveDesertBank,N.A. Mojave 25‐Jan‐13 103,504 yesAcquiredbyMissionBancorpat0.824xTBV
EvergreenInternationalBank LongBeach 2‐Jan‐13 22,473 no Voluntarilyliquidatedcharter
*Traded:yesmeanspubliclytradedandnomeansprivatelyheld TBV=Tangiblebookvalue
CALIFORNIAFINANCIALINSTITUTIONSCLOSEDIN2013(Sortedbyassetsizeofseller)
Carpenter & Company --
Industry Valuations
Deal
Announce Seller Deal Completed Buyer Seller Value P/TBV
Buyer/Target Date City Status Date ($000) (x)
BankofMarinBancorp/NorCalCommunityBancorp 7/1/2013 Alameda Completion 11/29/2013 1,427,022 264,691 32.51 1.233
BayCommercialBank/BankOnIt,Inc. 1/16/2014 Stockton Pending 327,181 118,480 4.80 1.086
CentralValleyCommunityBancorp/VisaliaCommunityBank 12/20/2012 Visalia Completion 7/1/2013 887,737 200,373 21.27 1.236
CoronadoFirstBank/SanDiegoPrivateBank 11/27/2012 LaJolla Completion 4/2/2013 166,000 129,198 13.56 1.039
FirstCaliforniaFinancialGroup,Inc./PremierServiceBank 2/28/2012 Riverside Termination 1/30/2013 1,876,315 138,983 1.99 0.031
FirstPacTrustBancorp,Inc./PrivateBankofCalifornia 8/22/2012 LosAngeles Completion 7/1/2013 1,115,120 638,746 51.95 1.279
GrandpointCapital,Inc./CaliforniaCommunityBank 1/19/2012 Escondido Completion 11/30/2012 1,179,030 243,775 29.96 1.116
GrandpointCapital,Inc./GilmoreBank 7/2/2013 LosAngeles Completion 9/26/2013 2,188,807 176,922 NA NA
GrandpointCapital,Inc./NCALBancorp 6/11/2012 LosAngeles Termination 1/28/2013 1,551,939 382,894 NA NA
HeritageOaksBancorp/MissionCommunityBancorp 10/21/2013 SanLuisObispo Pending 1,096,882 446,956 55.98 1.625
IndependenceBank/PremierServiceBank 11/4/2013 Riverside Pending 311,772 128,987 8.64 1.256
MissionBancorp/MojaveDesertBank,N.A. 7/24/2012 Mojave Completion 1/24/2013 262,242 103,834 7.14 0.824
PacificPremierBancorp,Inc./SanDiegoTrustBank 3/6/2013 SanDiego Completion 6/24/2013 1,173,792 242,005 31.13 1.210
PacWestBancorp/CapitalSourceInc. 7/22/2013 LosAngeles Pending 5,299,905 8,482,677 2,381.89 1.771
PacWestBancorp/FirstCaliforniaFinancialGroup,Inc. 11/6/2012 WestlakeVillage Completion 5/31/2013 5,538,502 1,990,804 235.24 1.709
Privateinvestor‐Mr.RichardTan/CaliforniaBusinessBank 1/23/2013 LosAngeles Completion 7/19/2013 NA 57,910 NA NA
PrivateInvestor‐Mr.TiemingChen/OrientBancorporation 10/1/2012 SanFrancisco Completion 2/8/2013 NA 544,102 NA NA
Privateinvestor/NCALBancorp 9/16/2013 LosAngeles Pending NA 377,977 NA NA
Privateinvestors/FirstNationalBankofSouthernCalifornia 12/10/2013 Riverside Pending NA 144,480 NA NA
RBBBancorp/LosAngelesNationalBank 1/8/2013 BuenaPark Completion 5/17/2013 626,654 198,942 NA NA
SterlingFinancialCorporation/AmericanHeritageHoldings 10/22/2012 LaMesa Completion 2/28/2013 9,599,513 149,649 6.50 0.507
SterlingFinancialCorporation/CommerceNationalBank 5/2/2013 NewportBeach Completion 10/1/2013 9,256,436 242,748 42.90 1.475
TriCoBancshares/NorthValleyBancorp 1/21/2014 Redding Pending 2,632,106 912,447 178.92 1.885
WesternAllianceBancorporation/CentennialBank 1/22/2013 FountainValley Completion 4/30/2013 7,403,603 581,807 57.50 0.660
WilshireBancorp,Inc./SaehanBancorp 7/15/2013 LosAngeles Completion 11/20/2013 2,756,420 542,366 105.50 1.805
Assets($000)
MergerAnnouncementsand/orCompletionsin2013/2014
Carpenter & Company --
STOCK PERFORMANCE: 2013 Annual Report
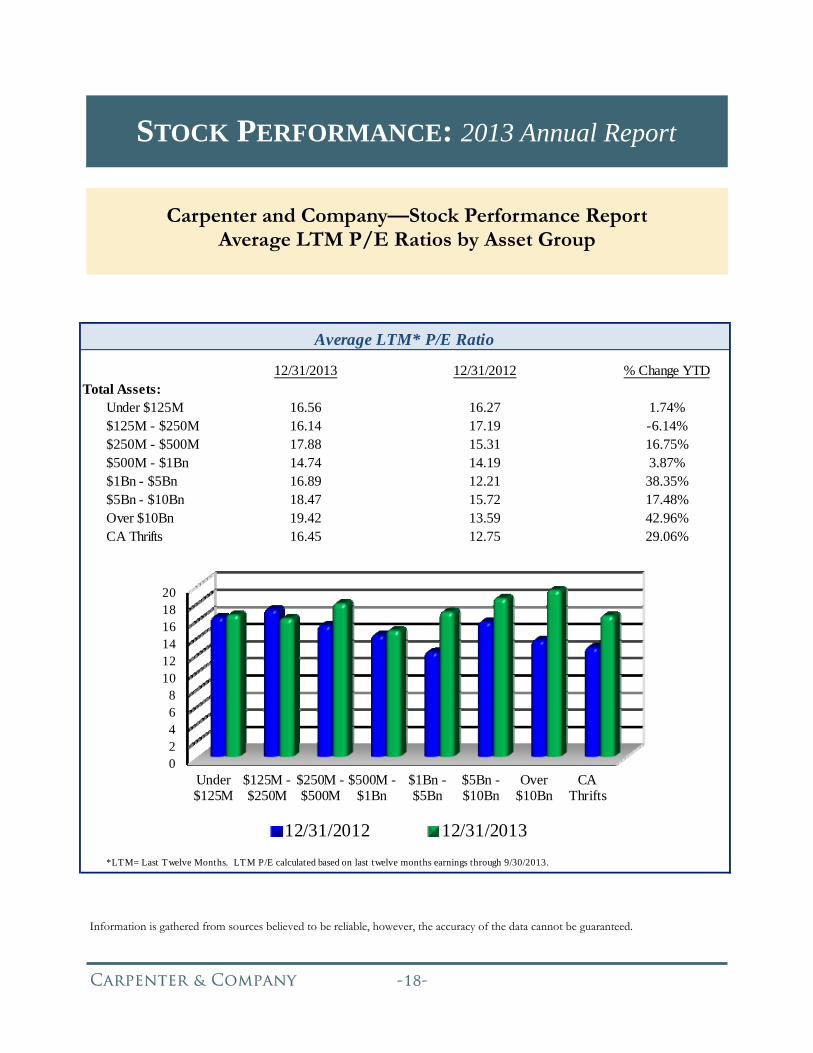
Carpenter and Company—Stock Performance Report Average LTM P/E Ratios by Asset Group
Information is gathered from sources believed to be reliable, however, the accuracy of the data cannot be guaranteed.
12/31/2013 revious Mon 12/31/2012 Change Mon % Change YTDTotal Assets:
Under $125M 16.56 16.83 16.27 -1.62% 1.74%$125M - $250M 16.14 15.59 17.19 3.55% -6.14%$250M - $500M 17.88 17.67 15.31 1.18% 16.75%$500M - $1Bn 14.74 14.63 14.19 0.71% 3.87%$1Bn - $5Bn 16.89 16.76 12.21 0.80% 38.35%$5Bn - $10Bn 18.47 18.06 15.72 2.28% 17.48%Over $10Bn 19.42 19.11 13.59 1.67% 42.96%CA Thrifts 16.45 16.51 12.75 -0.31% 29.06%
*LTM= Last Twelve Months. LTM P/E calculated based on last twelve months earnings through 9/30/2013.
Average LTM* P/E Ratio
02468
101214161820
Under$125M
$125M -$250M
$250M -$500M
$500M -$1Bn
$1Bn -$5Bn
$5Bn -$10Bn
Over$10Bn
CAThrifts
12/31/2012 12/31/2013
Carpenter & Company --
STOCK PERFORMANCE
Information is gathered from sources believed to be reliable, however, the accuracy of the data cannot be guaranteed.
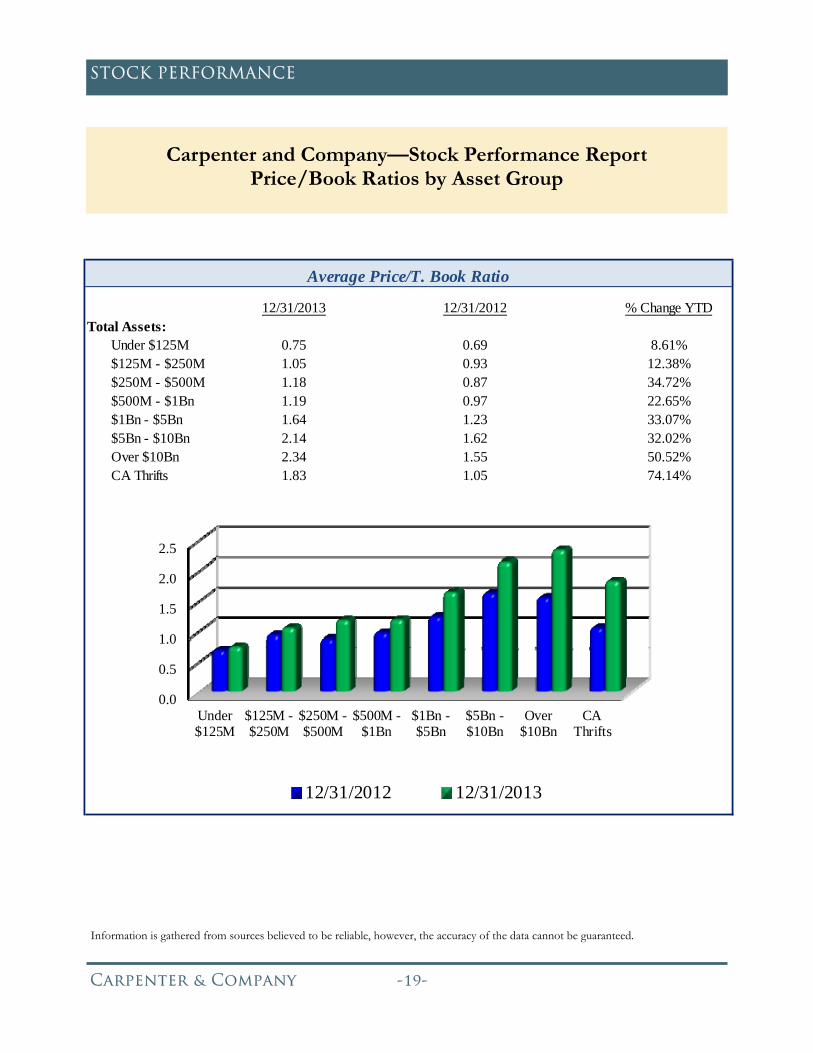
Carpenter and Company—Stock Performance Report Price/Book Ratios by Asset Group
12/31/2013 Previous Month 12/31/2012 Change Month % Change YTDTotal Assets:
Under $125M 0.75 0.75 0.69 -1.15% 8.61%$125M - $250M 1.05 1.05 0.93 -0.26% 12.38%$250M - $500M 1.18 1.16 0.87 1.32% 34.72%$500M - $1Bn 1.19 1.16 0.97 2.72% 22.65%$1Bn - $5Bn 1.64 1.59 1.23 3.25% 33.07%$5Bn - $10Bn 2.14 2.09 1.62 2.42% 32.02%Over $10Bn 2.34 2.29 1.55 1.88% 50.52%CA Thrifts 1.83 1.85 1.05 -1.26% 74.14%
Average Price/T. Book Ratio
0.0
0.5
1.0
1.5
2.0
2.5
Under$125M
$125M -$250M
$250M -$500M
$500M -$1Bn
$1Bn -$5Bn
$5Bn -$10Bn
Over$10Bn
CAThrifts
12/31/2012 12/31/2013

Carpenter & Company --
STOCK PERFORMANCE
Information is gathered from sources believed to be reliable, however, the accuracy of the data cannot be guaranteed.
Carpenter and Company—Stock Performance Report Industry-wide Ratio Comparisons
California Banks SNL Banks ifornia BaNL Bank California Banks SNL BanksTotal Assets:
Less than $250M 0.75 3.27 0.75 3.26 0.86 1.14Less than $500M 1.05 1.23 1.05 1.20 0.86 0.93$250M - $500M 1.18 1.15 1.16 1.13 0.87 0.92$500M - $1Bn 1.19 1.27 1.16 1.27 0.97 1.01$1Bn - $5Bn 1.64 2.05 1.59 2.03 1.23 1.51$5Bn - $10Bn 2.14 2.36 2.09 2.34 1.62 1.50Over $10Bn 2.34 1.73 2.29 1.69 1.55 1.37Thrifts 1.83 1.73 1.85 1.70 1.05 1.34
California Banks SNL Banks ifornia BaNL Bank California Banks SNL BanksTotal Assets:
Less than $250M 16.24 24.47 15.90 25.35 16.99 NALess than $500M 16.78 14.12 16.51 14.01 16.52 14.86$250M - $500M 17.88 13.92 17.67 13.79 15.31 14.86$500M - $1Bn 14.74 14.65 14.63 14.60 14.19 12.27$1Bn - $5Bn 16.89 18.54 16.76 18.39 12.21 14.00$5Bn - $10Bn 18.47 20.22 18.06 20.06 15.72 13.27Over $10Bn 19.42 15.15 19.11 14.99 13.59 14.67Thrifts 16.45 19.91 16.51 19.66 12.75 17.37
Previous Month 12/31/201212/31/2013
Carpenter California Banks - SNL Bank Index: Price/Tangible Book Ratio (x)
12/31/2013 Previous Month 12/31/2012
Carpenter California Banks - SNL Bank Index: Price/LTM EPS Ratio (x)
0.00
1.00
2.00
3.00
4.00
Less than$250M
Less than$500M
$250M -$500M
$500M -$1Bn
$1Bn -$5Bn
$5Bn -$10Bn
Over$10Bn
Thrifts
12/31/2013 Comparison
California Banks SNL Banks
0.00
5.00
10.00
15.00
20.00
25.00
Less than$250M
Less than$500M
$250M -$500M
$500M -$1Bn
$1Bn -$5Bn
$5Bn -$10Bn
Over$10Bn
Thrifts
12/31/2013 Comparison
California Banks SNL Banks

Carpenter & Company --
STOCK PERFORMANCE
Information is gathered from sources believed to be reliable, however, the accuracy of the data cannot be guaranteed.
Carpenter and Company— 2013 Annual Stock Performance Report California Banks with Total Assets Under $125 Million
Total Market Capitalization: $151 Million
Symbol Name Annual Mkt Cap LTM Price/
Date Price ($) Volume ($) P/E T. Book Low ($)High ($) (%) ($) (%)
AUNB AMERICAS UNITED BANK 31-Dec 5.75 1,034,907 16,549,363 11.06 0.91 5.30 6.35 119.8% 0.45 8.5%BKOT BANK ON IT, INC 16-Dec 2.03 71,841 3,163,365 N/M 0.73 1.76 2.25 127.8% 0.29 16.7%CABB CALIFORNIA BUSINESS BANK 19-Dec 0.22 522,886 784,426 N/M 0.10 0.11 0.52 472.7% -0.13 -37.1%
CCBC CHINO COMMERCIAL BANCORP 31-Dec 15.90 103,230 13,249,152 17.47 1.57 9.50 16.50 173.7% 5.40 51.4%CKTM COMMERCE BK TEMECULA VALLEY 19-Dec 4.25 109,813 6,385,090 N/M 0.73 3.35 4.50 134.3% 0.00 0.0%CMUV COMMUNITY VALLEY BANK 26-Dec 5.15 282,704 8,394,958 9.77 0.91 3.75 5.25 140.0% 0.15 3.0%
CRSB CORNERSTONE COMMUNITY BANK 19-Dec 8.50 22,941 10,200,000 9.55 0.84 8.00 9.25 115.6% 0.50 6.3%CTBP COAST BANCORP 31-Dec 1.92 132,493 1,626,012 N/M N/M 1.10 3.50 318.2% 0.57 42.2%
DEBC DELTA NATIONAL BANCORP 6-May 7.00 324 2,662,121 N/M 0.32 6.00 7.00 116.7% 1.00 16.7%FHLB FRIENDLY HILLS BANK 31-Dec 5.02 99,468 8,112,320 N/M 0.64 4.50 6.25 138.9% 0.52 11.6%GSBB GOLDEN STATE BANK 27-Dec 0.19 59,792 341,251 N/M 0.08 0.13 0.75 576.9% -0.02 -7.5%
MOKB MISSION OAKS BANCORP 31-Dec 0.20 557,643 2,221,288 N/M N/M 0.09 0.70 777.8% 0.11 122.2%MOLB MOTHER LODE BANK 31-Dec 1.25 124,652 5,547,481 9.94 1.09 0.57 1.50 263.2% 0.68 119.3%PAMB PAN AMERICAN BANK 28-Oct 0.15 3,200 2,628,016 N/M N/M 0.15 0.55 366.7% -0.15 -50.0%
PPFC PAN PACIFIC BANK 24-Dec 2.45 241,908 12,065,843 24.75 0.84 1.91 2.95 154.5% 0.54 28.3%SAGN SAIGON NATIONAL BANK 31-Dec 0.16 144,012 11,108,185 N/M N/M 0.12 0.30 250.0% -0.09 -36.0%SBKK SUNCREST BANK 30-Dec 5.90 86,440 11,303,822 13.66 0.82 5.90 8.65 146.6% -0.22 -3.6%
SFRK SECURITY FIRST BANK 27-Dec 4.07 40,818 6,919,000 17.79 0.62 3.36 4.75 141.4% 0.57 16.3%SUTB SUTTER COMMUNITY BANK 31-Dec 5.75 23,771 5,472,149 33.52 0.61 5.75 6.49 112.9% -0.25 -4.2%
SVBA SIERRA VISTA BANK 30-Dec 2.53 64,197 9,919,707 18.07 0.88 1.55 3.75 241.9% 0.98 63.2%TRVB TRI-VALLEY BANK 31-Dec 0.39 361,905 9,680,982 N/M 1.15 0.32 0.65 203.1% -0.02 -4.1%USMT US METRO BANK 30-Dec 1.25 37,988 2,475,000 N/M 0.59 1.06 3.10 292.5% -1.85 -59.7%
Average 16.56 0.75Median 15.57 0.78
High 33.52 1.57
Low 9.55 0.08
Last Trade YTD ChangePricing in 2013
Carpenter & Company --
STOCK PERFORMANCE
Information is gathered from sources believed to be reliable, however, the accuracy of the data cannot be guaranteed.
Carpenter and Company— 2013 Annual Stock Performance Report California Banks with Total Assets Between $125 and $250 Million
Total Market Capitalization: $683 Million
Symbol Name Annual Mkt Cap LTM Price/
Date Price ($) Volume ($) P/E T. Book Low ($) High ($) ($) (%)
ABNK ALTAPACIFIC BANK 31-Dec 7.40 815,978 39,195,913 N/M 1.17 6.05 9.75 0.00 0.0%
ACAL AMERICAN CALIFORNIA BANK 7-Aug 4.56 114,400 6,553,691 4.35 0.57 3.50 4.56 1.06 30.3%ARBV AMERICAN RIVIERA BANK 31-Dec 10.50 433,697 26,837,055 16.94 1.20 7.50 11.00 3.00 40.0%
BNNP BANK OF NAPA NA 31-Dec 8.70 163,047 19,913,291 10.24 1.05 7.55 9.50 1.30 17.6%
BSCA BANK OF SANTA CLARITA 30-Dec 8.95 300,021 19,918,306 18.65 1.02 7.30 10.00 1.80 25.2%
CALW CALWEST BANCORP 27-Dec 1.70 643,943 4,286,530 N/M N/M 0.22 1.70 1.25 277.8%CBBC COMMUNITY BUSINESS BANK 11-Dec 8.90 170,411 19,165,242 18.19 1.15 6.12 10.00 2.78 45.4%
CBJC CAPITAL BANK 13-Dec 19.50 46,229 30,304,892 16.98 2.05 17.51 22.95 -1.50 -7.1%
CBYAA COMMUNITY BANK OF THE BAY 26-Dec 4.40 902,459 18,107,866 7.86 1.41 3.10 4.90 1.50 51.7%
CFBN COMMUNITY 1ST BANK 24-Dec 4.00 911,327 21,796,968 33.33 1.36 2.62 4.49 1.00 33.3%CNYB COUNTY COMMERCE BANK 20-Dec 16.10 131,679 23,076,919 15.33 1.29 14.05 16.99 0.10 0.6%
CYSM COMMUNITY BANK OF SANTA MARIA 31-Dec 6.90 670,142 16,436,807 21.91 0.97 6.53 7.47 -0.45 -6.1%
FBBN BANK OF SOUTHERN CALIFORNIA NA 18-Dec 7.00 1,439 22,844,738 23.03 1.29 5.65 8.00 1.35 23.9%
FBCP FOUNDERS BANCORP 31-Dec 10.30 101,698 11,656,510 11.97 1.02 10.00 11.99 0.30 3.0%
FMBP FIRST MOUNTAIN BANK 31-Dec 7.30 460,705 11,423,960 N/M N/M 3.75 7.75 1.50 25.9%FOLB FOLSOM LAKE BANK 31-Dec 7.10 66,072 11,311,088 12.68 0.96 6.06 8.50 0.29 4.3%
FSNF FRESNO FIRST BANK 31-Dec 10.00 371,105 19,515,880 N/M 1.42 8.71 10.95 0.31 3.2%
FTFS F&T FINANCIAL SERVICES, INC. 30-Dec 68.50 12,915 20,064,678 12.83 0.69 63.00 72.00 5.50 8.7%
GVYB GOLDEN VALLEY BANCORP 31-Dec 9.40 62,946 18,731,587 14.30 1.20 7.85 9.50 0.91 10.7%LGHT LIGHTHOUSE BANK 31-Dec 10.90 192,894 23,328,616 10.49 1.16 9.62 11.00 -0.10 -0.9%
LIBC LIBERTY BANCORP INC 20-Dec 12.00 6,600 10,639,344 18.75 0.99 10.03 12.00 1.97 19.6%
MNBO MNB HOLDINGS CORP 11-Dec 26.00 7,810 11,902,098 9.54 0.72 18.67 26.00 7.33 39.3%
NCNB NORTHERN CA NATIONAL BANK 18-Nov 8.75 33,406 11,898,828 14.52 0.89 7.60 35.00 0.60 7.4%NRLB NORTHERN CALIFORNIA BANCORP INC 30-Dec 1.20 113,525 2,143,069 N/M 0.24 0.28 1.90 0.80 200.0%
NWBN NEW RESOURCE BANK 31-Dec 3.95 476,885 22,112,961 18.69 0.87 3.65 4.95 -0.05 -1.3%
OCBB ORANGE COUNTY BUSINESS BANK NA 31-Dec 7.25 400,582 34,253,176 36.25 1.03 3.91 7.34 3.34 85.4%
OJCB OCB BANCORP 31-Dec 6.00 186,967 12,484,668 13.78 0.91 5.65 7.00 -1.00 -14.3%PBNK PINNACLE BANK 23-Dec 5.28 93,124 17,376,522 3.05 0.85 4.25 5.40 0.80 17.9%
PFBN PACIFIC ALLIANCE BANK 30-Dec 4.90 44,198 9,102,661 9.42 0.62 3.81 5.25 1.09 28.6%
PFCI PACIFIC COMMERCE BANK 27-Dec 4.25 256,471 18,960,334 3.48 0.95 2.40 5.20 1.85 77.1%
PMRA PROMERICA BANK 26-Dec 5.05 150,935 13,993,550 12.63 0.78 3.90 6.00 1.46 40.7%PSBK PREMIER SERVICE BANK 31-Dec 6.15 212,383 7,756,878 18.64 1.32 0.80 6.25 5.25 583.3%
PVBK PACIFIC VALLEY BANK 30-Dec 10.10 83,028 36,329,205 18.39 1.78 7.27 10.77 0.10 1.0%
RVVY RIVER VALLEY COMMUNITY BANK 31-Dec 17.00 36,536 29,312,981 24.14 1.67 14.50 21.00 2.00 13.3%
SCVE SANTA CLARA VALLEY BANK NA 31-Dec 5.60 105,336 10,741,735 N/M 1.08 5.52 6.00 -0.39 -6.5%
SMAL SUMMIT BANCSHARES INC 30-Dec 11.30 68,011 14,692,011 16.14 0.74 7.50 11.80 3.80 50.7%UIFC UNITI FINANCIAL CORP 10-Oct 1.37 55,131 16,961,637 33.82 0.86 0.55 1.37 0.82 149.1%
VBBK VIBRA BANK 14-Nov 18.00 28,644 13,299,570 N/M 1.10 17.30 21.00 -0.51 -2.8%
VCBC VALLEY COMMUNITY BANK 24-Dec 2.25 521,582 4,227,449 N/M 0.47 0.80 2.50 1.55 221.4%Average 16.14 1.05
Median 15.33 1.02High 36.25 2.05
Low 3.05 0.24
Last Trade YTD ChangePricing in 2013
Carpenter & Company --
STOCK PERFORMANCE
Information is gathered from sources believed to be reliable, however, the accuracy of the data cannot be guaranteed.
Carpenter and Company— 2013 Annual Stock Performance Report California Banks with Total Assets Between $250 and $500 Million
Total Market Capitalization: $898 Million
Symbol Name Annual Mkt Cap LTM Price/
Date Price ($) Volume ($) P/E T. Book Low ($) High ($) ($) (%)
AVBH AVIDBANK HOLDINGS INC 31-Dec 11.70 441,925 50,093,339 15.39 1.06 9.21 12.00 2.45 26.5%BCML BAY COMMERCIAL BANK 31-Dec 9.70 1,324,732 46,855,433 18.65 0.89 7.40 10.25 1.50 18.3%CABC CALIFORNIA BANK OF COMMERCE 31-Dec 10.90 470,813 30,075,749 12.96 1.10 7.90 12.00 3.27 42.9%CWBK COMMERCEWEST BANK 31-Dec 13.90 1,184,479 60,358,790 11.58 1.22 8.50 14.00 4.95 55.3%FCSB FOCUS BUSINESS BANK 23-Dec 8.90 126,890 26,035,953 27.98 0.99 7.24 9.45 1.20 15.6%FISB 1ST CAPITAL BANK 30-Dec 11.33 705,455 38,269,024 20.60 1.06 10.51 13.50 0.58 5.4%GSCB GREATER SACRAMENTO BANCORP 26-Dec 15.20 184,796 39,682,442 12.56 1.16 14.75 16.98 -0.70 -4.4%MISN MISSION COMMUNITY BANCORP 31-Dec 6.56 153,836 57,433,233 26.24 1.60 3.20 6.56 3.16 92.9%MNHN MANHATTAN BANCORP 26-Dec 4.16 151,848 52,135,973 27.76 1.05 3.51 5.20 0.41 11.1%MSBC MISSION BANCORP 31-Dec 24.05 83,951 33,864,613 17.70 1.01 22.25 28.55 -0.70 -2.8%MVLY MISSION VALLEY BANCORP 26-Dec 6.50 326,663 17,103,015 12.04 1.09 4.95 7.15 1.55 31.3%NCAL NCAL BANCORP 23-Dec 0.55 219,878 1,322,885 N/M 0.89 0.53 1.99 -1.40 -71.8%OPBK OPEN BANK 31-Dec 7.50 1,074,647 54,194,445 9.38 1.74 2.10 7.75 5.40 257.1%PDOB PRESIDIO BANK 31-Dec 9.95 472,778 41,491,500 36.85 1.14 7.30 9.95 2.45 32.7%PLZB PLAZA BANK 31-Dec 2.98 209,837 51,049,602 11.04 1.04 2.05 4.00 0.93 45.4%RWCB REDWOOD CAPITAL BANCORP 26-Dec 8.81 104,661 15,945,060 8.72 1.05 7.10 9.25 1.71 24.1%SCCB SEACOAST COMMERCE BANK 31-Dec 8.00 693,838 44,567,456 N/M 2.03 4.30 8.00 3.50 77.8%SCZC SANTA CRUZ COUNTY BANK 31-Dec 17.75 120,125 35,184,973 10.82 1.11 14.00 19.50 3.85 27.7%SDPB SAN DIEGO PRIVATE BANK 27-Dec 11.69 530,018 47,763,107 27.85 1.04 9.03 11.69 2.54 27.8%SSBI SUMMIT STATE BANK 31-Dec 10.50 1,472,972 50,144,535 12.80 1.15 6.81 10.53 3.75 55.6%UABK UNITED AMERICAN BANK 31-Dec 0.22 770,248 9,902,176 N/M N/M 0.18 0.40 -0.03 -12.0%VCBP VALLEY COMMERCE BANCORP 27-Dec 13.51 210,934 37,614,934 9.72 0.95 10.32 14.00 3.16 30.5%VLLX VALLEY REPUBLIC BANK 31-Dec 16.28 25,009 56,745,373 26.89 1.53 15.00 16.50 1.28 8.5%
Average 17.88 1.18Median 14.18 1.07
High 36.85 2.03
Low 8.72 0.89
Last Trade YTD ChangePricing in 2013
Carpenter & Company --
STOCK PERFORMANCE
Information is gathered from sources believed to be reliable, however, the accuracy of the data cannot be guaranteed.
Carpenter and Company— 2013 Annual Stock Performance Report California Banks with Total Assets Between
$500 Million and $1 Billion Total Market Capitalization: $1.6 Billion
Symbol Name Annual Mkt Cap LTM Price/
Date Price ($) Volume ($) P/E T. Book Low ($)High ($) ($) (%)
AMRB AMERICAN RIVER BANKSHARES 31-Dec 9.45 2,854,927 82,734,948 28.64 1.14 6.75 9.52 2.54 36.8%
BOCH BANK OF COMMERCE HLDG 31-Dec 5.71 5,754,167 81,504,266 12.41 1.00 4.59 5.90 1.11 24.1%
CFNB CALIFORNIA FIRST NATIONAL BANCORP 31-Dec 15.10 1,357,432 157,753,128 20.68 0.86 14.73 18.52 0.15 1.0%
CRPB CALIFORNIA REPUBLIC BANK 26-Dec 23.70 462,504 123,240,000 17.00 2.13 15.50 25.00 7.20 43.6%
CWBB COMMONWEALTH BUSINESS BANK 31-Dec 21.40 735,722 72,697,491 7.81 1.23 11.98 21.40 12.45 139.1%
CWBC COMMUNITY WEST BANCSHARES 31-Dec 6.56 1,607,536 51,606,096 7.37 1.05 2.87 6.59 3.21 95.8%
FCTY 1ST CENTURY BANCSHARES 31-Dec 7.15 2,441,156 66,340,581 8.51 1.22 4.65 7.93 2.54 55.1%
FENB 1ST ENTERPRISE BANK 30-Dec 19.30 263,660 73,772,108 16.08 1.42 15.40 19.80 4.00 26.1%
FNBG FNB BANCORP 31-Dec 28.00 410,879 110,660,536 18.49 1.36 17.67 28.00 9.45 50.9%
FNRN FIRST NORTHERN COMMUNITY BANCORP 27-Dec 7.20 529,087 68,243,760 15.14 0.96 5.10 7.40 2.00 38.5%
NOVB NORTH VALLEY BANCORP 31-Dec 18.91 2,891,543 129,280,711 40.23 1.36 14.50 19.90 4.67 32.8%
OVLY OAK VALLEY BANCORP 31-Dec 8.37 835,949 66,371,047 11.79 1.05 7.50 8.75 0.92 12.3%
PFCF PACIFIC CITY FINANCIAL CORP 13-Dec 4.00 526,260 100,476,012 5.31 1.54 1.65 4.75 2.20 122.2%
PLBC PLUMAS BANCORP 31-Dec 6.22 616,813 29,749,881 9.87 0.99 3.27 6.79 2.96 90.8%
PMBC PACIFIC MERCANTILE BANCORP 31-Dec 6.22 8,969,510 118,139,290 N/M 0.99 5.24 6.62 -0.07 -1.1%
PVLY PREMIER VALLEY BANK 31-Dec 5.82 827,256 74,891,760 11.64 1.42 5.65 6.95 0.52 9.8%
SCAF SECURITY CALIFORNIA BANCORP 31-Dec 9.61 482,900 54,483,088 15.48 0.99 8.07 10.70 1.60 20.0%
SWBC SUNWEST BANK 1-Aug 33,000 198 73,095,000 6.43 0.78 26,900 33,500 6,000 22.2%UBFO UNITED SECURITY BANCSHARES 31-Dec 4.92 1,695,315 72,094,413 12.37 1.05 2.41 5.47 2.36 92.2%
Average 14.74 1.19
Median 12.39 1.05
High 40.23 2.13
Low 5.31 0.78
Last Trade YTD ChangePricing in 2013
Carpenter & Company --
STOCK PERFORMANCE
Information is gathered from sources believed to be reliable, however, the accuracy of the data cannot be guaranteed.
Carpenter and Company— 2013 Annual Stock Performance Report California Banks with Total Assets Between $1 and $5 Billion
Total Market Capitalization: $6.5 Billion
Carpenter and Company— 2013 Annual Stock Performance Report California Banks with Total Assets Between $5 and $10 Billion
Total Market Capitalization: $8.6 Billion
Symbol Name Annual Mkt Cap LTM Price/
Date Price ($) Volume ($) P/E T. Book Low ($) High ($) ($) (%)
BBCN BBCN BANCORP 31-Dec 16.59 92,710,568 1,315,049,152 15.22 1.95 11.85 16.85 5.02 43.4%
CSE CAPITAL SOURCE, INC. 31-Dec 14.37 468,405,310 2,829,613,470 19.16 1.99 7.67 14.50 6.79 89.6%CVBF CVB FINANCIAL CORP 31-Dec 17.07 124,497,602 1,796,440,552 19.40 2.53 10.31 17.29 6.67 64.1%
FMBL FARMERS & MERCHANTS BK 31-Dec 5,226 4,417 684,229,728 11.32 0.91 4,310 5,300 916 21.3%PACW PACWEST BANCORP 31-Dec 42.22 92,966,134 1,945,419,577 27.24 3.35 25.79 42.78 17.45 70.4%
Average 18.47 2.14
Median 19.16 1.99
High 27.24 3.35
Low 11.32 0.91
Last Trade YTD ChangePricing in 2013
Symbol Name Annual Mkt Cap LTM Price/
Date Price ($) Volume ($) P/E T. Book Low ($) High ($) ($) (%)
AMBZ AMERICAN BUSINESS BANK 31-Dec 30.28 258,280 148,339,025 11.23 1.55 24.10 31.00 3.73 14.0%
BBNK BRIDGE CAPITAL HOLDINGS 31-Dec 20.54 5,654,764 323,784,200 23.61 2.07 13.65 21.22 4.98 32.0%
BMRC BANK OF MARIN BANCORP 31-Dec 43.39 3,975,873 254,883,187 14.37 1.47 37.40 45.99 5.93 15.8%
BSRR SIERRA BANCORP 31-Dec 16.09 4,888,258 228,424,243 19.86 1.32 11.74 19.38 4.66 40.8%
CUNB CU BANCORP 31-Dec 17.48 6,475,639 193,545,412 21.85 1.60 11.80 19.28 5.77 49.3%
CVCY CENTRAL VALLEY COMMUNITY BAN 31-Dec 11.25 2,058,355 122,790,150 15.63 1.39 7.76 12.69 3.49 45.0%
EXSR EXCHANGE BANK 31-Dec 69.00 49,635 118,289,736 8.69 0.87 53.75 69.94 15.25 28.4%
FMCB FARMERS & MERCHANTS BANCORP ( 31-Dec 417.00 8,837 324,376,794 13.61 1.54 384.00 500.00 12.00 3.0%
HAFC HANMI FINANCIAL CORP 31-Dec 21.89 58,433,548 695,152,302 15.86 1.75 14.10 22.40 8.30 61.1%
HEOP HERITAGE OAKS BANCORP 31-Dec 7.50 8,683,927 190,435,073 17.86 1.75 5.35 7.99 1.70 29.3%
HTBK HERITAGE COMMERCE CORP 31-Dec 8.24 7,169,369 217,085,511 24.24 1.45 6.36 8.33 1.26 18.1%
MCHB MECHANICS BANK 31-Dec 13,000 269 251,940,000 9.95 0.85 10,825 14,999 2,200 20.4%
PFBC PREFERRED BANK 31-Dec 20.05 5,512,695 265,982,719 14.74 1.33 14.47 21.05 5.85 41.2%
PPBI PACIFIC PREMIER BANCORP 31-Dec 15.74 17,965,442 262,039,378 25.80 1.78 10.44 16.18 5.50 53.7%
RCBC RIVER CITY BANK 30-Dec 100.00 12,339 122,192,100 12.18 0.93 70.50 102.00 29.50 41.8%
TCBK TRICO BANCSHARES 31-Dec 28.37 10,165,281 456,094,901 17.09 1.99 15.77 28.76 11.62 69.4%
WABC WESTAMERICA BANCORP 31-Dec 56.46 29,731,295 1,503,470,912 21.63 3.75 42.29 57.21 13.87 32.6%WIBC WILSHIRE BANCORP INC 31-Dec 10.93 93,530,959 852,464,408 15.84 2.17 5.87 11.13 5.06 86.2%
Average 16.89 1.64
Median 15.85 1.55
High 25.80 3.75
Low 8.69 0.85
12/31/2013Last Trade YTD ChangePricing in 2013

Carpenter & Company --
STOCK PERFORMANCE
Information is gathered from sources believed to be reliable, however, the accuracy of the data cannot be guaranteed.
Carpenter and Company— 2013 Annual Stock Performance Report California Banks with Total Assets Between $10 and $100 Billion
Total Market Capitalization: $23.0 Billion
Carpenter and Company— 2013 Annual Stock Performance Report California Thrifts
Total Market Capitalization: $1.8 Billion
Symbol Name Annual Mkt Cap LTM Price/
Date Price ($) Volume ($) P/E T. Book Low ($) High ($) ($) (%)
CATY CATHAY GENERAL BANCORP 31-Dec 26.73 67,866,142 2,125,127,219 19.95 1.90 18.37 27.63 7.20 36.9%
CYN CITY NATIONAL CORP 31-Dec 79.22 78,071,511 4,309,875,136 20.26 2.46 51.13 79.33 29.70 60.0%
EWBC EAST WEST BANCORP INC 31-Dec 34.97 221,522,884 4,816,694,013 17.14 2.50 22.29 35.15 13.48 62.7%
FRC FIRST REPUBLIC BANK 31-Dec 52.35 236,098,395 6,930,848,725 16.67 2.35 33.15 52.72 19.57 59.7%SIVB SVB FINANCIAL GROUP 31-Dec 104.86 65,358,161 4,788,587,303 23.10 2.46 58.24 106.10 48.89 87.4%
Average 19.42 2.34
Median 19.95 2.46
High 23.10 2.50
Low 16.67 1.90
Last Trade YTD ChangePricing in 2013
Symbol Name Annual Mkt Cap LTM Price/
Date Price ($) Volume ($) P/E T. Book Low ($) High ($) ($) (%)
BANC BANC OF CALIFORNIA 31-Dec 13.41 21,613,906 261,913,915 N/M 1.29 10.26 15.54 1.14 9.3%
BOFI BOFI HOLDINGS INC 31-Dec 78.43 42,934,526 1,086,496,202 25.55 3.90 28.45 81.90 50.62 182.0%BYFC BROADWAY FINANCIAL CORP 31-Dec 0.93 1,639,586 18,071,673 N/M N/M 0.52 1.45 0.27 40.8%
MLGF MALAGA FINANCIAL CORP 31-Dec 19.20 276,342 114,239,501 10.00 1.19 16.80 19.20 2.40 14.3%
PROV PROVIDENT FINANCIAL HOLDINGS INC 31-Dec 15.00 16,072,649 149,971,605 8.72 N/M 14.25 19.03 -2.50 -14.3%SMPL SIMPLICITY BANCORP, INC 31-Dec 16.16 5,264,571 127,341,753 21.55 0.92 14.05 16.75 1.21 8.1%
Average 16.45 1.83Median 15.77 1.24
High 25.55 3.90
Low 8.72 0.92
Last Trade YTD ChangePricing in 2013
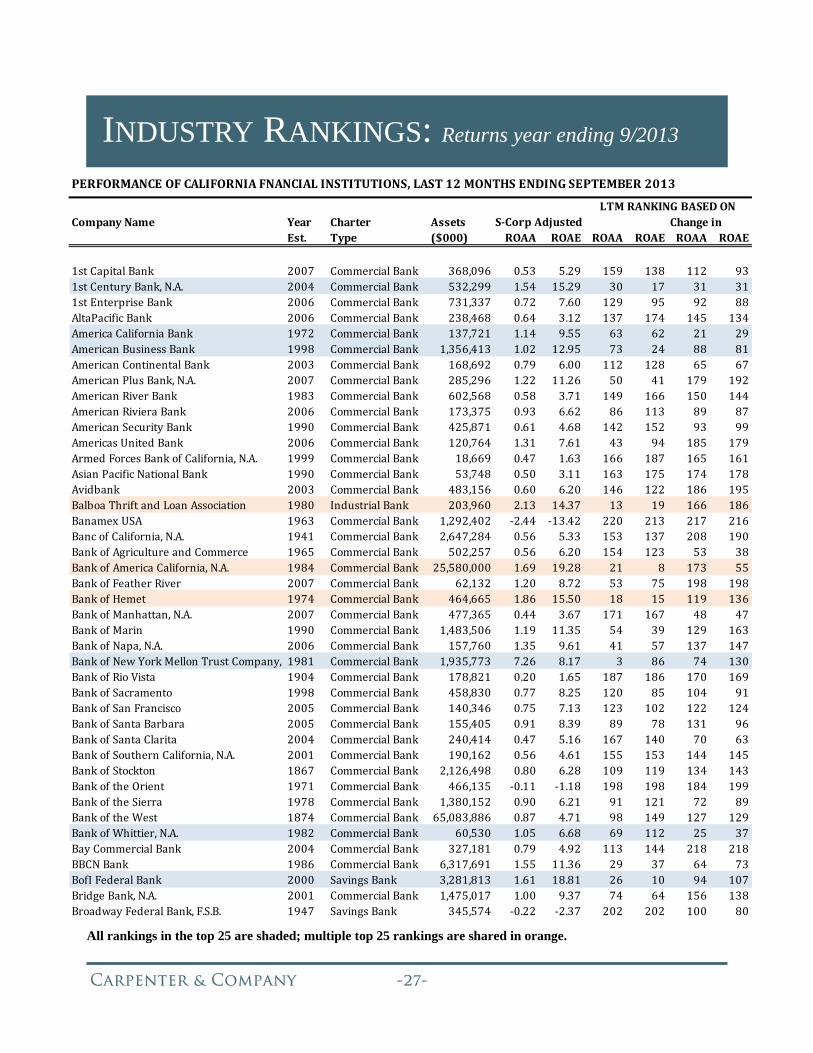
Carpenter & Company --
INDUSTRY RANKINGS: Returns year ending 9/2013
All rankings in the top 25 are shaded; multiple top 25 rankings are shared in orange.
PERFORMANCEOFCALIFORNIAFNANCIALINSTITUTIONS,LAST12MONTHSENDINGSEPTEMBER2013
CompanyName Year Charter Assets ChangeinEst. Type ($000) ROAA ROAE ROAA ROAE ROAA ROAE
1stCapitalBank 2007 CommercialBank 368,096 0.53 5.29 159 138 112 931stCenturyBank,N.A. 2004 CommercialBank 532,299 1.54 15.29 30 17 31 311stEnterpriseBank 2006 CommercialBank 731,337 0.72 7.60 129 95 92 88AltaPacificBank 2006 CommercialBank 238,468 0.64 3.12 137 174 145 134AmericaCaliforniaBank 1972 CommercialBank 137,721 1.14 9.55 63 62 21 29AmericanBusinessBank 1998 CommercialBank 1,356,413 1.02 12.95 73 24 88 81AmericanContinentalBank 2003 CommercialBank 168,692 0.79 6.00 112 128 65 67AmericanPlusBank,N.A. 2007 CommercialBank 285,296 1.22 11.26 50 41 179 192AmericanRiverBank 1983 CommercialBank 602,568 0.58 3.71 149 166 150 144AmericanRivieraBank 2006 CommercialBank 173,375 0.93 6.62 86 113 89 87AmericanSecurityBank 1990 CommercialBank 425,871 0.61 4.68 142 152 93 99AmericasUnitedBank 2006 CommercialBank 120,764 1.31 7.61 43 94 185 179ArmedForcesBankofCalifornia,N.A. 1999 CommercialBank 18,669 0.47 1.63 166 187 165 161AsianPacificNationalBank 1990 CommercialBank 53,748 0.50 3.11 163 175 174 178Avidbank 2003 CommercialBank 483,156 0.60 6.20 146 122 186 195BalboaThriftandLoanAssociation 1980 IndustrialBank 203,960 2.13 14.37 13 19 166 186BanamexUSA 1963 CommercialBank 1,292,402 ‐2.44 ‐13.42 220 213 217 216BancofCalifornia,N.A. 1941 CommercialBank 2,647,284 0.56 5.33 153 137 208 190BankofAgricultureandCommerce 1965 CommercialBank 502,257 0.56 6.20 154 123 53 38BankofAmericaCalifornia,N.A. 1984 CommercialBank 25,580,000 1.69 19.28 21 8 173 55BankofFeatherRiver 2007 CommercialBank 62,132 1.20 8.72 53 75 198 198BankofHemet 1974 CommercialBank 464,665 1.86 15.50 18 15 119 136BankofManhattan,N.A. 2007 CommercialBank 477,365 0.44 3.67 171 167 48 47BankofMarin 1990 CommercialBank 1,483,506 1.19 11.35 54 39 129 163BankofNapa,N.A. 2006 CommercialBank 157,760 1.35 9.61 41 57 137 147BankofNewYorkMellonTrustCompany, 1981 CommercialBank 1,935,773 7.26 8.17 3 86 74 130BankofRioVista 1904 CommercialBank 178,821 0.20 1.65 187 186 170 169BankofSacramento 1998 CommercialBank 458,830 0.77 8.25 120 85 104 91BankofSanFrancisco 2005 CommercialBank 140,346 0.75 7.13 123 102 122 124BankofSantaBarbara 2005 CommercialBank 155,405 0.91 8.39 89 78 131 96BankofSantaClarita 2004 CommercialBank 240,414 0.47 5.16 167 140 70 63BankofSouthernCalifornia,N.A. 2001 CommercialBank 190,162 0.56 4.61 155 153 144 145BankofStockton 1867 CommercialBank 2,126,498 0.80 6.28 109 119 134 143BankoftheOrient 1971 CommercialBank 466,135 ‐0.11 ‐1.18 198 198 184 199BankoftheSierra 1978 CommercialBank 1,380,152 0.90 6.21 91 121 72 89BankoftheWest 1874 CommercialBank 65,083,886 0.87 4.71 98 149 127 129BankofWhittier,N.A. 1982 CommercialBank 60,530 1.05 6.68 69 112 25 37BayCommercialBank 2004 CommercialBank 327,181 0.79 4.92 113 144 218 218BBCNBank 1986 CommercialBank 6,317,691 1.55 11.36 29 37 64 73BofIFederalBank 2000 SavingsBank 3,281,813 1.61 18.81 26 10 94 107BridgeBank,N.A. 2001 CommercialBank 1,475,017 1.00 9.37 74 64 156 138BroadwayFederalBank,F.S.B. 1947 SavingsBank 345,574 ‐0.22 ‐2.37 202 202 100 80
S‐CorpAdjustedLTMRANKINGBASEDON
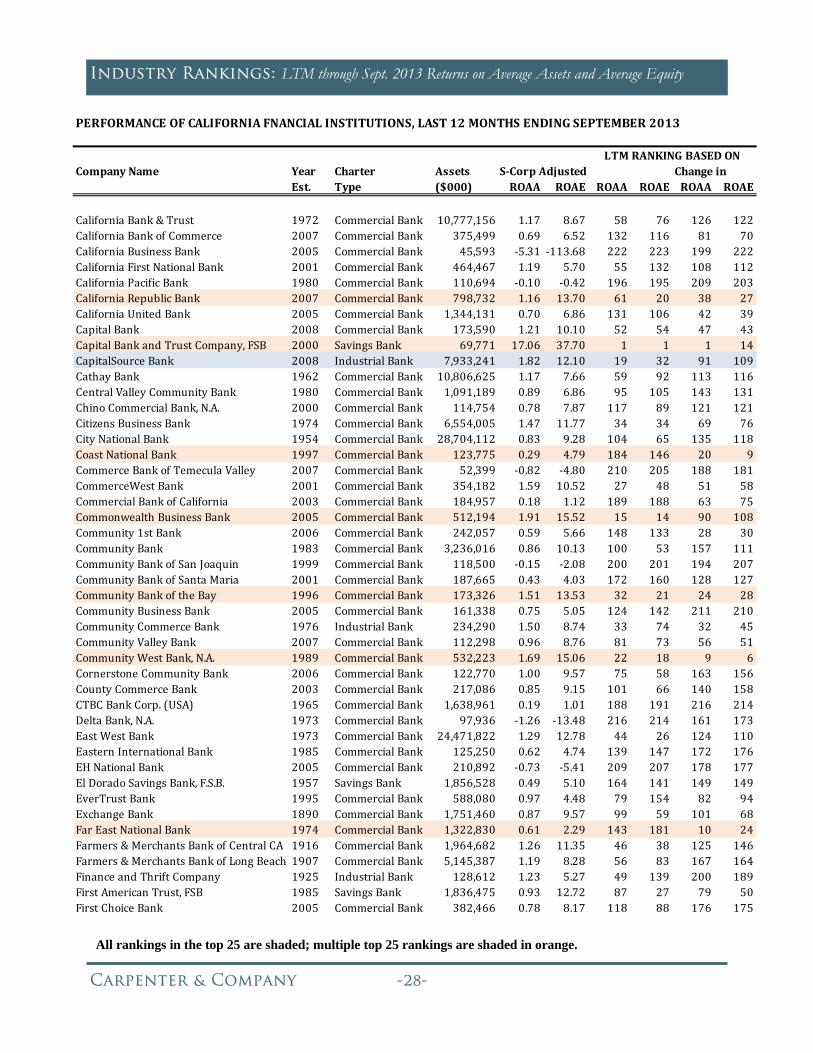
Carpenter & Company --
Industry Rankings: LTM through Sept. 2013 Returns on Average Assets and Average Equity
All rankings in the top 25 are shaded; multiple top 25 rankings are shaded in orange.
PERFORMANCEOFCALIFORNIAFNANCIALINSTITUTIONS,LAST12MONTHSENDINGSEPTEMBER2013
CompanyName Year Charter Assets ChangeinEst. Type ($000) ROAA ROAE ROAA ROAE ROAA ROAE
CaliforniaBank&Trust 1972 CommercialBank 10,777,156 1.17 8.67 58 76 126 122CaliforniaBankofCommerce 2007 CommercialBank 375,499 0.69 6.52 132 116 81 70CaliforniaBusinessBank 2005 CommercialBank 45,593 ‐5.31 ‐113.68 222 223 199 222CaliforniaFirstNationalBank 2001 CommercialBank 464,467 1.19 5.70 55 132 108 112CaliforniaPacificBank 1980 CommercialBank 110,694 ‐0.10 ‐0.42 196 195 209 203CaliforniaRepublicBank 2007 CommercialBank 798,732 1.16 13.70 61 20 38 27CaliforniaUnitedBank 2005 CommercialBank 1,344,131 0.70 6.86 131 106 42 39CapitalBank 2008 CommercialBank 173,590 1.21 10.10 52 54 47 43CapitalBankandTrustCompany,FSB 2000 SavingsBank 69,771 17.06 37.70 1 1 1 14CapitalSourceBank 2008 IndustrialBank 7,933,241 1.82 12.10 19 32 91 109CathayBank 1962 CommercialBank 10,806,625 1.17 7.66 59 92 113 116CentralValleyCommunityBank 1980 CommercialBank 1,091,189 0.89 6.86 95 105 143 131ChinoCommercialBank,N.A. 2000 CommercialBank 114,754 0.78 7.87 117 89 121 121CitizensBusinessBank 1974 CommercialBank 6,554,005 1.47 11.77 34 34 69 76CityNationalBank 1954 CommercialBank 28,704,112 0.83 9.28 104 65 135 118CoastNationalBank 1997 CommercialBank 123,775 0.29 4.79 184 146 20 9CommerceBankofTemeculaValley 2007 CommercialBank 52,399 ‐0.82 ‐4.80 210 205 188 181CommerceWestBank 2001 CommercialBank 354,182 1.59 10.52 27 48 51 58CommercialBankofCalifornia 2003 CommercialBank 184,957 0.18 1.12 189 188 63 75CommonwealthBusinessBank 2005 CommercialBank 512,194 1.91 15.52 15 14 90 108Community1stBank 2006 CommercialBank 242,057 0.59 5.66 148 133 28 30CommunityBank 1983 CommercialBank 3,236,016 0.86 10.13 100 53 157 111CommunityBankofSanJoaquin 1999 CommercialBank 118,500 ‐0.15 ‐2.08 200 201 194 207CommunityBankofSantaMaria 2001 CommercialBank 187,665 0.43 4.03 172 160 128 127CommunityBankoftheBay 1996 CommercialBank 173,326 1.51 13.53 32 21 24 28CommunityBusinessBank 2005 CommercialBank 161,338 0.75 5.05 124 142 211 210CommunityCommerceBank 1976 IndustrialBank 234,290 1.50 8.74 33 74 32 45CommunityValleyBank 2007 CommercialBank 112,298 0.96 8.76 81 73 56 51CommunityWestBank,N.A. 1989 CommercialBank 532,223 1.69 15.06 22 18 9 6CornerstoneCommunityBank 2006 CommercialBank 122,770 1.00 9.57 75 58 163 156CountyCommerceBank 2003 CommercialBank 217,086 0.85 9.15 101 66 140 158CTBCBankCorp.(USA) 1965 CommercialBank 1,638,961 0.19 1.01 188 191 216 214DeltaBank,N.A. 1973 CommercialBank 97,936 ‐1.26 ‐13.48 216 214 161 173EastWestBank 1973 CommercialBank 24,471,822 1.29 12.78 44 26 124 110EasternInternationalBank 1985 CommercialBank 125,250 0.62 4.74 139 147 172 176EHNationalBank 2005 CommercialBank 210,892 ‐0.73 ‐5.41 209 207 178 177ElDoradoSavingsBank,F.S.B. 1957 SavingsBank 1,856,528 0.49 5.10 164 141 149 149EverTrustBank 1995 CommercialBank 588,080 0.97 4.48 79 154 82 94ExchangeBank 1890 CommercialBank 1,751,460 0.87 9.57 99 59 101 68FarEastNationalBank 1974 CommercialBank 1,322,830 0.61 2.29 143 181 10 24Farmers&MerchantsBankofCentralCA 1916 CommercialBank 1,964,682 1.26 11.35 46 38 125 146Farmers&MerchantsBankofLongBeach 1907 CommercialBank 5,145,387 1.19 8.28 56 83 167 164FinanceandThriftCompany 1925 IndustrialBank 128,612 1.23 5.27 49 139 200 189FirstAmericanTrust,FSB 1985 SavingsBank 1,836,475 0.93 12.72 87 27 79 50FirstChoiceBank 2005 CommercialBank 382,466 0.78 8.17 118 88 176 175
LTMRANKINGBASEDONS‐CorpAdjusted

Carpenter & Company --
Industry Rankings: LTM through Sept. 2013 Returns on Average Assets and Average Equity
All rankings in the top 25 are shaded; multiple top 25 rankings are shaded in orange.
PERFORMANCEOFCALIFORNIAFNANCIALINSTITUTIONS,LAST12MONTHSENDINGSEPTEMBER2013
CompanyName Year Charter Assets ChangeinEst. Type ($000) ROAA ROAE ROAA ROAE ROAA ROAE
FirstCommercialBank(USA) 1997 CommercialBank 494,707 0.16 0.76 191 192 204 196FirstCommunityBank 2005 CommercialBank 679,655 1.37 12.20 39 30 27 19FirstCreditBank 1983 CommercialBank 372,882 4.33 11.93 5 33 77 188FirstFederalS&LAionofSanRafael 1963 SavingsBank 173,528 0.51 2.39 161 180 136 135FirstFoundationBank 2007 CommercialBank 957,588 0.95 11.31 83 40 80 152FirstGeneralBank 2005 CommercialBank 522,323 1.69 16.18 23 13 68 140FirstMountainBank 1981 CommercialBank 132,710 ‐1.11 ‐12.74 214 212 187 205FirstNationalBankofNorthernCalifornia 1963 CommercialBank 926,346 0.76 7.35 122 99 189 182FirstNationalBankofSouthernCalifornia 1984 CommercialBank 144,480 ‐0.18 ‐1.34 201 199 66 65FirstNorthernBankofDixon 1910 CommercialBank 876,020 0.64 6.55 138 115 83 69FirstRepublicBank 2010 CommercialBank 40,950,820 1.27 12.88 45 25 132 157FirstSecurityBusinessBank 1988 IndustrialBank 94,395 1.90 11.18 17 42 139 97FiveStarBank 1999 CommercialBank 570,160 1.52 17.17 31 11 123 49FocusBusinessBank 2007 CommercialBank 280,911 0.40 3.61 174 169 215 213FolsomLakeBank 2007 CommercialBank 136,931 0.67 6.72 134 109 95 79FoundersCommunityBank 2005 CommercialBank 156,925 0.74 6.70 127 111 107 98FremontBank 1964 CommercialBank 2,571,622 2.98 28.09 9 3 37 23FresnoFirstBank 2005 CommercialBank 222,600 ‐0.10 ‐0.98 197 197 206 208FriendlyHillsBank 2006 CommercialBank 105,535 0.14 1.12 192 189 183 183FrontierBank,FSB 1998 SavingsBank 164,148 ‐1.41 ‐58.99 217 221 14 3GatewayBank,F.S.B 1990 SavingsBank 209,496 ‐1.70 ‐30.92 219 219 201 204GBCInternationalBank 1976 CommercialBank 466,859 0.85 8.42 102 77 141 159GoldenPacificBank,N.A. 1986 CommercialBank 133,813 ‐0.12 ‐1.46 199 200 102 100GoldenStateBank 2003 CommercialBank 82,639 ‐0.84 ‐14.94 211 216 17 7GoldenValleyBank 2006 CommercialBank 140,295 1.00 7.59 76 96 114 106GrandpointBank 2007 CommercialBank 2,009,541 0.81 6.27 107 120 46 48HanmiBank 1982 CommercialBank 2,839,470 1.69 11.65 24 36 214 217HeritageBankofCommerce 1994 CommercialBank 1,398,732 0.91 7.78 90 91 155 114HeritageOaksBank 1983 CommercialBank 1,151,841 1.18 8.80 57 72 175 172HomeBankofCalifornia 1981 CommercialBank 102,727 1.33 7.23 42 101 192 206IndependenceBank 2004 CommercialBank 311,772 0.53 3.83 160 163 85 104InternationalCityBank,N.A. 1984 CommercialBank 133,423 2.85 19.08 11 9 8 13JPMorganBankandTrustCo.,N.A. 2008 CommercialBank 9,918,380 2.19 17.13 12 12 29 60LibertyBank 1982 CommercialBank 223,014 0.80 6.44 110 117 39 40LighthouseBank 2007 CommercialBank 160,699 1.37 10.56 40 47 67 83LutherBurbankSavings 1982 SavingsBank 3,626,517 1.22 10.23 51 52 191 117MalagaBankF.S.B. 1985 SavingsBank 870,878 1.46 10.89 35 44 152 166ManufacturersBank 1962 CommercialBank 2,292,631 0.37 2.88 179 178 99 101MechanicsBank 1905 CommercialBank 3,300,126 0.79 8.35 114 81 110 102MegaBank 2008 CommercialBank 250,969 0.48 3.81 165 164 181 171MerchantsBankofCalifornia,N.A. 1989 CommercialBank 87,632 1.42 7.37 38 97 58 84MerchantsNationalBankofSacramento 1921 CommercialBank 194,346 0.83 8.34 105 82 162 165MetroUnitedBank 1991 CommercialBank 488,849 0.80 5.49 111 135 30 36MetropolitanBank 1983 CommercialBank 130,255 1.10 10.31 65 50 11 12MissionBank 1998 CommercialBank 390,144 0.62 7.03 140 103 164 139
S‐CorpAdjustedLTMRANKINGBASEDON
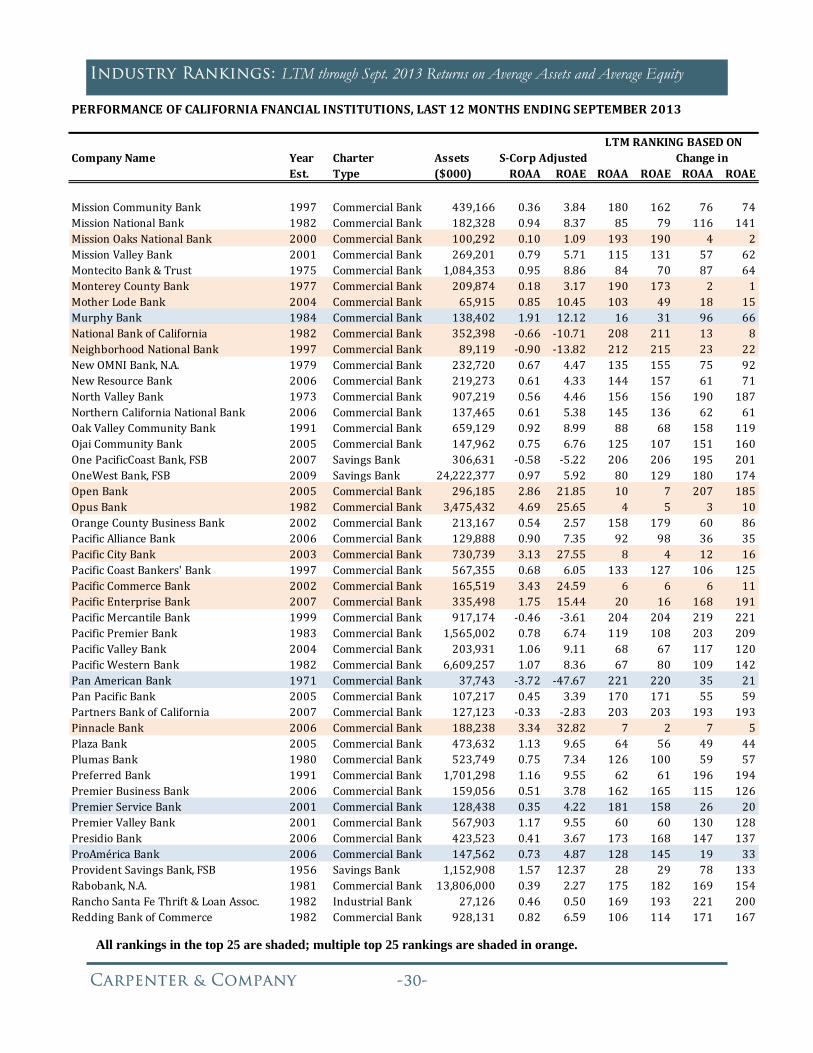
Carpenter & Company --
Industry Rankings: LTM through Sept. 2013 Returns on Average Assets and Average Equity
All rankings in the top 25 are shaded; multiple top 25 rankings are shaded in orange.
PERFORMANCEOFCALIFORNIAFNANCIALINSTITUTIONS,LAST12MONTHSENDINGSEPTEMBER2013
CompanyName Year Charter Assets ChangeinEst. Type ($000) ROAA ROAE ROAA ROAE ROAA ROAE
MissionCommunityBank 1997 CommercialBank 439,166 0.36 3.84 180 162 76 74MissionNationalBank 1982 CommercialBank 182,328 0.94 8.37 85 79 116 141MissionOaksNationalBank 2000 CommercialBank 100,292 0.10 1.09 193 190 4 2MissionValleyBank 2001 CommercialBank 269,201 0.79 5.71 115 131 57 62MontecitoBank&Trust 1975 CommercialBank 1,084,353 0.95 8.86 84 70 87 64MontereyCountyBank 1977 CommercialBank 209,874 0.18 3.17 190 173 2 1MotherLodeBank 2004 CommercialBank 65,915 0.85 10.45 103 49 18 15MurphyBank 1984 CommercialBank 138,402 1.91 12.12 16 31 96 66NationalBankofCalifornia 1982 CommercialBank 352,398 ‐0.66 ‐10.71 208 211 13 8NeighborhoodNationalBank 1997 CommercialBank 89,119 ‐0.90 ‐13.82 212 215 23 22NewOMNIBank,N.A. 1979 CommercialBank 232,720 0.67 4.47 135 155 75 92NewResourceBank 2006 CommercialBank 219,273 0.61 4.33 144 157 61 71NorthValleyBank 1973 CommercialBank 907,219 0.56 4.46 156 156 190 187NorthernCaliforniaNationalBank 2006 CommercialBank 137,465 0.61 5.38 145 136 62 61OakValleyCommunityBank 1991 CommercialBank 659,129 0.92 8.99 88 68 158 119OjaiCommunityBank 2005 CommercialBank 147,962 0.75 6.76 125 107 151 160OnePacificCoastBank,FSB 2007 SavingsBank 306,631 ‐0.58 ‐5.22 206 206 195 201OneWestBank,FSB 2009 SavingsBank 24,222,377 0.97 5.92 80 129 180 174OpenBank 2005 CommercialBank 296,185 2.86 21.85 10 7 207 185OpusBank 1982 CommercialBank 3,475,432 4.69 25.65 4 5 3 10OrangeCountyBusinessBank 2002 CommercialBank 213,167 0.54 2.57 158 179 60 86PacificAllianceBank 2006 CommercialBank 129,888 0.90 7.35 92 98 36 35PacificCityBank 2003 CommercialBank 730,739 3.13 27.55 8 4 12 16PacificCoastBankers'Bank 1997 CommercialBank 567,355 0.68 6.05 133 127 106 125PacificCommerceBank 2002 CommercialBank 165,519 3.43 24.59 6 6 6 11PacificEnterpriseBank 2007 CommercialBank 335,498 1.75 15.44 20 16 168 191PacificMercantileBank 1999 CommercialBank 917,174 ‐0.46 ‐3.61 204 204 219 221PacificPremierBank 1983 CommercialBank 1,565,002 0.78 6.74 119 108 203 209PacificValleyBank 2004 CommercialBank 203,931 1.06 9.11 68 67 117 120PacificWesternBank 1982 CommercialBank 6,609,257 1.07 8.36 67 80 109 142PanAmericanBank 1971 CommercialBank 37,743 ‐3.72 ‐47.67 221 220 35 21PanPacificBank 2005 CommercialBank 107,217 0.45 3.39 170 171 55 59PartnersBankofCalifornia 2007 CommercialBank 127,123 ‐0.33 ‐2.83 203 203 193 193PinnacleBank 2006 CommercialBank 188,238 3.34 32.82 7 2 7 5PlazaBank 2005 CommercialBank 473,632 1.13 9.65 64 56 49 44PlumasBank 1980 CommercialBank 523,749 0.75 7.34 126 100 59 57PreferredBank 1991 CommercialBank 1,701,298 1.16 9.55 62 61 196 194PremierBusinessBank 2006 CommercialBank 159,056 0.51 3.78 162 165 115 126PremierServiceBank 2001 CommercialBank 128,438 0.35 4.22 181 158 26 20PremierValleyBank 2001 CommercialBank 567,903 1.17 9.55 60 60 130 128PresidioBank 2006 CommercialBank 423,523 0.41 3.67 173 168 147 137ProAméricaBank 2006 CommercialBank 147,562 0.73 4.87 128 145 19 33ProvidentSavingsBank,FSB 1956 SavingsBank 1,152,908 1.57 12.37 28 29 78 133Rabobank,N.A. 1981 CommercialBank 13,806,000 0.39 2.27 175 182 169 154RanchoSantaFeThrift&LoanAssoc. 1982 IndustrialBank 27,126 0.46 0.50 169 193 221 200ReddingBankofCommerce 1982 CommercialBank 928,131 0.82 6.59 106 114 171 167
LTMRANKINGBASEDONS‐CorpAdjusted
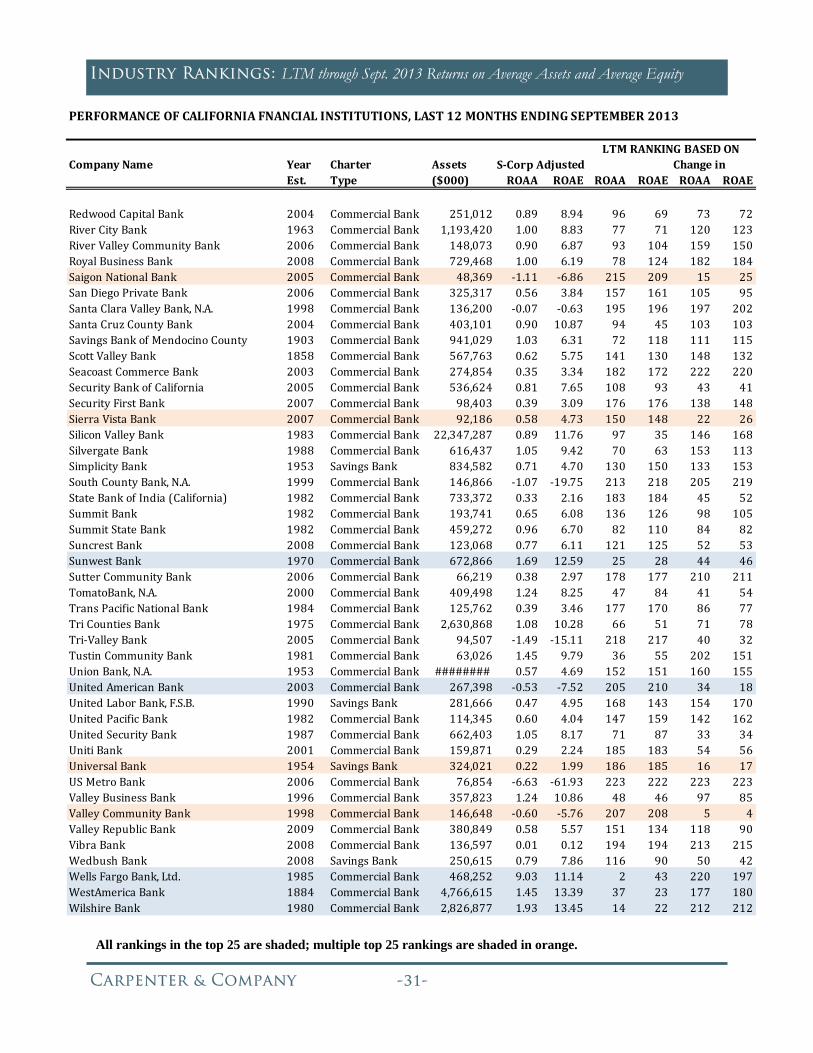
Carpenter & Company --
Industry Rankings: LTM through Sept. 2013 Returns on Average Assets and Average Equity
All rankings in the top 25 are shaded; multiple top 25 rankings are shaded in orange.
PERFORMANCEOFCALIFORNIAFNANCIALINSTITUTIONS,LAST12MONTHSENDINGSEPTEMBER2013
CompanyName Year Charter Assets ChangeinEst. Type ($000) ROAA ROAE ROAA ROAE ROAA ROAE
RedwoodCapitalBank 2004 CommercialBank 251,012 0.89 8.94 96 69 73 72RiverCityBank 1963 CommercialBank 1,193,420 1.00 8.83 77 71 120 123RiverValleyCommunityBank 2006 CommercialBank 148,073 0.90 6.87 93 104 159 150RoyalBusinessBank 2008 CommercialBank 729,468 1.00 6.19 78 124 182 184SaigonNationalBank 2005 CommercialBank 48,369 ‐1.11 ‐6.86 215 209 15 25SanDiegoPrivateBank 2006 CommercialBank 325,317 0.56 3.84 157 161 105 95SantaClaraValleyBank,N.A. 1998 CommercialBank 136,200 ‐0.07 ‐0.63 195 196 197 202SantaCruzCountyBank 2004 CommercialBank 403,101 0.90 10.87 94 45 103 103SavingsBankofMendocinoCounty 1903 CommercialBank 941,029 1.03 6.31 72 118 111 115ScottValleyBank 1858 CommercialBank 567,763 0.62 5.75 141 130 148 132SeacoastCommerceBank 2003 CommercialBank 274,854 0.35 3.34 182 172 222 220SecurityBankofCalifornia 2005 CommercialBank 536,624 0.81 7.65 108 93 43 41SecurityFirstBank 2007 CommercialBank 98,403 0.39 3.09 176 176 138 148SierraVistaBank 2007 CommercialBank 92,186 0.58 4.73 150 148 22 26SiliconValleyBank 1983 CommercialBank 22,347,287 0.89 11.76 97 35 146 168SilvergateBank 1988 CommercialBank 616,437 1.05 9.42 70 63 153 113SimplicityBank 1953 SavingsBank 834,582 0.71 4.70 130 150 133 153SouthCountyBank,N.A. 1999 CommercialBank 146,866 ‐1.07 ‐19.75 213 218 205 219StateBankofIndia(California) 1982 CommercialBank 733,372 0.33 2.16 183 184 45 52SummitBank 1982 CommercialBank 193,741 0.65 6.08 136 126 98 105SummitStateBank 1982 CommercialBank 459,272 0.96 6.70 82 110 84 82SuncrestBank 2008 CommercialBank 123,068 0.77 6.11 121 125 52 53SunwestBank 1970 CommercialBank 672,866 1.69 12.59 25 28 44 46SutterCommunityBank 2006 CommercialBank 66,219 0.38 2.97 178 177 210 211TomatoBank,N.A. 2000 CommercialBank 409,498 1.24 8.25 47 84 41 54TransPacificNationalBank 1984 CommercialBank 125,762 0.39 3.46 177 170 86 77TriCountiesBank 1975 CommercialBank 2,630,868 1.08 10.28 66 51 71 78Tri‐ValleyBank 2005 CommercialBank 94,507 ‐1.49 ‐15.11 218 217 40 32TustinCommunityBank 1981 CommercialBank 63,026 1.45 9.79 36 55 202 151UnionBank,N.A. 1953 CommercialBank ######## 0.57 4.69 152 151 160 155UnitedAmericanBank 2003 CommercialBank 267,398 ‐0.53 ‐7.52 205 210 34 18UnitedLaborBank,F.S.B. 1990 SavingsBank 281,666 0.47 4.95 168 143 154 170UnitedPacificBank 1982 CommercialBank 114,345 0.60 4.04 147 159 142 162UnitedSecurityBank 1987 CommercialBank 662,403 1.05 8.17 71 87 33 34UnitiBank 2001 CommercialBank 159,871 0.29 2.24 185 183 54 56UniversalBank 1954 SavingsBank 324,021 0.22 1.99 186 185 16 17USMetroBank 2006 CommercialBank 76,854 ‐6.63 ‐61.93 223 222 223 223ValleyBusinessBank 1996 CommercialBank 357,823 1.24 10.86 48 46 97 85ValleyCommunityBank 1998 CommercialBank 146,648 ‐0.60 ‐5.76 207 208 5 4ValleyRepublicBank 2009 CommercialBank 380,849 0.58 5.57 151 134 118 90VibraBank 2008 CommercialBank 136,597 0.01 0.12 194 194 213 215WedbushBank 2008 SavingsBank 250,615 0.79 7.86 116 90 50 42WellsFargoBank,Ltd. 1985 CommercialBank 468,252 9.03 11.14 2 43 220 197WestAmericaBank 1884 CommercialBank 4,766,615 1.45 13.39 37 23 177 180WilshireBank 1980 CommercialBank 2,826,877 1.93 13.45 14 22 212 212
LTMRANKINGBASEDONS‐CorpAdjusted
Carpenter & Company --
Industry Rankings: LTM through Sept. 2013 Returns on Average Assets and Average Equity
ABOUT THE RETURN RANKINGS Rankings of the 2013 returns on average assets and average equity are based upon data for California financial institutions, as of September 30, 2013, obtained from SNL Financial. Removed from this analysis are California non-depository trust companies. Wherever possible, the rankings were based upon earnings estimates that were adjusted for S-Corporate treatment. S-Corp returns, however, were not generally available for savings associations. The rankings were based upon the following metrics:
Returns on assets and equity for the LTM (last 12 months) ending September 30, 2013. Year-over-year change in the two measures
Note: No adjustments were make in the return data and, therefore, in the rankings for the following factors that may cause a distortion in the return ratios relative to other financial institutions:
A savings association that is a Sub-chapter S corporation. A financial institution with a high dependency on fee income. A financial institution that is owned by a holding company, especially a holding company
absorbing a portion of the operating expenses of the individual financial institution. A financial institution with a large income tax loss carry-forward or for a number of reason
does not have earnings that are not taxed at the full tax rate for California corporations.