NOTA LAVORO - COnnecting REpositoriesBy Emanuele Massetti, Fondazione Eni Enrico Mattei and...
56
Super-Grids and Concentrated Solar Power: A Scenario Analysis with the WITCH Model NOTA DI LAVORO 47.2011 By Emanuele Massetti, Fondazione Eni Enrico Mattei and Euro-Mediterranean Centre for Climate Change, Italy Elena Claire Ricci , Università degli Studi di Milano and Fondazione Eni Enrico Mattei, Italy
Transcript of NOTA LAVORO - COnnecting REpositoriesBy Emanuele Massetti, Fondazione Eni Enrico Mattei and...

Super-Grids and Concentrated Solar Power: A Scenario Analysis with the WITCH Model
NOTA DILAVORO47.2011
By Emanuele Massetti, Fondazione Eni Enrico Mattei and Euro-Mediterranean Centre for Climate Change, Italy Elena Claire Ricci, Università degli Studi di Milano and Fondazione Eni Enrico Mattei, Italy
The opinions expressed in this paper do not necessarily reflect the position of Fondazione Eni Enrico Mattei
Corso Magenta, 63, 20123 Milano (I), web site: www.feem.it, e-mail: [email protected]
Climate Change and Sustainable Development Series Editor: Carlo Carraro
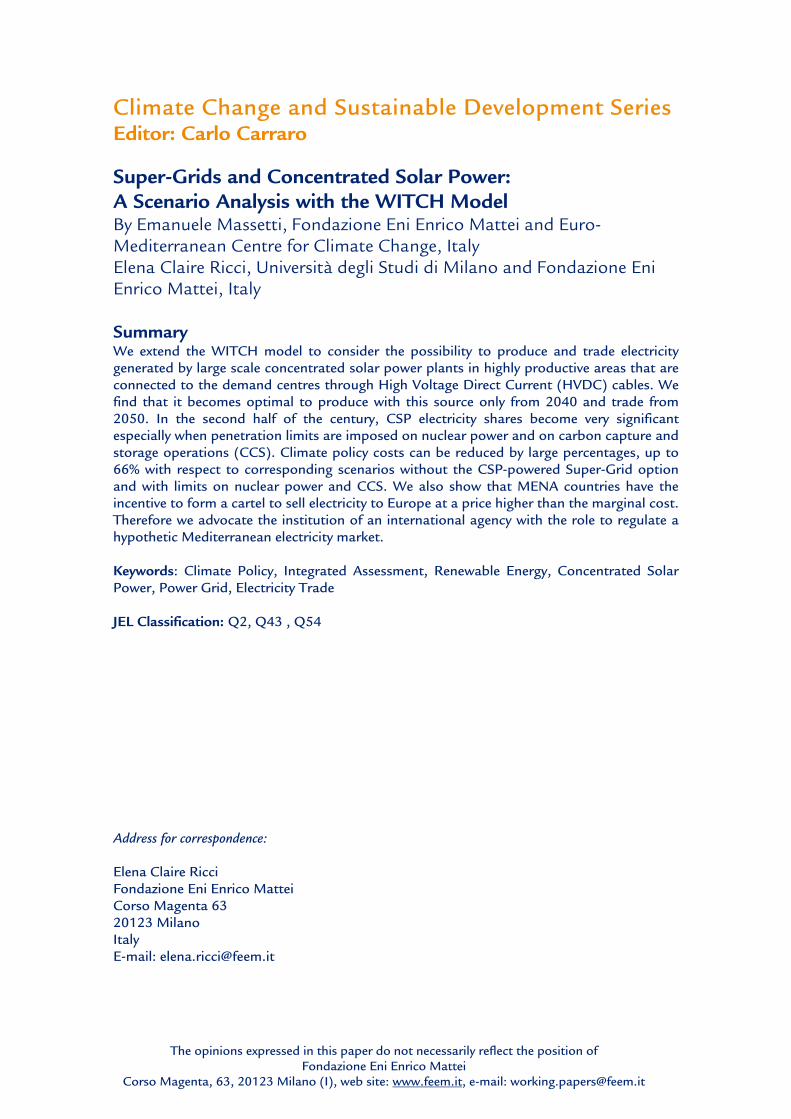
Super-Grids and Concentrated Solar Power: A Scenario Analysis with the WITCH Model By Emanuele Massetti, Fondazione Eni Enrico Mattei and Euro-Mediterranean Centre for Climate Change, Italy Elena Claire Ricci, Università degli Studi di Milano and Fondazione Eni Enrico Mattei, Italy Summary We extend the WITCH model to consider the possibility to produce and trade electricity generated by large scale concentrated solar power plants in highly productive areas that are connected to the demand centres through High Voltage Direct Current (HVDC) cables. We find that it becomes optimal to produce with this source only from 2040 and trade from 2050. In the second half of the century, CSP electricity shares become very significant especially when penetration limits are imposed on nuclear power and on carbon capture and storage operations (CCS). Climate policy costs can be reduced by large percentages, up to 66% with respect to corresponding scenarios without the CSP-powered Super-Grid option and with limits on nuclear power and CCS. We also show that MENA countries have the incentive to form a cartel to sell electricity to Europe at a price higher than the marginal cost. Therefore we advocate the institution of an international agency with the role to regulate a hypothetic Mediterranean electricity market. Keywords: Climate Policy, Integrated Assessment, Renewable Energy, Concentrated Solar Power, Power Grid, Electricity Trade JEL Classification: Q2, Q43 , Q54 Address for correspondence: Elena Claire Ricci Fondazione Eni Enrico Mattei Corso Magenta 63 20123 Milano Italy E-mail: [email protected]
1
SUPER-GRIDS AND CONCENTRATED SOLAR POWER: A SCENARIO ANALYSIS WITH THE WITCH MODEL
Emanuele Massetti Fondazione Eni Enrico Mattei
Centro Euro-Mediterraneo per i Cambiamenti Climatici
Elena Claire Ricci* Università degli Studi di Milano Fondazione Eni Enrico Mattei
Abstract
We extend the WITCH model to consider the possibility to produce and trade electricity generated by large scale concentrated solar power plants in highly productive areas that are connected to the demand centres through High Voltage Direct Current (HVDC) cables. We find that it becomes optimal to produce with this source only from 2040 and trade from 2050. In the second half of the century, CSP electricity shares become very significant especially when penetration limits are imposed on nuclear power and on carbon capture and storage operations (CCS). Climate policy costs can be reduced by large percentages, up to 66% with respect to corresponding scenarios without the CSP-powered Super-Grid option and with limits on nuclear power and CCS. We also show that MENA countries have the incentive to form a cartel to sell electricity to Europe at a price higher than the marginal cost. Therefore we advocate the institution of an international agency with the role to regulate a hypothetic Mediterranean electricity market. .
* Corresponding author: Corso Magenta, 63, 20123 Milano – Italy. Email: [email protected].
2
1. Introduction
Nowadays, general consensus on the impacts of human activities on global climate change has
been reached and the interest related to climate issues is growing also among the general public.
The debate now focuses on the actions that need to be undertaken to avoid damages that are
unacceptable from an economic, social, ethical or environmental point of view and on the
policies that can lead to the achievement of such objectives (Nordhaus 1993; Stern 2006; IPCC
2007).
Around the world, initiatives aimed at reducing anthropogenic greenhouse gas (GHG) emissions
are beginning to spread, though an operative and effective international agreement is far from
being reached. The recent 16th United Nations Framework Convention on Climate Change
(UNFCCC) Conference of the Parties (COP 16) in Cancun has moved the situation a step
forward by confirming, and slightly extending, the results of the Copenhagen Accord in an
official, though non-binding, UNFCCC agreement (the Cancun Agreement). Policies aimed at
drastically reducing GHG emissions – like for example the discussion about 50% global
emission reduction by 2050 emerged at the 2009 L’Aquila G8 meeting – might entail large
economic costs; however inaction may lead to even higher costs in the future (Stern 2006;
Weitzman 2009).
It is therefore, very important to analyse what the true costs and impacts of the proposed climate
policies may be. Extensive work in this field has already been carried out (WGIII of IPCC 2007;
Clarke et al. 2009; Edenhofer et al. 2009); more specifically, this paper aims at evaluating the
changes in the policy costs – and in the electricity mix – when the option of long distance
transmission of concentrated solar power (CSP) is added to the portfolio of available
technological options. We analyse the issue in a cost-minimization framework, i.e., to look for
the least-cost option that allows the achievement of the targeted climate policy.
The focus is on the electric sector, as a wide range of model simulations consistently find that in
stringent mitigation scenarios it is optimal to electrify the energy supply (Richels et al. 2007;
Bosetti et al. 2009). In addition, due to its peculiar characteristics and to the fact that the non-
electric energy sector is still far from finding viable solutions to drastically reduce its carbon
emissions, the electric power sector will have to reach high levels of decarbonisation already
from the first half of the century. For instance, stabilization scenarios at 550ppm CO2-eq that
emerge from long term models require almost carbon-free electricity generation (Bosetti et al.
2007b; Gurney et al. 2009; ECF 2010).
3
The electric power sector is, indeed, one of the most relevant sources of carbon emissions and at
the same time electricity is becoming more and more important for the contemporary society,
with its demand growing at a high rate, especially in developing countries. Emissions from the
power sector1 in Europe and worldwide exceed 39% (1.6 MtCO2e) and 45% (12.8 MtCO2e) of
their global emissions, respectively (WRI 2010), and electricity demand is expected to increase
76% by 2030 worldwide according to the IEA (2009) and 87% by 2035 according to the EIA
(2010). These projections (IEA 2009) assume that more than one billion of people will still lack
access to electricity in 2030 compared with the current 1.5 billion people.
Moreover, the power sector is characterised by long term investments that necessarily shape
future emission scenarios and it is particularly relevant also because low carbon technologies –
that can help target the problem of reducing GHG emissions – already exist or are in an
advanced phase of development (nuclear power, carbon capture and storage for hydrocarbon
sources, renewable technologies).
The pull for reducing the electric power sector’s GHG emissions is coming both from the
policies, but also form the demand side. Evidence that supports the existence of a willingness to
pay – of a certain fraction of consumers – for “greener energy” is, in fact, increasing (Bird et al.
2006; Wiser 2007; Carlsson et al. 2010).
Reaching stringent emission targets with present technologies may be technically feasible, but
serious political and social issues arise especially in scenarios with a high penetration of nuclear
power and production based on coal with carbon capture and storage. More specifically, nuclear
power generation through fission is technologically mature and would be technically able to
expand and decarbonize electricity generation. However, there are still large unsolved issues
regarding: (i) the safe treatment and disposal of radioactive waste and (ii ) proliferation of
nuclear technology, knowledge and reprocessable waste, with its geopolitical implications. This,
together with the operational risks made apparent by past and recent incidents, induces
scepticism towards a nuclear expansion in a significant part of the general public and in the
political arena.2 The technology needed for carbon capture and storage (CCS) operations is
already commercially available, but used separately for different production processes.
Consequently, there is no need for technological breakthroughs, but for large-scale
demonstration plants, to be used as learning opportunities to solve some of the concerns
regarding CCS. The major problematic issues about this technology are related to: (i) the very
1 Data is taken from CAIT 2010 and refers to emissions from electricity and heat plants in 2006 for EU-27 and Worldwide.

4
high costs of capture operations compared to the price attached to carbon emissions; (ii ) the
uncertainties regarding storage operations, related mainly to storage capacity and leakage; (iii )
the uncertain legal and regulatory framework for storage and long-term liability; (iv) public
acceptance of storage.3
Given the issues related to the expansion of nuclear power and CCS, strong decarbonisation
targets will necessarily require the introduction of new technologies and it will be important not
to focus only on the different generation technologies, but also on the opportunities induced by
the structural transformations of the distribution system and its management.
The current discussion about new technological options that may be added to the optimal
mitigation portfolio, indeed, includes important innovations in the distribution system and
focuses on Super-Grids and Smart-Grids that may increase the exploitation of renewable
sources (WBGU 2003; Trieb 2006; Battaglini et al. 2008; ECF 2010; IEA 2010c; Jacobson and
Delucchi 2010). These innovations entail a re-engineering of the power systems towards a more
evolved structure that will require a more complex management capable of dealing with new
and distributed production sources and even possible changes in consumer involvement.
This work focuses on Super-Grids (SG), that are high capacity wide area transmission networks
intended to transmit power over long distances. Although Super-Grids allow the connection of
all kinds of power generation plants, their link with renewable energy is particularly interesting
because it allows to take advantage of sources distantly located from consumption areas. The
development of high-voltage direct current (HVDC) cables, indeed, allows the exploitation of
sources that where previously non-economically viable due to transmission losses. In addition,
such cables allow the integration of inter-regional electric power systems, facilitating trade and
helping to smooth the variations in supply and demand (Wolff 2008) taking advantage of
meteorological or time differences. Even if they require the construction of converter stations
that are costly and have a high footprint4 in terms of land-requirements, HVDC cables are more
suitable than high-voltage alternating current (HVAC) cables for large-scale and long distance
transmission, because of: (i) lower transmission losses over long distances; (ii ) the possibility of
submarine cables over long distances and of (iii ) underground cables over long distances and
with high power; (iv) a lower number of lines is needed to transmit the same power; (v) smaller
footprint, in terms of occupied land, of the over-head lines; (vi) smaller magnetic fields from the
2 For a deeper discussion on the topic see Deutch et al. (2003) and Jacobson and Delucchi (2010). 3 For a more detailed discussion on the topic see IPCC (2005) and Herzog (2010). 4 Footprint here refers to the area around the converter station or the power line on which no buildings or high trees are allowed.
5
lines; (vii) greater control over power transfers, that is important for electricity trade (Heyman et
al. 2010).
The investments needed for projects that aim at connecting different regions or very distant
national areas are high, and in order to attract investors and be profitable such infrastructure
needs to be used consistently, and therefore to be subject to long-term agreements. Especially
for the implementation of international Super-Grids, issues of security exist and need to be
carefully considered, as these lines have the potential to cover large percentages of the regional
power loads.
All water, wind and solar related technologies are likely to play an important role in
decarbonising electricity production (ECF 2010; Jacobson and Delucchi 2010). In particular,
this paper focuses on concentrated solar power, and more specifically on parabolic troughs, as
the levels of solar radiation, especially for the Middle-East and North Africa (MENA) region,
may be the source of comparative advantages.
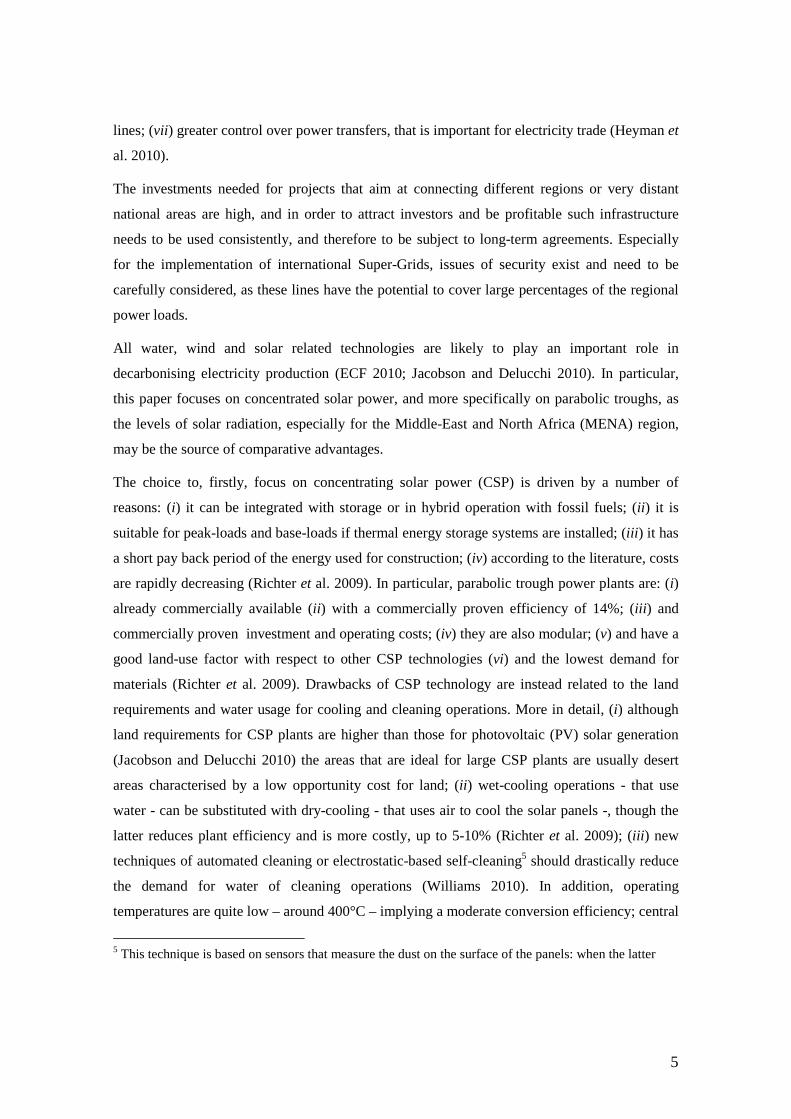
The choice to, firstly, focus on concentrating solar power (CSP) is driven by a number of
reasons: (i) it can be integrated with storage or in hybrid operation with fossil fuels; (ii ) it is
suitable for peak-loads and base-loads if thermal energy storage systems are installed; (iii ) it has
a short pay back period of the energy used for construction; (iv) according to the literature, costs
are rapidly decreasing (Richter et al. 2009). In particular, parabolic trough power plants are: (i)
already commercially available (ii ) with a commercially proven efficiency of 14%; (iii ) and
commercially proven investment and operating costs; (iv) they are also modular; (v) and have a
good land-use factor with respect to other CSP technologies (vi) and the lowest demand for
materials (Richter et al. 2009). Drawbacks of CSP technology are instead related to the land
requirements and water usage for cooling and cleaning operations. More in detail, (i) although
land requirements for CSP plants are higher than those for photovoltaic (PV) solar generation
(Jacobson and Delucchi 2010) the areas that are ideal for large CSP plants are usually desert
areas characterised by a low opportunity cost for land; (ii ) wet-cooling operations - that use
water - can be substituted with dry-cooling - that uses air to cool the solar panels -, though the
latter reduces plant efficiency and is more costly, up to 5-10% (Richter et al. 2009); (iii ) new
techniques of automated cleaning or electrostatic-based self-cleaning5 should drastically reduce
the demand for water of cleaning operations (Williams 2010). In addition, operating
temperatures are quite low – around 400°C – implying a moderate conversion efficiency; central
5 This technique is based on sensors that measure the dust on the surface of the panels: when the latter

6
receiver CSP plants have instead good prospects for reaching higher temperatures, though this
technology has not yet been commercially proven (Richter et al. 2009).
Some economic studies that investigate the feasibility of this option have already been carried
out. The tools that have been applied, though, are mainly policy analysis and scenario analysis
(Trieb 2006; Patt et al. 2008; Ummel and Wheeler 2008; IEA 2010b, Jacobson and Delucchi
2010). These methods identify potential risks, implementation barriers, required subsidies and
policies or choose and describe feasible future situations to evaluate their effects and pathways
towards them. To our knowledge, the only attempt to introduce a Super-Grid in a more
sophisticated economic model is that of Bauer et al. (2009), that aims at finding the political
barriers to the electricity trade between Europe and MENA analysing the effects on
macroeconomic activity, sectoral outputs and trade relations.
The present work aims at evaluating the optimal profile of investments in a Super-Grid capable
of delivering long distance electricity, generated with solar thermal power plants. The optimal
timing and quantity of investments both in the grid and in the new power plants will be
determined as the outcome of a long-term optimization process in which economic resources are
allocated efficiently across sectors and time. To do so, we build on a pre-existing model – the
WITCH (World Induced Technical Change Hybrid) Model – where investment decisions for all
regions in which the world countries are grouped in the model, are the outcome of a strategic
interaction modelled as an open loop Nash game.
More precisely, we extend the model so that it is able to consider concentrated solar power
production and its transmission over long distances within or between regions. In particular, we
model the possibility for Western and Eastern Europe to import electricity generated in highly
productive areas of the Middle-East and North Africa, allowing the latter to use this electricity
also for domestic consumption, without the need of a SG. We also simulate the possibility for
the USA and China to invest in a domestic CSP powered SG connecting highly insolated areas
with distant highly energy demanding areas of the same region. This may enable an increased
diversification of electricity sources and also an increased usage of low carbon technologies,
reducing the electric power sector CO2 footprint.
Future work will try to account for the main social effects of the increased availability of
(carbon-free) electricity in the MENA region, starting from the possibility of producing
reaches a certain level, the panel surface is energised so that a dust-repelling wave lifts the dust and it transports it to the edge of the screen.
7
relatively cheap and low-carbon fresh water, in line with some exploratory work that has
appeared in the literature (Trieb and Müller-Steinhagen 2007; Trieb 2009).
The main goal of this paper is to illustrate modelling choices to introduce CSP powered Super-
Grids and international trade of electricity in the WITCH model and to review the implications
that these technology options have on technological and economic/geo-political issues. On the
technological side we are interested in examining (i) the optimal scale of CSP, (ii) the optimal
timing of investments in CSP, (iii) the optimal power generation mix, (iv) the implications for
non-power energy uses. On the economic/geo-political side we examine (i) the impact of
introducing CSP on the cost of achieving a given stabilization target, (ii) the scale of the
investments needed and the size of the European Union-MENA (Euro-MENA) electricity trade,
(iii) the evolution of investment costs in CSP (iv) the geo-political implications of having a
large fraction of electricity in the EU that is imported from the MENA region and (v) we start
investigating scenarios where market power is exerted.
Our analysis is the most comprehensive in the literature. Compared to previous policy scenarios
analysis we use a solid energy-economy modelling framework (Trieb 2006; Patt et al. 2008;
Ummel and Wheeler 2008; Jacobson and Delucchi 2010). With respect to Bauer et al. (2009)
we make further considerations on the nature of the electricity trade between the Euro-MENA;
we also introduce CSP powered SG also in the USA and in China.
The next sections will describe the WITCH model (Section 2) and the insertion of the Super-
Grid option (Section 3), discuss the calibration procedure (Section 4) and then (Section 5)
evaluate the costs, benefits and potential effects of the Super-Grid option, to understand if the
necessary technological upgrades are economically justifiable. Section 6 evaluates the costs and
benefits of an anticipated common deployment of CSP while Section 7 analyses the Euro-
MENA trade situation in the presence of market power. Section 8 illustrates the sensitivity
analysis and conclusions follow.
2. A Brief Introduction to the WITCH Model
WITCH – World Induced Technical Change Hybrid – is a regional integrated assessment model
structured to provide normative information on the optimal responses of world economies to
climate policies (Bosetti et al. 2006, 2007a).
It is a hybrid model because it combines features of both top-down and bottom-up modelling:
the top-down component consists of an inter-temporal optimal growth model in which the
8
energy input of the aggregate production function has been integrated into a bottom-up like
description of the energy sector. WITCH’s top-down framework guarantees a coherent, fully
intertemporal allocation of investments, including those in the energy sector.
World countries are aggregated in twelve regions on the basis of geographic, economic and
technological vicinity. The regions interact strategically on global externalities: GHGs,
technological spillovers, a common pool of exhaustible natural resources.6
WITCH contains a representation of the energy sector, which allows the model to produce a
reasonable characterization of future energy and technological scenarios and an assessment of
their compatibility with the goal of stabilizing greenhouse gases concentrations. In addition, by
endogenously modelling fuel prices (oil, coal, natural gas, uranium), as well as the cost of
storing the CO2 captured, the model can be used to evaluate the implication of mitigation
policies on the energy system in all its components.
In WITCH emissions arise from fossil fuels used in the energy sector and from land use changes
that release carbon sequestered in biomasses and soils. Emissions of CH4, N2O, SLF (short-lived
fluorinated gases), LLF (long-lived fluorinated) and SO2 aerosols, which have a cooling effect
on temperature, are also identified. Since most of these gases arise from agricultural practices,
the modelling relies on estimates for reference emissions, and a top-down approach for
mitigation supply curves.7
A climate module governs the accumulation of emissions in the atmosphere and the temperature
response to growing GHGs concentrations. WITCH is also equipped with a damage function
that provides the feedback on the economy of global warming. However, in this study we
exclude the damage function and we take the so-called “cost-minimization” approach: given a
target in terms of GHGs concentrations in the atmosphere, we produce scenarios that minimize
the cost of achieving this target.
Endogenous technological dynamics are a key feature of WITCH. Dedicated R&D investments
increase the knowledge stock that governs energy efficiency. Learning-by-doing curves are used
6 The regions are USA, WEURO (Western Europe), EEURO (Eastern Europe), KOSAU (South Korea, South Africa and Australia), CAJANZ (Canada, Japan and New Zealand), TE (Transition Economies), MENA (Middle East and South Africa), SSA (Sub-Saharan Africa), SASIA (South Asia), SEASIA (South-East Asia), CHINA, LACA (Latin America and the Caribbean). 7 Reducing emissions from deforestation and degradation (REDD) is estimated to offer sizeable low-cost abatement potential. WITCH includes a baseline projection of land use CO2 emissions, as well as estimates of the global potential and costs for reducing emissions from deforestation, assuming that all tropical forest nations can join an emission trading system and have the capacity to implement REDD
9
to model cost dynamics for wind and solar power capital costs. Both energy-efficiency R&D
and learning exhibit international spillovers. Two backstop technologies – one in the electricity
sector and the other in the non-electricity sector – necessitate dedicated innovation investments
to become competitive. In line with the most recent literature, the costs of these backstop
technologies are modelled through a so-called two-factor learning curve, in which their price
declines both with investments in dedicated R&D and with technology diffusion.
The base year for calibration is 2005; all monetary values are in constant 2005 USD. The
WITCH model uses market exchange rates for international income comparisons.
3. Super-Grids: Major Characteristics and Modelling Assumptions
This paper considers the production of solar thermal power focusing on parabolic trough power
plants. Such power plants are characterised by arrays of parabolic reflectors that concentrate
incident solar radiation on to an absorber, positioned in the focal line of the concentrator,
converting it into thermal energy which is then used to generate superheated steam for the
turbine (Richter et al. 2009). More specifically, we consider collectors that are able to track the
sun diurnal course by means of a single-axis system and to store the equivalent of seven hours
of production at the nominal plant capacity.
Power production with this kind of technology is strongly influenced by solar irradiance and
atmospheric conditions. Solar thermal power, in fact, employs only direct sunlight, therefore it
is best positioned in areas, such as deserts, steppe or savannas, without large amounts of
humidity, fumes or dust that may deviate the sunbeams (Richter et al. 2009).
For these reasons, this paper focuses on desert areas with high values of Direct Normal
Irradiation8 that are found in the MENA region9, in the north of China and the South-West of
the United States (Richter et al. 2009; Trieb 2009b; IEA 2010c). In this version of the model,
the geographic location of the power plants can not be endogenously chosen. Production is
modelled as if positioned in one unique point characterized by the average regional conditions.
programs. However, avoided deforestation is not a source of emissions reductions in the version of the model that we used for this study. 8 Direct Normal Irradiation (DNI) is the amount of solar radiation received per unit area by a surface that is always oriented perpendicular (or normal) to the sun rays. It is usually expressed in kWh/m2 over a period of time. 9 Sand storms seem not be a major problem for CSP power plants in the Sahara desert as they are rare. In addition, for power plants that have thermal storage, electricity generation can continue even when the mirrors are protected to avoid damage from the storms.
10
The choice of the production locations – characterised by high and stable levels of irradiance –
and the inclusion of power plants equipped with integrated thermal storage allows us to target,
at least partly, the problem of intermittency of solar power.
The infrastructure that enables the trade of solar electricity from MENA to Europe or to transfer
the CSP electricity within China or the USA – that is High Voltage Direct Current (HVDC)
cables and conversion stations – is costly and it is not adjustable in size, therefore in order for a
SG to be implemented there is the need for a significant and stable demand of such product. As
results will show, this is not a major modelling problem.
The main problematic issue is related to the high investment costs, thus we need to evaluate the
economic convenience to invest in this technology that will ultimately determine its success. To
do so, different scenarios with and without this option will be analysed and compared to assess
the economic and environmental potential effects of this option.
In addition, for the MENA–Europe case where trade is allowed, strong security of supply and
geopolitical issues arise, especially as this market involves two regions at different levels of
development and therefore more complex considerations, above the economic ones, are
involved.
3.1. Modelling Assumptions: Supply
The SG is considered as an add-on to the existing regional power system networks that enables
their connection. The costs related to modifications to the previous infrastructure that may need
to be implemented in order to manage and distribute such electricity at the low voltage level are
not considered.
National power grids are dynamic structures that have a “history”, tied with economic,
technological and social preferences, that strongly determines their evolution. Although it is
difficult to account for such issues, the WITCH model considers that these systems are not able
to take on any “shape” in little time, but need time in order to evolve, as investments in power
generation or transmission are long-lived. In this direction, the use of a constant-elasticity
function (CES) makes moving away from an established and differentiated energy mix costly.
The model starting values for each region are calibrated on the real situation at 2005 (Bosetti et
al. 2007a).
First of all, we introduce the possibility to produce solar thermal electricity. Electricity
generated with CSP can be consumed domestically or it can be exported. Regions in which solar

11
irradiance is low and the opportunity cost of land is relatively high, can choose to import
electricity from abroad by exploiting the new technological options that allow transmission over
long distances with low losses.
The amount of CSP electricity (ELCSP,prod) supplied to the grid of each region n is determined
combining in fixed proportions: (i) the generation capacity accumulated in each region (KCSP,n),
measured in power units, corrected through an efficiency coefficient (plant utilization rate)
µCSP,n, that indicates the number of yearly full load hours that a concentrating solar power plant
in the specific region may provide; (ii ) CSP plants operation and maintenance (O&MCSP,n),
measured in 2005 USD, converted into energy units by θCSP; (iii ) the capacity of the SG (Kgrid,n)
to transmit electricity from remote areas to the local grid, measured in power units, with its
efficiency coefficient µgrid,n; and (iv) operation and maintenance for the SG (O&Mgrid,n),
measured in 2005 USD, converted into energy units by θgrid. The production function of CSP
electricity is synthetically represented by the following Leontief function:
),(),(),(),(),( ;;;min ,,, tntntntntn gridgridgridngridCSPCSPCSPnCSPprodCSP O&MKO&MKEL θµθµ= . (1)
Power generation capacity in CSP accumulates as it follows:
),(
),(),()1,( )1(
tn
tntntn
CSP
CSPCSPCSPCSP SC
IKK +−=+ δ ; (2)
where ),( tnCSPI represents the investments in concentrated solar power plants made by region n
at time t, CSPδ the CSP capital depreciation rate, and SCCSP the unit investment cost of
installing CSP generation capacity.
Investment costs follow a one-factor learning curve depending on cumulative10 world capacity
in CSP power plants (TK) and decrease as experience/technology diffusion increases. To take
into account the limited expansion possibilities at each time step – due to supply restrictions on
intermediate goods – unit costs also increase with investments in the same period and region:
( ) ( )( )( )
++
+=+−
γ
α
β1,
1,
1)()(
,1,)(
00
tnSC
tnI
tTK
tTKtnSCtnSC CSP
CSP
CSPCSP (3)
10 The cumulative capacity is calculated aggregating – at each time step – installed capacity of all regions, gross of depletion.
12
The investment costs in the SG infrastructure have not been simply modelled as higher
investment costs for the production of the solar thermal electricity for export, as they are not
perfectly proportional to the amount of electricity exported but are instead directly related to the
SG maximum capacity. Moreover, a separate formulation would enable to analyze the SG as an
electricity vector and therefore to test the effects of exporting electricity generated from
different energy sources.
Theoretically, SG investments should not be modelled as a continuous function with respect to
quantity. There is, indeed, a minimum amount of investments necessary to allow for the
transmission between the two regions or two distant areas of the same region. Though, our
simulations show that a continuous modelling of SG investments is not affected by this
constraint as solar power demand is large enough to imply sufficient grid investments from the
very beginning of its production. Therefore, we model investments (Igrid,n) and capital in the SG
infrastructure similarly to those for other technologies:
),(
),(),()1,( )1(
tn
tntntn
grid
gridgridgridgrid SC
IKK +−=+ δ . (4)
If investments in transmission infrastructure – i.e. the SG – are sufficient to cover the distance
between the networks of two regions, the electricity from CSP power plants can also be
exported. The production function for exported CSP electricity differs from the production
function of CSP electricity consumed domestically only for different grid requirements:
),(),(),(),(),( ,,,,, &;;&;min tntntntntn XgridgridXgridXnCSPCSPCSPCSPnXCSP MOKMOKEL θµθµ= , (5)
where the index X stands for exports. Therefore, electricity from CSP produced in region n at
time t must be equal to domestic production plus exports:
),(),(),( ,, tnELtntnEL XCSPCSPprodCSP EL += , (6)
with 0),(, <tnEL XCSP in importing regions and 0),(, =tnEL XCSP in regions that are not connected
to an international electricity grid.
Investments in CSP generation and in the SG infrastructure together with the O&M costs enter
the budget constraint:
),(),(),(),(),(),(),(),( && tntntntntntntntn gridCSPgridCSPw
wwc MOMOIIZpIYC −−−−−= −∑ , (7)

13
where Y is net output of the economy, Ic is the investment in the final good sector, ∑w
ww tnZp ),(
is the expenditure for investments in the energy sector, in R&D and other expenses that are
detailed in Appendix A.
3.2. Modelling Assumptions: Demand
In the model, electric power use (EL) is an aggregate of electricity generated by the various
sources, combined using a CES function:
( ) ( )[ ]),(),(, 2 tnELntnELtnEL HYDROHYDROα+= ; (8)
( ) ( ) ( ) ( )[ ] 2222
/1&&2 ),(),(),(, ELELELEL tnELntnELntnFFntnEL SWSWNUKENUKEFF
ρρρρ ααα ++= ; (9)
( ) [ ]),(),(, tnELtnELtnEL BACKSTOPNUCLEARNUKE += ; (10)
( ) ( ) ( ) ( )[ ] FFFFFFFF tnELntnELntnELntnFF GASGASOILOILCOALCOAL
ρρρρ ααα/1
),(),(),(, ++= ; (11)
( ) [ ]),(),(, tnELtnELtnEL IGCCPCCOAL += . (12)
All of the above quantities are endogenously determined in the optimization process except for
hydroelectric power that is exogenous.
In our simulations, electricity from CSP power will enter various nodes depending on the
region. Section 4 will give a more detailed description of the various assumptions. For further
details on the structure of the model see Bosetti et al. (2007a).
3.3. Electricity Trade
The equilibrium of the international market of CSP electricity requires that demand and supply
are equal for each time period:
∑ ∀=n
ttnXCSPEL 0),(, . (13)
The market clearing price (PCSP) is the price that will determine the trade flows. The revenue
(expenditure) for CSP electricity is added (subtracted) from the regional output (Y):
( )( ) ( ) )(,
,,
),(),( , tPELtnVptn
tnGYY CSPXCSP
qqq tntn +−
Ω= ∑
, (14)
14
where GY is gross output, Ω the damage function11 and ( )∑q
qq tnVp , the sum of expenditures,
as better detailed in Appendix A.
4. Calibration
Economic data on solar thermal power plants are taken from Kaltschmitt et al. (2007). More
precisely, we consider parabolic trough power plants, with nominal capacity of 50MW each,
100% solar share and equipped with integrated thermal storage units for 7 hours. The latter
characteristic helps to deal with the intermittency issues of solar power.
The overall investment costs for such power plants are estimated at 260 million euro, while the
operation and maintenance costs amount to approximately 5.1 million euro per year. The data
refer to state-of-the-art technology and to installations in a geographic area with a high share of
direct radiation (Kaltschmitt et al. 2007). These investment costs are also in line with those
expected from the latest Californian development project: the Blythe Solar Power Project
(Streater 2010).
Parabolic trough power plants are one of the solar thermal technologies for which more is
known about the real market costs as some installations have already been built. Existing plants
include the SEGS plants in California, Nevada One in Nevada and the Andasol Plants in Spain.
Installed capacity in 2009 was 500 MW, while under-construction or proposed capacity
currently exceeds ten thousand MW (Richter et al. 2009). We have modelled a learning by
doing effect with a progress ratio of 90% as suggested in Neij (2008) and IEA (2010c). This
means that investments costs are reduced by 10% at every doubling of the installed capacity.
Estimates in the literature vary from 85% to 92% (Enermodal Engineering Limited 1999; IEA
2003, 2010c; Kearney 2003; Neij 2008).
Data on Direct Normal Irradiation (DNI) are taken from the U.S. National Renewable Energy
Laboratory (NREL) estimates available from the NASA Atmospheric Science Data Center. This
dataset uses NREL’s Climatological Solar Radiation (CSR) Model which accounts for cloud
cover, atmospheric water vapor, trace gases, and aerosol in calculating the insolation with
measurements checked against ground stations where available.
11 Note that, as discussed in Section 2, in this work we do not include the damage function as we take a cost-minimization approach.
15
For MENA, we consider delocalised production in different sites in the Sahara Desert region as
currently discussed (Trieb 2006; Trieb and Müller-Steinhagen 2007); for China we have chosen
the Tibet area around the city of Xigaze, as one of the options described in Chien (2009), and
for the USA we consider production in Arizona, around Phoenix, as it would be the most
productive part of the country.
The number of full load hours of operation per year of the reference plant in the various regions
is taken from Trieb (2009b). Such value for MENA is also available in Kaltschmitt et al.
(2007).
For what concerns the Super-Grid infrastructure that should transmit the CSP power,
connections lines in the order of thousands of km have been assumed. We consider High
Voltage Direct Current (HVDC) cables that connect two AC-DC converter stations.
Transmission power losses are in the range of 3% for 1000 Km, while HVDC terminal losses
are 0.6% per inlet or outlet station (May 2005). Power transmission over distances of 3000 Km
entail transmission losses around 10%, while high voltage alternating current (HVAC) cables
would cause power losses of around 20% and higher investment costs (Breyer and Knies 2009).
Estimates of investment costs for such infrastructure vary in the literature and depending on the
characteristics of the cables: voltage, power capacity and overhead/submarine. We consider
cables with 5GW of power capacity and +/- 800 kV voltage, and costs have been extrapolated
from May (2005) and Trieb (2006). The adaptation of the values presented in the latter papers
to our conditions has led us to use the estimates presented in Table 1.
For the Europe-MENA interconnection we assume a connecting power line of 3000 Km as in
Czisch (2004), Trieb (2006), and Bauer et al. (2009). More specifically, we consider connection
lines of overhead and submarine cables in the ratio of ¾ and ¼ respectively. Such lines would
allow the connection of the most northern parts of the Sahara with Scandinavia or more inland
areas with the centre of Europe, considered to be Strasbourg. For China we consider overhead
transmission lines in the order of 2800 Km, calculated as the average between the distances of
Xigaze from three of the major industrial centres: Beijing, Shanghai and Guangzhou. For the
USA, we assume the transmission of the electricity generated to be split in half between the
West Coast and the East Coast. Considering Phoenix, Los Angeles and New York as reference
points this entails overhead transmission lines of 577 and 3447 km respectively.

16
RegionProduction Location
DNIFull load
hoursInvest. Cost
CSPO&MCSP SG lenght
Invest. Cost SG
O&Mgrid
(-) (kWh/m2/year) (h) ($/kW) ($/kW) (km) ($/kW) ($/kW)
CHINA Tibet (Xigaze) 2300 4110 6500 127.5 2800 329 6.6
MENA Sahara Desert 2190 3680 6500 127.5 3000 336 6.7
USAArizona (Phoenix) 2600 4600 6500 127.5 577 and 3447 277 5.5
Table 1. Parameter assumptions overview
In this first analysis of the impacts of Super-Grids, we have focused on the Europe-MENA case
as investment projects and financing options are already taking shape (Trieb and Müller-
Steinhagen 2007). We have then added the cases of China and the USA as they are the largest
emitters of GHGs and include in their territory highly productive areas for CSP electricity.
Domestic SGs have been considered as such electricity markets are likely to remain closed in
the next decades. Future work will include Australia, Brasil and Indonesia as these are the other
world regions with the most potential for CSP production (Trieb 2009-b).
In our simulations, CSP electricity directly substitutes electricity from Oil and Gas in MENA, as
these are its major power generation sources (ELCSP,oil and ELCSP,gas are added to equation 11).
( )( ) ( )( )( )( )
FF
FF
FFFF
tnELtnELn
tnELtnELntnELntnFF
gasCSPGASGAS
oilCSPOILOILCOALCOAL
ρ
ρ
ρρ
α
αα/1
,
,
),(),(
),(),(),(,
++
+++= (11bis)
For all other regions, CSP electricity enters in direct competition with nuclear power (ELcsp is
added to the right-hand side of equation 10) and IGCC power with CCS (ELcsp is added to the
right-hand side of equation 12) as these, together with renewable sources, are the most
promising options to target Climate Change. It is interesting to study these two technologies
also because their expansion may be limited by issues of public acceptability.
( ) [ ]),(),(),(, , tnELtnELtnELtnEL nukeCSPBACKSTOPNUCLEARNUKE ++= ; (10bis)
( ) [ ]),(),(),(, , tnELtnELtnELtnEL ccsCSPIGCCPCCOAL ++= . (12bis)
We model CSP as if it was the backstop technology taking shape. All regions without the CSP
option still have the classic formulation of a generic electric backstop technology.
A sensitivity analysis of the key parameters is reported in Section 8.
17
5. Simulation Results
To analyze the potential economic and environmental effects that the introduction of a CSP
powered Super-Grid – among the options to reduce the electricity sector’s carbon footprint –
may have, we have modelled and analyzed different potential climate stabilization policies
and/or technological evolution scenarios. More precisely, we analyze a “business as usual”
scenario where no climate policy is in place and therefore there is no market value attached to
CO2 emissions and four different stabilization scenarios where instead a global climate policy is
enacted, imposing a limit on greenhouse gas emissions.
The policy tool considered is a world carbon market in which carbon allowances can be traded
among regions without limits. The allocation of carbon permits follows a “Contraction and
Convergence” rule, which assigns global emissions targets to each region, initially in proportion
to current emissions and then, progressively, in proportion to each region’s population, with the
aim of reaching similar per-capita emissions by the end of the century. To be able to achieve
such emission targets, the twelve regions of the model have the possibility of undertaking the
following actions: (i) reduce consumption of energy; (ii ) change energy mix; (iii ) trade emission
permits; (iv) reduce emissions from LULUCF and emissions of non-CO2 gasses.
More in detail, the scenarios analysed are:
• Business as usual: i.e. no climate policy and therefore no restriction on GHG
emissions (indicated as “Bau”), however energy efficiency and other technological
options can be implemented for domestic concerns;
• Unconstrained Stabilization. GHG atmospheric concentration needs to be stabilized
at 535 ppm CO2 equivalent by 2100 (indicated as “U-Stab”);
• Constrained Stabilization with limit on Nuclear Power. U-Stab + constraint on the
expansion of Nuclear Power that cannot exceed 2005 levels (indicated as “NC-Stab”);
• Constrained Stabilization with limit on CCS. U-Stab + no possibility of executing
Carbon Capture and Storage (CCS) operations (indicated as “CC-Stab”);
• Constrained Stabilization with penetration limits on Nuclear power and CCS. U-
Stab + NC-Stab + CC-Stab (indicated as “NCC-Stab”).
The choice of the constrained scenarios relates to the discussion on nuclear power and CCS
operations detailed in Section 1. Other studies (ECF 2010, PricewaterhouseCoopers 2010) also
include scenarios with no CCS nor nuclear power expansion.
All of the above scenarios include the possibility for the USA, China and MENA to produce and
domestically consume CSP electricity and for Western and Eastern Europe to import from
18
MENA. Moreover, all scenarios include a constraint on domestic renewable sources: regional
Wind and Solar electricity generation cannot exceed 25% of the total regional generation. This
is due to the incapability of current power systems to manage large percentages of intermittent
electricity sources.12
In addition to these different climate policy scenarios, we also simulate all the corresponding
cases without the possibility to produce or trade CSP power to use as counter-factuals and
evaluate the effects of the introduction of the CSP powered Super-Grid (the latter are indicated
as “policy_name- without CSP” in the graphs).
One of the main interests of this work is to evaluate the economic convenience of the Super-
Grid with CSP-power option. Indeed, we have allowed three regions to produce CSP power and
transmit it over long distances. Our results show that it is optimal to invest in such technology
under various scenarios. In particular, we find that for MENA CSP is not only a valid mitigation
strategy, but it is also an economically viable generation technology even in the absence of
climate policies. For the USA and China this is true only if we insert penetration limits to other
zero-carbon technologies such as nuclear.
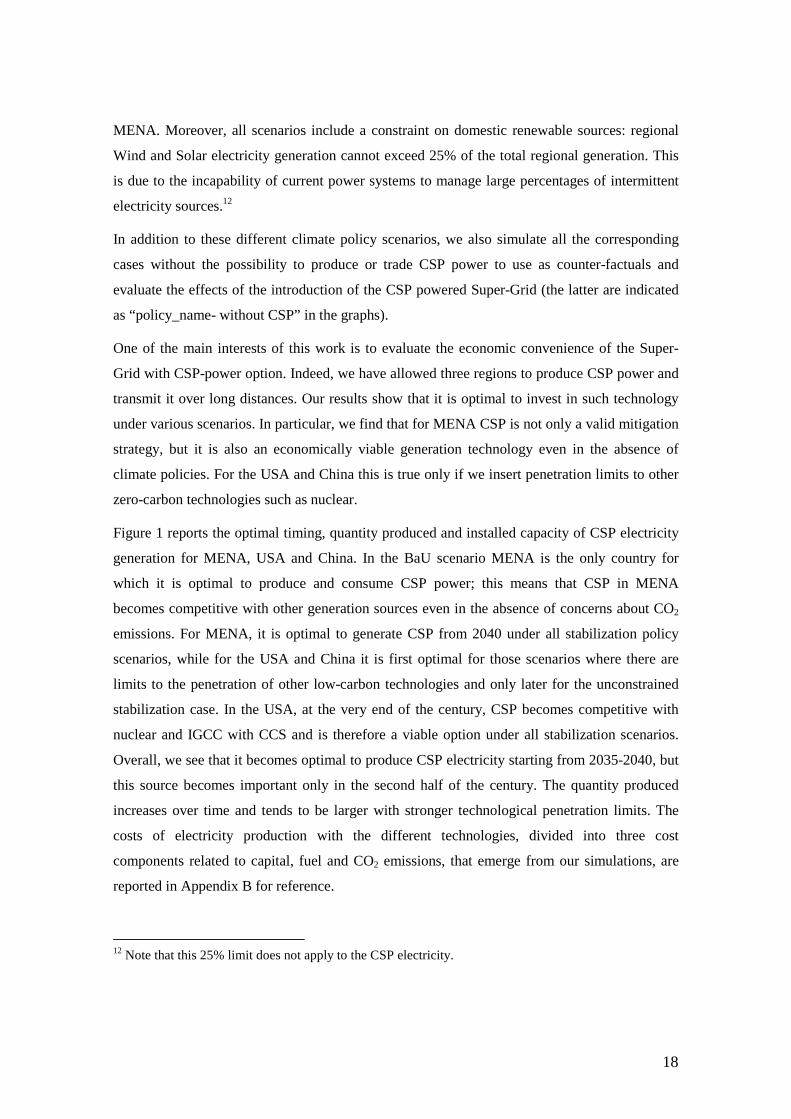
Figure 1 reports the optimal timing, quantity produced and installed capacity of CSP electricity
generation for MENA, USA and China. In the BaU scenario MENA is the only country for
which it is optimal to produce and consume CSP power; this means that CSP in MENA
becomes competitive with other generation sources even in the absence of concerns about CO2
emissions. For MENA, it is optimal to generate CSP from 2040 under all stabilization policy
scenarios, while for the USA and China it is first optimal for those scenarios where there are
limits to the penetration of other low-carbon technologies and only later for the unconstrained
stabilization case. In the USA, at the very end of the century, CSP becomes competitive with
nuclear and IGCC with CCS and is therefore a viable option under all stabilization scenarios.
Overall, we see that it becomes optimal to produce CSP electricity starting from 2035-2040, but
this source becomes important only in the second half of the century. The quantity produced
increases over time and tends to be larger with stronger technological penetration limits. The
costs of electricity production with the different technologies, divided into three cost
components related to capital, fuel and CO2 emissions, that emerge from our simulations, are
reported in Appendix B for reference.
12 Note that this 25% limit does not apply to the CSP electricity.

19
MENA
0
2000
4000
6000
8000
10000
2040 2045 2050 2055 2060 2065 2070 2075 2080 2085 2090 2095 2100
TW
h
0
500
1000
1500
2000
2500
GW
Bau U-Stab NC-Stab CC-Stab NCC-Stab
USA
0
2000
4000
6000
8000
10000
2040 2045 2050 2055 2060 2065 2070 2075 2080 2085 2090 2095 2100
TW
h
0
500
1000
1500
2000
2500
GW
Bau U-Stab NC-Stab CC-Stab NCC-Stab
China
0
2000
4000
6000
8000
10000
2040 2045 2050 2055 2060 2065 2070 2075 2080 2085 2090 2095 2100
TW
h
0
500
1000
1500
2000
2500
GW
Bau U-Stab NC-Stab CC-Stab NCC-Stab
Notes: Bau = Business as usual; U-Stab = unconstrained stabilization; NC-Stab = constrained stabilization with cap on nuclear; CC-Stab = constrained stabilization with no CCS; NCC-Stab = constrained stabilization with cap on nuclear and no CCS.
Figure 1. CSP Installed Capacity and Electricity Generation

20
0
100200
300
400500
600
700
800900
1000
2040 2045 2050 2055 2060 2065 2070 2075 2080 2085 2090 2095 2100
GW
U-Stab NC-Stab CC-Stab NCC-Stab
Notes: Bau = Business as usual; U-Stab = unconstrained stabilization; NC-Stab = constrained stabilization with cap on nuclear; CC-Stab = constrained stabilization with no CCS; NCC-Stab = constrained stabilization with cap on nuclear and no CCS. Figure 2. Super-Grid Installed Capacity – Europe-MENA
In absolute terms, China is the region with the largest production of CSP electricity, followed
closely by the USA. This is explained by the size of the Chinese economy, which reaches the
USA at the end of the century in our BaU scenario. Recall that the total quantity produced by
MENA shown in Figure 1 includes both domestic consumption and export to Europe.
Moreover, simulations show that the unconstrained stabilization converges to the stabilization
with no IGCC power with CCS and that the stabilization with limited nuclear power production
tends to the stabilization with both penetration limits; this is due to the fact that the importance
of CCS in the electricity mix decreases towards the end of the century. This technological
option is not completely carbon-free (the capture rate is assumed to be 90% in line with current
technological predictions), and towards the end of the century the residual 10% of GHG
emissions becomes significant. Notice though, that, domestic consumption of CSP for MENA is
not very sensitive to the different policy scenarios (Figure 1); the differences that can be seen in
Figure 1 mostly depend on the import demand from Europe.
Figure 2 shows the installed capacity of Super-Grid infrastructure for MENA that allows the
export of CSP electricity to Europe. The sensitivity of import demand with respect to the
different policy scenarios is evident. For the USA and China the installed capacity of Super-
Grid is equal to the CSP capacity shown in Figure 1.
Figure 3 reports the paths of investments that are necessary for building the CSP and SG
capacities depicted in the previous Figures. Similar trends of convergence between scenarios
can be identified. Notice also that while capacity presents a clear increasing trend until the end

21
of the century, investment costs follow a very different trend highlighting the strong
Learning-by-Doing effect of technology diffusion.
In all cases, the investments needed for the construction of the Super-Grid infrastructure are
significantly lower than those for the generation power plants and range between 1-9% of the
total investment costs for MENA, 5-15% for the USA.13 Their share increases over time as we
have assumed non decreasing investment costs for the Super-Grid infrastructure.
The cost paths depicted in the left panel of Figure 4 represent the weighted average of the costs
across regions14 that we obtain for the four policy scenarios. The main decreasing trend is
induced by world cumulative capacity that is quite sensitive to the policy scenario. There are
some differences in the regional investment costs due to the component of the investment cost
that mimics short term frictions (see Eq. 3).
Our results also show that investment projects in a Mediterranean SG that connects the power
networks of MENA and Europe are optimal under certain scenario conditions. Figure 5 shows
how the total CSP electricity generated by MENA is divided between domestic consumption
and exports to Western and Eastern Europe, under the different policy scenarios considered.
Indeed, the graph shows that: (i) most of the electricity produced is for domestic consumption,
and (ii ) that a market for this electricity and its transmission over long distances does arise.
More in detail, it results optimal to invest in such trade projects only in the presence of a
stabilization policy and mainly in the second half of the century. We will discuss with greater
detail the optimal timing of investments in Section 6.
The later and lower consumption of CSP electricity by the European regions, compared to the
other regions is related to the lower solar intensity considered for MENA and to the fact that for
Western and Eastern Europe the import of CSP electricity constitutes a net loss and not an
expenditure that induces positive effects on other sectors of the domestic economy.
Both domestic consumption and exports increase over time, but exports seem to be more
sensitive to the various policy cases. This is mainly due to the fact that MENA has low levels of
generation with both nuclear and IGCC with CCS power plants. Differences in production for
domestic consumption by MENA depend on the varying investment costs associated with
installed capacity at the world level.
13 Investments needed to build CSP capacity and the super-grid in China are similar to those needed in the USA. 14 This is the average of the regional costs weighted by the amount of production of the region.

22
MENA
0
50
100
150
200
250
300
350U
-Sta
b
NC
-Sta
b
CC
-Sta
b
NC
C-S
tab
U-S
tab
NC
-Sta
b
CC
-Sta
bN
CC
-Sta
b
U-S
tab
NC
-Sta
b
CC
-Sta
bN
CC
-Sta
b
U-S
tab
NC
-Sta
b
CC
-Sta
bN
CC
-Sta
b
2040 2060 2080 2100
Bill
ion
$
Power plants Grid
USA
0
50
100
150
200
250
300
350
U-S
tab
NC
-Sta
b
CC
-Sta
bN
CC
-Sta
b
U-S
tab
NC
-Sta
bC
C-S
tab
NC
C-S
tab
U-S
tab
NC
-Sta
bC
C-S
tab
NC
C-S
tab
U-S
tab
NC
-Sta
b
CC
-Sta
bN
CC
-Sta
b
2040 2060 2080 2100
Bill
ion
$
Power plants Grid Notes: Bau = Business as usual; U-Stab = unconstrained stabilization; NC-Stab = constrained stabilization with cap on nuclear; CC-Stab = constrained stabilization with no CCS; NCC-Stab = constrained stabilization with cap on nuclear and no CCS.
Figure 3. Investments for CSP-Plants and the Super-Grid Infrastructure – MENA and the USA
CSP Investment costs
1000
2000
3000
4000
5000
6000
7000
2030
2035
2040
2045
2050
2055
2060
2065
2070
2075
2080
2085
2090
2095
2100
$/kW
U-Stab NC-Stab CC-Stab NCC-Stab
Market price for CSP electricity tradedbetween the EU and MENA
0
5
10
15
20
25
30
35
2040
2045
2050
2055
2060
2065
2070
2075
2080
2085
2090
2095
2100
c$/K
Wh
U-Stab NC-Stab CC-Stab NCC-Stab Figure 4. CSP Investment Cost and Market Price for CSP Electricity Trade Between the EU and MENA
0
1000
2000
3000
4000
5000
6000
7000
8000
Bau
U-S
tab
NC
-Sta
bC
C-S
tab
NC
C-S
tab
Bau
U-S
tab
NC
-Sta
bC
C-S
tab
NC
C-S
tab
Bau
U-S
tab
NC
-Sta
bC
C-S
tab
NC
C-S
tab
Bau
U-S
tab
NC
-Sta
bC
C-S
tab
NC
C-S
tab
Bau
U-S
tab
NC
-Sta
bC
C-S
tab
NC
C-S
tab
Bau
U-S
tab
NC
-Sta
bC
C-S
tab
NC
C-S
tab
Bau
U-S
tab
NC
-Sta
bC
C-S
tab
NC
C-S
tab
2040 2050 2060 2070 2080 2090 2100
TW
h
MENA domestic use Western Europe Eastern Europe
Figure 5. Distribution of CSP Power Produced by MENA.
23
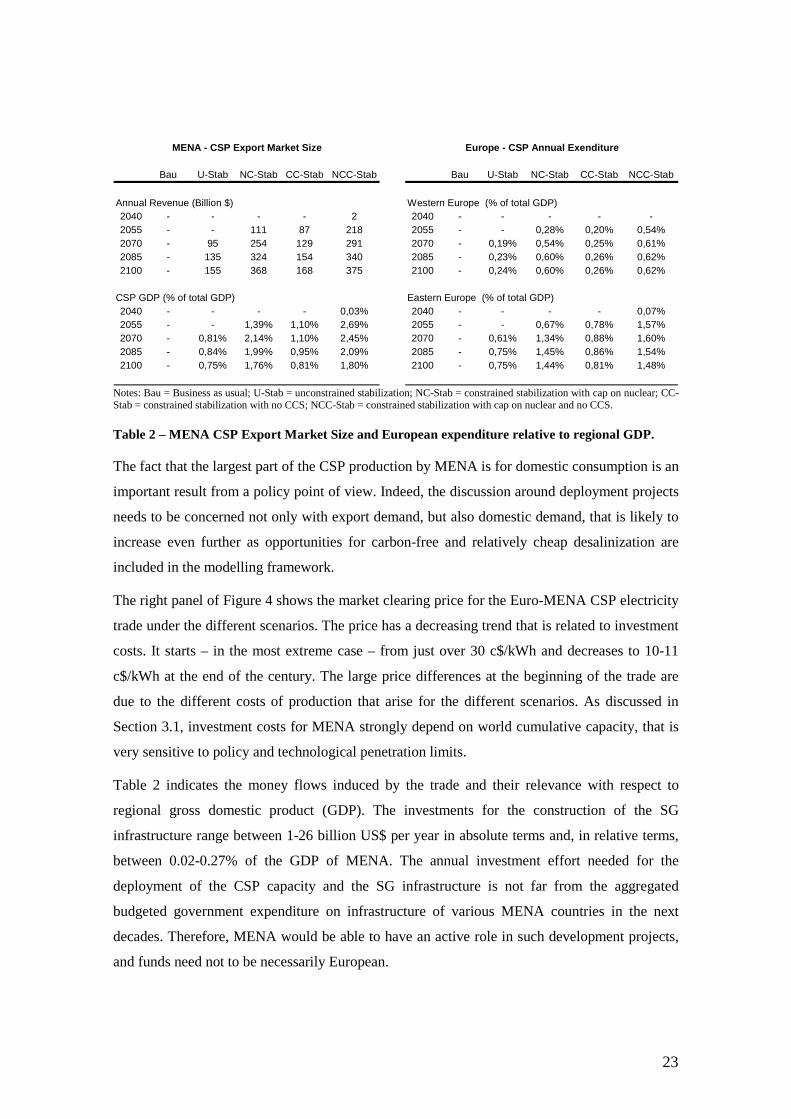
Bau U-Stab NC-Stab CC-Stab NCC-Stab Bau U-Stab NC-Stab CC-Stab NCC-Stab
Annual Revenue (Billion $) Western Europe (% of total GDP)2040 - - - - 2 2040 - - - - -2055 - - 111 87 218 2055 - - 0,28% 0,20% 0,54%2070 - 95 254 129 291 2070 - 0,19% 0,54% 0,25% 0,61%2085 - 135 324 154 340 2085 - 0,23% 0,60% 0,26% 0,62%2100 - 155 368 168 375 2100 - 0,24% 0,60% 0,26% 0,62%
CSP GDP (% of total GDP) Eastern Europe (% of total GDP)2040 - - - - 0,03% 2040 - - - - 0,07%2055 - - 1,39% 1,10% 2,69% 2055 - - 0,67% 0,78% 1,57%2070 - 0,81% 2,14% 1,10% 2,45% 2070 - 0,61% 1,34% 0,88% 1,60%2085 - 0,84% 1,99% 0,95% 2,09% 2085 - 0,75% 1,45% 0,86% 1,54%2100 - 0,75% 1,76% 0,81% 1,80% 2100 - 0,75% 1,44% 0,81% 1,48%
MENA - CSP Export Market Size Europe - CSP Annual Exenditure
Notes: Bau = Business as usual; U-Stab = unconstrained stabilization; NC-Stab = constrained stabilization with cap on nuclear; CC-Stab = constrained stabilization with no CCS; NCC-Stab = constrained stabilization with cap on nuclear and no CCS.
Table 2 – MENA CSP Export Market Size and European expenditure relative to regional GDP.
The fact that the largest part of the CSP production by MENA is for domestic consumption is an
important result from a policy point of view. Indeed, the discussion around deployment projects
needs to be concerned not only with export demand, but also domestic demand, that is likely to
increase even further as opportunities for carbon-free and relatively cheap desalinization are
included in the modelling framework.
The right panel of Figure 4 shows the market clearing price for the Euro-MENA CSP electricity
trade under the different scenarios. The price has a decreasing trend that is related to investment
costs. It starts – in the most extreme case – from just over 30 c$/kWh and decreases to 10-11
c$/kWh at the end of the century. The large price differences at the beginning of the trade are
due to the different costs of production that arise for the different scenarios. As discussed in
Section 3.1, investment costs for MENA strongly depend on world cumulative capacity, that is
very sensitive to policy and technological penetration limits.
Table 2 indicates the money flows induced by the trade and their relevance with respect to
regional gross domestic product (GDP). The investments for the construction of the SG
infrastructure range between 1-26 billion US$ per year in absolute terms and, in relative terms,
between 0.02-0.27% of the GDP of MENA. The annual investment effort needed for the
deployment of the CSP capacity and the SG infrastructure is not far from the aggregated
budgeted government expenditure on infrastructure of various MENA countries in the next
decades. Therefore, MENA would be able to have an active role in such development projects,
and funds need not to be necessarily European.

24
Western Europe
0
500
1000
1500
2000
2500
3000
Bau
U-S
tab
NC
-Sta
bC
C-S
tab
NC
C-S
tab
Bau
U-S
tab
NC
-Sta
bC
C-S
tab
NC
C-S
tab
Bau
U-S
tab
NC
-Sta
bC
C-S
tab
NC
C-S
tab
Bau
U-S
tab
NC
-Sta
bC
C-S
tab
NC
C-S
tab
2040 2060 2080 2100
TW
h
ccs nuclear
Eastern Europe
0
200
400
600
800
Bau
U-S
tab
NC
-Sta
bC
C-S
tab
NC
C-S
tab
Bau
U-S
tab
NC
-Sta
bC
C-S
tab
NC
C-S
tab
Bau
U-S
tab
NC
-Sta
bC
C-S
tab
NC
C-S
tab
Bau
U-S
tab
NC
-Sta
bC
C-S
tab
NC
C-S
tab
2040 2060 2080 2100
TW
h
ccs nuclear
USA
0
2000
4000
6000
8000
10000
Ba
uU
-Sta
bN
C-S
tab
CC
-Sta
bN
CC
-Sta
b
Ba
uU
-Sta
bN
C-S
tab
CC
-Sta
bN
CC
-Sta
b
Ba
uU
-Sta
bN
C-S
tab
CC
-Sta
bN
CC
-Sta
b
Ba
uU
-Sta
bN
C-S
tab
CC
-Sta
bN
CC
-Sta
b
2040 2060 2080 2100
TW
h
ccs nuclear
China
0
2000
4000
6000
8000
10000
12000
Bau
U-S
tab
NC
-Sta
bC
C-S
tab
NC
C-S
tab
Bau
U-S
tab
NC
-Sta
bC
C-S
tab
NC
C-S
tab
Bau
U-S
tab
NC
-Sta
bC
C-S
tab
NC
C-S
tab
Bau
U-S
tab
NC
-Sta
bC
C-S
tab
NC
C-S
tab
2040 2060 2080 2100
TW
h
ccs nuclear
MENA
0
1000
2000
3000
4000
5000
Bau
U-S
tab
NC
-Sta
bC
C-S
tab
NC
C-S
tab
Bau
U-S
tab
NC
-Sta
bC
C-S
tab
NC
C-S
tab
Bau
U-S
tab
NC
-Sta
bC
C-S
tab
NC
C-S
tab
Bau
U-S
tab
NC
-Sta
bC
C-S
tab
NC
C-S
tab
2040 2060 2080 2100
TW
h
oil gas
Notes: Bau = Business as usual; U-Stab = unconstrained stabilization; NC-Stab = constrained stabilization with cap on nuclear; CC-Stab = constrained stabilization with no CCS; NCC-Stab = constrained stabilization with cap on nuclear and no CCS.
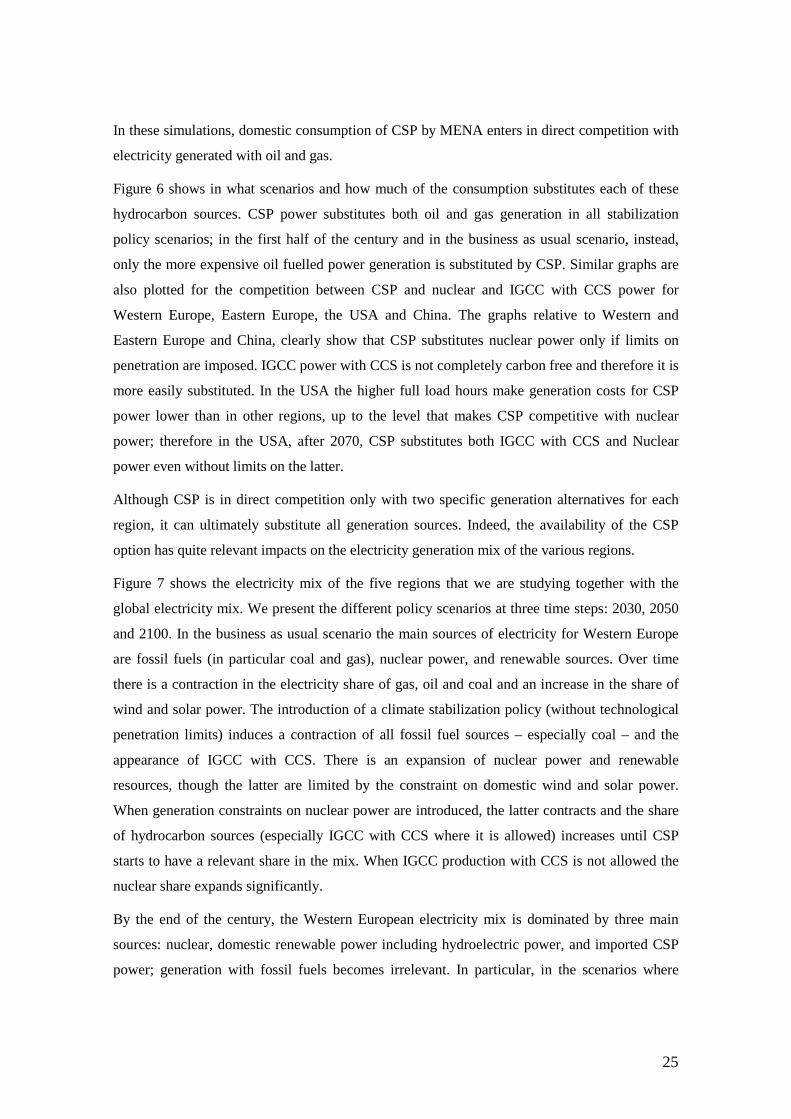
Figure 6. Regional Concentrated Solar Power use
25
In these simulations, domestic consumption of CSP by MENA enters in direct competition with
electricity generated with oil and gas.
Figure 6 shows in what scenarios and how much of the consumption substitutes each of these
hydrocarbon sources. CSP power substitutes both oil and gas generation in all stabilization
policy scenarios; in the first half of the century and in the business as usual scenario, instead,
only the more expensive oil fuelled power generation is substituted by CSP. Similar graphs are
also plotted for the competition between CSP and nuclear and IGCC with CCS power for
Western Europe, Eastern Europe, the USA and China. The graphs relative to Western and
Eastern Europe and China, clearly show that CSP substitutes nuclear power only if limits on
penetration are imposed. IGCC power with CCS is not completely carbon free and therefore it is
more easily substituted. In the USA the higher full load hours make generation costs for CSP
power lower than in other regions, up to the level that makes CSP competitive with nuclear
power; therefore in the USA, after 2070, CSP substitutes both IGCC with CCS and Nuclear
power even without limits on the latter.
Although CSP is in direct competition only with two specific generation alternatives for each
region, it can ultimately substitute all generation sources. Indeed, the availability of the CSP
option has quite relevant impacts on the electricity generation mix of the various regions.
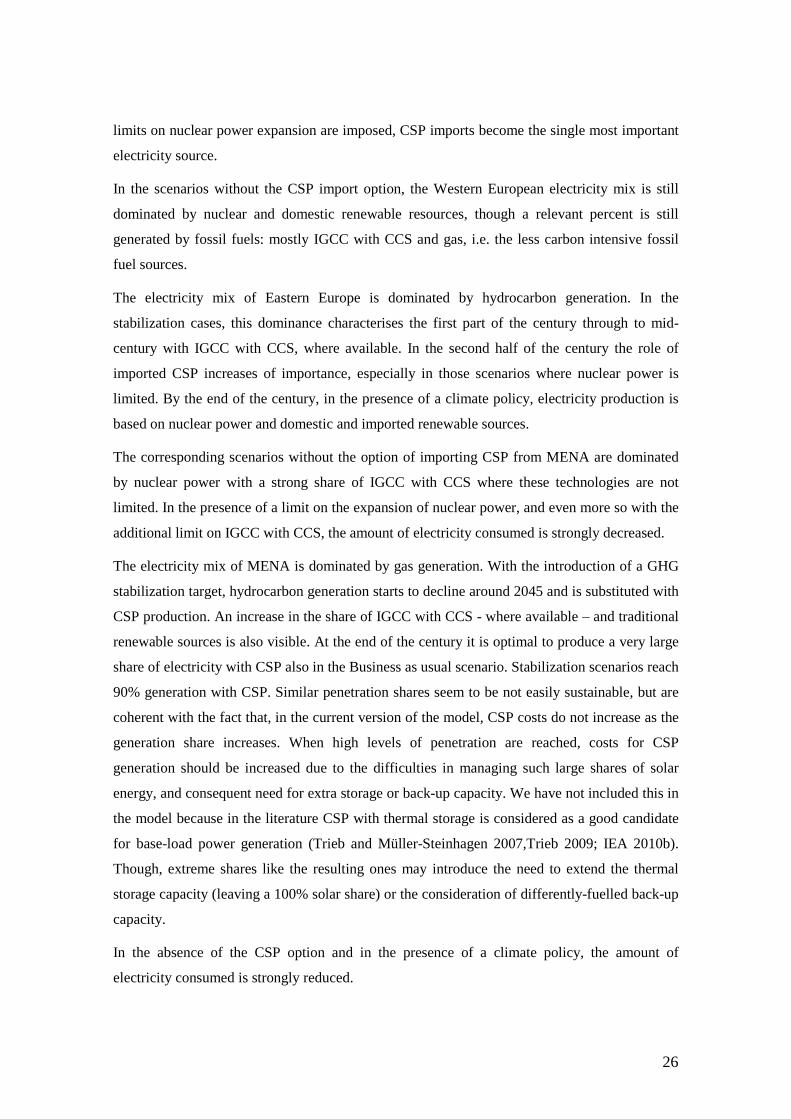
Figure 7 shows the electricity mix of the five regions that we are studying together with the
global electricity mix. We present the different policy scenarios at three time steps: 2030, 2050
and 2100. In the business as usual scenario the main sources of electricity for Western Europe
are fossil fuels (in particular coal and gas), nuclear power, and renewable sources. Over time
there is a contraction in the electricity share of gas, oil and coal and an increase in the share of
wind and solar power. The introduction of a climate stabilization policy (without technological
penetration limits) induces a contraction of all fossil fuel sources – especially coal – and the
appearance of IGCC with CCS. There is an expansion of nuclear power and renewable
resources, though the latter are limited by the constraint on domestic wind and solar power.
When generation constraints on nuclear power are introduced, the latter contracts and the share
of hydrocarbon sources (especially IGCC with CCS where it is allowed) increases until CSP
starts to have a relevant share in the mix. When IGCC production with CCS is not allowed the
nuclear share expands significantly.
By the end of the century, the Western European electricity mix is dominated by three main
sources: nuclear, domestic renewable power including hydroelectric power, and imported CSP
power; generation with fossil fuels becomes irrelevant. In particular, in the scenarios where
26
limits on nuclear power expansion are imposed, CSP imports become the single most important
electricity source.
In the scenarios without the CSP import option, the Western European electricity mix is still
dominated by nuclear and domestic renewable resources, though a relevant percent is still
generated by fossil fuels: mostly IGCC with CCS and gas, i.e. the less carbon intensive fossil
fuel sources.
The electricity mix of Eastern Europe is dominated by hydrocarbon generation. In the
stabilization cases, this dominance characterises the first part of the century through to mid-
century with IGCC with CCS, where available. In the second half of the century the role of
imported CSP increases of importance, especially in those scenarios where nuclear power is
limited. By the end of the century, in the presence of a climate policy, electricity production is
based on nuclear power and domestic and imported renewable sources.
The corresponding scenarios without the option of importing CSP from MENA are dominated
by nuclear power with a strong share of IGCC with CCS where these technologies are not
limited. In the presence of a limit on the expansion of nuclear power, and even more so with the
additional limit on IGCC with CCS, the amount of electricity consumed is strongly decreased.
The electricity mix of MENA is dominated by gas generation. With the introduction of a GHG
stabilization target, hydrocarbon generation starts to decline around 2045 and is substituted with
CSP production. An increase in the share of IGCC with CCS - where available – and traditional
renewable sources is also visible. At the end of the century it is optimal to produce a very large
share of electricity with CSP also in the Business as usual scenario. Stabilization scenarios reach
90% generation with CSP. Similar penetration shares seem to be not easily sustainable, but are
coherent with the fact that, in the current version of the model, CSP costs do not increase as the
generation share increases. When high levels of penetration are reached, costs for CSP
generation should be increased due to the difficulties in managing such large shares of solar
energy, and consequent need for extra storage or back-up capacity. We have not included this in
the model because in the literature CSP with thermal storage is considered as a good candidate
for base-load power generation (Trieb and Müller-Steinhagen 2007,Trieb 2009; IEA 2010b).
Though, extreme shares like the resulting ones may introduce the need to extend the thermal
storage capacity (leaving a 100% solar share) or the consideration of differently-fuelled back-up
capacity.
In the absence of the CSP option and in the presence of a climate policy, the amount of
electricity consumed is strongly reduced.

27
Western Europe
0%
20%
40%
60%
80%
100%
Bau
U-S
tab
NC
-Sta
b
CC
-Sta
b
NC
C-S
tab
Bau
U-S
tab
NC
-Sta
b
CC
-Sta
b
NC
C-S
tab
Bau
U-S
tab
NC
-Sta
b
CC
-Sta
b
NC
C-S
tab
2030 2050 2100
COAL PC COAL IGCC OIL GASNUKE HYDRO W&S CSP
Eastern Europe
0%
20%
40%
60%
80%
100%
Bau
U-S
tab
NC
-Sta
b
CC
-Sta
b
NC
C-S
tab
Bau
U-S
tab
NC
-Sta
b
CC
-Sta
b
NC
C-S
tab
Bau
U-S
tab
NC
-Sta
b
CC
-Sta
b
NC
C-S
tab
2030 2050 2100
COAL PC COAL IGCC OIL GASNUKE HYDRO W&S CSP
Middle East and North Africa
0%
20%
40%
60%
80%
100%
Bau
U-S
tab
NC
-Sta
b
CC
-Sta
b
NC
C-S
tab
Bau
U-S
tab
NC
-Sta
b
CC
-Sta
b
NC
C-S
tab
Bau
U-S
tab
NC
-Sta
b
CC
-Sta
b
NC
C-S
tab
2030 2050 2100
COAL PC COAL IGCC OIL GASNUKE HYDRO W&S CSP
United States
0%
20%
40%
60%
80%
100%
Bau
U-S
tab
NC
-Sta
b
CC
-Sta
b
NC
C-S
tab
Bau
U-S
tab
NC
-Sta
b
CC
-Sta
b
NC
C-S
tab
Bau
U-S
tab
NC
-Sta
b
CC
-Sta
b
NC
C-S
tab
2030 2050 2100
COAL PC COAL IGCC OIL GASNUKE HYDRO W&S CSP
China
0%
20%
40%
60%
80%
100%
Bau
U-S
tab
NC
-Sta
b
CC
-Sta
b
NC
C-S
tab
Bau
U-S
tab
NC
-Sta
b
CC
-Sta
b
NC
C-S
tab
Bau
U-S
tab
NC
-Sta
b
CC
-Sta
b
NC
C-S
tab
2030 2050 2100
COAL PC COAL IGCC OIL GASNUKE HYDRO W&S CSP
World
0%
20%
40%
60%
80%
100%
Bau
U-S
tab
NC
-Sta
b
CC
-Sta
b
NC
C-S
tab
Bau
U-S
tab
NC
-Sta
b
CC
-Sta
b
NC
C-S
tab
Bau
U-S
tab
NC
-Sta
b
CC
-Sta
b
NC
C-S
tab
2030 2050 2100
COAL PC COAL IGCC OIL GASNUKE HYDRO W&S CSP
Notes: Bau = Business as usual; U-Stab = unconstrained stabilization; NC-Stab = constrained stabilization with cap on nuclear; CC-Stab = constrained stabilization with no CCS; NCC-Stab = constrained stabilization with cap on nuclear and no CCS. Figure 7. Regional and World Electricity Mix
28
Notice also that the differences between the unconstrained stabilization and the stabilization
with limit on nuclear power, and also those between the CCS constrained scenario with the one
with both penetration limits, are due mainly to the differences in investments costs of CSP
related to world installed capacity, as the limit on nuclear power should be un-influential in the
domestic electricity mix of MENA.
Under a Business as Usual scenario, the main generation sources in the United States are coal,
nuclear and gas. With the introduction of a climate policy the share of pulverised coal
generation is drastically reduced substituted mainly by IGCC with CCS and Nuclear power –
where available – or gas. Towards the mid part of the century renewable sources drastically
increase their share of electricity generation, especially CSP. By the end of the century- in the
stabilization scenarios – CSP generation reaches 70%. The other generation sources are
traditional wind and solar and, in small part, nuclear power.
The Chinese electricity mix is instead dominated by coal and hydro-electric power. With a
stabilization policy, pulverised coal is substituted by IGCC with CCS and nuclear power, where
these technologies are available. Starting form the mid part of the century it becomes optimal to
generate electricity with CSP and this technology increasingly gains importance, reaching very
large shares by the end of the century, especially when nuclear power is limited. Fossil fuel
generation, that is the largest source of electricity in the Business as Usual case, almost
disappears in the stabilization scenarios.
Also for both the USA and China, in the absence of CSP, nuclear power is the main source of
electricity together with IGCC with CCS. In the presence of a limit on the expansion of nuclear
power, and even more with the additional limit on IGCC with CCS, the amount of electricity
consumed is strongly decreased.
The changes in the single regions also indirectly affect the decisions of the regions that do not
have the possibility to generate or consume CSP and have an aggregated effect on the world
electricity mix, via prices in fuels and emission permits (Figure 7). In a Business as Usual
scenario electricity is generated using mainly pulverised coal, nuclear, gas and renewable
sources, such as traditional wind and solar and hydro-electric power. As for the regional cases
analysed before, the introduction of a GHG emission target reduces the share of pulverised coal
in favour of nuclear power and IGCC power with CCS and renewable sources. When an
expansion of the former technologies is not available, generation with gas becomes more
relevant. Starting from 2045-2050, in the presence of a stabilization policy, CSP generation
starts to have an increasingly important role reaching almost 50% of the generation share when
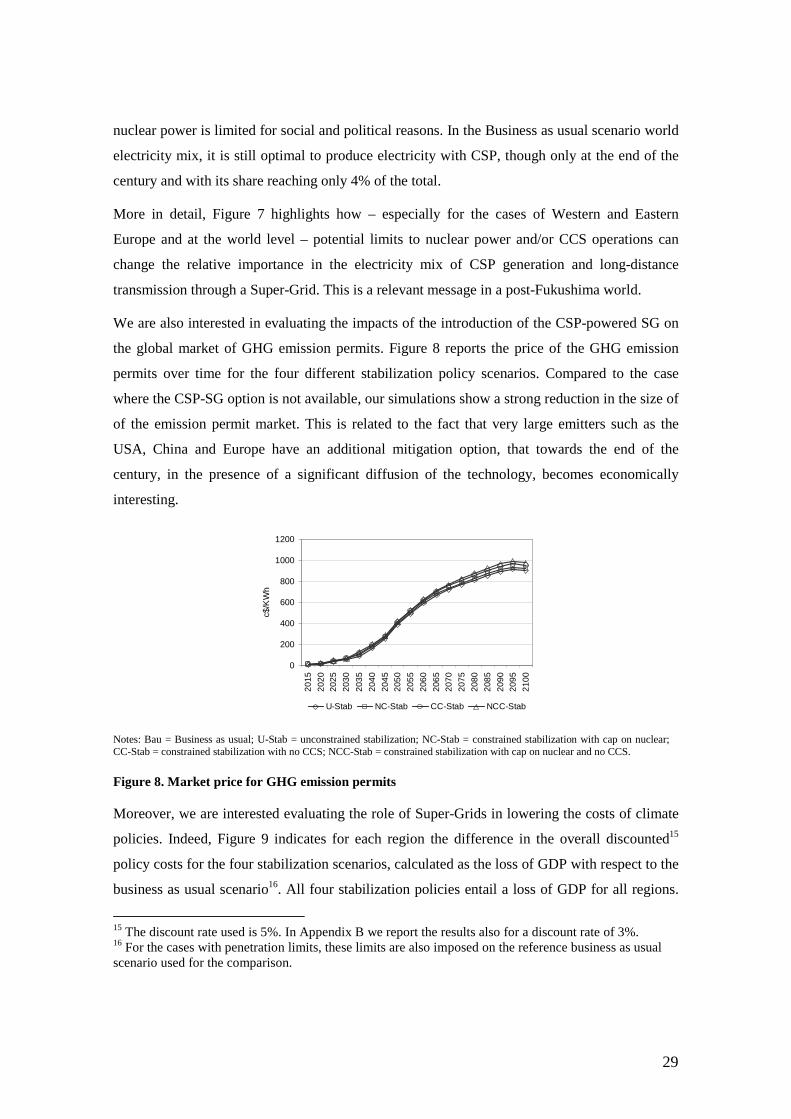
29
nuclear power is limited for social and political reasons. In the Business as usual scenario world
electricity mix, it is still optimal to produce electricity with CSP, though only at the end of the
century and with its share reaching only 4% of the total.
More in detail, Figure 7 highlights how – especially for the cases of Western and Eastern
Europe and at the world level – potential limits to nuclear power and/or CCS operations can
change the relative importance in the electricity mix of CSP generation and long-distance
transmission through a Super-Grid. This is a relevant message in a post-Fukushima world.
We are also interested in evaluating the impacts of the introduction of the CSP-powered SG on
the global market of GHG emission permits. Figure 8 reports the price of the GHG emission
permits over time for the four different stabilization policy scenarios. Compared to the case
where the CSP-SG option is not available, our simulations show a strong reduction in the size of
of the emission permit market. This is related to the fact that very large emitters such as the
USA, China and Europe have an additional mitigation option, that towards the end of the
century, in the presence of a significant diffusion of the technology, becomes economically
interesting.
0
200
400
600
800
1000
1200
2015
2020
2025
2030
2035
2040
2045
2050
2055
2060
2065
2070
2075
2080
2085
2090
2095
2100
c$/K
Wh
U-Stab NC-Stab CC-Stab NCC-Stab
Notes: Bau = Business as usual; U-Stab = unconstrained stabilization; NC-Stab = constrained stabilization with cap on nuclear; CC-Stab = constrained stabilization with no CCS; NCC-Stab = constrained stabilization with cap on nuclear and no CCS.
Figure 8. Market price for GHG emission permits
Moreover, we are interested evaluating the role of Super-Grids in lowering the costs of climate
policies. Indeed, Figure 9 indicates for each region the difference in the overall discounted15
policy costs for the four stabilization scenarios, calculated as the loss of GDP with respect to the
business as usual scenario16. All four stabilization policies entail a loss of GDP for all regions.
15 The discount rate used is 5%. In Appendix B we report the results also for a discount rate of 3%. 16 For the cases with penetration limits, these limits are also imposed on the reference business as usual scenario used for the comparison.
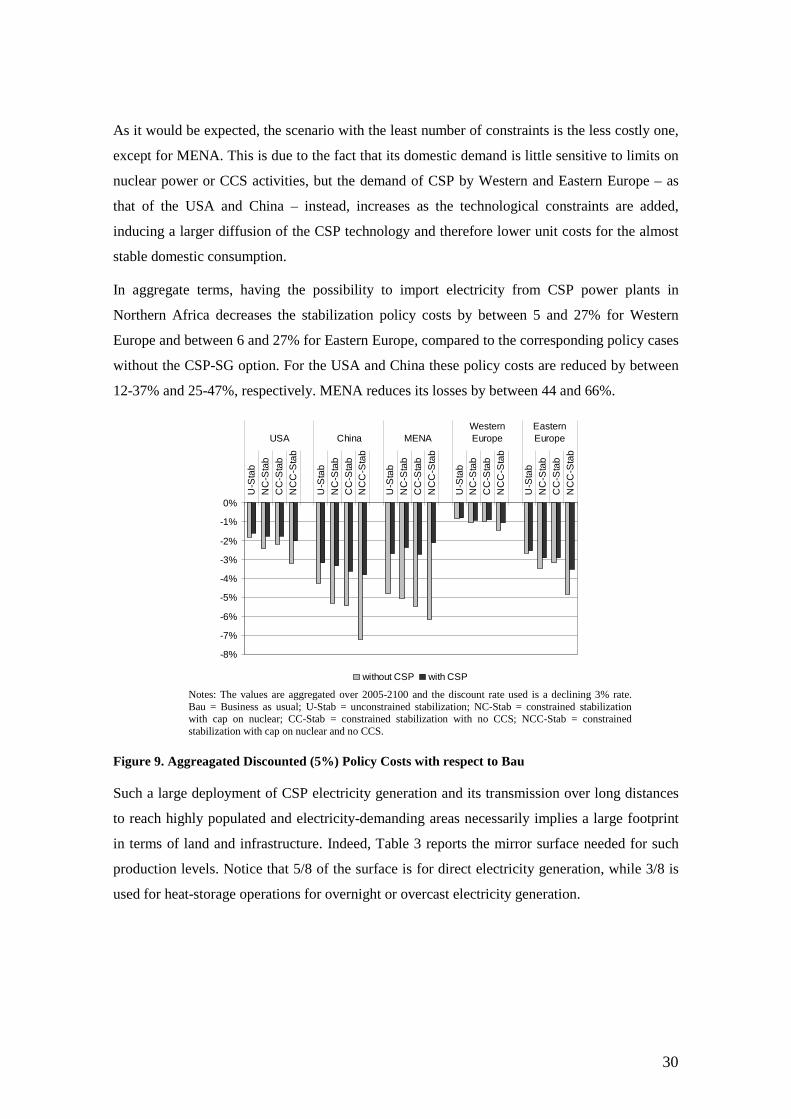
30
As it would be expected, the scenario with the least number of constraints is the less costly one,
except for MENA. This is due to the fact that its domestic demand is little sensitive to limits on
nuclear power or CCS activities, but the demand of CSP by Western and Eastern Europe – as
that of the USA and China – instead, increases as the technological constraints are added,
inducing a larger diffusion of the CSP technology and therefore lower unit costs for the almost
stable domestic consumption.
In aggregate terms, having the possibility to import electricity from CSP power plants in
Northern Africa decreases the stabilization policy costs by between 5 and 27% for Western
Europe and between 6 and 27% for Eastern Europe, compared to the corresponding policy cases
without the CSP-SG option. For the USA and China these policy costs are reduced by between
12-37% and 25-47%, respectively. MENA reduces its losses by between 44 and 66%.
-8%
-7%
-6%
-5%
-4%
-3%
-2%
-1%
0%
U-S
tab
NC
-Sta
bC
C-S
tab
NC
C-S
tab
U-S
tab
NC
-Sta
bC
C-S
tab
NC
C-S
tab
U-S
tab
NC
-Sta
b
CC
-Sta
bN
CC
-Sta
b
U-S
tab
NC
-Sta
bC
C-S
tab
NC
C-S
tab
U-S
tab
NC
-Sta
bC
C-S
tab
NC
C-S
tab
USA China MENAWesternEurope
EasternEurope
without CSP with CSP Notes: The values are aggregated over 2005-2100 and the discount rate used is a declining 3% rate. Bau = Business as usual; U-Stab = unconstrained stabilization; NC-Stab = constrained stabilization with cap on nuclear; CC-Stab = constrained stabilization with no CCS; NCC-Stab = constrained stabilization with cap on nuclear and no CCS.
Figure 9. Aggreagated Discounted (5%) Policy Costs with respect to Bau
Such a large deployment of CSP electricity generation and its transmission over long distances
to reach highly populated and electricity-demanding areas necessarily implies a large footprint
in terms of land and infrastructure. Indeed, Table 3 reports the mirror surface needed for such
production levels. Notice that 5/8 of the surface is for direct electricity generation, while 3/8 is
used for heat-storage operations for overnight or overcast electricity generation.
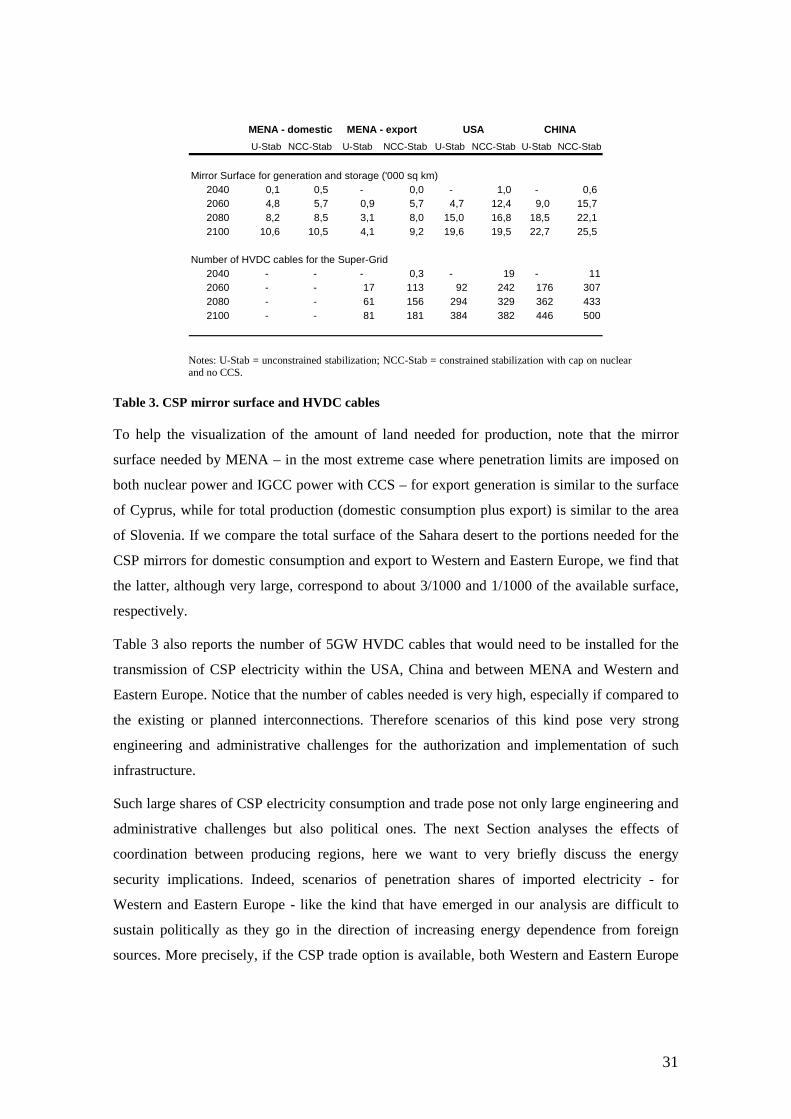
31
U-Stab NCC-Stab U-Stab NCC-Stab U-Stab NCC-Stab U-Stab NCC-Stab
Mirror Surface for generation and storage ('000 sq km)2040 0,1 0,5 - 0,0 - 1,0 - 0,6 2060 4,8 5,7 0,9 5,7 4,7 12,4 9,0 15,7 2080 8,2 8,5 3,1 8,0 15,0 16,8 18,5 22,1 2100 10,6 10,5 4,1 9,2 19,6 19,5 22,7 25,5
Number of HVDC cables for the Super-Grid2040 - - - 0,3 - 19 - 112060 - - 17 113 92 242 176 3072080 - - 61 156 294 329 362 4332100 - - 81 181 384 382 446 500
MENA - domestic MENA - export USA CHINA
Notes: U-Stab = unconstrained stabilization; NCC-Stab = constrained stabilization with cap on nuclear and no CCS.
Table 3. CSP mirror surface and HVDC cables
To help the visualization of the amount of land needed for production, note that the mirror
surface needed by MENA – in the most extreme case where penetration limits are imposed on
both nuclear power and IGCC power with CCS – for export generation is similar to the surface
of Cyprus, while for total production (domestic consumption plus export) is similar to the area
of Slovenia. If we compare the total surface of the Sahara desert to the portions needed for the
CSP mirrors for domestic consumption and export to Western and Eastern Europe, we find that
the latter, although very large, correspond to about 3/1000 and 1/1000 of the available surface,
respectively.
Table 3 also reports the number of 5GW HVDC cables that would need to be installed for the
transmission of CSP electricity within the USA, China and between MENA and Western and
Eastern Europe. Notice that the number of cables needed is very high, especially if compared to
the existing or planned interconnections. Therefore scenarios of this kind pose very strong
engineering and administrative challenges for the authorization and implementation of such
infrastructure.
Such large shares of CSP electricity consumption and trade pose not only large engineering and
administrative challenges but also political ones. The next Section analyses the effects of
coordination between producing regions, here we want to very briefly discuss the energy
security implications. Indeed, scenarios of penetration shares of imported electricity - for
Western and Eastern Europe - like the kind that have emerged in our analysis are difficult to
sustain politically as they go in the direction of increasing energy dependence from foreign
sources. More precisely, if the CSP trade option is available, both Western and Eastern Europe
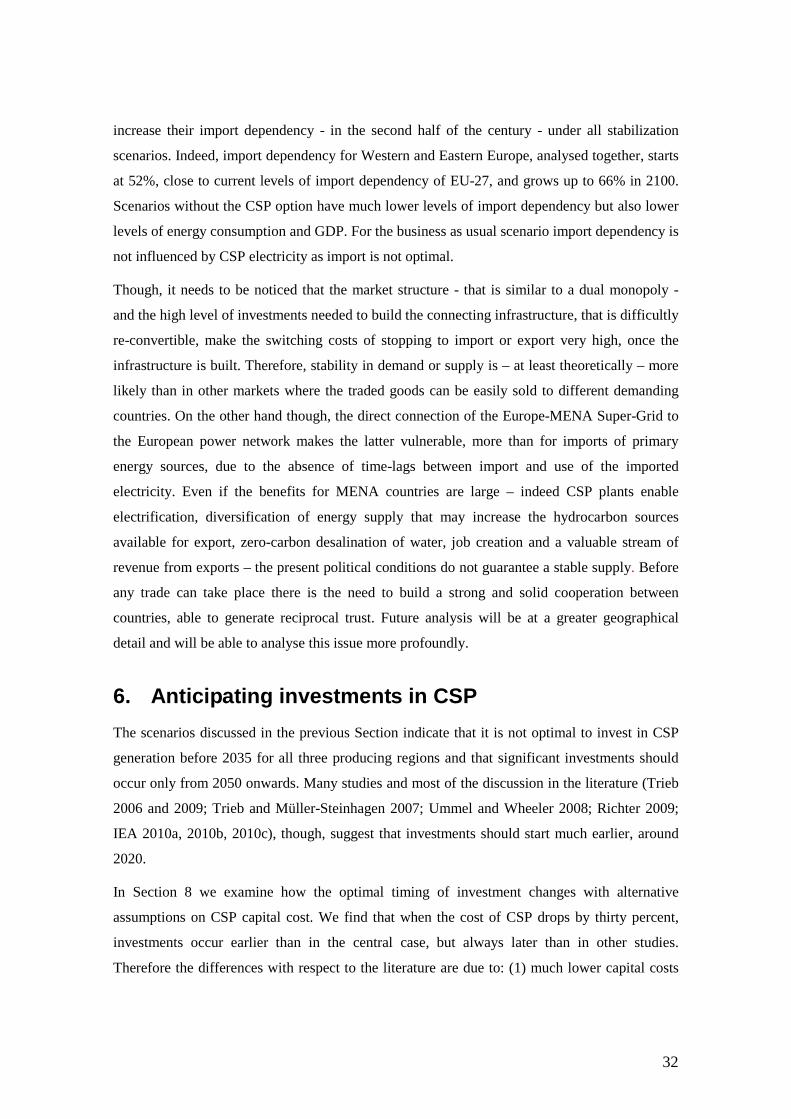
32
increase their import dependency - in the second half of the century - under all stabilization
scenarios. Indeed, import dependency for Western and Eastern Europe, analysed together, starts
at 52%, close to current levels of import dependency of EU-27, and grows up to 66% in 2100.
Scenarios without the CSP option have much lower levels of import dependency but also lower
levels of energy consumption and GDP. For the business as usual scenario import dependency is
not influenced by CSP electricity as import is not optimal.
Though, it needs to be noticed that the market structure - that is similar to a dual monopoly -
and the high level of investments needed to build the connecting infrastructure, that is difficultly
re-convertible, make the switching costs of stopping to import or export very high, once the
infrastructure is built. Therefore, stability in demand or supply is – at least theoretically – more
likely than in other markets where the traded goods can be easily sold to different demanding
countries. On the other hand though, the direct connection of the Europe-MENA Super-Grid to
the European power network makes the latter vulnerable, more than for imports of primary
energy sources, due to the absence of time-lags between import and use of the imported
electricity. Even if the benefits for MENA countries are large – indeed CSP plants enable
electrification, diversification of energy supply that may increase the hydrocarbon sources
available for export, zero-carbon desalination of water, job creation and a valuable stream of
revenue from exports – the present political conditions do not guarantee a stable supply. Before
any trade can take place there is the need to build a strong and solid cooperation between
countries, able to generate reciprocal trust. Future analysis will be at a greater geographical
detail and will be able to analyse this issue more profoundly.
6. Anticipating investments in CSP
The scenarios discussed in the previous Section indicate that it is not optimal to invest in CSP
generation before 2035 for all three producing regions and that significant investments should
occur only from 2050 onwards. Many studies and most of the discussion in the literature (Trieb
2006 and 2009; Trieb and Müller-Steinhagen 2007; Ummel and Wheeler 2008; Richter 2009;
IEA 2010a, 2010b, 2010c), though, suggest that investments should start much earlier, around
2020.
In Section 8 we examine how the optimal timing of investment changes with alternative
assumptions on CSP capital cost. We find that when the cost of CSP drops by thirty percent,
investments occur earlier than in the central case, but always later than in other studies.
Therefore the differences with respect to the literature are due to: (1) much lower capital costs

33
of CSP and Super-Grid (also thanks to subsidies), (2) much higher costs or limits to the
penetration of other carbon free electricity generation technologies, (3) less opportunities for
energy efficiency improvements, (4) other non-tangible benefits or positive spillovers.
In this Section we focus on the latter explanation and we examine the role of learning
externalities. It must be recalled that the standard solution of WITCH is the outcome of a non-
cooperative game. Since the cost of CSP is governed by a one-factor learning curve, regional
social planners do not internalize the knowledge spillovers and invest less – and later – than
what it would be socially optimal (See Equation 3).17
We assume that MENA, China and the USA introduce a coordinated policy that forces the
investments in CSP to be above a minimal threshold from 2010 until 2030. This threshold is
different for all regions and varies over time in order to replicate the investment pattern in CSP
found in the “New Policies Scenario” of the World Energy Outlook 2010 (IEA 2010c). The
target remains to stabilize GHG concentrations at 535 ppm CO2 equivalent by 2100, with no
limits to the penetration of nuclear or IGCC with CCS power (indicated as “anticipated-U-Stab”
in the graphs).
The new scenario shows that a more rapid expansion of CSP determines a faster contraction of
investment costs, due to learning by doing (Figure 10). However, after 2050 the learning effect
vanishes and costs converge in the two scenarios. After 2030 the USA and China stop investing,
while MENA keeps adding CSP capacity. When the USA and China resume investments in
2045, they add much more capacity than in the U-Stab scenario because the cost of CSP is
lower. However, they rapidly converge to the investment pattern of the U-Stab scenario. CSP
electricity trade with Europe starts five years earlier, in 2055, definitely later than in the
literature.
The forced anticipation of investments has positive welfare effects. MENA, CHINA, the USA
and Europe have higher discounted welfare than in the U-Stab scenario. The policy acts as a
coordination mechanism and internalizes the learning externalities. However, the discounted
consumption gains are very small. In MENA, the discounted sum of consumption increases by
0.16% (5% interest rate) or 0.24% (3% interest rate); all other regions have much lower
consumption gains.
Therefore, learning externalities might motivate the introduction of subsidies to invest in CSP
all in countries with high production potential. However, they do not suggest that it would be
17 Externalities within each region are instead fully internalized.
34
optimal for Europe to import CSP electricity before the second half of the century, if there are
not major constraints on the expansion of nuclear and CCS.
0
1000
2000
3000
4000
5000
6000
7000
2005 2015 2025 2035 2045 2055 2065 2075 2085 2095
$/K
W
U-Stab anticipated U-Stab WEO 2010
Figure 10. CSP Investments costs for in the unconstrained scenario and in the anticipated investments scenario.
7. Building a Mediterranean Power Market: Energy Security and Regulation Issues
The literature and the debate over the possibility to develop an international Super-Grid across
the Mediterranean to exploit the solar potential of Northern Africa have examined only
marginally two very relevant issues.
The most overlooked issue regards the security of the future European power market if a large
fraction of electricity will be imported from MENA countries. CSP electricity covers from 18%
to 46% of total electricity consumption in Europe in our scenarios. The Desertec concept
foresees 17% of electricity consumption from the MENA region. These large shares of imported
electricity represent a technical and political challenge for the European power market, which is
now practically self-sufficient. Particular attention must be paid to avoid negative repercussions
from disruptions in the power supply from MENA countries. A sudden collapse of supply,
either intentional or un-intentional, would put the whole European network under stress. A large
share of imported CSP therefore requires investments in back-up capacity, which reduce the
convenience to displace electricity generation in Northern Africa.18
18 The Desertec concept is very optimistic on the development pattern of Northern Africa and assumes that the South Mediterranean region will have roughly the same economic power of Europe in 2050 (http://www.desertec.org/en/concept/questions-answers/#c809). In Trieb et al. (2006), it is instead recognized that trade of electricity across the Mediterranean scenario will not become reality automatically. A developmental path “enlarging the gap” is not an exotic fiction, according to Trieb et al. (2006).
35
Second, the creation of a large trans-Mediterranean market for electricity requires the
establishment of an international regulatory agency to oversee the functioning of the grid and to
ensure the highest possible level of market competition. Unfortunately, the complex institutional
aspects of a large Mediterranean grid have not been discussed so far. We believe instead that
they should be moved on top of the agenda, before any large investment project starts. The
investments in Super-Grids are so high and long-lived that generate a market similar to a
bilateral monopoly where there are both monopoly and monopsony features. Therefore, market
price and output will, most likely, be determined as the outcome of an international bargaining
process. A badly regulated market can cause serious international frictions and might eventually
jeopardize the establishment of the market itself.
In particular, countries part of the MENA aggregate might have the incentive to form a cartel to
sell electricity at prices higher than the marginal cost. This hypothesis is not unrealistic and is
supported by the historic ties that many MENA countries have in the Organization of Petroleum
Exporting Countries (OPEC). The rest of this Section is devoted to test this hypothesis.
In the standard solution of WITCH all regions are “price takers” – i.e. they are not able to
excerpt any market power. This implies that in all the scenarios examined in the previous
sections MENA exports electricity at a price equal to its marginal cost. Those scenarios
constitute the best possible market structure for Europe. Therefore, in order to test if MENA
countries have the incentive to build a cartel we prepared an additional set of scenarios. Instead
of letting supply and demand forces determine the market price, in these new scenarios we fix
the price of CSP electricity and we let demand adjust to it. It is important to note that the returns
to scale to the CSP industry are linear, with space not being a limiting factor. Therefore supply
can support any level of demand if the price is above the marginal cost. If the price is below the
marginal cost supply goes to zero and no market arises. If the price of electricity is too high,
demand drops to zero because alternative carbon-free power generation options in Europe
become more affordable. Figure 11 displays the minimum and the maximum price vectors for
which a Mediterranean market for CSP exists. Since we do not pose any constraint to the
deployment of nuclear and CCS, the p-min price is equal to the price in the U-Stab scenario.
All combinations of prices and the corresponding quantities traded, included in the grey area,
are Pareto improving compared to the corresponding simulations where CSP trade is not
allowed. We have tested three intermediate combinations of prices.

36
0,09
0,10
0,11
0,12
0,13
0,14
0,15
0,16
0,17
0,18
2060 2065 2070 2075 2080 2085 2090 2095 2100
$/kW
h
pmin p1 p2 p3 pmax
Figure 11. Price for traded CSP Electricity
0
200
400
600
800
1000
1200
pmin p1 p2 p3 pmax
Bill
ion
$
revenue costs profits
Figure 12. MENA Aggregated costs, Revenue and Profits from CSP Electricity trade
We find that as price increases the quantity traded decreases and therefore both revenues and
costs decrease (see Figure 12). Profits, defined as the difference between revenues from CSP
sales and costs to generate and transmit electricity, follow an inverted-U relationship with prices
of electricity because demand in Europe – in particular in Western Europe – is elastic and
domestic carbon-free options are available.
On welfare grounds, MENA’s consumption and welfare levels also follow an inverted-U
relationship with prices of electricity and reach their maximum in correspondence to the price in
the vicinity of the price vector “p3”. Therefore, compared to the competitive equilibrium case,
MENA is better off with prices around those tested with vector “p3”. Western and Eastern
Europe instead are better off in correspondence with the minimum price vector where they are
37
able to import a larger amount of zero-carbon electricity at lower prices. What the exchange
price will be will depend on the relative strengths of the regions in the bargaining process of the
long-term international agreements that necessarily need to take place for the implementation of
the Super-Grid infrastructure to be possible.
The Desertec concept does not believe that MENA countries might form a cartel because
Europe has the potential to generate CSP domestically and would discourage any monopoly.19
We show here that there are instead incentives for MENA countries to behave as a block and to
supply electricity at a price above the marginal cost. However, prices cannot increase too much
because Europe can expand the domestic supply of electric power from nuclear, coal with CCS
and renewables. Of course, the bargaining position of Europe gets weaker if the deployment of
nuclear and CCS is limited.
8. Sensitivity Analysis
In this Section we test the robustness of our results by varying the values of the key input
parameters. We focus on the assumptions for CSP electricity generation, long-distance
transmission through a Super-Grid and its trade. We test the alternative assumptions using as a
reference case the unconstrained stabilization scenario. More in detail, we test variations ceteris
paribus of ±5%, ±10%, ±20% and ±30% of the reference value of: (i) initial CSP investments
costs (SCCSP); (ii ) SG infrastructure investments costs (SCgrid); and (iii-v ) the parameters of the
cost function, related to the learning by doing effect (α) and to the cost increase due to limited
supply of intermediate goods (β, γ).
The graphs reported in Appendix B depict the changes of: (i) future investment costs, (ii ) trade
of CSP Electricity between MENA and Europe, and (iii ) world CSP installed capacity, for the
alternative assumptions on the above parameters. For simplicity, in the graphs we report the
values of the variables for variations of 0%, ±5%, ±30%. We find that all three output variables
are more sensitive to the initial value of the CSP investment cost and to the progress ratio used
in the learning by doing term of the cost function, compared to the other three. For small input
parameters variations (5-10%), output results are stable; for larger variations results differ
sensibly, though in all cases the differences are mainly quantitative and not qualitative.
The timing of CSP deployment for MENA is influenced by variations only in CSP investment
costs, while for the USA and China also by the progress ratio. The optimal timing for the
19 http://www.desertec.org/en/concept/questions-answers/#c809, accessed on June 8, 2011.

38
Europe-MENA trade is mainly sensitive to the previous two parameters; Super-Grid investment
costs are also influential but to a smaller extent.
To conclude, the sensitivity analysis shows that the crucial parameters for this analysis are the
initial investment costs for the CSP power plants and the rate at which these will decrease as
cumulative installed capacity grows, therefore particular care should be devoted to their
estimation.
9. Conclusions
We have analyzed the effects of the introduction of Concentrated Solar Power (CSP)
transmitted by means of Super-Grids (SG) in four regions of the world: Europe, Middle East
and North Africa (MENA), the United States of America and China. We have evaluated the
economic potential of this low-carbon option for electricity generation, under a Business as
Usual scenario and under a 535ppm-CO2eq policy target in the presence of a global carbon
market. We tested our results under different assumptions regarding the expansion of nuclear
power and coal power with carbon capture and storage (CCS), that, together with renewable
power, are the most promising technologies to tackle the electricity sector’s greenhouse gas
(GHG) emissions, though might be subject to opposition by the general public, high costs,
technological and geo-political challenges.
Our simulations suggest that an extensive use of CSP power both for domestic consumption or
export, in the case of the Europe-MENA Super-Grid, will become optimal only in the second
half of the century.
CSP-powered SG electricity in Western and Eastern Europe and China substitutes production
from zero-carbon technologies only when there are penetration limits to the exploitation of the
latter. CSP domestic production by MENA is optimal from 2040 onwards and large, under all
climate policy scenarios. In the second part of the century it becomes optimal even in the
Business as Usual scenario. Therefore, development projects regarding a Europe-MENA CSP-
SG need to take into account a large domestic use of CSP by MENA, that is most likely to
increase further if demand for low-carbon desalination is included in the model.
The price at which the CSP electricity will be traded between Europe and MENA is expected to
start around 30c$/KWh, for the most extreme case, and decrease over time to 10-11 c$/KWh as
the world cumulative capacity increases triggering the Learning by Doing effect that drastically
reduces investment costs for CSP generation. Though, the trading price, will necessarily depend

39
on long-term international agreements. Our simulations have also identified a set of feasible and
Pareto-improving combinations of price and quantity exported and the best situation for Europe
and for MENA
In the second part of the century the electricity mix of the USA, China, MENA, Western Europe
and Eastern Europe will be strongly modified by the additional CSP option that will reach very
large shares of electricity generation. Limits to the penetration of this technology or the
consideration of the increasing cost of managing the power network with large shares of solar
electricity might be needed to make the results more realistic.
The introduction of the CSP-SG option allows stabilization policy costs to be reduced, under all
scenarios for all five regions. The stabilization policy is still costly in terms of GDP loss
compared to the Business as Usual scenario, though adding the CSP-SG option may decrease
such losses up to 66%.
Finally, the literature on CSP and the political debate have largely neglected the complexities of
building the institutions capable of managing a large Mediterranean market for electricity.
Without a sound institutional framework tensions among the two regions might emerge and
jeopardize the overall deployment of a CSP power market. In particular, high attention should
be devoted to the mechanisms and rules that will determine the price of electricity. We have
shown that there are incentives that may lead MENA countries to form a cartel. The emergence
of market power can be troublesome for Europe. Equally problematic, in case of a large
deployment of CSP, might be the large exposure of the European power network to foreign
shocks. Instead of increasing energy security, a massive use of imported CSP might increase
energy dependence. Therefore our scenarios, appear to be overly optimistic. Realistically, CSP
will be able to contribute only marginally to the European power mix and domestic carbon-free
power sources need to be developed. Very large is instead the potential of CSP in China, the
USA, and in MENA countries, where the only constraints are technological. Future
developments of this work will expand the number of regions that can invest profitably in CSP,
will explore more stringent stabilization targets and will describe with greater precision the
optimal geographical location of CSP plants and Super-Grids.

40
References
Battaglini A., J. Lilliestam, C. Bals and A. Haas (2008), “The SuperSmart Grid”, European Climate Forum.
Bauer, N., O. Edenhofer, M. Jakob, S. Ludig and Lüken, M. (2009), “Electricity Trade among World Regions. Trade Theoretic Foundation of Energy-Economy Models”, Paper presented at the NCCR Conference on the International Dimensions of climate Policy, Bern, Switzerland, January 21-23, 2009.
Bird, L. and E. Brown (2006), “Trends in Utility Green Pricing Programs (2005)”, Technical Report, National Renewable Energy Laboratory, NREL/TP 640-40777.
Bosetti, V., C. Carraro, M. Galeotti, E. Massetti and M. Tavoni (2006), “WITCH: A World Induced Technical Change Hybrid Model”, The Energy Journal, Special Issue on Hybrid Modeling of Energy-Environment Policies: Reconciling Bottom-up and Top-down, pp.13-38.
Bosetti, V., E. Massetti and M. Tavoni (2007a), “The WITCH model: Structure, Baseline and Solutions”, FEEM Working Paper 10-2007, Milan.
Bosetti, V., C. Carraro, E. Massetti and M. Tavoni (2007b), “Optimal Energy Investment and R&D Strategies to Stabilise Greenhouse Gas Atmospheric Concentrations”, FEEM Working Paper 95-2007, Milan.
Bosetti, V., C. Carraro, E. Massetti, A. Sgobbi and M. Tavoni (2009), "Optimal Energy Investment and R&D Strategies to Stabilise Greenhouse Gas Atmospheric Concentrations", Resource and Energy Economics 31-2, pp.123-137.
Breyer, C. and G. Knies (2009), “Global Energy Supply Potential of Concetrating Solar Power”, Proceedings SolarPaces 2009, Berlin.
Carlsson, F., M. Kataria, A. Krupnick, E. Lampi, Å. Lofgren, P. Qin, S. Chung, and T. Sterner (2010), “Paying for Mitigation: A Multiple Country Study”, Environment for Development Discussion Paper Series, EfD DP 10-12.
Chien, J. C. (2009), Concentrating Solar Thermal Power: A Viable Alternative in China’s Energy Supply, Master Thesis, Lauder Institute of International Studies.
Clarke, L., J. Edmonds, V. Krey, R. Richels, S. Rose and M. Tavoni (2009), “International climate policy architectures: Overview of the EMF 22 International Scenarios”, Energy Economics 31, S64–S81.
Czisch, G. (2004), “Least-cost European/Transeuropean electricity supply entirely with renewable Energies”, unpublished paper.
Deutch, J., E.J. Moniz, S. Ansolabehere, M. Driscoll, P.E. Gray, J.P. Holdren, P.L.Joskow, R.K. Lester, N.E. Todreas and E.S. Beckjord (2003), The future of nuclear power: an interdisciplinary MIT study, Massachusetts Institute of Tech- nology, Boston, MA.
Edenhofer, O., C. Carraro, J.C. Hourcade, K. Neuhoff, G. Luderer, C. Flachsland, M. Jakob, A. Popp, J. Steckel, J. Strohschein, N. Bauer, S. Brunner, M. Leimbach, H.
41
Lotze-Campen, V. Bosetti, E. de Cian, M. Tavoni, O. Sassi, H. Waisman, R. Crassous-Doerfler, S. Monjon, S. Dröge, H. van Essen, P. del Río, A. Türk (2009), The Economics of Decarbonization. Report of the RECIPE project, Potsdam-Institute for Climate Impact Research, Potsdam.
EIA (2010), Annual Energy Outlook 2010, U.S. Energy Information Administration, Report n. DOE/EIA-0383(2010)
ECF (2010), Roadmap 2050. A practical guide to a prosperous low carbon Europe, European Climate Foundation
Enermodal Engineering Limited (1999), Cost reduction study for solar thermal power plants. Prepared for The World Bank.
European Commission (2009), EU Action against climate change. Leading global action to 2020 and beyond, Office for Official Publications of the European communities, Bruxelles, Belgium.
Gurney, A., H. Ahammad and M. Ford (2009), "The economics of greenhouse gas mitigation: Insights from illustrative global abatement scenarios modelling", Energy Economics 31 (Supplement 2), S174-S186.
Heyman, O., L. Weimers and M.L. Bohl (2010), “HVDC - A key solution in future transmission systems”, Paper presented at the World Energy Congress - WEC 2010, Montreal, Quebec, Canada, September 12-16, 2010.
Herzog, H., "Scaling up carbon Dioxide Capture and Storage: From Megatons to Gigatons," Energy Economics, In Press, Corrected Proof, Available online 12 November 2010.
IEA (2003), Renewables for Power Generation. Status & Prospects, International Energy Agency, Paris, France.
IEA (2009), World Energy Outlook 2009, International Energy Agency, Paris, France.
IEA (2010a), Energy Technology Perspectives 2010, International Energy Agency, Paris, France.
IEA (2010b), Technology Roadmap: Concentrating Solar Power, International Energy Agency, Paris, France.
IEA (2010c), World Energy Outlook 2010, International Energy Agency, Paris, France.
IPCC (2005), Carbon Capture and Storage, Metz B., O. Davidson, H. de Coninck, M. Loos and L. Meyer (Eds.) Cambridge University Press, UK. pp 431.
IPCC (2007), Climate Change 2007: Synthesis Report. Contribution of Working Groups I, II and III to the Fourth Assessment Report of the Intergovernmental Panel on Climate Change. Core Writing Team, Pachauri, R.K. and Reisinger, A. (Eds.) IPCC, Geneva, Switzerland.
Jacobson, M.Z. and M.A. Delucchi (2010), “Providing all global energy with wind, water, and solar power, Part I: Technologies, energy resources, quantities and areas of infrastructure, and materials”, Energy Policy 2010-11-040
Kaltschmitt, M., W. Streicher and A. Wiese (2007), Renewable Energy, Springer.

42
Kearney, D. (2003), “Concentrating Solar Power Systems”, National Center for Photovoltaics and Solar Program Review Meeting Proceedings, 24-26 March 2003, Denver, Colorado (CD-ROM). NREL/CD-520-33586. Golden, Colorado, National Renewable Energy Laboratory.
May, N. (2005), Eco-balance of Solar Electricity Transmission from North Africa to Europe, Diploma Thesis, Technical University of Braunschweig.
NASA Atmosferic Science Data Center. Available at: http://eosweb.larc.nasa.gov/
Neij, L. (2008), “Cost development of future technologies for power generation – A study based on experience curves and complementary bottom-up assessments”, Energy Policy, 36, pp.2200-2211.
Nordhaus, W. D. (1993), “Rolling the 'DICE': An Optimal Transition Path for Controlling Greenhouse Gases,” Resource and Energy Economics, vol. 15, 1993, pp. 27-50.
Patt, A., A. Battaglini, N. Komendantova and J. Lilliestam (2008), “Linking North Africa’s Renewable Energy Resources to Europe: policy challenges“, Background paper for a scientific workshop International Institute for Applied Systems Analysis, Laxenburg, Austria, 24 – 26 November 2008.
PricewaterhouseCoopers LLP (2010), 100% renewable electricity. A roadmap to 2050 for Europe and North Africa. Availbale at:http://www.pwc.co.uk/pdf/100_percent_ renewable_electricity.pdf
Richels, R.G., G. J. Blanford and T. Rutherford (2007), “The Value of Technological Advance in Decarbonizing the U.S economy”, AEI-Brookings Working paper 07-19.
Richter, C., S. Teske and J. A. Nebrera (2009), “Concentrating Solar Power Global Outlook 09”, Greenpeace International / European Solar Thermal Electricity Association (ESTELA) / IEA SolarPACES, Report 2009.
Stern, N. (2006), “The Economics of Climate Change: The Stern Review”, Cambridge University Press.
Streater, S. (2010), “1,000-Megawatt Plant in Calif. Marks New Milestone in Solar Expansion”, The New York Times (26-8-2010).
Trieb, F. (2006), Trans-Mediterranean Interconnection for Concentrationg Solar Power, German Aerospace Center (DLR).
Trieb, F. and H. Müller-Steinhagen (2007), “The DESERTEC concept”. In Knies G., U. Möller and M. Straub (Eds.) Clean power from the deserts: The DESERTEC concept for energy,water and climate security, White Paper, 23-44. Hamburg: TREC, 2007. http://www.desertec.org/downloads/articles/trec_white_paper.pdf Accessed 25 August 2008.
Trieb, F. (2009), Combined Solar Power and Desalination Plants: Techno-Economic Potential in Mediterranean Partner Countries, German Aerospace Center (DLR)
Trieb, F. (2009b), “Global Potential of Concetrating Solar Power”, Proceedings SolarPaces 2009, Berlin.
43
Ummel, K. and D. Wheeler (2008), “Desert Power: The Economics of Solar Thermal Electricity for Europe, North Africa, and the Middle East”, Center for Global Development Working Paper Number 156.
WBGU - German Advisory Council on Global Change – (2003), World in Transition – Towards Sustainable Energy Systems, Earthscan, London.
Weitzman, M.L. (2009), “Additive Damages, Fat-Tailed Climate Dynamics, and Uncertain Discounting”, Economics: The Open-Access, Open-Assessment E-Journal, Vol. 3, 2009-39.
Williams, A. (2010), “CSP O&M: Dust-proof solar fields”, CSP Today (17-12-2010).
Wiser, R.H. (2007) , “Using contingent valuation to explore willingness to pay for renewable energy: A comparison of collective and voluntary payment vehicles”, Ecological Economics 62 (3-4), pp. 419-432.
Wolff, G. (2008), “Supergrid Costs And Benefits”, Desertec Resources, Desertecc-UK.
WRI (2010), Climate Analysis Indicators Tool (CAIT), Version 7.0. Washington, DC, World Resources Institute. Available at http://cait.wri.org

44
Appendix A
List of Main Equations In this Appendix we reproduce the main equations of the model. For a full description of the model please refer to Bosetti et al (2007-a; 2009). The website www.witchmodel.org contains useful information on the model. The list of variables is reported at the end of this Section.
In each region, indexed by n, a social planner maximises the following utility function:
[ ] [ ] ∑∑ ==tt
tRtnctnLtRtnLtnCUnW )(),(log),()(),(),,()( , (A1)
where t are 5-year time spans and the pure time preference discount factor is given by:
( ) ( )[ ]∏=
−+=t
ttR0
1ν
νρ , (A2)
where the pure rate of time preference ( )νρ is assumed to decline over time. Moreover, ),(
),(),(
tnL
tnCtnc =
is per capita consumption.
Output gross of climate change damages, in the non-oil sector, is produced by combining a capital-labour intermediate input with energy services (ES) in a constant elasticity of substitution (CES) production function:
( ) ( ) ( ) ( ) ( )( ) ( )( ) ( )[ ] YYY
tnESntnLtnKntnTFPtnGY YY
ρρρββ αα/1
1 ,1,,,, −+= − . (A3)
Total factor productivity ( )tnTFP , evolves exogenously with time. The labour force is set equal to
population (L), which evolves exogenously. Capital (K) evolves following a standard pattern:
( ) ( )( ) ( )tnItn K tnK GY ,1,1, +−=+ δ (A4)
Energy services are an aggregate of energy (EN) and a stock of knowledge combined with a CES function:
( ) ( ) ( )[ ] ESESES tnENntnHEntnES ENHE
ρρρ αα/1
),(),(, += . (A5)
New ideas which contribute to the stock of energy knowledge, ( )tnZHE , , are produced using R&D
investments, ( )tnI DR ,& , together with the previously cumulated knowledge stock ( )tnHE , :
( ) dcbHEHE tnHKLtnHEtnI a tnZ ),(),(),(, = . (A6)
The knowledge stock evolves as follows:
( )tnZtn HE) tHE(n HE ,)1)(,(1, +−=+ δ (A7)
The Energy Sector
Energy is a combination of electric (EL) and non-electric energy (NEL):
( ) ( ) ( )[ ] ENENEN tnNELntnELntnEN NELEL
ρρρ αα/1
),(),(, += . (A8)
Each factor is further decomposed into several sub-components that are aggregated using CES, linear and Leontief production functions. In particular:

45
( ) ( )[ ]),(),(, 2 tnELntnELtnEL HYDROHYDROα+= ; (A9)
( ) ( ) ( ) ( )[ ] 2222
/1
&&2 ),(),(),(, ELELELEL tnELntnELntnFFntnEL SWSWNUKENUKEFF
ρρρρ ααα ++= ; (A10)
( ) ( ) ( ) ( )[ ] FFFFFFFF tnELntnELntnELntnFF GASGASOILOILCOALCOAL
ρρρρ ααα /1),(),(),(, ++= ; (A11)
( ) ( ) ( )[ ] COALCOALCOAL
ELELEL tnELntnELntnEL IGCCIGCCPCPCCOAL
ρρρ αα/1
),(),(, += . (A12)
The Super-Grid
We reproduce here the equations that have been illustrated in the main text of the paper for an easy reference:
),(),(),( ,, tnELtntnEL XCSPCSPprodCSP EL += . (A13)
),(),(),(),(),( ;;;min ,,, tntntntntn gridgridgridnCSPCSPCSPnprodCSP O&MKO&MKEL µµ= . (A14)
),(),(),(),(),( ,,,, ;;;min tntntntntn DgridDgridgridnCSPCSPCSPnCSP O&MKO&MKEL µµ= . (A15)
),(),(),(),(),( ,,,,, ;;;min tntntntntn XgridXgridgridnCSPCSPCSPnXCSP O&MKO&MKEL µµ= . (A16)
∑ ∀=n
ttnEL XCSP 0),(, . (A17)
),(
),(),()1,( )1(
tn
tntntn
CSP
CSPCSPCSPCSP SC
IKK +−=+ δ . (A18)
),(
),(),()1,( )1(
tn
tntntn
grid
gridgridgridgrid SC
IKK +−=+ δ . (A19)
),(),(),( ,, tntntn XgridDgridgrid KKK += . (A20)
( ) ( )
( )( )
++
+⋅⋅=+−
γ
α
β1,
1,
1)(
)(,1,
)(
00
tnSC
tnI
tTK
tTKtnSCtnSC CSP
CSP
CSPCSP . (A21)
),(),(),( ,, tntntn XgridDgridgrid O&MO&MO&M += . (A22)
),(),(
),(),(),(),(),(),(),(),(
&&
&&
tntn
tntntntntntntntn
gridCSP
gridCSPj
jj
jj
DR
MOMO
IIMOIIIYC
−−
−−−−−= −∑∑∑. (A23)
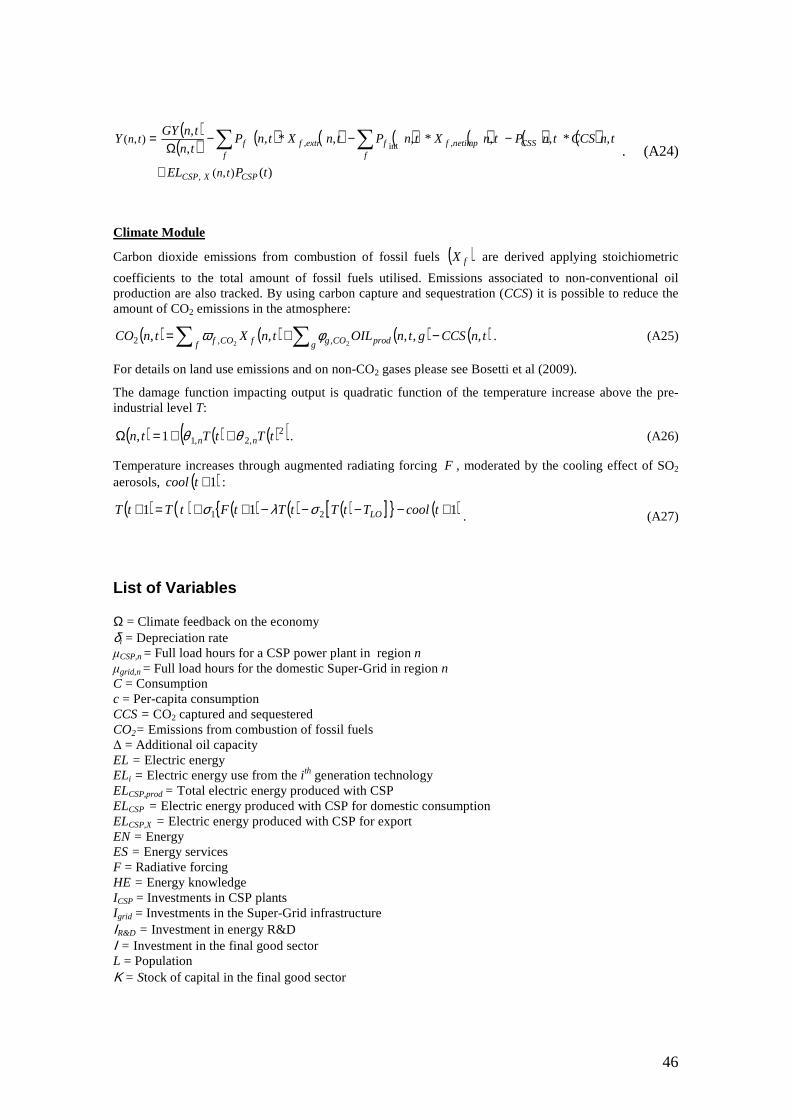
46
( )( ) ( ) ( ) ( ) ( ) ( ) ( )
)(
,*,,*,,*,,,
),(
),(
,
,int,
tPEL
tnCCStnPtnXtnPtnXtnPtn
tnGYY
CSPXCSP
CSSf
netimpfff
extrff
tn
tn
+
−−−Ω
= ∑∑. (A24)
Climate Module
Carbon dioxide emissions from combustion of fossil fuels ( )fX are derived applying stoichiometric
coefficients to the total amount of fossil fuels utilised. Emissions associated to non-conventional oil production are also tracked. By using carbon capture and sequestration (CCS) it is possible to reduce the amount of CO2 emissions in the atmosphere:
( ) ( ) ( ) ( )tnCCSgtnOILtnXtnCOg prodCOgf fCOf ,,,,,
22 ,,2 −+= ∑∑ φω . (A25)
For details on land use emissions and on non-CO2 gases please see Bosetti et al (2009).
The damage function impacting output is quadratic function of the temperature increase above the pre-industrial level T:
( ) ( ) ( )( )2,2,11, tTtTtn nn θθ ++=Ω . (A26)
Temperature increases through augmented radiating forcing F , moderated by the cooling effect of SO2 aerosols, ( )1+tcool :
( ) ( ) ( ) ( ) ( )[ ] ( )111 21 +−−−−++=+ tcoolTtTtTtFtTtT LOσλσ . (A27)
List of Variables
Ω = Climate feedback on the economy δi = Depreciation rate µCSP,n = Full load hours for a CSP power plant in region n µgrid,n = Full load hours for the domestic Super-Grid in region n C = Consumption c = Per-capita consumption CCS = CO2 captured and sequestered CO2= Emissions from combustion of fossil fuels ∆ = Additional oil capacity EL = Electric energy ELi = Electric energy use from the i th generation technology ELCSP,prod = Total electric energy produced with CSP
ELCSP = Electric energy produced with CSP for domestic consumption ELCSP,X = Electric energy produced with CSP for export EN = Energy ES = Energy services F = Radiative forcing HE = Energy knowledge ICSP = Investments in CSP plants Igrid = Investments in the Super-Grid infrastructure ΙR&D = Investment in energy R&D Ι = Investment in the final good sector L = Population Κ = Stock of capital in the final good sector

47
Κ CSP= Stock of capital in CSP Κ grid = Stock of capital in the whole Super-Grid infrastructure Κ grid,D = Stock of capital in the Super-Grid infrastructure for domestic consumption Κ grid,X = Stock of capital in the Super-Grid infrastructure for export NEL = Non-electric energy NIP = Net import of carbon permits O&MCSP = Operation and maintenance costs associated with CSP generation O&Mgrid = Operation and maintenance costs associated with the whole Super-Grid O&Mgrid,X = Operation and maintenance costs associated with Super-Grid for domestic consumption O&Mgrid,X = Operation and maintenance costs associated with Super-Grid for export PCSP = Price of the traded CSP power p = Price of carbon permits PZ = a vector of prices for the input vector XZ R = Discount factor SCCSP = Investment costs for the construction of CSP plants SCgrid = Investment costs for the construction of the Super-Grid T = Temperature level ΤFP = Total factor productivity U = Instantaneous utility W = Welfare XZ = a vector including inputs that are considered a net loss for the economy Y = Gross Domestic Product ZHE = Flow of new energy knowledge
Assigned Values to Key Parameters: List of key parameters
µCSP μgrid μgrid,X SCCSP SCgrid SCgrid,X O&MCSP O&M grid O&M grid,X
(h) (h) (h) ($/kW) ($/kW) ($/kW) ($/kW) ($/kW) ($/kW)
CHINA 4110 4110 6500 329 127.5 6.6
MENA 3680 3680 6500 336 127.5 6.7
USA 4600 4600 6500 277 127.5 5.5
Note: the values in $ are in 2007US$ as reported in the original data source (Kaltshmitt 2007), these are then converted into 2005US$ for the model simulations.
δCSP δgrid α β γ
All 0.1 0.1 0.15 380 3

48
Appendix B
Additional Results
Electricity Costs
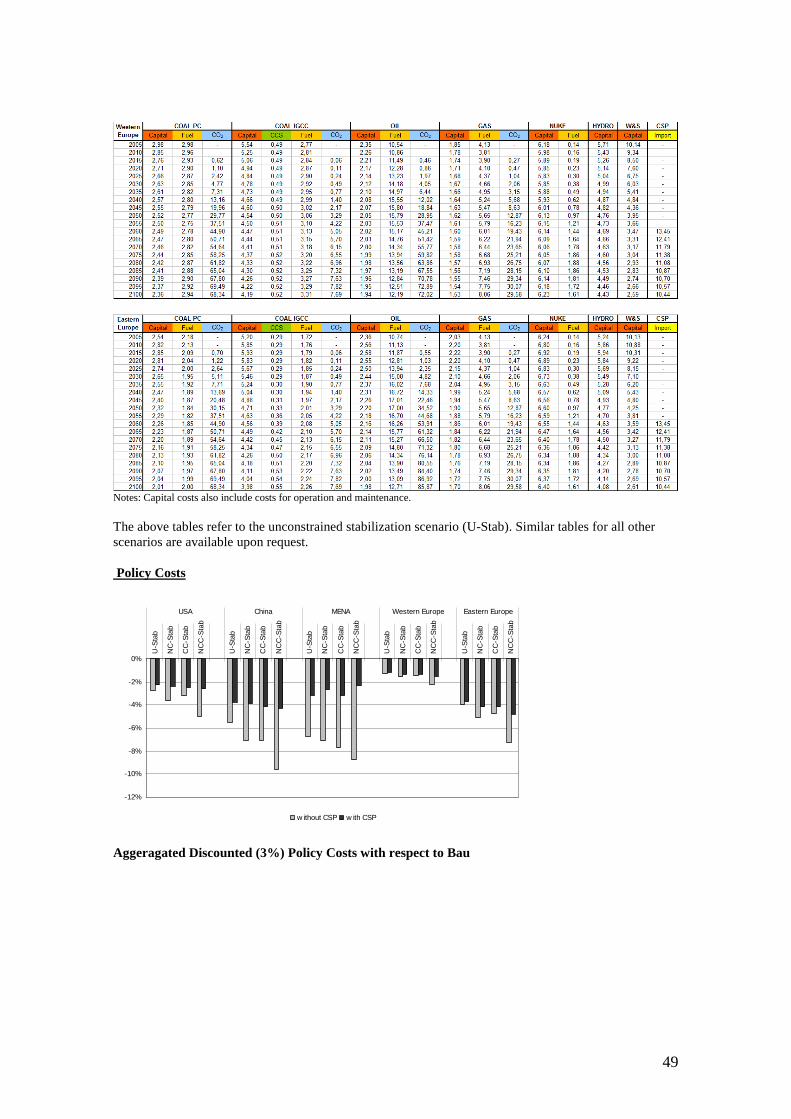
49
Notes: Capital costs also include costs for operation and maintenance. The above tables refer to the unconstrained stabilization scenario (U-Stab). Similar tables for all other scenarios are available upon request. Policy Costs
-12%
-10%
-8%
-6%
-4%
-2%
0%
U-S
tab
NC
-Sta
b
CC
-Sta
b
NC
C-S
tab
U-S
tab
NC
-Sta
b
CC
-Sta
b
NC
C-S
tab
U-S
tab
NC
-Sta
b
CC
-Sta
b
NC
C-S
tab
U-S
tab
NC
-Sta
b
CC
-Sta
b
NC
C-S
tab
U-S
tab
NC
-Sta
b
CC
-Sta
b
NC
C-S
tab
USA China MENA Western Europe Eastern Europe
w ithout CSP w ith CSP
Aggeragated Discounted (3%) Policy Costs with respect to Bau
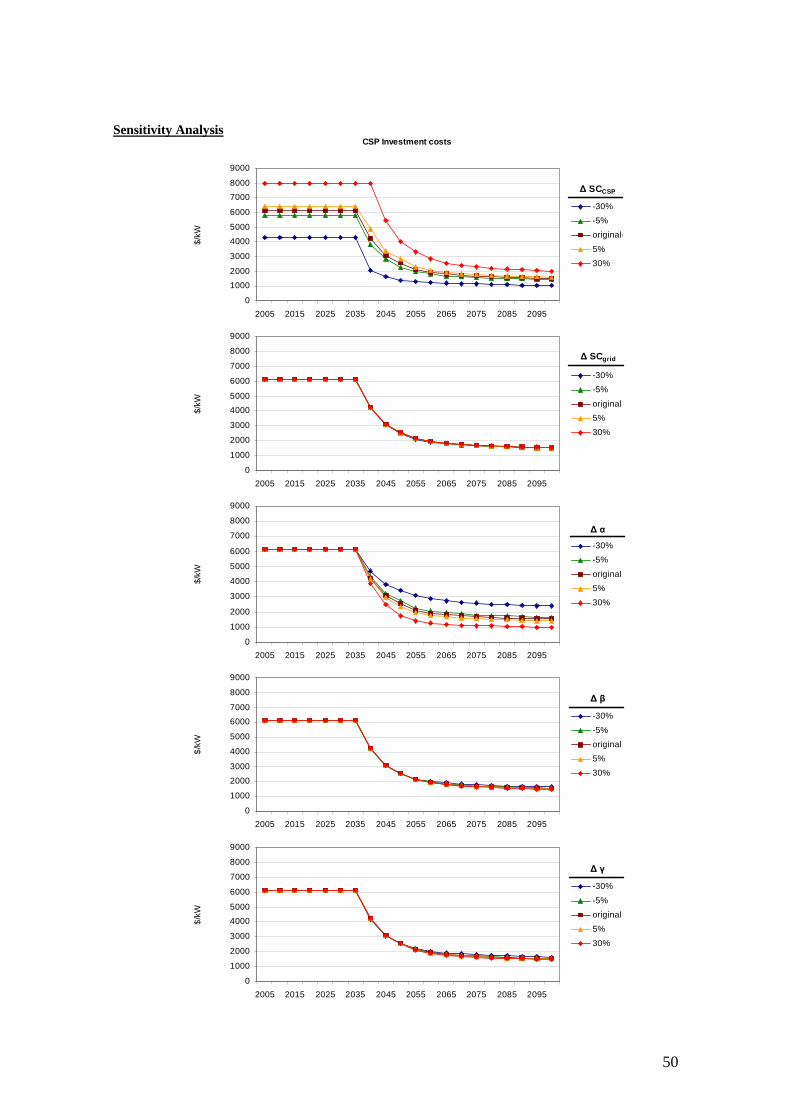
50
0
1000
2000
3000
4000
5000
6000
7000
8000
9000
2005 2015 2025 2035 2045 2055 2065 2075 2085 2095
$/k
W
-30%
-5%
originale
5%
30%
∆ SCgrid
0
1000
2000
3000
4000
5000
6000
7000
8000
9000
2005 2015 2025 2035 2045 2055 2065 2075 2085 2095
$/k
W
-30%
-5%
originale
5%
30%
∆ α
0
1000
2000
3000
4000
5000
6000
7000
8000
9000
2005 2015 2025 2035 2045 2055 2065 2075 2085 2095
$/k
W
-30%
-5%
originale
5%
30%
∆ β
0
1000
2000
3000
4000
5000
6000
7000
8000
9000
2005 2015 2025 2035 2045 2055 2065 2075 2085 2095
$/k
W
-30%
-5%
originale
5%
30%
∆ γ
CSP Investment costs
0
1000
2000
3000
4000
5000
6000
7000
8000
9000
2005 2015 2025 2035 2045 2055 2065 2075 2085 2095
$/k
W-30%
-5%
originale
5%
30%
∆ SCCSP
Sensitivity Analysis
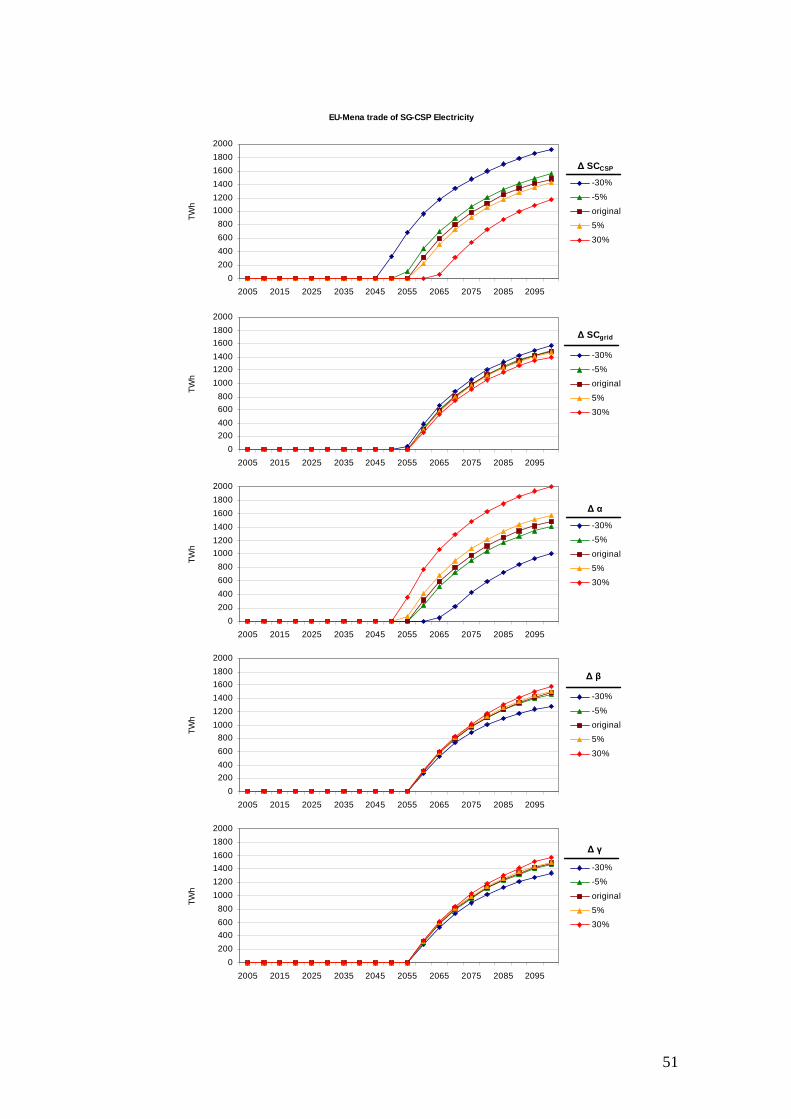
51
EU-Mena trade of SG-CSP Electricity
0
200
400
600
800
1000
1200
1400
1600
1800
2000
2005 2015 2025 2035 2045 2055 2065 2075 2085 2095
TW
h-30%
-5%
original
5%
30%
∆ SCCSP
0
200
400
600
800
1000
1200
1400
1600
1800
2000
2005 2015 2025 2035 2045 2055 2065 2075 2085 2095
TW
h
-30%
-5%
original
5%
30%
∆ SCgrid
0
200
400
600
800
1000
1200
1400
1600
1800
2000
2005 2015 2025 2035 2045 2055 2065 2075 2085 2095
TW
h
-30%
-5%
original
5%
30%
∆ α
0
200
400
600
800
1000
1200
1400
1600
1800
2000
2005 2015 2025 2035 2045 2055 2065 2075 2085 2095
TW
h
-30%
-5%
original
5%
30%
∆ β
0
200
400
600
800
1000
1200
1400
1600
1800
2000
2005 2015 2025 2035 2045 2055 2065 2075 2085 2095
TW
h
-30%
-5%
original
5%
30%
∆ γ
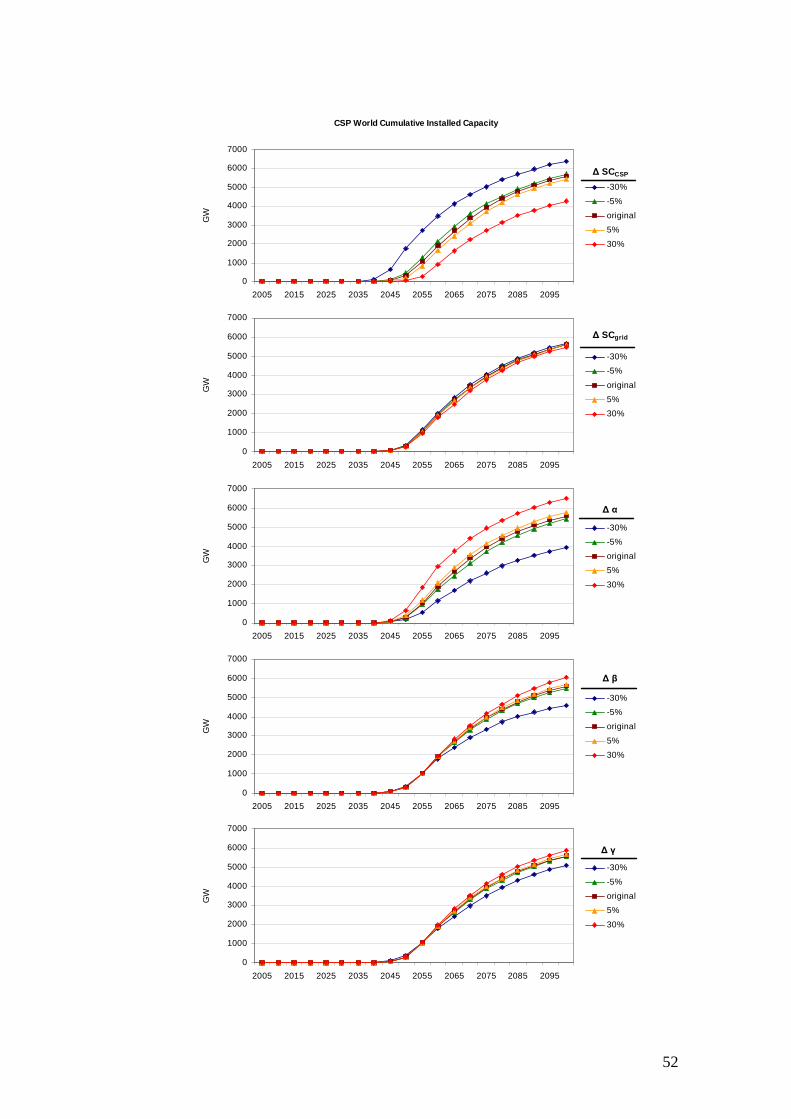
52
CSP World Cumulative Installed Capacity
0
1000
2000
3000
4000
5000
6000
7000
2005 2015 2025 2035 2045 2055 2065 2075 2085 2095
GW
-30%
-5%
original
5%
30%
∆ SCCSP
0
1000
2000
3000
4000
5000
6000
7000
2005 2015 2025 2035 2045 2055 2065 2075 2085 2095
GW
-30%
-5%
original
5%
30%
∆ SCgrid
0
1000
2000
3000
4000
5000
6000
7000
2005 2015 2025 2035 2045 2055 2065 2075 2085 2095
GW
-30%
-5%
original
5%
30%
∆ α
0
1000
2000
3000
4000
5000
6000
7000
2005 2015 2025 2035 2045 2055 2065 2075 2085 2095
GW
-30%
-5%
original
5%
30%
∆ β
0
1000
2000
3000
4000
5000
6000
7000
2005 2015 2025 2035 2045 2055 2065 2075 2085 2095
GW
-30%
-5%
original
5%
30%
∆ γ
NOTE DI LAVORO DELLA FONDAZIONE ENI ENRICO MATTEI
Fondazione Eni Enrico Mattei Working Paper Series
Our Note di Lavoro are available on the Internet at the following addresses: http://www.feem.it/getpage.aspx?id=73&sez=Publications&padre=20&tab=1
http://papers.ssrn.com/sol3/JELJOUR_Results.cfm?form_name=journalbrowse&journal_id=266659 http://ideas.repec.org/s/fem/femwpa.html
http://www.econis.eu/LNG=EN/FAM?PPN=505954494 http://ageconsearch.umn.edu/handle/35978
http://www.bepress.com/feem/
NOTE DI LAVORO PUBLISHED IN 2011 SD 1.2011 Anna Alberini, Will Gans and Daniel Velez-Lopez: Residential Consumption of Gas and Electricity in the U.S.:
The Role of Prices and Income SD 2.2011 Alexander Golub, Daiju Narita and Matthias G.W. Schmidt: Uncertainty in Integrated Assessment Models of
Climate Change: Alternative Analytical Approaches SD 3.2010 Reyer Gerlagh and Nicole A. Mathys: Energy Abundance, Trade and Industry Location SD 4.2010 Melania Michetti and Renato Nunes Rosa: Afforestation and Timber Management Compliance Strategies in
Climate Policy. A Computable General Equilibrium Analysis SD 5.2011 Hassan Benchekroun and Amrita Ray Chaudhuri: “The Voracity Effect” and Climate Change: The Impact of
Clean Technologies IM 6.2011 Sergio Mariotti, Marco Mutinelli, Marcella Nicolini and Lucia Piscitello: Productivity Spillovers from Foreign
MNEs on Domestic Manufacturing Firms: Is Co-location Always a Plus? GC 7.2011 Marco Percoco: The Fight Against Geography: Malaria and Economic Development in Italian Regions GC 8.2011 Bin Dong and Benno Torgler: Democracy, Property Rights, Income Equality, and Corruption GC 9.2011 Bin Dong and Benno Torgler: Corruption and Social Interaction: Evidence from China SD 10.2011 Elisa Lanzi, Elena Verdolini and Ivan Haščič: Efficiency Improving Fossil Fuel Technologies for Electricity
Generation: Data Selection and Trends SD 11.2011 Stergios Athanassoglou: Efficient Random Assignment under a Combination of Ordinal and Cardinal
Information on Preferences SD 12.2011 Robin Cross, Andrew J. Plantinga and Robert N. Stavins: The Value of Terroir: Hedonic Estimation of
Vineyard Sale Prices SD 13.2011 Charles F. Mason and Andrew J. Plantinga: Contracting for Impure Public Goods: Carbon Offsets and
Additionality SD 14.2011 Alain Ayong Le Kama, Aude Pommeret and Fabien Prieur: Optimal Emission Policy under the Risk of
Irreversible Pollution SD 15.2011 Philippe Quirion, Julie Rozenberg, Olivier Sassi and Adrien Vogt-Schilb: How CO2 Capture and Storage Can
Mitigate Carbon Leakage SD 16.2011 Carlo Carraro and Emanuele Massetti: Energy and Climate Change in China SD 17.2011 ZhongXiang Zhang: Effective Environmental Protection in the Context of Government Decentralization SD 18.2011 Stergios Athanassoglou and Anastasios Xepapadeas: Pollution Control: When, and How, to be Precautious SD 19.2011 Jūratė Jaraitė and Corrado Di Maria: Efficiency, Productivity and Environmental Policy: A Case Study of
Power Generation in the EU SD 20.2011 Giulio Cainelli, Massimiliano Mozzanti and Sandro Montresor: Environmental Innovations, Local Networks
and Internationalization SD 21.2011 Gérard Mondello: Hazardous Activities and Civil Strict Liability: The Regulator’s Dilemma SD 22.2011 Haiyan Xu and ZhongXiang Zhang: A Trend Deduction Model of Fluctuating Oil Prices SD 23.2011 Athanasios Lapatinas, Anastasia Litina and Eftichios S. Sartzetakis: Corruption and Environmental Policy:
An Alternative Perspective SD 24.2011 Emanuele Massetti: A Tale of Two Countries:Emissions Scenarios for China and India SD 25.2011 Xavier Pautrel: Abatement Technology and the Environment-Growth Nexus with Education SD 26.2011 Dionysis Latinopoulos and Eftichios Sartzetakis: Optimal Exploitation of Groundwater and the Potential for
a Tradable Permit System in Irrigated Agriculture SD 27.2011 Benno Torgler and Marco Piatti. A Century of American Economic Review SD 28.2011 Stergios Athanassoglou, Glenn Sheriff, Tobias Siegfried and Woonghee Tim Huh: Optimal Mechanisms for
Heterogeneous Multi-cell Aquifers SD 29.2011 Libo Wu, Jing Li and ZhongXiang Zhang: Inflationary Effect of Oil-Price Shocks in an Imperfect Market: A
Partial Transmission Input-output Analysis SD 30.2011 Junko Mochizuki and ZhongXiang Zhang: Environmental Security and its Implications for China’s Foreign
Relations SD 31.2011 Teng Fei, He Jiankun, Pan Xunzhang and Zhang Chi: How to Measure Carbon Equity: Carbon Gini Index
Based on Historical Cumulative Emission Per Capita SD 32.2011 Dirk Rübbelke and Pia Weiss: Environmental Regulations, Market Structure and Technological Progress in
Renewable Energy Technology — A Panel Data Study on Wind Turbines SD 33.2011 Nicola Doni and Giorgio Ricchiuti: Market Equilibrium in the Presence of Green Consumers and Responsible
Firms: a Comparative Statics Analysis
SD 34.2011 Gérard Mondello: Civil Liability, Safety and Nuclear Parks: Is Concentrated Management Better? SD 35.2011 Walid Marrouch and Amrita Ray Chaudhuri: International Environmental Agreements in the Presence of
Adaptation ERM 36.2011 Will Gans, Anna Alberini and Alberto Longo: Smart Meter Devices and The Effect of Feedback on Residential
Electricity Consumption: Evidence from a Natural Experiment in Northern Ireland ERM 37.2011 William K. Jaeger and Thorsten M. Egelkraut: Biofuel Economics in a Setting of Multiple Objectives &
Unintended Consequences CCSD 38.2011 Kyriaki Remoundou, Fikret Adaman, Phoebe Koundouri and Paulo A.L.D. Nunes: Are Preferences for
Environmental Quality Sensitive to Financial Funding Schemes? Evidence from a Marine Restoration Programme in the Black Sea
CCSD 39.2011 Andrea Ghermanti and Paulo A.L.D. Nunes: A Global Map of Costal Recreation Values: Results From a Spatially Explicit Based Meta-Analysis
CCSD 40.2011 Andries Richter, Anne Maria Eikeset, Daan van Soest, and Nils Chr. Stenseth: Towards the Optimal Management of the Northeast Arctic Cod Fishery
CCSD 41.2011 Florian M. Biermann: A Measure to Compare Matchings in Marriage Markets CCSD 42.2011 Timo Hiller: Alliance Formation and Coercion in Networks CCSD 43.2011 Sunghoon Hong: Strategic Network Interdiction CCSD 44.2011 Arnold Polanski and Emiliya A. Lazarova: Dynamic Multilateral Markets CCSD 45.2011 Marco Mantovani, Georg Kirchsteiger, Ana Mauleon and Vincent Vannetelbosch: Myopic or Farsighted? An
Experiment on Network Formation CCSD 46.2011 Rémy Oddou: The Effect of Spillovers and Congestion on the Segregative Properties of Endogenous
Jurisdiction Structure Formation CCSD 47.2011 Emanuele Massetti and Elena Claire Ricci: Super-Grids and Concentrated Solar Power: A Scenario Analysis
with the WITCH Model