Not Without Its Charms - colliers.com · Korean peninsula and the summit between US President ......
18
Colliers Radar Seoul sProperty 19 June 2018 Not Without Its Charms Seoul office property offers good value for tenants, and near-term attractions for investors
Transcript of Not Without Its Charms - colliers.com · Korean peninsula and the summit between US President ......

Colliers Radar
Seoul sProperty 19 June 2018
Not Without Its Charms Seoul office property offers good value for tenants, and near-term attractions for investors

Judy Jang Associate Director | Research | Seoul
Andrew Haskins Executive Director | Research | Asia
Robust demand in most Asian office
markets is driving up rents. Seoul is
more favourable to tenants, and should
see marginal rent growth and rising
vacancy over the next few years. We
advise tenants to take advantage of this
situation to negotiate new leases now.
Hong Kong and Tokyo were the top
Asian investment markets in Q1, with
Seoul third. We expect volumes in Seoul
to stay firm in H2 and 2019. Looking
further ahead, rapprochement between
South and North Korea improves
prospects for Seoul, and justifies further
reduction in the market's cap rate.
Flexible workspace is growing across
Asia. In Seoul, landlords use flexible
workspace as a tool to cut vacancy.
They should choose operator partners
and plan future strategies carefully to
exploit the concept more successfully.
Executive Summary Conditions in most Asian office leasing markets are firm.
Hong Kong, Singapore and big Chinese and Indian cities
are seeing strong demand from existing and new tenant
sectors, notably technology and flexible workspace
operators. We therefore expect prime grade office rent to
rise further in many cities in 2018, with Singapore likely
to record growth of 10-12%. Seoul is more favourable to
tenants than many other markets, with rent growth set to
be marginal and vacancy to rise over the next few years.
In our view, tenants in Seoul should take advantage of
these conditions to negotiate new leases now.
Investment property markets in Asia remain strong, and
aggregate transactions in Q1 2018 rose 24% YOY, to
USD37.4 billion, based on RCA figures. Hong Kong and
Tokyo were the top two urban investment markets. Seoul
came third, confirming firm investment demand despite
the dull occupier market. Solid yields (4.3% for Grade A
office, 4-5% for retail, 6-7% for logistics) and high sales
listings suggest demand will stay firm in H2 and 2019.
Long-run prospects for Seoul as an investment target
have improved after this year's rapprochement on the
Korean peninsula and the summit between US President
Trump and North Korea's Chairman Kim. Cap rates for
Seoul office property have declined since the GFC, but
may well fall further if financial markets remove the risk
premium traditionally applied to South Korean assets. In
the near term, political reconciliation should boost capital
values in northern Gyeonggi Province in particular.
Flexible workspace is now an integral part of the Asian
commercial property market. It accounts for 3-11% of
Grade A office space in large Asian cities, but for a much
higher proportion of new take-up, and the market should
grow further. Seoul landlords use flexible workspace
largely as a tool to lower vacancy. In our view, landlords
need to choose operator partners and devise future
strategies for flexible workspace carefully, in order to
exploit the concept more profitably and avoid pitfalls
such as the loss of an anchor tenant.
Figure 1: Summary of Asia Prime Grade office market
City Rental growth City vacancy City vacancy
Net income yld*
10 year govt Spread
(2017-21 avg pa) (Q1 2018) (2021E) (Q1 2018) bond yld
Seoul 3.3% 11.8% 14.7% 4.3% 2.7% 1.6pp
Hong Kong 2.1% 5.1% 5.0% 2.4% 2.2% 0.2pp
Singapore 4.1% 5.8% 6.4% 3.6% 2.6% 1.0pp
Shanghai 0.5% 13.6% 12.7% 3.6% 3.6% 0.0pp
Beijing -0.3% 8.7% 14.7% 4.0% 3.6% 0.4pp
Shenzhen 1.1% 11.1% 20.4% 3.9% 3.6% 0.3pp
Taipei 0.6% 12.9% 5.9% 2.8% 0.9% 1.9pp
Bangalore 4.9% 9.1% 7.0% 8.0-8.5% 7.9% 0.1-0.6pp
Source: Colliers International Research, Bloomberg

3 Not Without Its Charms | 19 June 2018 | Seoul | Property | Colliers International
Contents Seoul market at a glance .................... 4
Asian Office Market Trends ............... 5
Strong conditions in most markets .................. 5
Key market snapshots Q1 2018 ...................... 6
Seoul Office Q1: Higher vacancy due to YBD ................................................. 8
Forecast at a glance ........................................ 8
Leasing Market ................................................ 8
Supply ............................................................. 8
Vacancy Rate and Rent ................................... 9
Outlook ............................................................ 9
Asian Investment Market Trends ..... 10
Market conditions remain firm in Q1 .............. 10
Korean market strong in Q1 2018 ................. 11
Seoul yields above Asian averages ............... 11
Long-run prospects less attractive ................. 12
Rapprochement between the two Koreas a positive surprise ............................................ 13
Implications of reconciliation .......................... 13
Seoul Investment Q1: Still Active .... 14
Forecast at a glance ...................................... 14
Capital Markets: transactions active .............. 14
Asian Flexible Workspace Trends ... 15
Flexible workspace impacts the Seoul office market ..................................... 16
Flexible workspace business status .............. 16
Transaction market impact ............................ 16

4 Not Without Its Charms | 19 June 2018 | Seoul | Property | Colliers International
Seoul market at a
glance Office market
Seoul Office Market: Demand and Supply
Source: Colliers International Korea
Seoul Office Market: Grade A Rent and Vacancy
Source: Colliers International Korea
Seoul Office Market: Supply Forecasts
Source: Colliers International Korea
Investment market
Asia property transaction volumes by country in Q1 2018 (USD, YOY)
Note. These totals exclude undeveloped land. Source: RCA as of 8
May 2017; calculations by Colliers
Asia property transaction volumes by urban centre in Q1 2018 (USD, YOY)
Note. These totals exclude undeveloped land. Source: RCA as of 8
May 2017; calculations by Colliers
0.0%
2.0%
4.0%
6.0%
8.0%
10.0%
12.0%
14.0%
16.0%
(50)
-
50
100
150
200
GLA
('000 s
qm
)
New Supply Net Absorption Vacancy
0%
5%
10%
15%
20%
0
5,000
10,000
15,000
20,000
25,000
30,000
Vacancy
Rate
(%
)
Rent
(KR
W/s
q.m
./m
o)
Overall Rent Vacancy Rate (%)
0
200
400
600
800
1,000
2010 2011 2012 2013 2014 2015 2016 2017 2018 2019 2020
000
sqm
CBD GBD YBD Others
Investment Property Transactions in Asian Cities
US$ million Q1 2017 Q1 2018 YoY
Japan 11,715 13,148 12%
China 7,415 9,222 24%
Hong Kong 4,195 7,877 88%
South Korea 2,783 4,404 58%
Singapore 1,587 995 -37%
Taiwan 500 515 3%
India 289 441 53%
Malaysia 369 107 -71%
Thailand 618 33 -95%
Vietnam 78 17 -78%
Investment Property Transactions in Asian Cities
US$ million Q1 2017 Q1 2018 YoY
Hong Kong 4,195 7,877 88%
Tokyo 4,594 6,864 49%
Seoul 1,793 3,613 102%
Shanghai 4,436 1,065 -76%
Nagoya 196 1,006 413%
Singapore 1,587 995 -37%
Guangzhou 179 958 435%
Beijing 917 675 -26%
Yokohama 1,453 566 -61%
Fukuoka 172 291 69%
5 Not Without Its Charms | 19 June 2018 | Seoul | Property | Colliers International
Asian Office
Market Trends
Strong conditions in most markets
> Economic growth in Asia remains robust. China,
Japan, South Korea, Hong Kong, and Singapore all
saw growth accelerate in 2017 (and in some cases
Q1 2018), with only mild slowdowns likely over the
rest of this year. Furthermore, after a disappointing
2018, momentum in India is now rebounding sharply.
> Hong Kong, Singapore, and leading Chinese and
Indian cities are seeing strong office leasing demand
from existing and new occupier sectors (e.g. finance,
technology, and flexible workspace operators).
> Consequently, we expect prime grade office rent to
rise further in many cities in 2018. Singapore has
entered a multiyear upcycle, and should see the
highest rent growth of all this year, at 10-12%.
> Tier 1 Chinese cities, notably Shenzhen and
Guangzhou, face heavy new office supply over the
next few years. However, in our view demand can
absorb this supply without major downward pressure
on rents.
> India saw a 23% YOY increase in gross office
absorption in Q1, driven by finance and technology,
but also flexible workspace and manufacturing.
Colliers advises large occupiers looking for modern
buildings to make pre-commitments to space,
especially in low-vacancy markets like Bengaluru,
Pune and Hyderabad.
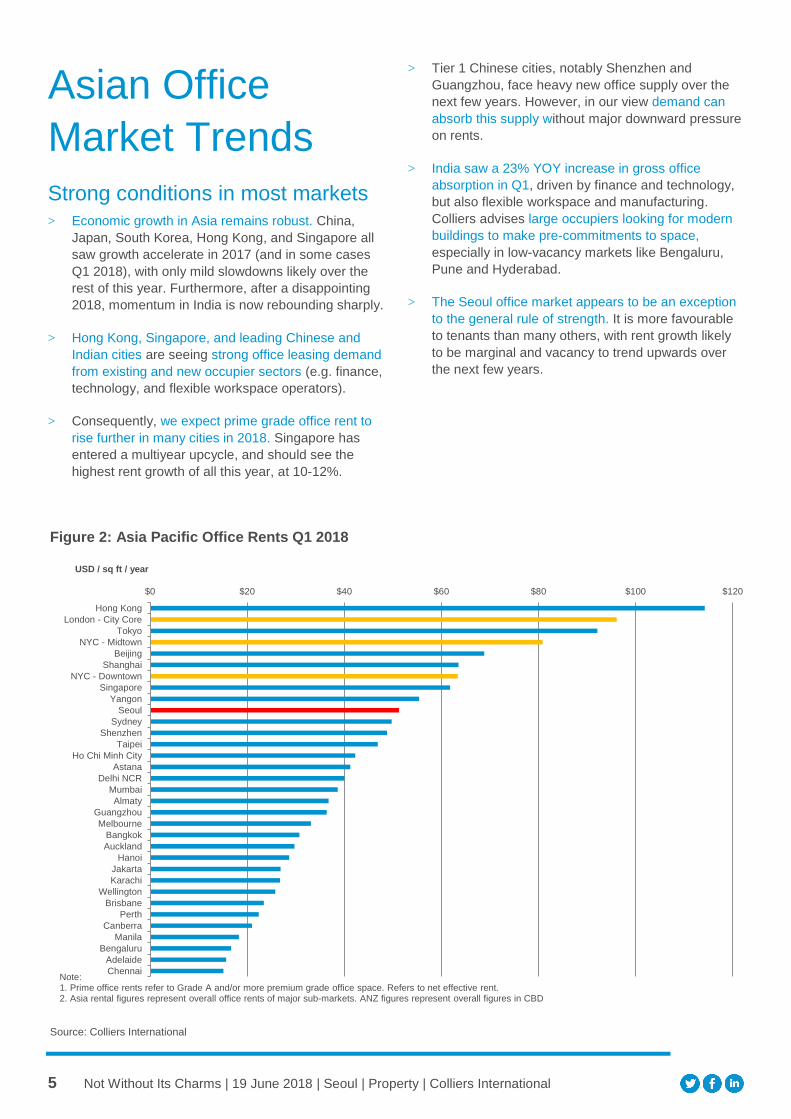
> The Seoul office market appears to be an exception
to the general rule of strength. It is more favourable
to tenants than many others, with rent growth likely
to be marginal and vacancy to trend upwards over
the next few years.
Figure 2: Asia Pacific Office Rents Q1 2018
Source: Colliers International
$0 $20 $40 $60 $80 $100 $120
Hong Kong
London - City Core
Tokyo
NYC - Midtown
Beijing
Shanghai
NYC - Downtown
Singapore
Yangon
Seoul
Sydney
Shenzhen
Taipei
Ho Chi Minh City
Astana
Delhi NCR
Mumbai
Almaty
Guangzhou
Melbourne
Bangkok
Auckland
Hanoi
Jakarta
Karachi
Wellington
Brisbane
Perth
Canberra
Manila
Bengaluru
Adelaide
Chennai
USD / sq ft / year
Note: 1. Prime office rents refer to Grade A and/or more premium grade office space. Refers to net effective rent.2. Asia rental figures represent overall office rents of major sub-markets. ANZ figures represent overall figures in CBD

6 Not Without Its Charms | 19 June 2018 | Seoul | Property | Colliers International
Key market snapshots Q1 2018
Hong Kong
Singapore
Source: Colliers International
Source: Colliers International

7 Not Without Its Charms | 19 June 2018 | Seoul | Property | Colliers International
Shanghai
Bengaluru
Source: Colliers International
Source: Colliers International

8 Not Without Its Charms | 19 June 2018 | Seoul | Property | Colliers International
Seoul Office Q1:
Higher vacancy
due to YBD Despite sustained demand in the CBD and GBD due
to economic strength, overall Grade A vacancy in
Seoul increased due to new supply in the YBD.
Although serviced office providers are in expansion
mode, we expect the tenant-oriented market to
persist until 2020 due to new supply. Therefore,
occupiers should take advantage of the tenant-
oriented market conditions to negotiate new leases.
Forecast at a glance
Demand Leasing demand in the IT sector
should be sustained due to economic
strength. In addition, we think demand
for flexible workspace will grow.
Supply In the CBD, Centropolis Building (4%
of total surveyed stock in CBD) will be
completed in H2 2018. In the GBD,
Luchen Tower and Gangnam N
Tower will be completed in H2. These
will boost total stock in the GBD by
4%. Over the next three years, we
expect total new supply in prime
areas to exceed 1.3 million sq m (14.9
million sq ft).
Vacancy rate The overall Grade A vacancy rate will
continue to increase due to the LG
Group's relocation and new supply.
We expect vacancy to rise to a peak
of nearly 17.0% in 2020 due to heavy
new supply in YBD and, but to fall
back to 14.0% by end-2022.
Rent Face rent has increased due to
cyclically adjusted terms as some
buildings increased the rent level at
the start of 2018. We estimate a 2%
rent increase in Seoul this year linked
to the CPI. We expect rental growth
over the next few years to be
marginal, there could be an increase
of 2-3% per annum on average.
Leasing Market
Demand
Net absorption in the Seoul Grade A office market fell by
27,928 sq m (300,610 sq ft) in Q1 2018 QOQ due to the
YBD market. CBD and GBD increased by 10,913 sq m
(117,464 sq ft) and 8,300 sq m (89,340 sq ft),
respectively, while the YBD fell by 47,140 sq m.
(507,415 sq ft).
Certain companies are actively upgrading and signing
new lease contracts as they expand their business due
to economic strength. The CBD area's Seoul City Tower
resolved 514 sq m (5,530 sq ft) of vacancy after
completing lease expansion contracts with BNP Paribas
and NH Insurance. In addition, Shinhan Life Insurance
and Shinhan Data system took up about 1,300 sq m
(13,995 sq ft) of office space in Shinhan L Tower. Oil
Hub Korea leased 2,023 sq m (21,775 sq ft) in the Seoul
Square building, moving from the B Grade Building
where it was previously resident.
There is strong demand from growth sectors in the IT
industry. Tera Fintech, the local crowd-funding company,
leased 1,523 sq m (16,395sq ft) in the SI Tower, to
relocate headquarters. South Korea’s cryptocurrency
exchange, Bithumb, leased 2,878 sq m (30,980 sq ft) in
the KT&G Dachie Tower to expand its call centre in the
GBD area. Meanwhile, Amazon Korea leased 2,768 sq
m (29,795 sq ft) in the Pine Avenue A building to open a
new call centre in the CBD area.
Supply
The Korean Teachers Credit Union (KTCU) building, with
83,381 sq m (897,505 sq ft) of gross floor area, was
finished in Q1 2018. About 40% of KTCU is dedicated to
self-use and the other 60% is leased to KB Securities.
Fig. 3: Seoul Office Market: Demand and Supply
Source: Colliers International Korea.
0.0%
2.0%
4.0%
6.0%
8.0%
10.0%
12.0%
14.0%
16.0%
(50)
-
50
100
150
200
GLA
('000 s
qm
)
New Supply Net Absorption Vacancy

9 Not Without Its Charms | 19 June 2018 | Seoul | Property | Colliers International
Vacancy Rate and Rent
The average vacancy rate in the CBD stood at 11.3% at
end-Q1, a slight decrease from end-2017. The expected
relocation from the CBD to other areas of companies
including Daewoo Construction and public institutions
will push up the CBD’s vacancy rate in H2 2018. We
predict 15.0% for end-2018.
The GBD vacancy rate fell by 0.3 percentage points to
6.0%, thanks to the limited supply and increased
demand in the IT industry.
The YBD vacancy rate increased by 8.3 percentage
points to 22.3% due to vacant storeys in the newly
completed KTCU and the relocations of some
companies out of the YBD. As LG CNS relocated to LG
Science Park in Magok, FKI Tower's vacant area was
added to the YBD market. In addition, the relocation of
KTCU created backfill space in 63 Building after KTCU
moved out.
The average asking rent of overall Grade A offices
increased to KRW27,182 (USD25.2) per sq m per
month, a 2% increase from Q4 2017 as most office
buildings adjusted their rates similar to the CPI level at
the start of 2018.
Fig. 4: Seoul Office: Grade A Rent and Vacancy
Source: Colliers International Korea
Figure 5: Q1 2018 Vacancy and Rent Level
Source: Colliers International Korea
Outlook
The economic indices of South Korea are showing
hopeful signs of strength. Although demand for Grade A
office space in Seoul is recovering, the upward trend in
vacancy rates in the market is likely to continue due to
the emergence of backfill spaces by new supply.
In the CBD area, Summit Tower and Seosomun Building
(6% of total surveyed stock in the CBD) are due to be
completed in 2019. If Daewoo E&C, which is developer
of the building, relocates to Summit Tower, the Daewoo
E&C headquarter will become available. Thus, the rise in
the CBD vacancy rate should continue in 2019.
Meanwhile, the expected new supply will be quickly filled
due to the limited prime office supply and increasing
flexible workspace tenants in the GBD.
In the YBD area, the Parc 1, with 336,610 sq m.
(897,505 sq ft) of gross floor area, will enter the market
in 2020. The KB Finance’s headquarters building and the
Korea Post office building are also expected to be
completed in 2020. Moreover, the Private School
Pension Building is expected to start its re-construction
in 2018 with completion slated in 2022. Although some
areas of new completions will likely be owner-occupied,
the relocation of headquarters from existing buildings to
new supply will create some backfill space. Currently,
market conditions favour tenants, and we assume that
this will remain the case until 2020.
Figure 6: Seoul Office Market: Supply Forecasts
Source: Colliers International Korea
0%
5%
10%
15%
20%
0
5,000
10,000
15,000
20,000
25,000
30,000
Vacancy
Rate
(%
)
Rent
(KR
W/s
q.m
./m
o)
Overall Rent Vacancy Rate (%) 0
200
400
600
800
1,000
2010 2011 2012 2013 2014 2015 2016 2017 2018 2019 2020
000
sqm
CBD GBD YBD Others
SUBMARKET VACANCY (%) RENT(KRW/SQM/MO)
CBD 11.3% 31,328
GBD 5.95% 26,800
YBD 22.3% 23,416
OVERALL 11.8% 27,182

10 Not Without Its Charms | 19 June 2018 | Seoul | Property | Colliers International
Asian Investment
Market Trends
Market conditions remain firm in Q1
> Property investment in Asia maintained the strength
of recent years and hit the highest Q1 level since
2007 in Q1 2018, with completed property
transactions reaching USD37.4bn, up by 24% YOY.
> Hong Kong and Tokyo were the most active cities,
recording transactions of completed properties worth
USD7.9bn (+88% YoY) and USD6.9bn (+49% YoY)
in Q1 2018, respectively.
> Looking ahead, we expect the investment market in
India (+53% YOY) to continue maturing, while Japan
should recover further from dull volumes in 2017.
> Valuations of most categories of investment property
look rich, with yield spreads over ten-year bonds for
prime-grade office property mostly in a range of 0-2
percentage points. However, according to our
Valuations team's latest Asia Cap Rates report1
capitalisation rates in Asia are mostly either stable or
still declining.
> We therefore now assume around 10% growth in
transaction volumes for completed properties in
2018. The chief risk to this view is not weak demand
or availability of capital, but potential lack of high-
quality properties available for sale.
1 Valuation & Advisory Services | Asia "Asia Cap Rates" Q1 18
Figure 8: Investment Property Transactions in Asia
Source: Real Capital Analytics (as of 15 May 2018) for closed deals of
properties over USD10 million, excluding land development sites
0
20
40
60
80
100
120
140
US
$ b
illio
ns
Figure 7: Summary of Asia Prime Grade office market
City Rental growth City vacancy City vacancy
Net income yld*
10 yr govt. Spread
(2017-21 avg pa) (Q1 2018) (2021E) (Q1 2018) bond yield
Seoul 3.3% 11.8% 14.7% 4.3% 2.7% 1.6pp
Hong Kong 2.1% 5.1% 5.0% 2.4% 2.2% 0.2pp
Singapore 4.1% 5.8% 6.4% 3.6% 2.6% 1.0pp
Shanghai 0.5% 13.6% 12.7% 3.6% 3.6% 0.0pp
Beijing -0.3% 8.7% 14.7% 4.0% 3.6% 0.4pp
Shenzhen 1.1% 11.1% 20.4% 3.9% 3.6% 0.3pp
Taipei 0.6% 12.9% 5.9% 2.8% 0.9% 1.9pp
Bangalore 4.9% 9.1% 7.0% 8.0-8.5% 7.9% 0.1-0.6pp
Note. This table is repeated from Figure 1 above. Source: Colliers International Research, Bloomberg

11 Not Without Its Charms | 19 June 2018 | Seoul | Property | Colliers International
Korean market strong in Q1 2018
According to RCA, total property transaction volumes for
South Korea increased by 58% YOY in Q1 2018, to
USD4.4 billion. This represents a significantly stronger
outcome than over 2017 as a whole, for which the
increase was just 7% (to USD14.3 billion). RCA notes
that domestic capital was the driving force behind the
high deal volumes in South Korea in the period.
It is noteworthy that Seoul accounted for over 80% of
total transactions in South Korea: deals in the capital
more than doubled YOY in Q1 2018, to USD3.6 billion.
Accordingly, Seoul ranked as the no.3 urban investment
market in Asia in Q1 after Hong Kong and Tokyo.
Seoul yields above Asian averages
Above-average property yields make Seoul attractive as
a near-term investment target. As shown in Figure 6,
Grade A office property in Seoul offers a net yield of
4.3%, compared to no higher than 4.0% for most other
leading Asian cities except Bangalore, and as low as
2.4% for Hong Kong. Moreover, Seoul office property
offers a spread over ten-year government bonds of 1.5
percentage points, versus very narrow spreads for Hong
Kong and Tier 1 Chinese cities.
Looking at other categories of investment property, retail
property in Seoul yields 4.0-5.0%, compared to 2.3-2.5%
in Hong Kong but a similar range of 4.2-5.0% in
Singapore. Logistics property around Seoul yields 6.0-
7.0%, far above Hong Kong on 3.5-3.7% and above
most leading Chinese cities in a range of 5.0-6.7%.
Figure 8: Asia property transaction volumes by country in Q1 2018 (USD, YOY)
Investment Property Transactions in Asian Countries
US$ million Q1 2017 Q1 2018 YoY
Japan 11,715 13,148 12%
China 7,415 9,222 24%
Hong Kong 4,195 7,877 88%
South Korea 2,783 4,404 58%
Singapore 1,587 995 -37%
Taiwan 500 515 3%
India 289 441 53%
Malaysia 369 107 -71%
Thailand 618 33 -95%
Vietnam 78 17 -78%
Note. These totals exclude undeveloped land. Source: RCA as of 8 May 2017; calculations by Colliers
Figure 9: Asia property transaction volumes by urban centre in Q1 2018 (USD, YOY)
Investment Property Transactions in Asian Cities
US$ million Q1 2017 Q1 2018 YoY
Hong Kong 4,195 7,877 88%
Tokyo 4,594 6,864 49%
Seoul 1,793 3,613 102%
Shanghai 4,436 1,065 -76%
Nagoya 196 1,006 413%
Singapore 1,587 995 -37%
Guangzhou 179 958 435%
Beijing 917 675 -26%
Yokohama 1,453 566 -61%
Fukuoka 172 291 69%
Note. These totals exclude undeveloped land. Source: RCA as of 8 May 2017; calculations by Colliers

12 Not Without Its Charms | 19 June 2018 | Seoul | Property | Colliers International
In our opinion, high transaction volumes in Seoul partly
reflect interest in the market from foreign institutional
investors looking to diversify their portfolios who perceive
South Korea as a relatively stable market providing solid
investment yields. As noted, Grade A office property in
Seoul offers a net yield 1.6 percentage points above ten-
year government bonds, and 1.8 percentage points
above the five-year government bonds (currently yielding
2.5%) which some Korean investment institutions seem
to use as a benchmark. Investment property in Seoul
therefore offers good value to both foreign and domestic
institutions.
We see little chance that capital values will decline in the
near term, with the result that property that offers good
value now offers significantly better value in a few
months' time. The key reason for this is that the pace of
monetary tightening in South Korea looks set to be very
gradual. The Bank of Korea tightened interest rates for
the first time in six years in November 2017, when it
raised the seven-day repurchase rate from 1.25% to
1.5%. However, not only is the outlook for inflation
benign, but also the government seems likely to retain
an accommodative bias in fiscal policy as President
Moon pushes ahead with a domestic agenda of job
creation and increased welfare provision.
Oxford Economics predicts that the short-term nominal
interest rate will rise gradually to 3.5% by end-2021.
Between Q2 2018 and Q4 2021, it predicts that CPI
inflation will only increase from 1.7% to 2.0%2. On the
basis of these forecasts, real (i.e. inflation-adjusted)
short-term interest rates, which stand at about zero now,
will stay below about 1% until end-2020. Persistent low
real interest rates should support capital values and
investment activity in the property market.
Long-run prospects less attractive
The attractions of relatively high yields in Seoul are
offset by lower long-run economic growth and poorer
demographic prospects than for many other Asian cities.
While the South Korean economy is performing well right
now, for the country as a whole Oxford Economics
projects average real GDP growth over 2017-2021 at
2.7%, and over 2022-2026 at 2.3%. Such growth rates
are well below those of developing markets such as
India, Indonesia and, indeed, China, for which Oxford
Economics predicts average real GDP growth over
2017-2021 of 6.1%, and over 2022-2026 of 4.9%.
The contrast in terms of economic growth is most
evident at the city level. Figure 9 below compares real
2 Please see "Country Economic Forecast, South Korea" by Oxford
Economics (9 May 2018).
GDP growth rates over the next five years for major Asia
Pacific investment centres. Bangalore is at the top, and
Seoul is second from last. Seoul does outperform Tokyo,
a city with which comparisons are obvious.
Figure 9: Real GDP growth (%), 2018-2022
Source: Oxford Economics. HK = Hong Kong, SG = Singapore, BG =
Bangalore
Incidentally, it should be clear from Figure 9 that Seoul
will only be growing at about 1.5-2.5% over the next five
years, compared to Oxford Economics' forecast for
average real GDP growth for South Korea as a whole
over 2017-2021 of 2.7%. The reason why Seoul is
underperforming the national average is that South
Korea has a strong competitive advantage in advanced
manufacturing, but is less strong in services, and the
economy of Seoul is mostly services-based.
In addition, weaker long-run economic growth prospects
for Seoul partly reflect a weak demographic profile. The
population of Seoul is currently shrinking, although
Oxford Economics expects the rate of decline to
moderate over the next few years.
Fig. 10: Average population growth, 2018-2022
Source: Oxford Economics. HK = Hong Kong, SG = Singapore, BG =
Bangalore
0.0%
2.0%
4.0%
6.0%
8.0%
10.0%
2018 2019 2020 2021 2022
Seoul HK SG ShanghaiBeijing Shenzhen Taipei BGSydney Tokyo
-0.5%
0.0%
0.5%
1.0%
1.5%
2.0%
2.5%

13 Not Without Its Charms | 19 June 2018 | Seoul | Property | Colliers International
Rapprochement between the two Koreas a positive surprise
An important positive surprise for investors in the Seoul
property market has come from the recent easing of
tensions between North Korea and South Korea.
Investors in financial assets in South Korea – whether
equities, bonds or property – have lived within the
possibility of conflict on the peninsula ever since the
Korean War ended with an armistice in 1953.
The summit held in late April 2018 in Panmunjom
between President Moon Jae-in of South Korea and
Chairman Kim Jong-un of North Korea marked the first
time that a North Korean leader had entered the South
since the end of the war. Immediately after this summit,
optimism increased about the scope for broader
reconciliation between the two Koreas, and perhaps
eventual reunification. The fact that President Donald
Trump of the US and President Xi Xinping of China had
made a significant contribution to the peace process was
perceived as another factor encouraging factor.
Optimism has increased further following the summit
held in Singapore on 12 June between US President
Trump and North Korea's Chairman Kim. In the wake of
the decision by the US in early May to withdraw from an
international nuclear agreement with Iran, we had
become sceptical about prospects for a further major
diplomatic breakthrough on the Korean peninsula. In the
event, we were too cautious. One could argue that the
Singapore summit resulted only in a commitment on
North Korea's part to the denuclearisation of the Korean
peninsula. Nevertheless, this is a major step forward;
and it is encouraging that the US and North Korea are
talking and negotiating with each other.
Overall, the degree of rapprochement between North
Korea on the one hand and South Korea and the US on
the other so far in 2018 has positively surprised most
international observers. It seems reasonable to hope for
continued progress towards reconciliation between the
two Koreas. Such progress should reduce concern
among foreign investors and property occupiers about
exposure to Seoul – a city which lies only about 55
kilometres from the border with North Korea.
If the perception spreads that the risk of conflict on the
Korean peninsula has permanently diminished, the
consequence might be the removal of the "risk premium"
traditionally applied to South Korean financial assets.
While capitalisation rates for Seoul office property have
been declining steadily ever since the Global Financial
Crisis of 2007-2008 to the present 4-5% range, we have
observed that they remain higher than in much of the
rest of Asia. For property investors, removal of the risk
premium might imply a permanent reduction in perceived
appropriate cap rates and a consequent increase in
capital values.
Implications of reconciliation
Interest in real estate investment in the Paju and
Yeoncheon districts, which border on Panmunjeon
where the Moon-Kim summit took place, continues to
increase. We expect that the rise of property prices in
some areas, especially in the northern part of Gyeonggi
Province, will affect the overall real estate market in
Seoul. The investment demand of liquid funds that has
been focused up to now on the housing market in central
Seoul will probably extend to other places such as the
land market skirting around Seoul. During his election
campaign, President Moon made a pledge to link Paju,
Kaesong, and Haeju into a unified economic zone. The
special economic zone of Tongil specialises in
developing border areas such as industrial complexes
and multiple cities by linking Paju, Gaeseong, and Haeju.
If the development of the Special Economic Zone comes
to fruition, real estate investors' attention will be
concentrated on the Gyeonggi region.
Looking further ahead, it is reasonable to expect political
reconciliation to contribute to a modest acceleration of
economic growth in South Korea compared to existing
estimates, to an improvement in consumer sentiment,
and to further growth in tourist arrivals. All these factors
ought to support the property market in Seoul and South
Korea in general.
It is probably too early to speculate about the
implications of eventual Korean reunification for the
Seoul property market. However, it may be instructive to
compare Seoul with Berlin. After the reunification of
Germany in 1990, it took 15-20 years for Berlin to
develop into a major international city attracting investors
and multinational corporate occupiers from around the
world. For investors in Seoul commercial property, that
may suggest a long wait ahead. However, at least the
start of the road now appears to be in sight.

14 Not Without Its Charms | 19 June 2018 | Seoul | Property | Colliers International
Seoul Investment
Q1: Still Active Based on Colliers' figures for nine major office
buildings, total transaction volume in Seoul in Q1
2018 stood at KRW2.4 trillion (USD2.3 billion).
Looking ahead, we expect that total market
transaction size for 2018 will exceed KRW7.0 trillion
(USD7.0 billion) as many properties will be put up for
sale. We expect the Seoul office investment market
to continue to thrive for as long as the real interest
rate stays low.
Forecast at a glance
Demand
Actual 2017 aggregate transaction
size was about KRW7.0 trillion
(USD7.0 billion). If expected sales are
completed successfully, the office
transaction volume in 2018 will equal
or exceed the total transacted volume
in 2017.
Foreign Investors
Foreign investors’ inbound investment
led Seoul office deals in 2016, with
44% coming from foreign investors. In
2017, total office transaction volume
stood at KRW7.0 trillion (USD7.0
billion), of which total only15% came
from foreign investors. For investment
portfolio diversification, we expect
foreign investors to expand their
investment in Korea again.
Price
The average sales value rose in Q1,
thanks to prime building transactions
like the K-Twin Tower, representing
the highest unit price transacted for
buildings sold in Seoul. We expect the
sale price of Grade A buildings to stay
broadly stable until 2020, reflecting
low real interest rates but competitive
conditions in the occupier market.
While investors' appetite for office
buildings is high, vacancy remains a
critical issue, and we expect funding
to stay challenging for buildings with
high vacancy rates.
Capital Markets: transactions active
In Q1 2018, the K-Twin Tower (83,878 sq m by GFA),
previously owned by KKR and LIM, was purchased by
Samsung SRA Asset Management for KRW714 billion
(USD664 million), implying a unit price of KRW28 million
per pyeong (USD7,926 per sq m). The sale of this
property broke the record for unit prices in Seoul.
Investors are now increasing their focus on major
investment areas such as Pangyo, which currently
enjoys a low vacancy rate. Pangyo has emerged as a
viable alternative office location. Mirae Asset
Management has acquired the ALPHADOM 6-3 Tower
from Hana Asset Management for KRW460 billion
(USD429 million). In addition, LH plans to sell the
ALPHADOM 6-4 Tower, located near the ALPHADOM 6-
3 Tower, to a public REITs Elsewhere, East Central
Tower, which is located in the Gangdong area, was
purchased by Millinium Inmark Asset for KRW340 billion
(USD316 million).
Value-added strategies are increasingly being adopted in
the Seoul investment property market. Pebble Stone
Asset Management has purchased the Hana Card HQ
building for KRW73 billion (USD61 million). As Hana
Card is moving out, the Hana Card HQ building remains
vacant. However, Pebble Stone was able to close trhe
deal successfully by implementing a value-added
strategy. A consortium of Mastern Investment
Management and Angelo Gordon purchased KB Bank
Myeongdong HQ building for KRW241 billion (USD 202
million). The investors plan to redevelop the property into
a retail and hotel site.
Looking ahead, many Grade A buildings, including the
Centropolis building, the Samsung C&T Corporation's
headquarters, and KDB Life insurance Tower are due to
be put on the market. In addition, major conglomerates
like Samsung Group continue to put up their real estate
holdings for sale. Despite concerns over high vacancy
rates, institutional investors appear to be investing
actively in alternative assets due to the environment of
prolonged low interest rates. The majority of domestic
investors still prefer stable assets that guarantee long-
term tenants. Unlike domestic investors, foreign
investors are taking a long-term perspective even
regarding high vacancy rates. Foreign investors with
ample operating experience are buying buildings with a
vacancy rate of 50% or more, attracting tenants, and
pursuing strategies to return the assets to domestic
institutional investors. Thus, foreign investors are
increasing their exposure to property holdings for their
investment portfolio diversification in Korea. We have
seen that there is also increasing interest among
investors in value-add investment strategies, and we
expect this interest to persist.

15 Not Without Its Charms | 19 June 2018 | Seoul | Property | Colliers International
Asian Flexible
Workspace
Trends "Flexible workspace is no longer a disruptor, nor a
complementary sub-sector to the office market. It is a
fundamental part of the commercial real estate market
and a sector in its own right, growing in size and
importance to landlords and occupiers. The average
flexible workspace leasing term is now over 24 months,
up from 12 months in 2013, demonstrating that it is now
competition to traditional office space.
We have seen continued growth in the sector…. This
growth has been fuelled by the thirst for flexibility from
multinational corporations, evidenced by the percentage
of deals for 15 desks or more increasing to 48% in 2017
from 32% in 2016, which in turn was up from 12% in
2014." From "The Flexible Workspace Outlook Report 2018 (APAC)"
(March 2018), by Colliers International
The flexible workspace market in Asia has become far
more sophisticated, and now spans a wide range of
products lying between coworking and traditional
serviced offices. Since flexible workspace is a low-
margin business with low barriers to entry, flexible
workspace operators need to continue to enhance their
offerings. There has been a movement away from banks
of cellular offices to larger, more customised spaces.
Increased sophistication is driving increased popularity.
The flexible workspace market therefore continues to
expand across Asia. In the CBDs of most major cities,
flexible workspace still accounts for less than about 5%
of occupied prime grade office space; exceptions include
Bangalore and Chengdu, on 11% and 9% respectively.
However, flexible workspace operators have become an
important source of demand for new leased space. In
Shanghai, for example, flexible workspace operators
presently account for 4% of aggregate Grade A office
space, but for about 8% of new take-up of leased space.
Tenant mix, Shanghai Grade A office (end-2017)
Source: Colliers International
Tenant mix of new take-up Shanghai Grade A office (2017)
Source: Colliers International
Finance, 42%
Professional Service, 16%
TMT, 9%
Flexible workspace,
4%
Manufacturing, 8%
Medical & Health, 5%
Trading, 8%
Fashion, 3%FMCG, 2%Others, 3%
Finance, 35%
Professional Service, 21%
TMT, 12%
Flexible workspace,
8%
Manufacturing, 7%
Medical & Health, 5%
Trading, 4%
Fashion, 2%FMCG, 2% Others, 5%
Flexible Workspace in Asia: Market Indicators
Source: Colliers International

16 Not Without Its Charms | 19 June 2018 | Seoul | Property | Colliers International
Flexible workspace
impacts the Seoul
office market The expansion of the flexible workspace has an
influence not only on the office leasing market but also
on the transaction market. In a market favouring tenants,
landlords use the flexible office operators as a new tool
to lower vacancy rates. Flexible workspace is also used
as a means to raise the value of buildings in order to
close sales successfully. In a market situation favouring
tenants, we expect that flexible workspace operators will
be able to earn higher profits with favourable lease
terms. However, if the area occupied by the flexible
workspace operator is large, depending on its strategy
the landlord may not benefit. The landlord will not be
able to change the term conditions due to the long-term
contract.
We expect demand for flexible workspace to continue to
expand. However, since both domestic companies and
major companies which own buildings are entering the
flexible workspace market together, competition between
domestic and overseas companies is likely to become
intense. Therefore, in order to be a win-win partner for a
flexible workspace operator and a landlord, it is
necessary to consider effective leasing strategies based
on market forecasts.
Flexible workspace business status
The expansion of the flexible workspace market has had
a major impact on the office leasing market and the
investment market in Seoul since WeWork, the global
flexible workspace operator, entered the domestic
market in 2016.
The leasing demand for large Grade A office-space was
stable due to major companies' increased demand for
headquarters relocation in 2014. However, the vacancy
rate has continued to rise since 2015 due to the
economic downturn and new office supply. The demand
for leased office space has been recovering over 2017
and 2018, with Gangnam as the centre of the flexible
workspace sector driven by WeWork since 2016. Due to
the rise of tech-related start-ups, which prefer cost-
effective office space, flexible workspace has emerged
as an alternative method to lower vacancy rates.
In particular, as of April 2018, WeWork has opened 10
branches in Seoul within two years of entering the
market. WeWork has had a significant impact on
lowering office vacancy rates by leasing ten or more
floors in major buildings with high vacancy rates. For
example, in the case of the HP building in the Yeoido
area, in which seven floors were vacant, WeWork leased
tall the vacant floors and reduced vacancy in the building
to zero.
Preference for flexible workspace has expanded beyond
Gangnam, a region which IT ventures or start-ups prefer,
and now to Gangbuk. Recently, WeWork leased eight
floors of Jongno Tower and plans to open its tenth
branch in September. This is because demand for start-
ups as well as domestic large companies is increasing.
Not only global but also domestic flexible workspace
operators are actively opening new branches. A
representative flexible workspace company in Korea is
FastFive, which was launched in March 2015. As of
November 2017, it operates 12 branches and recently
opened a Hongdae branch.
In addition, large companies are entering the shared
office market to decrease vacancy in their buildings and
to discover new business opportunities. In fact, Hanwha
Life recently opened a 'Dream Plus Gangnam' shared
office of 15 stories in the Hanwha Life Seocho Building.
In addition, the Hyundai Card has a 'Studio black' and
A-ju group operates ‘Spacrap’.
Present state of WeWork in Seoul
Building Submarket Area (SQM) Open date
Hongwoo GBD 6,500 Aug. 2016
Dashin Security CBD 20,000 Feb. 2017
Ilsong Building GBD 13,080 Aug. 2017
Arc Place GBD 5,801 Dec. 2017
K-Twin Tower CBD 6,930 Mar. 2018
HP Building YBD 12,356 April. 2018
Seoul Square CBD 17,852 May. 2018
Daese Building GBD 9,205 June. 2018
PCA Life Tower GBD 11,918 July. 2018
Jongro Tower CBD 12,742 Sep. 2018
Total Operating 10 locations
Source: Colliers International
Transaction market impact
Flexible workspace also has a significant impact on the
successful closure of commercial real estate
transactions. Flexible workspace operations can involve
the leasing of large areas of office space for long
periods, and so can increase the value of buildings by

17 Not Without Its Charms | 19 June 2018 | Seoul | Property | Colliers International
lowering vacancy. In fact, KTB Asset Management was
recently able to close the Ilsong Building (WeWork
Building) acquisition by securing WeWork as a key
tenant and attracted investors in a timely manner when
Seoul’s office vacancy rate is high.
In addition, the K-Twin Tower was the first Korean
commercial real estate that Kohlberg Kravis Roberts
(KKR) invested in, and has recorded the highest unit
price at KRW310 billion (USD289 million) so far in 2018,
purchased by Samsung SRA Asset Management.
Although the building was vacant when the KTCU first
invested, it was able to close the deal successfully by
effectively managing the vacancy rate by leasing to
Microsoft and WeWork. Meanwhile, NC Tower 2 was
able to complete a successful sale of Igis Asset
Management, as Fast Five leased the vacant space
where Cupang had moved out.
The asset manager uses the flexible workspace as a
marketing point to attract institutional investors. In fact,
most of the 10 branches which WeWork has leased are
owned by asset management companies. Arc Place is
owned by Blackstone. Seoul Square and Jongno Tower
are owned by Alpha Investment. In addition, HP Building
is owned by CBRE Global Investor Asset Management
and is put on the market.
Looking ahead, we expect flexible workspace to continue
to have an impact on office leasing and investment
markets, as high growth continues. Flexible workspace
companies are taking advantage of the current market
situation, which is favourable to tenants. In order to
attract flexible workspace operators, the building owners
offer various benefits such as rent-free periods, interior
subsidy support and rent reduction. In addition, there is
an increasing number of buildings that change the
signboard of the building to the name of the flexible
workspace operator. The reason why the landlord
changes the image of the building and leases the office
is that the vacancy rate in the Seoul office is getting
higher and use of flexible workspace helps solve the
vacancy rate in a short time.
However, for a building investor, a single anchor tenant
can be a risk. In particular, if the lease adjustment is not
flexible when the building is sold, the yield may
decrease. In addition, real estate funds must secure a
fixed cash flow for regular dividends. Leasing the same
area to several tenants may result in a more stable cash
rental income stream.
In addition, as the expansion of the domestic flexible
workspace as well as the global flexible workspace
market is accelerating, competition among the flexible
space operators will become more intense, and there is
a possibility that some flexible workspaces may be shut
down and that a single tenant may leave the building.
The departure of a single tenant can cause a bigger loss
to a landlord than the departure of multiple small tenants,
if early tenant benefits are irrecoverable.
Therefore, the building owners need to analyse the
market prospects, and negotiate lease terms when
dealing with flexible workspace operators based on long-
term strategies, and monitor the creditworthiness and
growth potential of the flexible workspaces.

Copyright © 2018 Colliers International.
The information contained herein has been obtained from sources deemed reliable. While every reasonable effort has been made to ensure its accuracy, we cannot guarantee it. No responsibility is assumed for any inaccuracies. Readers are encouraged to consult their professional advisors prior to acting on any of the material contained in this report.
413 offices in
69 countries on
6 continents United States: 145
Canada: 28
Latin America: 23
Asia Pacific: 86
EMEA: 131
$2.7 billion in annual revenue
2 billion square feet under management
15,400 professionals and staff
Primary Authors:
Judy Jang
Associate Director | Research | Korea
+82 2 6325 1900
Judy.Jang @colliers.com
Regional Authors:
Andrew Haskins
Executive Director | Research | Asia
+852 2 2822 0511
Andrew.Haskins @colliers.com
Colliers International | <Korea>
14F, S Tower, 82, Saemunan-ro
Jongno-gu,Seoul 03185| Korea
+ 82 2 6325 1900
About Colliers International Group Inc.
Colliers International Group Inc. (NASDAQ & TSX: CIGI) is an industry-leading real estate services
company with a global brand operating in 69 countries and a workforce of more than 12,000 skilled
professionals serving clients in the world’s most important markets. Colliers is the fastest-growing
publicly listed global real estate services company, with 2017 corporate revenues of $2.3 billion ($2.7
billion including affiliates). With an enterprising culture and significant employee ownership and
control, Colliers professionals provide a full range of services to real estate occupiers, owners and
investors worldwide. Services include strategic advice and execution for property sales, leasing and
finance; global corporate solutions; property, facility and project management; workplace solutions;
appraisal, valuation and tax consulting; customized research; and thought leadership consulting.
Colliers professionals think differently, share great ideas and offer thoughtful and innovative advice
that help clients accelerate their success. Colliers has been ranked among the top 100 global
outsourcing firms by the International Association of Outsourcing Professionals for 13 consecutive
years, more than any other real estate services firm. Colliers has also been ranked the number one
property manager in the world by Commercial Property Executive for two years in a row.
For the latest news from Colliers, visit Colliers.com or follow us on Twitter: @Colliers and LinkedIn.