NOT RATED - Techno HDFC Securities... · NOT RATED . Best in class. Techno Electric and Engineering...
17
VISIT NOTE 19 MAY 2015 Techno Electric & Engineering Co. NOT RATED Best in class Techno Electric and Engineering Company (TEEC) is amongst India’s premier T&D substation EPC companies with a substantial wind energy portfolio (162MW) and investments in transmission assets. Selective bidding, tight control on execution and an asset light model have enabled the company to earn industry leading ROICs (standalone EPC) over the past five years. With power T&D capex in India expected to remain strong, as suggested by capex plans of SEBs and PGCIL, we expect order inflow momentum to continue. High book to bill (3x in FY15) will lead to 24/34% revenue/EBITDA CAGR over FY14-17. The company has put its wind assets on the block which will improve consolidated returns and yield cash to invest in related businesses like transmission assets. We believe TEEC provides a high quality play on India’s T&D infra build out. We arrive at an SOTP based fair value of Rs 539/sh based on sum of 10x FY17E EV/EBITDA for EPC, Rs 55mn EV/MW for wind assets and NPV of Rs 29/sh for transmission assets. EPC business: EPC business primarily caters to power T&D substations, besides also taking opportunistic business in power BOP and industrial distribution solutions. The company operates an asset light business model with tight control on working capital leading to industry leading ROCE of 60% (trailing 5 yr average). We expect margins to go back to historical levels of 15-16% (11-16% over FY14-17) as revenue growth picks up and operating leverage kicks-in. Wind business: TEEC acquired 95MW of wind capacity from Suzlon in FY10 and followed it up by setting up 112MW of capacity on its own in TN. However, lack of demand for RECs (renewable energy certificates), poor evacuation and cash flow problems led to poor returns on the foray. The company now plans to sell these assets (recently sold 44MW) and invest proceeds in businesses related to its core expertise. Transmission assets: TEEC ventured into the transmission BOOT business in FY10 when it won the Jhajjar transmission project in a JV with Kalpataru Power. The company also won another project (Patran) in FY14. Total equity investment in these projects will be Rs 875mn. TEEC has been bidding for BOOM projects that have a higher substation EPC portion, thus enabling it to capture EPC value as well. Valuation and forecasts: We pencil in a 24% CAGR in EPC revenue and stable order inflows (Rs 14-16bn) over FY14-17 for the EPC business. For the wind business, we have assumed a PLF of 20% (in line with historical PLFs). We arrive at a fair value of Rs 539/sh (27% upside) and believe TEEC is amongst the best plays on India’s T&D capex, available at an attractive valuation of 15x FY17E EPS. FINANCIAL SUMMARY - CONSOLIDATED (Rs mn) FY13 FY14 FY15E FY16E FY17E Net Sales 7,001 7,085 7,467 10,202 12,447 EBITDA 2,346 1,925 2,161 2,502 3,130 APAT 1,217 866 925 1,284 1,652 Diluted EPS (Rs) 21.3 15.2 16.2 22.5 28.9 P/E (x) 19.7 27.6 25.8 18.6 14.5 P/B (x) 3.1 2.9 2.6 2.0 1.8 RoE (%) 16.9 10.8 10.6 12.2 13.0 Source : Company, HDFC sec Inst Research INDUSTRY CAPITAL GOODS CMP (as on 19 May 2015) Rs 425 Target Price NA Nifty 8,366 Sensex 27,646 KEY STOCK DATA Bloomberg TEEC IN No. of Shares (mn) 57 MCap (Rs bn) / ($ mn) 24/381 6m avg traded value (Rs mn) 32 STOCK PERFORMANCE (%) 52 Week high / low Rs 455/194 3M 6M 12M Absolute (%) (0.3) 30.9 101.0 Relative (%) 5.9 32.3 87.6 SHAREHOLDING PATTERN (%) Promoters 57.98 FIs & Local MFs 15.13 FIIs 5.10 Public & Others 21.79 Source : BSE Abhinav Sharma [email protected] +91-22-6171-7331 Raahil Shah [email protected] +91-22-6171-7327 HDFC securities Institutional Research is also available on Bloomberg HSLB <GO> & Thomson Reuters
Transcript of NOT RATED - Techno HDFC Securities... · NOT RATED . Best in class. Techno Electric and Engineering...

VISIT NOTE 19 MAY 2015
Techno Electric & Engineering Co. NOT RATED
Best in class Techno Electric and Engineering Company (TEEC) is amongst India’s premier T&D substation EPC companies with a substantial wind energy portfolio (162MW) and investments in transmission assets. Selective bidding, tight control on execution and an asset light model have enabled the company to earn industry leading ROICs (standalone EPC) over the past five years. With power T&D capex in India expected to remain strong, as suggested by capex plans of SEBs and PGCIL, we expect order inflow momentum to continue. High book to bill (3x in FY15) will lead to 24/34% revenue/EBITDA CAGR over FY14-17. The company has put its wind assets on the block which will improve consolidated returns and yield cash to invest in related businesses like transmission assets.
We believe TEEC provides a high quality play on India’s T&D infra build out. We arrive at an SOTP based fair value of Rs 539/sh based on sum of 10x FY17E EV/EBITDA for EPC, Rs 55mn EV/MW for wind assets and NPV of Rs 29/sh for transmission assets.
EPC business: EPC business primarily caters to power T&D substations, besides also taking opportunistic business in power BOP and industrial distribution solutions. The company operates an asset light business model with tight control on working capital leading to industry leading ROCE of 60% (trailing 5 yr average). We expect margins to go back to historical levels of 15-16% (11-16% over FY14-17) as revenue growth picks up and operating leverage kicks-in.
Wind business: TEEC acquired 95MW of wind capacity from Suzlon in FY10 and followed it up by setting up 112MW of capacity on its own in TN. However, lack of demand for RECs (renewable energy certificates), poor evacuation and cash flow problems led to poor returns on the foray. The company now plans to sell these assets (recently sold 44MW) and invest proceeds in businesses related to its core expertise.
Transmission assets: TEEC ventured into the transmission BOOT business in FY10 when it won the Jhajjar transmission project in a JV with Kalpataru Power. The company also won another project (Patran) in FY14. Total equity investment in these projects will be Rs 875mn. TEEC has been bidding for BOOM projects that have a higher substation EPC portion, thus enabling it to capture EPC value as well.
Valuation and forecasts: We pencil in a 24% CAGR in EPC revenue and stable order inflows (Rs 14-16bn) over FY14-17 for the EPC business. For the wind business, we have assumed a PLF of 20% (in line with historical PLFs). We arrive at a fair value of Rs 539/sh (27% upside) and believe TEEC is amongst the best plays on India’s T&D capex, available at an attractive valuation of 15x FY17E EPS.
FINANCIAL SUMMARY - CONSOLIDATED (Rs mn) FY13 FY14 FY15E FY16E FY17E Net Sales 7,001 7,085 7,467 10,202 12,447 EBITDA 2,346 1,925 2,161 2,502 3,130 APAT 1,217 866 925 1,284 1,652 Diluted EPS (Rs) 21.3 15.2 16.2 22.5 28.9 P/E (x) 19.7 27.6 25.8 18.6 14.5 P/B (x) 3.1 2.9 2.6 2.0 1.8 RoE (%) 16.9 10.8 10.6 12.2 13.0 Source : Company, HDFC sec Inst Research
INDUSTRY CAPITAL GOODS CMP (as on 19 May 2015) Rs 425 Target Price NA Nifty 8,366
Sensex 27,646
KEY STOCK DATA
Bloomberg TEEC IN
No. of Shares (mn) 57
MCap (Rs bn) / ($ mn) 24/381
6m avg traded value (Rs mn) 32
STOCK PERFORMANCE (%)
52 Week high / low Rs 455/194
3M 6M 12M
Absolute (%) (0.3) 30.9 101.0
Relative (%) 5.9 32.3 87.6
SHAREHOLDING PATTERN (%)
Promoters 57.98
FIs & Local MFs 15.13
FIIs 5.10
Public & Others 21.79 Source : BSE Abhinav Sharma [email protected] +91-22-6171-7331
Raahil Shah [email protected] +91-22-6171-7327 HDFC securities Institutional Research is also available on Bloomberg HSLB <GO> & Thomson Reuters

TECHNO ELECTRIC & ENGINEERING CO. : VISIT NOTE
Company Overview
Source : Company IFC holds 3.38% in Simran
CONSOLIDATED SEGMENT FINANCIALSRs mn FY10 FY11 FY12 FY13 FY14
Revenue 7,021 7,166 8,199 7,001 7,085
EPC 6,318 6,488 7,040 5,159 5,705
Wind Energy 703 678 1,158 1,842 1,380
EBITDA EPC 770 989 1,128 573 602
% 12 15 16 11 11
Wind Energy 653 646 1,115 1,773 1,324
% 93 95 96 96 96 Source : Company, HDFC sec Inst Research
Techno Electric is a leading provider of engineering, procurement and construction (EPC) services to the power transmission sector with an expertise in substation EPC TEEC diversified into the renewable energy space by acquiring wind assets of 95MW and setting up further 112MW over FY10-12 TEEC has also ventured into the transmission space by successfully bidding for a BOOT based project in Haryana (JV, commissioned) and a BOOM based project in Patran, Punjab
100%
49%
Techno Electric and Engineetring Company Limited (TEEC)
Wind Transmission assetsEPC
Transmisssion, Distribution and
Industrial
Substations TEEC Standalone (45MW)
Simran (117MW)
Jhajjar KT Transco
Patran Transmission
96.62%
Page | 2
TECHNO ELECTRIC & ENGINEERING CO. : VISIT NOTE
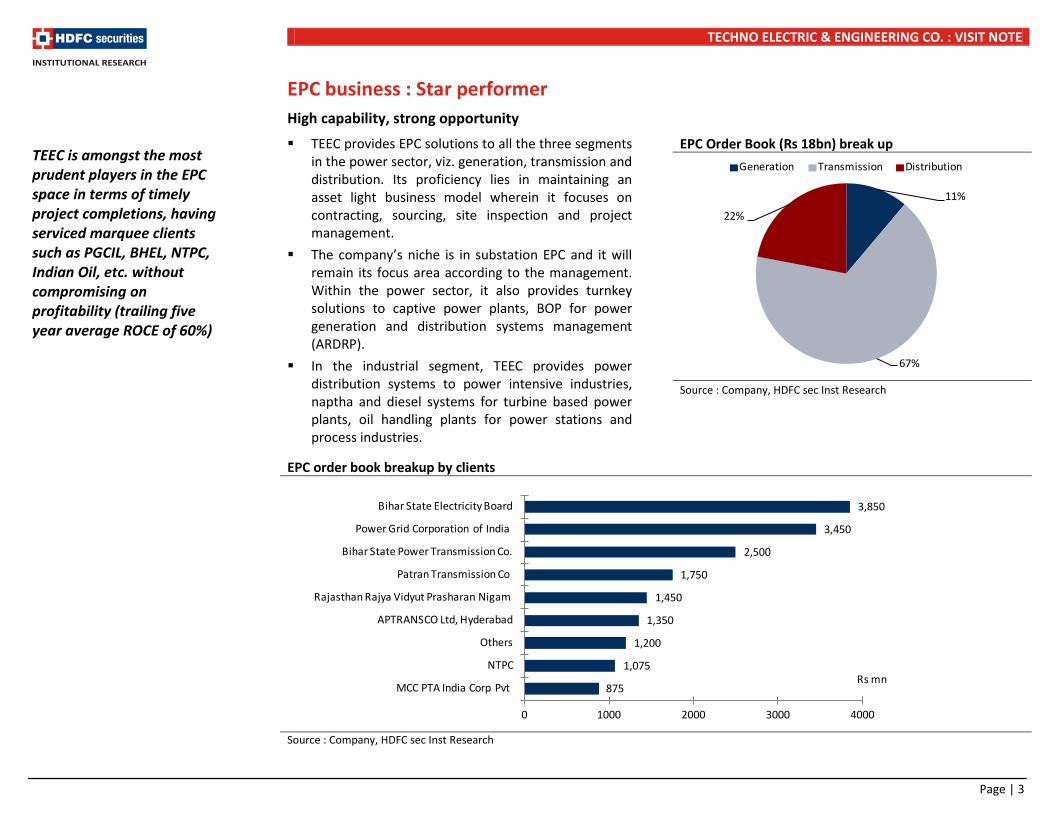
EPC business : Star performer High capability, strong opportunity TEEC provides EPC solutions to all the three segments
in the power sector, viz. generation, transmission and distribution. Its proficiency lies in maintaining an asset light business model wherein it focuses on contracting, sourcing, site inspection and project management.
The company’s niche is in substation EPC and it will remain its focus area according to the management. Within the power sector, it also provides turnkey solutions to captive power plants, BOP for power generation and distribution systems management (ARDRP).
In the industrial segment, TEEC provides power distribution systems to power intensive industries, naptha and diesel systems for turbine based power plants, oil handling plants for power stations and process industries.
EPC Order Book (Rs 18bn) break up
Source : Company, HDFC sec Inst Research
EPC order book breakup by clients
Source : Company, HDFC sec Inst Research
875
1,075
1,200
1,350
1,450
1,750
2,500
3,450
3,850
0 1000 2000 3000 4000
MCC PTA India Corp Pvt
NTPC
Others
APTRANSCO Ltd, Hyderabad
Rajasthan Rajya Vidyut Prasharan Nigam
Patran Transmission Co
Bihar State Power Transmission Co.
Power Grid Corporation of India
Bihar State Electricity Board
Rs mn
TEEC is amongst the most prudent players in the EPC space in terms of timely project completions, having serviced marquee clients such as PGCIL, BHEL, NTPC, Indian Oil, etc. without compromising on profitability (trailing five year average ROCE of 60%)
11%
67%
22%
Generation Transmission Distribution
Page | 3
TECHNO ELECTRIC & ENGINEERING CO. : VISIT NOTE
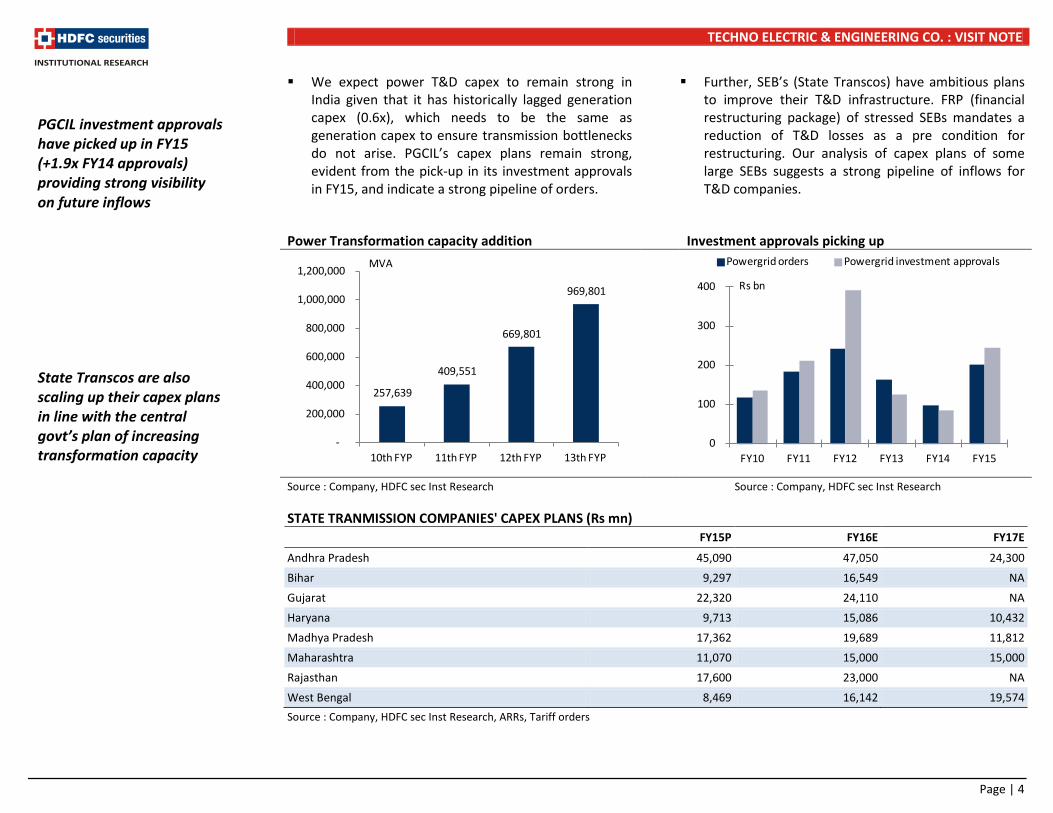
We expect power T&D capex to remain strong in India given that it has historically lagged generation capex (0.6x), which needs to be the same as generation capex to ensure transmission bottlenecks do not arise. PGCIL’s capex plans remain strong, evident from the pick-up in its investment approvals in FY15, and indicate a strong pipeline of orders.
Further, SEB’s (State Transcos) have ambitious plans to improve their T&D infrastructure. FRP (financial restructuring package) of stressed SEBs mandates a reduction of T&D losses as a pre condition for restructuring. Our analysis of capex plans of some large SEBs suggests a strong pipeline of inflows for T&D companies.
Power Transformation capacity addition Investment approvals picking up
Source : Company, HDFC sec Inst Research Source : Company, HDFC sec Inst Research STATE TRANMISSION COMPANIES' CAPEX PLANS (Rs mn)
FY15P FY16E FY17E
Andhra Pradesh 45,090 47,050 24,300
Bihar 9,297 16,549 NA
Gujarat 22,320 24,110 NA
Haryana 9,713 15,086 10,432
Madhya Pradesh 17,362 19,689 11,812
Maharashtra 11,070 15,000 15,000
Rajasthan 17,600 23,000 NA
West Bengal 8,469 16,142 19,574 Source : Company, HDFC sec Inst Research, ARRs, Tariff orders
PGCIL investment approvals have picked up in FY15 (+1.9x FY14 approvals) providing strong visibility on future inflows State Transcos are also scaling up their capex plans in line with the central govt’s plan of increasing transformation capacity
0
100
200
300
400
FY10 FY11 FY12 FY13 FY14 FY15
Powergrid orders Powergrid investment approvals
Rs bn
257,639
409,551
669,801
969,801
-
200,000
400,000
600,000
800,000
1,000,000
1,200,000
10th FYP 11th FYP 12th FYP 13th FYP
MVA
Page | 4

TECHNO ELECTRIC & ENGINEERING CO. : VISIT NOTE
PGCIL substation orders & TEEC’s share EPC book to bill ratio
Source : Company, HDFC sec Inst Research Source : Company, HDFC sec Inst Research
EPC Business is truly ‘Best in class’ TEEC has shown commendable efficiency in its
operations when compared to other EPC players in terms of operating margins, revenue/gross block, operating cash flows and consequently ROCE. This emphasizes TEEC’s capabilities in prudently bidding for only those projects that can be executed in a timely manner without adversely impacting its margins and profitability.
We have compared TEEC’s standalone EPC business’ key operating metrics to three companies – KEC international, Kalpataru Power (transmission line and substation EPC) and KNR construction (roads EPC Company) to emphasize TEEC’s superior return ratios. We believe that a comparison with equipment companies like ABB and Siemens is misleading as their business has different dynamics.
0.0
0.5
1.0
1.5
2.0
2.5
3.0
3.5
0
5
10
15
20
25
30
35
40
FY12 FY13 FY14 FY15
Substation orders TEEC Share
Rs bn Rs bn
Substation orders from PGCIL have picked up and we expect TEEC to continue its order inflow momentum Sharp pick up in order book growth in the past three years lends strong revenue visibility with a book to bill ratio of 3.3x in FY15E
0.0
0.5
1.0
1.5
2.0
2.5
3.0
3.5
-
5,000
10,000
15,000
20,000
25,000
FY10 FY11 FY12 FY13 FY14 FY15E
Order book Revenue Book to bill
Rs bn x
Page | 5

TECHNO ELECTRIC & ENGINEERING CO. : VISIT NOTE
Net Working Capital/Sales – Among the best Revenue/Gross block – Fixed asset light
Source : Company, HDFC sec Inst Research Source : Company, HDFC sec Inst Research
Operating Margin Profile – Higher than closest peers ROCE – Far ahead of peers
Source : Company, HDFC sec Inst Research Source : Company, HDFC sec Inst Research
TEEC has one of the best operating metrics amongst comparable companies, which has been made possible by its strong focus on cash flow, asset light model and tight control on working capital High Revenue/Gross block underscores the company’s asset-light business model as the company focuses on its core competence of engineering and project management while outsourcing the equipment and civil construction part Tight control on working capital coupled with impressive margins and a high asset turnover leads to industry leading ROCE ROCE is depressed to an extent as the company provides short term loans to corporates to utilize excess cash, else the business operates at negative capital employed!
-30%
-20%
-10%
0%
10%
20%
30%
40%
FY10 FY11 FY12 FY13 FY14
Kalpataru Power KEC InternationalKNR Construction Techno Electric
%
0
10
20
30
40
FY10 FY11 FY12 FY13 FY14
Kalpataru Power KEC InternationalKNR Construction Techno Electric
x
0%
5%
10%
15%
20%
FY10 FY11 FY12 FY13 FY14
Kalpataru Power KEC InternationalKNR Construction Techno Electric
%
0%
20%
40%
60%
80%
100%
FY10 FY11 FY12 FY13 FY14
Kalpataru Power KEC InternationalKNR Construction Techno Electric
%
Page | 6
TECHNO ELECTRIC & ENGINEERING CO. : VISIT NOTE
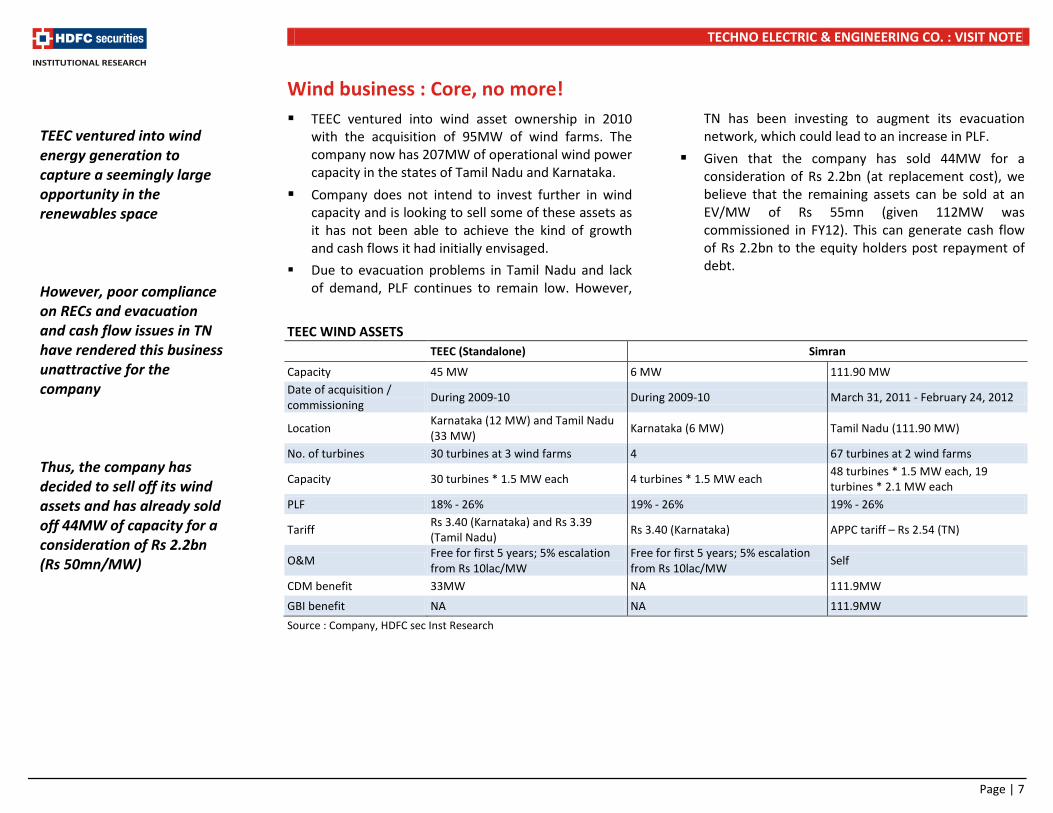
Wind business : Core, no more!
TEEC ventured into wind asset ownership in 2010 with the acquisition of 95MW of wind farms. The company now has 207MW of operational wind power capacity in the states of Tamil Nadu and Karnataka.
Company does not intend to invest further in wind capacity and is looking to sell some of these assets as it has not been able to achieve the kind of growth and cash flows it had initially envisaged.
Due to evacuation problems in Tamil Nadu and lack of demand, PLF continues to remain low. However,
TN has been investing to augment its evacuation network, which could lead to an increase in PLF.
Given that the company has sold 44MW for a consideration of Rs 2.2bn (at replacement cost), we believe that the remaining assets can be sold at an EV/MW of Rs 55mn (given 112MW was commissioned in FY12). This can generate cash flow of Rs 2.2bn to the equity holders post repayment of debt.
TEEC WIND ASSETS
TEEC (Standalone) Simran
Capacity 45 MW 6 MW 111.90 MW Date of acquisition / commissioning During 2009-10 During 2009-10 March 31, 2011 - February 24, 2012
Location Karnataka (12 MW) and Tamil Nadu (33 MW) Karnataka (6 MW) Tamil Nadu (111.90 MW)
No. of turbines 30 turbines at 3 wind farms 4 67 turbines at 2 wind farms
Capacity 30 turbines * 1.5 MW each 4 turbines * 1.5 MW each 48 turbines * 1.5 MW each, 19 turbines * 2.1 MW each
PLF 18% - 26% 19% - 26% 19% - 26%
Tariff Rs 3.40 (Karnataka) and Rs 3.39 (Tamil Nadu) Rs 3.40 (Karnataka) APPC tariff – Rs 2.54 (TN)
O&M Free for first 5 years; 5% escalation from Rs 10lac/MW
Free for first 5 years; 5% escalation from Rs 10lac/MW Self
CDM benefit 33MW NA 111.9MW
GBI benefit NA NA 111.9MW Source : Company, HDFC sec Inst Research
TEEC ventured into wind energy generation to capture a seemingly large opportunity in the renewables space However, poor compliance on RECs and evacuation and cash flow issues in TN have rendered this business unattractive for the company Thus, the company has decided to sell off its wind assets and has already sold off 44MW of capacity for a consideration of Rs 2.2bn (Rs 50mn/MW)
Page | 7

TECHNO ELECTRIC & ENGINEERING CO. : VISIT NOTE
Impact of sale of wind assets
TEEC recently sold off 44.45MW of Simran’s wind assets for a consideration of Rs 2.2bn. Given that the management had earlier indicated its intent of selling off the entire wind portfolio, this is a move in that direction.
We believe that such a sale will increase the company’s return ratios. To illustrate this, we have compared TEEC’s existing ROCE profile with TEEC’s consolidated ROCE after stripping off the wind business.
As evident from the table below, the company would achieve an avg. ROCE of ~17% ex-wind over FY15-17 vs. ~10% avg. ROCE with the wind business. We note that while stand alone EPC business has even higher ROCE (operates at negative capital employed), overall returns are depressed due to presence of cash, short term advances (to companies) and investments in transmission assets.
ROCE* COMPARISON Rs mn FY11 FY12 FY13 FY14 FY15E FY16E FY17E
EBIT (consolidated, ex wind) 1,265 1,345 771 713 873 1,668 2,297
EBIT (consolidated) 1,630 1,860 1,897 1,379 1,606 2,204 2,794
Capital employed (ex wind) 555 1,068 2,171 3,215 5,327 9,119 10,248
Total capital employed 8,517 12,927 14,376 14,448 15,855 18,549 19,014
Consolidated ROCE (ex wind) (%) 85 111 32 18 14 15 16 Consolidated ROCE (%) 17 14 12 9 9 9 11
Source : Company, HDFC sec Inst Research *ROCE = [EBIT*(1-tax rate)]/Capital employed
Wind portfolio has depressed the company’s otherwise very healthy return ratios If the company were to sell off its wind portfolio, it would increase its consolidated return ratios and also increase the cash balance
Page | 8

TECHNO ELECTRIC & ENGINEERING CO. : VISIT NOTE
Transmission assets : Opportunistic use of excess cash TEEC has undertaken two transmission BOOM
projects. One of them (Jhajjar) is operational while the other one (Patran) is under execution. The company has bid fairly conservatively in both these projects and can achieve IRRs of 14%+ according to our estimates.
OVERVIEW OF TEEC’S BOOT/BOOM PROJECTS
Project Name Jhajjar KT
(51:49 JV with Kalpataru Power)
Patran
Line/Substation details
400 kV double circuit, Jharli - Kabalpur & Kabalpur -
Dipalpur
400 kV double circuit, Patiala -
Kaithal Line Length (km) 99 5
Expected COD Commissioned in Mar-12 May-16
Capex (Rs mn) 4,440 2,000
Equity (Rs mn) 760 500
Debt (Rs mn) 2,760 1,500
VGF (Rs mn) 920
Tariff (Rs mn) Rs 540mn in first year; Fixed: 85%, Escalable: 15%
Rs 220mn in first year; Fixed: 97%,
Escalable: 3% Source : Company, HDFC sec Inst Research Power ministry has been trying to increase private
participation in the transmission sector, given the large investment needs. PGCIL being the Central Transmission Utility (CTU) has been historically responsible for inter-state and inter regional power transmission. However, private participation is being encouraged to increase competition and to meet increasing investment needs. Thus, TBCB (Tariff based competitive bidding) is expected to pick up in the 13th FYP (five year plan).
The experience with private sector has been mixed so far. There have been instances where private companies have not been able to deliver on time. Bidding has also been aggressive given the stable nature of these assets and lack of demand in other sectors.
We believe that with the model and challenges now being better understood, bidding will be saner in the future. This is already being witnessed in new bids, with the number of bidders coming down to 8-10 from 20-22 seen in 2010-12 period.
Some of the state governments (e.g. Haryana, MP, and Maharashtra) have also been active in bidding out transmission projects. This trend is expected to pick-up, given the funding constraints and lack of execution expertise at the State Transco level.
LIST OF PROJECTS TO BE AWARDED VIA TBCB
Project Estimated
cost (US$mn)
ISTS for Renewable in Northern Region 740
Inter-Regional AC link for Southern Region 1,428
System Strengthening beyond Vemagiri 1,172
Electricity Scheme of Puducherry 8
NER System Strengthening scheme-II 275
CTS for Phase-II Generation Project 433
Evacuation System for OPGC Project in Odisha 25
System Strengthening (Indian side) for HEPs of Bhutan 302 Source : Company, HDFC sec Inst Research
TEEC’s niche is in substations and hence it consciously focuses on bidding for BOOT & BOOM projects having a larger portion of substation EPC work
Page | 9
TECHNO ELECTRIC & ENGINEERING CO. : VISIT NOTE
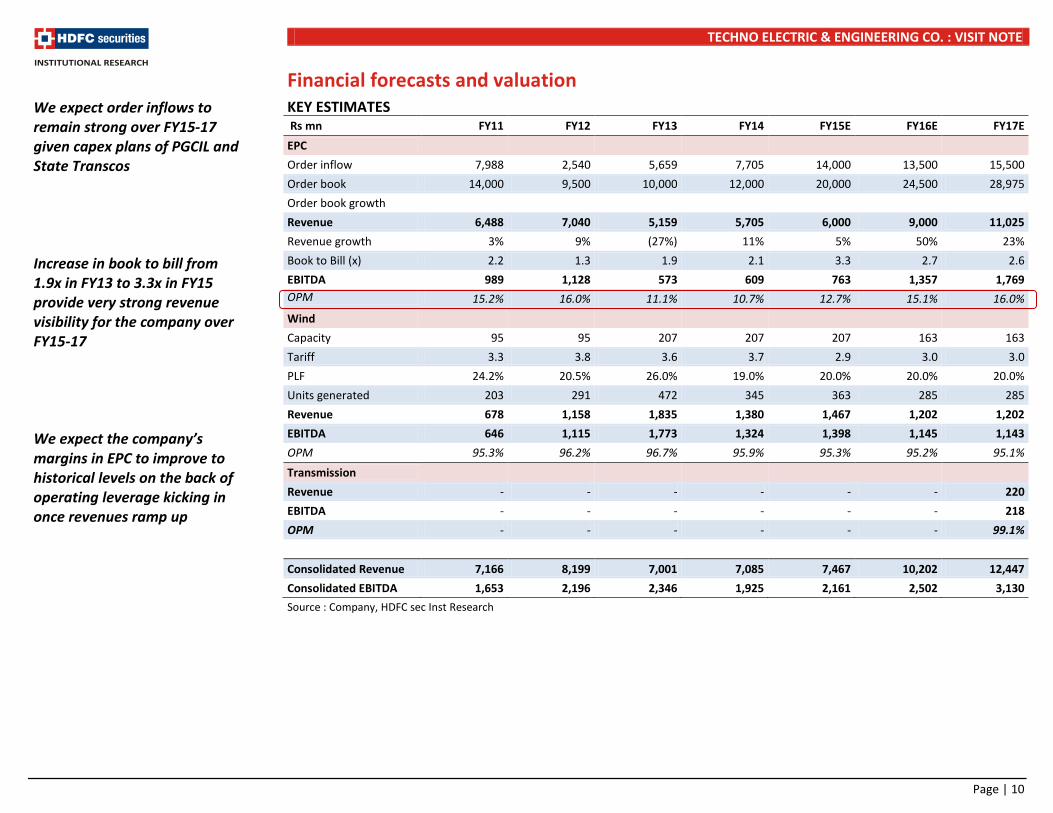
Financial forecasts and valuation KEY ESTIMATES Rs mn FY11 FY12 FY13 FY14 FY15E FY16E FY17E EPC Order inflow 7,988 2,540 5,659 7,705 14,000 13,500 15,500 Order book 14,000 9,500 10,000 12,000 20,000 24,500 28,975 Order book growth Revenue 6,488 7,040 5,159 5,705 6,000 9,000 11,025 Revenue growth 3% 9% (27%) 11% 5% 50% 23% Book to Bill (x) 2.2 1.3 1.9 2.1 3.3 2.7 2.6 EBITDA 989 1,128 573 609 763 1,357 1,769 OPM 15.2% 16.0% 11.1% 10.7% 12.7% 15.1% 16.0% Wind Capacity 95 95 207 207 207 163 163 Tariff 3.3 3.8 3.6 3.7 2.9 3.0 3.0 PLF 24.2% 20.5% 26.0% 19.0% 20.0% 20.0% 20.0% Units generated 203 291 472 345 363 285 285 Revenue 678 1,158 1,835 1,380 1,467 1,202 1,202 EBITDA 646 1,115 1,773 1,324 1,398 1,145 1,143 OPM 95.3% 96.2% 96.7% 95.9% 95.3% 95.2% 95.1% Transmission Revenue - - - - - - 220 EBITDA - - - - - - 218 OPM - - - - - - 99.1%
Consolidated Revenue 7,166 8,199 7,001 7,085 7,467 10,202 12,447 Consolidated EBITDA 1,653 2,196 2,346 1,925 2,161 2,502 3,130 Source : Company, HDFC sec Inst Research
We expect order inflows to remain strong over FY15-17 given capex plans of PGCIL and State Transcos Increase in book to bill from 1.9x in FY13 to 3.3x in FY15 provide very strong revenue visibility for the company over FY15-17 We expect the company’s margins in EPC to improve to historical levels on the back of operating leverage kicking in once revenues ramp up
Page | 10

TECHNO ELECTRIC & ENGINEERING CO. : VISIT NOTE
VALUATION SOTP Business Parameter Multiple Value (Rs mn) Value/sh EPC EV/EBITDA 10 19,696 345 Wind energy EV/MW 55 8,940 157 Transmission projects NPV 1,642 29
Net debt (EPC+Wind) FY16E end 482 8
Total 30,761 539 CMP 425 Source : HDFC sec Inst Research PEER VALUATION
Company TP (Rs)
CMP (Rs) Rating
Market Cap P/E (x) P/B (x) ROE (%) Rs bn US$bn FY15E FY16E FY17E FY15E FY16E FY17E FY15E FY16E FY17E
L&T 1,725 1,619 BUY 1,487 23.2 22.8 20.2 16.6 4.0 3.7 3.3 14.4 14.9 16.3 BHEL 189 235 SELL 574 8.8 29.3 21.9 19.9 1.7 1.6 1.5 5.8 7.5 7.9 Crompton Greaves 209 173 BUY 111 1.7 37.3 26.0 16.5 2.9 2.7 2.5 8.0 10.8 15.8 KEC International NA 119 NR 31 0.4 19.0 18.4 12.6 2.3 2.1 1.8 12.7 12.9 16.4 Kalpataru Power NA 227 NR 35 0.5 21.1 16.5 12.7 1.6 1.4 1.3 7.5 8.9 10.3 Techno Electric NA 425 NR 25 0.4 26.2 18.9 14.7 2.7 2.0 1.8 10.6 12.2 13.0 KNR Construction 665 541 BUY 15 0.2 25.7 20.5 13.6 2.7 2.4 2.0 10.9 12.3 16.2 Source : Bloomberg, HDFC sec Inst Research
We value the EPC business at 10x EV/EBIDTA, which is at a premium to other EPC players but is fully justified given its premium ROICs The wind business is valued at an EV/MW of Rs 55mn which is roughly the replacement cost of the wind assets TEEC will continue to command a premium over peers given the high quality of its EPC business, impressive return ratios and comfortable debt levels
Page | 11

TECHNO ELECTRIC & ENGINEERING CO. : VISIT NOTE
Annexure KEY INCENTIVES TO PROMOTE WIND ENERGY
Regulation Explanation Impact Accelerated Depreciation (AD)
Depreciate 80% of the wind asset in the first year of installation in books of account
Provide tax savings for Wind Energy developers in the initial years of installations, particularly favourable for small investors and captive users
Generation Based Incentives (GBI)
Incentive of Rs 0.50 per kWh for a period of 4 to 10 years, albeit with a cap of Rs 10mn per MW
Incentivize actual generation rather than mere establishment of capacity, thus attracting large IPPs and FDI in the wind market
Feed in Tariffs (FIT)
This is applicable to developers that avail of GBI (and not RECs) wherein they can additionally receive a preferential tariff from state distribution companies to which they are selling electricity. Several states have increased wind power tariffs by 2-15% to attract investments
A shift in wind power projects from wind rich states like Tamil Nadu and Gujarat to low wind density states like Rajasthan, Madhya Pradesh and Maharashtra
Renewable Purchase Obligations (RPO)
Mandate requiring distribution companies, open access consumers and captive consumers to buy a fixed percentage of electricity from renewables and to be met through direct purchases via bilateral contracts and Renewable Energy Certificates (REC)
RECs being traded as a currency in the Wind Energy market whereby states that cannot directly purchase electricity from local wind developers can purchase RECs at market rates to meet the RPO quota. This removes the geographical barrier
Source : Company, HDFC sec Inst Research STATE LEVEL INCENTIVES
Andhra Pradesh Karnataka Madhya Pradesh Maharashtra Rajasthan Tamilnadu Gujarat
Wheeling and Transmission
As per Rules, Regulations and terms and conditions as approved by the Commission.
5 % of energy
Allowed 2% of energy + transmission charges as per ERC
Normal Open Access Charges
Normal Open Access Charges
5% of Energy in case of consumption at HV / EHV and 7.5% in case of LV
Normal OA Transmission Charges and transmission losses for 66 kV and above
Banking Allowed Allowed @ 2% of energy input
Allowed 15 Minutes Adjustment
6 Months 5% (12 months)
Monthly settlement
Feed in Tariff (Rs/Kwh)
4.70
4.20 5.92 *Zone 1 – 5.70 Zone 2 – 5.01 Zone 3 – 4.18 Zone 4 – 3.92
Rs. 5.93 /unit for Jaisalmer, Barmer and Jodhpur etc. and Rs. 5.64 /unit for other district
3.51 (Levelised) 4.15
Open Access Allowed Allowed Allowed Allowed Allowed Allowed Allowed Source : MNRE, HDFC sec Inst Research *Zones according to wind energy density, higher the density lower the tariff
Page | 12

TECHNO ELECTRIC & ENGINEERING CO. : VISIT NOTE
REC mechanism REC (Renewable energy certificates) is a mechanism
wherein states which are wind deficient can fulfill their renewable purchase obligations (RPO) by buying RECs from renewable power generators.
RPO is mandated by law and every state has to come up with its RPO targets. Non-compliance of RPO can
in theory lead to penalties being imposed on obligated entities.
REC mechanism has failed to attract as much interest as envisaged due to lack of compliance from buyers. Since the penalties for non compliance of RPO are not adequately being imposed, compliance has been poor.
REC MECHANISM : KEY HIGHLIGHTS Offtake/closing inventory of RECs REC Denomination 1 REC = 1 MWH
Categories 1. Solar REC 2. Non Solar RECs
Sellers RE generators, not selling via preferred tariffs
Buyers Distribution companies, open access consumers, captive consumers
Floor Price 1. Solar REC - 3500/REC 2. Non Solar - 1500/REC
Forbearance Price 1. Solar REC - 5800/REC 2. Non Solar - 3300/REC
Penalty for Non-compliance ‘Forbearance’ Price
Source : Company, HDFC sec Inst Research Source : REC registry, HDFC sec Inst Research
0.00
0.10
0.20
0.30
0.40
0.50
0.60
May
-13
Jul-1
3
Sep-
13
Nov
-13
Jan-
14
Mar
-14
May
-14
Jul-1
4
Sep-
14
Nov
-14
Jan-
15
Mar
-15
May
-15
Solar Non solarX
Page | 13
TECHNO ELECTRIC & ENGINEERING CO. : VISIT NOTE
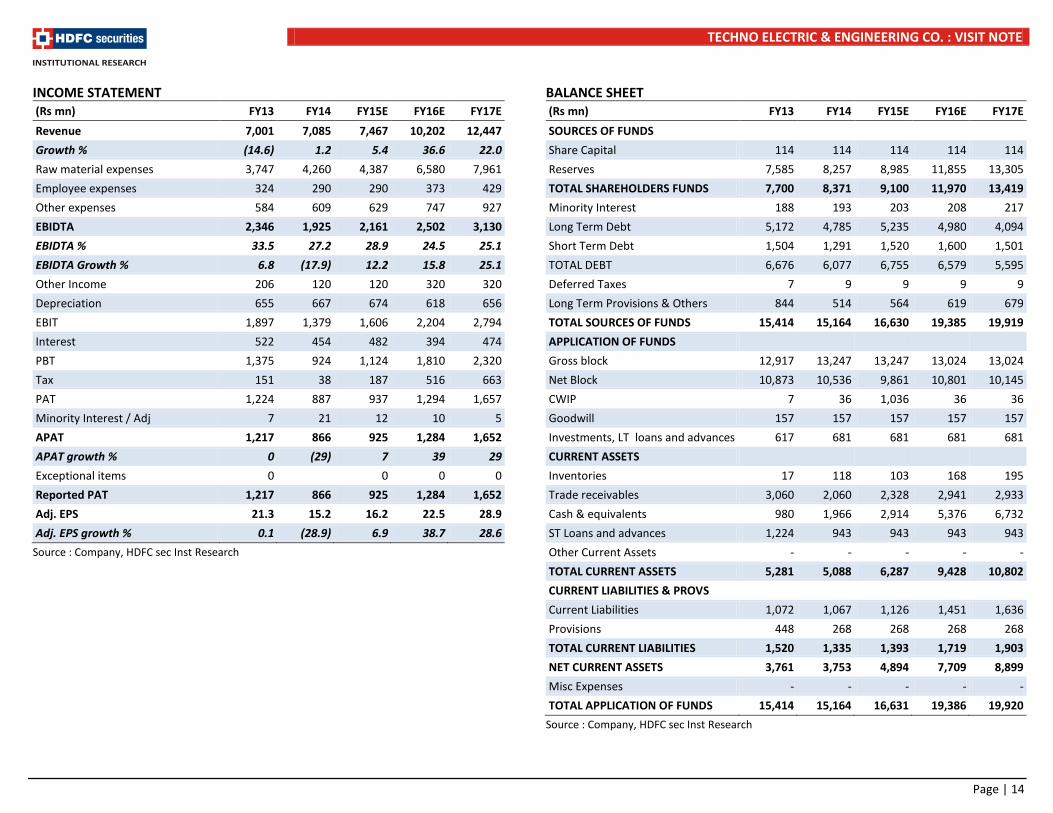
INCOME STATEMENT (Rs mn) FY13 FY14 FY15E FY16E FY17E Revenue 7,001 7,085 7,467 10,202 12,447 Growth % (14.6) 1.2 5.4 36.6 22.0 Raw material expenses 3,747 4,260 4,387 6,580 7,961 Employee expenses 324 290 290 373 429 Other expenses 584 609 629 747 927 EBIDTA 2,346 1,925 2,161 2,502 3,130 EBIDTA % 33.5 27.2 28.9 24.5 25.1 EBIDTA Growth % 6.8 (17.9) 12.2 15.8 25.1 Other Income 206 120 120 320 320 Depreciation 655 667 674 618 656 EBIT 1,897 1,379 1,606 2,204 2,794 Interest 522 454 482 394 474 PBT 1,375 924 1,124 1,810 2,320 Tax 151 38 187 516 663 PAT 1,224 887 937 1,294 1,657 Minority Interest / Adj 7 21 12 10 5 APAT 1,217 866 925 1,284 1,652 APAT growth % 0 (29) 7 39 29 Exceptional items 0 0 0 0 Reported PAT 1,217 866 925 1,284 1,652 Adj. EPS 21.3 15.2 16.2 22.5 28.9 Adj. EPS growth % 0.1 (28.9) 6.9 38.7 28.6
Source : Company, HDFC sec Inst Research
BALANCE SHEET (Rs mn) FY13 FY14 FY15E FY16E FY17E SOURCES OF FUNDS Share Capital 114 114 114 114 114 Reserves 7,585 8,257 8,985 11,855 13,305 TOTAL SHAREHOLDERS FUNDS 7,700 8,371 9,100 11,970 13,419 Minority Interest 188 193 203 208 217 Long Term Debt 5,172 4,785 5,235 4,980 4,094 Short Term Debt 1,504 1,291 1,520 1,600 1,501 TOTAL DEBT 6,676 6,077 6,755 6,579 5,595 Deferred Taxes 7 9 9 9 9 Long Term Provisions & Others 844 514 564 619 679 TOTAL SOURCES OF FUNDS 15,414 15,164 16,630 19,385 19,919 APPLICATION OF FUNDS Gross block 12,917 13,247 13,247 13,024 13,024 Net Block 10,873 10,536 9,861 10,801 10,145 CWIP 7 36 1,036 36 36 Goodwill 157 157 157 157 157 Investments, LT loans and advances 617 681 681 681 681 CURRENT ASSETS Inventories 17 118 103 168 195 Trade receivables 3,060 2,060 2,328 2,941 2,933 Cash & equivalents 980 1,966 2,914 5,376 6,732 ST Loans and advances 1,224 943 943 943 943 Other Current Assets - - - - - TOTAL CURRENT ASSETS 5,281 5,088 6,287 9,428 10,802 CURRENT LIABILITIES & PROVS Current Liabilities 1,072 1,067 1,126 1,451 1,636 Provisions 448 268 268 268 268 TOTAL CURRENT LIABILITIES 1,520 1,335 1,393 1,719 1,903 NET CURRENT ASSETS 3,761 3,753 4,894 7,709 8,899 Misc Expenses - - - - - TOTAL APPLICATION OF FUNDS 15,414 15,164 16,631 19,386 19,920
Source : Company, HDFC sec Inst Research
Page | 14

TECHNO ELECTRIC & ENGINEERING CO. : VISIT NOTE
CASH FLOW STATEMENT (Rs mn) FY13 FY14 FY15E FY16E FY17E
PAT from operations 1,011 746 806 964 1,332 Interest 522 454 482 394 474 Depreciation 655 667 674 618 656 Working capital change (1,083) 632 (143) (299) 227 Other adjustments (60) 100 11 5 8 OPERATING CASH FLOW (a) 1,045 2,598 1,830 1,682 2,696 Capex (198) (54) (1,000) 1,223 0 Free Cash Flow (FCFF) 847 2,544 830 2,904 2,696 Investments & Others (31) (1,135) 0 0 0 Non operating income 167 54 120 320 320 INVESTING CASH FLOW (b) (63) (1,135) (880) 1,542 320 Capital issuance 0 0 0 0 0 Debt issuance 267 (1,367) 678 (176) (984) Interest (495) (343) (482) (394) (474) Free Cash Flow to Equity(FCFE) 755 (246) 1,146 2,655 1,557 Dividend (199) 0 (199) (199) (199) FINANCING CASH FLOW © (426) (1,710) (2) (768) (1,657) E/O Items - - - - - NET CASH FLOW (a+b+c) 556 (246) 948 2,456 1,359
Source : Company, HDFC sec Inst Research
KEY RATIOS FY13 FY14 FY15E FY16E FY17E PROFITABILITY (%) GPM 46.5 39.9 41.2 35.5 36.0 EBITDA margin 33.5 27.2 28.9 24.5 25.1 EBIT margin 27.1 19.5 21.5 21.6 22.4 APAT margin 17.4 12.2 12.4 12.6 13.3 RoE 16.9 10.8 10.6 12.2 13.0 RoCE 12.4 9.2 8.8 9.2 10.6 RoIC 11.1 9.2 9.7 10.2 13.7 EFFICIENCY Tax rate % 11.0 4.1 16.6 28.5 28.6 Asset turnover (x) 0.5 0.5 0.6 0.8 1.0 Inventory (days) 0.9 6.1 5.0 6.0 5.7 Debtor (days) 159.5 106.1 113.8 105.2 86.0 Payables (days) 55.9 54.9 55.0 51.9 48.0 Cash conversion cycle (days) 104.5 57.3 63.8 59.3 43.8 Debt/EBITDA (x) 2.8 3.2 3.1 2.6 1.8 Net D/E 0.7 0.5 0.4 0.1 (0.1) Interest coverage 4.5 4.2 4.5 6.4 6.6 VALUATION EPS (Rs/sh) 21.3 15.2 16.2 22.5 28.9 DPS (Rs/sh) 3.0 3.0 3.0 3.0 3.0 BV (Rs/sh) 134.9 146.6 159.4 209.7 235.0 P/E 19.9 28.0 26.2 18.9 14.7 P/BV 3.2 2.9 2.7 2.0 1.8 EV/EBITDA 12.8 14.7 13.0 10.2 7.4 EV/Revenues 4.3 4.0 3.8 2.5 1.9 OCF/EV (%) 3.5 9.2 6.5 6.6 11.7 FCFF/EV (%) 2.8 9.0 3.0 11.4 11.7 FCFE/MCAP (%) 2.5 (0.9) 4.1 10.4 6.7 Dividend yield (%) 0.7 0.7 0.7 0.7 0.7
Source : Company, HDFC sec Inst Research
Page | 15

TECHNO ELECTRIC & ENGINEERING CO. : VISIT NOTE
Rating Definitions BUY : Where the stock is expected to deliver more than 10% returns over the next 12 month period NEUTRAL : Where the stock is expected to deliver (-)10% to 10% returns over the next 12 month period SELL : Where the stock is expected to deliver less than (-)10% returns over the next 12 month period
Disclosure: We, Abhinav Sharma, MBA & Raahil Shah, authors and the names subscribed to this report, hereby certify that all of the views expressed in this research report accurately reflect our views about the subject issuer(s) or securities. We also certify that no part of our compensation was, is, or will be directly or indirectly related to the specific recommendation(s) or view(s) in this report. Research Analyst or his/her relative or HDFC Securities Ltd. does not have any financial interest in the subject company. Also Research Analyst or his relative or HDFC Securities Ltd. or its Associate may have beneficial ownership of 1% or more in the subject company at the end of the month immediately preceding the date of publication of the Research Report. Further Research Analyst or his relative or HDFC Securities Ltd. or its associate does not have any material conflict of interest. Any holding in stock – No Disclaimer: This report has been prepared by HDFC Securities Ltd and is meant for sole use by the recipient and not for circulation. The information and opinions contained herein have been compiled or arrived at, based upon information obtained in good faith from sources believed to be reliable. Such information has not been independently verified and no guaranty, representation of warranty, express or implied, is made as to its accuracy, completeness or correctness. All such information and opinions are subject to change without notice. This document is for information purposes only. Descriptions of any company or companies or their securities mentioned herein are not intended to be complete and this document is not, and should not be construed as an offer or solicitation of an offer, to buy or sell any securities or other financial instruments. This report is not directed to, or intended for display, downloading, printing, reproducing or for distribution to or use by, any person or entity who is a citizen or resident or located in any locality, state, country or other jurisdiction where such distribution, publication, reproduction, availability or use would be contrary to law or regulation or what would subject HDFC Securities Ltd or its affiliates to any registration or licensing requirement within such jurisdiction. If this report is inadvertently send or has reached any individual in such country, especially, USA, the same may be ignored and brought to the attention of the sender. This document may not be reproduced, distributed or published for any purposes without prior written approval of HDFC Securities Ltd . Foreign currencies denominated securities, wherever mentioned, are subject to exchange rate fluctuations, which could have an adverse effect on their value or price, or the income derived from them. In addition, investors in securities such as ADRs, the values of which are influenced by foreign currencies effectively assume currency risk. It should not be considered to be taken as an offer to sell or a solicitation to buy any security. HDFC Securities Ltd may from time to time solicit from, or perform broking, or other services for, any company mentioned in this mail and/or its attachments. HDFC Securities and its affiliated company(ies), their directors and employees may; (a) from time to time, have a long or short position in, and buy or sell the securities of the company(ies) mentioned herein or (b) be engaged in any other transaction involving such securities and earn brokerage or other compensation or act as a market maker in the financial instruments of the company(ies) discussed herein or act as an advisor or lender/borrower to such company(ies) or may have any other potential conflict of interests with respect to any recommendation and other related information and opinions. HDFC Securities Ltd, its directors, analysts or employees do not take any responsibility, financial or otherwise, of the losses or the damages sustained due to the investments made or any action taken on basis of this report, including but not restricted to, fluctuation in the prices of shares and bonds, changes in the currency rates, diminution in the NAVs, reduction in the dividend or income, etc. HDFC Securities Ltd and other group companies, its directors, associates, employees may have various positions in any of the stocks, securities and financial instruments dealt in the report, or may make sell or purchase or other deals in these securities from time to time or may deal in other securities of the companies / organizations described in this report. HDFC Securities or its associates might have managed or co-managed public offering of securities for the subject company or might have been mandated by the subject company for any other assignment in the past twelve months. HDFC Securities or its associates might have received any compensation from the companies mentioned in the report during the period preceding twelve months from the date of this report for services in respect of managing or co-managing public offerings, corporate finance, investment banking or merchant banking, brokerage services or other advisory service in a merger or specific transaction in the normal course of business. HDFC Securities or its analysts did not receive any compensation or other benefits from the companies mentioned in the report or third party in connection with preparation of the research report. Accordingly, neither HDFC Securities nor Research Analysts have any material conflict of interest at the time of publication of this report. Compensation of our Research Analysts is not based on any specific merchant banking, investment banking or brokerage service transactions. HDFC Securities may have issued other reports that are inconsistent with and reach different conclusion from the information presented in this report. Research entity has not been engaged in market making activity for the subject company. Research analyst has not served as an officer, director or employee of the subject company. We have not received any compensation/benefits from the subject company or third party in connection with the Research Report.
Page | 16

TECHNO ELECTRIC & ENGINEERING CO. : VISIT NOTE
HDFC securities Institutional Equities Unit No. 1602, 16th Floor, Tower A, Peninsula Business Park, Senapati Bapat Marg, Lower Parel, Mumbai - 400 013 Board : +91-22-6171 7330 www.hdfcsec.com
Page | 17