Northwestern University’s Financial Vision Ahead @ NU January 26, 2010.
31
Northwestern University’s Financial Vision Ahead @ NU January 26, 2010
-
Upload
jason-underwood -
Category
Documents
-
view
215 -
download
2
Transcript of Northwestern University’s Financial Vision Ahead @ NU January 26, 2010.

Northwestern University’sFinancial Vision
Ahead @ NU January 26, 2010

2
“It is simply hard to manage a place if you do not know what is going on.”
Gordon Winston
3
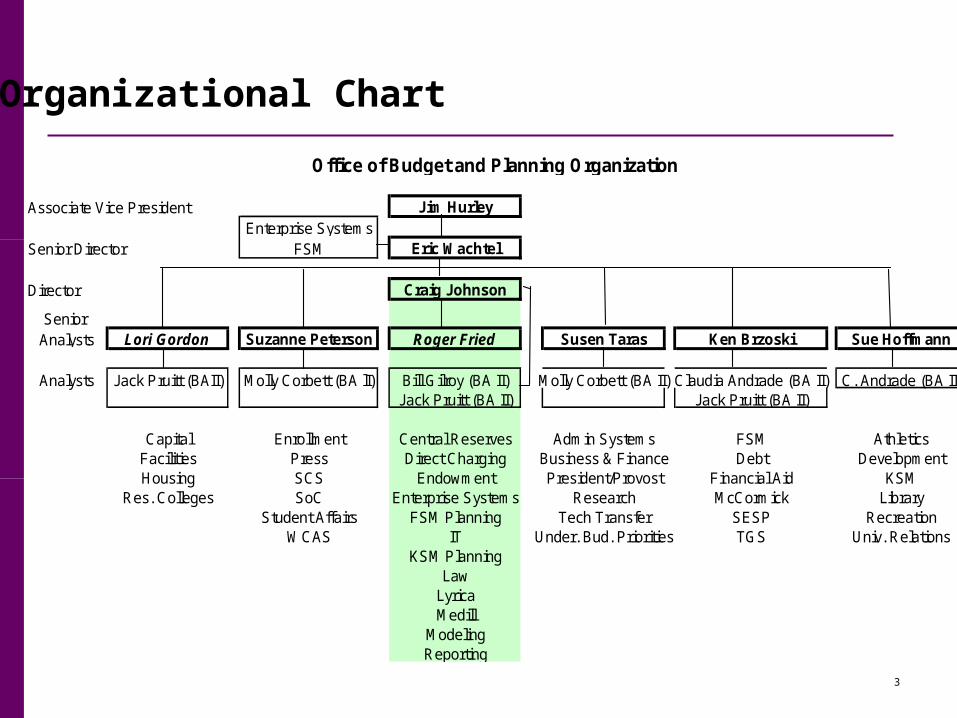
Organizational Chart
Associate Vice President Jim HurleyEnterprise Systems
Senior Director FSM Eric Wachtel
Director Craig Johnson
Senior Analysts Lori Gordon Suzanne Peterson Roger Fried Susen Taras Ken Brzoski Sue Hoffmann
Analysts Jack Pruitt (BAII) Molly Corbett (BA lI) Bill Gilroy (BA II) Molly Corbett (BA II) Claudia Andrade (BA II) C. Andrade (BA II)Jack Pruitt (BA II) Jack Pruitt (BA II)
Capital Enrollment Central Reserves Admin Systems FSM AthleticsFacilities Press Direct Charging Business & Finance Debt DevelopmentHousing SCS Endowment President/Provost Financial Aid KSM
Res. Colleges SoC Enterprise Systems Research McCormick LibraryStudent Affairs FSM Planning Tech Transfer SESP Recreation
WCAS IT Under. Bud. Priorities TGS Univ. RelationsKSM Planning
LawLyricaMedill
ModelingReporting
Office of Budget and Planning Organization

4
In addition to managing the budget.......
President’s Office, Provost’s Office and SVP Business and Finance analytical needs
Housing study Animal laboratories New all-funds budget presentations Enterprise systems planning FSM financial planning Athletics financial planning Kellogg financial planning NU - Qatar campus development Graduate student pricing modeling Fringe benefit rates setting Endowment modeling

5
Budget Process
September Provost call letterOctober – Feb. School and unit meetingsDecember Trustee Budget Committee
Planning ParametersFebruary Trustee Budget Committee
Tuition and Financial AidMarch Planning and Budget Committee
deliberationsApril Communication of preliminary
budgetsMay/June Budget preparationJune Trustee Budget Committee
Budget approval

6
Planning and Budget Group
Dan Linzer Provost and Chair
Morton Schapiro President Gene Sunshine SVP Business and Finance Jim Hurley AVP Budget and Planning Marilyn McCoy VP Administration and Planning
Jay Walsh VP Research Jake Julia AVP Change Management Jean Shedd AP Budget, Facilities and Analysis Eric Wachtel SD Budget Planning Evelyn Caliendo AD Administration and Planning

7
Developing the University’s Budget
- Budget model update
- Planning parameters Tuition and room and board (enrollments, tuition, room and meal
plan rates, financial aid) Compensation (faculty, staff and student, market factors,
benefits) Research (climate, growth and indirect cost recovery) Endowment payout Fringe benefit rates
- External environment Economy
investment returns, inflation, utilities, family circumstances/student need, fundraising

8
Developing the University’s Budget (cont’d)
Governments Research climate Media
Chronicle of Higher Education Inside Higher Education Times, Trib, WSJ
Peer institutions Research University Budget Officers Group Big 10 Business Officers’ Group
Planning and budget process Community engagement

9
Budget Climate
The University has a history of prudent and responsibly aggressive financial management, reasonable budgets and positive operating results going back 25 years.
- Conservative budgets
- We budget the equivalent of a 3% contingency, about 1% or $15 million is a pure contingency and 2% or $30M is allocated to the non-recurring budget for capital projects, faculty start-ups and other one time expenses.
- Strong reserves, we will end the current year with about $86 million, which is committed for future capital projects, faculty start-up and retention packages and other one-time expenses. This is then replenished with unused contingency and bottom line results the following year, when we consider additional capital projects and other one-time expense commitments.
Current commitments for major capital projects, faculty start-up and retention commitments, and other one-time expenses total $262.4 million through FY 2015.
Projected additions to reserves through FY 2015 total $180 million, resulting in a projected FY 2015 balance of $3.5 million.

10
Budget Climate (cont’d)
- Our endowment as a percentage of revenue (18%) is lower than some peers. Examples of institutions with high rates of dependency on endowment include Harvard Faculty of Arts and Sciences (56%), Yale (45%), and Princeton (48%). Additionally, our payout guideline prevented premature consumption of gains in recent years.
- We have enjoyed budget relief from the proceeds of Lyrica, all of which has gone into the endowment ($761 million).
- Our hospital partner contributions have also increased while a number of peers’ hospitals/partners are having financial difficulty.

11
Budget Climate (cont’d)
We constantly benchmark ourselves to peers and review the effect of our actions relative to our circumstances, which are not as acute as some peers.
When comparing Northwestern’s responses relative to the actions of our peers, differences among institutions such as levels of debt, endowment asset allocation, liquidity status, capital commitments and budgeting practices and discipline are considered.
Peer Responses- Delays on new capital projects (most peers)- Base budget reductions (most peers)- Faculty and staff wage freezes (many peers)- Staff hiring freezes (some peers)- Taxable debt offerings to fund operations rather than sell
distressed assets to meet liquidity needs (some peers)- Staff layoffs (some peers)

12
Budget Climate (cont’d)
Philanthropy: new commitments declined 9% ($271 million to $247 million), cash decreased 4% ($218 million to $210 million) compared to FY 2008.
There are bright spots on the external front including the economic stimulus package provisions for research ($101 million in awards received to date) and facilities.

13
Endowment
- Endowment market value @ 11/30: $5.9 billion
(High of $7.4 billion April 2008,
Low of $5.0 billion March 2009)
- FY 2007 year end +22%- FY 2008 total return 0%- FY 2009 reporting -23%
Harvard -30%
Yale -30%
Duke -27%
Columbia -21%
Penn -16%
Vanderbilt -16%
14
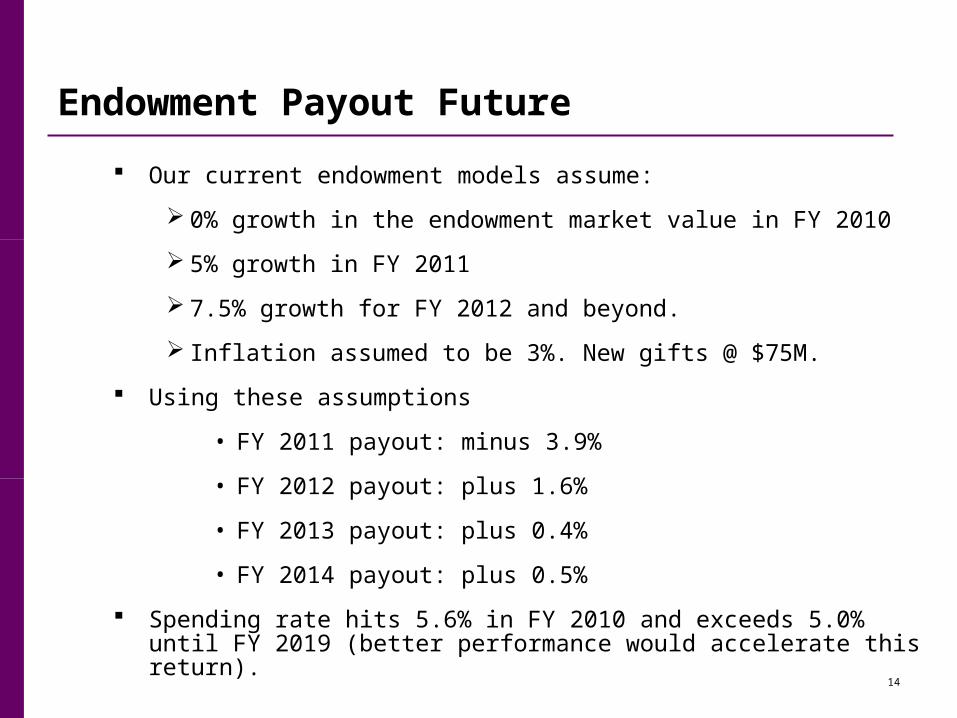
Endowment Payout Future
Our current endowment models assume:
0% growth in the endowment market value in FY 2010
5% growth in FY 2011
7.5% growth for FY 2012 and beyond.
Inflation assumed to be 3%. New gifts @ $75M.
Using these assumptions
• FY 2011 payout: minus 3.9%
• FY 2012 payout: plus 1.6%
• FY 2013 payout: plus 0.4%
• FY 2014 payout: plus 0.5%
Spending rate hits 5.6% in FY 2010 and exceeds 5.0% until FY 2019 (better performance would accelerate this return).

15
5.47% 5.57%
5.10%
4.46%
4.13%
3.79%
4.18%
5.58% 5.56% 5.44%
0.00%
1.00%
2.00%
3.00%
4.00%
5.00%
6.00%
FY 2002 FY 2003 FY 2004 FY 2005 FY 2006 FY 2007 FY 2008 FY 2009 FY 2010 FY 2011
Endowment Payout History
Payout

16
Liquidity Challenges
Relationships
Other UnitHolders
Treasury Pool
Long Term Merged Pool
Operating andCapital Budget
TuitionGiftsGrantsOther Income
$90 MillionPer Month
$23 MillionPer Month*
$67 MillionPer Month
*Includes payout and management fee

17
Liquidity Options
- Review asset allocation
- Draw on short-term financing and credit lines ($200 million in commercial paper and $350 million, Trustees-approved increase from $250 million, secured $325 million)
- Retain operating cash
- Refinance debt (extended variable 1 year)
- Find alternative capital sources for student loans ($67M)
- Reduce amount of payout
- Reduce expenses

18
FY 2010 Budget Planning
Increased undergraduate tuition, room and board by 3.6 percent while increasing the amount of scholarship funds by 10 percent to $86 million. - Feinberg @ 2.5%- Law@ 4.75%- Kellogg @ 4.89%
Required all academic and administrative areas of the University to reduce their operating expenses (other than salaries) by 3 percent. These areas normally receive a 2 percent increase annually, so the reduction will essentially mean a 5 percent cut in operating expenses for next year.
Unfunded 25 previously approved, unfilled positions
Limited salary increases.

19
FY 2010 Budget Planning
We added very, very little to the budget and only in critical areas.
We are not planning any University-wide personnel reductions; however, some personnel reductions have been necessary because external funds are no longer available.
Reduced our capital expenditures, including delaying several large construction projects totaling about $90 million. Some mixed news from Illinois Capital Budget (received $18.3M but question on whether we’ll ever see this).
Projecting balanced University budget: - $1.562 billion revenue = $1.562 billion expense

20
FY 2011 and FY 2012 Outlook (what we know now, subject to change) Likely modest tuition increases
Additional funds for financial aid will be needed (projected 6.4% v. 4.5% planning parameter)
Endowment funds likely reduced by approximately 4%
Salary and benefits parameters under discussion
Likely no non-salary inflationary adjustments
Reallocation is the primary way to meet program priorities and new needs
Very limited funds for capital projects unless supported by fundraising (planning for next campaign underway)
Costs and timing of major capital projects being reviewed- Kellogg, Feinberg, Music

21
Major Capital Projects ($M)
Funding Identified Silverman Hall 103.5
Tech Infills 90.6 – 106.6
Searle Health Services 20.0
Harris Hall 19.6
Library Off-Site Storage 12.0
Housing 10.0 $300M+ pending need
FSM Renovations 24.0
Earth and Planetary Sciences (Hogan) 10.0
Research Computing 10.0
Funding to be Identified/Fundraising Needs to Occur
Kellogg New Facility 350.0
FSM Pavilion 212.0
Music Building 127.0
Library Renovation/Replacement 200.0+
Total $1,188.7 – 1,198.7

22
Appendix

23
Northwestern Budget StructureNorthwestern University manages under a hybrid financial management structure. The financial management of the six undergraduate schools as well as the academic and administrative support areas is centralized. The professional schools – Feinberg, Law, and Kellogg – plus University Housing, operate under a decentralized model.
Fein
berg
an
d L
aw
Kello
gg
Au
xili
ary
Cen
tral
The schools and support units on the centralized model receive annual expense budget appropriations, supported by revenues that are managed centrally (tuition, indirect cost recoveries, endowment and investment income). Financial aid for the centralized schools is managed centrally, as well as building operation and maintenance. Centralized schools may generate local revenues that supplement the central expense appropriation. Centralized schools include McCormick, WCAS, School of Communication, School of Music, SESP, and Medill.
Since 2001-2002, the Feinberg School of Medicine has managed within the decentralized (“tub on its own bottom”) financial framework. Under this framework, the School retains the revenues it generates and is expected to cover all of its direct and indirect costs. Annually, the School is charged its “fair share” of various centrally-managed academic and administrative support services identified as “shared services.” In addition, the School is charged a modest net contribution from the revenues it generates, which is used at the discretion of the President and Provost to meet critical needs of the University. The Medical School is responsible for its capital projects, as well as an allocated share of the major administrative systems replacement projects.
In Fiscal Year 2006, the Law School was moved to this same decentralized financial management structure, with identical processes, such as “shared services” and a net contribution from its revenues.
The Kellogg School of Management operates under a slightly different decentralized model than Feinberg and Law. The central element for the Kellogg model is tuition revenue sharing on their core education programs. Revenue from the executive education programs is not subject to the revenue-sharing structure; however, starting in Fiscal Year 2005, it has been assessed an administrative fee. Central administration covers administrative support services for Kellogg from the share of tuition revenue it retains. Central administration also covers Kellogg’s building operation and maintenance costs. Kellogg is responsible for its capital projects.
University Housing and Food Services operates as an auxiliary, retaining all revenues and paying for direct and indirect expenses incurred on its behalf. Housing also pays for its capital projects, including renewal and replacement work. Housing is charged an overhead assessment for central services based on an older calculation methodology. Plans are underway to move them to the “shared services” model as well.
A critical component of the University’s financial management approach has been the creation of an environment in which budgetary discipline and rigor are recognized as major factors in assessing the management performance of deans and unit directors. For the centralized areas, this environment includes strong financial incentives for effective budget management, because they are permitted to retain year-end budget savings that can provide non-recurring funding for their program needs. The decentralized areas retain all net revenue, after covering direct expenses, the shared services / overhead assessment, and the annual contribution.

24
Operating BudgetFY 2010 Budget (in $M)
REVENUESTuition and Fees 709.9 Financial Aid (238.5)Grants and Contracts - Direct and Indirect 427.9Endowment Distribution 257.5Other Income 21.5Gifts 95.6Sales and Services 287.8Total 1,561.7
EXPENSESAcademic Salaries 390.6Staff / Student Salaries 260.2Employee Benefits 146.5Services and Professional Fees 174.3Maintenance, Utilities, Equipment 173.6Supplies, Materials, Travel, Other Non-Salary 287.7Transfers to/ (from) Capital Projects, Debt Service, Endowment, 128.8and to/ (from) Other Funds for Future ExpendituresTotal 1,561.7
OPERATING RESULT 0.0

25
Operating Budget ExpenseFY 2010 Budget (In $ M. Total Budget = $1,561.7M)
Academic Salaries, 390.6 , 26%
Staff / Student Salaries, 260.2 , 17%
Employee Benefits, 146.5 , 9%Services and Professional Fees,
174.3 , 11%
Maintenance, Utilities, Equipment, 173.6 , 11%
Supplies, Materials, Travel, Other Non-Salary, 287.7 , 18%
Transfers to/ (from) Capital Projects, Debt Service, and Endowment, 128.8 , 8%

26
Operating Budget RevenueFY 2010 Budget (In $ M. Total Budget = $1,561.7M)
Tuition and Fees, 471.4 , 31%
Grants and Contracts - Direct and Indirect, 427.9 , 28%
Endowment Distribution, 257.5 , 16%
Other Income, 21.5 , 1%
Gifts, 95.6 , 6%
Sales and Services, 287.8 , 18%

27
Operating Budget DefinitionsFY 2010 Budget
EXPENSES Academic Salaries Wages paid to full, part time, and temporary faculty for teaching, research,
administration, and other duties. Includes compensation provided to teaching assistants and research assistants.
Staff / Student Salaries Includes wages, overtime, and additional pay provided to exempt, non-
exempt, part-time, temporary, technical staff. Also includes student wages. Employee Benefits The cost borne by the University to provide statutory and elective benefits to
all benefits-eligible staff. This line includes health and dental insurance, retirement, social security, tuition remission, and other benefits. Also includes any allowance for cumulative prior year benefit pool performance.
Services and Professional Fees The cost of general service items, such as insurance, postage, technical and
general consulting, merchandise resale, space rental, insurance, professional services, theatrical productions and other expenses.
Maint., Utilities, Equip. Utility expenses (gas, water, steam, electricity), operating maintenance, and
non-capital equipment. Supplies, Materials, Travel, Expenses for supplies, library materials, travel, prizes and awards, Other Non-Salary grant matching funds, and other miscellaneous expenses. Transfers to/(from) Capital Projects Transfers of funds to support capital projects, renewal and Debt Service, Endowment, and replacement activities, debt service, and new system implementation, Other Funds for Future Expenditures and to/from endowment and other funds for future expenditures.

28
Operating Budget DefinitionsFY 2010 Budget
REVENUES Tuition and Fees Tuition from undergraduate, graduate, professional, continuing education
and non-credit programs. Also includes fees directly assessed to students. Financial Aid Reduction to Tuition and Fees for aid and stipends provided to students.
Grants and Contracts Revenue received from external granting agencies for direct and indirect
expenditures on grants and contracts. Endowment Distribution Total distribution from the merged endowment pool. Other Income Income from internal loans, parking, working capital, and other
miscellaneous income. Gifts Restricted and unrestricted gifts to the University. Sales and Services Includes patent royalty estimates, room and board, and other general
revenue.

29
Capital Funding Sources and UsesFY 2009 Actual (in $M)
Sources
University $112.6Debt $57.0Endowment $10.1Grant/Gift/Other $6.0Total Sources: $185.7
Uses
New Building Construction $82.6Renovation/Remodel $40.3Renewal & Replacement $37.4Site-Infrastructure Work $5.1Health & Safety, Equipment, Systems $20.5Total Uses: $185.7
30
About Capital Funding Sources
Northwestern University's Capital Plan relies on several funding sources: University funds, Gifts/Grants, Debt and "Other" funding.
University Funds: The source of these funds includes central budget, school, department, University reserves and internal loans.
Debt: The amount of debt to be allocated to capital projects takes into consideration the University's debt capacity and the ability to service debt from current funds.
Gifts and Grants and Other: A combination of gifts in hand and state, federal and corporation and foundation grants. Other Categories include investment return from endowment, and other funding sources made up the balance of the FY 2009 funding sources for capital and construction projects.

31
About Capital Funding Uses The Capital Plan has the following "use" categories: New Building Construction;
Renewal, Replacement and Renovation; Site/Infrastructure Work; Systems, Safety and Other.
New Building Construction: Includes major construction projects that generally add gross square footage to the University such as Robert H. Lurie Medical Research Center; Richard and Barbara Silverman Hall; Henry and Leigh Bienen School of Music; Student Health Services Expansion, etc..
Renewal, Replacement and Renovation: Encompasses a wide variety of projects from the major renovation of Wieboldt Hall and Harris Hall, to on-going construction and improvement projects within the Feinberg School of Medicine, Law School and University Housing.
Site and Infrastructure Work: Generally large scale projects, e.g. installation of the 4th chiller in the University physical plant; new steam line construction; repair and replacement of older steam lines; softball field, soccer and lacrosse field improvements; parking and landscaping projects.
Health and Saftey, Equipment and Systems: Examples include: Northwestern University's enterprise system initiative capitalizable expense; various upgrades to information technology assets; code improvements to meet city and state fire and safety requirements; upgraded security programs, handicapped accessibility enhancements and equipment.