NORTHWESTERN UNIVERSITY Temporal Evolution...
214
NORTHWESTERN UNIVERSITY Temporal Evolution of the Chemistry and Nanostructure of Multicomponent Model Ni-Based Superalloys A DISSERTATION SUBMITTED TO THE GRADUATE SCHOOL IN PARTIAL FULFILLMENT OF THE REQUIREMENTS for the degree DOCTOR OF PHILOSOPHY Field of Materials Science and Engineering By Kevin Eylhan Yoon EVANSTON, ILLINOIS June 2004
-
Upload
duongduong -
Category
Documents
-
view
215 -
download
1
Transcript of NORTHWESTERN UNIVERSITY Temporal Evolution...

NORTHWESTERN UNIVERSITY
Temporal Evolution of the Chemistry and Nanostructure of Multicomponent Model
Ni-Based Superalloys
A DISSERTATION
SUBMITTED TO THE GRADUATE SCHOOL
IN PARTIAL FULFILLMENT OF THE REQUIREMENTS
for the degree
DOCTOR OF PHILOSOPHY
Field of Materials Science and Engineering
By
Kevin Eylhan Yoon
EVANSTON, ILLINOIS
June 2004

ii
© Copyright by Kevin Eylhan Yoon 2004
All Rights Reserved

iii
Abstract
Temporal Evolution of the Chemistry and Nanostructure of Multicomponent Model
Ni-Based Superalloys
Kevin Eylhan Yoon
Ni-based superalloys are critical materials in the aerospace industry because of
their excellent balance of mechanical properties including the elevated-temperature
strength, which is a result of the dual-phase microstructure, consisting of the Ni-rich
γ−matrix (FCC) and γ′−precipitates (L12 structure). It is critical to understand the effects
of each alloying element on the microstructure of Ni-based superalloys in order to
further improve the mechanical properties, which are direct consequences of the
microstructure.
Nanoscale chemistry, nanostructure, and temporal evolution of several Ni-based
superalloys, ranging from a simple model Ni-Cr-Al ternary alloy to a complex
commercial superalloy, René N6, have been investigated utilizing three-dimensional
atom probe (3DAP) microscopy and conventional transmission electron microscopy
(CTEM).
First, this research demonstrates the power of 3DAP microscopy, which can
analyze the chemistry of the complex commercial superalloy, René N6, with nine

iv
elements. Concentration profiles and proximity histogram were obtained displaying the
partitioning behavior of all alloying elements and especially Re interfacial segregation at
the γ/γ′ interface.
Next, a model Ni-based superalloy, Ni-Cr-Al alloy, was studied as a reference for
the study of a more complex quaternary alloy, Ni-Cr-Al-Re alloy. The temporal
evolution of chemistry and nanostructure of the alloy are determined employing 3DAP
microscopy. The coarsening kinetics of the γ′−precipitates is examined and compared
with theory, which is in partial agreement. A new coarsening mechanism has been
suggested which explains the difference between the experimental results and the
theoretical predictions. In addition, experimental results are also compared with the
results of kinetic Monte Carlo (KMC) simulations.
Finally, the effects of a Re addition on the temporal evolution of chemistry and
microstructure of the Ni-Cr-Al alloy and coarsening kinetics of the γ′−precipitates have
been investigated employing 3DAP microscopy and CTEM. The Re addition stabilizes
the spheroidal morphology of the γ′−precipitates for extended aging times and retards the
coarsening kinetics without any Re interfacial segregation. The coarsening kinetics is
also compared with the theory.

v
Acknowledgements
First and foremost, I would like to thank my advisor Prof. David Seidman for his
guidance along the study. He showed me the art of materials science with his idea.
Without his trust and support, none of my work would have been possible. Next, I would
like to thank my Ph.D. defense committee members – Profs. Mark Asta, Peter Voorhees,
and Dr. Ronald Noebe – for their time and scientific discussions. I would like to give
special thanks to Dr. Noebe, also my mentor at NASA Glenn Research Center, for his
scientific and financial support of my project. In addition, all Ni-based superalloys that
are investigated in my research were supplied by Dr. Noebe.
I would like to thank my undergraduate advisors at Yonsei University, Seoul,
Korea – Profs. Chong-Sool Choi, Do-Hyang Kim, Kwang-Bum Kim, and Yong Soo
Park – for their inspiration that helped me pursuing my graduate study.
I would like to thank Dr. C. E. Campbell at NIST for the database of alloying
elements diffusivities in Ni-based superalloys.
Many thanks to the members of NUCAPT research group for valuable scientific
discussions and sharing time: Stephan Gerstl, Richard Karnesky, Keith Knipling,
Prakash Kolli, Emmanuelle Marquis, Chantal Sudbrack, and Marsha van Dalen;
especially Dieter Isheim, Jorg Rüsing, and Jason Sebastian for their help with three-
dimensional atom probe microscopy, Jung-il Hong and Christian Fuller for transmission
electron microscopy, and Olof Hellman and Zugang Mao for data analyses and computer

vi
simulations. Special thanks to Ariel Knowles for her assistance with analyzing TEM
micrographs.
I acknowledge the financial support of the NASA Graduate Student Researchers
Program, the National Science Foundation, and Walter P. Murphy Fellowship at
Northwestern University.
I could not thank my parents enough for their never-ending love, prayer, faith
and support. I thank my sister, Lira, who made my life at Northwestern easy. Wish all
the best for the rest of her Ph.D. study.
Great thanks to my friends who have put up with me over the years: Annie, Brian,
Chris, Hayom, Jaeho, Jeesoo, Jiho, Jjung, Jungyoung, Marty, Min, Sang Hyuk, Un,
Yoonmi, and Woong, just to name a few; especially the members of Daeil Foreign
Language High School male vocal double quartet CASCADE, Yonsei University Glee
Club, and Ewha Women’s University Ewha Chorus for their songs, which kept me alive.
Hope I can sing again with them soon. And thanks to Kevin’s home family. Now I can
answer to those whom never learned to stop asking me when I would be done. ^_^
Thanks be to God. Through him, all things were possible.
vii
List of abbreviations and symbols
1DAP One-dimensional atom probe
3DAP Three-dimensional atom probe
AP Atom probe
APB Anti-phase boundary
APFIM Atom probe field ion microscopy
BW Brailsford-Wynblatt
CCD Charge-coupled device
CDC Cluster-diffusion-coagulation
CTEM Conventional transmission electron microscopy
DOF Degree of freedom
DTA Differential thermal analysis
EC Evaporation-condensation
ECOPoSAP Energy compensated optical position sensitive atom probe
EDM Electric discharge machining
FCC Face-centered cubic
FIM Field ion microscopy
ICP Inductively coupled plasma
KMC Kinetic Monte Carlo
LSW Lifshitz-Slyozov-Wagner
viii
ND Not detected
PSD Precipitate size distribution
SC Single crystal
SEM Scanning electron microscopy
TCP Topologically closed packed
TDC Time-to-digital converter
TOF Time of flight
UHV Ultra high vacuum
UO Umantsev-Olson
A Interfacial area
aγ Lattice parameter of γ−matrix
aγ′ Lattice parameter of γ′−precipitates
jiC Concentration of species i in phase j
∆Ci Matrix supersaturation of species i
Di Diffusion coefficient of species i
E0 Electric field
f Pulse fraction
Κγ′/γ Solute partitioning ratio
kf Constant related to the taper angle of tip
kUO Coarsening rate constant for the radius of precipitates

ix
ΚUO Coarsening rate constant for the number density of precipitates
κUO Coarsening rate constant for the matrix supersaturation
Nv Number density
Rg Ideal gas constant
r0 Apex radius of tip
R Radius of a precipitate
<R> Mean precipitate radius
T Temperature
t Time
u Normalized precipitate radius
Vf Volume fraction
Vm Molar volume
v Interfacial velocity of the γ′−precipitates
χ Fraction of γ′−precipitates interconnected
δ Lattice parameter misfit
Γi Gibbsian interfacial excess of species i
RelativeiΓ Relative Gibbsian interfacial excess of element i with respect to other
elements
γ FCC-structured matrix phase of a Ni-based superalloy
γ′ L12-ordered precipitate phase in a Ni-bases superalloy

x
<λ>c-c Mean center-to-center interprecipitate distance
<λ>e-e Mean edge-to-edge interprecipitate distance
µ2 Chemical potential of the solute atom
ρ Aspect ratio
σ Interfacial free energy
σsd Standard deviation

xi
TABLE OF CONTENTS
LIST OF ABBREVIATIONS AND SYMBOLS ....................................................... VII
LIST OF TABLES ......................................................................................................XIV
LIST OF FIGURES .................................................................................................. XVII
CHAPTER ONE: INTRODUCTION............................................................................ 1
CHAPTER TWO: BACKGROUND.............................................................................. 4
2.1. GENERAL CHARACTERISTICS OF NI-BASED SUPERALLOYS .................................. 4
2.1.1. Phase diagrams and microstructure of Ni-Cr-Al system........................... 4
2.1.2. Strengthening mechanism in Ni-based superalloys ................................. 11
2.1.3. Corrosion and oxidation resistance of superalloys ................................. 12
2.2. COARSENING THEORY....................................................................................... 13
2.3. PRIOR STUDIES EMPLOYING ATOM-PROBE FIELD-ION MICROSCOPY (APFIM) AND THREE-DIMENSIONAL ATOM-PROBE (3DAP) MICROSCOPY ...................................... 17
2.4. SEGREGATION: GIBBSIAN INTERFACIAL EXCESS ............................................... 20
CHAPTER THREE: ATOM PROBE FIELD ION MICROSCOPY (APFIM) ...... 23
3.1. FUNDAMENTALS OF FIELD ION MICROSCOPY (FIM) AND ATOM PROBE (AP) MICROSCOPY............................................................................................................ 23
3.1.1. Field Ion Microscopy (FIM) .................................................................... 23
3.1.2. Atom Probe (AP) microscopy .................................................................. 27
3.1.3. Three-dimensional Atom Probe (3DAP) microscopy .............................. 31
3.2. ADVANTAGES OF USING 3DAP MICROSCOPY IN MATERIALS SCIENCE............... 37
CHAPTER FOUR: NANOSCALE CHEMICAL STUDIES OF A COMMERCIAL NI-BASED SUPERALLOY, RENÉ N6 .............................................................. 39
4.1. INTRODUCTION ................................................................................................. 39

xii
4.2. EXPERIMENTAL PROCEDURES ........................................................................... 40
4.3. RESULTS AND DISCUSSION ................................................................................ 43
4.4. CONCLUSIONS................................................................................................... 64
CHAPTER FIVE: NI-CR-AL, NI-CR-AL-RE ALLOYS AND EXPERIMENTAL PROCEDURES..................................................................................................... 66
5.1. THERMAL HISTORY OF THE NI-14.2 AT.% CR-5.2 AT.% AL AND NI-8.5 AT.% CR-10 AT.% AL-2 AT.% RE ALLOYS ....................................................................... 66
5.2. EXPERIMENTAL ASPECTS OF 3DAP MICROSCOPY ANALYSES............................ 67
5.3. EXPERIMENTAL ASPECTS OF CTEM INVESTIGATION ........................................ 71
CHAPTER SIX: TEMPORAL EVOLUTION OF THE NI-14.2 AT.% CR-5.2 AT.% AL ALLOY ................................................................................................ 74
6.1. INTRODUCTION ................................................................................................. 74
6.2. RESULTS ........................................................................................................... 75
6.2.1. Initial state and temporal evolution of the γ′−precipitates ...................... 75
6.2.3. Properties of the γ′−precipitates.............................................................. 83
6.3. DISCUSSIONS .................................................................................................... 91
6.3.1. Morphology of the γ′−precipitates ........................................................... 91
6.3.2. Temporal evolution of the concentrations ............................................... 92
6.3.3. Coarsening kinetics of the alloy............................................................... 93
6.3.4. Coagulation and coalescence of the γ′−precipitates ............................. 104
6.4. CONCLUSIONS...................................................................................................... 109
CHAPTER SEVEN: EFFECTS OF RE ADDITIONS ON THE TEMPORAL EVOLUTION OF THE NI-8.5 AT.% CR-10 AT.% AL-2 AT.% RE ALLOY............................................................................................................................... 113
7.1. INTRODUCTION ............................................................................................... 113
xiii
7.2. RESULTS ......................................................................................................... 114
7.2.1. Conventional transmission electron microscopy ................................... 114
7.2.2. Three-dimensional atom probe microscopy........................................... 125
7.2.3. Coarsening of the γ′−precipitates .......................................................... 133
7.3. DISCUSSIONS .................................................................................................. 141
7.3.1. Morphological evolution of the γ′−precipitates..................................... 141
7.3.2. Temporal evolution of precipitate size distributions ............................. 142
7.3.3. Chemical evolution of the alloy ............................................................. 143
7.3.4. Ordering of γ′−precipitates during early stage decomposition ............. 145
7.3.5. Heterophase segregation of Re at the γ/γ′ interface .............................. 146
7.3.6. Coarsening kinetics................................................................................ 150
7.3.7. Interconnected γ′−precipitates............................................................... 155
7.4. CONCLUSIONS................................................................................................. 163
CHAPTER EIGHT: SUMMARY AND FUTURE RESEARCH............................ 167
8.1 SUMMARY....................................................................................................... 167
8.2 FUTURE RESEARCH ......................................................................................... 169
REFERENCES............................................................................................................. 171
APPENDIX A: DATA ANALYSIS ............................................................................ 183
A.1. DATA ANALYSES OF 3DAP MICROSCOPY RESULTS ......................................... 183
A.2. DATA ANALYSES OF CTEM RESULTS ............................................................. 184
VITA.............................................................................................................................. 187

xiv
List of tables
Table 2.1. Effects of the major alloying elements in nickel-based superalloys [20]...8 Table 4.1. Chemical composition of René N6 superalloy obtained by ICP atomic
emission spectroscopy…………………………………………………..41 Table 4.2. Overall composition of René N6 obtained from 1DAP microscopy
analysis………………………………………………………………….48 Table 4.3. Comparison of the compositions (at.%) of γ−matrix (FCC) and
γ′−precipitates (L12) measured by 1DAP microscopy analysis with standard deviation (σsd) values [88]……………………………………..48
Table 4.4. Calculated solute partitioning ratio (Κγ′/γ, the atomic concentration of an
element in the γ′−precipitates divided by the atomic concentration of the same element in the γ−matrix) for each alloying element as determined from 1DAP microscopy analyses……………………………………….50
Table 4.5. Calculated solute partitioning ratio (Κγ′/γ) for each alloying element as
determined from 3DAP microscopy analyses compared to the phase extraction results. ……………………………………………………….50
Table 4.6. Calculated interfacial excess values of Re, ΓRe, at γ/γ′ interfaces for two
different data sets as determined from 3DAP microscopy analyses. Note that the excess values are in good agreement with one another………...59
Table 5.1. Bulk Compositions (at.%) and compositions of γ−matrix and
γ′−precipitates measured by ICP chemical analysis and volume fraction of γ′−precipitates determined by phase extraction method and ThermoCalc calculations: (a) Ni-Cr-Al and (b) Ni-Cr-Al-Re alloys………………….68
Table 6.1. Compositions (at.%) of γ−matrix (FCC) determined by 3DAP microscopy
as a function of aging time in hours. ……………………………………82 Table 6.2. Compositions (at.%) of γ′−precipitate (L12) determined by 3DAP
microscopy as a function of aging time in hours. ………………………82 Table 6.3. Partitioning ratio (Κγ′/γ, the atomic concentration of an element in the
γ′−precipitates divided by the atomic concentration of the same elements in the γ−matrix) of Ni-Cr-Al alloy as a function of aging time in hours..86

xv
Table 6.4. Detailed results of 3DAP microscopy investigations of the γ′−precipitates
as a function of aging time in hours..……………………………………89 Table 6.5. Overall composition (at.%) of the Ni-Cr-Al alloy and extrapolated
equilibrium composition of the γ−matrix and γ′−precipitates determined from Figures 6.8 and 6.9..……………………………………………...100
Table 6.6. Time exponents of coarsening kinetics obtained from 3DAP microscopy
experiments compared with the asymptotic prediction of the UO theory [36, 37]..………………………………………………………………..100
Table 6.7. The fraction of γ′−precipitates interconnected, χ ( .
..
. / Totppt
interconppt NN=χ ), as
a function of aging time in hours..……………………………………..108 Table 7.1. Detailed results of conventional TEM investigations of the γ′−precipitates
as a function of aging time in hours.…………………………………...118 Table 7.2. Characteristic precipitate size distribution parameters from CTEM
investigations of γ′−precipitates as a function of aging time in hours…124 Table 7.3. Compositions (at.%) of γ−matrix (FCC) determined by 3DAP microscopy
as a function of aging time in hours.…………………………………...130 Table 7.4. Compositions (at.%) of γ′−precipitate (L12) determined by 3DAP
microscopy as a function of aging time in hours..……………………..130 Table 7.5. Partitioning ratio (Κγ′/γ, the atomic concentration of an element in the
γ′−precipitates divided by the atomic concentration of the same elements in the γ−matrix) of Ni-Cr-Al-Re alloy as a function of aging time in hours.
…………………………………………………………………………130 Table 7.6. Overall composition (at.%) of the Ni-Cr-Al-Re alloy and extrapolated
equilibrium compositions of the γ−matrix and γ′−precipitates as determined from Figures 7.11 and 7.14.……………………………….138
Table 7.7. The width of the γ/γ′ interfaces measured from the proxigrams of Re as a
function of aging time in hours.………………………………………..149 Table 7.8. Tracer diffusivities of Ni, Cr, Al, and Re in Ni at 1073 K [132] and ratio
of each tracer diffusivity to that of Ni.……..………………………….151

xvi
Table 7.9. Time exponents obtained from TEM and 3DAP microscopy experiments
compared with the predicted asymptotic values of UO theory [36]…...153

xvii
List of figures
Figure 2.1. An isothermal section, 1023 K, of the Ni-Cr-Al phase diagram [18]…….5 Figure 2.2. Comparison of macro- and microstructures in (from left) equiaxed,
directionally solidified, and single crystal turbine blades [22]…………...7 Figure 2.3. Alloying elements used in Ni-based superalloys. The height of the
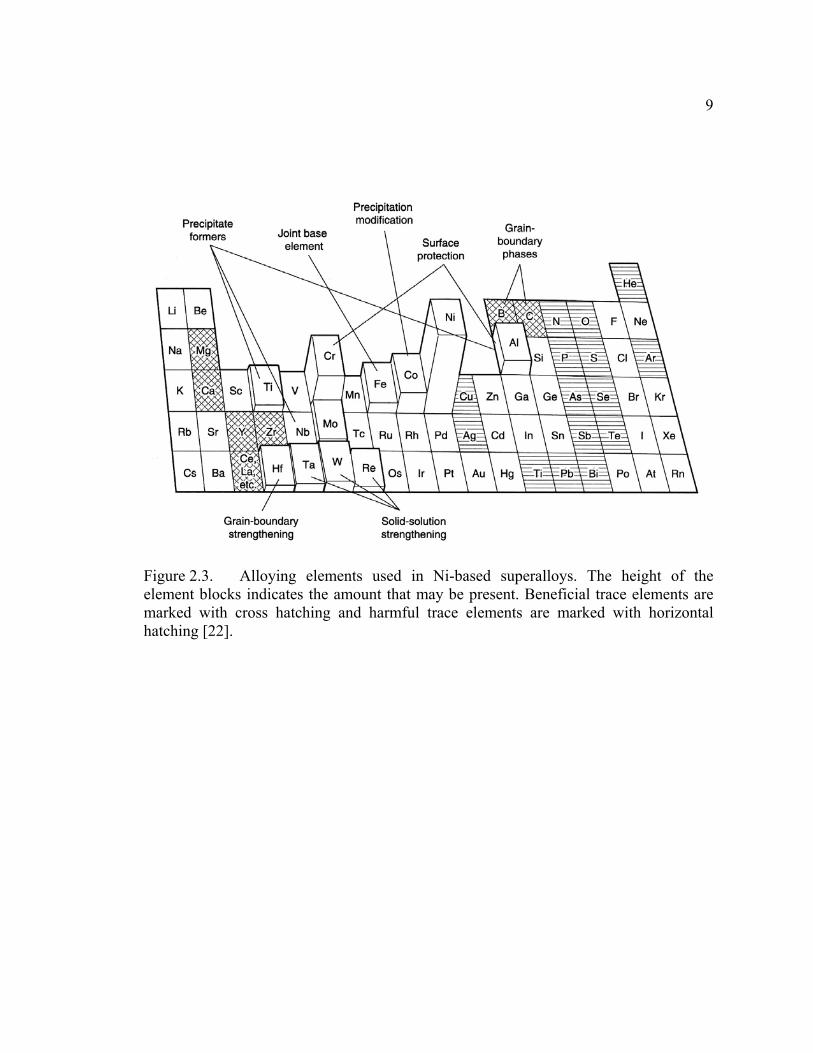
element blocks indicates the amount that may be present. Beneficial trace elements are marked with cross hatching and harmful trace elements are marked with horizontal hatching [22]…………………………………….9
Figure 2.4. Schematic illustration of the variation of the composition of a typical Ni-
based superalloy single crystal composition with time [23]…………….10 Figure 2.5. Spatial distribution of Al + Ti (red), Cr (yellow), Mo (Blue), and B + C
(green) in the vicinity of a serrated grain boundary in a Ni-based superalloy, Astroloy (Ni-8.5% Al-4.0% Ti-15.9% Cr-16% Co-3% Mo-0.13% C-0.11% B-0.03% Zr). Images recorded using the tomographic atom probe. The analyzed region is 10 × 10 × 120 nm. Two types of interfaces are present: two γ/γ′ boundaries and one γ′/γ′ boundary [45]...19
Figure 3.1. Schematic diagram of a modern APFIM equipped with an energy-
compensated atom probe, an imaging atom probe, and a pulsed laser atom probe [75].……………………………………………………………….24
Figure 3.2. Transmission electron micrograph of a Ni3Al APFIM specimen obtained
with a Hitachi H700B microscope operated at 200 kV in the bright field condition. A grain boundary is seen at a distance of 400 nm from the apex [65]. ……………………………………………………………………..24
Figure 3.3. Principles of image formation. The image gas atoms are polarized by the
strong electric field and drawn towards the specimen surface. Field adsorption occurs on prominent surface atoms, which are themselves polarized by the field (dipoles are indicated by short arrows). Field ionization of the gas atoms occurs by tunneling of electrons through the field adsorbed gas atoms and into the metal. The positive image gas ions are then repelled away from the specimen towards the screen where the field ion image is formed [75].………………………………………….25
Figure 3.4. Ball model illustrating the origin of the FIM image contrast. White atoms

xviii
indicate prominent sites above which field ionization occurs preferentially. The model is of the FCC structure, with the (001) plane at the top, {111} planes to the left and right, and the (024) plane fully resolved at center front [75].…………………………………………….28
Figure 3.5. Image of tungsten taken in a He atmosphere under a pressure of 10-4 Pa and a temperature of 60 K (courtesy Dr. J. Rüsing)…………………….29
Figure 3.6. Schematic drawings of an interface analysis (a) using conventional AP
and (b) using 3DAP microscopies. In the case of conventional AP microscopy, if the interface is not perpendicular to the probing direction, it is impossible to determine the concentration change at the interface without convolution. However, using a 3DAP microscopy, a cylinder of analysis can be arbitrarily selected as shown in the figure [84]………...32
Figure 3.7. Appearance of 3DAP microscope at Northwestern University…………34 Figure 3.8. Schematic diagram of the operation of a 3DAP microscopy, with a
reflectron lens (courtesy Dr. J. T. Sebastian, Northwestern University)..35 Figure 3.9. Schematic diagram of an energy compensating AP that incorporates a
reflectron lens. Ions with energy deficits do not penetrate as far into the lens as ions with the full energy before being reflected to the detector thereby decreasing their flight paths and flight times and compensating for their lower velocities [76].…………………………………………..36
Figure 3.10. Schematic diagram of optical instruments that combines a photodiode
array camera to provide the positions and a multianode array to provide the flight times of ions striking the detector [76]……………………….36
Figure 4.1. (a) SEM micrograph showing high number density of cuboidal
γ′−precipitates in the γ−matrix. The Vf of γ′−precipitates is approximately 70%. (b) A bright-field TEM micrograph recorded along the <001> zone axis showing cuboidal γ′−precipitates in a René N6 superalloy. The measured Vf of γ′−precipitates is 68% (TEM micrograph, courtesy Ms. C. K. Sudbrack)…………………………………………………………….44
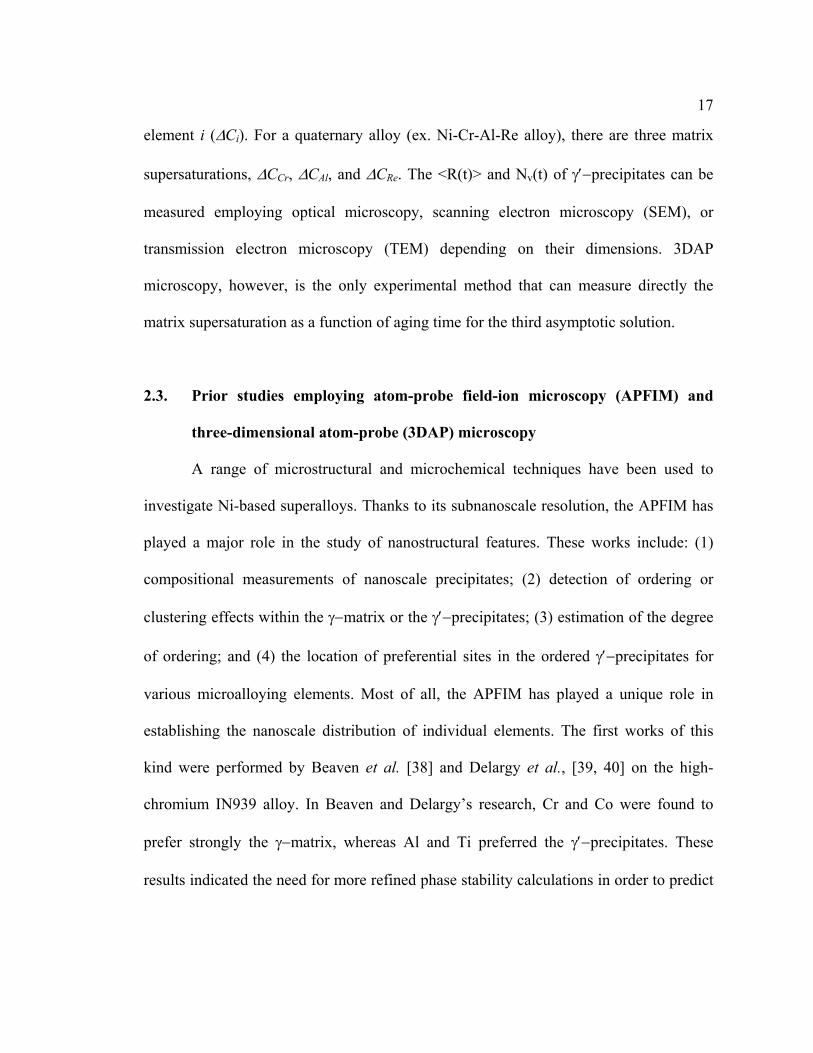
Figure 4.2. Part of the mass spectrum obtained by: (a) 1DAP microscopy, showing
the close proximity of the elements Ta and Re; and (b) 3DAP microscopy, showing a clear distinction among the isotopes of Ta, W and Re………46

xix
Figure 4.3. Concentration profiles obtained by 1DAP microscopy, showing the concentration variation through γ/γ′ interfaces. Re segregation is observed at the γ/γ′ interfaces in its profile.……………………………………….47
Figure 4.4. An integral profile for Re utilizing the graphical method indicated for
determining the interfacial excess of solute; references [49, 53] for details. …………………………………….…………………………………….51 Figure 4.5. Three-dimensional atom-by-atom reconstruction of the second data set
containing one million atoms with an isoconcentration surface of Cr at a threshold value of 7 at.%. The positions of Al atoms are displayed in red, Ta in light pink, Cr in blue, W in light blue, Re in yellow, and Mo in dark green. The Ni, Co and Hf atoms are not exhibited in this figure for the sake of clarity.…………………………………………………………...52
Figure 4.6. The proxigram of Cr is used for determining the optimum threshold value
for the isoconcentration surface. The steepest concentration gradient of the profile is between 3.5 and 8.5 at.% Cr.…………………………...…54
Figure 4.7. A proxigram displaying the Re atomic concentration as a function of
distance with respect to the γ/γ′ interface; positive values are into the γ−matrix and negative values are into the γ′−precipitates. The interface is defined by an isoconcentration surface at 7 at.% Cr (Figure 4.6). The interfacial excess of Re is indicated by the gray region………………...55
Figure 4.8. The proxigrams of Re for (a) the first data set and (b) the second data set.
Note that as the threshold value is changed, only the reference point shifts. There is no change in the integrated area under the profile at the peak since the shape of the profile remains unchanged: Table 4.6…………...58
Figure 4.9. A proxigram displaying the Cr atomic concentration as a function of
distance with respect to the γ/γ′ interface; positive values are into the γ−matrix and negative values are into the γ′−precipitates. The interface is defined by an isoconcentration surface at 7 at.% Cr (Figure 4.6). The interfacial excess of Cr is indicated by the gray region…………………62
Figure 4.10. A proxigram displaying the Co atomic concentration as a function of
distance with respect to the γ/γ′ interface; positive values are into the γ−matrix and negative values are into the γ′−precipitates. The interface is defined by an isoconcentration surface at 7 at.% Co (Figure 4.6). The interfacial excess of Re is indicated by the gray region………………...63

xx
Figure 5.1. (a) FIM micrograph of a Ni-Cr-Al-Re alloy aged at 1073 K for 1 h taken in a Ne atmosphere under a pressure of 10-3 Pa and a temperature of 50 K, with the area near 100-type pole selected by primary detector for 3DAP microscopy analyses and (b) corresponding crystallographic orientation of Figure 5.1(a).…………………………………………………………70
Figure 5.2. Dark-field TEM micrograph of Ni-Cr-Al-Re alloy aged for 264 h, taken
along the [100] zone axis in a two-beam condition, with its accompanying diffraction pattern in the upper left-hand corner..……………………….73
Figure 6.1. Ni-14.2 at.% Cr-5.2 at.% Al alloy: (a) diffraction pattern of as-quenched
state specimens; and (b) dark-field TEM micrograph of sample aged for 1024 h, taken along the [100] zone axis with its accompanying diffraction pattern in the upper left-hand corner. Note the presence of superlattice reflections in the diffraction pattern in the micrograph of the 1024 h specimens, from the γ′−precipitates (L12), which reside between the strong reflections from the γ-matrix (FCC).…………………………….77
Figure 6.2. A 9 at.% Al isoconcentration surface is employed to identify the
γ′−precipitates in the Ni-Cr-Al alloy aged at 873 K for different aging times thereby displaying the temporal evolution of the γ′−precipitates. Each reconstruction is a subset of results extracted from a larger volume to create a 10×10×25 nm3 parallelepiped for comparison as a function of aging time. This figure qualitatively exhibits the increase in the mean radius of γ′−precipitates and concomitant decrease in the number density of the γ′−precipitates, as a function of increasing aging time…………...78
Figure 6.3. Three-dimensional reconstruction of the Ni-Cr-Al alloy (containing 1.6
million atoms in a 22×22×83 nm3 parallelepiped) after an aging time of 1024 h; Cr atoms are shown in blue and Al atoms in red, while Ni atoms are not shown for the sake of clarity. This figure demonstrates that the γ′−precipitates maintain the spheroidal morphology at an aging time of 1024 h.…………………………………………………………………..80
Figure 6.4. Proxigrams of Ni, Cr, and Al for three different aging times (1, 64, and
1024 h). The graphs exhibit the temporal evolution of each elemental concentration in both γ−matrix and γ′−precipitates. As aging time increases, the concentrations of Ni and Cr increase but the Al concentration decreases in the γ−matrix. In the γ′−precipitates, Cr and Al concentrations decrease, while the Ni concentration increases…………81
Figure 6.5. Volume fraction, Vf, of γ′−precipitates as a function of aging time, which

xxi
converges to approximately 16 vol.% with increasing aging time. KMC simulation results are superimposed for comparison [96]; they are in good agreement with the experimental results.……………………………….84
Figure 6.6. Partitioning ratios, Κγ′/γ, for all the elements in this Ni-Cr-Al alloy plotted
as a function of aging time. This graph clearly displays the partitioning behavior of the elements; Ni and Cr prefer the γ−matrix, while Al favors the γ′−precipitates.………………………………………………………85
Figure 6.7. Double logarithmic plot of (a) mean radius, <R>, and (b) number density,
Nv, of γ′−precipitates and (c) the mean edge-to-edge interprecipitate distance, <λ>e-e, versus aging time (0.17, 0.25, 1, 4, 16, 64, 256 and 1024 h) for this Ni-Cr-Al alloy. As aging time increases, the values of <R> increases, while Nv monotonically decreases. In addition, <λ>e-e decreases then increases after an aging time of 4 h. Time exponents of the coarsening are determined from these log-log plots. The results of KMC simulations are superimposed for comparison [96]……………………..88
Figure 6.8. Interfacial velocity of the γ′−precipitates, v, derived from the <R> of
γ′−precipitates (Figure 6.7 (a)), as a function of aging time. The displacement of the interface of the γ′−precipitates steadily decreases, as aging time increases……………………………………………………..90
Figure 6.9. The γ−matrix concentrations of Cr and Al far away from the
γ/γ′ interfaces, measured by 3DAP microscopy as a function of (aging time)-1/3 at 873 K. The extrapolated intercepts on the ordinate axis, to infinite time, correspond to the equilibrium solid-solubilities of Cr and Al in the γ−matrix.………………………………………………………….98
Figure 6.10. The γ′−precipitates concentrations of Cr and Al measured by 3DAP
microscopy as a function of (aging time)-1/3 at 873 K. The extrapolated intercepts on the ordinate axis, to infinite time, correspond to the equilibrium concentrations of Cr and Al in the γ′−precipitates…………99
Figure 6.11. Double logarithmic plots of the Cr and Al matrix supersaturations, ∆Ci, as
a function of aging time at 873 K. The slopes of these plots yield the time exponents of coarsening of Cr and Al. The results of KMC simulations are superimposed for comparison [96]………………………………...101
Figure 6.12. Double logarithmic plots of the concentration difference in γ′−precipitates,
[ ])()( '' ∞→− tCtC iiγγ , of Cr and Al as a function of aging time at 873 K.

xxii
…………………………………….…………………………………...102 Figure 6.13. Mean precipitate radius cubed, <R>3, as a function of aging time for this
Ni-Cr-Al alloy. The slope of the straight line corresponds to the coarsening rate constant, kUO.………………………………………….103
Figure 6.14. The fraction of γ′−precipitates interconnected, χ (total number of
γ′−precipitates interconnected by necks with other γ′−precipitates in the analyzed volume divided by the total number of γ′−precipitates in the analyzed volume), as a function of aging time at 873 K. At 0.17 and 1024 h, the γ′−precipitates interconnected by necks are not detected by 3DAP microscopy.…………………………………………………………….107
Figure 7.1. Dark-field TEM micrograph of Ni-8.5 at.% Cr-10 at.% Al-2 at.% Re
alloy: (a) as-quenched state; and (b) aged for 264 h. Micrographs are recorded along the [100] zone axis with its accompanying diffraction pattern in the upper left-hand corner. Note the presence of superlattice reflections in the diffraction pattern in both micrographs, from the γ′−precipitates (L12), which reside between the strong reflections from the γ-matrix (FCC).………………………………………………………...115
Figure 7.2. A comparison of the γ′−precipitate morphologies formed from
superlattice dark-field TEM images (utilizing a 100 superlattice reflection near the [100] zone axis) of Ni-8.5 at.% Cr-10 at.% Al-2 at.% Re alloy aged for: (a) 0 h; (b) 0.25 h; (c) 1 h; (d) 4 h; (e) 16 h; (f) 64h; and (g) & (h) 264 h. The morphology of the γ′−precipitates remains spheroidal even at the longest aging time, 264 h.………………..……………………...117
Figure 7.3. Double logarithmic plot of: (a) difference in mean radius cubed, <R(t)>3-
<R(t=0)>3, and (b) number density, Nv, of γ′−precipitates and (c) the mean edge-to-edge interprecipitate distance, <λ>e-e, versus aging time (0.25, 1, 4, 16, 64 and 264 h) for Ni-8.5 at.% Cr-10 at.% Al-2 at.% Re alloy. As the aging time increases, <R> and <λ>e-e increase, while Nv monotonically decreases.………………………………………………119
Figure 7.4. Interfacial velocity of the γ′−precipitates, v, derived from the <R> of
γ′−precipitates, as a function of aging time. The velocity of the interface of the γ′−precipitates steadily decelerates as aging time increases…….120
Figure 7.5. Volume fraction, Vf, of γ′−precipitates versus aging time, which
converges to approximately 25 vol.% with increasing aging time. This is in reasonable agreement with the result obtained from the phase

xxiii
extraction method, Table 5.1 (b).………………………………………121 Figure 7.6. Precipitate size distributions (PSDs) of Ni-8.5 at.% Cr-10 at.% Al-2 at.%
Re alloy aged for 0, 0.25, 1, 4, 16, 64 and 264 h, in which histograms of the distribution function are plotted as a function of normalized radius, u = R/<R>. Precipitate size distributions for the LSW theory and BW model are superimposed for comparison. The shape of the experimental PSDs changes as aging time increases, which disagrees with the time-invariant shape of LSW theory. In addition, the experimental PSDs do not agree with the prediction of the non-zero volume fraction corrected BW model.………………………………………………………………….123
Figure 7.7. Three-dimensional atom probe microscopy reconstruction of Ni-8.5 at.%
Cr-10 at.% Al-2 at.% Re alloy (containing 1.5 million atoms in a 16×16×130 nm3 parallelepiped) in as-quenched state, which indicates the presence of the γ′−precipitates; Cr atoms are shown in blue, Al atoms in red, and Re atoms in orange, while Ni atoms are not shown for the sake of clarity. A 12 at.% Al isoconcentration surface is used to indicate the γ/γ′ interfaces. A fraction of the γ′−precipitates is interconnected by necks. A portion of a γ′−precipitate is magnified with only Al atoms shown to display the alternating Al planes in the [100] direction of ordered L12 structure. This result indicates that phase separation and ordering of γ′−precipitates occur during the quench from 1253 K…………………126
Figure 7.8. Three-dimensional atom probe microscopy of Ni-8.5 at.% Cr-10 at.% Al-
2 at.% Re alloy for a series of aging times displaying the temporal evolution of the γ′−precipitates. Each reconstruction is a subset of results extracted from the entire volume to create a 10×10 nm2 cross-section for comparison as a function of aging time. The cross-section of the volume is perpendicular to the plane of page. The color-coding of the atoms is the same as in Figure 7.7. This figure qualitatively exhibits the increase in the mean radius, <R>, and decrease in the number density, Nv, of the γ′−precipitates as a function of increasing aging time…………………127
Figure 7.9. Proxigrams of Ni, Cr, and Al for four different aging times (0, 0.25, 1,
and 264 h). The graphs exhibit the temporal evolution of each elemental concentration in both γ−matrix and γ′−precipitates. With increasing aging time, the concentrations of Ni and Cr increase but the Al concentration decreases in γ−matrix. The opposite behavior is observed for the γ′−precipitates.…………………………………………………………128
Figure 7.10. A series of Re proxigrams displaying the temporal evolution of Re.

xxiv
Contrary to the result for a commercial Ni-based superalloy, René N6, there is no significant Re interfacial segregation at the γ/γ′ interface. Negative distance is into the γ−matrix, while positive distance is into the γ′−precipitates. The broad Re profile across the γ/γ′ interface of the as-quenched state becomes significantly sharper with increasing aging time…………………………………………………………………….132
Figure 7.11. γ−matrix concentrations of Cr, Al, and Re far away from the γ/γ′ interface
measured by 3DAP microscopy as a function of (aging time)-1/3 at 1073 K. The extrapolated intercepts on the ordinate axis, to infinite time, correspond to the equilibrium solid-solubility of these solutes in the γ−matrix.……………………………………………………………….135
Figure 7.12. The γ′−precipitates concentrations of Cr, Al, and Re measured by 3DAP
microscopy as a function of (aging time)-1/3 at 1073 K. The extrapolated intercepts on the ordinate axis, to infinite time, correspond to the equilibrium concentration of these solutes in the γ′−precipitates……...137
Figure 7.13. Double logarithmic plot of the Cr, Al, and Re matrix supersaturations,
∆Ci, as a function of aging time at 1073 K. The slopes of the plot yield the time exponents of UO theory for ∆Ci, for each alloying element…139
Figure 7.14. Double logarithmic plots of the concentration difference in γ′−precipitates,
[ ])()( '' ∞→− tCtC iiγγ , of Cr, Al, and Re as a function of aging time at
1073 K. The slope of the plots yield the time exponents for the [ ])()( '' ∞→− tCtC ii
γγ , for each alloying element…………………….140 Figure 7.15. Partitioning ratio (atomic concentration of an element in γ′−precipitates
divided by atomic concentration of element in γ−matrix) of all the elements in: (a) Ni-8.5 at.% Cr-10 at.% Al; (b) Ni-8.5 at.% Cr-10 at.% Al-2 at.% W; and (c) Ni-8.5 at.% Cr-10 at.% Al-2 at.% Re alloy, plotted as a function of aging time and compared with other results [90]. This graph vividly displays the effect of the Re addition on the partitioning behavior of all alloying elements in this Ni-based model superalloy….144
Figure 7.16. The width of γ/γ′ interfaces measured from Re concentration profiles
(Figure 7. 10) as a function of aging time at 1073 K. The broad interfaces in as-quenched state evolve to narrower interfaces with increasing aging time. In addition, a gradual decrease in Re concentration across the interfaces in as-quenched state changes to the sharp decrease in Re concentration with increasing aging time……………………………...148

xxv
Figure 7.17. The difference in mean precipitate radius cubed, <R(t)>3-<R(t=0)>3, as a
function of aging time for Ni-8.5 at.% Cr-10 at.% Al-2 at.% Re alloy. The slope of the straight line corresponds to the coarsening rate constant for the mean radius of the γ′−precipitates, kUO = (2.59 ± 0.66) × 10-27 m3 s-1.
………………………………….……………………………………...154 Figure 7.18. The fraction of γ′−precipitates interconnected, χ, as a function of aging
time at 1073 K. After an aging time of 1 h, the γ′−precipitates interconnected by necks are not detected by 3DAP microscopy………157
Figure 7.19. Three-dimensional atom probe microscopy reconstruction of Al atoms
inside the interconnected γ′−precipitates, which displays clearly the alternating Al-rich planes of the L12-ordered structure in both the precipitates and neck region, along the [100] direction. Only Al atoms are shown for the sake of clarity…………………………………………...158
Figure 7.20. Distributions of the aspect ratio (ρ, the ratio of the maximum caliper
diameter of a precipitate divided by the minimum caliper diameter of a precipitate) of the γ′−precipitates of Ni-8.5 at.% Cr-10 at.% Al-2 at.% Re alloy aged for 0, 0.25, 1, 4, 16, 64 and 264 h, in which the histograms of probability density are plotted as a function of ρ. With increasing aging time, γ′−precipitates with high values of ρ disappear, which indicates that the number of interconnected precipitates with necks is decreasing with increasing aging time…………………………………………………..161
Figure 7.21. The mean aspect ratio, <ρ>, of the γ′−precipitates is decreasing as aging
time increases after 4 h of aging. This indicates that elongated precipitates become more spheroidal with increasing aging time………………….162

1
Chapter One
Introduction
"A superalloy is an alloy developed for elevated temperature service, usually
based on group VIII elements, where relatively severe mechanical stressing is
encountered, and where high surface stability is frequently required [1]." Superalloys are
utilized for aircraft, marine, industrial, and vehicular gas turbines, space vehicles, rocket
engines, and nuclear reactors dating from the mid-1900s. The need for Ni-based
superalloys has been led by the aerospace industry's demand for energy efficient turbine
engines [2, 3]. Ni-based superalloys have a positive temperature-strength relationship
and high corrosion resistance: Consequently, it is possible to increase the operating
temperatures of turbine engines without the addition of cooling systems. Some of the
most popular Ni-based superalloys are Ni-Cr-Al alloys that derive their high temperature
properties from the dual phase structure of ordered Ni3Al-type γ′−precipitates, which are
dispersed in a chromium-enriched solid-solution [4-8]. This two-phase microstructure
gives Ni-Cr-Al alloys both strength and ductility.
To further improve the high temperature properties of Ni-Cr-Al alloys, additions
of microalloying elements (Re, Ti, W, Hf, V, Ta, Y, Zr, and Ce) have been utilized [9-
17]. The favorable elevated-temperature properties of Ni-Cr-Al-X alloys, where X is Ta,
W, Re, Mo and Nb, have led to many applications. One such application is for the next
generation of aerospace alloys, which has been demonstrated in new turbine engine

2
blades, engine disks, and land-based turbine engines, such as those used for electrical
power generators [12, 15].
This research focuses on the interplay between the addition of a quaternary
element, X, and the corresponding nanostructural properties of Ni-Cr-Al-X alloys. A
combination of conventional transmission electron microscopy (CTEM) and three-
dimensional atom-probe (3DAP) microscopy are employed to investigate chemical
nanostructural changes, nano- to subnanoscale chemical analysis, and the segregation
and partitioning of alloying elements.
This thesis consists of eight chapters:
In Chapter Two, characteristics of nickel-based superalloys, experimental investigations
employing atom-probe field-ion microscopy (APFIM), coarsening theory, and
background on solute segregation at solid/solid interfaces are presented.
In Chapter Three, background materials on APFIM and 3DAP microscopy are discussed.
In Chapter Four, results of 3DAP microscopy investigations of a complex
multicomponent commercial Ni-based superalloy, René N6, are presented. From the
results, the compositions of γ−matrix (FCC) and γ′−precipitates (L12), partitioning
behavior, and the volume fraction of γ′−precipitates is determined. Segregation of Re at
the γ/γ′ interface is quantified by utilizing the proximity histogram (proxigram for short).
3DAP microscopy enables the investigation of the chemical nature of complex materials
with high mass resolution and three-dimensional atomic resolution. It is, however,
difficult to pinpoint the effect of individual alloying element on the microstructure

3
because of the large number of alloying elements.
In the next three chapters, therefore, we present the results of model ternary and
quaternary Ni-based superalloys to investigate the roles played by individual alloying
elements on the temporal evolution of their nanostructure.
In Chapter Five, materials and experimental procedures employed for investigating
ternary and quaternary Ni-based superalloys are presented.
In Chapter Six, the temporal evolution of γ′−precipitates in a model ternary Ni-14.2 at.%
Cr-5.2 at.% Al alloy is presented. 3DAP microscopy results are exhibited as a function
of aging time at 873 K. From the results, the compositions of γ−matrix and
γ′−precipitates, partitioning behavior, and volume fraction of γ′−precipitates is
determined. In addition, the coarsening kinetics of the alloy are compared with kinetic
Monte Carlo (KMC) simulations and coarsening theories.
In Chapter Seven, the effects of a 2 at.% Re addition on the chemistry and nanostructure
of model Ni-8.5 at.% Cr-10 at.% Al alloy are presented. Rhenium additions are found to
change the precipitate morphology, number density, and coarsening kinetics.
Chapter Eight is a summary of the current research and future research on
multicomponent Ni-based superalloys.

4
Chapter Two
Background
2.1. General characteristics of Ni-based superalloys
2.1.1. Phase diagrams and microstructure of Ni-Cr-Al system
The Ni-Cr-Al system is fundamental to the structure and behavior of
multicomponent Ni-based superalloys. It has been studied primarily within the Ni-rich
region [18]. The addition of Cr significantly lowers the liquidus temperatures in
comparison to the binary Ni-Al alloy. The Cr-enriched γ−matrix phase can dissolve
about 30 at.% Cr at 1423 K, and the Al-enriched γ′−precipitate phase about 15 at.% Cr at
same temperature in this system. The solubility of Cr in the γ′−precipitate of commercial
superalloys is usually significantly less, 3-4 at.% being typical, particularly at lower
temperatures (< 1123 K). The 1023 K isothermal, Ni-rich section of the Ni-Cr-Al ternary
phase diagram is displayed in Figure 2.1.
Nickel-based superalloys have a γ−matrix phase with a face-centered cubic
(FCC) structure, containing a dispersion of ordered intermetallic γ′−precipitates (Ni3Al-
type, L12) [2, 3, 19-21]. These alloys derive their strength from the solid-solution
strengthening elements and the precipitating γ′ phase. The principal microstructural
variables of superalloys are: (1) the volume fraction (Vf) and number density (Nv) of
γ′−precipitates and their morphology; (2) the grain size and shape; and (3) the carbide
particle distribution. Microstructural control is achieved through composition

5
Figure 2.1. An isothermal section, 1023 K, of the Ni-Cr-Al phase diagram [18].

6
selection/modification and alloy processing, such as directional solidification. The Vf of
γ′−precipitates varies from less than 25 vol.% to 60 vol.%. The γ′−precipitates have a
spheroidal morphology at lower Vf, but often a cuboidal morphology in higher Vf alloys
(Vf ≥ 35 vol.%). The inherent strength capability of superalloys is controlled by the
intragranular distribution of precipitates. The usable strength, however, of
polycrystalline alloys is determined by the state of the grain boundaries, particularly as
affected by the carbide phase morphology and distribution. The introduction of single
crystal (SC) turbine blades, however, negates the need for adding C, B, and Zr as grain
boundary strengtheners to prevent grain boundary embrittlement, since directional
casting technique to create SC removes all grain boundaries. Consequently,
improvement of the Ni-based superalloys focuses on the development of compositions
and microstructure to increase the operating temperature of turbine engines. Substantial
property improvements utilizing SC turbine blades include: increase in ductility through
removal of transverse grain boundary segments; increase in the solidus temperature
resulting from substituting grain boundary strengtheners (melting point depressants) with
refractory elements; and increase in creep strength due to the high Vf of γ′−precipitates.
The different macro- and microstructures corresponding to the different solidification
techniques are illustrated in Figure 2.2 [22].
The effects of the major alloying elements in Ni-based superalloys are tabulated
in Table 2.1 [20] and displayed in Figure 2.3 [22]. In addition, the composition evolution
of single-crystal Ni-based superalloys is shown in Figure 2.4 [23].

7
Figure 2.2. Comparison of macro- and microstructures in (from left) equiaxed, directionally solidified, and single crystal turbine blades [22].

8
Table 2.1. Effects of the major alloying elements in nickel-based superalloys [20].
9
Figure 2.3. Alloying elements used in Ni-based superalloys. The height of the element blocks indicates the amount that may be present. Beneficial trace elements are marked with cross hatching and harmful trace elements are marked with horizontal hatching [22].

10
Figure 2.4. Schematic illustration of the variation of the composition of a typical Ni-based superalloy single crystal composition with time [23].
11
2.1.2. Strengthening mechanism in Ni-based superalloys
Superalloys are complex alloy systems that utilize numerous strengthening
mechanisms, including: (1) solid-solution strengthened γ−matrix; (2) increased Vf of γ′
or γ″−precipitates − Ni3(Cr, Al) and Ni3(Nb, Ti), respectively; (3) precipitation hardened
γ′−precipitates; and (4) control of carbides and grain boundary γ′−precipitates to enhance
rupture strength [2, 19-21]. Most approaches used to increase the strength of the Ni-Cr-
Al alloys are strengthening of the matrix by substitutional solid-solution elements and
increasing the Vf of γ′−precipitates for precipitation hardening [17, 24, 25]. Grain
boundaries are reinforced by carbide precipitation and by the use of minor additions of
boron and zirconium to increase boundary cohesion [26].
Because of its electronic structure, the FCC Ni lattice has a large solid-solubility
for many other elements. In order to achieve a useful solid-solution, the following
requirements for a specific element must be satisfied: (1) it has a wide range of solid
solubility in the matrix; (2) it has large enough dissimilarity in atomic size with the
matrix for effective lattice distortion; and (3) it has a high melting point. The first two of
these requirements are to some extent incompatible, since Hume-Rothery's work has
shown that a wide range of solid-solution is obtained only when the atomic size of the
constituent metals are similar. Therefore, there is a tradeoff between the solid solubility
and lattice distortion. Molybdenum and W are effective because they provide strong
lattice cohesion and reduce diffusion, particularly at high temperatures [19, 20].
The primary contribution to the strength of precipitation-hardened Ni-based
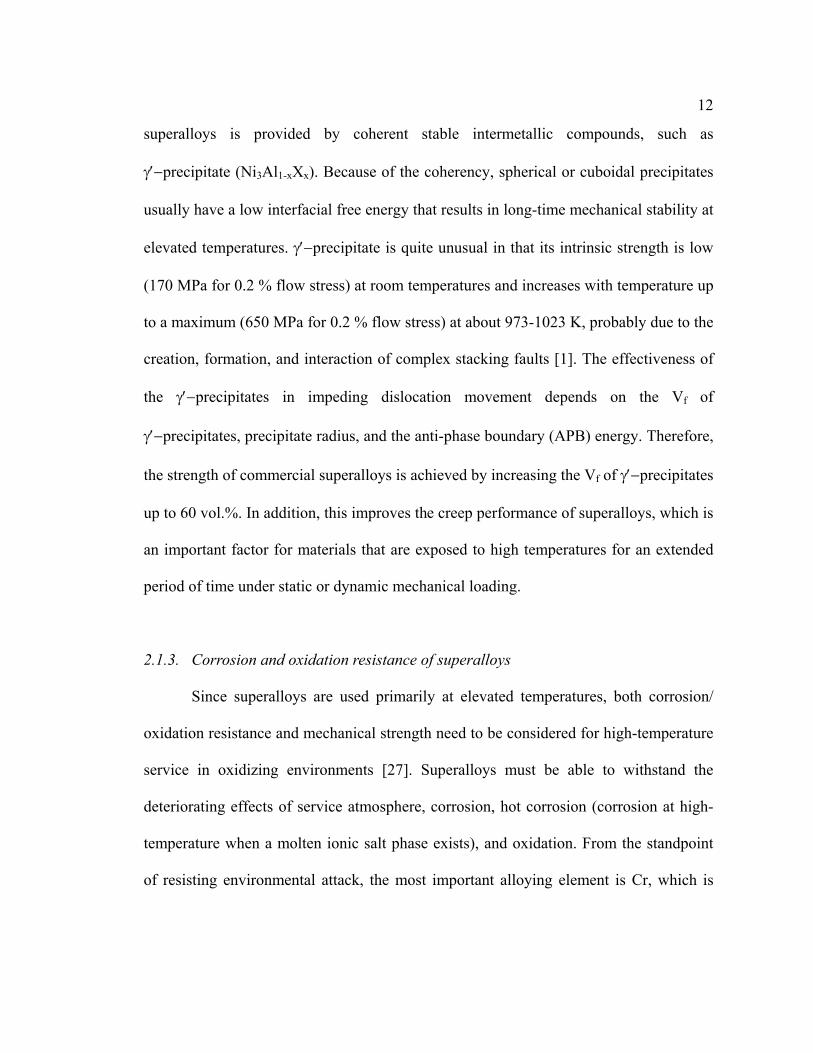
12
superalloys is provided by coherent stable intermetallic compounds, such as
γ′−precipitate (Ni3Al1-xXx). Because of the coherency, spherical or cuboidal precipitates
usually have a low interfacial free energy that results in long-time mechanical stability at
elevated temperatures. γ′−precipitate is quite unusual in that its intrinsic strength is low
(170 MPa for 0.2 % flow stress) at room temperatures and increases with temperature up
to a maximum (650 MPa for 0.2 % flow stress) at about 973-1023 K, probably due to the
creation, formation, and interaction of complex stacking faults [1]. The effectiveness of
the γ′−precipitates in impeding dislocation movement depends on the Vf of
γ′−precipitates, precipitate radius, and the anti-phase boundary (APB) energy. Therefore,
the strength of commercial superalloys is achieved by increasing the Vf of γ′−precipitates
up to 60 vol.%. In addition, this improves the creep performance of superalloys, which is
an important factor for materials that are exposed to high temperatures for an extended
period of time under static or dynamic mechanical loading.
2.1.3. Corrosion and oxidation resistance of superalloys
Since superalloys are used primarily at elevated temperatures, both corrosion/
oxidation resistance and mechanical strength need to be considered for high-temperature
service in oxidizing environments [27]. Superalloys must be able to withstand the
deteriorating effects of service atmosphere, corrosion, hot corrosion (corrosion at high-
temperature when a molten ionic salt phase exists), and oxidation. From the standpoint
of resisting environmental attack, the most important alloying element is Cr, which is

13
present in significant amounts in all superalloys. Because of the presence of Cr,
superalloys generally have satisfactory corrosion resistance for many applications. In
addition, the high Cr content of superalloys yields a sufficient oxidation resistance for
the service demanded. Alloying additions of Cr, Si, and Al allow for the formation of
relatively protective spinel and rhombohedral oxide phases (Cr2O3 and Al2O3). Additions
of Re and Y are known to have beneficial effects on the cyclic-oxidation resistance of
superalloys by reducing their internal oxidation beneath a scale of Cr2O3 [28, 29]. Since,
higher Cr contents interfere with the γ′−precipitates strengthening mechanism, the
compositions of most superalloys represents a compromise to provide adequate high-
temperature oxidation resistance in combination with high-temperature strength.
Refractory elements such as Mo, Ta, W, and Nb are used at elevated temperatures to
achieve sufficient mechanical strength. The addition of refractory elements generally,
however, impairs the oxidation resistance [30]. Therefore, in many applications,
oxidation-resistant coatings are used for extremely high-temperature operation.
2.2. Coarsening theory
An analytical theory describing diffusion-limited coarsening (or Ostwald
ripening [31]) of the isolated precipitates was developed simultaneously based on a
binary alloy by Lifshitz, Slyozov, and Wagner (LSW) [32, 33]. The driving force for
coarsening is the reduction of the total surface area associated with a distribution of
precipitates. This theory is based on the Gibbs-Thomson equation, which requires that

14
the solubility in the small precipitates with a large surface area-to-volume ratio is higher
than that for larger precipitates. The larger precipitates, therefore, tend to grow at the
expense of the smaller ones to decrease the total interfacial free energy of the alloy. The
assumptions of LSW theory are [34, 35]: (i) the linearized Gibbs-Thomson equation is
valid; (ii) no elastic interactions occur among precipitates, i.e., the precipitate Vf is close
to zero; (iii) diffusion fields of precipitates do not overlap; (iv) dilute solution theory
obtains; (v) coarsening occurs in a stress-free matrix; (vi) precipitates have a spherical
morphology; (vii) precipitates form with the composition given by the equilibrium phase
diagram; (viii) coarsening is a self-similar process; and (ix) it implicitly assumes the
evaporation-condensation (EC) mechanism. LSW theory predicts that as the aging time,
t, approaches infinity, three asymptotic solutions are obtained: (1) the precipitate number
density, Nv, is proportional to t-1; (2) the mean precipitate radius, <R>, is proportional to
t1/3; and (3) the matrix supersaturation is proportional to t-1/3.
Umantsev and Olson expanded the LSW theory to the multicomponent system
(UO theory) [36]. The assumptions of UO theory are: (i) the linearized Gibbs-Thomson
equation is valid; (ii) no elastic interactions occur among precipitates, i.e., the precipitate
Vf is close to zero; (iii) diffusion fields of precipitates do not overlap; (iv) coarsening
occurs in a stress-free matrix; (v) precipitates have a spherical morphology; (vi)
precipitates form with the composition given by the equilibrium phase diagram; (vii)
coarsening is a self-similar process; and (viii) it implicitly assumes the evaporation-
condensation (EC) mechanism. The time dependencies of LSW theory are all the same

15
for the UO theory of multicomponent alloys, albeit with different rate constants [36, 37].
In the coarsening experiments of Ni-14.2 at.% Cr-5.2 at.% Al alloy presented in Chapter
6 and Ni-8.5 at.% Cr-10 at.% Al-2 at.% Re alloy presented in Chapter 7, the Vf of
γ′−precipitates is greater than zero (15 % and 26 %, respectively), therefore the alloys
may not satisfy the assumptions (ii) and (iii). In addition, the compositions of
γ′−precipitates in both alloys change with increasing aging time, which is against the
assumption (vi). The assumption (viii) is discussed in detail in Sections 6.3.4 and 7.3.7.
The first solution states the linear dependence of the cube of the mean precipitate
radius, <R(t)>3, and aging time, t, is:
tkRtR UO=><−>< 33 )0()( ; (2.1)
with
( ) ( )
−+
−=
Al
AlAl
Cr
CrCr
mUO
DkC
DkC
TR
Vk
22 119
8γγ
σ; (2.1.1)
where <R(t)> is the mean precipitate radius at time t, <R(0)> is the mean precipitate
radius at t = 0 (which corresponds to the beginning of coarsening), and kUO is the
coarsening rate constant for the mean radius of γ′−precipitates. In Equation (2.1.1), σ is
the interfacial free energy, Vm is the molar volume of the γ′−precipitates, Rg is the ideal
gas constant, T is the aging temperature, Di and γiC are the diffusion coefficient and the
equilibrium solubility of the ith solute in the γ−matrix, and ki is the distribution
coefficient of the ith solute element between the γ−matrix and γ′−precipitates and is

16
defined by γγii CC /' .
The second solution describes the number density of precipitates, Nv(t),
decreases as aging time increases:
1)( −Κ= ttN UOv ; (2.2)
where ΚUO is the coarsening rate constant for the Nv of precipitates, which is described
as follows:
( ) ( )
σπ
γγ
4
113 22
−+−
=ΚAl
Al
AlCr
Cr
Crf
UO
kDC
kDC
VTR; (2.2.1)
where Vf is the γ′−precipitate volume fraction.
The third solution describes the change of supersaturation of each solute element
in the matrix with increasing aging time:
[ ] 3/1)()( −=∞→− ttCtC UOii κγγ ; (2.3)
with
( ) ( ) ( )3/1
223/2 113
−+−= Al
Al
AlCr
Cr
CrmUO k
DC
kDC
TRVγγ
σκ ; (2.3.1)
where )(tCiγ is the composition of ith component in the matrix at time t, )( ∞→tCi
γ is
the equilibrium solid-solubility of the ith component in the γ−matrix, κUO is the
coarsening rate constant for the matrix supersaturation. The quantity in the bracket on
the left-hand side of Equation (2.3) is denoted the matrix supersaturation of solute
17
element i (∆Ci). For a quaternary alloy (ex. Ni-Cr-Al-Re alloy), there are three matrix
supersaturations, ∆CCr, ∆CAl, and ∆CRe. The <R(t)> and Nv(t) of γ′−precipitates can be
measured employing optical microscopy, scanning electron microscopy (SEM), or
transmission electron microscopy (TEM) depending on their dimensions. 3DAP
microscopy, however, is the only experimental method that can measure directly the
matrix supersaturation as a function of aging time for the third asymptotic solution.
2.3. Prior studies employing atom-probe field-ion microscopy (APFIM) and
three-dimensional atom-probe (3DAP) microscopy
A range of microstructural and microchemical techniques have been used to
investigate Ni-based superalloys. Thanks to its subnanoscale resolution, the APFIM has
played a major role in the study of nanostructural features. These works include: (1)
compositional measurements of nanoscale precipitates; (2) detection of ordering or
clustering effects within the γ−matrix or the γ′−precipitates; (3) estimation of the degree
of ordering; and (4) the location of preferential sites in the ordered γ′−precipitates for
various microalloying elements. Most of all, the APFIM has played a unique role in
establishing the nanoscale distribution of individual elements. The first works of this
kind were performed by Beaven et al. [38] and Delargy et al., [39, 40] on the high-
chromium IN939 alloy. In Beaven and Delargy’s research, Cr and Co were found to
prefer strongly the γ−matrix, whereas Al and Ti preferred the γ′−precipitates. These
results indicated the need for more refined phase stability calculations in order to predict

18
more accurately the long-term service behavior of these alloys at high temperatures.
Contrary to previous speculations, the measured composition profiles revealed little
segregation of the minor elements (Ta, W, and B) at the γ/γ′ interfaces.
The partitioning behavior of the alloying elements in CMSX-2 and PWA 1480
superalloys and their Re-modified versions was studied by Blavette et al. [9, 41]. Some
preliminary evidence was found for the presence of small Re clusters in the matrix of the
modified alloys. These researchers suggested that approximate size of 1 nm clusters
detected might be the reason for better creep performance. Investigation of crept alloys
would provide answers to this assumption. The local degree of order and site occupancy
of various substitutional elements in L12-ordered γ′−precipitates also has been studied [7,
38, 42-44]. Additions of Ti, Nb, Ta, Mo, W, and Re were preferentially located on the Al
sublattice, whereas Cr and Co were found to prefer the Ni sublattice.
The next generation atom-probe microscopy technique, 3DAP microscopy, has
demonstrated the unique ability to provide information that is not accessible employing
other modern instruments. The few extant 3D reconstructions related to grain boundaries
(Figure 2.5) [45] or chemical order within the γ′−precipitates in superalloys [4, 5, 46, 47]
illustrate this point. The 3DAP microscopy is the first instrument able to give a direct
view of the arrangement of chemical species on an atomic scale in three-dimensional
direct lattice space.

19
Figure 2.5. Spatial distribution of Al + Ti (red), Cr (yellow), Mo (Blue), and B + C (green) in the vicinity of a serrated grain boundary in a Ni-based superalloy, Astroloy (Ni-8.5% Al-4.0% Ti-15.9% Cr-16% Co-3% Mo-0.13% C-0.11% B-0.03% Zr). Images recorded using the tomographic atom probe. The analyzed region is 10 × 10 × 120 nm. Two types of interfaces are present: two γ/γ′ boundaries and one γ′/γ′ boundary [45].

20
2.4. Segregation: Gibbsian interfacial excess
Segregation phenomena are understood at the atomic level by realizing that
interfaces generally contain a large variety of sites for the segregant atoms, which have
environments that are different from those of lattice sites. Interfaces are, therefore, often
capable of preferentially attracting solute atoms. Solute-atom segregation at internal
interfaces (grain boundaries or heterophase interfaces) affects the physical properties of
the interfaces and this, in turn, affects bulk properties. It is, therefore, important to be
able to predict and to measure quantitatively the level of segregation of solute atoms at
internal interfaces. The subnanoscale resolution of an atom probe (AP) microscopy and
its direct accessibility to solid/solid internal interfaces enables one to measure the
amount of solute segregation at an interface, in terms of the Gibbsian interfacial excess
of solute i, Γi. Using the well-known Gibbs adsorption isotherm, the interfacial excess of
solute can be described on a macroscopic thermodynamic basis as [48]:
DOFsPTi
,,2
∂∂
−=Γµσ
; (2.4)
where σ is the interfacial free energy, µ2 is the chemical potential of the solute atom, and
DOFs are the five macroscopic degrees of freedom that define a heterophase interface.
The quantity Γi is defined operationally by [49]:
AN excess
ii =Γ ;
(2.5)
where excessiN is the excess number of atoms associated with an interface, and A is the

21
interfacial area over which Γsolute is determined. The quantity Γsolute predicts that
preferential segregation of solute atoms at an interface tends to occur at constant T and P,
whenever a change in chemical potential decreases the interfacial free energy. Atom
probe microscopy makes it possible to measure Γsolute directly, without any data
deconvolution [49, 50]. Interfacial solute segregation in a ternary or higher alloy is
quantified employing the relative Gibbsian interfacial excess of element i with respect to
other elements, RelativeiΓ . It is calculated from the relative Gibbs adsorption isotherm [49,
51-53]:
i
n
i
ii
i
cccccccc
δµδσ
βα
βα
βα
βα
∑=
Γ−Γ−=3
21
21
1112
1 ; (2.6)[54]
with
βα
βα
111
1
CCCC ii
ii −−
Γ−Γ=Γ ; (2.6.1)
where 1iΓ is the relative Gibbsian interfacial excess of element i with respect to element
1 and Γi is the Gibbsian interfacial excess of element i, which is calculated from a
proxigram by measuring the area under the curve at the interface, where the excess
solute is located and multiplied by the atomic density of the matrix [55]. In addition, jiC
are the concentrations of species i in phase j (j = α or β).
Most of the research that yields quantitative information on segregation has been

22
performed for metallic systems, due to their well-known structures [56-65]. Studies of
ceramic/metal interfaces have been retarded by complicated interatomic structure and
ionic charge cloud effects. Research in this area, however, has been increasing because
of its technical importance to modern industry [53, 66-72].

23
Chapter Three
Atom Probe Field Ion Microscopy (APFIM)
3.1. Fundamentals of Field Ion Microscopy (FIM) and Atom Probe (AP)
microscopy
3.1.1. Field Ion Microscopy (FIM)
An AP microscope is a combination of an Field ion microscope [73, 74] and a
time-of-flight (TOF) mass spectrometer with single-ion sensitivity [75, 76]. Both the
FIM and the AP microscopy [77] techniques were invented by the late Professor E. W.
Müller at Pennsylvania State University. A schematic diagram of an APFIM is shown in
Figure 3.1.
The AP microscopy specimen is prepared by producing a needle-like tip (Figure
3.2) employing electrochemical polishing, with an end radius of typically 50-100 nm.
This tip is maintained at a cryogenic temperature (20-50 K) in order to reduce the
transverse velocity of the imaging gas atoms and obtain a high-resolution FIM
micrograph. A small partial pressure of an inert gas, usually He or Ne, is admitted into a
FIM to obtain FIM micrographs. Upon applying a high positive potential to a tip, gas
atoms near the apex are polarized by the strong electric field and are drawn toward the
surface. The gas atoms collide with the surface, lose part of their kinetic energy by
thermal accommodation, and become trapped in the local high field region. Gas atoms
then execute a series of jumps of decreasing amplitude across a specimen's surface.
These complex series of surface processes are illustrated in Figure 3.3.

24
Figure 3.1. Schematic diagram of a modern APFIM equipped with an energy-compensated atom probe, an imaging atom probe, and a pulsed laser atom probe [75].
Figure 3.2. Transmission electron micrograph of a Ni3Al APFIM specimen obtained with a Hitachi H700B microscope operated at 200 kV in the bright field condition. A grain boundary is seen at a distance of 400 nm from the apex [65].

25
Figure 3.3. Principles of image formation. The image gas atoms are polarized by the strong electric field and drawn towards the specimen surface. Field adsorption occurs on prominent surface atoms, which are themselves polarized by the field (dipoles are indicated by short arrows). Field ionization of the gas atoms occurs by tunneling of electrons through the field adsorbed gas atoms and into the metal. The positive image gas ions are then repelled away from the specimen towards the screen where the field ion image is formed [75].

26
The electric field, E0, at the apex of a sharply pointed tip is given by:
of
oo rk
VE = ;
(3.1)
where V0 is the applied electric potential, r0 is the apex radius, and kf is a numerical
constant, which depends on the taper angle of the tip [78]. The electric field strengths
needed to produce field ionization of common gases are in the range of 20-50 V nm-1.
For example, E0 required for the ionization of He is 44 V nm-1. Therefore, it is necessary
to reduce the end radius of a specimen to produce ionization at an applied voltage of 10
kV.
If the electric field is sufficiently high, the first gas atoms to reach the surface
become field adsorbed in high-field sites above the apices of prominent surface atoms.
Gas atoms that arrive subsequently migrate across the surface above the field-adsorbed
layer until they are ionized by the quantum-mechanical tunneling process of field
ionization [79]. In this process, an electron from a gas atom tunnels through the surface
potential barrier into a vacant energy level in the specimen, leaving a positively charged
gas ion above the surface. These ions are, near or above the Fermi level, then repelled
from the tip and are projected approximately radially toward a phosphor screen, where
they produce a highly magnified image of a specimen's surface. The magnification of the
image is primarily governed by the ratio of the specimen-to-screen distance to a
specimen's radius and is easily of the order of a million times, which is sufficient to
observe individual atoms. The FIM technique was the first one to observe individual

27
atoms.
The nature of FIM images can be readily understood by employing a ball model
(Figure 3.4) of a hemispherical crystal, on which the positions of the most prominent
atoms have been marked. Field ionization occurs preferentially at these prominent sites,
as the local field is highest above these atoms. The rings correspond to the ledges of
atomic terraces of prominent crystallographic planes on the surface of a specimen, and
the bright spots correspond to ionization above the ledge and corner atoms on these
planes. The overall pattern (Figure 3.5) resembles, to first order, a stereographic
projection of the surface, which can be indexed using standard crystallographic
techniques [80].
3.1.2. Atom Probe (AP) microscopy
If the electric field is raised to a sufficiently high value (≥ 45 V nm-1, which is
material and temperature dependent), atoms can be removed from the surface by the
process of field evaporation [81]. A high field is applied to the tip by applying a
superimposed series of high-voltage pulses with sub-nanosecond rise times. The
evaporated atoms, which are positively charged ions, are accelerated away from the
specimen to a TOF mass spectrometer equipped with a high gain (≥106) detector that has
single ion sensitivity, typically a multichannel plate [77]. In order to select a particular
area of a tip for analysis, a small probe aperture is incorporated into the FIM image
screen. When atoms are ionized and desorbed from the surface of a tip, only those ions

28
Figure 3.4. Ball model illustrating the origin of the FIM image contrast. White atoms indicate prominent sites above which field ionization occurs preferentially. The model is of the FCC structure, with the (001) plane at the top, {111} planes to the left and right, and the (024) plane fully resolved at center front [75].

29
Figure 3.5. Image of tungsten taken in a He atmosphere under a pressure of 10-4 Pa and a temperature of 60 K (courtesy Dr. J. Rüsing).

30
whose trajectories pass through the probe hole are analyzed by the mass spectrometer.
Since the trajectories of field-ionized gas atoms and the field-evaporated ions from the
tip are nearly equivalent, the identification of preselected individual atoms is possible;
this is not, however, a standard operating mode.
The mass-to-charge state ratio of these ions, m/n, is calculated by equating the
potential energy of an ion on the surface of a specimen at total voltage V0 (steady-state
tip voltage plus pulse voltage) to the kinetic energy that the ion acquires during
acceleration to the grounded counter electrode positioned in front of a tip, as shown by:
2
2
0 21
tdmneV = , and
(3.2)
2
2
02dteV
nm
= ; (3.3)
where d is the distance from the specimen to the detector, e is the elementary charge on
an electron, and t is the corrected TOF to the detector. The TOFs are measured by using
a time-to-digital converter (TDC). The identity of each ion is determined from its mass-
to-charge state ratio by consulting a periodic table of the elements with measured
isotopic abundances. By this means, the chemical analysis of a specimen can be
performed on an atom-by-atom basis.
The detector for a one-dimensional atom probe (1DAP) microscope permits only
the recording of TOFs of field-evaporated ions without their positions on an atomic
plane. Accordingly, mass-to-charge state ratios of ions are collected in the depth
direction, without any information concerning the lateral positions of atoms on a

31
specimen's tip. The data chain of the collected atoms can be converted to a one-
dimensional depth profile. As field evaporation occurs atomic layer-by-layer, it is
possible to resolve individual atomic layers in a depth profile and the resolution can be
as accurate as one interplanar spacing (less than 0.1 nm).
Since the collected data represents one-dimensional (i.e. depth) information, the
depth profile shows the average concentration of solute within the area of the probe hole.
Because of that, there is always a possibility that chemical information from the selected
area is a convolution of more than two phases. Consequently, accurate measurement of
small precipitates less than 5 nm is still challenging, even with the AP microscopy
technique. When analyzing interfaces, the cylinder of analysis may intersect the interface
at an inclined angle (shown in Figure 3.6) and this may smear out a sharp interface
concentration profile.
3.1.3. Three-dimensional Atom Probe (3DAP) microscopy
Three-dimensional atom probe microscopy provides a solution to the above-
described problems, which are inherent to 1DAP microscopy, by employing a two-
dimensional position sensitive detector to measure the lateral positions of atoms within
an atomic plane [82]. By measuring the TOFs and the coordinates of ions using a
position sensitive detector, it is possible to map out a two-dimensional elemental
distribution with near atomic subnanoscale resolution. The lateral spatial resolution is
limited by the aberrations associated with the process of field-evaporation of ions form a

32
Figure 3.6. Schematic drawings of an interface analysis (a) using conventional AP and (b) using 3DAP microscopies. In the case of conventional AP microscopy, if the interface is not perpendicular to the probing direction, it is impossible to determine the concentration change at the interface without convolution. However, using a 3DAP microscopy, a cylinder of analysis can be arbitrarily selected as shown in the figure [84].

33
surface. Elemental maps can be extended in the depth direction by field-evaporating
atoms from the surface of a specimen, on an atomic layer-by-layer basis, and then
reconstructioning the 3D lattice with the aid of a computer.
The 3DAP microscope at Northwestern University (Figures 3.7, 3,8) is based on
the design of the Energy Compensated Optical Position Sensitive Atom Probe
(ECOPoSAP) developed at the University of Oxford, Great Britain . It has a reflectron
lens for energy compensation and an optical system for collecting lateral information.
A reflectron lens [76] (Figure 3.9) is an electrostatic lens that dramatically
improves the mass resolution of the AP microscopy by compensating for the small
energy spread of field-evaporated ions. The lens consists of series of annular circular
electrodes with a linearly increasing electric potential terminating at a maximum
potential at the end of the drift tube, which is greater than the potential of the field-
evaporated ions. Once an ion has penetrated the reflectron lens, it is turned around and
directed towards the detector. Ions with lower energies do not penetrate as deeply into
the lens as ions with the full energy, thereby decreasing their flight paths and flight times.
Consequently, ions with the same mass-to-charge state ratio evaporated with the same
pulse, arrive at the detector at almost the same time despite the initial energy spread.
A high-speed video camera with an integrated image intensifier (Figure 3.10) is
capable of determining the lateral position by digitizing the image appearing on a
phosphor screen. The camera is interfaced to an intelligent module that enables the x-
and y-coordinates and intensity of the light produced by the ions to be determined [76].

34
Figure 3.7. Appearance of 3DAP microscope at Northwestern University.

35
Figure 3.8. Schematic diagram of the operation of a 3DAP microscopy, with a reflectron lens (courtesy Dr. J. T. Sebastian, Northwestern University).

36
Figure 3.9. Schematic diagram of an energy compensating AP that incorporates a reflectron lens. Ions with energy deficits do not penetrate as far into the lens as ions with the full energy before being reflected to the detector thereby decreasing their flight paths and flight times and compensating for their lower velocities [76].
Figure 3.10. Schematic diagram of optical instruments that combines a photodiode array camera to provide the positions and a multianode array to provide the flight times of ions striking the detector [76].

37
There is, however, a limitation in that only one ion should be permitted to strike the
detector for each field evaporation pulse. In order to over come this one-ion-per-pulse
constraint, the optical image from the primary detector in divided into two by a beam
splitter, so that a second detector may be used. The positions of ions are determined by a
charge-coupled device (CCD) camera, but the TOFs are determined on an 8×10
multianode detector in which each anode is connected to a TDC. This dual system
provides a position and an identity for each ion.
3.2. Advantages of using 3DAP microscopy in materials science
The near atomic spatial resolution of the atom probe makes it an exceedingly
valuable tool for microstructural and chemical analyses of materials. By employing a
3DAP microscopy, it is possible to map out elemental distributions in real space and
make chemical analyses of interfaces and nanoparticles with improved accuracy in
comparison with the conventional AP microscopy. The following are several
applications where the use of 3DAP microscopy exhibits superior results compared to
other microstructural analytical techniques.
Phase transformations: The nature of phase transformations near low-temperature
miscibility gaps has received considerable attention. The scale of the microstructures,
especially at the earliest stages of decomposition, is ideal for AP microscopy analysis
and is difficult to discern by other techniques. When materials decompose by a
nucleation and growth mechanism, it is possible to measure <R>, Nv, composition, and
38
coarsening rate of individual precipitates. The size, however, of the critical nucleus
cannot exceed the detectability limit of an AP microscopy. In addition, 3DAP
microscopy is effective in determining the local degree of order near microstructural
features and the site preferences of multiple elements that are present in complex alloy
systems.
Interfaces: The study of interfaces within and between materials is an important field,
which is relevant to almost all aspects of materials science. The structure and chemistry
of interfaces often determines the performance of heterophase materials. Therefore, it is
important to be able to predict and characterize interfacial structures. Most of all,
quantitative studies of solute-atom segregation at interfaces is needed. The atomic scale
resolution of 3DAP microscopy makes it possible to determine the amount of solute
segregation at the interface, which is given by the Gibbsian interfacial excess of an
element. By using a proxigram, it is possible to avoid the problem of defining a Gibbs
dividing surface [85]. Because of the small field of view in the 3DAP microscopy, the
chance of finding an interface at random is low, so it is common to use TEM to pre-
select specimens that contain interfaces of interest.

39
Chapter Four
Nanoscale chemical studies of a commercial Ni-based superalloy, René N6
4.1. Introduction
René N6 is a third generation commercial Ni-based superalloy, developed by
General Electric [86], which contains the alloying elements Ni, Co, Cr, Mo, W, Re, Al,
Ta, and Hf. It is believed that the refractory alloying elements Ta, Re, Mo, and W play
important roles as solid-solution strengtheners that increase the strength of the γ−matrix,
though they partition to both the γ−matrix and γ′−precipitates to varying degrees.
Segregation of Re at the γ/γ′ interfaces increases the misfit between the matrix and the
γ′−precipitates and this delays the onset of creep at high temperature. However, the
mechanism for the improved creep resistance has not been clarified [7, 9, 87].
A René N6 alloy was investigated using both 1DAP and 3DAP microscopies,
which have subnano- to nanoscale spatial resolution for studying chemistry. The
concentration profiles obtained from 1DAP and 3DAP reconstructions were used to
investigate the partitioning behavior of the alloying elements between the γ−matrix
(FCC) and γ′−precipitates (L12 structure). In addition, segregation of Re at the γ/γ′
interfaces was observed and analyzed in detail; specifically its interfacial excess was
determined by both 1DAP and 3DAP microscopies. To elucidate the microstructural
relationships on a mesoscopic scale, TEM analyses were performed. In addition, the
sensitivity of the interfacial excess value on the threshold value of the isoconcentration

40
surface was examined by calculating the interfacial excess values for a range of
threshold values. Thereby demonstrating that the value of the interfacial excess is only
weakly dependent on the threshold value.
4.2. Experimental procedures
An ingot of single crystal René N6 alloy was supplied by General Electric in the
as-heat treated state. The material was solution heat-treated at 1603 K for 6 hours and
then received a proprietary three-stage aging heat treatment.
Bulk chemical analysis of the particular René N6 alloy was performed using an
Applied Research Laboratories Model 3560 inductively coupled plasma (ICP) atomic-
emission vacuum spectrometer. The results of the bulk chemical analysis are presented
in Table 4.1 and are consistent with the composition for such an alloy. The overall
composition of each phase in the alloy (γ−matrix and γ′−precipitates) was determined
using a constant current γ/γ′ phase extraction technique. Phase extraction is
accomplished by anodic dissolution of the γ−matrix phase with a 1:1 aqueous solution of
citric acid and ammonium nitrate at constant current density. The γ−matrix is dissolved
in the electrolyte and the γ′−precipitates remain as a solid phase. Quantitative elemental
analysis is then performed on both phases utilizing ICP atomic-emission spectroscopy.
Results of the ICP analysis of the γ−matrix and γ′−precipitates are also presented in
Table 4.1.

41
Table 4.1. Chemical composition of René N6 superalloy obtained by ICP atomic emission spectroscopy.
Element Ni Al Co Cr Ta W Re Mo Hf Bulk 61.37 13.34 12.96 4.96 2.55 2.08 1.8 0.89 0.05
γ (at.%)* 52.14 5.66 22.19 10.85 0.37 2.35 4.85 1.59 ND γ' (at.%)* 66.3 16.59 8.87 1.88 3.42 1.88 0.38 0.59 0.08
ND – Not detected * Analysis indicates approximately 33 wt.% γ and 67 wt.% γ′ (32 vol.% γ and 68 vol.% γ′) present in the sample.

42
AP specimens were cut from the alloy into 0.2×0.2×2 mm blanks using electric
discharge machining (EDM). A standard electrochemical polishing technique [75] was
employed, using 2 vol.% perchloric acid in butoxyethanol electrolyte, to obtain sharp
needle-like tips, with an apex radius of ≤ 50 nm. FIM micrographs were obtained at 60
K using Ne as an imaging gas. Atom probe analyses were conducted under ultrahigh
vacuum (UHV) conditions (< 1.33×10⁻⁷ Pa gauge pressure) at 40 K with a pulse fraction,
f, of 0.19 (f is the ratio of the pulse voltage to the steady-state dc imaging voltage) and a
pulse frequency of 1.5 kHz. A VG-FIM 100 was used for 1DAP microscopy analyses
and our energy compensated AP, with an optical detection system [76], was used for the
3DAP microscopy analyses.
For TEM studies, standard 3 mm diameter disk specimens were prepared. The
specimens were polished electrochemically using 5 vol.% perchloric acid in glacial
acetic acid electrolyte at 288 K and then thinned by ion milling. A Hitachi H-8100 200
kV microscope was utilized for CTEM studies. TEM micrographs were recorded at an
accelerating voltage of 200 kV, along the <001> zone axis. The large size of the
γ′−precipitates sometimes caused them to fall out of specimens during electrochemical
polishing and to avoid this the specimens were thinned to their final thickness by ion-
beam milling.

43
4.3. Results and discussion
SEM and TEM micrographs (Figure 4.1) exhibit a high Nv of cuboidal
γ′−precipitates in the γ−matrix. The measured Vf of γ′−precipitates is 68% and the
average size, in edge length, of the precipitates is 0.28 µm, with an average channel
width of 37 nm, which are common values for commercial Ni-based superalloys.
Prior to AP microscopy analyses, FIM imaging was performed using the 3DAP
at 60 K and an imaging gas pressure of 1.33×10⁻³ Pa neon. Low Miller-index poles,
however, were not prominent in the FIM images. If a low Miller-index pole is observed
before an AP analysis, a region close to it can be selected and analyzed to distinguish
clearly the {100} atomic planes (alternating 100 at.% Ni and 50 at.% Ni: 50 at.% Al in
the L12 structure) in the [100] analysis direction from the three-dimensional
reconstructions, enabling a direct calibration of the depth scale. This demonstrates that a
3DAP has an ultimate depth resolution of one interplanar spacing (< 0.2 nm). This type
of representation is visually very revealing; the composition of the analyzed volume may
not, however, be accurate because multiple ion pile-ups may occur when low Miller-
index poles are selected for atom-probe analyses. The reason for this is that the atomic
planar density is greater for crystallographic planes with low Miller indices than for
planes with high Miller indices. Therefore, for an accurate composition analysis, the
exact center of low-index poles should be avoided. In rare cases, however, accurate
composition of materials is possible, even when the region of low-index poles is selected
for AP microscopy analyses [65] and indeed this is the case for ordered Ni3Al.

44
(a)
(b)
Figure 4.1. (a) SEM micrograph showing high number density of cuboidal γ′−precipitates in the γ−matrix. The Vf of γ′−precipitates is approximately 70%. (b) A bright-field TEM micrograph recorded along the <001> zone axis showing cuboidal γ′−precipitates in a René N6 superalloy. The measured Vf of γ′−precipitates is 68%. (TEM micrograph, courtesy Ms. C. K. Sudbrack)

45
A portion of the mass spectrum of René N6 superalloy obtained by 1DAP
microscope is displayed in Figure 4.2 (a). As seen from the spectrum, Ni-based
superalloys contain several refractory elements that have nearly overlapping isotopes.
Therefore, to achieve an accurate compositional analysis high mass-resolution is
required. The VG-FIM 100 has an energy-compensating Poschenrieder lens, which does
not have sufficient mass resolution to distinguish peaks with closely related mass-to-
charge state ratios. The 3DAP microscope, however, equipped with a reflectron lens has
sufficient mass resolution to identify clearly the most abundant isotopes of Re, Ta and W,
Figure 4.2 (b).
Concentration profiles through γ/γ′ interfaces, obtained from the 1DAP
microscope, are shown in Figure 4.3. The composition of an alloy can be measured from
either a concentration profile or a mass spectrum. The measured average composition of
René N6 employing 1DAP microscopy is presented in Table 4.2. Because of peak
broadening in our 1DAP microscope, there is an overestimation of the concentrations of
multi-isotopic elements, such as Ni, and an underestimation for mono-isotopic elements,
such as Al, compared with the bulk analysis shown in Table 4.1. Nevertheless, the
concentration profiles show clearly the partitioning behavior of all the alloying elements.
Ni, Al, Ta, and Hf are partitioned to the γ′−precipitates, while the matrix-strengthening
elements, Co, Cr, Mo, W, and Re, are partitioned to the γ−matrix. The composition of
the γ−matrix is compared to the γ′−precipitates’ compositions in Table 4.3 and these
results should be compared with the phase extraction results in Table 4.1. The
46
(a)
(b) Figure 4.2. Part of the mass spectrum obtained by: (a) 1DAP microscopy, showing the close proximity of the elements Ta and Re; and (b) 3DAP microscopy, showing a clear distinction among the isotopes of Ta, W and Re.

47
Figure 4.3. Concentration profiles obtained by 1DAP microscopy, showing the concentration variation through γ/γ′ interfaces. Re segregation is observed at the γ/γ′ interfaces in its profile.

48
Table 4.2. Overall composition of René N6 obtained from 1DAP microscopy analysis. Element Ni Al Co Cr Ta W Re Mo Hf
at.% 65.19 7.26 14.99 4.16 1.92 3.89 1.21 1.25 0.13
Table 4.3. Comparison of the compositions (at.%) of γ−matrix (FCC) and γ′−precipitates (L12) measured by 1DAP microscopy analysis with standard deviation (σsd) values [88].
Phase Enriched in γ′ Enriched in γ Element Ni Al Ta Hf Co Cr W Re Mo
Ppt. No. 1 72.63 9.64 2.6 0.19 10.41 0.96 2.67 0.28 0.62 σsd 0.63 0.43 0.2 0.06 0.41 0.13 0.21 0.07 0.1
Ppt. No. 2 76.18 6.25 2.24 0.19 7.61 1.21 4.35 1 0.97 σsd 1.52 0.62 0.36 0.72 0.31 0.11 0.62 0.23 0.25
Matrix 49.37 2.19 0.48 0.04 24.72 10.97 6.46 3.18 2.59 σsd 0.75 0.22 0.1 0.03 0.71 0.44 0.32 0.29 0.21

49
partitioning behavior is determined quantitatively by calculating the partitioning ratio
(the atomic concentration of an element in the γ′−precipitates divided by the atomic
concentration of the same elements in the γ−matrix, Κγ′/γ), as listed in Table 4.4.
The subnanoscale resolution of an AP microscopy and its direct accessibility to
buried solid/solid internal interfaces, via the physical process of field evaporation,
enables one to measure the concentration of solute at an interface, in terms of the
interfacial excess of a solute element i, Γi, which is the correct thermodynamic measure
of segregation. The concentration profiles for this René N6 alloy exhibit segregation of
Re at the γ/γ′ interfaces. The value of ΓRe can be calculated using an integral profile with
a graphical method we have developed for studying interfacial segregation at grain
boundaries and heterophase interfaces [49, 53]. The local slope of an integral profile
corresponds to its local concentration. From these concentration values, the excess
number of atoms of a given element at an internal interface is calculated. The integral
profile for Re is displayed in Figure 4.4 and the average value for Re is 2.32 × 10¹⁴
atoms cm-2 (2.32 atoms nm-2).
In the 3DAP microscopy, the partitioning behavior of all the elements can be
visualized employing three-dimensional reconstructions, Figure 4.5. This result is in
agreement with the one obtained by 1DAP microscopy. Our results for René N6
superalloy are consistent with observations on the superalloys CMSX-4 [89] and RR
3000 [87]. Table 4.5 presents the Κγ′/γ calculated from the 3DAP microscopy data and its

50
Table 4.4. Calculated solute partitioning ratio (Κγ′/γ, the atomic concentration of an element in the γ′−precipitates divided by the atomic concentration of the same element in the γ−matrix) for each alloying element as determined from 1DAP microscopy analyses.
Phase Enriched in γ′ Enriched in γ Element Ni Al Ta Hf Co Cr W Re Mo
No. 1 1.47 4.4 5.42 4.75 0.42 0.088 0.41 0.088 0.24 σsd 0.026 0.48 1.2 3.87 0.021 0.012 0.038 0.023 0.043
No. 2 1.54 2.85 4.67 4.75 0.31 0.11 0.67 0.31 0.37 σsd 0.027 0.35 1.06 3.87 0.019 0.013 0.047 0.036 0.049 ICP 1.27 2.93 9.24 ND 0.40 0.17 0.80 0.08 0.37
Table 4.5. Calculated solute partitioning ratio (Κγ′/γ) for each alloying element as determined from 3DAP microscopy analyses compared to the phase extraction results.
Phase Enriched in γ′ Enriched in γ Element Ni Al Ta Hf Co Cr W Re Mo 3DAP 1.29 3.56 7.14 ND 0.411 0.209 0.622 0.282 0.536
σsd 0.005 0.042 0.272 0.006 0.007 0.011 0.008 0.011 Phase
extraction 1.27 2.93 9.24 ND 0.4 0.17 0.80 0.08 0.37
ND – Not detected

51
Figure 4.4. An integral profile for Re utilizing the graphical method indicated for determining the interfacial excess of solute; references [49, 53] for details.

52
Figu
re 4
.5.
Thre
e-di
men
sion
al a
tom
-by-
atom
rec
onst
ruct
ion
of t
he s
econ
d da
ta s
et c
onta
inin
g on
e m
illio
nat
oms
with
an
isoc
once
ntra
tion
surf
ace
of C
r at
a t
hres
hold
val
ue o
f 7
at.%
. Th
e po
sitio
ns o
f A
l at
oms
are
disp
laye
d in
red,
Ta
in li
ght p
ink,
Cr i
n bl
ue, W
in li
ght b
lue,
Re
in y
ello
w, a
nd M
o in
dar
k gr
een.
The
Ni,
Co
and
Hf a
tom
s are
not
exh
ibite
d in
this
figu
re fo
r the
sake
of c
larit
y.

53
comparison with the data obtained by the phase extraction technique. There is good
agreement between the two methods except in the case of Re, for which segregation to
the γ/γ′ interface occurs, which can therefore skew the phase extraction results.
To calculate the interfacial excess of solute for γ/γ′ interfaces, from the 3DAP
microscopy data, we use a powerful data analysis tool, the proxigram [85]. The
proxigram can be employed for any internal interface, regardless of the complexity of its
topological shape. The isoconcentration surface for Cr, with a threshold value of 7 at.%,
was first drawn in a three-dimensional reconstruction to identify the location of all the
γ/γ′ interfaces; it is emphasized that the proxigram methodology simultaneously
measures all the interfaces in a given data set, which is important for obtaining
statistically significant data rapidly. The alloying element chosen for generating the
isoconcentration has to be a major alloying element with high preference of either matrix
or precipitates in order to reduce the statistical error. Chromium was chosen because it is
the major alloying element with low partitioning ratio (highly prefers the γ′−matrix). The
threshold value was chosen from the inflection point in the Cr profile (Figure 4.6 - the
first data set) and this determines the reference point (i.e., x = 0) of the proxigrams
(Figure 4.6-4.8). This means that the concentration of Cr at x = 0 is 7 at.% Cr in Figure
4.6. The reason for choosing the threshold value employing the inflection point is
explained in detail below. Using this Cr isoconcentration surface as a reference surface,
the concentration of Re can be calculated at specific distances away from the γ/γ′
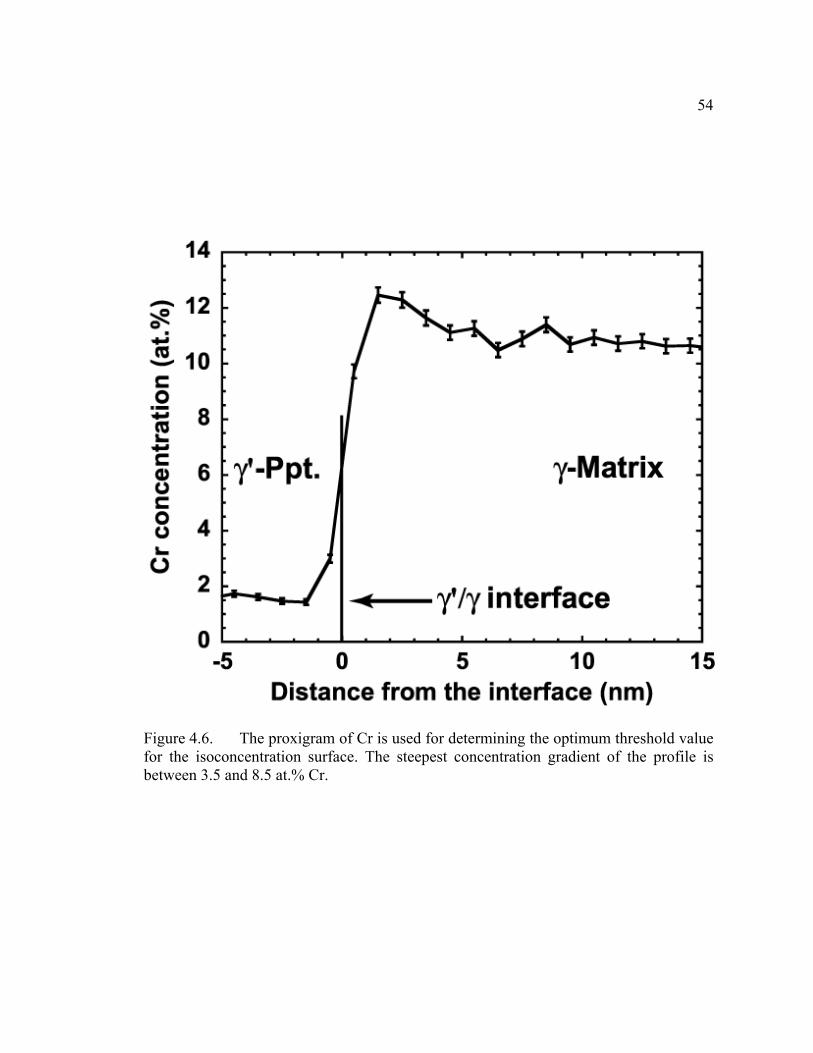
54
Figure 4.6. The proxigram of Cr is used for determining the optimum threshold value for the isoconcentration surface. The steepest concentration gradient of the profile is between 3.5 and 8.5 at.% Cr.

55
Figure 4.7. A proxigram displaying the Re atomic concentration as a function of distance with respect to the γ/γ′ interface; positive values are into the γ−matrix and negative values are into the γ′−precipitates. The interface is defined by an isoconcentration surface at 7 at.% Cr (Figure 4.6). The interfacial excess of Re is indicated by the gray region, 2.41 atoms nm-2.

56
interfaces. A proxigram for Re (Figure 4.7) displays a significant amount of excess Re at
the γ′/γ interface. The value of ΓRe is then calculated from this diagram by measuring the
area under the curve at the interface, using a planimeter, where the excess Re is located.
It is strongly emphasized that Figure 4.7 contains three-dimensional information, as the
proxigram method integrates over two of the six faces of the cuboidal γ′−precipitates; the
precipitates have a mean edge length of 500 nm, which is a significant fraction of the tip
diameter and therefore it is difficult to sample all six faces of the cuboidal precipitates
simultaneously. However, in a model Ni-Cr-Al superalloy with considerably smaller
precipitate diameters we are able to analyze all six faces simultaneously [90]. The
calculated value of ΓRe from the proxigram is 2.41 ± 0.68 ×10¹⁴ atoms cm-2 (2.41 ± 0.68
atoms nm-2), using the average atomic density of the γ−matrix (83 atoms nm-3).
To investigate the sensitivity of the Re excess value on the threshold value,
additional 3DAP microscopy experiment was performed and a total of 1.4 million ions
were collected. The collected data was divided into two data sets (400,000 and one
million ions) for the convenience of computer analyses and were analyzed utilizing
ADAM 1.5 [91, 92]. The first data set contains a γ/γ′ interface that is perpendicular to the
analysis direction, while the second data set contains a γ/γ′ interface that is parallel to the
analysis direction. Five different proxigrams were generated employing five different
threshold values (4, 6, 6.5, 7, and 8.1 at.% Cr) for the first data set. For the second data
set, four threshold values (4.9, 5.5, 7, and 10 at.% Cr) were used. All the threshold
values were chosen arbitrarily from the concentration values that are located in the

57
steepest portion of the concentration gradient of the Cr profile (Figure 4.6). This was
done in order to acquire a physically meaningful isoconcentration surface, which is
located within the width of the real γ/γ′ interfaces. Different Cr threshold values were
utilized for each data set to guarantee this point. The proxigram for Cr for the first data
set is exhibited in Figure 4.6 and the proxigrams for Re for both data sets is displayed in
Figure 4.8. All the proxigrams of Re display significant amount of excesses Re at the γ/γ′
interfaces. The calculated interfacial excess values, using the average density of the
γ−matrix (83 atoms nm-3), are listed in Table 4.6 and compared with one another.
Although, the Cr threshold values for the isoconcentration surfaces vary by
approximately 100% for both data sets, the calculated Re excess values obtained are
within the range of statistical error of one another.
The interfacial excess ( iΓ ) is expressed by Equation (2.5) [49],
AN excessii /=Γ ; (2.5)
where excessiN is the excess number of i atoms at the interface and A is the area of
the interface. The excess value is, therefore, an excess quantity per unit interfacial area
and depends on the arbitrary choice of the location of the so-called Gibbs dividing
surface. The ideal Gibbs dividing surface would be placed at the phase boundary. In the
proxigram method, the isoconcentration surface is represented on the proxigram at zero
on the horizontal axis and the heterophase boundary is taken to be the point of steepest
slope in the concentration profile of Cr (Figure 4.6). Consequently, the amount of

58
(a)
(b)
Figure 4.8. The proxigrams of Re for (a) the first data set and (b) the second data set. Note that as the threshold value is changed, only the reference point shifts. There is no change in the integrated area under the profile at the peak since the shape of the profile remains unchanged: Table 4.6.

59
Table 4.6. Calculated interfacial excess values of Re, ΓRe, at γ/γ′ interfaces for two different data sets as determined from 3DAP microscopy analyses. Note that the excess values are in good agreement with one another.
Data set Threshold value - Cr (at.%) ΓRe (atoms nm-2) 1st 4 2.59 ± 0.82
6 2.41 ± 0.61 6.5 2.30 ± 0.61 7 2.42 ± 0.61 8.1 2.6 ± 0.74
2nd 4.9 2.3 ± 0.37 5.5 2.42 ± 0.30 7 2.32 ± 0.27 10 2.33 ± 0.27

60
positional shift of the heterophase boundary is minimized when one varies the threshold
value. In addition, the proxigram calculates the concentration of Re in three-dimensional
real space and measures the shortest distance from a specific atomic position to the
isoconcentration surface. This calculation technique for the proxigram [55] makes the
detailed topological complexity of the surface irrelevant for the calculation; that is, it
does not require the interface to be flat. As a result, a change in threshold value for the
isoconcentration surface only changes the position of the reference point (i.e., x = 0, in
the proxigram) and not the shape of the concentration profile in the proxigram, as seen in
the Figure 4.8. The shift in the position of the reference point does not significantly
affect the shape of the profile, so the area under the profile at the peak remains
essentially constant. As a result, the dependence of the interfacial excess value on the
threshold value of the isoconcentration surface is weak. If the isoconcentration surface is
taken at the heterophase boundary, then that isoconcentration surface is the dividing
surface. The current investigation, however, demonstrated that the dependence of the
interfacial excess on the choice of where the dividing surface is placed is weak, so
precise placement of the isoconcentration surface is not necessary.
In some circumstances, it is actually better to place the isoconcentration surface
away from the heterophase boundary. For instance, in the case of small precipitates,
choosing an isoconcentration surface further into the matrix can increase the statistical
sample size and therefore decrease the error in calculating concentrations. In these cases,
the current investigation confirms that this technique is a valid one for reducing

61
statistical error.
In addition, Cr and Co interfacial segregations at the γ/γ′ interfaces are also
observed by 3DAP microscopy, Figures 4.9 and 4.10, respectively. The interfacial
excesses of Cr and Co are calculated employing proxigram, and their values are 4.92 ±
1.22 ×10¹⁴ atoms cm-2 (4.92 ± 1.22 atoms nm-2) and 4.22 ± 0.93 ×10¹⁴ atoms cm-2 (4.22
± 0.93 atoms nm-2). For other alloying elements, no segregation at the γ/γ′ interfaces has
been detected.
The relative interfacial excesses of Cr, Co, and Re with respect to Ni and Co/Cr,
which are solvent element (Ni) and major solute elements (Co and Cr), are also
calculated utilizing Equation 2.6, to determine if the interfacial excess values obtained
from proxigrams are truly independent of the position of the dividing surface. The values
of CoNiCr
,Γ , CrNiCo
,Γ , and CoNiRe
,Γ are 2.32 ± 1.79, 3.76 ± 2.91, and 1.15 ± 0.96 atoms nm-2,
respectively, and the relative interfacial excess values are all within the errors of the
values calculated employing proxigrams. The results, therefore, indicate that the
interfacial excess values can be measured directly from proxigrams, and the values are
independent of the position of the dividing surface.

62
Figure 4.9. A proxigram displaying the Cr atomic concentration as a function of distance with respect to the γ/γ′ interface; positive values are into the γ−matrix and negative values are into the γ′−precipitates. The interface is defined by an isoconcentration surface at 7 at.% Cr (Figure 4.6). The interfacial excess of Cr is indicated by the gray region, 4.92 atoms nm-2.

63
Figure 4.10. A proxigram displaying the Co atomic concentration as a function of distance with respect to the γ/γ′ interface; positive values are into the γ−matrix and negative values are into the γ′−precipitates. The interface is defined by an isoconcentration surface at 7 at.% Cr (Figure 4.6). The interfacial excess of Co is indicated by the gray region, 4.22 atoms nm-2.

64
4.4. Conclusions
• Energy-compensated three-dimensional atom probe (3DAP) microscopy shows
definite advantages over one-dimensional atom probe (1DAP) microscopy in
terms of mass resolution for distinguishing isotopes with similar mass-to-charge
state ratios as well as spatial resolution for a direct real-space visualization of the
positions of atoms and their chemical identities. 3DAP microscopy is particularly
appropriate for nanoscale chemical studies of complex commercial alloys
containing a large number of alloying elements; for example, General Electric’s
René N6, Ni-based superalloy.
• The partitioning behavior of alloying elements between phases is determined
from concentration profiles (1DAP microscopy) and direct lattice three-
dimensional reconstructions (3DAP microscopy) of General Electric’s René N6,
Ni-based superalloy. Ni, Al, Ta, and Hf are partitioned to the γ′−precipitates (LI2
crystal structure). In contrast, Co, Cr, Re, W, and Mo are partitioned to the
γ−matrix (FCC). 3DAP microscopy exhibits improved counting statistics over
1DAP microscopy, as it is possible to collect data sets in excess of several
million atoms.
• Segregation of Re is observed at the γ/γ′ interfaces by both 1DAP and 3DAP
microscopies. The interfacial excess of Re, ΓRe, is calculated from an integral
profile using the graphical (1DAP microscopy) and proxigram (3DAP
microscopy) methods. Its value is 2.32×10¹⁴ atoms cm-2 (2.32 atoms nm-2) for the

65
graphical method and 2.41×10¹⁴ atoms cm-2 (2.41 atoms nm-2), using the average
atomic density of the γ−matrix, for the proxigram method. The latter method is
applicable to both planar and non-planar heterophase interfaces, while the
integral profile method requires the interface to be flat, and detects readily the
excess for all the precipitates in the analyzed volume in parallel.
• The dependence of the excess value on the threshold value of the
isoconcentration surface was examined by varying its value, for nine different
values (4, 6, 6.5, 7, and 8.1 at.% Cr for the first data set and 4.9, 5.5, 7, and 10
at.% Cr for the second data set), and then calculating the excess value for Re at
γ/γ′ interfaces in René N6. Our results demonstrate the insensitivity of the value
of the excess on the threshold value associated with an isoconcentration surface
for René N6. In addition, the values of ΓRe are independent of whether the γ/γ′
interface is parallel or perpendicular to the direction of analysis.
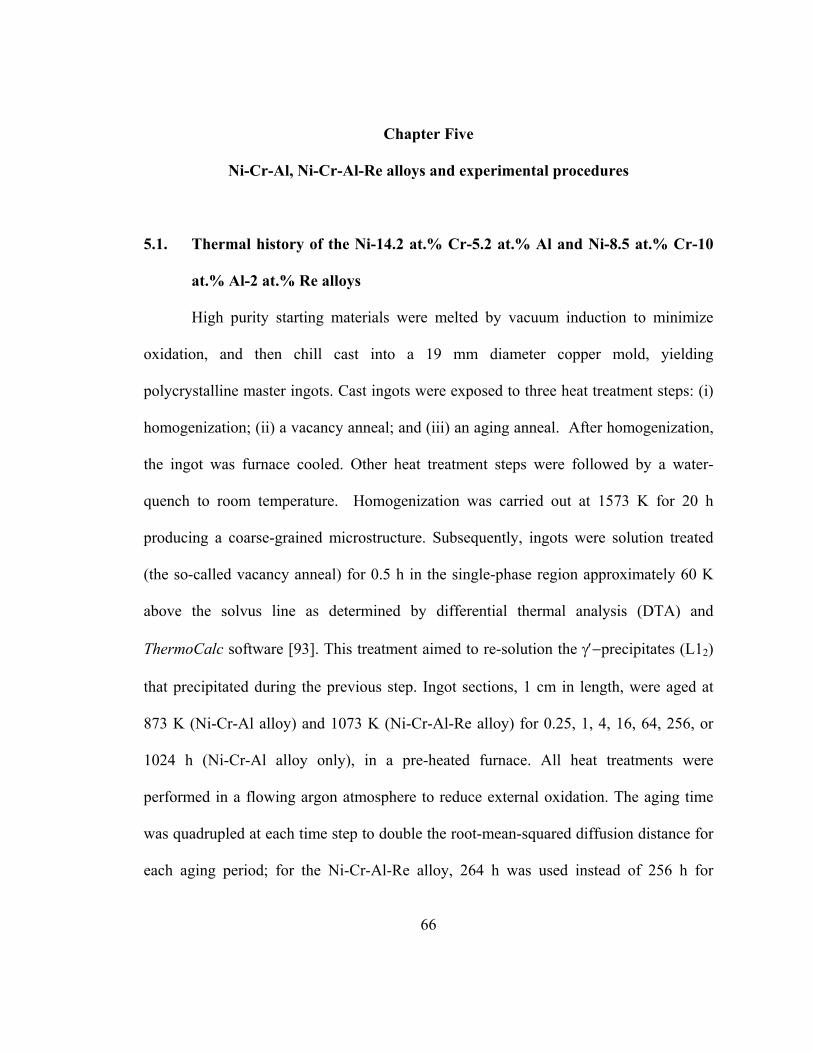
66
Chapter Five
Ni-Cr-Al, Ni-Cr-Al-Re alloys and experimental procedures
5.1. Thermal history of the Ni-14.2 at.% Cr-5.2 at.% Al and Ni-8.5 at.% Cr-10
at.% Al-2 at.% Re alloys
High purity starting materials were melted by vacuum induction to minimize
oxidation, and then chill cast into a 19 mm diameter copper mold, yielding
polycrystalline master ingots. Cast ingots were exposed to three heat treatment steps: (i)
homogenization; (ii) a vacancy anneal; and (iii) an aging anneal. After homogenization,
the ingot was furnace cooled. Other heat treatment steps were followed by a water-
quench to room temperature. Homogenization was carried out at 1573 K for 20 h
producing a coarse-grained microstructure. Subsequently, ingots were solution treated
(the so-called vacancy anneal) for 0.5 h in the single-phase region approximately 60 K
above the solvus line as determined by differential thermal analysis (DTA) and
ThermoCalc software [93]. This treatment aimed to re-solution the γ′−precipitates (L12)
that precipitated during the previous step. Ingot sections, 1 cm in length, were aged at
873 K (Ni-Cr-Al alloy) and 1073 K (Ni-Cr-Al-Re alloy) for 0.25, 1, 4, 16, 64, 256, or
1024 h (Ni-Cr-Al alloy only), in a pre-heated furnace. All heat treatments were
performed in a flowing argon atmosphere to reduce external oxidation. The aging time
was quadrupled at each time step to double the root-mean-squared diffusion distance for
each aging period; for the Ni-Cr-Al-Re alloy, 264 h was used instead of 256 h for

67
convenience. Bulk chemical analyses of the cast alloys were performed using an Applied
Research Laboratories Model 3560 ICP atomic-emission vacuum spectrometer and the
results are presented in Table 5.1: (a) Ni-Cr-Al and (b) Ni-Cr-Al-Re alloys. In addition,
the volume fraction, Vf, of γ′−precipitates of the alloys aged for 1024 h (Ni-Cr-Al alloy)
and 264 h (Ni-Cr-Al-Re alloy) are listed, which were measured experimentally
employing the phase extraction method (Vfexp., NASA Glenn Center, Cleveland, OH)
and the equilibrium volume fraction calculated utilizing ThermoCalc software (Vfcalc.).
The Vfexp. and Vf
calc. are in reasonable agreement for the Ni-Cr-Al-Re alloy. For the Ni-
Cr-Al alloy, however, there is significant difference between the two values. Because the
mean radius, <R>, of the γ′−precipitates is very small (< 10 nm at 1024 h) in the Ni-Cr-
Al alloy, some of them may be dissolved by the electrolyte meant for the γ−matrix
and/or may not be collected completely by filtration for weighing after the dissolution,
which would create the discrepancy.
5.2. Experimental aspects of 3DAP microscopy analyses
Atom-probe specimens were cut from the aged alloy ingot into 0.2×0.2×2 mm3
blanks using electric discharge machining (EDM). Tips for 3DAP microscopy analyses
were prepared by standard electropolishing techniques at room temperature [94]. A two-
stage method was used to polish 200-µm thick blanks, which involves commencing with
beaker polishing and finishing with loop polishing. The electrolyte was 5 vol.%

68
Table 5.1. Bulk Compositions (at.%) and compositions of γ−matrix and γ′−precipitates measured by ICP chemical analysis and volume fraction of γ′−precipitates determined by phase extraction method and ThermoCalc calculations: (a) Ni-Cr-Al and (b) Ni-Cr-Al-Re alloys.
(a) Ni Cr Al Vfexp. Vf
calc. Aim 80 14.8 5.2
Measured 80.52 14.24 5.24 γ 81.07 14.75 4.18 γ' 69.42 13.5 17.08 5.32 14.1
(b) Ni Cr Al Re Vfexp. Vf
calc. Aim 79.5 8.5 10 2
Measured 79.93 8.61 9.47 1.99 γ 81.36 9.15 7.19 2.3 γ' 76.85 4.91 17.13 1.1 25.36 21.6

69
perchloric acid in acetic acid. The polishing commenced at 26 Vdc and the voltage was
lowered to < 15 Vdc as the tip sharpened to a point. A neck formed at about 10 Vdc and
electrolytic cutting of the neck was performed at less than 5 Vdc. This method produced
sharp needle-like tips with a radius of curvature less than 50 nm. 3DAP microscopy
analyses were performed using our energy compensated 3DAP microscope. FIM
micrographs were obtained at 50 K using Ne (gauge pressure of 1.33×10⁻³ Pa) as an
imaging gas, which exposed the prominent poles and allowed alignment of the tip along
a specific crystallographic orientation for 3DAP microscopy analyses. A region close to
a 100-type pole was selected and analyzed to distinguish clearly the {100} atomic planes
(alternating between 100 at.% Ni and 50 at.% Ni: 50 at.% Al in the L12 structure) along
the [100] analysis direction from the three-dimensional reconstructions, thereby enabling
a direct calibration of the depth scale. Figure 5.1 (a) displays the FIM micrograph of Ni-
Cr-Al-Re alloy aged at 1073 K for 1 h. It clearly exhibits the prominent poles and the
region close to a 100-type pole selected by primary detector is shown on the right side.
In addition, Figure 5.1 (b) displays the corresponding crystallographic orientation of
Figure 5.1 (a), which is fully indexed. The analyses commenced typically at 7.5 kVdc
and ended at 15 kVdc. They were performed in a background pressure of 10-8 Pa, at a
specimen temperature of 40 K for Ni-Cr-Al alloy and 50 K for Ni-Cr-Al-Re alloy, a
pulse frequency of 1.5 kHz, and an average detection rate between 0.007 and 0.1 ion
pulse-1. The Re addition to the model Ni-8.5 at.% Cr-10 at.% Al alloy significantly
changed the field evaporation behavior of the alloy. A higher temperature, therefore, was

70
Figure 5.1. (a) FIM micrograph of a Ni-Cr-Al-Re alloy aged at 1073 K for 1 h taken in a Ne atmosphere under a pressure of 10-3 Pa and a temperature of 50 K, with the area near 100-type pole selected by primary detector for 3DAP microscopy analyses and (b) corresponding crystallographic orientation of Figure 5.1(a).

71
utilized for the Ni-Cr-Al-Re alloy to ensure the smooth and consistent field evaporation
of this alloy. In addition, data sets of approximately two million ions were collected for
each aging time. An f of 19 % was used to eliminate selective field evaporation of atoms
in between the field evaporation voltage pulses.
5.3. Experimental aspects of CTEM investigation
Conventional TEM specimens were cut from the aged heat-treated alloy ingot
into 10×20×0.25 mm sheets using EDM. First, 250 µm thick sheets were mechanically
pre-thinned to ca. 100 µm. Then, standard 3 mm diameter TEM disks were cut from the
sheets using an abrasive slurry cutter with a mixture of 50 µm diameter boron particles
and glycerin, which form an abrasive slurry. Finally, electropolishing of disks was
performed employing a Struers TenuPol-5 at 11 Vdc, a flow rate of 20 (a Struers
arbitrary unit), and 243 K, using dry ice and methanol mixture as a coolant. The
electrolyte consisted of 12 vol.% perchloric acid and 5 vol.% butoxyethanol in 83 vol.%
methanol. Conventional TEM investigations were performed using a Hitachi H-8100 at
200 kV, utilizing a double-tilt sample holder. All TEM micrographs were taken along a
[100] zone axis or employing a two-beam condition near the [100] zone axis, Figure 5.2
taken from the Ni-Cr-Al-Re alloy. Note the presence of superlattice reflections, from
γ′−precipitates (L12), in the inset diffraction pattern, which reside between the strong
reflections from the γ−matrix (FCC). In addition, micrographs were recorded from a
minimum of three different areas of TEM specimens to eliminate any local variation in

72
composition. Conventional TEM investigations were performed only on the Ni-Cr-Al-
Re alloy, since the <R> values of the γ′−precipitates in the Ni-Cr-Al alloy are too small
(< 1 nm for early aging times) to be measured employing CTEM.
73
Figure 5.2. Dark-field TEM micrograph of Ni-Cr-Al-Re alloy aged for 264 h, taken along the [100] zone axis in a two-beam condition, with its accompanying diffraction pattern in the upper left-hand corner.

74
Chapter Six
Temporal evolution of the Ni-14.2 at.% Cr-5.2 at.% Al alloy
6.1. Introduction
Ternary Ni-Cr-Al alloys are fundamental to the structure of multicomponent
nickel-based superalloys. They derive their high temperature strength and creep
resistance from the dual phase structure of ordered Ni3Al-type γ′−precipitates (L12),
which are dispersed in a Cr-enriched γ−matrix (FCC). This two-phase nanostructure
gives Ni-Cr-Al alloys both strength and ductility. In addition, due to native Cr and Al
oxides, Ni-Cr-Al alloys generally have satisfactory corrosion and oxidation resistance
for many high-temperature applications [20, 27].
In a seminal paper involving a 3DAP microscopy investigation of a Ni-14.8 at.%
Cr-5.2 at.% Al alloy, Schmuck et al. claimed that the coarsening experiments of this
alloy, which was aged up to 64 h, are in good agreement with LSW theory [4], which
differ from the conclusions presented in this article. The low to moderate supersaturation
of Al makes this alloy suitable for an investigation of the nucleation, growth and
coarsening kinetics employing 3DAP microscopy, because of the high number density,
Nv > 1023 m-3, and low volume fraction, Vf ~ 15%, of the γ′−precipitates. We have
studied this alloy in great detail and have investigated all three asymptotic solutions of
UO coarsening theory for multicomponent alloys.

75
Three-dimensional atom probe microscopy has been utilized to investigate the
temporal evolution of the nanostructure of a Ni-14.2 at.% Cr-5.2 at.% Al alloy,
measuring the mean radius (<R>), Nv, and Vf of the γ′−precipitates, compositions of
both γ′−precipitates and γ−matrix, and partitioning behavior of alloying elements
between the γ′−precipitates and γ−matrix as a function of aging time at 873 K for times
ranging from 0.033 to 1024 h. In addition, the time dependence of the matrix
supersaturations, ∆Ci ( )()( ∞→−=∆ tCtCC iiiγγ ), of Cr and Al has been measured
directly from experiments for the first time. Conventional TEM has been employed to
investigate the nanostructure and morphology of the γ′−precipitates of the as-quenched
state and at 1024 h, the longest aging time. In addition, experimental results are
compared with simulation results obtained employing kinetic Monte Carlo (KMC)
simulations [96]. I performed the investigations of alloys aged for 0, 0.08, 1, 64, and
1024 h. My colleague Ms. C. K. Sudbrack performed investigations of alloys aged for
0.03, 0.17, 0.25, 4, 16, and 256 h [97].
6.2. Results
6.2.1. Initial state and temporal evolution of the γ′−precipitates
The γ′−precipitates are not detected in the as-quenched state of this alloy, in a
3DAP microscopy dataset containing > 1.2 million atoms in a 15×15×128 nm3 analysis
volume, employing the isoconcentration surface method with a threshold value of 9 at.%

76
Al to differentiate the γ′−precipitates from the γ−matrix. In addition, the diffraction
pattern obtained utilizing CTEM does not exhibit superlattice reflections resulting from
L12-type ordered γ′−precipitates. It only displays diffraction patterns for the FCC matrix
in the [100] beam direction, Figure 6.1 (a). Therefore, it is suggested that the as-
quenched alloy maintains the nanostructure of a solution heat-treatment temperature
(1123 K), and no observable precipitation occurs during quenching due to the low
supersaturations of Cr and Al. Figure 6.1 (b) exhibits the spheroidal morphology of the
γ′−precipitates at the longest aging time of 1024 h. The inset diffraction pattern exhibits
the superlattce reflections of L12-type ordered γ′−precipitates.
γ′−precipitates with <R> of 0.74 nm are first observed for an aging time of 0.17 h.
Figure 6.2 displays 10×10×25 nm3 subsets of analyzed volumes with the γ′−precipitates
delineated by a 9 at.% Al isoconcentration surface in this alloy, as a function of aging
time from 0.17 to 1024 h. This figure clearly displays the temporal evolution of the
γ′−precipitates and shows that the <R> of the γ′−precipitates increases, while the Nv
decreases with increasing aging time after 4 h. Individual atoms are not shown in Figure
6.2 for the sake of clarity. In addition, some of the γ′−precipitates are interconnected
with other precipitates by necks between 0.25 to 256 h. This is discussed in more detail
in Section 6.3.4.

77
Figure 6.1. Ni-14.2 at.% Cr-5.2 at.% Al alloy: (a) diffraction pattern of as-quenched state specimens; and (b) dark-field TEM micrograph of sample aged for 1024 h, taken along the [100] zone axis with its accompanying diffraction pattern in the upper left-hand corner. Note the presence of superlattice reflections in the diffraction pattern in the micrograph of the 1024 h specimens, from the γ′−precipitates (L12), which reside between the strong reflections from the γ-matrix (FCC).

78
Figu
re 6
.2.
A 9
at.%
Al i
soco
ncen
tratio
n su
rfac
e is
em
ploy
ed to
iden
tify
the
γ′−p
reci
pita
tes i
n th
e N
i-Cr-
Al a
lloy
aged
at
873
K f
or d
iffer
ent
agin
g tim
es t
here
by d
ispl
ayin
g th
e te
mpo
ral
evol
utio
n of
the
γ′−
prec
ipita
tes.
Each
reco
nstru
ctio
n is
a s
ubse
t of
resu
lts e
xtra
cted
fro
m a
larg
er v
olum
e to
cre
ate
a 10
×10×
25 n
m3 p
aral
lele
pipe
d fo
rco
mpa
rison
as
a fu
nctio
n of
agi
ng t
ime.
Thi
s fig
ure
qual
itativ
ely
exhi
bits
the
inc
reas
e in
the
mea
n ra
dius
of
γ′−p
reci
pita
tes
and
conc
omita
nt d
ecre
ase
in th
e nu
mbe
r de
nsity
of
the
γ′−p
reci
pita
tes,
as a
fun
ctio
n of
incr
easi
ngag
ing
time.

79
6.2.2. Chemical evolution of the alloy
A three-dimensional atom probe microscopy reconstruction of the alloy aged for
1024 h is exhibited in Figure 6.3, where the Al atoms are shown in red, Cr atoms in blue,
and Ni atoms are omitted for clarity. The partitioning behavior of all the elements is
visualized employing this three-dimensional reconstruction of the data. Al partitions, of
course, to the γ′−precipitates, while Ni and Cr prefer the γ−matrix. In addition, the
morphology of the γ′−precipitates still remains spheroidal even after the longest aging
time of 1024 h. The micrograph obtained utilizing CTEM also confirms the spheroidal
shape of the γ′−precipitates after aging for 1024 h, Figure 6.1 (b).
The temporal evolution of the elemental concentrations in both the γ−matrix and
γ′−precipitates is investigated employing the proxigram methodology. The proxigrams of
the specimen aged for 1, 64 and 1024 h are displayed in Figure 6.4. The concentrations
of elements are determined by counting the number of atoms associated with each phase
as differentiated by the inflection point in the proxigrams, which is the threshold value
for the isoconcentration surface, 9 at.% Al. The compositions of the γ−matrix and
γ′−precipitates are listed in Tables 6.1 and 6.2 as a function of aging time. The Vf of
γ′−precipitates is determined directly from the ratio of the number of atoms inside the
γ′−precipitates to the total number of atoms collected. Since the lattice parameter misfit,
δ, between the γ−matrix and γ′−precipitate is estimated to be zero [98-100], it is safe to
assume that the atomic densities in the two phases are the same. The Vf of the

80
Figu
re 6
.3.
Thre
e-di
men
sion
al re
cons
truct
ion
of th
e N
i-Cr-
Al a
lloy
(con
tain
ing
1.6
mill
ion
atom
s in
a 2
2×22
×83
nm3 p
aral
lele
pipe
d) a
fter a
n ag
ing
time
of 1
024
h; C
r ato
ms
are
show
n in
blu
e an
d A
l ato
ms
in re
d, w
hile
Ni a
tom
sar
e no
t sh
own
for
the
sake
of
clar
ity.
This
fig
ure
dem
onst
rate
s th
at t
he γ
′−pr
ecip
itate
s m
aint
ain
the
sphe
roid
alm
orph
olog
y at
an
agin
g tim
e of
102
4 h.

81
Figure 6.4. Proxigrams of Ni, Cr, and Al for three different aging times (1, 64, and 1024 h). The graphs exhibit the temporal evolution of each elemental concentration in both γ−matrix and γ′−precipitates. As aging time increases, the concentrations of Ni and Cr increase but the Al concentration decreases in the γ−matrix. In the γ′−precipitates, Cr and Al concentrations decrease, while the Ni concentration increases.

82
Table 6.1. Compositions (at.%) of γ−matrix (FCC) determined by 3DAP microscopy as a function of aging time in hours.
Time (h) Ni Cr Al 0.17 80.530 ± 0.078 14.240 ± 0.070 5.230 ± 0.043 0.25 80.560 ± 0.060 14.270 ± 0.055 5.170 ± 0.035
1 80.623 ± 0.052 14.252 ± 0.046 5.125 ± 0.029 4 80.830 ± 0.053 14.540 ± 0.048 4.630 ± 0.028 16 80.980 ± 0.036 14.790 ± 0.033 4.230 ± 0.018 64 81.110 ± 0.057 14.938 ± 0.052 3.952 ± 0.028 256 81.170 ± 0.071 15.220 ± 0.066 3.610 ± 0.034 1024 81.215 ± 0.049 15.407 ± 0.045 3.378 ± 0.023
Table 6.2. Compositions (at.%) of γ′−precipitate (L12) determined by 3DAP microscopy as a function of aging time in hours.
Time (h) Ni Cr Al 0.17 71.180 ± 2.733 10.230 ± 1.900 18.590 ± 2.300 0.25 73.120 ± 0.937 9.410 ± 0.600 17.470 ± 0.800
1 73.970 ± 0.694 9.036 ± 0.454 16.993 ± 0.596 4 74.990 ± 0.244 8.870 ± 0.160 16.140 ± 0.210 16 75.700 ± 0.127 8.390 ± 0.080 15.910 ± 0.110 64 75.908 ± 0.185 8.129 ± 0.159 15.963 ± 0.118 256 76.270 ± 0.196 7.800 ± 0.130 15.930 ± 0.170 1024 76.756 ± 0.123 7.920 ± 0.105 15.324 ± 0.079
83
precipitates as a function of aging time is plotted in Figure 6.5, compared with the results
of KMC simulations.
The partitioning ratio, Κγ′/γ, of alloying element is determined quantitatively from
the γ−matrix and γ′−precipitate compositions. Κγ′/γ is defined to be the ratio of the atomic
concentration of an element in γ′−precipitates divided by the atomic concentration of the
same element in the γ−matrix; Κγ′/γ values as a function of time are listed in Table 6.3
and plotted in Figure 6.6. A Κγ′/γ value greater than unity indicates partitioning of a
solute element to the γ′−precipitates, while a value less than unity indicates partitioning
of a solute element to the γ−matrix. As qualitatively observed in Figure 6.3, Al favors
the precipitates whereas Ni and Cr partition to the γ−matrix. In addition, Κγ′/γ values of
Cr and Al approach plateaus after 256 h, while Ni reaches a plateau after 16 h, which
indicates that this alloy has not achieved a global steady-state, 0=
∂∂
tC .
6.2.3. Properties of the γ′−precipitates
The <R> value of the γ′−precipitates is determined by measuring the maximum
and minimum axes of the spheroidal-shaped precipitates from the three-dimensional
reconstructions, then calculating the volume equivalent radius. The Nv values of
γ′−precipitates are determined by counting the total number of γ′−precipitates within the
analyzed volumes and dividing by volume. The analyzed volume is measured from the

84
Figure 6.5. Volume fraction, Vf, of γ′−precipitates as a function of aging time, which converges to approximately 16 vol.% with increasing aging time. KMC simulation results are superimposed for comparison [96]; they are in good agreement with the experimental results.

85
Figure 6.6. Partitioning ratios, Κγ′/γ, for all the elements in this Ni-Cr-Al alloy plotted as a function of aging time. This graph clearly displays the partitioning behavior of the elements; Ni and Cr prefer the γ−matrix, while Al favors the γ′−precipitates.

86
Table 6.3. Partitioning ratio (Κγ′/γ, the atomic concentration of an element in the γ′−precipitates divided by the atomic concentration of the same elements in the γ−matrix) of Ni-Cr-Al alloy as a function of aging time in hours.
Time (h) Ni Cr Al 0.17 0.8839 ± 0.0349 0.7184 ± 0.1344 3.5545 ± 0.4412 0.25 0.9076 ± 0.0133 0.6594 ± 0.0437 3.3791 ± 0.1573
1 0.9175 ± 0.0102 0.6340 ± 0.0333 3.3156 ± 0.1186 4 0.9277 ± 0.0064 0.6100 ± 0.0148 3.4860 ± 0.0515 16 0.9348 ± 0.0042 0.5673 ± 0.0084 3.7612 ± 0.0311 64 0.9359 ± 0.0065 0.5442 ± 0.0146 4.0390 ± 0.0414 256 0.9396 ± 0.0080 0.5125 ± 0.0148 4.4127 ± 0.0603 1024 0.9451 ± 0.0055 0.5141 ± 0.0108 4.5360 ± 0.0334

87
dimensions of the three-dimensional reconstructions. The mean center-to-center
interprecipitate distance, <λ>c-c, is obtained from the number density of precipitates,
utilizing:
3/1
4312
⋅=>< −
vcc Nπ
λ . (6.1)
The mean edge-to-edge interprecipitate distance, <λ>e-e, is calculated from:
><−>=<>< −− Rccee 2λλ . (6.2)
The quantities <R>, Nv, and <λ>e-e are plotted as a function of time in Figure 6.7:
(a), (b), and (c), respectively. The number of γ′−precipitates detected for each aging time,
<R>, Nv, Vf, and <λ>e-e are summarized in Table 6.4. The interfacial velocity of the
γ′−precipitates, v, is derived from the temporal dependence of the measured <R> values
of the γ′−precipitates, employing:
dtRdv /><= . (6.3)
Figure 6.8 demonstrates that the values of v decrease to a small value with increasing
aging time; at 1024 h, v is 2.03×10⁻³ nm h-1, which corresponds to a decrease of a factor
of 232 from 0.47 nm h-1 at 0 h.

88
Figure 6.7. Double logarithmic plot of (a) mean radius, <R>, and (b) number density, Nv, of γ′−precipitates and (c) the mean edge-to-edge interprecipitate distance, <λ>e-e, versus aging time (0.17, 0.25, 1, 4, 16, 64, 256 and 1024 h) for this Ni-Cr-Al alloy. As aging time increases, the values of <R> increases, while Nv monotonically decreases. In addition, <λ>e-e decreases then increases after an aging time of 4 h. Time exponents of the coarsening are determined from these log-log plots. The results of KMC simulations are superimposed for comparison [96].

89
Table 6.4. Detailed results of 3DAP microscopy investigations of the γ′−precipitates as a function of aging time in hours.
Aging time (h)
No. of ppts.
analyzed
Volume fraction
(%)
Mean radius (nm)
Number density (m-3)
Edge-to-edge interprecipitate distance (nm)
0.17 7.5 0.11 0.74 ± 0.11 3.6 ± 2.3 × 10²³ 16.01 ± 2.87 0.25 74 0.55 0.75 ± 0.11 2.1 ± 0.4 × 1024 8.15 ± 0.77
1 100 2.33 0.89 ± 0.13 2.5 ± 0.5 × 1024 7.35 ± 0.81 4 173.5 5.24 1.27 ± 0.19 3.2 ± 0.6 × 1024 5.85 ± 0.32 16 101 8.82 2.14 ± 0.32 1.5 ± 2.7 × 1024 6.59 ± 0.66 64 46 10.02 2.83 ± 0.42 4.9 ± 1.7 × 10²³ 10.11 ± 2.34 256 81 13.25 4.08 ± 0.61 2.4 ± 0.4 × 10²³ 11.91 ± 1.82 1024 6 15.66 7.7 ± 1.16 1.1 ± 0.6 × 10²³ 10.59 ± 5.47

90
Figure 6.8. Interfacial velocity of the γ′−precipitates, v, derived from the <R> of γ′−precipitates (Figure 6.7 (a)), as a function of aging time. The displacement of the interface of the γ′−precipitates steadily decreases, as aging time increases.

91
6.3. Discussions
6.3.1. Morphology of the γ′−precipitates
In many Ni-based alloys (e.g. Ni-Al, Ni-Si, and Nimonic 115 alloys), the
morphology of γ′−precipitates changes from sphere-to-cube to clover leaves, which
finally split into eight small cuboidal precipitates (i.e. ogdoad) during the coarsening
process [101-104]. The interfacial and elastic energies of the γ′−precipitates are the
sources of this morphological evolution and the balance between the two determines the
morphology of precipitates. For small precipitates, the precipitate surface-area-to-
volume ratio is large and the morphology of precipitates is determined by the
minimization of the dominant interfacial free energy, making the precipitates spheroidal.
Alternatively, when precipitates become large, the ratio of precipitate surface-area-to-
volume is small and the elastic strain energy, arising from accommodating lattice
mismatch at the interface, determines the morphology. In the case of Ni-based
superalloys, where the γ′−precipitates are elastically stiffer than the γ−matrix, the
precipitates become cuboidal as their radii increase. If, however, the matrix is stiffer
than the precipitates then a plate morphology is preferred [34].
Unlike Ni-Al binary alloys, whose γ′−precipitates experience the sphere-to-cube
morphological transition during an isothermal heat treatment and align along [100]-type
directions in the later stage of coarsening [101, 105], the morphology of the γ′−
precipitates in our Ni-14.2 at.% Cr-5.2 at.% Al alloy remains relatively spheroidal even
after the longest aging time of 1024 h, Figures 6.1 (b) and 6.3. This can be explained by
92
the effect of a Cr addition to a Ni-Al alloy. The room temperature lattice parameter
misfit, δ, of the Ni-Al binary system with 12.7-14.5 at.% Al is [98, 106]:
%57.02/)( '
' =+
−=
γγ
γγδaa
aa; (6.4)
where aγ is the lattice parameter of the γ−matrix and aγ′ is that of the γ′−precipitates.
After the addition of Cr, however, δ in Ni-Cr-Al ternary alloys is estimated to be zero for
the range of compositions that are within the scope of this investigation [98-100]. Since
the Cr addition creates a misfit-free environment between the γ−matrix and
γ′−precipitates, the elastic strain energy resulting from δ is small. To minimize the
dominant interfacial free energy (σ), the morphology of γ′−precipitates remains
spheroidal for extended aging times, up to 1024 h. In addition, the minimization of σ
reduces the coarsening rate constant, kUO, which leads to a delay in the coarsening
kinetics of the γ′−precipitates.
6.3.2. Temporal evolution of the concentrations
The Cr concentration in the γ−matrix increases while the Al concentration
decreases with increasing aging time, Table 6.1. In the γ′−precipitates, however, both Cr
and Al concentrations decrease, Table 6.2. These changes are reflected in the values of
Κγ′/γ, where the ratios for Cr are decreasing with increasing aging time whereas the ratio
for Al is increasing with time, Figure 6.6. The compositions of the γ−matrix,

93
γ′−precipitates and the partitioning behavior demonstrate that the temporal evolution of
Ni-Cr-Al alloy does not decrease until after 256 h of aging. This suggests that the Ni-Cr-
Al alloy is not in a true steady-state regime, 0=
∂∂
tC , as defined by UO coarsening
theory.
Table 6.2 shows that the γ′−precipitates in the early stages of aging have high Cr
and Al concentrations, which suggests that the precipitates may nucleate from Cr and
Al-rich clusters and then reject solute atoms with increasing aging time. As growth and
coarsening progresses, the Cr and Al concentrations in the γ′−precipitates decrease,
while the Ni concentration concomitantly increases. This result differs from the
assumption of UO theory that the compositions of precipitates do not change during
coarsening; therefore coarsening in this Ni-Cr-Al alloy is in the non-steady-state.
6.3.3. Coarsening kinetics of the alloy
The three asymptotic solutions of UO theory for a ternary alloy are expressed for
<R>, Nv, and ∆Ci, respectively, as follows [36, 37]:
tkRtR UO=><−>< 33 )0()( ; (2.1)
with
( ) ( )
−+
−=
Al
AlAl
Cr
CrCr
mUO
DkC
DkC
TR
Vk
22 119
8γγ
σ; (2.1.1)
94
1)( −Κ= ttN UOv ; (2.2)
with
( ) ( )
σπ
γγ
4
113 22
−+−
=ΚAl
Al
AlCr
Cr
Crf
UO
kDC
kDC
VTR; (2.2.1)
[ ] 3/1)()( −=∞→− ttCtC UOii κγγ ; (2.3)
with
( ) ( ) ( )3/1
223/2 113
−+−= Al
Al
AlCr
Cr
CrmUO k
DC
kDC
TRVγγ
σκ . (2.3.1)
In Equation (2.1), <R(t)> is the mean precipitate radius at time t, <R(0)> is the mean
precipitate radius at t = 0, and kUO is the coarsening rate constant for the mean radius of
γ′−precipitates. In Equation (2.1.1), σ is the interfacial free energy, Vm is the molar
volume of the γ′−precipitates, Rg is the ideal gas constant, T is the aging temperature, Di
and γiC are the diffusion coefficient and the equilibrium solubility of the ith solute in the
γ−matrix, and ki is the distribution coefficient of the ith solute between the γ−matrix and
γ′−precipitates and is defined by γγii CC /' . In Equation (2.2), ΚUO is the coarsening rate
constant for the Nv of precipitates and Vf is the γ′−precipitate volume fraction. In
Equation (2.3), )(tCiγ is the composition of ith component in matrix at time t,
)( ∞→tCiγ is the equilibrium solid-solubility of the ith component in the γ−matrix, and
κUO is the coarsening rate constant for the matrix supersaturation. The quantity in the
95
bracket on the left-hand side of Equation (2.3) is denoted the matrix supersaturation of
solute element i (∆Ci). The time exponents are the same as for a binary alloy described
by LSW theory.
To compare the coarsening experiments with UO theory, the time exponents for
coarsening are determined from the slopes of the double logarithmic plots of the <R>
and Nv values of the γ′−precipitates, and ∆Ci values of Cr and Al, in the γ−matrix as a
function of aging time. First, the values of <R> of the γ′−precipitates are plotted versus
aging time as shown in Figure 6.7 (a). For the earliest aging time from 0.17 to 1 h, <R>
remains approximately constant within experimental error, where the time exponent is
0.11 ± 0.11. After 1 h of aging, <R> increases as aging time increases with the time
exponent 0.30 ± 0.04, which is in approximate agreement with the prediction of UO
theory, 1/3 (Equation (2.1)). Second, the time exponent for Equation (2.2) is determined
from the slope of the curve in Figure 6.7 (b), which is a plot of Nv, for γ′−precipitates, as
a function of aging time. It clearly displays three distinct regimes with different slopes as
aging time increases. The first regime, which is the nucleation regime, is from 0.17 to 0.
25 h. In this regime, precipitation of the γ′−precipitates is occurring in the γ−matrix and
Nv increases significantly as aging time increases, with a time exponent of 4.4 ± 0.17.
The second regime, which involves both nucleation and growth, is from 0.25 to 4 h.
Because nucleation and growth of the γ′−precipitates is occurring simultaneously, Nv
increases considerably slower than in the pure nucleation regime, with a time exponent
96
of 0.15 ± 0.09. After 4 h of aging, the third regime commences, which involves both
growth and coarsening. In this regime, Nv decreases with increasing aging time as the
large γ′−precipitates grow and coarsens as a result of different mechanisms. The time
exponent in this regime is –0.64 ± 0.06, as compared with the UO value of –1 for pure
steady-state coarsening, 0=
∂∂
tC . Finally, the time exponent for the ∆Ci, Equation
(2.3), is obtained from the composition of the γ−matrix. First, Figure 6.9 exhibits the
concentration of each solute element in the γ-matrix as measured from the plateau region
of a proxigram, far away from the γ/γ′interfaces, as a function of (aging time)-1/3. Note
that the concentration of Cr increases linearly after a transient period, while the Al
concentration decreases with increasing aging time after a transient period. The
extrapolated intercept, at infinite time, on the ordinate axis corresponds to the
equilibrium solute solid-solubility in the γ-matrix. Since the growth and coarsening
regime of the alloy, determined from Nv as a function of time, starts after 4 h of aging,
only the data from 4 h to 1024 h are utilized to extrapolate to the intercept )( ∞→t . The
extrapolated equilibrium composition of the γ-matrix extrapolated from Figure 6.9 is
Ni81.26Cr15.65Al3.10. Employing the same method, we can also extrapolate the equilibrium
composition of the γ′−precipitates by plotting the concentration of each solute element in
the γ′−precipitates as a function of (aging time)-1/3, which is determined to be
Ni76.53Cr6.77Al16.69, Figure 6.10. The extrapolated equilibrium compositions of both γ-

97
and γ′−phases are listed in Table 6.5, with the overall composition of the alloy. Using the
solid-solubilities obtained from Figure 6.9, the time exponent for each solute element is
determined from the slope of ∆Ci as a function of aging time, log-log plots in Figure
6.11. The time exponents are –0.31 ± 0.04 for Cr and –0.33 ± 0.02 for Al, which are
both in approximate agreement with the predicted value of the UO theory, –1/3. In
addition, results of KMC simulations are superimposed for comparison and they are in
reasonably good agreement with the experimental results [96]. Utilizing the same
method, we can calculate the time exponents for the concentration differences in
γ′−precipitates, [ ])()( '' ∞→− tCtC iiγγ , of Cr and Al by plotting the concentration
differences as a function of aging time at 873 K, Figure 6.12. The time exponents are –
0.38 ± 0.06 for Cr and –0.38 ± 0.10 for Al.
The time exponents of <R> and ∆Ci of Cr and Al, obtained from the 3DAP
microscopy experiments, are in reasonably good agreement with the predictions of UO
theory. The time exponent of Nv, however, deviates considerably from the predicted
value of UO theory. A possible reason that causes this discrepancy is discussed in
Section 6.3.4. The time exponents for the γ−matrix and γ′−precipitates determined
employing 3DAP microscopy are listed in Table 6.6, compared with the theoretical
asymptotic predictions of UO theory.

98
Figure 6.9. The γ−matrix concentrations of Cr and Al far away from the γ/γ′ interfaces, measured by 3DAP microscopy as a function of (aging time)-1/3 at 873 K. The extrapolated intercepts on the ordinate axis, to infinite time, correspond to the equilibrium solid-solubilities of Cr and Al in the γ−matrix.

99
Figure 6.10. The γ′−precipitates concentrations of Cr and Al measured by 3DAP microscopy as a function of (aging time)-1/3 at 873 K. The extrapolated intercepts on the ordinate axis, to infinite time, correspond to the equilibrium concentrations of Cr and Al in the γ′−precipitates.

100
Table 6.5. Overall composition (at.%) of the Ni-Cr-Al alloy, as determined by 3DAP microscopy, and extrapolated equilibrium composition of the γ−matrix and γ′−precipitates determined from Figures 6.8 and 6.9.
Ni Cr Al Overall 80.6 14.2 5.2 γ-matrix 81.26 ± 0.08 15.65 ± 0.05 3.1 ± 0.08 γ'-ppts. 76.53 ± 0.25 6.77 ± 0.15 16.69 ± 0.21
Table 6.6. Time exponents of coarsening kinetics obtained from 3DAP microscopy experiments compared with the asymptotic prediction of the UO theory [36, 37].
∆Ci [ ])()( '' ∞→− tCtC iiγγ
<R> Nv Cr Al Cr Al
3DAP microscopy 0.30 ± 0.04 −0.64 ±
0.06 −0.31 ± 0.04
−0.33 ± 0.02
−0.38 ± 0.06
−0.38 ± 0.10
UO theory 1/3 −1 −1/3

101
Figure 6.11. Double logarithmic plots of the Cr and Al matrix supersaturations, ∆Ci, as a function of aging time at 873 K. The slopes of these plots yield the time exponents of coarsening of Cr and Al. The results of KMC simulations are superimposed for comparison [96].

102
Figure 6.12. Double logarithmic plots of the concentration difference in γ′−precipitates, [ ])()( '' ∞→− tCtC ii
γγ , of Cr and Al as a function of aging time at 873 K.
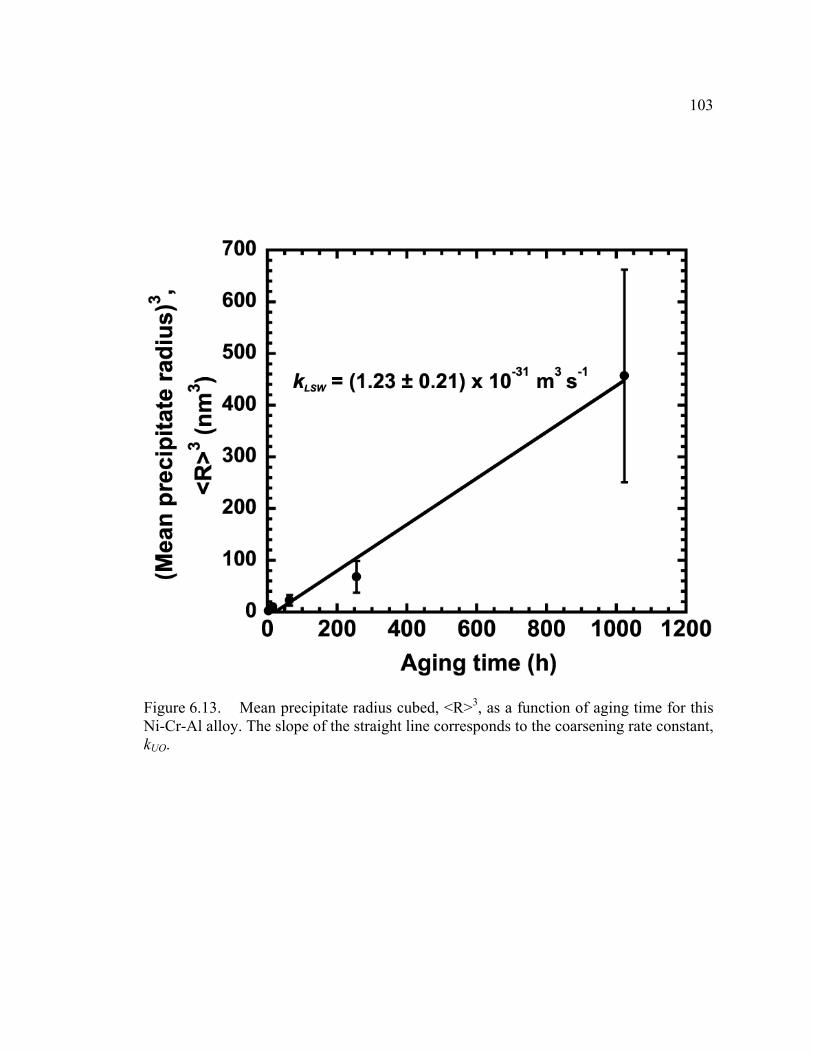
103
Figure 6.13. Mean precipitate radius cubed, <R>3, as a function of aging time for this Ni-Cr-Al alloy. The slope of the straight line corresponds to the coarsening rate constant, kUO.

104
The time exponents of <R> and ∆Ci of Cr and Al, obtained from the 3DAP
microscopy experiments, are in reasonably good agreement with the predictions of UO
theory. The time exponent of Nv, however, deviates considerably from the predicted
value of UO theory. A possible reason that causes this discrepancy is discussed in
Section 6.3.4. The time exponents for the γ−matrix and γ′−precipitates determined
employing 3DAP microscopy are listed in Table 6.6, compared with the theoretical
asymptotic predictions of UO theory.
The experimental coarsening rate constant, kUO, of Equation (2.1) is determined
by plotting <R(t)>3 as a function of aging time, which exhibits a linear relationship,
Figure 6.13. The slope of the linear regression line is kUO, (1.23 ± 0.21) × 10-31 m3 s-1.
This experimental value is in approximate agreement with previous research, 2.18×10⁻³¹
m3 s-1 [4]. In addition, the coarsening rate remains the same throughout the coarsening
regime and no abrupt increase in its value is observed, which indicates that the
γ′−precipitates retain their low interfacial free energy and coherency [107], to at least
1024 h.
6.3.4. Coagulation and coalescence of the γ′−precipitates
From the 3DAP microscopy reconstructions, it is clear that a fraction of the
γ′−precipitates are interconnected with other γ′−precipitates by necks at 0.25 h of aging
and the necks survive to an aging time of up to 256 h (Figure 6.2), which is an indication
that the cluster-diffusion-coagulation (CDC) mechanism is involved in the coarsening of

105
the precipitates [108-110]. Traditionally, it is believed that coarsening of precipitates is
accomplished by the so-called evaporation-condensation (EC) mechanism, which
involves a single atom evaporating from a shrinking smaller precipitate, diffusing to a
larger precipitate by random-walk diffusion, and then condensing on a growing larger
precipitate. The 3DAP microscopy results in concert with KMC simulations, however,
suggest that coarsening involves as well the CDC mechanism. This CDC mechanism
involves the formation of small clusters of solute atoms from the γ−matrix, which diffuse
and attach themselves to the growing precipitates, and then form necks between the
closely located growing precipitates. Kinetic Monte Carlo simulation results on a Ni-Cr-
Al alloy demonstrate that n-mers of Cr, Al, and Cr-Al have higher diffusivities, up to a
pentamer, than Cr or Al monomers (i.e. single atom) [111]. This implies that clusters of
Cr, Al, or Cr-Al atoms can arrive at growing γ′−precipitates before a monomer of Cr or
Al arrives, which suggests a CDC mechanism in parallel with an EC mechanism. UO
theory assumes implicitly that the coarsening of precipitates is achieved by an EC
mechanism. The results of 3DAP microscopy experiments and KMC simulation,
however, demonstrate that a CDC mechanism is also operating as well as an EC
mechanism in the Ni-Cr-Al alloy. As a result, we obtain the time exponent of Nv that is
different from the predicted value of UO theory of –1.
The fraction of the γ′−precipitates interconnected (χ) is determined as follow:
.
.
..
Totppt
interconppt
NN
=χ ; (6.5)

106
where ..
interconpptN is the total number of γ′−precipitates interconnected by necks with other
γ′−precipitates in the analyzed volume and ..
TotpptN is the total number of γ′−precipitates in
the analyzed volume. The values of χ demonstrate that the amount of coalescence first
increases with increasing aging time, reaches a peak value at 4 h of aging, and then
decreases as the aging time increases, Table 6.7 and Figure 6.14. This is expected since
Nv increases up to 4 h of aging and concomitantly the γ′−precipitates approach one
another, which facilitates the coalescence process by increasing the possibility of
clusters forming necks among the precipitates. After 4 h of aging, however, Nv decreases
and the γ′−precipitates are located further apart as coarsening progresses, which
decreases the probability of clusters forming necks lower between the γ′−precipitates at
longer aging times (Figure 6.7 (c) for the <λ>e-e as a function of aging time plot), at this
point the EC mechanism dominates. The temporal evolution of χ values displays the
trend in the relative level of CDC mechanism involvement in the precipitates coarsening.
Therefore, even when the χ value is zero (at 1024 h), the CDC mechanism may still be
engaged in the coarsening of the precipitates.
The solid solubility of each alloying element, )(' ∞→tCiγ , is determined at
infinite aging time and it is not affected by the CDC mechanism. In ∆Ci, the solid
solubility plays a major role; therefore the time exponent of ∆Ci is in reasonable
agreement with UO theory, regardless of the involvement of the CDC mechanism in the
coarsening of γ′−precipitates. The reason why the time exponent of <R> is in reasonable
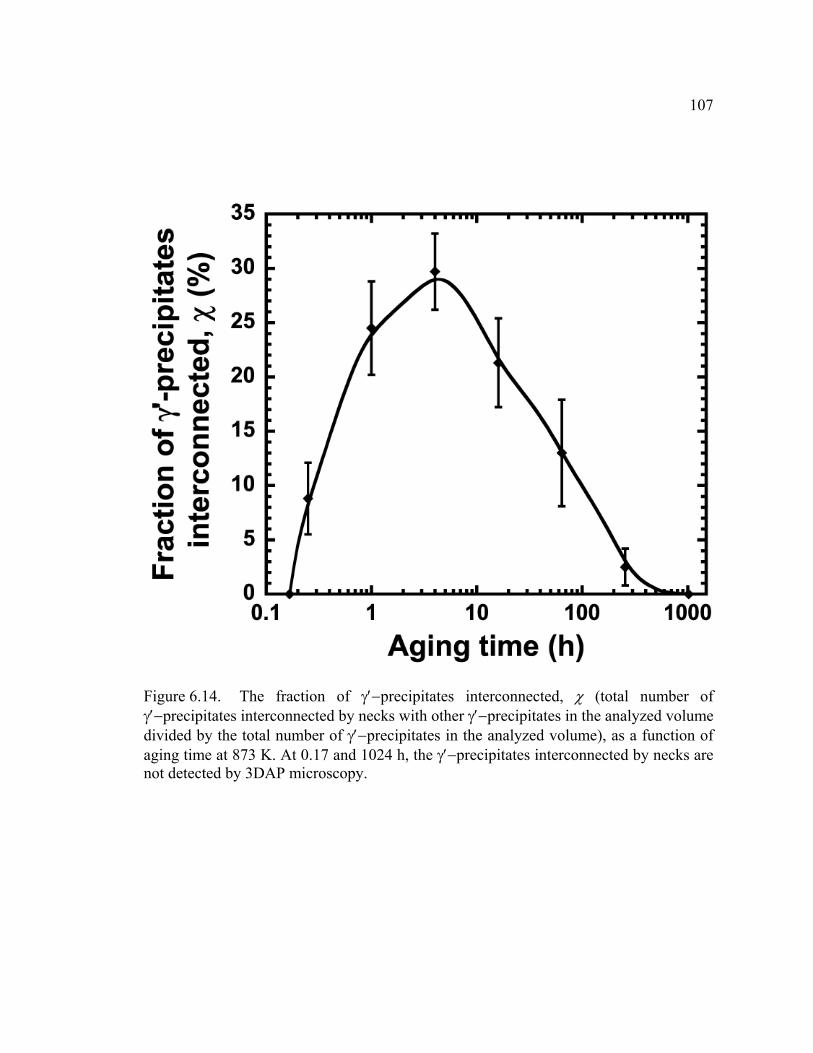
107
Figure 6.14. The fraction of γ′−precipitates interconnected, χ (total number of γ′−precipitates interconnected by necks with other γ′−precipitates in the analyzed volume divided by the total number of γ′−precipitates in the analyzed volume), as a function of aging time at 873 K. At 0.17 and 1024 h, the γ′−precipitates interconnected by necks are not detected by 3DAP microscopy.

108
Table 6.7. The fraction of γ′−precipitates interconnected, χ ( .
..
. / Totppt
interconppt NN=χ ), as
a function of aging time in hours. Aging
time (h) 0.17 0.25 1 4 16 64 256 1024
χ (%) ND* 8.8 ± 3.3 24.5 ± 4.3 29.7 ± 4.3 21.3 ± 4.1 13 ± 4.9 2.5 ± 1.7 ND* *ND: Not detected.

109
agreement with the theory is still under investigation.
6.4. Conclusions
Three-dimensional atom probe microscopy and CTEM are utilized to investigate
the temporal evolution of a Ni-14.2 at.% Cr-5.2 at.% Al alloy aged at 873 K from 0.03 to
1024 h. The nanostructure, chemistry, and coarsening kinetics of the Ni-Cr-Al alloy are
determined and analyzed as follows:
• In the as-quenched state, the γ′−precipitates are not found from 3DAP microscopy
results containing over 1.2 million atoms in a 15×15×128 nm3 volume. In addition,
diffraction patterns obtained employing CTEM do not exhibit superlattice reflections
resulting from L12-ordered γ′−precipitates, which confirms the 3DAP microscopy
results, Figure 6.1(a). These results indicate that no γ′−precipitation occurs during
quenching, due to the low to moderate supersaturations of Cr and Al.
• The spheroidal γ′−precipitates, with a mean radius, <R>, of approximately 0.74 nm
containing 150 atoms, are first observed after aging for 0.17 h, Figure 6.2. The <R>
values of the γ′−precipitates increase as the aging time increases. The number density,
Nv, values of the γ′−precipitates first increase with increasing aging time during the
nucleation, and nucleation and growth regimes. The Nv values reach a peak at an
aging time of 4 h. After 4 h, Nv values decrease with increasing aging time, as
anticipated. This suggests that the Ni-Cr-Al alloy is in the growth and coarsening
regime after an aging time of 4 h, and not in the pure coarsening regime, Figure 6.7.

110
• The 3DAP microscopy reconstructions demonstrate that the morphology of γ′-
precipitates remains spheroidal, even at the longest aging time of 1024 h (Figure 6.3),
while the γ′-precipitates in many Ni-based superalloys go through the sphere-to-cube
morphology transition during isothermal aging. In addition, CTEM micrographs of
the 1024 h aging time sample, taken along a [100] zone axis, also display the
spheroidal morphology of the γ′−precipitates, Figure 6.1 (b).
• The lattice parameter misfit, δ, value of the Ni-14.2 at.% Cr-5.2 at.% Al alloy is
estimated to be zero, while the value of δ in a Ni-Al binary alloy is estimated to be
0.57 %. Addition of Cr to Ni-Al alloys, therefore, makes a misfit-free state, resulting
in a reduction of the elastic strain energy between the γ′−precipitates and γ−matrix,
and therefore maintaining the spheroidal morphology of the γ′−precipitates for
extended aging times to minimize the dominant interfacial free energy.
• The concentrations of Cr and Al inside the γ′−precipitates decrease with a
concomitant increase of Ni concentration with increasing aging time, Figure 6.4.
This indicates that the γ′−precipitates may be precipitating from Cr-Al clusters. In
addition, changes occurring in the compositions of γ′−precipitates with increasing
aging time indicate that the alloy has not achieved a global steady-state, 0=
∂∂
tC .
The extrapolated equilibrium composition of the γ′−precipitates is Ni76.53Cr6.77Al16.69,
see Section 6.3.3 for details.
• Three-dimensional atom probe microscopy reconstructions display the partitioning
111
behavior of the alloying elements. This is determined quantitatively by calculating
the partitioning ratio, Κγ′/γ, for each element, which is the atomic concentration of an
element in the γ′−precipitates divided by the atomic concentration of this element in
the γ−matrix, Figure 6.6. Aluminum prefers the γ′−precipitates, while Ni and Cr
favor the γ−matrix. The temporal evolution of Κγ′/γ does not decelerate until after an
aging time of 256 h.
• The time exponents for coarsening are determined from the slopes of log-log plots of
the <R> and Nv values of γ′−precipitates (Figure 6.7), and the matrix supersaturation,
∆Ci ( )()( ∞→−=∆ tCtCC iiiγγ ), of Cr and Al as a function of aging time (Figure
6.11). The measured time exponents are 0.30 ± 0.04 (<R> vs. t), –0.64 ± 0.06 (Nv vs.
t), and –0.31 ± 0.04 for Cr and –0.33 ± 0.02 for Al (∆Ci vs. t). The experimental
results are consistent with the results of KMC simulations [96]. In addition, the time
exponents obtained from 3DAP microscopy for <R> and ∆Ci are in approximate
agreement with the predictions of Umantsev-Olson (UO) theory (1/3 and –1/3,
respectively). The experimental time exponent for Nv, however, deviates
significantly from the predicted UO value of –1. The time exponents for the
concentration differences in γ′−precipitates are also obtained, –0.38 ± 0.06 for Cr and
–0.38 ± 0.10 for Al.
• The coarsening rate constant, kUO, of this Ni-Cr-Al alloy, (1.23 ± 0.21)×10-31 m3 s-1
(Figure 6.13), is in approximate agreement with the value measured from previous

112
research [4], 2.18×10⁻³¹ m3 s-1.
• The 3DAP microscopy reconstructions demonstrate that some γ′−precipitates are
interconnected with other γ′−precipitates by necks for aging times as long as 256 h.
The fraction of γ′−precipitates interconnected, χ ( ..
.. / Tot
pptinterconppt NN=χ ), is increasing
with increasing aging time, reaching a peak value after 4 h of aging, and then
decreasing with increasing aging time, Figure 6.14. This, in concert with KMC
simulations, constitutes evidence that coarsening of the γ′−precipitates is the result of
the so-called cluster-diffusion-coagulation (CDC) mechanism, as well as the
evaporation-condensation (EC) mechanism implicit to UO theory. In addition, the
CDC mechanism constitutes a possible reason for the measured deviation of the time
exponent for the Nv (–0.64 ± 0.06) of the γ′−precipitates from the UO value of –1.

113
Chapter Seven
Effects of Re addition on the temporal evolution of
the Ni-8.5 at.% Cr-10 at.% Al-2 at.% Re alloy
7.1. Introduction
The refractory elements, such as W, Mo, Ta, and Re, have been in the center of
focus since late 1970s for the development of single crystal turbine blades, and they have
improved the high temperature properties of Ni-based superalloys significantly [112-
117]. The optimum mechanical properties of single crystal blades are achieved by
increasing the total amounts of refractory elements. Recent third generation Ni-based
superalloys, such as CMSX-10 and René N6, have higher Re concentration to obtain
higher operating temperatures of the order of 85% of the absolute melting temperature of
the alloy, even though large amounts of the heavy refractory elements increase the
density of the alloys. In spite of the improvement of mechanical properties of Ni-based
superalloys utilizing the addition of refractory elements, their effects on the
microstructure of superalloys are mostly unidentified.
We added 2 at.% Re to Ni-8.5 at.% Cr-10 at.% Al alloy to study its effects on the
temporal evolution of a Ni-Cr-Al alloy, aged at 1073 K for times ranging from 0.25 to
264 h. It is believed that Re segregates at the γ/γ′ interfaces and retards the coarsening of
γ′−precipitates at elevated temperatures [113], therefore increasing the creep resistance
of Ni-based superalloys [112, 114]. Three-dimensional atom probe (3DAP) microscopy

114
has been utilized to investigate the temporal evolution of γ′−precipitates, partitioning
between the γ−matrix and the γ′−precipitates, and interfacial segregation behavior of
alloying elements at the γ/γ′ interfaces, as well as the temporal dependence of the matrix
supersaturation, ∆Ci. Conventional TEM was employed to study the coarsening of
γ′−precipitates, specifically morphological evolution, mean radius, <R>, and number
density, Nv, of γ′−precipitates as a function of aging time. The experimental coarsening
kinetics of γ′−precipitates investigated by both TEM and 3DAP microscopies are
compared with UO theory.
The present study is part of a systematic program to study the effects of
refractory elemental additions (Ta, W, Re and/or Ru) on the temporal evolution of the
nanostructure and chemistry of a Ni-8.5 at.% Cr-10 at.% Al alloy. The results of the
present study are compared with the results of Ni-8.5 at.% Cr-10 at.% Al and Ni-8.5
at.% Cr-10 at.% Al-2 at.% W alloys aged at 1073 K [90].
7.2. Results
7.2.1. Conventional transmission electron microscopy
The CTEM micrographs (Figure 7.1) exhibit spheroidal γ′−precipitates (L12) in a
γ−matrix (FCC). Note the presence of superlattice reflections from L12 precipitates, in
the inset diffraction pattern, which reside between the strong reflections from the
γ−matrix (FCC) even for the as-quenched sample, Figure 7.1 (a). The morphology of
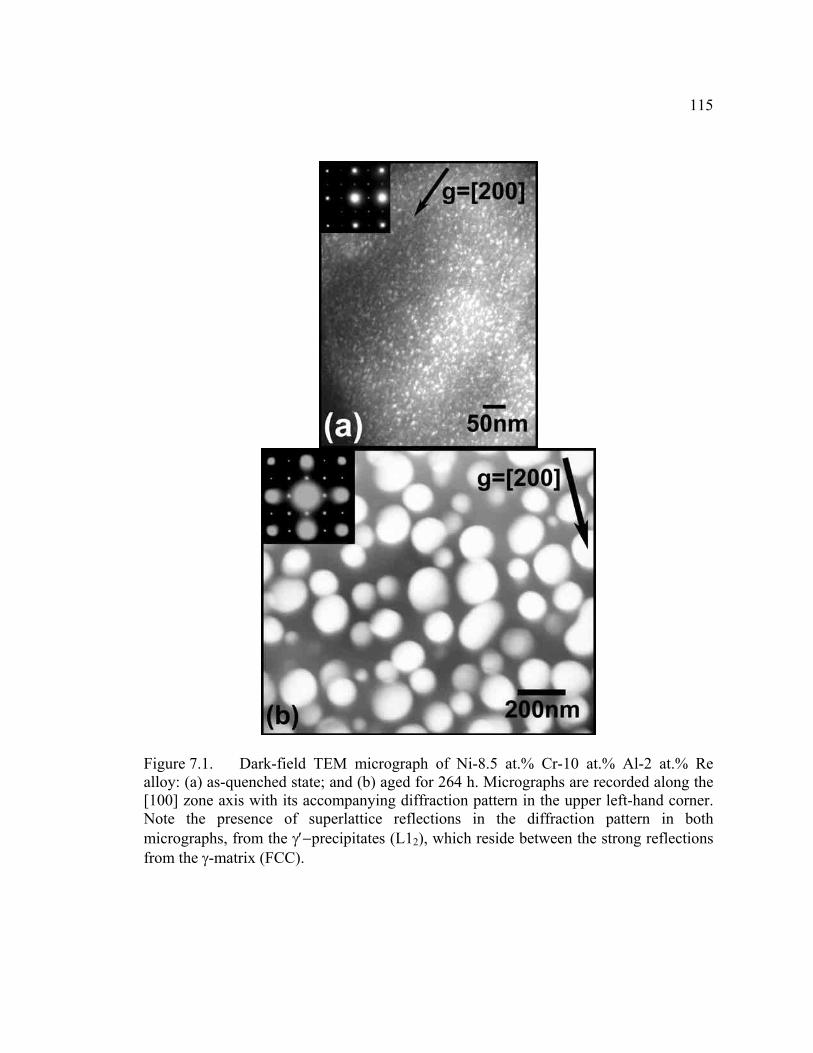
115
Figure 7.1. Dark-field TEM micrograph of Ni-8.5 at.% Cr-10 at.% Al-2 at.% Re alloy: (a) as-quenched state; and (b) aged for 264 h. Micrographs are recorded along the [100] zone axis with its accompanying diffraction pattern in the upper left-hand corner. Note the presence of superlattice reflections in the diffraction pattern in both micrographs, from the γ′−precipitates (L12), which reside between the strong reflections from the γ-matrix (FCC).

116
γ′−precipitates remains spheroidal up to the longest aging time of 264 h, Figure 7.1 (b).
In Figure 7.2, TEM micrographs present the precipitate morphology as a function of
aging time at 1073 K. The spheroidal morphology of γ′−precipitates is preserved at all
aging times. Table 7.1 lists the properties of γ′−precipitates measured utilizing CTEM as
a function of aging time. The values of <R> increase, while Nv values decrease with
increasing aging time, as anticipated, Figure 7.3 (a) and (b). The mean center-to-center
interprecipitate distance, <λ>c-c, is obtained from the number density of precipitates,
utilizing Equation (6.1) ( ( ) 3/1)43/(12 vcc Nπλ ⋅=>< − ). The mean edge-to-edge
interprecipitate distance, <λ>e-e, is calculated from Equation (6.2)
( ><−>=<>< −− Rccee 2λλ ). The values of <λ>e-e as a function of aging time are
plotted in Figure 7.3 (c). As Nv decreases with increasing aging time, <λ>e-e increases as
anticipated. The interfacial velocity of the γ′−precipitates, v, is derived from the
measured <R> values of the γ′−precipitates, employing:
dtRdv /><= . (6.3)
Figure 7.4 shows v decreasing to a small value with increasing aging time; at 264 h, v is
3.28×10⁻² nm h-1. The Vf of γ′−precipitates versus aging time is shown in Figure 7.5. It
converges to approximately 25 vol.% with increasing aging time, which agrees with the
results obtained by the phase extraction method, Table 5.1. The coarsening kinetics of
the Ni-8.5 at.% Cr-10 at.% Al-2 at.% Re alloy is discussed in Sections 7.2.3 and 7.3.6 in
detail.
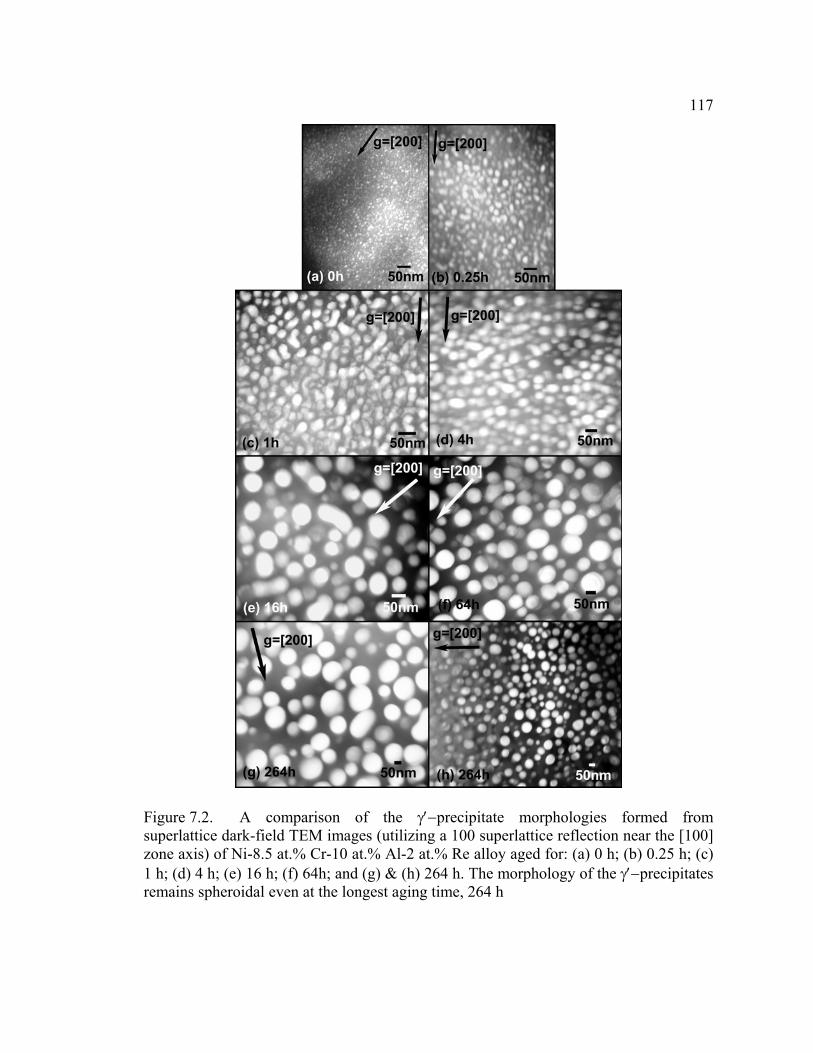
117
Figure 7.2. A comparison of the γ′−precipitate morphologies formed from superlattice dark-field TEM images (utilizing a 100 superlattice reflection near the [100] zone axis) of Ni-8.5 at.% Cr-10 at.% Al-2 at.% Re alloy aged for: (a) 0 h; (b) 0.25 h; (c) 1 h; (d) 4 h; (e) 16 h; (f) 64h; and (g) & (h) 264 h. The morphology of the γ′−precipitates remains spheroidal even at the longest aging time, 264 h

118
Tabl
e 7.
1.
Det
aile
d re
sults
of
conv
entio
nal
TEM
inv
estig
atio
ns o
f th
e γ′
−pre
cipi
tate
s as
a f
unct
ion
ofag
ing
time
in h
ours
.
* A
spec
t rat
io =
max
imum
cal
iper
dia
met
er/m
inim
um c
alip
er d
iam
eter
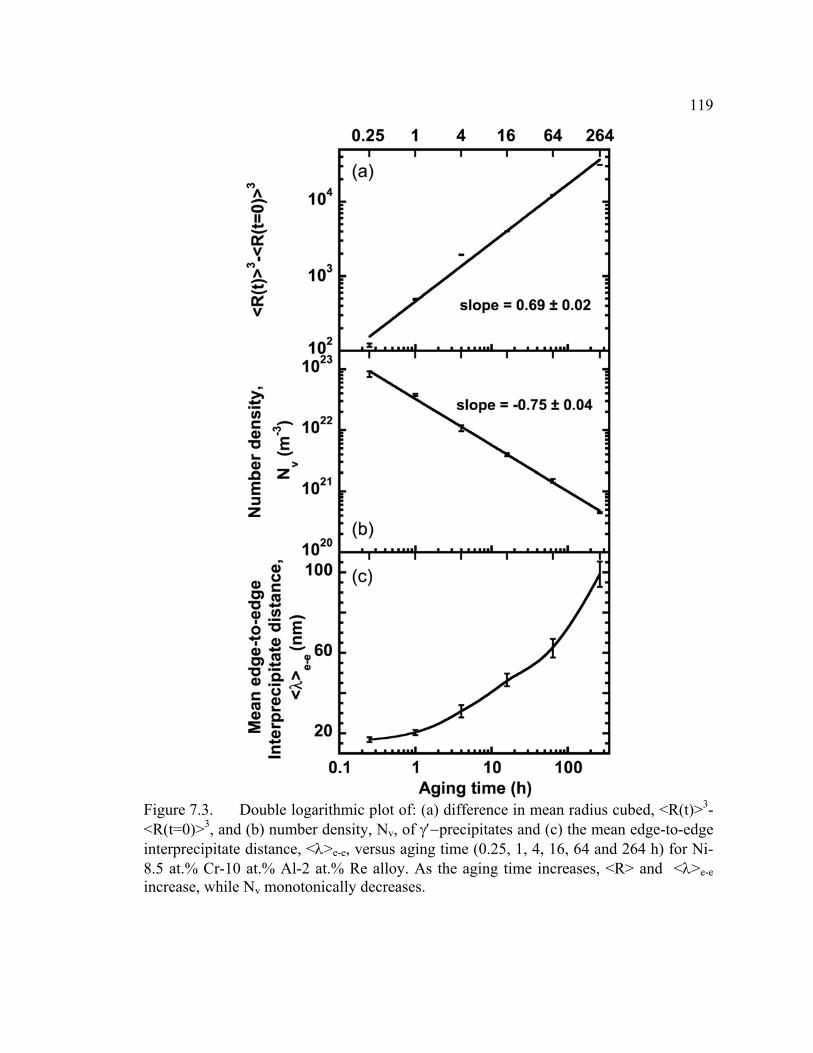
119
Figure 7.3. Double logarithmic plot of: (a) difference in mean radius cubed, <R(t)>3-<R(t=0)>3, and (b) number density, Nv, of γ′−precipitates and (c) the mean edge-to-edge interprecipitate distance, <λ>e-e, versus aging time (0.25, 1, 4, 16, 64 and 264 h) for Ni-8.5 at.% Cr-10 at.% Al-2 at.% Re alloy. As the aging time increases, <R> and <λ>e-e increase, while Nv monotonically decreases.
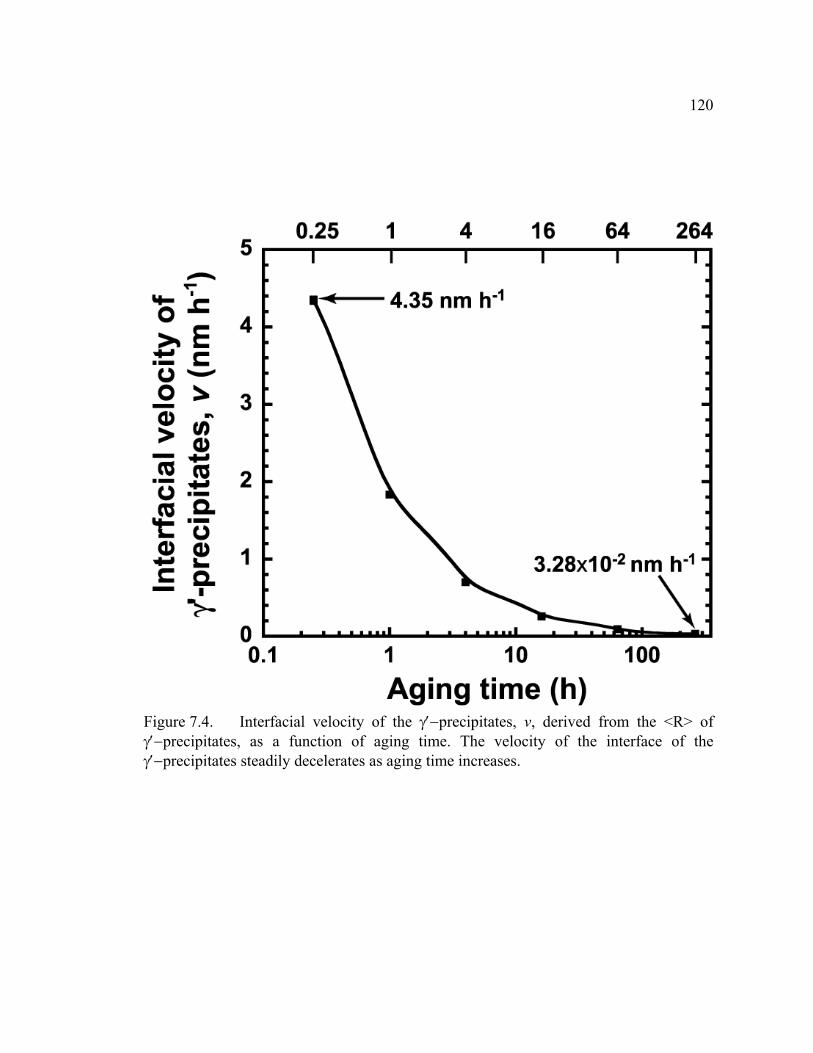
120
Figure 7.4. Interfacial velocity of the γ′−precipitates, v, derived from the <R> of γ′−precipitates, as a function of aging time. The velocity of the interface of the γ′−precipitates steadily decelerates as aging time increases.

121
Figure 7.5. Volume fraction, Vf, of γ′−precipitates versus aging time, which converges to approximately 25 vol.% with increasing aging time. This is in reasonable agreement with the result obtained from the phase extraction method, Table 5.1 (b).

122
The precipitate size distribution (PSD) is a histogram, which is a plot of the
distribution function (g(R/<R>, t), where R is the radius of the γ′−precipitate) as a
function of normalized precipitate radius (u = R/<R>), as displayed in Figure 7.6 for
each aging time. First, PSDs of experimental results for all aging times are compared
with superimposed calculated PSDs according to LSW (solid line) theory and Brailsford-
Wynblatt (BW) model (dotted line) [118]. The BW model incorporates the effects of
non-zero Vf of precipitates into coarsening theory; it lowers the peak height and
broadens the width of the distribution compared with the LSW distribution. Initially, the
peak heights of our experimental PSDs are greater than the predicted values for both
LSW theory and BW model and the normalized radii for the maximum values of
g(R/<R>) are smaller than unity. In addition, our PSDs are narrower than the predictions
of both theories. As the aging time increases, however, the maximum values of
experimental g(R/<R>) are shifted to larger normalized radii, which are closer to unity.
In addition, the peak heights decrease and distributions broaden to yield PSD shapes that
are similar to those of LSW theory. At later aging times, the broadness of our
experimental PSDs is comparable to the width of the BW model, however the peak
heights are still greater than the value predicted by BW model. In Table 7.2, the first four
moments of the PSDs determined from CTEM investigations are presented, which
quantitatively yield the shape evolution of PSDs with respect to increasing aging time.

123
Figure 7.6. Precipitate size distributions (PSDs) of Ni-8.5 at.% Cr-10 at.% Al-2 at.% Re alloy aged for 0, 0.25, 1, 4, 16, 64 and 264 h, in which histograms of the distribution function are plotted as a function of normalized radius, u = R/<R>. Precipitate size distributions for the LSW theory and BW model are superimposed for comparison. The shape of the experimental PSDs changes as aging time increases, which disagrees with the time-invariant shape of LSW theory. In addition, the experimental PSDs do not agree with the prediction of the non-zero volume fraction corrected BW model.

124
Table 7.2. Characteristic precipitate size distribution parameters from CTEM investigations of γ′−precipitates as a function of aging time in hours.
Time (h) No. ppts. (n)
Mean radius (<R>, nm)
Standard deviation (σ) Skewness+ Kurtosis*
0 391 4.18 ± 0.06 0.135 1.313 ± 0.109 7.664 ± 1.120 0.25 1025 5.77 ± 0.07 0.132 0.403 ± 0.042 2.382 ± 0.335
1 1305 8.26 ± 0.12 0.161 -0.132 ± -0.016 2.896 ± -0.134 4 1151 12.61 ± 0.23 0.197 -0.197 ± -0.022 5.009 ± -0.245 16 365 15.98 ± 0.28 0.188 -0.536 ± -0.070 4.168 ± -0.633 64 407 23.14 ± 0.39 0.178 -0.733 ± -0.115 1.710 ± -0.820 264 294 31.47 ± 0.62 0.215 -0.511 ± -0.097 1.434 ± -0.690
31
3)(Skewness
σn
Rxn
ii∑ ><−
= =+; 4
1
4)(Kurtosis*
σn
Rxn
ii∑ ><−
= =

125
7.2.2. Three-dimensional atom probe microscopy
Spheroidal γ′−precipitates, <R> = 3.89 nm, are observed in the as-quenched alloy
and this is due to the high supersaturations of Cr and Al. The three-dimensional
reconstruction of a volume of 16×16×130 nm3, containing over 1.5 million atoms,
confirms the presence of the γ′−precipitates in the as-quenched state sample (Figure 7.7),
which is consistent with the CTEM results – Figure 7.1 (a). In Figure 7.7, Al atoms are
in red, Cr atoms in blue, and Re atoms in orange, while the Ni atoms are not shown for
the sake of clarity. In addition, the partitioning behavior of all the elements is visualized
employing a three-dimensional reconstruction of the data. Al partitions, of course, to
γ′−precipitates, while Ni, Cr and Re prefer the γ−matrix. Figure 7.8 displays the three-
dimensional reconstructions as a function of aging time, which clearly visualizes the
coarsening of the precipitates.
The temporal evolution of elemental concentrations in both the γ−matrix and
γ′−precipitates is investigated employing the proxigrams. The proxigrams of Ni, Cr, and
Al for 0, 0.25, 1, and 264 h are displayed in Figure 7.9. Significant changes in
proxigrams occur during the early aging times (0 to 1 h) while only small changes occur
after 1 h. Therefore, the proxigrams for 4, 16, and 64 h are not presented here. The
concentrations of Ni and Cr increase in the γ−matrix, while that of Al decreases, with
increasing aging time. Conversely, the concentration of Al increases in γ′−precipitates,
while those of Ni and Cr decrease, with increasing aging time.

126
Figu
re 7
.7.
Thre
e-di
men
sion
al a
tom
pro
be m
icro
scop
y re
cons
truct
ion
of N
i-8.5
at.%
Cr-
10 a
t.% A
l-2 a
t.% R
eal
loy
(con
tain
ing
1.5
mill
ion
atom
s in
a 1
6×16
×130
nm
3 par
alle
lepi
ped)
in
as-q
uenc
hed
stat
e, w
hich
ind
icat
es t
hepr
esen
ce o
f the
γ′−
prec
ipita
tes;
Cr a
tom
s ar
e sh
own
in b
lue,
Al a
tom
s in
red,
and
Re
atom
s in
ora
nge,
whi
le N
i ato
ms
are
not s
how
n fo
r the
sak
e of
cla
rity.
A 1
2 at
.% A
l iso
conc
entra
tion
surf
ace
is u
sed
to in
dica
te th
e γ/
γ′ in
terf
aces
. Afr
actio
n of
the
γ′−
prec
ipita
tes
is i
nter
conn
ecte
d by
nec
ks. A
por
tion
of a
γ′−
prec
ipita
te i
s m
agni
fied
with
onl
y A
lat
oms
show
n to
dis
play
the
alte
rnat
ing
Al p
lane
s in
the
[100
] dire
ctio
n of
ord
ered
L1 2
stru
ctur
e. T
his
resu
lt in
dica
tes
that
pha
se se
para
tion
and
orde
ring
of γ
′−pr
ecip
itate
s occ
ur d
urin
g th
e qu
ench
from
125
3 K
.

127
Figu
re 7
.8.
Thre
e-di
men
sion
al a
tom
pro
be m
icro
scop
y of
Ni-8
.5 a
t.% C
r-10
at.%
Al-2
at.%
Re
allo
y fo
r a s
erie
s of
agin
g tim
es d
ispl
ayin
g th
e te
mpo
ral e
volu
tion
of th
e γ′
−pre
cipi
tate
s. Ea
ch re
cons
truct
ion
is a
sub
set o
f res
ults
ext
ract
edfr
om t
he e
ntire
vol
ume
to c
reat
e a
10×1
0 nm
2 cro
ss-s
ectio
n fo
r co
mpa
rison
as
a fu
nctio
n of
agi
ng t
ime.
The
cro
ss-
sect
ion
of th
e vo
lum
e is
per
pend
icul
ar to
the
plan
e of
pag
e. T
he c
olor
-cod
ing
of th
e at
oms
is th
e sa
me
as in
Fig
ure
7.7.
This
figu
re q
ualit
ativ
ely
exhi
bits
the
incr
ease
in th
e m
ean
radi
us, <
R>,
and
dec
reas
e in
the
num
ber d
ensi
ty, N
v, of
the
γ′−p
reci
pita
tes a
s a fu
nctio
n of
incr
easi
ng a
ging
tim
e.

128
Figure 7.9. Proxigrams of Ni, Cr, and Al for four different aging times (0, 0.25, 1, and 264 h). The graphs exhibit the temporal evolution of each elemental concentration in both γ−matrix and γ′−precipitates. With increasing aging time, the concentrations of Ni and Cr increase but the Al concentration decreases in γ−matrix. The opposite behavior is observed for the γ′−precipitates.

129
The compositions of the γ−matrix and γ′−precipitates are listed in Tables 7.3 and
7.4 as a function of aging time. They are determined by counting the number of atoms
associated with each phase as differentiated by the inflection point in the proxigrams,
which is the threshold value for the isoconcentration surface, 12 at.% Al. After aging at
1073 K for times ranging from 0.25 to 264 h, it is observed that the alloy exhibits only
small changes in its chemistry after 1 h. Since the precipitates are larger than the analysis
volume after 0.25 h, they are all cut by it. The exact radii of the γ′−precipitates, therefore,
cannot be measured accurately using conventional 3DAP microscopy, where a typical
run is approximately 2×10⁶ atoms.
From the γ−matrix and γ′−precipitate compositions, the partitioning ratio, Κγ′/γ, is
determined quantitatively. It is defined to be the ratio of the atomic concentration of an
element in the γ′−precipitates divided by the atomic concentration of the same element in
the γ−matrix; Κγ′/γ values as a function of time are listed in Table 7.5. A Κγ′/γ value
greater than unity indicates partitioning of a solute to the γ′−precipitates, while a value
smaller than unity indicates partitioning of a solute to the γ−matrix. As qualitatively
observed in Figures 7.7 and 7.8, Al favors the γ′−precipitates whereas, Ni, Cr and Re all
partition to the γ−matrix.
Interfacial solute segregation in a ternary or higher alloy is quantified employing
the relative Gibbsian interfacial excess of element i with respect to other elements,
RelativeiΓ . It is calculated from the relative Gibbs adsorption isotherm [51-53]:

130
Table 7.3. Compositions (at.%) of γ−matrix (FCC) determined by 3DAP microscopy as a function of aging time in hours. Time (h) Ni Cr Al Re
0 80.540 ± 0.110 9.680 ± 0.080 7.740 ± 0.070 2.040 ± 0.040 0.25 80.770 ± 0.080 9.730 ± 0.030 7.400 ± 0.050 2.100 ± 0.030
1 80.829 ± 0.092 9.956 ± 0.070 7.082 ± 0.060 2.133 ± 0.034 4 80.995 ± 0.099 9.953 ± 0.075 6.931 ± 0.064 2.122 ± 0.036 16 80.909 ± 0.071 9.955 ± 0.054 6.979 ± 0.046 2.157 ± 0.026 64 81.086 ± 0.158 9.894 ± 0.121 6.838 ± 0.102 2.182 ± 0.059 264 81.000 ± 0.150 10.000 ± 0.110 6.860 ± 0.090 2.140 ± 0.050
Table 7.4. Compositions (at.%) of γ′−precipitate (L12) determined by 3DAP microscopy as a function of aging time in hours. Time (h) Ni Cr Al Re
0 76.170 ± 0.170 6.460 ± 0.100 15.600 ± 0.140 1.770 ± 0.050 0.25 76.330 ± 0.150 5.460 ± 0.080 16.920 ± 0.130 1.290 ± 0.040
1 76.770 ± 0.110 5.040 ± 0.060 17.190 ± 0.100 1.000 ± 0.030 4 76.713 ± 0.163 5.055 ± 0.086 17.285 ± 0.145 0.976 ± 0.037 16 76.660 ± 0.080 4.990 ± 0.040 17.440 ± 0.070 0.930 ± 0.020 64 76.396 ± 0.140 5.069 ± 0.072 17.570 ± 0.126 0.935 ± 0.032 264 76.312 ± 0.293 5.227 ± 0.153 17.612 ± 0.262 0.849 ± 0.063
Table 7.5. Partitioning ratio (Κγ′/γ, the atomic concentration of an element in the γ′−precipitates divided by the atomic concentration of the same elements in the γ−matrix) of Ni-Cr-Al-Re alloy as a function of aging time in hours. Time (h) Ni Cr Al Re
0 0.9457 ± 0.0025 0.6674 ± 0.0117 2.0155 ± 0.0257 0.8676 ± 0.0298 0.25 0.9450 ± 0.0021 0.5612 ± 0.0084 2.2865 ± 0.0234 0.6143 ± 0.0210
1 0.9498 ± 0.0017 0.5063 ± 0.0070 2.4272 ± 0.0250 0.4689 ± 0.0159 4 0.9471 ± 0.0023 0.5079 ± 0.0094 2.4939 ± 0.0312 0.4600 ± 0.0192 16 0.9475 ± 0.0013 0.5013 ± 0.0048 2.4988 ± 0.0192 0.4312 ± 0.0106 64 0.9422 ± 0.0025 0.5124 ± 0.0096 2.5694 ± 0.0424 0.4284 ± 0.0188 264 0.9421 ± 0.0040 0.5227 ± 0.0164 2.5673 ± 0.0509 0.3967 ± 0.0309
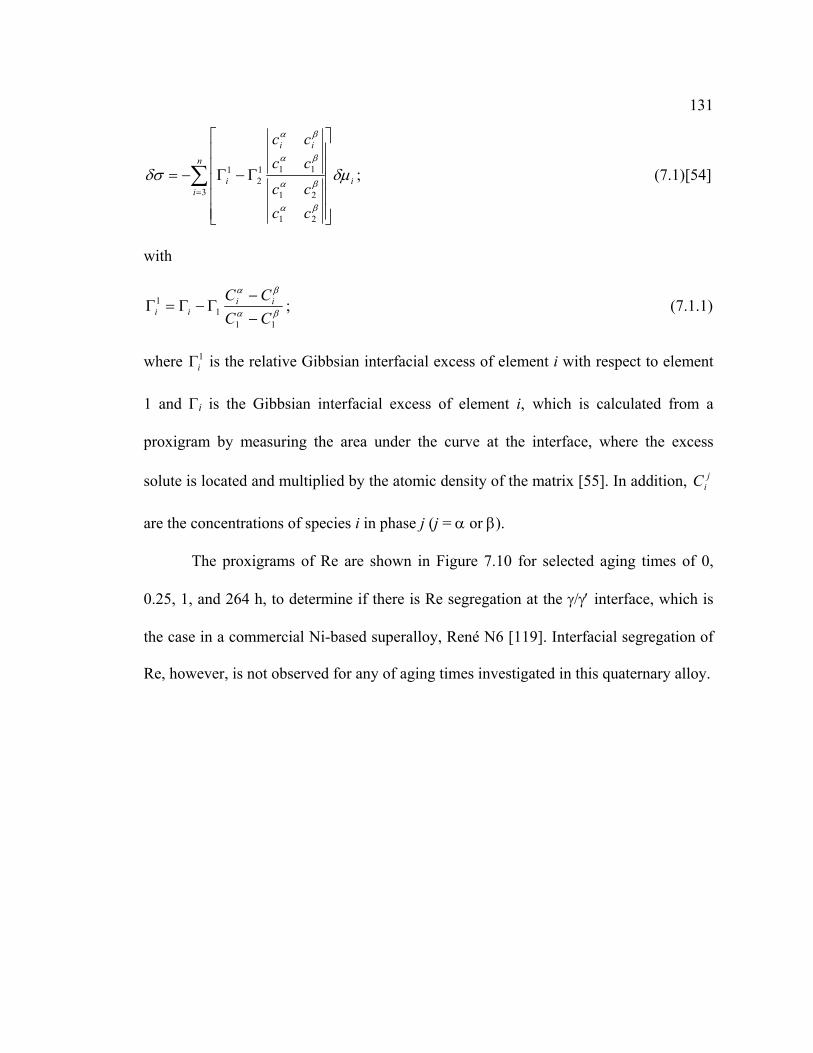
131
i
n
i
ii
i
cccccccc
δµδσ
βα
βα
βα
βα
∑=
Γ−Γ−=3
21
21
1112
1 ; (7.1)[54]
with
βα
βα
111
1
CCCC ii
ii −−
Γ−Γ=Γ ; (7.1.1)
where 1iΓ is the relative Gibbsian interfacial excess of element i with respect to element
1 and Γi is the Gibbsian interfacial excess of element i, which is calculated from a
proxigram by measuring the area under the curve at the interface, where the excess
solute is located and multiplied by the atomic density of the matrix [55]. In addition, jiC
are the concentrations of species i in phase j (j = α or β).
The proxigrams of Re are shown in Figure 7.10 for selected aging times of 0,
0.25, 1, and 264 h, to determine if there is Re segregation at the γ/γ′ interface, which is
the case in a commercial Ni-based superalloy, René N6 [119]. Interfacial segregation of
Re, however, is not observed for any of aging times investigated in this quaternary alloy.

132
Figure 7.10. A series of Re proxigrams displaying the temporal evolution of Re. Contrary to the result for a commercial Ni-based superalloy, René N6, there is no significant Re interfacial segregation at the γ/γ′ interface. Negative distance is into the γ−matrix, while positive distance is into the γ′−precipitates. The broad Re profile across the γ/γ′ interface of the as-quenched state becomes significantly sharper with increasing aging time.

133
7.2.3. Coarsening of the γ′−precipitates
The three asymptotic solutions of UO theory for a quaternary alloy are expressed
for <R>, Nv, and ∆Ci, respectively, as follows [36]:
tkRtR UO=><−>< 33 )0()( ; (7.2)
with
( ) ( ) ( )
−+
−+
−=
Re
ReRe
Al
AlAl
Cr
CrCr
mUO
DkC
DkC
DkC
TR
Vk
222 1119
8γγγ
σ; (7.2.1)
1)( −Κ= ttN UOv ; (7.3)
with
( ) ( ) ( )
σπ
γγγ
4
1113
222
−+−+−
=Κ Re
ReReAl
Al
AlCr
Cr
Crf
UO
DkC
kDC
kDC
VTR; (7.3.1)
[ ] 3/1)()( −=∞→− ttCtC UOii κγγ ; (7.4)
with
( ) ( ) ( ) ( )3/12
223/2 1113
−+−+−=
Re
ReReAl
Al
AlCr
Cr
CrmUO D
kCk
DC
kDC
TRVγγγ
σκ . (7.4.1)
In Equation (7.2), <R(t)> is the mean precipitate radius at time t, <R(0)> is the mean
precipitate radius at t = 0, and kUO is the coarsening rate constant for the mean radius of
γ′−precipitates. In Equation (7.2.1), σ is the interfacial free energy, Vm is the molar
volume of the γ′−precipitates, Rg is the ideal gas constant, T is the aging temperature, Di

134
and γiC are the diffusion coefficient and the equilibrium solubility of the ith solute in the
γ−matrix, and ki is the distribution coefficient of the ith solute between the γ−matrix and
γ′−precipitates and is defined by γγii CC /' . In Equation (7.3), ΚUO is the coarsening rate
constant for the Nv of precipitates and Vf is the γ′−precipitate volume fraction. In
Equation (7.4), )(tCiγ is the composition of ith component in matrix at time t,
)( ∞→tCiγ is the equilibrium solid-solubility of the ith component in the γ−matrix, and
κUO is the coarsening rate constant for the matrix supersaturation. The quantity in the
bracket on the left-hand side of Equation (7.4) is denoted the matrix supersaturation of
solute element i (∆Ci).
The values of <R(t)>3-<R(t=0)>3 of γ′−precipitates are plotted as a function of
aging time as shown in Figure 7.3 (a), which has a time exponent of 0.69 ± 0.02, as
compared with the time exponent of 1 predicted by UO theory. The time exponent for Nv
is determined from the slope of the curve in Figure 7.3 (b), which is a plot of Nv of the
γ′−precipitates versus aging time. The exponent is –0.75 ± 0.04, as compared with the
predicted value of –1. Both <R> and Nv are obtained from CTEM experiments. Finally,
the time exponent for the ∆Ci is obtained from the 3DAP microscopy results. First,
Figure 7.11 exhibits the concentration of Cr, Al, and Re in the γ–matrix measured from
the plateau region of a proxigram, far away from the γ/γ′ interfaces, as a function of
(aging time)-1/3. Note that the concentrations of Cr and Re increase linearly, while the Al

135
Figure 7.11. γ−matrix concentrations of Cr, Al, and Re far away from the γ/γ′ interface measured by 3DAP microscopy as a function of (aging time)-1/3 at 1073 K. The extrapolated intercepts on the ordinate axis, to infinite time, correspond to the equilibrium solid-solubility of these solutes in the γ−matrix.

136
concentration decreases with increasing aging time. The extrapolated intercept on the
ordinate axis, at infinite time, corresponds to the equilibrium solute solid-solubility in
the γ-matrix. The extrapolated equilibrium composition of the γ-matrix derived from the
Figure 7.11 is Ni81.07Cr10.04Al6.74Re2.15. Employing the same method, the equilibrium
composition of the γ′−precipitates also can be extrapolated by plotting the concentration
of each element with respect to (aging time)-1/3, Figure 7.12. It is determined to be
Ni76.17Cr4.97Al18.05Re0.81. The equilibrium compositions of the γ−matrix and
γ′−precipitates, determined by extrapolation, are listed in Table 7.6 with the overall
composition of the alloy. Using the solid-solubilities obtained from Figure 7.11, the time
exponent for Cr, Al, and Re is determined from the slope of the ∆Ci versus aging time,
log-log plots in Figure 7.13. The time exponents are –0.28 ± 0.01 for Cr, –0.33 ± 0.02
for Al, and –0.22 ± 0.03 for Re, as compared with the predicted UO value of –1/3.
Utilizing the same method, we can calculate the time exponents for the
concentration differences in γ′−precipitates, [ ])()( '' ∞→− tCtC iiγγ , of Cr, Al, and Re by
plotting the concentration differences as a function of aging time at 1073 K, Figure 7.14.
The time exponents are –0.30 ± 0.04 for Cr, –0.32 ± 0.06 for Al, and –0.36 ± 0.01 for
Re.

137
Figure 7.12. The γ′−precipitates concentrations of Cr, Al, and Re measured by 3DAP microscopy as a function of (aging time)-1/3 at 1073 K. The extrapolated intercepts on the ordinate axis, to infinite time, correspond to the equilibrium concentration of these solutes in the γ′−precipitates.

138
Table 7.6. Overall composition (at.%) of the Ni-Cr-Al-Re alloy and extrapolated equilibrium compositions of the γ−matrix and γ′−precipitates as determined from Figures 7.11 and 7.14. Time (h) Ni Cr Al Re Overall 79.5 8.5 10 2 γ-matrix 81.07 ± 0.08 10.04 ± 0.02 6.74 ± 0.04 2.15 ± 0.01 γ'-ppts. 76.17 ± 0.13 4.97 ± 0.05 18.05 ± 0.09 0.81 ± 0.02
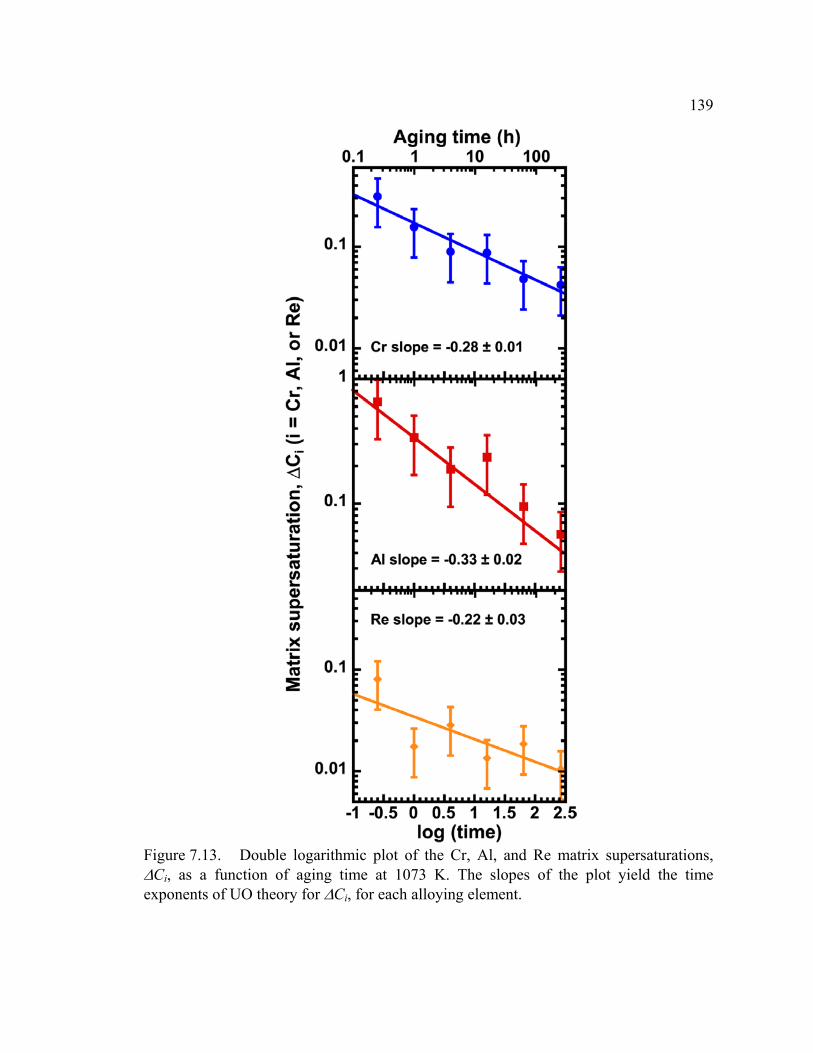
139
Figure 7.13. Double logarithmic plot of the Cr, Al, and Re matrix supersaturations, ∆Ci, as a function of aging time at 1073 K. The slopes of the plot yield the time exponents of UO theory for ∆Ci, for each alloying element.

140
Figure 7.14. Double logarithmic plots of the concentration difference in γ′−precipitates, [ ])()( '' ∞→− tCtC ii
γγ , of Cr, Al, and Re as a function of aging time at 1073 K. The
slope of the plots yield the time exponents for the [ ])()( '' ∞→− tCtC iiγγ , for each
alloying element.

141
7.3. Discussions
7.3.1. Morphological evolution of the γ′−precipitates
In many Ni-based alloys (e.g. Ni-Al, Ni-Si, and Nimonic 115 alloys), the
morphology of γ′−precipitates changes from sphere-to-cube to clover leaves, which
finally split into eight small cuboidal precipitates (i.e. ogdoad) during the coarsening
process [101-104]. The interfacial and elastic energies of the γ′−precipitates are the
sources of this morphological evolution and the balance between the two determines the
morphology of precipitates. For small precipitates, the precipitate surface-area-to-
volume ratio is large and the morphology of precipitates is determined by the
minimization of the dominant interfacial free energy, making the precipitates spheroidal.
Alternatively, when precipitates become large, the ratio of precipitate surface-area-to-
volume is small and the elastic strain energy, arising from accommodating lattice
mismatch at the interface, determines the morphology. In the case of Ni-based
superalloys, where the γ′−precipitates are elastically stiffer than the γ−matrix, the
precipitates become cuboidal as their radii increase. If, however, the matrix is stiffer
than the precipitates then they prefer a plate morphology [34].
Unlike most Ni-based superalloys, whose γ′−precipitates appear to be cuboidal
and align along [100]-type directions in the later stage of coarsening [101, 105], the
morphology of the γ′−precipitates in this Ni-8.5 at.% Cr-10 at.% Al-2 at.% Re alloy
remains relatively spheroidal and the γ′−precipitates are distributed randomly in the
γ−matrix even after 264 h of aging, Figure 7.1 (b). Since the morphological evolution of

142
γ′−precipitates in our model Ni-8.5 at.% Cr-10 at.% Al alloy aged at 1073 K [90] follows
the trend observed for most Ni-based superalloys (sphere-to-cube transition), the
addition of Re must be playing an important role in reducing the interfacial free energy
(γ′−precipitate composition of Ni76.49Cr6.04Al17.47 in the ternary alloy as compared with
Ni76.31Cr5.23Al17.61Re0.85 in the quaternary alloy at 264 h aging time) and maintaining the
morphology of the γ′−precipitates to be spheroidal. The conventional wisdom is that Re
segregation occurs at the γ/γ′ interfaces and impedes the coarsening of the γ′−precipitates
by lowering the interfacial free energy, thereby stabilizing the morphology of the
precipitates in the Ni-based superalloys. 3DAP microscopy investigations, however, do
not reveal any significant Re interfacial segregation at any aging time for this alloy. This
result is discussed in Section 7.3.5 in detail.
7.3.2. Temporal evolution of precipitate size distributions
Precipitate size distributions display how well the experiments agree with the
predictions made by the LSW theory and BW model. The PSDs of Ni-Cr-Al-Re alloys
as a function of aging time exhibit broadening of the distributions and lowering of peak
heights with increasing aging time, which is contrary to the prediction of LSW theory of
a time-invariant shape. The temporal evolution of the experimental PSDs, however,
agrees with the predicted trends of the volume fraction corrected BW model, which
exhibits broadening of the distributions and lowering of peak heights with increasing Vf
of precipitates. This demonstrates that the experimental PSDs are not in the pure steady-

143
state coarsening regime
=
∂∂
0t
Ci , defined by the LSW theory. In addition, the shapes
of the experimental PSDs do not match those of the BW model. The results, therefore,
imply that the coarsening of the γ′−precipitates may not occur solely by the conventional
evaporation-condensation (EC) mechanism, which is a single atom detachment-
attachment process [111]. This is discussed in Section 7.3.7 in detail.
7.3.3. Chemical evolution of the alloy
The Cr and Re concentrations in the γ−matrix increase while the Al concentration
decreases with increasing aging time, Table 7.3. The opposite behavior is found for the
γ′−precipitates, Table 7.4. These changes are reflected in the values of Κγ′/γ, where the
ratios for Cr and Re are decreasing with increasing aging time, whereas the ratio for Al
is increasing with increasing aging time. The partitioning behavior of elements in the
quaternary Ni-8.5 at.% Cr-10 at.% Al-2 at.% Re alloy is compared with the ternary Ni-
8.5 at.% Cr-10 at.% Al and the quaternary Ni-8.5 at.% Cr-10 at.% Al-2 at.% W alloy
[90] in Figure 7.15. This figure demonstrates that the addition of Re to our Ni-Cr-Al
alloy increases the partitioning of Al to γ′−precipitates and Cr to the γ−matrix. The
effects, however, of adding Re on the Κγ′/γ of alloying elements are smaller than adding
W to the same Ni-Cr-Al ternary alloy. The composition of the γ−matrix, γ′−precipitate
and the partitioning behavior of elements demonstrate that the temporal evolution of Ni-
Cr-Al-Re alloy decelerates considerably after 1 h of aging. This suggests that Ni-Cr-Al-

144
Figure 7.15. Partitioning ratio (atomic concentration of an element in γ′−precipitates divided by atomic concentration of element in γ−matrix) of all the elements in: (a) Ni-8.5 at.% Cr-10 at.% Al; (b) Ni-8.5 at.% Cr-10 at.% Al-2 at.% W; and (c) Ni-8.5 at.% Cr-10 at.% Al-2 at.% Re alloy, plotted as a function of aging time and compared with other results [90]. This graph vividly displays the effect of the Re addition on the partitioning behavior of all alloying elements in this Ni-based model superalloy.

145
Re alloy may be in a quasi steady-state regime, 0≈
∂∂
tCi .
Table 7.4 shows that the γ′−precipitates in the as-quenched state samples have
high Cr and Re concentrations, which suggests that the precipitates may nucleate from
Cr and Re-rich clusters during the quench and then reject both Cr and Re atoms with
increasing aging time. As growth and coarsening progresses, the Cr and Re
concentrations in the γ′−precipitates decrease, while the Al concentration concomitantly
increases. This result disagrees with the assumption of UO theory that the compositions
of precipitates do not change during coarsening; therefore coarsening in this Ni-Cr-Al-
Re alloy is not in the pure steady-state coarsening regime, 0=
∂∂
tC .
7.3.4. Ordering of γ′−precipitates during early stage decomposition
It has been strongly debated whether the precipitation and ordering of the
γ′−precipitates occurs simultaneously or clustering of atoms first takes place followed by
their ordering [120-122]. A 3DAP microscopy reconstruction of Ni-Cr-Al-Re alloy
(Figure 7.7) clearly exhibits the alternating Al-rich planes along the [100] analysis
direction inside the γ′−precipitates, even in the as-quenched state. This is explicit
evidence that the γ′−precipitates have the ordered L12-structure. This is also confirmed
employing CTEM. The diffraction pattern of as-quenched state specimens exhibits the
superlattice reflections of the ordered L12-structure, which indicates that the

146
γ′−precipitates are ordered, Figure 7.1 (a). These experimental results suggest that phase
separation and ordering are occurring during the quench, which agrees with the previous
experimental results for binary Ni-Al [123-128] and ternary Ni-Cr-Al alloys [99, 125,
129]. In addition, this result demonstrates the powerful atomic scale resolution of 3DAP
microscopy.
7.3.5. Heterophase segregation of Re at the γ/γ′ interface
Unlike the commercial Ni-based superalloy, René N6, this quaternary Ni-8.5
at.% Cr-10 at.% Al-2 at.% Re alloy does not exhibit significant interfacial segregation of
Re at the γ/ γ′ interfaces for any of the aging times, Figure 7.10. This, therefore, suggests
that Re segregation at the γ/ γ′ interfaces in René N6 is the result of interactions among
the many alloying elements (i.e. Co, Mo, Hf, Ta, W, and Re) in commercial Ni-based
superalloys, the effect of misfit, δ, between the γ−matrix and γ′−precipitates, and/or the
thermal history. First, additional alloying elements may change the electronic interaction
and/or chemical bondings at the interface and provide a way for Re interfacial
segregation to lower the energy of Re atoms in René N6. Second, the δ value of the Ni-
Cr-Al ternary system is reported to be [98-100]:
%02/)( '
' =+
−=
γγ
γγδaa
aa. (6.4)
In addition, the change in δ with a change in Re concentration of Ni-based superalloys is
estimated to be [130]:

147
1
Re
.%%3.0 −−≈
at
dcdδ . (7.5)
From the available information, the estimated δ value for our Ni-Cr-Al-Re alloy, which
contains 2 at.% Re, is calculated to be:
%6.023.00 −=×−=δ ; (7.6)
compared with 0.05 % for René N6 [131]. A negative δ value in this Ni-Cr-Al-Re alloy
indicates that the lattice parameter of the γ−matrix is greater than that of the
γ′−precipitates. Because of this lattice parameter difference, it may be easier for the Re
atoms, which are rejected from the γ′−precipitates, to diffuse into the γ−matrix.
Nevertheless, the addition of Re delays the coarsening of the precipitates and stabilizes
the spheroidal morphology of γ′−precipitates, in comparison to the ternary Ni-Cr-Al and
quaternary Ni-Cr-Al-W alloys, which have larger γ′−precipitates than Ni-Cr-Al-Re alloy
and a cuboidal morphology for the precipitates [90]. In addition, a series of proxigrams
demonstrate clearly the temporal evolution of Re, which is the slowest diffusing element
in this alloy. The concentration of Re decreases gradually across the γ/γ′ interfaces and
the width of the interfaces is broad (approximately 4 nm wide) in the as-quenched state.
The γ/ γ′ interfaces, however, become narrower (approximately 2 nm wide) and the Re
concentration exhibits a sharp decrease as aging time increases. The width of the
interfaces measured from the Re concentration profile as a function of aging time is
listed in Table 7.7 and plotted in Figure 7.16. Note that the width decreases from 4 nm to
1.5 nm as a result of 264 h of aging.

148
Figure 7.16. The width of γ/γ′ interfaces measured from Re concentration profiles (Figure 7. 10) as a function of aging time at 1073 K. The broad interfaces in as-quenched state evolve to narrower interfaces with increasing aging time. In addition, a gradual decrease in Re concentration across the interfaces in as-quenched state changes to the sharp decrease in Re concentration with increasing aging time.

149
Table 7.7. The width of the γ/γ′ interfaces measured from the proxigrams of Re as a function of aging time in hours.
Time (h) 0 0.25 1 4 16 64 264 Width of interface (nm) 4 2.5 2.5 2.25 2 1.75 1.5
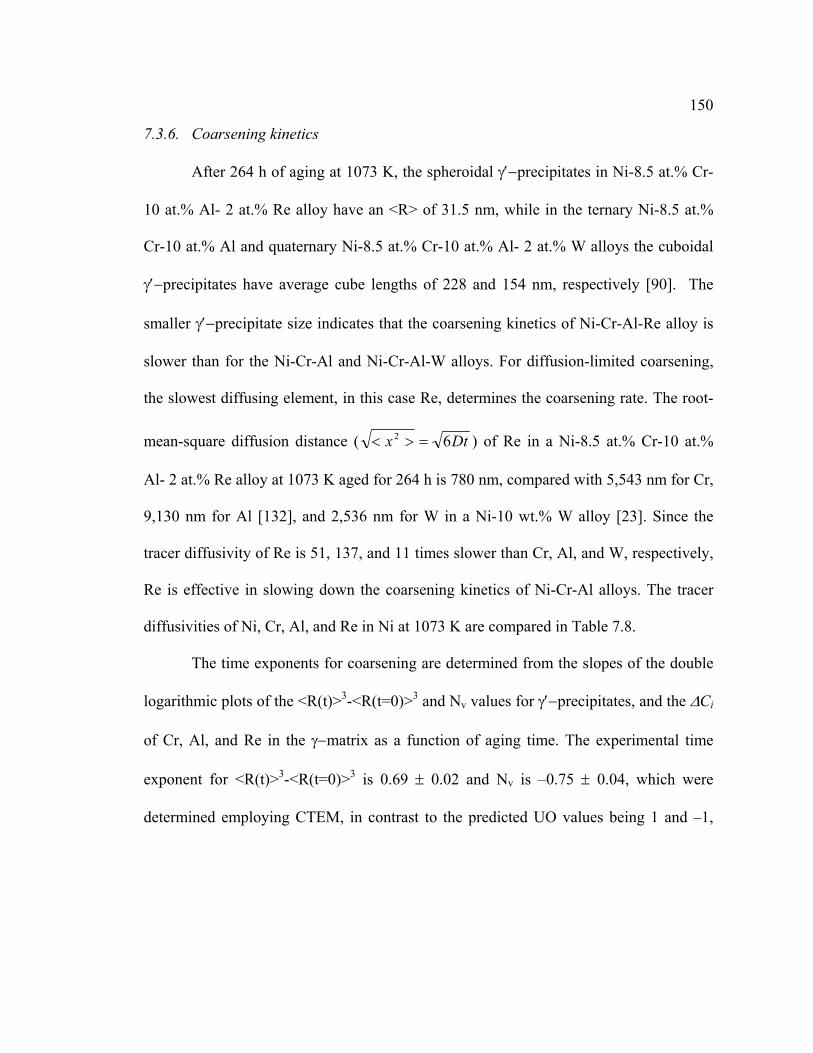
150
7.3.6. Coarsening kinetics
After 264 h of aging at 1073 K, the spheroidal γ′−precipitates in Ni-8.5 at.% Cr-
10 at.% Al- 2 at.% Re alloy have an <R> of 31.5 nm, while in the ternary Ni-8.5 at.%
Cr-10 at.% Al and quaternary Ni-8.5 at.% Cr-10 at.% Al- 2 at.% W alloys the cuboidal
γ′−precipitates have average cube lengths of 228 and 154 nm, respectively [90]. The
smaller γ′−precipitate size indicates that the coarsening kinetics of Ni-Cr-Al-Re alloy is
slower than for the Ni-Cr-Al and Ni-Cr-Al-W alloys. For diffusion-limited coarsening,
the slowest diffusing element, in this case Re, determines the coarsening rate. The root-
mean-square diffusion distance ( Dtx 62 =>< ) of Re in a Ni-8.5 at.% Cr-10 at.%
Al- 2 at.% Re alloy at 1073 K aged for 264 h is 780 nm, compared with 5,543 nm for Cr,
9,130 nm for Al [132], and 2,536 nm for W in a Ni-10 wt.% W alloy [23]. Since the
tracer diffusivity of Re is 51, 137, and 11 times slower than Cr, Al, and W, respectively,
Re is effective in slowing down the coarsening kinetics of Ni-Cr-Al alloys. The tracer
diffusivities of Ni, Cr, Al, and Re in Ni at 1073 K are compared in Table 7.8.
The time exponents for coarsening are determined from the slopes of the double
logarithmic plots of the <R(t)>3-<R(t=0)>3 and Nv values for γ′−precipitates, and the ∆Ci
of Cr, Al, and Re in the γ−matrix as a function of aging time. The experimental time
exponent for <R(t)>3-<R(t=0)>3 is 0.69 ± 0.02 and Nv is –0.75 ± 0.04, which were
determined employing CTEM, in contrast to the predicted UO values being 1 and –1,

151
Table 7.8. Tracer diffusivities of Ni, Cr, Al, and Re in Ni at 1073 K [132] and ratio of each tracer diffusivity to that of Ni.
Di (m2 s-1) Di/DNi Ni 4.05 × 10⁻¹⁸ 1 Cr 5.39 × 10⁻¹⁸ 1.33 Al 1.46 × 10⁻¹⁷ 3.61 Re 1.07 × 10⁻¹⁹ 0.03

152
respectively. The experimental values deviate significantly from the values predicted by
UO theory, which means this alloy does not follow the predicted temporal evolution.
The high percentage of interconnected precipitates is one possible explanation why the
coarsening results of this Ni-Cr-Al-Re alloy do not follow UO theory. This point is
discussed in the following section.
The experimental time exponents for ∆Ci, determined employing 3DAP
microscopy, are –0.28 ± 0.01 for Cr, –0.33 ± 0.02 for Al, and –0.22 ± 0.03 for Re. The
time exponent for Al is closest to the theoretical prediction of –1/3, but the values for Cr
and Re are significantly smaller than the predicted value. Since the Al is the fastest
diffusing alloying element in our Ni-Cr-Al-Re alloy, it achieves partial equilibrium state
first and thus has a time exponent approximately equal to the UO value of –1/3, while Cr
and Re are in a non-equilibrium state. In addition, Re is a slower diffuser than Cr in Ni,
so the time exponent for Re deviates more from the predicted UO value than the one for
Cr. For Re to achieve the root-mean-squared diffusion distance of Al at 1073 K for 264 h,
9,130 nm, it would take 36,220 h (more than 4 years). The Ni-Cr-Al-Re alloy, therefore,
will not satisfy the third asymptotic solution of the UO theory,
[ ] 3/1)()( −=∞→− ttCtC UOii κγγ , within a reasonable time frame. However, the time
exponents for the concentration differences in the γ′−precipitates are within the
experimental error of one another, –0.30 ± 0.04 for Cr, –0.32 ± 0.06 for Al, and –0.36 ±
0.01 for Re. Because the root-mean-square diffusion distances of all elements are greater

153
Table 7.9. Time exponents obtained from TEM and 3DAP microscopy experiments compared with the predicted asymptotic values of UO theory [36].
∆Ci [ ])()( '' ∞→− tCtC iiγγ
<R(t)>3-<R(t=0)>3 Nv
Cr Al Re Cr Al Re
CTEM 0.24 ± 0.01
−0.75 ± 0.04
3DAP microscopy −0.28
± 0.01 −0.33 ± 0.02
−0.22 ± 0.03
−0.30 ± 0.04
−0.32 ± 0.06
−0.36 ± 0.01
UO theory 1 −1 −1/3
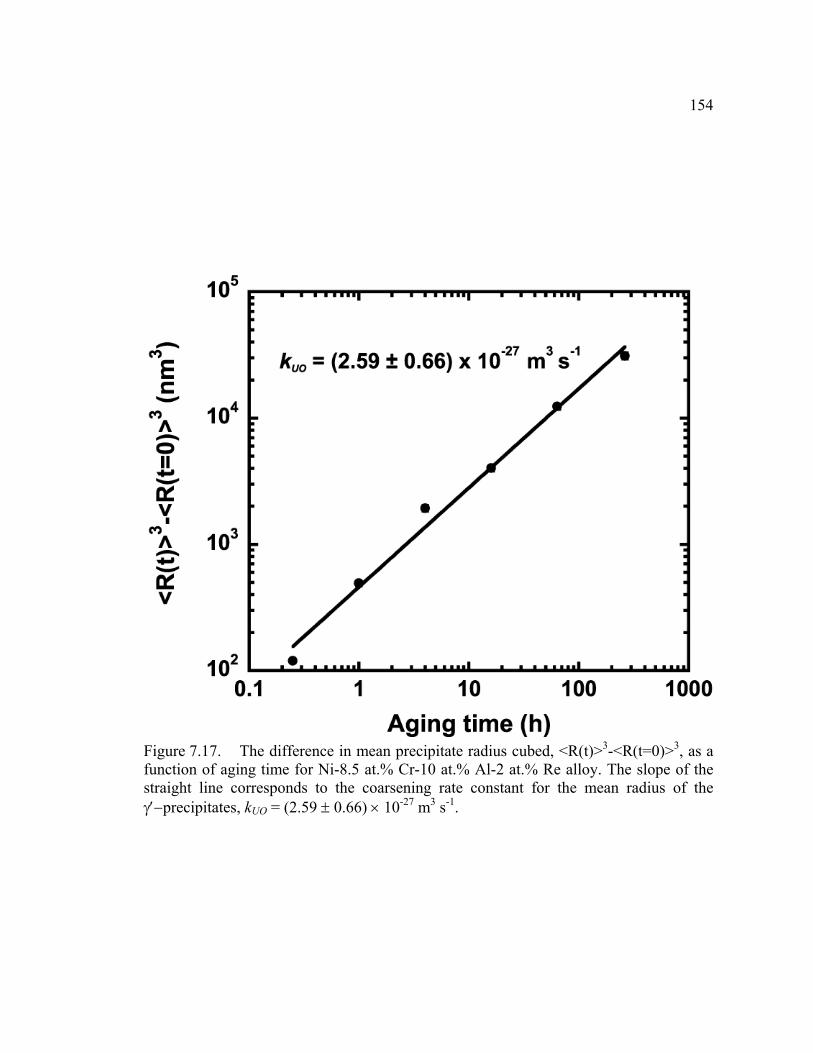
154
Figure 7.17. The difference in mean precipitate radius cubed, <R(t)>3-<R(t=0)>3, as a function of aging time for Ni-8.5 at.% Cr-10 at.% Al-2 at.% Re alloy. The slope of the straight line corresponds to the coarsening rate constant for the mean radius of the γ′−precipitates, kUO = (2.59 ± 0.66) × 10-27 m3 s-1.

155
than the diameter of the γ′−precipitates (63 nm at 264 h), the time exponents for the
concentration differences in the γ′−precipitates are almost the same for all alloying
elements. The time exponents for all three asymptotic solutions determined by
employing TEM and 3DAP microscopies are listed in Table 7.9, and compared with the
theoretical predictions of UO theory.
In addition, the experimental coarsening rate constant, kUO, is determined by
plotting <R(t)>3-<R(t=0)>3 as a function of aging time, Figure 7.17. The slope of the
linear regression line is kUO = (2.59 ± 0.66) × 10-27 m3 s-1.
7.3.7. Interconnected γ′−precipitates
From the three-dimensional reconstructions, it is clear that a significant fraction
of the γ′−precipitates are interconnected with other precipitates by necks and the necks
survive to an aging time of at least 1 h (Figures 7.7 and 7.8), which is an indication that
the cluster-diffusion-coagulation (CDC) mechanism is involved in the coarsening of the
precipitates [108-110]. Traditionally, it is believed that coarsening of precipitates is
accomplished by the so-called EC mechanism, which involves a single atom evaporating
from a shrinking smaller precipitate, diffusing to the larger precipitate by random-walk
diffusion, and then condensing on a growing, larger precipitate. The 3DAP microscopy
results in concert with KMC simulations, however, suggest that coarsening involves the
CDC mechanism, in addition to an EC mechanism. This CDC mechanism involves the
formation of small clusters of solute atoms from the γ−matrix, which diffuse and attach

156
themselves to the growing precipitates, and then form necks between the closely located
growing precipitates. Kinetic Monte Carlo simulation results on a Ni-Cr-Al alloy
demonstrate that n-mers of Cr, Al, and Cr-Al have higher diffusivities, up to a pentamer,
than Cr or Al monomers (i.e. single atom) [111]. This implies that clusters of Cr, Al, or
Cr-Al atoms can arrive at growing γ′−precipitates before a monomer of Cr or Al arrives,
which suggests a CDC mechanism in parallel with an EC mechanism. UO theory
assumes implicitly that coarsening of precipitates is achieved by an EC mechanism. The
results of experiments, however, demonstrate that a CDC mechanism is involved with
the growth and coarsening as well as an EC mechanism in this Ni-Cr-Al-Re alloy. As a
result, we obtain time exponents for coarsening that are different from the predicted
values of UO theory.
The fraction of γ′−precipitates interconnected (χ, ..
.. / Tot
pptinterconppt NN=χ - Equation
(6.5)), demonstrates that the amount of coalescence decreases with increasing aging time,
Figure 7.18. This is expected since as Nv decreases the <λ>e-e values of γ′−precipitates
increase concomitantly, which makes the possibility of clusters forming necks among
the precipitates lower at later aging times (Figure 7.3 (c) for <λ>e-e as a function of aging
time), at this point the EC mechanism dominates. The temporal evolution of χ values
displays the trend in the relative level of CDC mechanism involvement in the
precipitates coarsening. Therefore, even when the χ value is zero (after 4 h), the CDC
mechanism may still be engaged in the coarsening of the precipitates. In addition, the

157
Figure 7.18. The fraction of γ′−precipitates interconnected, χ, as a function of aging time at 1073 K. After an aging time of 1 h, the γ′−precipitates interconnected by necks are not detected by 3DAP microscopy.

158
Figure 7.19. Three-dimensional atom probe microscopy reconstruction of Al atoms inside the interconnected γ′−precipitates, which displays clearly the alternating Al-rich planes of the L12-ordered structure in both the precipitates and neck region, along the [100] direction. Only Al atoms are shown for the sake of clarity.
159
3DAP microscopy reconstruction of atoms inside the γ′−precipitates interconnected by a
neck is presented in Figure 7.19; Only Al atoms are shown for the sake of clarity. Figure
7.19 clearly displays the alternating Al-rich planes of the L12-ordered structure in both
precipitates and the neck region. This is a clear indication that the ordering of
each γ′−precipitate is continuous through the neck region, without the presence of an
anti-phase boundary (APB).
The limited resolution of CTEM compared with 3DAP microscopy makes it
challenging to use CTEM for detecting and/or measuring the coalescence of the
γ′−precipitates. The aspect ratio, ρ, of the γ′−precipitates, however, measured employing
CTEM can complement the 3DAP microscopy results by determining the possible
occurrence of precipitate coalescence and a morphological transition during coarsening
[133, 134]. The ρ value of a γ′−precipitate is defined as the ratio of the maximum caliper
diameter divided by the minimum caliper diameter of the precipitates, Table 7.1. Since
images on TEM micrographs display the two-dimensional projections of three-
dimensional objects, a spherical precipitate has a ρ value equal to 1 and a cubic
precipitate has a ρ value equal to 2 . The temporal evolution of the distribution of ρ is
displayed in Figure 7.20. At earlier aging times (≤ 1 h) distributions are broader than at
later aging times. With increasing aging time, high ρ values are less frequent and the
distributions become narrower. The mean aspect ratio, <ρ>, of the γ′−precipitates with
respect to increasing aging time is displayed in Figure 7.21. The <ρ> values remain the

160
same, within experimental error, for the first 4 h of aging and then decreases with
increasing aging time. The narrowing distributions and decreasing <ρ> indicates that the
interconnected γ′−precipitates, which are elongated and have high ρ values, become
more spheroidal as coalesced precipitates continue to grow. This result demonstrates
reasonable agreement between the results of 3DAP microscopy and CTEM.

161
Figure 7.20. Distributions of the aspect ratio (ρ, the ratio of the maximum caliper diameter of a precipitate divided by the minimum caliper diameter of a precipitate) of the γ′−precipitates of Ni-8.5 at.% Cr-10 at.% Al-2 at.% Re alloy aged for 0, 0.25, 1, 4, 16, 64 and 264 h, in which the histograms of probability density are plotted as a function of ρ. With increasing aging time, γ′−precipitates with high values of ρ disappear, which indicates that the number of interconnected precipitates with necks is decreasing with increasing aging time.

162
Figure 7.21. The mean aspect ratio, <ρ>, of the γ′−precipitates is decreasing as aging time increases after 4 h of aging. This indicates that elongated precipitates become more spheroidal with increasing aging time.

163
7.4. Conclusions
Three-dimensional atom probe (3DAP) microscopy and CTEM are utilized to
investigate the temporal evolution of a Ni-8.5 at.% Cr-10 at.% Al- 2 at.% Re alloy aged
at 1073 K for 0 to 264 h. The effects of the Re addition on the nanostructure, coarsening
kinetics, and chemistry of the Ni-8.5 at.% Cr-10 at.% Al alloy are determined and
analyzed as follows:
• In the as-quenched state, spheroidal γ′−precipitates, with a mean radius, <R>, of
approximately 4 nm, are present, which are formed during the quenching process due
to the high supersaturations of Cr and Al, Figures 7.1 and 7.7.
• Conventional TEM micrographs, taken along a [100] zone axis, show that the
morphology of the γ′−precipitates remains spheroidal even at the longest aging time
of 264 h, Figures 7.1 and 7.2, while in contrast the precipitates in many Ni-based
superalloys go through the sphere-to-cube morphological transition during
isothermal aging [101-104]. In addition, the <R> values of the γ′−precipitates in Ni-
8.5 at.% Cr-10 at.% Al-2 at.% Re alloy are considerably smaller (63 nm after 264h)
than the ones of Ni-8.5 at.% Cr-10 at.% Al and Ni-8.5 at.% Cr-10 at.% Al-2 at.% W
alloy (228 and 154 nm after 264 h, respectively), which have cuboidal γ′−precipitates.
Addition of Re to a Ni-Cr-Al alloy, therefore, plays an important role in decelerating
the coarsening kinetics and stabilizing the spheroidal morphology of γ′−precipitates.
• The <R> of the γ′−precipitates increases and number density, Nv, decreases
concomitantly with increasing aging time, as anticipated, Figure 7.3.

164
• The experimental precipitate size distributions, PSDs, obtained utilizing CTEM
investigations are compared with both Lifshitz-Slyozov-Wagner (LSW) coarsening
theory and Brailsford-Wynblatt (BW) model. The experimental PSDs demonstrate
that the experiments are not in the pure steady-state coarsening regime defined by
LSW theory, 0=
∂∂
tC . In addition, experimental PSDs disagree with those of non-
zero volume fraction corrected by BW model, Figure 7.6.
• The Cr and Re concentrations of the γ′−precipitates are decreasing with increasing
aging time, with a concomitant increase of the Al concentration (Figure 7.9). The
changing compositions of the γ′−precipitates with increasing aging time indicate that
the alloy has not achieved a global steady-state. These results in concert with Figure
7.3 demonstrate that this Ni-Cr-Al-Re alloy is in the growth and coarsening regime.
• The proxigrams of Re for all aging times display no indication of interfacial Re
segregation at γ/γ′ interfaces (Figure 7.10), while commercial Ni-based superalloys,
e.g., René N6 [119], exhibit significant Re interfacial segregation (2.41 atoms nm-2).
This suggests that the Re interfacial segregation is the result of interactions among
multiple alloying elements in commercial nickel-based superalloys, thermal history
and/or the effect of lattice parameter misfit, δ, between the matrix and precipitates.
The estimated δ in Ni-Cr-Al-Re alloy is –0.6 %, compared with +0.05 % for René
N6. Rhenium, however, is still an effective alloying element for delaying the
coarsening of precipitates without significant interfacial segregation.

165
• The time exponents for coarsening are determined from the slopes of log-log plots of
the <R(t)>3-<R(t=0)>3, Nv of γ′−precipitates (Figure 7.3), and the matrix
supersaturation (∆Ci, )()( ∞→−=∆ tCtCC iiiγγ ) of Cr, Al, and Re as a function of
aging time, Figure 13). The time exponents are 0.24 ± 0.01 (<R> vs. t), –0.75 ± 0.04
(Nv vs. t), and –0.28 ± 0.01 for Cr, –0.33 ± 0.02 for Al, and –0.22 ± 0.03 for Re (∆Ci
vs. t), which all deviate from the predicted values of the UO theory (1/3, –1 and –1/3,
respectively). The only exponent close to a predicted value is the value of –0.33 ±
0.02 for the time dependence of the ∆CAl, which may achieve a quasi steady-state
≈
∂∂
0t
Ci due to the high diffusivity of Al in this alloy. In addition, the time
exponents for the concentration differences in γ′−precipitates are obtained, –0.30 ±
0.04 for Cr, –0.32 ± 0.06 for Al, and –0.36 ± 0.01 for Re.
• According to the tracer diffusivity data of Re in Ni, it diffuses significantly slower
than Cr and Al in Ni. Furthermore, the root-mean-square diffusion distance of Re
will not reach that of Al within a reasonable time frame; this Ni-Cr-Al-Re alloy,
therefore, will not satisfy the third asymptotic solution of UO theory,
[ ] 3/1)()( −=∞→− ttCtC UOii κγγ .
• Three-dimensional atom probe microscopy results demonstrate that addition of Re
increases the partitioning of Al to the γ′−precipitates and Cr to the γ−matrix,
compared to the model Ni-Cr-Al alloy. Initially, the value of the partitioning ratio,

166
Κγ′/γ, changes strongly with increasing aging time and then gradually after 1 h of
aging (Figure 7.15). This implies that the alloy may be in a quasi steady-state regime
after 1 h of aging.
• Three-dimensional reconstructions obtained using 3DAP microscopy display
alternating Al-rich planes inside the γ′−precipitates, along the [100] direction of the
ordered L12-structure, even in the as-quenched state sample, Figures 7.7 and 7.19.
This result, therefore, suggests that the ordering of γ′−precipitates and phase
separation occur during the quench.
• The 3DAP microscopy reconstructions demonstrate that some γ′−precipitates are
interconnected by necks at the earliest aging times (≤ 1 h) and the fraction of
γ′−precipitates interconnected (χ, ..
.. / Tot
pptinterconppt NN=χ ) decreases with increasing aging
time, Figure 7.18. This, in concert with KMC simulations [96], constitutes evidence
that coarsening of the γ′−precipitates is the result of the cluster-diffusion-coagulation
(CDC) mechanism as well as the evaporation-condensation (EC) mechanism implicit
to UO theory. In addition, the CDC mechanism establishes a possible reason for the
measured deviations from the predictions of UO theory. In addition, the aspect ratio,
ρ, of γ′−precipitates versus aging time curve, measured employing CTEM,
complements the results of 3DAP microscopy, which shows that the coalescence of
the γ′−precipitates decreases with increasing aging time.

167
Chapter Eight
Summary and future research
8.1 Summary
The nanoscale chemistry, nanostructure, and temporal evolution of several Ni-
based superalloys, such as model alloys Ni-14.2 at.% Cr-5.2 at.% Al and Ni-8.5 at.% Cr-
10 at.% Al-2 at.% Re, and a commercial alloy, René N6, have been investigated utilizing
3DAP microscopy and CTEM and compared with KMC simulations and/or the UO
coarsening theory and BW model.
Chapter Four presents the nanoscale chemistry of a commercial Ni-based
superalloy, René N6. The results obtained from 1DAP and 3DAP microscopies are
compared. This demonstrates the true power of 3DAP microscopy, which can be
employed to investigate the chemical nature of complex materials, which have large
number of alloying elements, with high mass resolution and three-dimensional atomic
resolution. Partitioning behavior of all alloying elements has been investigated as
follows; Ni, Al, Ta, and Hf partition to the γ′−precipitates, while the matrix-
strengthening elements, Co, Cr, Mo, W, and Re are partitioned to the γ−matrix.
Segregation of Re is observed at the γ/γ′ interfaces utilizing both 1DAP and 3DAP
microscopies and the interfacial excess is quantified to be 2.41×10¹⁴ atoms cm-2 (2.41
atoms nm-2), employing 3DAP microscopy. In addition, the interfacial excess value is

168
shown to be independent of the threshold value (i.e. the location of the isoconcentration
surface) thanks to the calculation technique embedded in the proxigram method.
Chapter Six discusses the temporal evolution of chemistry and nanostructure of a
model Ni-14.2 at.% Cr-5.2 at.% Al ternary alloy employing 3DAP microscopy. Cr
addition to Ni-Al binary alloy stabilizes the γ′−precipitate morphology as spheroids, as a
result of a reduced lattice parameter misfit. The coarsening kinetics of the γ′−precipitates
is investigated and the time exponents for all three asymptotic solutions are compared
with the values predicted by UO theory and the results obtained employing KMC
simulations. The experimental results are reasonably consistent with the simulations. In
addition, the time exponents for the mean radius of the γ′−precipitate and matrix
supersaturations of Cr and Al are in reasonable agreement with the predicted values of
UO theory. The time exponent for the number density of precipitates, however, is
smaller than the theoretical value. A fraction of the γ′−precipitates are interconnected
with other precipitates by necks, which suggests that coarsening is a result of the cluster-
diffusion-coagulation mechanism as well as the evaporation-condensation mechanism
implicit to UO theory. This may be the reason why the time exponent for the number
density does not agree with the theory. In addition, longer aging time may result in better
agreement between the experiments and the theory.
Chapter Seven demonstrates the effects of 2 at.% Re addition on the temporal
evolution of chemistry and nanostructure of a model Ni-8.5 at% Cr-10 at.% Al alloy.
Rhenium addition delays the coarsening and stabilizes the spheroidal morphology of the

169
γ′−precipitates by creating a negative lattice parameter misfit between the γ−matrix and
γ′−precipitates. Contrary to the result of a commercial Ni-based superalloy, René N6, no
Re segregation at the γ/γ′ interface has been observed in Ni-8.5 at.% Cr-10 at.% Al-2
at.% Re alloy. The thermal history, negative lattice parameter misfit and/or lack of
interaction among alloying elements may prevent Re interfacial segregation. In addition,
Re addition strengthens the partitioning of Cr to the γ−matrix and the partitioning of Al
to the γ′−precipitates. All time exponents of coarsening determined employing CTEM
and 3DAP microscopy experiments deviate from the expected UO theoretical values.
This may be due to the slow diffusion of Re compared to Cr and Al in the γ−matrix
and/or the cluster-diffusion-coagulation coarsening mechanism. This result suggests that
the Ni-8.5 at.% Cr-10 at.% Al-2 at.% Re alloy may be in the quasi steady-state
coarsening regime, 0≈
∂∂
tCi .
8.2 Future research
In commercial Ni-based superalloy, René N6, Re interfacial segregation at the
γ/γ′ interface has been observed employing both 1DAP and 3DAP microscopies. To
investigate the effects of excess Re at the interface on mechanical properties of this alloy,
creep experiments would be of interest. In addition, 3DAP microscopy experiments of
crept samples would solve the role played by Re on the mechanical properties by
locating the position of Re atoms after creep deformation. Comprehensive γ−matrix

170
investigation should provide clear information about nanoscale Re clusters, if they exist,
which researchers claim to be the source of creep strength improvement in Re containing
Ni-based superalloys.
Current research presents the effects of Re addition on the temporal behavior of
the chemistry and nanostructure of the Ni-8.5 at.% Cr-10 at.% Al alloy. The effects of
Re addition on the performance of the Ni-Cr-Al alloy would also be of interest. Again,
creep experiments and 3DAP microscopy experiments of crept samples may elucidate
the role of Re on the creep deformation properties of this alloy.
In addition, investigation of quinary Ni-8.5 at.% Cr-10 at.% Al-1 at.% Re-1 at.%
W alloys would be desirable to probe the interactions among refractory alloying
elements and their effects on temporal evolution of the chemistry and nanostructure of
alloys. In René N6, which has nine components, W prefers the γ−matrix. In a Ni-8.5
at.% Cr-10 at.% Al-2 at.% W alloy, however, W favors the γ′−precipitates. The
morphology of γ′−precipitates in a Ni-8.5 at.% Cr-10 at.% Al-2 at.% Re alloy is
spheroidal, while it is cuboidal in a Ni-8.5 at.% Cr-10 at.% Al-2 at.% W alloy.
Investigation of a quinary alloy may determine the condition that affects the partitioning
behavior of W and sphere-to-cube morphological transition in the γ′−precipitates. Also
an increased number of alloying elements may trigger Re segregation at the γ/γ′ interface.

171
References
1. C. T. Sims and W. C. Hagel, Editors. The superalloys. 1972, John Wiley & Sons, Inc.: New York, NY.
2. C. T. Sims, in Superalloys ii; high-temperature materials for aerospace and
industrial power, C. T. Sims, N. S. Stoloff, and W. C. Hagel, Editors. 1987, John Wiley & Sons INC.: New York, NY.
3. W. Betteridge, Nickel and its alloys. 1984, West Sussex, England: Ellis Horwood
Limited. 4. C. Schmuck, P. Caron, A. Hauet, and D. Blavette, Ordering and precipitation of
γ' phase in low supersaturated Ni-Cr-Al model alloy: An atomic scale investigation. Philos. Mag. A, 1997. 76(3): pp. 527-542.
5. C. Schmuck, F. Danoix, P. Caron, A. Hauet, and D. Blavette, Atomic scale
investigation of ordering and precipitation processes in a model Ni-Cr-Al alloy. Appl. Surf. Sci., 1996. 94-5: pp. 273-279.
6. D. Blavette, E. Cadel, and B. Deconihout, The role of the atom probe in the study
of nickel-based superalloys. Mater. Charact., 2000. 44(1-2): pp. 133-157. 7. H. Murakami, H. Harada, and H. Bhadeshia, The location of atoms in Re-
containing and V-containing multicomponent nickel-base single-crystal superalloys. Appl. Surf. Sci., 1994. 76(1-4): pp. 177-183.
8. D. Blavette, L. Letellier, P. Duval, and M. Guttmann, Atomic-scale investigation
of grain boundary segregation in Astroloy with a three dimensional atom-probe, in Intergranular and interphase boundaries in materials, Pt 1. 1996, Trans Tech Publications: Aedermannsdorf, Switzerland. pp. 79-91.
9. D. Blavette, P. Caron, and T. Khan, An atom probe investigation of the role of
rhenium additions in improving creep resistance of Ni-base superalloys. Scripta Met., 1986. 20(10): pp. 1395-1400.
10. J. Bursik and M. Svoboda, The existence of P-phase and ni2cr superstructure in
Ni-Al-Cr-Mo system. Scripta Mater., 1998. 39(8): pp. 1107-1112. 11. S. Chakravorty, S. Sadiq, and D. R. F. West, Intermetallic compound
precipitation in Ni-Cr-Al-Mo system. Mater. Sci. Tech.-Lond., 1987. 3(8): pp. 629-641.

172
12. N. S. Cheruvu, Development of a corrosion resistant directionally solidified material for land based turbine blades. J. Eng. Gas Turb. Power, 1998. 120(4): pp. 744-750.
13. J. F. Huang, H. S. Fang, and X. R. Fu, High-temperature oxidation behavior and
mechanism of a new type of wrought Ni-Fe-Cr-Al superalloy up to 1300°C. Oxid. Met., 2000. 53(3-4): pp. 273-287.
14. J. Lapin, A. Klimova, R. Velisek, and M. Kursa, Directional solidification of Ni-
Al-Cr-Fe alloy. Scripta Mater., 1997. 37(1): pp. 85-91. 15. H. Nickel, D. Clemens, W. J. Quadakkers, and L. Singheiser, Development of
NiCrAlY alloys for corrosion-resistant coatings and thermal barrier coatings of gas turbine components. J. Press. Vess.-T ASME, 1999. 121(4): pp. 384-387.
16. D. Prajitno, B. Gleeson, and D. J. Young, The cyclic oxidation behaviour of α-
Cr+β-NiAl alloys with and without trace Zr addition. Corros. Sci., 1997. 39(4): pp. 639-654.
17. R. Yang, J. A. Leake, and R. W. Cahn, Chromium precipitation from β-Ni(Al, Ti)
and γ'-Ni3(Al, Ti) in the alloy (Ni70Al20Ti10)0.9Cr0.1. Philos. Mag. A, 1992. 65(4): pp. 961-980.
18. A. Taylor and R. W. Floyd, The constitution of nickel-rich alloys of 1464, the
nickel-chromium-aluminum system. J. Inst. Met., 1952. 81: pp. 451-464. 19. W. Betteridge and J. Heslop, The nimonic alloys, and other nickel-base high-
temperature alloys. 2nd ed. 1974, New York,: Crane Russack. 20. M. Durand-Charre, The microstructure of superalloys. 1997, Amsterdam, The
Netherlands: Gordon and Breach Science Publishers. 21. E. F. Bradley, Superalloys : A technical guide. 1988, Metals Park, OH: ASM
International. 22. J. R. Davis, Editor. Nickel, cobalt, and their alloys. ASM specialty handbook.
2000, ASM International: Materials Park, OH. 23. M. S. A. Karunaratne, P. Carter, and R. C. Reed, Interdiffusion in the face-
centred cubic phase of the Ni-Re, Ni-Ta and Ni-W systems between 900 and 1300°C. Mater. Sci. Eng. A, 2000. 281(1-2): pp. 229-233.
173
24. S. Schanzer and E. Nembach, The critical resolved shear-stress of γ'-strengthened nickel-based superalloys with γ'-volume fractions between 0.07 and 0.47. Acta Metall. Mater., 1992. 40(4): pp. 803-813.
25. A. K. Jena and M. C. Chaturvedi, The role of alloying elements in the design of
nickel-base superalloys. J. Mater. Sci., 1984. 19(10): pp. 3121-3139. 26. Y. Q. Li and J. Y. Liu, Precipitation and degeneration of grain-boundary Cr7C3
and M4B3 in Ni-Cr-Al-Ti nickel-base superalloys. J. Mater. Sci., 1992. 27(24): pp. 6635-6640.
27. M. G. Fontana, Corrosion engineering. McGraw-hill series in materials science
and engineering. 1986, New York: McGraw-Hill. 28. M. A. Phillips and B. Gleeson, Beneficial effects of rhenium additions on the
cyclic-oxidation resistance of β-NiAl+α-Cr alloys. Oxid. Met., 1998. 50(5-6): pp. 399-429.
29. P. Castello and F. H. Stott, Yttrium-promoted selective oxidation of aluminum in
the oxidation at 1100°C of an eutectic Ni-Al-Cr3C2 alloy. Corros. Sci., 1999. 41(5): pp. 901-918.
30. J. L. G. Carrasco, P. Adeva, and M. Aballe, The role of microstructure on
oxidation of Ni-Cr-Al base alloys at 1023 and 1123 K in air. Oxid. Met., 1990. 33(1-2): pp. 1-17.
31. W. Ostwald, Studien uber die bildung und umwandlung fester korper. Z. Phys.
Chem., 1897. 22: p. 289. 32. I. M. Lifshitz and V. V. Slyozov, The kinetics of precipitation from
supersaturated solid solutions. J. Phys. Chem. Solids, 1961. 19(1/2): pp. 35-50. 33. C. Wagner, Theorie der alterung von niederschlagen durch umlosen. Z.
Elektrochem., 1961. 65(7/8): p. 581. 34. R. Wagner, R. Kampmann, and P. W. Voorhees, Homogeneous second-phase
precipitation, in Phase transformations in materials, G. Kostorz, Editor. 2001, Wiley-VCH: New York. pp. 309-407.
35. L. Ratke and P. W. Voorhees, Growth and coarsening: Ripening in material
processing. 2002, Berlin: Springer-Verlag.

174
36. A. Umantsev and G. B. Olson, Ostwald ripening in multicomponent alloys. Scripta Metall. Mater., 1993. 29(8): pp. 1135-1140.
37. C. J. Kuehmann and P. W. Voorhees, Ostwald ripening in ternary alloys. Metall.
Mater. Trans. A, 1996. 27(4): pp. 937-943. 38. P. A. Beaven, M. K. Miller, and G. D. W. Smith, Microstructure and
microcomposition of a cast nickel-based superalloy, in Electron microscopy and analysis 1977, D. L. Misell, Editor. 1977, Institute of Physics: London, UK. pp. 199-203.
39. K. M. Delargy and G. D. W. Smith, Phase-composition and phase-stability of a
high-chromium nickel-based super-alloy, in939. Metall. Trans. A, 1983. 14(9): pp. 1771-1783.
40. K. M. Delargy, S. W. K. Shaw, and G. D. W. Smith, Effects of heat-treatment on
mechanical-properties of high- chromium nickel-base superalloy IN-939. Mater. Sci. Technol., 1986. 2(10): pp. 1031-1037.
41. A. Buchon, A. Bostel, and D. Blavette, Atom probe study of some fine scale
features in nickel-base superalloys. J. Phys.-Paris, 1989. 50(C8): pp. C8401-C8406.
42. D. Blavette, A. Bostel, and M. Bouet, Partitioning of alloying elements in a
nickel-base superalloy containing Nb and Mo - an atom-probe study. J. Phys.-Paris, 1984. 45(C9): pp. 379-384.
43. D. Blavette and A. Bostel, Phase composition and long range order in γ' phase
of a nickel base single crystal superalloy CMSX2 - an atom probe study. Acta Met., 1984. 32(5): pp. 811-816.
44. D. Blavette, A. Bostel, and J. M. Sarrau, Atom-probe microanalysis of a nickel-
base superalloy. Metall. Trans. A., 1985. 16(10): pp. 1703-1711. 45. L. Letellier, M. Guttmann, and D. Blavette, Atomic-scale investigation of grain-
boundary microchemistry in the nickel-based superalloy Astroloy with a 3-dimensional atom-probe. Philos. Mag. Lett., 1994. 70(4): pp. 189-194.
46. C. Pareige-Schmuck, F. Soisson, and D. Blavette, Ordering and phase
separation in low supersaturated Ni-Cr-Al alloys: 3D atom probe and Monte Carlo simulation. Mater. Sci. Eng. A, 1998. 250(1): pp. 99-103.

175
47. C. Pareige, F. Soisson, G. Martin, and D. Blavette, Ordering and phase separation in Ni-Cr-Al: Monte Carlo simulations vs three-dimensional atom probe. Acta Mater., 1999. 47(6): pp. 1889-1899.
48. A. P. Sutton and R. W. Balluffi, Interfaces in crystalline materials. Monographs
on the physics and chemistry of materials ; 51. 1996, Oxford: Oxford University Press.
49. B. W. Krakauer and D. N. Seidman, Absolute atomic-scale measurements of the
Gibbsian interfacial excess of solute at internal interfaces. Phys. Rev. B, 1993. 48(9): pp. 6724-6727.
50. D. N. Seidman, Subnanoscale studies of segregation at grain boundaries:
Simulations and experiments. Ann. Rev. Mater. Res., 2002. 32: pp. 235-269. 51. C. H. P. Lupis, Chemical thermodynamics of materials. 1983, Englewood Cliff,
NJ: Prentice Hall, Inc. 52. S. A. Dregia and P. Wynblatt, Equilibrium segregation and interfacial energy in
multicomponent systems. Acta Metall. Mater., 1991. 39(5): pp. 771-778. 53. D. A. Shashkov and D. N. Seidman, Atomic-scale studies of segregation at
ceramic/metal heterophase interfaces. Phys. Rev. Lett., 1995. 75(2): pp. 268-271. 54. R. Defay and I. Prigogine, Surface tension and adsorption. 1966, New York,
NY: John Wiley & Sons, Inc. 55. O. C. Hellman and D. N. Seidman, Measurement of the Gibbsian interfacial
excess of solute at an interface of arbitrary geometry using three-dimensional atom probe microscopy. Mater. Sci. Eng. A, 2002. 327(1): pp. 24-28.
56. J. G. Hu and D. N. Seidman, Atomic-scale observations of 2-dimensional Re
segregation at an internal interface in W(Re). Phys. Rev. Lett., 1990. 65(13): pp. 1615-1618.
57. D. N. Seidman, Solute-atom segregation at internal interfaces on an atomic scale
- atom-probe experiments and computer-simulations. Mater. Sci. Eng. A, 1991. 137: pp. 57-67.
58. M. Thuvander, K. Stiller, and E. Olsson, Influence of heat treatment on grain
boundary microstructure in a Ni-16Cr-10Fe-0.022C model material. Mater. Sci. Technol., 1999. 15(3): pp. 237-245.

176
59. M. Thuvander, K. Stiller, D. Blavette, and A. Menand, Grain boundary precipitation and segregation in Ni-16Cr-9Fe model materials. Appl. Surf. Sci., 1996. 94-5: pp. 343-350.
60. D. N. Seidman, B. W. Krakauer, and D. Udler, Atomic-scale studies of solute-
atom segregation at grain- boundaries - experiments and simulations. J. Phys. Chem. Solids, 1994. 55(10): pp. 1035-1057.
61. D. Udler and D. N. Seidman, Solute segregation at [001] tilt boundaries in dilute
FCC alloys. Acta Mater., 1998. 46(4): pp. 1221-1233. 62. M. K. Miller and H. Kurishita, APFIM characterization of grain boundary
segregation in titanium carbide-doped molybdenum. J. Phys. IV, 1996. 6(C5): pp. 265-270.
63. M. K. Miller and G. D. W. Smith, Atom-probe analysis of interfacial segregation.
Appl. Surf. Sci., 1995. 87-8(1-4): pp. 243-250. 64. S. M. Kuo, A. Seki, Y. Oh, and D. N. Seidman, Solute-atom segregation - an
oscillatory Ni profile at an internal interface in Pt(Ni). Phys. Rev. Lett., 1990. 65(2): pp. 199-202.
65. G. P. E. M. Van Bakel, K. Hariharan, and D. N. Seidman, On the structure and
chemistry of ni3al on an atomic-scale via atom-probe field-ion microscopy. Appl. Surf. Sci., 1995. 90(1): pp. 95-105.
66. D. K. Chan, D. N. Seidman, and K. L. Merkle, Chemistry and structure of
CdO/Ag(222) heterophase interfaces. Phys. Rev. Lett., 1995. 75(6): pp. 1118-1121.
67. D. A. Muller, D. A. Shashkov, R. Benedek, L. H. Yang, J. Silcox, and D. N.
Seidman, Atomic scale observations of metal-induced gap states at {222}MgO/Cu interfaces. Phys. Rev. Lett., 1998. 80(21): pp. 4741-4744.
68. D. A. Muller, D. A. Shashkov, R. Benedek, L. H. Yang, J. Silcox, and D. N.
Seidman, Atomic-scale studies of the electronic structure of ceramic/metal interfaces: {222}MgO/Cu, in Intergranular and interphase boundaries in materials, iib98. 1999. pp. 99-102.
69. D. A. Shashkov and D. N. Seidman, Atomic-scale studies of silver segregation at
MgO/Cu heterophase interfaces. Appl. Surf. Sci., 1996. 94-5: pp. 416-421.
177
70. D. A. Shashkov and D. N. Seidman, Atomic scale studies of silver segregation at {222}MgO/Cu heterophase interfaces, in Intergranular and interphase boundaries in materials, Pt 1. 1996. pp. 429-432.
71. D. A. Shashkov, M. F. Chisholm, and D. N. Seidman, Atomic-scale structure and
chemistry of ceramic/metal interfaces - I. Atomic structure of {222} MgO/Cu (Ag) interfaces. Acta Mater., 1999. 47(15-16): pp. 3939-3951.
72. D. A. Shashkov, D. A. Muller, and D. N. Seidman, Atomic-scale structure and
chemistry of ceramic/metal interfaces - II. Solute segregation at MgO/Cu (Ag) and CdO/Ag (au) interfaces. Acta Mater., 1999. 47(15-16): pp. 3953-3963.
73. E. W. Müller, Field ionization and field ion microscopy. Adv. Electron. El. Phys.,
1960. 13: pp. 83-179. 74. E. W. Müller, Field ion microscopy. Science, 1965. 149(3684): pp. 591-601. 75. M. K. Miller and G. D. W. Smith, Atom probe microanalysis: Principles and
applications to materials problems. 1989, Pittsburgh, PA: Materials Research Society.
76. M. K. Miller, A. Cerezo, M. G. Hetherington, and G. D. W. Smith, Atom probe
field ion microscopy. Monographs on the physics and chemistry of materials ; 52. 1996, Oxford: Oxford University Press.
77. E. W. Müller, J. A. Panitz, and S. B. McLane, Atom-probe field ion microscope.
Rev. Sci. Instrum., 1968. 39(1): pp. 83-86. 78. R. Gomer, Field emission and field ionization. American vacuum society classics.
1993, New York: American Institute of Physics. 79. J. R. Oppenheimer, Three notes on the quantum theory of aperiodic effects. Phys.
Rev., 1928. 31: pp. 66-81. 80. M. Drechsler and D. Wolf, Zur analyse von feldionemilroskop-aufmahmen mit
atomarer auflosung. Proceedings of International Congress for Electron Microscopy, 1960. 4: pp. 835-848.
81. E. W. Müller and T. T. Tsong, Field ion microscopy, field ionization and field
evaporation. Prog. Surf. Sci., 1973. 4(1): pp. 1-139.

178
82. D. Blavette, B. Deconihout, S. Chambreland, and A. Bostel, Three-dimensional imaging of chemical order with the tomographic atom-probe. Ultramicroscopy, 1998. 70(3): pp. 115-124.
83. B. Deconihout, C. Pareige, P. Pareige, D. Blavette, and A. Menand, Tomographic
atom probe: New dimension in materials analysis. Microsc. Microanal., 1999. 5(1): pp. 39-47.
84. K. Hono and M. Murayama, Nanoscale microstructural analyses by atom probe
field ion microscopy. High Temp. Mater. Process., 1998. 17(1-2): pp. 69-85. 85. O. C. Hellman, J. A. Vandenbroucke, J. Rusing, D. Isheim, and D. N. Seidman,
Analysis of three-dimensional atom-probe data by the proximity histogram. Microsc. Microanal., 2000. 6(5): pp. 437-444.
86. René N6, us patent, 5,270,123. 87. P. J. Warren, A. Cerezo, and G. D. W. Smith, An atom probe study of the
distribution of rhenium in a nickel- based superalloy. Mater. Sci. Eng. A, 1998. 250(1): pp. 88-92.
88. L. G. Parratt, Probability and experimental errors in science. 1966, New York:
John Wiley and Sons, Inc. 89. N. Wanderka and U. Glatzel, Chemical composition measurements of a nickel-
base superalloy by atom probe field ion microscopy. Mater. Sci. Eng. A, 1995. 203(1-2): pp. 69-74.
90. C. K. Sudbrack, D. Isheim, R. D. Noebe, N. S. Jacobson, and D. N. Seidman, The
influence of tungsten on the chemical composition of a temporally evolving nanostructure of a model Ni-Al-Cr superalloy. Microsc. Microanal., to appear 2004.
91. O. Hellman, J. Vandenbroucke, J. B. du Rivage, and D. N. Seidman, Application
software for data analysis for three-dimensional atom probe microscopy. Mater. Sci. Eng. A, 2002. 327(1): pp. 29-33.
92. O. C. Hellman, J. B. du Rivage, and D. N. Seidman, Efficient sampling for three-
dimensional atom probe microscopy data. Ultramicroscopy, 2003. 95(1-4): pp. 199-205.
93. W. Huang and Y. A. Chang, A thermodynamic description of the Ni-Al-Cr-Re
system. Mater. Sci. Eng. A, 1999. 259(1): pp. 110-119.

179
94. B. W. Krakauer, J. G. Hu, S. M. Kuo, R. L. Mallick, A. Seki, D. N. Seidman, J. P.
Baker, and R. J. Loyd, A system for systematically preparing atom-probe field-ion-microscope specimens for the study of internal interfaces. Rev. Sci. Instrum., 1990. 61(11): pp. 3390-3398.
95. M. K. Miller, Atom probe tomography: Analysis at the atomic level. 2000, New
York: Kluwer Academic / Plenum Publishers. 96. Z. Mao, P. Bellon, and D. N. Seidman. Ordering and decomposition of Ni-Al-Cr
superalloy: A three dimensional study by kinetic Monte Carlo simulations. in Materials Science and Technology 2003. 2003. Chicago, IL.
97. C. K. Sudbrack, Ph.D. thesis, Northwestern University, 2004. 98. W. B. Pearson, A handbook of lattice spacings and structures of metals and
alloys. International series of monographs on metal physics and physical metallurgy ; v. 4. Vol. 1. 1958, Oxford: Pergamon Press.
99. E. Hornbogen and M. Roth, Distribution of coherent particles in nickel alloys. Z.
Metallk., 1967. 58(12): pp. 842-855. 100. Y. Mishima, S. Ochiai, and T. Suzuki, Lattice-parameters of Ni(γ), Ni3Al(γ') and
Ni3Ga(γ') solid-solutions with additions of transition and B-subgroup elements. Acta Met., 1985. 33(6): pp. 1161-1169.
101. T. Miyazaki, H. Imamura, and T. Kozakai, The formation of "γ'-precipitate
doublets" in Ni-Al alloys and their energetic stability. Mater. Sci. Eng., 1982. 54(1): pp. 9-15.
102. M. Doi and T. Miyazaki, The effects of elastic interaction energy on the shape of
γ' precipitate in nickel-based alloys, in Fifth international symposium on superalloys, M. Gell et al., Editors. 1984, AIME: Champion, PA. pp. 543-552.
103. M. Doi, T. Miyazaki, and T. Wakatsuki, The effects of elastic interaction energy
on the γ' precipitate morphology of continuously cooled nickel-base alloys. Mater. Sci. Eng., 1985. 74(2): pp. 139-145.
104. M. J. Kaufman, P. W. Voorhees, W. C. Johnson, and F. S. Biancaniello, An
elastically induced morphological instability of a misfitting precipitate. Metall. Trans. A, 1989. 20(10): pp. 2171-2175.

180
105. P. W. Voorhees, Ostwald ripening of 2-phase mixtures. Annu. Rev. Mater. Sci., 1992. 22: pp. 197-215.
106. R. F. Decker and J. R. Mihalisin, Coherency strains in γ' hardened nickel alloys.
Trans. ASM, 1969. 62(2): pp. 481-489. 107. C. B. Fuller, Ph.D. thesis, Northwestern University, 2003. 108. K. Binder and D. Stauffer, Theory for slowing down of relaxation and spinodal
decomposition of binary mixtures. Phys. Rev. Lett., 1974. 33(17): pp. 1006-1009. 109. K. Binder, Theory for dynamics of "clusters." ii. Critical diffusion in binary
systems and kinetics of phase separation. Phys. Rev. B, 1977. 15(9): pp. 4425-4447.
110. K. Binder and D. W. Heermann, Growth of domains and scaling in the late
stages of phase separation and diffusion-controlled ordering phenomena, in Scaling phenomena in disordered systems, R. Pynn and A. Skjeltorp, Editors. 1985, Plenum Press: New York. pp. 207-230.
111. Z. Mao, G. Martin, and D. N. Seidman. The mobility and kinetics of solutes in a
Ni-Al-Cr superalloy: A three dimensional atomic study by kinetic Monte Carlo simulations. in Materials Science and Technology 2003. 2003. Chicago, IL.
112. D. L. Anton and F. D. Lemkey, Quinary alloy modifications of the eutectic
superalloy γ/γ'+Cr3C2, in Fifth international symposium on superalloys, M. Gell et al., Editors. 1984, AIME: Champion, PA. pp. 601-610.
113. A. F. Giamei and D. L. Anton, Rhenium additions to a Ni-base superalloy -
effects on microstructure. Met. Trans. A, 1985. 16(11): pp. 1997-2005. 114. K. Harris, G. L. Erikson, and R. E. Schwer, CMSX single crystal, CM DS &
integral wheel alloys properties & performance, in High temperature alloys for gas turbines and other applications, W. Betz et al., Editors. 1986, D. Reidel publishing company: Liege, Belgium. pp. 709-728.
115. D. J. Frasier, J. R. Whetstone, K. Harris, and G. L. Erickson, Process and alloy
optimization for CMSX-4 superalloy single crystal airfoils, in High temperature materials for power engineering 1990, E. Bachelet et al., Editors. 1990, Kluwer academic publishers: Liege, Belgium. pp. 1281-1300.

181
116. T. Hino, Y. Yoshioka, K. Nagata, H. Kashiwaya, T. Kobayashi, Y. Koizumi, H. Harada, and T. Yamagata, Design of high Re containing single crystal superalloys for industrial gas turbines, in Materials for advanced power engineering 1998, J. Lecomte-Beckers, F. Schubert, and P. J. Ennis, Editors. 1998, Forschungszentrum Julich GmbH: Liege, Belgium. pp. 1129-1137.
117. P. Caron and T. Khan, Third generation superalloys for single crystal blades, in
Materials for advanced power engineering 1998, J. Lecomte-Beckers, F. Schubert, and P. J. Ennis, Editors. 1998, Forschungszentrum Julich GmbH: Liege, Belgium. pp. 897-912.
118. A. D. Brailsford and P. Wynblatt, Dependence of ostwald ripening kinetics on
particle volume fraction. Acta Met., 1979. 27(3): pp. 489-497. 119. K. E. Yoon, D. Isheim, R. D. Noebe, and D. N. Seidman, Nanoscale studies of
the chemistry of a René N6 superalloy. Interface Sci., 2001. 9(3/4): pp. 249-255. 120. A. G. Khachaturyan, T. F. Lindsey, and J. W. Morris, Theoretical investigation
of the precipitation of δ' in Al-Li. Metall. Trans. A, 1988. 19(2): pp. 249-258. 121. W. A. Soffa and D. E. Laughlin, Decomposition and ordering processes
involving thermodynamically first-order order→ disorder transformations. Acta Met., 1989. 37(11): pp. 3019-3028.
122. M. Athenes, P. Bellon, G. Martin, and F. Haider, A Monte-Carlo study of B2
ordering and precipitation via vacancy mechanism in bcc lattices. Acta Mater., 1996. 44(12): pp. 4739-4748.
123. A. J. Ardell, An application of theory of particle coarsening - γ' precipitate in Ni-
Al alloys. Acta Met., 1968. 16(4): pp. 511-516. 124. A. J. Ardell and R. B. Nicholson, On modulated structure of aged Ni-Al alloys.
Acta Met., 1966. 14(10): pp. 1295-1309. 125. D. J. Chellman and A. J. Ardell, Coarsening of γ' precipitates at large volume
fractions. Acta Met., 1974. 22(5): pp. 577-588. 126. T. Hirata and D. H. Kirkwood, Prediction and measurement of precipitate
number densities in a nickel-6.05 wt.%-aluminum alloy. Acta Met., 1977. 25(12): pp. 1425-1434.

182
127. H. Wendt and P. Haasen, Nucleation and growth of γ'-precipitates in Ni-14 at% Al. Acta Met., 1983. 31(10): pp. 1649-1659.
128. T. A. Abinandanan, F. Haider, and G. Martin, Phase transformations involving
ordering and phase separation: A Monte Carlo study. Solid State Phenom., 1995. 42/43: pp. 87-96.
129. H. Gleiter and E. Hornbogen, Formation of coherent ordered precipitates in Ni-
Cr-Al-alloy. Z. Metallk., 1967. 58(3): pp. 157-163. 130. A. Epishin, U. Bruckner, P. D. Portella, and T. Link, Influence of small rhenium
additions on the lattice spacing of nickel solid solution. Scripta Mater., 2003. 48(4): pp. 455-459.
131. P. Caron, High γ' solvous new generation nickel-based superalloys for single
crystal turbine blade applications, in Superalloys 2000, T. M. Pollock et al., Editors. 2000, TMS: Warrendale, PA. pp. 737-746.
132. C. E. Campbell, Personal communication. 133. A. D. Sequeira, H. A. Calderon, G. Kostorz, and J. S. Pedersen, Bimodal size
distributions of γ' precipitates in Ni-Al-Mo-I. Small-angle neutron scattering. Acta Metall. Mater., 1995. 43(9): pp. 3427-3439.
134. A. D. Sequeira, H. A. Calderon, G. Kostorz, and J. S. Pedersen, Bimodal size
distributions of γ' precipitates in Ni-Al-Mo-II. Transmission electron microscopy. Acta Metall. Mater., 1995. 43(9): pp. 3441-3451.
135. E. E. Underwood, Quantitative stereology. 1970, Reading, MA: Addison-Wesley
Publishing Company. 136. P. M. Kelly, Quantitative electron microscopy. Met. Forum, 1982. 5(1): pp. 13-
23.

183
Appendix A
Data analysis
A.1. Data analyses of 3DAP microscopy results
The data analyses were performed using ADAM 1.5 software [55, 85, 91, 92].
ADAM 1.5 is a custom Macintosh application, currently employing OS9, developed at
Northwestern University specifically to analyze data generated by a 3DAP microscope.
The 3DAP microscopy reconstructions are obtained assuming 60 % detection efficiency
for the average atomic density of the matrix (83 atoms nm-3 for Ni) for lateral scaling,
while utilizing the interplanar atomic spacing for known crystallographic directions for
depth scaling. The error in concentration is represented by the standard deviation, σsd:
atoms
iisd N
CC )1( −=σ ; (A.1)
which was determined by employing standard counting statistics. The quantity Ci is the
measured atomic concentration of element i and Natoms is the total number of atoms
detected.
The proxigram [85] method is a data analysis technique that we have developed
to generate concentration profiles associated with interfaces independent of the
topological complexity of an interface. This analysis technique integrates the chemical
and three-dimensional positional information and then generates a histogram of the
atomic fractions of all alloying elements versus distance to an interface, for all the
interfaces in a specimen, in parallel, delineated by the isoconcentration surface. In

184
addition, it does not require choosing any arbitrary axis or geometric subvolume. In this
study, an isoconcentration surface with a threshold value of 9 at.% Al for the Ni-14.2
at.% Cr-5.2 at.% Al and 12 at.% Al for Ni-8.5 at.% Cr-10 at.% Al-2 at.% Re alloy are
used to define the location of all γ/γ′ interfaces for each aging time. The nominal
composition of the two alloys are different, therefore different threshold values are
utilized. Using an Al isoconcentration surface as a reference surface, the atomic
concentration of each element can be calculated at specific distances away from the γ/γ′
interfaces, for all interfaces present in the analysis volume. In addition, this analysis
technique makes it possible to analyze the properties of individual precipitates, such as
radius and composition, in parallel by differentiating all the precipitates at once from the
matrix using the isoconcentration surface as the matrix/precipitate interface.
A.2. Data analyses of CTEM results
The micrographs obtained employing CTEM were scanned at a resolution of 800
to 1600 dpi depending of the radius of γ′−precipitates. Adobe Photoshop was utilized to
crop and to optimize the brightness and contrast of the micrographs, and to delineate the
precipitates by placing a transparent layer over the micrographs and tracing the outline
of each precipitate. Only the layers with the outlines of precipitates were saved for the
precipitate analyses, which were performed using NIH Image. The software measured
the area, perimeter length, maximum caliper diameter, and minimum caliper diameter of
each precipitate.

185
The radii of γ′−precipitates were determined from the area of precipitates
measured from the micrographs, assuming the precipitates to be circular on the projected
planes. Then, the mean radius, <R>, of γ′−precipitates were calculated employing
precipitate size distributions (PSDs). The error in <R> is determined from the standard
deviation of the mean radius of precipitates, σ<R>, as follow:
Nsd
rσ
σ =>< ; (A.2)
where σsd the standard deviation determined from the PSDs (i.e. the width of the PSDs)
and N is the number of the precipitates measured. The projected areal fraction, A′, of the
precipitates was determined for each micrograph by dividing the total area of the
precipitates by the area of the entire micrograph. The volume fraction, Vf, and number
density, Nv, of the precipitates were calculated utilizing <R> and A′ [135, 136]. Vf was
determined as follow:
+><><
−−=hR
RAV f 344)'1ln( ; (A.3)
where h is the thickness of the TEM specimen, while Nv was determined as follow:
><++
=Rh
MNN AAv 2
'' ; (A.4)
where NA′ is the projected precipitates area density calculated by dividing the total
number of precipitates by the area of entire micrograph and MA′ is the correction factor
for overlapping, which is expressed by:

186
'22
3' AfA NR
hVM
><= . (A.5)

187
Vita
Kevin Eylhan Yoon
Place of birth: Rolla, MO
Education • Northwestern University, Evanston, IL 1998 – present
Ph.D., Materials Science and Engineering
• Yonsei University, Seoul, Korea 1994 –1998 B.S., Metallurgical Engineering
Research Experience • Northwestern University 1998 – Present
Research Assistant, Department of Materials science and Engineering Publications • K. E. Yoon
Ph.D. thesis, Northwestern University, 2004.
• K. E. Yoon, R. D. Noebe, and D. N. Seidman “The effects of Re addition on the nanostructure, chemistry, and coarsening kinetics of a Ni-Cr-Al superalloy,” to be submitted.
• K. E. Yoon, C. K. Sudbrack, R. D. Noebe, and D. N. Seidman “Nanoscale investigation of the temporal evolution of a Ni-Cr-Al superalloy,” to be submitted.
• K. E. Yoon, O. C. Hellman, R. D. Noebe, and D. N. Seidman “Dependence of the Interfacial Excess on the Threshold Value of the Isoconcentration Surface,” Surface and Interface Analysis, to appear 2004.
• K. E. Yoon, D. Isheim, R. D. Noebe, and D. N. Seidman “Nanoscale Studies of the Chemistry of a René N6 Superalloy,” Interface Science 9 (2001) 249-255.
• C. K. Sudbrack, K. E. Yoon, Z. Mao, R. D. Noebe, D. Isheim, and D. N. Seidman “Temporal evolution of nanostructures in a model nickel-base superalloy: experiments and simulations,” in Electron Microscopy: Its Role in Materials Research – The Mike Meshii Symposium, J. R. Weertman et al. Editors. (TMS (The Minerals, Metals & Materials Society), Warrendale, PA, 2003), pp. 43-50.
Presentations • K. E. Yoon, R. D. Noebe, and D. N. Seidman
“The effects of Re on the temporal evolution of the nanostructure of Ni-Cr-Al superalloy,” presented by K. E. Yoon at Materials Science & Technology 2003, Chicago, IL, November 2003.

188
• C. K. Sudbrack, K. E. Yoon, D. Isheim, R. D. Noebe, and D. N. Seidman “Three-Dimensional Atom-Probe Microscope Study of the Temporal Evolution of a Model Ni-Base Superalloy, Ni-5.2 Al-14.2 Cr at. %, on a Nanoscale,” presented by C. K. Sudbrack at Materials Science & Technology 2003, Chicago, IL, November 2003.
• D. N. Seidman, K. E. Yoon, C. K Sudbrack, Z. Mao, D. Isheim, R. D. Noebe, and P. Bellon “Temporal evolution of nanostructures in a model nickel-base superalloy: experiments and simulations,” presented by D. N. Seidman at 2003 TMS Annual meeting, San Diego, CA, February 2003
• K. E. Yoon, R. D. Noebe, and D. N. Seidman “Dependence of the Gibbsian Interfacial Excess on the Threshold Value of the Isoconcentration Surface,” presented by K. E. Yoon at 48th International Field Emission Symposium, Lyon, France, July 2002
• K. E. Yoon, R. D. Noebe, and D. N. Seidman “Nanoscale studies of the effects of refractory elements on the temporal evolution of the microstructure of a Ni-Cr-Al superalloy,” presented by K. E. Yoon at 48th International Field Emission Symposium, Lyon, France, July 2002
• C. K. Sudbrack, K. E. Yoon, D. Isheim, R. D. Noebe, and D. N. Seidman “A comparison of the early stages of decomposition and coarsening in Ni-Al-Cr superalloys with a low and a high supersaturation of Al,” presented by D. Isheim at 48th International Field Emission Symposium, Lyon, France, July 2002
• K. E. Yoon, R. D. Noebe, and D. N. Seidman “Temporal Evolution of Microstructures in Nickel-based Superalloys: Nanoscale studies by three-dimensional atom-probe microscopy,” presented by K. E. Yoon at NASA Glenn Research Center, July 2002
• D. Isheim, C. B. Fuller, S. S. A. Gerstl, E. A. Marquis, C. K Sudbrack, K. E. Yoon, O.C. Hellman, and D.N. Seidman “Three-dimensional Microstructural Characterization at the Atomic Level by Atom-Probe Microscopy,” presented by D. Isheim at 2002 TMS Fall Meeting, Columbus, OH, October 2002
• K. E. Yoon, D. Isheim, R. D. Noebe, and D. N. Seidman “Nanoscale Studies of the Chemistry of a René N6 Superalloy,” presented by K. E. Yoon at 10th International Conference on Intergranular & Interphase Boundaries, Haifa, Israel, July, 2001 and 47th International Field Emission Symposium, Berlin, Germany, July 2001
Scholarships and Awards • National Aeronautics & Space Administration Graduate Student Researchers

189
Program fellowship • National Aeronautics & Space Administration traineeship • Walter P. Murphy Research Fellowship, Northwestern University • Four year full academic scholarship, Yonsei University