
NORTHWESTERN UNIVERSITY Formwork Pressure of Self ...
293
NORTHWESTERN UNIVERSITY Formwork Pressure of Self-Consolidating Concrete: Influence of Flocculation Mechanisms, Structural Rebuilding, Thixotropy and Rheology A DISSERTATION SUBMITTED TO THE GRADUATE SCHOOL IN PARTIAL FULFILLMENT OF THE REQUIREMENTS for the degree DOCTOR OF PHILOSOPHY Field of Civil and Environmental Engineering By Raissa Patricia Douglas Ferron EVANSTON, ILLINOIS December 2008
Transcript of NORTHWESTERN UNIVERSITY Formwork Pressure of Self ...

NORTHWESTERN UNIVERSITY
Formwork Pressure of Self-Consolidating Concrete: Influence of Flocculation Mechanisms,
Structural Rebuilding, Thixotropy and Rheology
A DISSERTATION
SUBMITTED TO THE GRADUATE SCHOOL IN PARTIAL FULFILLMENT OF THE REQUIREMENTS
for the degree
DOCTOR OF PHILOSOPHY
Field of Civil and Environmental Engineering
By
Raissa Patricia Douglas Ferron
EVANSTON, ILLINOIS
December 2008

2
© Copyright by Raissa Patricia Ferron 2008 All Rights Reserved

3
ABSTRACT
Formwork Pressure of Self-Consolidating Concrete: Influence of Flocculation
Mechanisms, Structural Rebuilding, Thixotropy and Rheology
Raissa Patricia Douglas Ferron
While self-consolidating concrete (SCC) may no longer be considered a “new concrete”,
there are still significant challenges to overcome before there is broader acceptance of SCC. One
of these challenges concerns the formwork pressure exerted by SCC. A major advantage of SCC
is the accelerated casting process due to the elimination of external vibration. However, faster
casting rates may induce higher formwork pressure; this is a major concern for cast-in place
applications, especially when casting tall elements.
It has been reported that the formwork pressure of SCC can be less than hydrostatic
pressure. This is due to the build-up of a three-dimensional structure when the concrete is left at
rest. The development of this structure and the mechanisms behind it are of particular interest to
users of SCC.
The research presented in this manuscript was carried out at the Center for Advanced
Cement-Based Materials at Northwestern University and the Universidad Complutense de
Madrid. This dissertation focuses on the structural rebuilding SCC and its implications for
formwork pressure. Special emphasis was given to the influence of flocculation mechanisms and
the impact of material constituents. A rheological protocol to characterize structural rebuilding
was developed. This protocol can be used to assess the contributions from irreversible structural

4
build-up from hydration and reversible structural rebuilding from thixotropic effects. The
impact of various mixture ingredients, including cement type, mineral admixtures, chemical
admixtures and clays, on the structural rebuilding was examined. The results showed that the
rheological properties of the paste matrix and its evolution over time can be used as an indication
of the formwork pressure behavior. Formwork pressure is highly impacted by the structural
rebuilding that occurs in the paste matrix, and the results showed that formwork pressure is
related to the rate at which structural rebuilding occurs and the total amount of structural build-
up. In addition, a novel experimental technique was used to examine the flocculation and
breakage mechanisms of cement paste suspensions subjected to shear using. It is believed to be
the first time that direct investigation of the microstructural response of concentrated cement
paste suspensions subjected to shear-induced stresses has occurred.

5
ACKNOWLEDGEMENTS
“No woman is an island”
Those five words sum up my personal motto on life. I firmly believe that I am here in this
position right now because of the support, guidance, love, and sacrifice of many people. To all
those whom have helped me to this point in my life, I thank you for your support.
I thank the Lord for all the gifts that he has bestowed on me. All praises and glories are his, and
I thank him for carrying me through this journey.
The work presented in this dissertation was supported through funding obtained from the
Strategic Development Council of the American Concrete Institute, National Ready-Mix
Concrete Foundation, and National Science Foundation (Grant #0625606). Thank you for
recognizing the importance of this work and for providing financial support.
To my advisor Professor Surendra Shah: I remember the first time we spoke. I was in my
dormitory at Howard University (big-up HU), and I answered the phone and it was you on the
other line. That phone call has shaped my life, and I thank you for agreeing to be my advisor.
Whenever anyone asks me why I selected Northwestern University, I always say, “to work with
Professor Shah”. I have never regretted that decision. I thank you for your encouragement and
support over the last couple of years. You cared about my holistic development and made me a

6
better researcher, teacher, gym-goer, wine drinker…..to put it shortly you have made me a
better person. Thank you.
To my committee members Professors Isaac Daniel and Hamlin Jennings: Thank you for
participating in my research career. I am grateful for all the support you have given me and
discussions we have had about my career and research. I am especially thankful for the millions
of letters of references you wrote on my behalf. Professor Jennings, I would like to add a special
note thanking you for pushing me to think deeper about the issues. You have helped me to
become a better researcher, and I sincerely appreciate all the conversations that we had not only
about my research, but about life. Thank you both for all of your help and support.
To Professor Kamal Khayat, Professor Maria Consta, and Dr. David Bonen: Thank you for
your invaluable insights about this work. I sincerely appreciated all of your support, discussions
and recommendations. I am especially grateful to Dr. Yanfei Peng at USG for the chemical
analysis tests and particle size distribution tests she performed.
To Professor Carlos Negro and Dr. Elena Fuente: Me gustaria agradecerte por todo lo que me
has ayudado. The last part of this research could never have been completed without your
support. Thank you for welcoming me into your research group and making me feel at home.

7
To Dean Warren, Dean Henschen, Cheryl Judice, and Mario Craigen: Thank you for all the
assistance you have given me throughout my tenure at Northwestern. At times when it seems
that the road was blocked, you made a way. Thank you for all of your support.
To Richard Garza: I appreciate you keeping me sane. I will miss you and my coconut
cupcakes. Thank you for all of your support. I look forward to seeing you and Kim in Austin.
To all lab technicians that have helped me, especially Steve Albertson, Richard Warta, David
Ventre and Saman Shafaie: Thank you for all of your assistance. This research would not have
been possible without your technical expertise.
To industrial suppliers of materials, especially Lafarge, Holcim, BASF, W.R. Grace, Dynergy
Energy, and Ozinga: I am thankful for all the material donations that I received throughout the
course of this work. Thank you for your support.
To my ACBM family: I will always remember the good times we have shared. Each one of you
helped shaped my graduate school experience. I will miss the long hours in the lab (ok, maybe
not) and our random discussions about life. Mark, Shiho, Paramita, Giri, Katie, Sun, Aleksandra,
Mauren, Ana, Nilufer, Jon---thanks for all of the good times. Nathan, you are my SCC-
flocculation brother. Who else would have had conversations with me at 4 AM about viscosity
and yield stress? No one (that’s because everyone else has a life). Amedeo, you were there
when I started on this research project and you are here to see the end. The funny thing is that

8
you live in Italy, so I am grateful that you keep coming to the States to visit me. Seriously,
thank you for all of your support and insightful comments. Mrs. Shah, thank you for “balancing
out” Professor Shah. You made me feel at home at ACBM, and I will miss your wonderful
dinner parties. Giri, my little brother, you are the “Mafia” guru. If there is ever anyone looking
to get me, I will call you to help me figure out who it is. Paramita, I know we will be in touch.
Thanks for all your support. I will miss our conversations about finding a job, but I guess our
new conversations will focus on finding research grants. Good Luck at UIUC. Zoi, wow I can’t
believe that I am actually leaving you. I will miss you, our lunches at Mandarin, and our
discussion about men. LOL. I am so happy that I had a chance to meet you and I look forward to
visiting you in Greece. You will always be my office buddy. Hold it down for the ladies in
A120. I will miss you.
To my BGSA family: Another one is out the door! This time it is me. Thank you for the special
friendships and keeping me grounded. Laura, Yolanda, Deidra, Lexyne, Stacey, Cynthia, James
Fin., Janaka, Uche, Ade, Michelle, A. Smart—I will miss our good times. I don’t know how I
would have lasted at Northwestern without ya’ll. I will miss our writing sessions, nail salon
excursions, and our lunches. Thank you for bringing some flavor to my experience at
Northwestern.
To all my professors and teachers: To my high school physics teacher: Thank you for
introducing me to the world of engineering and nominating me to attend the summer engineering
program at the University of Vermont and Manhattan College. To my professors at Howard

9
University, especially Dr. Kimberly Jones, Dr. Errol Noel, Dean James Johnson, Dr. Robert
Efimba, Dr. Laurence Burley, and Dr. Gajanan Sabnis: Thank you for encouraging me attend
graduate school and for giving me the foundation to excel at Northwestern University.
To my best friend, Natasha Russell: Girl, you have had my back since the third grade and I
don’t know what I would do with out you. Thank you for listening to me vent, being excited
when I had an accomplishment in my research, motivating me, and keeping me up to date on the
latest styles, trends, and dances. I look forward to us starting the next chapters of our lives
together in Austin.
To my family, especially my Parents and siblings: To my parents. I am who I am because of
you. You told me that I could achieve anything I set out to do, and instilled in me a sense of
perseverance and confidence that I helped me along this journey towards obtaining my doctorate.
Your love and support has shaped me into the woman that I am today. I thank you for all of the
hard work and sacrifices that you have made. To my daddy, Celestine Harold Douglas: You are
my champion. When I am down, you lift me up. Thank you for all of your support and for being
interested in my work. Now we can get started on the house in Grenada. To my mommy,
Patresia Bernadette Sylvester Douglas: I admire you so much. You have showed me what it
means to be a woman of strength, fortitude and determination. You have supported and stood by
me no matter where this road of life has me, literally and figuratively. I will always remember
you sitting in the audience during my presentation in Sorrento. I think you were more nervous
than me! To my sister Celeste and my brother Doug: Now you must call me Doctor! Seriously,

10
I thank you for always having faith in me and for supporting me. Celeste, you are my role
model. When I look at you, I see everything that I hope to be. I am truly honored to be your little
sister, and I look forward to us working together to transform the educational system in Brooklyn
and in Austin. To my little brother Dougy: You know how to keep me grounded. Thank you for
your unwavering support and for knowing how to make me laugh when I am stressed. Who
knows, maybe you will be the next Douglas to get a PhD? To my aunts, uncles, and
grandparents, I stand on your shoulders. Aunty Veda, you will always be with me.
To my husband Marcus: I know you were wondering when I would get to you. Words can not
express how grateful I am to have you by my side. I am blessed to have you as my partner in
life. I thank you for keeping me nourished---physically and emotionally. I appreciate all the
sacrifices you have made, and I thank you for your understanding and patience. You have
always had my back. You are my rock, and you believed in me when I doubted myself. I know
that together we can accomplish anything. You are the best husband I have ever had (LOL).
Okay, okay…you are the best husband in the world, and I did not write that because you told me
that I better write you a good acknowledgement. I wrote it because my heart says it is true. You
know when to encourage me, and you know when to back off. I appreciate you staying up late at
night with me when you could have been sleeping (you know I would have been sleeping, ).
Thank you for coming to the lab and helping me mix concrete. Thank you for all the hugs and
kisses. Thank you for keeping my life balanced. Thank you for holding my hand and telling me
that everything will be okay. Because when you said it, I knew that was true. But most of all,
thank you for being you. And guess what? You won’t have to hear me say “Do you actually

11
think I can finish this?” Because you know what, I did…we did it. Thank you. I love you.
Saltfish and Bakes. Let’s get it started.
12
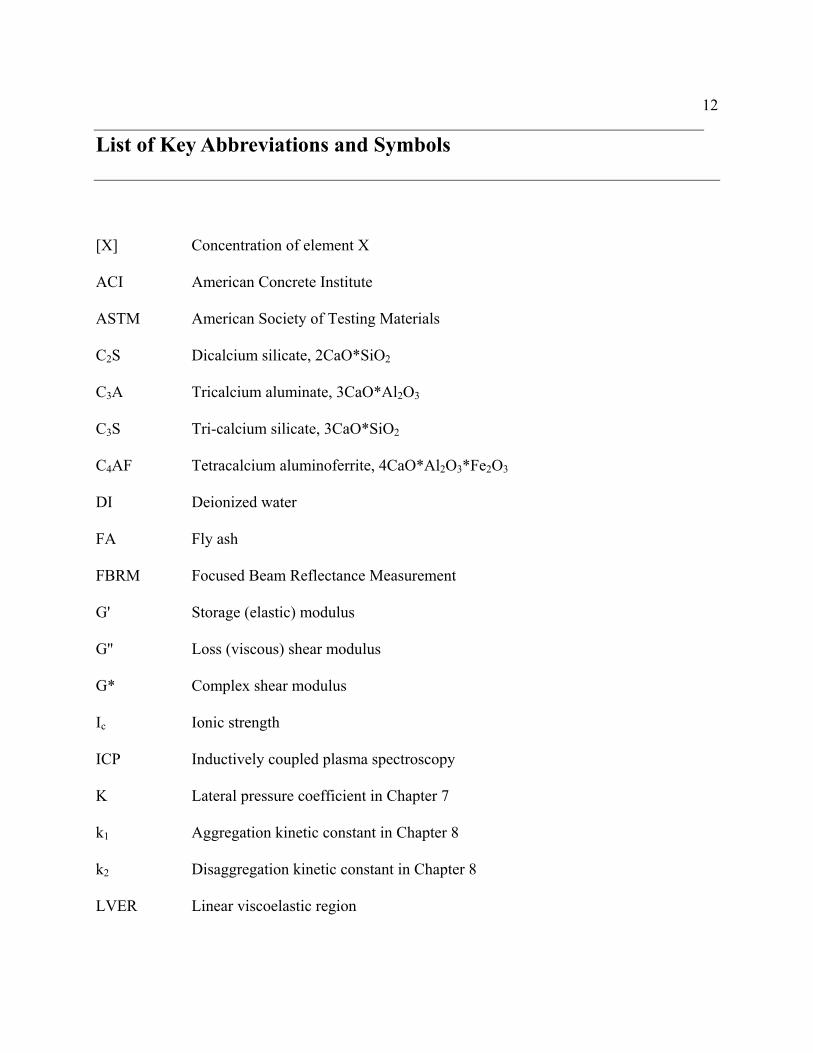
List of Key Abbreviations and Symbols
[X] Concentration of element X
ACI American Concrete Institute
ASTM American Society of Testing Materials
C2S Dicalcium silicate, 2CaO*SiO2
C3A Tricalcium aluminate, 3CaO*Al2O3
C3S Tri-calcium silicate, 3CaO*SiO2
C4AF Tetracalcium aluminoferrite, 4CaO*Al2O3*Fe2O3
DI Deionized water
FA Fly ash
FBRM Focused Beam Reflectance Measurement
G' Storage (elastic) modulus
G'' Loss (viscous) shear modulus
G* Complex shear modulus
Ic Ionic strength
ICP Inductively coupled plasma spectroscopy
K Lateral pressure coefficient in Chapter 7
k1 Aggregation kinetic constant in Chapter 8
k2 Disaggregation kinetic constant in Chapter 8
LVER Linear viscoelastic region
13
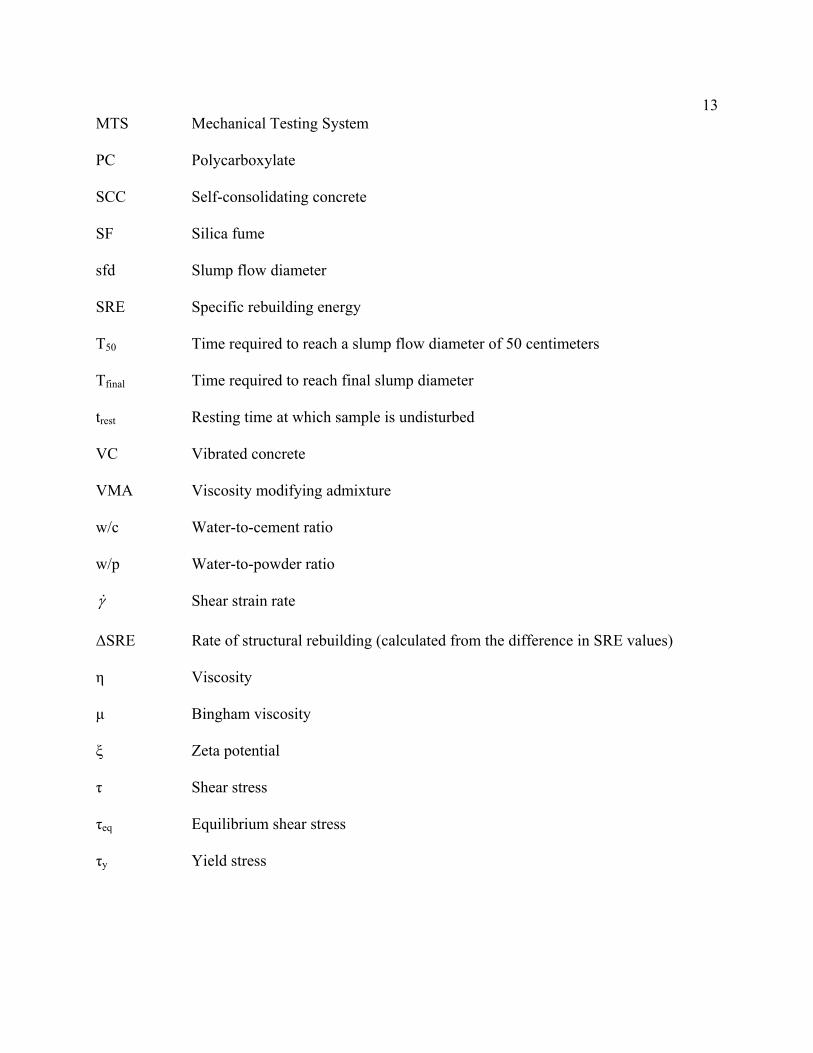
MTS Mechanical Testing System
PC Polycarboxylate
SCC Self-consolidating concrete
SF Silica fume
sfd Slump flow diameter
SRE Specific rebuilding energy
T50 Time required to reach a slump flow diameter of 50 centimeters
Tfinal Time required to reach final slump diameter
trest Resting time at which sample is undisturbed
VC Vibrated concrete
VMA Viscosity modifying admixture
w/c Water-to-cement ratio
w/p Water-to-powder ratio
γ& Shear strain rate
ΔSRE Rate of structural rebuilding (calculated from the difference in SRE values)
η Viscosity
μ Bingham viscosity
ξ Zeta potential
τ Shear stress
τeq Equilibrium shear stress
τy Yield stress

14
Dedicated to my parents, Patresia and Harold Douglas, for creating the path to get me here
and to my husband, Marcus Ferron, for walking beside me along the path.

15
Table of Contents
ABSTRACT................................................................................................................................... 3
ACKNOWLEDGEMENTS ......................................................................................................... 5
LIST OF KEY ABBREVIATIONS AND SYMBOLS ............................................................ 12
LIST OF TABLES ...................................................................................................................... 21
LIST OF FIGURES .................................................................................................................... 23
PART I: OVERVIEW ................................................................................................................ 34
1 CHAPTER 1: INTRODUCTION...................................................................................... 35
1.1 PROBLEM OVERVIEW..................................................................................................... 35
1.2 RESEARCH OBJECTIVES ................................................................................................. 37
1.3 STRUCTURE OF THE DISSERTATION................................................................................ 37
PART II: BACKGROUND/LITERATURE REVIEW........................................................... 39
2 CHAPTER 2: SELF-CONSOLIDATING CONCRETE AND LATERAL PRESSURE
………………………………………………………………………………………………40
2.1 INTRODUCTION .............................................................................................................. 40
2.2 SELF-CONSOLIDATING CONCRETE................................................................................. 40
2.2.1 Advantages and Disadvantages ...........................................................................................................41
2.2.2 Mix Proportioning ...............................................................................................................................43

16
2.3 FORMWORK PRESSURE OF SELF-CONSOLIDATING CONCRETE ....................................... 47
3 CHAPTER 3: RHEOLOGY AND FLOCCULATION................................................... 55
3.1 INTRODUCTION .............................................................................................................. 55
3.2 RHEOLOGY..................................................................................................................... 55
3.2.1 Rheological Categories........................................................................................................................57
3.2.2 Measurement........................................................................................................................................61
3.3 ORIGIN OF YIELD STRESS IN CEMENT PASTE................................................................... 63
3.4 ORIGIN OF THIXOTROPY IN CEMENT PASTE..................................................................... 65
3.4.1 Rheological experimental characterization of thixotropy....................................................................67
3.4.2 Mathematical theories for thixotropy ..................................................................................................72
3.5 FLOCCULATION MECHANISMS ....................................................................................... 78
3.5.1 Attractive Forces .................................................................................................................................78
3.5.2 Repulsive Forces..................................................................................................................................82
3.5.3 DLVO Theory and Stability .................................................................................................................88
PART III: EVALUATION OF STRUCTURAL REBUILDING........................................... 92
4 CHAPTER 4: DEVELOPMENT OF A RHEOLOGICAL PROTOCOL TO
MEASURE STRUCTURAL REBUILDING ........................................................................... 93
4.1 INTRODUCTION .............................................................................................................. 93
4.2 EXPERIMENTAL PROGRAM............................................................................................. 93
4.2.1 Materials and Mix Composition ..........................................................................................................93
4.2.2 Sample Preparation .............................................................................................................................94
4.2.3 Rheometer ............................................................................................................................................95
4.3 PRELIMINARY ATTEMPTS ............................................................................................... 97

17
4.3.1 Dynamic rheology................................................................................................................................97
4.3.2 Shear Rheology..................................................................................................................................101
4.3.3 Evaluation of Rebuilding ...................................................................................................................103
4.4 FINAL PROTOCOL ......................................................................................................... 105
4.4.1 Effect of Fluidity ................................................................................................................................109
4.4.2 Effect of Shear History.......................................................................................................................109
4.4.3 Sensitivity and Repeatability..............................................................................................................111
4.5 CHAPTER SUMMARY.................................................................................................... 112
PART IV: IMPACT OF MIXTURE PROPORTIONING ON STRUCTURAL
REBUILDING........................................................................................................................... 114
5 CHAPTER 5: SCREENING STUDIES - INFLUENCE OF CEMENT
COMPOSITION ....................................................................................................................... 115
5.1 INTRODUCTION ............................................................................................................ 115
5.2 MATERIALS.................................................................................................................. 115
5.3 RESULTS ...................................................................................................................... 117
5.4 DISCUSSION ................................................................................................................. 118
5.5 CHAPTER SUMMARY.................................................................................................... 127
6 CHAPTER 6: DETAILED STUDIES - INFLUENCE OF MIX COMPOSITION ON
STRUCTURAL REBUILDING .............................................................................................. 128
6.1 INTRODUCTION ............................................................................................................ 128
6.2 EXPERIMENTAL PROGRAM........................................................................................... 128
6.2.1 Materials............................................................................................................................................128
6.2.2 Mix Proportions.................................................................................................................................131

18
6.2.3 Methods .............................................................................................................................................132
6.2.4 Sample Preparation ...........................................................................................................................134
6.3 RESULTS ...................................................................................................................... 135
6.3.1 How to analyze factorial analysis......................................................................................................135
6.3.2 Rheology ............................................................................................................................................136
6.3.3 Vicat Needle Tests..............................................................................................................................143
6.3.4 ICP Tests............................................................................................................................................151
6.4 DISCUSSION ................................................................................................................. 162
6.4.1 Understanding the correlation between paste matrix and structural rebuilding...............................162
6.4.2 Correlation between Structural Rebuilding and Initial Setting Time ................................................170
6.5 CHAPTER SUMMARY.................................................................................................... 171
PART V: RELATIONSHIP AMONG STRUCTURAL REBUILDING, FORMWORK
PRESSURE, AND AGGREGATION MECHANISMS ........................................................ 174
7 CHAPTER 7: FORMWORK PRESSURE OF SCC AND INFLUENCE OF
STRUCTURAL REBUILDING .............................................................................................. 175
7.1 INTRODUCTION ............................................................................................................ 175
7.1.1 Formwork Pressure Simulation Overview.........................................................................................175
7.2 EXPERIMENTAL PROGRAM........................................................................................... 182
7.2.1 Materials and Mixture proportions ...................................................................................................182
7.2.2 Sample Fabrication and Testing Program.........................................................................................184
7.3 RESULTS ...................................................................................................................... 186
7.3.1 Fresh State Properties .......................................................................................................................186
7.3.2 Lateral Pressure and Pore Water Pressure Evolution ......................................................................187
7.3.3 Formwork Pressure of SCC...............................................................................................................189

19
7.3.4 Structural Rebuilding.........................................................................................................................191
7.4 DISCUSSION ................................................................................................................. 192
7.5 CHAPTER SUMMARY.................................................................................................... 204
8 CHAPTER 8: FLOCCULATION OF CEMENT PASTES.......................................... 206
8.1 INTRODUCTION ............................................................................................................ 206
8.2 FOCUSED BEAM REFLECTANCE MEASUREMENT (FBRM) ........................................... 207
8.3 EXPERIMENTAL PROGRAM........................................................................................... 211
8.3.1 Mix Proportions and Materials .........................................................................................................211
8.3.2 Sample Preparation ...........................................................................................................................214
8.4 RESULTS AND DISCUSSION........................................................................................... 215
8.4.1 Effect of shear history ........................................................................................................................215
8.4.2 Effect of VMA and clays.....................................................................................................................227
8.4.3 Relationship between Structural Rebuilding and Flocculation .........................................................234
8.4.4 Formwork pressure and flocculation.................................................................................................236
8.5 CHAPTER SUMMARY.................................................................................................... 243
PART VI: CONCLUSION....................................................................................................... 245
9 CHAPTER 9: CONCLUSIONS AND FUTURE WORK ............................................. 246
9.1 INTRODUCTION ............................................................................................................ 246
9.2 CONCLUSIONS.............................................................................................................. 246
9.3 FUTURE WORK ............................................................................................................ 253
10 CHAPTER 10: REFERENCES....................................................................................... 258
APPENDIX A: ZETA POTENTIAL TESTING ................................................................... 274

20
A.1. INTRODUCTION ............................................................................................................ 274
A.2. EXPERIMENTAL PROTOCOL.......................................................................................... 274
A.3. RESULTS ...................................................................................................................... 277
VITA........................................................................................................................................... 288

21
List of Tables
Table 2-1. Variables influencing formwork pressure ................................................................... 48
Table 2-2. SCC formwork pressure as reported by different authors (adapted from [29]) .......... 54
Table 4-1. Chemical composition of cement, fly ash, and silica fume......................................... 94
Table 4-2. Slump flow diameter for pastes used in oscillatory rheology studies ......................... 98
Table 5-1. Chemical analysis, fineness, and initial set time for cements in screening studies... 116
Table 5-2. Polycarboxylate-based superplasticizers used during screening studies.................. 116
Table 5-3. Superplasticizer dosage required to achieve initial slump flow of 330 mm.............. 121
Table 6-1. Detailed properties for Cement 5 and Cement 6 ....................................................... 130
Table 6-2. Properties for fly ash and silica fume ........................................................................ 131
Table 6-3. Mixture proportions for evaluated paste mixtures (un-coded factorial design units).
............................................................................................................................................. 133
Table 6-4. Rate of rebuilding determined using rheological protocol ........................................ 137
Table 6-5. Pore solution analysis measured 120 minutes after mixing (where 1 was determined
using the pH meter, 2 was determined using the charge balance) ...................................... 153
Table 6-6. Ionic strength ............................................................................................................. 155

22
Table 7-1. Particle size distribution and physical properties of coarse and fine aggregates ...... 183
Table 7-2. Composition of SCC mixtures................................................................................... 184
Table 7-3. Fresh State Properties for Concrete and Paste........................................................... 187
Table 7-4. Maximum initial pressure and rate of pressure cancellation ..................................... 200
Table 7-5. Equilibrium shear stress measured at beginning and end of rheological test. The %
increase represents contribution from irreversible build-up, where a 0% increase means that
all structural build-up was due to reversible (thixotropic) build-up. .................................. 203
Table 8-1. Mix compositions for FBRM studies ........................................................................ 213
Table 8-2. Particle Size for when Peclet number equals 1 ......................................................... 216
Table 8-3. Influence of shearing regime on rebuilding of flocs ................................................. 226
Table 8-4. Influence of shearing regime on breakdown of flocs ................................................ 227
Table 8-5. Breakage kinetics constant (N=400 rpm) .................................................................. 234
Table 8-6. Aggregation and disaggreagation kinetics................................................................. 238
Table A- 1. Mixture proportions for zeta potential tests………………………………………..284

23
List of Figures
Figure 2-1. Comparison of vibrated concrete and SCC proportioned with 6% nominal air
(adapted from [23]) ............................................................................................................... 46
Figure 2-2. Lateral pressure envelope development when concrete is initially poured and
subjected to vibration. Figure on right shows depth of concrete pour. Figure on left shows
lateral pressure exerted by concrete. Lateral pressure is equal to hydrostatic pressure.
Hydostatic pressure equals ρgH, where ρ is density of concrete. ......................................... 49
Figure 2-3. Lateral pressure envelope development after second layer of concrete is cast and is
subjected to vibration. Figure on left shows depth of concrete pour. Figure on right shows
lateral pressure exerted by concrete. Lateral pressure is equal to hydrostatic pressure.
Hydostatic pressure equals ρg2H, where ρ is density of concrete. ....................................... 50
Figure 2-4. Lateral pressure envelope development after third layer of concrete is cast and is
subjected to vibration. Figure on left shows depth of concrete pour. Thick solid line in
figure on right shows lateral pressure exerted by concrete, and dashed line shows the
hydrostatic pressure. Effects from vibrator are not felt throughout the entire depth of
concrete and the lateral pressure is less than hydrostatic pressure. Hydostatic pressure
equals ρg3H, where ρ is density of concrete......................................................................... 51

24
Figure 2-5. Lateral pressure envelope development after final layer of concrete is cast (i.e. end
of pour) and concrete is subjected to vibration. Figure on left shows depth of concrete pour.
Thick solid line in figure on right shows lateral pressure exerted by concrete, and dashed
line shows the hydrostatic pressure. Effects from vibrator are not felt throughout the entire
depth of concrete and the lateral pressure is significantly less than hydrostatic pressure due
to shear strength resistance in lower layers. Hydostatic pressure equals ρg4H, where ρ is
density of concrete. ............................................................................................................... 52
Figure 3-1. Shear deformation for a Hookean solid ..................................................................... 56
Figure 3-2. Viscous flow in a Newtonian fluid (bottom plate is fixed)........................................ 57
Figure 3-3. Time independent rheologies ..................................................................................... 58
Figure 3-4. Shear thinning and thixotropic fluid .......................................................................... 61
Figure 3-5. Schematic of thixotropy phenomenon ....................................................................... 66
Figure 3-6. Hysteresis approach to examining thixotropy............................................................ 68
Figure 3-7. Hysteresis curves for cement paste [60]..................................................................... 69
Figure 3-8. Equilibrium flow curve .............................................................................................. 71
Figure 3-9. Shear stress measured at different shear rates as a function of preconditioning time
[48]........................................................................................................................................ 72

25
Figure 3-10. Attractive energy as a function of distance between particles [77] ......................... 80
Figure 3-11. Schematic representation of zeta potential............................................................... 83
Figure 3-12. Repulsive energy as a function of distance between particles [77] ......................... 85
Figure 3-13. Schematic of steric repulsion mechanism................................................................ 88
Figure 3-14. Total interaction potential curve for a stable dispersion [77] .................................. 89
Figure 3-15. Effect of ionic concentration on total interaction potential curves (from [80]) ....... 91
Figure 4-1. Paste slump flow diameter test (a) prior to lifting mini-slump cone; (b) slump flow
diameter: sfd = (diameter 1 + diameter 2)/2 ......................................................................... 95
Figure 4-2. Concentric cylinder rheometer system conforming to German DIN 53019 sensor
system with standardized dimensions, where Ra = radius of outer cylinder, Ri = radius of
inner cylinder, Rs = radius of the rotor shaft, a = distance from bottom of outer cylinder to
apex of cone, α = angle of the cone, L = length of inner cylinder, L’ = distance of the rotor
[90]........................................................................................................................................ 96
Figure 4-3. Dependence on loss modulus on strain (f = 1 Hz) ..................................................... 99
Figure 4-4. Dependence on elastic modulus on strain (f = 1 Hz) ............................................... 100
Figure 4-5. Strain sweep and viscoelastic behavior of cement paste.......................................... 101
Figure 4-6. Establishment of equilibrium condition (shear rate = 600 s-1)................................. 102

26
Figure 4-7. Equilibrium loop ...................................................................................................... 103
Figure 4-8. Hysteresis loops for each trest (with select trest emphasized at 10 minutes, 50 minutes,
and 90 minutes)................................................................................................................... 106
Figure 4-9. Area between up curve of hysteresis loop and equilibrium line is used as a measure
of the rate of rebuilding and denoted as SRE (Specific Rebuilding Energy). The figure
shows SRE for trest = 90 minutes. ........................................................................................ 107
Figure 4-10. Application of protocol to compare rate of structural rebuilding of different
mixtures. Slope of line indicates degree of rebuilding. ..................................................... 108
Figure 4-11. Effect of shear history on structural rebuilding measurements (w/c = 0.35, SP
dosage = 0.2%, initial slump flow = 280 mm)................................................................... 111
Figure 4-12. Sensitivity and repeatability for final protocol (SF=silica fume, FA=15) ............. 112
Figure 5-1. Rate of rebuilding for paste mixtures made with superplasticizer 1........................ 117
Figure 5-2. Rate of rebuilding for mixtures made with superplasticizer 2 ................................. 118
Figure 5-3. Rate of rebuilding versus C3A content (for pastes made with SP1) ........................ 119
Figure 5-4. Rate of rebuilding versus equivalent alkali content (for pastes made with SP1)..... 120
Figure 5-5. Relationship between superplasticizer dosage and C3A contents for cement pastes
evaluated during screening study. Superplasticizer dosage was varied such that all mixtures
had same initial slump flow diameter. ................................................................................ 121

27
Figure 5-6. Relationship between superplasticizer dosage and equivalent alkali for cement
pastes evaluated during screening study. Superplasticizer dosage was varied such that all
mixtures had same initial slump flow diameter. ................................................................. 122
Figure 5-7. Structural rate of rebuilding for cement 1 with SP1 and SP2 .................................. 123
Figure 5-8. Structural rate of rebuilding for cement 2 with SP1 and SP2 .................................. 124
Figure 5-9. Structural rate of rebuilding for cement 3 with SP1 and SP2 .................................. 124
Figure 5-10. Structural rate of rebuilding for cement 4 with SP1 and SP2 ................................ 125
Figure 5-11. Structural rate of rebuilding for cement 5 with SP1 and SP2 ................................ 125
Figure 5-12. Structural rate of rebuilding for cement 6 with SP1 and SP2 ................................ 126
Figure 5-13. Structural rate of rebuilding for cement 7 with SP1 and SP2 ................................ 126
Figure 6-1. Volume size particle size distribution of cements and fly ash (determined by laser
diffraction) .......................................................................................................................... 129
Figure 6-2. SRE vs. trest for mixes in detailed studies ................................................................. 136
Figure 6-3. Main effect plots for structural rebuilding (-1 and 1 indicate low and high level for
each factor; see Table 6-3 for the value for each factor) .................................................... 138
Figure 6-4. Interaction plots for structural rebuilding (-1 and 1 indicate low and high level for
each factor; see Table 6-3 for the value for each factor) .................................................... 140

28
Figure 6-5. Normal probability plot of effects for structural rebuilding..................................... 141
Figure 6-6. Pareto plot for structural rebuilding ......................................................................... 142
Figure 6-7. Evolution of Vicat needle penetration (representative mixture) .............................. 144
Figure 6-8. Initial Setting Times................................................................................................. 145
Figure 6-9. Main effect plots for initial set ................................................................................. 146
Figure 6-10. Normal probability plot of effects for initial setting time ...................................... 147
Figure 6-11. Pareto plot of effects for initial setting time........................................................... 148
Figure 6-12. Interaction plot of cement type and w/b ratio for initial set (AB interaction)........ 149
Figure 6-13. Interaction plot of cement type and fly ash dosage for initial set (AC interaction).
............................................................................................................................................. 150
Figure 6-14. Interaction plot of cement type and silica fume dosage for initial set (AD
interaction) .......................................................................................................................... 151
Figure 6-15. Normal probability plot for [Al] ............................................................................ 157
Figure 6-16. Normal probability plot for [Ca] ............................................................................ 158
Figure 6-17. Normal probability plot for [Fe] ............................................................................ 158
Figure 6-18. Normal probability plot for [K].............................................................................. 159
29
Figure 6-19. Normal probability plot for [Mg]........................................................................... 159
Figure 6-20. Normal probability plot for [Na]............................................................................ 160
Figure 6-21. Normal probability plot for [S] .............................................................................. 160
Figure 6-22. Normal probability plot for [Si] ............................................................................. 161
Figure 6-23. Normal probability plot for [OH-].......................................................................... 161
Figure 6-24. Effect of silica fume dosage and w/b ratio on Aluminum concentration (in coded
units) ................................................................................................................................... 162
Figure 6-25. SP dosage and SRE (odd numbers indicate mixtures made with Cement 6)......... 164
Figure 6-26. Relationship between superplasticizer demand and [Na] ...................................... 164
Figure 6-27. Relationship between superplasticizer demand and [S]......................................... 165
Figure 6-28. Relationship between superplasticizer demand and [K] ........................................ 165
Figure 6-29. Main effect of silica fume on structural rebuilding................................................ 168
Figure 6-30. Factors influencing superplasticizer demand ......................................................... 170
Figure 6-31. Relationship between rate of rebuilding and initial setting time............................ 171
Figure 7-1. Schematic of formwork pressure system ................................................................. 177
Figure 7-2. Instrumented Apparatus ........................................................................................... 181
30
Figure 7-3. Measurement of the total pressure: the sensor touches the concrete ....................... 181
Figure 7-4. Measurement of the pore water pressure: the hydraulic connection........................ 182
Figure 7-5. Evolution of pressure reading with time and height ................................................ 190
Figure 7-6. Evolution of pressure decay, where P(t) is the formwork pressure of the concrete at a
specific time. Phydrostatic is constant and corresponds to the total vertical pressure applied at
the end of casting (approximately 240 kPa). ...................................................................... 191
Figure 7-7. Structural rebuilding curves for representative paste matrix ................................... 192
Figure 7-8. Depiction of different structural conditions based on equilibrium line location ..... 195
Figure 7-9. Equilibrium lines for representative paste mixtures................................................. 196
Figure 7-10. Transformation of SRE to take into account intial degree of structure and rate of
rebuilding (a) SRE curves (b) Transformation of Cem5 SRE curve to area ...................... 198
Figure 7-11. Rebuilding Power versus Pressure Reduction Percentage ..................................... 199
Figure 7-12. Initial structural breakdown curves........................................................................ 201
Figure 7-13. Contribution from irreversible structural buildup in Cem5 (1 represents structural
breakdown curve conducted at beginning of test, 2 represents structural breakdown curve
conducted after 90 minutes)................................................................................................ 202

31
Figure 7-14. Contribution from irreversible structural build-up in Cem6 (1 represents
structural breakdown curve conducted at beginning of test, 2 represents structural
breakdown curve conducted after 90 minutes) ................................................................... 202
Figure 7-15. Contribution from irreversible structural buildup in Cem6SF (1 represents structural
breakdown curve conducted at beginning of test, 2 represents structural breakdown curve
conducted after 90 minutes)................................................................................................ 203
Figure 8-1. FBRM probe operation method [136]...................................................................... 208
Figure 8-2. Schematic of FBRM system..................................................................................... 209
Figure 8-3. FBRM experimental set-up ...................................................................................... 210
Figure 8-4. Mean chord size evolution when subjected to different shearing conditions .......... 218
Figure 8-5. Counts per second when subjected to different shearing conditions ....................... 218
Figure 8-6. Chord size distribution curves for cement suspension at t= 1800s for samples
subjected to constant shearing of 40 rpm and constant shearing of 400 rpm ..................... 219
Figure 8-7. Percent difference when N= 40 rpm during 30 minute interval............................... 220
Figure 8-8. Loss and gain of particle size X ............................................................................... 221
Figure 8-9. Percent difference when N= 400 rpm during 30 minute interval............................. 222
Figure 8-10. Number of counts at end of 20 min period for sample allowed to continuously
rebuild and sample subjected to shear prior to rebuilding .................................................. 225

32
Figure 8-11. Influence of VMA on number of particles for Cement 5....................................... 228
Figure 8-12. Influence of clays and VMA on particle counts evolution .................................... 229
Figure 8-13. Influence of clays and VMA on average chord length .......................................... 231
Figure 8-14. Influence of clays and VMA on floc size evolution during Stage 3 ...................... 232
Figure 8-15. Floc sizes greater than 65 microns during Stage 3................................................. 233
Figure 8-16. Chord Size Evolution for Mix 9 and Mix 10 ......................................................... 235
Figure 8-17. Influence of fly ash on number of counts............................................................... 237
Figure 8-18. Percent difference from beginning to end of flocculation period .......................... 238
Figure 8-19. Comparison of small particles/flocs for mixtures made with and without fly ash. 239
Figure 8-20. Structural rebuilding curve showing slower rate of rebuilding when fly ash is used
............................................................................................................................................. 240
Figure 8-21. Influence of fly ash on formwork pressure ............................................................ 242
Figure A- 1. Phase plot for “standard” suspension during fast field reversal………………….275
Figure A- 2. Zeta Potential Distribution for sample prepared using sample preparation protocol 1
............................................................................................................................................. 277
Figure A- 3. Phase plot for sample prepared using sample preparation protocol 1.................... 278
33
Figure A- 4. Zeta potential distribution for sample prepared using sample preparation protocol
2........................................................................................................................................... 279
Figure A- 5. Zeta potential distribution for sample prepared using sample preparation protocol 3
............................................................................................................................................. 281
Figure A- 6. Temporal evolution of zeta potential distribution for sample prepared using sample
preparation protocol 3 (numbers corresponds to different measurement times, with 1 = first
measurement, 3 = third measurement)................................................................................ 282
Figure A- 7. Influence of cement type on zeta potential............................................................. 285
Figure A- 8. Influence of superplasticizer on low alkali/C3A cement ........................................ 286
Figure A- 9. Influence of superplasticizer on high alkali/C3A cement....................................... 286

34
PART I: Overview

CHAPTER 1: Introduction
35
1 CHAPTER 1: Introduction
1.1 Problem Overview
Concrete, a composite material composed of cement, water, sand, and gravel, is the world’s most
widely used construction material. In its fresh state, concrete is a dense suspension consisting of
aggregate particles suspended in a mortar matrix. Traditionally, concrete must be vibrated to
remove entrapped air voids and to consolidate it; however, this can lead to durability problems
due to improper consolidation (either from over-vibration or under-vibration). In the late 1980’s,
a new generation of concrete, self-consolidating concrete (SCC), was developed to combat the
problems due to poorly vibrated concrete. SCC is a highly flowable concrete that does not
require any external vibration during placing. One of the major advantages of SCC is that it can
accelerate the construction process since casting can occur more quickly as there is no need to
stop the pouring to vibrate the concrete. However, increasing the casting rate leads to higher
lateral pressure against the formwork [1], and if not properly accounted for, the high pressure can
lead to formwork failure. In North America, the pre-cast industry has spearheaded the usage of
SCC. However, its usage in ready-mix (i.e. cast-in place) industry has progressed at a slower
rate due to concerns about quality control and uncertainty about formwork pressure
development.
Presently, formworks for SCC are designed for at least full hydrostatic pressure [2].
However, recent studies have shown that not all types of SCC achieve hydrostatic pressures [3-6]
and that formwork pressure behavior can be influenced by factors such as casting rate, aggregate

CHAPTER 1: Introduction
36volume, and mineral and chemical admixtures. Thus, the conservative assumption of
hydrostatic pressure can lead to unnecessary costs due to the construction of over-dimensioned
formworks. Considering the fact that in the United States the cost of formwork can be as much
as 60% (and sometimes even more) of the total cost of the completed concrete structure in place
[7], it is evident that there is a dire need to understand the factors, particularly as it pertains to the
mix composition, that can influence the formwork pressure of SCC.
In addition to concerns related to formwork pressure, there is a need to increase the
fundamental knowledge about the rheological behavior of cement-based materials. Cementitious
fluids have complex rheology and typically exhibit shear-thinning viscosity, yield stress,
elasticity, and thixotropy. Thixotropy is defined as “a decrease of the apparent viscosity [in
time] under constant shear stress or shear rate, followed by a gradual recovery when the stress or
shear rate is removed” [8]. In cementitious materials, the phenomenon of thixotropy results from
the heterogeneity of the material and the finite time that it takes for the microstructure to
rearrange when subjected to shear-induced stresses. The specific causation of thixotropy
depends on interactions at the molecular level, which, unfortunately, are poorly understood. The
rheological behavior of cement-based materials is directly linked to the aggregation, de-
aggregation, re-aggregation, and dispersion of the solid particles. Research that can provide
information about any of these phenomena would advance the state of knowledge on the flow
behavior of cement-based materials.

CHAPTER 1: Introduction
371.2 Research Objectives
The over-arching goal of this research was to advance the understanding of the role of mixture
ingredients on the structural rebuilding and the formwork pressure behavior of SCC. To
accomplish this goal the following objectives were established:
1. Evaluate evolution of structural rebuilding during the matrix phase.
2. Identify the role of material constituents that have a major influence on structural
rebuilding.
3. Relate structural rebuilding to formwork pressure.
4. Gain fundamental understanding of the aggregation behavior.
To accomplish the first objective, a rheological protocol based on hysteretic loops was
developed. To achieve the second goal, a comprehensive research program was undertaken to
evaluate the influence of various mixture ingredients on the paste matrix phase of SCC. The
third objective was achieved by developing a formwork pressure simulation apparatus. Using
the rheological protocol developed in the first objective and the information gained from the
second objective, the influence of mixture proportioning was investigated. The last objective
was accomplished by conducting studies that focused on evaluating the role of pore solution
chemistry and in situ particle size measurements within the cement paste matrix.
1.3 Structure of the Dissertation
This chapter provided an overview of the research significance and objectives of the proposed
research. In addition, an introduction to concrete and SCC were given. Chapter 2 reviews the

CHAPTER 1: Introduction
38major factors governing formwork pressure of SCC, and Chapter 3 provides background
information regarding rheology and flocculation. In Chapter 3, the mechanisms governing yield
stress and thixotropy are highlighted, and the role of interparticle forces and their influence on
rheology are discussed. Chapters 4 through 8 should be considered the major body of this
dissertation. Chapter 4 presents a rheological protocol that was developed to evaluate structural
rebuilding and Chapter 5 provides the results from preliminary studies concerning the influence
of cement composition. Chapter 6 offers a systematic investigation of the role of mixture
ingredients, and discusses the impact of mixture proportioning on structural rebuilding. Chapter
7 focuses on the implications of structural rebuilding on formwork pressure, and Chapter 8
explores the impact of aggregation and breakage mechanisms on structural rebuilding and
formwork pressure. Chapter 9 provides key conclusions from this study and thoughts on future
work. A list of all the works cited in this manuscript can be found in Chapter 10.
39
PART II: Background/Literature Review

CHAPTER 2: Self-Consolidating Concrete and Lateral Pressure
40
2 CHAPTER 2: Self-Consolidating Concrete and Lateral Pressure
2.1 Introduction
This chapter provides an overview of SCC and the issues concerning the formwork pressure
generated by SCC.
2.2 Self-Consolidating Concrete
As its name implies, SCC is a special class of concrete that consolidates only from self-weight
and needs no extra external compaction methods. It is generally agreed that Professor Hajime
Okamura first proposed the idea of SCC in 1986, and that the first prototype was developed in
1988. However, precursors to SCC have been identified before 1988. Mario Collepardi states
that as early as 1975 self-compacting concretes were studied and that as early as 1981
commercial applications of non-vibrated self-leveling concretes were used in the United States,
Hong Kong, and Italy [9].
SCC is characterized by its filling ability (flowability), passing ability, and stability
(resistance to segregation and bleeding). Filling ability, or flowability, is the ability of the
concrete to completely flow (horizontally and vertically upwards if necessary) and fill all spaces
in the formwork without the addition of any external compaction. Passing ability is the ability of
the concrete to flow though restricted spaces without blocking. Stability, or resistance to
segregation, is the ability of the concrete to remain uniform and cohesive throughout the entire
construction process (mixing, transporting, handling, placing, casting, etc.). There should be

CHAPTER 2: Self-Consolidating Concrete and Lateral Pressure
41minimum segregation of the aggregates (both fine and coarse) from the matrix and little
bleeding. Hence, SCC is a highly flowable, non-segregating concrete that is able to spread and
flow through restricted orifices, fill formwork, and completely cover any reinforcement without
any mechanical vibration. In the field, the quality of SCC is assessed based on its slump flow
diameter (sfd), which is measured using the slump flow test (ASTM C1611) [10], a modified
version of the popular slump test (ASTM C143) [11] for vibrated concrete (VC). Depending on
the application, the sfd of SCC can range from 18.5 to 31.5 inches (470 to 800 mm) [12]. At low
sfd ranges, extra precaution should be taken to ensure that SCC is truly consolidated, whereas at
high sfd ranges care should be taken to guarantee that the concrete is stable.
2.2.1 Advantages and Disadvantages Over the last two decades, SCC has revolutionized the practices of concrete construction in the
United States and throughout most of the world. Typically, the term high performance concrete
is bestowed upon concretes that exhibit extraordinary properties in the hardened state (ex. ultra-
high compressive strength, crack-resistant concrete, long-term durability, etc.); however, SCC
can also be considered a high performance concrete due to its high performance in the fresh
state. In fact, SCC was developed in order to alleviate durability problems due to poorly vibrated
concrete [13]. The degree of compaction significantly affects the quality of the concrete.
Insufficient compaction can result in entrapped air voids or poor bonding between the
reinforcement and concrete, whereas excessive compaction can lead to segregation and cracking.
As a result, the skill level and assiduousness of the construction workers became crucially
important, and it was thought that the development of SCC could eliminate problems caused by

CHAPTER 2: Self-Consolidating Concrete and Lateral Pressure
42negligence and lack of skill during the compaction stage. In addition to the above-mentioned
advantage, other benefits to using SCC are:
increased construction productivity
improved jobsite safety
improved hardened properties
reduction in noise due to elimination of vibration
reduction in labor and equipment costs
better surface finish and little to no remedial surface retouching for bugholes
ability to flow into tight spaces and openings (This allows for the opportunity to cast
intricate structural and architectural shapes and is especially beneficially in high
seismic zones where dense reinforcement is used.)
higher bond strength and less significant top bar effect
faster casting rates and quicker unloading of ready mixed concrete trucks
However, the material costs for SCC are generally higher than for conventionally placed
concrete due to the usage of chemical admixtures, which are necessary in order to achieve the
fresh state properties. Other challenges for users of SCC are:
greater technical expertise and quality control measures needed to develop and
control mixtures
lack of standardized mix design and test procedures
increased sensitivity of fresh state properties due to small changes during processing
(i.e. guaranteeing robustness)
increased shrinkage due to high paste volume
CHAPTER 2: Self-Consolidating Concrete and Lateral Pressure
43 increased formwork costs due to concerns about formwork pressure
2.2.2 Mix Proportioning SCC was made possible through the development of advanced chemical admixtures coupled with
proper understanding of concrete materials. SCC constituent materials and mixture proportions
must be properly selected to achieve the required flow properties. Mixtures are typically
designed with high powder contents and contain chemical admixtures, such as superplasticizers
(also known as high range water reducers) and viscosity modifying admixtures (VMA).
2.2.2.1 Superplasticizers and VMAs Plasticizers are chemical admixtures that are added to concrete to improve workability or reduce
the water content. For a given slump/slump flow, incorporation of plasticizers can yield a 5 -
10% reduction in the water content [14]. This enables one to achieve higher-strength concrete
(due to a lower water-to-cement (w/c) ratio) without sacrificing workability. As their name
implies, superplasticizers are more powerful than plasticizers and yield water reductions of 12%
or more [15], and as much as 20 – 30% water reduction in some cases [15]. Superplasticizers are
commonly derived from sulphonated melamine, sulphonated naphthalene, modified
lignosulphonates, or carboxylated polymers [15-17]. They increase workability by dispersing
the cement particles; however, the dispersion efficiency strongly depends on cement-
superplasticizer interactions. Hence, for a given cement drastically different dispersion effects
(and hence workability) can occur when different superplasticizers are employed. Other factors
such as the dosage and time at which the superplasticizer is added to the mixture will also
influence workability. Typically, polycarboxylate (PC) superplasticizers (as the carboxylated

CHAPTER 2: Self-Consolidating Concrete and Lateral Pressure
44polymer superplasticizers are commonly called) are used in SCC mixtures. PC
superplasticizers are synthetic organic polymers and were introduced in the early 1980s [15].
They are generally more effective dispersants than superplasticizers derived from sulphonated
melamine, sulphonated naphthalene, or modified lignosulphonates.
VMAs are water-soluble polysaccharides that are added to increase cohesiveness of
concrete [18, 19]. The first application of VMAs was in Germany during the mid-1970s, and it
was not until the late 1980s that VMAs were used in North America [18]. Initially, VMAs were
used in specialty grouts and underwater concrete applications to enhance water-retention and
reduce the washout; however, they are frequently used in SCC to improve homogeneity,
deformability, robustness, and stability. According to Bury and Christensen [20], VMAs work
by two different mechanisms: binding or thickening. The binding type VMA works by adhering
to water molecules within the mixture, whereas the thickening type VMA functions by
thickening the concrete to make it more cohesive without significantly influencing the fluidity.
In SCC, the most commonly used VMAs are semi-synthetic polymers derived from cellulose
ethers (such as hydroxypropyl methyl cellulose) and biopolymers polymers (such as welan gum).
In the case of welan gum and cellulose derivatives, it is believed that these VMAs function by
adsorbing onto water molecules and expanding [18]. Furthermore, the polymer chains intertwine
and develop attractive forces in adjacent polymer chains, which further restrict the movement of
water and cause a gel formation. A good review on VMAs can be found in a paper published by
Kamal Khayat [21].

CHAPTER 2: Self-Consolidating Concrete and Lateral Pressure
452.2.2.2 Mix Design When designing SCC one must consider both the matrix phase and the aggregate phase. With
regard to the matrix phase, there are two commonly used approaches for developing SCC: the
powder approach and the VMA approach (c.f. Figure 2-1). In the powder SCC approach, the
amount of fine materials (ex. cement, fly ash, limestone filler, blast furnace slag, silica fume,
and/or fine aggregate particles smaller than 0.125mm) is significantly increased when compared
to conventionally vibrated concrete (VC)*. Superplasticizers are used to increase the flowability
and the water-to-powder (w/p) ratio (by volume) ranges from 0.9 to 1.0, compared to VC whose
w/p ratio (by volume) range from 1.5 to 2.0 [22]. This method, also referred to as the “Japanese
approach”, was the original approach used to develop SCC and does not employ the use of
VMA. In the method suggested by Okamura [13], the coarse aggregate content is fixed at 50%
of the total solid volume of concrete, and the fine aggregate is fixed at 40% of the mortar
volume. Self-compactability is obtained by adjusting the superplasticizer dosage and w/p ratio
(by mass). In the VMA-SCC approach, VMA is incorporated to enhance stability while the
powder content remains less than that used in the powder-type SCC approach but still higher
than that of a VC. A third approach combines the powder approach and the VMA approach to
form an SCC with a moderate powder content and VMA.
* In this manuscript, conventional concrete that is subjected to external vibration will referred to as vibrated concrete (VC).

CHAPTER 2: Self-Consolidating Concrete and Lateral Pressure
46
Type of Concrete
Vibrated Concrete Powder Type SCC VMA Type SCC
Volu
me
Perc
ent
(%)
0
20
40
60
80
100
120
air water cement and other fines (< .125 mm) fine aggregate coarse aggregate
Figure 2-1. Comparison of vibrated concrete and SCC proportioned with 6% nominal air
(adapted from [23])
Regardless of the method used to design the matrix phase, there should be enough paste
to ensure good deformability of the concrete. However, volume instability increases with an
increase in paste content. Thus, it is desirable to use larger size coarse aggregates since the
reduction in surface area of the aggregates will lower the paste demand requirement. Because
passing ability is also an important consideration, the grading of the aggregates should be

CHAPTER 2: Self-Consolidating Concrete and Lateral Pressure
47optimized to minimize blockage and paste requirements. Segregation resistance and passing
ability is also improved by reducing the overall content of coarse aggregate [9].
2.3 Formwork Pressure of Self-Consolidating Concrete
The lateral pressure exerted by freshly placed SCC against vertical form surfaces has been the
subject of many research papers during the last couple of years [2-5, 23, 24]. Underestimating
the pressure may cause deformed structural elements or even failure of the formwork, while
overestimating the pressure leads to unnecessary costs due to over-dimensioned formworks.
With respect to conventional VC, numerous studies were necessary to obtain sufficient
understanding of the main variables controlling lateral pressure. In VC, the major factors
affecting pressure development are the depth of fluidized concrete and the development of shear
strength and wall shear by the concrete [1]. However, these factors are significantly influenced
by the height of cast, casting rate, casting method, consolidation method, ambient temperature,
temperature of the concrete, maximum aggregate size, consistency of fresh concrete, setting
time, and the shape of formwork. As shown in Table 2-1 these variables can be grouped into
three categories: concrete material properties, formwork characteristics, and processing
influence.

CHAPTER 2: Self-Consolidating Concrete and Lateral Pressure
48 Table 2-1. Variables influencing formwork pressure
Concrete Properties Formwork Characteristics Processing
Consistency Dimensions consolidation method and depth
mix composition material rate of cast
set time permeability method of placement
Temperature surface roughness ambient temperature (weather)
Density shoring and bracing depth of placement (lift)
VC is poured into forms in lifts, and the concrete is consolidated through mechanical
vibration. Typically, poker-type vibrators, which are immersed into the top 3 feet of concrete,
are used for consolidation [1]. Figure 2-2 to Figure 2-5 show the lateral pressure development
for concrete placed into a wall or column. When vibrated, the fresh concrete fluidizes, and the
fluidized layer develops hydrostatic pressure (c.f. Figure 2-2 and Figure 2-3). However, once the
head of the concrete reaches a certain height (c.f. Figure 2-4) the effect of the vibrator is reduced
and the lowest layer of the concrete can not be fluidized by the poker vibrator. This layer will
begin to stiffen, the shear resistance will increase, and the pressure at the bottom will be less than
hydrostatic.

CHAPTER 2: Self-Consolidating Concrete and Lateral Pressure
49
Figure 2-2. Lateral pressure envelope development when concrete is initially poured and
subjected to vibration. Figure on right shows depth of concrete pour. Figure on left shows
lateral pressure exerted by concrete. Lateral pressure is equal to hydrostatic pressure.
Hydostatic pressure equals ρgH, where ρ is density of concrete.
External vibrator

CHAPTER 2: Self-Consolidating Concrete and Lateral Pressure
50
Figure 2-3. Lateral pressure envelope development after second layer of concrete is cast
and is subjected to vibration. Figure on left shows depth of concrete pour. Figure on right
shows lateral pressure exerted by concrete. Lateral pressure is equal to hydrostatic
pressure. Hydostatic pressure equals ρg2H, where ρ is density of concrete.
External vibrator

CHAPTER 2: Self-Consolidating Concrete and Lateral Pressure
51
Figure 2-4. Lateral pressure envelope development after third layer of concrete is cast and
is subjected to vibration. Figure on left shows depth of concrete pour. Thick solid line in
figure on right shows lateral pressure exerted by concrete, and dashed line shows the
hydrostatic pressure. Effects from vibrator are not felt throughout the entire depth of
concrete and the lateral pressure is less than hydrostatic pressure. Hydostatic pressure
equals ρg3H, where ρ is density of concrete.
If the concrete head is increased further (c.f. Figure 2-5), the shear strength of the lower
layer will become even more significant, and the lateral pressure will reach a maximum at some
elevation above the base of the formwork. Figure 2-5 shows that the lateral pressure along the
depth of the form will be hydrostatic from the free surface, reach a maximum, and then decrease.
Hence, VC formworks are designed taking into account the stiffening of the lower layer of
External vibrator

CHAPTER 2: Self-Consolidating Concrete and Lateral Pressure
52concrete, and the forms are designed for a maximum pressure that is lower than the hydrostatic
pressure.
Figure 2-5. Lateral pressure envelope development after final layer of concrete is cast (i.e.
end of pour) and concrete is subjected to vibration. Figure on left shows depth of concrete
pour. Thick solid line in figure on right shows lateral pressure exerted by concrete, and
dashed line shows the hydrostatic pressure. Effects from vibrator are not felt throughout
the entire depth of concrete and the lateral pressure is significantly less than hydrostatic
pressure due to shear strength resistance in lower layers. Hydostatic pressure equals ρg4H,
where ρ is density of concrete.
External vibrator
CHAPTER 2: Self-Consolidating Concrete and Lateral Pressure
53SCC quickly flows into the formwork and full consolidation can occur without the
need for vibration. SCC is particularly convenient in cases of heavily reinforced structures and
for narrow cross sections since it can flow readily through restricted spaces. Due to the high
fluidity of SCC, it is cast at faster rates than VC. This induces higher formwork pressure and
raises questions about the adequacy of using current formwork design practices for SCC. The
American Concrete Institute Committee 347, Formwork for Concrete, recommends that
formworks be designed with the assumption that full liquid pressure head will be achieved unless
trial study measurements can prove otherwise [2]. Similarly, the European Federation of
Producers and Contractors of Specialist Products for Structures (EFNARC) recommends that
forms higher than 3 meters be designed for full hydrostatic head [25]. Currently, forms for SCC
are constructed with more structural ties or heavier steel-framed gang forms than those
constructed for vibrated concrete [2, 6]. This is of particular concern because formwork
construction (i.e. materials and labor) can account for a significant amount of the construction
costs and oftentimes is greater than the cost of the concrete itself [26].
Studies have shown that not all SCCs achieve hydrostatic pressures (c.f. Table 2-2) [3-6].
Research on instrumented formwork up to 12 meter high has shown that the pressure exerted by
the SCC can consistently deviate from the linear hydrostatic distribution (up to 30-35% at the
casting bottom) [27]. In that case, the difference between the expected (hydrostatic) theoretical
values and the measured pressure values was attributed to the friction between the concrete and
the formwork’s internal surface [27]. An extensive laboratory study conducted by Assaad,
Khayat and Mesbah showed that mix composition was a key factor that influenced formwork
pressure [28]. This was attributed to the belief that mix composition affects the kinetics of a
structural build-up phase and thixotropy. In 2001, Peter Billberg conducted full scale tests using

CHAPTER 2: Self-Consolidating Concrete and Lateral Pressure
54wall forms to evaluate the effect of different SCC compositions on formwork pressure [6].
The results indicated that casting rate strongly influenced pressure development, and that mix
composition was not a significant factor affecting form pressures. Another study [3] showed that
the pressure generated by SCC was very close to the hydrostatic profile. This was attributed to
the aggravating effect of a faster formwork filling rate (3 m/h). The reason for the diversity of
results reported by the literature is still not clear given that pressure values equal to the 60% of
hydrostatic values have been reported also in cases of SCC castings with filling rates higher than
5 m/h [3, 6].
Table 2-2. SCC formwork pressure as reported by different authors (adapted from [29]) Author Max. pressure
(% hydrostatic)
Casting Rate (m/hr)
Height (m) Time to fill (hr)
Leemann-Hoffman
87 – 90/102* 7.3/18.3 2.7/4.7 0.37/0.26
Vanhove 75/80* 25/19.5 11.9 0.48/0.61 Assaad-Khayat
87 – 100 10 1.0 0.09
Billing 18/38/65 1/1.3/2 3.0 3/2.3/1.4 Fedroff-Frosch
35 1 3.7 4
Tejeda-Lange 24/32/80 1.2/2.7/18.3 8.5/6.6/3.2 7/2.4/0.18 * Concrete was pumped from bottom
The study conducted by Assaad, Khayat and Mesbah showed that in addition to casting
rate, mix composition was a key factor that influenced formwork pressure [28]. This was
attributed to the belief that mix composition affects the kinetics of structural build-up and
thixotropy.
CHAPTER 3: Rheology and Flocculation
55
3 CHAPTER 3: Rheology and Flocculation
3.1 Introduction
Cement paste is a dense flocculated suspension. As such, its flow behavior will be influenced by
the degree of flocculation within the paste. This depends on the attractive and repulsive forces
between the molecules. This chapter gives an overview of rheology and the influence of
flocculation.
3.2 Rheology
Rheology is the study of the deformation and flow of matter under stress [30]. Its origin as an
independent branch of natural sciences began in 1929, and, typically, rheologists are primarily
concerned with trying to explain the behavior of industrially relevant materials with properties
intermediate between those of ideal liquids (ex. Newtonian fluid) and ideal solids (Hookean
solid) [31]. The deformation (strain) of a Hookean solid only depends on the applied load; once
the load is removed, the deformation is immediately recovered (i.e. the solid returns back to its
original shape). For these materials, the shear deformation relates linearly to the force causing
the deformation:
γτ G= Equation 3-1
where τ is the shear stress, G is the constant of proportionality (shear modulus), and γ is the shear
deformation (shear strain).

CHAPTER 3: Rheology and Flocculation
56
Figure 3-1. Shear deformation for a Hookean solid
For a Newtonian liquid, the application of a load does not produce a definite shear strain;
rather, the shear stress is linearly proportional to the velocity gradient (in the direction
perpendicular to the plane of shear):
γητ &= Equation 3-2
where η is the viscosity, and γ& is the velocity gradient (also known as the shear rate). The
viscosity represents the ability of the fluid to resist shear-induced flow, and it is an indication of
fluidity. Immediately, it follows that the Newtonian viscosity is the constant of proportionality
that represents the characteristic behavior of the liquid, and that the viscosity is constant for
anyγ& .

CHAPTER 3: Rheology and Flocculation
57
Figure 3-2. Viscous flow in a Newtonian fluid (bottom plate is fixed)
Consider the case of a Newtonian fluid confined between two plates where the bottom
plate is fixed. The application of an applied load to the top plate causes the plate to move with a
velocity, V. A layer of fluid next to the top plate moves with the plate, and a layer of fluid,
which is essentially stationary, exists next to the stationary plate. Thus, a velocity gradient
develops in the fluid from the top plate to the stationary plate.
Viscoelastic materials simultaneously exhibit the properties of a viscous fluid and an
elastic solid. Thus, the shear stress will be proportional to the shear rate and the shear strain. For
a solid, the deformation and recovery may be virtually instantaneous, whereas for fluid virtually
none of the deformation is recovered. In a viscoelastic material, the response of the material may
be slow and the recovery is not immediate.
3.2.1 Rheological Categories
The field of rheology characterizes and quantifies the different viscous behaviors existing in
fluids and suspensions. There are two general categories of rheological properties: time-
independent and time dependent.
Force, F Velocity, V
Area, A
dYdV
=γ&
Y γητ &=Velocity gradient, dV/dY
τ= F/A
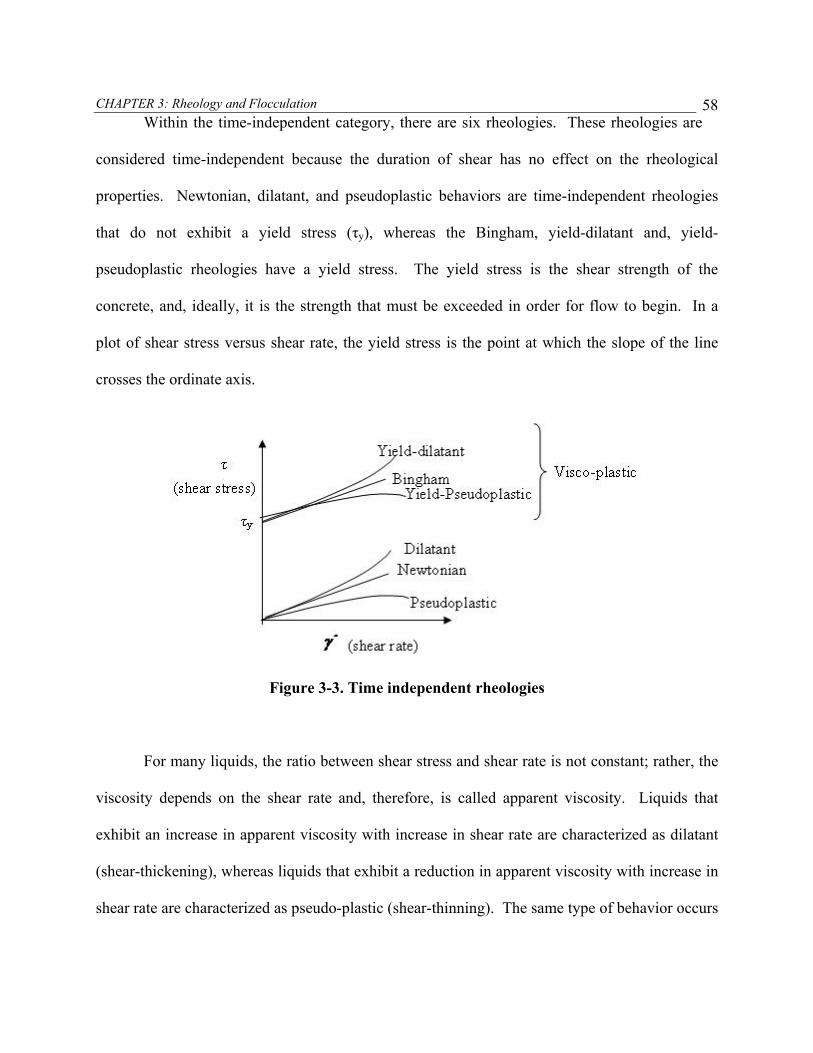
CHAPTER 3: Rheology and Flocculation
58Within the time-independent category, there are six rheologies. These rheologies are
considered time-independent because the duration of shear has no effect on the rheological
properties. Newtonian, dilatant, and pseudoplastic behaviors are time-independent rheologies
that do not exhibit a yield stress (τy), whereas the Bingham, yield-dilatant and, yield-
pseudoplastic rheologies have a yield stress. The yield stress is the shear strength of the
concrete, and, ideally, it is the strength that must be exceeded in order for flow to begin. In a
plot of shear stress versus shear rate, the yield stress is the point at which the slope of the line
crosses the ordinate axis.
Figure 3-3. Time independent rheologies
For many liquids, the ratio between shear stress and shear rate is not constant; rather, the
viscosity depends on the shear rate and, therefore, is called apparent viscosity. Liquids that
exhibit an increase in apparent viscosity with increase in shear rate are characterized as dilatant
(shear-thickening), whereas liquids that exhibit a reduction in apparent viscosity with increase in
shear rate are characterized as pseudo-plastic (shear-thinning). The same type of behavior occurs
CHAPTER 3: Rheology and Flocculation
59in time-independent liquids with a yield stress. For these liquids, the flow behavior cannot be
described by a single parameter. The simplest model for this type of fluid is expressed by the
Bingham model [32]:
γμττ &+= y for τ ≥ τy Equation 3-3
and
0=γ& for τ ≤ τy Equation 3-4
where μ is the plastic or “Bingham viscosity”. In an ideal Bingham fluid, once the yield stress is
exceeded the material flows, and the viscosity is the material’s resistance to flow. For a
Bingham fluid, the relationship between (Newtonian) viscosity and plastic viscosity is:
γτ
μη&y+= Equation 3-5
Hence, the Newtonian viscosity is the viscosity limit at high shear rates. It must be
stressed that the Bingham model is not the only model that can be used to describe visco-plastic
materials. Models such as the Casson and Herschel-Bulkley models are slightly more
complicated but are also used to represent yield-pseudoplastic fluids. Examples of some fluids
that appear to have a yield stress are clays, toothpastes, ketchups, and drilling mud.
Cementitious fluids have complex rheology and exhibit yield-pseudoplastic and
thixotropic behavior. Further complicating matters is the fact that the rheological properties of

CHAPTER 3: Rheology and Flocculation
60cementitious fluid are constantly changing with time. G.H. Tattersall and P.F.G. Banfill wrote
the first comprehensive book on the rheology of cement paste and concrete in 1983 [30]. In this
classic text, it was suggested that concrete and cement paste should be described using a
minimum of two parameters. The flow behavior of cement paste and concrete is most often
modeled as Bingham fluids (two parameters are τy and μ). However, a pseudoplastic model is
probably a more accurate representation of the flow behavior since oftentimes the viscosity
above the yield stress tends to show shear-dependent behavior.
Within the time-dependent category, there are two rheologies: thixotropy and rheopexy.
Thixotropic fluids display a reduction in magnitude of rheological properties (ex. elastic
modulus, yield stress, and viscosity) with a distinct time dependence on the application of the
shear strain [33]. The changes in the system occur reversibly and isothermally. A rheopectic, or
antithixotropic, fluid exhibits behavior that is the opposite of a thixotropic fluid. Namely, the
viscosity increases with time under a constant rate of shear, and once the shear is removed the
viscosity decreases. Oftentimes, thixotropy is confused with the shear-thinning behavior of non-
Newtonian fluids. It is important to point out that thixotropy is related to non-Newtonian time-
dependent changes, whereas shear-thinning refers to Non-Newtonian time-independent changes.
A pseudo-plastic fluid should “solidify” almost immediately after being sheared, whereas a finite
amount of time is required before a thixotropic fluid “solidifies”. As shown in Figure 3-4, in a
plot of viscosity versus time (for a given shear rate), a shear thinning fluid will have a constant
viscosity for any given time, whereas a thixotropic fluid will display a decrease in viscosity.

CHAPTER 3: Rheology and Flocculation
61
Figure 3-4. Shear thinning and thixotropic fluid
As mentioned in Section 3.2, viscoelasticity is also due to time effects, and this can be
another source of stress relaxation at constant strain rate. When a shear stress is applied to a
viscoelastic material part of the mechanical energy supplied is stored as elastic energy. When
the maximum stored energy for a particular stress is reached, the rate of supply of the energy
falls to that necessary to maintain flow, and the strain rate decreases [34]. When the stress is
removed, the elastic recovery of the system can be observed. In these fluids, there will be partial
recovery.
3.2.2 Measurement Commercially available devices in the form of coaxial cylinder, parallel plate, and vane
geometry are commonly used to measure the rheological properties of cement paste. High
fluidity cement pastes are measured most often using a coaxial cylinder or vane configuration in
order to prevent the material from flowing out of the test apparatus. Originally developed to

CHAPTER 3: Rheology and Flocculation
62measure polymer rheology, the sample holders for commercially available rheometers are
small, and, thus, are limited to cement paste. Slippage at the walls of the viscometer,
sedimentation of the particles, and plug flow [35] are some experimental challenges that can be
encountered during rheological testing. The yield stress and viscosity of the sample can be
underestimated due to the occurrence of a water rich layer that is formed at the surface of the
rheometer. For concentrated suspensions, a low viscosity layer can develop near cylinder
surfaces which leads to an apparent wall slip [32]. Slip is more prevalent in concentric cylinder
rheometers due to the constant strain rate in the material. The slip velocity can be determined by
making measurements with two different inner bobs with different radii, and this velocity can be
used to correct shear rate readings to give the true viscosity. Other ways to minimize slip are to
use a vane bob or by serrating the rheometer surface. Sedimentation is of particular concern to
high fluidity cement pastes. At high water contents, the particles in cement pastes may separate
gravitationally and centrifugally, which can cause errors. Plug flow occurs when the shear stress
does not exceed the yield stress everywhere in the sample. Thus, there will be a region within
the material that remains stationary and acts as a solid plug. Plug flow becomes more significant
at low shear rates. In the light of these experimental challenges, care should be taken to
minimize these problems when possible.
A number of custom-designed rheometers (BML, BTRHEOM, IBB, CEMAGREG-IMG
and Two-point workability test rheometer) have been developed to measure the rheological
properties of mortar and concrete. The reader is referred to reference [36] for more information
about the configuration and measurement principles of concrete rheometers. A comparison of
concrete rheometers was conducted at Laboratorie Central des Ponts et Chaussees (LCPC) in
Nantes, France [37]. The yield stress and plastic viscosity of twelve concrete mixes were

CHAPTER 3: Rheology and Flocculation
63measured in five different rheometers in order to compare the data measured from the different
rheometers and to establish correlation functions. It was found that even in controlled rheology
experiments (in which the same materials and mixing protocol were used) significantly different
values of yield stress and viscosity were obtained. However, good empirical correlation of yield
stress and viscosity measurements between any two rheometers existed. A second comparison of
concrete rheometers was conducted in 2003 in Cleveland, Ohio to determine the reliability of
the rheometers [38]. A high degree of variation was found among the measurements, which may
be an indication that the concrete rheometers were more sensitive to small variations in concrete
mixtures than originally thought.
3.3 Origin of yield Stress in cement paste
An amorphous C-S-H gel structure forms around the cement grain immediately after the cement
reacts with water. This gel structure arises from a combination of colloidal forces and the
chemical reaction that occurs during hydration. While cement may not be technically defined as
a colloid, a large proportion of cement consists of colloidal (particles ranging from 1 nm – 10 μm
[39]) particles, and for a typical cement powder the percentage of particles smaller than 2 μm is
20% by number [40]. It is likely that the interparticle forces resulting from these colloidal
particles largely contribute to the yield stress of the paste. Furthermore, as the cement paste
ages, its structure changes and the yield stress and viscosity increases. The microscopic
mechanism of yield stress in cement paste is likely due to the gel structure’s resistance to
deformation and reorganization of individual cement particles under applied stresses. If the
applied stress exceeds the threshold of the particles and the gel structure to resist deformation
and reorganization, flow will occur. The yield stress can be used as a measure of the strength

CHAPTER 3: Rheology and Flocculation
64and number of interparticle bonds that are ruptured due to the applied shear or stress [30]. It
has been hypothesized that interparticle links exist within cement paste that are broken
irreversibly by shear [30]. Tattersall and Banfill reported initial yield values for a normal
consistency cement paste ranging from 50 – 200 Pa [30]. Similarly, the yield stress values for
VC range from 500 Pa to a several thousands Pa, and for SCC these values tend to range from 0
– 60 Pa [41].
There are several ways to measure yield stress, and one of the most common techniques
is to extrapolate the shear rate – shear stress curve to the point in which the line intercepts the
stress axis. The point of intersection is considered the yield stress. In actuality, an exact yield
point is often difficult to measure, and the existence of the yield stress as a material property is a
topic of much debate [42-44]. It has been suggested that the yield stress does not exist at all
[45]. For most structured liquids the transition from the point of no flow to the point of flow (i.e.
yield point) is not a single defined point. Barnes and Walters showed that if the shear rate is
sufficiently low, there exists a lower Newtonian viscosity zone, and at sufficiently high shear
rates, an upper Newtonian viscosity zone. Between the upper and lower Newtonian viscosity
zones the viscosity decreases. Thus, there exists a range of stresses over which the flow behavior
changes dramatically. However, it has been argued that if the transition occurs over a small
range of stresses, then, for practical engineering purposes, this region can be considered the yield
stress, and, therefore, it is defined as an apparent yield stress [46].
Further complicating the matter, is the fact that different results can be achieved based on
the materials, testing protocol, and measuring device [30, 47-49]. Rahman and Nehdi [50]
investigated the effect of different rheological test geometries (smooth parallel plates serrated
parallel plate, coaxial cylinder, vane rotor) on the properties of cement paste. Rheological

CHAPTER 3: Rheology and Flocculation
65properties were found to be strongly affected by the surface friction and gap of the test
geometry. Test geometries with lower friction capability (i.e., smooth parallel plate and coaxial
cylinder) exhibited lower yield stress and higher viscosity compared to test geometries with
higher friction capability. Hodne [48] compared the influence of propeller blade shape and size
on the energy applied to oil-well cement slurries. It was found that the mixing energy was
dependent on the type of blade used and that the type of propeller blade used during mixing
influenced the rheological performance of the cement slurries. In 2002, Geiker et al. [49]
investigated the effect of measuring protocols on the rheological properties of SCC. They found
that shorter measurement sampling time resulted in higher values for yield stress and viscosity
and that the amount of time needed to achieve steady state flow is an important parameter that
should be taken into account when determining rheological protocols.
3.4 Origin of thixotropy in cement paste
In cementitious materials, the phenomenon of thixotropy results from the heterogeneity of the
material and changes in the resulting microstructure due to hydration. The specific causation of
thixotropy depends on interactions at the molecular level. Unfortunately, these mechanisms are
poorly understood. Thixotropy develops due to the finite time that it takes for the microstructure
to change from one state to another, and Helmuth (as reported by Struble [40]) suggested that
mixing breaks down the flocculent structure responsible for thixotropic behavior. Thus, from a
microstructural perspective, thixotropy is a result of structural degradation due to the rupturing of
flocs or linked particles [51]. As shown in Figure 3-5, one can visualize thixotropy as a
coagulation of particles when the system is at rest, and then as a separation of the particles during
shearing or agitation due to the rupturing of the interparticle bonds. In cement paste, it is likely

CHAPTER 3: Rheology and Flocculation
66that thixotropy is governed by a combination of reversible coagulation, dispersion, and then
re-coagulation of the cement particles [52].
Figure 3-5. Schematic of thixotropy phenomenon
The decrease in viscosity that is accompanied with thixotropy is due to the resulting flow
altering the microstructure. When a specific microstructure is agitated, the viscosity will
decrease with the shearing time until an equilibrium state (the lowest energetically possible state)
is achieved. Thus, the time scale in which the microstructural changes take place is an important
parameter in the consideration of thixotropy. During macroscopic flow, alignment of particles
along flow lines and/or separation of flocculated particles can occur, which results in a decrease
in viscosity. Reflocculation of the particles may offset the degree to which the viscosity reduces.
From the above discussion, it may be apparent that yield stress is coupled together with
thixotropy. The yield stress of cement paste is influenced by thixotropy because it takes time for
the microstructure to rebuild. For example, suppose a sample of cement paste is sheared for 5
minutes and then is left at rest. The resulting yield stress will be a function of the time that the
sample is allowed to rest. For a thixotropic fluid, longer resting times result in higher yield stress
because the fluid becomes more structured with time. The rate at which the yield stress changes
with time of rest can be used to quantify thixotropy [53].
At rest Under agitation
CHAPTER 3: Rheology and Flocculation
67There are several papers in the literature that confirm the existence of the thixotropic
phenomena in cementitious materials [30, 54, 55]. In 1941 Pierce conducted one of the earliest
experimental studies on thixotropy in which he attempted to measure the gel strength of cement
slurries under alternating cycles of rest and agitation [56]. More recently, in 2002, researchers at
the University of Sherbrook [57] investigated the influence of thixotropy on grout and concrete
by examining the difference between the peak stress and equilibrium stress. Another study [28]
was conducted in 2003 to assess thixotropy in SCC. In both of these studies, the mixtures were
not brought to an equilibrium state prior to performing the experiments. This is an important
consideration because the initial stress value depends on the shear history of the mixture. The
researchers at the University of Sherbrook conducted experiments in order to determine the
variation of thixotropy over time after 1, 2, and 3 hours, which provides a useful way to describe
the rate in which the material is rebuilding.
3.4.1 Rheological experimental characterization of thixotropy Measuring the rheology of cement paste gives an indication of the colloidal state and interactions
that are occurring. There are no standard methods to measure thixotropy but typical thixotropic
experiments often consist of either rheological tests conducted at a constant shear rate
(equilibrium flow curves) or using varied sheared rates (hysteresis loops) [8, 58, 59]. In the
varied sheared rate protocol, the shear rate is increased to a pre-determined maximum and then
decreased, and the rheological behavior is evaluated by plotting the resulting shear stress as a
function of the applied versus shear rate. If the plot shows a hysteresis loop (the “up increasing
shear-rate” curve is above the “down decreasing shear-rate” curve) then the material is
thixotropic (Figure 3-6a), whereas if there is no hysteresis loop (the “up” curve and “down”

CHAPTER 3: Rheology and Flocculation
68curve coincide) the material is shear-thinning (see Figure 3-6b). In actuality, nearly all shear-
thinning materials are thixotropic because it takes time for the microstructure to realign itself.
Figure 3-6. Hysteresis approach to examining thixotropy
For thixotropic fluids, the area between the “up” and “down” curve can be used as a
measure of thixotropy [58]. If a sample is left at rest for a period of time before testing, then the
formation of the up curve is a result of the initial resistance of the sample to flow. Once the
initial resistance of the sample is exceeded, flow will occur and the sample will undergo partial
breakdown. When the shear rate is decreased, there is a natural tendency for the structure to try
to rebuild. However, it takes time for the bonds to rebuild, and, thus, the up-curve and down-
curve do not coincide. An ideal shear thinning fluid is able to rebuild rapidly, and the up and
down curve will coincide.
Tattersall [60] was the first to report the use of varied shear rates to study the structural
breakdown and thixotropic behavior of cement paste. Pastes with a water-to-cement (w/c) ratio
ranging from 0.28 – 0.32 were tested using a coaxial cylinder viscometer. The speed of rotation

CHAPTER 3: Rheology and Flocculation
69of the outer cylinder was increased to a pre-defined maximum, reduced to zero, and then
increased again. This protocol (increasing and decreasing the speed of rotation of the outer
cylinder) was repeated about four times. Hysteresis loops were obtained for all paste mixtures
(see Figure 3-7), which provided evidence of the occurrence of structural breakdown due to
shear. Unfortunately, it is unclear if the specimen was allowed to rest for a period of time before
the outer cylinder’s speed of rotation was increased. Nevertheless, under the experimental
conditions used in Tattersall’s research, the structural buildup did not appear to occur at a fast
rate.
Figure 3-7. Hysteresis curves for cement paste [60]
In 1999, Ur’ev et al. [55] conducted experiments using the hysteresis testing method to
evaluate the variation of yield stress in different cement paste systems. Various superplasticizers
and different cement compositions were used in this study. In all mixtures, positive hysteresis
loop behavior was seen (up curve is at higher stress levels than the down curve), and it was

CHAPTER 3: Rheology and Flocculation
70supposed that this behavior was due to irreversible destruction of the crystalline component of
the coagulation-crystallization structure. Regardless of the type of superplasticizer added, the
area of the hysteresis loop significantly decreased..
If the structure experiences complete breakdown then the intersection of the down curve
of the hysteresis loop with the ordinate axis (τod) may also be used as an indication of yield
stress. Atzeni et al. [61] conducted a study in which τod was compared with the equilibrium yield
stress extracted from the equilibrium flow curve. Good agreement was found between the two
values. In general, a disadvantage of using a hysteresis loop testing method to evaluate
thixotropy is that the entire structural breakdown of the material may not be captured since the
loop captures a range between the peak and equilibrium stress for a given shear rate.
The shape of the hysteresis loop is highly influenced by the ramp rate. Studies conducted
by Saak [51] show that as the ramp rate decreases, the hysteresis loops shift to lower stress
values since more energy is inputted into the system to break the interparticle bonds of the
cement paste. However, if the ramp rate is too slow then it is possible to get a “figure 8”
hysteresis due to structural recovery. The varied shear rate protocol is a useful measurement
technique to measure the flow characteristics of cement systems, and information about the
transient flow properties can be obtained from testing one sample. However, the shape of the
hysteresis loop is very sensitive to the testing protocol (ramp rate, shear history), and, thus, it is
important that a detailed account of the experimental procedure is given.
Equilibrium flow curves are generated through monitoring the stress as a function of time
for a constant shear rate (see Figure 3-8). The initial stress, τi, is generally considered to
correspond to the initial structural condition [5], and the equilibrium stress, τeq, represents a
structural condition in which rate of structural breakdown and buildup are in equilibrium. τeq is

CHAPTER 3: Rheology and Flocculation
71independent of shear history and should only depend on the shear rate. It should be noted that
the material’s initial response in such tests may be elastic [8], and in controlled strain
experiments the thixotropic response may be seen as an overshoot in the stress. Typically, the
equilibrium flow curve is preferred over hysteresis loops since the effects of time and shear rate
are not coupled.
Figure 3-8. Equilibrium flow curve
Figure 3-9 shows the results that were obtained from testing an oil-well cement slurry
made from an ordinary Portland cement as reported by Hodne [48]. In this study, the rheological
properties of the cement slurries were tested after specific time intervals in a consistometer (an
apparatus that measures the torque exerted on a stationary paddle immersed in a rotating
container). In the figure, each curve represents the shear stress measured at a particular shear
rate plotted as a function of time spent in the consistometer. Although it was not pointed out in
the paper, it can be seen that for almost every shear rate, no significant increase in shear stress
occurred until after 120 minutes. Thus, two possible hypotheses can be made: 1) for the shear
Time
Shear stressτeq
τi

CHAPTER 3: Rheology and Flocculation
72rates used in the study, the rate of structural build-up and structural break-down are in
equilibrium; 2) breakdown dominates and rate of structural buildup is too slow to be significant.
Figure 3-9. Shear stress measured at different shear rates as a function of preconditioning
time [48]
3.4.2 Mathematical theories for thixotropy An ideal model to describe thixotropic behavior should start from some fundamental, rheology-
determining physical entity (ex. floc size, orientation angle of particles) that takes time to change
when the flow field around it is changing or has changed [8]. With information about the rate at
which the changes occur and how the microstructure relates to the stress, a predication about the
overall behavior may be possible.

CHAPTER 3: Rheology and Flocculation
733.4.2.1 Viscous theories:
A large number of thixotropic materials hardly show any elastic effects [58]. There are
numerous models in the literature [58] to describe viscous thixotropic behavior. In general they
can be divided into two classes: generalized continuum theory and structural kinetics.
Generalized continuum approach: These models specify the properties of the fluid through a
constitutive equation (equation that relates stresses (forces) to strains (deformations)). The
Reiner-Rivlin constitutive equation describes the nonlinear viscosity and some normal stress
effect behavior of (visco-inelastic) fluids [33]. Existing theories for thixotropic materials
generalize the Reiner-Rivlin constitutive equation by making the relationship between stress and
strain rate dependent on time [58]. The model can also be modified to include plastic behavior
(yield stresses). Slibar and Paslay (as reported in Mewis [58] and Mujumdar [62]) were the first
to apply a phenomenological approach to thixotropy. They used a Bingham equation with a non-
constant yield stress that was a function of shear rate and time to describe the flow of drilling
mud. In the model, flow will occur if the critical yield stress required for initiating flow (τcrit)
exceeds the stress necessary to sustain it (sliding yield stress, τsliding). The important modeling
features can be shown as [62]:
γμττ &+= sliding for τ ≥ τcrit Equation 3-6
where ),( tslidingsliding γττ &= and τcrit depends on shear history through an exponential memory
function. Similar models can be developed by modifying the assumptions used by Slibar and
Paslay (ex. allow for pseudoplastic behavior or introduce Hookean elastic behavior before
yielding). It should be noted that Equation 3.6 is a simplified expression of the equations

CHAPTER 3: Rheology and Flocculation
74developed by Slibar and Paslay in order to highlight the key terms. In reality, models based
on the continuum mechanics approach may consist of terms in which the physical meaning is not
clear [58] and may not be directly connected to the basic processes responsible for the structural
changes [62].
Structural kinetics approach: The flow behavior of thixotropic fluids involves the competition of
between the interparticle bonds broken from shear-induced stresses and the interparticle bonds
formed from shear-induced collisions and attractive forces. Thus, the behavior of both can be
modeled as a rate process in which the two major parameters are structural breakdown and
structural buildup. A state of dynamic equilibrium is reached when the rates between the two are
equal. The methodology of this approach consists of a rheological constitutive equation and a
kinetic equation.
3.4.2.2 Indirect Microstructural Theories This approach is based on a scalar structural parameter, λ, which is used to represent the extent
of breakdown. λ can vary from 0 to 1 where a completely broken down structure is represented
by λ = 1 and a fully built up structure is represented by λ = 0. The time derivative of λ is used to
represent thixotropy, and, in the simplest theories, it is only controlled by the shear rate and the
current level of structure λ [8]. Balance equations can be written for the structural buildup and
structural breakdown
ab kkdtd γλγλλ
&& 12 )1( −−= Equation 3-7

CHAPTER 3: Rheology and Flocculation
75where a is the exponent for the rate of structural breakdown, b is the exponent for rate of
structural buildup, and k1 and k2 are rate constants for breakdown and build-up, respectively. λ is
then related to the shear stress or viscosity through rheological models (ex. Bingham equation,
etc.). It is assumed that the rate of break-down depends on the shear rate and on the fraction of
links existing at any instant and that the rate of buildup is proportional to the fraction of links
remaining to be formed [63]. In Equation 3-7, the mechanisms of breakdown and buildup are
described using a single rate constant; however, considering the likelihood that there are different
types of bonding in the system (van der Waals, ionic, etc.) and that these bonds have different
strength, using a distribution of rate constants may provide a more accurate characterization of
the mechanisms.
In 1964, Worrall and Tuliani [64] used the concept of structural parameter to account for
yield stress during the aging in clay-water suspensions. For deflocculated clay-water
suspensions, the rate of structure breakdown was given as
γλλλλ&102 )( kk
dtd
−−= Equation 3-8
where λ0 is the maximum amount of structure in the suspension and λ varied from 1 (for
complete build-up) to 0 (for complete breakdown). The relationship between λ and stress was
found to be
ba
bgyield +
⋅⋅++=
γγτγητ
&
&&0 Equation 3-9
where τyield is the yield stress.

CHAPTER 3: Rheology and Flocculation
76 In the classic paper by Cheng and Evans [65], general models for thixotropic and
antithixotropic fluids were developed. They proposed that the change in shear stress with respect
to the change in shear rate (for a constant structure) is always greater than zero and that the
structure will always tend towards the equilibrium condition. Allesandrini et al. [66] used the
Cheng and Evans approach to derive a constitutive equation characterizing the rheological
behavior of gypsum plaster pastes. The pastes were tested under a constant shear rate condition,
and the model was used to characterize the shear stress decay prior to the occurrence of set. The
kinetic equation for the degree of structure was considered in respect to the Herschel-Bulkley
equation and the Bingham equation. While a better fit to the data was obtained with the
Herschel-Bulkley equation, the Bingham equation better described the shear and time-dependent
behavior due to variations in the solid volume content. In 1988, Papo [67] also employed the
Cheng and Evans approach to characterize the initial shear stress decay with time for white
cement pastes. The constitutive equation used in this study was based on the Casson model.
Roussel et al. [68] also employed the Cheng Evans approach to fresh cement pastes. Their
constitutive relationship was based on an approach by Coussot et al [69] in which the apparent
viscosity was an increasing function of the structural parameter and was given as
( )γλμτ &a+= 10 Equation 3-10
and
γλλ&1
1 kTdt
d−= Equation 3-11

CHAPTER 3: Rheology and Flocculation
77where μ0 is the viscosity at infinite shear rate when λ tends towards zero (completely broken
down structure) and 1/T is the flocculation term, and T is the characteristic time of aging. In
2003, Cheng [70] revisited the models proposed in his earlier work in order to take into account
negative slope behavior of the equilibrium flow curve for thixotropic materials.
3.4.2.2.1 Direct Structural Theories In these models, the rate of change in time of rheological parameters is caused by changes in the
internal structure [58]. Typically, it has been assumed that the number of bonds within the
material is an adequate way to characterize the changes within the internal structure. However, it
should be noted that there are studies in which the apparent viscosity has been used as a measure
of structure [58]. Similar to the methodology used in Section 3.4.2.2, balance equations can be
used to represent the change in the interparticle bonds:
[ ] αβ γγ )()()()(102 tnkttnnk
dttdn cd && −−= Equation 3-12
where n is the number of unbroken bonds, n0 is the total number of bonds in the existing virgin
structure, α is the exponent for structure breakdown, β is the exponent for structure build-up, and
k1, k2, d, and c are constants [58]. A change in dn/dt results in a proportional change in the
material behavior (ex. viscosity), and the rheological constitutive equation characterizes
instantaneous stress as a function of the degree of structure, [ ] βγτ &ban += . As reported by
Barnes [8], Denny and Brodkey used a structural kinetics approach that looked at the distribution
of broken and unbroken bonds and then later connected the number of these bonds to viscosity.

CHAPTER 3: Rheology and Flocculation
783.4.2.3 Viscoelastic Theories The mechanism of thixotropy can be introduced into viscoelastic theories if the parameters for
viscous and elastic responses are modified to take into account variable structure. For direct
structural theories, the instantaneous response to stress is now viscoelastic [58], and the
generalized continuum approach should be modified to include elasticity.
3.5 Flocculation Mechanisms
3.5.1 Attractive Forces The way in which the atoms are arranged is primarily determined by nature and the directionality
of the interatomic bonds holding the fluid together [71]. Ionic, covalent, and metallic bonds can
be considered strong primary bonds. These bonds are formed when outer orbital electrons are
transferred or shared between atoms [72]. Van der Waals force is the general term for all the
weaker secondary intermolecular attractive forces that exist between neutral molecules. These
forces are significant only when molecules are very close together. These secondary bonds can
be thought of as physical bonds, and they are the result of more subtle attraction between
positive and negative charges without any actual transfer or sharing of electrons [72]. Rather,
the attraction depends on the dipole (asymmetrical distribution of positive and negative charges)
within each atom or molecular unit being bonded. In regard to thixotropy, the interatomic bonds
are easily broken by shear; thus, it is likely that the weaker secondary bonds are at issue and that
these are the bonds that will control reversible coagulation and deflocculation. There are four
types of secondary forces: ion-dipole, dipole-dipole, hydrogen bonds, and London dispersion
force. The following paragraph will discuss these forces in more detail.

CHAPTER 3: Rheology and Flocculation
79The shape of a molecule and the polarity of its bonds determine the charge distribution
in the molecule. A molecule in which the centers of negative and positive charge do not coincide
is called a polar molecule. Dipole-induced dipole (also known as Debye) occurs when a polar
molecule having a permanent electric dipole moment induces a dipole moment in a nonpolar
molecule [73]. Dipole-dipole (also known as Keesom) forces are the attractive forces that occur
among molecules with a permanent electric dipole moment. These forces are generally weaker
than ion-dipole forces [74]. For molecules of similar mass and size, an increase in dipole
polarity increases the strength of intermolecular attraction. Hydrogen bonds are a special type of
intermolecular attraction occurring between the hydrogen atom in a polar bond and an unshared
electron pair on a nearby ion or atom [74]. These bonds can be considered a particular type of
dipole-dipole bond, but, they tend to be stronger than the typical dipole-dipole bond. London
dispersion forces arise from the temporary (instantaneous) dipole that is created from the
oscillation of electron clouds in an atom or molecule. The temporary dipole in an atom can
induce a similar dipole on an adjacent atom causing the atoms to be attracted to one another.
Since all molecules have electron clouds that can oscillate, London forces always contribute to
intermolecular attractions. Forces like dipole-dipole will act in addition to the London dispersion
forces.
Van der Waals forces are always attractive between particles of the same nature. As
noted by Morrison [75], in 1937, Hamaker proposed a molecular model to calculate the van der
Waals force of attraction between particles. This model is based on the summation of the van
der Waals energies between all pairs of molecules in the separate particles and is proportional to
the inverse sixth power of distance [76]. The general form of the Hamaker equation for the
energy of attraction between two particles is given by:

CHAPTER 3: Rheology and Flocculation
80
∫∫−=21
612
22
112,VV
A rdVdVAVπ
Equation 3-13
where dV1 and dV2 are differential volume elements of the particles, and A is Hamaker constant
[75]. Hamaker constant is a material-dependent term dependent on the properties of the particles
and the dispersion fluid. The particular case of the attraction between two equal spherical
particles of radius, a, is given by:
⎥⎦
⎤⎢⎣
⎡ −++
−−= 2
22
2
2
22
2 4ln24
26 R
aRRa
aRaAVA Equation 3-14
where R is the distance between the centers of the two particles. The attractive force is directly
proportional to the size of the particle and inversely proportional to the square of the distance
separating the particles (Figure 3-10).
Figure 3-10. Attractive energy as a function of distance between particles [77]

CHAPTER 3: Rheology and Flocculation
81 It should be noted that that the energy of attraction is retarded if the distance between
the particles is too large. This is due to the large amount of time that is needed for the electric
field to propagate from one particle to another. However, in most practical examples of colloid
stability, only the nonretarded van der Waals force is important [76].
As stated earlier, the van der Waals force is always present between atoms, and, in the
absence of any other repulsive or attractive forces, the London dispersion force will be
responsible for the creation of flocs in a suspension [78]. However, in cement paste it is unclear
whether flocculation of cement particles is due to the London dispersion force or electrostatic
attraction among particles of dissimilar surface potential [40]. The strength of the force of
attraction from the London dispersion forces is related to the size of the particle, and, for
colloidal particles, the forces are significant. As stated in Section 3.3, although cement is not a
colloid, a large percentage of the particles are colloidal. Thus, it is likely that a large number of
particles may flocculate due to the London dispersion forces. In addition, since cement is a
heterogeneous material and it is composed of many different phases, compositional differences
are also likely to cause electrostatic attraction between particles [40]. A recent study by Plassard
et al. in 2005 [79] involved the use of atomic force microscopy to investigate if non van der
Waals forces contribute to the flocculation of cement pastes. The pore solution of the hydrated
cemented paste was simulated using a calcium hydroxide solution. It was found that the
intensity of the attractive force is related to the calcium hydroxide concentration. For high
calcium hydroxide concentrations, the interaction force was purely attractive, and it was
suggested that the attraction was due to ion-ion interaction. This indicates that there are forces
other than the weak van der Waals force that are holding the structure together, and it is possible
that the different bonds will break and reform at different rates.

CHAPTER 3: Rheology and Flocculation
823.5.2 Repulsive Forces Repulsive forces can occur either through electrostatic repulsion or by steric repulsion. The next
section will discuss these two mechanisms in more detail.
3.5.2.1 Electrostatic Repulsion In an aqueous media, particles can be electrically charged. As a result, the ions in the water that
have a sign opposite of the particle charge will be drawn toward the particle [32]. Thus, near the
surface of the particle, a layer of these charges will develop. This layer is called the Stern layer.
The Stern layer is strongly attached to the surface of the particle. Outside of the Stern layer is a
diffuse layer of counter ions. The concentration of counter ions is high near the surface of the
Stern layer, and the concentration of counter ions decreases linearly with distance within the
Stern layer. Outside of the Stern layer, the potential decreases exponentially with distance until
equilibrium is reached with the counter-ion concentration in the bulk solution (Figure 3-11).

CHAPTER 3: Rheology and Flocculation
83
Figure 3-11. Schematic representation of zeta potential
Because cement particles in water are positively charged (Powers as reported in Saak
[51]), let us suppose that the Stern layer is composed of negative ions. Additional negative ions
are attracted to the positive cement particle, but they are repelled by the negative Stern layer and
the other negative ions that are also trying to approach the positively charged cement particle.
Thus, the diffuse layer is the result of the dynamic equilibrium of competing counter-ions. If the
particles are of the same chemical nature and have surface charges and surface potentials of the
same sign and magnitude, then the electrostatic forces will always lead to repulsion between the
particles [76]. In cement paste, the electrostatic repulsion force will depend on the pore solution.

CHAPTER 3: Rheology and Flocculation
84 The attached counter-ions in the Stern layer and the charged atmosphere in the diffuse
layer together are called the double layer. The Debye-Hückel length (1/κ) represents the
thickness of the double layer, which depends upon the type and concentration of ions in solution.
The range of the electrostatic repulsion force is of the order of the Debye-Hückel length:
∑
= 2201
ii zcFRTεε
κ Equation 3-15 (from [76])
where ε0 is the permittivity of the vacuum, ε is the dielectric constant (relative permittivity) of
the dispersion medium, R is the gas constant, T is the absolute temperature, F is the Faraday
constant, ci is the ionic concentration of the ions of type i in the dispersion medium, and zi is the
charge number of the ions of type i in the dispersion medium. In colloidal dispersions, the
Debye-Hückel length ranges from 1 – 100 nm [80].
For small surface potentials, Φ0 and small κa (thus the double layer is extended beyond
the radius of the particle), the energy of repulsion, Vr, is
aH
HaVr 2/1)exp(2 2
00 +−
=κφπεε Equation 3-16
where H is the distance between the surfaces of the two particles. Thus, the distance between the
two centers of two particles is given by R = 2a+H. For small values of Φ0 and small values of
exp(-κH), the repulsion energy is
)exp(2 200 HaVr κφπεε −= Equation 3-17
Vr becomes significant when the double layers between two particles begin to interact.

CHAPTER 3: Rheology and Flocculation
85An electrostatic repulsion curve is used to indicate the energy that must be overcome
for the particles to be forced together. A maximum value for the repulsive energy is obtained
when the particles are in close contact, and it decreases to zero outside of the double layer (see
Figure 3-12).
Figure 3-12. Repulsive energy as a function of distance between particles [77]
It is assumed that the surface potential is constant during the course of action of the
particles; however, for cementitious materials this may not be a valid assumption due to changes
that result from the hydration reaction. Furthermore, the value of the actual surface potential is
often not known, and, thus, the zeta potential, ξ, is often used as an approximation of Φ0. The
zeta potential is defined as the electric potential at the plane of shear between the moving particle
and the liquid constituting the bulk liquid phase [81]. This plane of shear (also called the slip
plane) is usually defined as the point where the Stern layer and the diffuse layer meet, but it can
vary anywhere within the double layer. The electric potential within the plane of shear can vary

CHAPTER 3: Rheology and Flocculation
86right up to the surface of the particle due to the adsorption of ions within the Stern layer [75].
The zeta potential and the Debye-Hückel length are the two parameters of the double layer that
can be determined experimentally. However, neither of these properties can be measured
directly. The zeta potential is computed from measurements that use electrokinetic motion of
particles, while the Debye-Hückel length is computed from the ionic composition of the
dispersion medium and where the ionic strength of the bulk solution is defined as
∑= 2
21
iic zcI Equation 3-18 [80]
If the zeta potential is too small then the maximum electrical repulsion will not be strong
enough to overcome the London-van der Waals attraction between the particles, and, as a result,
the particles will flocculate. In pure cement paste, the zeta potential typically ranges from -10 to
20 mV [82]. Chemical admixtures, such as water-reducing agents and viscosity-modifying
agents (VMA), are commonly used to alter the flocculation mechanisms. Water-reducing
admixtures are commonly used in concrete to lower water demand requirements while still
maintaining good workability. Regular water-reducing admixtures are capable of reducing water
demand requirements by 5 - 10% while mid-range water reducers reduce water demand
requirements by 10 - 15%. Further reductions in water requirements can be obtained by using
higher dosages, though it is not recommended due to problems that can occur with setting,
segregation, bleeding, and air content of the concrete. High range water-reducing admixtures
(also known as superplasticizers) are able to impart much higher amounts of water-reduction
(ranging from 15 – 30%) and are commonly used in SCC and high-performance concrete. Until

CHAPTER 3: Rheology and Flocculation
87recently, all superplasticizers were highly ionic polymers that adsorbed at the interface
between the cement particle and water. As mentioned in Section 3.5.2.1, cement particles carry a
surface charge, and the molecules of the water-reducing admixture interact to neutralize these
surface charges so that the surfaces will carry uniform charges of the like sign [83]. As a result,
electrostatic repulsion acts between the cement particles. The cement particles are dispersed and
the fluidity of the cement paste increases. The addition of water-reducing agents typically
induces negative zeta potentials, ranging from -30mV for strong electrolytes to -5mV for weaker
electrolytes [82, 84]. In ordinary cement pastes, zeta potential studies have been used
successfully to investigate particle coagulation [85], flocculation mechanisms [86], and the effect
of superplasticizers on rheology [87]. If the zeta potential is too small then the maximum
electrical repulsion will not be strong enough to overcome the London-van der Waals attraction
between the particles, which will result in flocculation/coagulation.
3.5.2.2 Steric Repulsion Surface-active agents are organic molecules that when dissolved in a solvent at low
concentration have the ability to adsorb at the interfaces, thereby altering the physical properties
at those interfaces [39]. The addition of large molecules, such as proteins or gums, inhibits
flocculation in colloidal suspensions due to interaction of long-chain molecules adsorbed on the
particles. The source of the steric repulsion between dispersed particles is due to an increase in
free energy resulting from the overlap of adsorbed layers [75]. This will occur if the chain length
of the adsorbed particle is longer than the distance between the particles. Hence, for a given
system, surfactants must be carefully selected. If the surfactant chain molecules are shorter than
the size of the particles in the system, steric repulsion will not occur.

CHAPTER 3: Rheology and Flocculation
88
Figure 3-13. Schematic of steric repulsion mechanism
Advances in chemical engineering and concrete/cement rheology have lead to the
development of new admixtures with better and longer dispersing ability, and the use of
polycarboxylate-based superplasticizers have been important in the development of SCC. These
superplasticizers use negatively charged polymers to adsorb at the interface. It is generally
accepted that steric repulsion from the bulky protective layer of the adsorbed polymers on the
cement particles prevents the cement particles from agglomerating (see Figure 3-13). In 1997,
Uchikawa et al. [88] experimentally proved for the first time the existence of a steric repulsive
force in the dispersion of cement pastes with organic admixtures.
3.5.3 DLVO Theory and Stability Developed in the 1940’s by Derjaguin, Landau, Verwey, and Overbeek, the DLVO theory is the
general theory that describes the stability of colloidal suspensions. This theory is based on the
linear addition of the electrostatic potential and van der Waals forces potential to determine the
total force (net interaction energy) acting on the system.
RAT VVV += Equation 3-19
cement cement grafted polymer
protective layer

CHAPTER 3: Rheology and Flocculation
89Substituting in 3-20 and 3-21 yields
)exp(24ln24
26
2002
22
2
2
22
2
HaR
aRRa
aRaAVT κφπεε −+⎥
⎦
⎤⎢⎣
⎡ −++
−−= Equation 3-22
Figure 3-14 shows a schematic of the VT as a function of the separation between the
particles. The point of maximum repulsive energy is called the energy barrier (shown as ψmax in
Figure 3-15), and the height of this barrier indicates the stability of the dispersion. A higher
height indicates a more stable dispersion. In order for two particles to flocculate, there must be
sufficient kinetic energy (due to the mass and velocity of the particle) to get over the energy
barrier. If the kinetic energy is sufficient to overcome the energy barrier, then the net interaction
is attractive and the particles will flocculate. This inner region is referred to as an energy trap
(shown as ψmin in Figure 3-15) since the particles can be considered to be trapped together by van
der Waals forces [77].
Figure 3-14. Total interaction potential curve for a stable dispersion [77]
CHAPTER 3: Rheology and Flocculation
90Flocculation will occur when the particles move into an attractive minimum, and more
than one minimum is possible (shown as ψmin and ψsec in Figure 3-15). The depth of the
attractive minimum determines the nature of the flocculation. The larger the depth of the
attractive minimum, the more strongly the particles will stick together. A dispersion is
considered stable when the maximum value of the total interaction curve is large compared to the
kinetic energy [75]. Thus, the magnitude of the repulsive potential must be greater than the
magnitude of the attractive potential to prevent flocculation.
It was shown in Section 3.5.2.1, that Vr = fn(ionic concentration), and, if the zeta
potential and particle size is held constant while varying the ionic strength, then the energy
barrier (and hence the flocculation mechanisms) within the dispersion can be altered. A stable
dispersion (represented by Curve A in Figure 3-15) is obtained at low ionic strength and high
surface potential. Similar to the curve shown in Figure 3-14, the repulsive potential is greater
than the attractive potential at all separation distances. A flocculated suspension (Curve B in
Figure 3-15) is obtained at moderate ionic concentrations when the two particles are located in
the secondary minimum. Particles in this region may be strongly flocculated or weakly
flocculated depending on the magnitude of ψsec. When -ψsec/kBT ≈ 1, the state of flocculation is
reversible [80]. When the ionic concentration increases to a critical concentration, the energy
barrier disappears and the system becomes a coagulated suspension (Curve C in Figure 3-15). In
this state, the particles are irreversibly flocculated at the primary minimum.
In a dilute dispersion, it is sufficient to consider interactions between only two particles at
a time; however, for a concentrated suspension like cement paste, multi-particle (more than two)
interactions should be considered. Furthermore, the addition of superplasticizers may also result
in electrosteric repulsion forces between the particles. The zeta potential is a measure of the

CHAPTER 3: Rheology and Flocculation
91strength of the electrical force that exists between particles in a fluid. However, it does not
capture the contribution due to steric repulsion mechanisms. For highly plasticized cement
pastes (especially those used in SCC) an additional term should be added to the DLVO theory in
order to describe the contribution of the steric repulsive mechanism to the repulsive force. With
the inclusion of the steric forces, the total interaction force can be expressed as [89]
( ) TaMkvrR
aRRa
aRaAV BT )1(
2724ln2
42
622/32
2/5
2
22
2
2
22
2
απ−+⎥
⎦
⎤⎢⎣
⎡ −++
−−= Equation 3-23
where υ is the number of adsorbing chains per unit area, α is the surface potential, <r2>1/2 is the
mean distance between both ends of the chain in the solvent, and M is the coefficient concerning
the distance H.
Figure 3-15. Effect of ionic concentration on total interaction potential curves (from [80])

92
PART III: Evaluation of Structural
Rebuilding

CHAPTER 4: Development of a Rheological Protocol to Measure Structural Rebuilding
93
4 CHAPTER 4: Development of a Rheological Protocol to
Measure Structural Rebuilding
4.1 Introduction The main hypothesis of this dissertation is that the structural changes that occur within and
during the induction period (i.e. prior to initial setting) are primarily governed by the paste
matrix since the aggregates can be thought of as inert materials. Rheological tests can provide a
useful way to characterize the structure of a cement paste prior to initial set. This chapter
presents a newly developed protocol for measuring structural rebuilding.
4.2 Experimental Program
4.2.1 Materials and Mix Composition All of the paste mixtures were prepared using Type I cement and tap water. In select mixtures,
silica fume and fly ash were used to replace portions of the cement. The chemical compositions
of the cement, fly ash, and silica fume are listed in Table 4-1. A polycarboxylate superplasticizer
(specific gravity = 1.04) was employed in all of the mixtures.

CHAPTER 4: Development of a Rheological Protocol to Measure Structural Rebuilding
94
Table 4-1. Chemical composition of cement, fly ash, and silica fume
Cement Fly ash Silica fume SiO2 (%) 20.1 47.5 95.5 Al2O3 (%) 4.8 26.4 0.41 Fe2O2 (%) 2.7 12.2 0.28 CaO (%) 63.8 5.4 0.49
MgO 2.5 0.9 0.24 SO3 2.5 1.1 - LOI 1.42 2.04
Fineness (+325 mesh) (%) 95 16 - Oversize 45μm (0.0017 in.) (%) - - 0.42
Specific gravity 3.1 2.3 2.07
4.2.2 Sample Preparation A Hobart mixer was used to mix all samples. Prior to mixing, a portion of the water was used to
dilute the superplasticizer. In addition, another portion of the water was set aside to rinse the
cylinder containing the diluted superplasticizer. The remaining water (total water minus rinse
water and water used for dilution) was added to the powder materials and mixed for 3 minutes at
a low speed (136 rpm). Then the mixer was turned off and within one minute the sides of the
bowl were scraped with a spatula and the superplasticizer was added. Then, the paste was mixed
for 15 seconds at low speed. Finally, the paste was mixed for an additional 2 minutes and 45
seconds at high speed (281 rpm). Hence, the total mixing time for the cement paste was 7
minutes. After mixing, a portion of the paste was placed into a HAAKE-RS150 rheometer for
rheological testing and the remainder of the paste was used for the paste flow tests. Paste flow
tests were conducted 1 minute after the sample preparation was completed (hence 8 minutes after
the induction of water) using a glass plate and a mini-slump cone (c.f. Figure 4-1). The

CHAPTER 4: Development of a Rheological Protocol to Measure Structural Rebuilding
95dimensions of the cone were 70 mm (2.76 in), 100 mm (3.94 in.), and 50 mm (1.97 in.), for
the upper inner diameter, lower inner diameter, and height. After pouring the sample into the
cone, the cone was vertically lifted to allow the paste to flow freely. The diameters in two right
angle directions were measured one minute after lifting the cone. The slump flow diameter (sfd)
was determined by taking the average of the two measured diameters.
(a) (b)
Figure 4-1. Paste slump flow diameter test (a) prior to lifting mini-slump cone; (b) slump
flow diameter: sfd = (diameter 1 + diameter 2)/2
4.2.3 Rheometer A HAAKE Rheostress150 rheometer with a concentric cylinder geometry conforming to the
German DIN 53019 sensor system was used. The radius of the outer cylinder (Ra), radius of the
inner cylinder (Ri), and the length of the inner cylinder (L) are 10.85 mm, 10.00 mm, and 30.00
mm, respectively (c.f. Figure 4-2). For time-dependent fluids, it is desirable for the annular gap
Mini-slump cone
Diameter1
Diameter2

CHAPTER 4: Development of a Rheological Protocol to Measure Structural Rebuilding
96to be very small in order to minimize the strain variation and difference in shear history for the
materials near the inner and outer cylinder. The shear rate (γ& ) is estimated to be proportional to
the angular velocity of the inner rotating cylinder (Ω ) and a geometry factor (M), M⋅Ω=γ&
where 22
22
io
oi
RRRR
M−
+= for the concentric cylinder geometry. The angular velocity is measured
in units of reciprocal seconds and is determined from the 60/2 n⋅⋅=Ω π where n represents the
speed of the rotor (measured in reciprocal minutes) [90]. All tests were conducted using a
temperature control unit (maintained at 23°C) to limit strain variations due to sample heating.
Figure 4-2. Concentric cylinder rheometer system conforming to German DIN 53019
sensor system with standardized dimensions, where Ra = radius of outer cylinder, Ri =
radius of inner cylinder, Rs = radius of the rotor shaft, a = distance from bottom of outer
cylinder to apex of cone, α = angle of the cone, L = length of inner cylinder, L’ = distance of
the rotor [90]

CHAPTER 4: Development of a Rheological Protocol to Measure Structural Rebuilding
974.3 Preliminary attempts Different rheological techniques that could be used to measure the structural rebuilding were
considered. One of the key considerations was that the method provided a relatively fast way to
measure the rebuilding and that it was not too labor-intensive.
4.3.1 Dynamic rheology The application of dynamic tests using small-amplitude oscillatory shearing to measure the
viscoelastic properties was investigated. When the strain amplitude in an oscillatory shear flow
is very small, the stress curve as a function of time can be described by a single trigonometric
function
[ ])cos()('')sin()(')( 0 tGtGt ωωωωγσ +=
where γ0 is the strain amplitude imposed on the fluid, ω is the frequency of oscillation, G’(ω) is
the storage (elastic) shear modulus, and G’’(ω) is the loss (viscous) shear modulus. The storage
shear modulus represents the elastic behavior or the energy storage of the material, and the loss
shear modulus represents the viscous behavior or energy dissipation of the material. The
complex shear modulus, G*, is a measure of the material’s resistance to deformation and defined
by G* = G’+iG’’ where i is the imaginary unit. By limiting the strain to small amplitudes, the
particles stay in close contact with one another and are able to recover elastically so that the
microstructure is not disturbed and the paste behaves as a solid [91]. Thus, an important aspect
to conducting this type of test is determining the linear viscoelastic region (LVER) in which the
moduli are independent of the strain amplitude. An additional parameter for the LVER is that

CHAPTER 4: Development of a Rheological Protocol to Measure Structural Rebuilding
98the frequency of the applied oscillation provides sufficient time for the sample to relax so that
there is no build up of residual energy. A practical way to determine the critical shear strain for
the LVER is to conduct a strain sweep for a constant frequency. Ideally, there should exist a low
shear plateau zone in which the moduli are constant. This plateau is seen when the moduli are
plotted against the applied strain in a log-log scale. The critical shear strain is determined at the
point in which the low shear plateau ends. In order to determine whether oscillatory shear
rheology can be used to evaluate the structural rate of rebuilding in SCC pastes, the LVER
should be first established.
A strain sweep was performed on 2 different plasticized cement pastes. Each paste had a
w/b ratio of 0.35, but the superplasticizer dosage was varied in order to achieve a slump flow
diameter which would be more representative of paste for SCC (Table 4-2). The rheometer was
specified to sweep the shear strain from 3.87 x10⁻⁵ (which is the lowest capacity of the machine)
to 1.00 x10², and the frequency was set at a level of 1 Hz. Prior to the start of the strain sweep
each sample was sheared at 600s-1 for eight minutes and then allowed to rest for 15 minutes.
The rest time was given so that the internal structure would have time to rebuild.
Table 4-2. Slump flow diameter for pastes used in oscillatory rheology studies
Paste Slump flow diameter
A 10.5 inch (267 mm)
B 12 inch (305 mm)

CHAPTER 4: Development of a Rheological Protocol to Measure Structural Rebuilding
99Figure 4-3 and Figure 4-4 show the variation of G’’ and G’ with strain amplitude. It
can be seen that regardless of the slump flow diameter, the low shear strain plateau is not well
defined and that the critical shear strain is very small. Small critical strains are associated with
strong interparticle forces [92]. A critical shear strain of approximately 1.2 x 10⁻⁴ was seen in
mix A. This result is in agreement with data from Sun for a non-plasticized cement paste with a
w/c ratio of 0.6 [93]. When the slump flow diameter was increased to 12 inches the critical shear
strain decreased to the point that the observance of the low shear strain plateau (and thus LVER)
ceased to exist. This indicates that Paste B has a much shorter LVER than Paste A and,
therefore, would be expected to break down much more easily with small movements or
agitations. This is expected due to the higher dosage of superplasticizer, which decreases the
elasticity and stress resistance of the sample.
Figure 4-3. Dependence on loss modulus on strain (f = 1 Hz)

CHAPTER 4: Development of a Rheological Protocol to Measure Structural Rebuilding
100
Figure 4-4. Dependence on elastic modulus on strain (f = 1 Hz)
As seen in Figure 4-5, the addition of superplasticizer caused a reduction in the
rheological parameters (compare G’ and G’’ of Paste A and Paste B). This reduction is
indicative of microstructural changes occurring due to the interaction of the polymer chains of
the superplasticizer with the cement particles. Difficulty in determining the extremely small
critical strain values makes it hard to ensure that the sample is tested within the LVER. For this
reason, alternative ways of investigating the structural build-up were investigated.

CHAPTER 4: Development of a Rheological Protocol to Measure Structural Rebuilding
101
Figure 4-5. Strain sweep and viscoelastic behavior of cement paste
4.3.2 Shear Rheology To accurately evaluate and compare the rate of rebuilding of different materials, it is important
that the specimen starts from a well-defined initial condition. After placing the cement paste in
the rheometer, the sample was immediately sheared at 600 s-1 (c.f. Figure 4-6). The time needed
to establish the equilibrium shear stress (τeq) depends on the mix composition, but it was found
that shearing the mixes at 600 s-1 for 8 minutes was enough to establish an initial equilibrium
condition in which a steady-state shear stress was achieved.

CHAPTER 4: Development of a Rheological Protocol to Measure Structural Rebuilding
102
Time (s)
0 100 200 300 400 500 600
Shea
r St
ress
(Pa
)
60
80
100
120
140
160
τeq
equilibrium condition
Figure 4-6. Establishment of equilibrium condition (shear rate = 600 s-1)
The shear rate was then ramped down from 600 s-1 to 0 s-1 over a 30 second interval.
This process establishes the equilibrium loop—that is, the hysteresis loop used to establish the
equilibrium downline. This is so named because if immediately after ramping the shear rate
from 600 s-1 to 0 s-1 the shear rate is then ramped from 0 s-1 to 600 s-1, the resulting line will be
perfectly superimposed on the descending branch of the equilibrium loop. Thus, the descending
portion of the equilibrium loop is called the equilibrium line (c.f. Figure 4-7). It was shown that
for a given shear rate the stresses in the equilibrium line correspond to τeq for a given shear rate
[51].
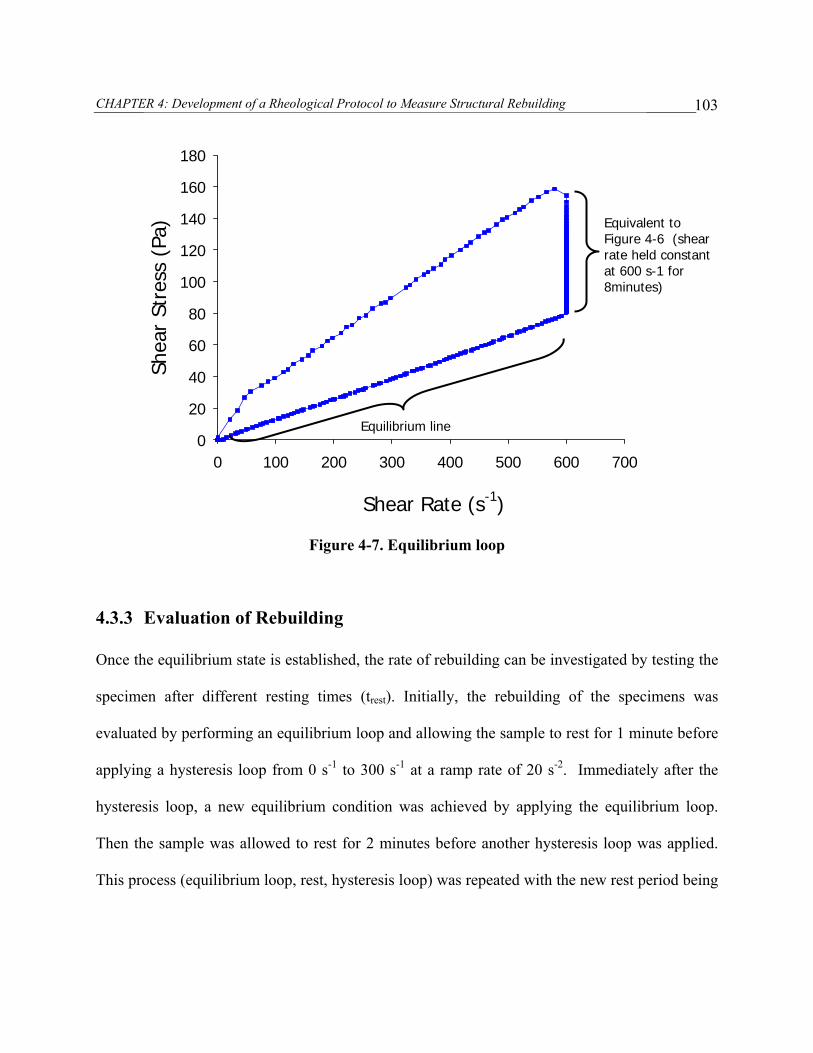
CHAPTER 4: Development of a Rheological Protocol to Measure Structural Rebuilding
103
Shear Rate (s-1)
0 100 200 300 400 500 600 700
Shea
r St
ress
(Pa
)
0
20
40
60
80
100
120
140
160
180
Figure 4-7. Equilibrium loop
4.3.3 Evaluation of Rebuilding Once the equilibrium state is established, the rate of rebuilding can be investigated by testing the
specimen after different resting times (trest). Initially, the rebuilding of the specimens was
evaluated by performing an equilibrium loop and allowing the sample to rest for 1 minute before
applying a hysteresis loop from 0 s-1 to 300 s-1 at a ramp rate of 20 s-2. Immediately after the
hysteresis loop, a new equilibrium condition was achieved by applying the equilibrium loop.
Then the sample was allowed to rest for 2 minutes before another hysteresis loop was applied.
This process (equilibrium loop, rest, hysteresis loop) was repeated with the new rest period being
Equivalent to Figure 4-6 (shear rate held constant at 600 s-1 for 8minutes)
Equilibrium line

CHAPTER 4: Development of a Rheological Protocol to Measure Structural Rebuilding
104twice the amount of the previous rest period. Thus, the resting periods were 1, 2, 4, 8, and 16
minutes.
For a given resting period, the area on the rheogram plane between the up curve of each
hysteresis loop and the corresponding equilibrium line was used to evaluate the rebuilding that
occurred in the specimen. This area has the physical dimension of energy per unit time per unit
of volume (or power per unit volume) and is called the specific rebuilding energy (SRE). A plot
of the SRE versus its corresponding trest is used to determine the rate of rebuilding by looking at
the slope of the line in this plane. For a given specimen, the slope of this line indicates the
degree of thixotropy. For various mixes, the slope of the line in the SRE- trest plane can be used
to compare the thixotropic potential of different mixes.
Conceptually, the protocol described above can be easily applied to thixotropic materials
that do not experiences changes due to additional chemical or physical processes (ex. ketchup,
crude oil, grease). But, in the case of cement and concrete, there are other mechanisms
influencing material behavior. In particular, cementitious materials also undergo a hydration
reaction, which makes the amount of structural rebuilding also a function of the age of the
specimen. Therefore, an amendment in the original protocol was made in light of the following
observations:
1) The achievement of a τeq in a specimen became gradually more difficult as more energy (and
hence time) was required to rupture bonds. As a result, the usage of the equilibrium loop
described in Section 4.3.2 was not effective. A screening would have to be conducted for every
trest of each specimen in order to determine the time needed to achieve τeq. This makes it difficult
to use the same protocol for all the specimens because the time needed to establish each new τeq
may vary significantly among specimens.

CHAPTER 4: Development of a Rheological Protocol to Measure Structural Rebuilding
1052) It is practically impossible to separate the effect of aging and trest. In other words, can the
rate of rebuilding be different if the same resting time is used at different ages of the specimen?
With the above protocol, the effects of thixotropy and structural rebuilding associated
with hydration are coupled. Furthermore, the maximum resting time investigated was only 16
minutes, but the age of the specimen was already 71 minutes (and that is only if the time needed
to reach τeq for each trest was 8 minutes). Since it is important to conduct the test within the
induction period, it is obvious that the amount of data that can be obtained using this approach is
limited.
4.4 Final protocol Based on the results of the preliminary tests, the final procedure used to evaluate thixotropy is
described below:
1) Immediately after mixing and the paste flow test, the sample was poured in the rheometer.
Rheological testing was initiated when the age of the specimen was 12 minutes (counted from
the introduction of water) by using the equilibrium loop protocol as specified in Section 4.3.3.
2) The specimen was allowed to rest in the rheometer for 10 minutes, and then a hysteresis loop
was performed. The protocol for the hysteresis loop was as follows: during a 30 second time
interval, the shear rate was ramped up from 0 s-1 to 300 s-1; then, the shear rate was ramped down
from 300s-1 to 0s-1 over a 30 second interval. This procedure was repeated 8 more times (rest for
10 minutes, hysteresis loop, rest for 10 minutes, hysteresis loop, etc.). Thus, the hysteresis loop
applied after the second rest period was conducted 20 minutes after the equilibrium loop;

CHAPTER 4: Development of a Rheological Protocol to Measure Structural Rebuilding
106similarly, the hysteresis loop applied after the ninth rest period was conducted 90 minutes
after the equilibrium loop. As expected, an increase in shear stress can be seen with trest (c.f.
Figure 4-8).
Shear Rate (s-1)
0 100 200 300 400 500 600 700
Shea
r St
ress
(Pa
)
0
20
40
60
80
100
120
140
160
180
200
Hysteresis loop at trest = 10 min
Hysteresis loop at trest = 50 min
Hysteresis loop at trest = 90 min
Equilibrium line
Figure 4-8. Hysteresis loops for each trest (with select trest emphasized at 10 minutes, 50
minutes, and 90 minutes).
3) The area within 100 s-1 and 200 s-1 of the up curve of each hysteretic loop and the initial
equilibrium line (in the plane of shear stress versus shear rate) was calculated and used as the
SRE. Figure 4-9 shows the SRE for a specimen with a corresponding trest of 90 minutes. The

CHAPTER 4: Development of a Rheological Protocol to Measure Structural Rebuilding
107shear rate interval of 100 – 200 s-1 was chosen in order to reduce errors caused by the initial
elastic response of the sample.
Shear Rate (s-1)
0 100 200 300 400 500 600 700
Shea
r St
ress
(Pa
)
0
20
40
60
80
100
120
140
160
180
200
Hysteresis loop at trest = 10 min
Hysteresis loop at trest = 50 min
Hysteresis loop at trest = 90 min
Equilibrium line
SRE
Figure 4-9. Area between up curve of hysteresis loop and equilibrium line is used as a
measure of the rate of rebuilding and denoted as SRE (Specific Rebuilding Energy). The
figure shows SRE for trest = 90 minutes.

CHAPTER 4: Development of a Rheological Protocol to Measure Structural Rebuilding
1084) SRE versus trest is plotted and the slope of the line in this plane describes the rate of
rebuilding. This slope is used as a measure of the rate of rebuilding and provides a way to
compare different mixtures. In Figure 4-10, material 1 has a faster rate of rebuilding than
materials 2, 3, and 4 because its slope is the steepest.
trest (min)
0 20 40 60 80 100
SRE
(J/s
*m3 )
0
2000
4000
6000
8000
10000Material 1 Material 2 Material 3 Material 4
Figure 4-10. Application of protocol to compare rate of structural rebuilding of different
mixtures. Slope of line indicates degree of rebuilding.
The approach described above gives an indication of the initial degree of structural
rebuilding and the way it varied with time. In order to assess the total amount of rebuilding that

CHAPTER 4: Development of a Rheological Protocol to Measure Structural Rebuilding
109occurred in a specimen hysteresis loops would have to be repeated again and again until the
up curve and down curve completely overlap. The addition of area between each hysteresis loop
would represent the total amount of energy needed to bring the structure to its minimum degree
of organization. However, this would require a new specimen for each trest and an extensive
amount of time.
4.4.1 Effect of Fluidity Initial studies showed that the rate of structural rebuilding was strongly related to the initial
fluidity of the specimen [94]. When the initial slump flow of the sample was increased, the rate
of rebuilding decreased. In order to better understand how structural rebuilding is influenced by
different mixture ingredients, comparisons among specimens were only made for mixes that had
the same initial fluidity level (as determined by the sfd with the slump flow test). The target
fluidity level can be obtained by two methods: varying the superplasticizer dosage or varying the
water-to-cement ratio. It was determined that the adoption of a lower w/c ratio with a greater
dosage of superplasticizer was more effective in increasing structural rebuilding thixotropy than
using a higher w/c ratio and a lower superplasticizer dosage [94]. Increasing the water content
increases the thickness of the water layer around the particles. Therefore, the inter-particle
distance increases and particle flocculation is reduced because the inter-particle coagulation
forces decrease.
4.4.2 Effect of Shear History An important aspect that should be considered is the effect of the previous hysteresis loops and
the SRE. In other words, it is important to know if the hysteresis loop conducted after the second

CHAPTER 4: Development of a Rheological Protocol to Measure Structural Rebuilding
110resting period will significantly affect the hysteresis loop that is conducted after the third
resting period and so on. The effect of shear history will depend on the amount of time required
by the cement paste to recover its structure (i.e. rebuild its bonds) after the cessation of shear. If
the cement paste is subjected to a hysteresis loop before it fully recovers from the previous
hysteresis loops, then the area between the up curve of the hysteresis loop and the equilibrium
line will be smaller. In addition, the shear stress values will be lower.
Figure 4-11 shows the results from experiments that were conducted in order to
investigate the effect of shear history. In order to do this, experiments were performed using a
new sample for each trest. In these tests, the equilibrium loop was performed as usual, and then
the sample was allowed to rest for the required amount of time (ex. 10 minutes, 20 minutes, etc.)
without any agitation until the hysteresis loop was performed. As shown in the figure, during the
early stages of the testing, there was little variation between the results of the tests in which a
new sample was used for each trest versus the one in which the same sample was used for each
trest. However, at later ages, the results from the test using the same sample at each may deviate
from the results in which a new sample was used for each test. This indicates that the rate of
rebuilding may be underestimated due to the effects of shear history. In effect, the protocol is
also giving some indication of the sensitivity of the structural network to shear and accounting
for the influence of disturbances on the rate of rebuilding (which may actually be more
representative of the process that concrete would experience in the field).

CHAPTER 4: Development of a Rheological Protocol to Measure Structural Rebuilding
111
trest (min)
0 10 20 30 40 50
SRE
(J/s
*m3 )
1000
1500
2000
2500
3000
3500
4000
Same Specimen for each trestNew Specimen for each trest
Figure 4-11. Effect of shear history on structural rebuilding measurements (w/c = 0.35, SP
dosage = 0.2%, initial slump flow = 280 mm)
4.4.3 Sensitivity and Repeatability Tests were conducted using various mix compositions and initial slump flow conditions in order
to evaluate the reliability of the protocol. As shown in Figure 4-12, good repeatability exists
among the experiments. The developed protocol was also sensitive enough to detect changes in
structural rebuilding due to the changes in the fluidity level and mix proportions. The fluidity
level was evaluated using the slump flow diameter (sfd) obtained from the paste flow tests.
Three target fluidity levels were evaluated:
• low fluidity: sfd = 165 mm (6.50 in.)
• mid fluidity: sfd = 240 mm (9.45 in.)

CHAPTER 4: Development of a Rheological Protocol to Measure Structural Rebuilding
112• high fluidity: sfd = 330 mm (13.0 in.)
All mixtures were within ± 7 mm (0.28 in.) of the target fluidity level.
trest (min)
0 20 40 60 80 100
SRE
(J/s
*m3 )
0
2000
4000
6000
8000
10000
w/c=0.35, low sfdw/c=0.35, low sfd_repeatw/b=0.45, SF=5%, med sfdw/b=0.45, SF=5%, med sfd_repeatw/b=0.45, FA=15%, high sfdw/b=0.45, FA=15%, sfd high_repeat
Figure 4-12. Sensitivity and repeatability for final protocol (SF=silica fume, FA=15)
4.5 Chapter Summary
The feasibility of using small amplitude oscillatory shear rheology as an evaluation technique to
monitor the rate of structural rebuilding in high fluidity cement pastes was examined. A critical
shear strain of approximately 1 x10⁻⁴ was measured in a cement paste with an initial slump flow
diameter of 240 mm, but when the initial slump flow diameter was increased to 330 mm the

CHAPTER 4: Development of a Rheological Protocol to Measure Structural Rebuilding
113critical shear strain was below the limits of detection for the rheometer used in this study.
Due to the highly fluidized nature of SCC it was difficult to establish the linear viscoelastic
range, which is needed in order to accurately determine the moduli. Shear rheology can provide
an alternative to measuring structural rebuilding, and a shear rheological protocol based on
hysteresis loops and rebuilding energy was proposed to evaluate the rebuilding of cementitious
materials. The protocol was shown to be effective in evaluating the rate of structural buildup.
The rheological protocol developed in this chapter will be used throughout this research program
to evaluate and compare the rate of structural rebuilding of various SCC cement paste mixtures.

114
PART IV: Impact of Mixture
Proportioning on Structural Rebuilding

Chapter 5: Screening Studies - Influence of cement composition
115
5 Chapter 5: Screening Studies - Influence of cement composition
5.1 Introduction
The key objective in this phase of the research was to determine if structural rebuilding is
influenced by the type of cement used. The rheological protocol presented in Chapter 4 was
used to assess the rate of structural rebuilding.
5.2 Materials Seven different cements were selected for this study. The chemical composition of these
cements is given in Table 5-1. The chemical composition provided in Table 5-1 was based on
mill analyses received from the cement manufacturer, and items denoted with * indicate that the
value was calculated using Bogue Equation. The cements have a wide compositional range,
varying from C3A contents of 2 to 11% and equivalent alkali content ranging from 0.45 to 1 (%).
Cements 2, 3, 5, 6, and 7 are manufactured as an ASTM Type I cement, and cements 1 and 4 are
manufactured as an ASTM Type V. Each cement was tested with two different polycarboxylate
superplasticizers (c.f. Table 5-2). The w/c ratio was held constant at 0.35, and the
superplasticizer dosage was adjusted so that the initial slump flow diameter of each mix was 330
mm (13 in.) ± 13 mm (0.5 in.).

Chapter 5: Screening Studies - Influence of cement composition
116Table 5-1. Chemical analysis, fineness, and initial set time for cements in screening
studies
Cement
Oxide Analysis 1 2 3 4 5 6 7 CaO (%) 63.2 63.0 61.9 63.9 62.0 63.7 64.2 SiO2 (%) 22.0 19.6 18.9 21.6 18.7 20.4 19.8 Al2O3 (%) 3.4 4.9 5.7 3.8 5.7 4.1 4.7 Fe2O3 (%) 4.3 2.5 2.6 3.5 2.5 2.4 2.7 SO3 (%) 2.1 3.0 4.4 2.3 4.3 2.3 2.6
MgO (%) 3.4 3.4 2.3 2.7 2.4 3.9 2.6 Equivalent Alkali (%) 0.45 0.7 1 0.52 0.85 0.26 0.52 Free lime (f-CaO) (%) 0.6 1.4 ---- ---- ---- 1.3 0.6
LOI (%) 0.7 2.2 1.8 1.1 1.9 1.5 2.3
Blaine specific surface (m2/kg) 373 394 368 ---- 388 365 382
Compound
C3S (%) 55 55 54 59 56 67 59 C2S (%) 21 15 16* 18 11 14* 8* C3A (%) 2 9 11 4 11 7 8
C4AF (%) 13 8 8* 11 8 7* 8*
Initial Set 274 125 120 ---- 120 101 274
Table 5-2. Polycarboxylate-based superplasticizers used during screening studies
Superplasticizer Active Solids Content (%) Specific Gravity Application
SP1 25 - 50 1.04 Ready-mix
SP2 --- 1.05 Precast

Chapter 5: Screening Studies - Influence of cement composition
1175.3 Results
Figure 5-1 shows the rate of rebuilding curves for paste mixtures made with SP1. It can be seen
that the structural rebuilding rate is significantly influenced by the cement. Faster rates of
structural rebuilding were seen in paste mixtures made with cement 4, 6, and 7. Slower rates of
rebuilding were seen in the paste mixtures made with cement 2, 1, 3, and 5. With the exception
of cement 1, the C3A contents varied from 9 to 11% in the mixtures displaying the slower rates
of rebuilding. Figure 5-2 shows the rate of rebuilding curves for paste mixtures made with SP2.
Similar to SP1 results, faster rates of structural rebuilding were exhibited in the pastes prepared
with cements that had lower C3A and alkali contents.
trest (min)
10 20 30 40 50 60 70 80 90
SRE
(J/s
*m3 )
0
2000
4000
6000
8000
10000
12000
14000
cement 4cement 6cement 7cement 2 cement 1cement 3cement 5
Figure 5-1. Rate of rebuilding for paste mixtures made with superplasticizer 1

Chapter 5: Screening Studies - Influence of cement composition
118
trest (min)
10 20 30 40 50 60 70 80 90
SRE
(J/s
*m3 )
0
1000
2000
3000
4000
5000
6000
7000
cement 6cement 4 cement 1cement 2cement 3cement 7cement 5
Figure 5-2. Rate of rebuilding for mixtures made with superplasticizer 2
5.4 Discussion
Based on the literature, it was believed that structural build up would occur faster in the cements
that contained higher contents of C3A and alkalis. This is due to the fact that early stiffening of
Portland cement paste occurs predominantly from the hydration of C3A [95, 96]. In addition, the
alkalis from potassium and sodium are quickly dissolved into the pore solution, which tends to
increase the attractive forces among the cement particles. However, as shown in Figure 5-1 and
Figure 5-2, the opposite trend was seen. A correlation between the C3A content and the rate of
rebuilding appears to exist. With the exception of cement 1, the rate of structural rebuilding
increased as the C3A content decreased (c.f. Figure 5-3). In Figure 5-4, the equivalent alkali

Chapter 5: Screening Studies - Influence of cement composition
119content is plotted with respect to the rate of rebuilding, and the rate of rebuilding decreases
from left to right (i.e. mix 4 had the fastest rate of rebuilding, and mix 5 had the slowest rate of
rebuilding). Even if cement 1 is ignored, a positive correlation between the total equivalent
alkali and structural rate of rebuilding could not be established. In terms of structural build-up, it
is often cited that it is the soluble alkali content, and not necessarily the total alkali content, that
is of importance [16, 97-99].
Cement
4 6 7 2 1 3 5
C 3A
(%)
0
2
4
6
8
10
12
Figure 5-3. Rate of rebuilding versus C3A content (for pastes made with SP1)
Decreasing rate of rebuilding

Chapter 5: Screening Studies - Influence of cement composition
120
Cement
4 6 7 2 1 3 5
Equi
vale
nt A
lkal
i (%
)
0.0
0.2
0.4
0.6
0.8
1.0
1.2
Figure 5-4. Rate of rebuilding versus equivalent alkali content (for pastes made with SP1)
Table 5-3 provides information about the superplasticizer demand required to achieve the
target slump flow diameter. It is likely that there is a greater propensity for particle aggregation
in cements pastes with the high C3A and alkali contents, and, as seen in Figure 5-5 and Figure
5-6, higher superplasticizer dosages were required as the C3A and alkali content increased. It is
known that setting time of cements can be delayed when superplasticizer dosage is increased.
This is due to the higher amount of superplasticizer molecules that are present to disperse the
cement particles; this prevents the particles from aggregating and retards the development of the
3-dimensional network required set. The results indicate that the same effect occurred with
regards to structural rebuilding.
Decreasing rate of rebuilding

Chapter 5: Screening Studies - Influence of cement composition
121
Table 5-3. Superplasticizer dosage required to achieve initial slump flow of 330 mm
Cement C3A (%)
Equivalent alkali (%)
SP1 dosage (% by mass of cementitious
materials)
SP2 dosage (% by mass of cementitious
materials)
1 2 0.45 0.20 0.32
2 9 0.7 0.30 0.43
3 11 1 0.75 0.65
4 4 0.52 0.23 0.45
5 11 0.85 0.75 0.83
6 7 0.26 0.14 0.28
7 8 0.52 0.25 0.47
0
0.1
0.2
0.3
0.4
0.5
0.6
0.7
0.8
2 4 7 8 9 11 11
C 3 A content (%)
S P
d o
s a
g e
(%
bin
der)
Figure 5-5. Relationship between superplasticizer dosage and C3A contents for cement
pastes evaluated during screening study. Superplasticizer dosage was varied such that all
mixtures had same initial slump flow diameter.

Chapter 5: Screening Studies - Influence of cement composition
122With regard to cement 1, the slower rate of rebuilding may be due to many reasons,
including, but not limited to, the superplasticizer adsorption, dispersing effect of the
superplasticizer, soluble alkali content, hydration kinetics and hydrates formed, and particle
morphology. Taking into account that the setting time of cement 1 is approximately twice that of
the other cements, it is likely that the mechanisms influencing setting and structural rebuilding
are interconnected, and the results indicate that mixtures which have longer setting times will
have slower rates of rebuilding.
0
0.1
0.2
0.3
0.4
0.5
0.6
0.7
0.8
0.26 0.45 0.52 0.52 0.7 0.85 1
Equivalent alkali (%)
S P
d o
s a
g e
(%
bin
der)
Figure 5-6. Relationship between superplasticizer dosage and equivalent alkali for cement
pastes evaluated during screening study. Superplasticizer dosage was varied such that all
mixtures had same initial slump flow diameter.

Chapter 5: Screening Studies - Influence of cement composition
123A comparison of the structural build-up between the two superplasticizers is shown in
Figure 5-7 through Figure 5-13. In each case, the rate of rebuilding was either the same or faster
when SP1 was used. Mixtures made with SP2 did not exhibit a faster rate of rebuilding in any of
the cases. These results can also be used to determine the sensitivity of the cements to different
superplasticizers. Cement 1 appears to be the most robust cement exhibiting the same rate of
stiffening regardless of the superplasticizer used.
trest (min)
0 10 20 30 40 50 60 70 80 90 100
SRE
(J/s
*m3 )
0
1000
2000
3000
4000
5000SP1 SP2
Figure 5-7. Structural rate of rebuilding for cement 1 with SP1 and SP2

Chapter 5: Screening Studies - Influence of cement composition
124
trest (min)
0 10 20 30 40 50 60 70 80 90 100
SRE
(J/s
*m3 )
0
1000
2000
3000
4000
5000
6000SP1 SP2
Figure 5-8. Structural rate of rebuilding for cement 2 with SP1 and SP2
trest (min)
0 10 20 30 40 50 60 70 80 90 100
SRE
(J/s
*m3 )
0
1000
2000
3000
4000SP1 SP2
Figure 5-9. Structural rate of rebuilding for cement 3 with SP1 and SP2

Chapter 5: Screening Studies - Influence of cement composition
125
trest (min)
0 10 20 30 40 50 60 70 80 90 100
SRE
(J/s
*m3 )
0
2000
4000
6000
8000
10000
12000
14000SP1 SP2
Figure 5-10. Structural rate of rebuilding for cement 4 with SP1 and SP2
trest (min)
0 10 20 30 40 50 60 70 80 90 100
SRE
(J/s
*m3 )
800
1000
1200
1400
1600
1800
2000
2200SP1 SP2
Figure 5-11. Structural rate of rebuilding for cement 5 with SP1 and SP2

Chapter 5: Screening Studies - Influence of cement composition
126
trest (min)
0 10 20 30 40 50 60 70 80 90 100
SRE
(J/s
*m3 )
0
2000
4000
6000
8000
10000SP1 SP2
Figure 5-12. Structural rate of rebuilding for cement 6 with SP1 and SP2
trest (min)
0 10 20 30 40 50 60 70 80 90 100
SRE
(J/s
*m3 )
0
1000
2000
3000
4000
5000
6000
7000
8000SP1 SP2
Figure 5-13. Structural rate of rebuilding for cement 7 with SP1 and SP2

Chapter 5: Screening Studies - Influence of cement composition
1275.5 Chapter Summary
The results showed that the rate of structural rebuilding can be influenced by the cement
composition. Since SP1 was found to perform better than SP2 vis-à-vis the rate of stiffening,
SP1 was selected for further studies. Cement 6 and Cement 5 were also selected for further
studies because they exhibited significantly different rates of structural build-up. The general
trend from the results indicates that slower rates of rebuilding occurred in cements with the
higher C3A and alkali contents. Cement 6 will be used to represent the cements with slow rates
of structural build-up while Cement 5 will be used to represent the cements with fast rates of
structural build-up.

Chapter 6: Detailed Studies - Influence of mix composition on structural rebuilding
128
6 Chapter 6: Detailed Studies - Influence of mix composition on structural rebuilding
6.1 Introduction Due to the complex relationships among the various mixture ingredients, information about the
interaction effects among the ingredients may also be significant in understanding the role of the
paste matrix in controlling structural rebuilding. To evaluate the role of these potential
interactions, a 25-1 factorial design experiment was developed. This chapter presents the results
from a comprehensive experimental program that included shear rheological studies, setting time
measurements, and elemental analysis studies to examine the role of mix composition on
structural rebuilding. Previous research showed that initial fluidity is a crucial factor affecting
the rate of rebuilding [94]. Thus, the initial fluidity level was held constant so that the influence
of the constituent ingredients could be highlighted.
6.2 Experimental Program
6.2.1 Materials
Sixteen cement paste mixtures were proportioned using Cement 5 or Cement 6 (c.f. Chapter 5).
The C3A and equivalent alkali content of Cement 5 was 11 and 0.8, respectively. The C3A and
equivalent alkali content of Cement 6 was 7 and 0.26, respectively. The maximum limit on
equivalent alkalis when cement is to be used in concrete with reactive aggregates is 0.6% [100].
The usual equivalent alkali content of Portland cements, however, ranges from 0.3 to 1.3% [14,

Chapter 6: Detailed Studies - Influence of mix composition on structural rebuilding
129101]. The C3A contents of normal Portland cements generally range from 5 – 10 % [96].
Cement 6 was selected to represent the cements in Chapter 5 that showed relatively fast rates of
structural rebuilding behavior. These cements generally contained lower C3A and alkali
contents. Cement 5 was selected to represent the cements in Chapter 5 that showed relatively
slow rates of structural rebuilding behavior. These cements generally contained higher C3A and
alkali contents. For the purpose of this study, Cement 6 will be referred to as the “low alkali/
C3A”, and Cement 5 will be referred to as the “high alkali/ C3A” cement.
A portion of the cement was systematically replaced with Class F fly ash and/or silica
fume. The fly ash and silica fume dosages were replaced on a mass basis. A polycarboxylate
superplasticizer with a specific gravity of 1.04 (represented as SP1 in Table 5-2) was used in all
mixtures. A liquid, water-soluble, cellulose-based VMA with a specific gravity of 1.002 and
solids content of 70% was employed in select mixtures. The properties of the cements, fly ash,
and silica fume are listed in Table 6-1 and Table 6-2. The particle size distributions of the
cements and fly ash are shown in Figure 6-1.
Size (microns)
5 105 10 20 50 100 150
Perc
ent
Fine
r (%
)
20
30
40
50
60
70
80
90
100Cement 5Cement 6Fly ash
Figure 6-1. Volume size particle size distribution of cements and fly ash (determined by
laser diffraction)

Chapter 6: Detailed Studies - Influence of mix composition on structural rebuilding
130
Table 6-1. Detailed properties for Cement 5 and Cement 6
Cement Oxide Analysis 5 6
CaO (%) 62.0 63.7 SiO2 (%) 18.7 20.4 Al2O3 (%) 5.7 4.1 Fe2O3 (%) 2.5 2.4 SO3 (%) 4.3 2.3
MgO (%) 2.4 3.9 Equivalent Alkali (%) 0.85 0.26
free lime (f-CaO) (%) 1.3
LOI (1000°C) (%) 1.94 1.5
Specific surface (m2/kg) 388 365
Compound
C3S (%) 56 67 C2S (%) 11 14* C3A (%) 11 7
C4AF (%) 8 7*
Initial Set 120 101 Fineness, 45 um (% pass) 91.6 93
Blaine specific surface (m2/kg) 388 365 3 day f'c (psi/MPa) 3440/ 23.7 3272/ 22.6
28 day f'c (psi/MPa) 5920/ 40.8 6729/ 46.4 Air content (mortar) (%) 8 6

Chapter 6: Detailed Studies - Influence of mix composition on structural rebuilding
131 Table 6-2. Properties for fly ash and silica fume
6.2.2 Mix Proportions A 25-1 factorial design was used to develop the mix proportions. Five factors—cement type, w/b
ratio, fly ash (FA) dosage, silica fume (SF) dosage, and VMA dosage—were tested at two levels
each. The high level and low level for each factor in un-coded units is given in Table 6-3. The
superplasticizer dosage was adjusted such that all mixtures had an initial mini-slump flow of 330
mm (13 in.) ± 7 mm (0.28 in.). The superplasticizer and VMA dosages were calculated based on
the mass of the aqueous solution with respect to the mass of the cementitious materials (cement +
fly ash + silica fume). When used, the dosage of VMA was set to 400 ml/100 kg of cementitious
materials.
Oxide Fly ash
Al2O3 (%) 17.86
CaO (%) 12.50
Fe2O3 (%) 7.49
K2O (%) 1.24
MgO (%) 3.72
Na2O (%) 0.17
P2O5 (%) 0.10
SiO2 (%) 54.35
SO3 (%) 0.53
TiO2 (%) 1.15
LOI (750°C) (%) 0.06
Oxide Silica Fume
SiO2 (%) 95.5
Al2O3 (%) 0.41
Fe2O2 (%) 0.28
CaO (%) 0.49
MgO (%) 0.24
LOI (%) 2.04
Oversize 45μm (%) 0.42
Specific gravity 2.07

Chapter 6: Detailed Studies - Influence of mix composition on structural rebuilding
1326.2.3 Methods Brief descriptions of the different experimental methods used in this phase of the project are
given below:
Vicat Needle Test: This test is used for normal consistency cement pastes and defines initial set
as the time between the initial contact of cement and water and the time in which the Vicat
needle penetrates into a depth of 25 mm or less into a cement paste sample [102]. The pressure
applied to the paste can be calculated from the diameter and weight of the Vicat apparatus. For
the standard Vicat apparatus this corresponds to a pressure of 3.7 MPa and force of 2.94 N.
Research conducted by Struble et al. [103] showed that the Vicat needle tests could be used to
determine the initial setting time of fluid pastes.
Inductively Coupled Plasma Spectroscopy (ICP): A Varian model ICP Spectrometer, which can
cover a spectral range from 175 – 785 nm was used in this study. ICP is an instrumental
elementary analysis technique for determining chemical composition. A sample is subjected to
very high temperatures generated by a plasma of argon. The elements within the sample are
excited and emit light. The elemental analysis of the sample is conducted by measuring the
intensity of the characteristic emitted light at predetermined wavelengths. Each element has its
own characteristic wavelength; thus, the intensity at a specified wavelength determines the
concentration of the element in the specimen.

Chapter 6: Detailed Studies - Influence of mix composition on structural rebuilding
133Table 6-3. Mixture proportions for evaluated paste mixtures (un-coded factorial design
units)
Mix Alkali/C3A Cement Type W/B FA (% binder)
SF (% binder) VMA
1 Low (Cement 6) 0.3 20 0 included
2 High (Cement 5) 0.3 20 0 0
3 Low (Cement 6) 0.4 20 0 0
4 High (Cement 5) 0.4 20 0 included
5 Low (Cement 6) 0.3 30 0 0
6 High (Cement 5) 0.3 30 0 included
7 Low (Cement 6) 0.4 30 0 included
8 High (Cement 5) 0.4 30 0 0
9 Low (Cement 6) 0.3 30 8 0
10 High (Cement 5) 0.3 20 8 included
11 Low (Cement 6) 0.4 20 8 included
12 High (Cement 5) 0.4 20 8 0
13 Low (Cement 6) 0.3 30 8 included
14 High (Cement 5) 0.3 30 8 0
15 Low (Cement 6) 0.4 30 8 0
16 High (Cement 5) 0.4 30 8 included

Chapter 6: Detailed Studies - Influence of mix composition on structural rebuilding
134Rheology: A HAAKE Rheostress150 rheometer with a concentric cylinder geometry
conforming to the German DIN 53019 sensor system was used. The radius of the outer cylinder
(Ro), radius of the inner cylinder (Ri), and the length of the inner cylinder (L) are 10.85 mm,
10.00 mm, and 30.00 mm, respectively.
6.2.4 Sample Preparation A Hobart N-50 mixer was used to mix all samples. Prior to mixing, a portion of the water was
used to dilute the superplasticizer. In addition, another portion of the water was set aside to rinse
the cylinder containing the diluted superplasticizer. The remaining water (total water minus
rinse water and water used for dilution) was added to the powder materials and mixed for 3
minutes at a low speed (136 rpm). Then the mixer was turned off and within one minute the
sides of the bowl was scraped with a spatula and the superplasticizer was added. Then, the paste
was mixed for 15 seconds at low speed. Finally, the paste was mixed for an additional 2 minutes
and 45 seconds at a higher speed (281 rpm). The total mixing time for the cement paste was 7
minutes. Paste flow tests were conducted 1 minute after the sample preparation was completed
(hence, 8 minutes after the introduction of water) using a glass plate and a mini-slump cone. The
dimensions of the cone were 70 mm (2.76 in), 100 mm (3.94 in.), and 50 mm (1.97 in.), for the
upper inner diameter, lower inner diameter, and height. After preparing the paste, approximately
10 ml of paste was placed into the rheometer for rheological testing. Rheological tests
commenced twelve minutes after the introduction of water. The rheological protocol was
described in detail in Chapter 4.
The samples for the setting time experiments and ICP experiments were each batched
separately. For the setting time tests, after preparing the paste, a portion of it was immediately
Chapter 6: Detailed Studies - Influence of mix composition on structural rebuilding
135poured into the Vicat needle apparatus mold, covered with plastic, and left to rest. The first
needle penetration test was conducted 30 minutes after the resting time followed by needle
penetration tests every 10 minutes until a penetration of 25 mm or less was obtained. For the ICP
tests, the cement paste samples were prepared using deionized (DI) water. After mixing, the
paste was transferred into a nitrogen filled glove box. The pore solutions were extracted by
vacuum filtering through a Buckner funnel (with 0.3 μm filter paper). Samples with VMA were
centrifuged first, and then the supernatant was filtered through the Buckner funnel. All solutions
were diluted with a nitric acid aqueous solution by a factor of 1:150 and then filtered through a
0.2 μm syringe filter. The pH was measured prior to any dilution in order to determine the
concentration of the hydroxide ions.
6.3 Results
6.3.1 How to analyze factorial analysis
The results were analyzed using a statistical software program (Minitab 14, distributed by
Minitab Inc.). A normal probability plot was used to assess the effect of each factor. All effects
are assumed to be normally distributed with zero mean and the same variance. Effects that
follow this pattern will fall along a straight line and are considered negligible, whereas
significant effects will not lie along the straight line [104]. A Pareto bar chart was used in
conjunction with the normal probability plot in order to insure that all significant effects would
be considered. A Pareto bar chart plots the effects in descending order, and any effect above a
critical horizontal line is considered significant.

Chapter 6: Detailed Studies - Influence of mix composition on structural rebuilding
1366.3.2 Rheology Figure 6-2 shows the rate of rebuilding for the 16 paste mixtures. As stated in Section 4.4, the
slope of the curves is normally used as a measure of rebuilding, but this analysis method can not
be used for mixtures that exhibit nonlinear behavior.
Figure 6-2. SRE vs. trest for mixes in detailed studies
The data was transformed according to the formula shown below so that all mixtures
could be compared:
ΔSRE = SREfinal – SREinitial

Chapter 6: Detailed Studies - Influence of mix composition on structural rebuilding
137where SREinitial corresponds to the SRE value at trest equals 10 min and SREfinal corresponds to
the SRE value at trest equals 90 minutes. Higher ΔSRE values correspond to mixtures with a
faster rate of structural rebuilding. The equation above can be normalized so that the rate of
structural rebuilding at different times can be evaluated. In this case the equation would be
ΔSREnorm = (SRE2 – SRE1)/ (trest2 - trest1)
where the values 2,1 corresponds to different trest values and trest2 > trest1. ΔSRE values are given
in Table 6-4. The maximum ΔSRE was obtained by mix 9, whereas the minimum ΔSRE was
obtained by mix 2. The average ΔSRE for all the mixtures was 1767 J/m3*s.
Table 6-4. Rate of rebuilding determined using rheological protocol
Mix Alkali/C3A Cement Type
ΔSRE (J/s* m3)
1 low 2633 2 high 210 3 low 1630 4 high 304 5 low 1680 6 high 765 7 low 2128 8 high 297 9 low 5777 10 high 1112 11 low 2929 12 high 645 13 low 3882 14 high 1251 15 low 2030 16 high 1005

Chapter 6: Detailed Studies - Influence of mix composition on structural rebuilding
138The main effects of each factor on ΔSRE are plotted in Figure 6-3. The slope of the
line indicates the strength of the response (i.e. steeper slope indicates that the factor is more
significant). All plots are shown in coded units. Thus -1 corresponds to the low level and 1
corresponds to the high level of each factor listed in Table 6-3. For example, -1 for the w/b
corresponds to mixtures having a w/b ratio of 0.3, whereas 1 corresponds to a w/b ratio of 0.4.
Similarly, -1 for VMA corresponds to mixtures that did not include VMA, and +1 for VMA
corresponds to mixtures that included VMA.
Mea
n o
f R
ebu
ildin
g
1-1
3000
2500
2000
1500
1000
1-1 1-1
1-1
3000
2500
2000
1500
1000
1-1
Cement type w/b FA dose
SF dose VMA
Figure 6-3. Main effect plots for structural rebuilding (-1 and 1 indicate low and high level
for each factor; see Table 6-3 for the value for each factor)

Chapter 6: Detailed Studies - Influence of mix composition on structural rebuilding
139The average effect of cement type and w/b ratio was negative, which means that the
rate of rebuilding decreased when either one of these factors was increased. The main effect of
increasing the silica fume dosage was positive, and on average the rate of rebuilding increased
when silica fume was used as a cement replacement.
Nominal changes in the rate of structural rebuilding were seen when the fly ash dosage
was increased or VMA was added to the mixtures. Thus, when only these main effects are
considered, the rate of rebuilding is maximized when silica fume is set at the high level, w/b ratio
is set at the low level, and cement type is set at the low level. The trends for the main effects
generally hold true (i.e. decrease in rate of rebuilding when the cement with the higher
alkali/C3A content was used regardless of the w/b ratio). However, in certain cases interactions
among the factors will influence the response. These interactions provide further insight into the
structural rebuilding behavior.
Figure 6-4 shows the interaction plots for all the factors plotted in Figure 6-3. All plots
are shown in coded units. Thus -1 corresponds to the low level and 1 corresponds to the high
level of each factor listed in Table 6-3. For example, -1 for the w/b corresponds to mixtures
having a w/b ratio of 0.3, whereas 1 corresponds to a w/b ratio of 0.4. Similarly, -1 for VMA
corresponds to mixtures that did not include VMA, and +1 for VMA corresponds to mixtures
that included VMA. The slope of the line indicates the strength of the response (i.e. steeper
slope indicates that the factor is more significant). In addition, information about the degree of
interaction among the factors can be obtained by comparing the slopes of the two lines in a given
plot. Higher degrees of interactions are seen in plots in which the slopes of the two lines are
significantly different.

Chapter 6: Detailed Studies - Influence of mix composition on structural rebuilding
140
Cement type
FA dose
SF dose
VMA
w/b
1-1 1-1 1-1 1-1
4000
2000
04000
2000
04000
2000
04000
2000
0
-11
typeCement
-11
w/b
-11
doseFA
-11
doseSF
Figure 6-4. Interaction plots for structural rebuilding (-1 and 1 indicate low and high level
for each factor; see Table 6-3 for the value for each factor)
It can be seen that the interaction between w/b ratio and silica fume resulted in a larger
increase in the rate of rebuilding when silica fume was added to the lower w/b mixtures than
when silica fume was incorporated in the higher w/b mixtures. Similarly, a larger increase in the
rate of rebuilding was seen when silica fume was incorporated in the lower alkali/C3A mixtures
compared to when the higher alkali/C3A cement was used. Different behaviors were seen in the
rate of rebuilding when the fly ash dosage was increased in the high alkali/C3A mixtures

Chapter 6: Detailed Studies - Influence of mix composition on structural rebuilding
141compared to the low alkali/C3A mixtures. Specifically, a small increase in the rate of
rebuilding occurred when a higher dosage of fly ash was used with the higher alkali/C3A cement,
whereas the opposite trend was seen when the lower alkali/C3A cement was used.
Analysis of the normal probability plot of effects (c.f. Figure 6-5) provides insight into
which factors were most significant in influencing the rate of rebuilding. According to the
normal probability plot, main effect A had a substantial influence on ΔSRE. The next effect that
is furthest away from the straight line is the interaction effect AC. Analysis of the Pareto plot
shows that if interaction effect AC is considered significant, then main effects D and B and
interaction effect BD must also be considered. VMA did not significantly alter the rate of
rebuilding.
Effect
Per
cent
150010005000-500-1000-1500-2000-2500
99
95
90
80
70
60
50
40
30
20
10
5
1
A Cement typeB w/bC FA doseD SF doseE VMA
Factor Name
DE
CE
CD
BE
BD
BC
AE
AD
AC
AB
E
D
C
B
A
Figure 6-5. Normal probability plot of effects for structural rebuilding

Chapter 6: Detailed Studies - Influence of mix composition on structural rebuilding
142
Term
Effect
AE
E
BC
C
BE
CD
DE
CE
AD
AB
AC
BD
B
D
A
2000150010005000
A Cement typeB w/bC FA doseD SF doseE VMA
Factor Name
Figure 6-6. Pareto plot for structural rebuilding
Considering only the main effects, the regression model is
ΔSRE = 1767 - 1069 cement type - 396 w/b - 138 FA dose + 561 SF dose + 77 VMA
R2 = 0.79
Equation 6-1
where 1767 is the average response and the coded variables (cement type, w/b, FA dose, SF
dose, and VMA) take on values -1 or +1. The model can be improved by taken into
consideration the BD and AC interaction effects. This yield
ΔSRE = 1767 - 1069 cement type - 396 w/b - 138 FA dose + 561 SF dose - 280 w/c*SF + 269
cement*FA dose
R2 = 0.86
Equation 6-2
Insignificant effects

Chapter 6: Detailed Studies - Influence of mix composition on structural rebuilding
143Due to the principle of hierarchy [105], the insignificant term (FA dose) remains in
the model as a main effect because it is included in an interaction effect. Using the regression
model given in Equation 6-2, and taking into account the information gained from interaction
plots, the fastest rate of rebuilding appears to be obtained when the factors are set at the
following levels:
Cement: -1
w/b: -1
Silica fume: +1
Fly ash: - 1
VMA: arbitrary, but set at +1 due to the interaction effects that shows ΔSRE is maximized at
this level when silica fume dosage is set to +1 and fly ash dosage is set to -1
This corresponds to using the low alkali/C3A cement at a w/b ratio of 0.30 with 8% silica
fume and 20% fly ash. With the higher alkali/C3A cement (Cement 5), the optimal levels to
achieve the fastest rate of rebuilding are w/b of 0.30 with a silica fume dosage of 8% and a fly
ash dosage of 30%.
6.3.3 Vicat Needle Tests
The Vicat needle test was used to determine the initial setting time, which is typically considered
an indirect reflection of the physical state of the hydrating material. High fluidity pastes were
used so that the results are more representative of the pastes used in SCC. Figure 6-7 shows
results obtained from monitoring the time evolution of the Vicat needle penetration. The
penetration resistance of the sample was relatively constant, and then after a critical point (which

Chapter 6: Detailed Studies - Influence of mix composition on structural rebuilding
144in the figure is approximately 9 hours), an abrupt transition occurred in which the depth of
penetration rapidly decreased towards zero. This constant behavior prior to the transition was
seen in all mixtures, although the critical time in which the abrupt transition occurred was
different for the various mixtures.
Figure 6-7. Evolution of Vicat needle penetration (representative mixture)
Figure 6-8 shows a chart of the initial setting time in order of increasing setting time. In
general the mixtures made with the low alkali/C3A cement displayed the shortest initial setting
time. Further understanding can be elicited from the analysis of the factorial design.

Chapter 6: Detailed Studies - Influence of mix composition on structural rebuilding
145
Figure 6-8. Initial Setting Times
The main effect plots are shown in Figure 6-9. In general, increasing the alkali/C3A
content, w/b ratio, fly ash dosage, and VMA dosage resulted in an increase in the initial setting
time. Incorporating silica fume into the mixtures resulted in a decrease in the initial setting time.

Chapter 6: Detailed Studies - Influence of mix composition on structural rebuilding
146
Mea
n of
Ini
tial
Set
(m
in)
1-1
500
475
450
425
400
1-1 1-1
1-1
500
475
450
425
400
1-1
Cement type w/b FA dose
SF dose VMA
Figure 6-9. Main effect plots for initial set
The normal probability plot of the effects is shown in Figure 6-10. The significant effects
that emerge from this analysis were the main effect A (cement type), main effect D (silica fume),
and the AB (cement type*w/b), AC (cement type*fly ash), and AD (cement type*silica fume)
interactions. The effect of cement was positive; whereas the effect of silica fume was negative
(i.e. increasing alkali and C3A content increases setting time while increasing silica fume dosage
decreases setting time). Thus, if we considered only these main effects and ignored any
interactions among the factors, in order to reduce the setting time a low alkali/C3A cement and
high silica fume dosage should be used. However, it is necessary to examine any interactions
that are important since main effects by themselves do not have much meaning when they are

Chapter 6: Detailed Studies - Influence of mix composition on structural rebuilding
147involved in significant interactions. Figure 6-11 shows the Pareto plot for the main effects
and interaction effects. A horizontal line was drawn to separate the significant effects of A, D,
AB, AC, and AD from the non-significant effects. However, it is seen that main effects B (w/b)
and E (VMA), as well as interaction effects DE (silica fume*VMA) and BD (w/b*silica fume),
must also be included since they fall above the horizontal line. Thus, all main factors except fly
ash were significant.
Effect
Per
cent
1251007550250-25-50
99
95
80
50
20
5
1
A Cement typeB w/bC FA doseD SF doseE VMA
Factor Name
DE
CE
CDBE
BD
BC
AE
AD
ACAB
E
D
C
B
A
Figure 6-10. Normal probability plot of effects for initial setting time

Chapter 6: Detailed Studies - Influence of mix composition on structural rebuilding
148
Term
Effect
CEC
AEBECDBCABE
BDACADDEBDA
120100806040200
A Cement typeB w/bC FA doseD SF doseE VMA
Factor Name
Figure 6-11. Pareto plot of effects for initial setting time
The AB, AC, and AD interactions are plotted in Figure 6-12, Figure 6-13, and Figure
6-14, respectively. Note from the AB interaction, that the influence of w/b was very small when
the high alkali/C3A cement was used and very large when the low alkali/C3A cement was used.
The AC interaction indicates that increasing the fly ash dosage resulted in a large increase in the
initial setting time when the low alkali/C3A cement was used. The reverse trend is seen when the
fly ash dosage was increased when using the high alkali/C3A cement. The AD interaction shows
that a large negative effect (i.e. decrease in setting time) occurred when silica fume was used
with the high alkali/C3A cement.
Insignificant effects

Chapter 6: Detailed Studies - Influence of mix composition on structural rebuilding
149
w/b
Mea
n
1-1
525
500
475
450
425
400
375
350
-11
typeCement
Figure 6-12. Interaction plot of cement type and w/b ratio for initial set (AB interaction)

Chapter 6: Detailed Studies - Influence of mix composition on structural rebuilding
150
FA dose
Mea
n
1-1
525
500
475
450
425
400
375
350
-11
typeCement
Figure 6-13. Interaction plot of cement type and fly ash dosage for initial set (AC
interaction)

Chapter 6: Detailed Studies - Influence of mix composition on structural rebuilding
151
SF dose
Mea
n
1-1
560
540
520
500
480
460
440
420
400
-11
typeCement
Figure 6-14. Interaction plot of cement type and silica fume dosage for initial set (AD
interaction)
6.3.4 ICP Tests The pore solutions were extracted at two distinct time intervals: immediately after mixing (t=0
min) and 120 minutes after the conclusion of mixing (t=120 min). The elemental concentration
of aluminum (Al), calcium (Ca), iron (Fe), potassium (K), magnesium (Mg), sodium (Na), sulfur
(S), and silicon (Si) were measured by ICP and the hydroxide (OH-) ion concentration was
determined by measuring the pH. The total concentration of sulfur was determined independent
of its redox state. In Portland cement pastes, S is present in the oxidized form as sulfate [106].
Square brackets (with letter(s) inside) will be used to represent the concentration of an element
or ion.

Chapter 6: Detailed Studies - Influence of mix composition on structural rebuilding
152A rapid dissolution of ionic species into the aqueous solution occurred immediately
after the cements were placed in contact with water. The alkali concentrations included alkalis
released into the pore fluids from the hydrating cement and those released by fly ash and/or silica
fume. No distinction was made between the amount of alkali contributed from the cement, fly
ash, or silica fume.
Table 6-5 provides information about the pore solution chemistry of the samples 120
minutes after mixing. As expected, the concentrations of Al, Fe, Mg, and Si were lower than the
Ca, K, Na, and S contents. This is due to the quick dissolution of the soluble alkali compounds,
which deposit potassium, sodium, and sulfate ions into the pore solution. Calcium and additional
sulfate ions are deposited into the pore solution from C3S, C2S, and calcium sulfate [107, 108].
All elemental concentrations measured in this study, except for silicon, were in accord with
previously published results [97, 106, 108-112]. The silicon concentration was about 1 order of
magnitude greater than those reported in the literature. (This may be due to errors in the
equipment as the author was informed that the spectrometer was serviced a couple of months
after these experiments were conducted). The pH ranged from 12.44 to 13.01, and mixtures
made with Cement 5 (high alkali/C3A) generally exhibited a higher pH than paste mixtures made
with Cement 6 (low alkali/C3A).

153 Table 6-5. Pore solution analysis measured 120 minutes after mixing (where 1 was determined using the pH meter, 2 was
determined using the charge balance)
Mix [Al] (mM)
[Ca] (mM)
[Fe] (mM)
[K] (mM)
[Mg] (mM)
[Na] (mM)
[S] (mM)
[Si] (mM)
[OH-](1) (mM) PH (1) CB
(%) [OH-] (2) (mM)
PH (2)
1 0.62 31.55 0.08 40.67 0.61 17.41 20.87 2.28 36.31 12.56 36 79.44 12.902 3.93 26.23 0.95 262.38 6.13 91.95 150.82 4.44 117.49 13.07 -3 105.14 13.023 0.84 31.42 0.11 20.52 0.75 7.71 12.13 2.96 31.62 12.5 39 66.81 12.824 2.86 21.42 0.50 271.87 2.57 74.10 139.68 3.41 107.15 13.03 1 109.46 13.045 0.73 25.88 0.12 29.28 0.57 13.54 12.68 1.74 34.67 12.54 37 69.21 12.846 1.56 18.16 0.42 279.23 3.22 88.18 152.59 2.86 114.82 13.06 -4 98.56 12.997 1.15 35.34 0.50 23.22 0.58 10.83 14.17 3.14 30.90 12.49 43 76.39 12.888 5.57 55.98 1.42 238.02 2.98 66.82 128.71 9.88 75.86 12.88 3 102.73 13.019 0.13 27.07 0.00 44.32 0.23 20.04 22.29 1.54 29.51 12.47 37 73.92 12.87
10 7.19 41.64 0.00 296.95 6.99 104.68 182.60 11.56 107.15 13.03 3 119.73 13.0811 0.20 28.10 0.00 29.69 0.23 12.34 14.97 0.76 43.65 12.64 25 68.29 12.8312 0.01 0.14 0.00 2.00 0.01 0.58 1.08 1.68 100.00 13 1 102.69 13.0113 0.01 0.30 0.00 0.34 0.01 0.17 0.18 3.82 37.15 12.57 45 111.41 13.0514 0.01 0.14 0.00 2.22 0.01 0.72 1.18 4.31 100.00 13 6 129.05 13.1115 0.41 31.25 0.00 30.47 0.28 14.62 16.32 1.08 26.30 12.42 45 74.93 12.8716 0.69 14.36 0.03 221.34 0.73 63.74 125.68 1.99 81.28 12.91 -6 62.44 12.80

Chapter 6: Detailed Studies - Influence of mix composition on structural rebuilding
154The charge balance error provides an indication of the quality of the results. Despite
the fact that the extractions and analyses of the pore solutions were conducting in a random
order, higher errors were obtained for the mixtures made with Cement 5 (c.f. Table 6-5). Charge
balance errors are typical due to the inaccuracies in ICP measurements from spectral
interferences and contamination, and, although much effort was taken to prevent contamination,
it is impossible to eliminate all contaminates. Charge balance errors may also occur from
carbonation (which would reduce the pH) and inaccuracies in determination of the hydroxyl ion
concentration. The pH measurement is an activity measurement, and the hydroxyl concentration
was calculated from the pH measurement with the assumption that the activity and concentration
of the hydrogen ions was the same. In actuality, it is impossible to calculate the concentration of
the hydrogen ion directly with an ion-selective electrode unless activity is known [113].
Furthermore, since other ions exist in the pore solution, it is highly likely that the activity
coefficient is not equal to unity, and, thus, the actual hydrogen ion concentration in the solution
and the hydrogen activity derived from the pH meter [97, 113] are not equal. If this is the case,
hydroxyl ion concentration, as estimated from the pH measurement, would also be inaccurate.
The aqueous phase of cement pastes is characterized with high ionic strengths (greater than
0.1M). Table 6-6 provides an estimate of the ionic strength (Ic) of the pore solutions using the
measured concentrations reported in Table 6-5. (In order to actually determine the ionic
strength, speciation should be conducted to determine the concentration of each ion. However,
since this requires sophisticated thermodynamic modeling and knowledge of stability constants
and activity coefficients, which in themselves are not agreed upon within the cement community,
the elemental concentrations (as measured by ICP) were used to approximate the ionic strength.)
In general, when the ionic strength increases, the activity coefficient decreases [113]. This

Chapter 6: Detailed Studies - Influence of mix composition on structural rebuilding
155would lead to an under-prediction in the hydrogen ion and hydroxyl ion concentration (see
equation below) and higher charge balance errors:
aH=γ[H]
where aH is the hydrogen ion activity and γ = activity coefficient. Theoretical hydroxyl ion
concentrations and pH values using the elemental concentrations from the ICP test were shown
in Table 6-5. For mixtures made with Cement 6 (odd number mixtures), the hydroxyl ion
concentration calculated from the pH meter was substantially lower than those calculated from
the ICP elemental concentrations.
Table 6-6. Ionic strength
Mix Ic (M) 1 0.17 2 0.66 3 0.15 4 0.60 5 0.13 6 0.62 7 0.17 8 0.68 9 0.16 10 0.84 11 0.14 12 0.63 13 0.24 14 0.72 15 0.14 16 0.48
As mentioned earlier, the experiments were randomized, and if the charge balance errors
were only attributed to under prediction in the hydroxyl ion concentration then one would expect
that these errors would be evenly distributed across all the test results. However, this was not the

Chapter 6: Detailed Studies - Influence of mix composition on structural rebuilding
156case. A surplus of cations were measured in the mixtures made with Cement 6 (lower
alkali/C3A), which suggests the presence of unaccounted anions in the pore solution. Although a
significant amount of research has been devoted to understanding the chemistry of the aqueous
phase of Portland cement pastes (and concretes), charge balance checks are often not reported
due to researchers selecting to calculate the hydroxyl ion concentration from the charge balance
of elemental concentrations instead of measuring the pH or lack of sufficient data (i.e. not
measuring all the major ions). Charge balance errors at early hydration times have ranged from
1 – 26% [106, 111, 112, 114].
In general, little change was seen between the measurements conducted immediately after
mixing (not shown) and those conducted after 120 minutes. This suggests that some type of
equilibrium condition was established, or the rates of dissolution of the cement phases and the
precipitation of cement hydration products were equal [96].
Based on the experimental program used in this study, changes in the mix proportioning
did not significantly change the [Si], [Fe], and [Ca]. Figure 6-15 to Figure 6-23 show the normal
probability plots for all the measured species. Significant increases in [Al], [K], [Mg], [Na], [S],
and [OH-] occurred when Cement 5 (higher C3A/alkali) was used instead of Cement 6 (lower
C3A/alkali). Low total alkali contents (as determined by the chemical composition) are usually
associated with low soluble alkali concentrations and low ionic strengths; however, high total
alkali content does not always imply high soluble alkali content and high ionic strengths. Alkalis
in cements are present as alkali sulfates or trapped in the calcium aluminates and calcium silicate
phases (incorporation into the aluminate and silicate phases occurs when there is not a sufficient
amount of S03) [99, 101]. The alkalis inside the aluminate and silicate phases are often
considered as the insoluble portion of the total alkali content, whereas the solubility of alkali

Chapter 6: Detailed Studies - Influence of mix composition on structural rebuilding
157sulfates are very high and are released rapidly into the pore solution upon the contact of
cement with water. Studies [97, 99] have shown that the rate of dissolution of the alkalis are
influence by the type and quantity of the sulfate, and that clinkers containing relatively large
amounts of SO3 have larger fractions of alkali sulfates [99, 115]. The high concentration of [Na]
and [K] in the pore solutions of pastes made with Cement 5 indicates that the majority of the
total alkalis were present as alkali sulfate. In order to maintain the mass balance of the solution,
higher [OH-] and [S] were released in mixtures made with Cement 5 to compensate for the
cations released from the dissolution of the alkali sulfates. Furthermore, changes in the w/b ratio
and silica fume dosage also influenced the pore solution chemistry. In particular, the main effect
of increasing the w/b ratio reduced [Mg], [Na], and [S]. Incorporation of silica fume yielded an
increase in the [Na]. Cement replacement with silica fume increased [Al] when the w/b ratio
was 0.30, but the opposite trend was seen when silica fume was added in mixes with a w/b ratio
of 0.40 (c.f. Figure 6-24).
Effect
Per
cen
t
210-1-2
99
95
90
80706050403020
10
5
1
A Cement typeB w/bC FA doseD SF doseE VMA
Factor Name
DE
CECD
BE
BD
BC
AE
AD
AC
AB
E
D
C
B
A
Figure 6-15. Normal probability plot for [Al]

Chapter 6: Detailed Studies - Influence of mix composition on structural rebuilding
158
Effect
Per
cent
1050-5-10
99
95
90
80706050403020
10
5
1
A Cement typeB w/bC FA doseD SF doseE VMA
Factor Name
DE
CE
CD
BE
BD
BC
AE
ADAC
AB
ED
C
B
A
Figure 6-16. Normal probability plot for [Ca]
Effect
Per
cent
0.50.40.30.20.10.0-0.1-0.2-0.3-0.4
99
95
90
80706050403020
10
5
1
A Cement typeB w/bC FA doseD SF doseE VMA
Factor Name
DE
CECD
BE
BD
BC
AEAD
AC
AB
E
DC
B
A
Figure 6-17. Normal probability plot for [Fe]

Chapter 6: Detailed Studies - Influence of mix composition on structural rebuilding
159
Effect
Per
cent
250200150100500
99
95
90
80706050403020
10
5
1
A Cement typeB w/bC FA doseD SF doseE VMA
Factor Name
DE
CE
CDBE
BDBC
AE
AD
AC
AB
E
D
C
B
A
Figure 6-18. Normal probability plot for [K]
Effect
Per
cent
3210-1-2
99
95
90
80706050403020
10
5
1
A Cement typeB w/bC FA doseD SF doseE VMA
Factor Name
DE
CE
CDBE
BD
BC
AE
AD
ACAB
E
D
C
B
A
Figure 6-19. Normal probability plot for [Mg]

Chapter 6: Detailed Studies - Influence of mix composition on structural rebuilding
160
Effect
Per
cent
706050403020100-10-20
99
95
90
80706050403020
10
5
1
A Cement typeB w/bC FA doseD SF doseE VMA
Factor NameDE
CE
CD
BE
BDBC
AE
AD
ACAB
E
D
C
B
A
Figure 6-20. Normal probability plot for [Na]
Effect
Per
cent
150100500
99
95
90
80706050403020
10
5
1
A Cement typeB w/bC FA doseD SF doseE VMA
Factor NameDE
CECD
BEBDBC
AE
AD
AC
AB
E
D
C
B
A
Figure 6-21. Normal probability plot for [S]

Chapter 6: Detailed Studies - Influence of mix composition on structural rebuilding
161
Effect
Per
cent
1050-5-10
99
95
90
80
70
60
50
40
30
20
10
5
1
A Cement typeB w/bC FA doseD SF doseE VMA
Factor Name
DE
CECD
BE
BD
BC
AEAD
ACAB
E
DC
B
A
Figure 6-22. Normal probability plot for [Si]
Effect
Per
cent
706050403020100-10-20
99
95
90
80706050403020
10
5
1
A Cement typeB w/bC FA doseD SF doseE VMA
Factor Name
DE
CECD
BEBD
BC
AE
ADAC
AB
E
D
C
B
A
Figure 6-23. Normal probability plot for [OH-]

Chapter 6: Detailed Studies - Influence of mix composition on structural rebuilding
162
SF dose
Mea
n
1-1
3.0
2.5
2.0
1.5
1.0
0.5
-11
w/b
Figure 6-24. Effect of silica fume dosage and w/b ratio on Aluminum concentration (in
coded units)
6.4 Discussion In this section, the structural rebuilding of SCC cement paste suspensions will be linked to
changes in mixture proportioning.
6.4.1 Understanding the correlation between paste matrix and structural
rebuilding

Chapter 6: Detailed Studies - Influence of mix composition on structural rebuilding
1636.4.1.1 Cement composition The experimental results clearly show that the most significant factor influencing structural
rebuilding within fresh cement pastes is the cement composition when the initial fluidity level is
kept constant. All mixtures made with Cement 5 (higher C3A/alkali) had significantly lower
rates of rebuilding (an order of magnitude difference) than mixtures made with Cement 6 (lower
C3A/alkali). This is attributed in part to the different cement-superplasticizer interactions. As
illustrated in Figure 6-25, mixtures made with Cement 5 (represented by even numbers in Figure
6-25) are shown to increase the superplasticizer demand compared to those made with Cement 6
(represented by odd numbers).
Figure 6-26, Figure 6-27, and Figure 6-28 show a comparison between the SP dosage and
the sodium, sulfur, and potassium concentrations, respectively. It is postulated that this increase
in superplasticizer dosage is necessary to counteract the increased cohesiveness of the pastes due
to the reduction in repulsive forces. The double-layer thickness of ions surrounding a particle
depends markedly on the ionic strength of the pore fluid, and, as the ionic strength increases, the
thickness of the double-layer thickness rapidly decreases, which allows particles to come in
closer contact.
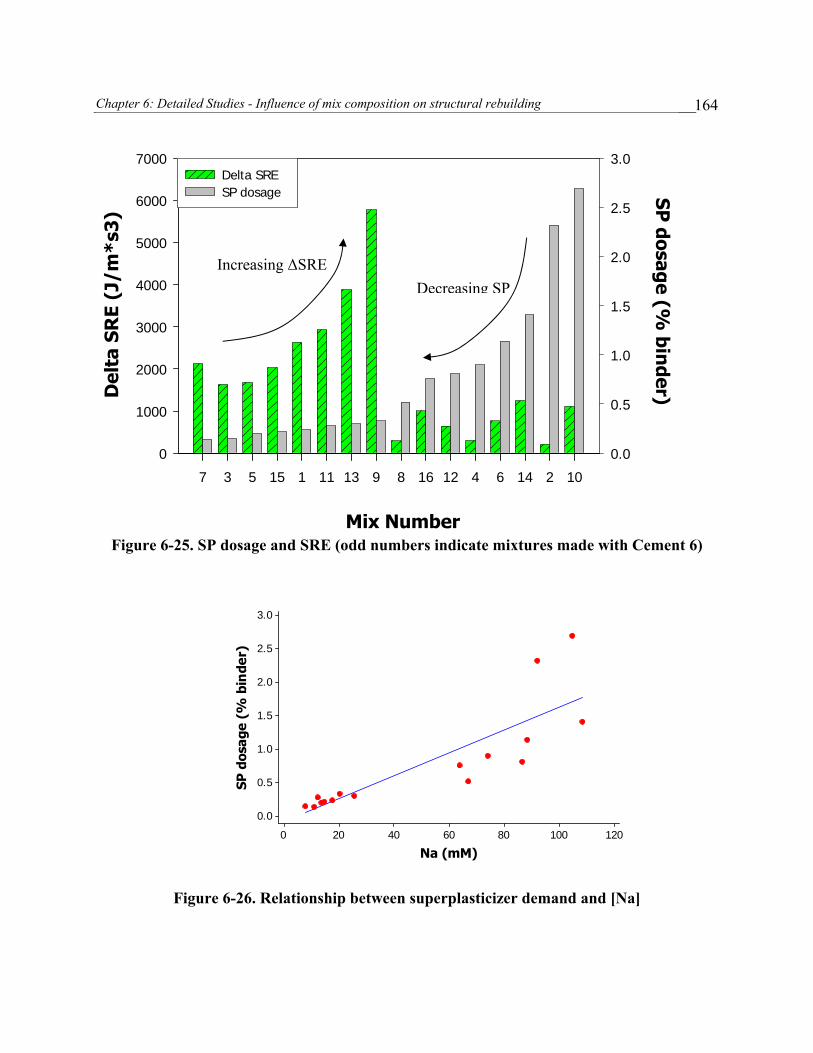
Chapter 6: Detailed Studies - Influence of mix composition on structural rebuilding
164
Mix Number
7 3 5 15 1 11 13 9 8 16 12 4 6 14 2 10
Del
ta S
RE
(J/m
*s3
)
0
1000
2000
3000
4000
5000
6000
7000SP
dosage (% bin
der)
0.0
0.5
1.0
1.5
2.0
2.5
3.0Delta SRE SP dosage
Figure 6-25. SP dosage and SRE (odd numbers indicate mixtures made with Cement 6)
Na (mM)
SP d
osag
e (%
bin
der)
120100806040200
3.0
2.5
2.0
1.5
1.0
0.5
0.0
Figure 6-26. Relationship between superplasticizer demand and [Na]
Decreasing SPIncreasing ΔSRE

Chapter 6: Detailed Studies - Influence of mix composition on structural rebuilding
165
S (mM)
SP d
osag
e (%
bin
der)
180160140120100806040200
3.0
2.5
2.0
1.5
1.0
0.5
0.0
Figure 6-27. Relationship between superplasticizer demand and [S]
K (mM)
SP d
osag
e (%
bin
der)
350300250200150100500
3.0
2.5
2.0
1.5
1.0
0.5
0.0
Figure 6-28. Relationship between superplasticizer demand and [K]
Increasing the concentration of soluble sulfates tends to decrease the fluidity due to a
reduction in the adsorption of PC polymers on the cement particles and hydrated phases [116].

Chapter 6: Detailed Studies - Influence of mix composition on structural rebuilding
166In addition, Kato et al. (as reported in [116] indicated that in the presence of excess soluble
sulfates the length of the polyethylene oxide (PEO) side chains contained in the admixture
shrink, thereby decreasing the steric repulsion force. PC superplasticizers are preferentially
adsorbed onto the aluminate phases (particularly C3A) [15, 117], and, thus, an increase in C3A
content is likely to produce an increase in the superplasticizer demand. However, the formation
of ettringite also involves the C3A phases, and, thus, competitive adsorption between the sulfate
ions and anionic PC molecules exists. Additional factors such as the particle size distribution,
composition and structure of the tricalcium aluminate phase, type calcium sulfate, alkali sulfate
composition, and hydration precipitates will also influence adsorption [15, 16, 96, 98, 118].
It is proposed that the vast differences in structural rebuilding behavior between the two
cements used in this study are based on the following mechanisms:
Anhydrous compounds of cement react with water. Rapid dissolution of alkali sulfates in
combination with a release of Ca+2 and OH- ions increases the attractive forces resulting
in a more cohesive paste.
Superplasticizer is introduced to the system. Superplasticizer preferentially adsorbs onto
C3A and ettringite resulting in higher superplasticizer demand in Cement 6 due to the
higher C3A content. Due to high concentration of sulfate ions in the pore solution,
adsorption decreases causing the need for a higher superplasticizer dosage to achieve the
target initial slump flow.
Due to poorer and weaker adsorption, more “free” PC superplasticizer exists in the
aqueous solution of pastes made with Cement 6. This results in a reservoir of
superplasticizer molecules available to adsorb onto newly formed hydrates, which should
result in better slump flow retention due to a more dispersed particle network.

Chapter 6: Detailed Studies - Influence of mix composition on structural rebuilding
1676.4.1.2 Mineral Admixtures
Addition of silica fume was the second most significant factor influencing the rate of structural
rebuilding. This is most likely due to the high fineness of the silica fume particles. As
mentioned in Chapter 3, the strength of the force of attraction from the London dispersion forces
is related to the size of the particle. Due to the high surface area of the silica fume particles, the
London dispersion forces are likely to be more significant, and the silica fume particles will be
more prone to aggregate. This would reduce the fluidity, and, as seen in Figure 6-29,
superplasticizer demand increased when silica fume was added. In addition, since the cement
substitution was conducted on a mass basis, the total solid volume content increased by
approximately 2% when silica fume was used. (This is due to the differences in specific
gravities among the cement, fly ash, and silica fume.) Although it is not possible to accurately
determine how many more particles are in the paste, the increase in solid volume content may
contribute to increasing the rate of structural rebuilding since the distance between flocs is
reduced. However, it is likely that this effect is small since a faster rate of rebuilding was not
seen in the fly ash mixtures. Rather the increase in structural rebuilding is probably more
associated with the small size of the silica fume particles.

Chapter 6: Detailed Studies - Influence of mix composition on structural rebuilding
168
SF dose
Mea
n o
f SP
dos
e
1-1
0.86
0.84
0.82
0.80
0.78
0.76
0.74
0.72
0.70
Figure 6-29. Main effect of silica fume on structural rebuilding
With regard to fly ash, a modest increase in the rate of rebuilding occurred when the fly
ash dosage was increased in pastes made with Cement 5 (c.f. Figure 6-4). In mixtures made with
Cement 6, an increase was seen in the rate of rebuilding. The particle size distributions of the
cements were very similar, which should lead to similar packing densities and, thus, similar
behaviors if the rate of stiffening is only due to particle packing. It was shown in Chapter 6.3.4
that increasing the fly ash content resulted in a reduction in sodium concentration, potassium
concentration pH, and ionic strength when Cement 5 (high alkali / C3A) was used. When
Cement 6 (low alkali/ C3A) was used, increasing the fly ash content decreased the pH and
increased the ionic strength. Assuming the validity of the ICP test results, then the increase in
the rate of rebuilding in the low alkali cements is related to an increase in the ionic strength of
the pore solution.

Chapter 6: Detailed Studies - Influence of mix composition on structural rebuilding
1696.4.1.3 Water-to-Binder Ratio and VMA
As expected, an increase in w/b ratio resulted in a decrease in the rate of structural rebuilding.
The solid volume concentration was reduced by approximately 13% when the w/b was changed
from 0.3 to 0.4. Thus, there is more water to coat the particles and the interparticle forces of
attraction are lessened.
Surprisingly, VMA was not a significant factor influencing the rate of rebuilding.
Limited research has been conducted on VMA and structural rebuilding. Assaad and Khayat
[119] evaluated the relationship between type and content of VMA on the structural rebuilding
and formwork pressure of SCC. The cement composition, w/b ratio, and aggregate content were
held constant. They observed that formwork pressure can be reduced when VMA is used at a
low concentration. The authors also noted that using a cellulose-based VMA along with a PC-
based superplasticizer increased the magnitude of the maximum pressure and decreased the rate
of pressure drop when the VMA was used at low and medium dosage rates. This was attributed
to an increase in fluidity retention from an increase in SP dosage. Furthermore, the authors noted
that mixtures containing a cellulose-based VMA and a PC-based superplasticizer developed the
highest degree of structural build-up, but at later ages the structural build-up decreased. Again,
this was attributed to the increase in superplasticizer demand. Figure 6-30 shows a normal
probability for the superplasticizer demand. The superplasticizer demand was most influenced
by the cement type, w/b ratio, fly ash content, and interactions between the cement and fly ash.
The presence of VMA resulted in a modest increase on superplasticizer demand (VMA is to right
of zero) and, thus, does not fully account for the behavior seen in the VMA pastes. VMA will be
discussed in more detail in Chapter 8.

Chapter 6: Detailed Studies - Influence of mix composition on structural rebuilding
170
Effect
Per
cen
t
1.251.000.750.500.250.00-0.25-0.50
99
95
90
80706050403020
10
5
1
A Cement typeB w/bC FA doseD SF doseE VMA
Factor Name
DE
CE
CDBE
BD
BC
AEAD
AC
AB
ED
C
B
A
Figure 6-30. Factors influencing superplasticizer demand
6.4.2 Correlation between Structural Rebuilding and Initial Setting Time
The initial setting time signifies the physical state transition at which the consistency of fresh
cement paste goes from an easily deformable paste to a non-moldable paste. Although initial set
is based on an arbitrary measurement, the stiffening that occurs prior to initial set is controlled by
chemical and physical processes from the hydration of cement compounds, and, hence, initial set
is typically used for quality control to ensure that the cement does not abnormally set or to test
for the response of a particular cement and admixture. As shown in Figure 6-7, the Vicat needle
test is not sensitive enough to detect the gradual and progressive changes that are occurring
within the microstructure. However, it is interesting to note that even though the time scale of
the structural rebuilding and initial setting time tests were different (90 minutes compared to 300
- 600 minutes, respectively), an inverse relationship exists between the initial setting time and

Chapter 6: Detailed Studies - Influence of mix composition on structural rebuilding
171rate of structural rebuilding (c.f. Figure 6-31). In general, mixtures exhibiting longer initial
setting times had slower rates of rebuilding. As the superplasticizer demand increased, the
setting time was delayed. This demonstrates that the cement-superplasticizer interactions also
affect the physical processes controlling the development of the 3 dimensional network required
for setting.
Initial Set (min)
Reb
uild
ing
600550500450400350300
6000
5000
4000
3000
2000
1000
0
Figure 6-31. Relationship between rate of rebuilding and initial setting time
6.5 Chapter Summary The objective of this chapter was to determine the relative importance of the different constituent
ingredients on the structural rate of rebuilding. A comprehensive experimental program was
carried out to determine the role of cement type, fly ash content, silica fume content, and w/b
Δ SRE (J/s*m3)

Chapter 6: Detailed Studies - Influence of mix composition on structural rebuilding
172ratio. Based on the foregoing data presented in this chapter, the following conclusions can be
made:
Structural rebuilding is influenced by the mixture proportioning of the matrix phase. The
rate of structural rebuilding was most strongly impacted by the cement chemistry,
followed by silica fume incorporation, and changes in the w/b ratio. This is attributed to
the significant impact that all three of these factors have on the interparticle interaction of
the cement particles.
The time-dependent structural build-up can not always be characterized using a linear
function.
Regardless of changes in the mixture proportioning, mixtures proportioned with the
cement with the high alkali/C3A content always had slower rates of rebuilding than the
mixtures proportioned with the lower alkali/C3A content. This highlights the importance
of proper cement selection. The difference in the structural rebuilding is attributed to the
significant differences in the pore solution chemistry, particularly the soluble alkalis and
sulfate contents.
A positive correlation was seen between the superplasticizer dosage and soluble alkalis
and sulfates. This indicates that superplasticizer demand increased in order to counteract
the reduction in the repulsive forces. Paste mixtures prepared with the lower alkali/C3A
cement necessitated lower superplasticizer demand than the higher alkali/C3A cement.
The results indicate that the structural rate of rebuilding is related to the interactions
between the cement and superplasticizer.
For a given fluidity condition and cement content, it was seen that the rate of structural
rebuilding was more influenced by incorporation of silica fume versus changes in the w/b

Chapter 6: Detailed Studies - Influence of mix composition on structural rebuilding
173ratio. Incorporation of silica fume increased the rate of rebuilding, and more
pronounced effects were obtained when silica fume was added to mixtures with a lower
w/b versus a higher w/b ratio. This is attributed to an increase in particle-particle
interaction due to the reduction of interparticle spacing and enhanced flocculation from
the silica fume particles.
Changes in the fly ash content resulted in slight changes in the rate of rebuilding. The fly
ash used in this study was coarser than Cement 5 and Cement 6. This is likely to
decrease the packing density and interparticle spacing among the solid particles. No
significant changes in the rate of rebuilding were seen with VMA addition.
The time of initial set was found to be related to the overall rate of rebuilding. The rate
of structural rebuilding decreased as the setting time increased. This indicates that the
mechanisms governing the structural build-up and the mechanisms governing the
development of the structural network required for initial set are closely linked.

174
PART V: Relationship among Structural
Rebuilding, Formwork Pressure, and
Aggregation Mechanisms

Chapter 7: Formwork Pressure of SCC and Influence of Structural Rebuilding
175
7 Chapter 7: Formwork Pressure of SCC and Influence of Structural Rebuilding
7.1 Introduction
As stated in Chapter 3, one of the key issues for designing formwork is determining the
horizontal pressure exerted by the concrete during casting. This chapter presents a simple
laboratory apparatus to simulate formwork pressure. The apparatus was used to monitor the
formwork pressure behavior of three concrete mixtures. In Chapter 6, it was determined that the
most significant factors influencing the rate of structural rebuilding were the type of cement and
the incorporation of silica fume. The main intent of this Chapter is to determine to what extent
the formwork pressure behavior of SCC can be changed through altering the mix composition.
The results from this section of the work can aid in developing formwork pressure models that
can better account for the influence of structural rebuilding.
7.1.1 Formwork Pressure Simulation Overview
7.1.1.1 Concept In the field of soil mechanics, the triaxial shear test is a popular method for determining shear
strength parameters. In this test, a specimen of soil encased in a rubber membrane is placed
inside of a cylindrical chamber. The chamber is filled with a fluid, and then the specimen is
subjected to a confining fluid pressure by applying an axial load to compress the fluid in the
chamber [120]. Experience shows that the horizontal pressure exerted by the specimen is lower,

Chapter 7: Formwork Pressure of SCC and Influence of Structural Rebuilding
176and decreases much faster, when the water is allowed to flow away from the pressurized
volume (drained condition). In contrast, the values of the horizontal pressure are higher, and less
prone to decrease, when an undrained condition is held during application of the axial load. The
absence of water drainage and the immobility of the fluid phase (cement paste) are reasonable
hypotheses for real casting of SCC into formworks. Hence, the same conditions have been
maintained during the experiments reported in this paper, and special care was taken to avoid
loss of fluid during the pressurization of the fresh concrete.
Simulation of the vertical loads generated by the concrete was performed using a
cylinder-piston system (c.f. Figure 7-1) to pressurize cementitious materials. A laboratory
mechanical testing system (MTS) was used to impose and control the axial load, and this force
was transferred to the concrete via the piston. The simulation of the filling of a real formwork
can be carried out by increasing the magnitude of the vertical load applied by the MTS to the
piston. Different casting rates can be easily simulated by changing the rate at which the vertical
load is applied. This device can be used to reproduce the real in situ casting conditions and,
according to the structural needs, to better control the main variables involved in the selection of
the best SCC mix and the placement procedure.
The height of any real column, H, can be simulated through the relationship:
HAN γ=
where A = cross sectional area of the piston
γ = specific weight of the material inside cylinder
N = vertical load applied by MTS

Chapter 7: Formwork Pressure of SCC and Influence of Structural Rebuilding
177The applied vertical stress (hydrostatic stress) is calculated by dividing the vertical load
applied by the cross-sectional area of the piston.
Figure 7-1. Schematic of formwork pressure system
The resulting lateral pressure depends on the vertical pressure applied. In the field of soil
mechanics, there are three categories of lateral pressure, and each depends on the movement
experienced by the vertical wall on which the pressure is acting. The at-rest lateral pressure
occurs when the wall does not move laterally. The active lateral pressure develops when the
wall moves away from the soil, whereas the passive lateral pressure occurs when the wall moves
into the soil. In the field, formworks for concrete are designed to remain stationary and are
constrained against lateral movement. In the case of the formwork simulation test, the walls of
the cylinders do not move, and, thus, the lateral pressure developed is similar to the at-rest lateral
pressure (for simplicity it will be referred to as lateral pressure). The horizontal stress acting in a
concrete
formwork
Pressure sensor
HAN γ=
< 1m
H Cylindrical container (formwork)
Piston

Chapter 7: Formwork Pressure of SCC and Influence of Structural Rebuilding
178soil at a specific point can be determined by multiplying the vertical stress at that point by the
ratio.
The ratio of the horizontal lateral stress (σh) to the vertical stress (σv) depends on lateral
pressure coefficient, K:
v
hKσσ
=
The value of K can range from 0 to 1 and is related to shear strength of the soil. The shear
strength of a soil is the internal resistance that the soil mass can offer to resist failure and sliding
[120]. According to Mohr-Coulomb failure criteria, the shear strength of soil at failure is
ϕστ tannf c +=
where τf is the shear strength, c is the cohesion, σn is the normal stress acting on the failure
plane, and φ is the internal angle of friction. Cohesion is the component of shear strength that is
independent of interparticle friction, and it is related to the forces that hold together the particles
within soil. Cohesion arises from electrostatic forces and adhesion from soil cementing
processes. The angle of internal friction is the component of shear strength that is independent
of cohesion, and it arises from the friction between grains [121]. Particle interlock also plays a
role in shear strength and is believed to contribute to the component of strength that arises from
the apparent cohesion [121]. In the formwork simulation test, K can be determined directly from
the ratio between the measured pressure recorded by pressure transducers and the vertical
pressure applied by mean of axial load. The K value will depend on the shear resistance of the
concrete, and this shear strength is a function of the frictional resistance and interlocking

Chapter 7: Formwork Pressure of SCC and Influence of Structural Rebuilding
179between the aggregate and cement powders [122], cohesion from the hydration process [5,
122], and cohesion due to thixotropic phenomena. If, and how much, K will change is
essentially the major concern regarding the formwork pressure of SCC. Initially, during the
casting of SCC the concrete behaves more fluid-like, and it may be assumed that K is equal to 1.
However, in order for there to be a reduction in the maximum formwork pressure value, at some
point during the casting, K must be less than 1 for the already placed concrete.
The role of friction at the interface between the formwork and concrete was recently
investigated [123]. It was suggested that the lateral pressure decay is due to increasing shear
stresses at the walls of the formwork. This increase in shear stress at the walls of the interface
was shown to be correlated to the time-dependent yield stress due to structural build-up and
formwork roughness. This suggests that formwork pressure will be higher when the frictional
effects between the concrete and formwork are reduced (i.e. as in the case of a smooth column or
formwork with oil) due to lower shear stresses at the wall. In other words, a rough wall would
carry a larger part of the vertical load than a smooth wall, and, therefore, the lateral stress is
higher than when a smoother wall is used (assuming all other parameters are equal). In the field,
it can be assumed that the frictional effects between the concrete and form are minimized since
form oil is used. The results from the aforementioned study also suggest that formwork pressure
may be reduced when taller or wider forms are used due to increased shear stresses (assuming
the material properties and casting rates are the same). Research by Assaad showed that the
initial formwork pressure was slightly reduced when wider columns were used (96% hydrostatic
pressure for the wider column compared with 99% hydrostatic pressure for the taller column);
however, the same study showed that higher initial lateral pressures were seen in shorter columns

Chapter 7: Formwork Pressure of SCC and Influence of Structural Rebuilding
180[5]. The influence of formwork geometry and interfacial friction between the form and
concrete is an area that requires further study.
7.1.1.2 Formwork Pressure Apparatus and Measurement A metal cylinder measuring 152 mm (6.0 inch) in the inner diameter, 300 mm (12.0 inch) in
height, and 5 mm (0.20 inch) in wall thickness was used as the formwork (Figure 7-2). The
cylinder consists of two symmetric halves held together by four screws and a circular steel plate
as the base (which was bolted onto the cylinder). For ease of cleaning, it was decided to design
the apparatus such that both sides of the cylinder and the bottom plate of the cylinder could be
removed. The piston portion of the apparatus was made of steel, and a hole was drilled through
the piston to serve as an air release valve. Duct tape was used to seal the gap where the
cylinder’s two ends were screwed together in order to prevent leakage from the system. Plumber
paste and o-rings were used to seal the gaps between the inner surface of the cylinder and the
perimeter of the piston and between the plate and the cylinder. Prior to each test, the inner
surface of the form was lightly coated with form oil. Once the concrete was poured into the
cylinder, the piston was lowered onto the surface of the fresh concrete. After ensuring that no
external air was trapped in the system, the air release valves were closed and the pressurization
began.
To record the horizontal pressures generated by the concrete during the pressurization,
the cylinder was instrumented with two diaphragm pressure cells positioned at mid-height
(Figure 7-2). Each pressure cell had a 400 kPa (58.0 psi) capacity and was calibrated prior to
use. Measurement of total and pore water pressures were carried out: the former by a sensor
directly touching the concrete surface (Figure 7-3), and the latter by means of a sensor in a

Chapter 7: Formwork Pressure of SCC and Influence of Structural Rebuilding
181chamber hydraulically connected to the concrete volume inside the formwork (Figure 7-4).
An automatic acquisition system with scanning voltage of 4 V was used.
Figure 7-2. Instrumented Apparatus
Figure 7-3. Measurement of the total pressure: the sensor touches the concrete

Chapter 7: Formwork Pressure of SCC and Influence of Structural Rebuilding
182
Figure 7-4. Measurement of the pore water pressure: the hydraulic connection
7.2 Experimental Program
7.2.1 Materials and Mixture proportions
Two cements, a class F fly ash, and silica fume were used. Cement replacement was conducted on a mass basis. The physical and chemical properties of the cements were given in Section Chapter 6.2. River sand and natural round coarse aggregate (nominal size 19 mm) were used, and the physical properties and particle size distributions of the sand and coarse aggregate are given in Table 7-1. A liquid water-soluble cellulose-based VMA with a specific gravity of 1.002 and
solids content of 70% was employed in all the mixtures. The superplasticizer was a carboxylated
polymer in aqueous solution (specific gravity = 1.04).

Chapter 7: Formwork Pressure of SCC and Influence of Structural Rebuilding
183
Table 7-1. Particle size distribution and physical properties of coarse and fine aggregates
The mix compositions of the concretes corresponding to a volume of 1000 m3 are
presented in Table 7-2. The volume percentage of paste was kept constant at 36% for all the
mixes. All mixtures were proportioned using a gravel-to-coarse aggregate ratio of 0.47 and w/b
ratio of 0.35. The water content was adjusted to account for aggregate absorption. The
superplasticizer dosage and VMA dosage were calculated based on the weight of the aqueous
solution relative to the weight of the binder materials. A constant VMA dosage of 400 ml/100
kg of binder was used in all of the mixtures. The superplasticizer content was adjusted until an
initial slump flow of 670 ± 12.5 mm (approximately 26.5 ± 0.5 inch). Paste mixtures
corresponding to the matrix phase of the concrete were also tested.
Screen Size (mm)
Coarse Aggregate% Passing
Screen Size (mm)
Fine Aggregate % Passing
19 100 9.5 99 12.5 74 4.75 88 9.5 46 2.36 68 5.66 23 1.18 46 4.75 19 0.6 30 2.36 10 0.3 16 1.18 10 0.15 4
0.075 2 0 0
Specific gravity 2.6 Specific
gravity 2.7
Absorption (%) 2.1 Absorption
(%) 2.3

Chapter 7: Formwork Pressure of SCC and Influence of Structural Rebuilding
184
Table 7-2. Composition of SCC mixtures
Mix Cement Type Cement (kg)
Fly ash (kg)
Silica Fume (kg)
Water (kg)
Gravel (kg)
Sand (kg)
VMA (kg)
SP (kg)
Cem6 Cement 6 417 104 0 182 792 893 2.09 1.93Cem6SF Cement 6 369 103 41 180 792 893 2.06 3.57
Cem5 Cement 5 417 104 0 182 792 893 2.09 6.2
7.2.2 Sample Fabrication and Testing Program
7.2.2.1 Concrete Fabrication
The concrete mixtures were prepared using a drum mixer with a rotation speed of 25 – 27 rpm.
The mixes were prepared by mixing the coarse and fine aggregates for 1 minute, after which
one-third of the water was added, and mixing continued for an additional minute. Then the
cement, mineral admixtures, superplasticizer, and additional one-third of the water were added.
After 3 minutes of mixing, VMA and the remaining portion of water were added and mixing
progressed for another 3 minutes. The total preparation time for the concrete sample was 10
minutes. The concrete temperature was recorded after mixing followed by the (inverted) slump
test (ASTM C1611 [10]) and visual stability test. The visual stability test is a subjective test that
is used to determine the dynamic stability of slump flow patty [124]. In addition to the T50 time,
the time at which the concrete reached the final slump flow diameter, Tf, was recorded. Recent
studies indicate that time to final spread is better correlated to the viscosity than T50 time [125].
After measuring the slump flow, the concrete was remixed for 30 seconds prior to conducting the
formwork pressure tests.

Chapter 7: Formwork Pressure of SCC and Influence of Structural Rebuilding
1857.2.2.2 Concrete Formwork Pressure Simulation Procedure The elapsed time between the end of mixing and the beginning of the formwork pressure
simulation test was approximately 10 – 15 minutes. The casting height selected for the
simulations was 10 m (33 ft), and the casting rate was fixed at a rate of 7 m/hr (23 ft/hr). For an
average concrete density of 2400 kg/m3 (150 lb/ft3) and the dimensions of the formwork
pressure simulation apparatus, this requires the final load of approximately 4.2 kN (944 lbf) to be
reached in about 1.5 hours. The load was maintained until the time of pressure cancellation.
During the simulations, the values of the horizontal pressure exerted by the tested material were
recorded each minute during the period in which the load was being increased, and then once
every five minutes during the period in which the axial load was held constant. In all tests, a
displacement ranging from 3 -5 mm was noticed during the time in which the axial load was kept
constant by the MTS. This can be due to rearrangement and consolidation of the particles. In
addition, it may also provide some insight about volumetric changes due to autogenous
shrinkage; however, that is outside of the scope of this dissertation.
7.2.2.3 Paste Fabrication
Paste mixtures corresponding to the tested concrete mixtures given in Table 7-2 were prepared
for structural rebuilding rheological testing (c.f. Chapter 4). A Hobart mixer (ASTM C305[126])
was used to mix all the paste samples. The mixing sequence consisted of homogenizing the dry
powder materials for one minute using at speed 1 (136 rpm), and then over a 30 second interval a
portion of the water and all of the superplasticizer were added. The paste was mixed for 2
minutes (at 136 rpm) after which the mixing was paused so that the sides of the bowl could be
cleaned. The VMA and the remaining water were added, and mixing was restarted for an

Chapter 7: Formwork Pressure of SCC and Influence of Structural Rebuilding
186additional 2 minutes (at 136 rpm). The mixing was paused a second time to clean the bowl,
and finally the paste was mixed for an additional 2 minutes at the higher speed (281 rpm). The
total preparation time for the paste mixtures was 9 minutes. After mixing, the paste slump flow
tests and rheological tests were conducted.
7.3 Results
7.3.1 Fresh State Properties Table 7-3 summarizes the fresh state properties for the concrete and the corresponding paste
matrix. The viscosity was calculated by fitting the Bingham model to the data shown in Figure
7-9. Cem5 was very cohesive and exhibited excellent segregation resistance, which can be
attributed to the high viscosity of this mix (as seen in the Tfinal reading of the concrete and the
viscosity measurement of the paste). The paste flow diameter of Cem6 was slightly lower than
the other two mixtures indicating that the paste matrix of this concrete would have a higher yield
stress. Slight bleeding and more air bubbles were observed in Cem6, and, in general, this
mixture was more sensitive to variations in the superplasticizer dosage than the other mixtures.
The T50 time indicates that the relative viscosity of the Cem6SF concrete is likely to have a
higher viscosity than the Cem5 concrete. However, due to the very short duration of the T50 test
and it being very sensitive to the user, it is difficult to compare results conducted by different
users due to the high variability of this test. Although the results show that the relative viscosity
of Cem6 is probably lower than Cem6SF, it can not be said with absolute certainty that the
relative viscosity of Cem5 differs from that of Cem6 or Cem6SF. The Tfinal time indicates that
relative viscosity of the Cem6SF concrete is likely to have a higher viscosity than Cem5
concrete. Furthermore, the Tfinal time is able to distinguish between the flow behavior of the

Chapter 7: Formwork Pressure of SCC and Influence of Structural Rebuilding
187Cem5 concrete and Cem6 concrete, and the results indicates that the relative viscosity of
Cem5 concrete is higher than Cem6 concrete. The Tfinal time does not show an appreciable
difference between the viscosity of the Cem5 concrete and Cem6SF concrete, which is probably
due to the influence of the yield stress. However, it is seen that the slump flow diameter of
Cem5 concrete is slightly larger than the slump flow diameter of Cem6SF concrete. Taking this
into account, the results seem to suggest that the Cem5 concrete has a slightly lower viscosity
than Cem6SF concrete.
Table 7-3. Fresh state properties for concrete and paste
Concrete Paste
Mix Slump flow (mm)
T50 (s)
Tfinal (s) VSI Temp.
(°C) Density (kg/m3)
Slump flow (mm)
Viscosity (Pa/s)
Cem6 667 4.8 37 1.5 22.9 2440 421 0.050 Cem6SF 667 10.0 67 0 22.9 2424 405 0.066
Cem5 673 7.0 66 0 24.1 2446 391 0.098
7.3.2 Lateral Pressure and Pore Water Pressure Evolution Initially, both pressure sensors followed similar paths, and the total lateral pressure (Pt) and the
pore pressure (Pp) both reached similar peak values. However, after the peak, the two readings
deviated and the total lateral pressure remained constant, whereas the pore water pressure
continued to decrease. The constant lateral pressure reading is due to the fact that the concrete is
able to retain its shape, and the deformation of the transducers diaphragms is no longer reversible
against the hardening material. Improvements could be obtain by applying a thicker layer of
grease between the concrete and the total lateral pressure transducer, but this only resulted in
slightly delaying the time at which the total lateral pressure deviated from the pore pressure

Chapter 7: Formwork Pressure of SCC and Influence of Structural Rebuilding
188reading with cancellation of the total pressure never occurring. This was similar to results
reported in another study [127] and brings into question the use of monitoring lateral pressure
with diaphragm pressure transducers that are in direct contact with a stiffening material. An
alternative procedure to monitor the evolution of the total pressure using a displacement-type
control procedure was developed by Andriamanantsilavo et al. [128]. The total pressure exerted
by cement paste against a mobile surface was measured against that required to push against
another fluid on the other side of the same surface and keep it in equilibrium. By using this
rigorous technique, it was demonstrated that the total and pore water pressure decreased
identically to zero during setting of cement pastes showing the equivalence between total and
pore water pressure when proper testing protocol is used. Since the pore water pressure is easier
to directly measure than the total lateral pressure for a setting material, the pore water pressure
was used to monitor the pressure evolution in this study.
In soil mechanics, the total stress at a particular point in a saturated soil mass (with no
seepage of water) is divided into two parts: pore water stress and the effective stress [120]. The
pore water stress is the stress carried by water in the continuous void spaces, and it acts in equal
intensity in all directions. The effective stress is the stress carried by the soil solids at their
points of contact [120]. This is represented mathematically by the following formula
u+= 'σσ
where σ is the total stress at the elevation of the considered point, σ’ is the effective stress, and u
is the pore stress. The above equation is based on the assumption that the fraction of cross-
sectional area occupied by the solid-to-solid contacts is negligible. As mentioned in the
preceding paragraph, it was found that in concrete the total stress was equal to the pore pressure.

Chapter 7: Formwork Pressure of SCC and Influence of Structural Rebuilding
189Thus, it appears that prior to pressure cancellation the concrete acts as a granular structure in
a dispersed state.
7.3.3 Formwork Pressure of SCC The variation of lateral pressure with respect to time and concrete head is shown in Figure 7-5.
The SCC mixture proportioned with Cement 5 exerted the lowest lateral pressure: 70% of the
hydrostatic value, compared to 80 % for mixture Cem6SF and 88 % for mix Cem6. Figure 7-6
shows evolution of pressure from the point at which casting has ended (denoted at t = 0 hr) to the
time of pressure cancellation (note: the lateral pressure at each time was normalized with respect
to the maximum lateral pressure exerted by the concrete). Although mixture Cem5 developed
the lowest maximum pressure, it displayed the slowest pressure drop. The fastest pressure decay
was seen in mixture Cem6, while both mixtures made with Cement 6 cancelled out at the same
time.

Chapter 7: Formwork Pressure of SCC and Influence of Structural Rebuilding
190
Pressure (kPa)
0 50 100 150 200 250 300
Hei
ght
(m)
0
2
4
6
8
10
Tim
e (h
r)
0.0
0.3
0.6
0.9
1.2
1.5
Figure 7-5. Evolution of pressure reading with time and height
Cem5
Hydrostatic Pressure
Cem6
Cem6SF
R=7m/hr

Chapter 7: Formwork Pressure of SCC and Influence of Structural Rebuilding
191
Time after casting (hr)
0 1 2 3 4 5 6 7 8 9 10 11 12
P(t)
/P h
ydro
stat
ic
(%)
0
10
20
30
40
50
60
70
80
90
100
Figure 7-6. Evolution of pressure decay, where P(t) is the formwork pressure of the
concrete at a specific time. Phydrostatic is constant and corresponds to the total vertical
pressure applied at the end of casting (approximately 240 kPa).
7.3.4 Structural Rebuilding Attempts were made to characterize the mortar phase by sieving portions of the fresh concrete
through a 0.15mm sieve, but difficulties in extracting a representative sample lead to highly
variable results. Thus, the rheological protocol described in Section 4.4 was used to characterize
the structural rebuilding within the representative paste matrix. The paste samples were prepared
using the same mix proportions as the concrete, except that no aggregates were used and no
additional water was added to account for aggregate absorption since no aggregates were used.
The structural rebuilding curves are plotted in Figure 7-7.
Cem5
Cem6SF
Cem6

Chapter 7: Formwork Pressure of SCC and Influence of Structural Rebuilding
192
0
400
800
1200
1600
2000
2400
0 20 40 60 80 100
trest (min)
SRE
(J/s
*m
3 )
Figure 7-7. Structural rebuilding curves for representative paste matrix
The results were in agreement with those obtained in Chapter 6. The paste mix proportioned
with Cement 5 had the lowest ΔSRE value (approximately half that of the mix made with
Cement 6), and the cement paste proportioned with Cement 6 with silica fume had the fastest
rate of rebuilding. The reasons for this behavior were discussed in Chapter 6.
7.4 Discussion
Surprisingly, the paste matrix that had the slowest rate of rebuilding yielded a concrete that had
the lowest maximum pressure. This is attributed to the different rheological properties of the
mixtures. Although Cem5 had the lowest ΔSRE value, the magnitude of its SRE values (c.f.
Figure 7-7) was much higher than those of Cem6 and Cem6SF. This was especially true during
Cem6
Cem6SF
Cem5
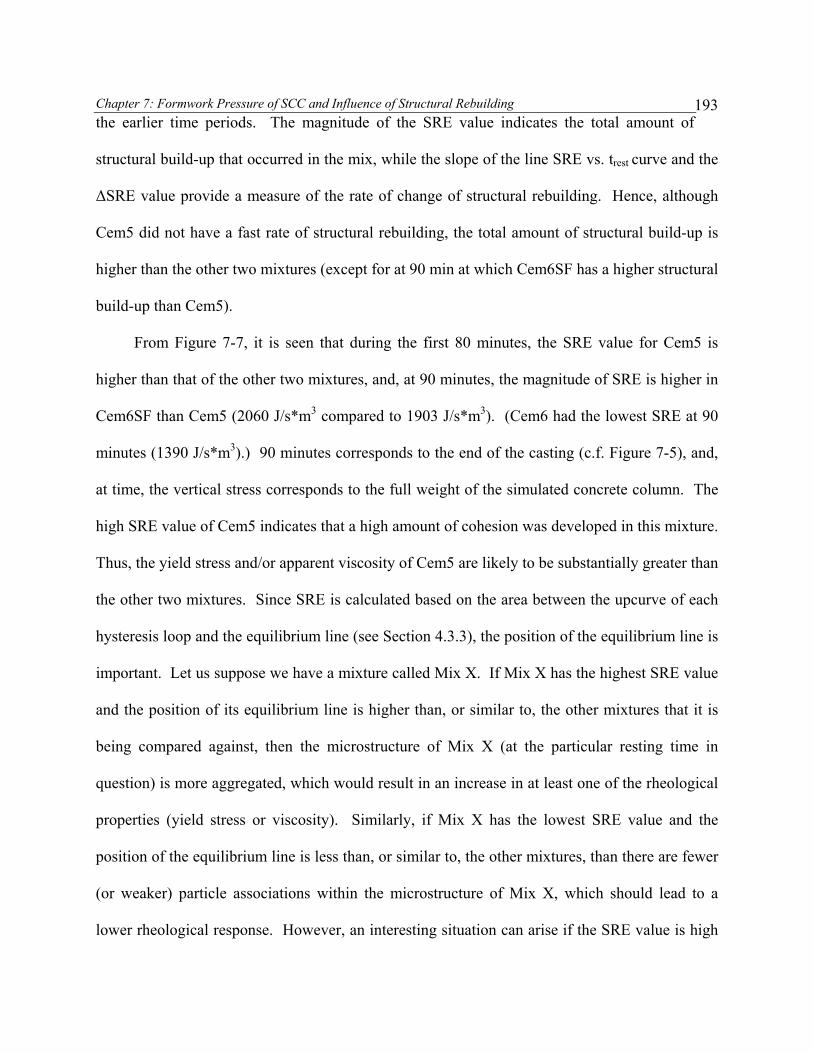
Chapter 7: Formwork Pressure of SCC and Influence of Structural Rebuilding
193the earlier time periods. The magnitude of the SRE value indicates the total amount of
structural build-up that occurred in the mix, while the slope of the line SRE vs. trest curve and the
ΔSRE value provide a measure of the rate of change of structural rebuilding. Hence, although
Cem5 did not have a fast rate of structural rebuilding, the total amount of structural build-up is
higher than the other two mixtures (except for at 90 min at which Cem6SF has a higher structural
build-up than Cem5).
From Figure 7-7, it is seen that during the first 80 minutes, the SRE value for Cem5 is
higher than that of the other two mixtures, and, at 90 minutes, the magnitude of SRE is higher in
Cem6SF than Cem5 (2060 J/s*m3 compared to 1903 J/s*m3). (Cem6 had the lowest SRE at 90
minutes (1390 J/s*m3).) 90 minutes corresponds to the end of the casting (c.f. Figure 7-5), and,
at time, the vertical stress corresponds to the full weight of the simulated concrete column. The
high SRE value of Cem5 indicates that a high amount of cohesion was developed in this mixture.
Thus, the yield stress and/or apparent viscosity of Cem5 are likely to be substantially greater than
the other two mixtures. Since SRE is calculated based on the area between the upcurve of each
hysteresis loop and the equilibrium line (see Section 4.3.3), the position of the equilibrium line is
important. Let us suppose we have a mixture called Mix X. If Mix X has the highest SRE value
and the position of its equilibrium line is higher than, or similar to, the other mixtures that it is
being compared against, then the microstructure of Mix X (at the particular resting time in
question) is more aggregated, which would result in an increase in at least one of the rheological
properties (yield stress or viscosity). Similarly, if Mix X has the lowest SRE value and the
position of the equilibrium line is less than, or similar to, the other mixtures, than there are fewer
(or weaker) particle associations within the microstructure of Mix X, which should lead to a
lower rheological response. However, an interesting situation can arise if the SRE value is high

Chapter 7: Formwork Pressure of SCC and Influence of Structural Rebuilding
194and the equilibrium line is lower than the other mixtures. Consider Figure 7-8a: it is obvious
that Mix A has a higher SRE value than Mix B. However, if the rheological properties were
extrapolated from fitting the Bingham model to the up curve, then the viscosity and yield stress
of a given mixture depends on the shape of the up curve. As shown in Figure 7-8b, the yield
strength of Mix B is greater than the yield strength of Mix A even though SREB < SREA (Mix B
and Mix A has the same viscosity). In Figure 7-8c, SREC < SREA and the yield stress of Mix C
is less than Mix A, but the viscosity of Mix C (characterized by the slope of the up curve) is
greater than the viscosity of Mix A. Hence, the SRE value should be used in conjunction with
the equilibrium line value in order to fully describe the behavior of a mixture. The equilibrium
lines are plotted in Figure 7-9. The equilibrium line of Cem5 is higher than the other two
mixtures, and this supports the hypothesis that the high SRE value in Cem5 is indeed due to a
more aggregated microstructure.
Using the rheological studies results, a better understanding of the resulting formwork
behavior is obtained. Initially the concrete behaves as a fluid and produces a hydrostatic
pressure that acts laterally on the vertical forms; all the vertical stresses are transferred to
horizontal stresses (i.e. K = 1). However, if cast slowly enough or if at rest, then the concrete has
time to build up an internal structure, and all the vertical stresses are not entirely transferred into
lateral stresses (i.e. K<1). All of the tested concretes exerted lateral pressures that were less than
hydrostatic, ranging anywhere from 70 to 90 percent of the hydrostatic value. Formwork
pressure can be reduced from aggregate interlocking [97], but since all the mixtures were
designed to have the same granular phase, it is assumed the differences in formwork pressure
behavior are due to the changes in the matrix phase.

Chapter 7: Formwork Pressure of SCC and Influence of Structural Rebuilding
195
Figure 7-8. Depiction of different structural conditions based on equilibrium line location
Yield stress
viscosity
Yield stress
viscosity 1
viscosity
Yield stress
1
1
Mix A Mix B
Mix C

Chapter 7: Formwork Pressure of SCC and Influence of Structural Rebuilding
196
02468
1012141618
100 120 140 160 180 200
Shear rate (s-1)
Shea
r st
ress
(Pa)
Figure 7-9. Equilibrium lines for representative paste mixtures
During the 90 minute casting process Cem5 had the lowest rate of rebuilding, but as
shown in Figure 7-7, and Figure 7-9 (imagine extrapolating to zero shear rate), the shear
strength (represented in the yield stress value) of this mix was significantly higher than the other
two mixtures. This difference in mechanical behavior is largely attributed to differences in the
pore solution chemistry. Paste mixtures proportioned with Cement 5 showed extremely high
concentrations of alkali and sulfate, which effectively compressed the electrical double layer and
reduced the electrostatic repulsive forces among the particles so that more interparticle links
developed. The higher shear strength of Cem5 enables less of the vertical stresses to be
transferred horizontally. Cem5 illustrates the importance of both the instantaneous amount of
structural rebuilding (i.e. the magnitude of structural rebuilding at a given time) and the overall
rate of structural rebuilding (determined from the difference between SRE values at 90 minutes
and 10 minutes). It was already shown that the high value for the instantaneous amount of
structural rebuilding in Cem5 is related to its high degree of structure and that when left at rest
Cem6
Cem5
Cem6SF

Chapter 7: Formwork Pressure of SCC and Influence of Structural Rebuilding
197this structure quickly rebuilds to its preferred state of structure (i.e. fast instantaneous
rebuilding). However, throughout the duration of the test, little additional rebuilding occurred
past this preferred state of structure, and, thus, the overall rate of structural rebuilding is low. As
mentioned earlier, the lateral pressure will depend on how much of the vertical stresses are
transferred through the material. Throughout the casting process a lower amount of the vertical
stresses were transferred due to the high state of structure in Cem5, which resulted in a
significant reduction in the formwork pressure.
With regard to Cem6SF, the reason why this mixture has a lower maximum formwork
pressure than Cem6 is related to both the higher degree of structure (c.f. Figure 7-9) and the
faster rate of structural rebuilding (both instantaneous and overall). During the first hour of
casting, Cem6 exerts hydrostatic pressure (K~1). After this point, enough shear strength is
developed in this mixture so that the pressure begins to deviate from the hydrostatic value. This
increase in shear strength could be attributed to an increase in inter-particle forces due to the
small surface area of the silica fume particles [129] and improved packing density [14, 129, 130].
The faster rate of structural rebuilding may also be due to the silica fume serving as a nucleation
site during the first few hours of hydration [131]. This can result in an enhanced precipitation of
hydration products on the surface of the silica fume particles, which may serve as bridges to
other particles [16]. Thus, the particle-particle contact is increased and promotes the
development of a continuous contact network. In order to fully characterize the initial formwork
pressure, the structural rebuilding parameter needs to include both the magnitude of structure
(i.e. value of static yield stress) and the rate of rebuilding. One way to account for the degree of
structure and the rate at which the structure rebuilds is to calculate the area under the SRE versus
trest curve (c.f. Figure 7-10).

Chapter 7: Formwork Pressure of SCC and Influence of Structural Rebuilding
198
trest (min)
0 20 40 60 80 100
SRE
(J/s
*m3 )
0
400
800
1200
1600
2000
2400
Cem5
trest (min)
0 20 40 60 80 100
SRE
(J/s
*m3 )
400
800
1200
1600
2000
2400
Cem5
Cem6SF
Cem6
(a) (b)
Figure 7-10. Transformation of SRE to take into account initial degree of structure and
rate of rebuilding (a) SRE curves (b) Transformation of Cem5 SRE curve to area
This area has the units of J*min/s*m3 (or alternatively, Pa*min/s) and represents the total
power (per unit volume and time) transferred into the system to break down the structure. The
power takes into account both the rate and the magnitude of the initial structure. Higher power
values should correlate to a lower formwork pressure. As shown in Figure 7-11, the behavior of
Cem5 is accounted for when this approach is used.

Chapter 7: Formwork Pressure of SCC and Influence of Structural Rebuilding
199
Rebuilding Power (J*min/s*m3)
6.0e+4 9.0e+4 1.2e+5 1.5e+5
% P
ress
ure
Red
uctio
n
0
20
40
60
80
100
% Pressure Reduction = -0.0003 (Rebuilding Power) +110.34R2 =0.9996
Cem6
Cem6SF
Cem5
Figure 7-11. Rebuilding Power versus Pressure Reduction Percentage
Research on formwork pressure behavior showed that the rate of pressure decay is
inversely proportional to the maximum initial pressure [5, 127, 132]. This is not to say that
mixtures with higher maximum formwork pressures always cancel out an earlier time, but rather
the relative rate at which the pressure decays tends to be faster when the initial maximum
pressure is high. Indeed, this same behavior was seen in this study (c.f. Table 7-4). Cem5 had
the slowest cancellation rate. This may be expected since this mixture had the lowest rate of
rebuilding. The time at which the pressure cancels corresponds to the point at which lateral
pressure against the formwork is equilibrated by the internal strength of the concrete, and the
cancellation time provides an indication of when the forms can be removed [133]. Studies have
shown that longer setting times are associated with longer cancellation times [5, 128]. The

Chapter 7: Formwork Pressure of SCC and Influence of Structural Rebuilding
200kinetics of pressure decay was decelerated in Cem5. This is likely to be related to the higher
superplasticizer demand, which prevents the particles from flocculating and delays the onset of
setting. With regard to Cem6 and Cem6SF, it is seen that although Cem6 had a lower initial
degree of structure it had a slightly faster rate of cancellation. Since the time of cancellation
occurs several hours after the end of mixing, it is closely linked to the rate of hydration. Since
the Cem6 mixture had a higher cement content, its rate of hydration is faster, and, thus, the
pressure decay is faster. In the case of longer casting times, it is possible that Cem6 and
Cem6SF may actually develop a lower initial formwork pressure than Cem5 since the effects of
hydration will be more significant when the casting period is extended.
Table 7-4. Maximum initial pressure and rate of pressure cancellation
Mix Hydrostatic Pressure(%)
Max Pressure(kPa)
Cancellation*(hr)
Rate of Cancellation(kPa/hr)
Cem6 89 212 10.95 19.4
Cem6SF 81 194 10.95 17.7
Cem5 70 168 11.38 14.7
*after the end of casting
An aspect that has not been discussed is whether the structural rebuilding in the mixtures is
reversible (i.e. thixotropic) or irreversible. Irreversible structural rebuilding in cementitious
materials occurs from aging effects due to a decrease in the superplasticizer efficiency and
hydration. Figure 7-12 shows the structural breakdown curves for the three mixtures. These
structural breakdown curves were conducted in order to establish the equilibrium condition (see

Chapter 7: Formwork Pressure of SCC and Influence of Structural Rebuilding
201Section 4.3.3) at the beginning of the tests (right after loading the sample into the rheometer).
In these curves, the equilibrium shear stress (τ1eq) is the shear stress value at 480 seconds.
Similarly, τ2eq defines the equilibrium shear stress for structural breakdown tests conducted at the
end of the 90 minute rheological tests. The difference between τ2eq and τ1eq provides insight into
the amount of irreversible and reversible bonds within the microstructure. τ2eq corresponds to the
shear stress value as it approaches an equilibrium value. If steady-state is achieved, and then it is
independent of shear history [51]. Smaller differences were seen between τ2eq and τ1eq for Cem5
and Cem6SF (c.f. Table 7-5), indicating that these microstructures are characterized by a large
amount of reversible (thixotropic) interparticle links (c.f. Figure 7-13and Figure 7-15). The
opposite is seen in Cem6 (c.f. Figure 7-14), and the structural rebuilding due to irreversible
bonds from hydration and/or coagulated flocs plays a larger role in this mix. The τ2eq stress of
Cem5 is greater than the τ2eq stress of Cem6, which indicates a higher degree of agglomeration.
Time (sec)
0 60 120 180 240 300 360 420 480
Shea
r st
ress
(Pa
)
20
40
60
80
100
120
140
160
Figure 7-12. Initial structural breakdown curves
Shear rate = 600 s-1
Conducted at beginning
Cem6
Cem6SF
Cem5
τ 1eq

Chapter 7: Formwork Pressure of SCC and Influence of Structural Rebuilding
202
Time (sec)
0 60 120 180 240 300 360 420 480
Shea
r st
ress
(Pa
)
0
20
40
60
80
100
120
140
160
180
Figure 7-13. Contribution from irreversible structural buildup in Cem5 (1 represents
structural breakdown curve conducted at beginning of test, 2 represents structural
breakdown curve conducted after 90 minutes)
Time (sec)
0 60 120 180 240 300 360 420 480
Shea
r st
ress
(Pa
)
0
20
40
60
80
100
120
140
160
Figure 7-14. Contribution from irreversible structural build-up in Cem6 (1 represents
structural breakdown curve conducted at beginning of test, 2 represents structural
breakdown curve conducted after 90 minutes)
1
2
2
1

Chapter 7: Formwork Pressure of SCC and Influence of Structural Rebuilding
203
Time (sec)
0 60 120 180 240 300 360 420 480
Shea
r st
ress
(Pa
)
0
20
40
60
80
100
120
140
160
Figure 7-15. Contribution from irreversible structural buildup in Cem6SF (1 represents
structural breakdown curve conducted at beginning of test, 2 represents structural
breakdown curve conducted after 90 minutes)
Table 7-5. Equilibrium shear stress measured at beginning and end of rheological test. The
% increase represents contribution from irreversible build-up, where a 0% increase means
that all structural build-up was due to reversible (thixotropic) build-up.
Mix τ eq1 (Pa)
τ eq2 (Pa)
Δ τ eq (Pa) % increase
Cem5 62.3 66.5 4.2 6.7 Cem6SF 43.5 48.6 5.1 11.7
Cem6 31.0 42.2 11.2 36.1
1
2
Chapter 7: Formwork Pressure of SCC and Influence of Structural Rebuilding
2047.5 Chapter Summary The use of a simple laboratory device to investigate the parameters influencing the formwork
pressure development of SCC was developed. The device allows for the study of the formwork
pressure of SCC without having to cast large scale columns and walls. With this device, an
experimental program to investigate the influence of structural rebuilding on formwork pressure
behavior was conducted. Based on the results of the study the following conclusions can be
made:
The rheological properties of the paste matrix and its evolution with time can be used
as indicators of the formwork pressure behavior of the concrete.
Replacing portions of cement with silica fume increases both the degree of structure
and the rate of structural rebuilding. This results in a decrease in the maximum
formwork pressure.
Formwork pressure is related to both the initial degree of internal structure (i.e.
magnitude of yield stress) and the rate at which the structure rebuilds with time
(ΔSRE). Both of these parameters should be accounted for in order to fully
characterize the initial formwork pressure exerted by an SCC mixture.
A two parameter model that predicts the formwork pressure behavior solely using the
rate of rebuilding and the time of cancelation may not be sufficient to describe the
formwork pressure behaviors. The rate of rebuilding during the casting period is not
the sole predictor of the time at which pressure will decay. Mixtures with slower
rates of rebuilding can cancel out similar times than mixtures with faster rates of
rebuilding depending on the rate of hydration. A two-component model may be

Chapter 7: Formwork Pressure of SCC and Influence of Structural Rebuilding
205required to describe formwork pressure of SCC: one part describes the formwork
pressure until the end of casting and the second part describes the formwork pressure
decay.
Formwork pressure decay is influenced by superplasticizer dosage. For a given w/b
ratio, higher superplasticizer demand reduces the rate of pressure decay.

CHAPTER 8: Flocculation of Cement Pastes
206
8 CHAPTER 8: Flocculation of Cement Pastes
8.1 Introduction The objective of this phase of the work was to evaluate the flocculation mechanisms in cement
pastes and to determine how the flocculation mechanisms are influenced by mixture
proportioning. With the growing use of SCC and the development of other unique rheological
cementitious suspensions, it is important to have a fundamental understanding of parameters that
can affect the flow behavior in order to better predict and control fresh state properties. The
results of the previous chapter showed that the structural rebuilding within the cement paste
matrix significantly influences the macroscopic behavior of concrete in its fresh state, in
particular the formwork pressure behavior. Aside from formwork pressure concerns, there are
limited studies that have focused on the flocculation mechanisms of high fluidity cement pastes.
The rheology of cement-based materials is related to the flocculation/deflocculation process
between particles, and current methods to examine the flocculation process involve sample
dilution or sampling or can not be measured in-process. To overcome these limitations, a new
experimental method was used to measure in situ the particle size evolution in real time. To the
author’s knowledge, this is the first time that in situ particle size measurements have been
measured in concentrated cement pastes while the paste is being subjected to shear-induced
stresses. Much research has focused on the microstructure and, more recently, on the
nanostructure of hardened concrete. However, there is still a lack of information about the
structure of cementitious materials in the fresh state, which is especially important during
processing of concrete (from mixing to pumping to formwork pressure to shrinkage). The results

CHAPTER 8: Flocculation of Cement Pastes
207from this stage of the project contribute to the state of knowledge regarding fresh state
microstructure and provide some answers to the following questions: What is the microstructure
of fresh cement paste? How do the different material ingredients influence the rate of
flocculation and floc strength? How does the microstructure of fresh cement paste respond to
shear-induced stresses?
8.2 Focused Beam Reflectance Measurement (FBRM) The FBRM method is a particle size analysis measurement technique that provides information
about particle chord length distribution in real-time. While there are various techniques for
determining particle size, few can be applied in situ or used for materials with high solid volume
concentrations[134]. The significant advantage of the FBRM method is that no dilution or
sampling of the suspension is required. The FBRM technique has been widely used in
crystallization studies and flocculation studies of dilute suspensions. Information obtained from
FBRM tests is often correlated to a process parameter. The chord length, defined as the
intersection of the scan plane with the projected-area of the particle in the focal plane, is a
characteristic measurement of particle geometry. FBRM instruments operate by scanning a
highly focused laser beam across particles in a suspension and measuring the time duration of
back scattered light from individual particles [135]. The laser beam is focused to a small beam
spot and scans at a fixed velocity. When the focused beam intersects the edge of a particle, the
particle will backscatter the laser light. Light will continue to backscatter until the beam reaches
the opposite edge of the particle (c.f. Figure 8-1).

CHAPTER 8: Flocculation of Cement Pastes
208
Figure 8-1. FBRM probe operation method [136]
A discriminating electronic circuit was used to isolate the time period of the
backscattered light, and this time period is multiplied by the scan speed to obtain a distance
[137]. It is this distance that is used as a measure of the particle size and is referred to as the
chord length in FBRM terminology. The mean chord length, C , is defined as follows,
∑
∑
∑∑
∑∑
=
=
=
=
= =
⎟⎟⎟⎟
⎠
⎞
⎜⎜⎜⎜
⎝
⎛
⎥⎥⎥⎥
⎦
⎤
⎢⎢⎢⎢
⎣
⎡
⎟⎟⎟⎟
⎠
⎞
⎜⎜⎜⎜
⎝
⎛
= k
iii
k
iii
k
ik
ii
i
k
iik
ii
i
Mn
Mn
n
n
Mn
n
C
1
0
1
1
1
1
where ni is the counts in an individual measurement channel, Mi is the midpoint of an individual
channel, and k is the upper channel number [137]. Every second thousands of chord length data
measurements are collected. The FBRM laser probe used in this research can obtain particle size
measurements in the range of 1 –1000 μm, and these measurements can be represented with
different distribution statistics (ex. median, mean, number of counted chords between any size

CHAPTER 8: Flocculation of Cement Pastes
209interval, cubic mean, square mean, etc.). Generally, the distinction between chord length
data and actual particle size is neglected because the considered process parameter has been
found to be related to some aspect of the chord length data [134]. An advantage of FBRM is that
it can be used in opaque materials, such as cement paste, since the chord length is determined by
the time (pulse width) rather than the intensity (pulse amplitude). A problem associated with
backscatter light measurements is difficulty in detecting smooth spherical particles or particles
suspended in liquids with refractive indices close to that of the particle [136, 138]. A schematic
of the FBRM probe and the actual experimental setup are shown in Figure 8-2 and Figure 8-3.
Figure 8-2. Schematic of FBRM system

CHAPTER 8: Flocculation of Cement Pastes
210
FBRM PROBE Agitator
400 ml Sample
Figure 8-3. FBRM experimental set-up
Further insight about the evolution of flocs was obtained by modeling the process of
aggregation and breakage. This process depends on the rate of different processes, namely, the
aggregation rate of particles forming flocs and the rate of floc breakage from shear induced
forces. Based on the Smoluchowshi classical theory of flocculation [139], a model based on
second-order kinetics for aggregation and first-order kinetics for disaggregation was used to
study the particle concentration evolution. This model is represented by the equation
nknkdtdn
22
1 +−=

CHAPTER 8: Flocculation of Cement Pastes
211where n is the number of particles, t is the time (in seconds), k1 is the aggregation kinetic
constant, and k2 is the disaggregation kinetic constant. The model assumes that flocculation
occurs from the collision of two particles (i.e. no multi-particle collision). The integrated
solution of this differential equation has been used to fit the experimental evolution of flocs and
is shown below:
where n0 is the initial number of particles.
8.3 Experimental Program
8.3.1 Mix Proportions and Materials Two cements and a class F fly ash were used. Cement replacement was conducted on a mass
basis. The physical and chemical properties of the cements and fly ash were given in Section
6.2. The superplasticizer was a carboxylated polymer in aqueous solution (specific gravity =
1.04). A liquid water-soluble cellulose-based VMA with a specific gravity of 1.002 and solids
content of 70% was employed in some of the mixtures. The manufacturer’s recommended
dosage for the VMA ranged from 130 to 910 mL/100 kg of cementitious materials. Based on
these recommendations, two dosages were used in this study: a medium dosage of 400 mL/100
kg of cementitious materials and a high dosage 800 mL/100 of cementitious materials. Two
clays were also used. The first clay was metakaolinite in pulverized powder form.
⎥⎥⎥⎥
⎦
⎤
⎢⎢⎢⎢
⎣
⎡
⎟⎟⎟⎟
⎠
⎞
⎜⎜⎜⎜
⎝
⎛ −−
=
− tken
kkn
kk
n
2
0
1
20
1
2
1

CHAPTER 8: Flocculation of Cement Pastes
212Metakaolinite is composed of pozzolonic amorphous alumino silicates formed by controlled
calcination of kaolinite. The chemical formula for kaolinite is Al2Si2O5(OH)4 and the general
formula for metakaolinite is Al2Si2O7. The second clay was sepiolite in slurry form. Sepiolite is
a hydrated magnesium silicate serpentine mineral commonly found in Spain. The chemical
formula for sepiolite is Mg4Si6O15·6(H2O). Both clays were used as a cement replacement, at a
dosage of 1.5% solids content. The water content for the sepiolite mix was adjusted to take into
account the water in the sepiolite slurry. The mix compositions are shown in Table 8-1:

213
Table 8-1. Mix compositions for FBRM studies
Mix Cement Type w/b
FA (%
binder)
SF (% binder)
SP dosage (% binder)
Cellulose VMA dosage
Meta-kaolinite
Clay
Sepiolite Clay
φ
(solids volume fraction)
Mix 9 (*) Cement 6 0.3 20 8 0.33 ----- ----- ----- 0.540 Mix 10 (*) Cement 5 0.3 20 8 2.69 medium ----- ----- 0.540
P1 Cement 5 0.4 ----- ----- ----- ----- ----- ----- 0.442 P1-SP Cement 5 0.4 ----- ----- 0.8 ----- ----- ----- 0.442
P1-VMA_H Cement 5 0.4 ----- ----- ----- high ----- ----- 0.442 P1-SP-VMA_H Cement 5 0.4 ----- ----- 0.8 high ----- ----- 0.442 P1-SP-VMA_M Cement 5 0.4 ----- ----- 0.8 medium ----- ----- 0.442
P2 Cement 6 0.4 ----- ----- 0.14 ----- ----- ----- 0.442 P2-VMA Cement 6 0.4 ----- ----- 0.14 medium ----- ----- 0.442 P2-Meta Cement 6 0.4 ----- ----- 0.14 ----- yes 0.443 P2-Sepio Cement 6 0.4 ----- ----- 0.14 ----- ----- yes 0.443
FA0 Cement 6 0.3 ----- ----- 0.33 ----- ----- ----- 0.514 FA20 Cement 6 0.3 20 ----- 0.33 ----- ----- ----- 0.532
* Corresponds to the same mix discussed in Chapter 6

CHAPTER 8: Flocculation of Cement Pastes
214
8.3.2 Sample Preparation
8.3.2.1 For effect of shear history, VMA, and clays Each suspension was prepared by manually mixing all the powder materials for 60 seconds.
Then, the superplasticizer and 90% of the deionized (DI) water were added while stirring, and
the sample was manually mixed for 60 seconds. Following the hand-mixing, the cement paste
suspension was mixed with a hand-held blender at low speed for 50 seconds, and then the
remaining water was added over a 10 second interval. When used, the viscosity modifying agent
or sepiolite slurry was also added during the 10 second interval. Next, the paste suspension was
mixed for 50 seconds at speed 1, after which the sides of the container were cleaned with a
spatula over a 30 second interval. Within a 40 second time interval the sample was transferred to
the FBRM. Hence, the FBRM experiment was started 4 minutes after the addition of water.
8.3.2.2 For studies of mix 9, mix 10, and fly ash
The suspensions were prepared by manually mixing all the powder materials for 60 seconds.
The superplasticizer and 90% of the DI water were added while stirring, and the sample was
manually mixed for 90 seconds. Following the hand-mixing, the cement paste suspension was
mixed with a hand-held blender at low speed for 50 seconds, and the remaining water and
viscosity modifying agent (when used) were added over a 10 second interval. Then, paste
suspension was mixed for 90 seconds at speed one, and over a thirty second interval the sides of
the beaker were cleaned with a spatula. Within a 60 second time interval the sample was
transferred to the FBRM. Hence, the FBRM experiment was started 5 minutes after the addition
of water.

CHAPTER 8: Flocculation of Cement Pastes
2158.4 Results and Discussion
8.4.1 Effect of shear history Figure 8-4 and Figure 8-5 show the mean chord length evolution and total number of particle
counts recorded for Mix9 subjected to different shearing conditions over a 30 minute period:
Stirred at 40 rpm for 30 min
Stirred at 400 rpm for 30 min
Stirred at 40 rpm for 10 min, 400 rpm for 10 min
Stirred at 400 rpm for 10 min, 40 rpm for 10 min, 400 rpm for 10 min
Stirred at 400 rpm for 10 min, 175 rpm for 10 min, 400 rpm for 10 min
A new sample was prepared for each test. It can be seen that both the particle size and
the total number of particles were influenced by the shearing conditions. Flocs can form from
three possible mechanisms: perikinetic aggregation, orthokinetic aggregation, and differential
sedimentation. Perikinetic aggregation refers to aggregation caused by Brownian (i.e. random)
motion whereas orthokinetic aggregation refers to aggregation caused by shear induced (i.e.
deterministic forces) forces [140]. Differential sedimentation occurs from particle collisions due
to differences in the settling velocities [141].
The Peclet number is a dimensionless quantity that characterizes the ratio of shear to
diffusion [142]:
TkNaP
Be 10
3πη=
where η is the shear-rate dependent suspension viscosity, a is the size of the particle, N is the
stirrer intensity in rpm, kB is Boltzmann’s constant, and T is the absolute temperature in Kelvin

CHAPTER 8: Flocculation of Cement Pastes
216[143]. Aggregation is perikinetic when the Peclet number is lower than 1 and orthokinetic
when the Peclet number is higher than 1. It is generally accepted that under shearing conditions
orthokinetic aggregation will dominant over differential sedimentation [134]. Hydrodynamic
effects increase with particle size and become more dominant for particles larger than a few
micrometers [144].
Table 8-2 shows the particle diameter that makes Pe = 1 under different shearing
conditions and viscosities. The viscosity values were selected to represent those of typical SCC
pastes [145, 146]. It is seen that perikinetic flocculation is the dominating mechanism for sizes
less ~ 0.1 μm. The minimum measurement range of the FBRM device was 1 micrometer;
therefore, aggregation of all of the measurable particles is orthokinetic. Increasing the stirring
intensity decreases the size limit of particles subjected to perikinetic aggregation, and in
cementitious suspensions this will increase the number of particles undergoing orthokinetic
aggregation. Increased mixing promotes particle-particle collisions (this can produces floc
growth); however, if the agitation is too vigorous, the turbulent shear forces that are produced
will break up the floc into smaller particles [147].
Table 8-2. Particle Size for when Peclet number equals 1
η (Pa/s)
N (rpm)
a (μm)
0.05 40 0.19 0.05 400 0.09 0.10 40 0.15 0.10 400 0.07 0.20 40 0.12 0.20 400 0.05 0.30 40 0.10 0.30 400 0.05

CHAPTER 8: Flocculation of Cement Pastes
2178.4.1.1 Floc Growth As shown in Figure 8-4, when N = 40 rpm, the mean chord size gradually increased over time,
which shows that the kinetics of aggregation dominates at this stirring intensity. During the
thirty minute test, the average chord length increased by 5.5%, from 11.00 μm to 11.60 μm. The
number of counts decreased when the chord size increased (c.f. Figure 8-5). This reflects the
phenomena of floc formation (i.e. individual particles/flocs coming together to form a larger
floc). As shown in Figure 8-6, the majority of the measured chords (~ 80%) are within less than
22 microns, and, thus, the average size of the suspension will tend towards the smaller values. In
addition to looking at the average chord size and total number of counts, the overall change of
different floc sizes provides further insight into the aggregation and breakage kinetics.
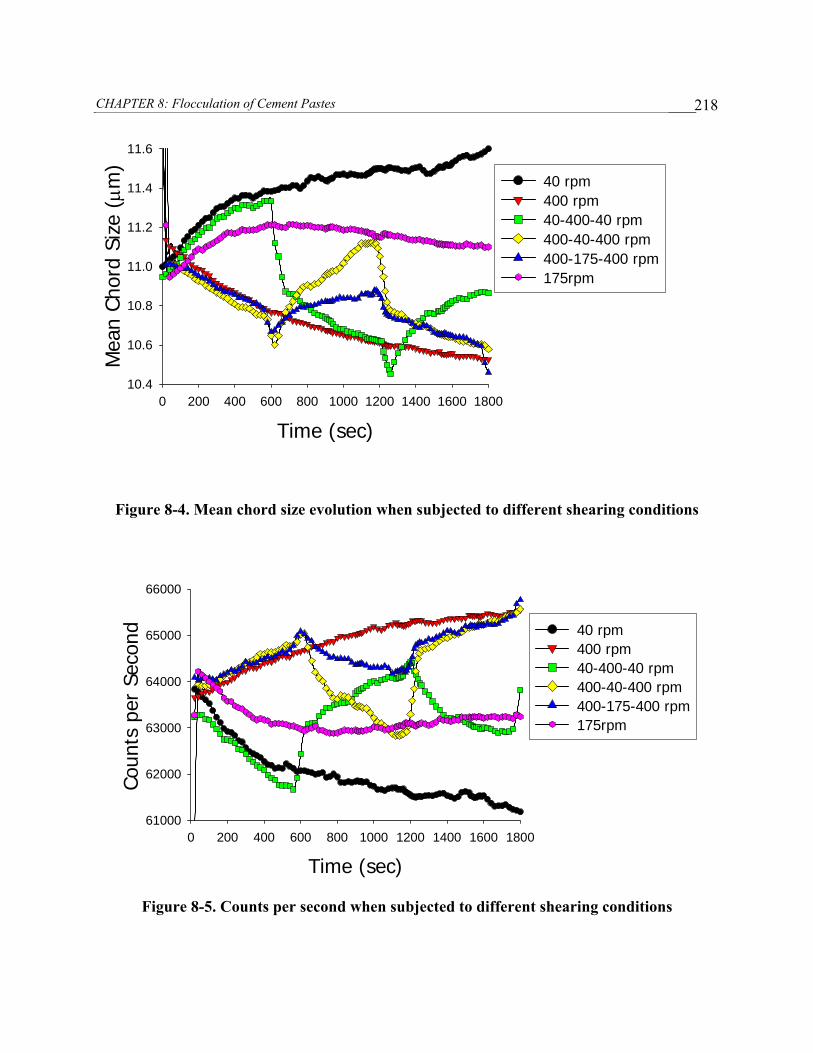
CHAPTER 8: Flocculation of Cement Pastes
218
Time (sec)
0 200 400 600 800 1000 1200 1400 1600 1800
Mea
n Ch
ord
Size
(μm
)
10.4
10.6
10.8
11.0
11.2
11.4
11.6
40 rpm400 rpm40-400-40 rpm400-40-400 rpm400-175-400 rpm175rpm
Figure 8-4. Mean chord size evolution when subjected to different shearing conditions
Time (sec)
0 200 400 600 800 1000 1200 1400 1600 1800
Coun
ts p
er S
econ
d
61000
62000
63000
64000
65000
66000
40 rpm400 rpm40-400-40 rpm400-40-400 rpm400-175-400 rpm175rpm
Figure 8-5. Counts per second when subjected to different shearing conditions

CHAPTER 8: Flocculation of Cement Pastes
219
Chord length (mm)
1 10 100 1000
Num
ber
of c
ount
s
0
200
400
600
800
1000
1200
1400
1600
180040 rpm 400 rpm
Figure 8-6. Chord size distribution curves for cement suspension at t= 1800s for samples
subjected to constant shearing of 40 rpm and constant shearing of 400 rpm
Figure 8-7 shows the percent difference of the various chord lengths from the beginning
and end of the thirty minute test. Negative values indicate a net loss of flocs within a particular
chord length range, whereas positive values indicates that the number of flocs within a given size
range increased. When the stirring intensity was held constant at 40 rpm, the number of flocs in
the smaller ranges decreased (6.5% reduction for flocs within 1-5 microns and 4.9% reduction
for flocs within 5-22 microns), while the number of larger flocs increased (3.9% increase for
flocs within 22-67 microns, 19.9% increase for flocs 67-95 microns, and 44.6% increase for flocs
within 95-250 microns).

CHAPTER 8: Flocculation of Cement Pastes
220
Chord Length (μm)
1-5 5-22 22-67 67-95 95-250
Perc
ent
Diff
eren
ce (
%)
-10
0
10
20
30
40
50
Figure 8-7. Percent difference when N= 40 rpm during 30 minute interval
This further demonstrates the dynamic process of rebuilding. Within a particular chord
range X, there will be a gain of flocs due to smaller particles outside of that size range
aggregating to form a new floc that is within range X. However, there will also be a loss of flocs
in chord range X, due to flocs that are within size range X now aggregating to form a new floc
that is larger than size X (c.f. Figure 8-8). The reduction in the number of flocs within the 1 – 22
micron range was very small (less than 10%), which indicates that there was a rapid formation of
new flocs from particles that were previously not measurable. The newly formed flocs
counterbalanced the decrease in the particle counts lost due to the particles within that size range
forming larger flocs. Regardless of the cement paste suspension tested, under a stirring intensity
of 40 rpm, the maximum floc size measured was 250 micron. Based on this observation, it is
hypothesized that even when the aggregation processes dominate, there is a limiting size
criterion for particle aggregation during the early stages of the induction period under shear. The
concept of a maximum stable aggregate size under orthokinetic aggregation has been seen in

CHAPTER 8: Flocculation of Cement Pastes
221polystyrene suspensions [148], scheelite particles in a sodium oleate solution [149] and
suspensions of quartz [150], and other systems [151-153]. It is likely that flocs that are larger
than 250 microns are weakly bonded and are unstable. Thus, when subjected to even a low
stirring intensity of 40 rpm their interparticle links are ruptured and the floc is broken up into
smaller sizes.
Figure 8-8. Loss and gain of particle size X
8.4.1.2 Floc Breakage When N = 400 rpm, the mean chord length decreased from 11.93 μm to 10.53 μm, representing a
11.7% decrease (c.f. Figure 8-4). A reduction in particle size typically indicates disaggregation
is occurring, and, as seen in Figure 8-5, the number of counts increased during the same period.
Thus, when N = 400 rpm, the disaggregation process dominates, and larger flocs are broken into
smaller flocs due to the high stirring intensity decreasing the aggregation efficiency [154].
Figure 8-9 shows the percent difference of the various chord lengths from the beginning and end
of the thirty minute test. A substantial decrease is seen in the larger chord length ranges and
almost all of the flocs within the 95 – 250 micron range are destroyed at the end of the 30

CHAPTER 8: Flocculation of Cement Pastes
222minutes. The high rate of breakage further supports the premise that the floc strength is
inversely proportional to floc size. As the floc size increases, it is more prone to breakage since
the probability of finding flaws (i.e. weaker bonds) also increases. Yang et al. examined the
sediment from differential sedimentation experiments and reported that the sediments from
cement-water systems were voluminous and soft, whereas sediments from cement-alcohol
systems were closely packed, dense, and hard [80]. Thus, as the floc size increases, it is likely
that the microstructure of the floc is more porous (i.e. less compact), and this would also increase
the susceptibility to breakage.
Chord Length (μm)
1-5 5-22 22-67 67-95 95-250
Perc
ent
Diff
eren
ce (
%)
-100
-80
-60
-40
-20
0
20
Figure 8-9. Percent difference when N= 400 rpm during 30 minute interval
8.4.1.3 Influence of shear regime on aggregation and breakage Consider the cement sample that is subjected to the 40-400-40 rpm stirring intensity cycle (c.f.
Figure 8-4). It is seen that the when the stirring intensity is initially increased from 40 rpm to
400 rpm, an immediate decrease in the average chord size was seen. This is accompanied by an

CHAPTER 8: Flocculation of Cement Pastes
223increase in the number of counts (c.f. Figure 8-5) and is a result of the disaggregation process
dominating over the aggregation kinetics. By the end of the 400 rpm stirring period, the average
chord size is the same as that of the suspension that was sheared continuously at 400 rpm.
However, the total number of counts was slightly less than that of the specimen that was sheared
at 400 rpm continuously, indicating that the arrangement of the microstructures of the two
systems are different. This can be due to re-conformation of the adsorbed polymers and
rearrangement of the flocs during the flocculation and breakage process. Negro et al. [154]
studied the flocculation of 5% w cement suspension cycled from low to high stirring intensities
and also found different tendencies in the aggregate size based on the shearing condition. A
significant increase in the mean chord sized evolution was seen when the stirring intensity was
cycled from 300-800-300 rpm versus being held constant at 300 rpm. This was believed to be
due to the smaller flocs sizes during the 800 rpm cycle increasing the hydration reaction.
The effect of shearing when the suspension is cycled from a high to low shearing
condition is demonstrated in samples subjected to the 400-40-400 cycle and the 400-175-400
cycle. At N = 400 rpm, the shearing forces generated by the high stirring intensity are strong
enough that breakage mechanisms dominate, and all samples sheared at 400 rpm achieved a
similar microstructural condition. When the stirring intensity was reduced, the sample began to
rebuild, and average particle size gradually increased. However, the microstructures of the
samples subjected to 400 rpm stirring intensity prior to rebuilding were different than the
microstructures of the samples that were continuously rebuilding. Samples subjected to shear
prior to rebuilding had smaller average chord sizes and a greater number of particle counts than
the sample that was allowed to continuously rebuild. Figure 8-10 shows the measured number of
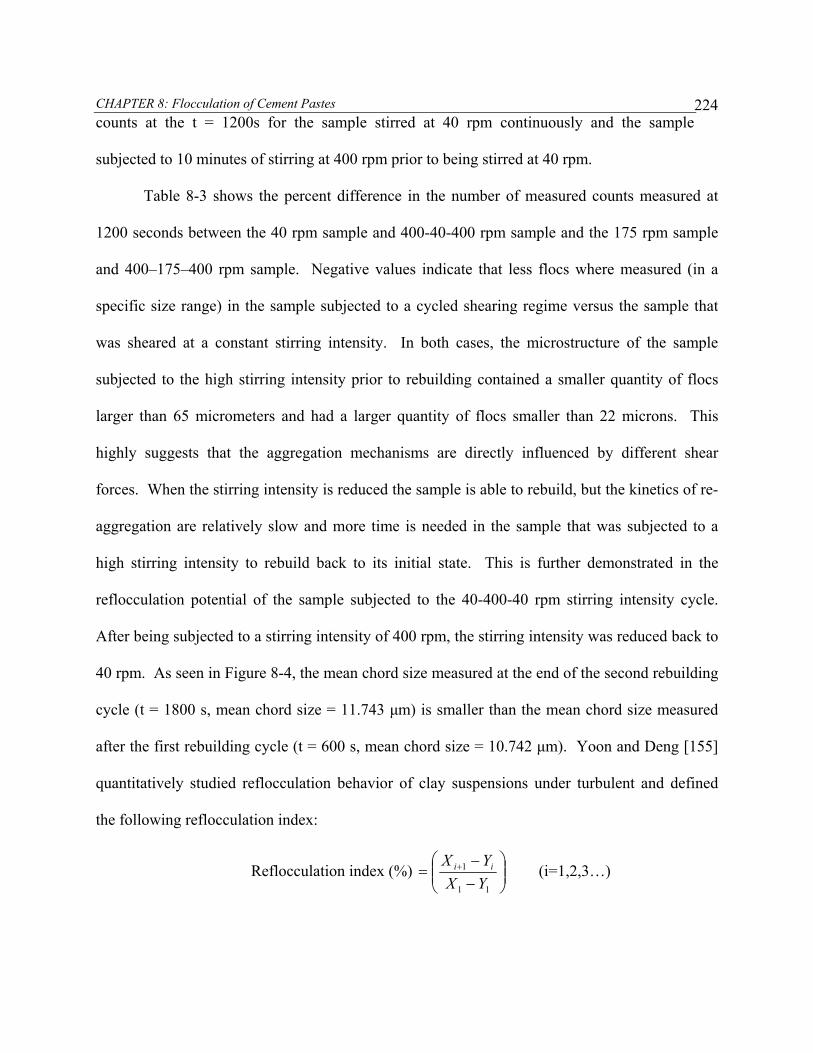
CHAPTER 8: Flocculation of Cement Pastes
224counts at the t = 1200s for the sample stirred at 40 rpm continuously and the sample
subjected to 10 minutes of stirring at 400 rpm prior to being stirred at 40 rpm.
Table 8-3 shows the percent difference in the number of measured counts measured at
1200 seconds between the 40 rpm sample and 400-40-400 rpm sample and the 175 rpm sample
and 400–175–400 rpm sample. Negative values indicate that less flocs where measured (in a
specific size range) in the sample subjected to a cycled shearing regime versus the sample that
was sheared at a constant stirring intensity. In both cases, the microstructure of the sample
subjected to the high stirring intensity prior to rebuilding contained a smaller quantity of flocs
larger than 65 micrometers and had a larger quantity of flocs smaller than 22 microns. This
highly suggests that the aggregation mechanisms are directly influenced by different shear
forces. When the stirring intensity is reduced the sample is able to rebuild, but the kinetics of re-
aggregation are relatively slow and more time is needed in the sample that was subjected to a
high stirring intensity to rebuild back to its initial state. This is further demonstrated in the
reflocculation potential of the sample subjected to the 40-400-40 rpm stirring intensity cycle.
After being subjected to a stirring intensity of 400 rpm, the stirring intensity was reduced back to
40 rpm. As seen in Figure 8-4, the mean chord size measured at the end of the second rebuilding
cycle (t = 1800 s, mean chord size = 11.743 μm) is smaller than the mean chord size measured
after the first rebuilding cycle (t = 600 s, mean chord size = 10.742 μm). Yoon and Deng [155]
quantitatively studied reflocculation behavior of clay suspensions under turbulent and defined
the following reflocculation index:
Reflocculation index (%) ⎟⎟⎠
⎞⎜⎜⎝
⎛−−
= +
11
1
YXYX ii (i=1,2,3…)

CHAPTER 8: Flocculation of Cement Pastes
225where i is the cycle number of the shear condition change, X is the floc size at low shear
condition, and Y is the floc size at high shear condition. Using this equation, the reflocculation
index at t = 1800 seconds for the 40-400-40 sample is 0.51. As stated earlier, the aggregation
kinetics are influenced by the shearing condition, and, thus, the differences in the mean chord
size is also attributed to different microstructural states prior to the beginning of each rebuilding
period. The sample is less agglomerated at t = 1200s than at t = 0 s, and it takes a longer time for
the interparticle bonds that were ruptured during the 400 rpm stirring period to be recovered.
Chord Size Range (mm)1-5 5-22 22-67 67-95 95-250
Num
ber
of C
ount
s
0
100
200
300
400
10000
15000
20000
25000
30000
40 rpm at t=1200s 400 - 40 - 400 rpm at t =1200s
Figure 8-10. Number of counts at end of 20 min period for sample allowed to continuously
rebuild and sample subjected to shear prior to rebuilding

CHAPTER 8: Flocculation of Cement Pastes
226
Table 8-3. Influence of shearing regime on rebuilding of flocs
Chord size range at t = 1200 seconds (μm) 1 - 5 5 - 22 22 - 67 67 - 95 95 - 250
Percent difference between 40 rpm sample, and 400-40-400 rpm sample 3.7 % 4.2 % -2.6 % -18.2 % -31.7 %
Percent difference between 175 rpm sample, and 400- 175-400 rpm sample 3.2 % 2.3 % -1.5 % -12.7 % -22.7 %
Examining the microstructures the samples at t = 1800s for the samples subjected to the
400-40-400 rpm and 400-175-400 rpm cycles provides information about the reversibility of the
bonds formed during the rebuilding periods. From Figure 8-4, it is evident that the flocs formed
during the rebuilding period were easily broken up when the stirring intensity increased. In both
cases, when the stirring intensity was increased to 400 rpm, the mean chord size and total
number of counts approached values that were similar to the sample that was continuously stirred
at 400 rpm. Table 8-4 shows the percent difference in number with respect to the number of
measured counts measured in the 400 rpm sample at 1800 seconds and the number of measured
counts in the 400-40-400 rpm sample and 400–175–400 rpm sample at the end of the second
breakdown period at t=1800s. Negative values indicate that less flocs were measured (in a
specific size range) in the sample subjected to a cycled shearing regime versus the sample that
was sheared at a constant stirring intensity. A larger number of large flocs were seen in the
mixture subjected to the 40 rpm rebuilding period indicating that the bond strength of the larger
flocs increased during the rebuilding period and that they are less susceptible to breakage.
However, it is likely that with continued shearing at 400 rpm, the majority of those flocs would
also be broken down. Overall, little difference is seen in the chord size distributions of the

CHAPTER 8: Flocculation of Cement Pastes
227samples; this indicates that the system tends towards an equilibrium microstructural
condition when the breakage kinetics dominates.
Table 8-4. Influence of shearing regime on breakdown of flocs
Chord size range at t = 1800 seconds (μm) 1 - 5 5 - 22 22 - 67 67 - 95 95 - 250
Percent difference between 400 rpm sample, and 400-40-400 rpm sample 0.2 % -0.6 % 1.1 % 5.2 % 11.3 %
Percent difference between 400 rpm sample, and 400- 175-400 rpm sample 0.4 % 0.6 % -0.8 % -3.0 % -1.7 %
8.4.2 Effect of VMA and clays Figure 8-11 shows the influence of VMA on chord count evolution for Cement 5. No substantial
changes in the number of chords counted were seen when VMA was added (compare P1 and P1-
VMA_H), which is an indication that additional flocculation of the cement particles did not
occur from the incorporation of this VMA. Rather, the superplasticizer was shown to be the
dominating factor affecting the chord length measurements, and a significant increase in the
number of counts occurred when superplasticizer was used (compare P1 with P1-SP). This
shows that the superplasticizer molecules directly interact with the cement particles such that the
cement particles are deflocculated, which increases the number of particles in the system. When
both VMA and superplasticizer are used in a paste, the flocculation behavior is more similar to
that of a paste with just superplasticizer. This behavior is seen regardless of the VMA dosage
(compare P1-SP, P1- SP-VMA_M, and P1-SP-VMA_H). It can be concluded that the VMA did

CHAPTER 8: Flocculation of Cement Pastes
228not interact with the cement particles, or if it did, it did not have any influence on the
flocculation properties. Thus, it is likely that the increase in cohesiveness when this particular
VMA is used is garnered from the polymers binding to the water phase.
Time (min)
0 10 20 30 40 50 60 70 80
Coun
ts P
er S
econ
d
45000
50000
55000
60000
65000
P1 P1-VMA_H P1-SP P1-SP-VMA_H P1-SP-VMA_M
Figure 8-11. Influence of VMA on number of particles for Cement 5
Figure 8-12 shows the influence of VMA and clays on mixtures made with Cement 6.
Similar to the behavior seen above, no significant changes were seen in the aggregation and
breakage behavior due to the incorporation of VMA. These results further support the
hypothesis that this particular VMA increased the stability of the paste matrix by adhering to the
aqueous phase. The results indicate that VMAs that increase the stability of the paste matrix by
Stage 1: 40rpm
Stage 2: 400rpm

CHAPTER 8: Flocculation of Cement Pastes
229adhering to the mixing water will not significantly change the rate of structural rebuilding
even though it may alter the viscosity of the paste.
Time (sec)
0 1000 2000 3000 4000 5000 6000
Coun
ts P
er S
econ
d
50000
52000
54000
56000
58000
60000
62000
64000
66000
P2P2-VMA P2-MetaP2-Sepio
Figure 8-12. Influence of clays and VMA on particle counts evolution
However, significant changes in the aggregation and breakage kinetics were seen when
clays were used. Regardless of the clay used in this study, an increase in the average chord size
and degree of flocculation occurred when they were employed. The increase in mean chord size
indicates that even at a small dosage of 1.5 %, the clays interact with the cement particles such
that particle-particle agglomeration is enhanced. This may be due to the clay particles serving as
micro/nano-fillers and increasing the connectivity of the network structure. In addition, due to
Stage 1: 40rpm
Stage 2: 400rpm
Stage 3: 40rpm
Stage 4: 40rpm

CHAPTER 8: Flocculation of Cement Pastes
230surface charge effects, clay minerals can form card-house type structures, and it is likely that
the formation of these card-house type structures will also contribute towards increasing the rate
of aggregation. The aggregation mechanisms are influenced by the morphology of the particles.
From previous investigations [156, 157], it was determined that the particles of the metakaolinite
clay are characterized by spiny needles on their surface, and it has been demonstrated that small
additions of this clay can improve the consolidation and shape stability of concrete mixtures
during the slipform paving process [156]. In addition, Kuder and Shah [158] showed that
kaolinite clays improve the cohesiveness of cement-based extruded materials at very low dosages
[158]. Sepiolite particles are also composed of needle-shaped structures [159-162], and their
ability to yield high viscosity values at low solid concentrations provides a major advantage
over other clays [161]. Thus, the increased mean chord size may also be attributed to the needle-
like particles of the clays increasing the flocculation efficiency by interweaving and bridging the
solid particles. Modification of natural clays using netting and bridging reagents has been shown
to increase the flocculation efficiency of solids particles in a freshwater system [160]. It is also
likely that interactions between the chemical admixtures and the clay particles can also influence
the flocculation and breakage kinetics. Studies have shown that clay surface modifications can
affect the adsorption behavior of the polymers [142], flocculation mechanisms and rheological
behavior of suspensions [142, 155], and hardened state microstructures [163].

CHAPTER 8: Flocculation of Cement Pastes
231
Time (sec)
0 1000 2000 3000 4000 5000 6000
Mea
n Ch
ord
Leng
th (μ m
)
10.0
10.5
11.0
11.5
12.0
12.5
13.0
13.5
P2P2-VMAP2-MetaP2-Sepio
Figure 8-13. Influence of clays and VMA on average chord length
During Stage 2, a reduction in the number of measured chords was seen in all mixtures
except P2-Sepio. The number of counts slightly increased in the P2-Sepio mix, which is
indicative of floc breakage of the larger, weaker flocs. Information about the reflocculation
ability is obtained from the behavior of the mixtures during Stage 4 (i.e. the recovery of the
system after being subjected to the 400 rpm stirring intensity). When the stirring intensity was
reduced, two responses were seen: an immediate reduction in the number of counts and then a
more gradual reduction in the number of counts. Mixtures with clays showed the smallest
immediate decrease in the number of counts, indicating that the flocs in these mixtures were
more stable. With respect to the gradual evolution of measured counts, the P2-Meta exhibited
the fastest decay, whereas the rate of reflocculation was relatively the same for the other
mixtures. The faster rate of flocculation in P2-Meta is attributed to a larger quantity, and faster
Stage 1: 40rpm
Stage 2: 400rpm
Stage 3: 40rpm
Stage 4: 40rpm

CHAPTER 8: Flocculation of Cement Pastes
232rate of formation, of flocs within the 22 – 95 micron range, which may be due to enhanced
particle aggregation from the needles bridging to form flocs.
Time (min)
45 50 55 60 65 70 75
Coun
ts P
er S
econ
d
7400
7600
7800
8000
8200
8400
8600
8800
9000
P2P2-VMAP2-MetaP2-Sepio
Time (min)
45 50 55 60 65 70 75Co
unts
Per
Sec
ond
200
250
300
350
400
450
500
P2P2-VMAP2-MetaP2-Sepio
(a) 22 – 67 microns (b) 67-95 microns
Figure 8-14. Influence of clays and VMA on floc size evolution during Stage 3
The response of the mixtures during Stages 2 and 4 provides information about the shear
resistance of the flocs. As evidenced by the increase in the measured counts, when the stirring
intensity is increased, the interparticle links ruptured. The reduction in the mean chord size
provides further confirmation that the breakage process is the dominating mechanism during this
stage. Table 8-5 contains the breakage kinetic constants for Stages 2 and 4. During Stage 2,
lower k2 values were seen in mixtures containing clays, and the flocs produced in P2 and P2-
VMA were the least stable and most sensitive to shear-induced changes. The relatively low k2
value of P2-Sepio is an indication that this mix is characterized by highly stable flocs with strong
interparticle bonds that are able to oppose floc breakage and floc erosion. Analysis of the chord
length distribution curve (not displayed here) showed that this was related to the stability of flocs

CHAPTER 8: Flocculation of Cement Pastes
233within the 1-5 micron range. In the case of mix P2-Meta, the relatively low k2 value is
attributed to highly stable large flocs, and as illustrated in Figure 8-15, a high percentage of the
flocs greater than 65 micron were retained during the high stirring intensity phases. Thus, there
exists a distinctive aggregation mechanism for the metakaolinite clay that encourages the
development of large flocs that have a high resistance to shear forces.
Time (min)
30.0 32.5 35.0 37.5 40.0 42.5 45.0
Coun
ts P
er S
econ
d
200
250
300
350
400
450
500
550
600 P2P2-VMAP2-MetaP2-Sepio
Mix
P2 P2-VMA P2-Meta P2-Sepio
% R
etai
ned
0
20
40
60
80
100
(a) Evolution with time (b) Percentage of flocs retained
Figure 8-15. Floc sizes greater than 65 microns during Stage 3
Comparing P2 and P2-VMA showed that VMA did not significantly change the breakage
kinetics of the paste mixture. This suggests that the VMA polymers induce a softer structural
network and that a stiffer structural network is formed when the viscosity is increased using
mechanisms that encourage particle-particle aggregation rather than mechanisms that thicken the
aqueous phase. From the second deflocculation period, it is seen that all of the mixtures had
good reversibility, and, in fact, higher k2 values (and total number of particle counts) were
measured during this stage. The results show that the deflocculation kinetic is highly influenced

CHAPTER 8: Flocculation of Cement Pastes
234by the shear history of the sample. This is directly related to the different microstructural
arrangement of pastes (as seen in the differences in chord length and number of counts) in Stages
1 and 3. The high increase in P2-Sepio shows that its floc structure is more sensitive to shear
history than the other mixtures.
Table 8-5. Breakage kinetics constant (N=400 rpm)
Stage 2 (t = 30 – 45 min)
Stage 4 ( t = 75 – 90 min) Mix
k2 (s-1) k2 (s-1) P2 0.0205 0.0298
P2-VMA 0.0212 0.0356 P2-META 0.0149 0.0345 P2-SEPIO 0.0045 0.0277
8.4.3 Relationship between Structural Rebuilding and Flocculation Figure 8-16 shows the chord length evolution for mixtures 9 and 10. Both mixtures had the same
initial slump flow (330 mm), yet significant differences in the aggregation kinetics were
displayed. During the first stage, little change is seen in the chord size evolution of mixture 9
indicating that the mixing energy during the sample preparation stage was high enough to
disperse the cement particles. The higher mean chord size value of mixture 10 (in addition to the
lower number of particle counts) shows that the microstructure of mixture 10 is more
agglomerated than mixture 9. However, the flocs formed in the mix are unstable, and, because
the flocs are held loosely together, they can be easily broken down and rearranged under shear.
This results in a decrease in average chord size of mix 10 during Stage 1.

CHAPTER 8: Flocculation of Cement Pastes
235
Time (min)
0 20 40 60 80 100 120 140 160
Mea
n Ch
ord
Size
(μ m
)
10.0
10.2
10.4
10.6
10.8
11.0
11.2
11.4
11.6
11.8
12.0
12.2
Mix 10Mix 9
Figure 8-16. Chord Size Evolution for Mix 9 and Mix 10
As shown in Section 6.3, the initial SRE of mix 10 is greater than the initial SRE value of
mix 9 (2678 J/m3*s versus 1339 J/m3*s). It was hypothesized that the magnitude of the SRE
value can be used as an indication of the degree of structure. The results show that there is a
correlation between the magnitude of the SRE value and the degree of structure and that the high
SRE value of mixture 10 was indeed attributed to a more flocculated microstructure. Changes in
the mean chord size were seen when the stirring intensity was cycled from 40 rpm to 400 rpm.
Initially, all mixtures displayed a high degree of reversibility. Mixture 10 had the highest
amount of reversibility, and the mean chord size at Stage 7 was actually smaller than the mean
chord size at Stage 1. This indicates that there are weak bonds among the flocs formed in mix 10
Stage 1: 400rpm
Stage 2: 40rpm
Stage 3: 400rpm
Stage 4: 40rpm
Stage 5: 400rpm
Stage 6: 40rpm
Stage 7: 400rpm

CHAPTER 8: Flocculation of Cement Pastes
236and that these bonds are easily broken under the influence of shear. The reflocculation
potential of mixture 10 is also very high, and it can be seen that the mean chord size at the end of
Stages 4 and 6 are similar to the mean chord size at the end of Stage 2. This is very interesting
because it shows that the microstructure of mix 10 tends to quickly restructure itself back to its
initial state (and nothing greater) after a disturbance. This agrees with the results seen in Figure
6-2 in which mixture 10 had a high SRE with a relatively slow rate of rebuilding. The
reversibility potential of mixture 9 decreases with time, and it is seen that the mean chord size at
the end of Stage 7 was greater than the mean chord size at the end of Stage 5. This may due to
an increase in the bond strength within the flocs, which makes them less susceptible to breakage
from the hydrodynamic forces, or to the formation of irreversible flocs due to the hydration
process. The reflocculation potential increases over time and mean chord size at the end of Stage
4 was greater than the mean chord size at Stage 2 in mix 9.
As shown in the previous chapter, in terms of formwork pressure, a mixture that exhibits
a behavior like mixture 10 would be preferable for reducing the maximum value of the formwork
pressure when the casting process is relatively short because the highly flocculated state of
mixture 10 provides more rigidity and the mixture quickly rebuilds back to this highly
flocculated state after a disturbance. This would be useful in cases in which the concrete is
refluidize during and after casting. However, mixture 9 would be preferable if the goal is to have
the quickest cancellation time due to its fast rate of structural build-up.
8.4.4 Formwork pressure and flocculation Figure 8-17 shows the chord counts evolution for mixes FA0 and FA20. Both mixtures were
subjected to the following experimental protocol: stirring at 400 rpm for 20 minutes followed by
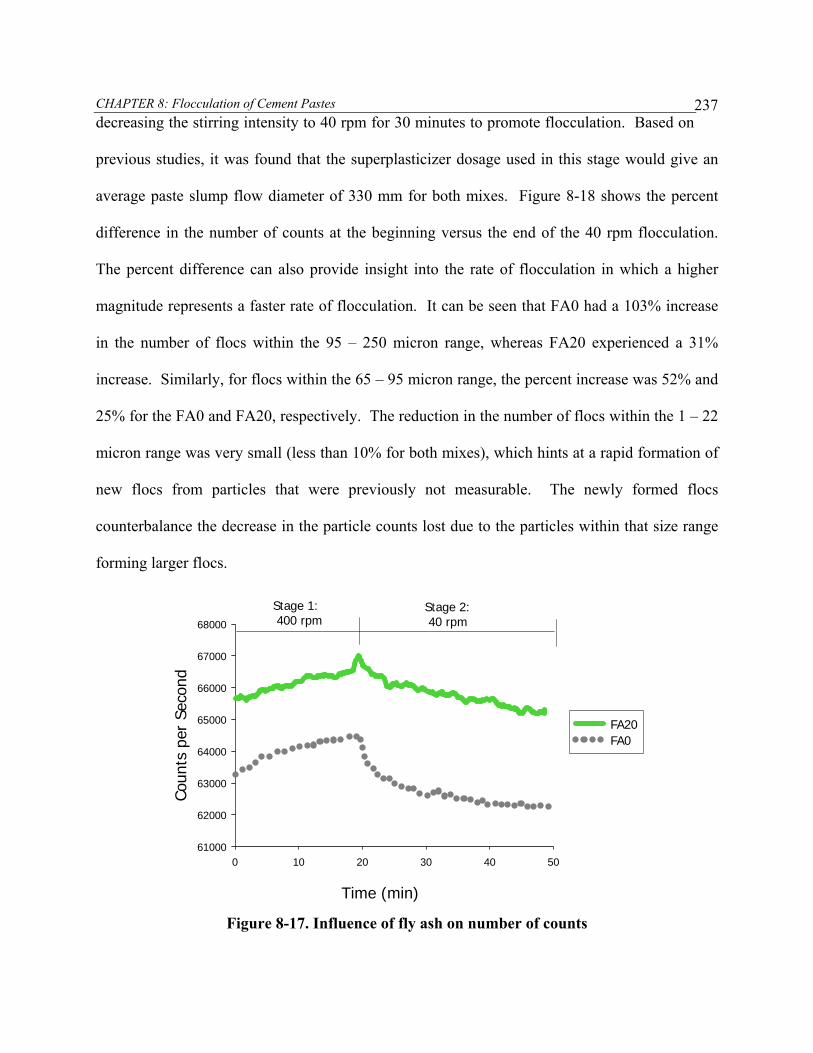
CHAPTER 8: Flocculation of Cement Pastes
237decreasing the stirring intensity to 40 rpm for 30 minutes to promote flocculation. Based on
previous studies, it was found that the superplasticizer dosage used in this stage would give an
average paste slump flow diameter of 330 mm for both mixes. Figure 8-18 shows the percent
difference in the number of counts at the beginning versus the end of the 40 rpm flocculation.
The percent difference can also provide insight into the rate of flocculation in which a higher
magnitude represents a faster rate of flocculation. It can be seen that FA0 had a 103% increase
in the number of flocs within the 95 – 250 micron range, whereas FA20 experienced a 31%
increase. Similarly, for flocs within the 65 – 95 micron range, the percent increase was 52% and
25% for the FA0 and FA20, respectively. The reduction in the number of flocs within the 1 – 22
micron range was very small (less than 10% for both mixes), which hints at a rapid formation of
new flocs from particles that were previously not measurable. The newly formed flocs
counterbalance the decrease in the particle counts lost due to the particles within that size range
forming larger flocs.
Time (min)
0 10 20 30 40 50
Coun
ts p
er S
econ
d
61000
62000
63000
64000
65000
66000
67000
68000
FA20FA0
Stage 1: 400 rpm
Stage 2: 40 rpm
Figure 8-17. Influence of fly ash on number of counts

CHAPTER 8: Flocculation of Cement Pastes
238
Chord Size Range (mm)
1-5 6-22 22-67 65-95 95-250
% D
iffer
ence
-20
0
20
40
60
80
100 FA0FA20
Figure 8-18. Percent difference from beginning to end of flocculation period
Values for the aggregation constant (k1) and disaggregation constant (k2) are given in
Table 8-6. The k1 value for FA0 is approximately two and a half times larger than the k1 value
for the FA20. Higher k1 values indicate a faster aggregation process. Thus, the addition of fly
ash is shown to decrease the rate of particle aggregation.
Table 8-6. Aggregation and disaggregation kinetics
Mix k1 (1/count *s) k2 (1/s)
FA0 3.21E-08 0.0020
FA20 1.39E-08 0.0009

CHAPTER 8: Flocculation of Cement Pastes
239The rheological method showed that fly ash typically yields a reduction in the rate of
structural rebuilding, and the flocculation studies showed that a larger number of smaller flocs
develop when fly ash is used. Insight into the stability of the flocs can be obtained from the
disaggregation constant. Higher k2 values indicate a lower floc strength (i.e. it is easier to
separate the particles within the flocs). The value of k2 decreases when fly ash is added. Hence,
the floc strength increases when fly ash is added and causes the formation of smaller, more
compact flocs (c.f. Figure 8-19). Since the flocs are more compact, more energy is required to
break the interparticle bonds.
Chord Size Range (μm)
1-5 6-22
Num
ber
of C
ount
s
25000
26000
27000
28000
29000
30000
31000
FA0 FA20
Figure 8-19. Comparison of small particles/flocs for mixtures made with and without fly
ash

CHAPTER 8: Flocculation of Cement Pastes
240The effect of fly ash on the formwork pressure in cement paste was measured using
the NU formwork pressure simulation device [132]. The simulated casting height was 14 m (46
ft) cast at a rate of 7m/hr (23 ft/hr). These tests were conducted using a different cement and
higher fly ash dosage (30%). Figure 8-20 shows the structural rebuilding curves for these
mixtures. As seen in the figure, the mixture made without fly ash had a faster rate of rebuilding
and a higher magnitude of the SRE value than the mix made with fly ash. The pastes in the
flocculation and structural rebuilding studies all showed a decrease in rate of rebuilding when fly
ash is used. Although the flocculation data can not be directly compared to the formwork
pressure data, the information from the flocculation study provides some insight into the
behavior that was seen when fly ash reduces the rate of rebuilding.
trest (min)
0 10 20 30 40 50 60 70 80 90 100
SRE
(J/s
*m3 )
0
1000
2000
3000
4000
5000
6000
7000FA0FA30
Figure 8-20. Structural rebuilding curve showing slower rate of rebuilding when fly ash is
used

CHAPTER 8: Flocculation of Cement Pastes
241 It is shown in Figure 8-21 that the addition of fly ash increased the peak pressure and
reduced the initial rate of formwork pressure decay (note, hydrostatic pressure is 350 kPa.).
This behavior can be explained from the slower rate of aggregation, which decreased the rate of
structural buildup. During the casting process, the formwork pressure is reduced when fly ash is
added because it takes more time for the flocs to form. The aggregation constant, k1, will play a
large role in both the initial formwork pressure and formwork pressure evolution. High k1 values
will decrease the initial formwork pressure and increase the rate at which the formwork pressure
decays due to the fact that the structural network develops at a faster rate. However, k2 values
will primarily influence the initial formwork pressure. A low k2 value may reduce the initial
formwork pressure since the structural network will be more effective in resisting shear-induced
forces from the casting process (ex. pouring and pumping). The key lies in achieving the optimal
balance between k1 and k2. This behavior is seen in Figure 8-21 in which the initial formwork
pressure between the two mixes were much closer due to the contribution from k2.

CHAPTER 8: Flocculation of Cement Pastes
242
Time (hr)
0.0 0.5 1.0 1.5 2.0 2.5 3.0 3.5
Pres
sure
(kP
a)
0
50
100
150
200
250
300
350
FA0: Pmax = 296 kPA
FA30: Pmax = 321 kPA
Figure 8-21. Influence of fly ash on formwork pressure
In the fly ash mix, although the flocs form at a slower rate once they form, they are harder
to break apart. Once the pouring has ceased, the k1 value is more significant since breakage of
flocs from shear induced forces is no longer a factor. The formwork pressure decays faster for
the mix made without fly ash, which has a k1 value that is approximately 2.5 times greater than
the mix made with fly ash. The particle size distribution of the fly ash varies widely. The fly ash
used in this study was coarser than the cement. An improvement in the formwork pressure and
rate of aggregation may occur when the fly ash particles are finer than the cement (i.e. using ultra
fine fly ash).
CHAPTER 8: Flocculation of Cement Pastes
2438.5 Chapter Summary
The objective of this phase of the work was to gain further insight into the flocculation
mechanisms within cement pastes. In order to accomplish this objective, a novel experimental
technique was used to obtain in situ information about the evolution and size distribution of flocs
within the fresh state microstructure. A kinetic model was successfully used to study the
aggregation and breakage kinetics. Based on the research presented, the following conclusions
can be drawn:
The FBRM technique can be used to evaluate the particle size evolution of
concentrated cement paste suspensions, and this technique can be used to identify the
flocculation mechanisms of chemical admixtures.
Aggregation and breakage kinetics of the paste matrix are highly influenced by shear
history. The kinetics of re-aggregation is relatively slow, and the time scale for
recovery is longer than the time needed to break down the structure.
Aggregation and breakage kinetics in cement pastes can be modified based on the
material ingredients. Floc stability is strongly influenced by the presence of chemical
admixtures. The addition of SP drastically reduces the mean floc size, which creates
a more dispersed suspension due to a reduction in particle aggregation.
The largest chord size measured was 250 microns. Thus, there appears to be a
limiting size to which the flocs will grow. Floc strength generally decreases as the
floc size increases.
VMAs that increase the stability of the paste matrix by adhering to the mixing water
will not significantly change the rate of aggregation.

CHAPTER 8: Flocculation of Cement Pastes
244 Clays increased the average chord size of the paste suspensions, and resulted in a
more flocculated network. The aggregation kinetics depends of the type of clay used.
Both clays produced highly stable flocs with strong interparticle bonds that were able
to oppose floc breakage and floc erosion. In the metakaolinite mix, this was
characterized by the larger flocs (greater than 65 micron), whereas in the sepiolite
mix, the increased floc strength was related to the smaller flocs (less than 5 microns).
Replacement of cement with fly ash results in a less flocculated structure. Fly ash
reduces the rate of rebuilding, but the floc strength increases when fly ash is added.
This results in the formation of smaller, more compact flocs. This indicates that the
rheological properties of cement pastes depend not only on the particle concentration
and size distribution, but also on the floc strength.
A relationship exists between the flocculation kinetics, structural rebuilding, and
formwork pressure. The maximum lateral pressure is related to both the floc strength
and the rate of aggregation, and the lateral pressure decay is related to the rate of
aggregation.

245
PART VI: Conclusion
CHAPTER 9: Conclusions and Future Work
246
9 CHAPTER 9: Conclusions and Future Work
9.1 Introduction
The main objective of the research presented in this dissertation was to identify the effect of
mixture composition on the rate of structural rebuilding and relate it to the lateral pressure
generated by SCC. After the overview section, the manuscript was divided into five sections.
Section I provided essential background information to understand the context of the work.
Section II presented an experimental method based on rheological measurements that was
developed to measure the structural rebuilding in cement pastes. Section III investigated the
impact of mixture proportioning on influencing the structural rebuilding. Section IV investigated
the relationship among formwork pressure, flocculation mechanisms, and structural rebuilding.
This final section summarizes the major conclusions of this body of work and provides ideas
about prospective work.
9.2 Conclusions An experimental program was conducted to gain insight into the role of mixture proportioning on
the structural rebuilding of high fluidity cement pastes and its implications for formwork
pressure development. Emphasis was given to understanding the role of aggregation and
breakage mechanisms on structural rebuilding. Based on the results of this research and well-
established principles from the literature, the following key findings and conclusions were made:

CHAPTER 9: Conclusions and Future Work
247 The rheological properties of the paste matrix and its evolution with time can be
used to predict the formwork pressure behavior of the concrete. The use of rheological
techniques provides a macroscopic way to measure structural rebuilding and to evaluate
indirectly the microstructure of the fresh cement paste.
Formwork pressure and structural rebuilding of SCC is highly influenced by the
mixture proportioning of the paste matrix phase. With proper design of the matrix phase
it may be possible to achieve significant reductions in lateral pressure development. A
30% reduction in formwork pressure (with respect to the hydrostatic pressure) was
produced solely by altering the paste matrix to one in which the network interactions
among particles were high.
The lateral pressure exerted by SCC is related to both the rate at which structural
rebuilding occurs and the total amount of structural build-up (i.e. overall degree of
structure). The higher the total amount of structural build-up, the higher the shear strength
properties of the concrete. This provides for further resistance to the applied vertical
stresses and less initial pressure will develop. The formwork pressure cancellation is
related to the rate of rebuilding and hydration effects. Mixtures with slower rates of
rebuilding can cancel out similar times (or even earlier) than mixtures with faster rates of
rebuilding depending on the rate of hydration.
Shear rheology can be effectively used to monitor and evaluate the rate of structural
rebuilding in fresh cement pastes. A rheological protocol was developed to measure the

CHAPTER 9: Conclusions and Future Work
248structural rebuilding within cement pastes. The developed protocol provides an
effective method to determine the rate at which a sample rebuilds. The effects of yield
stress and viscosity are coupled together, and the protocol provides a measure of the total
rate of rebuilding that occurred in a sample. The major advantage of this protocol is that it
requires only one sample providing a relatively quick way to determine the rate of
structural rebuilding.
For a given consistency level, higher rates of structural rebuilding were seen when the
consistency level was achieved by using a lower w/b ratio and slightly higher
superplasticizer dosage versus using a higher w/b ratio and slightly lower
superplasticizer dosage. Reducing the w/b ratio reduces the thickness of the water layer
around the particle, which decreases the inter-particle distance. Furthermore, the solid
volume content is increased when the w/b ratio is reduced, which results in more
interparticle contacts. In addition, the ion concentration of the pore solution increases
when the w/b ratio decreases, which also favors structural build-up due to a reduction in
the repulsive interaction forces.
Ideal thixotropic fluids show a decrease in viscosity when subjected to a constant shear
stress, or shear rate, and then a gradual recovery when the stress of shear rate is removed.
Furthermore, the recovery and breakdown is reversible. During the early stages of the
induction period (~ first 30 minutes), it is possible for plasticized cement paste to show
ideal thixotropic behavior. The length of time at which a cement paste will display ideal
thixotropic behavior is largely dependent on the cement-superplasticizer interaction. At

CHAPTER 9: Conclusions and Future Work
249later stages in the induction period, cement pastes do not display ideal thixotropic
behavior due to irreversible structural build-up, which results in the formation of a
stronger network structure.
The Vicat needle test is not sensitive enough to monitor changes in the microstructure
prior to initial set. However, a relationship was seen between the rate of structural
rebuilding during the first 90 minutes and the time of initial set. Mixtures with faster
rates of rebuilding showed lower initial setting times. This suggests that the mechanisms
influencing structural rebuilding are closely linked to the mechanisms influencing
stiffening.
The FBRM technique can be used to evaluate the flocculation behavior of concentrated
cement paste suspensions. This technique provides a direct way to evaluate structural
rebuilding in fresh cement pastes on a microstructural level. A relationship exists among
the FBRM particle size measurements, structural rebuilding determined with
rheological tests, and the lateral formwork pressure. The maximum lateral pressure
appears to be related to both the floc strength and the rate of aggregation while the
lateral pressure decay is mainly a function of the rate of aggregation. The degree of
structure (i.e. magnitude of SRE) is related to the total number of flocs and the size of the
flocs. Generally, floc strength decreases as the particle size increases. However,
mixtures with a high degree of structural build-up are characterized by lower particle
counts and larger chord sizes. This suggests that connectivity of the structural network

CHAPTER 9: Conclusions and Future Work
250increases when the particle size increases and that the rheological properties are also
influenced by the floc strength.
The FBRM technique can be used to identify the impact of chemical admixtures on the
flocculation/dispersion of cement particles. When superplasticizers were added to the
paste suspension, an immediate increase in the number of measured counts occurred.
This indicates that superplasticizers increase the workability of concrete through
mechanisms that cause a de-structuring of the interparticle network such that the cement
particles are dispersed.
Aggregation and breakage kinetics of the paste matrix are highly influenced by the
shear history. The kinetics of re-aggregation is relatively slow, and time scale for
recovery is longer than the time needed to break down the structure.
When subjected to shear-induced stresses, the microstructure of cement paste suspension
will tend towards an equilibrium condition or steady state condition in which the rate of
breakage and rate of aggregation are equal. The response of the system will depend on the
initial state of the structure. When the aggregation kinetics dominates, network
interactions among particles develop and the average floc size increases. When the
breakage kinetics dominates, the network interaction among particles is broken
accompanied by a decrease in the average floc size. This gives rise to the macroscopic
flow behavior of shear thinning and thixotropy.

CHAPTER 9: Conclusions and Future Work
251 The results suggest that there is a limiting size to floc growth. The maximum floc size
correlates with the stirring intensity and is indirectly proportional to the stirring intensity.
Thus, the maximum floc size decreases as the shear intensity increases.
The above statements are holistic conclusions and findings that can be applied to other
studies regarding cement paste suspensions. However, no statements were made concerning the
influence of materials on proportioning on the structural rebuilding and formwork pressure of
SCC. As with any other concrete, the nature of the constituent ingredients of SCC depends on
the availability of local materials, and the properties of the raw materials will vary from SCC to
SCC. As such, different behaviors can occur based on the specific properties of raw materials.
With these considerations in mind, the following conclusions can be drawn regarding the role of
mixture proportioning:
Structural rebuilding is highly influenced by the cement composition. The results show
that the rate of structural rebuilding is related to the C3A, soluble alkali content, and
sulfate ion concentration. Faster rates of structural rebuilding were seen in pastes with
lower contents of C3A, soluble alkali, and sulfate ion. The superplasticizer demand was
also found to be highly dependent of the cement composition, and higher superplasticizer
demand was found in the cement with the higher C3A and alkali content. The results
indicate that cement-superplasticizer interaction plays a large role on the structural
rebuilding behavior, and it was suggested that this is largely due to the amount of
superplasticizer adsorption.
CHAPTER 9: Conclusions and Future Work
252 The rate of structural rebuilding is significantly affected by the incorporation of silica
fume. Faster rates of rebuilding were seen in paste mixtures in which silica fume was
used as a cement replacement. This appears to be more related to physical effects and
less to changes in the pore solution chemistry. The increase in the structural rate of
rebuilding is attributed to stronger attractive forces due to the high surface area of the
silica fume particles. The flocs made in pastes that contain silica fume are likely to be
less susceptible to breakage and have faster rates of aggregation due to the increased
colloidal forces of attraction. This increases the shear resistance of the concrete and
reduces the initial formwork pressure.
On a microscopic level, the rate of particle aggregation is reduced and the microstructure
is less agglomerated when fly ash is used as a cement replacement. Thus, it takes longer
for the structural network to build-up, and slower rates of structural rebuilding were seen
when fly ash was added. These effects resulted in a higher formwork pressure value for
the mixture containing fly ash. No significant difference was seen in the rate of
rebuilding when the fly ash dosage was increased, which suggests that the initial
formwork pressure behavior would be similar for the two fly ash contents. Thus, in terms
of cost and environmental considerations, a higher dosage of fly ash could be used
without detrimentally affecting the initial formwork pressure.
The results indicate that VMAs that increase the stability of the paste matrix by adhering
to the mixing water will not significantly change the rate of aggregation. This suggests

CHAPTER 9: Conclusions and Future Work
253that the rate of structural rebuilding is largely controlled by factors influencing
particle-particle interaction of the structural network.
Minor additions of clays can significantly impact the structural network development of
cement paste suspensions and result in a more flocculated structure. The flocs produced
by the clays were highly stable flocs with strong interparticle bonds that were able to
oppose floc breakage and floc erosion.
9.3 Future Work
The results from this study have many implications for the cement and concrete industry. The
results showed that there is a linkage between structural rebuilding, flocculation, and formwork
pressure. It was found that formwork pressure is highly influenced by the total degree of
structure and that changing the composition of the paste matrix phase can significantly impact
the formwork pressure behavior. Furthermore, for the first time the response of the
microstructure to applied shear forces was directly explored. The results showed that the
response of the system will depend on the aggregation and breakage kinetics. While much
information has been gleaned, much research still remains to be conducted. The following
section highlights a few areas where future research would be very valuable:
Focus Beam Reflectance Measurement Studies: The results show that the FBRM
technique could be used to assess the particle formation and breakage process in cement
paste suspensions. However, there is still much work to be done concerning the

CHAPTER 9: Conclusions and Future Work
254relationship between the chord length measurement and the actual floc size
measurements in cement pastes. The relationship between the actual particle size and the
chord length measurement can be analyzed by conducting FBRM studies on cement-
alcohol suspensions and fly-ash-water suspensions. The particle size distribution via the
FBRM study would be compared against the particle size distribution obtained from other
methods in order to determine if the FBRM method is under-predicting or over-predicting
the particle size.
Structure-Property Relationships: As we move to concrete with more complicated
rheological properties, it is important to know how the microstructure of the fresh paste
matrix is influenced by processing. An experimental set-up in which the FBRM is used
with a rheometer would provide a direct way to develop structure-property relationships.
Research in this area could also focus on detailed characterization of the microstructure
using FBRM and microscopy techniques to investigate the role of mixing energy,
temperature, and delayed superplasticizer addition on the structure. Furthermore, studies
can also be conducted to examine the relationship between the fresh state microstructure,
fresh state properties, and hardened state properties. For example, the porosity of the
hardened paste is directly related to the connectivity of the solid phases. The addition of
micro/nano-particles to cementitious mixtures may result in a more homogeneous and
finer pore structure, and, based on the results of this study, these fine particles will also
influence the flocculation mechanism and microstructure of the fresh state. This leads to
the following question: What role does the fresh state microstructure and rheology play in
the development of the hardened state pore structure? And if there is a correlation

CHAPTER 9: Conclusions and Future Work
255between the fresh state structure and pore structure, the next question is: Can the pore
structure be micro-structurally engineered by controlling the fresh state microstructure?
Paste/Mortar Rheological Models: Cement pastes and concrete are typically modeled
as Bingham or Herschel-Buckley fluids. Due to structural rebuilding, the rheological
properties are time-dependent and rheological models for cementitious suspensions are
needed that can account for this behavior. Phenomenological equations have been
developed to express the viscosity of a suspension as a function of the viscosity of the
suspending medium, the solid volume fraction, and the characteristics of the particles.
Work in this area could focus on developing a phenomenological equation that is
applicable to concentrated cement pastes and mortars.
Relationship between Paste, Mortar, and Concrete Rheology: This is perhaps the
most fundamental issue concerning concrete rheology and has been the subject of much
research. The relationship among paste, mortar, and concrete rheology is complex, but
the ability to link these two would be beneficial because this would allow for the
prediction of concrete rheology solely from the characterization of the paste or mortar
phase. Research in this area should not only focus on the impact of aggregate volume
and size, but also on the role of aggregate morphology and packing density on the
rheological properties of the paste matrix. Computational modeling of flow behavior is an
area that needs to be further explored.

CHAPTER 9: Conclusions and Future Work
256 Cement-Superplasticizer Interaction: It was shown that a correlation existed
between the rate of rebuilding and the chemistry of the aqueous phase. The rate of
rebuilding is influenced significantly by type of cement selected, and the results showed
that this is attributed largely to interactions between the cement and superplasticizer.
Further, parameters should be investigated to evaluate how cement-superplasticizer
interactions influence the rate of rebuilding and flocculation mechanisms. This includes
studying the influence of superplasticizer adsorption, cement fineness, C3A reactivity and
dissolution, alkali sulfates, and the role of cement phases and hydrates.
Influence of hydration on structural rebuilding and initial set: Structural rebuilding
in cementitious materials is influenced by reversible and irreversible structural rebuilding
due to hydration effects. Determining the contribution of irreversible structural
rebuilding can provide insight into the mechanisms controlling initial set. Isothermal
calorimetric studies could be used to evaluate the amount of irreversible structural
rebuilding from hydration.
Role of clays on flocculation: Significant increases in the floc size were seen with
minor additions of clays. Research in this area could focus on determining the effects of
clay morphology and clay particle surface modification on flocculation and rheology.
Formwork Pressure: Comprehensive studies on the influence binder composition on
the formwork pressure of concrete when subjected to various casting rates are needed.
Other possible areas of further research include modifying the formwork pressure

CHAPTER 9: Conclusions and Future Work
257simulation device to make it field-friendly, developing comprehensive formwork
pressure models that account for structural rebuilding, and investigating the influence of
frictional effects on maximum lateral formwork pressure.
Structural Rebuilding and Fresh State Properties: The mechanisms that give rise to
structural rebuilding, time-dependent viscosity, and time-dependent yield stress are
interconnected. However, it is possible that the time-dependent viscosity may be more
important for a particular fresh state property, and vice-versa. Research in this area could
focus on evaluating how different properties (i.e. formwork pressure, segregation) are
influenced by the time-dependent yield stress and time-dependent viscosity.

CHAPTER 10: REFERENCES
258
10 CHAPTER 10: REFERENCES
[1] N. J. Gardner, "Pressure of Concrete on Formwork--a Review," ACI Materials Journal, pp. 744-753, Sept - Oct 1985.
[2] J. Nasvik, "Formwork for Self-Consolidating Concrete," Concrete Construction, 2004.
[3] S. U. W. Brameshuber, "Investigations on the Formwork Pressure Using Self-Compacting Concrete," in 3rd International Symposium on Self-Compacting Concrete, Reykjavik, Iceland, 2003, pp. 281-287.
[4] D. Fedroff and R. Frosch, "Formwork for Self-Consolidating Concrete," Concrete International, pp. 32-37, October 2004.
[5] J. Assaad, "Formwork Pressure of Self-Consolidating Concrete-Influence of Thixotropy," Ph.D. Dissertation, Universite de Sherbrooke, Sherbrooke (Quebec), Canada 2004.
[6] P. Billberg, "Form Pressure Generated by Self-Compacting Concrete," in 3rd International Symposium on Self-Compacting Concrete, Reykjavik, Iceland, 2003.
[7] ACI Committee 347, "Guide to Formwork for Concrete," American Concrete Institute, Farmington Hills, MI ACI 347-01, 2001.
[8] H. A. Barnes, "Thixotropy-a Review," Journal of Non-Newtonian Fluid Mechanics, vol. 70, pp. 1-33, 1997.
[9] M. Collepardi, The New Concrete. Italy: Grafiche Tintoretto, 2006.
[10] ASTM C1611/C 1611M, "Standard Test for Slump Flow of Self-Consolidating Concrete," PA: ASTM International, 2005.
[11] ASTM C143/C 143M, "Standard Test Method for Slump of Hydraulic-Cement Concrete," PA: ASTM International, 2008.

CHAPTER 10: REFERENCES
259[12] J. Walraven, "Structural Aspects of Self-Compacting Concrete," in Third
International Symposium on Self-Compacting Concrete, Reykjavik, Iceland, 2003, pp. 15-22.
[13] H. Okamura, "Self-Compacting High-Performance Concrete," Concrete International, pp. 50-54, July 1997.
[14] A. M. Neville, Properties of Concrete, Fourth Edition ed.: Pearson Education, 1995.
[15] N. Spiratos, M. Page, N. P. Mailvaganam, V. M. Malhotra, and C. Jolicoeur, Superplasticizers for Concrete: Fundamentals, Technology and Practice. Ottawa: Marquis, 2006.
[16] C.-T. Chen, "Interactions between Portland Cements and Carboxylated and Naphthalene-Based Superplasticizers," Ph.D. Dissertation, University of Illinois at Urbana-Champaign, Urbana-Champaign 2007.
[17] ACI Committee 212, "Chemical Admixtures for Concrete," Materials Journal, vol. 86, pp. 297-327, May 1 1989.
[18] K. H. Khayat, "Viscosity-Enhancing Admixtures for Cement-Based Materials -- an Overview," Cement and Concrete Composites, vol. 20, pp. 171-188, 1998.
[19] M. Sonebi, "Rheological Properties of Grouts with Viscosity Modifying Agents as Diutan Gum and Welan Gum Incorporating Pulverised Fly Ash," Cement and Concrete Research, vol. 36, pp. 1609-1618, 2006.
[20] M. Bury and B. Christensen, "The Role of Innovative Chemical Admixtures in Producing Self-Consolidating Concrete," in First North American Conference on The Design and Use of Self-Consolidating Concrete, Northwestern University, Evanston, IL, 2002, pp. 137-140.
[21] K. H. Khayat, "Effects of Antiwashout Admixtures on Fresh Concrete Properties," ACI Materials Journal, vol. 92, pp. 164-171, 1995.

CHAPTER 10: REFERENCES
260[22] S. Girish, J. Vengala, and R. Ranganath, "Volume Fractions in Self-Compacting
Concrete - a Review," in 5th International RILEM Symposium on Self-Compacting Concrete - SCC 2007, Ghent, 2007, pp. 73 - 83.
[23] A. Leemann and C. Hoffmann, "Pressure of Self-Compacting Concrete on the Formwork," in 3rd International Symposium on Self-Compacting Concrete, Reykjavik, Iceland, 2003, pp. 288 - 295.
[24] A. Leemann, C. Hoffmann, and F. Winnefeld, "Pressure of Self-Consolidating Concrete on Formwork," Concrete International, vol. 28, pp. 27-31, February 2006.
[25] EFNARC, Specification and Guidelines for Self-Compacting Concrete, 2002.
[26] "Forming Strategy for the High-Rise," in Concrete Construction. vol. 19, 1974, pp. 159, 186.
[27] Centre Experiméntal du Bâtiment et des Travaux Publics (CEBTP), "The Validated Technique of Self-Compacting Concrete," Report No. B242-9-054, June 1999.
[28] J. Assaad, K. Khayat, and H. Mesbah, "Assessment of Thixotropy of Flowable and Self-Consolidating Concrete," ACI Materials Journal, vol. 100, pp. 99-107, 2003.
[29] F. Tejeda-Dominguez, "Laboratory and Field Study of Self-Consolidating Concrete Formwork Pressure," M.S. Thesis, University of Illinois at Urbana-Champaign, Urbana-Champaign 2005.
[30] G. H. Tattersall and P. F. G. Banfill, The Rheology of Fresh Concrete, First ed. Marshfield: Pitman Publishing Inc, 1983.
[31] D. Doraiswamy, "The Origins of Rheology: A Short Historical Excursion," Rheology Bulletin, vol. 71, pp. 7-17, 2002.
[32] C. W. Macosko, Rheology: Principles, Measurements, and Applications. New York, NY: Vch, 1994.

CHAPTER 10: REFERENCES
261[33] F. R. Eirich, Rheology: Theory and Applications vol. 4. New York,: Academic Press,
1956.
[34] R. W. Whorlow, Rheological Techniques, 2nd ed.: Ellis Horwood, 1992.
[35] P. F. G. Banfill, "The Rheology of Fresh Cement and Concrete - a Review," in 11th International Cement Chemistry Congress, Durban, May 2003.
[36] RILEM Technical Committee 145-WSM, "Report 024: Workability and Rheology of Fresh Concrete: Compendium of Tests," 2002.
[37] P. Banfill, D. Beaupre, F. Chapdelaine, F. d. Larrard, P. Domone, L. Nachbaur, T. Sedran, O. Wallevik, and J. E. Wallevik, "Comparison of Concrete Rheometers: International Tests at LCPC," National Institute of Standards, Nantes, France 2000.
[38] D. Beaupre, F. Chapdelaine, P. Domone, E. Koehler, L. Shen, M. Sonebi, L. Struble, D. Tepke, O. Wallevik, and J. E. Wallevik, "Comparison of Concrete Rheometers: International Tests at MB," National Institute of Standards, Cleveland 2003.
[39] T. Cosgrove, Colloid Science: Principles, Methods and Applications. Ames, Iowa: Blackwell Publisher Professional, 2005.
[40] L. J. Struble, "The Rheology of Fresh Cement Paste," in Advances in Cementitious Materials, v. 16 ed., S. Mindess, Ed., 1991, pp. 7-29.
[41] O. H. Wallevik, "Rheology - a Scientific Approach to Develop Self-Compacting Concrete," in 3rd International RILEM Symposium, Reykjavik, Iceland, 2003, pp. 23-31.
[42] P. Moller, J. Mewis, and D. Bonn, "Yield Stress and Thixotropy: On the Difficulty of Measuring Yield Stresses in Practice," Soft Matter, vol. 2, pp. 274-283, 2006.
[43] H. A. Barnes, "Yield Stress - a Review or `ΠΑΝΤΑ ΡΕΙ' - Everything Flows?," Journal of Non-Newtonian Fluid Mechanics, vol. 81, pp. 133-178, 1999.

CHAPTER 10: REFERENCES
262[44] D. C.-H. Cheng, "Yield Stress: A Time-Dependent Property and How to Measure It,"
Rheologica Acta, vol. 25, pp. 542-554, 1986.
[45] H. A. Barnes and K. Walters, "The Yield Stress Myth?," Rheologica Acta, vol. 24, pp. 323-326, 1985.
[46] I. D. Evans, "Letter to the Editor: On the Nature of the Yield Stress," Journal of Rheology, vol. 36, pp. 1313-1318, 1992.
[47] D. A. Williams, A. W. Saak, and H. M. Jennings, "Influence of Mixing on the Rheology of Fresh Cement Paste," Cement and Concrete Research, vol. 29, pp. 1491-1496, 1999.
[48] H. Hodne, A. Saasen, A. B. O'Hagan, and S. O. Wick, "Effects of Time and Shear Energy on the Rheological Behaviour of Oilwell Cement Slurries," Cement and Concrete Research, vol. 30, pp. 1759-1766, 2000.
[49] M. R. Geiker, M. Brandl, L. N. Thrane, D. H. Bager, and O. Wallevik, "The Effect of Measuring Procedure on the Apparent Rheological Properties of Self-Compacting Concrete," Cement and Concrete Research, pp. 1791-1795, 2002.
[50] M. A. Rahman and M. Nehdi, "Effect of Geometry, Gap, and Surface Friction of Test Accessory on Measured Rheological Properties of Cement Paste," ACI Materials Journal, vol. 100, pp. 331-339, 2003.
[51] A. Saak, "Characterization and Modeling of Rheology of Cement Paste: With Applications toward Self-Flowing Materials," Ph.D. Dissertation, Northwestern University, Evanston 2000.
[52] J. Wallevik, "Rheology of Particle Suspensions," Ph.D. Dissertation, The Norwegian University of Science and Technology, Trondheim, Norway 2003.
[53] L. D. A. Schwartzentruber, R. Le Roy, and J. Cordin, "Rheological Behaviour of Fresh Cement Pastes Formulated from a Self Compacting Concrete (SCC)," Cement and Concrete Research, vol. 36, pp. 1203-1213, 2006.
[54] C. Hu and F. de Larrard, "The Rheology of Fresh High-Performance Concrete," Cement and Concrete Research, vol. 26, pp. 283-294, 1996.

CHAPTER 10: REFERENCES
263[55] N. B. Ur'ev, R. L. Baru, A. P. Izhik, S. V. Choi, and V. V. Saskovets, "Rheology and
Thixotropy of Cement-Water Suspensions in the Presence of Superplasticizers," Colloid Journal of the Russian Academy of Sciences, vol. 59, pp. 773-779, 1997.
[56] C. H. Pierce, "Thixotropy of Oil Well Cement Slurries," Ph.D. Dissertation, Stanford University, Stanford 1940.
[57] K. Khayat, M. Saric-Coric, and F. Liotta, "Influence of Thixotropy on Stability Characteristics of Cement Grout and Concrete," ACI Materials Journal, vol. 99, pp. 234 - 241, 2002.
[58] J. Mewis, "Thixotropy - a General Review," Journal of Non-Newtonian Fluid Mechanics, vol. 6, pp. 1-20, 1979.
[59] R. Lapasin, A. Papo, and S. Rajgelj, "Flow Behavior of Fresh Cement Pastes," Cement and Concrete Research, vol. 13, pp. 349-356, 1983.
[60] G. H. Tattersall, "Rheology of Portland Cement Pastes," British Journal of Applied Physics L2 - http://dx.doi.org/10.1088/0508-3443/6/5/304, vol. 6, pp. 165-167, 1955.
[61] C. Atzeni, L. Massidda, and U. Sanna, "Effect of Rheological Properties of Cement Pastes on Workability of Mortars," Cement, Concrete and Aggregates, vol. 7, pp. 78-83, 1985.
[62] A. Mujumdar, A. N. Beris, and A. B. Metzner, "Transient Phenomena in Thixotropic Systems," Journal of Non-Newtonian Fluid Mechanics, vol. 102, pp. 157-178, 2002.
[63] E. A. Toorman, "Modeling the Thixotropic Behaviour of Dense Cohesive Sediment Suspensions," Rheologica Acta, vol. 36, pp. 56-65, 1997.
[64] W. E. Worrall and S. Tuliani, "Viscosity Changes During Ageing of Clay-Water Suspensions," British Ceramic Society -- Transactions, vol. 63, pp. 167-185, 1964.
[65] D. C.-H. Cheng and F. Evans, "Phenomenological Characterization of the Rheological Behaviour of Inelastic Reversible Thixotropic and Antithixotropic Fluids," British Journal of Applied Physics, vol. 16, pp. 1599-1617, 1965.
CHAPTER 10: REFERENCES
264[66] A. Alessandrini, B. Caufin, R. Lapasin, and A. Papo, "Phenomenological Description
of the Thixotropic Behaviour of Gypsum Plaster Pastes," Rheologica Acta, vol. 24, pp. 617-622, 1985.
[67] A. Papo, "Thixotropic Behavior of White Portland Cement Pastes.," Cement and Concrete Research, vol. 18, pp. 595-603, 1988.
[68] N. Roussel, "Steady and Transient Flow Behaviour of Fresh Cement Pastes," Cement and Concrete Research, vol. 35, pp. 1656-1664, 2005.
[69] P. Coussot, Q. D. Nguyen, H. T. Huynh, and D. Bonn, "Viscosity Bifurcation in Thixotropic, Yielding Fluids," Journal of Rheology, vol. 46, pp. 573-589, 2002.
[70] D. C.-H. Cheng, "Characterisation of Thixotropy Revisited," Rheologica Acta, vol. 42, pp. 372-382, 2003.
[71] M. W. Barsoum, Fundamentals of Ceramics. New York: McGraw Hill, 1997.
[72] J. F. Shackelford, Introduction to Materials Science for Engineers, 4th ed. Upper Saddle River, N.J.: Prentice Hall, 1996.
[73] R. Serway and R. Beichner, Physics for Scientists and Engineers with Modern Physics, 5th ed. ed. vol. 2: Saunders College Publishing, 2000.
[74] T. Brown, J. H. Eugene Lemay, and B. Bursten, Chemistry: The Central Science, 7th ed. New Jersey: Prentice Hall, 1997.
[75] I. D. Morrison and S. Ross, Colloidal Dispersions: Suspensions, Emulsions, and Foams. New York: Wiley-Interscience, 2002.
[76] J. T. G. Overbeek, "Recent Developments in the Understanding of Colloid Stability," Journal of Colloid and Interface Science, vol. 58, pp. 408 - 422, 1977.
[77] Zeta-Meter Incorporation, "Zeta Potential: A Complete Course in 5 Minutes." vol. 2005, Z.-M. Inc., Ed., 1998.

CHAPTER 10: REFERENCES
265[78] D. R. Dinger, Rheology for Ceramists. Clemson, SC: Dinger Ceramic Consulting
Services, 2002.
[79] C. Plassard, E. Lesniewska, I. Pochard, and A. Nonat, "Nanoscale Experimental Investigation of Particle Interactions at the Origin of the Cohesion of Cement," Langmuir, vol. 21, pp. 7263-7270, 2005.
[80] M. Yang, C. M. Neubauer, and H. M. Jennings, "Interparticle Potential and Sedimentation Behavior of Cement Suspensions: Review and Results from Paste," Advanced Cement Based Materials, vol. 5, pp. 1-7, 1997.
[81] E. Nagele, "Zeta-Potential of Cement," Cement and Concrete Research, vol. 15, pp. 453-462, 1985.
[82] H. Uchikawa, D. Sawaki, and S. Hanehara, "Influence of Kind and Added Timing of Organic Admixture on the Composition, Structure and Property of Fresh Cement Paste," Cement and Concrete Research, vol. 25, pp. 353-364, 1995.
[83] S. Mindess, J. F. Young, and D. Darwin, Concrete, Second ed. Upper Saddle River: Prentice Hall, 2003.
[84] C. F. Ferraris and R. J. Flatt, "Acoustophoretic Characterization of Cement Suspensions," Materials and Structures/Materiaux et Constructions, vol. 35, pp. 541-549, 2002.
[85] C. M. Neubauer, M. Yang, and H. M. Jennings, "Interparticle Potential and Sedimentation Behavior of Cement Suspensions: Effects of Admixtures," Advanced Cement Based Materials, vol. 8, pp. 17-27, 1998.
[86] J. Bjornstrom and S. Chandra, "Effect of Superplasticizers on the Rheological Properties of Cements," Materials and Structures/Materiaux et Constructions, vol. 36, pp. 685-692, 2003.
[87] P. Termkhajornkit and T. Nawa, "The Fluidity of Fly Ash-Cement Paste Containing Naphthalene Sulfonate Superplasticizer," Cement and Concrete Research, vol. 34, pp. 1017-1024, 2004.

CHAPTER 10: REFERENCES
266[88] H. Uchikawa, S. Hanehara, and D. Sawaki, "The Role of Steric Repulsive Force in
the Dispersion of Cement Particles in Fresh Paste Prepared with Organic Admixture," Cement and Concrete Research, vol. 27, pp. 37-50, 1997.
[89] N. Toyoharu, "Chemical Admixture to Improve the Microstructures and Properties of Hardened Concrete." vol. 2006.
[90] Thermo Haake, "Instruction Manual Rotovisco ® Rt20 Rheostress ® Rs75/Rs80 and Rs150," in Instruction Manual for the Measuring Instrument, Karlsruhe, Germany: Federal Republic of Germany : Gebrueder Haake, 1999.
[91] M. A. Schultz and L. J. Struble, "Use of Oscillatory Shear to Study Flow Behavior of Fresh Cement Paste," Cement and Concrete Research, vol. 23, pp. 273-282, 1993.
[92] L. Nachbaur, J. C. Mutin, A. Nonat, and L. Choplin, "Dynamic Mode Rheology of Cement and Tricalcium Silicate Pastes from Mixing to Setting," Cement and Concrete Research, vol. 31, pp. 183-192, 2001.
[93] Z. Sun, "Monitoring the Early-Age Properties of Cementitious Materials with Ultrasonic Wave Reflection Method at Macro- and Micro-Structural Levels," Ph.D. Dissertation, Northwestern University, Evanston 2005.
[94] R. P. Douglas, A. Gregori, Z. Sun, D. Bonen, and S. P. Shah, "The Effect of Ingredients and Shear History on the Thixotropic Rate of Rebuilding of SCC," in SCC 2005: Second North American Conference and the Fourth RILEM International Conference on SCC, Chicago, IL, 2005.
[95] M. K. Lyon, D. W. Mead, R. E. Elliott, and L. G. Leal, "Structure Formation in Moderately Concentrated Viscoelastic Suspensions in Simple Shear Flow," Journal of Rheology, vol. 45, pp. 881-890, 2001.
[96] H. F. W. Taylor, Cement Chemistry. San Diego: Academic Press Inc., 1990.
[97] D. Bonen and S. L. Sarkar, "The Superplasticizer Adsorption Capacity of Cement Pastes, Pore Solution Composition, and Parameters Affecting Flow Loss," Cement and Concrete Research, vol. 25, pp. 1423-1434, October 1995.

CHAPTER 10: REFERENCES
267[98] A. Griesser, "Cement-Superplasticizer Interactions at Ambient Temperatures:
Rheology, Phase Composition, Pore Water and Heat of Hydration of Cementitious Systems," Ph.D. Dissertation, Swiss Federal Institute of Technology, Zurich 2002.
[99] S. Jiang, B.-G. Kim, and P.-C. Aitcin, "Importance of Adequate Soluble Alkali Content to Ensure Cement/Superplasticizer Compatibility," Cement and Concrete Research, vol. 29, pp. 71-78, 1999.
[100] ASTM C150, "Standard Specification for Portland Cement," PA: ASTM International, 2007.
[101] I. Jawed and J. Skalny, "Alkalies in Cement: A Review-Part 1. Forms of Alkalies and Their Effect on Clinker Formation," Cement and Concrete Research, vol. 7, pp. 719-729, 1977.
[102] ASTM C191, "Standard Test Methods for Time of Setting of Hydraulic Cement by Vicat Needle," PA: ASTM International, 2004.
[103] L. Struble, T. Y. Kim, and H. Zhang, "Setting of Cement and Concrete," Cement, Concrete and Aggregates, vol. 23, pp. 88-93, 2001.
[104] R. H. Myers, M. D. C., and cm, Response Surface Methodology: Process and Product Optimization Using Designed Experiments, 2nd edition ed. New York: Wiley, 2005.
[105] G. Box, J. Hunter, and W. Hunter, Statistics for Experimenters: Design, Innovation and Discovery, Second Edition ed. Hoboken, New Jersey: John Wiley & Sons, Inc., 2005.
[106] B. Lothenbach and F. Winnefeld, "Thermodynamic Modelling of the Hydration of Portland Cement," Cement and Concrete Research, vol. 36, pp. 209-226, 2006.
[107] H. J. H. Brouwers and R. J. vanEijk, "Alkali Concentrations of Pore Solution in Hydrating Opc," Cement and Concrete Research, vol. 33, pp. 191-196, 2003.
[108] A. Kelzenberg, S. Traacy, B. Christiansen, J. Thomas, M. Clarage, S. Hodson, and H. Jennings, "Chemistry of the Aqueous Phase of Ordinary Portland Cement Pastes at Early Reaction Times," American Ceramic Society Journal, vol. 81, pp. 2349-2359, 1998.

CHAPTER 10: REFERENCES
268[109] M. Michaux, P. Fletcher, and B. Vidick, "Evolution at Early Hydration Times of the
Chemical Composition of Liquid Phase of Oil-Well Cement Pastes with and without Additives. Part I. Additive Free Cement Pastes," Cement and Concrete Research, vol. 19, pp. 443-456, 1989.
[110] E. J. Reardon, "Problems and Approaches to the Prediction of the Chemical Composition in Cement/Water Systems," Waste Management, vol. 12, pp. 221-239, 1992.
[111] K. Andersson, B. Allard, M. Bengtsson, and B. Magnusson, "Chemical Composition of Cement Pore Solutions," Cement and Concrete Research, vol. 19, pp. 327-332, 1989/5 1989.
[112] E. Gartner, F. Tang, and S. Weiss, "Saturation Factors for Calcium Hydroxide and Calcium Sulfates in Fresh Portland Cements," Journal of the American Ceramic Society, vol. 68, pp. 667-673, 1985.
[113] C. McCarty and E. Vitz, "Ph Paradoxes: Demonstrating That It Is Not True That Ph=-Loh[H+]," Journal of Chemical Education, vol. 83, pp. 752-757, May 2006.
[114] J. T. M. Vickers, S. A. Farrington, J. R. Bury, and L. E. Brower, "Influence of Dispersant Structure and Mixing Speed on Concrete Slump Retention," Cement and Concrete Research, vol. 35, pp. 1882-1890, 2005.
[115] I. Jawed and J. Skalny, "Alkalies in Cement: A Review- Part 2: Effects of Alkalies on Hydration and Performance of Portland Cement," Cement and Concrete Research, vol. 8, pp. 37-51, 1978.
[116] S. Hanehara and K. Yamada, "Interaction between Cement and Chemical Admixture from the Point of Cement Hydration, Absorption Behaviour of Admixture, and Paste Rheology," Cement and Concrete Research, vol. 29, pp. 1159-1165, 1999.
[117] A. Zingg, F. Winnefeld, L. Holzer, J. Pakusch, S. Becker, and L. Gauckler, "Adsorption of Polyelectrolytes and Its Influence on the Rheology, Zeta Potential, and Microstructure of Various Cement and Hydrate Phases," Journal of Colloid and Interface Science, vol. 323, pp. 301-312, 2008.

CHAPTER 10: REFERENCES
269[118] S. Pourchet, C. Comparet, A. Nonat, and P. Maitrasse, "Influence of Three Types of
Superplasticizers on Tricalcium aluminate Hydration in Presence of Gypsum," in 8th CANMET/ACI International Conference on Superplasticizers and Other Chemical Admixtures in Concrete, Sorrento, Italy, 2006.
[119] J. Assaad and K. Khayat, "Effect of Viscosity-Enhancing Admixtures on Formwork Pressure and Thixotropy of Self-Consolidating Concrete," ACI Materials Journal, vol. 103, pp. 280 - 287, 2006.
[120] B. Das, Principles of Geotechnical Engineering, 4th ed. ed. Boston: PWS Publishing Company, 1997.
[121] A. Schofield, "Mohr Coulomb Error Correction," Ground Engineering, vol. 31, p. 30, 1998.
[122] A. Alexandridis and N. J. Gardner, "Mechanical Behaviour of Fresh Concrete," Cement and Concrete Research, vol. 11, pp. 323-339, 1981.
[123] J. C. Tchamba, S. Amziane, G. Ovarlez, and N. Roussel, "Lateral Stress Exerted by Fresh Cement Paste on Formwork: Laboratory Experiments," Cement and Concrete Research, vol. 38, pp. 459-466, 2008.
[124] J. Assaad, K. H. Khayat, and J. Daczko, "Evaluation of Static Stability of Self-Consolidating Concrete," ACI Materials Journal, vol. 101, pp. 207-215, 2004.
[125] N. Tregger, L. Ferrara, and S. Shah, "Empirical Relationships between Viscosity and Flow-Time Measurements from Mini-Slump Tests for Cement Pastes Formulated from SCC," in 5th International RILEM Symposium on Self-Compacting Concrete - SCC 2007, Ghent, 2007, pp. 273 - 278.
[126] ASTM C305, "Standard Practice for Mechanical Mixing of Hydraulic Cement Pastes and Mortars of Plastic Consistency," PA: ASTM International, 2006.
[127] S. Amziane, N. Andriamananantsilavo, and P. Baudeau, "An Experimental Study of the Pressure of Cement Based Materials against Formwork," in 15th ASCE Engineering Mechanics Conference, Columbia University, New York, 2005.
CHAPTER 10: REFERENCES
270[128] N. R. Andriamanantsilavo and S. Amziane, "Maturation of Fresh Cement Paste
within 1- to 10-M-Large Formworks," Cement and Concrete Research, vol. 34, pp. 2141-2152, 2004.
[129] A. Kwan and H. Wong, "Packing Density of Cementitious Materials: Part 2—Packing and Flow of Opc + pfa + csf," Materials and Structures, vol. 41, pp. 773-784, 2008.
[130] J. Assaad and K. H. Khayat, "Kinetics of Formwork Pressure Drop of Self-Consolidating Concrete Containing Various Types and Contents of Binder," Cement and Concrete Research, vol. 35, pp. 1522-1530, 2005.
[131] J. Zelic, D. Rusic, D. Veza, and R. Krstulovic, "Role of Silica Fume in the Kinetics and Mechanisms During the Early Stage of Cement Hydration," Cement and Concrete Research, vol. 30, pp. 1655-1662, 2000.
[132] A. Gregori, R. Ferron, and Z. Sun, "Experimental Simulation of SCC Formwork Pressure," ACI Materials Journal, vol. 105, pp. 97 - 104, 2008.
[133] S. Amziane and C. F. Ferraris, "Cementitious Paste Setting Using Rheological and Pressure Measurements," ACI Materials Journal, vol. 104, pp. 137-145, 2007.
[134] A. R. Heath, P. D. Fawell, P. A. Bahri, and J. D. Swift, "Estimating Average Particle Size by Focused Beam Reflectance Measurement (FBRM)," Particle and Particle Systems Characterization, vol. 19, pp. 84-95, 2002.
[135] A. Blanco, E. Fuente, C. Negro, and J. Tijero, "Flocculation Monitoring: Focused Beam Reflectance Measurement as a Measurement Tool," Canadian Journal of Chemical Engineering, vol. 80, pp. 734-740, 2002.
[136] E. Kougoulos, A. G. Jones, K. H. Jennings, and M. W. Wood-Kaczmar, "Use of Focused Beam Reflectance Measurement (FBRM) and Process Video Imaging (PVI) in a Modified Mixed Suspension Mixed Product Removal (MSMPR) Cooling Crystallizer," Journal of Crystal Growth, vol. 273, pp. 529-534, 2005.
[137] Lasentec, "FBRM Control Interface Version 6.0. User Manuel," USA: Laser Sensor Technology Inc., 1999.

CHAPTER 10: REFERENCES
271[138] Mettler-Toledo, "Understanding the FBRM Measurement," in Particle System
Characterization Training: Understanding and Applying Lasentec FBRM Technology, 2005.
[139] D. N. Thomas, S. J. Judd, and N. Fawcett, "Flocculation Modelling: A Review," Water Research, vol. 33, pp. 1579-1592, 1999/5 1999.
[140] T. G. M. V. d. Ven, Colloidal Hydrodynamics. San Diego, CA: Academic Press Inc., 1989.
[141] D. N. Thomas, S. F. Judd, and N. Fawcett, "Flocculation Modelling: A Review," Water Research, vol. 33, pp. 1579 - 1592, 1999.
[142] J. Zebrowski, V. Prasad, W. Zhang, L. M. Walker, and D. A. Weitz, "Shake-Gels: Shear-Induced Gelation of Laponite-Peo Mixtures," Colloids and Surfaces A: Physicochemical and Engineering Aspects, vol. 213, pp. 189-197, 2003.
[143] A. Blanco, C. Negro, E. Fuente, and J. Tijero, "Effect of Shearing Forces and Flocculant Overdose on Filler Flocculation Mechanisms and Floc Properties," Industrial and Engineering Chemistry Research, vol. 44, pp. 9105-9112, 2005.
[144] D. H. Everett, Basic Principles of Colloid Science. London: Royal Society of Chemistry, 1988.
[145] V. K. Bui, Y. Akkaya, and S. P. Shah, "Rheological Model Self-Consolidating Concrete," ACI Materials Journal, vol. 99, pp. 549-559, 2002.
[146] R. Douglas, V. Bui, Y. Akkaya, and S. P. Shah, "Properties of Self-Consolidating Concrete Containing Class F Fly Ash," in Proceedings from RILEM/ACBM Conference "Advances in Concrete through Science and Engineering", Evanston, IL, March 2004.
[147] C. F. Lu and L. A. Spielman, "Kinetics of Floc Breakage and Aggregation in Agitated Liquid Suspensions," Journal of Colloid and Interface Science, vol. 103, pp. 95-105, 1985.
[148] S. E. P. Patrick T. Spicer, "Coagulation and Fragmentation: Universal Steady-State Particle-Size Distribution." vol. 42, 1996, pp. 1612-1620.

CHAPTER 10: REFERENCES
272[149] P. T. L. Koh, J. R. G. Andrews, and P. H. T. Uhlherr, "Modelling Shear-Flocculation
by Population Balances," Chemical Engineering Science, vol. 42, pp. 353-362, 1987.
[150] S. Lu, Y. Ding, and J. Guo, "Kinetics of Fine Particle Aggregation in Turbulence," Advances in Colloid and Interface Science, vol. 78, pp. 197-235, 1998.
[151] T. A. Kramer and M. M. Clark, "Modeling Orthokinetic Coagulation in Spatially Varying Laminar Flow," Journal of Colloid and Interface Science, vol. 227, pp. 251-261, 2000.
[152] L. B. Brakalov, "A Connection between the Orthokinetic Coagulation Capture Efficiency of Aggregates and Their Maximum Size," Chemical Engineering Science, vol. 42, pp. 2373-2383, 1987.
[153] D. Tomi and D. F. Bagster, "A Model of Floc Strength under Hydrodynamic Forces," Chemical Engineering Science, vol. 30, pp. 269-278, 1975.
[154] C. Negro, L. M. Sánchez, E. Fuente, Á. Blanco, and J. Tijero, "Polyacrylamide Induced Flocculation of a Cement Suspension," Chemical Engineering Science, vol. 61, pp. 2522-2532, 2006.
[155] S.-Y. Yoon and Y. Deng, "Flocculation and Reflocculation of Clay Suspension by Different Polymer Systems under Turbulent Conditions," Journal of Colloid and Interface Science, vol. 278, pp. 139-145, 2004.
[156] B. Y. Pekmezci, T. Voigt, K. Wang, and S. S.P., "Low Compaction Energy Concrete for Improved Slip Form Casting of Concrete Pavements," ACI Materials Journal, vol. 104, 2000.
[157] J.-J. Mbele, "Optimization of Self-Consolidating Concrete for Slip-Form Pavement," M.S. Thesis, Northwestern University, Evanston 2006.
[158] K. G. Kuder, N. Ozyurt, E. B. Mu, and S. P. Shah, "Rheology of Fiber-Reinforced Cementitious Materials," Cement and Concrete Research, vol. 37, pp. 191-199, 2007.
[159] E. Franchini, J. Galy, and J.-F. Gérard, "Sepiolite-Based Epoxy Nanocomposites: Relation between Processing, Rheology, and Morphology," Journal of Colloid and Interface Science, vol. 329, pp. 38-47, 2009.

CHAPTER 10: REFERENCES
273[160] G. Pan, M.-M. Zhang, H. Chen, H. Zou, and H. Yan, "Removal of Cyanobacterial
Blooms in Taihu Lake Using Local Soils. I. Equilibrium and Kinetic Screening on the Flocculation of Microcystis Aeruginosa Using Commercially Available Clays and Minerals," Environmental Pollution, vol. 141, pp. 195-200, 2006.
[161] M. ÇInar, M. F. Can, E. Sabah, C. Karagüzel, and M. S. Çelik, "Rheological Properties of Sepiolite Ground in Acid and Alkaline Media," Applied Clay Science, vol. In Press, Corrected Proof.
[162] T. Kavas, E. Sabah, and M. S. Çelik, "Structural Properties of Sepiolite-Reinforced Cement Composite," Cement and Concrete Research, vol. 34, pp. 2135-2139, 2004.
[163] B. Ryznarova, J. Zelenka, F. Lednicky, and J. Baldrian, "Epoxy-Clay Nanocomposites: Influence of the Clay Surface Modification on Structure," Journal of Applied Polymer Science, vol. 109, pp. 1492-1497, 2008.
[164] Malvern Instruments, "Zetasizer Nano Series User Manual," 2004.

Appendix: Zeta Potential Testing
274
APPENDIX A: Zeta Potential Testing
A.1. Introduction Concrete is a concentrated suspension, and, as shown in the previous section, formwork
pressure is influenced by the degree of aggregation within the paste matrix. Zeta potential
provides a measure of the electrical potential of a particle and indicates to what degree particles
within a liquid will tend to aggregate. In pure cement paste, the zeta potential typically ranges
from -10 to 20 mV [82]. Chemical admixtures, such as water-reducing agents and viscosity-
modifying agents (VMA), are commonly used to alter the particle dispersion and the aggregation
mechanisms. In ordinary cement pastes, zeta potential studies have been used to investigate
particle coagulation [85], flocculation mechanisms [86], and the effect of SPs on rheology [87].
In most of these studies very high dilution factors (ex. w/c = 500) were used, which altered the
pore solution and, this will affect the zeta potential. Hence, in order to accurately measure the
zeta potential it is important that one tests the particle in its original pore solution.
The objective of this stage of the research was to evaluate the capability of using zeta
potential measurements as a means to evaluate the rate at which structural rebuilding occurs
within a cement paste matrix.
A.2. Experimental Protocol A Zetasizer Nano manufactured by Malvern Instruments was used in this study. This device
uses electrophoresis to determine the zeta potential and is capable of measuring the zeta potential
of particles ranging from 5 nanometers to 10 microns. One of the features of the device is that
particle movement is tracked using phase angle light scattering, which is sensitive to very small

Appendix: Zeta Potential Testing
275shifts in movement. Slow field and fast field reversal of the electric field are also used to
determine the zeta potential. Slow field reversal reduces polarization of the electrodes and it
provides a measure of the zeta potential distribution. Fast field reduces effects from
electroosmosis so that particle movement is primarily due to electrophoresis.
Figure A- 1 shows the phase plot for a “standard” zeta potential fluid manufactured by
Malvern Instruments. As shown in the figure, during the fast field reversal period the graph
should show oscillations as the sample responds to the quick phase shifts.
Figure A- 1. Phase plot for “standard” suspension during fast field reversal
Proper sample preparation is important in order to ensure reliable and accurate measurements. If
the sample concentration is too low, not enough light will be scattered to make a measurement;
however, if the concentration is too high, then multi-particle scattering may occur, which can
prevent the laser from reaching the detector. In the Zetasizer Nano device, the laser power is
automatically attenuated so that the count rate from the sample, especially high scattering
Appendix: Zeta Potential Testing
276samples, is within acceptable limits. An attenuation index of 11 denotes no attenuation (full
laser power), while 0 denotes full attenuation (total laser block) [164]. Poor quality data with an
attenuation index of 11 can indicate that the particle concentration is too low and the sample
concentration should be increased. Similarly, poor quality data with a low attenuation value of 0
can signify that particle concentration is too high and the laser light can not be transmitted.
Hence, the particle concentration should be decreased.
During this stage of the program, careful attention was given to develop a sample
preparation protocol that would yield results that are representative of the in situ conditions.
After mixing the paste samples with a Hobart mixer, the samples were prepared for zeta potential
testing. Initially, five different sample preparation sequences were evaluated:
1) Mix--Centrifuge--Filter--Zeta Potential Testing
2) Mix--Centrifuge--Filter--Suspend--Zeta Potential Testing
3) Mix--Centrifuge--Filter--Suspend--Rest--Zeta Potential Testing
4) Mix--Centrifuge--Filter--Rest--Zeta Potential Testing
5) Mix--Centrifuge--Rest--Zeta Potential Testing
2) Mix--Centrifuge--Filter--Suspend--Stir--Zeta Potential Testing
Mix refers to the 5 minute process in which the cement paste suspension was prepared with a
Hobart Mixer. Centrifuge refers to the 8 minute process in which the samples were centrifuged.
Filter refers to the process in which the supernatant from the centrifuging process was filtered
through a syringe filter. Suspend refers to the process in which a portion of the original cement
sample was added to the supernatant extracted from the centrifuge step. Stir refers to the process

Appendix: Zeta Potential Testing
277in which the supernatant sample (with or without suspended particles) was agitated with a
stirring rod. Zeta potential testing refers to the point at with the supernatant sample was
transferred to the zeta potential device.
A.3. Results During this stage of the study, all testing was performed on a cement sample with a w/c ratio of
0.5 and DI water. Figure A- 2 shows the results obtained using the first sample preparation
protocol in which the supernatant was filtered through a 0.2 micron syringe filter prior to testing.
The average zeta potential was 6.416 mV, and the first standard deviation around the mean was
164.8 mV. The attenuation value was 10 and this indicated that the sample concentration was
too low.
Figure A- 2. Zeta Potential Distribution for sample prepared using sample preparation
protocol 1

Appendix: Zeta Potential Testing
278The phase plot exhibited no oscillations and is shown in Figure A- 3. The fact that
the zeta potential distribution has a wide distribution, a high attenuation value, and a smooth
phase plot were all indicators that the data quality was not good and that the sample preparation
technique needed to be modified.
Figure A- 3. Phase plot for sample prepared using sample preparation protocol 1
The zeta potential distribution for a sample tested using sample preparation technique 2 is
shown in Figure A- 4. The sample was filtered through a 1.2 micron syringe filter and 1 drop of
cement paste was added to the supernatant prior to zeta potential testing in order to increase
particle concentration. Five measurements were taken on this sample. Figure A- 4a shows the
results of the first measurement and Figure A- 4b shows the results from the last measurement,
which was taken eleven minutes after the first measurement. A broader distribution was seen in
the first measurement with two distinct peaks obtained at -19.53 mV and 34.91 mV. The
average zeta potential, zeta potential deviation, and attenuation value were 1.745 mV, 123.4 mV,
and 9, respectively. In Figure A- 4b, the average zeta potential, zeta potential deviation, and

Appendix: Zeta Potential Testing
279attenuation value were 0.6317 mV, 13.32 mV, and 9, respectively. Only one peak was seen
in the measurement and the distribution was much smaller.
(a) initial
(b) final
Figure A- 4. Zeta potential distribution for sample prepared using sample preparation
protocol 2

Appendix: Zeta Potential Testing
280It must be noted that the zeta potential is actually the average value based on the
results of the zeta potential distribution of all the particles in the suspension. It was very
common to obtain zeta potential with very broad distributions (as shown in Figure A- 2). Since
cement is a multiphase particle, this distribution varied considerably from measurement to
measurement, and it was very difficult to obtain the same results even if the testing conditions
were carefully repeated. For a suspension composed of homogenous particles, the distribution is
narrow with one well-defined peak. It was observed that the zeta potential distribution for the
cement paste sample tended to a distribution with a sharper peak as the number of measurements
on a sample increased. However, numerous measurements (at least 10 measurements of 25 runs)
were needed in order to improve data quality. While some results were clearly outliers, it was
often difficult to decide which values were due to true differences in material behavior and not
just noise or experimental error. The zeta potential measurement is based on the movement of
the particles to the applied electric field, and movement due to sedimentation (i.e. gravitational
forces) can cause erroneous values since this movement is not accounted for in the measurement
principles of the zeta potential device. Peaks from particle sedimentation would cause the values
for the zeta potential to change with time since the location of the particles in the measurement
cell is continuously changing due to the settling of the particles. However, if the multiple peaks
were due to the heterogeneous nature of the cement particles, then these peaks should still appear
in the zeta potential graphs at later times since heterogenousity is not temporal. In Figure A- 4b,
a single, distinct peak occurs suggesting that the multiple peaks seen in the earlier measurements
were due to the particle movement from sedimentation.

Appendix: Zeta Potential Testing
281The influence of particle concentration is shown in Figure A- 5. The sample was
prepared using sample preparation technique 3 in which a 1.2 micron syringe filter was used and
6 drops of cement paste were resuspended in the supernatant. The sample was allowed to rest for
10 minutes before the top portion of the suspension was transferred to the zeta potential device
for testing. Increasing particle concentration did not increase data quality. Broader distributions
and multiple peaks were obtained when the particle distribution was increased. This is due to the
greater number of particles settling in the system. Even though the sample was allowed to rest
before testing, while transferring the sample to the testing cell, it is likely that large particles
were also transferred and settled during the measurement.
Figure A- 5. Zeta potential distribution for sample prepared using sample preparation
protocol 3

Appendix: Zeta Potential Testing
282Figure A- 6 shows the temporal evolution of the zeta potential distribution of the
sample shown in Figure A- 5. As seen in Figure A- 6, the number of peaks decreased with
measurement time. In the first measurement (labeled 1) four peaks were seen in the
measurement. In the second measurement (labeled 2), which was taken two minutes after the
first measurement, 3 peaks were seen. However, in the third measurement (labeled 3), 1 major
peak and 2 smaller humps were seen in the graph indicating that with more time the
measurement would be more stable and better quality data would be obtainable.
Figure A- 6. Temporal evolution of zeta potential distribution for sample prepared using
sample preparation protocol 3 (numbers corresponds to different measurement times, with
1 = first measurement, 3 = third measurement)

Appendix: Zeta Potential Testing
283Based on the above results, a protocol that involved centrifuging the cement paste and
filtering out the large particles was developed. The protocol consisted of centrifuging the
samples for five minutes at 10,000 rpm in a Sorvall RC 5B centrifuge. Approximately 20 mL of
pore solution was extracted from 240 mL of centrifuged paste, and this pore solution was filtered
through a 1.2 μm filter in order to remove the large particles that may settle during the zeta
potential testing. The filter size of 1.2 um was large enough so that the solids concentration of
the filtered solution was high enough for the ZetaSizer Nano instrument, but large amounts of
particle settling did not occur. Other filtering approaches were tried but produced poor results.
A 0.2 um filtered solution had too low of a particle count rate for the machine. A 0.8 um filter
yielded variable results that were sometimes acceptable but several times the count rates were
too low for the ZetaSizer Nano instrument. Another approach was to use unfiltered pore
solution. This yielded results with high deviations, but, after about 8 measurements of 50 runs,
the data became fairly consistent. Re-suspending particles from the initial cement paste after
filtering was investigated but was found to disrupt zeta potential measurements as large particles
settled in the sample cell during testing. Care was taken to cover filtered and unfiltered pore
solution to reduce effects associated with carbonation.
After developing the protocol, the zeta potential of four mixtures was measured at
different times.
Table A- 1 contains the mix design of the mixtures evaluated. The w/c ratio was held
constant at 0.35, and, in mixtures in which superplasticizer was used, the superplasticizer dosage
corresponded to the dosage necessary to achieve an initial slump flow of approximately 330 mm.
The superplasticizer was a carboxylated polymer in aqueous solution (specific gravity = 1.04)
and the dosages shown in Table A- 1 were calculated based on the mass of the aqueous solution

Appendix: Zeta Potential Testing
284with respect to the mass of the cement. The physical and chemical properties of the cements
were given in Table 6-1.
Table A- 1. Mixture proportions for zeta potential tests
Mixture Name Cement SP dosage (% cement)
LowCem Cement 6 (low alkali/C3A cement) 0
HighCem Cement 5 (high alkali/C3A cement) 0
LowCemSP Cement 6 (low alkali/C3A cement) 0.14
HighCemSP Cement 5 (high alkali/C3A cement) 0.80
The zeta potential was measured at approximately 40-50, 120-150, and 200-250 minutes
(taken with respect to the time centrifuging commenced). The range of times reflects differences
in the amount of time it takes to transfer the cement to centrifuge tubes, which depends on the
consistency of the paste.
Figure A- 7 shows the results for mixtures made without any superplasticizer. The zeta
potential of HighCem is negative, whereas LowCem has a positive zeta potential. Ignoring the
sign of the zeta potential, the magnitude of both mixtures increases over time. Initially the zeta
potential of HighCem was -3.8 mV compared to an initial zeta potential of +1.8 mV for
LowCem. A high zeta potential (ζ > 25 mV) indicts that a solution or dispersion will resist
aggregation. The low zeta potential value in both mixtures indicates that the suspensions are
coagulated (strongly aggregated). Initial set occurred in HighCem before the third measurement
was conducted, and, thus, only two readings were recorded.

Appendix: Zeta Potential Testing
285
Time (min)
50 120 210
Zeta
Pot
entia
l (m
V)
-6
-4
-2
0
2
4
6
LowCem HighCem
Figure A- 7. Influence of cement type on zeta potential
Figure A- 8 and Figure A- 9 show the effect of superplasticizer on the zeta potential.
Regardless of the mix, the addition of superplasticizer increased the initial magnitude of the
zeta potential. A sign reversal was seen in the mixture made with the high alkali/C3A cement
(HighCem) when superplasticizer was added. This indicates that the superplasticizer is
dispersing the cement particles through electrostatic and electrosteric repulsion mechanisms.

Appendix: Zeta Potential Testing
286
Time (min)
0 50 100 150 200 250
Zeta
Pot
entia
l (m
V)
0
1
2
3
4
5
6
7
LowCem LowCemSP
Figure A- 8. Influence of superplasticizer on low alkali/C3A cement
Time (min)
50 120 210
Zeta
Pot
entia
l (m
V)
-6
-4
-2
0
2
4
6
8
10
HighCem SPHighCem
Figure A- 9. Influence of superplasticizer on high alkali/C3A cement

Appendix: Zeta Potential Testing
287In general there does not seem to be significant changes in the zeta potential values
measured over time (exceeding a magnitude of 5 mV with respect to the preceding
measurement). Slight changes may exist, but with the difficulty of interpreting data, these
changes are hard to distinguish from the inherent variation of the cement paste system if they do
not have a strong and obvious effect on the average zeta potential value.

Vita
288
VITA
Raissa Patricia Ferron was born on April 10, 1980 in Brooklyn, New York, under her maiden
name Raissa Patricia Douglas. She is the daughter of Celestine Harold Douglas and Patresia
Bernadette Douglas. Raissa defended her Ph.D. work on November 13, 2008. She has accepted
a faculty position at the University of Texas at Austin, and will start there in January 2009 as an
Assistant Professor in the Department of Civil, Architectural and Environmental Engineering.
M.S. in Civil Engineering; Northwestern University, Evanston, IL, Granted June 2004, Thesis: Development of Self-Consolidating Concrete with Type F Fly Ash: With a Verification of the Minimum Paste Volume Method, Advisor: Professor Surendra P. Shah B.S. in Civil Engineering; Howard University, Washington, D.C., Granted May 2002; Summa Cum Laude Research Experience Research Assistant, 09/2002 – Present, Northwestern University Studied the fresh state and hardened state properties of self-consolidating concrete (SCC).
Developed rheological protocol to quantify the structural rebuilding in the paste matrix. Developed a field-friendly viscometer for high fluidity cement pastes and mortars. Devised experimental laboratory device to simulate formwork pressure and developed prediction
models for SCC formwork pressure. Evaluated flexural strength, compressive strength, fracture properties, and shrinkage of steel
reinforced and polypropylene reinforced SCC specimens. Evaluated the influence of fly ash on chloride permeability resistance.
Visiting Researcher, 06/2007 – 08/2007, Universidad Complutense de Madrid, Madrid, Spain
Investigated and modeled the flocculation mechanisms of cementitious materials. Teaching and Research Mentoring Experience
Properties of Concrete o Undergraduate Student Research Advisor (Spring 2007): Developed unique research projects for students to conduct as part of their term project. Directly supervised the research of four undergraduate students. Mentored students about career plans and graduate school o Teaching Assistant (Spring 2005): Developed and graded exams. Organized and updated class lecture notes and syllabus. Scheduled guest lecturers. Managed course website.

Vita
289o Laboratory Instructor (Spring 2005): Prepared and organized laboratory handouts. Gave lectures. Demonstrated and assisted students in laboratory techniques regarding rheological testing, concrete mechanical testing, concrete durability testing, and mechanical testing. Graded laboratory reports.
Reinforced Concrete Design o Teaching Assistant (Spring 2006): Developed and graded homework and exams. Organized and updated class lecture notes and syllabus. Scheduled guest lecturers. Managed course website.
Mechanics of Materials o Grader (Winter 2007): Graded homework assignments.
Modern Materials and Society o Science/Engineering Research and Teaching Synthesis Advisor (Spring 2007): Created a research project for four non-science/engineering undergraduate. Directly supervised and advised students.
Accelerated Inorganic Chemistry o Guest Lecturer (Fall 2005-2007): Gave a lecture on the use of chemistry in concrete technology.
Center for Advanced Cement-Based Materials o Undergraduate Student Research Coordinator (Summer 2005): Trained and supervised an
undergraduate student conducting research.
Honors and Awards National Science Foundation US/Africa Materials Research Institute Travel Fellowship, 2007 Featured in Winter 2007/Spring 2008 issue of Diversity/Careers in Engineering & Information
Technology Magazine Georgia Institute of Technology Focus Fellow, 2007 Southern Regional Education Board Doctoral Scholar, 2007 ASTM International Katharine and Bryant Mather Scholarship, 2006 McCormick School of Engineering I &G Dissertation Year Fellowship, 2006 Illinois Ready Mixed Concrete Association Harvey H. Hagge Concrete Scholarship, 2006 Invited Participant of National Science Foundation ADVANCE Workshop on Transforming the
Professoriate: Preparing Women for Careers in Science and Engineering, Blacksburg, Virginia, June 20-22, 2006
Invited Participant of NSF-funded Workshop for the Advancement and Retention of Underrepresented and Minority Engineering Educators, Arlington, Virginia, March 5-8, 2006
First Place Award ACBM Poster Competition, 2005 Alliance for Graduate Education and the Professoriate (AGEP) Scholar, 2005 American Concrete Institute Student Fellow, 2002 Portland Cement Association Fellow, 2002 Illinois Minority Graduate Incentive Fellow, 2002 National Science Foundation Fellowship—Honorable Mention, 2002 Northwestern University P. Murphy Fellowship, 2002 CDM Certificate of Commendation for Technical and Service Excellence, 2002 UNCF/Camp Dresser & McKee Fellow, 2001 Tau Beta Pi Nagel Scholar, 2001 All American Scholar, 2001 Who’s Who in American Colleges and Universities, 2001 Professionals Dedicated to Excellence Coin Presented by Japan Engineer District Commander, 2001 National Society of Collegiate Scholars, 2000 Howard University’s Legacy Scholarship, 1998 Essence and Pepsi-Cola Youth Leadership Award, 1998

Vita
290 Research and Travel Grants 2007 Northwestern University Graduate School/ Alliance for Graduate Education and the
Professoriate Proposal Title: Flocculation Mechanisms in Cement Pastes Awarded $3000 travel grant to conduct research overseas
2006 National Science Foundation (NSF) Division of Civil and Mechanical Systems (CMS); Infrastructure Materials and Structural
Mechanics Program Proposal Title: Thixotropy and Formwork Pressure of SCC; Grant No: 0625606
2005 Federal Highway Association (FHWA) Proposal Title: Highways 2008: Innovative Infrastructure Materials and Quality Control
Techniques Award No: DTF H61-05-C-00001
2004 Ready-Mix Concrete Research Foundation; American Concrete Institute Strategic Development Council
Proposal Title: SCC Formwork Pressure Leadership Positions
Treasurer, CEE Graduate Student Board, 09/2006 – Present, Northwestern University Civil Engineering Delegate, Engineering Graduate Leadership Council, 09/2006 –08/2007,
Northwestern University President, Black Graduate Student Association, 05/2004 – 05/2005, Northwestern University
Chairperson of the 9th Annual Graduate and Professional Student Research Conference held in April 2005 which had over 100 attendees from all over the country. To date, the conference was the best attended one in BGSA history.
Secretary, CEE Graduate Student Board, 05/2003 – 05/2004, Northwestern University President-Elect, Black Graduate Student Association, 05/2003 – 05/2004, Northwestern University President, American Society of Civil Engineers, 09/2000 – 06/2002, Howard University Vice-President, Tau Beta Pi National Engineering Honor Society, 09/2000 – 06/200, Howard
University Professional Development
Preparing Future Faculty Program Participant, 10/2004 – 06/2005, Northwestern University Attended monthly workshops focused on preparing doctoral students for the professoriate
ACBM/Portland Cement Association Undergraduate Faculty Enhancement Workshop, 07/2004, Skokie, IL
Participant in a four day program geared towards effectively teaching concrete materials. University Service and Outreach Activities
Northwestern University Graduate Student Recruiter, 03/2003 – Present, Northwestern University
Student Life and Multi-cultural Affairs Graduate Student Mentor, 08/2003 – Present, Northwestern University
Planned activities that focused on the recruitment, retention and graduation of underrepresented students in the fields of science, technology and engineering.

Vita
291 Graduate Leadership Council (GLC), 05/2003 – 05/2005, Northwestern University
Served as a member of a council composed of ten graduate students and representatives from The Graduate School, and The Office of the Vice President for Student Affairs. Presented issues to the Board of Trustees concerning graduate student needs. Met with internal and external reviewers for the program review of Northwestern University.
Seminar Coordinator, 2004, Northwestern University Organized First Joint Industrial Engineering Departmental Seminar Series and Distinguished Minority Engineering Lecture Series.
Career Day for Girls Lab Tour Host, 02/2003 and 02/2004, Northwestern University Summer Research Opportunity Program (SROP) Mentor, Summer 2003 and 2004, Northwestern
University Communications Task Force Committee Member, 06/2003, Northwestern University
Served on a committee composed of faculty, staff and graduate students which focused on improving communication across and within constituencies of the College of Engineering
Industry Experience Civil Engineer Intern, Camp, Dresser, & McKee (CDM); Summer 2002, New York, NY
Performed quality control verification on air analysis tests and soil tests to ensure that design details were accurate. Wrote property summary reports to inform residents on the amount of contamination that was found on their property.
Engineering Technician, U.S. Army Corps of Engineers (AMIE Program); Summer 2001, Camp Zama, Japan
Accompanied design engineer for site inspections of facilities prior to designing drawing plans. Conducted Design Reviews and Bid ability, Construction ability, Operation ability, and Environmental reviews. Accompanied resident engineer on safety inspections and safety surveys during construction phase. Accompanied resident engineer for site visits to inspect concrete cylinders and pile driving.
Assistant Superintendent, York Hunter Construction Services (INROADS, NYC), Summer 2000, New York, NY
Helped organize and update manpower reports, daily logs, requests for information, and construction schedule. Created a Safe Work Plan for Office of Self-Insurance Plans (OSIP) which outlined the major activities occurring on site and the safety guidelines to follow to take minimize risk of any accidents.
Engineering Intern, Brooklyn Union Gas Company, Summer 1998 and 1999, Brooklyn, NY Edited maps using Integrating Mapping System (IMS) and AUTOCAD.
Professional Memberships
American Ceramic Society Materials Advantage American Society for Testing and Materials American Concrete Institute Tau Beta Pi American Society of Civil Engineers National Society of Black Engineers

Vita
292Professional Service
Organizing Secretary, 3rd North American Conference on the Design and Use of Self-Consolidating Concrete
Reviewer for technical journals: ACI Materials Journal, Materials and Structures Professional Licenses
Engineer-In-Training (EIT), certified in the District of Columbia, EIT 900753 Publications (* indicates presenter at conference) Journals
Kwon, S., Ferron, R., Akkaya, Y., and S.P. Shah. “Cracking of fiber-reinforced self-consolidating concrete due to restrained shrinkage,” Korea Concrete Institute Journal of Construction Material and Structures (submitted)
Gregori, A., Ferron, R., Sun, Z. and S.P. Shah. “Experimental simulation of SCC formwork pressure,” American Concrete Institute Materials Journal, v105(1), January/February 2008
Ferron, R., Gregori, A., Sun, Z. and S.P. Shah. “Rheological method to evaluate the thixotropy of cement pastes for SCC,” American Concrete Institute Materials Journal, v104(3), May/June 2007
Sun, Z. Gregori, A., Ferron, R., and S.P. Shah. “Developing a falling-ball viscometer for high flowable cement-based materials,” American Concrete Institute Materials Journal, v104(2), March/April, 2007
Refereed conference proceedings Kwon, S., Ferron, R., Akkaya, Y., and S.P. Shah. “Restrained shrinkage cracking of fiber-reinforced
self-consolidating concrete,” 6th RILEM International Conference on Pavement Cracking, June 9-11, 2008, Chicago, IL (submitted)
Ferron, R.,* Gregori, A., Sun, Z. and S.P. Shah. “The effect of superplasticizers on the thixotropy of cementitious material,” Proceedings of the Eighth CANMET/ACI International Conference on Superplasticizers and Other Chemical Admixtures in Concrete, Supplementary Vol., pp 175-185, October 29-November 1, 2006, Sorrento, Italy
Douglas, R., Gregori, A., Sun, Z. and S.P. Shah. “Investigations of the properties of SCC: a method for measuring thixotropy and viscosity,” Proceedings of Knud Hojgaard Conference on Advanced Cement-Based Materials: Research and Teaching, pp 19 -30, June 12-15, 2005, Lyngby, Denmark
Douglas, R.P.*, Bui, V.K., Akkaya, Y., and S.P. Shah. “Properties of self-consolidating concrete containing class f fly ash: with a verification of the minimum paste volume method,” ACI Committees 236 and 237 Special Publications: Workability of SCC: Roles of Its Constituents and Measurement Techniques, CD-ROM, April 17 - 21, 2005, New York, NY
Non-refereed conference proceedings Shah, S.P., Ferron, R., Ferrara, L., Tregger, N., and S. Kwon. “Research on SCC: some emerging
themes,” Proceedings of the 5th International RILEM Symposium on Self-Compacting Concrete, v1, pp 3 – 14, September 2007, Ghent, Belgium
Kwon, S., Ferron, R., and S.P. Shah. “Development of a prediction model for SCC formwork pressure,” Proceedings of the National Ready Mix Concrete Association 2007 Concrete Technology Forum, CD-ROM, May 2007, Dallas, TX
Douglas, R.*, Gregori, A., Sun, Z., Shah, S.P. and D. Bonen. “The effect of ingredients and shear history on the thixotropic rate of rebuilding of SCC,” Proceedings of the 2nd North American Conference on the Design and Use of Self-Consolidating Concrete and the 4th International RILEM Symposium on Self-Compacting Concrete, v1, pp 591 - 596, October 30 - November 3, Chicago, IL
Gregori, A., Sun, Z., Douglas, R., Shah, S.P. and D. Bonen. “The evaluation of viscosity by using a novel viscometer for SCC,” Proceedings of the 2nd North American Conference on the Design and

Vita
293Use of Self-Consolidating Concrete and the 4th International RILEM Symposium on Self-Compacting Concrete, October 30 - November 3, 2005, v1, pp 775 – 782, Chicago, IL
Douglas, R.P.*, Bui, V.K., Akkaya, Y., and S.P. Shah. “Properties of self-consolidating concrete containing class f fly ash,” Proceedings of the RILEM International Symposium on Advances in Concrete through Science and Engineering, Evanston, IL, CD-ROM, March 21-24 2004,.
Other Publications (Magazine Articles, Technical Reports) Contributing Author of White Paper on Self-Consolidating Concrete prepared for Portland Cement
Association, February 2007, (http://www.cement.org/bookstore/profile.asp?itemid=RP440) Featured in article “Coming to terms with SCC: a short list of high-tech terms lets you talk the talk
with the experts,” The Concrete Producer, October 2005 Select Oral and Poster Presentations (9 out of 18)
Ferron, R., Fuente, E., Negro, C., and S.P. Shah. “Aggregation mechanisms in pastes for self-consolidating concrete,” The 4th International Conference of the African Materials Research Society, December 13, 2007, Dar es Salaam, Tanzania
Ferron, R. and S.P. Shah. “Flocculation mechanisms of SCC cement pastes,” American Concrete Institute Fall Convention, October 15, 2007, Fajardo, Puerto Rico
Ferron, R. and S.P. Shah. “Structural rebuilding of cementitious materials using rheological and particle size measurements,” 109th Annual Meeting of the American Ceramics Society, September 17, 2007, Detroit, MI
Ferron, R. “Thixotropy, workability, and formwork pressure of SCC,” Universidad Complutense de Madrid, July 26, 2007, Madrid, Spain
Ferron, R. “Concrete: it’s more than cement, water, and gravel,” BGSA 11th Graduate and Professional Student Research Conference, April 28, 2007, Evanston, IL
Ferron R. and S.P. Shah, “Structural stiffening and flocculation in cementitious materials,” ACBM Semi-Annual Meeting, Fall 2006, Evanston, IL
Douglas, R., Gregori, A., Sun, Z. and S.P. Shah. “The effect of mixture ingredients on the thixotropic rate of rebuilding of self-consolidating concrete (SCC),” ACI Student Fellowship Showcase, April 2005, New York, NY
Douglas, R.P., Bui, V.K., and S.P. Shah. “Application of minimum paste volume method in designing self-consolidating concrete with class f fly ash,” 7th Annual Joint IMGIP, ICEOP, and King-Chavez-Parks Future Conference, November 13–16 2003, Lansing, MI,
Douglas, R.P., Bui, V.K., and S.P. Shah. “Development of self-consolidating concrete containing type f fly ash, ” Portland Cement Association Fall Meeting, April 29 2003, Chicago, IL,
Invited Presentations
“Rheology, Flocculation, and Formwork Pressure of Self Consolidating Concrete,” Civil and Environmental Engineering Departmental Seminar, Princeton University, November 29, 2007
.